UNITED STATES SECURITIES AND EXCHANGE COMMISSION
Washington, D.C. 20549
Form 10-K
ANNUAL REPORT PURSUANT TO SECTION 13 OR 15(d) OF
THE SECURITIES EXCHANGE ACT OF 1934
For The Fiscal Year Ended December 31, 2012
Commission File No. 001-33881
MEDASSETS, INC.
(Exact Name Of Registrant As Specified In Its Charter)
| | |
| DELAWARE | | 51-0391128 |
(State or Other Jurisdiction of Incorporation or Organization) | | (I.R.S. Employer Identification Number) |
100 North Point Center East, Suite 200
Alpharetta, Georgia 30022
(Address of Principal Executive Offices)
(678) 323-2500
(Registrant’s telephone number)
Securities registered pursuant to Section 12(b) of the Act:
| | |
Title of Each Class | | Name of Each Exchange on Which Registered |
| Common Stock, par value $0.01 | | The Nasdaq Stock Market LLC (Nasdaq Global Select Market) |
Securities registered pursuant to Section 12(g) of the Act:
Not Applicable
Indicate by check mark if the registrant is a well-known seasoned issuer (as defined in Rule 405 of the Securities Act). Yes þ No ¨
Indicate by check mark if the registrant is not required to file reports pursuant to Section 13 or Section 15(d) of the Securities Act. Yes ¨ No þ
Indicate by check mark whether the registrant (1) has filed all reports required to be filed by Section 13 or 15(d) of the Securities Exchange Act of 1934 during the preceding 12 months (or for such shorter period that the registrant was required to file such reports), and (2) has been subject to such filing requirements for the past 90 days. Yes þ No ¨
Indicate by check mark whether the registrant has submitted electronically and posted on its corporate Web site, if any, every Interactive Data File required to be submitted and posted pursuant to Rule 405 of Regulation S-T during the preceding 12 months (or for such shorter period that the registrant was required to submit and post such files). Yes þ No ¨
Indicate by check mark if disclosure of delinquent filers pursuant to Item 405 of Regulation S-K is not contained herein, and will not be contained, to the best of registrant’s knowledge, in definitive proxy or information statements incorporated by reference in Part III of this Form 10-K or any amendment to this Form 10-K. ¨
Indicate by check mark whether the registrant is a large accelerated filer, an accelerated filer, a non-accelerated filer, or a smaller reporting company. See the definitions of “large accelerated filer,” “accelerated filer” and “smaller reporting company” in Rule 12b-2 of the Exchange Act. (Check one):
| | | | | | |
Large accelerated filer þ | | Accelerated filer ¨ | | Non-accelerated filer ¨ | | Smaller reporting company ¨ |
| | (Do not check if a smaller reporting company) |
Indicate by check mark whether the registrant is a shell company (as defined in Rule 12b-2 of the Act). Yes ¨ No þ
The aggregate market value of Common Stock held by non-affiliates of the registrant on June 30, 2012, the last business day of the registrant’s most recently completed second fiscal quarter, was $737,206,510 based on the closing sale price of the Common Shares on the Nasdaq Global Select Market on that date. For purposes of the foregoing calculation only, the registrant has assumed that all officers and directors of the registrant are affiliates.
The number of shares of Common Stock outstanding at February 08, 2013 was 59,460,863.
Documents incorporated by reference
Portions of the Registrant’s Proxy Statement (to be filed pursuant to Regulation 14A within 120 days after the Registrant’s fiscal year-end of December 31, 2011), for the annual meeting of shareholders, are incorporated by reference in Part III.
MEDASSETS, INC.
TABLE OF CONTENTS
PART I
Unless the context indicates otherwise, references in this Annual Report to “MedAssets,” the “Company,” “we,” “our” and “us” mean MedAssets, Inc., and its subsidiaries and predecessor entities.
NOTE ON FORWARD-LOOKING STATEMENTS
This Annual Report on Form 10-K contains certain “forward-looking statements” (as defined in Section 27A of the U.S. Securities Act of 1933, as amended, or the “Securities Act,” and Section 21E of the U.S. Securities Exchange Act of 1934, as amended, or the “Exchange Act”) that reflect our expectations regarding our future growth, results of operations, performance and business prospects and opportunities. Words such as “anticipates,” “believes,” “plans,” “expects,” “intends,” “aims,” “estimates,” “projects,” “targets,” “can,” “could,” “may,” “should,” “will,” “would,” and similar expressions have been used to identify these forward-looking statements, but are not the exclusive means of identifying these statements. For purposes of this Annual Report on Form 10-K, any statements contained herein that are not statements of historical fact may be deemed to be forward-looking statements. These statements reflect our current beliefs and expectations and are based on information currently available to us. As such, no assurance can be given that our future growth, results of operations, performance and business prospects and opportunities covered by such forward-looking statements will be achieved. We have no intention or obligation to update or revise these forward-looking statements to reflect new events, information or circumstances.
Such forward-looking statements are subject to a number of known and unknown risks, uncertainties and assumptions, which may cause our actual results, performance or achievements to be materially different from any future results, performance or achievements expressed or implied by such forward-looking statements.
A number of important factors could cause our actual results to differ materially from those indicated by such forward-looking statements, including those described under the heading “Risk Factors” in Part I, Item 1A. herein and elsewhere in this Annual Report on Form 10-K.
Overview
MedAssets is headquartered in Alpharetta, Georgia, and was incorporated in 1999. We are a financial and performance improvement company providing technology-enabled products and services (“solutions”) that, together, help mitigate the increasing financial pressures faced by hospitals, health systems, and other non-acute healthcare providers. These pressures include lower revenues due to shortfalls in, and the increasing complexity of, healthcare reimbursement, reductions in elective procedures, high levels of uncompensated care, and higher costs resulting from increasing operational complexity and clinical acuity. According to quarterly financial disclosure reports, the median hospital operating margin was 3.1% in 2011, and more than 25% of the hospitals reported a negative total profit margin for the year. We believe that hospital and health system operating margins will remain under long-term and continual financial pressure due to shortfalls or reductions in government reimbursement, commercial insurance pricing leverage, continued escalation of operating and supply costs, and increased demand for services at lower reimbursement rates with the implementation of healthcare reform initiatives.
Our solutions are designed to improve operating margins, cash flow and overall operational effectiveness for our clients, which are primarily hospitals and health systems. We believe implementation of our full suite of solutions has the potential to improve client operating margins by 1.5% to 5.0% of revenues by increasing revenue capture, decreasing supply costs and improving clinical resource utilization. The sustainable financial improvements provided by our solutions typically occur in a matter of months and can be quantified and confirmed by our clients. Our solutions integrate with our clients’ existing operations and enterprise software systems, and require minimal upfront costs or capital expenditures.
Our technology-enabled solutions are delivered primarily through company-hosted software, sometimes referred to as software as a service (“SaaS”) or Web-based applications, supported by implementation, process improvement consulting and outsourced services, as well as enterprise-wide sales and client management
1
support. Our Web-based applications employ the concept of cloud computing by using the Internet to virtually deploy our solutions across decentralized health care organizations, providing standardization and compliance to improve operating efficiency and performance. We employ an integrated, client-centric approach to delivering our solutions which, when combined with the ability to deliver measurable financial improvement, has resulted in high retention of our large health system clients, and, in turn, a predictable base of stable, recurring revenue. Our ability to expand the breadth and value of our solutions over time has allowed us to develop strong relationships with our clients’ senior management teams.
Our success in improving our clients’ ability to increase revenue and manage supply expense has driven substantial growth in our client base and has allowed us to expand sales of our products and services to existing clients. These factors have contributed to our compounded annual net revenue growth rate of approximately 18.0% over our last five fiscal years. Our client base currently includes over 4,200 acute care hospitals and more than 122,000 ancillary or non-acute provider locations.
We deliver our solutions through our two business segments, Spend and Clinical Resource Management (“SCM”) and Revenue Cycle Management (“RCM”). Our SCM segment manages more than $50 billion of annual supply spend by healthcare providers, including over $28 billion of annual spend through our group purchasing organization (“GPO”), on behalf of more than 3,000 hospital clients. Our RCM segment currently has more than 2,600 hospital clients and touches over $365 billion in gross patient revenue annually.
| | • | | Spend and Clinical Resource Management. Our SCM segment is an industry leader in cost management capabilities for healthcare providers. We provide a comprehensive suite of cost management services, supply chain analytics and data capabilities that help our clients manage many of their high expense categories. Our solutions lower operating costs through compliance to our strategic sourcing of supplies and purchased services at discounted prices, supply chain outsourcing and procurement services capabilities, and improvement in care processes, reduction in care variations, through the use of our clinical and process improvement consulting services, workforce optimization solutions and business analytics and intelligence tools. Based on our analysis of certain clients that have implemented a portion of our products and services, we estimate that implementation of our full suite of SCM solutions has the potential to decrease a typical health system’s supply expenses by 3% to 10%, which equates to an increase in operating margin of 0.5% to 2.0% of revenue. |
| | • | | Revenue Cycle Management. Our RCM segment is one of the largest providers of revenue cycle management solutions to healthcare providers, primarily hospitals and health systems. We provide a comprehensive suite of SaaS or Web-based software and technology-enabled services addressing the revenue cycle processes — from patient access and financial responsibility, clinical documentation, charge capture and revenue integrity, pricing analysis, claims processing and denials management, payor contract management, extended business office revenue recovery, accounts receivable services and outsourcing. Our workflow solutions leverage proprietary data, reimbursement and payor rules in combination with our data management, compliance and audit tools to increase net revenue collections, reduce accounts receivable balances and increase regulatory compliance. Based on our analysis of certain clients that have implemented a portion of our products and services, we estimate that implementation of our full suite of revenue cycle management solutions has the potential to increase a typical health system’s net patient revenue by 1.0% to 3.0%. |
We believe that we are well positioned to deliver client-specific solutions to the market as hospitals, health systems and non-acute providers continue to face the financial pressures that are endemic and long-term to the healthcare industry and particularly acute in today’s economic climate. We have leveraged the scale and scope of our overall business to develop a strong understanding and unique base of content regarding the environment in which hospitals and health systems operate. With the benefit of this insight, we develop solutions that are designed to strengthen the discrete financial and operational inefficiencies across our clients’ operations, helping them reduce the total cost of care, enhance operational efficiency, improve delivery of care, and capture greater revenue.
2
Industry
According to the U.S. Centers for Medicare & Medicaid Services (“CMS”), spending on healthcare in the United States was estimated to be $2.7 trillion in 2011, or 17.9% of United States Gross Domestic Product, or GDP. Healthcare spending is projected to reach almost $4.8 trillion by 2021, or 19.6% of GDP. In 2011, spending on hospital care was estimated to be $850.6 billion, representing the single largest component of healthcare spending. According to the American Hospital Association, the U.S. healthcare market has approximately 5,700 acute care hospitals, of which nearly 3,000 are part of health systems. A health system is a healthcare provider with a range of facilities and services designed to deliver care more efficiently and to compete more effectively to increase market share. The Bureau of Labor Statistics estimates that the non-acute care market consists of nearly 545,000 healthcare facilities and providers, including outpatient medical centers and surgery centers, medical and diagnostic laboratories, imaging and diagnostic centers, home healthcare service providers, long term care providers, and physician practices.
We believe that ongoing strains on government agencies’ ability to pay for healthcare will have the effect of limiting available reimbursement for healthcare providers. Reimbursement by federal programs often does not cover a hospital’s cost of providing care. In 2011, community hospitals had a shortfall of more than $41.1 billion relative to the cost of providing care to Medicare and Medicaid beneficiaries, up 90.3% from $21.6 billion in 2000, according to the American Hospital Association. The growing Medicare-eligible population, combined with a declining number of workers per Medicare beneficiary, is expected to result in significant Medicare budgetary pressures leading to increasing reimbursement shortfalls for hospitals relative to the cost of providing care.
In order to address rising healthcare costs, employers are pressuring managed care companies to contain healthcare insurance premium increases and reduce the healthcare benefits offered to employees. These ongoing efforts by employers to manage healthcare costs could have the effect of limiting reimbursement for hospitals. The expected launch of government-sponsored health insurance exchanges may negatively impact broader reimbursement trends for healthcare providers.
The introduction of consumer-directed or high-deductible health plans by managed care companies, as well as the overall decline in healthcare coverage by employers, has forced private individuals to assume greater financial responsibility for their healthcare expenditures. Consumer-directed health plans, and their associated high deductibles, increase the complexity and change the nature of billing procedures for hospitals and health systems. As more and more payment responsibility shifts to the consumer, , hospitals forego reimbursement and classify the associated care expenses as bad debt as individuals are unable to pay for services rendered.
Hospitals in particular continue to deal with financial pressures that are continuing to create cash flow challenges and bad debt risk. The sluggish U.S. economy has resulted in, and may continue to result in, increased costs of capital and decreased liquidity for hospitals. The macroeconomic environment has also forced high unemployment rates and adding to the rolls of the uninsured, which could lead to lower levels of reimbursement and a greater percentage of uncompensated care.
Hospital and Health System Reimbursement Complexity
Hospitals typically submit multiple invoices to a large number of different payors, including government agencies, commercial insurance companies and private individuals, in order to collect payment for the care they provide. The delivery of an individual patient’s care depends on the provision of a large number and wide range of different products and services, which are tracked through numerous clinical and financial information systems across various hospital departments, resulting in invoices that are usually highly detailed and complex. For example, a hospital invoice for a common surgical procedure can reflect over 200 unique charges or supply items and other expenses. A fundamental component of a hospital’s ability to bill for these items is the maintenance of an up-to-date, accurate chargemaster file, which can consist of over 40,000 individual charge items.
In addition to requiring intricate operational processes to compile appropriate charges and claims for reimbursement, hospitals must also submit these claims in a manner that adheres to numerous payor claim formats and properly reflects individually contracted payor reimbursement rates. For example, some hospitals
3
rely on accurate billing adjudication and payment from over 50 contracted payors that are linked to thousands of independent insurance plans, inclusive of private individuals, in order to be compensated for the patient care they provide. Upon receipt of the claim from a hospital, a payor proceeds to verify the accuracy and completeness of, or adjudicate, the claim to determine the appropriateness and accuracy of the corresponding payment to the hospital. If a payor denies payment for any or all of the amount of the claim, the hospital must determine the reason for the denial and then amend and/or resubmit the claim to the payor.
As reimbursement models move from fee-for-service to fee-for-value, healthcare providers will need to manage the complexities of both reimbursement structures, as well as understand profitability and utilization under both models. Payor contract modeling and adjudication capabilities must address these complexities.
Unsustainable Hospital and Health System Costs and Supply Expenses
We estimate that the supplies and non-labor services used in conjunction with the delivery of hospital care account for more than 30% of overall hospital costs. These costs include commodity-type medical-surgical supplies, medical devices, branded and generic pharmaceuticals, laboratory supplies, food and nutritional products and purchased services. Hospitals are required to purchase many different types of supplies and services as a result of the wide range of medical care that they administer to patients. For example, it is common for hospitals to maintain supply cost and pricing information on over 35,000 different product types and models in their internal supply record-keeping systems, or master item files.
Hospitals often rely on GPOs, which aggregate hospitals’ purchasing volumes, to help manage supply and service costs. The Healthcare Supply Chain Association estimates that GPOs save the U.S. healthcare industry up to $36 billion in annual price discounts and over $2 billion in annual human resource costs. In 2010, it also found that hospitals and health systems paid 16% less by buying under GPO contracts that have negotiated discount prices with manufacturers, distributors and other vendors. These discounts have driven widespread adoption of the group-purchasing model. GPOs contract with suppliers directly for the benefit of their clients, but they do not take title or possession of the products for which they contract; nor do GPOs make any payments to the vendors for the products purchased by their clients. GPOs primarily derive their revenues from administrative fees earned from vendors based on a percentage of dollars spent by their hospital and health system clients. Vendors discount prices and pay administrative fees to GPOs because GPOs provide access to a large client base, thus reducing sales and marketing costs and overhead associated with managing contract terms with a highly fragmented provider market.
Market Opportunity
We believe that the endemic, persistent and growing healthcare industry pressures provide us substantial opportunities to assist hospitals and health systems to increase net revenue and reduce supply expense. We estimate the total addressable market for our enterprise-wide solutions in the United States to be more than $13 billion, including outsourced or embedded management services.
Reimbursement Complexities and Pressures
Hospitals and health systems are faced with complex and changing reimbursement rules across the government agency and managed care payor categories, as well as the challenge of collecting an increasing percentage of revenue directly from individual patients. Key reimbursement complexities and pressures include:
| | • | | Patient Protection and Affordable Care Act. In March 2010, the Patient Protection and Affordable Care Act (“PPACA”) was signed into law. The law focuses, among other things, on reform of the private health insurance market to provide coverage for uninsured individuals and better coverage for those with pre-existing conditions. It is estimated that as many as 32 million uninsured individuals will have access to affordable coverage beginning in 2014. The law also provides for the commencement of health insurance exchanges as a new market place where individuals and small businesses can compare policies and premiums, and buy insurance with a government subsidy, if eligible. In addition, the PPACA is creating the advent of accountable care organizations (ACOs) to promote accountability by healthcare providers and payors for a patient population, and has established various pilot projects to understand the impact |
4
| | and benefits of various bundled reimbursement methodologies. These new reimbursement methodologies will significantly affect providers that are involved in patient care delivery. Instead of each provider being paid separately for the services performed, one bundled payment will cover the total care provided. New competencies will be needed to coordinate care, manage costs and allocate reimbursement. |
While coverage of uninsured individuals may mean fewer unpaid hospital bills, much of the care provided to the newly insured is expected to be covered by state or federally-sponsored health insurance exchanges that may provide reimbursement at or near current Medicare/Medicaid rates, which are already below the cost of care delivery. Any short-term benefit for healthcare providers may also be offset by a decrease in funding for uncompensated care, reductions in Medicare and Medicaid payments, penalties for adverse outcomes, and the challenges of supporting increased utilization of healthcare services.
| | • | | Government agency reimbursement. Government-mandated billable coding changes continue to present ever greater complexity in the reimbursement process by requiring hospitals to change their systems and processes in order to submit compliant Medicare invoices required for payment, thereby straining existing information technology. For example, U.S. healthcare providers are required to transition from the ICD-9 (International Statistical Classification of Diseases and Related Health Problems) system to ICD-10, a much more complex coding scheme for documenting diagnoses and procedures in order to comply with World Health Organization standards as required by the U.S. Department of Health and Human Services (“HHS”) by October 1, 2014. The ICD-10 coding system totals approximately 155,000 different codes, ten times more than the 14,400 codes found in ICD-9. Healthcare providers, payors and clearinghouses were also required to be compliant with version 5010 of the Health Insurance Portability and Accountability Act (“HIPAA”) transaction and code set standards for eligibility, claims status, referrals, claims and remittances by June 30, 2012. Providers are forced to make investments in technology upgrades, process change and staff training with each of these major regulatory changes. |
CMS has multiple initiatives to prevent improper payments before a claim is paid, and to identify and recover improper payments after a claim has been paid. The Medicare Recovery Audit Contractors (RAC) program identified and corrected $797 million in Medicare overpayments in 2011. This program, which began nationwide in January 2010, requires providers to comply with the audit requests, thereby requiring addition resources and processes for providers. Using the appeals process, healthcare providers were successful in overturning 44% of the appeals in 2011.
| | • | | Managed care reimbursement. Employers typically provide medical benefits to their employees through managed care plans that can offer a variety of indemnity, preferred provider organization (“PPO”), health maintenance organization (“HMO”), point-of-service (“POS”), and consumer-directed health plans. Each of these plans has individual network designs and pre-authorization requirements, as well as co-payment, co-insurance and deductible profiles. These varying profiles are difficult to monitor and frequently result in the submission of invoices that do not comply with applicable payor requirements. |
| | • | | Consumer-directed health plans. According to CMS, consumer out-of-pocket payments for health expenditures increased to $308 billion in 2011 from $209 billion in 2001. Furthermore, many employer-sponsored plans have benefit designs that require large out-of-pocket expenses for individual employees. Traditionally, hospitals and health systems have developed billing and collection processes to interact with government agency and managed care payors on a high-volume, scheduled basis. The advent of consumer-directed healthcare, or high-deductible health insurance plans, requires hospitals and health systems to invoice patients on an individual basis. Many hospitals and health systems do not have the operational or technological infrastructure required to successfully manage a high volume of invoices to individuals. |
Provider Complexities and Pressures
Hospitals and health systems face increasing cost pressures caused by declining reimbursement, overutilization of services, continued increase of supply prices, technological innovation and complexities inherent in procuring the
5
vast number and quantity of supplies and medical devices required for the delivery of care, as well as the anticipated impact of health insurance reform initiatives. Key complexities and pressures include:
| | • | | Increased patient volumes and lower reimbursement from health insurance coverage. While coverage for an estimated 32 million uninsured individuals beginning in 2014 may mean fewer overall unpaid hospital bills as part of PPACA, the care provided to the newly insured is expected to be reimbursed at or near current Medicare/Medicaid rates, which are already below the cost of care delivery. Any short-term benefit for healthcare providers may also be offset by a decrease in funding for uncompensated care, reductions in Medicare and Medicaid payments, penalties for adverse outcomes, and the challenges of supporting increased utilization of healthcare services. |
| | • | | Pricing pressure due to technological innovation. Historically, advances in specific therapies and technologies have resulted in higher-priced supplies for hospitals, which have significantly decreased the profitability associated with a number of the medical procedures that hospitals perform. For implantable medical devices in particular, hospitals often have a limited ability to mitigate high unit costs because practicing physicians, who are usually not employed by the hospital, often prefer to choose the specific devices that will be used in the delivery of care. Furthermore, device vendors frequently market directly to the physicians. Although hospitals are required to procure and pay for these devices, their ability to manage the costs is limited because the hospitals cannot influence the purchasing decision in the same way they are able to with other medical supplies. |
| | • | | Supply chain complexities. Despite the use of GPOs to obtain discounts on supplies, hospitals and health systems often do not optimally manage their supply costs due to decentralized purchasing decisions and varying clinical preferences. In addition, hospital supply procurement is highly complex given the vast number of supplies purchased subject to frequently changing contract terms. As a result, supplies are often purchased without a manufacturer contract, or off-contract, which results in higher prices. Furthermore, hospitals often fail to aggregate purchases of commodity-type supplies to take advantage of discounts based on purchase volume or to recognize when they have qualified for these discounts. |
| | • | | Hospitals focus on quality clinical care. Healthcare organizations have historically devoted the majority of their financial and operational resources to investing in people, technologies and infrastructure that improve the level and quantities of clinical care that they can provide. In part, this focus has been driven by healthcare providers’ historical ability to capture higher reimbursement for innovative, more sophisticated medical procedures and therapeutic specialties. In addition, healthcare executives are worried about reducing waste and unwarranted utilization, and managing horizontally across their organizations. Since these organizations’ overall financial and operational resources are limited, investments in higher quality clinical care have often come at the expense of investment in other infrastructure systems, including revenue capture, billing, and materials management. As a result, existing hospital operations and financial and information systems are often ill-suited to manage the increasing complexity and ongoing changes that are inherent in the current and future reimbursement, supply procurement, clinical care and cost management environment. |
MedAssets Solutions
Our technology-enabled solutions enable healthcare providers, primarily hospitals and health systems, to reverse the trend of expenses increasing at a greater rate than revenue. Our SCM solutions reduce expenses through focused or comprehensive supply chain and clinical resource utilization services that use data and analytics, such as master item files and hospital purchasing data, to identify opportunities for savings and process improvement. This enables us to assist our clients in negotiating discounts on specific high-cost physician preference items and pharmaceuticals, and allows our clients to optimize purchasing of supplies and services as well as to engage physicians in the process to reduce the total cost of care. Our RCM solutions increase net revenue collection rates for healthcare providers by analyzing complex information sets, such as chargemasters and payor rules, to facilitate regulatory compliance and payor requirements, to realize accurate and timely submission and tracking of invoices or claims.
6
Our Competitive Strengths
Key elements of our competitive strengths include:
| | • | | Comprehensive and flexible suite of solutions. Our proprietary applications are primarily delivered through SaaS-based software and are designed to integrate with our clients’ existing systems and work processes, rather than replacing enterprise software systems. As a result, our solutions are scalable and generally require minimal or no upfront investment by our clients. In addition, our products have been recognized as industry leaders, with our payor contract management software tool maintaining its #1 ranking for the last seven years, and our claims management software tool ranking #1 for five out of the last seven years according to KLAS Enterprises LLC, a research firm specializing in monitoring and reporting the performance of healthcare vendors. Moreover, we can offer our clients an opportunity to leverage our comprehensive and flexible set of product and service capabilities in order to help transform their operations through fundamental and sustainable process change and to increase cost savings, revenue capture and/or cash flows. |
| | • | | Leading market position. We believe we are a market leader in each of the two segments in which we operate. This relative market share advantage enables us to invest, at a greater level, in areas of our business to enhance our competitiveness through product innovation and development, sales and client support, as well as employee training and development. |
| | • | | Long-term and expanding client relationships. We collaborate with our clients throughout the duration of our relationships to ensure anticipated financial improvement is realized and to identify additional solutions that can yield incremental financial improvements. Our ability to provide measurable financial improvement and expand the value of our solutions over time has allowed us to develop strong relationships with our clients’ senior management teams. Our collaborative approach and ability to deliver measurable financial improvement has resulted in high retention of our large health system clients and, in turn, a predictable base of stable, recurring revenue. |
| | • | | Superior proprietary data. Our solutions are supported by proprietary databases compiled by leveraging the breadth of our client base and product and service offerings over a period of years. We believe our databases are the industry’s most comprehensive, including our clinical analytic database of inpatient, outpatient, ambulatory surgery and physician encounters of over two billion charge detail records for over 550 clinical programs. MedAssets is able to provide a detail service line analysis that includes benchmarks, pricing targets, and utilization targets. Our proprietary master item file contains approximately two million different product types and models, our chargemaster contains over 230,000 distinct charges, and our claims management, contract management and KnowledgeSource databases contain governmental and other third-party payor rules and comprehensive pricing data. In addition, we integrate a hospital’s revenue cycle and spend management data sets to help ensure that all chargeable supplies are accurately represented in the hospital’s chargemaster, resulting in increased revenue capture and enhanced regulatory compliance. This content also enables us to provide our clients with spend management decision support and analytical services, including the ability to effectively manage and control their contract portfolios and monitor pricing, tiers and market share. The breadth and scale of our client base and product and service offerings enhances our ability to continually update our proprietary databases, ensuring that our data remains current and comprehensive. |
| | • | | Experienced and driven sales force & client management team. We employ highly-trained and focused sales and client service teams of approximately 325 people. Our sales and client service teams provide national coverage for establishing and managing client relationships and maintain close relationships with senior management of hospitals and health systems, as well as other operationally-focused executives involved in areas of revenue cycle management and spend and clinical resource management. Our large sales and client service teams allow us to have personnel that focus on enterprise sales, which we define as selling a comprehensive solution to healthcare providers, and on technical sales, which we define as sales of individual products and services. We utilize a highly consultative sales process during which we gather extensive client financial and operating data that we use to demonstrate that our solutions can yield significant near-term financial improvement. Our sales and client service teams’ compensation is |
7
| | designed to drive profitable growth in sales to both current clients and new prospects, and to support client satisfaction and retention efforts. We expect to use our existing highly consultative sales and client service teams and increased scale to drive additional growth across the combined company’s suite of products and solutions to both new and existing clients. |
| | • | | Proven management team and dynamic culture. Our senior management team has many years of business and healthcare industry experience, and our company has a proven track record of delivering measurable financial improvement for healthcare providers. We believe that our current management team has the expertise and experience to continue to grow our business by executing our strategy without significant additional headcount in senior management positions. Our management team has established a client-driven culture that encourages employees at all levels to focus on identifying and addressing the evolving needs of healthcare providers and has facilitated the integration of acquired companies. |
Our Strategy
Our mission is to partner primarily with healthcare providers to enhance their financial strength through improved operating margins and cash flows. Key elements of our strategy include:
| | • | | Capitalizing on strong industry fundamentals. Our target market has continued to experience growth due to increasing financial pressures faced by hospitals and health systems. These include the increasing complexity of healthcare reimbursement, rising levels of bad debt and uncompensated care, limited access to capital and significant increases in supply utilization and operating costs. We believe there is tremendous pressure on the United States healthcare system to reduce costs and transform the delivery system. Our comprehensive solutions can help our current and prospective clients simultaneously capture greater net revenue, reduce costs, and improve cash flow and operating margins, all of which allows for greater operational efficiency and performance improvement. |
| | • | | Continually improving and expanding our suite of solutions. We intend to continue to deploy our research and development team, proprietary databases and industry knowledge to further integrate our products and services and develop new financial and operational improvement solutions for hospitals and healthcare providers. In addition to our internal research and development, we also will continue to look to expand our portfolio of solutions through strategic partnerships and select acquisitions, if appropriate, that will allow us to offer incremental financial improvement to healthcare providers. Research and development of new products and the successful execution and integration of future acquisitions are integral to our overall strategy as we continue to expand our portfolio of solutions. |
| | • | | Further penetrating our existing client base. We intend to use our long-standing client relationships, large and experienced sales and client service teams, and expanded breadth of SCM and RCM capabilities to increase the penetration rate for our comprehensive suite of solutions with our existing clients. We estimate the addressable market for existing clients to be a $4.4 billion revenue opportunity for our existing products and services. Within our large and diverse client base, many of our clients utilize solutions from only one of our segments, and the vast majority of our clients use less than the full suite of our solutions. |
| | • | | Attracting new clients. We intend to utilize our large and experienced sales team to aggressively seek new clients. We estimate that the addressable market for new clients for our SCM and RCM solutions represents a $4.2 billion revenue opportunity for our existing products and services. We believe that our comprehensive and tailored suite of solutions and ability to demonstrate financial improvement opportunities through our highly-consultative sales process will continue to allow us to successfully differentiate our solutions from those of our competitors. The implementation of comprehensive or outsourced SCM and RCM services represents an additional revenue opportunity of more than $5 billion. |
| | • | | Leveraging operating efficiencies and economies of scale and scope. The design, scalability and scope of our solutions enable us to efficiently deploy a client-specific solution principally through web-based SaaS technologies. As we add new solutions to our portfolio and new clients, we expect to leverage our current capabilities to reduce the average cost of providing our solutions. As clients continue to experience cost pressures, they will be challenged to be able to afford the individual investments needed |
8
| | to operate and compete effectively. We believe demand for our solutions will grow as clients look to leverage our economies of scale and national presence. |
| | • | | Maintaining an internal environment that fosters a strong and dynamic culture. Our management team strives to maintain an organization of individuals who possess a strong work ethic and high integrity, and who are recognized for their dependability and commitment to excellence. We believe that this results in attracting employees who are driven to achieve our long-term mission of being the recognized leader in the markets in which we compete. We believe that dynamic, client-centric thinking will be a catalyst for our continued growth and success. |
Business Segments
We deliver our solutions through two business segments, Spend and Clinical Resource Management (“SCM”) and Revenue Cycle Management (“RCM”), which we previously referred to as our Spend Management Segment. Information about our business segments should be read together with Management’s Discussion and Analysis of Financial Condition and Results of Operations and our consolidated financial statements and related notes included elsewhere in this Annual Report on Form 10-K.
Spend and Clinical Resource Management Segment
Our SCM segment helps our clients manage a substantial portion of their high expense categories through a combination of strategic sourcing and group purchasing services, services that include medical device and clinical resource consulting as well as supply chain outsourcing and procurement services among other capabilities. In addition, we offer sophisticated business intelligence and decision support tools.
Strategic Sourcing
Our SCM segment is the industry leader in cost management capabilities for healthcare providers, managing more than $50 billion of annual supply spend by healthcare providers. We focus on optimizing supply chain performance by identifying and delivering cost savings opportunities through a combination of technology and strategic contracting services to help build customized solutions encompassing the procurement of medical supplies, pharmaceuticals, food and nutrition items and capital equipment. Our strategic sourcing services help clients reduce total supply expense in their major spend areas as well as perform more efficiently and effectively.
| | • | | Group purchasing. We are one of the largest healthcare GPO in the United States. Our national portfolio of over 1,800 contracts with more than 1,150 manufacturers, distributors and other vendors provides our clients with access to a wide range of products and services, including: medical/surgical supplies; pharmaceuticals; laboratory supplies; capital equipment; information technology; food and nutritional products; and purchased services. We use our aggregate purchasing power to negotiate pricing discounts and improved contract terms with vendors. Contracted vendors pay us administrative fees based on the purchase price of goods and services sold to our healthcare provider clients purchasing under the contracts we have negotiated. |
Our contract portfolio is designed to offer our healthcare provider clients with both a flexible solution comprised of multi-sourced supplier contracts, as well as a core group of pre-commitment and/or sole-sourced contracts that offer the significant discounts. Our multi-sourced contracts include pricing tiers based on purchase volume and multiple sources for many products and services. Our pre-commitment or sole-source supplier contracts require that our clients commit to a high percentage of purchase volume from the specified supplier contracts to access greater savings. We constantly evaluate the depth, breadth and competitiveness of our contract portfolio, and we adopted this evolving, driven strategy because of the varying needs of our clients and the significant number of factors, including overall size, service mix, for-profit versus not-for-profit status, and the degree of integration between hospitals in a health system, that influence and dictate their needs.
| | • | | Capital equipment services. We help healthcare providers deploy the right equipment to achieve a lower total cost of ownership. We offer a broad capital equipment contract portfolio, and can provide an assessment of equipment needs to gauge the lifespan of existing equipment, relative to service agreements, clinical utilization, technology trends and replacement/upgrade options. We also provide |
9
| | technology-driven equipment planning to help clients complete their construction or remodeling project on time and under budget. |
| | • | | Construction services. We offer an integrated approach to construction project planning that helps gain greater fiscal control of the building process. Our services include a comprehensive front-end, detailed design/build feasibility study to improve accuracy of budgeting processes for project financing, as well as an engineering/building process to minimize future maintenance and maintain client aesthetics. Overall project management, tracking, monitoring and reporting is delivered through Web-based technology portal, and savings can be achieved from aggregating and coordinating projects scheduled to begin in similar time frames. |
Spend and Clinical Resource Management Services
Our SCM services use a combination of demonstrated best practices, leading-edge technology and experienced consultants to reduce clinical and operational costs and increase operational efficiency. Our focus is on delivering significant and sustainable financial and operational improvement in the following areas:
| | • | | PPI cost and utilization management. Implantable physician preference item, or PPI, costs may represent approximately 40% of the total supply expense of an average hospital. PPI includes expensive medical products and implantable devices (e.g., stents, catheters, heart valves, pacemakers, leads, total joint implants, spine implants and bone products) in the areas of cardiology, orthopedics, neurology, and other highly advanced and innovative service lines, as well as branded pharmaceuticals. We assist healthcare providers with PPI cost reduction by providing data and utilization analyses and pricing targets, and by facilitating the implementation and request for proposal processes for PPI in the following areas: cardiac rhythm management; cardiovascular surgery; orthopedic surgery; spine surgery; interventional procedures; and clinical pharmacy management. |
| | • | | Outsourced services. We have over 450 professionals who oversee the supply chain operations for more than 175 hospitals through the direct management of the sourcing and contracting, purchasing, materials management and inventory management activities. Our teams of embedded employees work with hospital executives to set defined and measurable cost-reduction goals, leverage the most competitive supply contracts, use automation to streamline supply purchases, create new practices to accelerate distribution, and track performance to enable continuous improvement. |
| | • | | Procurement solutions. Through our National Procurement Center, this highly scalable operation handles the purchasing of supply chain products, consumable goods, purchased services and capital equipment for hospitals and other non-acute healthcare provider organizations. This service helps our clients increase efficiency and lower procurement-related expenses. |
| | • | | Workforce management. We help healthcare providers optimize internal and external clinical labor costs without sacrificing quality or service levels. We bring together a combination of our Web-based staff scheduling technology, agency nursing and allied healthcare sourcing, and vendor management services to optimize the staffing process and allow healthcare organizations to spend more time on providing patient care. |
| | • | | Process improvement consulting. Our teams of lean and process improvement experts assess areas for improvement across all major departments and services in a healthcare organization, including the operating room, emergency department, pharmacy department, and nursing floors for example, and implement operational efficiency processes to increase throughput turnaround time, patient satisfaction, and consistency in care delivery. |
| | • | | Comprehensive service line improvement. We assist providers in evaluating their service lines and identifying areas for clinical resource improvement through a rigorous process that includes advanced data analysis of utilization, profitability and other operational metrics. Specific areas of our service line expertise include cardiac and vascular surgery, invasive cardiology and rhythm management, medical cardiology, orthopedic surgery, spine and neurology, and general medicine. We assist organizations in reducing the variation in care delivery across locations and physicians within the health system. |
10
| | • | | Operational performance improvement and advisory solutions. We provide a comprehensive portfolio of evidence-based cost management, clinical utilization and revenue cycle consulting services to help clients improve financial and operational performance across their enterprise. We engage health system leaders and physicians in a data-driven approach to reduce clinical resource consumption, increase service line profitability and improve organizational quality and efficiency. We also offer specialized clinical consulting expertise, shared procurement services, e-commerce, advanced spend analytics, outsourced supply chain services and overall process improvement. In addition, we integrate the delivery of these capabilities with our revenue cycle consulting services to support redesigned workflow and processes, optimized staffing and enhanced utilization of technology to achieve and sustain best practice revenue cycle performance. |
Performance Analytics, Data Management and Decision Support
Our performance analytics and data management tools are an integral part of our SCM solutions. These tools provide transparency into expenses, identify performance deficiencies and areas for operational improvement, and allow for monitoring and measuring results. Key components include:
| | • | | Service line analytics. We offer a Web-based solution, supported by consulting services, for the ongoing control and management of supply costs. Using data from a hospital’s information systems, including clinical, financial and supply-cost data reported by service lines and diagnostic-related groups (“DRGs”), we identify opportunities for cost reduction and develop a management plan to achieve improved operational and financial performance results. |
| | • | | Spend analytics and strategic information services. Our Web-based, spend analytics tools identify saving opportunities by isolating purchases by facility, category, manufacturer or contract, and to also identify identical or similar products available on private or GPO contracts. In addition, we provide our clients with analytical services to help effectively manage pricing and pricing tiers, monitor market share and identify cost-saving alternatives. |
| | • | | E-Commerce. We offer a proprietary e-commerce platform that links clients with their suppliers to automate the supply procurement process. This helps to lower transaction costs and increase labor efficiency and provides deep data and analytics of a client’s own purchasing trends. |
| | • | | E-Procurement. We offer connectivity to supplier content network, which helps to automate and expedite the supply requisition processes |
| | • | | Client master item file services. We believe we have one of the most comprehensive, proprietary supply item databases in the industry. We provide master item file services utilizing our proprietary master item file containing approximately two million items, which allows us to quickly identify and standardize client supply data for timely and accurate reporting. |
| | • | | Electronic contract portfolio catalog. We establish and maintain a web-based contract warehouse that provides visibility, management and control of each client’s supply contract portfolio. |
| | • | | Decision support services. Our decision support software provides clients with an integrated suite of business intelligence tools designed to facilitate hospital decision-making by integrating clinical, financial and operational information into a common data set for accuracy and ease of use across the organization. Key components include budgeting, cost accounting, cost management, contract analytics, clinical analytics and client-defined key performance indicators such as profitability per referring physician and per procedure. |
Revenue Cycle Management Segment
Our RCM segment provides a comprehensive suite of products and services that span what has traditionally been viewed as the hospital revenue cycle. Progressing from a traditional revenue cycle solution, we have expanded the scope of revenue cycle to include products and services that may help to enhance the effectiveness of certain clinical and administrative functions performed within hospitals and health systems. We combine our
11
revenue cycle workflow solutions with business intelligence tools to increase financial improvement opportunities and regulatory compliance for our clients. Our suite of solutions provides us with significant flexibility in meeting client needs. Some clients choose to actively manage their revenue cycle using internal resources that are supplemented with our solutions. Other clients have chosen a more comprehensive solution set that utilizes our full suite of products and services spanning the entire revenue cycle workflow. Regardless of the client approach, we create timely, actionable information from the vast amount of data that exists in underlying client information systems. In so doing, we enable financial improvement through successful process improvement, informed decision making, and implementation.
Revenue Cycle Technology and Services
Healthcare providers face unique content, data management, business process and claims processing challenges and can utilize our solutions to address these issues in the following stages of the revenue cycle workflow:
| | • | | Patient access and financial responsibility. The initial point of patient contact and data collection during the scheduling and admissions process is critical for efficient and effective claim adjudication. Our patient bill estimation, patient access workflow manager and process improvement tools and services promote accurate information and data capture, facilitate communication across revenue cycle operations and assist clients in identifying a patient’s ability to pay and the subsequent collection of payment. |
| | • | | Case management, coding and documentation. Many hospitals need tools and processes to ensure accurate documentation and coding that adheres to complex and changing regulatory and payor requirements. For example, payors deploy reimbursement mechanisms that shift length-of-stay cost risk to providers and necessitate tools and processes to help providers manage ongoing payor authorization and concurrent denials management while the patient is being treated. Our solutions help clients improve workflow and management of covered days and length of stay to prevent denied days and reduced reimbursement in order to negotiate the complexities of documentation and coding and streamline the payor authorization communication channel. In addition, our clinical documentation solution improves the accuracy and completeness of documentation needed for reimbursement. |
| | • | | Charge capture and revenue integrity. Many hospitals need to have processes that ensure implementation of a defensible pricing strategy and compliance with third-party and government payor rules. Our charge integrity solutions help establish and sustain revenue integrity by identifying missed charges on billed claims. Our chargemaster and pricing solutions and workflow capabilities help hospitals accurately capture services rendered and present those services for billing with appropriate and compliant coding consistent with the hospital’s pricing methodology and payor rules. |
| | • | | Strategic pricing. We maintain a proprietary charge benchmark database that we estimate covers services resulting in over 95% of a hospital’s departmental gross revenues. Through our tools, hospitals are able to establish defensible pricing based on comparative charging benchmarks as well as hospital-specific costs and payor contracts to increase revenue while providing transparency to pricing strategies. |
| | • | | Claims processing. Following aggregation of all necessary claim data by a hospital’s patient accounting system, a hospital must deliver claims to payors electronically. Our claims processing tools enhance the process with comprehensive edits and workflow technology to correct non-compliant claims prior to submission. The efficiency that this tool provides expedites processing and, by extension, receipt of cash while reducing the resources required to adjudicate claims. |
| | • | | Denials management and reimbursement integrity. The collection of reimbursable dollars requires successful payor management and communication, and a proactive approach to managing the accuracy of payor reimbursement of claims. Our contract management and denial management solutions help providers hold payors accountable for contracted terms and rates, and identify all underpayments and denials to recover all net revenue owed to our clients for services rendered. We also target problem areas that affect the bottom line to improve collection of receivables due from payors. Our exception-driven receivables workflow provides visibility into the outstanding reimbursable dollars. |
12
| | • | | Bundled payments. Value-based reimbursement is a key initiative of healthcare reform, and our bundled payment solution helps healthcare payors and providers prepare for the significant changes to come in payment structure. Using our proprietary software and consultative knowledge, healthcare organizations are able to create new definitions for new patient episodes of care, implement and monitor fee-for-service claims within episode budgets, report on financial and quality metrics, administer payment reconciliation to each provider involved in the patient case, and monitor and track patients care pathway through the episode of care. |
| | • | | Revenue cycle and supply chain integration. Our CrossWalk® and CrossWalk for Pharmacy solutions, integrate a hospital’s supply chain and revenue cycle to provide side-by-side visibility into supply charge and cost data and the corresponding charges in the hospital’s chargemaster to ensure that all chargeable supplies are accurately represented in the chargemaster. These tools use our proprietary master item file containing approximately four million different product types and models and our proprietary chargemaster containing over 230,000 distinct charges. |
We employ our services and consulting expertise to help clients pinpoint the greatest areas to achieve operational improvements, and implement capabilities to deliver measurable and sustainable financial improvements in the following areas:
| | • | | Revenue recovery and accounts receivable management. Our solutions help to ensure appropriate payment is received for the services provided. We help manage clients’ accounts receivable balance to accelerate payments and to increase net revenues. Our revenue recovery services collect additional cash by detecting inappropriate discounting and inaccurate payments by payors, including silent PPOs, recovering revenue from denied claims and providing Medicare RAC audit review and appeal services. Our extended business office services focus on appeal and recovery of clinical denials, underpayments and breach of contract. |
| | • | | Comprehensive and outsourced services. Our revenue cycle consultants manage and drive best-practice process improvement by developing a data-intensive assessment of revenue cycle performance and a customized plan for redesigning services and solutions. We then implement products and services to transform revenue cycle processes to help provide appropriate payment for services and generate improved margins and cash flow through operational efficiency. |
Other Information About the Business
Clients
As of December 31, 2012, our client base included more than 4,200 acute care hospitals and approximately 122,000 ancillary or non-acute provider locations. Our group purchasing organization has contracts with more than 1,150 manufacturers, distributors and other vendors that pay us administrative fees based on purchase volume by our healthcare provider clients. The diversity of our large client base ensures that our success is not tied to a single healthcare provider or GPO vendor. Our clients are located primarily throughout the United States and, to a lesser extent, Canada.
Strategic Business Alliances
We complement our existing products and services and research and development (“R&D”) activities by entering into strategic business relationships with companies whose products and services complement our solutions. We also have co-marketing arrangements with entities whose products and services complement our solutions, such as financial eligibility qualification and registration quality as patients are being admitted into the hospital.
In addition to our employed sales force, we maintain business relationships with a number of other group purchasing and marketing affiliates that market or support our products or services. We refer to these individuals and organizations as affiliates or affiliate partners. These affiliate partners, which typically provide a limited number of services on a regional basis, are responsible for the recruitment and direct management of healthcare providers in both the acute care and non-acute markets. Through our relationship with these affiliate partners, we are able to offer a range of solutions to these providers, including both spend management and revenue cycle
13
management products and services, with minimal investment in additional time and resources. Our affiliate relationships provide a cost-effective way to serve certain markets, such as non-acute healthcare providers.
Competition
The market for our products and services is fragmented, intensely competitive and characterized by the frequent introduction of new products and services, rapidly evolving industry standards, technology and client needs. We have experienced and expect to continue to experience intense competition from a number of companies.
Our revenue cycle management solutions compete with products and services provided by large, well-financed and technologically sophisticated entities, including healthcare information technology providers such as Allscripts Corporation, Epic Systems Corporation, McKesson Corporation and Siemens AG; consulting and outsourcing firms such as Accenture Ltd., Accretive Health, Inc., Deloitte & Touche LLP, Ernst & Young LLP, Huron Consulting, Inc., Navigant Consulting, Inc., PricewaterhouseCoopers LLP and The Advisory Board Company; and providers of competitive products and services such as Conifer (a subsidiary of Tenet Healthcare), Craneware Inc., Emdeon Inc., Optum (a subsidiary of UnitedHealth Group, Inc.), Parallon (a subsidiary of HCA, Inc.), Passport Health Communications, Inc., RelayHealth (a subsidiary of McKesson Corporation) and The SSI Group, Inc. We also compete with hundreds of smaller niche companies.
Within our SCM segment, in addition to a number of the consulting firms listed above, our primary competitors are GPOs. There are more than 600 GPOs in the United States, the vast majority of which negotiate minor agreements with regional vendors for services. Five GPOs, including us, account for approximately 85 percent of the market. We primarily compete with Amerinet Inc., HealthTrust LLC, Novation LLC and Premier, Inc.
We compete on the basis of several factors, including:
| | • | | ability to deliver financial improvement and return on investment through the use of products and services; |
| | • | | breadth, depth and quality of product and service offerings; |
| | • | | quality and reliability of services, including client support; |
| | • | | ease of use and convenience; |
| | • | | ability to integrate services with existing technology; |
We believe that our ability to deliver measurable financial improvement and the breadth of our full suite of solutions give us a competitive advantage in the marketplace.
Employees
As of December 31, 2012, we had approximately 3,100 full time employees.
Government Regulation
The healthcare industry is highly regulated and is subject to changing political, legislative, regulatory and other influences. Existing and new federal and state laws and regulations affecting the healthcare industry could create unexpected liabilities for us, could cause us or our clients to incur additional costs and could restrict our or our client’s operations. Many healthcare laws are complex and their application to us, our clients or the specific services and relationships we have with our clients are not always clear. In particular, many existing healthcare laws and regulations, when enacted, did not anticipate the comprehensive products and revenue cycle management and spend management solutions that we provide, and these laws and regulations may be applied to our products and services in ways that we do not anticipate. Our failure to accurately anticipate the application of these laws and regulations, or our other failure to comply, could create liability for us, result in adverse publicity
14
and negatively affect our business. See the “Risk Factors” section herein for more information regarding the impact of government regulation on our Company.
Intellectual Property
Our success as a company depends upon our ability to protect our core technology and intellectual property. To accomplish this, we rely on a combination of intellectual property rights, trade secrets, copyrights and trademarks, as well as customary contractual protections.
We generally control access to, and the use of, our proprietary software and other confidential information. This protection is accomplished through a combination of internal and external controls, including protective provisions in contracts with employees, contractors, clients, and partners, and through a combination of U.S. and international copyright laws. We license some of our software pursuant to agreements that impose restrictions on our clients’ ability to use such software, such as prohibiting reverse engineering and limiting the use of copies. We also seek to avoid disclosure of our intellectual property by relying on non-disclosure and assignment of intellectual property agreements with our employees and consultants that acknowledge our exclusive ownership of all intellectual property developed by the individual during the course of his or her work with us. The agreements also require that each person maintain the confidentiality of all proprietary information disclosed to them.
We incorporate a number of third party software programs into certain of our software and information technology platforms pursuant to license agreements. Some of this software is proprietary and some is open source. We use third-party software to, among other things, maintain and enhance content generation and delivery, and support our technology infrastructure. Although we rely on multiple licenses from various third parties, we do not consider such licenses to be individually material to our business given the “off-the-shelf” nature of these licenses and that standard operating procedures and practices utilized by these third parties would generally afford us sufficient time to effectively transition to other readily available sources without long-term impact to our business.
We have registered, or have pending applications for the registration of, certain of our trademarks. We actively manage our trademark portfolio, maintain long-standing trademarks that are in use and file applications for trademark registrations for new brands in all relevant jurisdictions.
Research and Development
Our research and development expenditures primarily consist of our investment in internally developed software. We incurred $68.7 million, $58.8 million and $38.0 million for R&D activities in 2012, 2011 and 2010, respectively, and we capitalized 58.5%, 54.4% and 47.3% of these expenses, respectively. As of December 31, 2012, our software development, product management and quality assurance activities involved approximately 400 employees. We expect to incur significant R&D costs in the future due to our continuing investment in internally developed software as we intend to release new features and functionality, expand our content offerings, upgrade and extend our service offerings, and develop new technologies.
Information Availability
Our Annual Reports on Form 10-K, Quarterly Reports on Form 10-Q, Current Reports on Form 8-K and amendments to those reports filed or furnished pursuant to Section 13(a) or 15(d) of the Securities Exchange Act of 1934 (the “Exchange Act”), as amended, are available free of charge on our website (www.medassets.com under the “Investor Relations” caption) as soon as reasonably practicable after we electronically file such material with, or furnish it to, the Securities and Exchange Commission (the “SEC”). The content on any website referred to in this Annual Report on Form 10-K is not incorporated by reference into this report, unless expressly noted otherwise.
Although it is not possible to predict or identify all risks and uncertainties that could cause actual results to differ materially from those anticipated, projected or implied in any forward-looking statement, you should
15
carefully consider the risk factors discussed below which constitute material risks and uncertainties known to us that we believe could affect our future growth, results of operations, performance and business prospects and opportunities. You should not consider this list to be a complete statement of all the potential risks and uncertainties regarding our business and the trading price of our securities. Additional risks not presently known to us, or which we currently consider immaterial, may adversely impact our business and the trading price of our securities.
Risks Related to Our Business
We face intense competition, which could limit our ability to maintain or expand market share within our industry, and if we do not maintain or expand our market share, our business and operating results will be harmed.
The market for our products and services is fragmented, intensely competitive and characterized by the frequent introduction of new products and services and by rapidly evolving industry standards, technology and client needs. Our revenue cycle management products and services compete with products and services provided by large, well-financed and technologically-sophisticated entities, including: information technology providers such as Allscripts Corporation, Epic Systems Corporation, McKesson Corporation and Siemens AG; consulting and outsourcing firms such as Accenture Ltd., Accretive Health, Inc., Deloitte & Touche LLP, Ernst & Young LLP, Huron Consulting, Inc., Navigant Consulting, Inc., PricewaterhouseCoopers LLP and The Advisory Board Company; and providers of competitive products and services such as Conifer (a subsidiary of Tenet Healthcare), Craneware Inc., Emdeon Inc., Optum (a subsidiary of UnitedHealth Group, Inc.), Parallon (a subsidiary of HCA, Inc.), Passport Health Communications, Inc., RelayHealth (a subisidiary of McKesson Corporation) and The SSI Group, Inc. We also compete with hundreds of smaller niche companies. The primary competitors to our SCM products and services are other large GPOs, such as Amerinet Inc., HealthTrust LLC, Novation LLC and Premier, Inc., as well as a number of the consulting firms named above.
With respect to both our RCM and SCM products and services, we compete on the basis of several factors, including breadth, depth and quality of product and service offerings, ability to deliver financial improvement through the use of products and services, quality and reliability of services, ease of use and convenience, brand recognition, ability to integrate services with existing technology and price. Many of our competitors are more established, benefit from greater name recognition, have larger client bases and have substantially greater financial, technical and marketing resources. Other of our competitors have proprietary technology that differentiates their product and service offerings from ours. As a result of these competitive advantages, our competitors and potential competitors may be able to respond more quickly to market forces, undertake more extensive marketing campaigns for their brands, products and services and make more attractive offers to clients. In addition, many GPOs are owned by the provider-clients of the GPO, which enables our competitors to distinguish themselves on that basis.
We cannot be certain that we will be able to retain our current clients or expand our client base in this competitive environment. If we do not retain current clients or expand our client base, our business and results of operations will be harmed. Additionally, as a result of larger agreements that we have entered into in the recent past with certain of our clients, a larger portion of our revenue is now attributable to a smaller group of clients. Although no single client accounted for more than ten percent of our total net revenue as of December 31, 2012, any significant loss of business from these large clients could have a material adverse effect on our business, results of operations and financial condition. Moreover, we expect that competition will continue to increase as a result of consolidation in both the information technology and healthcare industries. If one or more of our competitors or potential competitors were to merge or partner with another of our competitors, the change in the competitive landscape could also adversely affect our ability to compete effectively and could harm our business. Many healthcare providers are consolidating to create integrated healthcare delivery systems with greater market power and regulatory and economic conditions may encourage additional consolidation. Some of these large systems may choose to contract directly with vendors for some supply categories; just as some vendors may seek to contract directly with providers rather than with GPOs. Additionally, providers could choose to create their own GPOs. As the healthcare industry consolidates, competition to provide services to industry participants will become more intense and the importance of existing relationships with industry participants will become greater.
16
We may face pricing pressures that could limit our ability to maintain or increase prices for our products and services.
We may be subject to pricing pressures with respect to our future sales arising from various sources, including, without limitation, competition within the industry, consolidation of healthcare industry participants, practices of managed care organizations, government action affecting reimbursement and clients who experience significant financial stress. If our competitors are able to offer products and services that result, or that are perceived to result, in client financial improvement that is substantially similar to or better than the financial improvement generated by our products and services, we may be forced to compete on the basis of additional attributes, such as price, to remain competitive. As healthcare providers consolidate to create integrated healthcare delivery systems with greater market power, these providers may try to use their market power to negotiate fee reductions for our products and services. If we cannot demonstrate the ability to increase vendor market share of healthcare provider purchases through our GPO, we may have less negotiating leverage with our contracted vendors which may result in our inability to maintain our client agreements or win new business. Additionally, our clients and the other entities with which we have a business relationship are affected by changes in regulations and limitations in governmental spending for Medicare and Medicaid programs. Government actions could limit government spending for the Medicare and Medicaid programs, limit payments to healthcare providers, and increase emphasis on competition and other programs that could have an adverse effect on our clients and the other entities with which we have a business relationship. Pricing pressure may also be exacerbated if our current and prospective clients do not benefit from any broader economic recovery.
If our pricing experiences significant downward pressure, our business will be less profitable and our results of operations will be adversely affected. In addition, because cash flow from operations funds our working capital requirements, reduced profitability could require us to raise additional capital sooner than we would otherwise need.
If we are not able to offer new and valuable products and services, we may not remain competitive and our revenue and results of operations may suffer.
Our success depends on providing products and services that healthcare providers use to improve financial performance. Our competitors are constantly developing products and services that may become more efficient or appealing to our clients. Our products may become obsolete in light of rapidly evolving industry standards, technology and client needs, including changing regulations and provider reimbursement policies, such as the transition from fee-for-service reimbursement models to value-based payment, bundled payment and episodic care models. Additionally, some healthcare information technology providers have begun to incorporate enhanced revenue cycle management analytical tools and functionality into their core product and service offerings used by healthcare providers. These developments may adversely impact the demand for our products and services. We must continue to invest significant resources in research and development in order to enhance our existing products and services, maintain or improve our product category rankings and introduce new high-quality products and services that clients and potential clients will want. Many of our client relationships are nonexclusive or terminable on short notice, or otherwise terminable after a specified term. If our new or modified product and service innovations are not responsive to client preferences or industry or regulatory changes, are not appropriately timed with market opportunity, or are not effectively brought to market, we may lose existing clients and be unable to obtain new clients and our results of operations may suffer.
We may experience significant delays in generating, or an inability to generate, revenues if potential clients take a long time to evaluate our products and services.
A key element of our strategy is to market our products and services directly to large healthcare providers, such as health systems and acute care hospitals and to increase the number of our products and services utilized by existing clients. The evaluation process is often lengthy and involves significant technical evaluation and commitment of personnel by these organizations. The use of our products and services may also be delayed due to an inability or reluctance to change or modify existing procedures. Additionally, healthcare providers’ resources may be focused on other mission critical initiatives which could delay their evaluation of our products and services. If we are unable to sell additional products and services to existing clients, or enter into and maintain favorable relationships with other large healthcare providers, our revenue could grow at a slower rate or even decrease.
17
Unsuccessful implementation of our products and services with our clients may harm our future financial success.
Some of our new-client projects are complex and require lengthy and significant work to implement our products and services. Each client’s situation may be different, and unanticipated difficulties and delays may arise as a result of failure by us or by the client to meet respective implementation responsibilities. If the client implementation process is not executed successfully or if execution is delayed, our relationships with some of our clients, and our results of operations may be adversely impacted. In addition, cancellation of any implementation of our products and services after it has begun may involve the loss to us of time, effort and resources invested in the cancelled implementation as well as lost opportunity for acquiring other clients over that same period of time. These factors may contribute to substantial fluctuations in our quarterly operating results.
If we are unable to maintain our strategic alliances or enter into new alliances, we may be unable to grow our current base business.
Our business strategy includes entering into strategic alliances and affiliations with leading healthcare service and information technology providers. We work closely with our strategic partners to either expand our penetration in certain areas or classes of trade, or expand our market capabilities. We may not achieve our objectives through these alliances. Many of these companies have multiple relationships and they may not regard us as significant to their business. These companies may pursue relationships with our competitors or develop or acquire products and services that compete with our products and services. In addition, in many cases, these companies may terminate their relationships with us with little or no notice. If existing alliances are terminated or we are unable to enter into alliances with leading healthcare service and information technology providers, we may be unable to maintain or increase our market presence.
If the protection of our intellectual property is inadequate, our competitors may gain access to our technology or confidential information and we may lose our competitive advantage.
Our success as a company depends in part upon our ability to protect our core technology and intellectual property. To accomplish this, we rely on a combination of intellectual property rights, including trade secrets, copyrights and trademarks, as well as customary contractual protections.
We utilize a combination of internal and external measures to protect our proprietary software and confidential information. Such measures include contractual protections with employees, contractors, clients, and partners, as well as U.S. copyright laws.
We protect the intellectual property in our software pursuant to customary contractual protections in our agreements that impose restrictions on our clients’ ability to use such software, such as prohibiting reverse engineering and limiting the use of copies. We also seek to avoid disclosure of our intellectual property by relying on non-disclosure and intellectual property assignment agreements with our employees and consultants that acknowledge our ownership of all intellectual property developed by the individual during the course of his or her work with us. The agreements also require each person to maintain the confidentiality of all proprietary information disclosed to them. Other parties may not comply with the terms of their agreements with us, and we may not be able to enforce our rights adequately against these parties. The disclosure to, or independent development by, a competitor of any trade secret, know-how or other technology not protected by a patent could materially adversely affect any competitive advantage we may have over any such competitor.
We cannot assure you that the steps we have taken to protect our intellectual property rights will be adequate to deter misappropriation of our rights or that we will be able to detect unauthorized uses of our proprietary products and services and take timely and effective steps to enforce our rights. If unauthorized uses were to occur, we might be required to engage in costly and time-consuming litigation to enforce our rights. We cannot assure you that we would prevail in any such litigation. If others were able to use our intellectual property, our business could be subject to greater pricing pressure.
18
If we are alleged to have infringed on the rights of others, we could incur unanticipated costs and be prevented from providing our products and services.
We could be subject to intellectual property infringement claims as the number of our competitors grows and our applications’ functionality overlaps with competitor products. While we do not believe that we have infringed or are infringing on any proprietary rights of third parties, we cannot assure you that infringement claims will not be asserted against us or that those claims will be unsuccessful. Any intellectual property rights claim against us or our clients, with or without merit, could be expensive to litigate, cause us to incur substantial costs and divert management resources and attention in defending the claim. Furthermore, a party making a claim against us could secure a judgment awarding substantial damages, as well as injunctive or other equitable relief that could effectively block our ability to provide products or services. In addition, we cannot assure you that licenses for any intellectual property of third parties that might be required for our products or services will be available on commercially reasonable terms, or at all. As a result, we may also be required to develop alternative non-infringing technology, which could require significant effort and expense.
In addition, a number of our contracts with our clients contain indemnity provisions whereby we indemnify them against certain losses that may arise from third-party claims that are brought in connection with the use of our products.
Our exposure to risks associated with the use of intellectual property may be increased as a result of acquisitions, as we have limited visibility into the development process with respect to such technology or the care taken to safeguard against infringement risks. In addition, third parties may make infringement and similar or related claims after we have acquired technology that had not been asserted prior to our acquisition.
Our sources of data might restrict our use of or refuse to license data, which could adversely impact our ability to provide certain products or services.
A portion of the data that we use is either purchased or licensed from third parties or is obtained from our clients for specific client engagements. We also obtain a portion of the data that we use from public records. We believe that we have all rights necessary to use the data that is incorporated into our products and services. However, in the future, data providers could withdraw their data from us if there is a competitive reason to do so; if legislation is passed restricting the use of the data; or if judicial interpretations are issued restricting use of the data that we currently use in our products and services. Further, we cannot assure you that our licenses for information will allow us to use that information for all potential or contemplated applications and products. If a substantial number of data providers were to withdraw their data, our ability to provide products and services to our clients could be materially adversely impacted.
Our use of “open source” software could adversely affect our ability to sell our products and subject us to possible litigation.
The products or technologies acquired, licensed or developed by us may incorporate so-called “open source” software, and we may incorporate open source software into other products in the future. Such open source software is generally licensed by its authors or other third parties under open source licenses, including, for example, the GNU General Public License, the GNU Lesser General Public License, “Apache-style” licenses, “Berkeley Software Distribution,” “BSD-style” licenses and other open source licenses. We attempt to monitor our use of open source software in an effort to avoid subjecting our products to conditions we do not intend; however, there can be no assurance that our efforts have been or will be successful. There is little or no legal precedent governing the interpretation of many of the terms of certain of these licenses, and therefore the potential impact of these terms on our business is somewhat unknown and may result in unanticipated obligations regarding our products and technologies. For example, we may be subjected to certain conditions, including requirements that we offer our products that use particular open source software at no cost to the user; that we make available the source code for modifications or derivative works we create based upon, incorporating or using the open source software; and/or that we license such modifications or derivative works under the terms of the particular open source license.
If an author or other party that distributes such open source software were to allege that we had not complied with the conditions of one or more of these licenses, we could be required to incur significant legal
19
costs defending ourselves against such allegations. If our defenses were not successful, we could be subject to significant damages; be enjoined from the distribution of our products that contained the open source software; and be required to comply with the foregoing conditions, which could disrupt the distribution and sale of some of our products. In addition, if we combine our proprietary software with open source software in a certain manner, under some open source licenses we could be required to release the source code of our proprietary software, which could substantially help our competitors develop products that are similar to or better than ours.
Our failure to license and integrate third-party technologies could harm our business.
We depend upon licenses from third-party vendors for some of the technology and data used in our applications, and for some of the technology platforms upon which these applications are built and operate, including Microsoft and Oracle. We also integrate into our proprietary applications and use third-party software to maintain and enhance, among other things, content generation and delivery, and to support our technology infrastructure. Some of this software is proprietary and some is open source. These technologies may not be available to us in the future on commercially reasonable terms or at all and could be difficult to replace once integrated into our own proprietary applications (although we currently believe this risk is remote given the “off-the-shelf” nature of these licenses and that standard operating procedures and practices utilized by these third parties would generally afford us sufficient time to effectively transition to other readily available sources without significant long-term impact to our business). Most of these licenses can be renewed only by mutual consent and may be terminated if we breach the terms of the license and fail to cure the breach within a specified period of time. Our inability to obtain any of these licenses could delay development until equivalent technology can be identified, licensed and integrated, which will harm our business, financial condition and results of operations.
Most of our third-party licenses are non-exclusive and our competitors may obtain the right to use any of the technology covered by these licenses to compete directly with us. Our use of third-party technologies exposes us to increased risks, including, but not limited to, risks associated with the integration of new technology into our solutions, the diversion of our resources from development of our own proprietary technology and our inability to generate revenue from licensed technology sufficient to offset associated acquisition and maintenance costs. In addition, if our vendors choose to discontinue support of the licensed technology in the future, we might not be able to modify or adapt our own solutions.
We may experience difficulties in integrating the MedAssets and Broadlane product portfolios, and our ability to achieve cost and revenue benefits from this integration may not be realized fully (or at all) and may take longer to realize than expected.
Our future performance may be impacted by our success in integrating the Broadlane product portfolio (our largest acquisition to date) into the existing MedAssets portfolio. Delays or unexpected difficulties or additional costs associated with our product portfolio integration process could have a material adverse effect on our business, financial condition and results of operations. This integration may not result in the realization of the full benefit of anticipated revenue-related synergies and other benefits that we expect. We cannot assure you that we will successfully integrate the MedAssets and Broadlane product portfolios or achieve the desired benefits from the Broadlane Acquisition within a reasonable period of time or at all.
We intend to continue to pursue acquisition opportunities, which may subject us to considerable business and financial risk.
We have grown through, and anticipate that we will continue to grow through, acquisitions of competitive and complementary businesses. We evaluate potential acquisitions on an ongoing basis and regularly pursue acquisition opportunities. We may not be successful in identifying acquisition opportunities, assessing the value, strengths and weaknesses of these opportunities and consummating acquisitions on acceptable terms. Furthermore, suitable acquisition opportunities may not be made available or known to us. In addition, we may compete for certain acquisition targets with companies having greater financial resources than we do and may expend significant resources in acquisition attempts that prove unsuccessful. We anticipate that we may finance acquisitions through cash provided by operating activities, borrowings under our credit facility, other indebtedness and issuances of equity. Borrowings necessary to finance acquisitions may not be available on
20
terms acceptable to us, or at all. Future acquisitions may also result in potentially dilutive issuances of equity securities. Acquisitions may expose us to particular business and financial risks that include, but are not limited to:
| | • | | diverting management’s attention; |
| | • | | incurring additional indebtedness and assuming liabilities, known and unknown; |
| | • | | incurring significant additional capital expenditures, transaction and operating expenses and other acquisition-related charges; |
| | • | | experiencing an adverse impact on our earnings from the amortization of acquired intangible assets, as well as from any future impairment of goodwill and other acquired intangible assets as a result of certain economic, competitive or regulatory changes impacting the fair value of these assets; |
| | • | | failing to integrate the operations and personnel of the acquired businesses; |
| | • | | entering new markets with which we are not familiar; and |
| | • | | failing to retain key personnel, vendors and clients of the acquired businesses. |
If we are unable to successfully implement our acquisition strategy or address the risks associated with acquisitions, or if we encounter unforeseen expenses, difficulties, complications or delays frequently encountered in connection with the integration of acquired entities and the expansion of operations, our growth and ability to compete may be impaired, we may fail to achieve anticipated cost-savings and we may be required to focus resources on integration of operations rather than on our primary product and service offerings.
Our indebtedness could adversely affect our financial health and reduce the funds available to us for other purposes.
We have and may continue to have a significant amount of indebtedness. On December 13, 2012, we entered into a new credit agreement consisting of a five-year $250 million senior secured term A loan facility (“Term A Facility”), a seven-year $300 million senior secured term B loan facility (“Term B Facility”) and a five-year $200 million senior secured revolving credit facility, including a letter of credit sub-facility of $25 million and a swing line sub-facility of $25 million. In addition, on November 16, 2010, we issued an aggregate principal amount of $325 million of senior notes due 2018. At December 31, 2012, we had total indebtedness of approximately $885 million.
Our substantial indebtedness could adversely affect our financial health in the following ways:
| | • | | a material portion of our cash flow from operations must be dedicated to the payment of interest on and principal of our outstanding indebtedness, thereby reducing the funds available to us for other purposes, including working capital, acquisitions and capital expenditures; |
| | • | | our substantial degree of leverage could make us more vulnerable in the event of a downturn in general economic conditions or other adverse events in our business or our industry; |
| | • | | our substantial degree of leverage could impair our ability to obtain additional financing for working capital, capital expenditures, acquisitions or general corporate purposes limiting our ability to maintain the value of our assets and operations; and |
| | • | | our revolving credit facility matures in December 2017, our Term A Facility matures in December 2017 and our Term B Facility matures in December 2019 (although our Term B Facility will mature on May 15, 2018 if our senior notes have not been repaid or refinanced in full by such date) . If cash flow from operations is less than our debt service responsibilities, we may face financial risk that could increase interest expense and hinder our ability to refinance our debt obligations. |
In addition, our credit facilities and the indenture governing our senior notes contain, and agreements governing future indebtedness may contain, financial and other restrictive covenants, ratios and tests that limit our ability to incur additional debt and engage in other activities that may be in our long-term best interests. For
21
example, our credit facilities and indenture include covenants restricting, among other things, our ability to incur indebtedness, create liens on assets, engage in certain lines of business, engage in certain mergers or consolidations, dispose of assets, make certain investments or acquisitions, engage in transactions with affiliates, enter into sale leaseback transactions, enter into negative pledges or pay dividends or make other restricted payments. Our credit facilities also include financial covenants, including requirements that we maintain compliance with a total leverage ratio and an interest coverage ratio.
Our ability to comply with the covenants and ratios contained in our credit facilities and indenture or in the agreements governing our future indebtedness may be affected by events beyond our control, including prevailing economic, financial and industry conditions. Our credit facilities and indenture prohibit us from making dividend payments on our common stock if we are not in compliance with our restricted payment covenants. If we were to experience any future event of default, if not waived or cured, it could result in the acceleration of the maturity of our indebtedness under our credit facilities and indenture. If we were unable to repay those amounts, the lenders under our credit facilities could proceed against the security granted to them to secure that indebtedness. If the lenders accelerate the payment of our indebtedness, our assets may not be sufficient to repay in full such indebtedness.
We may need to obtain additional financing which may not be available or, if it is available, may result in a reduction in the percentage ownership of our existing stockholders.
We may need to raise additional funds in order to:
| | • | | finance unanticipated working capital requirements; |
| | • | | develop or enhance our technological infrastructure and our existing products and services; |
| | • | | fund strategic relationships; |
| | • | | respond to competitive pressures; and |
| | • | | acquire complementary businesses, technologies, products or services. |
Additional financing may not be available on terms favorable to us, or at all. If adequate funds are not available or are not available on acceptable terms, our ability to fund our expansion, take advantage of unanticipated opportunities, develop or enhance technology or services or otherwise respond to competitive pressures would be significantly limited. If we raise additional funds by issuing equity or convertible debt securities, the percentage ownership of our then-existing stockholders may be reduced, and these securities may have rights, preferences or privileges senior to those of our existing stockholders.
If we are required to collect sales and use taxes on the solutions we sell in certain jurisdictions, we may be subject to tax liability for past sales and our future sales may decrease.
Rules and regulations applicable to sales and use tax vary significantly from state to state. In addition, the applicability of these rules given the nature of our products and services is subject to change.
We may lose sales or incur significant costs should various tax jurisdictions be successful in imposing sales and use taxes on a broader range of products and services. A successful assertion by one or more tax jurisdictions that we should collect sales or other taxes on the sale of our solutions could result in substantial tax liabilities for past sales, decrease our ability to compete and otherwise harm our business.
If one or more taxing authorities determines that taxes should have, but have not, been paid with respect to our services, we may be liable for past taxes in addition to taxes going forward. Liability for past taxes may also include very substantial interest and penalty charges. If we are required to collect and pay back taxes and the associated interest and penalties and if our clients fail or refuse to reimburse us for all or a portion of these amounts, we will have incurred unplanned costs that may be substantial. Moreover, imposition of such taxes on our services going forward will effectively increase the cost of such services to our clients and may adversely affect our ability to retain existing clients or to gain new clients in the areas in which such taxes are imposed.
22
Any significant increase in bad debt in excess of recorded estimates would have a negative impact on our business, financial condition and results of operations.
We initially evaluate the collectability of our accounts receivable based on a number of factors, including a specific client’s ability to meet its financial obligations to us, the length of time the receivables are past due and historical collections experience. Based on these assessments, we record a reserve for specific account balances as well as a general reserve based on our historical experience for bad debt to reduce the related receivables to the amount we expect to collect from clients. Many of our clients are under intense financial pressure and their operations are characterized by declining or negative margins. If circumstances related to specific clients worsen, especially those of our larger clients, as a result of economic conditions or otherwise, such as a limited ability to meet financial obligations due to bankruptcy, or if conditions deteriorate such that our past collection experience is no longer relevant, the amount of accounts receivable that we are able to collect may be less than our previous estimates as we experience bad debt in excess of reserves previously recorded.
Our quarterly results of operations have fluctuated in the past and may continue to fluctuate in the future as a result of certain factors, some of which may be outside of our control.
Certain of our client contracts contain terms that result in revenue that is deferred and cannot be recognized until the occurrence of certain events. For example, accounting principles do not allow us to recognize revenue associated with the implementation of products and services until the implementation has been completed, at which time we begin to recognize revenue over the life of the contract or the estimated client relationship period, whichever is longer. In addition, subscription-based fees generally commence only upon completion of implementation. As a result, the period of time between contract signing and recognition of associated revenue may be lengthy, and we are not able to predict with certainty the period in which implementation will be completed.
Certain of our contracts provide that some portion or all of our fees are at risk and refundable if our products and services do not result in the achievement of certain financial performance targets. To the extent that any revenue is subject to contingency for the non-achievement of a performance target, we only recognize revenue upon client confirmation that the financial performance targets have been achieved. If a client fails to provide such confirmation in a timely manner, our ability to recognize revenue will be delayed. Additionally, certain of our contracts include the potential for performance bonuses, which we may or may not earn when expected or at all.
Our SCM segment relies on participating vendors to provide periodic reports of their sales volumes to our clients and resulting administrative fees to us. If a vendor fails to provide such reporting in a timely and accurate manner, our ability to recognize administrative fee revenue will be delayed or prevented.
Certain of our fees are based on timing and volume of client invoices processed and payments received, which are often dependent upon factors outside of our control.
Other fluctuations in our quarterly results of operations may be due to a number of other factors, some of which are not within our control, including:
| | • | | the extent to which our products and services achieve or maintain market acceptance; |
| | • | | the purchasing and budgeting cycles of our clients; |
| | • | | the lengthy sales cycles for our products and services; |
| | • | | the impact of transaction fee and contingency fee arrangements with clients; |
| | • | | changes in our or our competitors’ pricing policies or sales terms; |
| | • | | the timing and success of our or our competitors’ new product and service offerings; |
| | • | | client decisions, especially those involving our larger client relationships, regarding renewal or termination of their contracts; |
23
| | • | | the amount and timing of operating costs related to the maintenance and expansion of our business, operations and infrastructure; |
| | • | | the amount and timing of costs related to the development or acquisition of technologies or businesses; |
| | • | | the financial condition of our current and potential clients; |
| | • | | unforeseen legal expenses, including litigation and settlement costs; and |
| | • | | general economic, industry and market conditions and those conditions specific to the healthcare industry. |
We base our expense levels in part upon our expectations concerning future revenue, and these expense levels are relatively fixed in the short term. If we have lower revenue than expected, we may not be able to reduce our spending in the short term in response. Any significant shortfall in revenue would have a direct and material adverse impact on our results of operations. We believe that our quarterly results of operations may vary significantly in the future and that period-to-period comparisons of our results of operations may not be meaningful. You should not rely on the results of one quarter as an indication of future performance. If our quarterly results of operations fall below the expectations of securities analysts or investors, the price of our common stock could decline substantially.
If we lose key personnel or if we are unable to attract, hire, integrate and retain key personnel, our business would be harmed.
Our future success depends in part on our ability to attract, hire, integrate and retain key personnel. Our future success also depends on the continued contributions of our executive officers and other key personnel, each of whom may be difficult to replace. The loss of services of any of our executive officers or key personnel could have a material adverse effect on our business. The replacement of any of these key individuals would involve significant time and expense and may significantly delay or prevent the achievement of our business objectives.
Risks Related to Our Product and Service Offerings
If our products fail to perform properly due to undetected errors or similar problems, our business could suffer.
Because of the large amount of data that we collect and manage, it is possible that hardware failures or errors in our systems could result in data loss or corruption or cause the information that we collect to be incomplete or contain inaccuracies that our clients regard as significant. Complex software such as ours may contain errors or failures that are not detected until after the software is introduced or updates and new versions are released. We continually introduce new software and updates and enhancements to our software. Despite testing by us, from time to time we have discovered defects or errors in our software, and such defects or errors may be discovered in the future. Defects and errors that are not timely detected and remedied could expose us to risk of liability to clients and the government and could cause delays in the introduction of new products and services, result in increased costs and diversion of development resources, require design modifications, decrease market acceptance or client satisfaction with our products and services or cause harm to our reputation. If any of these events occur, it could materially adversely affect our business, financial condition or results of operations.
Furthermore, our clients might use our software together with products from other companies. As a result, when problems occur, it might be difficult to identify the source of the problem. Even when our software does not cause these problems, the existence of these errors might cause us to incur significant costs, divert the attention of our technical personnel from our product development efforts, impact our reputation and lead to significant client relations problems.
If our products or services fail to provide accurate information, or if our content or any other element of our products or services is associated with incorrect, inaccurate or faulty coding, billing, or claims submissions to Medicare or any other third-party payor, we could be liable to clients or the government which could adversely affect our business.
Our products and content were developed based on the laws, regulations and third-party payor rules in existence at the time such software and content was developed. If we interpret those laws, regulations or rules
24
incorrectly; the laws, regulations or rules materially change at any point after the software and content was developed; we fail to provide up-to-date, accurate information; or our products, or services are otherwise associated with incorrect, inaccurate or faulty coding, billing or claims submissions, then clients could assert claims against us or the government or qui tam relators on behalf of the government could assert claims against us under the Federal False Claims Act or similar state laws. The assertion of such claims and ensuing litigation, regardless of its outcome, could result in substantial costs to us, divert management’s attention from operations, damage our reputation and decrease market acceptance of our services. We attempt to limit by contract our liability to clients for damages. We cannot, however, limit liability the government could seek to impose on us under the False Claims Act. Further, the allocations of responsibility and limitations of liability set forth in our contracts may not be enforceable or otherwise protect us from liability for damages.
Our information technology operations could be interrupted, which may adversely affect our reputation in the marketplace and our business, financial condition and results of operations.
The timely development, implementation and continuous and uninterrupted performance of our hardware, network, applications, the Internet and other systems, including those which may be provided by third parties, are important facets in our delivery of products and services to our clients. Our ability to properly manage and protect these processes and systems is a key factor in continuing to offer our clients our full complement of products and services on time in an uninterrupted manner.
Our operations are vulnerable to interruption or damage from a variety of sources, some of which are not within our control, including without limitation: (1) power loss and telecommunications failures; (2) software and hardware errors, failures or crashes; (3) computer viruses and similar disruptive problems; (4) fire, flood and other natural disasters; and (5) attacks on our network or damage to our software and systems carried out by hackers or Internet criminals.
System failures that interrupt our ability to develop applications or provide our products and services could affect our clients’ perception of the value and security of our products and services. Delays or interruptions in the delivery of our products and services could result from many causes including hardware and software defects, insufficient capacity or the failure of our website hosting and telecommunications providers to provide continuous and uninterrupted service. Additionally, we host some of our services and serve our clients through third-party data center hosting facilities. We do not control the operation of these facilities. From time to time, we may need to relocate our data or our clients’ data to alternative locations. Despite precautions taken during such moves, any difficulties experienced may impair the delivery of our services. We also depend on service providers that provide clients with access to our products and services. In addition, computer viruses or other attacks on our network and software may harm our systems causing us to lose data, and the transmission of computer viruses could expose us to litigation. In addition to potential liability, if we supply inaccurate information or experience interruptions in our ability to capture, store and supply information, our reputation could be harmed and we could lose clients. Any significant interruptions in our products and services could damage our reputation in the marketplace and have a negative impact on our business, financial condition and results of operations.
Unauthorized disclosure of confidential information provided to us by our clients or third parties, whether through breach of our secure network by an unauthorized party, employee theft or misuse, or otherwise, could harm our business.
The difficulty of securely transmitting confidential information has been a significant issue when engaging in sensitive communications over the Internet. Our business relies on using the Internet to transmit confidential information. We believe that any well-publicized compromise of Internet security may deter companies from using the Internet for these purposes.
Our services present the potential for embezzlement, identity theft, or other similar illegal behavior by our employees, subcontractors or third parties. If there were a disclosure of confidential information, or if a third party were to gain unauthorized access to the confidential information we possess, our operations could be seriously disrupted, our reputation could be harmed and we could be subject to claims pursuant to our agreements with our clients or other liabilities. In addition, if this were to occur, we could be perceived to have facilitated or
25
participated in illegal misappropriation of funds, documents or data and therefore be subject to civil or criminal liability or regulatory action. While we maintain professional liability insurance coverage in an amount that we believe is sufficient for our business, we cannot assure you that this coverage will prove to be adequate or will continue to be available on acceptable terms, if at all. A claim against us that is uninsured or under-insured could harm our business, financial conditions and results of operations. Even unsuccessful claims could result in substantial costs and diversion of management resources.
Risks Related to Government Regulation
The healthcare industry is highly regulated. Any material changes in the political, economic or regulatory healthcare environment that affect the group purchasing business or the purchasing practices and operations of healthcare organizations, or that lead to consolidation in the healthcare industry, could require us to modify our services or reduce the funds available to providers to purchase our products and services.
Our business, financial condition and results of operations depend upon conditions affecting the healthcare industry generally and hospitals and health systems particularly. Our ability to grow will depend upon the economic environment of the healthcare industry generally as well as our ability to increase the number of programs and services that we sell to our clients. The healthcare industry is highly regulated and is subject to changing political, economic and regulatory influences. Factors such as changes in reimbursement policies for healthcare expenses; consolidation in the healthcare industry; regulation; litigation; and general economic conditions affect the purchasing practices, operations and the financial health of healthcare organizations. In particular, changes in regulations affecting the healthcare industry, such as increased regulation of the purchase and sale of medical products, or restrictions on permissible discounts and other financial arrangements, could require us to make unplanned modifications to our products and services, result in delays or cancellations of orders, or reduce funds and demand for our products and services.
Cash flow and access to credit continue to be problematic for many healthcare delivery organizations. While we believe we are well positioned through our product and service offerings to assist hospitals and health systems who are dealing with intense and increasing financial pressures, it is unclear what long-term effects these conditions will have on the healthcare industry and in turn on our business, financial condition and results of operations.
In February 2009 the United States Congress enacted the Heath Information Technology for Clinical Health Act (“HITECH”) as part of the American Recovery and Reinvestment Act of 2009. Among other things, the HITECH Act provides for incentives for certain hospitals and health systems related to the adoption of electronic health records (“EHRs”). Meeting the requirements for such incentives may require additional investment in clinical information systems. While we believe that increased emphasis on EHRs by hospitals and health systems will also drive demand for SaaS-based tools, such as ours, to help rationalize and standardize patient and clinical data for efficient and accurate use, we cannot be certain of the extent or financial impact from such demand.
In March 2010, President Obama signed into law the Patient Protection and Affordable Care Act (“PPACA”), amended by the Health Care and Education and Reconciliation Act of 2010 (collectively, the “Affordable Care Act”). The Affordable Care Act is a sweeping measure designed to expand access to affordable health insurance, control health care spending, and improve health care quality. The law includes provisions to tie Medicare provider reimbursement to health care quality and incentives; mandatory compliance programs; enhanced transparency disclosure requirements; increased funding and initiatives to address fraud and abuse; and incentives to state Medicaid programs to promote community-based care as an alternative to institutional long-term care services. In addition, the law provides for the establishment of a national voluntary pilot program to bundle Medicare payments for hospital and post-acute services, which could lead to changes in the delivery of health care services. Likewise, many states have adopted or are considering changes in health care policies in part due to state budgetary shortfalls. The timetable for implementing many provisions of the Affordable Care Act remains unsettled, and we do not know what effect the federal Affordable Care Act or state law proposals may have on our business.
26
If current or future government regulations are interpreted or enforced in a manner adverse to us or our business, we may be subject to enforcement actions, penalties, and other material limitations on our business.
Most of the products offered through our group purchasing contracts are subject to direct regulation by federal and state governmental agencies. We rely upon vendors who use our services to meet all quality control, packaging, distribution, labeling, hazard and health information notice, record keeping and licensing requirements. In addition, we rely upon the carriers retained by our vendors to comply with regulations regarding the shipment of any hazardous materials.
We cannot guarantee that the vendors are in compliance with applicable laws and regulations. If vendors or the providers with whom we do business have failed, or fail in the future, to adequately comply with relevant laws or regulations, we could become involved in governmental investigations or private lawsuits concerning these regulations. If we were found to be legally responsible in any way for such failure we could be subject to injunctions, penalties or fines which could harm our business. Furthermore, any such investigation or lawsuit could cause us to expend significant resources and divert the attention of our management team, regardless of the outcome, and thus could harm our business.
The group purchasing industry and some of its largest purchasing clients have been reviewed by the Senate Judiciary Subcommittee on Antitrust, Competition Policy and Consumer Rights for possible conflict of interest and restraint of trade violations. As a response to the Senate Subcommittee inquiry, our company joined other GPOs to develop a set of voluntary principles of ethics and business conduct designed to address concerns regarding anti-competitive practices. The voluntary code was presented to the Senate Subcommittee in March 2006. In addition, we maintain our own Standards of Business Conduct that provide guidelines for conducting our business practices in a manner that is consistent with antitrust and restraint of trade laws and regulations. There has not been any further inquiry by the Senate Subcommittee since March 2006. On August 11, 2009, we, and several other GPOs, received a letter from Senators Charles Grassley, Herb Kohl and Bill Nelson requesting information concerning the different relationships between and among our GPO and its clients, distributors, manufacturers and other vendors and suppliers, and requesting certain information about the services the GPO performs and the payments it receives. On September 25, 2009, we and several other GPOs received a request for information from the Government Accountability Office (GAO), also concerning our GPO’s services and relationships with our clients. Subsequently, we, and other GPOs, received follow-up requests for additional information. We fully complied with all of these requests. On September 27, 2010, the GAO released a report titled “Group Purchasing Organizations — Services Provided to Customers and Initiatives Regarding Their Business Practices”. On that same day, the Minority Staff of the Senate Finance Committee released a report titled “Empirical Data Lacking to Support Claims of Savings with Group Purchasing Organizations”. On April 30, 2012, the GAO released another report, titled “Group Purchasing Organizations — Federal Oversight and Self-Regulation”, addressing federal oversight practices with respect to GPOs.
Congress, the Department of Health & Human Services (“HHS”), the Department of Justice, the Federal Trade Commission or another state or federal entity could at any time open a new investigation of the group purchasing industry, or develop new rules, regulations or laws governing the industry, that could adversely impact our ability to negotiate pricing arrangements with vendors, increase reporting and documentation requirements, or otherwise require us to modify our arrangements in a manner that adversely impacts our business and financial results. We may also face private or government lawsuits alleging violations arising from the concerns articulated by these governmental actors. We are involved on an ongoing basis in litigation, arising in the ordinary course of business or otherwise, which from time to time may include class actions involving consumers, shareholders, employees or injured persons, and claims relating to commercial, labor, employment, antitrust, securities or environmental matters. The outcome of litigation cannot be predicted with certainty and adverse litigation outcomes could adversely affect our financial results.
27
Our clients are highly dependent on payments from third-party healthcare payors, including Medicare, Medicaid and other government-sponsored programs, and reductions or changes in third-party reimbursement could adversely affect our clients and consequently our business.
Our clients derive a substantial portion of their revenue from third-party private and governmental payors, including Medicare, Medicaid and other government sponsored programs. Our sales and profitability depend, in part, on the extent to which coverage of and reimbursement for the products our clients purchase or otherwise obtain through us is available from governmental health programs, private health insurers, managed care plans and other third-party payors. These third-party payors exercise significant control over, and increasingly use their enhanced bargaining power to secure, discounted reimbursement rates and impose other requirements that may adversely impact our clients’ ability to obtain adequate reimbursement for products and services they purchase or otherwise obtain through us as a group purchasing member.
If third-party payors do not approve products for reimbursement or fail to reimburse for them adequately, our clients may suffer adverse financial consequences which, in turn, may reduce the demand for and ability to purchase our products or services. In addition, pursuant to the Medicare and Medicaid statutes, pharmaceutical manufacturers are required to report certain pricing data to the Centers for Medicare & Medicaid Services (“CMS”), which is the federal agency responsible for administering the Medicare and Medicaid programs. CMS uses this data to determine manufacturer rebate liabilities and to establish reimbursement limits for certain drugs under Medicare and Medicaid. CMS has issued final rules governing Medicare “average sales price” calculations and has published proposed rules governing Medicaid pricing calculations. Both the final and proposed rules include provisions that allow manufacturers to exclude “bona fide service fees” meeting certain standards from their pricing calculations, and CMS guidance has indicated that administrative fees paid by drug manufacturers to GPOs may qualify as bona fide service fees. There can be no assurance (i) that any pharmaceutical manufacturer will treat GPO fees paid to the Company as bona fide service fees or that CMS or other government agencies will agree with the manufacturer’s treatment of such fees, (ii) that CMS will continue to allow exclusion of GPO administrative fees meeting the bona fide service fee standards from Medicare pricing calculations or will adopt such an exclusion in a Medicaid final rule, or (iii) that, in the absence of any other basis for excluding such fees from government pricing calculations, any reimbursement limitations resulting from manufacturers’ reported pricing data, or other efforts by payors to limit reimbursement, will not have an adverse impact on our business.
If we fail to comply with federal and state laws governing submission of false or fraudulent claims to government healthcare programs and financial relationships among healthcare providers, we may be subject to civil and criminal penalties or loss of eligibility to participate in government healthcare programs.
We are subject to federal and state laws and regulations designed to protect patients, governmental healthcare programs, and private health plans from fraudulent and abusive activities. These laws include anti-kickback restrictions and laws prohibiting the submission of false or fraudulent claims. These laws are complex and their application to our specific products, services and relationships may not be clear and may be applied to our business in ways that we do not anticipate. Federal and state regulatory and law enforcement authorities have recently increased enforcement activities with respect to Medicare and Medicaid fraud and abuse regulations and other reimbursement laws and rules. From time to time we and others in the healthcare industry have received inquiries or subpoenas to produce documents in connection with such activities. We could be required to expend significant time and resources to comply with these requests, and the attention of our management team could be diverted to these efforts. Furthermore, if we are found to be in violation of any federal or state fraud and abuse laws, we could be subject to civil and criminal penalties, and we could be excluded from participating in federal and state healthcare programs such as Medicare and Medicaid. The occurrence of any of these events could significantly harm our business and financial condition.
Provisions in Title XI of the Social Security Act, commonly referred to as the federal Anti-Kickback Statute, prohibit the knowing and willful offer, payment, solicitation or receipt of remuneration, directly or indirectly, in return for the referral of patients or arranging for the referral of patients, or in return for the recommendation, arrangement, purchase, lease or order of items or services that are covered, in whole or in part, by a federal healthcare program such as Medicare or Medicaid. The definition of “remuneration” has been broadly interpreted to include anything of value such as gifts, discounts, rebates, waiver of payments or
28
providing anything at less than its fair market value. Many states have adopted similar prohibitions against kickbacks and other practices that are intended to induce referrals which are applicable to all patients regardless of whether the patient is covered under a governmental health program or private health plan. We attempt to scrutinize our business relationships and activities to comply with the federal anti-kickback statute and similar laws; and we attempt to structure our sales and group purchasing arrangements in a manner that is consistent with the requirements of applicable safe harbors to these laws. We cannot assure you, however, that our arrangements will be protected by such safe harbors or that such increased enforcement activities will not directly or indirectly have an adverse effect on our business financial condition or results of operations. Any determination by a state or federal agency that any of our activities or those of our vendors or clients violate any of these laws could subject us to civil or criminal penalties; could require us to change or terminate some portions of or operations or business, or could disqualify us from providing services to healthcare providers doing business with government programs; and, thus could have an adverse effect on our business.
Our business, particularly our Revenue Cycle Management segment, is also subject to numerous federal and state laws that forbid the submission or “causing the submission” of false or fraudulent information or the failure to disclose information in connection with the submission and payment of claims for reimbursement to Medicare, Medicaid, federal healthcare programs or private health plans. These laws and regulations may change rapidly, and it is frequently unclear how they apply to our business. Errors created by our products or consulting services that relate to entry, formatting, preparation or transmission of claim or cost report information may be determined or alleged to be in violation of these laws and regulations. Any failure of our products or services to comply with these laws and regulations could result in substantial civil or criminal liability; could adversely affect demand for our services; could invalidate all or portions of some of our client contracts; could require us to change or terminate some portions of our business; could require us to refund portions of our services fees; could cause us to be disqualified from serving clients doing business with government payors; and could have an adverse effect on our business.
Federal and state privacy and security laws may increase the costs of operation and expose us to civil and criminal sanctions.
We must comply with extensive federal and state requirements regarding the use, retention and security of patient healthcare information. The Health Insurance Portability and Accountability Act of 1996, as amended, and the regulations that have been issued under it, which we refer to collectively as HIPAA, contain substantial restrictions and requirements with respect to the use and disclosure of individuals’ protected health information. These restrictions and requirements are set forth in the HIPAA Privacy, Security and Breach Notification Rules. The HIPAA Privacy Rule prohibits a covered entity from using or disclosing an individual’s protected health information unless the use or disclosure is authorized by the individual or is specifically required or permitted under the Privacy Rule. The Privacy Rule imposes a complex set of requirements on covered entities for complying with this basic standard. Under the HIPAA Security Rule, covered entities must establish administrative, physical and technical safeguards to protect the confidentiality, integrity and availability of electronic protected health information maintained or transmitted by them or by others on their behalf. The Breach Notification Rule requires covered entities to report breaches of unsecured protected health information to affected individuals, the Secretary of HHS, and, in some circumstances, the media.
Our healthcare provider clients that engage in HIPAA-defined standard electronic transactions, and our own business operations as a healthcare clearinghouse, are directly subject to the HIPAA Privacy, Security and Breach Notification Rules governing “covered entities”. Additionally, because some of our clients disclose protected health information to us so that we may use that information to provide certain consulting or other services to those clients, we are a “business associate” of those clients. In these cases, in order to provide clients with services that involve the use or disclosure of protected health information, the HIPAA Privacy and Security Rules require us to enter into business associate agreements with our clients. Such agreements must, among other things, provide adequate written assurances:
| | • | | as to how we will use and disclose the protected health information; |
| | • | | that we will implement reasonable administrative, physical and technical safeguards to protect such information from misuse; |
29
| | • | | that we will enter into similar agreements with our agents and subcontractors that have access to the information; |
| | • | | that we will report security incidents and other inappropriate uses or disclosures of the information; and |
| | • | | that we will assist the covered entity with certain of its duties under the Privacy Rule. |
With the enactment of the HITECH Act, the privacy and security requirements of HIPAA were modified and expanded. The HITECH Act applies certain of the HIPAA privacy and security requirements directly to business associates of covered entities. The HITECH Act also establishes new mandatory federal requirements for both covered entities and business associates regarding notification of breaches of unsecured protected health information. These breach notification requirements are currently effective and being enforced. On January 17, 2013, the Office for Civil Rights of HHS released a major final rule modifying HIPAA, including revisions made by the HITECH Act. The rule is effective March 23, 2013 and as a covered entity and business associate we must comply with the applicable requirements of this final rule by September 23, 2013, including those provisions that expand certain privacy and security requirements for business associates, increase penalties for noncompliance, and strengthen requirements for reporting of breaches. We cannot determine at this time the cost of compliance with the new requirements.
Any failure or perceived failure of our products or services to meet HIPAA standards and related regulatory requirements could expose us to certain notification, penalty and/or enforcement risks and could adversely affect demand for our products and services, and force us to expend significant capital, research and development and other resources to modify our products or services to address the privacy and security requirements of our clients and HIPAA.
In addition to our obligations under HIPAA, most states have enacted patient confidentiality laws that protect against the disclosure of confidential medical information, and many states have adopted or are considering adopting further legislation in this area, including privacy safeguards, security standards, and data security breach notification requirements. These state laws, if more stringent than HIPAA requirements, are not preempted by the federal requirements, and we are required to comply with them as well.
We are unable to predict what changes to HIPAA or other federal or state laws or regulations might be made in the future or how those changes could affect our business or the associated costs of compliance. For example, the federal Office of the National Coordinator for Health Information Technology, (“ONCHIT”), is coordinating the development of national standards for creating an interoperable health information technology infrastructure based on the widespread adoption of EHRs in the healthcare sector. The Certification Commission for Health Information Technology (“CCHIT”) has tested and certified 90 EHR products under the Commission’s ONC-ATCB program, which certifies that the EHRs are capable of meeting the 2011/2012 criteria supporting Stage 1 meaningful use as approved by the Secretary of Health and Human Services. The certifications include 70 Complete non-behavioral health EHRs, which meet all of the 2011/2012 criteria for either eligible provider or hospital technology, and 7 non-behavioral health EHR Modules, which meet one or more — but not all — of the criteria. We are yet unable to predict what, if any, impact the creation of such standards and the further developments at ONCHIT and CCHIT will have on our products, services or compliance costs.
Failure by us to comply with any of the federal and state standards regarding patient privacy, identity theft prevention and detection, and data security may subject us to penalties, including civil monetary penalties and in some circumstances, criminal penalties. In addition, such failure may injure our reputation and adversely affect our ability to retain clients and attract new clients.
HIPAA and its implementing regulations also mandate format, data content and provider identifier standards that must be used in certain electronic transactions, such as claims, payment advice and eligibility inquiries. Although our systems are fully capable of transmitting transactions that comply with these requirements, some payers and healthcare clearinghouses with which we conduct business may interpret HIPAA transaction requirements differently than we do or may require us to use legacy formats or include legacy identifiers as they make the transition to full compliance. In cases where payers or healthcare clearinghouses require conformity with their interpretations or require us to accommodate legacy transactions or identifiers as a condition of successful transactions, we attempt to comply with their requirements, but may be subject to enforcement actions
30
as a result. In January 2009, CMS published a final rule adopting updated standard code sets for diagnoses and procedures known as ICD-10 code sets. A separate final rule also published by CMS in January 2009 resulted in changes to the formats to be used for electronic transactions subject to the ICD-10 code sets, known as Version 5010. Healthcare providers were required to comply with Version 5010 by January 1, 2012 (although CMS provided a temporary enforcement discretion period ending March 31, 2012). Use of the ICD-10 code sets is not mandated until October 1, 2014. We are actively working to make the proper modifications in preparation for the implementation of ICD-10. We may not be successful in responding to these changes and any changes in response that we make to our transactions and software may result in errors or otherwise negatively impact our service levels. We may also experience complications in supporting clients that are not fully compliant with the revised requirements as of the applicable compliance date.
If our clients who operate as not-for profit entities lose their tax-exempt status, those clients would suffer significant adverse tax consequences which, in turn, could adversely impact their ability to purchase products or services from us.
State tax authorities have challenged the tax-exempt status of hospitals and other healthcare facilities claiming such status on the basis that they are operating as charitable and/or religious organizations. The outcome of these cases has been mixed with some facilities retaining their tax-exempt status while others have been denied the ability to continue operating as not-for profit, tax-exempt entities under state law. In addition, many states have removed sales tax exemptions previously available to not-for-profit entities, and both the IRS and the United States Congress are investigating the practices of non-for profit hospitals. Those facilities denied tax exemptions could be subject to the imposition of tax penalties and assessments which could have a material adverse impact on their cash flow, financial strength and possibly ongoing viability. If the tax exempt status of any of our clients is revoked or compromised by new legislation or interpretation of existing legislation, that client’s financial health could be adversely affected, which could adversely impact our sales and revenue.
Risks Related to Ownership in Our Common Stock
The market price of our common stock may be volatile, and your investment in our common stock could suffer a decline in value.
There has been significant volatility in the market price and trading volume of equity securities, which is often unrelated or disproportionate to the financial performance of the companies issuing the securities. These broad market fluctuations may negatively affect the market price of our common stock. The market price of our common stock could fluctuate significantly in response to the factors described above and other factors, many of which are beyond our control, including:
| | • | | actual or anticipated changes in our or our competitors’ growth rates; |
| | • | | the public’s response to our press releases or other public announcements, including our filings with the SEC and announcements of mergers and acquisitions, technological innovations or new products or services by us or by our competitors; |
| | • | | actions of our historical equity investors, including sales of common stock by our directors and executive officers; |
| | • | | any major change in our senior management team; |
| | • | | legal and regulatory factors unrelated to our performance; |
| | • | | general economic, industry and market conditions and those conditions specific to the healthcare industry; |
| | • | | changes in stock market analyst recommendations regarding our common stock, other comparable companies or our industry generally; and |
| | • | | our quarterly results of operations falling below the expectations of securities analysts or investors. |
You may not be able to resell your shares at or above the market price you paid to purchase your shares due to fluctuations in the market price of our common stock caused by changes in the market as a whole or our operating performance or prospects.
31
Provisions in our certificate of incorporation and by-laws or Delaware law might discourage, delay or prevent a change of control of our company or changes in our management and, therefore, depress the trading price of our common stock.
Provisions of our certificate of incorporation and by-laws and Delaware law may discourage, delay or prevent a merger, acquisition or other change in control that stockholders may consider favorable, including transactions in which you might otherwise receive a premium for your shares of our common stock. These provisions may also prevent or frustrate attempts by our stockholders to replace or remove our management.
For example, our amended and restated certificate of incorporation provides for a staggered board of directors, whereby directors serve for three-year terms, with approximately a third of the directors coming up for re-election each year. Having a staggered board could make it more difficult for a third party to acquire us through a proxy contest. Other provisions that may discourage, delay or prevent a change in control or changes in management include:
| | • | | limitations on the removal of directors; |
| | • | | advance notice requirements for stockholder proposals and nominations; |
| | • | | the inability of stockholders to act by written consent or to call special meetings; and |
| | • | | the ability of our board of directors to designate the terms of, including voting, dividend and other special rights, and issue new series of preferred stock without stockholder approval. |
In addition, Section 203 of the Delaware General Corporation Law prohibits a publicly held Delaware corporation from engaging in a business combination with an interested stockholder, generally a person which together with its affiliates owns, or within the last three years has owned, 15% of our voting stock, for a period of three years from the time such person became an interested stockholder, unless the business combination is approved in a prescribed manner or an exception to such restriction applies.
A change of control may also impact employee benefit arrangements, which could make an acquisition more costly and could prevent it from going forward. For example, our equity compensation plans allow for all or a portion of the equity granted under these plans to vest upon a change of control. Finally, upon any change in control, the lenders under our credit facilities would have the right to require us to repay all of the outstanding obligations under our credit facilities and the noteholders under our indenture would have the right to require that we offer to redeem the notes thereunder at 101% of the principal amount plus accrued interest and all other amounts payable thereunder.
The existence of the foregoing provisions and anti-takeover measures could limit the price that investors might be willing to pay in the future for shares of our common stock. They could also deter potential acquirers of our company, thereby reducing the likelihood that you could receive a premium for your common stock in an acquisition.
We do not currently intend to pay dividends on our common stock and, consequently, your ability to achieve a return on your investment will depend on appreciation in the price of our common stock.
We do not intend to declare or pay any cash dividends on our common stock for the foreseeable future. We currently intend to invest our future earnings, if any, to fund our growth. Therefore, you are not likely to receive any dividends on your common stock for the foreseeable future and the success of an investment in shares of our common stock will depend upon any future appreciation in its value. There is no guarantee that shares of our common stock will appreciate in value or even maintain the price at which our stockholders have purchased their shares.
32
| ITEM 1B. UNRESOLVED | STAFF COMMENTS. |
Not Applicable
Facilities and Property
We do not own any real property and lease our existing facilities. Our principal executive offices are located in leased office space in Alpharetta, Georgia. Our facilities accommodate product development, marketing and sales, information technology, administration, training, graphic services and operations personnel. As of December 31, 2012, we leased office space to support our operations in the following locations:
| | | | | | | | | | |
Location | | Floor Area
(Sq. Feet) | | | Principal Business
Function or Segment | | End of Term | | Renewal Option |
Alpharetta, Georgia | | | 31,236 | | | Corporate | | March 31, 2015 | | Period of five additional years |
Alpharetta, Georgia | | | 89,424 | | | RCM | | March 31, 2015 | | Period of five additional years |
Bedford, Massachusetts | | | 7,756 | | | RCM | | December 31, 2015 | | Two periods of five additional years |
Bellevue, Washington | | | 5,535 | | | RCM | | June 30, 2016 | | Period of five additional years |
Bridgeton, Missouri | | | 26,341 | | | SCM | | June 30, 2013 | | Two periods of five additional years |
Cape Girardeau, Missouri(1) | | | 58,456 | | | SCM | | July 31, 2017 | | None |
Centennial, Colorado | | | 23,202 | | | SCM | | February 28, 2016 | | Two periods of three additional years |
Clearwater, Florida | | | 3,179 | | | SCM | | May 31, 2018 | | None |
El Segundo, California | | | 31,536 | | | RCM/SCM | | January 17, 2018 | | Period of five additional years |
Franklin, Tennessee | | | 7,081 | | | SCM | | December 31, 2015 | | None |
Gallatin, Tennessee | | | 4,250 | | | SCM | | December 31, 2016 | | Period of three additional years |
Mahwah, New Jersey | | | 26,000 | | | RCM | | September 30, 2013 | | Period of five additional years |
Nashville, Tennessee | | | 22,500 | | | RCM | | July 31, 2019 | | None |
Oakland, California | | | 6,849 | | | SCM | | October 31, 2018 | | None |
Plano, Texas | | | 100,528 | | | RCM | | January 14, 2022 | | Two periods of five additional years |
Plano, Texas | | | 100,000 | | | SCM | | February 28, 2013 | | Period of three additional months |
Plano, Texas | | | 4,226 | | | SCM | | June 20, 2013 | | None |
Plano, Texas | | | 6,086 | | | SCM | | November 30, 2016 | | Period of five additional years |
Plano, Texas | | | 225,000 | | | SCM/RCM | | February 29, 2028 | | Two periods of five additional years |
Richardson, Texas | | | 3,588 | | | RCM | | May 31, 2013 | | Period of three additional years |
Saddle River, New Jersey | | | 68,102 | | | RCM | | January 31, 2016 | | None |
Southborough, Massachusetts | | | 4,342 | | | RCM | | March 31, 2014 | | Period of five additional years |
Yakima, Washington | | | 5,298 | | | RCM | | June 30, 2015 | | Period of two additional years |
| (1) | See “Finance Obligation” in Note 7 to our Consolidated Financial Statements for a discussion of the capital lease treatment of our Cape Girardeau facility, lease term ending July 31, 2017. |
As of December 31, 2012, we did not have any off-balance sheet arrangements that have or are reasonably likely to have a current or future significant effect on our financial condition, revenues or expenses, results of operations, liquidity, capital expenditures or capital resources.
33
| ITEM 3. | LEGAL PROCEEDINGS. |
Legal Proceedings
From time to time, we become involved in legal proceedings arising in the ordinary course of our business. We are not presently involved in any legal proceedings, the outcome of which, if determined adversely to us, would have a material adverse affect on our business, operating results or financial condition.
| ITEM 4. | MINE SAFETY DISCLOSURES. |
Not applicable
PART II.
| ITEM 5. | MARKET FOR REGISTRANT’S COMMON EQUITY, RELATED STOCKHODLER MATTERS AND ISSUER PURCHASES OF EQUITY SECURITIES. |
Our common stock is publicly traded on the Nasdaq Global Select Market under the ticker symbol “MDAS.” The following chart sets forth, for the periods indicated, the high and low sales prices of our common stock on the Nasdaq Global Select Market.
Price Range of Common Stock
| | | | | | | | |
| | | Price Range of
Common Stock | |
Period | | High | | | Low | |
Fourth Quarter 2012 | | $ | 18.59 | | | $ | 15.71 | |
Third Quarter 2012 | | $ | 17.80 | | | $ | 12.80 | |
Second Quarter 2012 | | $ | 13.45 | | | $ | 10.92 | |
First Quarter 2012 | | $ | 14.43 | | | $ | 9.37 | |
Fourth Quarter 2011 | | $ | 13.08 | | | $ | 8.52 | |
Third Quarter 2011 | | $ | 14.12 | | | $ | 9.09 | |
Second Quarter 2011 | | $ | 16.28 | | | $ | 12.68 | |
First Quarter 2011 | | $ | 21.44 | | | $ | 13.88 | |
On February 8, 2013, the last reported sale price for our common stock was $19.47 per share. As of February 8, 2013, there were 110 holders of record of our common stock and approximately 9,970 beneficial holders.
Dividend Policy
We did not pay any dividends during the fiscal years ended December 31, 2012 and 2011. We currently anticipate that we will retain all of our future earnings, if any, for use in the expansion and operation of our business and do not anticipate paying any cash dividends for the foreseeable future. The payment of dividends, if any, is subject to the discretion of our board of directors and will depend on many factors, including our results of operations, financial condition and capital requirements, earnings, general business conditions, restrictions imposed by our current and any future financing arrangements, legal restrictions on the payment of dividends and other factors our board of directors deems relevant. Our current credit facilities and the indenture governing our senior notes include restrictions on our ability to pay dividends.
34
Equity Compensation Plan Information
The information regarding securities authorized for issuance under the Company’s equity compensation plans is set forth below, as of December 31, 2012:
| | | | | | | | | | | | |
Plan Category | | Number of
Securities to be
Issued Upon
Exercise of
Outstanding
Options,
Warrants and
Rights | | | Weighted-
Average
Exercise Price of
Outstanding
Options,
Warrants and
Rights | | | Number of Securities
Remaining Available
for Future Issuance
Under Equity
Compensation Plans
(excluding securities
reflected in column (a)) | |
Equity compensation plans approved by security holders | | | 5,591,694 | (1) | | $ | 13.86 | | | | 2,746,247 | (2) |
Equity compensation plans not approved by security holders | | | 187,500 | (3) | | | 18.14 | | | | — | |
| | | | | | | | | | | | |
Total(4) | | | 5,779,194 | | | $ | 14.00 | | | | 2,746,247 | |
| (1) | This amount includes 2,348,287 common stock options, 3,205,904 stock-settled stock appreciation rights (“SSARs”) and 37,503 common stock warrants issued under our Long Term Performance Incentive Plan (effected in 2008), 2004 Long Term Equity Incentive Plan, and 1999 Stock Incentive Plan. |
| (2) | All securities remaining available for future issuance are issuable under our Long Term Performance Incentive Plan. See Note 10 of the Notes to Consolidated Financial Statements for discussion of the equity plans. |
| (3) | Amount represents SSARs, net of forfeitures, issued pursuant to the MedAssets, Inc. 2010 Special Stock Incentive Plan (the “Plan”). The Plan was adopted by the Company’s Board of Directors on November 23, 2010 in connection with the Broadlane Acquisition pursuant to an exception to the requirement for stockholder approval under NASDAQ rules. No further equity grants will be issued under the Plan. |
| (4) | The above number of securities to be issued upon exercise of outstanding options, warrants and rights does not include 70,933 options issued in connection with our acquisition of OSI Systems, Inc. in June 2003 that remain outstanding. These options have a weighted average exercise price of $0.96. |
Repurchase of Common Stock
Stock repurchases during the fiscal years ended December 31, 2012 and 2011 were as follows:
| | | | | | | | | | | | | | | | |
Period | | Total Number
of Shares
Purchased | | | Average Price
Paid per Share | | | Total Number of
Shares Purchased
as Part of Publicly
Announced Plans
or Programs | | | Maximum Dollar
Value of Shares that
May Yet Be
Purchased Under the
Plans or Programs | |
| | | (In thousands, except per share data) | |
August 23-31, 2011 | | | 54 | | | $ | 10.69 | | | | 54 | | | | 24,423 | (1) |
September 1-30, 2011 | | | 41 | | | $ | 9.85 | | | | 41 | | | | 24,022 | |
October 1-31, 2011 | | | 167 | | | $ | 9.51 | | | | 167 | | | | 22,435 | |
November 1-30, 2011 | | | 80 | | | $ | 9.44 | | | | 80 | | | | 21,680 | |
December 1-31, 2011 | | | 210 | | | $ | 9.46 | | | | 210 | | | | 19,695 | |
January 1-31, 2012 | | | 62 | | | $ | 9.76 | | | | 62 | | | | 19,095 | |
| | | | | | | | | | | | | | | | |
Total | | | 614 | | | $ | 9.64 | | | | 614 | | | | | |
| (1) | On August 23, 2011, we announced that our Board of Directors had authorized the repurchase of up to $25,000 of our common stock. The table above shows our repurchase activity during the share repurchase program, which expired in August 2012. |
For additional information regarding our stock repurchase program, see Note 9 of the Notes to Consolidated Financial Statements.
35
Sales of Unregistered Securities
Set forth below is information regarding shares of common stock granted by us in the period covered by this Annual Report on Form 10-K that were not registered under the Securities Act. Also included is the consideration, if any, received by us for such shares and information relating to the section of the Securities Act, or rule of the SEC, under which exemption from registration was claimed.
For the fiscal years ended December 31, 2012, 2011 and 2010, we issued approximately 63,000, zero and 67,000 unregistered shares of our common stock in connection with stock option exercises with respect to options issued relating to our acquisition of OSI Systems, Inc. in June 2003. We received approximately $0.1 million in consideration in connection with these stock option exercises for both fiscal years ended December 31, 2012 and 2010.
The sales of the above shares were deemed to be exempt from registration in reliance on Section 4(2) of the Securities Act or Regulation D promulgated thereunder as transactions by an issuer not involving any public offering or as transactions pursuant to a compensatory benefit plan or a written contract relating to compensation.
36
Stock Price Performance Graph
The following graph compares the cumulative total stockholder return on the Company’s common stock from December 31, 2007 to December 31, 2012 with the cumulative total return of (i) the companies traded on the NASDAQ Global Select Market (the “NASDAQ Composite Index”) and (ii) the NASDAQ Computer & Data Processing Index.
COMPARISON OF 5 YEAR CUMULATIVE TOTAL RETURN*
Among MedAssets Inc., the NASDAQ Composite Index,
and the NASDAQ Computer & Data Processing Index
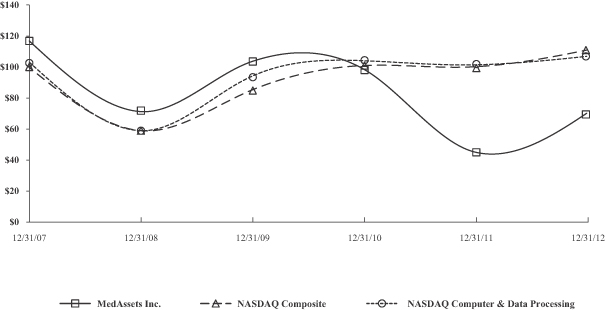
| * | $100 invested on 12/31/07 in stock or index, including reinvestment of dividends. |
| Fiscal | year ending December 31. |
Fiscal year ending:
| | | | | | | | | | | | | | | | | | | | | | | | |
| | | 12/31/2007 | | | 12/31/2008 | | | 12/31/2009 | | | 12/31/2010 | | | 12/31/2011 | | | 12/31/2012 | |
MedAssets Inc. | | | 116.78 | | | | 71.22 | | | | 103.46 | | | | 98.49 | | | | 45.12 | | | | 70.05 | |
NASDAQ Composite | | | 99.71 | | | | 58.93 | | | | 85.12 | | | | 100.89 | | | | 100.09 | | | | 110.78 | |
NASDAQ Computer & Data Processing | | | 103.08 | | | | 58.90 | | | | 94.11 | | | | 103.98 | | | | 101.36 | | | | 106.83 | |
37
| ITEM 6. | SELECTED FINANCIAL DATA. |
Our historical financial data as of and for the fiscal years ended December 31, 2012, 2011 and 2010 have been derived from the audited consolidated financial statements included elsewhere in this Annual Report on Form 10-K, and such data as of and for the fiscal years ended December 31, 2009 and 2008 have been derived from audited consolidated financial statements not included in this Annual Report on Form 10-K.
Historical results of operations are not necessarily indicative of results of operations or financial condition in the future or to be expected in the future. Refer to Management’s Discussion and Analysis of Financial Condition and Results of Operations for a summary of management’s primary metrics to measure the consolidated financial performance of our business, which includes non-GAAP gross fees, non-GAAP revenue share obligation, non-GAAP adjusted EBITDA, non-GAAP adjusted EBITDA margin and non-GAAP diluted adjusted EPS. The summary historical consolidated financial data and notes should be read in conjunction with Management’s Discussion and Analysis of Financial Condition and Results of Operations and our consolidated financial statements and the notes to those financial statements included elsewhere in this Annual Report on Form 10-K.
| | | | | | | | | | | | | | | | | | | | |
| | | Fiscal Year Ended December 31, | |
| | | 2012 | | | 2011 | | | 2010(2) | | | 2009 | | | 2008(3) | |
| | | (In thousands, except per share data) | |
| | | | | | | | | (recast) | | | (recast) | | | (recast) | |
Statement of Operations Data:(1) | | | | | | | | | | | | | | | | | | | | |
Net revenue: | | | | | | | | | | | | | | | | | | | | |
Spend and Clinical Resource Management | | $ | 393,571 | | | $ | 363,997 | | | $ | 177,603 | | | $ | 162,560 | | | $ | 151,620 | |
Revenue Cycle Management | | | 246,550 | | | | 214,275 | | | | 213,728 | | | | 178,721 | | | | 128,036 | |
| | | | | | | | | | | | | | | | | | | | |
Total net revenue | | | 640,121 | | | | 578,272 | | | | 391,331 | | | | 341,281 | | | | 279,656 | |
Operating expenses:(4) | | | | | | | | | | | | | | | | | | | | |
Cost of revenue | | | 138,618 | | | | 121,771 | | | | 100,737 | | | | 74,651 | | | | 51,548 | |
Product development expenses | | | 28,483 | | | | 26,823 | | | | 20,011 | | | | 18,994 | | | | 16,393 | |
Selling and marketing expenses | | | 60,438 | | | | 56,997 | | | | 46,736 | | | | 45,282 | | | | 43,205 | |
General and administrative expenses | | | 218,194 | | | | 203,101 | | | | 124,379 | | | | 110,661 | | | | 91,481 | |
Acquisition and integration-related expenses(5) | | | 6,348 | | | | 24,551 | | | | 21,591 | | | | — | | | | — | |
Depreciation | | | 30,190 | | | | 22,402 | | | | 19,948 | | | | 13,211 | | | | 9,793 | |
Amortization of intangibles | | | 72,652 | | | | 80,510 | | | | 31,027 | | | | 28,012 | | | | 23,442 | |
Impairment of property and equipment, goodwill and intangibles(6) | | | — | | | | — | | | | 46,423 | | | | — | | | | 2,272 | |
| | | | | | | | | | | | | | | | | | | | |
Total operating expenses | | | 554,923 | | | | 536,155 | | | | 410,852 | | | | 290,811 | | | | 238,134 | |
| | | | | | | | | | | | | | | | | | | | |
Operating income (loss) | | | 85,198 | | | | 42,117 | | | | (19,521 | ) | | | 50,470 | | | | 41,522 | |
Other income (expense) | | | | | | | | | | | | | | | | | | | | |
Interest expense | | | (66,045 | ) | | | (71,083 | ) | | | (27,508 | ) | | | (18,114 | ) | | | (21,271 | ) |
Loss on debt extinguishment(7) | | | (28,196 | ) | | | — | | | | — | | | | — | | | | — | |
Other income (expense) | | | 685 | | | | 3,621 | | | | 650 | | | | 417 | | | | (1,921 | ) |
| | | | | | | | | | | | | | | | | | | | |
(Loss) income before income taxes | | | (8,358 | ) | | | (25,345 | ) | | | (46,379 | ) | | | 32,773 | | | | 18,330 | |
Income tax (benefit) expense | | | (1,480 | ) | | | (9,851 | ) | | | (14,255 | ) | | | 12,826 | | | | 7,489 | |
| | | | | | | | | | | | | | | | | | | | |
Net (loss) income | | $ | (6,878 | ) | | $ | (15,494 | ) | | $ | (32,124 | ) | | $ | 19,947 | | | $ | 10,841 | |
(Loss) income per share basic | | $ | (0.12 | ) | | $ | (0.27 | ) | | $ | (0.57 | ) | | $ | 0.36 | | | $ | 0.22 | |
(Loss) income per share diluted | | $ | (0.12 | ) | | $ | (0.27 | ) | | $ | (0.57 | ) | | $ | 0.34 | | | $ | 0.21 | |
Shares used in per share calculation basic | | | 57,452 | | | | 57,298 | | | | 56,434 | | | | 54,841 | | | | 49,843 | |
Shares used in per share calculation diluted(8) | | | 57,452 | | | | 57,298 | | | | 56,434 | | | | 57,865 | | | | 52,314 | |
| (1) | Amounts have been recast to reflect our DSS operating unit within our SCM segment. |
38
| (2) | Amounts include the results of operations of Broadlane (as part of the SCM segment) from November 16, 2010, the date of acquisition. |
| (3) | Amounts include the results of operations of Accuro Healthcare Solutions, Inc. (as part of the RCM segment) from June 2, 2008, the date of acquisition. |
| (4) | Total share-based compensation expense included in the operating expense captions above for each period presented is as follows: |
| | | | | | | | | | | | | | | | | | | | |
| | | Fiscal Year Ended December 31, | |
| | | 2012 | | | 2011 | | | 2010 | | | 2009 | | | 2008 | |
| | | (In thousands) | |
Cost of revenue | | $ | 2,165 | | | $ | 1,362 | | | $ | 2,722 | | | $ | 3,063 | | | $ | 1,983 | |
Product development | | | 181 | | | | 267 | | | | 461 | | | | 866 | | | | 721 | |
Selling and marketing | | | 1,489 | | | | 559 | | | | 2,476 | | | | 2,920 | | | | 1,894 | |
General and administrative | | | 6,456 | | | | 2,835 | | | | 5,834 | | | | 9,803 | | | | 3,952 | |
| | | | | | | | | | | | | | | | | | | | |
Total share-based compensation expense | | $ | 10,291 | | | $ | 5,023 | (1) | | $ | 11,493 | | | $ | 16,652 | | | $ | 8,550 | |
| | | | | | | | | | | | | | | | | | | | |
| | (1) | During 2011, we reversed $6.5 million of previously recorded share-based compensation expense related to certain performance-based SSARs and performance-based restricted stock that were granted under the MedAssets, Inc. Long-Term Performance Incentive Plan in 2008. The share-based compensation expense was reversed due to non-achievement of certain performance criteria. Refer to Note 10 of the Notes to Consolidated Financial Statements for further details. |
| (5) | For the fiscal years ended December 31, 2012 and 2011, the amounts were attributable to integration and restructuring-type costs associated with the Broadlane Acquisition, such as severance, retention, certain performance-related salary-based compensation, and operating infrastructure costs. For the fiscal year ended December 31, 2010, the amount was attributable to $10.4 million in transaction costs incurred (not related to the financing) to complete the Broadlane Acquisition such as due diligence, consulting and other relates fees; $8.4 million for integration and restructuring-type costs associated with the Broadlane Acquisition, such as severance, retention, certain performance-related salary-based compensation, and operating infrastructure costs; and $2.8 million was attributable to acquisition-related fees associated with an unsuccessful acquisition attempt. |
| (6) | The impairment during the fiscal year ended December 31, 2010 primarily consisted of: (i) a $44.5 million write-off of goodwill relating to our DSS operating unit; and (ii) $1.3 million relating to an SCM trade name and a customer base intangible asset from prior acquisitions that were deemed to be impaired as part of the product and service offering integration associated with the Broadlane Acquisition. The impairment of intangibles during 2008 primarily relates to acquired developed technology from prior acquisitions, revenue cycle management trade names and internally developed software products deemed impaired due to the integration of Accuro’s operations and products. |
| (7) | The amount reflects the loss on debt extinguishment and is comprised of: (i) a $20.0 million write-off of debt issuance costs relating to our previous credit facility; and (ii) an $8.2 million swap termination fee for two forward starting interest rate swaps also relating to our previous credit facility. Refer to Note 7 and Note 14 of the Notes to Consolidated Financial Statements for additional details. |
| (8) | For the years ended December 31, 2012, 2011 and 2010, the effect of dilutive securities has been excluded because the effect is antidilutive as a result of the net loss attributable to common stockholders. |
39
Consolidated Balance Sheet Data:
| | | | | | | | | | | | | | | | | | | | |
| | | Fiscal Year Ended December 31, | |
| | | 2012 | | | 2011 | | | 2010 | | | 2009 | | | 2008 | |
| | | (In thousands, except per share data) | |
Cash and cash equivalents(1) | | $ | 13,734 | | | $ | 62,947 | | | $ | 46,836 | | | $ | 5,498 | | | $ | 5,429 | |
Current assets | | | 142,997 | | | | 200,908 | | | | 184,754 | | | | 95,980 | | | | 80,254 | |
Total assets | | | 1,678,237 | | | | 1,794,978 | | | | 1,845,353 | | | | 778,544 | | | | 773,860 | |
Current liabilities | | | 225,480 | | | | 318,325 | | | | 283,249 | | | | 99,344 | | | | 139,308 | |
Total non-current liabilities(2) | | | 1,019,134 | | | | 1,058,040 | | | | 1,126,521 | | | | 241,828 | | | | 251,613 | |
Total liabilities | | | 1,244,614 | | | | 1,376,365 | | | | 1,409,770 | | | | 341,172 | | | | 390,921 | |
Total stockholder’s equity(1) | | $ | 433,623 | | | $ | 418,613 | | | $ | 435,583 | | | $ | 437,372 | | | $ | 382,939 | |
| (1) | Our cash management practice is to reduce interest expense. We have an auto-borrowing plan which causes excess cash on hand to be used to repay any balance on our swing-line credit facility on a daily basis. We may also repay our revolving credit facility on a routine basis when our swing line credit facility is undrawn. As of December 31, 2012, we had a cash and cash equivalents balance as a result of the refinancing on December 13, 2012. As of December 31, 2011, we had a cash and cash equivalents balance in anticipation of the $120.1 million deferred payment associated with the Broadlane Acquisition that was paid in January 2012. As of December 31, 2010, we had a cash and cash equivalents balance due to the cash flows associated with the Broadlane Acquisition and a temporary suspension of our previous cash management practice. At December 31, 2009 and 2008, we had a cash and cash equivalents balance because we had a zero balance on our revolving credit facility. |
| (2) | Inclusive of capital lease obligations and long-term notes payable. |
| ITEM 7. | MANAGEMENT’S DISCUSSION AND ANALYSIS OF FINANCIAL CONDITION AND RESULTS OF OPERATIONS. |
The following discussion of our financial condition and results of operations should be read in conjunction with this entire Annual Report on Form 10-K, including the “Risk Factors” section and our consolidated financial statements and the notes to those financial statements appearing elsewhere in this report. The discussion and analysis below includes certain forward-looking statements that are subject to risks, uncertainties and other factors described in “Risk Factors” and elsewhere in this report that could cause our actual future growth, results of operations, performance and business prospects and opportunities to differ materially from those expressed in, or implied by, such forward-looking statements. See “Note On Forward-Looking Statements” herein.
Overview
We provide technology-enabled products and services which together deliver solutions designed to improve operating margin, cash flow and overall operational effectiveness for hospitals, health systems and other ancillary or non-acute healthcare providers. Our solutions are designed to efficiently analyze detailed information across the spectrum of revenue cycle, spend and clinical resource management processes. Our solutions integrate with existing operations and enterprise software systems of our clients and provide financial improvement with minimal upfront costs or capital expenditures. Our operations and clients are primarily located throughout the United States.
Our full-year results included total consolidated net revenue of $640.1 million, a 10.7% increase over 2011. These results were primarily driven by growth in net administrative fees from our GPO services, continued demand for medical device, clinical and performance improvement consulting services, as well as growth in revenue cycle technology tools and an increase in revenue cycle services and consulting fees. We reported a net loss of $6.9 million, or a loss of $0.12 per diluted share, due primarily to $28.2 million in one-time expenses related to the debt extinguishment we completed in December 2012. Our non-GAAP adjusted EBITDA was $207.3 million, a 12.6% increase over last year.
40
We believe the breadth of our comprehensive solution set, combined with our superior cost and revenue management value proposition, offers our company substantial opportunities to cross-sell additional products and services to current and prospective clients. Overall, we believe that our business model and best-practice, technology-enabled service solutions can provide our client base with the direction and support to manage total costs, optimize revenue, secure reimbursement, reduce waste, and increase cash flow for healthcare providers as the slow economic recovery and impact of health insurance reform continue to impact their financial stability and provision of care.
Management’s primary metrics to measure the consolidated financial performance of the business are net revenue, non-GAAP gross fees, non-GAAP revenue share obligation, non-GAAP adjusted EBITDA, non-GAAP adjusted EBITDA margin and non-GAAP diluted adjusted EPS.
For the fiscal years ended December 31, 2012, 2011 and 2010, our primary results of operations included the following:
| | | | | | | | | | | | | | | | | | | | | | | | | | | | | | | | |
| | | Fiscal Year Ended December 31, | | | Fiscal Year Ended December 31, | |
| | | 2012 | | | 2011 | | | Change | | | | | | 2011 | | | 2010 | | | Change | | | | |
| | | Amount | | | Amount | | | Amount | | | % | | | Amount | | | Amount | | | Amount | | | % | |
| | | (In millions) | | | (In millions) | |
Gross fees(1) | | $ | 800.9 | | | $ | 713.2 | | | $ | 87.7 | | | | 12.3 | % | | $ | 713.2 | | | $ | 454.3 | | | $ | 258.9 | | | | 57.0 | % |
Revenue share obligation(1) | | | (160.8 | ) | | | (134.9 | ) | | | (25.9 | ) | | | 19.2 | | | | (134.9 | ) | | | (63.0 | ) | | | (71.9 | ) | | | 114.1 | |
| | | | | | | | | | | | | | | | | | | | | | | | | | | | | | | | |
Total net revenue | | | 640.1 | | | | 578.3 | | | | 61.8 | | | | 10.7 | | | | 578.3 | | | | 391.3 | | | | 187.0 | | | | 47.8 | |
Operating income (loss) | | | 85.2 | | | | 42.1 | | | | 43.1 | | | | 102.4 | | | | 42.1 | | | | (19.5 | ) | | | 61.6 | | | | (315.9 | ) |
Net loss | | $ | (6.9 | ) | | $ | (15.5 | ) | | $ | 8.6 | | | | (55.5 | %) | | $ | (15.5 | ) | | $ | (32.1 | ) | | $ | 16.6 | | | | (51.7 | %) |
Adjusted EBITDA(1) | | $ | 207.3 | | | $ | 184.1 | | | $ | 23.2 | | | | 12.6 | % | | $ | 184.1 | | | $ | 128.0 | | | $ | 56.1 | | | | 43.8 | % |
Adjusted EBITDA margin(1) | | | 32.4 | % | | | 31.8 | % | | | | | | | | | | | 31.8 | % | | | 32.7 | % | | | | | | | | |
Adjusted EPS(1) | | $ | 1.13 | | | $ | 0.99 | | | $ | 0.14 | | | | 14.1 | % | | $ | 0.99 | | | $ | 0.82 | | | $ | 0.17 | | | | 20.7 | % |
| (1) | These are non-GAAP measures. See “Use of Non-GAAP Financial Measures” section for additional information. |
For the fiscal years ended December 31, 2012 and 2011, we generated non-GAAP gross fees of $800.9 million and $713.2 million, respectively, and total net revenue of $640.1 million and $578.3 million, respectively. The increases in non-GAAP gross fees and total net revenue in the fiscal year ended December 31, 2012 compared to the fiscal year ended December 31, 2011 were primarily attributable to:
| | • | | growth in our SCM segment from our medical device consulting and strategic sourcing services, and vendor administrative fees; and |
| | • | | growth in our RCM segment from an increase in our revenue cycle technology tools in addition to an increase in our revenue cycle services. |
For the fiscal year ended December 31, 2012, we generated operating income of $85.2 million compared to $42.1 million for the fiscal year ended December 31, 2011. The increase in operating income compared to the prior year was primarily attributable to the net revenue increase discussed above offset by the following:
| | • | | increased cost of revenue within both our RCM and SCM segments attributable to a higher percentage of net revenue being derived from service-based engagements; |
| | • | | higher operating expenses related to increased compensation expense for new and existing personnel, inclusive of performance-based incentive compensation expense; |
| | • | | an increase in depreciation expense from additions of property and equipment including purchased software and internally developed software; and |
| | • | | an increase in share-based compensation expense which was primarily attributable to the reversal of $6.5 million of previously recorded share-based compensation expense in 2011 related to certain performance-based SSARs and performance-based restricted stock. |
41
For the fiscal year ending December 31, 2012, the increase in non-GAAP adjusted EBITDA and non-GAAP adjusted EBITDA margin compared to the fiscal year ended December 31, 2011 was primarily attributable to the net revenue increase discussed above in addition to lower overall expense growth.
For the fiscal years ended December 31, 2011 and 2010, we generated non-GAAP gross fees of $713.2 million and $454.3 million, respectively, and total net revenue of $578.3 million and $391.3 million, respectively. The increases in non-GAAP gross fees and total net revenue in the fiscal year ended December 31, 2011 compared to the fiscal year ended December 31, 2010 were primarily attributable to:
| | • | | the Broadlane Acquisition on November 16, 2010; |
| | • | | growth in our SCM segment from our medical device consulting and strategic sourcing services, and vendor administrative fees as well as revenue related to achievement of certain client financial performance targets earned during the year; and |
| | • | | growth in our RCM segment from our revenue cycle technology tools offset by a decline in our revenue cycle services. |
For the fiscal year ended December 31, 2011, we generated operating income of $42.1 million compared to an operating loss of $19.5 million for the fiscal year ended December 31, 2010. The increase in operating income compared to the prior year was primarily attributable to the net revenue increase discussed above in addition to approximately $25 million in achieved cost reductions relating to combining the operations of Broadlane with our operations offset by the following:
| | • | | increased cost of revenue within our SCM segment attributable to a higher percentage of net revenue being derived from service-based engagements; |
| | • | | higher operating expenses related to increased compensation expense for new and existing personnel, inclusive of performance-based incentive compensation expense; |
| | • | | an increase in amortization expense of acquired intangibles; and |
| | • | | an increase in depreciation expense from additions of property and equipment including purchased software and fixed assets acquired in the Broadlane Acquisition, partially offset by lower depreciation expense from the change in useful life in our internally developed software. |
For the fiscal year ending December 31, 2011, the increase in non-GAAP adjusted EBITDA compared to the fiscal year ended December 31, 2010 was primarily attributable to the net revenue increase discussed above, which included performance-related revenue that has a higher contribution margin (and represented 5.3% and 4.4% of consolidated net revenue, respectively), in addition to achieved cost reductions realized from combining the operations of Broadlane with our existing operations partially offset by higher operating expenses inclusive of performance-based incentive compensation expense. The non-GAAP adjusted EBITDA margin remained relatively consistent with the prior period decreasing slightly primarily due to the increase in performance-based incentive compensation.
Segment Structure and Revenue Streams
Effective January 1, 2011, we realigned our decision support services (or “DSS”) under our Spend and Clinical Resource Management (“SCM”) segment from our Revenue Cycle Management (“RCM”) segment. We believe that this realignment helps us capitalize on the integration of our products and services, and to better focus on offering data-driven tools and services to help bridge our clients’ clinical and financial gaps so they can produce higher quality patient outcomes at a lower cost. As a result of this move, our results of operations, management’s discussion and analysis, and other applicable sections herein for periods prior to January 1, 2011 have been recast to reflect this change and DSS is included within our SCM performance analytics offerings in subsequent periods.
We deliver our solutions through two business segments, SCM and RCM. Management’s primary metrics to measure consolidated and segment financial performance are net revenue, non-GAAP gross fees, non-GAAP revenue share obligation, non-GAAP adjusted EBITDA, non-GAAP adjusted EBITDA margin, non-GAAP
42
diluted adjusted EPS and Segment Adjusted EBITDA. All of our revenues are from external clients and inter-segment revenues have been eliminated. See Note 13 of the Notes to Consolidated Financial Statements herein for discussion on Segment Adjusted EBITDA and certain items of our segment results of operations and financial position.
Spend and Clinical Resource Management
Our SCM segment provides a comprehensive suite of cost management services and supply chain analytics and data capabilities that help our clients manage many of their high and low expense categories. Our solutions lower supply and medical device costs and help to improve clinical resource utilization by managing the procurement process through our strategic sourcing of supplies and purchased services, discounted pricing through our group purchasing organization’s portfolio of contracts, consulting services and business analytics and intelligence tools. Our SCM segment revenue consists of the following components:
| | • | | Administrative fees and revenue share obligation. We earn administrative fees from manufacturers, distributors and other vendors (collectively referred to as “vendors”) of products and services with whom we have contracts under which our group purchasing organization clients may purchase products and services. Administrative fees represent a percentage, which we refer to as our administrative fee ratio, typically ranging from 0.25% to 3.00% of the purchases made by our group purchasing organization clients through contracts with our vendors. |
Our group purchasing organization clients make purchases, and receive shipments, directly from the vendors. Generally on a monthly or quarterly basis, vendors provide us with a report describing the purchases made by our clients through our group purchasing organization vendor contracts, including associated administrative fees. We recognize revenue upon the receipt of these reports from vendors.
Some client contracts require that a portion of our administrative fees be contingent upon achieving certain financial improvements, such as lower supply costs, which we refer to as performance targets. Contingent administrative fees are not recognized as revenue until we receive client acceptance on the achievement of those contractual performance targets. Prior to receiving client acceptance of performance targets, we record contingent administrative fees as deferred revenue on our consolidated balance sheets. Often, recognition of this revenue occurs in periods subsequent to the recognition of the associated costs. Should we fail to meet a performance target, we may be contractually obligated to refund some or all of the contingent fees. Additionally, in many cases, we are contractually obligated to pay a portion of the administrative fees to our hospital and health system clients. Typically this amount, which we refer to as our revenue share obligation, is calculated as a percentage of administrative fees earned on a particular client’s purchases from our vendors. Our total net revenue on our consolidated statements of operations is shown net of the revenue share obligation.
| | • | | Other service fees. The following items are included as “Other service fees” in our consolidated statement of operations: |
| | • | | Consulting fees. We consult with our clients regarding the costs and utilization of medical devices and physician preference items (“PPI”) and the efficiency and quality of their key clinical service lines. Our consulting projects are typically fixed fee projects with an average duration of six to nine months, and the related revenues are earned as services are rendered. We generate revenue from consulting contracts that also include performance targets. The performance targets generally relate to committed financial improvement to our clients from the use and implementation of initiatives that result from our consulting services. Performance targets are measured as our strategic initiatives are identified and implemented, and the financial improvement can be quantified by the client. Prior to receiving client acceptance of performance targets, we record contingent consulting fees as deferred revenue on our consolidated balance sheets. Often, recognition of this revenue occurs in periods subsequent to the recognition of the associated costs. Should we fail to meet a performance target, we may be contractually obligated to refund some or all of the contingent fees. |
43
| | • | | Subscription fees. We also offer technology-enabled services that provide spend management analytics and data services to improve operational efficiency, reduce supply costs, and increase transparency across spend management processes. We earn fixed subscription fees on a monthly basis for these Company-hosted SaaS-based solutions. |
Revenue Cycle Management
Our RCM segment provides a comprehensive suite of products and services spanning the hospital revenue cycle workflow — from patient access and financial responsibility, charge capture and integrity, pricing analysis, claims processing and denials management, payor contract management, revenue recovery and accounts receivable services. Our workflow solutions, together with our data management, compliance and audit tools, increase revenue capture and cash collections, reduce accounts receivable balances and increase regulatory compliance. Our RCM segment revenue is listed under the caption “Other service fees” on our consolidated statements of operations and consists of the following components:
| | • | | Subscription and implementation fees. We earn fixed subscription fees on a monthly or annual basis on multi-year contracts for client access to our SaaS-based solutions. We may also charge our clients non-refundable upfront fees for implementation of our SaaS-based services. These non-refundable upfront fees are earned over the subscription period or estimated client relationship period, whichever is longer. |
We defer costs related to implementation services and expense these costs in proportion to the revenue earned over the subscription period or client relationship period, as applicable.
In addition, we defer upfront sales commissions related to subscription and implementation fees and expense these costs ratably over the related contract term.
| | • | | Transaction fees. For certain of our revenue cycle management solutions, we earn fees that vary based on the volume of client transactions or enrolled members. |
| | • | | Service fees. For certain of our RCM solutions, we earn fees based on a percentage of cash remittances collected and fixed-fee consulting arrangements. The related revenues are earned as services are rendered. |
Operating Expenses
We classify our operating expenses as follows:
| | • | | Cost of revenue. Cost of revenue primarily consists of the direct labor costs incurred to generate our revenue. Direct labor costs consist primarily of salaries, benefits, incentive compensation and other direct costs and share-based compensation expenses related to personnel who provide services to implement our solutions for our clients (indirect labor costs for these personnel are included in general and administrative expenses). As the majority of our services are generated internally, our costs to provide these services are primarily labor-driven. A less significant portion of our cost of revenue consists of costs of third-party products and services and client reimbursed out-of-pocket costs. Cost of revenue does not include certain expenses relating to hosting our services and providing support and related data center capacity (which is included in general and administrative expenses), and allocated amounts for rent, depreciation, amortization or other indirect operating costs because we do not consider the inclusion of these items in cost of revenue relevant to our business. However, cost of revenue does include the amortization for the cost of software to be sold, leased, or otherwise marketed. In addition, any changes in revenue mix between our SCM and RCM segments, including changes in revenue mix towards SaaS-based revenue and consulting services, may cause significant fluctuations in our cost of revenue and have a favorable or unfavorable impact on operating income. |
| | • | | Product development expenses. Product development expenses primarily consist of the salaries, benefits, incentive compensation and share-based compensation expense of the technology professionals who develop, support and maintain our software-related products and services. Product development expenses are net of capitalized software development costs for both internal and external use. |
44
| | • | | Selling and marketing expenses. Selling and marketing expenses consist primarily of costs related to marketing programs (including trade shows and brand messaging), personnel-related expenses for sales and marketing employees (including salaries, benefits, incentive compensation and share-based compensation expense), certain meeting costs and travel-related expenses. |
| | • | | General and administrative expenses. General and administrative expenses consist primarily of personnel-related expenses for administrative employees and indirect time related to operational service-based employees (including salaries, benefits, incentive compensation and share-based compensation expense) and travel-related expenses, occupancy and other indirect costs, insurance costs, professional fees, and other general overhead expenses. |
| | • | | Acquisition and integration-related expenses. Acquisition and integration-related expenses may consist of: (i) costs incurred to complete acquisitions including due diligence, consulting and other related fees; (ii) integration and restructuring-type costs relating to our completed acquisitions; and (iii) acquisition-related fees associated with unsuccessful acquisition attempts. |
| | • | | Depreciation. Depreciation expense consists primarily of depreciation of fixed assets and the amortization of software, including capitalized costs of software developed for internal use. |
| | • | | Amortization of intangibles. Amortization of intangibles includes the amortization of all identified intangible assets (with the exception of software), primarily resulting from acquisitions. |
Key Considerations
Certain significant items or events must be considered to better understand differences in our results of operations from period to period. We believe that the following items or events have had a material impact on our results of operations for the periods discussed below or may have a material impact on our results of operations in future periods:
Debt Extinguishment
On December 13, 2012, we entered into a Credit Agreement with the banks and other financial institutions (the “Lenders”), JPMorgan Chase Bank, N.A., acting as administrative agent and collateral agent for the Lenders and letter of credit issuer, and Bank of America, N.A., acting as swing line lender (the “Credit Agreement”). The Credit Agreement consists of a: (i) five-year $250.0 million senior secured term A loan facility, (ii) a seven-year $300.0 million senior secured term B loan facility; and (iii) a five-year $200.0 million senior secured revolving credit facility, including a letter of credit sub-facility of $25.0 million and a swing line sub-facility of $25.0 million. Proceeds of borrowing under the Credit Agreement were used to repay all outstanding amounts under our prior credit facility.
The Credit Agreement permits us, subject to the satisfaction of certain conditions and obtaining commitments, to add one or more incremental term loan facilities, increase the aggregate commitments under the revolving credit facility or add one or more incremental revolving credit facility tranches in an aggregate amount of up to $200.0 million, which may have the same guarantees, and be secured on a pari passu basis by the same collateral, as the senior secured term loans and the senior secured revolving credit loans.
The Credit Agreement contains certain customary negative covenants, including, but not limited to, limitations on the incurrence of debt, limitations on liens, limitations on fundamental changes, limitations on asset sales and sale leasebacks, limitations on investments, limitations on dividends or distributions on, or redemptions of, equity interests, limitations on prepayments or redemptions of unsecured or subordinated debt, limitations on negative pledge clauses, limitations on transactions with affiliates and limitations on changes to our fiscal year. The Credit Agreement also includes maintenance covenants of maximum ratios of consolidated total indebtedness (subject to certain adjustments) to consolidated EBITDA (subject to certain adjustments) and minimum cash interest coverage ratios. The Credit Agreement contains certain customary representations and warranties, affirmative covenants and events of default, including payment defaults, breaches of representations and warranties, covenant defaults, cross-defaults to certain indebtedness, certain events of insolvency or bankruptcy, material judgments, certain events under ERISA, actual or asserted failures of any guaranty or security document
45
supporting the Credit Agreement to be in full force and effect and changes of control. As of December 31, 2012, we were not in default of any covenants under our Credit Agreement.
In connection with the Credit Agreement, we capitalized approximately $9.8 million in debt issuance costs. In addition, as a result of the debt extinguishment associated with our prior credit facility, we expensed approximately $20.0 million in debt issuance costs associated with the previous credit facility and terminated our forward starting interest rate swap agreements, as discussed further below.
Refer to Note 7 of the Notes to Consolidated Financial Statements for additional information.
Termination of Interest Rate Swaps
In December 2012, we terminated two floating-to-fixed rate LIBOR-based interest rate swaps as part of our debt refinancing that were originally scheduled to terminate in February 2015. In consideration of the early terminations, we paid the swap counterparties and incurred an expense of approximately $8.2 million for the fiscal year ended December 31, 2012. Accordingly, the swaps are no longer recorded on our Consolidated Balance Sheet as of December 31, 2012.
In November 2010, we terminated an interest rate swap as part of the Broadlane Acquisition that was originally scheduled to terminate in March 2012. In consideration of the early termination, we paid the swap counterparty, and incurred an expense of $1.6 million for the fiscal year ended December 31, 2010. Accordingly, the swap is no longer recorded on our Consolidated Balance Sheet as of December 31, 2010.
Broadlane Acquisition
We consummated the Broadlane Acquisition on November 16, 2010. During 2011, we finalized the purchase price with Broadlane LLC. As a result, we recorded an adjustment of approximately $1.7 million which decreased the deferred purchase consideration and goodwill. The final adjusted deferred purchase consideration amount of $120.1 million was paid by the Company in January 2012.
Share-based Compensation
During 2011, we reversed $6.5 million of previously recorded share-based compensation expense related to certain performance-based SSARs and performance-based restricted stock that were granted under the MedAssets, Inc. Long-Term Performance Incentive Plan in 2008. The share-based compensation expense was reversed due to non-achievement of certain performance criteria.
Segment Reporting
Effective January 1, 2011, we realigned our decision support services and performance analytics business operations under our SCM segment from our RCM segment. All prior period amounts have been recast to reflect this realignment.
46
Results of Operations
Consolidated Tables
The following tables set forth our consolidated results of operations grouped by segment for the periods shown:
| | | | | | | | | | | | |
| | | Fiscal Year Ended December 31, | |
| | | 2012 | | | 2011 | | | 2010 | |
| | | (In thousands) | |
| | | | | | | | | (recast) | |
Net revenue: | | | | | | | | | | | | |
Spend and Clinical Resource Management | | | | | | | | | | | | |
Gross administrative fees(1) | | $ | 427,698 | | | $ | 384,560 | | | $ | 182,024 | |
Revenue share obligation(1) | | | (160,783 | ) | | | (134,961 | ) | | | (62,954 | ) |
Other service fees | | | 126,656 | | | | 114,398 | | | | 58,533 | |
| | | | | | | | | | | | |
Total Spend and Clinical Resource Management | | | 393,571 | | | | 363,997 | | | | 177,603 | |
Revenue Cycle Management | | | 246,550 | | | | 214,275 | | | | 213,728 | |
| | | | | | | | | | | | |
Total net revenue | | | 640,121 | | | | 578,272 | | | | 391,331 | |
Operating expenses: | | | | | | | | | | | | |
Spend and Clinical Resource Management | | | 295,486 | | | | 304,142 | | | | 180,460 | |
Revenue Cycle Management | | | 214,935 | | | | 193,718 | | | | 182,868 | |
| | | | | | | | | | | | |
Total segment operating expenses | | | 510,421 | | | | 497,860 | | | | 363,328 | |
Operating income (loss) | | | | | | | | | | | | |
Spend and Clinical Resource Management | | | 98,085 | | | | 59,855 | | | | (2,857 | ) |
Revenue Cycle Management | | | 31,615 | | | | 20,557 | | | | 30,860 | |
| | | | | | | | | | | | |
Total segment operating income | | | 129,700 | | | | 80,412 | | | | 28,003 | |
Corporate expenses(2) | | | 44,502 | | | | 38,295 | | | | 47,524 | |
| | | | | | | | | | | | |
Operating income (loss) | | | 85,198 | | | | 42,117 | | | | (19,521 | ) |
Other income (expense): | | | | | | | | | | | | |
Interest expense | | | (66,045 | ) | | | (71,083 | ) | | | (27,508 | ) |
Loss on debt extinguishment | | | (28,196 | ) | | | — | | | | — | |
Other income | | | 685 | | | | 3,621 | | | | 650 | |
| | | | | | | | | | | | |
Loss before income taxes | | | (8,358 | ) | | | (25,345 | ) | | | (46,379 | ) |
Income tax benefit | | | (1,480 | ) | | | (9,851 | ) | | | (14,255 | ) |
| | | | | | | | | | | | |
Net loss | | | (6,878 | ) | | | (15,494 | ) | | | (32,124 | ) |
Reportable segment adjusted EBITDA(3): | | | | | | | | | | | | |
Spend and Clinical Resource Management | | | 176,893 | | | | 165,672 | | | | 87,696 | |
Revenue Cycle Management | | $ | 59,451 | | | $ | 49,635 | | | $ | 65,891 | |
Reportable segment adjusted EBITDA margin(4): | | | | | | | | | | | | |
Spend and Clinical Resource Management | | | 44.9 | % | | | 45.5 | % | | | 49.4 | % |
Revenue Cycle Management | | | 24.1 | % | | | 23.2 | % | | | 30.8 | % |
| (1) | These are non-GAAP measures. See “Use of Non-GAAP Financial Measures” section for additional information. |
| (2) | Represents the expenses of corporate office operations. |
47
| (3) | Management’s primary metric of segment profit or loss is segment adjusted EBITDA. See Note 13 of the Notes to Consolidated Financial Statements. |
| (4) | Reportable segment adjusted EBITDA margin represents each reportable segment’s adjusted EBITDA as a percentage of each segment’s respective net revenue. |
The following table sets forth our consolidated results of operations as a percentage of total net revenue for the periods shown:
| | | | | | | | | | | | |
| | | Fiscal Year Ended December 31, | |
| | | 2012 | | | 2011 | | | 2010 | |
| | | | | | | | | (recast) | |
Net revenue: | | | | | | | | | | | | |
Spend and Clinical Management | | | | | | | | | | | | |
Gross administrative fees(1) | | | 66.8 | % | | | 66.5 | % | | | 46.5 | % |
Revenue share obligation(1) | | | (25.1 | ) | | | (23.3 | ) | | | (16.1 | ) |
Other service fees | | | 19.8 | | | | 19.8 | | | | 15.0 | |
| | | | | | | | | | | | |
Total Spend and Clinical Management | | | 61.5 | | | | 62.9 | | | | 45.4 | |
Revenue Cycle Management | | | 38.5 | | | | 37.1 | | | | 54.6 | |
| | | | | | | | | | | | |
Total net revenue | | | 100.0 | | | | 100.0 | | | | 100.0 | |
Operating expenses: | | | | | | | | | | | | |
Spend and Clinical Management | | | 46.2 | | | | 52.6 | | | | 46.1 | |
Revenue Cycle Management | | | 33.6 | | | | 33.5 | | | | 46.7 | |
| | | | | | | | | | | | |
Total segment operating expenses | | | 79.7 | | | | 86.1 | | | | 92.8 | |
Operating income (loss) | | | | | | | | | | | | |
Spend and Clinical Management | | | 15.3 | | | | 10.4 | | | | (0.7 | ) |
Revenue Cycle Management | | | 4.9 | | | | 3.6 | | | | 7.9 | |
| | | | | | | | | | | | |
Total segment operating income | | | 20.2 | | | | 13.9 | | | | 7.1 | |
Corporate expenses(2) | | | 7.0 | | | | 6.6 | | | | 12.1 | |
| | | | | | | | | | | | |
Operating income (loss) | | | 13.3 | | | | 7.3 | | | | -5.0 | |
Other income (expense): | | | | | | | | | | | | |
Interest expense | | | (10.3 | ) | | | (12.3 | ) | | | (7.0 | ) |
Loss on debt extinguishment | | | (4.4 | ) | | | 0.0 | | | | 0.0 | |
Other income | | | 0.1 | | | | 0.6 | | | | 0.2 | |
| | | | | | | | | | | | |
Loss before income taxes | | | (1.3 | ) | | | (4.4 | ) | | | (11.9 | ) |
Income tax benefit | | | (0.2 | ) | | | (1.7 | ) | | | (3.6 | ) |
| | | | | | | | | | | | |
Net loss | | | -1.1 | % | | | -2.7 | % | | | -8.2 | % |
| (1) | These are non-GAAP measures. See “Use of Non-GAAP Financial Measures” section for additional information. |
| (2) | Represents the expenses of corporate office operations. |
48
Comparison of the Fiscal Years Ended December 31, 2012 and 2011
| | | | | | | | | | | | | | | | | | | | | | | | |
| | | Fiscal Year Ended December 31, | |
| | | 2012 | | | 2011 | | | Change | |
| | | Amount | | | % of
Revenue | | | Amount | | | % of
Revenue | | | Amount | | | % | |
| | | (In thousands) | |
Net revenue: | | | | | | | | | | | | | | | | | | | | | | | | |
Spend and Clinical Resource Management | | | | | | | | | | | | | | | | | | | | | | | | |
Gross administrative fees(1) | | $ | 427,698 | | | | 66.8 | % | | $ | 384,560 | | | | 66.5 | % | | $ | 43,138 | | | | 11.2 | % |
Revenue share obligation(1) | | | (160,783 | ) | | | (25.1 | ) | | | (134,961 | ) | | | (23.3 | ) | | | (25,822 | ) | | | 19.1 | |
Other service fees | | | 126,656 | | | | 19.8 | | | | 114,398 | | | | 19.8 | | | | 12,258 | | | | 10.7 | |
| | | | | | | | | | | | | | | | | | | | | | | | |
Total Spend and Clinical Resource Management | | | 393,571 | | | | 61.5 | | | | 363,997 | | | | 62.9 | | | | 29,574 | | | | 8.1 | |
Revenue Cycle Management | | | 246,550 | | | | 38.5 | | | | 214,275 | | | | 37.1 | | | | 32,275 | | | | 15.1 | |
| | | | | | | | | | | | | | | | | | | | | | | | |
Total net revenue | | $ | 640,121 | | | | 100.0 | % | | $ | 578,272 | | | | 100.0 | % | | $ | 61,849 | | | | 10.7 | % |
| (1) | These are non-GAAP measures. See “Use of Non-GAAP Financial Measures” section for additional information. |
Total net revenue. Total net revenue for the fiscal year ended December 31, 2012 was $640.1 million, an increase of approximately $61.8 million, or 10.7%, from total net revenue of $578.3 million for the fiscal year ended December 31, 2011. Total net revenue for the fiscal year ended December 31, 2011 excludes $6.2 million of revenue due to purchase accounting revenue adjustments required under GAAP (refer to footnote 6 of the Adjusted EBITDA Reconciliation table included in the “Use of Non-GAAP Financial Measures” section for additional information). Had this amount been included in total net revenue for the fiscal year ended December 31, 2011, our total net revenue for the fiscal year ended December 31, 2012 would have reflected an increase of 9.5% as compared to the prior period. The increase in total net revenue was comprised of a $29.6 million increase in SCM revenue and a $32.2 million increase in RCM revenue. For the fiscal years ended December 31, 2012 and 2011, performance-related revenue as a percentage of consolidated net revenue amounted to approximately 3.6% and 5.3%, respectively. Revenue may fluctuate significantly from period to period based upon achieving and thereof receiving client acknowledgement of the financial performance targets.
Spend and Clinical Resource Management net revenue. SCM net revenue for the fiscal year ended December 31, 2012 was $393.6 million, an increase of $29.6 million, or 8.1%, from net revenue of $364.0 million for the fiscal year ended December 31, 2011. SCM net revenue for the fiscal year ended December 31, 2011 excludes $6.2 million of revenue due to purchase accounting revenue adjustments required under GAAP. Had this amount been included in total SCM net revenue for the fiscal year ended December 31, 2011, our SCM net revenue for the fiscal year ended December 31, 2012 would have reflected an increase of 6.3% as compared to the prior period. The increase was the result of an increase in gross administrative fees of $43.1 million, or 11.2%, partially offset by an approximate $25.8 million increase in non-GAAP revenue share obligation, and an increase in other service fees of $12.3 million.
| | • | | Gross administrative fees. Non-GAAP gross administrative fee revenue increased by $43.1 million, or 11.2%, as compared to the prior period, primarily due to higher purchasing volumes by new and existing clients under our group purchasing organization contracts with our manufacturer and distributor vendors as well as an increase in the average administrative fee percentage realized under our manufacturer and distributor contracts. Non-GAAP gross administrative revenue for the fiscal year ended December 31, 2011 excludes $9.4 million of revenue due to purchase accounting revenue adjustments required under GAAP. Had this amount been included in non-GAAP gross administrative fee revenue for the fiscal year ended December 31, 2011, our non-GAAP gross administrative fee revenue for the fiscal year ended December 31, 2012 would have reflected an increase of 8.5% as compared to the prior period. We may have fluctuations in our non-GAAP gross administrative fee revenue in future periods as the timing of vendor reporting and client acknowledgement of achieved performance targets varies. |
49
| | • | | Revenue share obligation. Non-GAAP revenue share obligation increased $25.8 million, or 19.1%, as compared to the prior period. Non-GAAP revenue share obligation for the fiscal year ended December 31, 2011 excludes $4.8 million of purchase accounting revenue adjustments required under GAAP. Had this amount been included in non-GAAP revenue share obligation for the fiscal year ended December 31, 2011, our non-GAAP revenue share obligation for the fiscal year ended December 31, 2012 would have reflected an increase of 15.1% as compared to the prior period. We analyze the impact of our non-GAAP revenue share obligation on our results of operations by calculating the ratio of non-GAAP revenue share obligation to non-GAAP gross administrative fees including administrative fees not subject to a variable revenue share obligation (or the “revenue share ratio”). Our revenue share ratio was 37.6% and 35.1% for the fiscal years ended December 31, 2012 and 2011, respectively. Our revenue share ratio increased during the fiscal year ended December 31, 2012 as a result of gross administrative fee growth driven by clients that are entitled to a higher revenue share percentage. We may continue to experience fluctuations in our revenue share ratio based on the mix of clients who are entitled to a higher revenue share percentage due to increased purchasing volume in addition to an increase in the number of fixed-fee arrangements. |
| | • | | Other service fees. The $12.3 million, or 10.7%, increase in other service fees primarily related to $12.1 million in higher revenues from medical device consulting and strategic sourcing services. Other service fees for the fiscal year ended December 31, 2011 excludes $1.6 million of revenue due to purchase accounting revenue adjustments required under GAAP. Had this amount been included in other service fees for the fiscal year ended December 31, 2011, our other service fee revenue for the fiscal year ended December 31, 2012 would have reflected an increase of 9.2% as compared to the prior period. The growth in supply chain consulting was mainly due to an increased number of engagements from new and existing clients. The increase was partially offset by a $0.7 million decrease in revenue relating to our decision support services business. In addition, we recorded $5.7 million in revenue associated with our annual client and vendor meeting for the fiscal year ended December 31, 2012 compared to $5.5 million for the fiscal year ended December 31, 2011. |
Revenue Cycle Management net revenue. RCM net revenue for the fiscal year ended December 31, 2012 was $246.5 million, an increase of $32.2 million, or 15.1%, from net revenue of $214.3 million for the fiscal year ended December 31, 2011. The increase was attributable to a $18.6 million increase in revenue from our revenue cycle technology tools and a $13.6 million increase in revenue from our comprehensive revenue cycle service engagements. As we engage new clients, renew with existing clients and complete existing contracts, we will continue to experience fluctuations in our revenue cycle services financial performance as the business is characterized by a relatively small number of agreements, which each relate to large amounts of revenue.
50
Total Operating Expenses
| | | | | | | | | | | | | | | | | | | | | | | | |
| | | Fiscal Year Ended December 31, | |
| | | 2012 | | | 2011 | | | Change | |
| | | Amount | | | % of
Revenue | | | Amount | | | % of
Revenue | | | Amount | | | % | |
| | | (In thousands) | |
Operating expenses: | | | | | | | | | | | | | | | | | | | | | | | | |
Cost of revenue | | $ | 138,618 | | | | 21.7 | % | | $ | 121,771 | | | | 21.1 | % | | $ | 16,847 | | | | 13.8 | % |
Product development expenses | | | 28,483 | | | | 4.4 | | | | 26,823 | | | | 4.6 | | | | 1,660 | | | | 6.2 | |
Selling and marketing expenses | | | 60,438 | | | | 9.4 | | | | 56,997 | | | | 9.9 | | | | 3,441 | | | | 6.0 | |
General and administrative expenses | | | 218,194 | | | | 34.1 | | | | 203,101 | | | | 35.1 | | | | 15,093 | | | | 7.4 | |
Acquisition and integration-related expenses | | | 6,348 | | | | 1.0 | | | | 24,551 | | | | 4.2 | | | | (18,203 | ) | | | (74.1 | ) |
Depreciation | | | 30,190 | | | | 4.7 | | | | 22,402 | | | | 3.9 | | | | 7,788 | | | | 34.8 | |
Amortization of intangibles | | | 72,652 | | | | 11.3 | | | | 80,510 | | | | 13.9 | | | | (7,858 | ) | | | (9.8 | ) |
| | | | | | | | | | | | | | | | | | | | | | | | |
Total operating expenses | | | 554,923 | | | | 86.7 | | | | 536,155 | | | | 92.7 | | | | 18,768 | | | | 3.5 | |
Operating expenses by segment: | | | | | | | | | | | | | | | | | | | | | | | | |
Spend and Clinical Resource Management | | | 295,486 | | | | 46.2 | | | | 304,142 | | | | 52.6 | | | | (8,656 | ) | | | (2.8 | ) |
Revenue Cycle Management | | | 214,935 | | | | 33.6 | | | | 193,718 | | | | 33.5 | | | | 21,217 | | | | 11.0 | |
| | | | | | | | | | | | | | | | | | | | | | | | |
Total segment operating expenses | | | 510,421 | | | | 79.7 | | | | 497,860 | | | | 86.1 | | | | 12,561 | | | | 2.5 | |
Corporate expenses | | | 44,502 | | | | 7.0 | | | | 38,295 | | | | 6.6 | | | | 6,207 | | | | 16.2 | |
| | | | | | | | | | | | | | | | | | | | | | | | |
Total operating expenses | | $ | 554,923 | | | | 86.7 | % | | $ | 536,155 | | | | 92.7 | % | | $ | 18,768 | | | | 3.5 | % |
Cost of revenue. Cost of revenue for the fiscal year ended December 31, 2012 was $138.6 million, or 21.7% of total net revenue, an increase of $16.8 million, or 13.8%, from cost of revenue of $121.8 million, or 21.1% of total net revenue, for the fiscal year ended December 31, 2011. The increase was primarily attributable to an increase in service-related engagements in our RCM segment, which resulted in a higher cost of revenue given these activities are more labor intensive. In addition, for our engagements that include achieving financial performance targets, we recognize revenue based on when the financial performance targets are achieved and such achievement is acknowledged by our clients. There are instances during a reporting period where we incur a higher amount of direct costs with no associated revenue for these types of engagements. Also, we may record revenue in a reporting period where the direct costs have been recorded in a previous period. These events may affect period over period comparability.
Product development expenses. Product development expenses for the fiscal year ended December 31, 2012 were approximately $28.5 million, or 4.4% of total net revenue, an increase of $1.7 million, or 6.2%, from product development expenses of $26.8 million, or 4.6% of total net revenue, for the fiscal year ended December 31, 2011.
The increase was primarily attributable to a $1.0 million increase in compensation expense relating to new and existing employees; and a $0.7 million increase in professional fees. Our product development capitalization rate for the fiscal years ended December 31, 2012 and 2011, was 58.5% and 54.4%, respectively. The higher capitalization rate for the fiscal year ended December 31, 2012 was primarily due to: (i) an increase in product development within our SCM reporting unit attributable to investments in integration-related activities in connection with integrating the operations of Broadlane with our existing operations; and (ii) an increase in RCM investments in product development primarily due to new product features and functionality, new technologies, and upgrades to our service offerings.
Selling and marketing expenses. Selling and marketing expenses for the fiscal year ended December 31, 2012 were $60.4 million, or 9.4% of total net revenue, an increase of $3.4 million, or 6.0%, from selling and marketing expenses of $57.0 million, or 9.9% of total net revenue, for the fiscal year ended December 31, 2011.
51
The increase was attributable to a $3.3 million increase in compensation expense relating to new and existing employees; a $0.9 million increase in share-based compensation expense; and a $0.2 million increase in other operating infrastructure expense. The increase was partially offset by a $0.5 million decrease in expenses associated with our client and vendor meeting; and a $0.5 million decrease in transportation expense. Total expenses related to our client and vendor meeting amounted to $6.4 million and $7.0 million for the fiscal year ended December 31, 2012 and 2011, respectively.
General and administrative expenses. General and administrative expenses for the fiscal year ended December 31, 2012 were approximately $218.2 million, or 34.1% of total net revenue, an increase of $15.1 million, or 7.4%, from general and administrative expenses of $203.1 million, or 35.1% of total net revenue, for the fiscal year ended December 31, 2011. The increase was attributable to an $11.5 million increase in compensation expense to new and existing employees, primarily operations-based employees; a $3.6 million increase in share-based compensation expense; a $2.1 million increase in telecommunications expense; and a $0.4 million increase in professional fees. The increase was partially offset by a $1.6 million decrease in restructuring charges that were associated with certain management changes within our RCM segment that occurred in the prior period; a $0.6 million decrease in rent expense; and a $0.3 million decrease in other operating infrastructure expense.
Acquisition-related expenses. Acquisition and integration-related expenses for the fiscal year ended December 31, 2012 were $6.3 million, or 1.0% of total net revenue, a decrease of $18.2 million, from acquisition-related expenses of $24.5 million, or 4.2% of total net revenue, for the fiscal year ended December 31, 2011. The decrease was attributable to the decrease in costs relating to our integration and restructuring associated with our restructuring plans which include costs such as severance, retention, salaries relating to redundant positions, certain performance-related salary-based compensation, and operating infrastructure costs.
We expect to continue to incur costs during the first six months of 2013 related to our integration plans including aligning service offerings and standardizing and migrating certain Broadlane operational systems and transactional data sets into our operational systems.
Depreciation. Depreciation expense for the fiscal year ended December 31, 2012 was $30.2 million, or 4.7% of total net revenue, an increase of $7.8 million, or 34.8%, from depreciation of $22.4 million, or 3.9% of total net revenue, for the fiscal year ended December 31, 2011. The increase was primarily attributable to depreciation resulting from purchases of property and equipment inclusive of increases to capitalized software development. As a result of our capital investments, we expect our depreciation expense to increase in future periods.
Amortization of intangibles. Amortization of intangibles for the fiscal year ended December 31, 2012 was $72.6 million, or 11.3% of total net revenue, a decrease of $7.9 million, or 9.8%, from amortization of intangibles of $80.5 million, or 13.9% of total net revenue, for the fiscal year ended December 31, 2011. The decrease in amortization expense compared to the prior year was due to certain identified intangible assets that are nearing the end of their useful life under an accelerated method of amortization.
Segment Operating Expenses
Spend and Clinical Resource Management expenses. SCM operating expenses for the fiscal year ended December 31, 2012 were $295.5 million, or 46.2% of total net revenue, a decrease of $8.6 million, or 2.8%, from approximately $304.1 million, or 52.6% of total net revenue for the fiscal year ended December 31, 2011. As a percentage of SCM segment net revenue, segment expenses were 75.1% and 83.6% for the fiscal years ended December 31, 2012 and 2011, respectively.
The decrease was primarily attributable to a $18.4 million decrease in integration and restructuring costs associated with the Broadlane Acquisition, including severance, retention, certain performance-related salary-based compensation, and operating infrastructure costs; a $4.9 million decrease in the amortization of intangibles as certain intangible assets reached the end of their useful life; a $1.6 million decrease in other operating infrastructure expense; a $0.8 million decrease in rent expense; a $0.6 million decrease in expenses associated
52
with our client and vendor meeting; and a $0.3 million decrease in professional fees. The decrease was partially offset by a $14.0 million increase in compensation expense with respect to new and existing employees, primarily operations-based employees; a $1.2 million increase in depreciation expense; a $1.1 million increase in cost of revenue in connection with higher direct labor costs; a $1.0 million increase in share-based compensation expense; and a $0.7 million increase in telecommunications expense.
Revenue Cycle Management expenses. RCM operating expenses for the fiscal year ended December 31, 2012 were $214.9 million, or 33.6% of total net revenue, an increase of $21.2 million, or 11.0%, from $193.7 million, or 33.5% of total net revenue, for the fiscal year ended December 31, 2011. As a percentage of RCM segment net revenue, segment expenses were 87.2% and 90.4% for the fiscal year ended December 31, 2012 and 2011, respectively.
RCM operating expenses increased as a result of a $14.9 million increase in cost of revenue in connection with higher direct labor costs related to more service-based engagements; a $4.0 million increase in professional fees; a $3.1 million increase in telecommunications expense; a $2.7 million increase in compensation expense with respect to new and existing employees; a $2.1 million increase in depreciation expense; and a $0.9 million increase in share-based compensation expense. The increase was partially offset by a $2.9 million decrease in amortization of intangibles as certain intangible assets reached the end of their useful life; a $1.6 million decrease in restructuring charges that were associated with certain management changes within our RCM segment that occurred in the prior period; a $1.4 million decrease in other operating infrastructure expense; and a $0.6 million decrease in transportation expense.
Corporate expenses. Corporate expenses for the fiscal year ended December 31, 2012 were $44.5 million, an increase of $6.2 million, or 16.2%, from $38.3 million for the fiscal year ended December 31, 2011, or 7.0% and 6.6% of total net revenue, respectively. The increase in corporate expenses was attributable to a $5.3 million increase in share-based compensation expense; a $4.7 million increase in depreciation expense; and a $1.5 million increase in other operating infrastructure expense. The increase was partially offset by a $1.7 million decrease in telecommunications expense; a $1.5 million decrease in professional fees; a $1.3 million decrease in compensation expense; and a $0.8 million decrease in legal expense.
Non-operating Expenses
Interest expense. Interest expense for the fiscal year ended December 31, 2012 was $66.0 million, a decrease of $5.1 million from interest expense of $71.1 million for the fiscal year ended December 31, 2011. The decrease in interest expense was primarily due to: (i) a lower level of indebtedness compared to the prior period and (ii) our prior revolving credit facility having a lower interest rate as it is not subject to the minimum 1.50% LIBOR floor (prior to our refinancing discussed herein). As of December 31, 2012, we had total indebtedness of $885.0 million compared to $903.7 million as of December 31, 2011 (excluding the deferred purchase consideration of $120.1 million as of December 31, 2011). See Note 7 of the Notes to our Consolidated Financial Statements herein for more details.
Loss on debt extinguishment. For the fiscal year ended December 31, 2012, we incurred a $28.2 million loss associated with our debt extinguishment (as discussed in “Key Considerations”). The amount is comprised of approximately $20.0 million in debt issuance costs from our previous credit facility and approximately $8.2 million to settle and terminate our two forward starting interest rate swap agreements.
Refer to Notes 7 and 14 of the Notes to Consolidated Financial Statements for additional information.
Other income. Other income for the fiscal year ended December 31, 2012 was $0.7 million, primarily comprised of rental income. Other income for the fiscal year ended December 31, 2011 was $3.6 million. The decrease in other income was primarily attributable to a $3.3 million insurance settlement received during the period and $0.3 million in rental income. Refer to Note 8 in the Notes to Consolidated Financial Statements for additional details.
Income tax benefit. Income tax benefit for the fiscal year ended December 31, 2012 was $1.5 million, a decrease of $8.4 million from an income tax benefit of $9.9 million for the fiscal year ended December 31, 2011, which was primarily attributable to decreased loss before taxes. Income tax benefit recorded during the fiscal year ended December 31, 2012 reflected an effective income tax rate of 17.7 %. Income tax benefit recorded during the fiscal year ended December 31, 2011 reflected an effective income tax rate of 38.9%. The main items
53
contributing to the difference in effective tax rate when comparing 2012 to 2011, were (i) a relatively consistent state current tax expense associated with certain states where the calculation of state income tax expense is computed on a measure other than net income relative to a substantially lower pretax net loss in 2012; (ii) settlement with the Internal Revenue Service related to research and development credits from 1999-2009; (iii) no estimate for research and development credits in 2012 compared to actual credits generated in 2011, which was attributable to the American Taxpayer Relief Act of 2012 being enacted on January 2, 2013.
In November 2012, we settled the Internal Revenue Service’s audit of our 2009 federal income tax return. We agreed to a reduction to our research and development credits of 15% for tax years 1999-2009. As a result of this agreement, we reflected a reduced research and development credit carryforward and have adjusted our liability for uncertain tax positions accordingly. We were also notified by the Internal Revenue Service that they would not be auditing Broadlane Intermediate Holdings, Inc.’s 2009 tax year and the 2009 tax year was therefore closed with no further action or changes to be made by the Internal Revenue Service.
Comparison of the Fiscal Years Ended December 31, 2011 and 2010
| | | | | | | | | | | | | | | | | | | | | | | | |
| | | Fiscal Year Ended December 31, | |
| | | 2011 | | | 2010 | | | Change | |
| | | Amount | | | % of
Revenue | | | Amount | | | % of
Revenue | | | Amount | | | % | |
| | | (In thousands) | |
Net revenue: | | | | | | | | | | | | | | | | | | | | | | | | |
Spend and Clinical Resource Management | | | | | | | | | | | | | | | | | | | | | | | | |
Gross administrative fees(1) | | $ | 384,560 | | | | 66.5 | % | | $ | 182,024 | | | | 46.5 | % | | $ | 202,536 | | | | 111.3 | % |
Revenue share obligation(1) | | | (134,961 | ) | | | (23.3 | ) | | | (62,954 | ) | | | (16.1 | ) | | | (72,007 | ) | | | 114.4 | |
Other service fees | | | 114,398 | | | | 19.8 | | | | 58,533 | | | | 15.0 | | | | 55,865 | | | | 95.4 | |
| | | | | | | | | | | | | | | | | | | | | | | | |
Total Spend and Clinical Resource Management | | | 363,997 | | | | 62.9 | | | | 177,603 | | | | 45.4 | | | | 186,394 | | | | 104.9 | |
Revenue Cycle Management | | | 214,275 | | | | 37.1 | | | | 213,728 | | | | 54.6 | | | | 547 | | | | 0.3 | |
| | | | | | | | | | | | | | | | | | | | | | | | |
Total net revenue | | $ | 578,272 | | | | 100.0 | % | | $ | 391,331 | | | | 100.0 | % | | $ | 186,941 | | | | 47.8 | % |
| (1) | These are non-GAAP measures. See “Use of Non-GAAP Financial Measures” section for additional information. |
Total net revenue. Total net revenue for the fiscal year ended December 31, 2011 was $578.3 million, an increase of $187.0 million, or 47.8%, from revenue of $391.3 million for the fiscal year ended December 31, 2010. The increase in total net revenue was comprised of a $186.4 million increase in SCM revenue and a $0.6 million increase in RCM revenue. For the fiscal years ended December 31, 2011 and 2010, performance-related revenue as a percentage of consolidated net revenue amounted to 5.3% and 4.4%, respectively.
Spend and Clinical Resource Management net revenue. SCM net revenue for the fiscal year ended December 31, 2011 was $364.0 million, an increase of $186.4 million, or 104.9%, from revenue of $177.6 million for the fiscal year ended December 31, 2010. The increase was the result of an increase in non-GAAP gross administrative fees of $202.5 million, or 111.3%, partially offset by a $72.0 million increase in non-GAAP revenue share obligation, and an increase in other service fees of $55.9 million.
| | • | | Gross administrative fees. Non-GAAP gross administrative fee revenue increased by $202.5 million, or 111.3%, as compared to the prior period, primarily due to the Broadlane Acquisition in addition to higher purchasing volumes by new and existing clients under our group purchasing organization contracts with our manufacturer and distributor vendors as well as an increase in the average administrative fee percentage realized from our manufacturer and distributor contracts. |
| | • | | Revenue share obligation. Non-GAAP revenue share obligation increased $72.0 million, or 114.4%, as compared to the prior period. We analyze the impact of our non-GAAP revenue share obligation on our results of operations by calculating the ratio of non-GAAP revenue share obligation to non-GAAP gross |
54
| | administrative fees including administrative fees not subject to a variable revenue share obligation (or the “revenue share ratio”). Our revenue share ratio was 35.1% and 34.6% for the fiscal years ended December 31, 2011 and 2010, respectively. We did not have any significant change in our client revenue mix during the year that resulted in a material impact on our revenue share ratio. |
| | • | | Broadlane related revenue. In our fiscal year ended December 31, 2010, the operating results of Broadlane were included for forty-six days beginning with the closing of the Broadlane Acquisition on November 16, 2010. |
| | | As discussed further below, approximately $6.2 million and $13.4 million of estimated net administrative fees for the fiscal years ended December 31, 2011 and 2010, respectively, associated with the Broadlane Acquisition were excluded from our financial results because of GAAP relating to business combinations. |
| | | Given the significant impact of the Broadlane Acquisition on our SCM segment, we believe acquisition-affected measures are useful for the comparison of our year over year net revenue growth. SCM net revenue for the fiscal year ended December 31, 2011 was $370.2 million, an increase of $26.5 million, or 7.7%, from SCM non-GAAP acquisition-affected net revenue of $343.7 million for the fiscal year ended December 31, 2010. The following table sets forth the reconciliation of SCM non-GAAP acquisition-affected net revenue to SCM GAAP net revenue: |
| | | | | | | | | | | | | | | | |
| | | Fiscal Year Ended December 31, | |
| | | 2011 | | | 2010 | | | Change | |
| | | Amount | | | Amount | | | Amount | | | % | |
| | | (Unaudited, in thousands) | |
SCM net revenue | | $ | 363,997 | | | $ | 177,603 | | | $ | 186,394 | | | | 104.9 | % |
Broadlane acquisition-related adjustment(1) | | | — | | | | 152,664 | | | | (152,664 | ) | | | (100.0 | ) |
Broadlane purchase accounting revenue adjustment(1)(2) | | | 6,245 | | | | 13,406 | | | | (7,161 | ) | | | (53.4 | ) |
| | | | | | | | | | | | | | | | |
Total SCM acquisition-affected net revenue(1) | | $ | 370,242 | | | $ | 343,673 | | | $ | 26,569 | | | | 7.7 | % |
| | | | | | | | | | | | | | | | |
| (1) | These are non-GAAP measures. See “Use of Non-GAAP Financial Measures” section for additional information. |
| (2) | Upon acquiring Broadlane, we made a purchase accounting adjustment that reflects the fair value of administrative fees related to customer purchases that occurred prior to November 16, 2010, but were reported to us subsequent to that date. Under our revenue recognition accounting policy, which is in accordance with GAAP, these administrative fees would be ordinarily recorded as revenue when reported to us; however, the acquisition method of accounting requires us to estimate the amount of purchases occurring prior to the transaction date and to record the fair value of the administrative fees to be received from those purchases as an account receivable (as opposed to recognizing revenue when these transactions are reported to us and recording any corresponding revenue share obligation as a liability). For the fiscal year ended December 31, 2011, the $6.2 million represents the net amount of (i) $9.4 million in gross administrative fees and $1.6 million in other service fees based on vendor reporting received from January 1, 2011 through November 15, 2011 related to purchases made prior to the acquisition date; and (ii) a corresponding revenue share obligation of $4.8 million. For the fiscal year ended December 31, 2010, the $13.4 million represents the net amount of (i) $26.8 million in gross administrative fees based on vendor reporting received from the acquisition date up through December 31, 2010; and (ii) a corresponding revenue share obligation of $13.4 million. |
| | • | | Other service fees. The $55.9 million, or 95.4%, increase in other service fees primarily related to $58.7 million in higher revenues from medical device consulting and strategic sourcing services (inclusive of Broadlane). The growth in supply chain consulting was mainly due to an increased number of engagements from new and existing clients coupled with other service fee revenue relating to consulting and sourcing services from the Broadlane Acquisition. The increase was partially offset by a $3.4 million decrease in revenue relating to our decision support services business primarily due to a scheduled and |
55
| | planned step down in license fees from a certain client. In addition, we recorded $5.5 million in revenue associated with our annual client and vendor meeting for the fiscal year ended December 31, 2011 compared to $3.6 million for the fiscal year ended December 31, 2010. |
Revenue Cycle Management revenue. RCM net revenue for the fiscal year ended December 31, 2011 was $214.3 million, an increase of $0.6 million, or 0.3%, from net revenue of $213.7 million for the fiscal year ended December 31, 2010. The increase was primarily attributable to an $8.6 million increase in revenue from our revenue cycle technology tools partially offset by an $8.0 million decrease in revenue from our comprehensive revenue cycle service engagements.
Total Operating Expenses
| | | | | | | | | | | | | | | | | | | | | | | | |
| | | Fiscal Year Ended December 31, | |
| | | 2011 | | | 2010 | | | Change | |
| | | Amount | | | % of
Revenue | | | Amount | | | % of
Revenue | | | Amount | | | % | |
| | | (In thousands) | |
Operating expenses: | | | | | | | | | | | | | | | | | | | | | | | | |
Cost of revenue | | $ | 121,771 | | | | 21.1 | % | | $ | 100,737 | | | | 25.7 | % | | $ | 21,034 | | | | 20.9 | % |
Product development expenses | | | 26,823 | | | | 4.6 | | | | 20,011 | | | | 5.1 | | | | 6,812 | | | | 34.0 | |
Selling and marketing expenses | | | 56,997 | | | | 9.9 | | | | 46,736 | | | | 11.9 | | | | 10,261 | | | | 22.0 | |
General and administrative expenses | | | 203,101 | | | | 35.1 | | | | 124,379 | | | | 31.8 | | | | 78,722 | | | | 63.3 | |
Acquisition and integration-related expenses | | | 24,551 | | | | 4.2 | | | | 21,591 | | | | 5.5 | | | | 2,960 | | | | 13.7 | |
Depreciation | | | 22,402 | | | | 3.9 | | | | 19,948 | | | | 5.1 | | | | 2,454 | | | | 12.3 | |
Amortization of intangibles | | | 80,510 | | | | 13.9 | | | | 31,027 | | | | 7.9 | | | | 49,483 | | | | 159.5 | |
Impairment of property & equipment, goodwill and intangibles | | | — | | | | 0.0 | | | | 46,423 | | | | 11.9 | | | | (46,423 | ) | | | 100.0 | |
| | | | | | | | | | | | | | | | | | | | | | | | |
Total operating expenses | | | 536,155 | | | | 92.7 | | | | 410,852 | | | | 105.0 | | | | 125,303 | | | | 30.5 | |
Operating expenses by segment: | | | | | | | | | | | | | | | | | | | | | | | | |
Spend and Clinical Resource Management | | | 304,142 | | | | 52.6 | | | | 180,460 | | | | 46.1 | | | | 123,682 | | | | 68.5 | |
Revenue Cycle Management | | | 193,718 | | | | 33.5 | | | | 182,868 | | | | 46.7 | | | | 10,850 | | | | 5.9 | |
| | | | | | | | | | | | | | | | | | | | | | | | |
Total segment operating expenses | | | 497,860 | | | | 86.1 | | | | 363,328 | | | | 92.8 | | | | 134,532 | | | | 37.0 | |
Corporate expenses | | | 38,295 | | | | 6.6 | | | | 47,524 | | | | 12.1 | | | | (9,229 | ) | | | (19.4 | ) |
| | | | | | | | | | | | | | | | | | | | | | | | |
Total operating expenses | | $ | 536,155 | | | | 92.7 | % | | $ | 410,852 | | | | 105.0 | % | | $ | 125,303 | | | | 30.5 | % |
Cost of revenue. Cost of revenue for the fiscal year ended December 31, 2011 was $121.8 million, or 21.1% of total net revenue, an increase of $21.0 million, or 20.9%, from cost of revenue of $100.7 million, or 25.7% of total net revenue, for the fiscal year ended December 31, 2010. Excluding the impact of the Broadlane Acquisition, our cost of revenue as a percentage of related net revenue was 21.0% for the fiscal year ended December 31, 2011.
Of the increase, $23.5 million was attributable to cost of revenue associated with the Broadlane Acquisition. The increase was offset by a $2.5 million decrease in cost of revenue which was associated with: (i) a decrease in service-related engagements primarily in our revenue cycle services business, which result in a lower cost of revenue given these activities are more labor intensive; and (ii) a decrease in cost of revenue from our decision support services business which was driven by lower revenue as previously discussed.
Product development expenses. Product development expenses for the fiscal year ended December 31, 2011 were $26.8 million, or 4.6% of total net revenue, an increase of $6.8 million, or 34.0%, from product development expenses of $20.0 million, or 5.1% of total net revenue, for the fiscal year ended December 31, 2010. Excluding the impact of the Broadlane Acquisition, our product development expenses as a percentage of related net revenue was 5.4% for the fiscal year ended December 31, 2011.
56
Of the increase, $3.9 million was attributable to product development expenses associated with the Broadlane Acquisition. The remaining increase was attributable to a $1.6 million increase in professional fees; and a $1.3 million increase in compensation expense (inclusive of performance-based incentive compensation expense) to new and existing employees. Our product development capitalization rate for the fiscal year ended December 31, 2011 and 2010, was 54.4% and 47.3%, respectively. The higher capitalization rate for the fiscal year ended December 31, 2011 was primarily due to: (i) an increase in product and development within our SCM reporting unit attributable to investments in integration-related activities in connection with combining the operations of Broadlane with our existing operations; and (ii) an increase in RCM investments in product and development primarily due to new product features and functionality, new technologies, and upgrades to our service offerings.
Selling and marketing expenses. Selling and marketing expenses for the fiscal year ended December 31, 2011 were $57.0 million, or 9.9% of total net revenue, an increase of $10.3 million, or 22.0%, from selling and marketing expenses of $46.7 million, or 11.9% of total net revenue, for the fiscal year ended December 31, 2010. Excluding the impact of the Broadlane Acquisition, selling and marketing expenses as a percentage of related net revenue was 12.4% for the fiscal year ended December 31, 2011.
Of the increase, $4.5 million was attributable to selling and marketing expenses associated with the Broadlane Acquisition. The remaining increase was attributable to a $3.8 million increase in compensation expense (inclusive of performance-based incentive compensation expense) relating to new and existing employees; a $2.3 million increase in expenses associated with our client and vendor meeting; a $0.6 million increase in transportation expense; a $0.5 million increase in advertising expense; and a $0.5 million increase in meetings expense. The increase was partially offset by a $1.9 million decrease in share-based compensation expense resulting from the reversal of share-based compensation expense relating to certain performance-based equity awards (as discussed in “Key Considerations”) as well as the use of the accelerated method of expense attribution used for our service-based equity awards that are subject to graded vesting, which comprises a majority of our total equity awards. This method results in a continual decrease in annual share-based compensation expense with respect to each grant over the requisite service period of such grant. Total expenses related to our client and vendor meeting amounted to $7.0 million and $4.7 million for the fiscal years ended December 31, 2011 and 2010, respectively.
General and administrative expenses. General and administrative expenses for the fiscal year ended December 31, 2011 were $203.1 million, or 35.1% of total net revenue, an increase of $78.7 million, or 63.3%, from general and administrative expenses of $124.4 million, or 31.8% of total net revenue, for the fiscal year ended December 31, 2010. Excluding the impact of the Broadlane Acquisition, our general and administrative expenses as a percentage of related net revenue was 37.4% for the fiscal year ended December 31, 2011.
Of the increase, $46.0 million was attributable to the Broadlane Acquisition. The remaining increase was attributable to a $20.7 million increase in compensation expense (inclusive of performance-based compensation expense) to new and existing employees, primarily operational service-based employees; a $4.5 million increase in telecommunications expense; a $3.0 million increase in professional fees; a $2.7 million increase in rent expense; a $2.1 million increase in other operating infrastructure expense; a $1.4 million increase in restructuring charges associated with certain management changes within our RCM segment as described above in “Key Considerations”; a $1.4 million increase in transportation expense; and a $1.3 million increase in legal expense. The increase was partially offset by a $2.9 million decrease in share-based compensation expense (for the reason described within “Selling and marketing expenses”); and a $1.5 million decrease in bad debt expense due to significantly lower uncollectable accounts compared to the prior year.
Acquisition and integration-related expenses. Acquisition and integration-related expenses for the fiscal year ended December 31, 2011 were $24.5 million, or 4.2% of total net revenue, an increase of $2.9 million, or 13.7%, from acquisition and integration-related expenses of $21.6 million, or 5.5% of total net revenue for the fiscal year ended December 31, 2010. The increase was attributable to integration and restructuring-type costs associated with the Broadlane Acquisition, including severance, retention, redundant salaries, certain performance-related salary-based compensation, and operating infrastructure costs.
57
Depreciation. Depreciation expense for the fiscal year ended December 31, 2011 was $22.4 million, or 3.9% of total net revenue, an increase of $2.4 million, or 12.3%, from depreciation of $20.0 million, or 5.1% of total net revenue, for the fiscal year ended December 31, 2010. The increase was primarily attributable to depreciation resulting from purchases of property and equipment inclusive of increases to capitalized software development subsequent to December 31, 2010. The increase was partially offset by the change to extend the estimated useful life of our internally developed software (as discussed in “Key Considerations”).
Excluding the impact of the Broadlane Acquisition, our depreciation expense as a percentage of related net revenue was 4.3% for the fiscal year ended December 31, 2011.
Amortization of intangibles. Amortization of intangibles for the fiscal year ended December 31, 2011 was $80.5 million, or 13.9% of total net revenue, an increase of $49.5 million, or 159.5%, from amortization of intangibles of $31.0 million, or 7.9% of total net revenue, for the fiscal year ended December 31, 2010. Excluding the impact of additional amortization expense relating to the Broadlane Acquisition, which amounted to $53.7 million, amortization expense decreased compared to the prior year due to certain identified intangible assets that are nearing the end of their useful life under an accelerated method of amortization.
Excluding the impact of the Broadlane Acquisition, our amortization expense as a percentage of related net revenue was 4.6% for the fiscal year ended December 31, 2011.
Impairment of property and equipment, goodwill and intangibles. The impairment of property and equipment, goodwill and intangibles for the fiscal year ended December 31, 2010 of $46.4 million was primarily attributable to a $44.5 million write-off of goodwill relating to our decision support services operating unit; and a $1.3 million write-off relating to an SCM trade name and a customer base intangible asset from prior acquisitions that were deemed to be impaired as part of the product and service offering integration associated with the Broadlane Acquisition.
Segment Operating Expenses
Spend and Clinical Resource Management expenses. SCM expenses for the fiscal year ended December 31, 2011 were $304.1 million, or 52.6% of total net revenue, an increase of $123.6 million, or 68.5%, from $180.5 million, or 46.1% of total net revenue for the fiscal year ended December 31, 2010.
Of the increase, $135.3 million of expenses were attributable to the Broadlane Acquisition. SCM operating expenses also increased as a result of $15.9 million attributable to integration and restructuring-type costs associated with the Broadlane Acquisition, including severance, retention, certain performance-related salary-based compensation, and operating infrastructure costs; a $12.4 million increase in compensation expense (inclusive of performance-based compensation expense) to new and existing employees, primarily operational service-based employees; a $2.5 million increase in telecommunications expense; a $1.9 million increase in expenses associated with our client and vendor meeting; a $1.2 million increase in rent expense; a $1.2 million increase in professional fees; a $1.1 increase in advertising expense; a $1.1 million increase in operating infrastructure expense; and a $0.4 million increase in transportation expense. The increase was partially offset by a $44.5 million write-off of goodwill relating to our decision support services operating unit in 2010; a $1.3 million impairment charge in 2010 comprised of an SCM trade name and a customer base intangible asset from prior acquisitions that were deemed to be impaired as part of the product and service offering integration associated with the Broadlane Acquisition; a $1.9 million decrease in share-based compensation expense previously discussed; a $0.9 million decrease in the amortization of intangibles as certain of these assets reached the end of their useful life; and a $0.8 million decrease in depreciation expense.
Excluding the impact of the Broadlane Acquisition, our SCM segment expenses as a percentage of related net revenue were 60.5% for the fiscal year ended December 31, 2011.
Revenue Cycle Management expenses. RCM expenses for the fiscal year ended December 31, 2011 were $193.7 million, or 33.5% of total net revenue, an increase of $10.8 million, or 5.9%, from $182.9 million, or 46.7% of total net revenue for the fiscal year ended December 31, 2010.
RCM operating expenses increased as a result of a $12.0 million increase in compensation expense (inclusive of performance-based compensation expense) to new and existing employees, primarily operational
58
service-based employees; a $1.8 million increase in professional fees; a $1.6 million increase in restructuring charges associated with certain management changes within our RCM segment as described above in “Key Considerations”; a $1.4 million increase in rent expense; a $1.4 million increase in telecommunications expense; a $1.2 million increase in our operating infrastructure expense; and a $0.5 million increase in transportation expense. The increase was partially offset by a $3.2 million decrease in amortization of intangibles; a $2.4 million decrease in depreciation expense; a $1.4 million decrease in share-based compensation expense previously discussed; a $1.4 million decrease in cost of revenue in connection with lower direct labor costs; and a $0.7 million decrease in bad debt expense due to significantly lower uncollectable accounts compared to the prior year.
As a percentage of RCM segment net revenue, segment expenses were 90.4% and 85.6% for the fiscal years ended December 31, 2011 and 2010, respectively.
Corporate expenses. Corporate expenses for the fiscal year ended December 31, 2011 were $38.3 million, a decrease of $9.2 million, or 19.4%, from $47.5 million for the fiscal year ended December 31, 2010, or 6.6% and 12.1% of total net revenue, respectively. The decrease in corporate expenses was primarily attributable to a $13.0 million decrease in acquisition-related expenses; a $3.2 million decrease in share-based compensation expense previously discussed; and a $1.5 million decrease in other operating infrastructure expense. The decrease was partially offset by a $2.3 million increase in professional fees; a $1.8 million increase in depreciation expense; a $1.7 million increase in compensation expense (inclusive of performance-based incentive compensation expense); a $1.2 million increase in transportation expense; a $1.0 million increase in legal expense; and a $0.5 million increase in telecommunications expense.
Non-operating Expenses
Interest expense. Interest expense for the fiscal year ended December 31, 2011 was $71.1 million, an increase of $43.6 million, or 158.4%, from interest expense of $27.5 million for the fiscal year ended December 31, 2010. As of December 31, 2011, we had total indebtedness of $903.7 million compared to $960.0 million as of December 31, 2010. The increase in interest expense was attributable to a full year of interest expense in 2011 based on a higher level of indebtedness compared to lower weighted average level of indebtedness in 2010 due to the timing and related financing of the Broadlane Acquisition.
Other income (expense). Other income for the fiscal year ended December 31, 2011 was $3.6 million, comprised principally of a $3.3 million insurance settlement received during the period and $0.4 million in rental income partially offset by $0.1 million in foreign exchange transaction losses. Refer to Note 8 in the Notes to Consolidated Financial Statements for additional details of the insurance settlement. Other income for the fiscal year ended December 31, 2010 was $0.6 million, primarily comprised of $0.4 million in rental income and $0.1 million in interest income.
Income tax (benefit) expense. Income tax benefit for the fiscal year ended December 31, 2011 was $9.9 million, a decrease of $4.4 million from an income tax benefit of $14.3 million for the fiscal year ended December 31, 2010, which was primarily attributable to increased income before taxes resulting in: (i) lower federal income tax benefit of $8.9 million (at the statutory rate of 35%); and, (ii) higher foreign and state income tax benefit of $0.5 million. The income tax benefit recorded during the fiscal year ended December 31, 2011 and income tax benefit recorded during the fiscal year ended 2010 reflected an annual effective tax rate of 38.9% and 30.7%, respectively. The two primary items contributing to the variance in effective tax rate when comparing 2011 to 2010, were nondeductible transaction costs related to the acquisition of Broadlane in 2010 and the impact of the Broadlane acquisition on our state taxes.
Critical Accounting Policy Disclosure
The preparation of financial statements in conformity with accounting principles generally accepted in the United States requires management to make estimates and judgments that affect the reported amounts of assets and liabilities, disclosure of contingent assets and liabilities at the date of the financial statements and the reported amount of revenue and expenses during the reporting period. We base our estimates and judgments on historical experience and other assumptions that we find reasonable under the circumstances. Actual results may differ from such estimates under different conditions.
59
Management believes that the following accounting judgments and uncertainties are the most critical to aid in fully understanding and evaluating our reported financial results, as they require management’s most difficult, subjective or complex judgments. Management has reviewed these critical accounting estimates and related disclosures with the audit committee of our board of directors.
Revenue Recognition
In accordance with Staff Accounting Bulletin No. 104, Revenue Recognition, we recognize revenue when (a) there is a persuasive evidence of an arrangement, (b) the fee is fixed or determinable, (c) services have been rendered and payment has been contractually earned, and (d) collectability is reasonably assured.
Inclusive in our revenue recognition policies, we are required to make certain critical judgments that impact the period over which revenue is recognized. These judgments are described below.
Revenue Recognition — Multiple-Deliverable Revenue Arrangements
We may bundle certain of our SCM service and technology offerings into a single service arrangement. We may also bundle certain of our RCM service and technology offerings into a single service arrangement. In addition, we may bundle certain of both of our SCM and RCM service and technology offerings together into a single service arrangement and market them as an enterprise arrangement.
We use a selling price hierarchy for determining the appropriate value of a deliverable. The hierarchy is based on: (a) vendor-specific objective evidence if available (“VSOE”); (b) third-party evidence (“TPE”) if vendor-specific objective evidence is not available; or (c) estimated selling price (“ESP”) if neither VSOE nor TPE is available.
If we are unable to establish selling price using VSOE or TPE, we will establish an ESP. ESP is the estimated price at which we would transact a sale if the product or service were sold on a stand-alone basis. We establish a best estimate of ESP considering internal factors relevant to pricing practices such as costs and margin objectives, standalone sales prices of similar services and percentage of the fee charged for a primary service relative to a related service. Additional consideration is also given to market conditions such as competitor pricing strategies and market trends. If available, we regularly review VSOE and TPE for our services in addition to ESP.
Subscription and Implementation Fees
We apply the revenue recognition guidance prescribed by generally accepted accounting principles in the United States of America (“GAAP”) relating to software for our hosted solutions. We provide subscription-based revenue cycle and spend and clinical resource management services through software tools accessed by our clients while the data is hosted and maintained on our servers. In many arrangements, clients are charged set-up fees for implementation and monthly subscription fees for access to these web-based hosted services. Implementation fees are typically billed at the beginning of the arrangement and recognized as revenue over the greater of the subscription period or the estimated client relationship period. We estimate the client relationship period based on historical client retention rates. We currently estimate our client relationship period to be six years for our hosted services. Revenue from monthly hosting arrangements is recognized on a subscription basis over the period in which the client uses the service. Contract subscription periods typically range from two to six years from execution.
We monitor our client relationship periods and as a result, our estimated client relationship period may change due to the changing attrition rates of our clients. We have historically changed our estimates of client relationship periods for certain of our web-hosted clients. These changes in estimated client lives have typically deferred revenue over longer periods.
Goodwill and Intangible Assets
We evaluate goodwill and other intangible assets for impairment annually and whenever events or changes in circumstances indicate the carrying value of the goodwill or other intangible assets may not be recoverable.
60
The Company considers the following to be important factors that could trigger an impairment review and may result in an impairment charge: significant and sustained underperformance relative to historical or projected future operating results; identification of other impaired assets within a reporting unit; significant and sustained adverse changes in business climate or regulations; significant negative changes in senior management; significant changes in the manner of use of the acquired assets or the strategy for the Company’s overall business; significant negative industry or economic trends; and a significant decline in the Company’s stock price for a sustained period.
We complete our impairment evaluation by performing valuation analyses in accordance with GAAP relating to goodwill and other intangibles. This analysis contains uncertainties because it requires us to make market participant assumptions and to apply judgment to estimate industry economic factors and the profitability and growth of future business strategies to determine estimated future cash flows and an appropriate discount rate. When market prices are not available, we estimate the fair value of the reporting unit or asset group using the income approach and/or the market approach. The income approach uses cash flow projections. Inherent in our development of cash flow projections are assumptions and estimates derived from a review of our operating results, approved business plans, expected growth rates, capital expenditures and cost of capital, similar to those a market participant would use to assess fair value. We also make certain assumptions about future economic conditions and other data. Many of the factors used in assessing fair value are outside the control of management, and these assumptions and estimates may change in future periods.
Changes in assumptions or estimates can materially affect the fair value measurement of a reporting unit or asset group, and therefore can affect the amount of the impairment. The following are key assumptions we use in making cash flow projections:
| | • | | Business projections. We make assumptions about the demand for our products in the marketplace. These assumptions drive our planning assumptions for volume, mix, and pricing. We also make assumptions about our cost levels. These projections are derived using our internal business plans that are updated at least annually and reviewed by our Board of Directors. |
| | • | | Long-term growth rate. A growth rate is used to calculate the terminal value of the business, and is added to the present value of the debt-free cash flows. The growth rate is the expected rate at which a business unit’s earnings stream is projected to grow beyond the planning period. |
| | • | | Discount rate. When measuring possible impairment, future cash flows are discounted at a rate that is consistent with a weighted-average cost of capital that we anticipate a potential market participant would use. Weighted-average cost of capital is an estimate of the overall risk-adjusted after-tax rate of return required by equity and debt holders of a business enterprise. |
| | • | | Economic projections. Assumptions regarding general economic conditions are included in and affect our assumptions regarding industry sales and pricing estimates. These macro-economic assumptions include, but are not limited to, industry sales volumes and interest rates. |
Our estimates of future cash flows used in these valuations could differ materially from actual results. If actual results are not consistent with our estimates or assumptions, we may be exposed to an impairment charge that could be material.
As of October 1, 2012, the estimated fair value of each operating unit within our SCM and RCM segments exceeded its respective carrying value by more than 10%.
In addition, we make assumptions about the useful lives of our intangible assets. Intangible assets (including our capitalized software) are amortized over their useful lives, which have been derived based on an assessment of such factors as attrition, expected volume and economic benefit. We evaluate the useful lives of our intangible assets on an annual basis. Any changes to our estimated useful lives could cause depreciation and amortization to increase or decrease.
We may experience significant fluctuations in our stock price and related market capitalization. If we experience a decline in our stock price and market capitalization or if we experience unfavorable business trends which could lead to a reduction of expected future cash flows for one or more of our reporting units, we may incur potential impairment charges in future reporting periods.
61
Acquisitions — Purchase Price Allocation
In accordance with GAAP relating to business combinations, we use the purchase method of accounting for acquisitions which prescribes, among other things, how assets and liabilities are recognized in purchase accounting. The guidance also requires the recognition of assets acquired and liabilities assumed arising from contingencies, the capitalization of in-process research and development at fair value, and the expensing of acquisition-related costs as incurred.
Our purchase price allocation methodology requires us to make assumptions and to apply judgment to estimate the fair value of acquired assets and liabilities. We estimate the fair value of assets and liabilities based upon appraised market values, the carrying value of the acquired assets and widely accepted valuation techniques, including discounted cash flows and market multiple analyses. Management determines the fair value of fixed assets and identifiable intangible assets such as developed technology or client relationships, and any other significant assets or liabilities. We adjust the purchase price allocation, as necessary, up to one year after the acquisition closing date as we obtain more information regarding asset valuations and liabilities assumed. Unanticipated events or circumstances may occur which could affect the accuracy of our fair value estimates, including assumptions regarding industry economic factors and business strategies, and result in an impairment or a new allocation of purchase price.
Given our history of acquisitions, we may allocate part of the purchase price of future acquisitions to contingent consideration as required by GAAP for business combinations. The fair value calculation of contingent consideration will involve a number of assumptions that are subjective in nature and which may differ significantly from actual results. We may experience volatility in our earnings to some degree in future reporting periods as a result of these fair value measurements.
Allowance for Doubtful Accounts
In evaluating the collectability of our accounts receivable, we assess a number of factors, including a specific client’s ability to meet its financial obligations to us (which would be affected, for example, if such client declared bankruptcy). Other factors include the length of time the receivables are past due and historical collection experience. Based on these assessments, we record a reserve for specific account balances as well as a general reserve based on our historical experience for bad debt to reduce the related receivables to the amount we expect to collect from clients. Refer to Note 16 of the notes to consolidated financial statements.
We have not made any material changes in the accounting methodology used to estimate the allowance for doubtful accounts. If actual results are inconsistent with our estimates or assumptions, we may experience a higher or lower expense. In addition, if circumstances related to specific clients change, or economic conditions deteriorate such that our past collection experience is no longer relevant, our estimate of the recoverability of our accounts receivable could be further reduced from the levels provided for in the Consolidated Financial Statements.
Client Service Allowance
We maintain a client service allowance based on management’s evaluation of historical experience, current trends, individual client experience and other relevant factors that, in the opinion of management, deserve recognition in estimating such allowance. Estimates related to our client service allowance are recorded as a reduction to net revenue in our consolidated statements of operations and as a current liability in our consolidated balance sheets.
Income Taxes
We regularly review our deferred tax assets for recoverability and establish a valuation allowance, as needed, based upon historical taxable income, projected future taxable income, the expected timing of the reversals of existing temporary differences and the implementation of tax-planning strategies. Our tax valuation allowance requires us to make assumptions and apply judgment regarding the forecasted amount and timing of future taxable income.
62
We estimate the company’s effective tax rate based upon the currently enacted tax rates and estimated state apportionment. This rate is determined based upon location of company personnel, location of company assets and determination of sales on a jurisdictional basis. We currently file income tax returns in approximately 56 jurisdictions (inclusive of certain city jurisdictions).
We recognize excess tax benefits associated with stock based compensation directly to stockholders’ equity when realized. When assessing whether a tax benefit relating to share-based compensation has been realized, we follow the tax law ordering method, under which current year share-based compensation deductions are assumed to be utilized before net operating loss carryforwards and other tax attributes such as tax credits. If tax law does not specify the ordering in a particular circumstance, then a pro-rata approach is used.
We account for uncertain tax positions in accordance with GAAP relating to the accounting for uncertainty in income taxes. The guidance prescribes a recognition threshold and measurement attribute for the financial statement recognition and measurement of uncertain tax positions taken or expected to be taken in a company’s income tax return, and also provides guidance on de-recognition, classification, interest and penalties, accounting in interim periods, disclosure, and transition. Our policy is to include interest and penalties in our provision for income taxes. The tax years 1999 through 2011 remain open to examination by the Internal Revenue Service and certain state taxing jurisdictions to which we are subject. For years 1999 to 2008, the statute for assessments and refunds has generally expired; however, tax attributes for those years may still be examined, which would impact the tax years 2009 and forward.
Each quarter we assess our uncertain tax positions and adjust our reserve accordingly based on the most recent facts and circumstances. If there is a significant change in the underlying facts and circumstances or applicable tax law modifications, we may be exposed to additional benefits or expense. See Note 11 of the Notes to Consolidated Financial Statements for the impact of uncertain tax positions in 2012.
We expect a significant increase in our cash taxes in future years, primarily attributable to exhausting a significant portion of our federal net operating loss carryforwards and other tax attributes such as tax credits.
Share-Based Compensation
We have a share-based compensation plan, which includes non-qualified stock options, non-vested share awards and stock-settled stock appreciation rights. See Note 1, Significant Accounting Policies, Note 9, Stockholders’ Equity and Note 10, Share-Based Compensation, of the Notes to Consolidated Financial Statements for a complete discussion of our share-based compensation programs.
We utilize market-based share prices of our common stock in the Black-Scholes option pricing model to calculate fair value of our common stock option awards. This valuation technique involves highly subjective assumptions. These assumptions include estimating the length of time employees will retain their vested stock options before exercising them (“expected term”), the estimated volatility of our common stock price over the expected term and estimated forfeitures.
Historically, it has not been practicable for us to estimate the expected volatility of our share price, required by existing accounting requirements based solely on our own historical stock price volatility (trading history), given our limited history as a publicly traded company. Beginning in 2013, we will have sufficient history as a public company and will calculate the expected volatility of our share price based on our trading history, which may impact our future share-based compensation. In accordance with GAAP for stock compensation, we have estimated grant-date fair value of our shares using a combination of our own trading history and a volatility calculated (“calculated volatility”) from an appropriate industry sector index of comparable entities. We identified similar public entities for which share and option price information was available, and considered the historical volatilities of those entities’ share prices in calculating volatility. Dividend payments were not assumed, as we did not anticipate paying a dividend at the dates in which the various option grants occurred during the year. The risk-free rate of return reflects the interest rate offered for zero coupon treasury bonds over the expected term of the options. The expected term of the awards represents the period of time that options granted are expected to be outstanding. Based on our limited history, we utilized the “simplified method” as prescribed in Staff Accounting Bulletin No. 110, Share-based Payment , to calculate expected term. In general, for equity awards with graded-vesting, compensation cost is recognized using an accelerated method over the
63
vesting or service period and is net of estimated forfeitures. In general, for equity awards with cliff-vesting, compensation cost is recognized using a straight-line method over the vesting or service period and is net of estimated forfeitures. For performance-based equity awards, compensation cost is adjusted each reporting period in which a change in performance achievement is determined and is net of estimated forfeitures.
We granted certain equity awards under our 2008 long-term performance incentive plan that included performance-based stock-settled stock appreciation rights (“SSARs”) and performance-based restricted common stock. The performance-based SSARs would only vest upon the achievement of a 25% compounded annual growth rate of diluted adjusted EPS for the three-year period ended December 31, 2011. The performance-based restricted common stock awards vested in increments depending on the level of achievement in compounded annual growth rate of diluted adjusted EPS for the three-year period ended December 31, 2011.
As of December 31, 2011, the Company achieved a 15% compounded annual growth rate of diluted adjusted EPS, which resulted in 50% of the performance-based restricted stock being eligible to vest. As a result, approximately 1,411,000 performance-related restricted stock and SSAR awards were forfeited. The underlying shares related to these forfeited awards were added back to our 2008 Plan and are available for future grant. In addition, we reversed $6.5 million of previously recorded share-based compensation expense related to these performance-based restricted stock and performance-based SSARs due to non-achievement of the aforementioned performance criteria.
We assess the probability of achievement of the performance targets relating to performance-based equity awards on a quarterly basis. If during any reporting period under the related vesting term we conclude that we are unable to achieve the performance targets relating to these equity awards, we will reverse the amount of share-based compensation expense recognized in prior periods. This may amount to a significant change in our share-based compensation expense in future periods if it is not probable that we will achieve these performance targets.
Liquidity and Capital Resources
Our primary cash requirements involve payment of ordinary expenses, working capital fluctuations, debt service obligations and capital expenditures. Our capital expenditures typically consist of software purchases, internal product development capitalization and computer hardware purchases. Historically, the acquisition of complementary businesses has resulted in a significant use of cash. Our principal sources of funds have primarily been cash provided by operating activities and borrowings under our credit facilities.
We believe we currently have adequate cash flow from operations, capital resources, available credit facilities and liquidity to meet our cash flow requirements including the following near term obligations (next 12 months): (i) our working capital needs; (ii) our debt service obligations; (iii) planned capital expenditures; (iv) our revenue share obligation and rebate payments; and (v) estimated federal and state income tax payments.
On January 4, 2012, we paid the $120.1 million deferred purchase consideration due to the former owners of the Broadlane Group as part of the acquisition completed in November 2010. We funded the deferred payment with cash, which included a $55.0 million draw on our prior $150.0 million revolving credit facility.
On December 13, 2012, we terminated our credit agreement with Barclays Bank PLC and JP Morgan Securities LLC and entered into a new credit agreement with JPMorgan Chase Bank, N.A. The Credit Agreement consists of a (i) five-year $250.0 million senior secured term A loan facility; (ii) a seven-year $300.0 million senior secured term B loan facility ; and (iii) a five-year $200.0 million senior secured revolving credit facility, including a letter of credit sub-facility of $25.0 million and a swing line sub-facility of $25.0 million.
On November 16, 2010, we closed the offering of an aggregate principal amount of $325.0 million of senior notes due 2018 (the “Notes”). The Notes are guaranteed on a senior unsecured basis by each of the Company’s existing domestic subsidiaries and each of the Company’s future domestic restricted subsidiaries in each case that guarantees the Company’s obligations under the credit agreement. Each of the subsidiary guarantors is 100% owned by the Company; the guarantees by the subsidiary guarantors are full and unconditional; the guarantees by the subsidiary guarantors are joint and several; the Company has no independent assets or operations; and any subsidiaries of the Company other than the subsidiary guarantors are minor. The Notes and the guarantees are senior unsecured obligations of the Company and the subsidiary guarantors, respectively. The Notes were issued
64
pursuant to an indenture dated as of November 16, 2010 (the “Indenture”) among the Company, its subsidiary guarantors and Wells Fargo Bank, N.A., as trustee. Pursuant to the Indenture, the Notes will mature on November 15, 2018 and bear 8% annual interest. Interest on the Notes is payable semi-annually in arrears on May 15 and November 15 of each year, beginning on May 15, 2011.
Historically, we have utilized federal net operating loss carryforwards (“NOLs”) to reduce both regular and Alternative Minimum Tax (“AMT”) cash payments. Consequently, our federal cash tax payments in past reporting periods have been minimal. In 2012, we generated a NOL, which we will carryback to 2011. As a result, the credits previously utilized in 2011 will be reclaimed and utilized in 2013. Despite having NOLs and credits to offset certain tax amounts in 2013, we expect our cash tax liability to increase significantly in 2013 and in the future.
We have not historically utilized borrowings available under our credit agreement to fund operations. We implemented an auto-borrowing plan which caused all excess cash on hand to be used to repay our swing-line credit facility on a daily basis. As a result, any excess cash on hand will be used to repay our swing-line balance, if any, on a daily basis. See Note 7 of the Notes to Consolidated Financial Statements for further details.
As of December 31, 2012, we had $10.0 million drawn on our revolving credit facility resulting in $189.0 million of availability under our revolving credit facility inclusive of the swing-line (netted for a $1.0 million letter of credit). We may observe fluctuations in cash flows provided by operations from period to period. Certain events may cause us to draw additional amounts under our swing-line or revolving facility and may include the following:
| | • | | changes in working capital due to inconsistent timing of cash receipts and payments for major recurring items such as trade accounts payable, revenue share obligation, incentive compensation, changes in deferred revenue, and other various items; |
| | • | | transaction and integration related costs; |
| | • | | unforeseeable events or transactions. |
We may continue to pursue other acquisitions or investments in the future. We may also increase our capital expenditures consistent with our anticipated growth in infrastructure, software solutions, and personnel, and as we expand our market presence. Cash provided by operating activities may not be sufficient to fund such expenditures. Accordingly, in addition to the use of our available revolving credit facility, we may need to engage in additional equity or debt financings to secure additional funds for such purposes. Any debt financing obtained by us in the future could involve restrictive covenants relating to our capital raising activities and other financial and operational matters including higher interest costs, which may make it more difficult for us to obtain additional capital and to pursue business opportunities, including potential acquisitions. In addition, we may not be able to obtain additional financing on terms favorable to us, if at all. If we are unable to obtain required financing on terms satisfactory to us, our ability to continue to support our business growth and to respond to business challenges could be limited.
Discussion of Cash Flow
As of December 31, 2012 and 2011, we had cash and cash equivalents totaling $13.7 million and $62.9 million, respectively.
65
Operating Activities:
The following table summarizes the cash provided by operating activities for the fiscal years ended December 31, 2012 and 2011:
| | | | | | | | | | | | | | | | |
| | | Fiscal Year Ended December 31, | |
| | | 2012 | | | 2011 | | | Change | |
| | | Amount | | | Amount | | | Amount | | | % | |
| | | (In millions) | |
Net loss | | $ | (6.9 | ) | | $ | (15.5 | ) | | $ | 8.6 | | | | 55.5 | % |
Non-cash items | | | 139.8 | | | | 107.9 | | | | 31.9 | | | | 29.6 | |
Net changes in working capital | | | 24.9 | | | | 31.8 | | | | (6.9 | ) | | | (21.7 | ) |
| | | | | | | | | | | | | | | | |
Net cash provided by operations | | $ | 157.8 | | | $ | 124.2 | | | $ | 33.6 | | | | 27.1 | % |
Net loss represents the loss attained during the periods presented and is inclusive of certain non-cash expenses. These non-cash expenses include depreciation for fixed assets, amortization of intangible assets, stock compensation expense, bad debt expense, deferred income tax expense, excess tax benefit from the exercise of stock options, loss on sale of assets, amortization of debt issuance costs, impairment of intangibles and non-cash interest expense. Refer to our Consolidated Statement of Cash Flows for details regarding these non-cash items. The total for these non-cash expenses was $139.8 million and $107.9 million for the fiscal years ended December 31, 2012 and 2011, respectively. The increase in non-cash expenses for the fiscal year ended December 31, 2012 compared to December 31, 2011 was primarily attributable to: (i) the write-off of debt issuance costs from the debt extinguishment associated with our prior credit agreement; (ii) an increase in share-based compensation; and (iii) a decrease in our deferred income tax benefit. The increase was partially offset by: (i) a decrease in the amortization of intangibles; and (ii) a decrease in noncash interest expense. Refer to our Management Discussion and Analysis for more detail.
Working capital is a measure of our liquid assets. Changes in working capital are included in the determination of cash provided by operating activities. For the fiscal year ended December 31, 2012, the working capital changes resulting in an increase to cash flow from operations of $24.9 million primarily consisted of the following:
Increase of cash flow
| | • | | a decrease in accounts receivable of $7.0 million related to the timing of invoicing and cash collections and our revenue growth; |
| | • | | a decrease in other long term assets of $2.0 million primarily related to the timing of cash payments for our deferred sales expenses; |
| | • | | a $5.6 million working capital increase in trade accounts payable due to the timing of various payment obligations; |
| | • | | a $3.4 million increase in accrued revenue share obligation and rebates due to the timing of cash payments and client purchasing volume for our GPO; |
| | • | | a $6.8 million increase in accrued payroll and benefits due to payroll cycle timing and higher performance-based compensation expense than the prior period; and |
| | • | | an increase in deferred revenue of $7.5 million for cash receipts not yet recognized as revenue. |
The working capital changes resulting in an increase to cash flow from operations discussed above were partially offset by the following changes in working capital resulting in decreases to cash flow:
Decrease of cash flow
| | • | | an increase in prepaid expenses and other assets of $3.3 million primarily related a $2.0 million increase in prepaid income taxes and a $1.3 million increase in software and hardware maintenance; and |
66
| | • | | a decrease in other accrued expenses and long-term liabilities of $4.0 million primarily due to the $8.2 million interest rate swap termination as a result of the debt refinancing partially offset by the timing of various payment obligations. |
Changes in working capital are included in the determination of cash provided by operating activities. For the fiscal year ended December 31, 2011, the working capital changes resulting in an increase to cash flow from operations of $31.8 million primarily consisted of the following:
Increase of cash flow
| | • | | a decrease in prepaid expenses and other assets of $1.3 million primarily related to sales incentive compensation payments; |
| | • | | a $5.6 million working capital increase in trade accounts payable due to the timing of various payment obligations; |
| | • | | a $12.7 million increase in accrued revenue share obligation and rebates due to the timing of cash payments and client purchasing volume for our GPO; |
| | • | | a $10.5 million increase in accrued payroll and benefits due to payroll cycle timing and higher performance-based compensation expense than the prior period; and |
| | • | | an increase in deferred revenue of $16.5 million for cash receipts not yet recognized as revenue. |
The working capital changes resulting in an increase to cash flow from operations discussed above were partially offset by the following changes in working capital resulting in decreases to cash flow:
Decrease of cash flow
| | • | | an increase in accounts receivable of $3.5 million related to the timing of invoicing and cash collections and our revenue growth; |
| | • | | an increase in other long term assets of $5.0 million related to the timing of cash payments for our deferred sales expenses; and |
| | • | | a decrease in other accrued expenses of $6.4 million due to the timing of various payment obligations. |
Investing Activities:
Investing activities used $66.4 million of cash for the fiscal year ended December 31, 2012 which included: $40.2 million for investment in software development; and $26.2 million of capital expenditures. The increase in cash used for investing activities compared to the prior year was primarily due to: (i) investments in software development in connection with integrating the operations of Broadlane with our existing operations; (ii) RCM software development primarily due to new product features and functionality, new technologies, and upgrades to our service offerings; and (iii) investments in computer hardware associated with increased infrastructure demands.
Investing activities used $49.0 million of cash for the fiscal year ended December 31, 2011 which included: $32.0 million for investment in software development; and $17.0 million of capital expenditures. The increase in cash used for investing activities compared to the prior year was primarily due to: (i) investments in software development in connection with combining the operations of Broadlane with our existing operations; (ii) RCM software development primarily due to new product features and functionality, new technologies, and upgrades to our service offerings; and (iii) investments in computer hardware associated with increased infrastructure demands.
We believe that cash used in investing activities will continue to be materially impacted by continued growth in investments in property and equipment, future acquisitions and capitalized software. Our property, equipment, and software investments consist primarily of SaaS-based technology infrastructure to provide capacity for expansion of our client base, including computers and related equipment and software purchased or implemented by outside parties. Our software development investments consist primarily of company-managed design, development, testing and deployment of new application functionality.
67
Financing Activities:
Financing activities used $140.7 million of cash for the fiscal year ended December 31, 2012. We received $550.0 million to fund our debt refinancing on December 13, 2012 that consisted of $250.0 million from our Term A Facility and $300.0 million from our Term B Facility. We borrowed $140.0 million from our revolving credit facility consisting of: (i) a $55.0 million draw used to partially fund the deferred payment obligation made in January 2012; (ii) a $35.0 million draw used to make a voluntary prepayment on our previous senior term loan facility prior to the debt refinancing; and (iii) a $50.0 million draw used to help fund our debt refinancing on December 13, 2012. Refer to Note 7 in the Notes to Consolidated Financial Statements for additional details. We also received $7.7 million from the issuance of common stock (net of offering costs); and $1.5 million from the excess tax benefit from the exercise of stock options.
This was offset by $120.1 million for the payment of the deferred purchase consideration made in connection with the Broadlane Acquisition. We made payments on our senior term loan facility of $578.7 million consisting of: (i) $4.8 million in scheduled principal payments; (ii) $55.0 million in voluntary prepayments from free cash flow; (iii) a $35.0 million voluntary prepayment from our revolver draw discussed above; and (iv) a $483.8 million payment associated with the debt extinguishment of our prior credit agreement on December 13, 2012 to settle the balance of our previous term loan facility. We also made payments on our revolving credit facility of $130.0 million consisting of: (i) a $90.0 million payment associated with our debt extinguishment on December 13, 2012 to settle the balance of our previous revolving credit facility; and (ii) a $40.0 million voluntary payment on our new revolving credit facility from free cash flow. In addition, we made payments of $0.7 million that were made on our finance obligation (as discussed in Note 7 in the Notes to Consolidated Financial Statements) and repurchased approximately 62,000 shares of our common stock under our share repurchase program (which expired in August 2012) totaling $0.6 million. As of December 31, 2012, our credit agreement requires an assessment of excess cash flow beginning for our fiscal year ended December 31, 2013. We would be required to make any excess cash flow payment during the first quarter of 2014.
Financing activities used $59.1 million of cash for the fiscal year ended December 31, 2011. We made payments on our credit facility of $56.4 million and payments on our finance obligation of $0.7 million as described in Note 7 to the Consolidated Financial Statements. In addition, we repurchased approximately 552,000 shares of our common stock under our share repurchase program totaling $5.0 million. We received $2.0 million from the issuance of common stock and $1.0 million from the excess tax benefit from the exercise of stock options. As of December 31, 2011, our credit agreement requires an assessment of excess cash flow. Based on the voluntary repayments made during the fiscal year ended December 31, 2011, we do not expect to be required to make any excess cash flow payment during the first quarter of 2012.
Credit Facility and Notes Offering
Credit Facility
On December 13, 2012, we completed a refinancing and entered into a Credit Agreement with the banks and other financial institutions named therein (the “Lenders”), JPMorgan Chase Bank, N.A., acting as administrative agent and collateral agent for the Lenders and letter of credit issuer, and Bank of America, N.A., acting as swing line lender (the “Credit Agreement”). The Credit Agreement consists of a (i) five-year $250.0 million senior secured term A loan facility (the “Term A Facility”), (ii) a seven-year $300.0 million senior secured term B loan facility (the “Term B Facility”; and collectively with the Term A Facility, the “Term Loan Facility”); and (iii) a five-year $200.0 million senior secured revolving credit facility, including a letter of credit sub-facility of $25.0 million and a swing line sub-facility of $25.0 million (the “Revolving Credit Facility”). The borrowings under the Term Loan Facility were made in a single draw on December 13, 2012. Amounts borrowed under the Term Loan Facility that are prepaid may not be reborrowed. Proceeds of borrowing under the Credit Agreement were used to repay all outstanding amounts under our prior credit facility. The Revolving Credit Facility is available for working capital and other general corporate purposes at any time prior to the final maturity thereof. Borrowings under the Revolving Credit Facility are subject to the satisfaction of customary conditions precedent. Amounts repaid under the Revolving Credit Facility may be reborrowed.
The Credit Agreement permits us, subject to the satisfaction of certain conditions and obtaining commitments, to add one or more incremental term loan facilities, increase the commitments under the Term
68
Loan Facility or increase the aggregate commitments under the Revolving Credit Facility in an aggregate amount of up to $200.0 million, which may have the same guarantees, and be secured on a pari passu basis by the same collateral as the Term Facility or Revolving Facility, as applicable.
The interest rates per annum applicable to loans (other than swing line loans) under the Credit Agreement are, at our option, equal to either (i) a eurodollar rate for one-, two-, three- six-, or if agreed to by all relevant lenders, nine- or twelve-month interest periods or (ii) an alternate base rate, in each case, plus an applicable margin of (x) with respect to loans under the Term B Facility, (A) 2.75% for eurodollar loans and (B) 1.75% for alternate base rate loans, and (y) with respect to loans under the Term A Facility and Revolving Credit Facility, in each case subject to our leverage ratio, (A) 2.25%-2.50% for eurodollar loans and (B) 1.25%-1.50% for base rate loans. Interest rates per annum applicable to swing line loans are equal to the alternate base rate plus an applicable margin.
The eurodollar rate is determined by reference to the London inter-bank offer rate, which is the settlement rate established for deposits in dollars in the London interbank market for a period equal to the interest period of the loan and the maximum reserve percentages established by the Board of Governors of the United States Federal Reserve to which the lenders are subject. The eurodollar rate includes statutory reserves. The eurodollar rate for loans under the Term B Facility is subject to a floor of 1.25%. The alternate base rate for loans under the Term B Facility is subject to a floor of 2.25%. The alternate base rate is the highest of (i) the prime commercial lender rate published by the Wall Street Journal as the “prime rate”, (ii) the weighted average of rates on overnight Federal funds as published by the Federal Reserve Bank of New York plus one-half of 1% and (iii) the eurodollar rate for a one-month interest period plus 1%. The alternate base rate is subject to a minimum percentage equal to the minimum percentage for the eurodollar rate plus 1%.
See table below for a summary of the pricing tiers for all applicable margin rates. As of December 31, 2012, our applicable margin on our Revolving Credit Facility and Term A Facility was tier 1.
| | | | | | | | | | |
| Revolving credit facility |
Pricing Tier | | Total Leverage Ratio | | Commitment Fee | | Letter of Credit Fee | | Eurodollar Loans | | Base Rate Loans |
1 | | ³4.00:1.00 | | 0.50% | | 2.50% | | 2.50% | | 1.50% |
2 | | < 4.00:1.00 | | 0.50% | | 2.25% | | 2.25% | | 1.25% |
| | | | | | |
| Term Loan A Facility |
Pricing
Tier | | Total Leverage Ratio | | Eurodollar Loans | | Base Rate
Loans |
| 1 | | ³ 4.00:1.00 | | 2.50% | | 1.50% |
| 2 | | < 4.00:1.00 | | 2.25% | | 1.25% |
| | | | | | |
| Term Loan B Facility |
Pricing
Tier | | Total Leverage Ratio | | Eurodollar Loans | | Base Rate
Loans |
n/a | | n/a | | 2.75% | | 1.75% |
The loans under the Term A Facility amortize in quarterly installments of (i) $3.1 million each during 2013 and 2014, (ii) $4.7 million during 2015, and (iii) $6.3 million during 2016 through September 2017, with the balance payable on the fifth anniversary of December 13, 2012. The loans under the Term B Facility amortize in equal quarterly installments of $0.8 million each, with the balance payable on the seventh anniversary of December 13, 2012. The Term B Facility matures on December 13, 2019; provided that the facility will mature in full on May 15, 2018 if our outstanding senior notes have not been repaid or refinanced in full by such date. No principal payments are due on the revolving loan facility until the revolving facility maturity date. We are also required to prepay our debt obligations based on an excess cash flow calculation for the applicable fiscal year which is determined in accordance with the terms of our credit agreement.
69
As of December 31, 2012, we had an outstanding balance of $10.0 million on the Revolving Credit Facility resulting in $189.0 million available under the Revolving Credit Facility (after giving effect to $1.0 million of outstanding but undrawn letters of credit on such date). We also had $885.0 million of debt outstanding and a cash balance of $13.7 million as of December 31, 2012.
The Credit Agreement contains certain customary negative covenants, including, but not limited to, limitations on the incurrence of debt, limitations on liens, limitations on fundamental changes, limitations on asset sales and sale leasebacks, limitations on investments, limitations on dividends or distributions on, or redemptions of, equity interests, limitations on prepayments or redemptions of unsecured or subordinated debt, limitations on negative pledge clauses, limitations on transactions with affiliates and limitations on changes to our fiscal year. The Credit Agreement also includes maintenance covenants of maximum ratios of consolidated total indebtedness (subject to certain adjustments) to consolidated EBITDA (subject to certain adjustments) and minimum cash interest coverage ratios. The Credit Agreement contains certain customary representations and warranties, affirmative covenants and events of default, including payment defaults, breaches of representations and warranties, covenant defaults, cross-defaults to certain indebtedness, certain events of insolvency or bankruptcy, material judgments, certain events under ERISA, actual or asserted failures of any guaranty or security document supporting the Credit Agreement to be in full force and effect and changes of control.
For the fiscal quarter ending December 31, 2012, we were required to maintain compliance with a maximum consolidated total debt to adjusted EBITDA leverage ratio of 5.75 to 1.0 and a minimum consolidated interest coverage ratio of 2.25 to 1.0. The consolidated total debt to adjusted EBITDA leverage ratio and the consolidated interest coverage ratio thresholds adjust in future periods. The following table shows our future covenant thresholds:
| | | | |
| Covenant Requirements Table |
Fiscal Quarter Ended | | Maximum Total Leverage Ratio | | Minimum Interest Coverage Ratio |
March 31, 2013 | | 5.75:1.0 | | 2.5:1.0 |
June 30, 2013 | | 5.75:1.0 | | 2.5:1.0 |
September 30, 2013 | | 5.75:1.0 | | 2.5:1.0 |
December 31, 2013 | | 5.75:1.0 | | 2.5:1.0 |
March 31, 2014 | | 5.25:1.0 | | 2.5:1.0 |
June 30, 2014 | | 5.25:1.0 | | 2.5:1.0 |
September 30, 2014 | | 5.25:1.0 | | 2.5:1.0 |
December 31, 2014 | | 5.25:1.0 | | 2.5:1.0 |
March 31, 2015 | | 4.75:1.0 | | 2.5:1.0 |
June 30, 2015 | | 4.75:1.0 | | 2.5:1.0 |
September 30, 2015 | | 4.75:1.0 | | 2.5:1.0 |
December 31, 2015 | | 4.75:1.0 | | 2.5:1.0 |
March 31, 2016 | | 4.00:1.0 | | 2.5:1.0 |
June 30, 2016 | | 4.00:1.0 | | 2.5:1.0 |
September 30, 2016 and thereafter | | 4.00:1.0 | | 2.5:1.0 |
The components that comprise the calculation of the aforementioned covenants are specifically defined in the Credit Agreement and require us to make certain adjustments to derive the amounts used in the calculation of each ratio. Refer to the table in the earlier part of this section for a summary of the pricing tiers and the applicable rates.
The determination of our pricing tier is based on the total leverage ratio that was calculated in the most recent compliance certificate received by our administrative agent. In addition, our loans and other obligations under the credit agreement are guaranteed, subject to specified limitations, by our present and future direct and indirect domestic subsidiaries. As of December 31, 2012, we were not in default of any covenants under our credit agreement.
70
Notes Offering
In connection with the Broadlane Acquisition in 2010, the Company closed the offering of an aggregate principal amount of $325 million of Notes. The Notes are jointly and severally guaranteed on a senior unsecured basis by each of the Company’s existing domestic restricted subsidiaries and each of the Company’s future domestic restricted subsidiaries in each case that guarantees the Company’s obligations under the credit agreement. The Notes and the guarantees are senior unsecured obligations of the Company.
On July 22, 2011, we filed a registration statement with the SEC on Form S-4 for the purpose of registering new senior notes with the same terms and conditions as the Notes. The registration statement was declared effective on October 13, 2011, and on the same day we launched an exchange offer whereby we offered to exchange new registered 8% senior notes due 2018 (the “Exchange Notes”) for all of the outstanding unregistered Notes (the “Exchange Offer”). The terms of the Exchange Notes are substantially identical to those of the Notes, except the Exchange Notes are registered under the Securities Act of 1933, as amended. The Exchange Notes evidence the same indebtedness as the Notes and are entitled to the benefits of the Indenture governing the Notes. We did not and will not receive any proceeds from the Exchange Offer. The Notes and the Exchange Notes are now interchangeably referred to as the “Notes”.
The Notes were issued pursuant to an Indenture (the “Indenture”) dated as of November 16, 2010, among the Company, its subsidiary guarantors and Wells Fargo Bank, N.A., as trustee. Pursuant to the Indenture, the Notes will mature on November 15, 2018, and bear 8% annual interest. Interest on the Notes is payable semi-annually in arrears on May 15 and November 15 of each year, beginning on May 15, 2011.
The Indenture contains certain customary negative covenants, including, but not limited to, limitations on: the incurrence of debt; liens; consolidations or mergers; asset sales; certain restricted payments and transactions with affiliates. The Indenture does not contain any significant restrictions on the ability of the parent company to obtain funds from its subsidiaries by dividend or loan. The Indenture also contains customary events of default. As of December 31, 2012, we were not in default of any covenants under the Indenture.
Summary Disclosure Concerning Contractual Obligations and Commercial Commitments
In the ordinary course of business, we enter into contractual obligations to make cash payments to third parties. The Company’s known contractual obligations as of December 31, 2012 are as follows:
| | | | | | | | | | | | | | | | | | | | |
| | | | | | Payments Due by Period | |
| | | Total | | | Less Than
1 Year | | | 1-3 Years | | | 3-5 Years | | | More than
5 Years | |
| | | (In thousands) | |
Bank credit facility(1) | | $ | 560,000 | | | $ | 15,500 | | | $ | 37,250 | | | $ | 222,250 | | | $ | 285,000 | |
Bonds payable(2) | | | 325,000 | | | | — | | | | — | | | | — | | | | 325,000 | |
Interest on fixed rate debt | | | 152,750 | | | | 26,000 | | | | 52,000 | | | | 52,000 | | | | 22,750 | |
Interest on variable rate debt(3) | | | 115,504 | | | | 19,231 | | | | 37,483 | | | | 36,558 | | | | 22,232 | |
Operating leases(4) | | | 115,735 | | | | 13,439 | | | | 25,337 | | | | 17,836 | | | | 59,123 | |
Broadlane integration and restructuring obligations(5) | | | 1,432 | | | | 1,432 | | | | — | | | | — | | | | — | |
Finance obligations(6) | | | 13,056 | | | | 1,114 | | | | 2,228 | | | | 9,714 | | | | — | |
Tax liability(7) | | | 801 | | | | — | | | | — | | | | 801 | | | | — | |
| | �� | | | | | | | | | | | | | | | | | | |
| | $ | 1,284,278 | | | $ | 76,716 | | | $ | 154,298 | | | $ | 339,159 | | | $ | 714,105 | |
| (1) | Indebtedness under our credit facility bears interest at an annual rate of LIBOR (our credit agreement contains a 1.25% LIBOR floor on the Term B Facility) plus an applicable margin. The applicable weighted average interest rate, inclusive of LIBOR and the applicable margin was 3.45% on our Term Loan Facility at December 31, 2012. We had $10.0 million outstanding under our revolving credit facility at December 31, 2012. See Note 7 of the Notes to Consolidated Financial Statements for additional information regarding our borrowings. |
71
| (2) | Indebtedness on our bonds bear interest at an 8% annual rate. See Note 7 of the Notes to Consolidated Financial Statements for additional information regarding our bond offering. |
| (3) | Interest on variable rate debt is calculated using the weighted-average interest rate in effect as of December 31, 2012 for all future periods. In addition, our credit agreement requires us to calculate excess cash flow on an annual basis (beginning for our fiscal year ending December 31, 2013). We would be required to make any excess cash flow payment during the first quarter of 2014. |
| (4) | Relates to certain office space and office equipment under operating leases. Amounts represent future minimum rental payments under operating leases with initial or remaining non-cancelable lease terms of one year or more. See Note 8 of the Notes to Consolidated Financial Statements for more information. |
| (5) | Represents severance costs associated with the Broadlane Acquisition. See Note 6 of the Notes to Consolidated Financial Statements for additional information. |
| (6) | Represents a capital lease obligation incurred in a sale and subsequent leaseback transaction of an office building in August 2003. The transaction did not qualify for sale and leaseback treatment under generally accepted accounting principles relating to leases. In July 2007, we extended the terms of our office building lease agreement by an additional four years through July 2017, which increased our total finance obligation by $1.1 million. See Note 7 of the Notes to Consolidated Financial Statements under the subheading “Finance Obligations” for additional information regarding this transaction and the related obligation. |
| (7) | The above amount relates to management’s estimate of uncertain tax positions. As a result of tax attributes (net operating losses and tax credits), we have several tax periods open to examination until the statute of limitations has expired with respect to the year in which these attributes are utilized. As such, we cannot predict the precise timing that this liability will be applied or utilized. Additionally, the liability may increase or decrease if management’s estimate of uncertain tax positions changes when new information arises or changes in circumstances occur. |
Indemnification of product users. We provide a limited indemnification to users of our products against any patent, copyright, or trade secret claims brought against them. The duration of the indemnifications vary based upon the life of the specific individual agreements. We have not had a material indemnification claim, and we do not believe we will have a material claim in the future. As such, we have not recorded any liability for these indemnification obligations in our financial statements.
Off-Balance Sheet Arrangements
We have provided a $1.0 million letter of credit to guarantee our performance under the terms of a ten-year lease agreement. The letter of credit is associated with the capital lease of a building located in Cape Girardeau, Missouri under a finance obligation. We do not believe that this letter of credit will be drawn.
We lease office space and equipment under operating leases. Some of these operating leases include rent escalations, rent holidays, and rent concessions and incentives. However, we recognize lease expense on a straight-line basis over the minimum lease term utilizing total future minimum lease payments.
As of December 31, 2012, we did not have any other off-balance sheet arrangements that have or are reasonably likely to have a current or future significant effect on our financial condition, revenues or expenses, results of operations, liquidity, capital expenditures or capital resources.
Use of Non-GAAP Financial Measures
In order to provide investors with greater insight, promote transparency and allow for a more comprehensive understanding of the information used by management and the Board in its financial and operational decision-making, we supplement our Consolidated Financial Statements presented on a GAAP basis herein with the following non-GAAP financial measures: gross fees, gross administrative fees, revenue share obligation, EBITDA, adjusted EBITDA, adjusted EBITDA margin, acquisition-affected net revenue, adjusted net income and adjusted diluted earnings per share.
These non-GAAP financial measures have limitations as analytical tools and should not be considered in isolation or as a substitute for analysis of our results as reported under GAAP. We compensate for such limitations by relying primarily on our GAAP results and using non-GAAP financial measures only
72
supplementally. We provide reconciliations of non-GAAP measures to their most directly comparable GAAP measures, where possible. Investors are encouraged to carefully review those reconciliations. In addition, because these non-GAAP measures are not measures of financial performance under GAAP and are susceptible to varying calculations, these measures, as defined by us, may differ from and may not be comparable to similarly titled measures used by other companies.
Gross Fees, Gross Administrative Fees and Revenue Share Obligation. Gross fees include all gross administrative fees we receive pursuant to our vendor contracts and all other fees we receive from clients. Our revenue share obligation represents the portion of the gross administrative fees we are contractually obligated to share with certain of our GPO clients. Total net revenue (a GAAP measure) reflects our gross fees net of our revenue share obligation. These non-GAAP measures assist management and the Board and may be helpful to investors in analyzing our growth in the Spend and Clinical Resource Management segment given that administrative fees constitute a material portion of our revenue and are paid to us by over 1,150 vendors contracted by our GPO, and that our revenue share obligation constitutes a significant outlay to certain of our GPO clients. A reconciliation of these non-GAAP measures to their most directly comparable GAAP measure can be found in the “Results of Operations” section of Management’s Discussion and Analysis of Financial Condition and Results of Operations herein.
EBITDA, adjusted EBITDA and adjusted EBITDA margin. We define: (i) EBITDA, as net income (loss) before net interest expense, income tax expense (benefit), depreciation and amortization; (ii) adjusted EBITDA, as net income (loss) before net interest expense, income tax expense (benefit), depreciation and amortization and other non-recurring, non-cash or non-operating items; and (iii) adjusted EBITDA margin, as adjusted EBITDA as a percentage of net revenue. We use EBITDA, adjusted EBITDA and adjusted EBITDA margin to facilitate a comparison of our operating performance on a consistent basis from period to period and provide for a more complete understanding of factors and trends affecting our business than GAAP measures alone. These measures assist management and the Board and may be useful to investors in comparing our operating performance consistently over time as it removes the impact of our capital structure (primarily interest charges and amortization of debt issuance costs), asset base (primarily depreciation and amortization) and items outside the control of the management team (taxes), as well as other non-cash (purchase accounting adjustments, and imputed rental income) and non-recurring items, from our operational results. Adjusted EBITDA also removes the impact of non-cash share-based compensation expense.
Our Board and management also use these measures as: i) one of the primary methods for planning and forecasting overall expectations and for evaluating, on at least a quarterly and annual basis, actual results against such expectations; and ii) as a performance evaluation metric in determining achievement of certain executive incentive compensation programs, as well as for incentive compensation plans for employees generally.
Additionally, research analysts, investment bankers and lenders may use these measures to assess our operating performance. For example, our credit agreement requires delivery of compliance reports certifying compliance with financial covenants certain of which are, in part, based on an adjusted EBITDA measurement that is similar to the adjusted EBITDA measurement reviewed by our management and our Board. The principal difference is that the measurement of adjusted EBITDA considered by our lenders under our credit agreement allows for certain adjustments (e.g., inclusion of interest income, franchise taxes and other non-cash expenses, offset by the deduction of our capitalized lease payments for one of our office leases) that result in a higher adjusted EBITDA than the adjusted EBITDA measure reviewed by our Board and management and disclosed in our Annual Report on Form 10-K. Additionally, our credit agreement contains provisions that utilize other measures, such as excess cash flow, to measure liquidity.
EBITDA, adjusted EBITDA and adjusted EBITDA margin are not measures of liquidity under GAAP, or otherwise, and are not alternatives to cash flow from continuing operating activities. Despite the advantages regarding the use and analysis of these measures as mentioned above, EBITDA, adjusted EBITDA and adjusted EBITDA margin, as disclosed herein, have limitations as analytical tools, and you should not consider these measures in isolation, or as a substitute for analysis of our results as reported under GAAP; nor are these
73
measures intended to be measures of liquidity or free cash flow for our discretionary use. Some of the limitations of EBITDA are:
| | • | | EBITDA does not reflect our cash expenditures or future requirements for capital expenditures or contractual commitments; |
| | • | | EBITDA does not reflect changes in, or cash requirements for, our working capital needs; |
| | • | | EBITDA does not reflect the interest expense, or the cash requirements to service interest or principal payments under our credit agreement; |
| | • | | EBITDA does not reflect income tax payments we are required to make; and |
| | • | | Although depreciation and amortization are non-cash charges, the assets being depreciated and amortized often will have to be replaced in the future, and EBITDA does not reflect any cash requirements for such replacements. |
Adjusted EBITDA has all the inherent limitations of EBITDA. To properly and prudently evaluate our business, we encourage you to review the GAAP financial statements included elsewhere herein, and not rely on any single financial measure to evaluate our business. We also strongly urge you to review the reconciliation of net income to adjusted EBITDA in this section, along with our Consolidated Financial Statements included elsewhere herein.
The following table sets forth a reconciliation of EBITDA and adjusted EBITDA to net income, a comparable GAAP-based measure. All of the items included in the reconciliation from net income to EBITDA to adjusted EBITDA are either: (i) non-cash items (e.g., depreciation and amortization, impairment of intangibles and share-based compensation expense) or (ii) items that management does not consider in assessing our on-going operating performance (e.g., income taxes, interest expense and expenses related to the cancellation of an interest rate swap and acquisition and integration-related expenses). In the case of the non-cash items, management believes that investors may find it useful to assess our comparative operating performance because the measures without such items are less susceptible to variances in actual performance resulting from depreciation, amortization and other non-cash charges and more reflective of other factors that affect operating performance. In the case of the other non-recurring items, management believes that investors may find it useful to assess our operating performance if the measures are presented without these items because their financial impact does not reflect ongoing operating performance.
74
The following table reconciles net income to adjusted EBITDA for the fiscal years ended December 31, 2012, 2011 and 2010:
| | | | | | | | | | | | |
| | | Fiscal Year Ended December 31, | |
Adjusted EBITDA Reconciliation | | 2012 | | | 2011 | | | 2010 | |
| | | (In thousands) | |
Net loss | | $ | (6,878 | ) | | $ | (15,494 | ) | | $ | (32,124 | ) |
Depreciation | | | 30,190 | | | | 22,402 | | | | 19,948 | |
Depreciation (included in cost of revenue) | | | 1,859 | | | | 1,225 | | | | 2,894 | |
Amortization of intangibles | | | 72,652 | | | | 80,510 | | | | 31,027 | |
Amortization of intangibles (included in cost of revenue) | | | 557 | | | | 557 | | | | 648 | |
Interest expense, net of interest income(1) | | | 66,041 | | | | 71,069 | | | | 27,428 | |
Income tax benefit | | | (1,480 | ) | | | (9,851 | ) | | | (14,255 | ) |
| | | | | | | | | | | | |
EBITDA | | | 162,941 | | | | 150,418 | | | | 35,566 | |
Impairment of intangibles(2) | | | — | | | | — | | | | 46,423 | |
Share-based compensation expense(3) | | | 10,291 | | | | 5,023 | | | | 11,493 | |
RCM management restructuring expenses(4) | | | — | | | | 1,646 | | | | — | |
Rental income from capitalizing building lease(5) | | | (438 | ) | | | (438 | ) | | | (439 | ) |
Purchase accounting adjustments(6) | | | — | | | | 6,245 | | | | 13,406 | |
Acquisition and integration-related expenses(7) | | | 6,348 | | | | 24,551 | | | | 21,591 | |
Loss on debt extinguishment(8) | | | 28,196 | | | | — | | | | — | |
Insurance settlement(9) | | | — | | | | (3,340 | ) | | | — | |
| | | | | | | | | | | | |
Adjusted EBITDA | | $ | 207,338 | | | $ | 184,105 | | | $ | 128,040 | |
| (1) | Interest income is included in other income (expense) and is not netted against interest expense in our Consolidated Statement of Operations. During 2010, we terminated an interest rate swap as part of the Broadlane Acquisition that was originally scheduled to terminate in March 2012. In consideration of the early termination, we paid the swap counterparty, and incurred an expense of, $1.6 million for the fiscal year ended December 31, 2010. That termination amount is included in interest expense for the fiscal year ended December 31, 2010. |
| (2) | The impairment during the fiscal year ended December 31, 2010 primarily consisted of (i) a $44.5 million write-off of goodwill relating to our decision support services operating unit; and (ii) $1.3 million relating to an SCM trade name and a customer base intangible asset from prior acquisitions that were deemed to be impaired as part of the product and service offering integration associated with the Broadlane Acquisition. |
| (3) | Represents non-cash share-based compensation to both employees and directors. We believe excluding this non-cash expense allows us to compare our operating performance without regard to the impact of share-based compensation expense, which varies from period to period based on the amount and timing of grants. |
| (4) | Amount represents restructuring costs consisting of severance that resulted from certain management changes within our RCM segment. |
| (5) | The imputed rental income recognized with respect to a capitalized building lease is deducted from net (loss) income due to its non-cash nature. We believe this income is not a useful measure of continuing operating performance. See Note 7 of the Notes to Consolidated Financial Statements herein for further discussion of this rental income. |
| (6) | Upon acquiring Broadlane on November 16, 2010, we made certain purchase accounting adjustments that reflect the fair value of administrative fees related to client purchases that occurred prior to November 16, 2010 but were reported to us subsequent to that. Under our revenue recognition accounting policy, which is in accordance with GAAP, these administrative fees would be ordinarily recorded as revenue when reported to us; however, the acquisition method of accounting requires us to estimate the amount of purchases occurring prior to the transaction date and to record the fair value of the administrative fees to be received |
75
| | from those purchases as an account receivable (as opposed to recognizing revenue when these transactions are reported to us and recording any corresponding revenue share obligation as a liability). |
For the fiscal year ended December 31, 2011, the $6.2 million represents the net amount of: (i) approximately $11.0 million in gross administrative fees and other service fees primarily based on vendor reporting received from January 1, 2011 through November 15, 2011 relating to purchases made prior to the acquisition date, and (ii) a corresponding revenue share obligation of $4.8 million relating to the same period.
For the fiscal year ended December 31, 2010, the $13.4 million represents the net amount of: (i) $26.8 million in administrative fees based on vendor reporting received from the acquisition date up through December 31, 2010; and (ii) a corresponding revenue share obligation of $13.4 million.
| (7) | For the fiscal years ended December 31, 2012 and 2011, the amount was attributable to integration and restructuring-type costs associated with the Broadlane Acquisition, such as severance, retention, redundant salaries, certain performance-related salary-based compensation, and operating infrastructure costs. For the fiscal year ended December 31, 2010, the amount was attributable to $10.4 million in transaction costs incurred (not related to the financing) to complete the Broadlane Acquisition such as due diligence, consulting and other relates fees; $8.4 million for integration and restructuring-type costs associated with the Broadlane Acquisition, such as severance, retention, certain performance-related salary-based compensation, and operating infrastructure costs; and $2.8 million was attributable to acquisition-related fees associated with an unsuccessful acquisition attempt. We expect to incur costs during the first six months of 2013 related to our integration plans, including but not limited to aligning service offerings and standardizing and migrating certain Broadlane operational systems and transactional data sets into our operational systems. |
| (8) | The amount reflects the loss on debt extinguishment and is comprised of (i) a $20.0 million write-off of debt issuance costs relating to our previous credit facility; and (ii) an $8.2 million swap termination fee for two forward starting interest rate swaps also relating to our previous credit facility. Refer to Note 7 and Note 14 of the Notes to Consolidated Financial Statements for additional details. |
| (9) | Amount was attributable to a $3.3 million insurance settlement received during the period. Refer to Note 8 in the Notes to Consolidated Financial Statements for additional details. |
Spend and Clinical Resource Management (“SCM”) Acquisition-Affected Net Revenue. SCM acquisition-affected net revenue includes the revenue of Broadlane prior to the Company’s actual ownership. Although the Broadlane Acquisition was consummated on November 16, 2010, this measure assumes the acquisition of Broadlane occurred on January 1, 2010. Broadlane acquisition-related adjustment includes the historical results of Broadlane’s operations from January 1, 2010 through November 15, 2010, inclusive of certain purchase accounting adjustments. Broadlane purchase accounting revenue adjustment reflects an estimated reduction of net administrative fee revenue. Under the Company’s revenue recognition policies, administrative fees are recorded as revenue when reported to the Company by vendors. GAAP relating to business combinations requires that the Company estimate the amount of client supply purchases (the driver of administrative fee revenue) occurring prior to the acquisition closing date and to record the fair value of the administrative fees (the asset) to be received from those purchases as an account receivable and any corresponding revenue share obligation as a liability. As vendor reports are received and cash is collected, the Company will not recognize revenue for this acquisition-related purchase accounting revenue adjustment. SCM acquisition-affected net revenue is used by management and the Board to better understand the extent of growth of the SCM segment. Given the significant impact that the Broadlane Acquisition had on the Company during the fiscal year ended December 31, 2010 and will have in future periods, we believe this measure may be useful and meaningful to investors in their analysis of such growth. SCM acquisition-affected net revenue is presented for illustrative and informational purposes only and is not intended to represent or be indicative of what our results of operations would have been if this transaction had occurred at the beginning of 2010. This measure also should not be considered representative of our future results of operations. Reconciliations of SCM acquisition-affected net revenue to its most directly comparable GAAP measure can be found in the “Results of Operations” section of Management’s Discussion and Analysis of Financial Condition and Results of Operations herein.
76
Adjusted Net Income and Diluted Adjusted Earnings Per Share. The Company defines: i) adjusted net income as net income excluding non-cash acquisition-related intangible amortization and depreciation, and non-recurring expense items on a tax-adjusted basis, non-cash share-based compensation and certain acquisition and integration-related expenses on a tax adjusted basis; and ii) diluted adjusted EPS as earnings per share excluding non-cash acquisition-related intangible amortization and depreciation, and non-recurring expense items, non-cash share-based compensation and certain acquisition and integration-related expenses on a tax-adjusted basis. Adjusted net income and diluted adjusted EPS are not measures of liquidity under GAAP, or otherwise, and are not alternatives to cash flow from continuing operating activities. Diluted adjusted EPS growth has been used historically by the Company as the financial performance metric that determines whether certain equity awards granted pursuant to the Company’s Long-Term Performance Incentive Plan will vest. Use of these measures allows management and the Board to analyze the Company’s operating performance on a consistent basis by removing the impact of certain non-cash and non-recurring items from our operations and assess organic growth and accretive business transactions. As a significant portion of senior management’s incentive based compensation has been based on the achievement of certain diluted adjusted EPS growth over time, which is intended to reward them for organic growth and accretive business transactions, investors may find such information useful; however, as non-GAAP financial measures, adjusted net income and diluted adjusted EPS are not the sole measures of the Company’s financial performance and may not be the best measures for investors to gauge such performance.
| | | | | | | | | | | | |
| | | Twelve Months Ended December 31, | |
| | | 2012 | | | 2011 | | | 2010 | |
Net loss | | $ | (6,878 | ) | | $ | (15,494 | ) | | $ | (32,124 | ) |
Pre-tax non-cash, acquisition-related intangible amortization and depreciation | | | 75,103 | | | | 83,226 | | | | 31,676 | |
Pre-tax non-cash, share-based compensation(1) | | | 10,291 | | | | 5,023 | | | | 11,493 | |
Pre-tax acquisition and integration related expenses(2) | | | 6,348 | | | | 24,551 | | | | 21,591 | |
Pre-tax RCM management restructuring expenses(3) | | | — | | | | 1,646 | | | | — | |
Pre-tax purchase accounting adjustment(4) | | | — | | | | 6,245 | | | | 13,406 | |
Pre-tax deferred payment interest expense accretion(5) | | | — | | | | 3,082 | | | | 6,246 | |
Pre-tax non cash, impairment of intangibles(6) | | | — | | | | — | | | | 46,423 | |
Pre-tax, loss on debt extinguishment(7) | | | 28,196 | | | | — | | | | — | |
Pre-tax, insurance settlement(8) | | | — | | | | (3,340 | ) | | | — | |
| | | | | | | | | | | | |
Tax effect on pre-tax adjustments(9) | | | (47,975 | ) | | | (48,173 | ) | | | (52,333 | ) |
| | | | | | | | | | | | |
Non-GAAP adjusted net income | | $ | 65,085 | | | $ | 56,766 | | | $ | 46,378 | |
| | | | | | | | | | | | |
77
| | | | | | | | | | | | |
| | | Twelve Months Ended December 31, | |
Per share data | | 2012 | | | 2011 | | | 2010 | |
EPS — diluted | | $ | (0.12 | ) | | $ | (0.27 | ) | | $ | (0.57 | ) |
Pre-tax non-cash, acquisition-related intangible amortization and depreciation | | | 1.31 | | | | 1.45 | | | | 0.56 | |
Pre-tax non-cash, share-based compensation(1) | | | 0.18 | | | | 0.09 | | | | 0.20 | |
Pre-tax acquisition and integration related expenses(2) | | | 0.11 | | | | 0.43 | | | | 0.39 | |
Pre-tax RCM management restructuring expenses(3) | | | — | | | | 0.03 | | | | — | |
Pre-tax purchase accounting adjustment(4) | | | — | | | | 0.11 | | | | 0.24 | |
Pre-tax deferred payment interest expense accretion(5) | | | — | | | | 0.05 | | | | 0.11 | |
Pre-tax non cash, impairment of intangibles(6) | | | — | | | | — | | | | 0.82 | |
Pre-tax, loss on debt extinguishment(7) | | | 0.49 | | | | — | | | | — | |
Pre-tax, insurance settlement(8) | | | — | | | | (0.06 | ) | | | — | |
| | | | | | | | | | | | |
Tax effect on pre-tax adjustments(9) | | | (0.84 | ) | | | (0.84 | ) | | | (0.93 | ) |
| | | | | | | | | | | | |
Non-GAAP adjusted EPS — diluted | | $ | 1.13 | | | $ | 0.99 | | | $ | 0.82 | |
| | | | | | | | | | | | |
Weighted average shares — diluted (in 000s)(10) | | | 57,452 | | | | 57,298 | | | | 56,434 | |
| (1) | Represents the amount and the per share impact, on a pre-tax basis, of non-cash share-based compensation to employees and directors. We believe excluding this non-cash expense allows us to compare our operating performance without regard to the impact of share-based compensation expense, which varies from period to period based on the amount and timing of grants. |
| (2) | Represents the amount and the per share impact, on a pre-tax basis, of acquisition and integration-related costs which include costs such as severance, retention, salaries relating to redundant positions, certain performance-related salary-based compensation, and operating infrastructure costs. We consider these charges to be non-operating expenses and unrelated to our underlying results of operations. |
| (3) | Represents the amount and the per share impact, on a pre-tax basis, of restructuring costs consisting of severance that resulted from certain management changes within our RCM segment. |
| (4) | For the fiscal years ended December 31, 2011 and 2010, the amount and the per share impact, on a pre-tax basis, of certain purchase accounting adjustments associated with the Broadlane Acquisition that reflect the fair value of gross administrative fee receivables and other service fees less revenue share obligation primarily related to client purchases that were reported to us subsequent to the consummation of the Broadlane Acquisition. |
| (5) | For the fiscal year ended December 31, 2011, the amount represents the per share impact, on a pre-tax basis, of interest expense on the accretion of the $120.1 million deferred payment associated with the Broadlane Acquisition, which was made in January 2012. For the fiscal year ended December 31, 2010, the amount represents the per share impact, on a pre-tax basis, of: (i) a termination fee of $1.6 million associated with an interest rate swap as part of the Broadlane Acquisition that was originally scheduled to terminate in March 2012; (ii) the write-off of debt issuance costs relating to the termination of our previous credit facility in connection with the Broadlane Acquisition; and (iii) interest expense on the accretion of the deferred payment associated with the Broadlane Acquisition. We believe such expenses are infrequent in nature and are not indicative of continuing operating performance. |
| (6) | Represents the amount and the per share impact, on a pre-tax basis, of impairment of intangibles during the fiscal years ended December 31, 2010. The impairment primarily consisted of: (i) a $44.5 million write-off of goodwill relating to our decision support services operating unit; and (ii) $1.3 million relating to an SCM trade name and a customer base intangible asset from prior acquisitions that were deemed to be impaired as part of the product and service offering integration associated with the Broadlane Acquisition. |
78
| (7) | Represents the amount and the per share impact, on a pre-tax basis, of loss on debt extinguishment and is comprised of (i) a $20.0 million write-off of debt issuance costs relating to our previous credit facility; and (ii) an $8.2 million swap termination fee for two forward starting interest rate swaps also relating to our previous credit facility. Refer to Note 7 and Note 14 of the Notes to Consolidated Financial Statements for additional details. |
| (8) | Represents the amount and the per share impact, on a pre-tax basis, of a $3.3 million insurance settlement received during the period. Refer to Note 8 in the Notes to Consolidated Financial Statements for additional details. |
| (9) | Reflects the tax impact on the adjustments used to derive Non-GAAP diluted adjusted EPS. The Company generally utilizes its effective tax rate for each respective period to calculate the tax effect of each adjustment. Given the impact of the Broadlane Acquisition on the Company’s 2011 actual effective tax rate, the Company used a tax rate of 40.0% for the fiscal years ended December 31, 2012 and 2011. The effective tax rate for the fiscal year ended December 31, 2010 was 30.7%. |
| (10) | Given the Company’s net loss in 2012, 2011 and 2010, basic and diluted weighted average shares are the same for EPS and Non-GAAP diluted adjusted EPS. |
Related Party Transactions
For a discussion of our transactions with certain related parties see Note 18 of the Notes to Consolidated Financial Statements.
New Accounting Pronouncements
Intangibles — Goodwill and Other
In July 2012, the Financial Accounting Standards Board (“FASB”) issued an accounting standards update with respect to testing indefinite-lived intangible assets for impairment. The update provides entities the option to first assess qualitative factors to determine whether it is more likely than not that an indefinite-lived intangible asset is impaired as a basis for determining whether it is necessary to perform a second, quantitative impairment test. If, based on the qualitative assessment of events or circumstances, an entity determines it is not more-likely-than-not that the indefinite-lived intangible asset’s fair value is less than its carrying amount, then it would not be necessary to perform the quantitative impairment test. However, if an entity concludes otherwise, then the quantitative impairment test must also be performed to identify and measure any potential impairment amount. The update is effective for annual and interim impairment tests performed for fiscal years beginning after September 15, 2012.
In September 2011, the FASB issued an accounting standards update amending the guidance on the annual testing of goodwill for impairment. The update will allow companies to assess qualitative factors to determine if it is more-likely-than-not that goodwill might be impaired and whether it is necessary to perform the two-step goodwill impairment test required under current accounting standards. We adopted this update on January 1, 2012.
Comprehensive Income
In February 2013, the FASB issued an accounting standard update relating to improving the reporting of reclassifications out of accumulated other comprehensive income. The update would require an entity to report the effect of significant reclassifications out of accumulated other comprehensive income on the respective line items in net income if the amount being reclassified is required under GAAP to be reclassified in its entirety to net income. For other amounts that are not required under GAAP to be reclassified in their entirety to net income in the same reporting period, an entity is required to cross-reference other disclosures required under GAAP that provide additional detail about those amounts. The update is effective for reporting periods beginning after December 15, 2012.
In June 2011, the FASB issued an accounting standard update relating to comprehensive income. The update would require an entity to present the total of comprehensive income, the components of net income, and the components of other comprehensive income either in a single continuous statement of comprehensive income or in two separate but consecutive statements. The update eliminates the option to present the components of other comprehensive income as part of the statement of equity. We adopted this update on January 1, 2012.
79
Fair Value
In May 2011, the FASB issued an accounting standard update relating to fair value measurements and disclosures. The update provides a consistent definition of fair value and ensures that the fair value measurement and disclosure requirements are similar under GAAP and International Financial Reporting Standards. The update changes certain fair value measurement principles and enhances the disclosure requirements particularly for level 3 fair value measurements. We adopted this update on January 1, 2012.
| ITEM 7A. QUANTITATIVE | AND QUALITATIVE DISCLOSURES ABOUT MARKET RISK. |
Quantitative and Qualitative Disclosures About Market Risk
Foreign currency exchange risk. Certain of our contracts are denominated in Canadian dollars. As our Canadian sales have not historically been significant to our operations, we do not believe that changes in the Canadian dollar relative to the U.S. dollar will have a significant impact on our financial condition, results of operations or cash flows. We currently do not transact any other business in any currency other than the U.S. dollar. As we continue to grow our operations, we may increase the amount of our sales to foreign clients. Although we do not expect foreign currency exchange risk to have a significant impact on our future operations, we will assess the risk on a case-specific basis to determine whether any forward currency hedge instrument would be warranted.
Interest rate risk. We had outstanding borrowings on our Term Loan Facility and Revolving Credit Facility of $560.0 million as of December 31, 2012. The Term A Facility and the Revolving Credit Facility bear interest at LIBOR plus an applicable margin. The Term B Facility bears interest at LIBOR, subject to a floor of 1.25% plus an applicable margin. We also had outstanding an aggregate principal amount of our Notes of $325.0 million as of December 31, 2012, which bears interest at 8% per annum.
To the extent we do not hedge our variable rate debt, interest rates and interest expense could increase significantly.
A hypothetical 100 basis point increase in LIBOR, which would represent potential interest rate change exposure on our outstanding term loans, would have resulted in an approximate $5.6 million increase to our interest expense for the fiscal year ended December 31, 2012.
| ITEM 8. | FINANCIAL STATEMENTS AND SUPPLEMENTARY DATA. |
The information required by this item is included herein beginning on page F-1.
| ITEM 9. | CHANGES IN AND DISAGREEMENTS WITH ACCOUNTANTS ON ACCOUNTING AND FINANCIAL DISCLOSURE. |
Not applicable.
| ITEM 9A. CONTROLS | AND PROCEDURES. |
Disclosure Controls and Procedures
We maintain disclosure controls and procedures that are designed to ensure that information required to be disclosed by us in reports we file or submit under the Exchange Act is recorded, processed, summarized and reported within the time periods specified in the SEC’s rules and forms, and that such information is accumulated and communicated to our management, including our chief executive officer and chief financial officer, as appropriate, to allow timely decisions regarding required disclosure. In designing and evaluating disclosure controls and procedures, management recognizes that any control and procedure, no matter how well designed and operated, can provide only reasonable assurance of achieving the desired control objectives and management necessarily applies its judgment in evaluating the cost-benefit relationship regarding the potential utilization of certain controls and procedures.
As required by Rule 13a-15(b) under the Exchange Act, our management, with the participation of our chief executive officer and chief financial officer, evaluated the design and operation of our disclosure controls and
80
procedures (as defined in Rule 13a-15(e) and 15d-15(e) under the Exchange Act). Based on such evaluation, our chief executive officer and chief financial officer have concluded that, as of the end of the period covered by this report, our disclosure controls and procedures were effective and were operating at a reasonable assurance level.
Management Report on Internal Control Over Financial Reporting
Our management is responsible for establishing and maintaining adequate internal control over financial reporting (as defined in Rules 13a-15(f) and 15d-15(f) under the Exchange Act) to provide reasonable assurance regarding the reliability of our financial reporting and the preparation of financial statements for external purposes in accordance with U.S. generally accepted accounting principles. Management assessed our internal control over financial reporting as of December 31, 2012. In making this assessment, we used the criteria established by the Committee of Sponsoring Organizations of the Treadway Commission in Internal Control — Integrated Framework . Management’s assessment included evaluation of elements such as the design and operating effectiveness of key financial reporting controls, process documentation, accounting policies, and our overall control environment.
Based on our assessment, management has concluded that our internal control over financial reporting was effective as of December 31, 2012 to provide reasonable assurance regarding the reliability of financial reporting and the preparation of financial statements for external reporting purposes in accordance with U.S. generally accepted accounting principles. The effectiveness of our internal control over financial reporting as of December 31, 2012 has been audited by KPMG LLP, an independent registered public accounting firm, as stated in their report which is included herein.
Changes in Internal Control over Financial Reporting
There have been no changes in our internal control over financial reporting for the three months ended December 31, 2012 that have materially affected, or are reasonably likely to materially affect, our internal control over financial reporting.
| ITEM 9B. OTHER | INFORMATION. |
None.
PART III
| ITEM 10. DIRECTORS, | EXECUTIVE OFFICERS AND CORPORATE GOVERNANCE. |
Information regarding directors, executive officers and corporate governance will be set forth in the proxy statement for our 2013 annual meeting of stockholders and is incorporated herein by reference.
| ITEM 11. EXECUTIVE | COMPENSATION. |
Information regarding executive compensation will be set forth in the proxy statement for our 2013 annual meeting of stockholders and is incorporated herein by reference.
| ITEM 12. | SECURITY OWNERSHIP OF CERTAIN BENEFICIAL OWNERS AND MANAGEMENT AND RELATED STOCKHOLDER MATTERS. |
Information regarding security ownership of certain beneficial owners and management and related stockholder matters will be set forth in the proxy statement for our 2013 annual meeting of stockholders and is incorporated herein by reference. Also, see section “Equity Compensation Plan Information” in Item 5 of Part 2 herein.
| ITEM 13. | CERTAIN RELATIONSHIPS AND RELATED TRANSACTIONS AND DIRECTOR INDEPENDENCE. |
Information regarding certain relationships and related transactions and director independence will be set forth in the proxy statement for our 2013 annual meeting of stockholders and is incorporated herein by reference.
81
| ITEM 14. | PRINCIPAL ACCOUNTING FEES AND SERVICES. |
Information regarding principal accountant fees and services will be set forth in the proxy statement for our 2013 annual meeting of stockholders and is incorporated herein by reference.
PART IV
| ITEM 15. | EXHIBITS AND FINANCIAL STATEMENT SCHEDULES. |
a) documents as part of this Report.
(1) The following consolidated financial statements are filed herewith in Item 8 of Part II above.
(i) Report of Independent Registered Public Accounting Firm
(ii) Consolidated Balance Sheets
(iii) Consolidated Statements of Operations
(iv) Consolidated Statements of Changes in Stockholders’ Equity and Comprehensive Income (Loss)
(v) Consolidated Statements of Cash Flows
(vi) Notes to Consolidated Financial Statements
(2) Financial Statement Schedule
All other supplemental schedules are omitted because of the absence of conditions under which they are required.
(3)Exhibits
| | |
Exhibit
No. | | Description of Exhibit |
| 2.1 | | Stock Purchase Agreement, dated as of September 14, 2010, by and among the Company, Broadlane Intermediate Holdings, Inc. and Broadlane Holdings, LLC (Incorporated by reference to Exhibit 2.1 to the Company’s Current Report on Form 8-K filed on September 20, 2010) |
| 3.1 | | Amended and Restated Certificate of Incorporation of the Company (Incorporated by reference to Exhibit 3.1 to the Company’s Annual Report on Form 10-K filed on March 24, 2008) |
| 3.2 | | Amended and Restated By-laws of the Company (Incorporated by reference to Exhibit 3.1 to the Company’s Annual Report on Form 10-K filed on March 24, 2008) |
| 4.1 | | Form of common stock certificate of the Company (Incorporated by reference to Exhibit 4.3 to the Company’s Registration Statement on Form S-1 No. 333-145693) |
| 4.2 | | Amended and Restated Registration Rights Agreement (Incorporated by reference to Exhibit 4.4 to the Company’s Registration Statement on Form S-1 No. 333-145693) |
| 4.3 | | Indenture, dated as of November 16, 2010, among MedAssets, Inc., the subsidiary guarantors party thereto and Wells Fargo Bank, National Association, as trustee (Incorporated by reference to Exhibit 4.1 to the Company’s Current Report on Form 8-K filed on November 19, 2010) |
| 10.1 | | Credit Agreement, dated as of December 13, 2012, among MedAssets, Inc., the lenders from time to time party thereto, JPMorgan Chase Bank, N.A., as Administrative Agent, Collateral Agent and L/C Issuer; Bank of America, N.A., as Swing Line Lender; J.P. Morgan Securities LLC, Barclays Bank PLC, Deutsche Bank Securities Inc., Merrill Lynch, Pierce, Fenner & Smith Incorporated, Morgan Stanley Senior Funding, Inc. and Suntrust Robinson Humphrey, Inc., as Joint Lead Arrangers and Joint Bookrunners; Deutsche Bank Securities Inc., as Syndication Agent; and Barclays Bank PLC, Morgan Stanley Senior Funding, Inc., Suntrust Bank, Raymond James Bank, FSB and Fifth Third Bank, as Co-Documentation Agents (Incorporated by reference to Exhibit 10.1 to the Company’s Current Report on Form 8-K filed on December 18, 2012) |
82
| | |
Exhibit
No. | | Description of Exhibit |
| 10.2 | | 1999 Stock Incentive Plan (as amended) (Incorporated by reference to Exhibit 10.2 to the Company’s Registration Statement on Form S-1 No. 333-145693) |
| 10.3 | | MedAssets Inc. 2004 Long-Term Incentive Plan (as amended) (Incorporated by reference to Exhibit 10.3 to the Company’s Registration Statement on Form S-1 No. 333-145693) |
| 10.4 | | MedAssets, Inc. Long Term Performance Incentive Plan (Incorporated by reference to Annex A to the Company’s Definitive Proxy Statement on Form DEF 14A filed on September 30, 2008) |
| 10.5 | | Form of Indemnification Agreement entered into by the Company with each of its executive officers and directors (Incorporated by reference to Exhibit 10.9 to the Company’s Registration Statement on Form S-1 No. 333-145693) |
| 10.6 | | Form of Stock Appreciation Right (non-performance based) Grant Notice and Agreement (Incorporated by reference to Exhibit 10.11 to the Company’s Annual Report on Form 10-K filed on March 11, 2009) |
| 10.7 | | Form of Stock Appreciation Right (performance based) Grant Notice and Agreement (Incorporated by reference to Exhibit 10.12 to the Company’s Annual Report on Form 10-K filed on March 11, 2009) |
| 10.8 | | Form of Restricted Stock (non-performance based) Grant Notice and Agreement (Incorporated by reference to Exhibit 10.13 to the Company’s Annual Report on Form 10-K filed on March 11, 2009) |
| 10.9 | | Form of Restricted Stock (performance based) Grant Notice and Agreement (Incorporated by reference to Exhibit 10.14 to the Company’s Annual Report on Form 10-K filed on March 11, 2009) |
| 10.10 | | Amended and Restated Employment Agreement, dated May 2, 2011, by and between the Company and John A. Bardis (Incorporated by reference to Exhibit 10.1 to the Company’s quarterly report on Form 10-Q filed on August 8, 2011) |
| 10.11 | | Amended and Restated Employment Agreement, dated May 2, 2011, by and between the Company and Rand Ballard (Incorporated by reference to Exhibit 10.2 to the Company’s quarterly report on Form 10-Q filed on August 8, 2011) |
| 10.12 | | Amended and Restated Employment Agreement, dated May 2, 2011, by and between the Company and Charles Garner (Incorporated by reference to Exhibit 10.3 to the Company’s quarterly report on Form 10-Q filed on August 8, 2011) |
| 10.13 | | Amended and Restated Employment Agreement, dated May 2, 2011, by and between the Company and L. Neil Hunn Incorporated by reference to Exhibit 10.4 to the Company’s quarterly report on Form 10-Q filed on August 8, 2011) |
| 10.14 | | Amended and Restated Employment Agreement, dated May 2, 2011, by and between the Company and Lance M. Culbreth (Incorporated by reference to Exhibit 10.5 to the Company’s quarterly report on Form 10-Q filed on August 8, 2011) |
| 10.15 | | Separation and Release Agreement, dated as of September 6, 2011, between MedAssets, Inc., MedAssets Services, LLC, and Mr. L. Neil Hunn (Incorporated by reference to Exhibit 10.1 to the Company’s current report on Form 8-K filed on September 7, 2011) |
| 10.16 | | Employment Agreement, dated as of January 19, 2012, between MedAssets Services, LLC and Allen W. Hobbs (Incorporated by reference to Exhibit 10.1 to the Company’s current report on Form 8-K filed on January 23, 2012) |
| 10.17 | | Employment Agreement, dated as of June 17, 2011, by and between the Company and Gregory A. Strobel (Incorporated by reference to Exhibit 10.1 to the Company’s Quarterly Report on Form 10-Q filed on August 6, 2012) |
| 10.18 | | Employment Agreement, dated as of March 5, 2012, by and between the Company and Mike Nolte (Incorporated by reference to Exhibit 10.2 to the Company’s Quarterly Report on Form 10-Q filed on May 7, 2012) |
83
| | |
Exhibit
No. | | Description of Exhibit |
| 18 | | Preferability letter from KPMG, LLP on change in date of annual goodwill impairment testing performed by the Company (incorporated by reference to Exhibit 18 to the Company’s Annual Report on Form 10-K filed on February 28, 2012). |
| 21* | | Subsidiaries of the Company |
| 23* | | Consent of KPMG, LLP with respect to the consolidated financial statements of the Company |
| 31.1* | | Sarbanes-Oxley Act of 2002, Section 302 Certification for President and Chief Executive Officer |
| 31.2* | | Sarbanes-Oxley Act of 2002, Section 302 Certification for Chief Financial Officer |
| 32.1* | | Sarbanes-Oxley Act of 2002, Section 906 Certification for President and Chief Executive Officer and Chief Financial Officer |
| 101.INS* | | XBRL Instance Document |
| 101.SCH* | | XBRL Taxonomy Extension Schema Document |
| 101.CAL* | | XBRL Taxonomy Extension Calculation Linkbase Document |
| 101.DEF* | | XBRL Taxonomy Extension Definition Linkbase Document |
| 101.LAB* | | XBRL Taxonomy Extension Label Linkbase Document |
| 101.PRE* | | XBRL Taxonomy Extension Presentation Linkbase Document |
84
SIGNATURES
Pursuant to the requirements of Section 13 or 15(d) of the Securities Exchange Act of 1934, the Registrant has duly caused this report to be signed on its behalf by the undersigned, thereunto duly authorized.
| | | | |
| | MEDASSETS, Inc. |
| | | | |
| | | | |
February 26, 2013 | | By: | | /s/ JOHN A. BARDIS |
| | | | Name: John A. Bardis |
| | | | Title: Chief Executive Officer |
Pursuant to the requirements of the Securities Exchange Act of 1934, this report has been signed by the following persons on behalf of the registrant and in the capacities and on the dates indicated.
| | | | |
Signature | | Title | | Date |
/s/ JOHN A. BARDIS | | Chairman, President and Chief Executive Officer (Principal Executive Officer) | | February 26, 2013 |
Name: John A. Bardis | | |
| | |
/s/ CHARLES O. GARNER | | Chief Financial Officer | | February 26, 2013 |
Name: Charles O. Garner | | (Principal Financial Officer) | | |
| | |
/s/ LANCE M. CULBRETH | | Chief Accounting Officer | | February 26, 2013 |
Name: Lance M. Culbreth | | (Principal Accounting Officer) | | |
| | |
/s/ MICHAEL P. NOLTE | | Chief Operating Officer | | February 26, 2013 |
Name: Michael P. Nolte | | | | |
| | |
/s/ RAND A. BALLARD | | Director and Chief Customer | | February 26, 2013 |
Name: Rand A. Ballard | | Officer | | |
| | |
/s/ HARRIS HYMAN IV | | Director | | February 26, 2013 |
Name: Harris Hyman IV | | | | |
| | |
/s/ VERNON R. LOUCKS, JR. | | Director | | February 26, 2013 |
Name: Vernon R. Loucks, Jr. | | | | |
| | |
/s/ TERRENCE J. MULLIGAN | | Director | | February 26, 2013 |
Name: Terrence J. Mulligan | | | | |
| | |
/s/ C.A. LANCE PICCOLO | | Director | | February 26, 2013 |
Name: C.A. Lance Piccolo | | | | |
| | |
/s/ JOHN C. RUTHERFORD | | Director | | February 26, 2013 |
Name: John C. Rutherford | | | | |
85
| | | | |
Signature | | Title | | Date |
| | |
/s/ SAMUEL K. SKINNER | | Director | | February 26, 2013 |
Name: Samuel K. Skinner | | | | |
| | |
/s/ BRUCE F. WESSON | | Director | | February 26, 2013 |
Name: Bruce F. Wesson | | | | |
86
INDEX TO CONSOLIDATED FINANCIAL STATEMENTS
| | | | |
Report of Independent Registered Public Accounting Firm | | | F-2 | |
Consolidated balance sheets of MedAssets, Inc. as of December 31, 2012 and December 31, 2011 | | | F-3 | |
Consolidated statements of operations of MedAssets, Inc. for the years ended December 31, 2012, December 31, 2011 and December 31, 2010 | | | F-4 | |
Consolidated statements of stockholders’ equity and comprehensive income (loss) of MedAssets, Inc. for the years ended December 31, 2012, December 31, 2011 and December 31, 2010 | | | F-5 | |
Consolidated statements of cash flows of MedAssets, Inc. for the years ended December 31, 2012, December 31, 2011 and December 31, 2010 | | | F-8 | |
Notes to Consolidated Financial Statements | | | F-9 | |
F-1
Report of Independent Registered Public Accounting Firm
The Board of Directors and Stockholders
MedAssets, Inc.:
We have audited the accompanying consolidated balance sheets of MedAssets, Inc. (the Company) as of December 31, 2012 and 2011, and the related consolidated statements of operations, comprehensive loss, stockholders’ equity, and cash flows for each of the years in the three-year period ended December 31, 2012. We also have audited the Company’s internal control over financial reporting as of December 31, 2012, based on criteria established inInternal Control–Integrated Framework issued by the Committee of Sponsoring Organizations of the Treadway Commission (COSO). Company’s management is responsible for these consolidated financial statements, for maintaining effective internal control over financial reporting, and for its assessment of the effectiveness of internal control over financial reporting, included in the accompanying Management Report on Internal Control Over Financial Reporting. Our responsibility is to express an opinion on these consolidated financial statements and an opinion on the Company’s internal control over financial reporting based on our audits.
We conducted our audits in accordance with the standards of the Public Company Accounting Oversight Board (United States). Those standards require that we plan and perform the audits to obtain reasonable assurance about whether the financial statements are free of material misstatement and whether effective internal control over financial reporting was maintained in all material respects. Our audits of the consolidated financial statements included examining, on a test basis, evidence supporting the amounts and disclosures in the financial statements, assessing the accounting principles used and significant estimates made by management, and evaluating the overall financial statement presentation. Our audit of internal control over financial reporting included obtaining an understanding of internal control over financial reporting, assessing the risk that a material weakness exists, and testing and evaluating the design and operating effectiveness of internal control based on the assessed risk. Our audits also included performing such other procedures as we considered necessary in the circumstances. We believe that our audits provide a reasonable basis for our opinions.
A company’s internal control over financial reporting is a process designed to provide reasonable assurance regarding the reliability of financial reporting and the preparation of financial statements for external purposes in accordance with generally accepted accounting principles. A company’s internal control over financial reporting includes those policies and procedures that (1) pertain to the maintenance of records that, in reasonable detail, accurately and fairly reflect the transactions and dispositions of the assets of the company; (2) provide reasonable assurance that transactions are recorded as necessary to permit preparation of financial statements in accordance with generally accepted accounting principles, and that receipts and expenditures of the company are being made only in accordance with authorizations of management and directors of the company; and (3) provide reasonable assurance regarding prevention or timely detection of unauthorized acquisition, use, or disposition of the company’s assets that could have a material effect on the financial statements.
Because of its inherent limitations, internal control over financial reporting may not prevent or detect misstatements. Also, projections of any evaluation of effectiveness to future periods are subject to the risk that controls may become inadequate because of changes in conditions, or that the degree of compliance with the policies or procedures may deteriorate.
In our opinion, the consolidated financial statements referred to above present fairly, in all material respects, the financial position of MedAssets, Inc. and subsidiaries as of December 31, 2012 and 2011, and the results of their operations and their cash flows for each of the years in the three-year period ended December 31, 2012, in conformity with U.S. generally accepted accounting principles. Also in our opinion, MedAssets, Inc. maintained, in all material respects, effective internal control over financial reporting as of December 31, 2012, based on criteria established inInternal Control–Integrated Framework issued by the Committee of Sponsoring Organizations of the Treadway Commission.
/s/ KPMG LLP
Atlanta, Georgia
February 26, 2013
F-2
MedAssets, Inc.
Consolidated Balance Sheets
| | | | | | | | |
| | | December 31, | |
| | | 2012 | | | 2011 | |
| | | (In thousands, except
share and per share amounts) | |
| ASSETS | | | | | | | | |
Current assets | | | | | | | | |
Cash and cash equivalents | | $ | 13,734 | | | $ | 62,947 | |
Accounts receivable, net of allowances of $3,046 and $3,891 as of December 31, 2012 and December 31, 2011, respectively | | | 96,346 | | | | 104,039 | |
Deferred tax asset, current portion | | | 11,126 | | | | 15,434 | |
Prepaid expenses and other current assets | | | 21,791 | | | | 18,488 | |
| | | | | | | | |
Total current assets | | | 142,997 | | | | 200,908 | |
Property and equipment, net | | | 134,361 | | | | 101,471 | |
Other long term assets | | | | | | | | |
Goodwill | | | 1,027,847 | | | | 1,027,847 | |
Intangible assets, net | | | 330,163 | | | | 403,371 | |
Other | | | 42,869 | | | | 61,381 | |
| | | | | | | | |
Other long term assets | | | 1,400,879 | | | | 1,492,599 | |
| | | | | | | | |
Total assets | | $ | 1,678,237 | | | $ | 1,794,978 | |
| | | | | | | | |
| | |
| LIABILITIES AND STOCKHOLDERS’ EQUITY | | | | | | | | |
Current liabilities | | | | | | | | |
Accounts payable | | $ | 25,487 | | | $ | 21,185 | |
Accrued revenue share obligation and rebates | | | 74,274 | | | | 70,906 | |
Accrued payroll and benefits | | | 40,085 | | | | 33,265 | |
Other accrued expenses | | | 14,145 | | | | 17,811 | |
Deferred revenue, current portion | | | 55,756 | | | | 48,459 | |
Deferred purchase consideration (Note 5) | | | — | | | | 120,136 | |
Current portion of notes payable | | | 15,500 | | | | 6,350 | |
Current portion of finance obligation | | | 233 | | | | 213 | |
| | | | | | | | |
Total current liabilities | | | 225,480 | | | | 318,325 | |
Notes payable, less current portion | | | 544,500 | | | | 572,300 | |
Bonds payable | | | 325,000 | | | | 325,000 | |
Finance obligation, less current portion | | | 9,046 | | | | 9,287 | |
Deferred revenue, less current portion | | | 14,393 | | | | 14,148 | |
Deferred tax liability | | | 125,394 | | | | 129,635 | |
Other long term liabilities | | | 801 | | | | 7,670 | |
| | | | | | | | |
Total liabilities | | | 1,244,614 | | | | 1,376,365 | |
Commitments and contingencies | | | | | | | | |
Stockholders’ equity | | | | | | | | |
Common stock, $0.01 par value, 150,000,000 shares authorized; 59,324,000 and 57,857,000 shares issued and outstanding as of December 31, 2012 and December 31, 2011, respectively | | | 593 | | | | 579 | |
Additional paid-in capital | | | 688,431 | | | | 670,618 | |
Accumulated other comprehensive loss (Note 14) | | | — | | | | (4,061 | ) |
Accumulated deficit | | | (255,401 | ) | | | (248,523 | ) |
| | | | | | | | |
Total stockholders’ equity | | | 433,623 | | | | 418,613 | |
| | | | | | | | |
Total liabilities and stockholders’ equity | | $ | 1,678,237 | | | $ | 1,794,978 | |
| | | | | | | | |
The accompanying notes are an integral part of these consolidated financial statements.
F-3
MedAssets, Inc.
Consolidated Statements of Operations
| | | | | | | | | | | | |
| | | Years Ended December 31, | |
| | | 2012 | | | 2011 | | | 2010 | |
| | | (In thousands, except per share amounts) | |
Revenue: | | | | | | | | | | | | |
Administrative fees, net | | $ | 266,915 | | | $ | 249,599 | | | $ | 119,070 | |
Other service fees | | | 373,206 | | | | 328,673 | | | | 272,261 | |
| | | | | | | | | | | | |
Total net revenue | | | 640,121 | | | | 578,272 | | | | 391,331 | |
| | | | | | | | | | | | |
Operating expenses: | | | | | | | | | | | | |
Cost of revenue (inclusive of certain amortization expense) | | | 138,618 | | | | 121,771 | | | | 100,737 | |
Product development expenses | | | 28,483 | | | | 26,823 | | | | 20,011 | |
Selling and marketing expenses | | | 60,438 | | | | 56,997 | | | | 46,736 | |
General and administrative expenses | | | 218,194 | | | | 203,101 | | | | 124,379 | |
Acquisition and integration-related expenses (Notes 5 and 6) | | | 6,348 | | | | 24,551 | | | | 21,591 | |
Depreciation | | | 30,190 | | | | 22,402 | | | | 19,948 | |
Amortization of intangibles | | | 72,652 | | | | 80,510 | | | | 31,027 | |
Impairment of property and equipment, goodwill, and intangibles (Notes 2, 3 and 4) | | | — | | | | — | | | | 46,423 | |
| | | | | | | | | | | | |
Total operating expenses | | | 554,923 | | | | 536,155 | | | | 410,852 | |
| | | | | | | | | | | | |
Operating income (loss) | | | 85,198 | | | | 42,117 | | | | (19,521 | ) |
Other income (expense): | | | | | | | | | | | | |
Interest (expense) | | | (66,045 | ) | | | (71,083 | ) | | | (27,508 | ) |
Loss on debt extinguishment (Notes 7 and 14) | | | (28,196 | ) | | | — | | | | — | |
Other income | | | 685 | | | | 3,621 | | | | 650 | |
| | | | | | | | | | | | |
Loss before income taxes | | | (8,358 | ) | | | (25,345 | ) | | | (46,379 | ) |
Income tax benefit | | | (1,480 | ) | | | (9,851 | ) | | | (14,255 | ) |
| | | | | | | | | | | | |
Net loss | | $ | (6,878 | ) | | $ | (15,494 | ) | | $ | (32,124 | ) |
| | | | | | | | | | | | |
Basic and diluted loss per share: | | | | | | | | | | | | |
Basic net loss per share | | $ | (0.12 | ) | | $ | (0.27 | ) | | $ | (0.57 | ) |
| | | | | | | | | | | | |
Diluted net loss per share | | $ | (0.12 | ) | | $ | (0.27 | ) | | $ | (0.57 | ) |
| | | | | | | | | | | | |
Weighted average shares — basic | | | 57,452 | | | | 57,298 | | | | 56,434 | |
Weighted average shares — diluted | | | 57,452 | | | | 57,298 | | | | 56,434 | |
Consolidated Statements of Comprehensive Loss for the Fiscal Years Ended December 31, 2012, 2011 and 2010 | | | | | | | | | | | | |
Net loss | | $ | (6,878 | ) | | $ | (15,494 | ) | | $ | (32,124 | ) |
Unrealized (loss) gain from hedging activities for the period | | | (1,687 | ) | | | (6,522 | ) | | | 927 | |
Income tax benefit (expense) related to hedging activities for the period | | | 521 | | | | 2,461 | | | | (349 | ) |
Reclassification of realized loss into earnings from hedging activities | | | 8,209 | | | | — | | | | 1,656 | |
Reclassification of income tax benefit into earnings from hedging activities | | | (2,982 | ) | | | — | | | | (629 | ) |
| | | | | | | | | | | | |
Comprehensive loss | | $ | (2,817 | ) | | $ | (19,555 | ) | | $ | (30,519 | ) |
The accompanying notes are an integral part of these consolidated financial statements.
F-4
MedAssets, Inc.
Consolidated Statements of Stockholders’ Equity
Year Ended December 31, 2012
| | | | | | | | | | | | | | | | | | | | | | | | |
| | | Common Stock | | | Additional
Paid-In
Capital | | | Accumulated
Other
Comprehensive
Loss | | | Accumulated
Deficit | | | Total
Stockholders’
Equity | |
| | | Shares | | | Par Value | | | | | |
| | | (In thousands) | |
Balances at December 31, 2011 | | | 57,857 | | | $ | 579 | | | $ | 670,618 | | | $ | (4,061 | ) | | $ | (248,523 | ) | | $ | 418,613 | |
Issuance of common stock from stock option and SSAR exercises and restricted stock issuances, net | | | 1,529 | | | | 15 | | | | 7,669 | | | | — | | | | — | | | | 7,684 | |
Stock compensation expense | | | — | | | | — | | | | 10,291 | | | | — | | | | — | | | | 10,291 | |
Excess tax benefit from equity award exercises, net | | | — | | | | — | | | | 452 | | | | — | | | | — | | | | 452 | |
Repurchase of common stock | | | (62 | ) | | | (1 | ) | | | (599 | ) | | | — | | | | — | | | | (600 | ) |
Unrealized loss from hedging activities (net of a tax benefit of $521) | | | — | | | | — | | | | — | | | | (1,166 | ) | | | — | | | | (1,166 | ) |
Reclassification of realized loss into earnings from hedging activities (net of a tax benefit of $2,982) | | | — | | | | — | | | | — | | | | 5,227 | | | | — | | | | 5,227 | |
Net loss | | | | | | | | | | | | | | | — | | | | (6,878 | ) | | | (6,878 | ) |
| | | | | | | | | | | | | | | | | | | | | | | | |
Balances at December 31, 2012 | | | 59,324 | | | $ | 593 | | | $ | 688,431 | | | $ | — | | | $ | (255,401 | ) | | $ | 433,623 | |
| | | | | | | | | | | | | | | | | | | | | | | | |
The accompanying notes are an integral part of these consolidated financial statements.
F-5
MedAssets, Inc.
Consolidated Statements of Stockholders’ Equity
Year Ended December 31, 2011
| | | | | | | | | | | | | | | | | | | | | | | | |
| | | Common Stock | | | Additional
Paid-In
Capital | | | Accumulated
Other
Comprehensive
Loss | | | Accumulated
Deficit | | | Total
Stockholders’
Equity | |
| | | Shares | | | Par Value | | | | | |
| | | (In thousands) | |
Balances at December 31, 2010 | | | 58,410 | | | $ | 584 | | | $ | 668,028 | | | $ | — | | | $ | (233,029 | ) | | $ | 435,583 | |
Issuance of common stock from stock option and SSAR exercises and restricted stock issuances, net | | | 597 | | | | 6 | | | | 1,969 | | | | — | | | | — | | | | 1,975 | |
Forfeiture of common restricted stock | | | (598 | ) | | | (6 | ) | | | 6 | | | | — | | | | — | | | | — | |
Stock compensation expense | | | — | | | | — | | | | 5,023 | | | | — | | | | — | | | | 5,023 | |
Excess tax benefit from equity award exercises | | | — | | | | — | | | | 893 | | | | — | | | | — | | | | 893 | |
Repurchase of common stock | | | (552 | ) | | | (5 | ) | | | (5,301 | ) | | | — | | | | — | | | | (5,306 | ) |
Unrealized loss from hedging activities (net of a tax benefit of $2,461) | | | — | | | | — | | | | — | | | | (4,061 | ) | | | — | | | | (4,061 | ) |
Net loss | | | — | | | | — | | | | — | | | | — | | | | (15,494 | ) | | | (15,494 | ) |
| | | | | | | | | | | | | | | | | | | | | | | | |
Balances at December 31, 2011 | | | 57,857 | | | $ | 579 | | | $ | 670,618 | | | $ | (4,061 | ) | | $ | (248,523 | ) | | $ | 418,613 | |
| | | | | | | | | | | | | | | | | | | | | | | | |
The accompanying notes are an integral part of these consolidated financial statements.
F-6
MedAssets, Inc.
Consolidated Statements of Stockholders’ Equity
Year Ended December 31, 2010
| | | | | | | | | | | | | | | | | | | | | | | | |
| | | Common Stock | | | Additional
Paid-In
Capital | | | Accumulated
Other
Comprehensive
Income (Loss) | | | Accumulated
Deficit | | | Total
Stockholders’
Equity | |
| | | Shares | | | Par Value | | | | | |
| | | (In thousands) | |
Balances at December 31, 2009 | | | 56,715 | | | $ | 567 | | | $ | 639,315 | | | $ | (1,605 | ) | | $ | (200,905 | ) | | $ | 437,372 | |
Issuance of common stock from stock option and SSAR exercises | | | 1,415 | | | | 14 | | | | 10,684 | | | | — | | | | — | | | | 10,698 | |
Issuance of common restricted stock | | | 280 | | | | 3 | | | | (3 | ) | | | — | | | | — | | | | — | |
Stock compensation expense | | | — | | | | — | | | | 11,493 | | | | — | | | | — | | | | 11,493 | |
Excess tax benefit from equity award exercises | | | — | | | | — | | | | 6,539 | | | | — | | | | — | | | | 6,539 | |
Unrealized gain from hedging activities (net of a tax expense of $349) | | | — | | | | — | | | | — | | | | 578 | | | | — | | | | 578 | |
Realized loss from hedging activities (net of a tax benefit of $629) | | | — | | | | — | | | | — | | | | 1,027 | | | | — | | | | 1,027 | |
Net loss | | | — | | | | — | | | | — | | | | — | | | | (32,124 | ) | | | (32,124 | ) |
| | | | | | | | | | | | | | | | | | | | | | | | |
Balances at December 31, 2010 | | | 58,410 | | | $ | 584 | | | $ | 668,028 | | | $ | — | | | $ | (233,029 | ) | | $ | 435,583 | |
| | | | | | | | | | | | | | | | | | | | | | | | |
The accompanying notes are an integral part of these consolidated financial statements.
F-7
MedAssets, Inc.
Consolidated Statements of Cash Flows
| | | | | | | | | | | | |
| | | Years Ended December 31, | |
| | | 2012 | | | 2011 | | | 2010 | |
| | | (In thousands) | |
Operating activities | | | | | | | | | | | | |
Net loss | | $ | (6,878 | ) | | $ | (15,494 | ) | | $ | (32,124 | ) |
Adjustments to reconcile loss from continuing operations to net cash provided by operating activities: | | | | | | | | | | | | |
Bad debt expense | | | 735 | | | | 181 | | | | 1,686 | |
Impairment of property, equipment, goodwill, and intangibles | | | — | | | | — | | | | 46,423 | |
Depreciation | | | 32,049 | | | | 23,627 | | | | 22,842 | |
Amortization of intangibles | | | 73,209 | | | | 81,067 | | | | 31,675 | |
Loss on sale of assets | | | 370 | | | | 418 | | | | 189 | |
Noncash stock compensation expense | | | 10,291 | | | | 5,023 | | | | 11,493 | |
Excess tax benefit from exercise of equity awards | | | (1,495 | ) | | | (956 | ) | | | (6,845 | ) |
Amortization of debt issuance costs | | | 7,390 | | | | 7,445 | | | | 6,863 | |
Loss on debt extinguishment (Note 7) | | | 19,987 | | | | — | | | | — | |
Noncash interest expense, net | | | 514 | | | | 3,784 | | | | 936 | |
Deferred income tax benefit | | | (3,212 | ) | | | (12,734 | ) | | | (25,065 | ) |
Changes in assets and liabilities, net of acquisitions: | | | | | | | | | | | | |
Accounts receivable | | | 6,958 | | | | (3,459 | ) | | | 11,780 | |
Prepaid expenses and other assets | | | (3,303 | ) | | | 1,321 | | | | (3,928 | ) |
Other long-term assets | | | 1,969 | | | | (5,023 | ) | | | (3,076 | ) |
Accounts payable | | | 5,572 | | | | 5,645 | | | | 14,121 | |
Accrued revenue share obligations and rebates | | | 3,368 | | | | 12,737 | | | | 3,575 | |
Accrued payroll and benefits | | | 6,820 | | | | 10,536 | | | | (760 | ) |
Other accrued expenses and long-term liabilities | | | (4,013 | ) | | | (6,399 | ) | | | 12,554 | |
Deferred revenue | | | 7,542 | | | | 16,477 | | | | 13,572 | |
| | | | | | | | | | | | |
Cash provided by operating activities | | | 157,873 | | | | 124,196 | | | | 105,911 | |
| | | | | | | | | | | | |
Investing activities | | | | | | | | | | | | |
Purchases of property, equipment and software, net | | | (26,221 | ) | | | (16,976 | ) | | | (12,758 | ) |
Capitalized software development costs | | | (40,205 | ) | | | (31,997 | ) | | | (17,968 | ) |
Acquisitions, net of cash acquired | | | — | | | | — | | | | (749,055 | ) |
| | | | | | | | | | | | |
Cash used in investing activities | | | (66,426 | ) | | | (48,973 | ) | | | (779,781 | ) |
| | | | | | | | | | | | |
Financing activities | | | | | | | | | | | | |
Proceeds from notes payable | | | 550,000 | | | | — | | | | 655,000 | |
Proceeds from bonds payable | | | — | | | | — | | | | 325,000 | |
Borrowings from revolving credit facility | | | 140,000 | | | | — | | | | — | |
Repayment of notes payable | | | (578,650 | ) | | | (56,350 | ) | | | (235,161 | ) |
Repayment of revolving credit facility | | | (130,000 | ) | | | — | | | | — | |
Repayment of finance obligations | | | (676 | ) | | | (665 | ) | | | (658 | ) |
Payment of deferred purchase consideration | | | (120,136 | ) | | | — | | | | — | |
Debt issuance costs | | | (9,777 | ) | | | — | | | | (46,516 | ) |
Excess tax benefit from exercise of equity awards | | | 1,495 | | | | 956 | | | | 6,845 | |
Issuance of common stock, net of offering costs | | | 7,684 | | | | 1,975 | | | | 10,698 | |
Purchase of treasury shares | | | (600 | ) | | | (5,028 | ) | | | — | |
| | | | | | | | | | | | |
Cash (used in) provided by financing activities | | | (140,660 | ) | | | (59,112 | ) | | | 715,208 | |
| | | | | | | | | | | | |
Net (decrease) increase in cash and cash equivalents | | | (49,213 | ) | | | 16,111 | | | | 41,338 | |
Cash and cash equivalents, beginning of period | | | 62,947 | | | | 46,836 | | | | 5,498 | |
| | | | | | | | | | | | |
Cash and cash equivalents, end of period | | $ | 13,734 | | | $ | 62,947 | | | $ | 46,836 | |
| | | | | | | | | | | | |
The accompanying notes are an integral part of these consolidated financial statements.
F-8
MedAssets, Inc.
Notes to Consolidated Financial Statements
(in thousands, except share and per share amounts)
1. DESCRIPTION OF BUSINESS AND SIGNIFICANT ACCOUNTING POLICIES
We provide technology-enabled products and services which together deliver solutions designed to improve operating margin and cash flow for hospitals, health systems and other ancillary healthcare providers. Our client-specific solutions are designed to efficiently analyze detailed information across the spectrum of revenue cycle and spend management processes. Our solutions integrate with existing operations and enterprise software systems of our clients and provide financial improvement with minimal upfront costs or capital expenditures. Our operations and clients are primarily located throughout the United States and to a lesser extent, Canada.
Basis of Presentation
The consolidated financial statements include the accounts of MedAssets, Inc. and our wholly owned subsidiaries. All significant intercompany accounts and transactions have been eliminated in consolidation. We have prepared the accompanying consolidated financial statements in accordance with accounting principles generally accepted in the United States of America (“GAAP”) and pursuant to the rules and regulations of the Securities and Exchange Commission (the “SEC”).
Use of Estimates
The preparation of the financial statements and related disclosures in conformity with GAAP and pursuant to the rules and regulations of the SEC, requires management to make estimates and assumptions that affect the reported amounts of assets and liabilities and the disclosure of contingent liabilities at the date of the financial statements and the reported amounts of revenues and expenses during the reporting period. Actual results may differ materially from those estimates. We believe that the estimates, assumptions and judgments involved in revenue recognition, allowances for doubtful accounts and returns, product development costs, share-based payments, business combinations, impairment of goodwill, intangible assets and long-lived assets, and accounting for income taxes have the greatest potential impact on our consolidated financial statements.
Cash and Cash Equivalents
All of our highly liquid investments with original maturities of three months or less at the date of purchase are carried at cost which approximates fair value and are considered to be cash equivalents. Currently, our excess cash is voluntarily used to repay our swing-line credit facility, if any, on a daily basis and applied against our revolving credit facility on a routine basis when our swing-line credit facility is undrawn. In addition, we may periodically make voluntary repayments on our term loans. Cash and cash equivalents were $13,734 and $62,947 as of December 31, 2012 and December 31, 2011, respectively, and our swing-line balance was zero during those reporting periods. We had $10,000 outstanding on our revolving credit facility as of December 31, 2012 and zero outstanding as of December 31, 2011. In the event our cash balance is zero at the end of a period, any outstanding checks are recorded as accrued expenses. See Note 7 for immediately available cash under our revolving credit facility.
Additionally, we have a concentration of credit risk arising from cash deposits held in excess of federally insured amounts totaling $13,234 as of December 31, 2012.
Accounts Receivables and Allowance
Our trade accounts receivables are recorded at invoiced amounts and do not bear interest. We record an allowance for doubtful accounts against our trade receivables to reflect the balance at net realizable value on our consolidated balance sheets.
An allowance for doubtful accounts is established for accounts receivable estimated to be uncollectible due to client credit worthiness and is adjusted periodically based upon management’s evaluation of current economic conditions, historical experience and other relevant factors that, in the opinion of management, deserve
F-9
MedAssets, Inc.
Notes to Consolidated Financial Statements — (Continued)
(in thousands, except share and per share amounts)
recognition in estimating such allowance. Estimates related to our allowance for doubtful accounts are recorded as bad debt expense in our consolidated statement of operations. We review our allowance for doubtful accounts based upon the credit risk of specific clients, historical experience and other information.
Client Service Allowance
We maintain a client service allowance based on management’s evaluation of historical experience, current trends, individual client experience and other relevant factors that, in the opinion of management, deserve recognition in estimating such allowance. Estimates related to our client service allowance are recorded as a reduction to net revenue in our consolidated statements of operations and as a current liability in our consolidated balance sheets.
Financial Instruments
The carrying amount reported on the balance sheet for trade accounts receivable, trade accounts payable, accrued revenue share obligations and rebates, accrued payroll and benefits, and other accrued expenses approximate fair values due to the short maturities of the financial instruments.
We believe the carrying amount of notes payable approximates fair value, and interest expense is accrued on notes outstanding. The current portion of notes payable represents the portion of notes payable due within one year of the period end.
The fair value of the bonds payable is calculated based on quoted market prices for the same or similar issues or on rates currently offered to the Company for similar debt instruments.
Revenue Recognition
Net revenue consists primarily of: (a) administrative fees reported under contracts with manufacturers and distributors and (b) other service fee revenue that is comprised of: (i) consulting revenues received under fixed-fee or contingent-based service contracts; (ii) subscription and implementation fees received under our SaaS agreements; and (iii) transaction and contingent fees received under service contracts. Revenue is earned primarily in the United States.
Revenue is recognized when: 1) there is persuasive evidence of an arrangement; 2) the fee is fixed or determinable; 3) services have been rendered and payment has been contractually earned, and 4) collectability is reasonably assured.
Administrative Fees
Administrative fees are generated under contracted purchasing agreements with manufacturers and distributors of healthcare products and services (“vendors”). Vendors pay administrative fees to us in return for the provision of aggregated sales volumes from hospitals and health systems that purchase products qualified under our contracts. The administrative fees paid to us represent a percentage of the purchase volume of our hospitals and healthcare system clients.
We earn administrative fees in the quarter in which the respective vendors report client purchasing data to us, usually a month or a quarter in arrears of actual client purchase activity. The majority of our vendor contracts disallow netting product returns from the vendors’ administrative fee calculations in periods subsequent to their
F-10
MedAssets, Inc.
Notes to Consolidated Financial Statements — (Continued)
(in thousands, except share and per share amounts)
reporting dates. For those contracts that allow for netting of product returns, vendors supply us with sufficient purchase and return data needed for us to estimate and record an allowance for sales returns.
Revenue is recognized upon the receipt of vendor reports as this reporting proves that the delivery of the product or service has occurred, the administrative fees are fixed and determinable based on reported purchasing volume, and collectability is reasonably assured. Our client and vendor contracts substantiate persuasive evidence of an arrangement.
Certain hospital and healthcare system clients receive a revenue share obligation. This obligation is recognized according to the clients’ contractual agreements with our group purchasing organization (or GPO) as the related administrative fee revenue is recognized. In accordance with GAAP relating to principal agent considerations under revenue recognition, this obligation is netted against the related gross administrative fees, and is presented on the accompanying consolidated statements of operations as a reduction to arrive at total net revenue on our consolidated statements of operations.
Net administrative fees shown on our consolidated statements of operations reflect our gross administrative fees net of our revenue share obligation. Gross administrative fees include all administrative fees we receive pursuant to our group purchasing organization vendor contracts. Our revenue share obligation represents the portion of the administrative fees we are contractually obligated to share with certain of our GPO clients. The following shows the details of net administrative fee revenues for the years ended December 31, 2012, 2011 and 2010:
| | | | | | | | | | | | |
| | | Year Ended December 31, | |
| | | 2012 | | | 2011 | | | 2010 | |
Gross administration fees | | $ | 427,698 | | | $ | 384,560 | | | $ | 182,024 | |
Less: Revenue share obligation | | | (160,783 | ) | | | (134,961 | ) | | | (62,954 | ) |
| | | | | | | | | | | | |
Administrative fees, net | | $ | 266,915 | | | $ | 249,599 | | | $ | 119,070 | |
Other Service Fees
Consulting Fees
We generate revenue from fixed-fee consulting contracts. Revenue under these fixed-fee arrangements is recognized on a proportional performance method as services are performed and deliverables are provided, provided all other elements of SAB 104 are met.
Consulting Fees with Performance Targets
We generate revenue from consulting contracts that also include performance targets. The performance targets generally relate to committed financial improvement to our clients from the use and implementation of initiatives that result from our consulting services. Performance targets are measured as our strategic initiatives are identified and implemented, and the financial improvement can be quantified by the client. In the event the performance targets are not achieved, we are obligated to refund or reduce a portion of our fees.
Under these arrangements, all revenue is deferred and recognized as the performance target is achieved and the applicable contingency is released as evidenced by client acceptance. All revenues are fixed and determinable and the applicable service is rendered prior to recognition in the financial statements in accordance with SAB 104. One-time or non-recurring performance fees are recognized proportionately over the contract term in the period in which they are earned. We do not defer any related costs under these types of arrangements.
F-11
MedAssets, Inc.
Notes to Consolidated Financial Statements — (Continued)
(in thousands, except share and per share amounts)
Subscription and Implementation Fees
We follow GAAP for revenue recognition relating to arrangements that include the right to use software stored on another entity’s hardware for our SaaS-based solutions. Our clients are charged upfront non-refundable fees for implementation and recurring host subscription fees for access to web-based services. Our clients have access to our software applications while the data is hosted and maintained on our servers. Our clients cannot take physical possession of the software applications. Revenue from monthly hosting arrangements and services is recognized on a subscription basis over the period in which our clients use the product. Implementation fees are typically billed at the beginning of the arrangement and recognized as revenue over the greater of the subscription period or the estimated client relationship period beginning at client acceptance. We currently estimate the client relationship period at six years for our SaaS-based Revenue Cycle Management solutions. Contract subscription periods generally range from two to six years from execution.
Transaction Fees and Contingent Service Fees
We generate revenue from transactional-based service contracts and contingency-fee based service contracts. Provided all other elements of revenue recognition are met, revenue under these arrangements is recognized as services are performed, deliverables are provided and related contingencies are removed. All related direct costs are recorded as period costs when incurred.
Other
Other fees are primarily earned for our annual client and vendor meeting. Fees for our annual client and vendor meeting are recognized when the meeting is held and related obligations are performed.
Revenue Recognition — Multiple-Deliverable Revenue Arrangements
Effective January 1, 2011, we adopted the FASB’s accounting standards update for multiple-deliverable arrangements on a prospective basis. The guidance establishes a selling price hierarchy for determining the appropriate value of a deliverable. The hierarchy is based on: (a) vendor-specific objective evidence if available (“VSOE”); (b) third-party evidence (“TPE”) if vendor-specific objective evidence is not available; or (c) estimated selling price (“ESP”) if neither VSOE nor TPE is available. The guidance also eliminates the residual method of allocation of contract consideration to elements in the arrangement and requires that arrangement consideration be allocated to all elements at the inception of the arrangement using the relative selling price method.
Based on the selling price hierarchy established by the update, if we are unable to establish selling price using VSOE or TPE, we will establish an ESP. ESP is the estimated price at which we would transact a sale if the product or service were sold on a stand-alone basis. We establish a best estimate of ESP considering internal factors relevant to pricing practices such as costs and margin objectives, standalone sales prices of similar services and percentage of the fee charged for a primary service relative to a related service. Additional consideration is also given to market conditions such as competitor pricing strategies and market trends. If available, we regularly review VSOE and TPE for our services in addition to ESP.
Upon adoption of the update, we did not experience a change in our units of accounting nor did we change how we allocate arrangement consideration to our various units of accounting as we were able to obtain VSOE or TPE for our significant service deliverables. In addition, since adoption we have had no changes in our assumptions, inputs or methodology used in determining fair value that significantly affects the allocation of arrangement consideration. We continue to consider factors such as market size, the number of facilities, and the number of beds in a facility.
F-12
MedAssets, Inc.
Notes to Consolidated Financial Statements — (Continued)
(in thousands, except share and per share amounts)
Our revenue recognition policy for multiple-deliverable revenue arrangements is as follows:
We may bundle certain of our SCM service and technology offerings into a single service arrangement. We may also bundle certain of our RCM service and technology offerings into a single service arrangement. In addition, we may bundle certain of both of our SCM and RCM service and technology offerings together into a single service arrangement and market them as an enterprise arrangement.
Service arrangements generally include multiple deliverables or elements such as group purchasing services, consulting services, and SaaS-based subscription and implementation services. Provided that the total arrangement consideration is fixed and determinable at the inception of the arrangement, we allocate the total arrangement consideration to the individual elements within the arrangement based on their relative selling price using VSOE, TPE, or ESP for each element of the arrangement. We establish VSOE, TPE, or ESP for each element of a service arrangement based on the price charged for a particular element when it is sold separately in a stand-alone arrangement. Revenue is then recognized for each element according to the following revenue recognition methodology: (i) group purchasing service revenue is recognized as administrative fees are reported to us (generally ratably over the contractual term), (ii) consulting revenue is recognized on a proportional performance method as services are performed and deliverables are provided or once performance targets are accepted by our clients; and (iii) SaaS-based subscription revenue is recognized ratably over the subscription period (upfront non-refundable fees on our SaaS-based subscription services are recognized over the longer of the subscription period or the estimated client relationship period) beginning with the period in which the SaaS-based services are accepted by the client.
The majority of our multi-element service arrangements that include group purchasing services are not fixed and determinable at the inception of the arrangement because the fees for such arrangements are earned as administrative fees are reported. Administrative fees are not fixed and determinable until the receipt of vendor reports (nor can they be reliably estimated prior to the receipt of the vendor reports for revenue recognition purposes). For these multi-element service arrangements, we recognize each element as such element is delivered and as administrative fees are reported to us which generally approximates ratable recognition over the contract term.
In addition, certain of our arrangements include performance targets or other contingent fees that are not fixed and determinable at the inception of the arrangement. If the total arrangement consideration is not fixed and determinable at the inception of the arrangement, we allocate only that portion of the arrangement that is fixed and determinable to each element. As additional consideration becomes fixed, it is similarly allocated based on VSOE, TPE or ESP to each element in the arrangement and recognized in accordance with each element’s revenue recognition policy.
Performance targets generally relate to committed financial improvement to our clients from the use of our services. Revenue is only recognized if there are no refund rights and the fees earned are fixed and determinable. We obtain client acceptance as performance targets are achieved. In the event the performance targets are not achieved, we may be obligated to refund or reduce a portion of our fees and as such do not consider these fees fixed and determinable until we receive client acceptance.
In multi-element service arrangements that involve performance targets, the amount of revenue recognized on a particular delivered element is limited to the amount of revenue earned based on: (i) the proportionate performance of the individual element compared with all elements in the arrangement using the relative selling price method; and (ii) the proportional performance of that individual element. In all cases, revenue recognition is deferred on each element until the contingency on the performance target has been removed and the related revenue is fixed and determinable.
F-13
MedAssets, Inc.
Notes to Consolidated Financial Statements — (Continued)
(in thousands, except share and per share amounts)
Deferred Costs
We capitalize direct costs incurred during the implementation of our SaaS-based solutions. Deferred implementation costs are amortized into cost of revenue in proportion to the revenue earned over the subscription period or client relationship period, as applicable. In addition, we defer upfront sales commissions related to subscription and implementation fees and expense these costs ratably over the contract term. The current and long term portions of deferred costs are included in “Prepaid expense and other current assets” and “Other assets,” respectively in the accompanying consolidated balance sheets.
Property and Equipment
Property and equipment are stated at cost and include the capitalized portion of internal use product development costs. Depreciation of property and equipment (which includes amortization of capitalized internal use software) is computed on the straight-line method over the estimated useful lives of the assets which are as follows:
| | |
| | | Useful Lives
(in years) |
Buildings (Note 7) | | 30 |
Furniture and fixtures | | 7 |
Computers and equipment | | 5-7 |
Leasehold improvements | | Term of lease |
Purchased software and capitalized software development costs (internal use) | | 3-5 |
| | |
We evaluate the impairment or disposal of our property and equipment in accordance with GAAP. We evaluate the recoverability of property and equipment whenever events or changes in circumstances indicate that the carrying amount of an asset may not be recoverable, or whenever management has committed to an asset disposal plan. Whenever these indicators occur, recoverability is determined by comparing the net carrying value of an asset to its total undiscounted cash flows. We recognized impairment charges to write down certain software assets in the fiscal year ended December 31, 2010. See Note 2 for further details.
Product Development Costs
Our product development costs include costs incurred: (i) prior to the application development stage; (ii) prior to technological feasibility being reached; and (iii) in the post-development or maintenance stage. The majority of our software development costs relate to internal-use software development costs which are capitalized in accordance with relevant GAAP and classified as property and equipment. We have a small amount of external-use software development costs which are capitalized when the technological feasibility of a software product has been established in accordance with GAAP relating to research and development costs of computer software and are included in “Other” within Other long term assets in the accompanying consolidated balance sheets. Capitalized software costs are amortized on a straight-line basis over the estimated useful lives of the related software applications of up to five years. We periodically evaluate the useful lives of our capitalized software costs.
Goodwill and Intangible Assets — Indefinite Life
For identified intangible assets acquired in business combinations, we allocate purchase consideration based on the fair value of intangible assets acquired in accordance with GAAP relating to business combinations.
F-14
MedAssets, Inc.
Notes to Consolidated Financial Statements — (Continued)
(in thousands, except share and per share amounts)
As of December 31, 2012 and 2011, intangible assets with indefinite lives consist of goodwill. See Note 3 for further details.
We account for our intangible assets in accordance with GAAP relating to intangible assets, which states that goodwill or intangible assets with indefinite lives are not amortized. During 2011, we changed our annual impairment testing date from December 31 to October 1. We believe this new date is preferable since it provides additional time prior to the Company’s year-end to complete the goodwill impairment testing and report the results in our Annual Report on Form 10-K. We perform an impairment test of these assets on at least an annual basis and whenever events or changes in circumstances indicate that the carrying value of these assets may not be recoverable. To determine the fair values, we use the income approach based on estimated discounted future cash flows and the market approach based on comparable publicly traded companies in similar lines of business, and to a lesser extent, guideline public companies. Our cash flow assumptions consider historical and forecasted revenue, operating costs and other relevant factors. If the carrying value of the assets is deemed to be impaired, the amount of the impairment recognized in the financial statements is determined by estimating the fair value of the assets and recording a loss for the amount that the carrying value exceeds the estimated fair value.
We consider the following to be important factors that could trigger an impairment review: significant continued underperformance relative to historical or projected future operating results; identification of other impaired assets within a reporting unit; the more-likely-than not expectation that a reporting unit or a significant portion of a reporting unit will be sold; significant adverse changes in business climate or regulations; significant changes in senior management; significant changes in the manner of use of the acquired assets or the strategy for the Company’s overall business; significant negative industry or economic trends; a significant decline in the Company’s stock price for a sustained period or a significant unforeseen decline in the Company’s credit rating.
In connection with our 2010 annual impairment testing, we recognized an impairment charge on all of the goodwill at our DSS operating unit which was part of our Spend and Clinical Resource Management (“SCM”) reporting segment. In addition, we recognized an impairment charge on a trade name associated with a prior acquisition included in our SCM reporting segment. The trade name asset was deemed to be impaired as part of our integration associated with the Broadlane Acquisition. We did not recognize any goodwill or indefinite-lived intangible asset impairments during the fiscal years ended December 31, 2012 and 2011. See Note 3 for further details.
Intangible Assets — Definite Life
The intangible assets with definite lives are comprised of our customer base, developed technology, non-compete agreements and certain trade name assets. See Note 4 for further details.
Intangible assets with definite lives are amortized over their estimated useful lives which have been derived based on an assessment of such factors as attrition, expected volume and price changes. We evaluate the useful lives of our intangible assets with definite lives on an annual basis. Costs related to our customer base are amortized over the period and pattern of economic benefit that is expected from the client relationship based on the expected benefit of discounted cash flows. Customer base intangibles have estimated useful lives that range from seven to fourteen years. Costs related to developed technology are amortized on a straight-line basis over a useful life of three to seven years. Costs related to non-compete agreements are amortized on a straight-line basis over the life of the respective agreements. Costs associated with definite-lived trade names are amortized over the period of expected benefit of two to three years.
We evaluate indefinite-lived intangibles for impairment when events or changes in circumstances indicate that the carrying value of such assets may not be recoverable.
During 2010, we deemed certain customer base intangible assets associated with a prior acquisition within our Spend and Clinical Resource Management reporting segment to be impaired as part of our integration relating to the Broadlane Acquisition. See Note 4 for a description of the impairments.
F-15
MedAssets, Inc.
Notes to Consolidated Financial Statements — (Continued)
(in thousands, except share and per share amounts)
Business Combinations
We account for acquisitions in accordance with GAAP relating to business combinations. The guidance requires recognition of assets acquired, liabilities assumed, and contingent consideration at their fair value on the acquisition date with subsequent changes recognized in earnings; requires acquisition related expenses and restructuring costs to be recognized separately from the business combination and expensed as incurred; requires in-process research and development to be capitalized at fair value as an indefinite-lived intangible asset until completion or abandonment; and requires that changes in accounting for deferred tax asset valuation allowances and acquired income tax uncertainties after the measurement period be recognized as a component of provision for taxes. While we use our best estimates and assumptions as a part of the purchase price allocation process to accurately value assets acquired and liabilities assumed as of the business combination date, our estimates and assumptions are inherently uncertain and subject to refinement. As a result, during the preliminary purchase price measurement period, which may be up to one year from the business combination date, we record adjustments to the assets acquired and liabilities assumed, with the corresponding offset to goodwill. After the preliminary purchase price measurement period, we record adjustments to assets acquired or liabilities assumed subsequent to the purchase price measurement period in our operating results in the period in which the adjustments were determined.
Acquisition and Integration — Related Expenses
Acquisition and integration-related expenses may consist of: (i) transaction costs incurred to complete acquisitions including due diligence, consulting and other advisory related fees; (ii) integration-related costs related to third party consulting and other employee-related costs associated with the integration of an acquired business into our business; (iii) acquisition-related fees associated with unsuccessful acquisition attempts; and (iv) restructuring-type costs. Our restructuring-type costs are comprised primarily of employee termination costs related to headcount reductions. A liability for costs associated with an exit or disposal activity is recognized and measured initially at fair value only when the liability is incurred. Our restructuring charges also include accruals for estimated losses related to our excess facilities, based on our contractual obligations, net of estimated sublease income. We reassess the liability periodically based on market conditions. Refer to Note 6 for additional details of the restructuring activities.
Deferred Revenue
Deferred revenue consists of unrecognized revenue related to advanced client invoicing or client payments received prior to revenue being realized and earned. Substantially all deferred revenue consists of: (i) deferred administrative fees; (ii) deferred service fees; (iii) deferred software and implementation fees; and (iv) other deferred fees, including receipts for our annual meeting prior to the event.
Deferred administrative fees arise when cash is received from vendors prior to the receipt of vendor reports. Vendor reports provide details about a client’s purchases and provide evidence that delivery of product or service occurred. Administrative fees are also deferred when reported fees are contingent upon meeting a performance target that has not yet been achieved.
Deferred service fees arise when cash is received from clients or upon advanced client invoicing, prior to delivery of service. When the fees are contingent upon meeting a performance target that has not yet been achieved, the service fees are either not invoiced or are deferred on our balance sheet.
Deferred software and implementation fees primarily include: (i) implementation fees that are received at the beginning of a subscription contract. These fees are deferred and amortized over the expected period of benefit, which is the greater of the contracted subscription period or the client relationship period; and to a lesser extent, (ii) software support fees which represent client payments made in advance for annual software support contracts. Software and implementation fees are also deferred when the fees are contingent upon meeting a performance target that has not yet been achieved.
F-16
MedAssets, Inc.
Notes to Consolidated Financial Statements — (Continued)
(in thousands, except share and per share amounts)
For the years ended December 31, 2012 and 2011, deferred revenues recorded that are contingent upon meeting performance targets were $8,284 and $4,344, respectively.
The following table summarizes the deferred revenue categories and balances as of:
| | | | | | | | |
| | | December 31, | |
| | | 2012 | | | 2011 | |
Software and implementation fees | | $ | 24,468 | | | $ | 22,255 | |
Service fees | | | 26,135 | | | | 26,641 | |
Administrative fees | | | 14,672 | | | | 12,201 | |
Other fees | | | 4,874 | | | | 1,510 | |
| | | | | | | | |
Deferred revenue, total | | | 70,149 | | | | 62,607 | |
Less: Deferred revenue, current portion | | | (55,756 | ) | | | (48,459 | ) |
Deferred revenue, non-current portion | | $ | 14,393 | | | $ | 14,148 | |
| | | | | | | | |
Revenue Share Obligation and Rebates
We accrue revenue share obligation and rebates for certain clients according to our: (i) revenue share program and (ii) vendor rebate program.
Under our revenue share program, certain hospital and health system clients receive revenue share payments. This obligation is accrued according to contractual agreements between our GPO and the hospital and healthcare clients as the related administrative fee revenue is recognized. See description of this accounting treatment under “Administrative Fees” in the “Revenue Recognition” section.
We receive rebates pursuant to the provisions of certain vendor agreements. The rebates are earned by our hospitals and health system clients based on the volume of their purchases. We collect, process, and pay the rebates as a service to our clients. Substantially all the vendor rebates are excluded from revenue. The vendor rebates are accrued for active clients when we receive cash payments from vendors.
Advertising Costs
Advertising costs are expensed as incurred. Advertising expense for the years ended December 31, 2012, 2011 and 2010 was $2,750, $2,611 and $2,053, respectively.
Defined Contribution Plan
We sponsor a defined contribution plan for eligible employees. Under the terms of the plan, employees have the option of contributing a portion of their annual salary to the plan. We make matching contributions of 50 cents for each dollar contributed by employees up to the first six percent of compensation contributed. For the years ended December 31, 2012, 2011 and 2010, our plan contributions amounted to $5,175, $4,327 and $3,440, respectively.
Share-Based Compensation
Share-based payment transactions (as fully discussed in Note 10) are accounted for in accordance with GAAP relating to stock compensation. The guidance requires companies to recognize the cost (expense) of all share-based payment transactions in the financial statements. We expense employee share-based compensation using fair value-based measurement over an appropriate requisite service period primarily on an accelerated basis.
F-17
MedAssets, Inc.
Notes to Consolidated Financial Statements — (Continued)
(in thousands, except share and per share amounts)
Derivative Financial Instruments
Derivative instruments are accounted for in accordance with GAAP relating to derivatives and hedging. The guidance requires companies to recognize derivative instruments as either assets or liabilities on the balance sheet at fair value. See Note 14 for further discussion regarding our outstanding derivative financial instruments.
Income Taxes
In accordance with GAAP relating to income taxes, we recognize deferred income taxes based on the expected future tax consequences of differences between the financial statement basis and the tax basis of assets and liabilities, calculated using enacted tax rates in effect for the tax year in which the differences are expected to be reflected in the tax return.
The carrying value of our net deferred tax assets assumes that we will be able to generate sufficient future taxable income in applicable tax jurisdictions to realize the value of these assets. If we are unable to generate sufficient future taxable income in these jurisdictions, a valuation allowance is recorded when it is more likely than not that the value of the deferred tax assets is not realizable. Management evaluates the realizability of deferred tax assets and assesses the need for any valuation allowance adjustment. It is our policy to provide for uncertain tax positions and the related interest and penalties based upon management’s assessment of whether a tax benefit is more likely than not to be sustained upon examination by tax authorities. To the extent that the tax outcome of these uncertain tax positions falls below more likely than not, the change in estimate will impact the income tax provision in the period in which such determination is made. At December 31, 2012, we believe we have appropriately accounted for any unrecognized tax benefits. To the extent we prevail in matters for which a liability for an unrecognized tax benefit is established or we are required to pay amounts in excess of the liability, our effective tax rate in a given financial statement period may be affected. See Note 11 for further information.
Sales Taxes
In accordance with GAAP relating to principal agent considerations under revenue recognition, we record any tax assessed by a governmental authority that is directly imposed on a revenue-producing transaction between a seller and a client on a net basis (excluded from revenues).
Basic and Diluted Net Income and Loss Per Share
Basic net income or (loss) per share (“EPS”) is calculated in accordance with GAAP relating to earnings per share. Diluted EPS assumes the conversion, exercise or issuance of all potential common stock equivalents, unless the effect of inclusion would result in the reduction of a loss or the increase in income per share. For purposes of this calculation, our stock options, stock warrants, non-vested restricted stock, stock-settled stock appreciation rights and shares that were purchasable pursuant to our employee stock purchase plan are considered to be potential common shares and are only included in the calculation of diluted EPS when the effect is dilutive.
The shares used to calculate basic and diluted EPS represent the weighted-average common shares outstanding. Diluted net (loss) per share is the same as basic net (loss) per share for the fiscal years ended December 31, 2012, 2011 and 2010 since the effect of any potentially dilutive securities was excluded (as they were anti-dilutive due to our net loss).
Recent Accounting Pronouncements
Intangibles — Goodwill and Other
In July 2012, the Financial Accounting Standards Board (“FASB”) issued an accounting standards update with respect to testing indefinite-lived intangible assets for impairment. The update provides entities the option to
F-18
MedAssets, Inc.
Notes to Consolidated Financial Statements — (Continued)
(in thousands, except share and per share amounts)
first assess qualitative factors to determine whether it is more likely than not that an indefinite-lived intangible asset is impaired as a basis for determining whether it is necessary to perform a second, quantitative impairment test. If, based on the qualitative assessment of events or circumstances, an entity determines it is not more-likely-than-not that the indefinite-lived intangible asset’s fair value is less than its carrying amount, then it would not be necessary to perform the quantitative impairment test. However, if an entity concludes otherwise, then the quantitative impairment test must also be performed to identify and measure any potential impairment amount. The update is effective for annual and interim impairment tests performed for fiscal years beginning after September 15, 2012.
In September 2011, the FASB issued an accounting standards update amending the guidance on the annual testing of goodwill for impairment. The update will allow companies to assess qualitative factors to determine if it is more-likely-than-not that goodwill might be impaired and whether it is necessary to perform the two-step goodwill impairment test required under current accounting standards. We adopted this update on January 1, 2012.
Comprehensive Income
In February 2013, the FASB issued an accounting standard update relating to improving the reporting of reclassifications out of accumulated other comprehensive income. The update would require an entity to report the effect of significant reclassifications out of accumulated other comprehensive income on the respective line items in net income if the amount being reclassified is required under GAAP to be reclassified in its entirety to net income. For other amounts that are not required under GAAP to be reclassified in their entirety to net income in the same reporting period, an entity is required to cross-reference other disclosures required under GAAP that provide additional detail about those amounts. The update is effective for reporting periods beginning after December 15, 2012.
In June 2011, the FASB issued an accounting standard update relating to comprehensive income. The update would require an entity to present the total of comprehensive income, the components of net income, and the components of other comprehensive income either in a single continuous statement of comprehensive income or in two separate but consecutive statements. The update eliminates the option to present the components of other comprehensive income as part of the statement of equity. We adopted this update on January 1, 2012.
Fair Value
In May 2011, the FASB issued an accounting standard update relating to fair value measurements and disclosures. The update provides a consistent definition of fair value and ensures that the fair value measurement and disclosure requirements are similar under GAAP and International Financial Reporting Standards. The update changes certain fair value measurement principles and enhances the disclosure requirements particularly for level 3 fair value measurements. We adopted this update on January 1, 2012.
F-19
MedAssets, Inc.
Notes to Consolidated Financial Statements — (Continued)
(in thousands, except share and per share amounts)
2. PROPERTY AND EQUIPMENT
Property and equipment consists of the following as of:
| | | | | | | | |
| | | December 31, | |
| | | 2012 | | | 2011 | |
Land (Note 7) | | $ | 1,200 | | | $ | 1,200 | |
Buildings (Note 7) | | | 8,821 | | | | 8,821 | |
Furniture and fixtures | | | 18,914 | | | | 10,502 | |
Computers and equipment | | | 59,220 | | | | 48,018 | |
Leasehold improvements | | | 10,849 | | | | 10,608 | |
Purchased software | | | 26,357 | | | | 21,497 | |
Capitalized software development costs (internal use) | | | 113,825 | | | | 77,372 | |
| | | | | | | | |
| | | 239,186 | | | | 178,018 | |
Accumulated depreciation and amortization | | | (104,825 | ) | | | (76,547 | ) |
| | | | | | | | |
Property and equipment, net | | $ | 134,361 | | | $ | 101,471 | |
| | | | | | | | |
Software — Internal Use
We classify capitalized costs of software developed for internal use in property and equipment. Costs capitalized for software to be sold, leased or otherwise marketed are classified as other assets. Software acquired in a business combination is classified as a developed technology intangible asset. Capitalized costs of software developed for internal use during the years ended December 31, 2012 and 2011 amounted to $37,181 and $29,578, respectively. Accumulated amortization related to capitalized costs of software developed for internal use was $39,408 and $26,624 at December 31, 2012 and 2011, respectively.
We had no impairment charges related to property and equipment during the years ended December 31, 2012 and 2011.
For the fiscal year ended December 31, 2010, we recognized impairment charges of $398, which related to both of our segments and were attributable to the write down of software tools that we were not able to utilize. This impairment charge has been recorded to the impairment line item within our consolidated statements of operations.
Software — External Use
Capitalized costs of software developed for external use are classified as other assets on our consolidated balance sheet. Additions of capitalized costs of software developed for external use during the years ended December 31, 2012 and 2011 amounted to $3,024 and $2,419, respectively. Gross carrying value related to capitalized costs of software developed for external use was $15,435 and $13,177 at December 31, 2012 and 2011, respectively. Accumulated amortization related to capitalized costs of software developed for external use was $8,557 and $7,415 at December 31, 2012 and 2011, respectively.
During the years ended December 31, 2012, 2011 and 2010, we recognized $1,859, $1,225 and $2,894, respectively, in cost of revenue related to amortization of software developed for external use.
F-20
MedAssets, Inc.
Notes to Consolidated Financial Statements — (Continued)
(in thousands, except share and per share amounts)
3. GOODWILL
Goodwill consists of the following as of:
| | | | | | | | |
| | | December 31, | |
| | | 2012 | | | 2011 | |
Goodwill, net | | $ | 1,027,847 | | | $ | 1,027,847 | |
The changes in goodwill are summarized as follows, consolidated and by segment, for the years ended December 31, 2012 and 2011. We did not have any changes in goodwill for the year ended December 31, 2012:
| | | | | | | | | | | | |
| | | December 31, | |
| | | Consolidated | | | SCM | | | RCM | |
Balance, December 31, 2010 | | $ | 1,035,697 | | | $ | 653,052 | | | $ | 382,645 | |
Broadlane acquisition (Note 5) | | | (7,850 | ) | | | (7,850 | ) | | | — | |
| | | | | | | | | | | | |
Balance, December 31, 2011 and 2012 | | $ | 1,027,847 | | | $ | 645,202 | | | $ | 382,645 | |
We performed our annual impairment test as of October 1, 2012. As a result, the estimated fair value of each operating unit within our SCM and RCM segments exceeded its respective carrying value by more than 10%.
During 2010, we recognized a goodwill impairment charge of $44,495 relating to our decision support services operating unit within our SCM reporting segment. In addition, during 2010, we recorded an impairment charge of approximately $1,029 to write-off an indefinite-lived trade name acquired as part of a prior acquisition in connection with restructuring and rebranding of our SCM segment subsequent to the Broadlane Acquisition.
4. OTHER INTANGIBLE ASSETS
Intangible assets with definite lives consist of the following:
| | | | | | | | | | | | | | | | |
| | | Weighted
Average
Remaining
Amortization
Period
(Years)(1) | | | Gross
Carrying
Amount | | | Accumulated
Amortization | | | Net | |
December 31, 2012 | | | | | | | | | | | | | | | | |
Customer base | | | 4 years | | | $ | 510,547 | | | $ | (191,219 | ) | | $ | 319,328 | |
Developed technology | | | 2 years | | | | 36,500 | | | | (26,919 | ) | | | 9,581 | |
Trade name | | | 1 years | | | | 4,300 | | | | (3,046 | ) | | | 1,254 | |
| | | | | | | | | | | | | | | | |
| | | 4 years | | | $ | 551,347 | | | $ | (221,184 | ) | | $ | 330,163 | |
(1) The amount represents the weighted average amortization period remaining in total and for each asset class.
F-21
MedAssets, Inc.
Notes to Consolidated Financial Statements — (Continued)
(in thousands, except share and per share amounts)
| | | | | | | | | | | | | | | | |
| | | Weighted
Average
Remaining
Amortization
Period
(Years)(1) | | | Gross
Carrying
Amount | | | Accumulated
Amortization | | | Net | |
December 31, 2011 | | | | | | | | | | | | | | | | |
Customer base | | | 5 years | | | $ | 516,547 | | | $ | (134,696 | ) | | $ | 381,851 | |
Developed technology | | | 2 years | | | | 49,177 | | | | (31,069 | ) | | | 18,108 | |
Trade name | | | 2 years | | | | 4,300 | | | | (1,613 | ) | | | 2,687 | |
Non-compete agreements | | | 1.3 years | | | | 2,900 | | | | (2,175 | ) | | | 725 | |
| | | | | | | | | | | | | | | | |
| | | 4 years | | | $ | 572,924 | | | $ | (169,553 | ) | | $ | 403,371 | |
| (1) | The amount represents the weighted average amortization period remaining in total and for each asset class. |
In 2012, we reduced the gross carrying amount and the related accumulated amortization of our intangible assets by the following: (i) approximately $12,677 relating to fully amortized developed technology assets within our SCM and RCM segments amounting to $8,777 and $3,900, respectively; (ii) approximately $6,000 relating to a fully amortized customer base asset within our RCM segment; and (iii) approximately $2,900 relating to a fully amortized non-compete agreement within our SCM segment.
In 2011, we reduced the gross carrying amount and the related accumulated amortization by approximately $22,120 relating to a fully amortized customer base asset within our SCM segment. In addition, we reduced the gross carrying amount and the related accumulated amortization by approximately $224 relating to a fully amortized developed technology asset within our SCM segment.
In 2010, we recorded an impairment of approximately $501 related to customer base and acquired developed technology intangible assets acquired from previous acquisitions. The impairment charge has been recorded to the impairment line item within our consolidated statements of operations.
During the years ended December 31, 2012, 2011 and 2010, we recognized $73,209, $81,067 and $31,675, respectively in amortization expense, inclusive of ($557, $557 and $648) charged to cost of revenue for amortization of external-use acquired developed technology related to definite-lived intangible assets. Future amortization expense of definite-lived intangibles as of December 31, 2012, is as follows:
| | | | |
| | | Amount | |
2013 | | $ | 62,723 | |
2014 | | | 55,042 | |
2015 | | | 49,205 | |
2016 | | | 41,812 | |
2017 | | | 37,217 | |
Thereafter | | | 84,164 | |
| | | | |
| | $ | 330,163 | |
| | | | |
5. ACQUISITIONS
Broadlane Acquisition
In 2011, we finalized the acquisition purchase price and related purchase price allocation of Broadlane Intermediate Holdings, Inc. (“Broadlane”), formerly a wholly-owned subsidiary of Broadlane Holdings, LLC, which was acquired on November 16, 2010. In January 2012, the final adjusted deferred purchase consideration amount of $120,136 was paid to Broadlane Holdings, LLC.
F-22
MedAssets, Inc.
Notes to Consolidated Financial Statements — (Continued)
(in thousands, except share and per share amounts)
In connection with the acquisition, we incurred costs for the fiscal year ending December 31, 2010 amounting to approximately $10,396, primarily related to legal, financial, and accounting professional advisors. These costs were expensed as incurred and are included in the acquisition and integration-related expenses line item on the accompanying consolidated statement of operations.
Also during the fiscal year ended December 31, 2010, we incurred $2,798, respectively, related to certain due diligence and acquisition-related activities associated with an unsuccessful acquisition attempt. We expensed these costs as incurred in accordance with GAAP and they are included in the acquisition and integration-related expenses line item on our consolidated statement of operations.
6. RESTRUCTURING ACTIVITIES
During 2010, in connection with the Broadlane Acquisition, our management approved and initiated a plan to restructure our operations resulting in certain management, system and organizational changes within our SCM segment. During 2011, our management approved and initiated a plan to restructure our operations resulting in certain management changes within our RCM segment. During 2012, our management approved and initiated a plan to restructure our operations resulting in certain additional management changes within our RCM segment and our corporate segment. During the years ended December 31, 2012, 2011 and 2010, we expensed restructuring and exit and integration related costs of approximately $6,348, $26,197 (inclusive of $1,646 specific to our RCM management restructuring plan in 2011) and $8,397, respectively. These costs were attributable to management changes, restructuring activities of the acquired operations consisting of employee costs, system migration and standardization, facilities consolidation and other restructuring and integration costs. These costs are included within the acquisition and integration-related expenses line on the accompanying consolidated statements of operations with the exception of the RCM management restructuring costs in 2011 discussed above which are recorded within the product development and general and administrative expense line items of the accompanying consolidated statement of operations.
As of December 31, 2012 and 2011, the components of our restructuring plans are as follows:
| | • | | Employee-related costs — we are reorganizing our workforce and eliminating redundant or unneeded positions in connection with our SCM, RCM and corporate business operations. In connection with the workforce restructuring, we expect to incur severance, benefits and other employee-related costs in the range of $0 to $200 over the six months following December 31, 2012. During the years ended December 31, 2012 and 2011, we expensed approximately $3,276 and $14,207, respectively, primarily related to severance, salaries relating to redundant positions, certain bonuses and other employee benefits in connection with these activities. As of December 31, 2012 and 2011, we had approximately $995 and $2,908, respectively, included in current liabilities for these costs. |
| | • | | System migration and standardization — we are integrating and standardizing certain software platforms of the combined SCM business operations. In connection with the system migration and standardization, we expect to incur costs in the range of approximately $1,300 to $2,300 over the six months following December 31, 2012. During the years ended December 31, 2012 and 2011, we expensed approximately $3,010 and $5,551, respectively, primarily related to consulting and other third-party services in connection with these activities. As of December 31, 2012 and 2011, we had approximately $305 and $216, respectively, included in current liabilities for these costs. |
| | • | | Facilities consolidation — we are consolidating our SCM office space in areas where we have common or redundant locations. We expect to incur costs in the range of $0 to $100 over the six months following December 31, 2012 relating to ceasing to use certain facilities. During the years ended December 31, 2012 and 2011, we expensed approximately $62 and $6,439, respectively, relating to exit costs associated with our office space consolidation. As of December 31, 2012 and 2011, we had approximately $132 and $1,946, respectively, included in current liabilities for these costs. |
F-23
MedAssets, Inc.
Notes to Consolidated Financial Statements — (Continued)
(in thousands, except share and per share amounts)
| | • | | In addition, in November 2011, we entered into a new lease agreement for approximately 225,000 square feet of office space together with certain surface parking areas in Plano, Texas. The lease term commences on or around March 1, 2013 with an initial term of fifteen years plus an option to extend the lease term for up to ten years. In connection with this new lease agreement, we expect to incur estimated exit costs (inclusive of estimated sub-lease income) in the range of approximately $6,600 and $7,600 to exit from our existing SCM and RCM leased facilities in Plano, Texas. |
The following table summarizes the details of the Company’s restructuring activities during the years ended December 31, 2012 and 2011:
| | | | | | | | | | | | | | | | |
| | | Employee-related
costs | | | System
migration
and integration | | | Facility
consolidation | | | Total | |
Restructuring Reserve | | | | | | | | | | | | | | | | |
Accrued, December 31, 2010 | | $ | 3,488 | | | $ | — | | | $ | — | | | $ | 3,488 | |
Charges incurred | | | 14,207 | | | | 5,551 | | | | 6,439 | | | | 26,197 | |
Cash payments | | | (14,787 | ) | | | (5,335 | ) | | | (4,493 | ) | | | (24,615 | ) |
| | | | | | | | | | | | | | | | |
Accrued, December 31, 2011 | | $ | 2,908 | | | $ | 216 | | | $ | 1,946 | | | $ | 5,070 | |
Charges incurred | | | 3,276 | | | | 3,010 | | | | 62 | | | | 6,348 | |
Cash payments | | | (5,189 | ) | | | (2,921 | ) | | | (1,876 | ) | | | (9,986 | ) |
| | | | | | | | | | | | | | | | |
Accrued, December 31, 2012 | | $ | 995 | | | $ | 305 | | | $ | 132 | | | $ | 1,432 | |
| | | | | | | | | | | | | | | | |
7. NOTES AND BONDS PAYABLE
Our notes and bonds payable are summarized as follows as of:
| | | | | | | | |
| | | December 31, | |
| | | 2012 | | | 2011 | |
Term A facility | | $ | 250,000 | | | $ | — | |
Term B facility | | | 300,000 | | | | 578,650 | |
Revolving credit facility | | | 10,000 | | | | — | |
| | | | | | | | |
Total notes payable | | | 560,000 | | | | 578,650 | |
Bonds payable | | | 325,000 | | | | 325,000 | |
| | | | | | | | |
Total notes and bonds payable | | | 885,000 | | | | 903,650 | |
Less: current portions | | | (15,500 | ) | | | (6,350 | ) |
| | | | | | | | |
Total long-term notes and bonds payable | | $ | 869,500 | | | $ | 897,300 | |
| | | | | | | | |
Debt Extinguishment
We were previously party to a credit agreement dated November 16, 2010, with Barclays Bank PLC and JP Morgan Securities LLC that consisted of a senior secured term loan and a revolving line of credit that was administered by Barclays Bank PLC. On December 13, 2012, we extinguished our debt obligations relating to our previous credit agreement and entered into a new credit agreement with JPMorgan Chase Bank, N.A. as described below.
On December 13, 2012, MedAssets, Inc. (the “Company”) entered into a Credit Agreement with the banks and other financial institutions named therein (the “Lenders”), JPMorgan Chase Bank, N.A., acting as
F-24
MedAssets, Inc.
Notes to Consolidated Financial Statements — (Continued)
(in thousands, except share and per share amounts)
administrative agent and collateral agent for the Lenders and letter of credit issuer, and Bank of America, N.A., acting as swing line lender (the “Credit Agreement”). The Credit Agreement consists of a (i) five-year $250,000 senior secured term A loan facility (the “Term A Facility”), (ii) a seven-year $300,000 senior secured term B loan facility (the “Term B Facility”; and collectively with the Term A Facility, the “Term Loan Facility”), and (iii) a five-year $200,000 senior secured revolving credit facility (the “Revolving Credit Facility”), including a letter of credit sub-facility of $25,000 and a swing line sub-facility of $25,000.
The borrowings under the Term Loan Facility were made in a single draw on December 13, 2012. Amounts borrowed under the Term Loan Facility that are prepaid may not be reborrowed. Proceeds of borrowing under the Credit Agreement were used to extinguish the Company’s prior credit facility. The Revolving Credit Facility is available for working capital and other general corporate purposes at any time prior to the final maturity thereof. Borrowings under the Revolving Credit Facility are subject to the satisfaction of customary conditions precedent. Amounts repaid under the Revolving Credit Facility may be reborrowed.
The Credit Agreement permits the Company, subject to the satisfaction of certain conditions and obtaining commitments, to add one or more incremental term loan facilities, increase the aggregate commitments under the Revolving Credit Facility or add one or more incremental revolving credit facility tranches in an aggregate amount of up to $200,000, which may have the same guarantees, and be secured on a pari passu basis by the same collateral, as the senior secured term loans and the senior secured revolving credit loans.
The interest rates per annum applicable to loans (other than swing line loans) under the Credit Agreement are, at the Company’s option, equal to either (i) a eurodollar rate for one-, two-, three- six-, or if agreed to by all relevant lenders, nine- or twelve-month interest periods or (ii) an alternate base rate, in each case, plus an applicable margin of (x) with respect to loans under the Term B Facility, (A) 2.75% for eurodollar loans and (B) 1.75% for alternate base rate loans, and (y) with respect to loans under the Term A Facility and Revolving Credit Facility, in each case subject to the Company’s leverage ratio, (A) 2.25%-2.50% for eurodollar loans and (B) 1.25%-1.50% for base rate loans. Interest rates per annum applicable to swing line loans are equal to the alternate base rate plus an applicable margin.
The eurodollar rate is determined by reference to the London inter-bank offer rate, which is the settlement rate established for deposits in dollars in the London interbank market for a period equal to the interest period of the loan and the maximum reserve percentages established by the Board of Governors of the United States Federal Reserve to which the lenders are subject. The eurodollar rate includes statutory reserves. The eurodollar rate for loans under the Term B Facility is subject to a floor of 1.25%. The alternate base rate for loans under the Term B Facility is subject to a floor of 2.25%. The alternate base rate is the highest of (i) the prime commercial lender rate published by the Wall Street Journal as the “prime rate”, (ii) the weighted average of rates on overnight Federal funds as published by the Federal Reserve Bank of New York plus one-half of 1% and (iii) the eurodollar rate for a one-month interest period plus 1%. The alternate base rate is subject to a minimum percentage equal to the minimum percentage for the eurodollar rate plus 1%.
The loans under the Term A Facility amortize in quarterly installments of (i) $3,125 each during 2013 and 2014, (ii) $4,687 during 2015, and (iii) $6,250 during 2016 through September 2017, with the balance payable on the fifth anniversary of December 13, 2012. The loans under the Term B Facility amortize in equal quarterly installments of $750 each, with the balance payable on the seventh anniversary of December 13, 2012. The Term B Facility matures on December 13, 2019; provided that the facility will mature in full on May 15, 2018 if the outstanding senior notes of the Company have not been repaid or refinanced in full by such date.
Loans under the Credit Agreement must be prepaid under certain circumstances, including with proceeds from certain future debt issuances, asset sales and a portion of excess cash flow for the applicable fiscal year. Our first excess cash flow calculation will be completed during the first quarter of 2014 for the fiscal year ended December 31, 2013. Loans under the Credit Agreement may be voluntarily prepaid at any time, subject to customary LIBOR breakage costs.
F-25
MedAssets, Inc.
Notes to Consolidated Financial Statements — (Continued)
(in thousands, except share and per share amounts)
All of the Company’s obligations under the Credit Agreement are unconditionally guaranteed by each of the Company’s existing and subsequently acquired or organized wholly-owned restricted subsidiaries, except that the following subsidiaries do not and will not provide guarantees: (a) unrestricted subsidiaries, (b) subsidiaries with tangible assets and revenues each having a value of less than 2.5% of the consolidated tangible assets and consolidated revenues of the Company (provided that all such immaterial subsidiaries, on a consolidated basis, shall not account for more than 5.0% of the consolidated EBITDA of the Company), (c) any subsidiary prohibited by applicable law, rule or regulation from providing a guarantee or which would require governmental (including regulatory) consent or approval or which would result in adverse tax consequences and (d) not-for-profit subsidiaries.
All of the Company’s obligations under the Credit Agreement are secured by substantially all of the Company’s assets and the assets of each guarantor (subject to certain exceptions), including, but not limited to (1) a perfected pledge of all of the equity securities of each direct wholly owned restricted subsidiary of the Company and of each subsidiary guarantor (which pledge, in the case of any foreign subsidiary, is limited to 65% of the equity securities of such foreign subsidiary) and (2) perfected security interests in, and mortgages on, substantially all tangible and intangible personal property and material fee-owned real property of the Company and each subsidiary guarantor (including but not limited to accounts receivable, inventory, equipment, general intangibles (including contract rights), investment property, intellectual property, material fee-owned real property, material intercompany notes and proceeds of the foregoing).
The Credit Agreement contains certain customary negative covenants, including but not limited to, limitations on the incurrence of debt, limitations on liens, limitations on fundamental changes, limitations on asset sales and sale leasebacks, limitations on investments, limitations on dividends or distributions on, or redemptions of, equity interests, limitations on prepayments or redemptions of unsecured or subordinated debt, limitations on negative pledge clauses, limitations on transactions with affiliates and limitations on changes to the Company’s fiscal year. The Credit Agreement also includes maintenance covenants of maximum ratios of consolidated total indebtedness (subject to certain adjustments) to consolidated EBITDA (subject to certain adjustments) and minimum cash interest coverage ratios. The Credit Agreement contains certain customary representations and warranties, affirmative covenants and events of default, including but not limited to payment defaults, breaches of representations and warranties, covenant defaults, cross-defaults to certain indebtedness, certain events of insolvency or bankruptcy, material judgments, certain events under ERISA, actual or asserted failures of any guaranty or security document supporting the Credit Agreement to be in full force and effect and changes of control. The Company was in compliance with these covenants as of December 31, 2012.
Notes Payable
As of December 31, 2012, our long-term notes payable consists of a Term A Facility, a Term B Facility and a revolving credit facility (discussed in greater detail above), each with an outstanding balance of $250,000, $300,000 and $10,000, respectively. We have classified the $10,000 outstanding balance on our revolving credit facility as a long term liability given the maturity date of December 13, 2017. No amounts were drawn on our swing line loan, which resulted in approximately $189,000 of availability under our revolving credit facility inclusive of the swing line (after giving effect to $1,000 of outstanding but undrawn letters of credit on such date) as of December 31, 2012.
During the fiscal year ended December 31, 2012 and prior to our debt refinancing, we made payments on our prior credit facility which included voluntary prepayments on our term loan totaling $55,000 and scheduled principal payments of $4,763. Since we were charged a lower interest rate on any outstanding amount under our prior revolving credit facility as compared to our prior senior term loan facility, in September 2012 we drew
F-26
MedAssets, Inc.
Notes to Consolidated Financial Statements — (Continued)
(in thousands, except share and per share amounts)
$35,000 on our revolving credit facility and made a voluntary prepayment our senior term loan facility. Subsequent to our debt extinguishment, we made a $40,000 payment on our prior revolving credit facility.
The applicable weighted average interest rates (inclusive of the applicable bank margin) on our Term A Facility, Term B Facility and Revolving Credit Facility at December 31, 2012 were 2.81%, 4.00% and 2.81%, respectively.
As of December 31, 2011, our long-term notes payable consists of a senior term loan facility with an outstanding balance of $578,650 and no amounts were drawn on our revolving credit facility, which resulted in approximately $149,000 of availability under our revolving credit facility inclusive of the swing line (after giving effect to $1,000 of outstanding but undrawn letters of credit on such date) as of December 31, 2011. During the fiscal year ended December 31, 2011, we made payments on our term loan which included two voluntary prepayments totaling $50,000 and scheduled principal payments of $6,350. The applicable weighted average interest rate (inclusive of the applicable bank margin) on our senior term loan facility at December 31, 2011 was 5.25%.
Bonds Payable
In November 2010, we closed the offering of an aggregate principal amount of $325,000 of senior notes due 2018 (the “Notes”) in a private placement (the “Notes Offering”). In October 2011, our Notes were registered under the Securities Act of 1933, as amended. The Notes are guaranteed on a senior unsecured basis by each of our existing domestic subsidiaries and each of our future domestic restricted subsidiaries in each case that guarantees our obligations under the credit agreement. Each of the subsidiary guarantors is 100% owned by us; the guarantees by the subsidiary guarantors are full and unconditional; the guarantees by the subsidiary guarantors are joint and several; we have no independent assets or operations; and any subsidiaries of ours other than the subsidiary guarantors are minor. The Notes and the guarantees are senior unsecured obligations of the Company and the subsidiary guarantors, respectively.
The Notes were issued pursuant to an indenture dated as of November 16, 2010 (the “Indenture”) among the Company, its subsidiary guarantors and Wells Fargo Bank, N.A., as trustee. Pursuant to the Indenture, the Notes will mature on November 15, 2018 and bear 8% annual interest. Interest on the Notes is payable semi-annually in arrears on May 15 and November 15 of each year, beginning on May 15, 2011.
The Indenture contains certain customary negative covenants, including but not limited to, limitations on the incurrence of debt, limitations on liens, limitations on consolidations or mergers, limitations on asset sales, limitations on certain restricted payments and limitations on transactions with affiliates. The Indenture does not contain any significant restrictions on the ability of the Company or any subsidiary guarantor to obtain funds from the Company or any other subsidiary guarantor by dividend or loan. The Indenture also contains customary events of default. The Company was in compliance with these covenants as of December 31, 2012.
The Company has the option to redeem all or part of the Notes as follows: (i) at any time prior to November 15, 2013, the Company may at its option redeem up to 35% of the aggregate original principal amount of Notes issued; and (ii) on or after November 15, 2014, the Company may at its option, redeem all or a part of the Notes after the required notification procedures have been performed, at the following redemption prices:
| | | | |
Year | | Percentage | |
2014 | | | 104 | % |
2015 | | | 102 | % |
2016 and thereafter | | | 100 | % |
The Notes also contain a redemption feature that would require the repurchase of 101% of the aggregate principal amount plus accrued and unpaid interest at the option of the holders upon a change in control.
F-27
MedAssets, Inc.
Notes to Consolidated Financial Statements — (Continued)
(in thousands, except share and per share amounts)
As of December 31, 2012, the Company’s 8% senior notes due 2018 were trading at approximately 108.6% of par value (Level 1).
Debt Issuance Costs
As of December 31, 2012, we had approximately $21,073 of debt issuance costs related to our credit agreement and Notes which will be amortized into interest expense generally using the effective interest method until the applicable maturity date. In connection with our debt extinguishment described above, we capitalized approximately $9,777 in new debt issuance costs. For the fiscal year ended December 31, 2012, we recognized $7,390 in interest expense related to the amortization of debt issuance costs. In addition, we expensed $19,987 related to the write-off of the remaining unamortized debt issuance costs due to the extinguishment of our prior credit agreement with Barclays Bank and JP Morgan Securities. This is included in the loss on debt extinguishment line item within our consolidated statements of operations. For the fiscal year ended December 31, 2011, we recognized approximately $7,445 in interest expense related to the amortization of debt issuance costs.
Debt Maturity Table
The following table summarizes our stated debt maturities and scheduled principal repayments as of December 31, 2012:
| | | | | | | | | | | | | | | | | | | | |
Year | | Term A Facility | | | Term B Facility | | | Revolving Credit
Facility | | | Senior Unsecured
Notes | | | Total | |
2013 | | $ | 12,500 | | | $ | 3,000 | | | $ | — | | | $ | — | | | $ | 15,500 | |
2014 | | | 12,500 | | | | 3,000 | | | | — | | | | — | | | | 15,500 | |
2015 | | | 18,750 | | | | 3,000 | | | | — | | | | — | | | | 21,750 | |
2016 | | | 25,000 | | | | 3,000 | | | | — | | | | — | | | | 28,000 | |
2017 | | | 181,250 | | | | 3,000 | | | | 10,000 | | | | — | | | | 194,250 | |
Thereafter | | | — | | | | 285,000 | | | | — | | | | 325,000 | | | | 610,000 | |
| | | | | | | | | | | | | | | | | | | | |
| | $ | 250,000 | | | $ | 300,000 | | | $ | 10,000 | | | $ | 325,000 | | | $ | 885,000 | |
| | | | | | | | | | | | | | | | | | | | |
Total interest paid on our notes and bonds payable during the fiscal years ended December 31, 2012 and 2011 was approximately $58,890 and $61,340, respectively.
Finance Obligation
We entered into a lease agreement for a certain office building in Cape Girardeau, Missouri with an entity owned by the former owner of a company that was acquired in May 2001 (the “Lease Agreement”). Under the terms of the Lease Agreement, we were required to purchase the office building and adjoining retail space on January 7, 2004 for $9,274.
In August 2003, we facilitated the sale of the office building and related retail space under the Lease Agreement. We entered into a new lease with the new owner of the office building and provided a $1,000 letter of credit and eight months of prepaid rent in connection with the new lease. The lease agreement was for ten years. The letter of credit and prepaid rent constitute continuing involvement as defined in GAAP relating to leases, and as such the transaction did not qualify for sale and leaseback accounting. In accordance with the guidance, the Company recorded the transaction as a financing obligation. As such, the book value of the assets and related obligation remain on the Company’s consolidated financial statements. We recorded a $501 commission on the sale of the building as an increase to the corresponding financing obligation. In addition, we deferred $386 in financing costs that will be amortized into expense over the life of the obligation. The amount of
F-28
MedAssets, Inc.
Notes to Consolidated Financial Statements — (Continued)
(in thousands, except share and per share amounts)
the financial obligation decretion for the years ended December 31, 2012 and 2011 was $221 and $191, respectively.
In July 2007, we extended the lease terms of the Lease Agreement an additional four years through July 2017. The terms of the lease extension were substantially similar to that of the original lease term, and our outstanding letter of credit continues to constitute continuing involvement as defined by the guidance previously described. The lease extension effectively increased our outstanding finance obligation and corresponding office building asset by $1,121 at the time of the amendment.
The lease payments on the office building are charged to interest expense in the periods they are due. The lease payments included as interest expense in the accompanying statement of operations for the years ended December 31, 2012, 2011 and 2010 were $676, $665 and $658, respectively.
Rental income and additional interest expense is imputed on the retail space of approximately $438 annually. Both the income and the expense are included in “Other income (expense)” in the accompanying consolidated statement of operations for each of the years ended December 31, 2012, 2011 and 2010 with no effect to net income. Under the Lease Agreement, we are not entitled to actual rental income on the retail space, nor do we have legal title to the building.
When we have no further continuing involvement with the building as defined under GAAP relating to leases, we will remove the net book value of the office building, adjoining retail space, and the related finance obligation and account for the remainder of our payments under the Lease Agreement as an operating lease. Under the Lease Agreement, we will not obtain title to the office building and retail space. Our future commitment is limited to the payments required by the Lease Agreement. At December 31, 2012, the future undiscounted payments under the Lease Agreement aggregate to $3,098.
Future payments of the finance obligation as of December 31, 2012 are as follows:
| | | | |
| | | Obligations
Under
Capital Lease | |
2013 | | $ | 1,114 | |
2014 | | | 1,114 | |
2015 | | | 1,114 | |
2016 | | | 1,114 | |
2017 | | | 8,600 | |
| | | | |
| | | 13,056 | |
Less: Amounts representing interest | | | (3,777 | ) |
| | | | |
Net present value of capital lease obligation | | | 9,279 | |
Less: Amount representing current portion | | | (233 | ) |
| | | | |
Finance obligation, less current portion | | $ | 9,046 | |
| | | | |
8. COMMITMENTS AND CONTINGENCIES
We lease certain office space and office equipment under operating leases. Some of our operating leases include rent escalations, rent holidays, and rent concessions and incentives. However, we recognize lease expense on a straight-line basis over the related minimum lease term utilizing total future minimum lease
F-29
MedAssets, Inc.
Notes to Consolidated Financial Statements — (Continued)
(in thousands, except share and per share amounts)
payments. Future minimum rental payments under operating leases with initial or remaining non-cancelable lease terms of one year or more as of December 31, 2012 are as follows:
| | | | |
| | | Operating
Lease | |
2013 | | $ | 13,439 | |
2014 | | | 13,507 | |
2015 | | | 11,830 | |
2016 | | | 9,209 | |
2017 | | | 8,627 | |
Thereafter | | | 59,123 | |
| | | | |
| | $ | 115,735 | |
| | | | |
In November 2011, we entered into a new lease agreement for approximately 225,000 square feet of office space together with certain surface parking areas in Plano, Texas. The lease term commences on or around March 1, 2013 with an initial term of fifteen years plus an option to extend the lease term for up to ten years. The total estimated rental commitment under the initial term of the lease agreement is approximately $70,000 and is included in the table above.
Rent expense for the years ended December 31, 2012, 2011 and 2010, was approximately $11,060, $18,145 and $8,370, respectively.
Performance Targets
In the ordinary course of contracting with our clients, we may agree to make some or all of our fees contingent upon the client’s achievement of financial improvement targets from the use of our services and software. These contingent fees are not recognized as revenue until the client confirms achievement of the performance targets. We generally receive client acceptance as and when the performance targets are achieved. Prior to client confirmation that a performance target has been achieved, we record invoiced contingent fees as deferred revenue on our consolidated balance sheet. Often, recognition of this revenue occurs in periods subsequent to the recognition of the associated costs.
Legal Proceedings
As of December 31, 2012, we are not presently involved in any legal proceedings, the outcome of which, if determined adversely to us, would have a material adverse effect on our business, operating results or financial condition.
Insurance Settlement
During 2011, we received an insurance settlement of $3,340 relating to a 2006 litigation matter that was covered under an insurance policy in effect at the time. We recorded the insurance settlement in other income in the consolidated statements of operations for the fiscal year ended December 31, 2011 as certain initial costs related to this matter were expensed in other expense in our consolidated statement of operations in the applicable prior period.
9. STOCKHOLDERS’ EQUITY
Preferred Stock
In connection with our initial public offering we amended and restated our Certificate of Incorporation authorizing us to issue 50,000,000 shares of undesignated preferred stock, par value $0.01 per share. The
F-30
MedAssets, Inc.
Notes to Consolidated Financial Statements — (Continued)
(in thousands, except share and per share amounts)
preferred stock may be issued from time to time in one or more series, each series of which would have distinctive designation or title and such number of shares as was fixed by the Board prior to the issuance of any shares thereof. Each such series of preferred stock would have voting powers, full or limited, or no voting powers, and such preferences and relative, participating optional or other special rights and such qualifications, limitations or restrictions thereof, as stated and expressed in the resolution or resolutions providing for the issue of such series of preferred stock. We had no preferred stock issued or outstanding as of December 31, 2012 or 2011.
Common Stock
During 2012, 2011 and 2010, we issued shares of common stock in connection with employee share-based payment arrangements. See Note 10 for further information.
Common Stock Warrants
As of December 31, 2012 and 2011, we had approximately 38,000 warrants outstanding that were exercisable into common stock at a weighted average exercise price of $2.29 with a weighted average remaining life of 0.5 and 1.5 years, respectively.
Repurchase of Common Stock
On August 23, 2011, our Board of Directors authorized a share repurchase program of up to $25,000 of our common stock. The table below shows the amount and cost of shares of common stock we repurchased for the fiscal years ended December 31, 2012 and 2011 under the share repurchase program. The repurchased shares have not been retired and constitute authorized but unissued shares. The share repurchase program expired in August 2012.
| | | | | | | | |
| | | December 31, | |
| | | 2012 | | | 2011 | |
Number of shares repurchased | | | 62,334 | | | | 551,526 | |
Cost of shares repurchased(1) | | $ | 600 | | | $ | 5,306 | |
| (1) | Our share repurchase program required a three-day cash settlement period with our broker. We made purchases during the last three days of December 2011 amounting to 30,000 shares totaling $278, which were settled in January 2012. The cost of these shares is included in other accrued expenses on our Consolidated Balance Sheet as of December 31, 2011. |
10. SHARE-BASED COMPENSATION
As of December 31, 2012, we had restricted common stock, stock-settled stock appreciation rights (or “SSARs”) and common stock option equity awards outstanding under three share-based compensation plans.
The share-based compensation cost related to equity awards that has been charged against income was $10,291, $5,023 and $11,493 for the fiscal years ended December 31, 2012, 2011 and 2010, respectively. The total income tax benefit recognized in the income statement for share based compensation arrangements related to equity awards was $3,853, $1,878 and $4,387 for the fiscal years ended December 31, 2012, 2011 and 2010, respectively. There were no capitalized share-based compensation costs as of December 31, 2012, 2011 or 2010.
F-31
MedAssets, Inc.
Notes to Consolidated Financial Statements — (Continued)
(in thousands, except share and per share amounts)
Total share-based compensation expense (inclusive of restricted common stock, common stock options, and SSARs) for the fiscal years ended December 31, 2012, 2011 and 2010 is reflected in our consolidated statements of operations as noted below:
| | | | | | | | | | | | |
| | | December 31, | |
| | | 2012 | | | 2011 | | | 2010 | |
Cost of revenue | | $ | 2,165 | | | $ | 1,362 | | | $ | 2,722 | |
Product development | | | 181 | | | | 267 | | | | 461 | |
Selling and marketing | | | 1,489 | | | | 559 | | | | 2,476 | |
General and administrative | | | 6,456 | | | | 2,835 | | | | 5,834 | |
| | | | | | | | | | | | |
Total share-based compensation expense | | $ | 10,291 | | | $ | 5,023 | | | $ | 11,493 | |
During 2011, we reversed approximately $6,537 of share-based compensation expense because we did not achieve specific performance criteria relating to certain performance-based restricted stock grants and SSAR grants.
Employee Stock Purchase Plan
In 2010, the Company established the MedAssets, Inc. Employee Stock Purchase Plan (the “ESPP Plan”). Under the ESPP Plan, eligible employees may purchase shares of our common stock at a discounted price through payroll deductions. The price per share of the common stock sold to participating employees will be 95% of the fair market value of such share on the applicable purchase date. The ESPP Plan requires that all stock purchases be held by participants for a period of 18 months from the purchase date. A total of 500,000 shares of our common stock are authorized for purchase under the ESPP Plan. For the fiscal year ended December 31, 2012, we purchased approximately 25,400 shares of our common stock under the ESPP Plan which amounted to approximately $372. For the fiscal year ended December 31, 2011, we purchased approximately 45,600 shares of our common stock under the ESPP Plan which amounted to approximately $545. The ESPP Plan is non-compensatory and, as a result, no compensation expense is recorded in our consolidated statement of operations for the fiscal years ended December 31, 2012, 2011 and 2010.
Equity Incentive Plans
In 2010, the Board approved and the Company’s stockholders adopted the MedAssets, Inc. 2010 Special Stock Incentive Plan (the “Plan”). Under the Plan, the Company may award stock-based incentives to selected eligible persons. The Plan allows for the grant of stock options, which are the right to purchase shares of stock at a fixed price at some time in the future, and other stock-based awards. The Company granted 425,000 SSARs and 185,000 shares of restricted stock pursuant to the Plan. No further equity grants will be issued under the plan.
The purpose of the Plan is to assist the Company in attracting, retaining, motivating, and rewarding certain individuals who have not previously served as employees or directors of the Company or its affiliates and who have become employees of the Company or its affiliates in connection with the Company’s acquisition of the Broadlane Group, and to serve as an inducement to their entering into employment with the Company. The Plan is intended to promote the creation of long-term value for stockholders of the Company by closely aligning the interests of such individuals with those of the stockholders.
In 2008, the Board approved and the Company’s stockholders adopted the MedAssets Inc. Long-Term Performance Incentive Plan (the “2008 Plan”). The 2008 Plan provides for the grant of non-qualified stock options, incentive stock options, restricted stock awards, restricted stock unit awards, performance awards, stock appreciation rights and other stock-based awards. An aggregate of 5,500,000 underlying shares of our common stock were reserved for issuance to the Company’s directors, employees, and others under the 2008 Plan. As of
F-32
MedAssets, Inc.
Notes to Consolidated Financial Statements — (Continued)
(in thousands, except share and per share amounts)
December 31, 2012, we had approximately 2,746,000 shares remaining under our 2008 Plan available for grant (inclusive of the forfeited performance-based awards discussed below). The 2008 Plan was designed to replace and succeed the MedAssets, Inc. 2004 Long-Term Incentive Plan and the 1999 Stock Incentive Plan. Equity awards issued under the 2008 Plan consist of common stock options, restricted stock (both service-based and performance-based), and SSARs (both service-based and performance-based). Terms of the awards issued under the 2008 Plan are as follows:
Equity awards issued under the 2008 Plan generally vest over five years of continuous service and have seven-year contractual terms. Service-based share awards generally vest over one to five years.
Option awards issued under the 2004 Long Term Equity Incentive Plan generally vest based over five years of continuous service and have ten-year contractual terms. Service-based share awards generally vest over three years. We will not issue any additional awards under this plan and all future shares initially issued under this plan that are cancelled or forfeited will be added back to our 2008 plan.
Option awards issued under the 1999 Stock Incentive Plan generally vest based over three to four years of continuous service and have ten-year contractual terms. Service-based share awards generally vest over three years. We will not issue any additional awards under this plan and all future shares initially issued under this plan that are cancelled or forfeited will be added back to our 2008 plan.
Under all plans, our policy is to grant equity awards with an exercise price (or base price in the case of SSARs) equal to the fair market price of our stock on the date of grant.
Management Incentive Plan
In connection with a 2009 management incentive plan, specific vesting criteria were established for certain performance-based equity awards (restricted stock and SSARs) issued to employees based on the achievement of a 15%-25% compounded annual growth rate of diluted adjusted EPS for the three-year period ending December 31, 2011. Service-based SSARs vest 25% annually beginning on December 31, 2009 and our service-based restricted stock vest 100% on December 31, 2012.
As of December 31, 2011, the Company achieved a 15% compounded annual growth rate of diluted adjusted EPS, which resulted in 50% of the performance-based restricted stock being eligible to vest. In addition to achieving the 15% performance target, the grantees must be employed by the Company through December 31, 2012 in order for the restricted stock awards to vest. As a result, approximately 1,411,000 performance-related awards were forfeited. The underlying shares related to these forfeited awards were added back to our 2008 Plan and are available for future grant.
Equity Award Valuation
Under generally accepted accounting principles for stock compensation, we calculate the grant-date estimated fair value of share-based awards using a Black-Scholes valuation model. Determining the estimated fair value of share-based awards is judgmental in nature and involves the use of significant estimates and assumptions, including the expected term of the share-based awards, risk-free interest rates over the vesting period, expected dividend rates, the price volatility of the Company’s shares and forfeiture rates of the awards. The guidance requires forfeitures to be estimated at the time of grant and adjusted, if necessary, in subsequent periods if actual forfeitures differ from those estimates. The forfeiture rate is estimated based on historical and expected experience. We base fair value estimates on assumptions we believe to be reasonable but that are inherently uncertain. Actual future results may differ materially from those estimates.
F-33
MedAssets, Inc.
Notes to Consolidated Financial Statements — (Continued)
(in thousands, except share and per share amounts)
The fair value of each equity award has been estimated as of the date of grant using the Black-Scholes option-pricing model with the following assumptions for the fiscal years ended December 31, 2012, 2011 and 2010:
| | | | | | |
| | | December 31, |
| | | 2012 | | 2011 | | 2010 |
Range of calculated volatility | | 49.3% -51.6% | | 46.5% -49.28% | | 29.6% -44.99% |
Dividend yield | | 0% | | 0% | | 0% |
Range of risk free interest rate | | .62% - .92% | | 0.88% - 2.30% | | 1.37% - 2.44% |
Range of expected term | | 4.0 - 5.0 years | | 4.0 - 5.0 years | | 4.0 - 5.0 years |
Historically, it has not been practicable for us to estimate the expected volatility of our share price required by existing accounting requirements based solely on our own historical stock price volatility (i.e., trading history), given our limited history as a publicly traded company. Beginning in 2013, we expect to have sufficient history as a public company and will estimate the expected volatility of our share price, which may impact our future share-based compensation. In accordance with generally accepted accounting principles for stock compensation, we have estimated grant-date fair value of our shares using a combination of our own trading history and a volatility calculated (“calculated volatility”) from an appropriate industry sector index of comparable entities and using the “simplified method” as prescribed in Staff Accounting Bulletin No. 110, Share-based Payment, to calculate expected term. Dividend payments were not assumed, as we did not anticipate paying a dividend at the dates in which the various option grants occurred during the year. The risk-free rate of return reflects the interest rate offered for zero coupon treasury bonds over the expected term of the options. The expected term of the awards represents the period of time that options granted are expected to be outstanding.
Equity Award Expense Attribution
In general, for equity awards with graded-vesting, compensation cost is recognized using an accelerated method over the vesting or service period and is net of estimated forfeitures. In general, for equity awards with cliff-vesting, compensation cost is recognized using a straight-line method over the vesting or service period and is net of estimated forfeitures. For performance-based equity awards, compensation cost is adjusted each reporting period in which a change in performance achievement is determined and is net of estimated forfeitures. We evaluate the probability of performance achievement each reporting period and, if necessary, adjust share-based compensation expense based on expected performance achievement.
Restricted Common Stock Awards
We have issued restricted common stock awards to employees, our Board and our senior advisory board. During 2012, 2011 and 2010, we issued approximately 438,000, 239,000 shares and 280,000 shares, respectively. During 2012, 2011 and 2010, the weighted-average grant date fair value of each restricted common stock share was $14.00, $15.58 and $19.35, respectively. The fair value of shares vested during the fiscal years ended December 31, 2012, 2011 and 2010 was $10,584, $687 and $340, respectively.
F-34
MedAssets, Inc.
Notes to Consolidated Financial Statements — (Continued)
(in thousands, except share and per share amounts)
A summary of changes in restricted shares during the fiscal year ended December 31, 2012 is as follows:
| | | | | | | | | | | | | | | | | | | | | | | | |
| | | Service-
based
Shares(1) | | | Performance-
based Shares | | | Total
Shares(2) | | | Weighted
Average
Grant
Date Fair
Value | | | Weighted
Average
Remaining
Contractual
Term | | | Aggregate
Intrinsic
Value | |
Non-vested restricted shares outstanding as of January 1, 2012 | | | 613,000 | | | | 243,000 | | | | 856,000 | | | $ | 15.89 | | | | 2 years | | | | | |
Granted | | | 318,000 | | | | 120,000 | | | | 438,000 | | | | 14.00 | | | | | | | | | |
Vested | | | (421,000 | ) | | | (219,000 | ) | | | (640,000 | ) | | | 15.06 | | | | | | | | | |
Forfeited | | | (72,000 | ) | | | (24,000 | ) | | | (96,000 | ) | | | 19.22 | | | | | | | | | |
| | | | | | | | | | | | | | | | | | | | | | | | |
Restricted Shares outstanding as of December 31, 2012 | | | 438,000 | | | | 120,000 | | | | 558,000 | | | $ | 14.78 | | | | 3 years | | | $ | 9,350 | |
| | | | | | | | | | | | | | | | | | | | | | | | |
| (1) | Service-based shares are inclusive of certain restricted stock awards issued pursuant to the MedAssets, Inc. 2010 Special Stock Incentive Plan (the “Plan”). The Plan was adopted by the Company’s Board of Directors on November 23, 2010 in connection with the Broadlane Acquisition pursuant to an exception to the requirement for stockholder approval under NASDAQ rules; |
| (2) | During the year, we received approximately 168,000 restricted shares that were surrendered from equity award holders to settle their associated tax liability from shares that vested during the year. |
As of December 31, 2012, there was $5,013 of total unrecognized compensation cost related to unvested restricted common stock awards that will be recognized over a weighted average period of 1.7 years.
SSARs
We have issued SSARs to employees, our Board and our senior advisory board. During 2012, 2011 and 2010, we issued approximately 653,000, 926,000 and 1,689,000 SSARs, respectively. During 2012, 2011 and 2010 the weighted-average grant date fair value of each SSAR was $6.07, $6.02 and $7.52, respectively. The fair value of SSARs vested during the fiscal years ended December 31, 2012, 2011 and 2010 was $4,291, $4,080 and $2,322, respectively.
A summary of changes in SSARs during the fiscal year ended December 31, 2012 is as follows:
| | | | | | | | | | | | | | | | | | | | | | | | | | | | |
| | | Service-
based
SSARs(1) | | | Performance-
based SSARs | | | Total
SSARs | | | Weighted
Average
Grant
Date Fair
Value | | | Weighted
Average
Base
Price | | | Weighted
Average
Remaining
Contractual
Term | | | Aggregate
Intrinsic
Value | |
SSARs outstanding as of January 1, 2012 | | | 3,218,000 | | | | 99,000 | | | | 3,317,000 | | | $ | 5.89 | | | $ | 16.44 | | | | 5 years | | | | | |
Granted | | | 573,000 | | | | 80,000 | | | | 653,000 | | | | 6.07 | | | | 14.14 | | | | | | | | | |
Exercised | | | (173,000 | ) | | | — | | | | (173,000 | ) | | | 4.78 | | | | 14.21 | | | | | | | | | |
Forfeited | | | (311,000 | ) | | | (99,000 | ) | | | (410,000 | ) | | | 7.68 | | | | 19.96 | | | | | | | | | |
| | | | | | | | | | | | | | | | | | | | | | | | | | | | |
SSARs outstanding as of December 31, 2012 | | | 3,307,000 | | | | 80,000 | | | | 3,387,000 | | | $ | 6.10 | | | $ | 16.00 | | | | 5 years | | | $ | 5,785 | |
| | | | | | | | | | | | | | | | | | | | | | | | | | | | |
SSARs exercisable as of December 31, 2012 | | | 1,828,000 | | | | | | | | 1,828,000 | | | $ | 5.77 | | | $ | 16.35 | | | | 4 years | | | $ | 2,677 | |
| | | | | | | | | | | | | | | | | | | | | | | | | | | | |
F-35
MedAssets, Inc.
Notes to Consolidated Financial Statements — (Continued)
(in thousands, except share and per share amounts)
| (1) | Service-based SSARs are inclusive of certain SSAR awards issued pursuant to the Plan. The Plan was adopted by the Company’s Board of Directors on November 23, 2010 in connection with the Broadlane Acquisition pursuant to an exception to the requirement for stockholder approval under NASDAQ rules. |
During the fiscal year ended December 31, 2012, we issued approximately 19,000 shares of common stock in connection with exercises of 173,000 SSARs.
During the fiscal year ended December 31, 2011, we issued approximately 1,000 shares of common stock in connection with exercises of 9,000 SSARs.
During the fiscal year ended December 31, 2010, we issued approximately 12,000 shares of common stock in connection with exercises of 61,000 SSARs.
As of December 31, 2012, there was $6,048 of total unrecognized compensation cost related to unvested SSARs that will be recognized over a weighted average period of 1.8 years.
Common Stock Option Awards
During the fiscal years ended December 31, 2012 and 2011, no service-based stock options were issued. During the fiscal year ended December 31, 2010, we granted service-based stock options for the purchase of approximately 102,000 shares. The stock options granted during the fiscal year ended December 31, 2010 have a weighted average exercise price of $21.50 and have a service vesting period of five years.
The exercise price of all stock options described above was equal to the market price of our common stock on the date of grant (or “common stock grant-date fair value”), and therefore the intrinsic value of each option grant was zero. The common stock grant-date fair value of options granted during the fiscal years ended December 31, 2010 represents the market value of our common stock as of the close of market on the grant date.
The weighted-average grant-date fair value of each option granted during the fiscal year ended December 31, 2010 was $6.84.
A summary of changes in outstanding options during the fiscal year ended December 31, 2012 is as follows:
| | | | | | | | | | | | | | | | |
| | | Shares | | | Weighted
Average
Exercise
Price | | | Weighted
Average
Remaining
Contractual
Term | | | Aggregate
Intrinsic
Value | |
Options outstanding as of January 1, 2012 | | | 3,840,000 | | | $ | 10.28 | | | | 5 years | | | | | |
Granted | | | — | | | | — | | | | | | | | | |
Exercised | | | (1,336,000 | ) | | | 7.95 | | | | | | | | | |
Forfeited | | | (162,000 | ) | | | 14.64 | | | | | | | | | |
| | | | | | | | | | | | | | | | |
Options outstanding as of December 31, 2011 | | | 2,342,000 | | | $ | 11.31 | | | | 4 years | | | $ | 14,092 | |
| | | | | | | | | | | | | | | | |
Options exercisable as of December 31, 2012 | | | 2,183,000 | | | $ | 10.77 | | | | 4 years | | | $ | 13,895 | |
| | | | | | | | | | | | | | | | |
The total fair value of stock options vested during the fiscal years ended December 31, 2012, 2011 and 2010 was $2,246, $3,543 and $12,450, respectively.
During the fiscal years ended December 31, 2012, 2011 and 2010, we issued approximately 1,336,000, 373,000 and 1,403,000 shares of common stock, respectively, in connection with employee stock option exercises for aggregate exercise proceeds of $10,618, $2,155 and $10,698, respectively.
F-36
MedAssets, Inc.
Notes to Consolidated Financial Statements — (Continued)
(in thousands, except share and per share amounts)
The total intrinsic value of stock options exercised during the fiscal years ended December 31, 2012, 2011 and 2010 was $10,606, $3,655 and $19,883, respectively. Our policy for issuing shares upon stock option exercise is to issue new shares of common stock.
As of December 31, 2012, there was $287 of total unrecognized compensation cost related to outstanding stock option awards that will be recognized over a weighted average period of 1.2 years.
The following table summarizes the exercise price range, weighted average exercise price, and remaining contractual lives for the number of stock options outstanding as of December 31, 2012, 2011 and 2010:
| | | | | | |
| | | December 31,
2012 | | December 31,
2011 | | December 31,
2010 |
Range of exercise prices | | $1.56 - $23.11 | | $0.63 -$23.11 | | $0.63 - $23.11 |
Number of options outstanding | | 2,342,000 | | 3,840,000 | | 4,567,000 |
Weighted average exercise price | | $11.31 | | $10.28 | | $10.18 |
Weighted average remaining contractual life | | 4.4 years | | 5.2 years | | 5.7 years |
11. INCOME TAXES
The provision for income tax benefit is as follows for the years ended December 31:
| | | | | | | | | | | | |
| | | 2012 | | | 2011 | | | 2010 | |
Current expense | | | | | | | | | | | | |
Federal | | $ | 574 | | | $ | 1,793 | | | $ | 8,903 | |
Foreign | | | — | | | | 15 | | | | 14 | |
State | | | 1,158 | | | | 1,075 | | | | 1,893 | |
| | | | | | | | | | | | |
Total current expense | | | 1,732 | | | | 2,883 | | | | 10,810 | |
Deferred benefit | | | | | | | | | | | | |
Federal | | | (3,110 | ) | | | (10,886 | ) | | | (23,868 | ) |
State | | | (102 | ) | | | (1,848 | ) | | | (1,197 | ) |
| | | | | | | | | | | | |
Total deferred benefit | | | (3,212 | ) | | | (12,734 | ) | | | (25,065 | ) |
| | | | | | | | | | | | |
Provision for income taxes | | $ | (1,480 | ) | | $ | (9,851 | ) | | $ | (14,255 | ) |
| | | | | | | | | | | | |
F-37
MedAssets, Inc.
Notes to Consolidated Financial Statements — (Continued)
(in thousands, except share and per share amounts)
A reconciliation between reported income tax benefit and the amount computed by applying the statutory federal income tax rate of 35 percent is as follows at December 31, 2012, 2011 and 2010:
| | | | | | | | | | | | |
| | | 2012 | | | 2011 | | | 2010 | |
Computed tax benefit | | $ | (2,925 | ) | | $ | (8,871 | ) | | $ | (16,234 | ) |
State taxes (net of federal benefit) | | | 719 | | | | (525 | ) | | | 630 | |
Other permanent items | | | 143 | | | | 190 | | | | 101 | |
Meals & entertainment related to operations | | | 895 | | | | 992 | | | | 795 | |
Domestic production deduction | | | 290 | | | | (284 | ) | | | — | |
Acquisition costs | | | — | | | | (698 | ) | | | 2,036 | |
Research & development credits | | | (196 | ) | | | (477 | ) | | | (2,156 | ) |
Uncertain tax positions | | | (391 | ) | | | 29 | | | | 598 | |
Net operating loss adjustments | | | — | | | | — | | | | 164 | |
Alternative minimum tax | | | — | | | | — | | | | 108 | |
Other | | | (15 | ) | | | (207 | ) | | | (297 | ) |
| | | | | | | | | | | | |
Provision for income taxes | | $ | (1,480 | ) | | $ | (9,851 | ) | | $ | (14,255 | ) |
| | | | | | | | | | | | |
Deferred income taxes reflect the net effect of temporary differences between the carrying amounts of assets and liabilities for financial reporting purposes and the amounts used for income tax purposes. Significant components of the Company’s deferred tax assets and liabilities are as follows at December 31:
| | | | | | | | |
| | | 2012 | | | 2011 | |
Deferred tax asset, current | | | | | | | | |
Accrued expenses | | $ | 4,800 | | | $ | 7,016 | |
Accounts receivable | | | 1,142 | | | | 1,465 | |
Deferred revenue | | | 6,629 | | | | 8,360 | |
Net operating loss carryforwards | | | 4,426 | | | | 850 | |
Returns and allowances | | | 963 | | | | 847 | |
Research and development credit | | | 4,222 | | | | 2,487 | |
| | | | | | | | |
Deferred tax asset, current | | | 22,182 | | | | 21,025 | |
Valuation allowance | | | (921 | ) | | | (877 | ) |
| | | | | | | | |
Total deferred tax asset, current | | | 21,261 | | | | 20,148 | |
Deferred tax liability, current | | | | | | | | |
Prepaid expenses | | | (10,135 | ) | | | (4,714 | ) |
| | | | | | | | |
Total deferred tax liability, current | | | (10,135 | ) | | | (4,714 | ) |
| | | | | | | | |
Net deferred tax asset, current | | $ | 11,126 | | | $ | 15,434 | |
| | | | | | | | |
F-38
MedAssets, Inc.
Notes to Consolidated Financial Statements — (Continued)
(in thousands, except share and per share amounts)
| | | | | | | | |
| | | 2012 | | | 2011 | |
Deferred tax asset, non-current | | | | | | | | |
AMT credit | | $ | 3,838 | | | $ | 2,647 | |
Capital lease | | | 926 | | | | 896 | |
Capital loss limitation | | | 1,016 | | | | 1,017 | |
Debt issuance costs | | | 326 | | | | 719 | |
Deferred compensation | | | 10,712 | | | | 13,360 | |
Deferred revenue | | | 2,210 | | | | 2,787 | |
Financial hedges | | | 79 | | | | 2,506 | |
Net operating loss carryforwards | | | 4,178 | | | | 2,499 | |
Other | | | 42 | | | | 41 | |
| | | | | | | | |
Deferred tax asset, non-current | | | 23,327 | | | | 26,472 | |
Valuation allowance | | | (3,323 | ) | | | (1,906 | ) |
| | | | | | | | |
Total deferred tax asset, non-current | | | 20,004 | | | | 24,566 | |
Deferred tax liability, non-current | | | | | | | | |
Capitalized software costs | | | (32,783 | ) | | | (23,569 | ) |
Fixed assets | | | (5,906 | ) | | | (4,515 | ) |
Intangible assets | | | (106,709 | ) | | | (126,117 | ) |
| | | | | | | | |
Total deferred tax liability, non-current | | | (145,398 | ) | | | (154,201 | ) |
| | | | | | | | |
Net deferred liability, non-current | | $ | (125,394 | ) | | $ | (129,635 | ) |
| | | | | | | | |
We have historically maintained a valuation allowance on certain deferred tax assets, such as capital losses and various state net operating losses. In assessing the ongoing need for a valuation allowance, we consider recent operating results, the expected scheduled reversal of deferred tax liabilities, projected future taxable benefits and tax planning strategies. As a result of this assessment, we recorded a $1,461 increase to our valuation allowance on our state net operating losses for the year ended December 31, 2012.
As of December 31, 2012, we have federal net operating losses of $11,973 (expiring in 2032) and state net operating losses of $112,584 (expiring in 2019 – 2032). In addition, we have federal credits in the amount of $7,558 primarily relating to our research and development (expiring 2019 – 2032).
Cash paid (received) for income taxes amounted to $5,559 and $(2,120) for the years ended December 31, 2012 and 2011, respectively.
We accrued $129 and $35 of net interest expense and penalties for the fiscal year ended December 31, 2012 and December 31, 2011, respectively. During the fiscal year ended December 31, 2010, we accrued $82 of interest and penalties, of which $67 related to the acquisition of Broadlane and was reflected in the purchase price allocation. As of December 31, 2012, the total amount of interest and penalties included on our consolidated balance sheet was $384.
F-39
MedAssets, Inc.
Notes to Consolidated Financial Statements — (Continued)
(in thousands, except share and per share amounts)
A reconciliation of the beginning and ending amount of unrecognized tax benefits is as follows:
| | | | |
Balance at December 31, 2009 | | $ | 534 | |
Additions based on tax positions related to the current year | | | 1,230 | |
Additions for tax positions of prior years | | | 164 | |
Reductions for tax positions of prior years | | | — | |
Settlements and lapse of statue of limitations | | | — | |
| | | | |
Balance at December 31, 2010 | | $ | 1,928 | |
Additions based on tax positions related to the current year | | | 121 | |
Additions for tax positions of prior years | | | 128 | |
Reductions for tax positions of prior years | | | (878 | ) |
Settlements and lapse of statue of limitations | | | — | |
| | | | |
Balance at December 31, 2011 | | $ | 1,299 | |
Additions based on tax positions related to the current year | | | — | |
Additions for tax positions of prior years | | | 50 | |
Reductions for tax positions of prior years | | | — | |
Settlements and lapse of statue of limitations | | | (679 | ) |
| | | | |
Balance at December 31, 2012 | | $ | 670 | |
Included in our unrecognized tax benefits are $417 of uncertain positions that would impact our effective rate if recognized. We do not anticipate any significant changes to our unrecognized tax benefits in the next 12 months.
Our consolidated U.S. federal income tax returns for tax years 1999 to 2011 remain subject to examination by the Internal Revenue Service (or “IRS”) for net operating loss carryforward and credit carryforward purposes. For years 1999 to 2008, the statute for assessments and refunds has generally expired; however, tax attributes for those years may still be examined, which would impact the tax years 2009 and forward.
12. LOSS PER SHARE
We calculate earnings per share (or “EPS”) in accordance with the GAAP relating to earnings per share. Basic EPS is calculated by dividing reported net loss by the weighted-average number of common shares outstanding for the reported period following the two-class method. Diluted EPS reflects the potential dilution that could occur if our stock options, stock settled stock appreciation rights, unvested restricted stock, stock warrants and shares that were purchasable pursuant to our employee stock purchase plan were exercised and converted into our common shares during the reporting periods.
F-40
MedAssets, Inc.
Notes to Consolidated Financial Statements — (Continued)
(in thousands, except share and per share amounts)
The following table is a reconciliation of the denominator for basic and diluted loss per share for the years ended December 31, 2012, 2011 and 2010.
| | | | | | | | | | | | |
| | | Year Ended December 31, | |
| | | 2012 | | | 2011 | | | 2010 | |
Numerator for Basic and Diluted Loss Per Share: | | | | | | | | | | | | |
Net loss | | | (6,878 | ) | | | (15,494 | ) | | | (32,124 | ) |
Denominator for basic loss per share weighted average shares | | | 57,452,000 | | | | 57,298,000 | | | | 56,434,000 | |
Effect of dilutive securities: | | | | | | | | | | | | |
Stock options | | | — | | | | — | | | | — | |
Stock-settled stock appreciation rights | | | — | | | | — | | | | — | |
Restricted stock and stock warrants | | | — | | | | — | | | | — | |
| | | | | | | | | | | | |
Denominator for diluted loss per share - adjusted weighted average shares and assumed conversions | | | 57,452,000 | | | | 57,298,000 | | | | 56,434,000 | |
Basic loss per share: | | | | | | | | | | | | |
Basic net loss from continuing operations | | $ | (0.12 | ) | | $ | (0.27 | ) | | $ | (0.57 | ) |
| | | | | | | | | | | | |
Diluted net loss per share: | | | | | | | | | | | | |
Diluted net loss from continuing operations | | $ | (0.12 | ) | | $ | (0.27 | ) | | $ | (0.57 | ) |
| | | | | | | | | | | | |
During the fiscal years ended December 31, 2012, 2011 and 2010, basic and diluted EPS are the same for each year because potentially dilutive securities have been excluded from the calculation of diluted EPS given our net loss for each year. In addition, the effect of certain dilutive securities have been excluded because the impact is anti-dilutive as a result of certain securities being “out of the money” with strike prices greater than the average market price during the period presented. The following table provides a summary of those potentially dilutive securities that have been excluded from the above calculation of diluted EPS:
| | | | | | | | | | | | |
| | | Year Ended December 31, | |
| | | 2012 | | | 2011 | | | 2010 | |
Stock options | | | 878,000 | | | | 1,140,000 | | | | 2,023,000 | |
Stock-settled stock appreciation rights | | | 38,000 | | | | 5,200 | | | | 290,000 | |
Restricted stock and stock warrants | | | 234,000 | | | | 490,000 | | | | 222,000 | |
| | | | | | | | | | | | |
Total | | | 1,150,000 | | | | 1,635,200 | | | | 2,535,000 | |
13. SEGMENT INFORMATION
We deliver our solutions and manage our business through two reportable business segments, Spend and Clinical Resource Management (or “SCM”) and Revenue Cycle Management (or “RCM”).
Effective January 1, 2011, we realigned our decision support services (“DSS”) under our SCM segment from our RCM segment. We believe that this realignment will help us capitalize on the integration of our products and services, and to better focus on offering data-driven tools and services to help bridge our clients clinical and financial gaps so they can produce higher quality patient outcomes at a lower cost. As a result of this
F-41
MedAssets, Inc.
Notes to Consolidated Financial Statements — (Continued)
(in thousands, except share and per share amounts)
move, our results of operations, management’s discussion and analysis, and other applicable sections herein for periods prior to January 1, 2011 have been recast to reflect this change and DSS is included within our SCM performance analytics offerings in subsequent periods.
| | • | | Spend and Clinical Resource Management. Our SCM segment provides a comprehensive suite of technology-enabled services that help our clients manage their expense categories. Our solutions lower supply and medical device pricing and utilization by managing the procurement process through our group purchasing organization (“GPO”) portfolio of contracts, consulting services and business intelligence tools. |
| | • | | Revenue Cycle Management. Our RCM segment provides a comprehensive suite of software and services spanning the hospital, health system and other ancillary healthcare provider revenue cycle workflow — from patient admission and financial responsibility, patient financial liability estimation, charge capture, case management, contract management and health information management through claims processing and accounts receivable management. Our workflow solutions, together with our data management and business intelligence tools, increase revenue capture and cash collections, reduce accounts receivable balances and increase regulatory compliance. |
GAAP relating to segment reporting, defines reportable segments as components of an enterprise about which separate financial information is available that is evaluated regularly by the chief operating decision maker in deciding how to allocate resources and in assessing financial performance. The guidance indicates that financial information about segments should be reported on the same basis as that which is used by the chief operating decision maker in the analysis of performance and allocation of resources. Management of the Company, including our chief operating decision maker, uses what we refer to as Segment Adjusted EBITDA as its primary measure of profit or loss to assess segment performance and to determine the allocation of resources. We define Segment Adjusted EBITDA as segment net income (loss) before net interest expense, income tax expense (benefit), depreciation and amortization (“EBITDA”) as adjusted for other non-recurring, non-cash or non-operating items. Our chief operating decision maker uses Segment Adjusted EBITDA to facilitate a comparison of our operating performance on a consistent basis from period to period. Segment Adjusted EBITDA includes expenses associated with sales and marketing, general and administrative and product development activities specific to the operation of the segment. General and administrative corporate expenses that are not specific to the segments are not included in the calculation of Segment Adjusted EBITDA. These expenses include the costs to manage our corporate offices, interest expense on our credit facilities and expenses related to being a publicly-held company. All reportable segment revenues are presented net of inter-segment eliminations and represent revenues from external clients.
The following tables present Segment Adjusted EBITDA and financial position information as utilized by our chief operating decision maker. A reconciliation of Segment Adjusted EBITDA to consolidated net income is included. General corporate expenses are included in the “Corporate” column. “RCM” represents the Revenue Cycle Management segment and “SCM” represents the Spend and Clinical Resource Management segment. Other assets and liabilities are included to provide a reconciliation to total assets and total liabilities.
F-42
MedAssets, Inc.
Notes to Consolidated Financial Statements — (Continued)
(in thousands, except share and per share amounts)
The following tables represent our results of operations, by segment, for the fiscal years ended December 31, 2012, 2011 and 2010. The results of operations of Broadlane are included in our SCM segment from the date of acquisition, or November 16, 2010:
| | | | | | | | | | | | | | | | |
| | | Year Ended December 31, 2012 | |
| | | SCM | | | RCM | | | Corporate | | | Total | |
Results of Operations: | | | | | | | | | | | | | | | | |
Revenue: | | | | | | | | | | | | | | | | |
Administrative fees | | $ | 427,698 | | | $ | — | | | $ | — | | | $ | 427,698 | |
Revenue share obligation | | | (160,783 | ) | | | — | | | | — | | | | (160,783 | ) |
Other service fees | | | 126,656 | | | | 246,550 | | | | — | | | | 373,206 | |
| | | | | | | | | | | | | | | | |
Total net revenue | | | 393,571 | | | | 246,550 | | | | — | | | | 640,121 | |
Total operating expenses | | | 295,486 | | | | 214,935 | | | | 44,502 | | | | 554,923 | |
| | | | | | | | | | | | | | | | |
Operating income (loss) | | | 98,085 | | | | 31,615 | | | | (44,502 | ) | | | 85,198 | |
Interest expense | | | — | | | | — | | | | (66,045 | ) | | | (66,045 | ) |
Loss on debt extinguishment | | | — | | | | — | | | | (28,196 | ) | | | (28,196 | ) |
Other (expense) income | | | (13 | ) | | | 157 | | | | 541 | | | | 685 | |
| | | | | | | | | | | | | | | | |
Income (loss) before income taxes | | $ | 98,072 | | | $ | 31,772 | | | $ | (138,202 | ) | | $ | (8,358 | ) |
Income tax expense (benefit) | | | 17,363 | | | | 5,625 | | | | (24,468 | ) | | | (1,480 | ) |
| | | | | | | | | | | | | | | | |
Net income (loss) | | | 80,709 | | | | 26,147 | | | | (113,734 | ) | | | (6,878 | ) |
| | | | | | | | | | | | | | | | |
Segment Adjusted EBITDA | | $ | 176,893 | | | $ | 59,451 | | | $ | (29,006 | ) | | $ | 207,338 | |
| | | | | | | | | | | | | | | | |
| | | As of December 31, 2012 | |
| | | SCM | | | RCM | | | Corporate | | | Total | |
Financial Position: | | | | | | | | | | | | | | | | |
Accounts receivable, net | | $ | 38,845 | | | $ | 56,996 | | | $ | 505 | | | $ | 96,346 | |
Other assets | | | 995,479 | | | | 479,640 | | | | 106,772 | | | | 1,581,891 | |
| | | | | | | | | | | | | | | | |
Total assets | | | 1,034,324 | | | | 536,636 | | | | 107,277 | | | | 1,678,237 | |
Accrued revenue share obligation | | | 74,274 | | | | — | | | | — | | | | 74,274 | |
Deferred revenue | | | 28,229 | | | | 41,920 | | | | — | | | | 70,149 | |
Notes payable | | | — | | | | — | | | | 560,000 | | | | 560,000 | |
Bonds payable | | | — | | | | — | | | | 325,000 | | | | 325,000 | |
Other liabilities | | | 28,354 | | | | 19,453 | | | | 167,384 | | | | 215,191 | |
| | | | | | | | | | | | | | | | |
Total liabilities | | $ | 130,857 | | | $ | 61,373 | | | $ | 1,052,384 | | | $ | 1,244,614 | |
F-43
MedAssets, Inc.
Notes to Consolidated Financial Statements — (Continued)
(in thousands, except share and per share amounts)
| | | | | | | | | | | | | | | | |
| | | Year Ended December 31, 2011 | |
| | | SCM | | | RCM | | | Corporate | | | Total | |
Results of Operations: | | | | | | | | | | | | | | | | |
Revenue: | | | | | | | | | | | | | | | | |
Administrative fees | | $ | 384,560 | | | $ | — | | | $ | — | | | $ | 384,560 | |
Revenue share obligation | | | (134,961 | ) | | | — | | | | — | | | | (134,961 | ) |
Other service fees | | | 114,398 | | | | 214,275 | | | | — | | | | 328,673 | |
| | | | | | | | | | | | | | | | |
Total net revenue | | | 363,997 | | | | 214,275 | | | | — | | | | 578,272 | |
Total operating expenses | | | 304,142 | | | | 193,718 | | | | 38,295 | | | | 536,155 | |
| | | | | | | | | | | | | | | | |
Operating income (loss) | | | 59,855 | | | | 20,557 | | | | (38,295 | ) | | | 42,117 | |
Interest expense | | | — | | | | — | | | | (71,083 | ) | | | (71,083 | ) |
Other income (expense) | | | 73 | | | | (148 | ) | | | 3,696 | | | | 3,621 | |
| | | | | | | | | | | | | | | | |
Income (loss) before income taxes | | $ | 59,928 | | | $ | 20,409 | | | $ | (105,682 | ) | | $ | (25,345 | ) |
Income tax expense (benefit) | | | 23,313 | | | | 7,940 | | | | (41,104 | ) | | | (9,851 | ) |
| | | | | | | | | | | | | | | | |
Net income (loss) | | | 36,615 | | | | 12,469 | | | | (64,578 | ) | | | (15,494 | ) |
| | | | | | | | | | | | | | | | |
Segment Adjusted EBITDA | | $ | 165,672 | | | $ | 49,635 | | | $ | (31,202 | ) | | $ | 184,105 | |
| | | | | | | | | | | | | | | | |
| | | As of December 31, 2011 | |
| | | SCM | | | RCM | | | Corporate | | | Total | |
Financial Position: | | | | | | | | | | | | | | | | |
Accounts receivable, net | | $ | 57,539 | | | $ | 46,272 | | | $ | 228 | | | $ | 104,039 | |
Other assets | | | 1,052,741 | | | | 480,789 | | | | 157,409 | | | | 1,690,939 | |
| | | | | | | | | | | | | | | | |
Total assets | | | 1,110,280 | | | | 527,061 | | | | 157,637 | | | | 1,794,978 | |
Accrued revenue share obligation | | | 70,906 | | | | — | | | | — | | | | 70,906 | |
Deferred revenue | | | 27,484 | | | | 35,123 | | | | — | | | | 62,607 | |
Notes payable | | | — | | | | — | | | | 578,650 | | | | 578,650 | |
Bonds payable | | | — | | | | — | | | | 325,000 | | | | 325,000 | |
Other liabilities | | | 27,107 | | | | 16,472 | | | | 295,623 | | | | 339,202 | |
| | | | | | | | | | | | | | | | |
Total liabilities | | $ | 125,497 | | | $ | 51,595 | | | $ | 1,199,273 | | | $ | 1,376,365 | |
F-44
MedAssets, Inc.
Notes to Consolidated Financial Statements — (Continued)
(in thousands, except share and per share amounts)
| | | | | | | | | | | | | | | | |
| | | Year Ended December 31, 2010 | |
| | | SCM | | | RCM | | | Corporate | | | Total | |
Results of Operations: | | | | | | | | | | | | | | | | |
Revenue: | | | | | | | | | | | | | | | | |
Administrative fees | | $ | 182,024 | | | $ | — | | | $ | — | | | $ | 182,024 | |
Revenue share obligation | | | (62,954 | ) | | | — | | | | — | | | | (62,954 | ) |
Other service fees | | | 58,533 | | | | 213,728 | | | | — | | | | 272,261 | |
| | | | | | | | | | | | | | | | |
Total net revenue | | | 177,603 | | | | 213,728 | | | | — | | | | 391,331 | |
Total operating expenses | | | 180,460 | | | | 182,868 | | | | 47,524 | | | | 410,852 | |
| | | | | | | | | | | | | | | | |
Operating (loss) income | | | (2,857 | ) | | | 30,860 | | | | (47,524 | ) | | | (19,521 | ) |
Interest expense | | | (20 | ) | | | — | | | | (27,488 | ) | | | (27,508 | ) |
Other income | | | 26 | | | | 144 | | | | 480 | | | | 650 | |
| | | | | | | | | | | | | | | | |
(Loss) income before income taxes | | $ | (2,851 | ) | | $ | 31,004 | | | $ | (74,532 | ) | | $ | (46,379 | ) |
Income tax expense (benefit) | | | 17,581 | | | | (5,031 | ) | | | (26,805 | ) | | | (14,255 | ) |
| | | | | | | | | | | | | | | | |
Net (loss) income | | | (20,432 | ) | | | 36,035 | | | | (47,727 | ) | | | (32,124 | ) |
| | | | | | | | | | | | | | | | |
Segment Adjusted EBITDA | | $ | 87,696 | | | $ | 65,891 | | | $ | (25,547 | ) | | $ | 128,040 | |
GAAP relating to segment reporting requires that the total of the reportable segments’ measures of profit or loss be reconciled to the Company’s consolidated operating results. The following table reconciles Segment Adjusted EBITDA to consolidated net income (loss) for each of the fiscal years ended December 31, 2012, 2011 and 2010:
| | | | | | | | | | | | |
| | | Year Ended December 31, | |
| | | 2012 | | | 2011 | | | 2010 | |
SCM Adjusted EBITDA | | $ | 176,893 | | | $ | 165,672 | | | $ | 87,696 | |
RCM Adjusted EBITDA | | | 59,451 | | | | 49,635 | | | | 65,891 | |
| | | | | | | | | | | | |
Total reportable Segment Adjusted EBITDA | | | 236,344 | | | | 215,307 | | | | 153,587 | |
Depreciation | | | (19,991 | ) | | | (16,861 | ) | | | (16,164 | ) |
Depreciation (included in cost of revenue) | | | (1,859 | ) | | | (1,225 | ) | | | (2,894 | ) |
Amortization of intangibles | | | (72,652 | ) | | | (80,510 | ) | | | (31,027 | ) |
Amortization of intangibles (included in cost of revenue) | | | (557 | ) | | | (557 | ) | | | (649 | ) |
Interest expense, net of interest income(1) | | | 4 | | | | 14 | | | | 59 | |
Income tax expense | | | (22,988 | ) | | | (31,253 | ) | | | (12,549 | ) |
Impairment of intangibles(2) | | | — | | | | — | | | | (46,026 | ) |
Share-based compensation expense(3) | | | (5,097 | ) | | | (3,193 | ) | | | (6,491 | ) |
Purchase accounting adjustments(4) | | | — | | | | (6,245 | ) | | | (13,406 | ) |
RCM management restructuring expenses(5) | | | — | | | | (1,646 | ) | | | — | |
Acquisition and integration-related expenses(6) | | | (6,348 | ) | | | (24,747 | ) | | | (8,837 | ) |
| | | | | | | | | | | | |
Total reportable segment net income | | | 106,856 | | | | 49,084 | | | | 15,603 | |
Corporate net loss | | | (113,734 | ) | | | (64,578 | ) | | | (47,727 | ) |
| | | | | | | | | | | | |
Consolidated net loss | | $ | (6,878 | ) | | $ | (15,494 | ) | | $ | (32,124 | ) |
F-45
MedAssets, Inc.
Notes to Consolidated Financial Statements — (Continued)
(in thousands, except share and per share amounts)
| (1) | Interest income is included in other income (expense) and is not netted against interest expense in our consolidated statements of operations. |
| (2) | The impairment during the fiscal year ended December 31, 2010 primarily consisted of: (i) a $44,495 write-off of goodwill relating to our decision support services operating unit; and (ii) $1,281 relating to an SCM trade name and a customer base intangible asset from prior acquisitions that were deemed to be impaired as part of the product and service offering integration associated with the Broadlane Acquisition. |
| (3) | Represents non-cash share-based compensation to both employees and directors. We believe excluding this non-cash expense allows us to compare our operating performance without regard to the impact of share-based compensation, which varies from period to period based on amount and timing of grants. |
| (4) | Upon acquiring Broadlane, we made certain purchase accounting adjustments that reflect the fair value of administrative fees related to client purchases that occurred prior to November 16, 2010 but were reported to us subsequent to that date. Under our revenue recognition accounting policy, which is in accordance with GAAP, these administrative fees would be ordinarily recorded as revenue when reported to us; however, the acquisition method of accounting requires us to estimate the amount of purchases occurring prior to the transaction date and to record the fair value of the administrative fees to be received from those purchases as an account receivable (as opposed to recognizing revenue when these transactions are reported to us) and recording any corresponding revenue share obligation as a liability. |
For the fiscal year ended December 31, 2011, the $6,245 represents the net amount of: (i) $9,451 in gross administrative fees and $1,582 in other service fees based on vendor reporting received from January 1, 2011 through November 15, 2011 related to purchases made prior to the acquisition date; and (ii) a corresponding revenue share obligation of $4,788.
For the fiscal year ended December 31, 2010, the $13,406 represents the net amount of: (i) $26,791 in gross administrative fees based on vendor reporting received from the acquisition date up through December 31, 2010; and (ii) a corresponding revenue share obligation of $13,385. We may have similar purchase accounting adjustments in future periods if we have any new acquisitions.
| (5) | Amount represents restructuring costs consisting of severance that resulted from certain management changes within our RCM segment. |
| (6) | For the fiscal years ended December 31, 2012 and 2011, the amount was attributable to integration and restructuring-type costs associated with the Broadlane Acquisition, such as severance, retention, certain performance-related salary-based compensation, and operating infrastructure costs. For the fiscal year ended December 31, 2010, the amount was primarily attributable to $10,396 in transaction costs incurred (not related to the financing) to complete the Broadlane Acquisition such as due diligence, consulting and other related fees; $8,418 for integration and restructuring-type costs associated with the Broadlane Acquisition, such as severance, retention, certain performance-related salary-based compensation, and operating infrastructure costs; and $2,798 was attributable to acquisition-related fees associated with an unsuccessful acquisition attempt. We expect to continue to incur costs in future periods to fully integrate the Broadlane Acquisition, including but not limited to the alignment of service offerings and the standardization of the legacy Broadlane accounting policies to our existing accounting policies and procedures. |
14. DERIVATIVE FINANCIAL INSTRUMENTS
We have interest rate risk relative to the outstanding borrowings under our credit agreement. Loans under the credit agreement bear interest, at the Company’s election, either at the prime rate or the London Interchange Bank Offering Rate (“LIBOR”) plus a percentage point spread based on certain specified financial ratios. The Company’s policy has been to manage interest cost using a mix of fixed and variable rate debt. To manage this risk in a cost efficient manner, we entered into the derivative financial instruments described below.
F-46
MedAssets, Inc.
Notes to Consolidated Financial Statements — (Continued)
(in thousands, except share and per share amounts)
On May 5, 2011, we entered into three separate derivative financial instruments to convert 50% of our variable rate debt to a fixed or maximum rate debt, as required by our previous credit agreement. The derivative instruments consisted of: (i) a 3% LIBOR interest rate cap (exclusive of the applicable bank margin charged by our lenders) on a $317,500 notional amount beginning May 13, 2011 and ending on February 16, 2013; (ii) a forward starting interest rate swap which fixes three-month LIBOR at 2.80% (exclusive of the applicable bank margin charged by our lenders) on a $158,750 notional amount beginning February 19, 2013 and ending February 16, 2015; and (iii) a forward starting interest rate swap which fixes three-month LIBOR at 2.78% (exclusive of the applicable bank margin charged by our lenders) on a $158,750 notional amount beginning February 19, 2013 and ending February 16, 2015.
On December 13, 2012, we terminated our two floating-to-fixed rate LIBOR-based forward starting interest rate swaps, originally entered into on May 5, 2011. The swaps were originally scheduled to fully terminate by February 2015. Such early termination was deemed to be a termination of all future obligations between us and each counterparty. In consideration of the early termination, we paid a total of $8,209 to the counterparties on December 17, 2012. Prior to the termination, the fair values of the swaps were recorded in other long-term liabilities and accumulated other comprehensive loss on our balance sheet. The termination of the swaps resulted in the payment of such liability and the reclassification of the related accumulated other comprehensive loss to current period expense. The result was a charge to expense for the fiscal year ended December 31, 2012 of $8,209 ($5,227 net of tax). We have no assets or liabilities remaining on our Consolidated Balance Sheet with respect to these interest rate swaps as of December 31, 2012.
We have not treated the interest rate cap as a hedging instrument as defined by GAAP for derivatives and hedging. As a result, we will record the fair value adjustment on the interest rate cap through earnings each reporting period. For the fiscal years ended December 31, 2012 and 2011, we recorded a charge to interest expense of approximately $20 and $189, respectively, relating to the decrease in fair value of the interest rate cap.
We determined the fair values of the swaps using Level 2 inputs as defined under GAAP for fair value measurements and disclosures because our valuation techniques included inputs that are considered significantly observable in the market, either directly or indirectly. Our valuation technique assessed each swap by comparing each fixed interest payment, or cash flow, to a hypothetical cash flow utilizing an observable market three-month floating LIBOR rate. Future hypothetical cash flows utilize projected market-based LIBOR rates. Each fixed cash flow and hypothetical cash flow is then discounted to present value utilizing a market observable discount factor for each cash flow. The discount factor fluctuates based on the timing of each future cash flow. The fair value of each swap represents a cumulative total of the differences between the discounted cash flows that are fixed from those that are hypothetical using floating rates.
We considered the creditworthiness of each counterparty of the swaps and believe the performance of the counterparties of the swaps is probable given the size, international presence and past performance of the counterparties under the obligations of the contracts and that the counterparties are not at risk of default (which would change the highly effective status of the hedged instruments). We also assessed the Company’s creditworthiness and ability to deliver under the terms of the contracts. Given the availability under our revolving credit facility, our historical ability to generate positive cash flow and our expectation for the continuing ability to generate positive cash from operations, we expect to be able to perform all of our obligations under the interest rate swap arrangements.
As of December 31, 2011, our forward starting interest rate swaps were highly effective and, as a result, we did not record any gain or loss from ineffectiveness in our consolidated statements of operations for the fiscal year ended December 31, 2011. As discussed above, our forward starting interest rate swaps were terminated on December 13, 2012.
F-47
MedAssets, Inc.
Notes to Consolidated Financial Statements — (Continued)
(in thousands, except share and per share amounts)
The following table presents the fair value of our outstanding derivative instruments as of December 31, 2012 and 2011:
| | | | | | | | | | |
| | | Balance Sheet Location | | Fair Value of Financial
Instruments | |
| | | | | As of
December
31, 2012 | | | As of
December
31, 2011 | |
Derivative Liabilities | | | | | | | | | | |
Derivatives designated as hedging instruments - interest rate contracts | | Other long term liabilities | | $ | — | | | $ | 6,522 | |
The effects of derivative instruments designated as cash flow hedges on income and AOCI are summarized below:
| | | | | | | | | | | | |
| | | Fiscal Year Ended December 31, | |
| | | 2012 | | | 2011 | | | 2010 | |
Derivatives designated as cash flow hedges | | | | | | | | | | | | |
Total unrealized loss recognized in other comprehensive income - interest rate contracts | | $ | (1,166 | ) | | $ | (4,061 | ) | | $ | 578 | |
Total realized loss reclassified into earnings - interest rate contracts | | $ | 5,227 | | | | — | | | $ | 1,027 | |
15. FAIR VALUE MEASUREMENTS
We measure fair value for financial instruments, such as derivatives and non-financial assets, when a valuation is necessary, such as for impairment of long-lived and indefinite-lived assets when indicators of impairment exist in accordance with GAAP for fair value measurements and disclosures. This defines fair value, establishes a framework for measuring fair value and enhances disclosures about fair value measures required under other accounting pronouncements, but does not change existing guidance as to whether or not an instrument is carried at fair value.
Refer to Note 14 for information and fair values of our derivative instruments measured on a recurring basis under GAAP for fair value measurements and disclosures.
In estimating our fair value disclosures for financial instruments, we use the following methods and assumptions:
| | • | | Cash and cash equivalents. The carrying value reported in the consolidated balance sheets for these items approximates fair value due to the high credit standing of the financial institutions holding these items and their liquid nature; |
| | • | | Accounts receivable, net: The carrying value reported in the consolidated balance sheets is net of allowances for doubtful accounts which includes a degree of counterparty non-performance risk; |
| | • | | Accounts payable and current liabilities: The carrying value reported in the consolidated balance sheets for these items approximates fair value, which is the likely amount for which the liability with short settlement periods would be transferred to a market participant with a similar credit standing as the Company; |
| | • | | Notes payable: The carrying value of our long-term notes payable reported in the consolidated balance sheets approximates fair value since they bear interest at variable rates. Refer to Note 7 for further information; and |
| | • | | Bonds payable: The carrying value of our long-term bonds payable reported in the consolidated balance sheets approximates fair value. Refer to Note 7 for further information. |
F-48
MedAssets, Inc.
Notes to Consolidated Financial Statements — (Continued)
(in thousands, except share and per share amounts)
16. VALUATION AND QUALIFYING ACCOUNTS
We maintain an allowance for doubtful accounts that is recorded as a contra asset to our accounts receivable balance; a sales return reserve and client allowance that is recorded as a contra revenue account; and, a self-insurance accrual related to the medical and dental insurance provided to our employees. The following table sets forth the change in each of those reserves for the years ended December 31, 2012, 2011, and 2010.
Valuation and Qualifying Accounts
| | | | | | | | | | | | | | | | |
| | | Balance at
Beginning
of Year | | | Charged to
Bad Debt(1) | | | Writeoffs
Net of
Recoveries(2) | | | Balance at
End of
Year | |
Allowance for Doubtful Accounts | | | | | | | | | | | | | | | | |
Year ended December 31, 2012 | | $ | 3,891 | | | $ | 735 | | | $ | (1,580 | ) | | $ | 3,046 | |
Year ended December 31, 2011 | | | 5,256 | | | | 181 | | | | (1,546 | ) | | | 3,891 | |
Year ended December 31, 2010 | | | 4,189 | | | | 1,686 | | | | (619 | ) | | | 5,256 | |
| (1) | Additions to the allowance account through the normal course of business are charged to expense. |
| (2) | Write-offs reduce the balance of accounts receivable and the related allowance for doubtful accounts indicating management’s belief that specific balances are not recoverable. |
| | | | | | | | | | | | | | | | |
| | | Balance at
Beginning
of Year | | | Charged to
Net Revenue(1) | | | Writeoffs(2) | | | Balance at
End of
Year | |
Client Allowance and Return Reserve | | | | | | | | | | | | | | | | |
Year ended December 31, 2012 | | $ | 2,129 | | | $ | 2,126 | | | $ | (1,496 | ) | | $ | 2,759 | |
Year ended December 31, 2011 | | | 1,243 | | | | 4,573 | | | | (3,687 | ) | | | 2,129 | |
Year ended December 31, 2010 | | | 462 | | | | 847 | | | | (66 | ) | | | 1,243 | |
| (1) | Includes client service allowance and sales returns. Additions to the allowance through the normal course of business reduce net revenue. |
| (2) | Write-offs reduce the balance of the client allowance and return reserve. |
| | | | | | | | | | | | | | | | |
| | | Balance at
Beginning
of Year | | | Charged to
expense(2) | | | Claims
Payments(3) | | | Balance at
End of
Year | |
Self Insurance Accrual(1) | | | | | | | | | | | | | | | | |
Year ended December 31, 2012 | | $ | 2,966 | | | $ | 25,505 | | | $ | (25,850 | ) | | $ | 2,621 | |
Year ended December 31, 2011 | | | 2,066 | | | | 22,347 | | | | (21,447 | ) | | | 2,966 | |
Year ended December 31, 2010 | | | 1,538 | | | | 13,317 | | | | (12,789 | ) | | | 2,066 | |
| (1) | We have a self insurance policy to cover our employees’ medical and dental insurance. |
| (2) | Estimates of insurance claims expected to be incurred through the normal course of business are charged to expense. |
| (3) | Actual insurance claims payments reduce the self insurance accrual. |
F-49
MedAssets, Inc.
Notes to Consolidated Financial Statements — (Continued)
(in thousands, except share and per share amounts)
17. QUARTERLY FINANCIAL INFORMATION (UNAUDITED)
Unaudited summarized financial data by quarter for the years ended December 31, 2012 and 2011 is as follows:
| | | | | | | | | | | | | | | | |
| | | First
Quarter | | | Second
Quarter | | | Third
Quarter | | | Fourth
Quarter | |
Fiscal 2012 | | | | | | | | | | | | | | | | |
Net revenue | | $ | 149,890 | | | $ | 163,010 | | | $ | 163,441 | | | $ | 163,780 | |
Gross profit | | | 118,607 | | | | 128,280 | | | | 128,871 | | | | 125,745 | |
Net (loss) income | | | (239 | ) | | | 2,251 | | | | 5,464 | | | | (14,354 | ) |
Net (loss) income per basic share | | $ | 0.00 | | | $ | 0.04 | | | $ | 0.09 | | | $ | (0.25 | ) |
| | | | | | | | | | | | | | | | |
Net (loss) income per diluted share | | $ | 0.00 | | | $ | 0.04 | | | $ | 0.09 | | | $ | (0.25 | ) |
| | | | | | | | | | | | | | | | |
| | | | | | | | | | | | | | | | |
| | | First
Quarter | | | Second
Quarter | | | Third
Quarter | | | Fourth
Quarter | |
Fiscal 2011 | | | | | | | | | | | | | | | | |
Net revenue | | $ | 130,559 | | | $ | 147,374 | | | $ | 143,558 | | | $ | 156,781 | |
Gross profit | | | 100,004 | | | | 116,886 | | | | 114,030 | | | | 125,581 | |
Net (loss) income | | | (16,170 | ) | | | (2,488 | ) | | | (983 | ) | | | 4,147 | |
Net (loss) income per basic share | | $ | (0.28 | ) | | $ | (0.04 | ) | | $ | (0.02 | ) | | $ | 0.07 | |
| | | | | | | | | | | | | | | | |
Net (loss) income per diluted share | | $ | (0.28 | ) | | $ | (0.04 | ) | | $ | (0.02 | ) | | $ | 0.07 | |
| | | | | | | | | | | | | | | | |
18. RELATED PARTY TRANSACTION
We have an agreement with John Bardis, our chief executive officer, for the use of an airplane owned by JJB Aviation, LLC, a limited liability company, owned by Mr. Bardis. We pay Mr. Bardis at market-based rates for the use of the airplane for business purposes. The audit committee of the board of directors reviews such usage of the airplane annually. During the fiscal years ended December 31, 2012, 2011 and 2010, we incurred charges of $1,861, $2,191 and $1,913, respectively, related to transactions with Mr. Bardis.
19. SUBSEQUENT EVENTS
We have evaluated subsequent events for recognition or disclosure in the consolidated financial statements filed on Form 10-K with the SEC and no events have occurred that require disclosure.
F-50