Exhibit 99.2
Established. Focused. Trusted. Third Quarter 2012 Supplemental Financial Report
Index to Supplemental Information Page Company Information 2 Highlights 3 Quarterly Financial Results and Measures 4 Net Operating Income (NOI) Same-Property Analysis 6 Consolidated Balance Sheets 7 Total Capitalization and Selected Ratios 8 Debt Schedules 9 Portfolio Summary 13 Acquisitions and Dispositions 14 Development and Redevelopment 15 Net Asset Value Analysis 16 Investment in Joint Ventures 17 Leasing and Occupancy Summary 18 Top Twenty-Five Tenants 19 Portfolio Analysis 20 Market Concentration 21 Leasing Analysis 22 Lease Expirations 26 Portfolio by Size 29 Washington, DC Region 30 Maryland Region 33 Northern Virginia Region 36 Southern Virginia Region 39 Management Statements on Non-GAAP Supplemental Measures 42 Quarterly Supplemental Disclosure – September 30, 2012 1
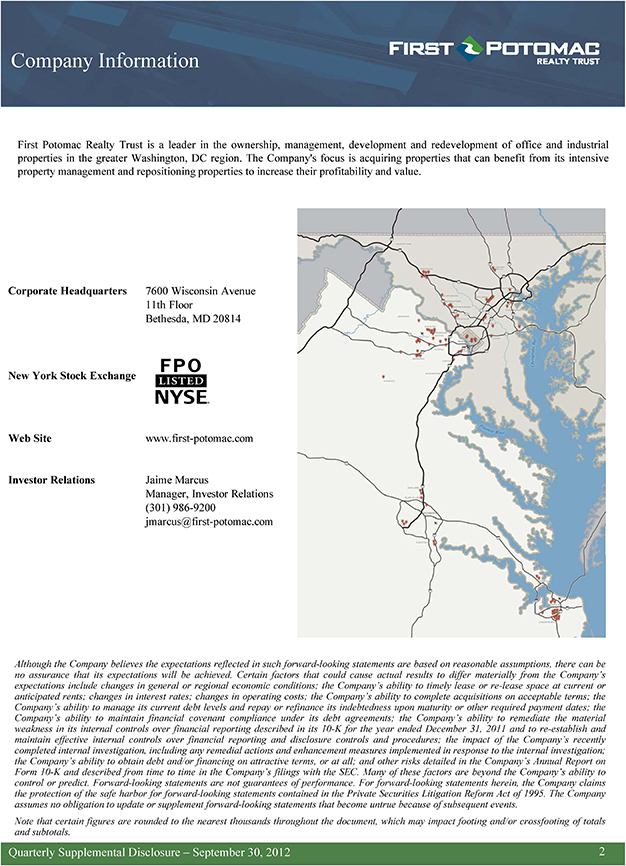
Company Information First Potomac Realty Trust is a leader in the ownership, management, development and redevelopment of office and industrial properties in the greater Washington, DC region. The Company’s focus is acquiring properties that can benefit from its intensive property management and repositioning properties to increase their profitability and value. Corporate Headquarters 7600 Wisconsin Avenue 11th Floor Bethesda, MD 20814 New York Stock Exchange Web Site www.first-potomac.com Investor Relations Jaime Marcus Manager, Investor Relations (301) 986-9200 jmarcus@first-potomac.com Although the Company believes the expectations reflected in such forward-looking statements are based on reasonable assumptions, there can be no assurance that its expectations will be achieved. Certain factors that could cause actual results to differ materially from the Company’s expectations include changes in general or regional economic conditions; the Company’s ability to timely lease or re-lease space at current or anticipated rents; changes in interest rates; changes in operating costs; the Company’s ability to complete acquisitions on acceptable terms; the Company’s ability to manage its current debt levels and repay or refinance its indebtedness upon maturity or other required payment dates; the Company’s ability to maintain financial covenant compliance under its debt agreements; the Company’s ability to remediate the material weakness in its internal controls over financial reporting described in its 10-K for the year ended December 31, 2011 and to re-establish and maintain effective internal controls over financial reporting and disclosure controls and procedures; the impact of the Company’s recently completed internal investigation, including any remedial actions and enhancement measures implemented in response to the internal investigation; the Company’s ability to obtain debt and/or financing on attractive terms, or at all; and other risks detailed in the Company’s Annual Report on Form 10-K and described from time to time in the Company’s filings with the SEC. Many of these factors are beyond the Company’s ability to control or predict. Forward-looking statements are not guarantees of performance. For forward-looking statements herein, the Company claims the protection of the safe harbor for forward-looking statements contained in the Private Securities Litigation Reform Act of 1995. The Company assumes no obligation to update or supplement forward-looking statements that become untrue because of subsequent events. Note that certain figures are rounded to the nearest thousands throughout the document, which may impact footing and/or crossfooting of totals and subtotals. Quarterly Supplemental Disclosure – September 30, 2012 2
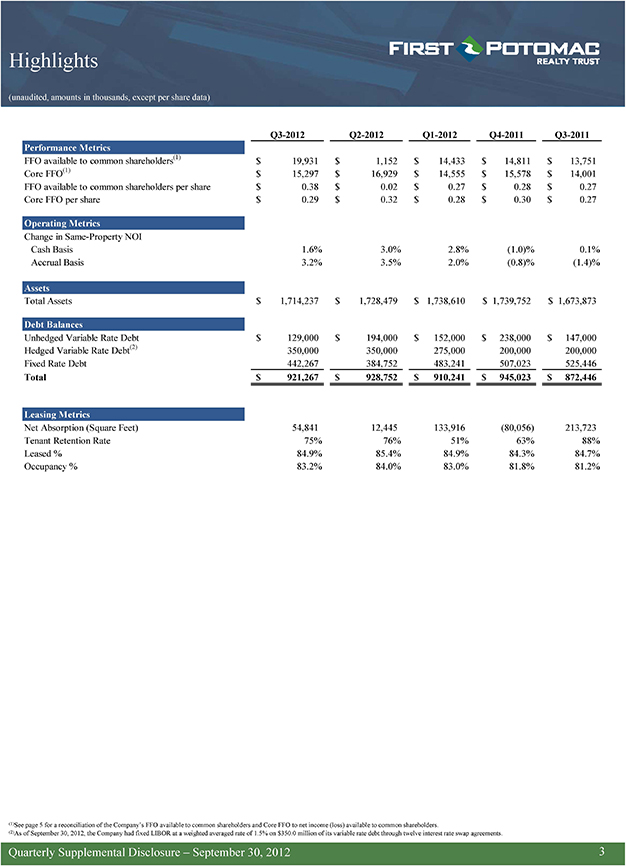
Highlights (unaudited, amounts in thousands, except per share data) Q3-2012 Q2-2012 Q1-2012 Q4-2011 Q3-2011 Performance Metrics FFO available to common shareholders(1) $ 19,931 $ 1,152 $ 14,433 $ 14,811 $ 13,751 Core FFO(1) $ 15,297 $ 16,929 $ 14,555 $ 15,578 $ 14,001 FFO available to common shareholders per share $ 0.38 $ 0.02 $ 0.27 $ 0.28 $ 0.27 Core FFO per share $ 0.29 $ 0.32 $ 0.28 $ 0.30 $ 0.27 Operating Metrics Change in Same-Property NOI Cash Basis 1.6% 3.0% 2.8% (1.0)% 0.1% Accrual Basis 3.2% 3.5% 2.0% (0.8)% (1.4)% Assets Total Assets $ 1,714,237 $ 1,728,479 $ 1,738,610 $ 1,739,752 $ 1,673,873 Debt Balances Unhedged Variable Rate Debt $ 129,000 $ 194,000 $ 152,000 $ 238,000 $ 147,000 Hedged Variable Rate Debt(2) 350,000 350,000 275,000 200,000 200,000 Fixed Rate Debt 442,267 384,752 483,241 507,023 525,446 Total $ 921,267 $ 928,752 $ 910,241 $ 945,023 $ 872,446 Leasing Metrics Net Absorption (Square Feet) 54,841 12,445 133,916 (80,056) 213,723 Tenant Retention Rate 75% 76% 51% 63% 88% Leased % 84.9% 85.4% 84.9% 84.3% 84.7% Occupancy % 83.2% 84.0% 83.0% 81.8% 81.2% (1)See page 5 for a reconciliation of the Company’s FFO available to common shareholders and Core FFO to net income (loss) available to common shareholders. (2)As of September 30, 2012, the Company had fixed LIBOR at a weighted averaged rate of 1.5% on $350.0 million of its variable rate debt through twelve interest rate swap agreements. Quarterly Supplemental Disclosure – September 30, 2012 3
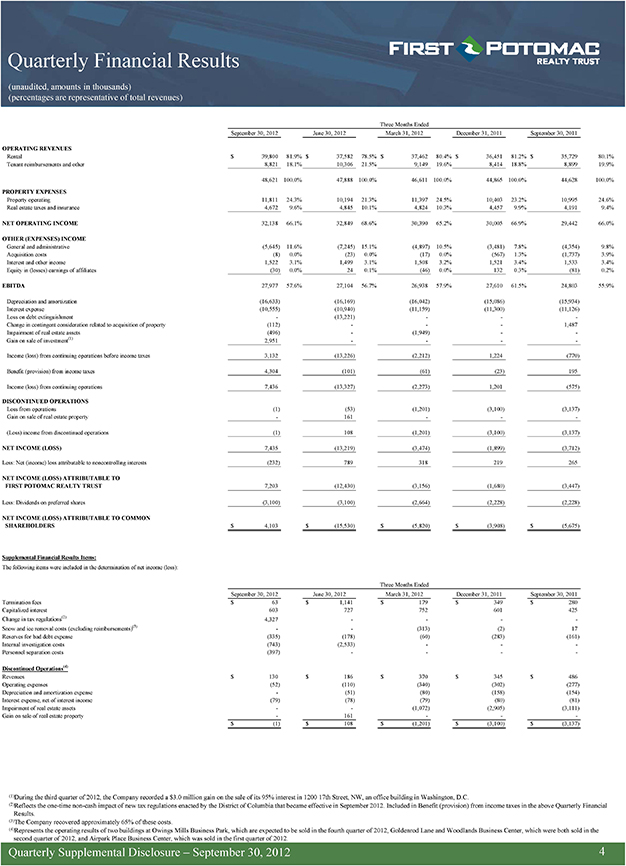
Quarterly Financial Results (unaudited, amounts in thousands) (percentages are representative of total revenues) Three Months Ended September 30, 2012 June 30, 2012 March 31, 2012 December 31, 2011 September 30, 2011 OPERATING REVENUES Rental $ 39,800 81.9% $ 37,582 78.5% $ 37,462 80.4% $ 36,451 81.2% $ 35,729 80.1% Tenant reimbursements and other 8,821 18.1% 10,306 21.5% 9,149 19.6% 8,414 18.8% 8,899 19.9% 48,621 100.0% 47,888 100.0% 46,611 100.0% 44,865 100.0% 44,628 100.0% PROPERTY EXPENSES Property operating 11,811 24.3% 10,194 21.3% 11,397 24.5% 10,403 23.2% 10,995 24.6% Real estate taxes and insurance 4,672 9.6% 4,845 10.1% 4,824 10.3% 4,457 9.9% 4,191 9.4% NET OPERATING INCOME 32,138 66.1% 32,849 68.6% 30,390 65.2% 30,005 66.9% 29,442 66.0% OTHER (EXPENSES) INCOME General and administrative (5,645) 11.6% (7,245) 15.1% (4,897) 10.5% (3,481) 7.8% (4,354) 9.8% Acquisition costs (8) 0.0% (23) 0.0% (17) 0.0% (567) 1.3% (1,737) 3.9% Interest and other income 1,522 3.1% 1,499 3.1% 1,508 3.2% 1,521 3.4% 1,533 3.4% Equity in (losses) earnings of affiliates (30) 0.0% 24 0.1% (46) 0.0% 132 0.3% (81) 0.2% EBITDA 27,977 57.6% 27,104 56.7% 26,938 57.9% 27,610 61.5% 24,803 55.9% Depreciation and amortization (16,633) (16,169) (16,042) (15,086) (15,934) Interest expense (10,555) (10,940) (11,159) (11,300) (11,126) Loss on debt extinguishment—(13,221)——Change in contingent consideration related to acquisition of property (112)—— 1,487 Impairment of real estate assets (496)—(1,949)—-Gain on sale of investment(1) 2,951———Income (loss) from continuing operations before income taxes 3,132 (13,226) (2,212) 1,224 (770) Benefit (provision) from income taxes 4,304 (101) (61) (23) 195 Income (loss) from continuing operations 7,436 (13,327) (2,273) 1,201 (575) DISCONTINUED OPERATIONS Loss from operations (1) (53) (1,201) (3,100) (3,137) Gain on sale of real estate property—161—— (Loss) income from discontinued operations (1) 108 (1,201) (3,100) (3,137) NET INCOME (LOSS) 7,435 (13,219) (3,474) (1,899) (3,712) Less: Net (income) loss attributable to noncontrolling interests (232) 789 318 219 265 NET INCOME (LOSS) ATTRIBUTABLE TO FIRST POTOMAC REALTY TRUST 7,203 (12,430) (3,156) (1,680) (3,447) Less: Dividends on preferred shares (3,100) (3,100) (2,664) (2,228) (2,228) NET INCOME (LOSS) ATTRIBUTABLE TO COMMON SHAREHOLDERS $ 4,103 $ (15,530) $ (5,820) $ (3,908) $ (5,675) Supplemental Financial Results Items: The following items were included in the determination of net income (loss): Three Months Ended September 30, 2012 June 30, 2012 March 31, 2012 December 31, 2011 September 30, 2011 Termination fees $ 63 $ 1,141 $ 179 $ 349 $ 280 Capitalized interest 603 727 752 601 425 Change in tax regulations(2) 4,327—— -Snow and ice removal costs (excluding reimbursements)(3)—- (313) (2) 17 Reserves for bad debt expense (335) (178) (60) (283) (161) Internal investigation costs (743) (2,533)——Personnel separation costs (397)———Discontinued Operations(4) Revenues $ 130 $ 186 $ 370 $ 345 $ 486 Operating expenses (52) (110) (340) (302) (277) Depreciation and amortization expense—(51) (80) (158) (154) Interest expense, net of interest income (79) (78) (79) (80) (81) Impairment of real estate assets—- (1,072) (2,905) (3,111) Gain on sale of real estate property—161——$ (1) $ 108 $ (1,201) $ (3,100) $ (3,137) (1)During the third quarter of 2012, the Company recorded a $3.0 million gain on the sale of its 95% interest in 1200 17th Street, NW, an office building in Washington, D.C. (2)Reflects the one-time non-cash impact of new tax regulations enacted by the District of Columbia that became effective in September 2012. Included in Benefit (provision) from income taxes in the above Quarterly Financial Results. (3)The Company recovered approximately 65% of these costs. (4)Represents the operating results of two buildings at Owings Mills Business Park, which are expected to be sold in the fourth quarter of 2012, Goldenrod Lane and Woodlands Business Center, which were both sold in the second quarter of 2012, and Airpark Place Business Center, which was sold in the first quarter of 2012. Quarterly Supplemental Disclosure – September 30, 2012 4
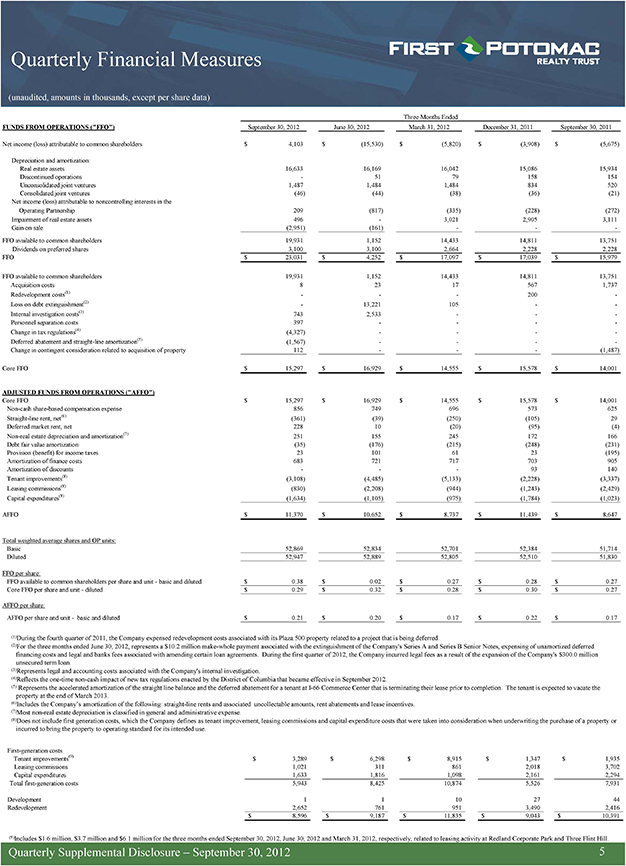
Quarterly Financial Measures (unaudited, amounts in thousands, except per share data) Three Months Ended FUNDS FROM OPERATIONS (“FFO”) September 30, 2012 June 30, 2012 March 31, 2012 December 31, 2011 September 30, 2011 Net income (loss) attributable to common shareholders $ 4,103 $ (15,530) $ (5,820) $ (3,908) $ (5,675) Depreciation and amortization: Real estate assets 16,633 16,169 16,042 15,086 15,934 Discontinued operations—51 79 158 154 Unconsolidated joint ventures 1,487 1,484 1,484 834 520 Consolidated joint ventures (46) (44) (38) (36) (21) Net income (loss) attributable to noncontrolling interests in the Operating Partnership 209 (817) (335) (228) (272) Impairment of real estate assets 496—3,021 2,905 3,111 Gain on sale (2,951) (161)——FFO available to common shareholders 19,931 1,152 14,433 14,811 13,751 Dividends on preferred shares 3,100 3,100 2,664 2,228 2,228 FFO $ 23,031 $ 4,252 $ 17,097 $ 17,039 $ 15,979 FFO available to common shareholders 19,931 1,152 14,433 14,811 13,751 Acquisition costs 8 23 17 567 1,737 Redevelopment costs(1)—— 200—Loss on debt extinguishment(2)—13,221 105—- Internal investigation costs(3) 743 2,533—— Personnel separation costs 397———Change in tax regulations(4) (4,327)———Deferred abatement and straight-line amortization(5) (1,567)———Change in contingent consideration related to acquisition of property 112—— (1,487) Core FFO $ 15,297 $ 16,929 $ 14,555 $ 15,578 $ 14,001 ADJUSTED FUNDS FROM OPERATIONS (“AFFO”) Core FFO $ 15,297 $ 16,929 $ 14,555 $ 15,578 $ 14,001 Non-cash share-based compensation expense 856 749 696 573 625 Straight-line rent, net(6) (361) (39) (250) (105) 29 Deferred market rent, net 228 10 (20) (95) (4) Non-real estate depreciation and amortization(7) 251 155 245 172 166 Debt fair value amortization (35) (176) (215) (248) (231) Provision (benefit) for income taxes 23 101 61 23 (195) Amortization of finance costs 683 721 717 703 905 Amortization of discounts—— 93 140 Tenant improvements(8) (3,108) (4,485) (5,133) (2,228) (3,337) Leasing commissions(8) (830) (2,208) (944) (1,243) (2,429) Capital expenditures(8) (1,634) (1,105) (975) (1,784) (1,023) AFFO $ 11,370 $ 10,652 $ 8,737 $ 11,439 $ 8,647 Total weighted average shares and OP units: Basic 52,869 52,834 52,701 52,384 51,714 Diluted 52,947 52,889 52,805 52,510 51,830 FFO per share: FFO available to common shareholders per share and unit—basic and diluted $ 0.38 $ 0.02 $ 0.27 $ 0.28 $ 0.27 Core FFO per share and unit—diluted $ 0.29 $ 0.32 $ 0.28 $ 0.30 $ 0.27 AFFO per share: AFFO per share and unit—basic and diluted $ 0.21 $ 0.20 $ 0.17 $ 0.22 $ 0.17 (1)During the fourth quarter of 2011, the Company expensed redevelopment costs associated with its Plaza 500 property related to a project that is being deferred. (2)For the three months ended June 30, 2012, represents a $10.2 million make-whole payment associated with the extinguishment of the Company’s Series A and Series B Senior Notes, expensing of unamortized deferred financing costs and legal and banks fees associated with amending certain loan agreements. During the first quarter of 2012, the Company incurred legal fees as a result of the expansion of the Company’s $300.0 million unsecured term loan. (3)Represents legal and accounting costs associated with the Company’s internal investigation. (4)Reflects the one-time non-cash impact of new tax regulations enacted by the District of Columbia that became effective in September 2012. (5) Represents the accelerated amortization of the straight line balance and the deferred abatement for a tenant at I-66 Commerce Center that is terminating their lease prior to completion. The tenant is expected to vacate the property at the end of March 2013. (6)Includes the Company’s amortization of the following: straight-line rents and associated uncollectable amounts, rent abatements and lease incentives. (7)Most non-real estate depreciation is classified in general and administrative expense. (8)Does not include first generation costs, which the Company defines as tenant improvement, leasing commissions and capital expenditure costs that were taken into consideration when underwriting the purchase of a property or incurred to bring the property to operating standard for its intended use. First-generation costs Tenant improvements(9) $ 3,289 $ 6,298 $ 8,915 $ 1,347 $ 1,935 Leasing commissions 1,021 311 861 2,018 3,702 Capital expenditures 1,633 1,816 1,098 2,161 2,294 Total first-generation costs 5,943 8,425 10,874 5,526 7,931 Development 1 1 10 27 44 Redevelopment 2,652 761 951 3,490 2,416 $ 8,596 $ 9,187 $ 11,835 $ 9,043 $ 10,391 (9)Includes $1.6 million, $3.7 million and $6.1 million for the three months ended September 30, 2012, June 30, 2012 and March 31, 2012, respectively, related to leasing activity at Redland Corporate Park and Three Flint Hill. Quarterly Supplemental Disclosure – September 30, 2012 5
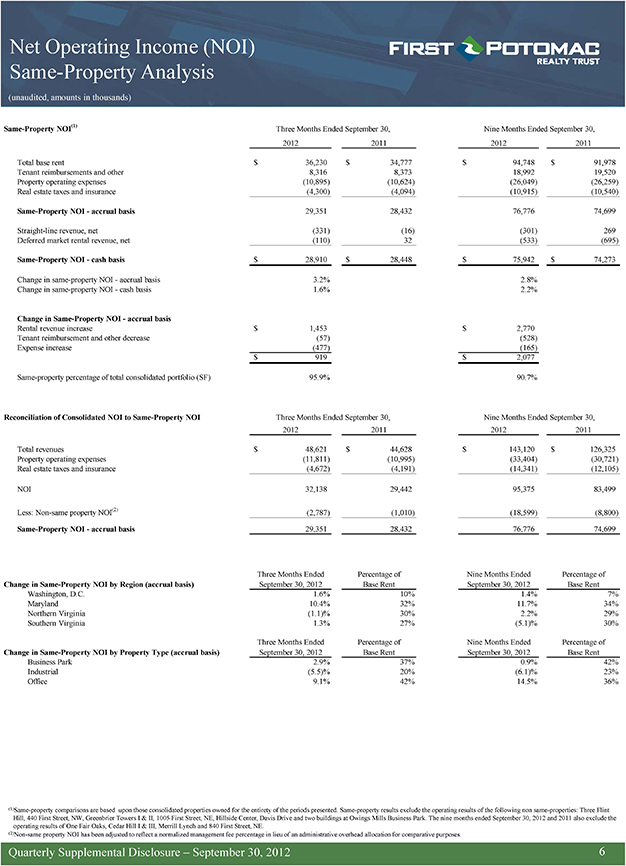
Net Operating Income (NOI) Same-Property Analysis (unaudited, amounts in thousands) Same-Property NOI(1) Three Months Ended September 30, Nine Months Ended September 30, 2012 2011 2012 2011 Total base rent $ 36,230 $ 34,777 $ 94,748 $ 91,978 Tenant reimbursements and other 8,316 8,373 18,992 19,520 Property operating expenses (10,895) (10,624) (26,049) (26,259) Real estate taxes and insurance (4,300) (4,094) (10,915) (10,540) Same-Property NOI—accrual basis 29,351 28,432 76,776 74,699 Straight-line revenue, net (331) (16) (301) 269 Deferred market rental revenue, net (110) 32 (533) (695) Same-Property NOI—cash basis $ 28,910 $ 28,448 $ 75,942 $ 74,273 Change in same-property NOI—accrual basis 3.2% 2.8% Change in same-property NOI—cash basis 1.6% 2.2% Change in Same-Property NOI—accrual basis Rental revenue increase $ 1,453 $ 2,770 Tenant reimbursement and other decrease (57) (528) Expense increase (477) (165) $ 919 $ 2,077 Same-property percentage of total consolidated portfolio (SF) 95.9% 90.7% Reconciliation of Consolidated NOI to Same-Property NOI Three Months Ended September 30, Nine Months Ended September 30, 2012 2011 2012 2011 Total revenues $ 48,621 $ 44,628 $ 143,120 $ 126,325 Property operating expenses (11,811) (10,995) (33,404) (30,721) Real estate taxes and insurance (4,672) (4,191) (14,341) (12,105) NOI 32,138 29,442 95,375 83,499 Less: Non-same property NOI(2) (2,787) (1,010) (18,599) (8,800) Same-Property NOI—accrual basis 29,351 28,432 76,776 74,699 Three Months Ended Percentage of Nine Months Ended Percentage of Change in Same-Property NOI by Region (accrual basis) September 30, 2012 Base Rent September 30, 2012 Base Rent Washington, D.C. 1.6% 10% 1.4% 7% Maryland 10.4% 32% 11.7% 34% Northern Virginia (1.1)% 30% 2.2% 29% Southern Virginia 1.3% 27% (5.1)% 30% Three Months Ended Percentage of Nine Months Ended Percentage of Change in Same-Property NOI by Property Type (accrual basis) September 30, 2012 Base Rent September 30, 2012 Base Rent Business Park 2.9% 37% 0.9% 42% Industrial (5.5)% 20% (6.1)% 23% Office 9.1% 42% 14.5% 36% (1)Same-property comparisons are based upon those consolidated properties owned for the entirety of the periods presented. Same-property results exclude the operating results of the following non same-properties: Three Flint Hill, 440 First Street, NW, Greenbrier Towers I & II, 1005 First Street, NE, Hillside Center, Davis Drive and two buildings at Owings Mills Business Park. The nine months ended September 30, 2012 and 2011 also exclude the operating results of One Fair Oaks, Cedar Hill I & III, Merrill Lynch and 840 First Street, NE. (2)Non-same property NOI has been adjusted to reflect a normalized management fee percentage in lieu of an administrative overhead allocation for comparative purposes. Quarterly Supplemental Disclosure – September 30, 2012 6
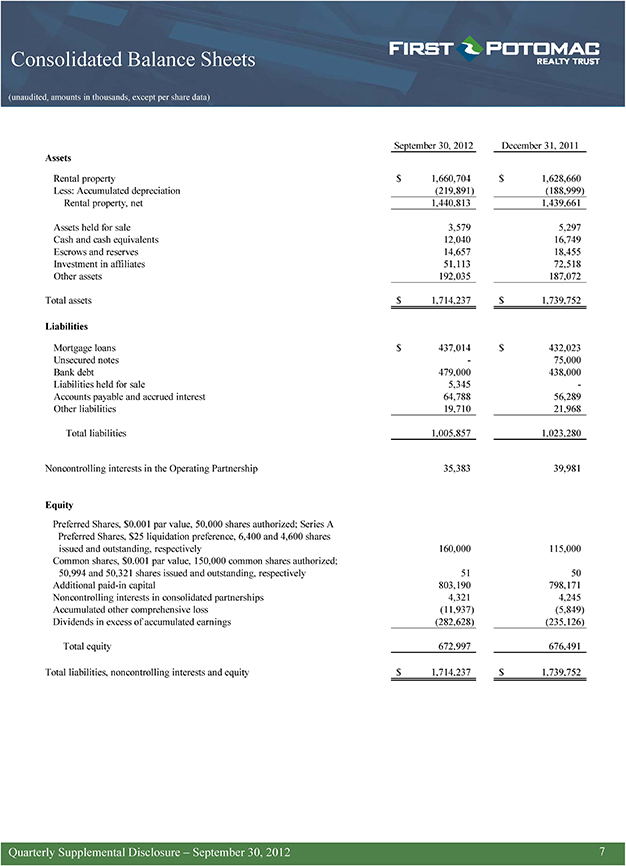
Consolidated Balance Sheets (unaudited, amounts in thousands, except per share data) September 30, 2012 December 31, 2011 Assets Rental property $ 1,660,704 $ 1,628,660 Less: Accumulated depreciation (219,891) (188,999) Rental property, net 1,440,813 1,439,661 Assets held for sale 3,579 5,297 Cash and cash equivalents 12,040 16,749 Escrows and reserves 14,657 18,455 Investment in affiliates 51,113 72,518 Other assets 192,035 187,072 Total assets $ 1,714,237 $ 1,739,752 Mortgage loans $ 437,014 $ 432,023 Unsecured notes—75,000 Bank debt 479,000 438,000 Liabilities held for sale 5,345 -Accounts payable and accrued interest 64,788 56,289 Other liabilities 19,710 21,968 Total liabilities 1,005,857 1,023,280 Noncontrolling interests in the Operating Partnership 35,383 39,981 Equity Preferred Shares, $0.001 par value, 50,000 shares authorized; Series A Preferred Shares, $25 liquidation preference, 6,400 and 4,600 shares issued and outstanding, respectively 160,000 115,000 Common shares, $0.001 par value, 150,000 common shares authorized; 50,994 and 50,321 shares issued and outstanding, respectively 51 50 Additional paid-in capital 803,190 798,171 Noncontrolling interests in consolidated partnerships 4,321 4,245 Accumulated other comprehensive loss (11,937) (5,849) Dividends in excess of accumulated earnings (282,628) (235,126) Total equity 672,997 676,491 Total liabilities, noncontrolling interests and equity $ 1,714,237 $ 1,739,752 Quarterly Supplemental Disclosure – September 30, 2012 7
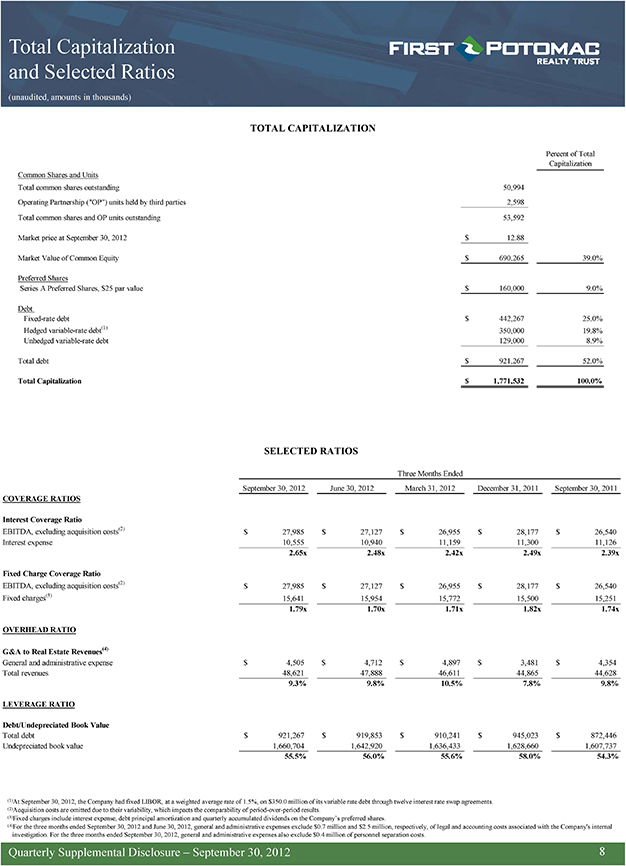
Total Capitalization and Selected Ratios (unaudited, amounts in thousands) TOTAL CAPITALIZATION Percent of Total Capitalization Common Shares and Units Total common shares outstanding 50,994 Operating Partnership (“OP”) units held by third parties 2,598 Total common shares and OP units outstanding 53,592 Market price at September 30, 2012 $ 12.88 Market Value of Common Equity $ 690,265 39.0% Preferred Shares Series A Preferred Shares, $25 par value $ 160,000 9.0% Debt Fixed-rate debt $ 442,267 25.0% Hedged variable-rate debt(1) 350,000 19.8% Unhedged variable-rate debt 129,000 8.9% Total debt $ 921,267 52.0% Total Capitalization $ 1,771,532 100.0% SELECTED RATIOS Three Months Ended September 30, 2012 June 30, 2012 March 31, 2012 December 31, 2011 September 30, 2011 COVERAGE RATIOS Interest Coverage Ratio EBITDA, excluding acquisition costs(2) $ 27,985 $ 27,127 $ 26,955 $ 28,177 $ 26,540 Interest expense 10,555 10,940 11,159 11,300 11,126 2.65x 2.48x 2.42x 2.49x 2.39x Fixed Charge Coverage Ratio EBITDA, excluding acquisition costs(2) $ 27,985 $ 27,127 $ 26,955 $ 28,177 $ 26,540 Fixed charges(3) 15,641 15,954 15,772 15,500 15,251 1.79x 1.70x 1.71x 1.82x 1.74x OVERHEAD RATIO G&A to Real Estate Revenues(4) General and administrative expense $ 4,505 $ 4,712 $ 4,897 $ 3,481 $ 4,354 Total revenues 48,621 47,888 46,611 44,865 44,628 9.3% 9.8% 10.5% 7.8% 9.8% LEVERAGE RATIO Debt/Undepreciated Book Value Total debt $ 921,267 $ 919,853 $ 910,241 $ 945,023 $ 872,446 Undepreciated book value 1,660,704 1,642,920 1,636,433 1,628,660 1,607,737 55.5% 56.0% 55.6% 58.0% 54.3% (1)At September 30, 2012, the Company had fixed LIBOR, at a weighted average rate of 1.5%, on $350.0 million of its variable rate debt through twelve interest rate swap agreements. (2)Acquisition costs are omitted due to their variability, which impacts the comparability of period-over-period results. (3)Fixed charges include interest expense, debt principal amortization and quarterly accumulated dividends on the Company’s preferred shares. (4)For the three months ended September 30, 2012 and June 30, 2012, general and administrative expenses exclude $0.7 million and $2.5 million, respectively, of legal and accounting costs associated with the Company’s internal investigation. For the three months ended September 30, 2012, general and administrative expenses also exclude $0.4 million of personnel separation costs. Quarterly Supplemental Disclosure – September 30, 2012 8
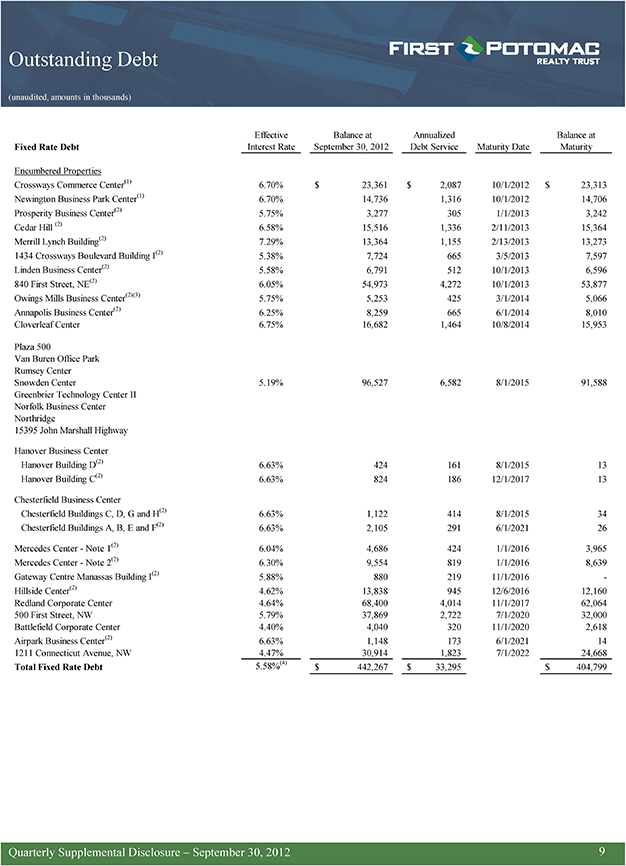
Outstanding Debt (unaudited, amounts in thousands) Effective Balance at Annualized Balance at Fixed Rate Debt Interest Rate September 30, 2012 Debt Service Maturity Date Maturity Encumbered Properties Crossways Commerce Center(1) 6.70% $ 23,361 $ 2,087 10/1/2012 $ 23,313 Newington Business Park Center(1) 6.70% 14,736 1,316 10/1/2012 14,706 Prosperity Business Center(2) 5.75% 3,277 305 1/1/2013 3,242 Cedar Hill (2) 6.58% 15,516 1,336 2/11/2013 15,364 Merrill Lynch Building(2) 7.29% 13,364 1,155 2/13/2013 13,273 1434 Crossways Boulevard Building I(2) 5.38% 7,724 665 3/5/2013 7,597 Linden Business Center(2) 5.58% 6,791 512 10/1/2013 6,596 840 First Street, NE(2) 6.05% 54,973 4,272 10/1/2013 53,877 Owings Mills Business Center(2)(3) 5.75% 5,253 425 3/1/2014 5,066 Annapolis Business Center(2) 6.25% 8,259 665 6/1/2014 8,010 Cloverleaf Center 6.75% 16,682 1,464 10/8/2014 15,953 Plaza 500 Van Buren Office Park Rumsey Center Snowden Center 5.19% 96,527 6,582 8/1/2015 91,588 Greenbrier Technology Center II Norfolk Business Center Northridge 15395 John Marshall Highway Hanover Business Center Hanover Building D(2) 6.63% 424 161 8/1/2015 13 Hanover Building C(2) 6.63% 824 186 12/1/2017 13 Chesterfield Business Center Chesterfield Buildings C, D, G and H(2) 6.63% 1,122 414 8/1/2015 34 Chesterfield Buildings A, B, E and F(2) 6.63% 2,105 291 6/1/2021 26 Mercedes Center—Note 1(2) 6.04% 4,686 424 1/1/2016 3,965 Mercedes Center—Note 2(2) 6.30% 9,554 819 1/1/2016 8,639 Gateway Centre Manassas Building I(2) 5.88% 880 219 11/1/2016 -Hillside Center(2) 4.62% 13,838 945 12/6/2016 12,160 Redland Corporate Center 4.64% 68,400 4,014 11/1/2017 62,064 500 First Street, NW 5.79% 37,869 2,722 7/1/2020 32,000 Battlefield Corporate Center 4.40% 4,040 320 11/1/2020 2,618 Airpark Business Center(2) 6.63% 1,148 173 6/1/2021 14 1211 Connecticut Avenue, NW 4.47% 30,914 1,823 7/1/2022 24,668 Total Fixed Rate Debt 5.58%(4) $ 442,267 $ 33,295 $ 404,799 Quarterly Supplemental Disclosure – September 30, 2012 9
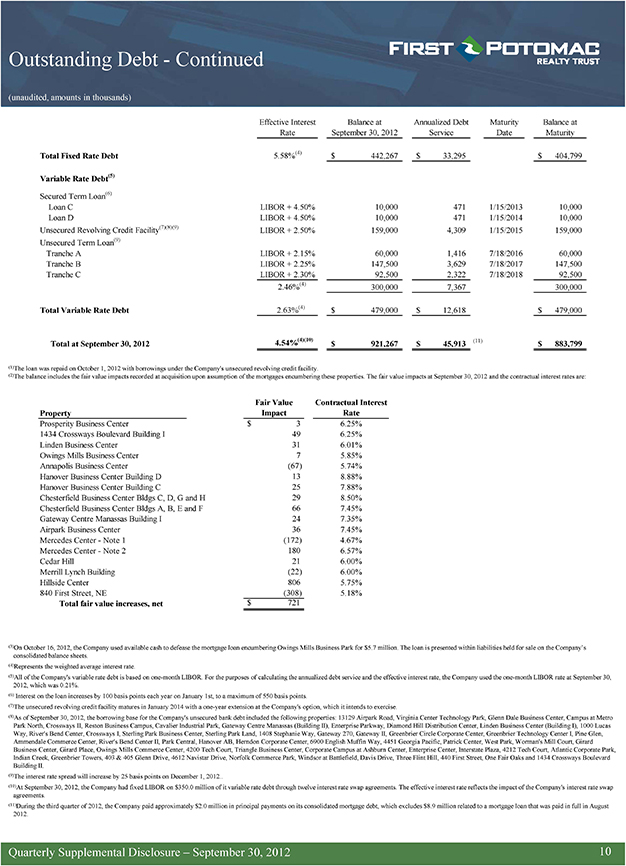
Outstanding Debt—Continued (unaudited, amounts in thousands) Effective Interest Balance at Annualized Debt Maturity Balance at Rate September 30, 2012 Service Date Maturity Total Fixed Rate Debt 5.58%(4) $ 442,267 $ 33,295 $ 404,799 Variable Rate Debt(5) Secured Term Loan(6) Loan C LIBOR + 4.50% 10,000 471 1/15/2013 10,000 Loan D LIBOR + 4.50% 10,000 471 1/15/2014 10,000 Unsecured Revolving Credit Facility(7)(8)(9) LIBOR + 2.50% 159,000 4,309 1/15/2015 159,000 Unsecured Term Loan(9) Tranche A LIBOR + 2.15% 60,000 1,416 7/18/2016 60,000 Tranche B LIBOR + 2.25% 147,500 3,629 7/18/2017 147,500 Tranche C LIBOR + 2.30% 92,500 2,322 7/18/2018 92,500 2.46%(4) 300,000 7,367 300,000 Total Variable Rate Debt 2.63%(4) $ 479,000 $ 12,618 $ 479,000 Total at September 30, 2012 4.54%(4)(10) $ 921,267 $ 45,913 (11) $ 883,799 (1)The loan was repaid on October 1, 2012 with borrowings under the Company’s unsecured revolving credit facility. (2)The balance includes the fair value impacts recorded at acquisition upon assumption of the mortgages encumbering these properties. The fair value impacts at September 30, 2012 and the contractual interest rates are: Fair Value Contractual Interest Property Impact Rate Prosperity Business Center $ 3 6.25% 1434 Crossways Boulevard Building I 49 6.25% Linden Business Center 31 6.01% Owings Mills Business Center 7 5.85% Annapolis Business Center (67) 5.74% Hanover Business Center Building D 13 8.88% Hanover Business Center Building C 25 7.88% Chesterfield Business Center Bldgs C, D, G and H 29 8.50% Chesterfield Business Center Bldgs A, B, E and F 66 7.45% Gateway Centre Manassas Building I 24 7.35% Airpark Business Center 36 7.45% Mercedes Center—Note 1 (172) 4.67% Mercedes Center—Note 2 180 6.57% Cedar Hill 21 6.00% Merrill Lynch Building (22) 6.00% Hillside Center 806 5.75% 840 First Street, NE (308) 5.18% Total fair value increases, net $ 721 (3)On October 16, 2012, the Company used available cash to defease the mortgage loan encumbering Owings Mills Business Park for $5.7 million. The loan is presented within liabilities held for sale on the Company’s consolidated balance sheets. (4)Represents the weighted average interest rate. (5)All of the Company’s variable rate debt is based on one-month LIBOR. For the purposes of calculating the annualized debt service and the effective interest rate, the Company used the one-month LIBOR rate at September 30, 2012, which was 0.21%. (6) Interest on the loan increases by 100 basis points each year on January 1st, to a maximum of 550 basis points. (7)The unsecured revolving credit facility matures in January 2014 with a one-year extension at the Company’s option, which it intends to exercise. (8)As of September 30, 2012, the borrowing base for the Company’s unsecured bank debt included the following properties: 13129 Airpark Road, Virginia Center Technology Park, Glenn Dale Business Center, Campus at Metro Park North, Crossways II, Reston Business Campus, Cavalier Industrial Park, Gateway Centre Manassas (Building II), Enterprise Parkway, Diamond Hill Distribution Center, Linden Business Center (Building I), 1000 Lucas Way, River’s Bend Center, Crossways I, Sterling Park Business Center, Sterling Park Land, 1408 Stephanie Way, Gateway 270, Gateway II, Greenbrier Circle Corporate Center, Greenbrier Technology Center I, Pine Glen, Ammendale Commerce Center, River’s Bend Center II, Park Central, Hanover AB, Herndon Corporate Center, 6900 English Muffin Way, 4451 Georgia Pacific, Patrick Center, West Park, Worman’s Mill Court, Girard Business Center, Girard Place, Owings Mills Commerce Center, 4200 Tech Court, Triangle Business Center, Corporate Campus at Ashburn Center, Enterprise Center, Interstate Plaza, 4212 Tech Court, Atlantic Corporate Park, Indian Creek, Greenbrier Towers, 403 & 405 Glenn Drive, 4612 Navistar Drive, Norfolk Commerce Park, Windsor at Battlefield, Davis Drive, Three Flint Hill, 440 First Street, One Fair Oaks and 1434 Crossways Boulevard Building II. (9)The interest rate spread will increase by 25 basis points on December 1, 2012 (10)At September 30, 2012, the Company had fixed LIBOR on $350.0 million of it variable rate debt through twelve interest rate swap agreements. The effective interest rate reflects the impact of the Company’s interest rate swap agreements. (11)During the third quarter of 2012, the Company paid approximately $2.0 million in principal payments on its consolidated mortgage debt, which excludes $8.9 million related to a mortgage loan that was paid in full in August 2012. Quarterly Supplemental Disclosure – September 30, 2012 10
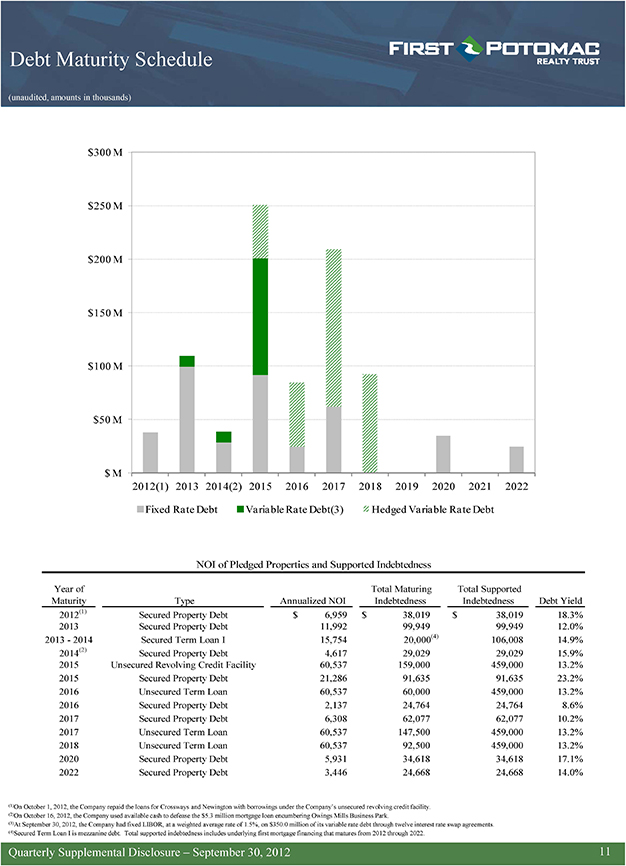
Debt Maturity Schedule (unaudited, amounts in thousands) $300 M $250 M $200 M $150 M $100 M $50 M $ M 2012(1) 2013 2014(2) 2015 2016 2017 2018 2019 2020 2021 2022 Fixed Rate Debt Variable Rate Debt(3) Hedged Variable Rate Debt NOI of Pledged Properties and Supported Indebtedness Year of Total Maturing Total Supported Maturity Type Annualized NOI Indebtedness Indebtedness Debt Yield 2012(1) Secured Property Debt $ 6,959 $ 38,019 $ 38,019 18.3% 2013 Secured Property Debt 11,992 99,949 99,949 12.0% 2013—2014 Secured Term Loan I 15,754 20,000(4) 106,008 14.9% 2014(2) Secured Property Debt 4,617 29,029 29,029 15.9% 2015 Unsecured Revolving Credit Facility 60,537 159,000 459,000 13.2% 2015 Secured Property Debt 21,286 91,635 91,635 23.2% 2016 Unsecured Term Loan 60,537 60,000 459,000 13.2% 2016 Secured Property Debt 2,137 24,764 24,764 8.6% 2017 Secured Property Debt 6,308 62,077 62,077 10.2% 2017 Unsecured Term Loan 60,537 147,500 459,000 13.2% 2018 Unsecured Term Loan 60,537 92,500 459,000 13.2% 2020 Secured Property Debt 5,931 34,618 34,618 17.1% 2022 Secured Property Debt 3,446 24,668 24,668 14.0% (1)On October 1, 2012, the Company repaid the loans for Crossways and Newington with borrowings under the Company’s unsecured revolving credit facility. (2)On October 16, 2012, the Company used available cash to defease the $5.3 million mortgage loan encumbering Owings Mills Business Park. (3)At September 30, 2012, the Company had fixed LIBOR, at a weighted average rate of 1.5%, on $350.0 million of its variable rate debt through twelve interest rate swap agreements. (4)Secured Term Loan I is mezzanine debt. Total supported indebtedness includes underlying first mortgage financing that matures from 2012 through 2022. Quarterly Supplemental Disclosure – September 30, 2012 11
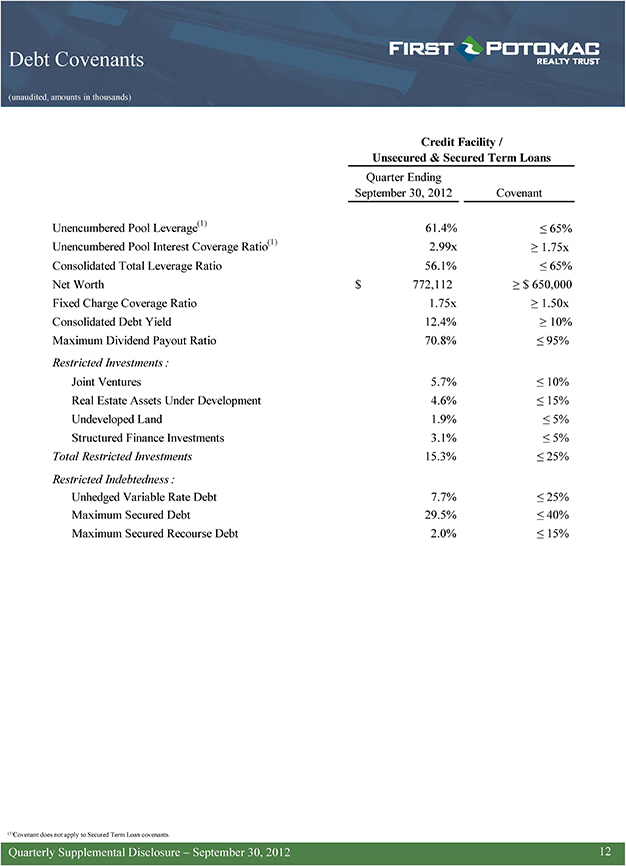
Debt Covenants (unaudited, amounts in thousands) Credit Facility / Unsecured & Secured Term Loans Quarter Ending September 30, 2012 Covenant Unencumbered Pool Leverage(1) 61.4% 65% Unencumbered Pool Interest Coverage Ratio(1) 2.99x 1.75x Consolidated Total Leverage Ratio 56.1% 65% Net Worth $ 772,112 $ 650,000 Fixed Charge Coverage Ratio 1.75x 1.50x Consolidated Debt Yield 12.4% 10% Maximum Dividend Payout Ratio 70.8% 95% Restricted Investments : Joint Ventures 5.7% 10% Real Estate Assets Under Development 4.6% 15% Undeveloped Land 1.9% 5% Structured Finance Investments 3.1% 5% Total Restricted Investments 15.3% 25% Restricted Indebtedness : Unhedged Variable Rate Debt 7.7% 25% Maximum Secured Debt 29.5% 40% Maximum Secured Recourse Debt 2.0% 15% (1)Covenant does not apply to Secured Term Loan covenants. Quarterly Supplemental Disclosure – September 30, 2012 12
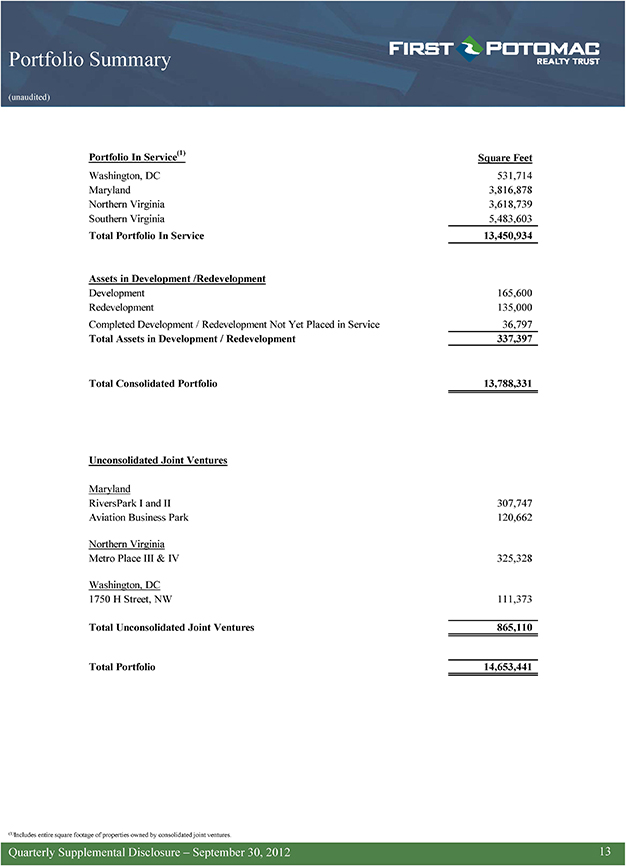
Portfolio Summary (unaudited) Portfolio In Service(1) Square Feet Washington, DC 531,714 Maryland 3,816,878 Northern Virginia 3,618,739 u , , Total Portfolio In Service 13,450,934 Assets in Development /Redevelopment Development 165,600 Redevelopment 135,000 Completed Development / Redevelopment Not Yet Placed in Service 36,797 Total Assets in Development / Redevelopment 337,397 Total Consolidated Portfolio 13,788,331 Unconsolidated Joint Ventures Maryland RiversPark I and II 307,747 Aviation Business Park 120,662 Northern Virginia Metro Place III & IV 325,328 Washington, DC 1750 H Street, NW 111,373 Total Unconsolidated Joint Ventures 865,110 Total Portfolio 14,653,441 (1)Includes entire square footage of properties owned by consolidated joint ventures. Quarterly Supplemental Disclosure – September 30, 2012 13
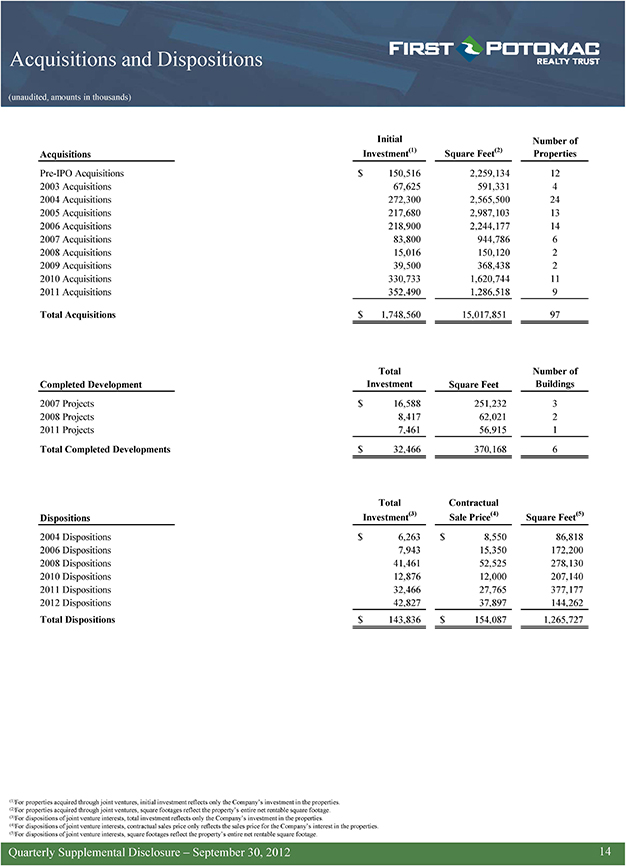
Acquisitions and Dispositions (unaudited, amounts in thousands) Initial Number of Acquisitions Investment(1) Square Feet(2) Properties Pre-IPO Acquisitions $ 150,516 2,259,134 12 2003 Acquisitions 67,625 591,331 4 2004 Acquisitions 272,300 2,565,500 24 2005 Acquisitions 217,680 2,987,103 13 2006 Acquisitions 218,900 2,244,177 14 2007 Acquisitions 83,800 944,786 6 2008 Acquisitions 15,016 150,120 2 2009 Acquisitions 39,500 368,438 2 2010 Acquisitions 330,733 1,620,744 11 2011 Acquisitions 352,490 1,286,518 9 Total Acquisitions $ 1,748,560 15,017,851 97 Total Number of Completed Development Investment Square Feet Buildings 2007 Projects $ 16,588 251,232 3 2008 Projects 8,417 62,021 2 2011 Projects 7,461 56,915 1 Total Completed Developments $ 32,466 370,168 6 Total Contractual Dispositions Investment(3) Sale Price(4) Square Feet(5) 2004 Dispositions $ 6,263 $ 8,550 86,818 2006 Dispositions 7,943 15,350 172,200 2008 Dispositions 41,461 52,525 278,130 2010 Dispositions 12,876 12,000 207,140 2011 Dispositions 32,466 27,765 377,177 2012 Dispositions 42,827 37,897 144,262 Total Dispositions $ 143,836 $ 154,087 1,265,727 (1)For properties acquired through joint ventures, initial investment reflects only the Company’s investment in the properties. (2)For properties acquired through joint ventures, square footages reflect the property’s entire net rentable square footage. (3)For dispositions of joint venture interests, total investment reflects only the Company’s investment in the properties. (4)For dispositions of joint venture interests, contractual sales price only reflects the sales price for the Company’s interest in the properties. (5)For dispositions of joint venture interests, square footages reflect the property’s entire net rentable square footage. Quarterly Supplemental Disclosure – September 30, 2012 14
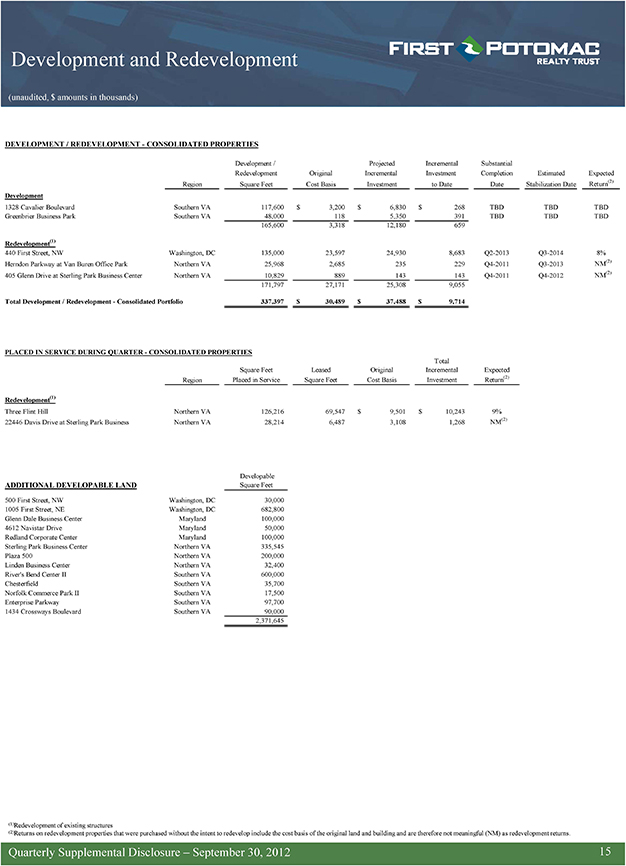
Development and Redevelopment (unaudited, $ amounts in thousands) DEVELOPMENT / REDEVELOPMENT—CONSOLIDATED PROPERTIES Development / Projected Incremental Substantial Redevelopment Original Incremental Investment Completion Estimated Expected Region Square Feet Cost Basis Investment to Date Date Stabilization Date Return(2) Development 1328 Cavalier Boulevard Southern VA 117,600 $ 3,200 $ 6,830 $ 268 TBD TBD TBD Greenbrier Business Park Southern VA 48,000 118 5,350 391 TBD TBD TBD 165,600 3,318 12,180 659 Redevelopment(1) 440 First Street, NW Washington, DC 135,000 23,597 24,930 8,683 Q2-2013 Q3-2014 8% Herndon Parkway at Van Buren Office Park Northern VA 25,968 2,685 235 229 Q4-2011 Q3-2013 NM(2) 405 Glenn Drive at Sterling Park Business Center Northern VA 10,829 889 143 143 Q4-2011 Q4-2012 NM(2) 171,797 27,171 25,308 9,055 Total Development / Redevelopment—Consolidated Portfolio 337,397 $ 30,489 $ 37,488 $ 9,714 PLACED IN SERVICE DURING QUARTER—CONSOLIDATED PROPERTIES Total Square Feet Leased Original Incremental Expected Region Placed in Service Square Feet Cost Basis Investment Return(2) Redevelopment(1) Three Flint Hill Northern VA 126,216 69,547 $ 9,501 $ 10,243 9% 22446 Davis Drive at Sterling Park Business Northern VA 28,214 6,487 3,108 1,268 NM(2) Developable ADDITIONAL DEVELOPABLE LAND Square Feet 500 First Street, NW Washington, DC 30,000 1005 First Street, NE Washington, DC 682,800 Glenn Dale Business Center Maryland 100,000 4612 Navistar Drive Maryland 50,000 Redland Corporate Center Maryland 100,000 Sterling Park Business Center Northern VA 335,545 Plaza 500 Northern VA 200,000 Linden Business Center Northern VA 32,400 River’s Bend Center II Southern VA 600,000 Chesterfield Southern VA 35,700 Norfolk Commerce Park II Southern VA 17,500 Enterprise Parkway Southern VA 97,700 1434 Crossways Boulevard Southern VA 90,000 2,371,645 (1)Redevelopment of existing structures (2)Returns on redevelopment properties that were purchased without the intent to redevelop include the cost basis of the original land and building and are therefore not meaningful (NM) as redevelopment returns. Quarterly Supplemental Disclosure – September 30, 2012 15
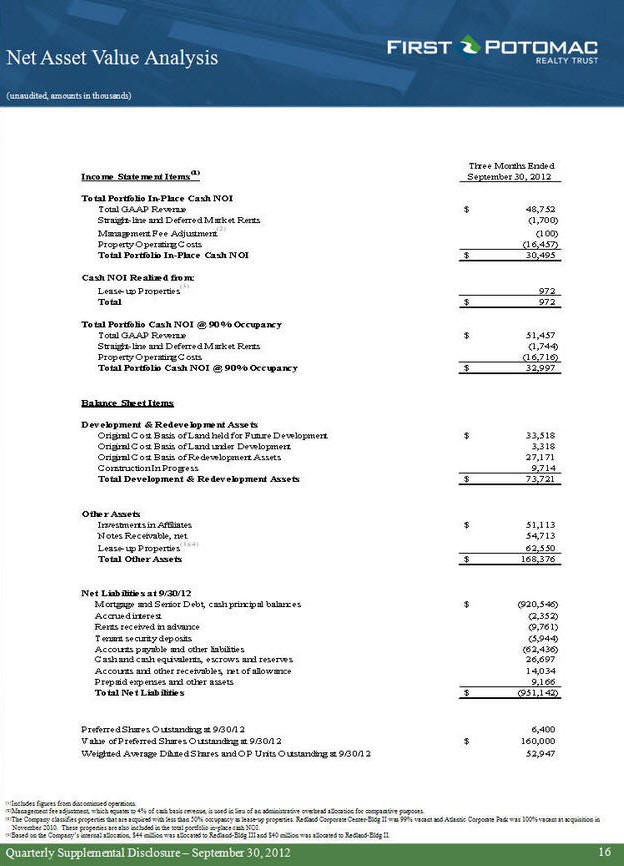
Net Asset Value Analysis (unaudited, amounts in thousands) Three Months Ended Income Statement Items(1) September 30, 2012 Total Portfolio In-Place Cash NOI Total GAAP Revenue $ 48,752 Straight-line and Deferred Market Rents (1,700) Management Fee Adjustment(2) (100) Property Operating Costs (16,457) Total Portfolio In-Place Cash NOI $ 30,495 Cash NOI Realized from: Lease-up Properties(3) 972 Total $ 972 Total Portfolio Cash NOI @ 90% Occupancy Total GAAP Revenue $ 55,522 Straight-line and Deferred Market Rents (1,744) Property Operating Costs (16,716) Total Portfolio Cash NOI @ 90% Occupancy $ 37,062 Balance Sheet Items Development & Redevelopment Assets Original Cost Basis of Land held for Future Development $ 33,518 Original Cost Basis of Land under Development 3,318 Original Cost Basis of Redevelopment Assets 27,171 Construction In Progress 9,714 Total Development & Redevelopment Assets $ 73,721 Other Assets Investments in Affiliates $ 51,113 Notes Receivable, net 54,713 Lease-up Properties(3)(4) 62,550 Total Other Assets $ 168,376 Net Liabilities at 9/30/12 Mortgage and Senior Debt, cash principal balances $ (920,546) Accrued interest (2,352) Rents received in advance (9,761) Tenant security deposits (5,944) Accounts payable and other liabilities (62,436) Cash and cash equivalents, escrows and reserves 26,697 Accounts and other receivables, net of allowance 14,034 Prepaid expenses and other assets 9,166 Total Net Liabilities $ (951,142) Preferred Shares Outstanding at 9/30/12 6,400 Value of Preferred Shares Outstanding at 9/30/12 $ 160,000 Weighted Average Diluted Shares and OP Units Outstanding at 9/30/12 52,947 (1)Includes figures from discontinued operations. (2)Management fee adjustment, which equates to 4% of cash basis revenue, is used in lieu of an administrative overhead allocation for comparative purposes. (3)The Company classifies properties that are acquired with less than 50% occupancy as lease-up properties. Redland Corporate Center-Bldg II was 99% vacant and Atlantic Corporate Park was 100% vacant at acquisition in November 2010. These properties are also included in the total portfolio in-place cash NOI. (4)Based on the Company’s internal allocation, $44 million was allocated to Redland-Bldg III and $40 million was allocated to Redland-Bldg II. Quarterly Supplemental Disclosure – September 30, 2012 16
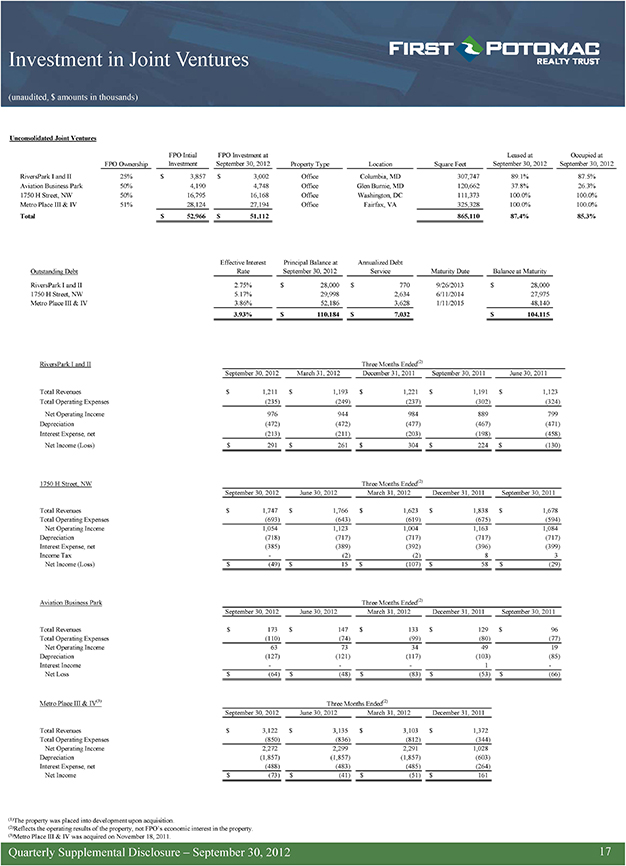
Investment in Joint Ventures (unaudited, $ amounts in thousands) Unconsolidated Joint Ventures FPO Intial FPO Investment at Leased at Occupied at FPO Ownership Investment September 30, 2012 Property Type Location Square Feet September 30, 2012 September 30, 2012 RiversPark I and II 25% $ 3,857 $ 3,002 Office Columbia, MD 307,747 89.1% 87.5% Aviation Business Park 50% 4,190 4,748 Office Glen Burnie, MD 120,662 37.8% 26.3% 1750 H Street, NW 50% 16,795 16,168 Office Washington, DC 111,373 100.0% 100.0% Metro Place III & IV 51% 28,124 27,194 Office Fairfax, VA 325,328 100.0% 100.0% Total $ 52,966 $ 51,112 865,110 87.4% 85.3% Effective Interest Principal Balance at Annualized Debt Outstanding Debt Rate September 30, 2012 Service Maturity Date Balance at Maturity RiversPark I and II 2.75% $ 28,000 $ 770 9/26/2013 $ 28,000 1750 H Street, NW 5.17% 29,998 2,634 6/11/2014 27,975 Metro Place III & IV 3.86% 52,186 3,628 1/11/2015 48,140 3.93% $ 110,184 $ 7,032 $ 104,115 RiversPark I and II Three Months Ended(2) September 30, 2012 March 31, 2012 December 31, 2011 September 30, 2011 June 30, 2011 Total Revenues $ 1,211 $ 1,193 $ 1,221 $ 1,191 $ 1,123 Total Operating Expenses (235) (249) (237) (302) (324) Net Operating Income 976 944 984 889 799 Depreciation (472) (472) (477) (467) (471) Interest Expense, net (213) (211) (203) (198) (458) Net Income (Loss) $ 291 $ 261 $ 304 $ 224 $ (130) 1750 H Street, NW Three Months Ended(2) September 30, 2012 June 30, 2012 March 31, 2012 December 31, 2011 September 30, 2011 Total Revenues $ 1,747 $ 1,766 $ 1,623 $ 1,838 $ 1,678 Total Operating Expenses (693) (643) (619) (675) (594) Net Operating Income 1,054 1,123 1,004 1,163 1,084 Depreciation (718) (717) (717) (717) (717) Interest Expense, net (385) (389) (392) (396) (399) Income Tax—(2) (2) 8 3 Net Income (Loss) $ (49) $ 15 $ (107) $ 58 $ (29) Aviation Business Park Three Months Ended(2) September 30, 2012 June 30, 2012 March 31, 2012 December 31, 2011 September 30, 2011 Total Revenues $ 173 $ 147 $ 133 $ 129 $ 96 Total Operating Expenses (110) (74) (99) (80) (77) Net Operating Income 63 73 34 49 19 Depreciation (127) (121) (117) (103) (85) Interest Income—— 1 -Net Loss $ (64) $ (48) $ (83) $ (53) $ (66) Metro Place III & IV(3) Three Months Ended(2) September 30, 2012 June 30, 2012 March 31, 2012 December 31, 2011 Total Revenues $ 3,122 $ 3,135 $ 3,103 $ 1,372 Total Operating Expenses (850) (836) (812) (344) Net Operating Income 2,272 2,299 2,291 1,028 Depreciation (1,857) (1,857) (1,857) (603) Interest Expense, net (488) (483) (485) (264) Net Income $ (73) $ (41) $ (51) $ 161 (1)The property was placed into development upon acquisition. (2)Reflects the operating results of the property, not FPO’s economic interest in the property. (3)Metro Place III & IV was acquired on November 18, 2011. Quarterly Supplemental Disclosure – September 30, 2012 17

Leasing and Occupancy Summary (unaudited) PORTFOLIO BY PROPERTY TYPE(1) % of Total Number of Square Feet Portfolio Buildings Business Park 5,650,464 42.0% 95 Office 3,343,351 24.9% 52 Industrial 4,457,119 33.1% 33 Total 13,450,934 100.0% 180 LEASED PORTFOLIO BY PROPERTY TYPE(1) % of Annualized Annualized Leased % of Leased Cash Basis Cash Basis Square Feet(2) Square Feet % Leased Rent(3)(4) Rent Business Park 4,658,953 40.8% 82.5% $ 50,142,771 36.4% Office 2,845,648 24.9% 85.1% 58,615,139 42.6% Industrial 3,910,503 34.3% 87.7% 28,992,453 21.0% Total / Average 11,415,104 100.0% 84.9% $ 137,750,363 100.0% OCCUPIED PORTFOLIO BY PROPERTY TYPE % of Annualized Annualized Occupied % of Occupied Cash Basis Cash Basis Square Feet Square Feet % Occupied Rent(3) Rent Business Park 4,527,128 40.4% 80.1% $ 48,904,289 36.1% Office 2,788,792 24.9% 83.4% 57,567,995 42.6% Industrial 3,881,353 34.7% 87.1% 28,816,361 21.3% Total / Average 11,197,273 100.0% 83.2% $ 135,288,645 100.0% PORTFOLIO BY LEASE TYPE Number of Leased % of Leased Leases(5) Square Feet(2) Portfolio Triple Net 451 7,904,852 69.3% Industrial Gross 24 391,531 3.4% Full Service 326 3,118,721 27.3% Total 801 11,415,104 100.0% (1)Does not include space in development or redevelopment. (2)Does not include vacant and core factor space. (3)Annualized cash basis rent at September 30, 2012, which is calculated as the contractual rent due under the terms of the lease, without taking into account rent abatements, is reflected on a triple-net equivalent basis, by deducting operating expense reimbursements that are included, along with base rent, in the contractual payments of the Company’s full service leases. (4)Includes leased spaces that are not yet occupied. (5)Does not include leases on property amenities, such as garages, antennae and land. Quarterly Supplemental Disclosure – September 30, 2012 18
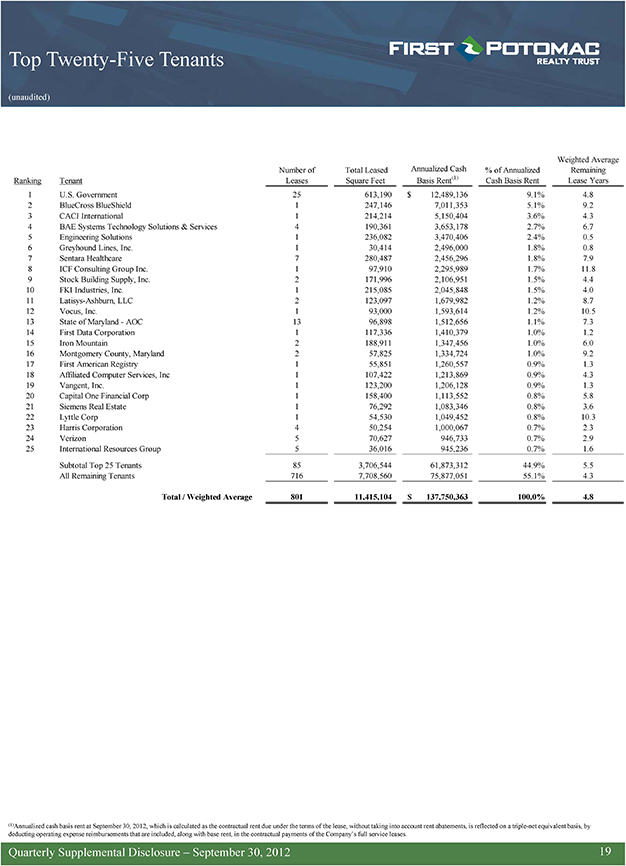
Top Twenty-Five Tenants (unaudited) Weighted Average Number of Total Leased Annualized Cash % of Annualized Remaining Ranking Tenant Leases Square Feet Basis Rent(1) Cash Basis Rent Lease Years 1 U.S. Government 25 613,190 $ 12,489,136 9.1% 4.8 2 BlueCross BlueShield 1 247,146 7,011,353 5.1% 9.2 3 CACI International 1 214,214 5,150,404 3.6% 4.3 4 BAE Systems Technology Solutions & Services 4 190,361 3,653,178 2.7% 6.7 5 Engineering Solutions 1 236,082 3,470,406 2.4% 0.5 6 Greyhound Lines, Inc. 1 30,414 2,496,000 1.8% 0.8 7 Sentara Healthcare 7 280,487 2,456,296 1.8% 7.9 8 ICF Consulting Group Inc. 1 97,910 2,295,989 1.7% 11.8 9 Stock Building Supply, Inc. 2 171,996 2,106,951 1.5% 4.4 10 FKI Industries, Inc. 1 215,085 2,045,848 1.5% 4.0 11 Latisys-Ashburn, LLC 2 123,097 1,679,982 1.2% 8.7 12 Vocus, Inc. 1 93,000 1,593,614 1.2% 10.5 13 State of Maryland—AOC 13 96,898 1,512,656 1.1% 7.3 14 First Data Corporation 1 117,336 1,410,379 1.0% 1.2 15 Iron Mountain 2 188,911 1,347,456 1.0% 6.0 16 Montgomery County, Maryland 2 57,825 1,334,724 1.0% 9.2 17 First American Registry 1 55,851 1,260,557 0.9% 1.3 18 Affiliated Computer Services, Inc 1 107,422 1,213,869 0.9% 4.3 19 Vangent, Inc. 1 123,200 1,206,128 0.9% 1.3 20 Capital One Financial Corp 1 158,400 1,113,552 0.8% 5.8 21 Siemens Real Estate 1 76,292 1,083,346 0.8% 3.6 22 Lyttle Corp 1 54,530 1,049,452 0.8% 10.3 23 Harris Corporation 4 50,254 1,000,067 0.7% 2.3 24 Verizon 5 70,627 946,733 0.7% 2.9 25 International Resources Group 5 36,016 945,236 0.7% 1.6 Subtotal Top 25 Tenants 85 3,706,544 61,873,312 44.9% 5.5 All Remaining Tenants 716 7,708,560 75,877,051 55.1% 4.3 Total / Weighted Average 801 11,415,104 $ 137,750,363 100.0% 4.8 (1)Annualized cash basis rent at September 30, 2012, which is calculated as the contractual rent due under the terms of the lease, without taking into account rent abatements, is reflected on a triple-net equivalent basis, by deducting operating expense reimbursements that are included, along with base rent, in the contractual payments of the Company’s full service leases. Quarterly Supplemental Disclosure – September 30, 2012 19
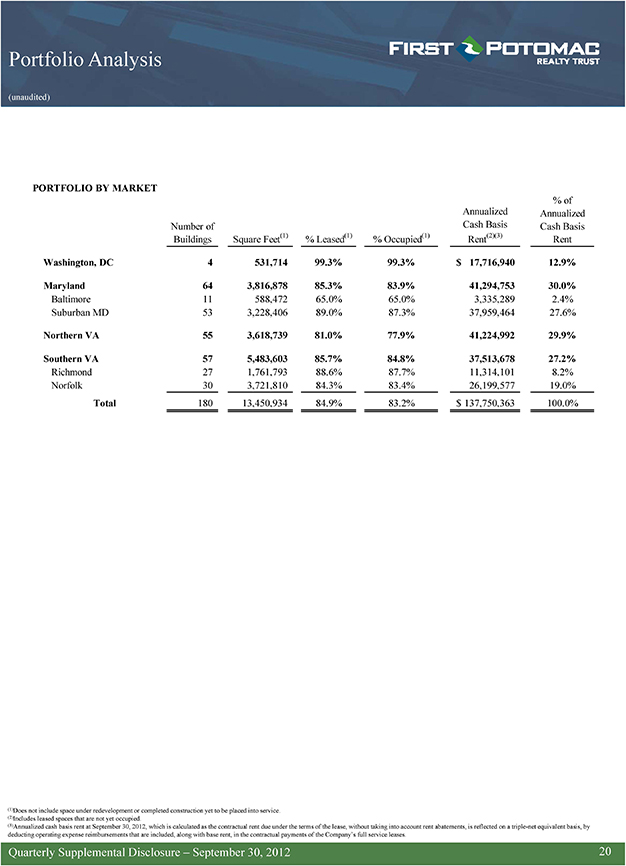
Portfolio Analysis (unaudited) PORTFOLIO BY MARKET % of Annualized Annualized Number of Cash Basis Cash Basis Buildings Square Feet(1) % Leased(1) % Occupied(1) Rent(2)(3) Rent Washington, DC 4 531,714 99.3% 99.3% $ 17,716,940 12.9% Maryland 64 3,816,878 85.3% 83.9% 41,294,753 30.0% Baltimore 11 588,472 65.0% 65.0% 3,335,289 2.4% Suburban MD 53 3,228,406 89.0% 87.3% 37,959,464 27.6% Northern VA 55 3,618,739 81.0% 77.9% 41,224,992 29.9% Southern VA 57 5,483,603 85.7% 84.8% 37,513,678 27.2% Richmond 27 1,761,793 88.6% 87.7% 11,314,101 8.2% Norfolk 30 3,721,810 84.3% 83.4% 26,199,577 19.0% Total 180 13,450,934 84.9% 83.2% $ 137,750,363 100.0% (1)Does not include space under redevelopment or completed construction yet to be placed into service. (2)Includes leased spaces that are not yet occupied. (3)Annualized cash basis rent at September 30, 2012, which is calculated as the contractual rent due under the terms of the lease, without taking into account rent abatements, is reflected on a triple-net equivalent basis, by deducting operating expense reimbursements that are included, along with base rent, in the contractual payments of the Company’s full service leases. Quarterly Supplemental Disclosure – September 30, 2012 20
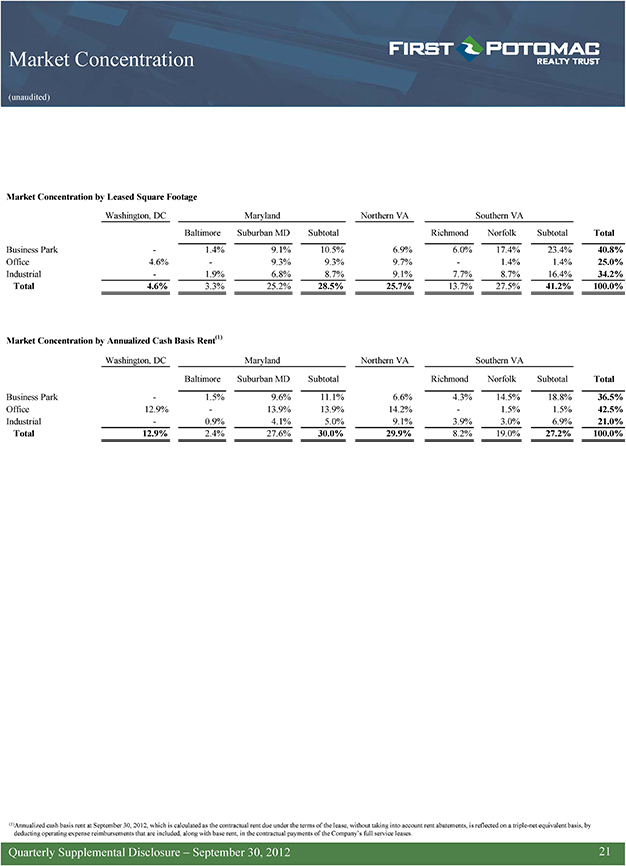
Market Concentration (unaudited) Market Concentration by Leased Square Footage Washington, DC Maryland Northern VA Southern VA Baltimore Suburban MD Subtotal Richmond Norfolk Subtotal Total Business Park—1.4% 9.1% 10.5% 6.9% 6.0% 17.4% 23.4% 40.8% Office 4.6%—9.3% 9.3% 9.7%—1.4% 1.4% 25.0% Industrial—1.9% 6.8% 8.7% 9.1% 7.7% 8.7% 16.4% 34.2% Total 4.6% 3.3% 25.2% 28.5% 25.7% 13.7% 27.5% 41.2% 100.0% Market Concentration by Annualized Cash Basis Rent(1) Washington, DC Maryland Northern VA Southern VA Baltimore Suburban MD Subtotal Richmond Norfolk Subtotal Total Business Park—1.5% 9.6% 11.1% 6.6% 4.3% 14.5% 18.8% 36.5% Office 12.9%—13.9% 13.9% 14.2%—1.5% 1.5% 42.5% Industrial—0.9% 4.1% 5.0% 9.1% 3.9% 3.0% 6.9% 21.0% Total 12.9% 2.4% 27.6% 30.0% 29.9% 8.2% 19.0% 27.2% 100.0% (1)Annualized cash basis rent at September 30, 2012, which is calculated as the contractual rent due under the terms of the lease, without taking into account rent abatements, is reflected on a triple-net equivalent basis, by deducting operating expense reimbursements that are included, along with base rent, in the contractual payments of the Company’s full service leases. Quarterly Supplemental Disclosure – September 30, 2012 21
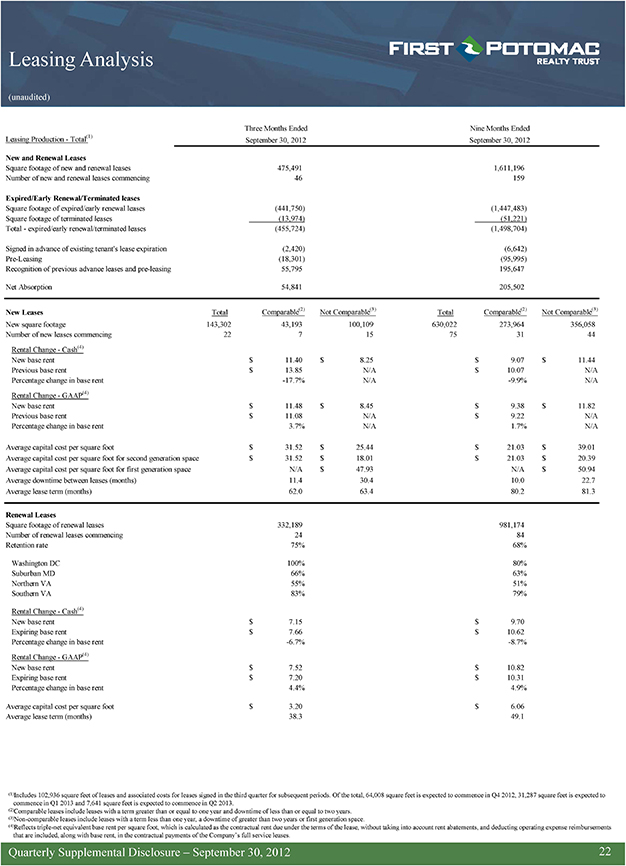
Leasing Analysis (unaudited) Three Months Ended Nine Months Ended Leasing Production—Total(1) September 30, 2012 September 30, 2012 New and Renewal Leases Square footage of new and renewal leases 475,491 1,611,196 Number of new and renewal leases commencing 46 159 Expired/Early Renewal/Terminated leases Square footage of expired/early renewal leases (441,750) (1,447,483) Square footage of terminated leases (13,974) (51,221) Total—expired/early renewal/terminated leases (455,724) (1,498,704) Signed in advance of existing tenant’s lease expiration (2,420) (6,642) Pre-Leasing (18,301) (95,995) Recognition of previous advance leases and pre-leasing 55,795 195,647 Net Absorption 54,841 205,502 New Leases Total Comparable(2) Not Comparable(3) Total Comparable(2) Not Comparable(3) New square footage 143,302 43,193 100,109 630,022 273,964 356,058 Number of new leases commencing 22 7 15 75 31 44 Rental Change—Cash(4) New base rent $ 11.40 $ 8.25 $ 9.07 $ 11.44 Previous base rent $ 13.85 N/A $ 10.07 N/A Percentage change in base rent -17.7% N/A -9.9% N/A Rental Change—GAAP(4) New base rent $ 11.48 $ 8.45 $ 9.38 $ 11.82 Previous base rent $ 11.08 N/A $ 9.22 N/A Percentage change in base rent 3.7% N/A 1.7% N/A Average capital cost per square foot $ 31.52 $ 25.44 $ 21.03 $ 39.01 Average capital cost per square foot for second generation space $ 31.52 $ 18.01 $ 21.03 $ 20.39 Average capital cost per square foot for first generation space N/A $ 47.93 N/A $ 50.94 Average downtime between leases (months) 11.4 30.4 10.0 22.7 Average lease term (months) 62.0 63.4 80.2 81.3 Renewal Leases Square footage of renewal leases 332,189 981,174 Number of renewal leases commencing 24 84 Retention rate 75% 68% Washington DC 100% 80% Suburban MD 66% 63% Northern VA 55% 51% Southern VA 83% 79% Rental Change—Cash(4) New base rent $ 7.15 $ 9.70 Expiring base rent $ 7.66 $ 10.62 Percentage change in base rent -6.7% -8.7% Rental Change—GAAP(4) New base rent $ 7.52 $ 10.82 Expiring base rent $ 7.20 $ 10.31 Percentage change in base rent 4.4% 4.9% Average capital cost per square foot $ 3.20 $ 6.06 Average lease term (months) 38.3 49.1 (1)Includes 102,936 square feet of leases and associated costs for leases signed in the third quarter for subsequent periods. Of the total, 64,008 square feet is expected to commence in Q4 2012, 31,287 square feet is expected to commence in Q1 2013 and 7,641 square feet is expected to commence in Q2 2013. (2)Comparable leases include leases with a term greater than or equal to one year and downtime of less than or equal to two years. (3)Non-comparable leases include leases with a term less than one year, a downtime of greater than two years or first generation space. (4)Reflects triple-net equivalent base rent per square foot, which is calculated as the contractual rent due under the terms of the lease, without taking into account rent abatements, and deducting operating expense reimbursements that are included, along with base rent, in the contractual payments of the Company’s full service leases. Quarterly Supplemental Disclosure – September 30, 2012 22
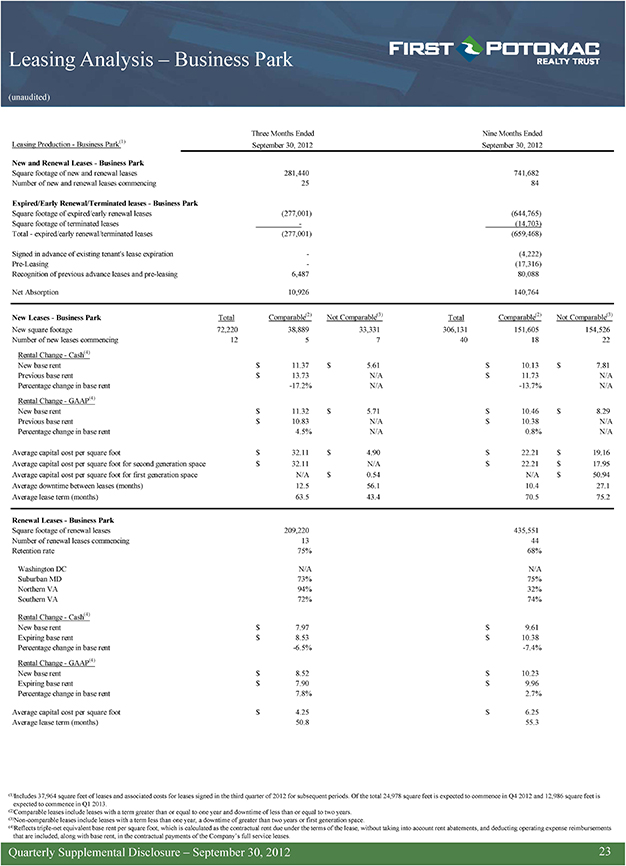
Leasing Analysis – Business Park (unaudited) Three Months Ended Nine Months Ended Leasing Production—Business Park(1) September 30, 2012 September 30, 2012 New and Renewal Leases—Business Park Square footage of new and renewal leases 281,440 741,682 Number of new and renewal leases commencing 25 84 Expired/Early Renewal/Terminated leases—Business Park Square footage of expired/early renewal leases (277,001) (644,765) Square footage of terminated leases—(14,703) Total—expired/early renewal/terminated leases (277,001) (659,468) Signed in advance of existing tenant’s lease expiration—(4,222) Pre-Leasing—(17,316) Recognition of previous advance leases and pre-leasing 6,487 80,088 Net Absorption 10,926 140,764 New Leases—Business Park Total Comparable(2) Not Comparable(3) Total Comparable(2) Not Comparable(3) New square footage 72,220 38,889 33,331 306,131 151,605 154,526 Number of new leases commencing 12 5 7 40 18 22 Rental Change—Cash(4) New base rent $ 11.37 $ 5.61 $ 10.13 $ 7.81 Previous base rent $ 13.73 N/A $ 11.73 N/A Percentage change in base rent -17.2% N/A -13.7% N/A Rental Change—GAAP(4) New base rent $ 11.32 $ 5.71 $ 10.46 $ 8.29 Previous base rent $ 10.83 N/A $ 10.38 N/A Percentage change in base rent 4.5% N/A 0.8% N/A Average capital cost per square foot $ 32.11 $ 4.90 $ 22.21 $ 19.16 Average capital cost per square foot for second generation space $ 32.11 N/A $ 22.21 $ 17.95 Average capital cost per square foot for first generation space N/A $ 0.54 N/A $ 50.94 Average downtime between leases (months) 12.5 56.1 10.4 27.1 Average lease term (months) 63.5 43.4 70.5 75.2 Renewal Leases—Business Park Square footage of renewal leases 209,220 435,551 Number of renewal leases commencing 13 44 Retention rate 75% 68% Washington DC N/A N/A Suburban MD 73% 75% Northern VA 94% 32% Southern VA 72% 74% Rental Change—Cash(4) New base rent $ 7.97 $ 9.61 Expiring base rent $ 8.53 $ 10.38 Percentage change in base rent -6.5% -7.4% Rental Change—GAAP(4) New base rent $ 8.52 $ 10.23 Expiring base rent $ 7.90 $ 9.96 Percentage change in base rent 7.8% 2.7% Average capital cost per square foot $ 4.25 $ 6.25 Average lease term (months) 50.8 55.3 (1)Includes 37,964 square feet of leases and associated costs for leases signed in the third quarter of 2012 for subsequent periods. Of the total 24,978 square feet is expected to commence in Q4 2012 and 12,986 square feet is expected to commence in Q1 2013. (2)Comparable leases include leases with a term greater than or equal to one year and downtime of less than or equal to two years. (3)Non-comparable leases include leases with a term less than one year, a downtime of greater than two years or first generation space. (4)Reflects triple-net equivalent base rent per square foot, which is calculated as the contractual rent due under the terms of the lease, without taking into account rent abatements, and deducting operating expense reimbursements that are included, along with base rent, in the contractual payments of the Company’s full service leases. Quarterly Supplemental Disclosure – September 30, 2012 23
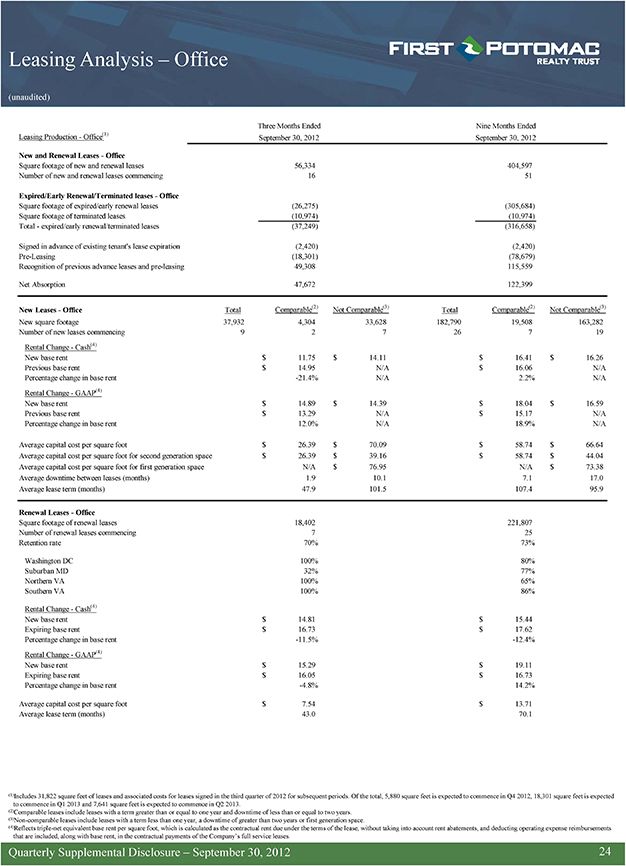
Leasing Analysis – Office (unaudited) Three Months Ended Nine Months Ended Leasing Production—Office(1) September 30, 2012 September 30, 2012 New and Renewal Leases—Office Square footage of new and renewal leases 56,334 404,597 Number of new and renewal leases commencing 16 51 Expired/Early Renewal/Terminated leases—Office Square footage of expired/early renewal leases (26,275) (305,684) Square footage of terminated leases (10,974) (10,974) Total—expired/early renewal/terminated leases (37,249) (316,658) Signed in advance of existing tenant’s lease expiration (2,420) (2,420) Pre-Leasing (18,301) (78,679) Recognition of previous advance leases and pre-leasing 49,308 115,559 Net Absorption 47,672 122,399 New Leases—Office Total Comparable(2) Not Comparable(3) Total Comparable(2) Not Comparable(3) New square footage 37,932 4,304 33,628 182,790 19,508 163,282 Number of new leases commencing 9 2 7 26 7 19 Rental Change—Cash(4) New base rent $ 11.75 $ 14.11 $ 16.41 $ 16.26 Previous base rent $ 14.95 N/A $ 16.06 N/A Percentage change in base rent -21.4% N/A 2.2% N/A Rental Change—GAAP(4) New base rent $ 14.89 $ 14.39 $ 18.04 $ 16.59 Previous base rent $ 13.29 N/A $ 15.17 N/A Percentage change in base rent 12.0% N/A 18.9% N/A Average capital cost per square foot $ 26.39 $ 70.09 $ 58.74 $ 66.64 Average capital cost per square foot for second generation space $ 26.39 $ 39.16 $ 58.74 $ 44.04 Average capital cost per square foot for first generation space N/A $ 76.95 N/A $ 73.38 Average downtime between leases (months) 1.9 10.1 7.1 17.0 Average lease term (months) 47.9 101.5 107.4 95.9 Renewal Leases—Office Square footage of renewal leases 18,402 221,807 Number of renewal leases commencing 7 25 Retention rate 70% 73% Washington DC 100% 80% Suburban MD 32% 77% Northern VA 100% 65% Southern VA 100% 86% Rental Change—Cash(4) New base rent $ 14.81 $ 15.44 Expiring base rent $ 16.73 $ 17.62 Percentage change in base rent -11.5% -12.4% Rental Change—GAAP(4) New base rent $ 15.29 $ 19.11 Expiring base rent $ 16.05 $ 16.73 Percentage change in base rent -4.8% 14.2% Average capital cost per square foot $ 7.54 $ 13.71 Average lease term (months) 43.0 70.1 (1)Includes 31,822 square feet of leases and associated costs for leases signed in the third quarter of 2012 for subsequent periods. Of the total, 5,880 square feet is expected to commence in Q4 2012, 18,301 square feet is expected to commence in Q1 2013 and 7,641 square feet is expected to commence in Q2 2013. (2)Comparable leases include leases with a term greater than or equal to one year and downtime of less than or equal to two years. (3)Non-comparable leases include leases with a term less than one year, a downtime of greater than two years or first generation space. (4)Reflects triple-net equivalent base rent per square foot, which is calculated as the contractual rent due under the terms of the lease, without taking into account rent abatements, and deducting operating expense reimbursements that are included, along with base rent, in the contractual payments of the Company’s full service leases. Quarterly Supplemental Disclosure – September 30, 2012 24
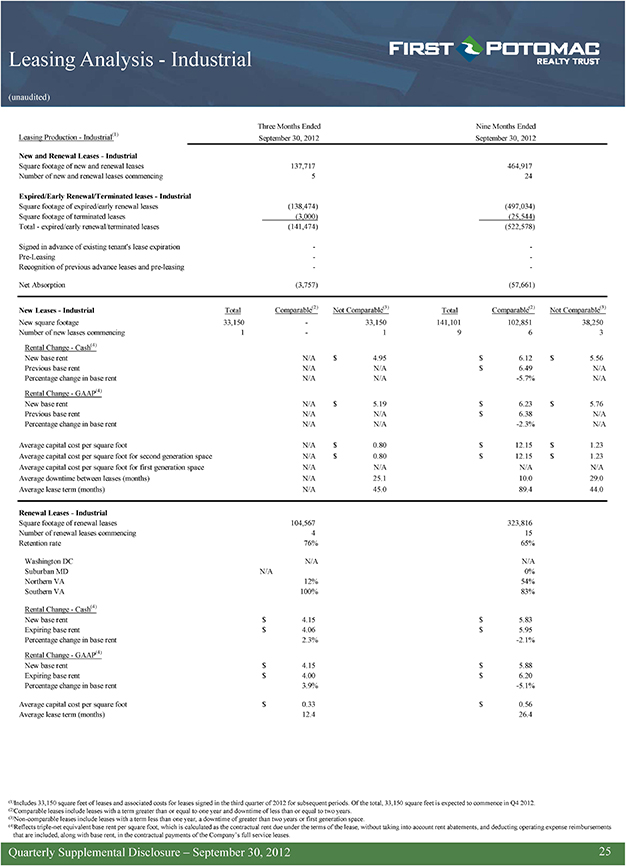
Leasing Analysis—Industrial (unaudited) Three Months Ended Nine Months Ended Leasing Production—Industrial(1) September 30, 2012 September 30, 2012 New and Renewal Leases—Industrial Square footage of new and renewal leases 137,717 464,917 Number of new and renewal leases commencing 5 24 Expired/Early Renewal/Terminated leases—Industrial Square footage of expired/early renewal leases (138,474) (497,034) Square footage of terminated leases (3,000) (25,544) Total—expired/early renewal/terminated leases (141,474) (522,578) Signed in advance of existing tenant’s lease expiration—-Pre-Leasing—-Recognition of previous advance leases and pre-leasing—- Net Absorption (3,757) (57,661) New Leases—Industrial Total Comparable(2) Not Comparable(3) Total Comparable(2) Not Comparable(3) New square footage 33,150—33,150 141,101 102,851 38,250 Number of new leases commencing 1—1 9 6 3 Rental Change—Cash(4) New base rent N/A $ 4.95 $ 6.12 $ 5.56 Previous base rent N/A N/A $ 6.49 N/A Percentage change in base rent N/A N/A -5.7% N/A Rental Change—GAAP(4) New base rent N/A $ 5.19 $ 6.23 $ 5.76 Previous base rent N/A N/A $ 6.38 N/A Percentage change in base rent N/A N/A -2.3% N/A Average capital cost per square foot N/A $ 0.80 $ 12.15 $ 1.23 Average capital cost per square foot for second generation space N/A $ 0.80 $ 12.15 $ 1.23 Average capital cost per square foot for first generation space N/A N/A N/A N/A Average downtime between leases (months) N/A 25.1 10.0 29.0 Average lease term (months) N/A 45.0 89.4 44.0 Renewal Leases—Industrial Square footage of renewal leases 104,567 323,816 Number of renewal leases commencing 4 15 Retention rate 76% 65% Washington DC N/A N/A Suburban MD N/A 0% Northern VA 12% 54% Southern VA 100% 83% Rental Change—Cash(4) New base rent $ 4.15 $ 5.83 Expiring base rent $ 4.06 $ 5.95 Percentage change in base rent 2.3% -2.1% Rental Change—GAAP(4) New base rent $ 4.15 $ 5.88 Expiring base rent $ 4.00 $ 6.20 Percentage change in base rent 3.9% -5.1% Average capital cost per square foot $ 0.33 $ 0.56 Average lease term (months) 12.4 26.4 (1)Includes 33,150 square feet of leases and associated costs for leases signed in the third quarter of 2012 for subsequent periods. Of the total, 33,150 square feet is expected to commence in Q4 2012. (2)Comparable leases include leases with a term greater than or equal to one year and downtime of less than or equal to two years. (3)Non-comparable leases include leases with a term less than one year, a downtime of greater than two years or first generation space. (4)Reflects triple-net equivalent base rent per square foot, which is calculated as the contractual rent due under the terms of the lease, without taking into account rent abatements, and deducting operating expense reimbursements that are included, along with base rent, in the contractual payments of the Company’s full service leases. Quarterly Supplemental Disclosure – September 30, 2012 25
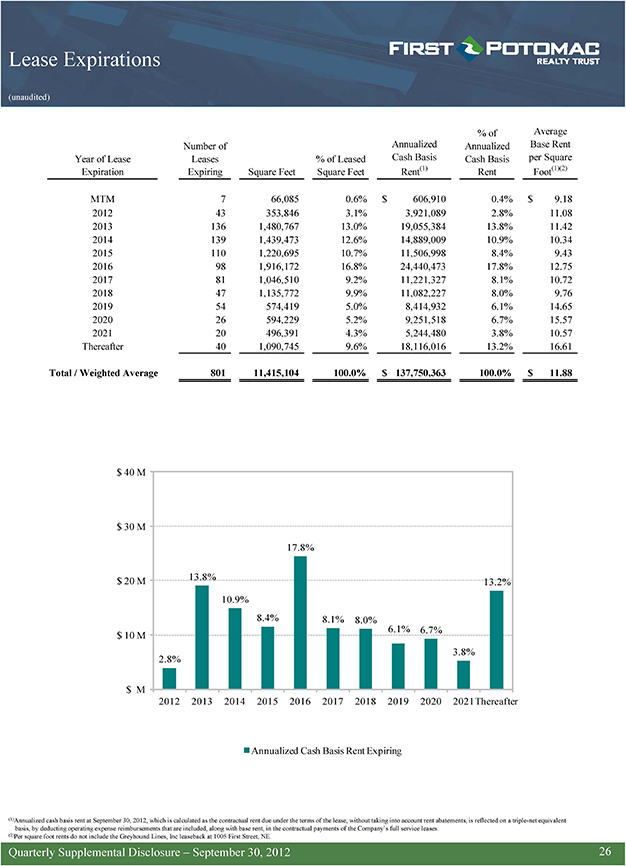
Lease Expirations (unaudited) % of Average Number of Annualized Annualized Base Rent Year of Lease Leases % of Leased Cash Basis Cash Basis per Square Expiration Expiring Square Feet Square Feet Rent(1) Rent Foot(1)(2) MTM 7 66,085 0.6% $ 606,910 0.4% $ 9.18 2012 43 353,846 3.1% 3,921,089 2.8% 11.08 2013 136 1,480,767 13.0% 19,055,384 13.8% 11.42 2014 139 1,439,473 12.6% 14,889,009 10.9% 10.34 2015 110 1,220,695 10.7% 11,506,998 8.4% 9.43 2016 98 1,916,172 16.8% 24,440,473 17.8% 12.75 2017 81 1,046,510 9.2% 11,221,327 8.1% 10.72 2018 47 1,135,772 9.9% 11,082,227 8.0% 9.76 2019 54 574,419 5.0% 8,414,932 6.1% 14.65 2020 26 594,229 5.2% 9,251,518 6.7% 15.57 2021 20 496,391 4.3% 5,244,480 3.8% 10.57 Thereafter 40 1,090,745 9.6% 18,116,016 13.2% 16.61 Total / Weighted Average 801 11,415,104 100.0% $ 137,750,363 100.0% $ 11.88 $ 40 M $ 30 M 17.8% $ 20 M 13.8% 13.2% 10.9% 8.4% 8.1% 8.0% 6.1% 6.7% $ 10 M 3.8% 2.8% $ M 2012 2013 2014 2015 2016 2017 2018 2019 2020 2021Thereafter Annualized Cash Basis Rent Expiring (1)Annualized cash basis rent at September 30, 2012, which is calculated as the contractual rent due under the terms of the lease, without taking into account rent abatements, is reflected on a triple-net equivalent basis, by deducting operating expense reimbursements that are included, along with base rent, in the contractual payments of the Company’s full service leases. (2)Per square foot rents do not include the Greyhound Lines, Inc leaseback at 1005 First Street, NE. Quarterly Supplemental Disclosure – September 30, 2012 26
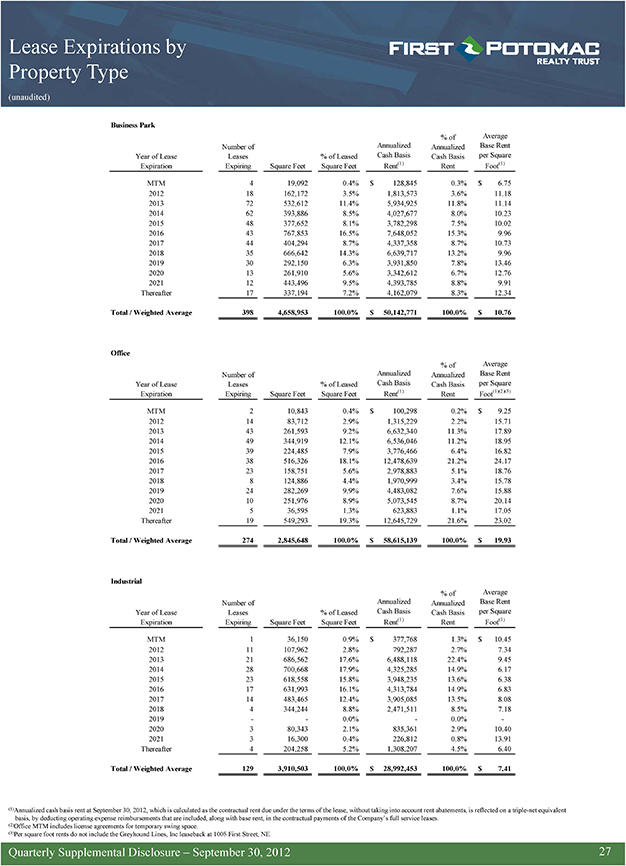
Lease Expirations by Property Type (unaudited) Business Park % of Average Number of Annualized Annualized Base Rent Year of Lease Leases % of Leased Cash Basis Cash Basis per Square Expiration Expiring Square Feet Square Feet Rent(1) Rent Foot(1) MTM 4 19,092 0.4% $ 128,845 0.3% $ 6.75 2012 18 162,172 3.5% 1,813,573 3.6% 11.18 2013 72 532,612 11.4% 5,934,925 11.8% 11.14 2014 62 393,886 8.5% 4,027,677 8.0% 10.23 2015 48 377,652 8.1% 3,782,298 7.5% 10.02 2016 43 767,853 16.5% 7,648,052 15.3% 9.96 2017 44 404,294 8.7% 4,337,358 8.7% 10.73 2018 35 666,642 14.3% 6,639,717 13.2% 9.96 2019 30 292,150 6.3% 3,931,850 7.8% 13.46 2020 13 261,910 5.6% 3,342,612 6.7% 12.76 2021 12 443,496 9.5% 4,393,785 8.8% 9.91 Thereafter 17 337,194 7.2% 4,162,079 8.3% 12.34 Total / Weighted Average 398 4,658,953 100.0% $ 50,142,771 100.0% $ 10.76 Office % of Average Number of Annualized Annualized Base Rent Year of Lease Leases % of Leased Cash Basis Cash Basis per Square Expiration Expiring Square Feet Square Feet Rent(1) Rent Foot(1)(2)(3) MTM 2 10,843 0.4% $ 100,298 0.2% $ 9.25 2012 14 83,712 2.9% 1,315,229 2.2% 15.71 2013 43 261,593 9.2% 6,632,340 11.3% 17.89 2014 49 344,919 12.1% 6,536,046 11.2% 18.95 2015 39 224,485 7.9% 3,776,466 6.4% 16.82 2016 38 516,326 18.1% 12,478,639 21.2% 24.17 2017 23 158,751 5.6% 2,978,883 5.1% 18.76 2018 8 124,886 4.4% 1,970,999 3.4% 15.78 2019 24 282,269 9.9% 4,483,082 7.6% 15.88 2020 10 251,976 8.9% 5,073,545 8.7% 20.14 2021 5 36,595 1.3% 623,883 1.1% 17.05 Thereafter 19 549,293 19.3% 12,645,729 21.6% 23.02 Total / Weighted Average 274 2,845,648 100.0% $ 58,615,139 100.0% $ 19.93 Industrial % of Average Number of Annualized Annualized Base Rent Year of Lease Leases % of Leased Cash Basis Cash Basis per Square Expiration Expiring Square Feet Square Feet Rent(1) Rent Foot(1) MTM 1 36,150 0.9% $ 377,768 1.3% $ 10.45 2012 11 107,962 2.8% 792,287 2.7% 7.34 2013 21 686,562 17.6% 6,488,118 22.4% 9.45 2014 28 700,668 17.9% 4,325,285 14.9% 6.17 2015 23 618,558 15.8% 3,948,235 13.6% 6.38 2016 17 631,993 16.1% 4,313,784 14.9% 6.83 2017 14 483,465 12.4% 3,905,085 13.5% 8.08 2018 4 344,244 8.8% 2,471,511 8.5% 7.18 2019—- 0.0%—0.0% -2020 3 80,343 2.1% 835,361 2.9% 10.40 2021 3 16,300 0.4% 226,812 0.8% 13.91 Thereafter 4 204,258 5.2% 1,308,207 4.5% 6.40 Total / Weighted Average 129 3,910,503 100.0% $ 28,992,453 100.0% $ 7.41 (1)Annualized cash basis rent at September 30, 2012, which is calculated as the contractual rent due under the terms of the lease, without taking into account rent abatements, is reflected on a triple-net equivalent basis, by deducting operating expense reimbursements that are included, along with base rent, in the contractual payments of the Company’s full service leases. (2)Office MTM includes license agreements for temporary swing space. (3)Per square foot rents do not include the Greyhound Lines, Inc leaseback at 1005 First Street, NE. Quarterly Supplemental Disclosure – September 30, 2012 27
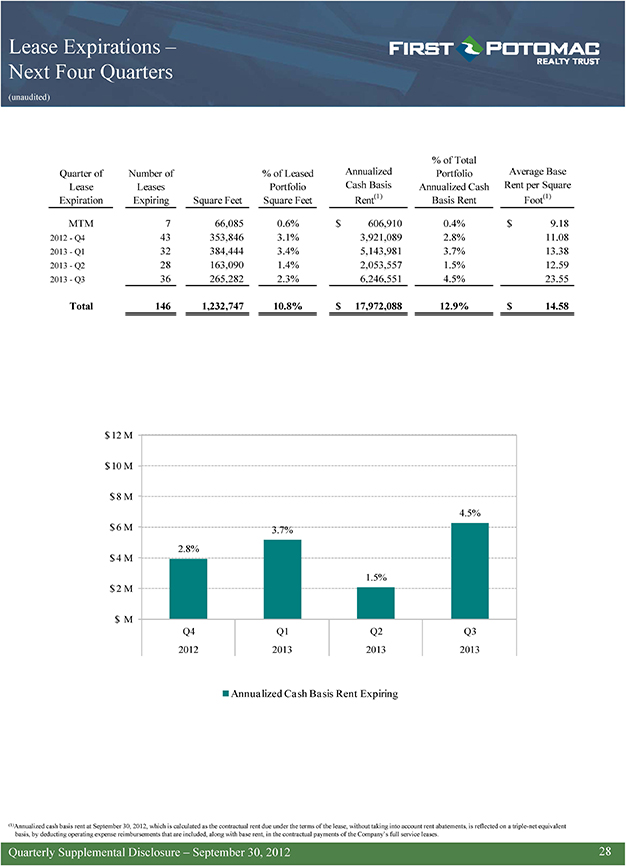
Lease Expirations –Next Four Quarters (unaudited) % of Total Quarter of Number of % of Leased Annualized Portfolio Average Base Lease Leases Portfolio Cash Basis Annualized Cash Rent per Square Expiration Expiring Square Feet Square Feet Rent(1) Basis Rent Foot(1) MTM 7 66,085 0.6% $ 606,910 0.4% $ 9.18 2012—Q4 43 353,846 3.1% 3,921,089 2.8% 11.08 2013—Q1 32 384,444 3.4% 5,143,981 3.7% 13.38 2013—Q2 28 163,090 1.4% 2,053,557 1.5% 12.59 2013—Q3 36 265,282 2.3% 6,246,551 4.5% 23.55 Total 146 1,232,747 10.8% $ 17,972,088 12.9% $ 14.58 $ 12 M $ 10 M $ 8 M 4.5% $ 6 M 3.7% 2.8% $ 4 M 1.5% $ 2 M $ M Q4 Q1 Q2 Q3 2012 2013 2013 2013 Annualized Cash Basis Rent Expiring (1)Annualized cash basis rent at September 30, 2012, which is calculated as the contractual rent due under the terms of the lease, without taking into account rent abatements, is reflected on a triple-net equivalent basis, by deducting operating expense reimbursements that are included, along with base rent, in the contractual payments of the Company’s full service leases. Quarterly Supplemental Disclosure – September 30, 2012 28
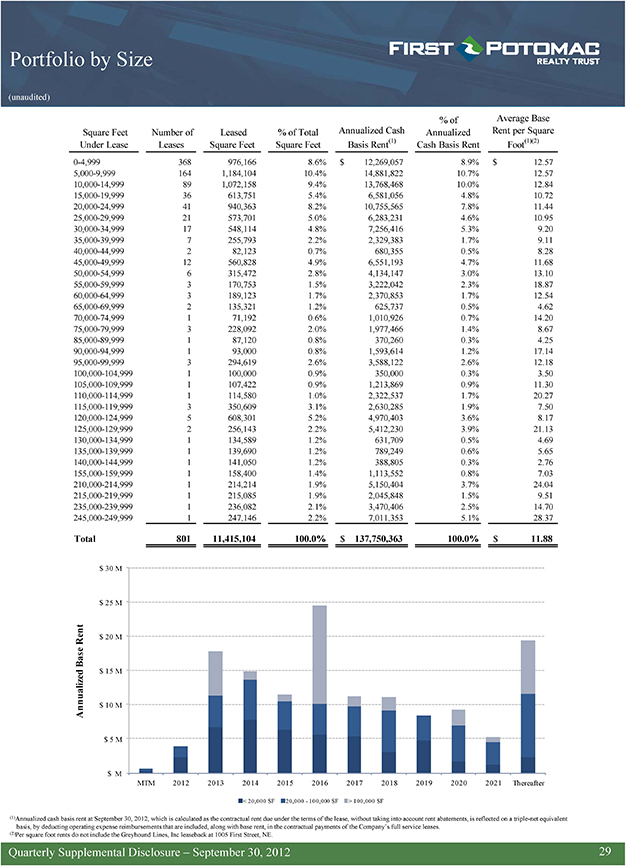
Portfolio by Size (unaudited) % of Average Base Square Feet Number of Leased % of Total Annualized Cash Annualized Rent per Square Under Lease Leases Square Feet Square Feet Basis Rent(1) Cash Basis Rent Foot(1)(2) 0-4,999 368 976,166 8.6% $ 12,269,057 8.9% $ 12.57 5,000-9,999 164 1,184,104 10.4% 14,881,822 10.7% 12.57 10,000-14,999 89 1,072,158 9.4% 13,768,468 10.0% 12.84 15,000-19,999 36 613,751 5.4% 6,581,056 4.8% 10.72 20,000-24,999 41 940,363 8.2% 10,755,565 7.8% 11.44 25,000-29,999 21 573,701 5.0% 6,283,231 4.6% 10.95 30,000-34,999 17 548,114 4.8% 7,256,416 5.3% 9.20 35,000-39,999 7 255,793 2.2% 2,329,383 1.7% 9.11 40,000-44,999 2 82,123 0.7% 680,355 0.5% 8.28 45,000-49,999 12 560,828 4.9% 6,551,193 4.7% 11.68 50,000-54,999 6 315,472 2.8% 4,134,147 3.0% 13.10 55,000-59,999 3 170,753 1.5% 3,222,042 2.3% 18.87 60,000-64,999 3 189,123 1.7% 2,370,853 1.7% 12.54 65,000-69,999 2 135,321 1.2% 625,737 0.5% 4.62 70,000-74,999 1 71,192 0.6% 1,010,926 0.7% 14.20 75,000-79,999 3 228,092 2.0% 1,977,466 1.4% 8.67 85,000-89,999 1 87,120 0.8% 370,260 0.3% 4.25 90,000-94,999 1 93,000 0.8% 1,593,614 1.2% 17.14 95,000-99,999 3 294,619 2.6% 3,588,122 2.6% 12.18 100,000-104,999 1 100,000 0.9% 350,000 0.3% 3.50 105,000-109,999 1 107,422 0.9% 1,213,869 0.9% 11.30 110,000-114,999 1 114,580 1.0% 2,322,537 1.7% 20.27 115,000-119,999 3 350,609 3.1% 2,630,285 1.9% 7.50 120,000-124,999 5 608,301 5.2% 4,970,403 3.6% 8.17 125,000-129,999 2 256,143 2.2% 5,412,230 3.9% 21.13 130,000-134,999 1 134,589 1.2% 631,709 0.5% 4.69 135,000-139,999 1 139,690 1.2% 789,249 0.6% 5.65 140,000-144,999 1 141,050 1.2% 388,805 0.3% 2.76 155,000-159,999 1 158,400 1.4% 1,113,552 0.8% 7.03 210,000-214,999 1 214,214 1.9% 5,150,404 3.7% 24.04 215,000-219,999 1 215,085 1.9% 2,045,848 1.5% 9.51 235,000-239,999 1 236,082 2.1% 3,470,406 2.5% 14.70 245,000-249,999 1 247,146 2.2% 7,011,353 5.1% 28.37 Total 801 11,415,104 100.0% $ 137,750,363 100.0% $ 11.88 $ 30 M $ 25 M Rent $ 20 M Base $ 15 M Annualized $ 10 M $ 5 M $ M MTM 2012 2013 2014 2015 2016 2017 2018 2019 2020 2021 Thereafter < 20,000 SF 20,000—100,000 SF > 100,000 SF (1)Annualized cash basis rent at September 30, 2012, which is calculated as the contractual rent due under the terms of the lease, without taking into account rent abatements, is reflected on a triple-net equivalent basis, by deducting operating expense reimbursements that are included, along with base rent, in the contractual payments of the Company’s full service leases. (2)Per square foot rents do not include the Greyhound Lines, Inc leaseback at 1005 First Street, NE. Quarterly Supplemental Disclosure – September 30, 2012 29
Washington, DC
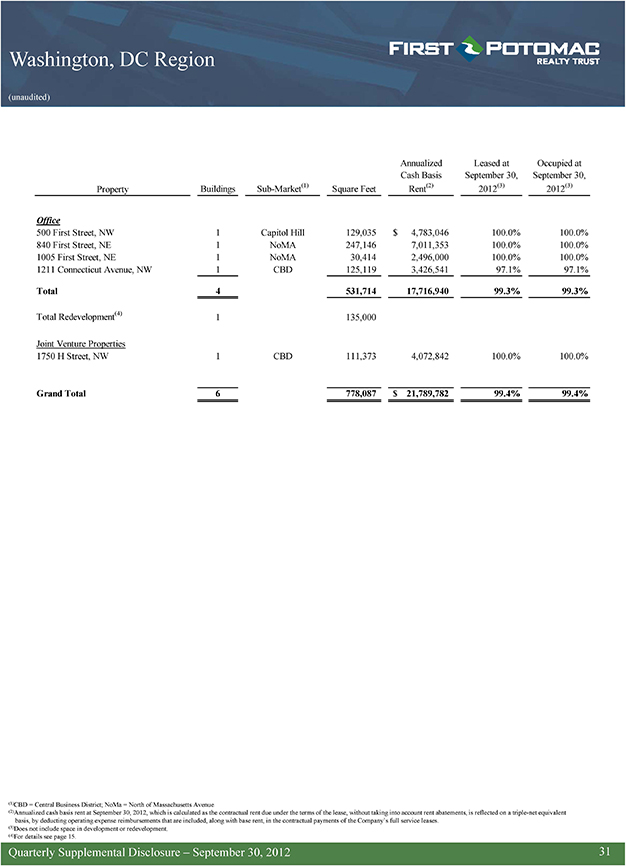
Washington, DC Region (unaudited) Annualized Leased at Occupied at Cash Basis September 30, September 30, Property Buildings Sub-Market(1) Square Feet Rent(2) 2012(3) 2012(3) Office 500 First Street, NW 1 Capitol Hill 129,035 $ 4,783,046 100.0% 100.0% 840 First Street, NE 1 NoMA 247,146 7,011,353 100.0% 100.0% 1005 First Street, NE 1 NoMA 30,414 2,496,000 100.0% 100.0% 1211 Connecticut Avenue, NW 1 CBD 125,119 3,426,541 97.1% 97.1% Total 4 531,714 17,716,940 99.3% 99.3% Total Redevelopment(4) 1 135,000 Joint Venture Properties 1750 H Street, NW 1 CBD 111,373 4,072,842 100.0% 100.0% Grand Total 6 778,087 $ 21,789,782 99.4% 99.4% (1)CBD = Central Business District; NoMa = North of Massachusetts Avenue (2)Annualized cash basis rent at September 30, 2012, which is calculated as the contractual rent due under the terms of the lease, without taking into account rent abatements, is reflected on a triple-net equivalent basis, by deducting operating expense reimbursements that are included, along with base rent, in the contractual payments of the Company’s full service leases. (3)Does not include space in development or redevelopment. (4)For details see page 15. Quarterly Supplemental Disclosure – September 30, 2012 31
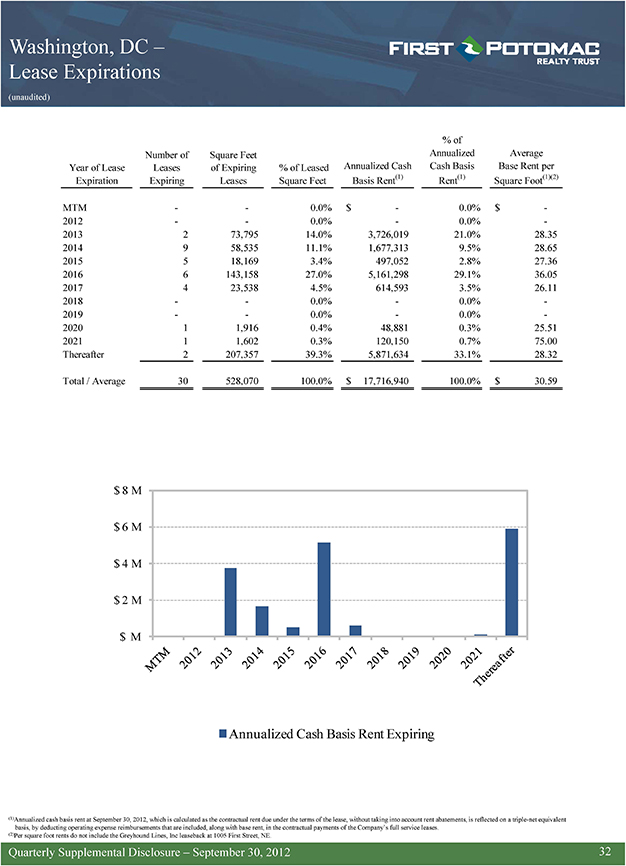
Washington, DC –Lease Expirations (unaudited) % of Number of Square Feet Annualized Average Year of Lease Leases of Expiring % of Leased Annualized Cash Cash Basis Base Rent per Expiration Expiring Leases Square Feet Basis Rent(1) Rent(1) Square Foot(1)(2) MTM—- 0.0% $—0.0% $ -2012—- 0.0%—0.0% -2013 2 73,795 14.0% 3,726,019 21.0% 28.35 2014 9 58,535 11.1% 1,677,313 9.5% 28.65 2015 5 18,169 3.4% 497,052 2.8% 27.36 2016 6 143,158 27.0% 5,161,298 29.1% 36.05 2017 4 23,538 4.5% 614,593 3.5% 26.11 2018—- 0.0%—0.0% -2019—- 0.0%—0.0% -2020 1 1,916 0.4% 48,881 0.3% 25.51 2021 1 1,602 0.3% 120,150 0.7% 75.00 Thereafter 2 207,357 39.3% 5,871,634 33.1% 28.32 Total / Average 30 528,070 100.0% $ 17,716,940 100.0% $ 30.59 $ 8 M $ 6 M $ 4 M $ 2 M $ M Annualized Cash Basis Rent Expiring (1)Annualized cash basis rent at September 30, 2012, which is calculated as the contractual rent due under the terms of the lease, without taking into account rent abatements, is reflected on a triple-net equivalent basis, by deducting operating expense reimbursements that are included, along with base rent, in the contractual payments of the Company’s full service leases. (2)Per square foot rents do not include the Greyhound Lines, Inc leaseback at 1005 First Street, NE. Quarterly Supplemental Disclosure – September 30, 2012 32
Maryland Region
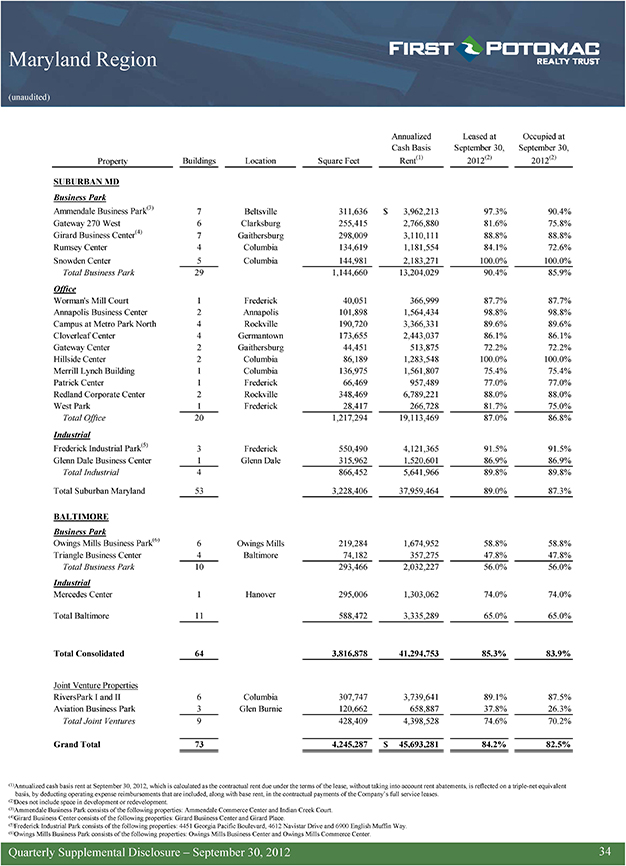
Maryland Region (unaudited) Annualized Leased at Occupied at Cash Basis September 30, September 30, Property Buildings Location Square Feet Rent(1) 2012(2) 2012(2) SUBURBAN MD Business Park Ammendale Business Park(3) 7 Beltsville 311,636 $ 3,962,213 97.3% 90.4% Gateway 270 West 6 Clarksburg 255,415 2,766,880 81.6% 75.8% Girard Business Center(4) 7 Gaithersburg 298,009 3,110,111 88.8% 88.8% Rumsey Center 4 Columbia 134,619 1,181,554 84.1% 72.6% Snowden Center 5 Columbia 144,981 2,183,271 100.0% 100.0% Total Business Park 29 1,144,660 13,204,029 90.4% 85.9% Office Worman’s Mill Court 1 Frederick 40,051 366,999 87.7% 87.7% Annapolis Business Center 2 Annapolis 101,898 1,564,434 98.8% 98.8% Campus at Metro Park North 4 Rockville 190,720 3,366,331 89.6% 89.6% Cloverleaf Center 4 Germantown 173,655 2,443,037 86.1% 86.1% Gateway Center 2 Gaithersburg 44,451 513,875 72.2% 72.2% Hillside Center 2 Columbia 86,189 1,283,548 100.0% 100.0% Merrill Lynch Building 1 Columbia 136,975 1,561,807 75.4% 75.4% Patrick Center 1 Frederick 66,469 957,489 77.0% 77.0% Redland Corporate Center 2 Rockville 348,469 6,789,221 88.0% 88.0% West Park 1 Frederick 28,417 266,728 81.7% 75.0% Total Office 20 1,217,294 19,113,469 87.0% 86.8% Industrial Frederick Industrial Park(5) 3 Frederick 550,490 4,121,365 91.5% 91.5% Glenn Dale Business Center 1 Glenn Dale 315,962 1,520,601 86.9% 86.9% Total Industrial 4 866,452 5,641,966 89.8% 89.8% Total Suburban Maryland 53 3,228,406 37,959,464 89.0% 87.3% BALTIMORE Business Park Owings Mills Business Park(6) 6 Owings Mills 219,284 1,674,952 58.8% 58.8% Triangle Business Center 4 Baltimore 74,182 357,275 47.8% 47.8% Total Business Park 10 293,466 2,032,227 56.0% 56.0% Industrial Mercedes Center 1 Hanover 295,006 1,303,062 74.0% 74.0% Total Baltimore 11 588,472 3,335,289 65.0% 65.0% Total Consolidated 64 3,816,878 41,294,753 85.3% 83.9% Joint Venture Properties RiversPark I and II 6 Columbia 307,747 3,739,641 89.1% 87.5% Aviation Business Park 3 Glen Burnie 120,662 658,887 37.8% 26.3% Total Joint Ventures 9 428,409 4,398,528 74.6% 70.2% Grand Total 73 4,245,287 $ 45,693,281 84.2% 82.5% (1)Annualized cash basis rent at September 30, 2012, which is calculated as the contractual rent due under the terms of the lease, without taking into account rent abatements, is reflected on a triple-net equivalent basis, by deducting operating expense reimbursements that are included, along with base rent, in the contractual payments of the Company’s full service leases. (2)Does not include space in development or redevelopment. (3)Ammendale Business Park consists of the following properties: Ammendale Commerce Center and Indian Creek Court. (4)Girard Business Center consists of the following properties: Girard Business Center and Girard Place. (5)Frederick Industrial Park consists of the following properties: 4451 Georgia Pacific Boulevard, 4612 Navistar Drive and 6900 English Muffin Way. (6)Owings Mills Business Park consists of the following properties: Owings Mills Business Center and Owings Mills Commerce Center. Quarterly Supplemental Disclosure – September 30, 2012 34
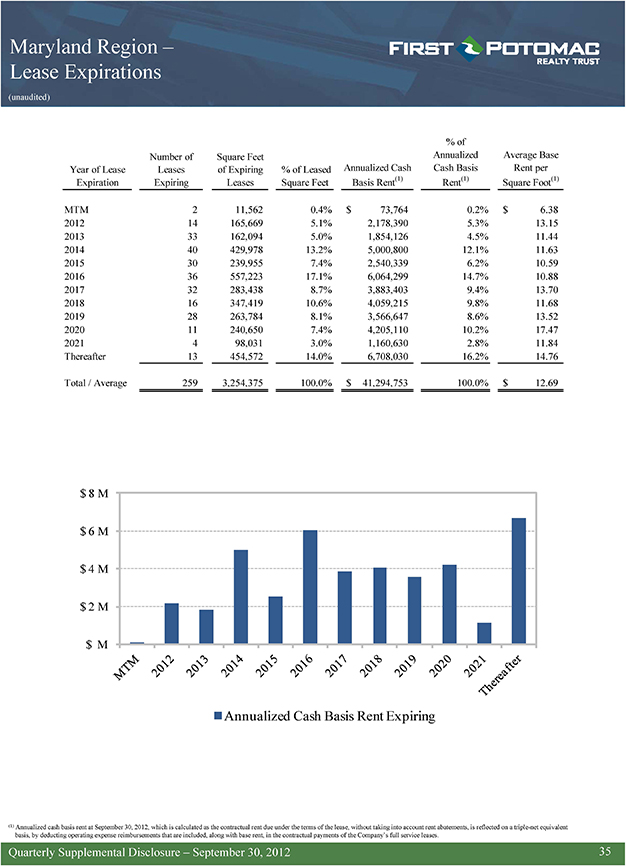
Maryland Region –Lease Expirations (unaudited) % of Number of Square Feet Annualized Average Base Year of Lease Leases of Expiring % of Leased Annualized Cash Cash Basis Rent per Expiration Expiring Leases Square Feet Basis Rent(1) Rent(1) Square Foot(1) MTM 2 11,562 0.4% $ 73,764 0.2% $ 6.38 2012 14 165,669 5.1% 2,178,390 5.3% 13.15 2013 33 162,094 5.0% 1,854,126 4.5% 11.44 2014 40 429,978 13.2% 5,000,800 12.1% 11.63 2015 30 239,955 7.4% 2,540,339 6.2% 10.59 2016 36 557,223 17.1% 6,064,299 14.7% 10.88 2017 32 283,438 8.7% 3,883,403 9.4% 13.70 2018 16 347,419 10.6% 4,059,215 9.8% 11.68 2019 28 263,784 8.1% 3,566,647 8.6% 13.52 2020 11 240,650 7.4% 4,205,110 10.2% 17.47 2021 4 98,031 3.0% 1,160,630 2.8% 11.84 Thereafter 13 454,572 14.0% 6,708,030 16.2% 14.76 Total / Average 259 3,254,375 100.0% $ 41,294,753 100.0% $ 12.69 $ 8 M $ 6 M $ 4 M $ 2 M $ M Annualized Cash Basis Rent Expiring (1) Annualized cash basis rent at September 30, 2012, which is calculated as the contractual rent due under the terms of the lease, without taking into account rent abatements, is reflected on a triple-net equivalent basis, by deducting operating expense reimbursements that are included, along with base rent, in the contractual payments of the Company’s full service leases. Quarterly Supplemental Disclosure – September 30, 2012 35
Northern Virginia Region
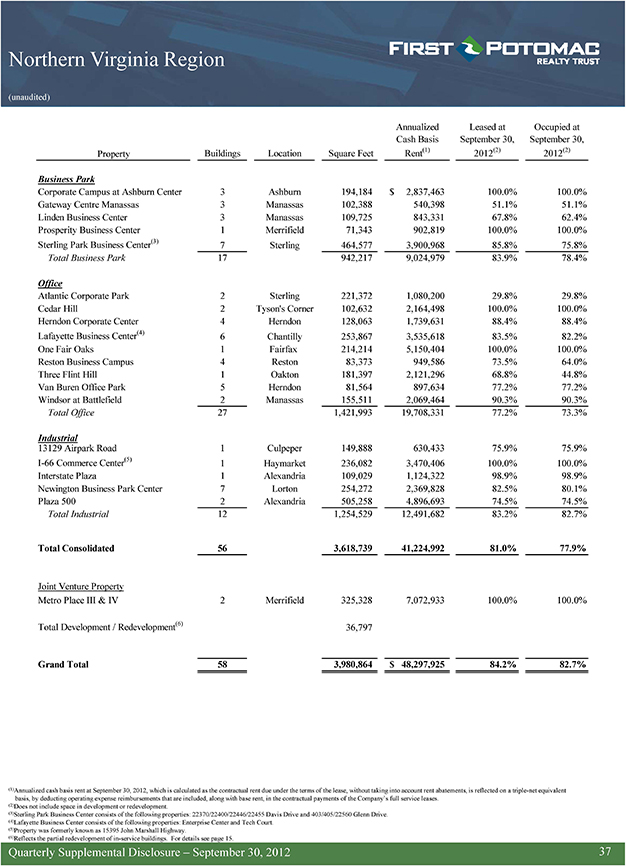
Northern Virginia Region (unaudited) Annualized Leased at Occupied at Cash Basis September 30, September 30, Property Buildings Location Square Feet Rent(1) 2012(2) 2012(2) Business Park Corporate Campus at Ashburn Center 3 Ashburn 194,184 $ 2,837,463 100.0% 100.0% Gateway Centre Manassas 3 Manassas 102,388 540,398 51.1% 51.1% Linden Business Center 3 Manassas 109,725 843,331 67.8% 62.4% Prosperity Business Center 1 Merrifield 71,343 902,819 100.0% 100.0% Sterling Park Business Center(3) 7 Sterling 464,577 3,900,968 85.8% 75.8% Total Business Park 17 942,217 9,024,979 83.9% 78.4% Office Atlantic Corporate Park 2 Sterling 221,372 1,080,200 29.8% 29.8% Cedar Hill 2 Tyson’s Corner 102,632 2,164,498 100.0% 100.0% Herndon Corporate Center 4 Herndon 128,063 1,739,631 88.4% 88.4% Lafayette Business Center(4) 6 Chantilly 253,867 3,535,618 83.5% 82.2% One Fair Oaks 1 Fairfax 214,214 5,150,404 100.0% 100.0% Reston Business Campus 4 Reston 83,373 949,586 73.5% 64.0% Three Flint Hill 1 Oakton 181,397 2,121,296 68.8% 44.8% Van Buren Office Park 5 Herndon 81,564 897,634 77.2% 77.2% Windsor at Battlefield 2 Manassas 155,511 2,069,464 90.3% 90.3% Total Office 27 1,421,993 19,708,331 77.2% 73.3% Industrial 13129 Airpark Road 1 Culpeper 149,888 630,433 75.9% 75.9% I-66 Commerce Center(5) 1 Haymarket 236,082 3,470,406 100.0% 100.0% Interstate Plaza 1 Alexandria 109,029 1,124,322 98.9% 98.9% Newington Business Park Center 7 Lorton 254,272 2,369,828 82.5% 80.1% Plaza 500 2 Alexandria 505,258 4,896,693 74.5% 74.5% Total Industrial 12 1,254,529 12,491,682 83.2% 82.7% Total Consolidated 56 3,618,739 41,224,992 81.0% 77.9% Joint Venture Property Metro Place III & IV 2 Merrifield 325,328 7,072,933 100.0% 100.0% Total Development / Redevelopment(6) 36,797 Grand Total 58 3,980,864 $ 48,297,925 84.2% 82.7% (1)Annualized cash basis rent at September 30, 2012, which is calculated as the contractual rent due under the terms of the lease, without taking into account rent abatements, is reflected on a triple-net equivalent basis, by deducting operating expense reimbursements that are included, along with base rent, in the contractual payments of the Company’s full service leases. (2)Does not include space in development or redevelopment. (3)Sterling Park Business Center consists of the following properties: 22370/22400/22446/22455 Davis Drive and 403/405/22560 Glenn Drive. (4)Lafayette Business Center consists of the following properties: Enterprise Center and Tech Court. (5)Property was formerly known as 15395 John Marshall Highway. (6)Reflects the partial redevelopment of in-service buildings. For details see page 15. Quarterly Supplemental Disclosure – September 30, 2012 37
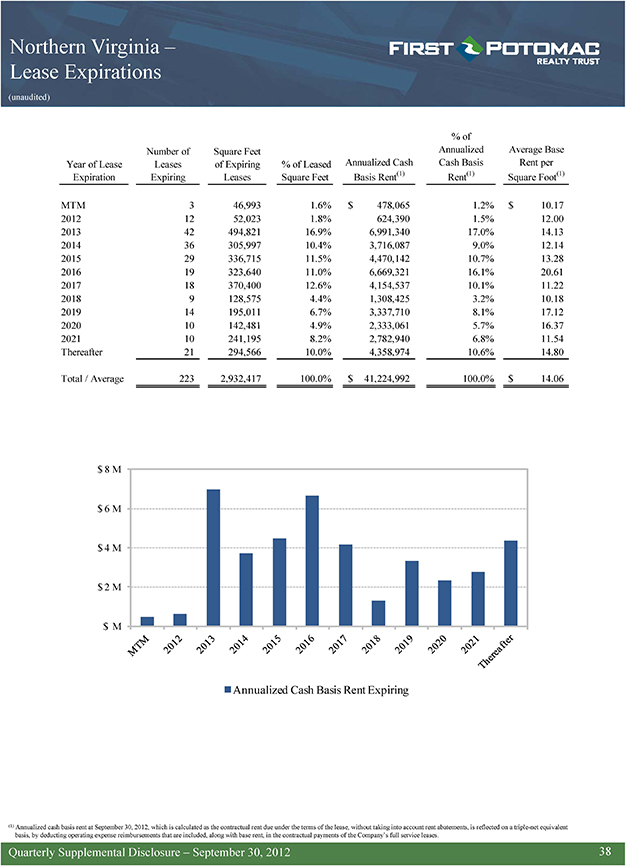
Northern Virginia –Lease Expirations (unaudited) % of Number of Square Feet Annualized Average Base Year of Lease Leases of Expiring % of Leased Annualized Cash Cash Basis Rent per Expiration Expiring Leases Square Feet Basis Rent(1) Rent(1) Square Foot(1) MTM 3 46,993 1.6% $ 478,065 1.2% $ 10.17 2012 12 52,023 1.8% 624,390 1.5% 12.00 2013 42 494,821 16.9% 6,991,340 17.0% 14.13 2014 36 305,997 10.4% 3,716,087 9.0% 12.14 2015 29 336,715 11.5% 4,470,142 10.7% 13.28 2016 19 323,640 11.0% 6,669,321 16.1% 20.61 2017 18 370,400 12.6% 4,154,537 10.1% 11.22 2018 9 128,575 4.4% 1,308,425 3.2% 10.18 2019 14 195,011 6.7% 3,337,710 8.1% 17.12 2020 10 142,481 4.9% 2,333,061 5.7% 16.37 2021 10 241,195 8.2% 2,782,940 6.8% 11.54 Thereafter 21 294,566 10.0% 4,358,974 10.6% 14.80 Total / Average 223 2,932,417 100.0% $ 41,224,992 100.0% $ 14.06 $ 8 M $ 6 M $ 4 M $ 2 M $ M Annualized Cash Basis Rent Expiring (1) Annualized cash basis rent at September 30, 2012, which is calculated as the contractual rent due under the terms of the lease, without taking into account rent abatements, is reflected on a triple-net equivalent basis, by deducting operating expense reimbursements that are included, along with base rent, in the contractual payments of the Company’s full service leases. Quarterly Supplemental Disclosure – September 30, 2012 38
Southern Virginia
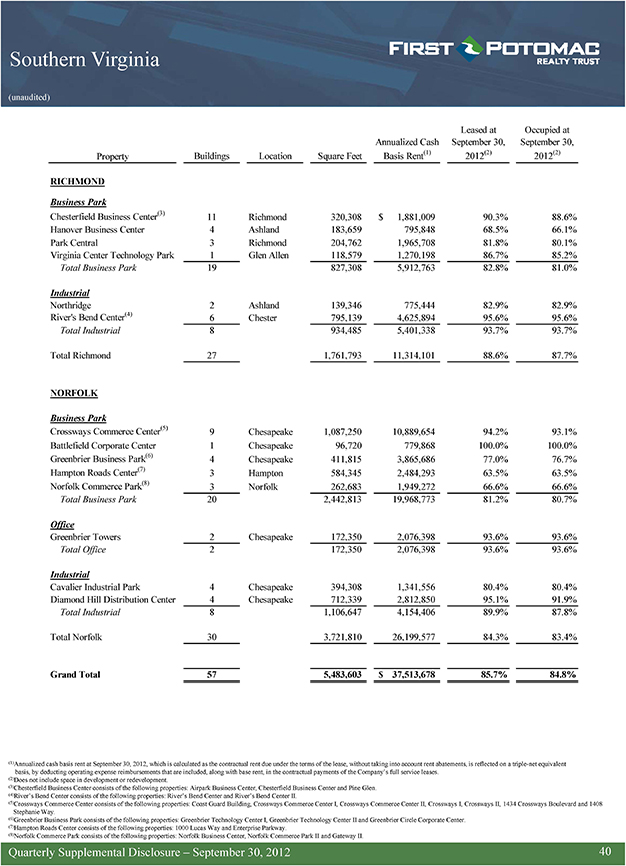
Southern Virginia (unaudited) Leased at Occupied at Annualized Cash September 30, September 30, Property Buildings Location Square Feet Basis Rent(1) 2012(2) 2012(2) RICHMOND Business Park Chesterfield Business Center(3) 11 Richmond 320,308 $ 1,881,009 90.3% 88.6% Hanover Business Center 4 Ashland 183,659 795,848 68.5% 66.1% Park Central 3 Richmond 204,762 1,965,708 81.8% 80.1% Virginia Center Technology Park 1 Glen Allen 118,579 1,270,198 86.7% 85.2% Total Business Park 19 827,308 5,912,763 82.8% 81.0% Industrial Northridge 2 Ashland 139,346 775,444 82.9% 82.9% River’s Bend Center(4) 6 Chester 795,139 4,625,894 95.6% 95.6% Total Industrial 8 934,485 5,401,338 93.7% 93.7% Total Richmond 27 1,761,793 11,314,101 88.6% 87.7% NORFOLK Business Park Crossways Commerce Center(5) 9 Chesapeake 1,087,250 10,889,654 94.2% 93.1% Battlefield Corporate Center 1 Chesapeake 96,720 779,868 100.0% 100.0% Greenbrier Business Park(6) 4 Chesapeake 411,815 3,865,686 77.0% 76.7% Hampton Roads Center(7) 3 Hampton 584,345 2,484,293 63.5% 63.5% Norfolk Commerce Park(8) 3 Norfolk 262,683 1,949,272 66.6% 66.6% Total Business Park 20 2,442,813 19,968,773 81.2% 80.7% Office Greenbrier Towers 2 Chesapeake 172,350 2,076,398 93.6% 93.6% Total Office 2 172,350 2,076,398 93.6% 93.6% Industrial Cavalier Industrial Park 4 Chesapeake 394,308 1,341,556 80.4% 80.4% Diamond Hill Distribution Center 4 Chesapeake 712,339 2,812,850 95.1% 91.9% Total Industrial 8 1,106,647 4,154,406 89.9% 87.8% Total Norfolk 30 3,721,810 26,199,577 84.3% 83.4% Grand Total 57 5,483,603 $ 37,513,678 85.7% 84.8% (1)Annualized cash basis rent at September 30, 2012, which is calculated as the contractual rent due under the terms of the lease, without taking into account rent abatements, is reflected on a triple-net equivalent basis, by deducting operating expense reimbursements that are included, along with base rent, in the contractual payments of the Company’s full service leases. (2)Does not include space in development or redevelopment. (3)Chesterfield Business Center consists of the following properties: Airpark Business Center, Chesterfield Business Center and Pine Glen. (4)River’s Bend Center consists of the following properties: River’s Bend Center and River’s Bend Center II. (5)Crossways Commerce Center consists of the following properties: Coast Guard Building, Crossways Commerce Center I, Crossways Commerce Center II, Crossways I, Crossways II, 1434 Crossways Boulevard and 1408 Stephanie Way. (6)Greenbrier Business Park consists of the following properties: Greenbrier Technology Center I, Greenbrier Technology Center II and Greenbrier Circle Corporate Center. (7)Hampton Roads Center consists of the following properties: 1000 Lucas Way and Enterprise Parkway. (8)Norfolk Commerce Park consists of the following properties: Norfolk Business Center, Norfolk Commerce Park II and Gateway II. Quarterly Supplemental Disclosure – September 30, 2012 40
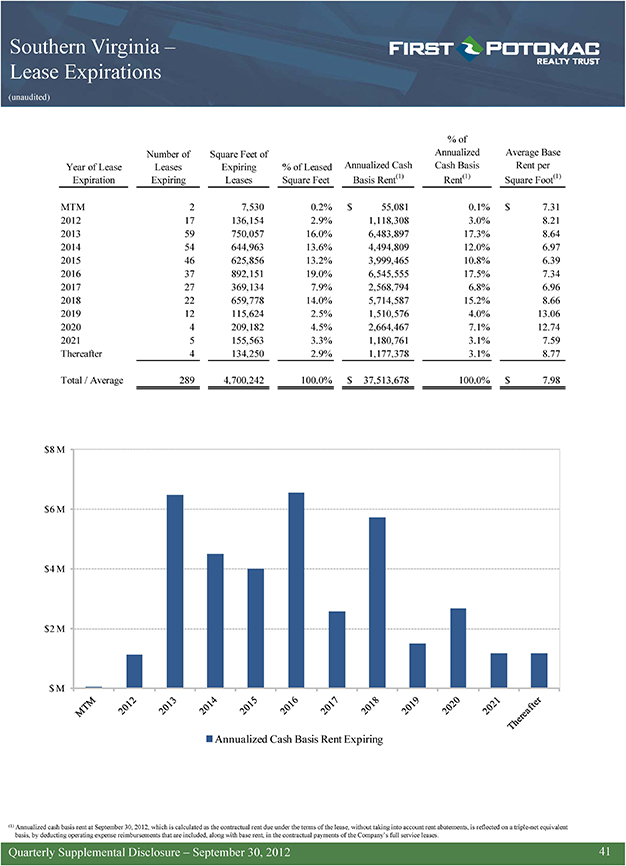
Southern Virginia –Lease Expirations (unaudited) % of Number of Square Feet of Annualized Average Base Year of Lease Leases Expiring % of Leased Annualized Cash Cash Basis Rent per Expiration Expiring Leases Square Feet Basis Rent(1) Rent(1) Square Foot(1) MTM 2 7,530 0.2% $ 55,081 0.1% $ 7.31 2012 17 136,154 2.9% 1,118,308 3.0% 8.21 2013 59 750,057 16.0% 6,483,897 17.3% 8.64 2014 54 644,963 13.6% 4,494,809 12.0% 6.97 2015 46 625,856 13.2% 3,999,465 10.8% 6.39 2016 37 892,151 19.0% 6,545,555 17.5% 7.34 2017 27 369,134 7.9% 2,568,794 6.8% 6.96 2018 22 659,778 14.0% 5,714,587 15.2% 8.66 2019 12 115,624 2.5% 1,510,576 4.0% 13.06 2020 4 209,182 4.5% 2,664,467 7.1% 12.74 2021 5 155,563 3.3% 1,180,761 3.1% 7.59 Thereafter 4 134,250 2.9% 1,177,378 3.1% 8.77 Total / Average 289 4,700,242 100.0% $ 37,513,678 100.0% $ 7.98 $8 M $6 M $4 M $2 M $ M Annualized Cash Basis Rent Expiring (1) Annualized cash basis rent at September 30, 2012, which is calculated as the contractual rent due under the terms of the lease, without taking into account rent abatements, is reflected on a triple-net equivalent basis, by deducting operating expense reimbursements that are included, along with base rent, in the contractual payments of the Company’s full service leases. Quarterly Supplemental Disclosure – September 30, 2012 41
Management Statements on Non-GAAP Supplemental Measures Investors depreciation andand analysts amortization following (“EBITDA”) the real estate andindustry adjustedutilize funds from fundsoperations from operations (“AFFO”), (“FFO”), variously net operating defined, income as supplemental (“NOI”),performance earnings before measures. interest, taxes, The reflecting Company the assumption believes FFO, that NOI, real estate EBITDA assetand values AFFO riseare or appropriate fall with market measures conditions, given their principally wide use adjusts by and for the relevance effectsto ofinvestors depreciation/amortization and analysts. FFO, of real factor estate in depreciation/amortization assets (in accordance with and U.non-property S. generally accepted specific expenses accounting such principles as general (“GAAP”)) and administrative . NOI provides expenses. a measure In addition, of rentalFFO, operations NOI, EBITDAand and doesnot AFFO and value. are commonly used in various ratios, pricing multiples/yields and returns and valuation calculations used to measure financial position, performance NOI The Company defines net operating income (“NOI”) as operating revenues (rental income, tenant reimbursements and other income) less property and related expenses (property expenses, real estate taxes and insurance). Management believes that NOI is a useful measure of the Company’s property operating performance as it provides a performance measure of the revenues and expenses directly associated with owning, operating, developing and redeveloping office and industrial properties, and provides a perspective not immediately apparent from net income or FFO. Other real estate investment trusts (“REITs”) may use different methodologies for calculating NOI, and accordingly, the Company’s NOI may not be comparable to other REITs. The Company’s NOI calculations are reconciled to total revenues and total operating expenses earlier in this Supplemental Financial Report. Same-Property NOI Same-Property Net Operating Income (“Same-Property NOI”), defined as operating revenues (rental, tenant reimbursements and other revenues) less operating expenses (property operating expenses, real estate taxes and insurance) from the properties owned by the Company for the entirety of the periods presented, is a primary performance measure the Company uses to assess the results of operations at its properties. As an indication of the Company’s operating performance, Same-Property NOI should not be considered an alternative to net income calculated in accordance with GAAP. A reconciliationof the Company’s Same-Property NOI to net income from its consolidated statements of operations is presented earlier in this Supplemental Financial Report. The Same-Property NOI results exclude corporate-level expenses, as well as certain transactions, such as the collection of termination fees, as these items vary significantly period-over-period thus impacting trends and comparability. Also, the Company eliminates depreciation and amortization expense, which are property level expenses, in computing Same-Property NOI as these are non-cash expenses that are based on historical cost accounting assumptions and do not offer the investor significant insight into the operations of the property. This presentation allows management and investors to distinguish whether growth or declines in net operating income are a result of increases or decreases in property operations or the acquisition of additional properties. While this presentation provides useful information to management and investors, the results below should be read in conjunction with the results from the consolidated statements of operations to provide a complete depiction of total Company performance. EBITDA Management depreciation and believes amortization. that EBITDA isa useful measure of the Company’s operating performance. EBITDA is defined as earnings before interest, taxes, amortization, Management considers gain (loss)EBITDA from property to be an dispositions appropriate and supplemental loss on earlyperformance retirement of measure debt. This since calculation it represents facilitates earnings the prior review to the of income impact from of depreciation, operations without Supplemental considering Financial theReport. effect of non-cash depreciation and amortization or the cost of debt. EBITDA is reconciled to net income (loss) earlier in this Funds from Operations Funds from operations (“FFO”) represents net income (computed in accordance with GAAP) excluding gains (losses) on sales of real estate and impairments of real estate assets, plus real estate-related depreciation and amortization and after adjustments for unconsolidated partnerships and joint ventures. On October 31, 2011, NAREIT issued revised guidance regarding the exclusion of impairment write-downs of depreciable assets reported in FFO. As a result, the Company began excluding impairment losses from FFO in the fourth quarter of 2011 and has restated FFO from prior periods to exclude such charges consistent with NAREIT’sguidance. The Company also excludes, from its FFO calculation, any depreciation and amortization related to third parties from its consolidated joint ventures. The Company considers FFO a useful measure of performance for an equity REIT because it facilitates an understandingof the operating performance of its properties without giving effect to real estate depreciation and amortization, which assume that the value of real estate assets diminishes predictably over time. Since real estate values have historically risen or fallen with market conditions, the Company believes that FFO provides a meaningful indication of its performance. The Company also considers FFO an appropriate performance measure given its wide use by investors and analysts. The Company computes FFO in accordance with standards established by the Board of Governors of NAREIT in its March 1995 White Paper (as amended in November 1999, April 2002 and January 2012), which may differ from the methodology for calculating FFO utilized by other equity REITs and, accordingly, may not be comparable to such other REITs. Further, FFO does not represent amounts available for management’s discretionary use because of needed capital replacement or expansion, debt service obligations or other commitments and uncertainties, nor is it indicative of funds available to fund the Company’s cash needs, including its ability to make distributions. The Company presents FFO per diluted share calculations that are based on the outstanding dilutive common shares plus the outstanding Operating Partnership units for the periods presented. The Company’s presentation of FFO in accordance with the NAREIT white paper, or as adjusted by the Company, should not be considered as an alternative to net income (computed in accordance with GAAP) as an indicator of the Company’s financial performance or to cash flow from operating activities (computed in accordance with GAAP) as an indicator of its liquidity. The Company’s FFO calculations are reconciled to net income earlier in this Supplemental Financial Report. CORE FFO provided Management by the believes Company’s that the operating computation portfolio of and FFOaffect in accordance the comparability with NAREIT’s of the Company’s definitionperiod-over-period includes certain items performance. that are not These indicative items include, of the but results are not separation limitedcosts, to, gains contingent and losses consideration on the extinguishment charges and acquisition of debt, legal costs. andThe accounting Company costs provides related a to reconciliation the Company’s of FFO internal to Core investigation, FFO earlier personnel in this Supplemental Financial Report. AFFO non-real The Company estate computes depreciation, AFFO andby then adding subtracting to Core cash FFO paid equity for any based recurring compensation tenant improvements, expense and the leasing non-cash commissions, amortization andof recurring deferredcapital financing expenditures, costs and and eliminating the net effect of straight-line rents, deferred market rent and debt fair value amortization. purchase First generation of a property costs include or incurred tenant improvements, to bring the property leasing commissions to operatingand standard capitalfor expenditures its intended thatuse. wereThe taken Company into consideration also excludes whendevelopment underwritingand the may redevelopment not be comparable related expenditures. to other REITs. However, The Company other REITs provides may a use reconciliation different methodologies of Core FFO to for AFFO calculating earlier AFFO in this and, Supplemental accordingly, Financial the Company’s Report. AFFO Quarterly Supplemental Disclosure – September 30, 2012 42