|
|
| SECOND QUARTER 2014 |
| SUPPLEMENTAL FINANCIAL INFORMATION |
|
| | |
| FIRST | | |
| POTOMAC | | |
REALTY TRUST | | www.first-potomac.com |
|
| | |
| | Index to Supplemental Information
|
|
| |
| | Page |
Company Information |
2 |
| Geographic Footprint | 3 |
| Earnings Release | 4 |
| Consolidated Statements of Operations | 12 |
| Consolidated Balance Sheets | 15 |
| Same-Property Analysis | 16 |
| Highlights | 17 |
| Quarterly Financial Results | 18 |
| Supplemental Financial Results | 19 |
| Quarterly Financial Measures | 20 |
| Capitalization and Selected Ratios | 21 |
| Outstanding Debt | 22 |
| Debt Maturity Schedule | 23 |
| Selected Debt Covenants | 24 |
| Net Asset Value Analysis | 25 |
| Investment in Joint Ventures | 26 |
| Portfolio Summary | 27 |
| Leasing and Occupancy Summary | 28 |
| Portfolio by Size | 29 |
| Top Twenty-Five Tenants | 30 |
| Annual Lease Expirations | 31 |
| Quarterly Lease Expirations | 32 |
| Leasing Analysis | 33 |
| Retention Summary | 34 |
| Office Properties | 35 |
| Business Park / Industrial Properties | 36 |
| Management Statements on Non-GAAP Supplemental Measures | 37 |
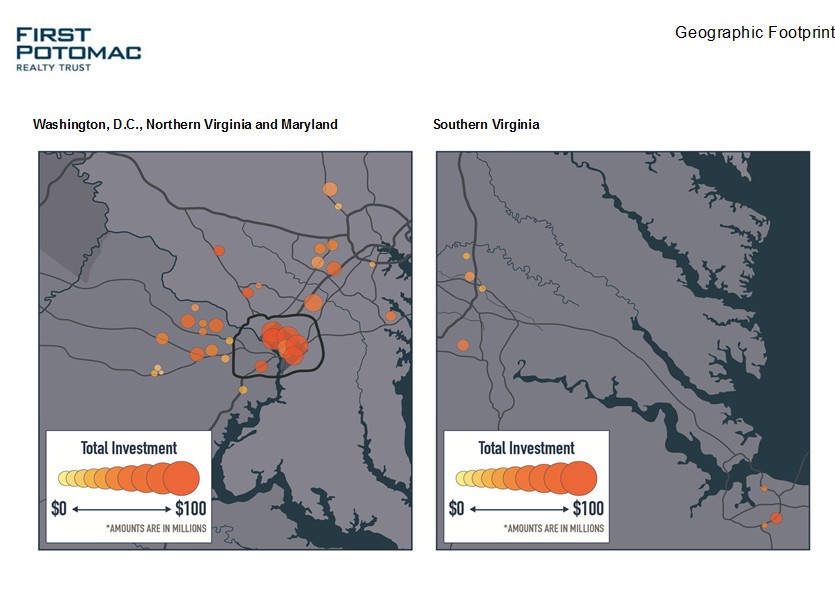
First Potomac Realty Trust is a leader in the ownership, management, development and redevelopment of office and business park properties in the greater Washington, DC region. Our focus is on acquiring properties that can benefit from our intensive property management, and repositioning properties to increase their profitability and value.
|
| | | |
| Corporate Headquarters | | 7600 Wisconsin Avenue |
| | | 11th Floor |
| | | Bethesda, MD 20814 |
| | | | |
| New York Stock Exchange | | | |
| | |
| | | | |
| Website | | www.first-potomac.com |
| | | | |
| Investor Relations | | Jaime N. Marcus |
| | | Director, Investor Relations |
| | | (301) 986-9200 |
| | | jmarcus@first-potomac.com |
The forward-looking statements contained in this supplemental financial information, including statements in our earnings release regarding our 2014 Core FFO guidance and related assumptions, potential sales and timing of such sales, and future acquisitions and growth opportunities, are subject to various risks and uncertainties. Although we believe the expectations reflected in any forward-looking statements contained herein are based on reasonable assumptions, there can be no assurance that our expectations will be achieved. Certain factors that could cause actual results to differ materially from our expectations include changes in general or regional economic conditions; our ability to timely lease or re-lease space at current or anticipated rents; changes in interest rates; changes in operating costs; our ability to complete acquisitions and, if applicable, dispositions on acceptable terms; our ability to manage our current debt levels and repay or refinance our indebtedness upon maturity or other required payment dates; our ability to maintain financial covenant compliance under our debt agreements; our ability to maintain effective internal controls over financial reporting and disclosure controls and procedures; any impact of the informal inquiry initiated by the U.S. Securities and Exchange Commission (the “SEC”); our ability to obtain debt and/or financing on attractive terms, or at all; changes in the assumptions underlying our earnings and Core FFO guidance and other risks detailed in our Annual Report on Form 10-K and described from time to time in our filings with the SEC. Many of these factors are beyond our ability to control or predict. Forward-looking statements are not guarantees of performance. For forward-looking statements herein, we claim the protection of the safe harbor for forward-looking statements contained in the Private Securities Litigation Reform Act of 1995. We assume no obligation to update or supplement forward-looking statements that become untrue because of subsequent events.
Note that certain figures are rounded to the nearest thousands or to a tenth of a percent throughout the document, which may impact footing and/or crossfooting of totals and subtotals.
|
| | | | |
| CONTACT: | | | | First Potomac Realty Trust |
| Jaime N. Marcus | | | | 7600 Wisconsin Avenue |
| Director, Investor Relations | | | 11th Floor |
| (301) 986-9200 | | | Bethesda, MD 20814 |
| jmarcus@first-potomac.com | | | | www.first-potomac.com |
FIRST POTOMAC REALTY TRUST REPORTS
SECOND QUARTER 2014 RESULTS
Achieves Tenth Consecutive Quarter of Positive Net Absorption
BETHESDA, MD. (July 24, 2014) – First Potomac Realty Trust (NYSE: FPO), a leader in the ownership, management, development and redevelopment of office and business park properties in the greater Washington, D.C. region, reported results for the three and six months ended June 30, 2014.
Second Quarter 2014 Highlights
| |
| • | Reported Core Funds From Operations of $14.5 million, or $0.24 per diluted share. |
| |
| • | Executed 353,000 square feet of leases, including 166,000 square feet of new leases. |
| |
| • | Increased leased percentage in consolidated portfolio to 89.5% from 86.5% at June 30, 2013, and increased leased percentage on strategic hold portfolio to 93.0% from 91.0% at June 30, 2013. |
| |
| • | In April, sold West Park, a 29,000 square foot office building, and Patrick Center, a 66,000 square-foot office building, for aggregate net proceeds of $13.8 million. |
| |
| • | In June, sold Corporate Campus at Ashburn Center, a 194,000 square-foot, single-story business park, for net proceeds of $39.9 million, bringing aggregate net proceeds from dispositions for the year to $85.3 million. |
| |
| • | In April, acquired 1401 K Street, NW, a 117,000 square foot twelve-story, office building located in downtown Washington, D.C., for $58.0 million. |
| |
| • | In June, acquired 1775 Wiehle Avenue, a 130,000 square foot, five-story, fully leased office building located in Reston, Virginia, for $41.0 million, bringing the aggregate purchase price of acquisitions for the year to $99.0 million. |
Douglas J. Donatelli, Chairman and CEO of First Potomac Realty Trust, stated, “I am very pleased with our second quarter results, which demonstrate continued execution of our strategic plan. We delivered our tenth consecutive quarter of positive net absorption, achieved strong leasing results, bringing our leased percentage to 89.5%, closed on the acquisition of two high-quality, multi-story office buildings and continued our capital recycling strategy. Each of these steps gets us closer to our goal of becoming a leading owner of office properties in our region and allows us to focus on opportunities that we believe will lead to long-term value creation for our shareholders.”
Funds From Operations (“FFO”) increased for the three months ended June 30, 2014 compared with the same period in 2013 due to an aggregate loss on debt extinguishment of $4.6 million for the three months ended June 30, 2013, primarily as a result of selling our industrial portfolio in June 2013. As a result of the reduction in net operating income from the sale of our industrial portfolio, FFO for the six months ended June 30, 2014 and Core FFO for the three and six months ended June 30, 2014 decreased compared with the comparable periods in 2013. The reduction in net operating income from the industrial portfolio sale for the three and six months ended June 30, 2014 was partially offset by improvements in net operating income on a same-property basis, as well as a reduction in interest expense, as we
|
| | |
| | Earnings Release - Continued |
decreased the weighted average interest rate on our total outstanding debt by over 100 basis points since June 30, 2013.
A reconciliation between Core FFO and FFO available to common shareholders for the three and six months ended June 30, 2014 and 2013 is presented below (in thousands, except per share amounts):
|
| | | | | | | | | | | | | | | | | | | | | | | | | | | | | | | |
| | Three Months Ended June 30, | | Six Months Ended June 30, |
| | 2014 | | 2013 | | 2014 | | 2013 | |
| | Amount | | Per diluted share | | Amount | | Per diluted share | | Amount | | Per diluted share | | Amount | | Per diluted share |
| Core FFO | $ | 14,452 |
| | $ | 0.24 |
| | $ | 15,886 |
| | $ | 0.28 |
| | $ | 27,816 |
| | $ | 0.46 |
| | $ | 31,733 |
| | $ | 0.58 |
|
| Loss on debt extinguishment | — |
| | — |
| | (4,615 | ) | | (0.08 | ) | | — |
| | — |
| | (4,615 | ) | | (0.08 | ) |
Deferred abatement and straight-line amortization(1) | — |
| | — |
| | — |
| | — |
| | (1,045 | ) | | (0.02 | ) | | 1,567 |
| | 0.03 |
|
| Acquisition costs | (1,111 | ) | | (0.02 | ) | | — |
| | — |
| | (1,179 | ) | | (0.02 | ) | | — |
| | — |
|
Contingent consideration related to acquisition of property(2) | — |
| | — |
| | (75 | ) | | — |
| | — |
| | — |
| | (75 | ) | | — |
|
| Legal costs associated with informal SEC inquiry | — |
| | — |
| | (55 | ) | | — |
| | — |
| | — |
| | (391 | ) | | (0.01 | ) |
| FFO available to common shareholders | $ | 13,341 |
| | $ | 0.22 |
| | $ | 11,141 |
| | $ | 0.20 |
| | $ | 25,592 |
| | $ | 0.42 |
| | $ | 28,219 |
| | $ | 0.52 |
|
| Net income | $ | 18,334 |
| | | | $ | 14,476 |
| | | | $ | 16,892 |
| | | | $ | 16,439 |
| | |
Net income attributable to common shareholders per diluted common share(3) | $ | 0.25 |
| | | | $ | 0.20 |
| | | | $ | 0.17 |
| | | | $ | 0.19 |
| | |
| |
(1) | As a result of the sale of Girard Business Center and Gateway Center in January 2014, we accelerated the amortization of straight-line rents and deferred abatement related to those properties. During the first quarter of 2013, we accelerated the amortization of the straight- line balance and the deferred abatement for Engineering Solutions at I-66 Commerce Center, which terminated its lease prior to completion. The tenant vacated the property at the end of March 2013. The property was sold in May 2013. |
| |
(2) | Reflects an increase in our contingent consideration liability related to our acquisition of Corporate Campus at Ashburn Center in 2009. We |
paid $1.7 million to the seller of the property in the third quarter of 2013 to fulfill our obligation. The property was subsequently sold in June 2014.
| |
(3) | Reflects amounts attributable to noncontrolling interests and the impact of dividends on our preferred shares to arrive at net income attributable to common shareholders. |
A reconciliation of net income to FFO available to common shareholders and Core FFO, as well as definitions and statements of purpose, are included below in the financial tables accompanying this press release and under “Non-GAAP Financial Measures,” respectively.
Operating Performance
At June 30, 2014, our consolidated portfolio consisted of 134 buildings totaling 8.7 million square feet. Our consolidated portfolio was 89.5% leased and 86.0% occupied at June 30, 2014 compared to 86.5% leased and 84.0% occupied at June 30, 2013. Year-over-year, our consolidated portfolio experienced a 300 basis-point increase in our leased percentage and a 200 basis-point increase in our occupied percentage. Our strategic hold portfolio was 93.0% leased and 90.5% occupied at June 30, 2014 and 91.0% leased and 88.4% occupied at June 30, 2013. Our value-add portfolio was 84.4% leased and 61.0% occupied at June 30, 2014 and 59.7% leased and 56.5% occupied at June 30, 2013. Our non-core portfolio was 80.6% leased and 77.7% occupied at June 30, 2014 and 80.7% leased and 78.5% occupied at June 30, 2013.
During the second quarter of 2014, we executed 353,000 square feet of leases, which consisted of 166,000 square feet of new leases and 186,000 square feet of renewal leases, and we achieved a tenant retention rate of 65%. We had positive net absorption of 63,000 square feet in the second quarter
|
| | |
| | Earnings Release - Continued |
of 2014, which resulted in our tenth consecutive quarter of positive net absorption. New leases executed during the second quarter included four new leases, totaling 17,000 square feet, at 440 First Street, NW in Washington, D.C, which brought the property to 34.1% leased at June 30, 2014. For the six months ended June 30, 2014, we achieved positive net absorption of 90,000 square feet, executed 609,000 square feet of leases, which included 311,000 square feet of new leases, and achieved a tenant retention rate of 60%.
Same-Property Net Operating Income (“Same-Property NOI”) increased 0.5% and 0.7% on an accrual basis for the three and six months ended June 30, 2014, respectively compared with the same periods in 2013. For the three months ended June 30, 2014, the increase in Same-Property NOI was primarily due to increases in occupancy at Redland Corporate Center and Gateway 270 West, which are both located in Maryland, and Plaza 500, which is located in Northern Virginia. The increase in Same-Property NOI for the three months ended June 30, 2014 was partially offset by a decrease in Same-Property NOI for the Washington, D.C. region compared with the same period in 2013 as a result of a decrease in occupancy at 1211 Connecticut Avenue, NW, the majority of which was re-leased in the first quarter of 2014. For the six months ended June 30, 2014, we incurred an additional $0.5 million of snow and ice removal costs, net of recoveries, in the same-property pool than during the first six months of 2013. Excluding the impact of the additional snow and ice removal costs, our Same-Property NOI increased 1.9% for the six months ended June 30, 2014 compared with the same period in 2013.
A reconciliation of net income to Same-Property NOI and a definition and statement of purpose are included below in the financial tables accompanying this press release and under “Non-GAAP Financial Measures,” respectively.
A list of our properties, as well as additional information regarding our results of operations, and our definition of “strategic hold,” “value add” and “non-core” as they relate to our portfolio, can be found in our Second Quarter 2014 Supplemental Financial Information Report, which is posted on our website, www.first-potomac.com.
Acquisitions
Consistent with our previously disclosed strategy of focusing on high-quality, multi-story office properties, we continued to improve the portfolio quality with active capital recycling. On April 8, 2014, we acquired 1401 K Street, NW, a 117,000 square foot, twelve-story, office building in downtown Washington, D.C. for $58.0 million. The property is currently 88% leased to 22 tenants. The acquisition was funded with the assumption of a $37.3 million mortgage loan, a $20.0 million draw under our unsecured revolving credit facility and available cash.
On June 25, 2014, we acquired 1775 Wiehle Avenue, a 130,000 square foot, five-story, office building in Reston, Virginia, for $41.0 million. The property is located two blocks from the Wiehle-Reston East Silver Line Metro station, which is expected to open on July 26, 2014, and is conveniently located directly off the Dulles Toll Road. The property is currently 100% leased to eight tenants. The acquisition was funded with the proceeds from the sale of Corporate Campus at Ashburn Center and available cash.
Dispositions
In April 2014, we sold West Park, a 29,000 square foot, four-story office building, and Patrick Center, a 66,000 square foot, seven-story office building, which are both located in Frederick, Maryland, for aggregate net proceeds of $13.8 million. As previously disclosed, we recorded an impairment charge of $2.2 million on West Park in the fourth quarter of 2013. We reported a gain on the sale of Patrick Center of $1.4 million in the second quarter of 2014. At June 30, 2014, the operating results of West Park and
|
| | |
| | Earnings Release - Continued |
Patrick Center for each of the periods presented in this press release, as well as the gain on the sale of Patrick Center are reflected as discontinued operations in our consolidated statements of operations.
On June 26, 2014, we sold Corporate Campus at Ashburn Center, a three-building, 194,000 square foot, single-story business park, which is located in Ashburn, Virginia, for net proceeds of $39.9 million and recorded a gain on the sale of the property of $21.2 million in the second quarter. We purchased the property in an off-market transaction in 2009 for $14.7 million and invested an additional approximately $5 million in the property. At the time of acquisition, the property was 45% leased and it was 100% leased at the time of sale. We used the net proceeds from the sale to acquire 1775 Wiehle Avenue.
On June 23, 2014, we entered into a non-binding contract to sell the four remaining buildings at Owings Mills Business Park, located in Owings Mills, Maryland, which total 180,500 square feet. Based on the anticipated sales price, we recorded an impairment charge of $4.0 million in the second quarter of 2014. The sale is expected to be completed in the third or fourth quarter of 2014. However, we can provide no assurances regarding the timing or pricing of the sale, or that such sale will occur at all. At June 30, 2014, we classified the four buildings at Owings Mills Business Park as “held-for-sale” on our consolidated balance sheet.
During the second quarter of 2014, we prospectively adopted new accounting standards pursuant to the Financial Accounting Standards Board’s Accounting Standards Update No. 2014-08, which requires us to classify the results from a disposed property within discontinued operations only if the disposition of the property represents a strategic shift in operations that has a major impact on financial results. In accordance with the new accounting standards, the operating results and gain on sale of Corporate Center at Ashburn Center and the operating results and impairment of Owings Mills Business Park are reflected in continuing operations in our consolidated statements of operations for each of the periods presented in this press release.
Financing Activity
On May 1, 2014, we prepaid, without penalty, an $8.0 million mortgage loan that encumbered Annapolis Business Center with a draw under our unsecured revolving credit facility.
On July 10, 2014, our 50% owned unconsolidated joint venture repaid a $27.9 million mortgage loan with Wells Fargo that encumbered 1750 H Street, NW, a ten-story, 113,000 square-foot office building located in Washington, D.C. Simultaneous with the repayment, the joint venture entered into a new $32.0 million mortgage loan with State Farm that has a fixed-interest rate of 3.92%, a maturity date of August 1, 2024, and is repayable in full without penalty on or after August 1, 2021. The new loan requires monthly interest-only payments with a constant interest rate over the life of the loan.
Balance Sheet
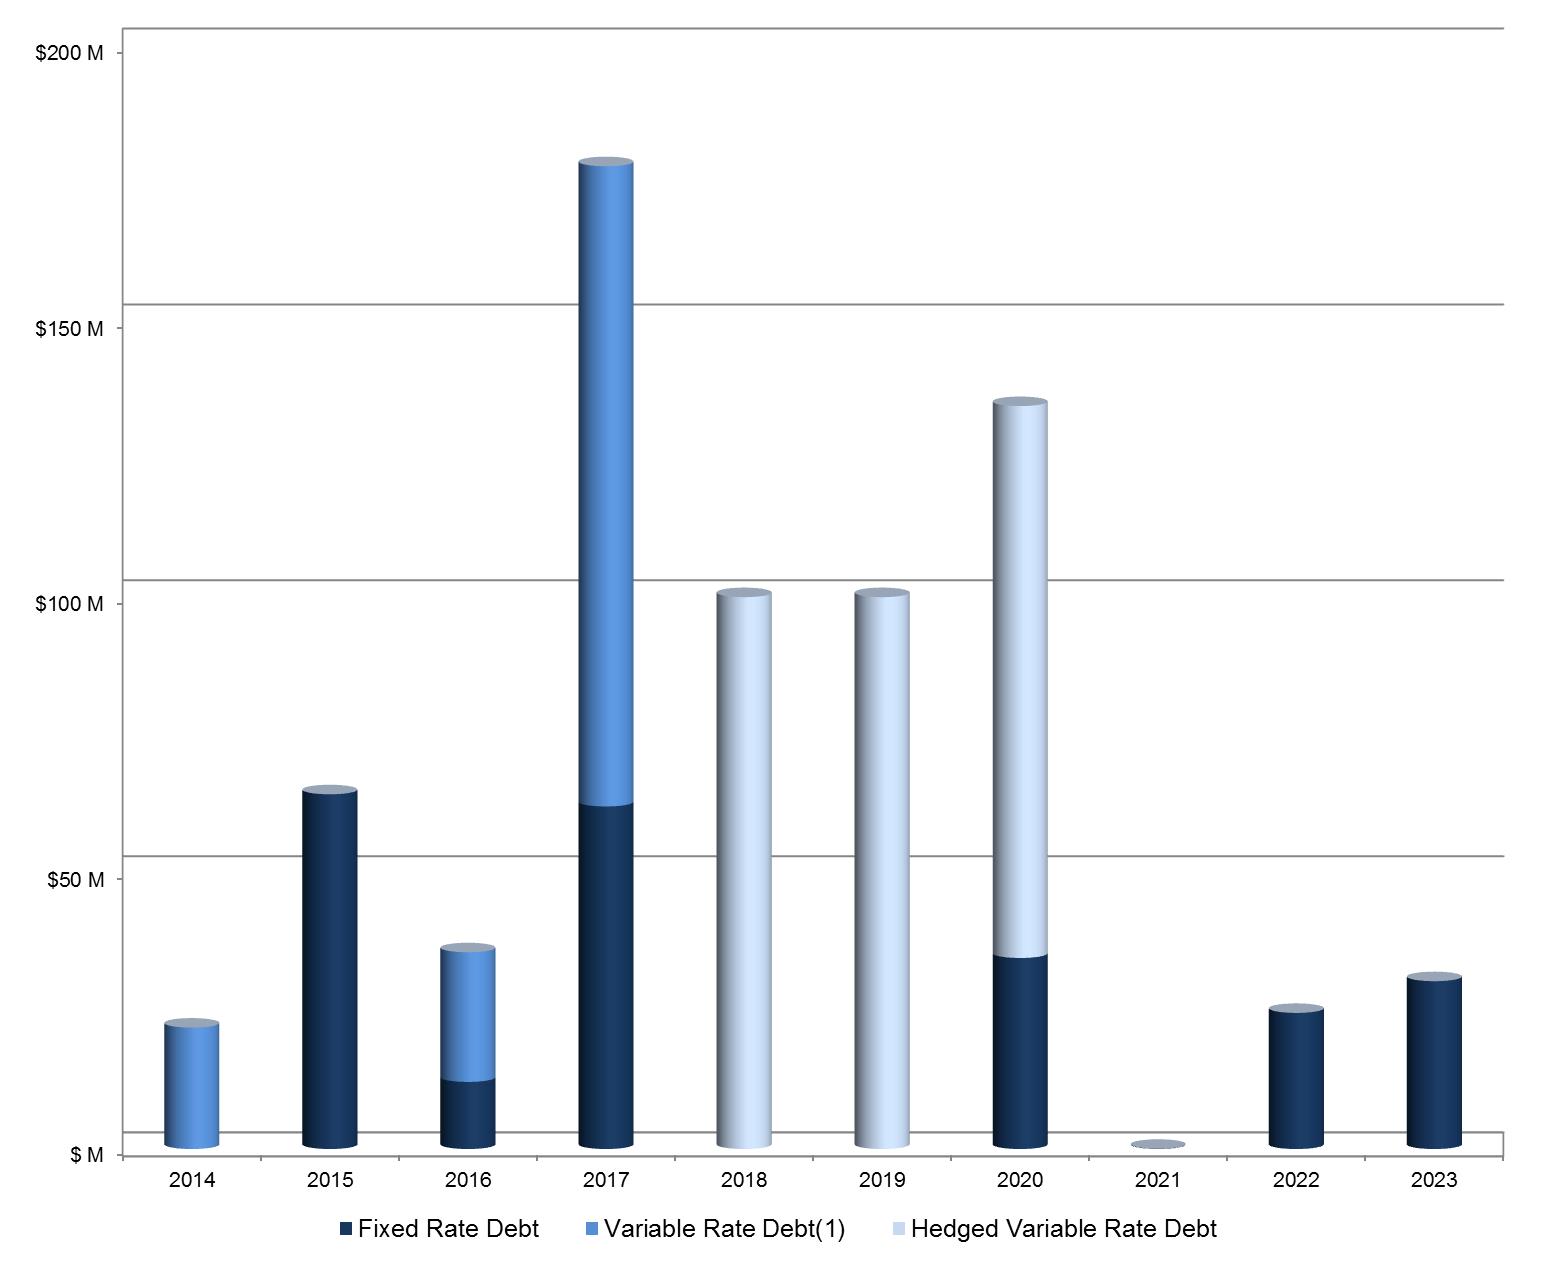
We had $718.9 million of debt outstanding at June 30, 2014, of which $257.4 million was fixed-rate debt, $300.0 million was hedged variable-rate debt and $161.5 million was unhedged variable-rate debt.
|
| | |
| | Earnings Release - Continued |
Dividends
On July 22, 2014, we declared a dividend of $0.15 per common share, equating to an annualized dividend of $0.60 per common share. The dividend will be paid on August 15, 2014 to common shareholders of record as of August 6, 2014. We also declared a dividend of $0.484375 per share on our Series A Preferred Shares. The dividend will be paid on August 15, 2014 to preferred shareholders of record as of August 6, 2014.
Core FFO Guidance
We modified our full-year 2014 Core FFO per share guidance to $0.91 to $0.97 per diluted share, as a result of our expectation that the GSA will not take occupancy at Atlantic Corporate Park until early 2015, and the current anticipated timing and pace of acquisitions for the remainder of the year. Our revised guidance reflects all completed capital recycling activities as of the date of this release. The following is a summary of the assumptions that we used in arriving at our guidance (unaudited, amounts in thousands except percentages and per share amounts):
|
| | | | | | | | | | |
| | | Expected Ranges |
| Portfolio NOI | | | | |
| | | | | |
| Properties Owned December 31, 2013 | | $ | 104,000 |
| — |
| $ | 106,000 |
|
Properties Sold (1) | | | (5,200 | ) | |
Assumption for Additional Dispositions (2) | | | (1,000 | ) | |
Properties Acquired (3) | | | 3,800 |
| |
Assumption for Additional Acquisitions (4) | | 0 |
| — |
| 1,000 |
|
| Total NOI | | $ | 101,600 |
| | $ | 104,600 |
|
| Interest and Other Income | | | $ | 6,500 |
| |
| FFO from Unconsolidated Joint Ventures | | $ | 4,750 |
| — |
| $ | 5,250 |
|
Interest Expense (5) | | $ | 24,500 |
| — |
| $ | 25,500 |
|
| G&A | | $ | 20,000 |
| — |
| $ | 22,000 |
|
| Preferred Dividends | | | $ | 12,400 |
| |
| Weighted Average Shares and Units | | 60,500 |
| — |
| 61,000 |
|
Year-End Occupancy (6) | | 87.0 | % | — |
| 88.5 | % |
Same Property NOI - Accrual Basis (7) | | 2.0 | % | — |
| 3.5 | % |
| |
(1) | Reflects the disposition of Girard Business Center and Gateway Center, which were sold in January 2014, the disposition of West Park and Patrick Center, which were sold in April 2014, and the disposition of Corporate Campus at Ashburn Center, which was sold in June 2014. |
| |
(2) | Assumes $70 million of additional dispositions are made throughout 2014. This is solely an assumption for the purposes of providing |
guidance and is in addition to the properties sold as of the date hereof and listed in footnote (1) above. We can provide no assurances regarding the timing or pricing of any potential dispositions, or that such dispositions will occur at all.
| |
(3) | Reflects the anticipated 2014 NOI from the acquisition of 1401 K Street, NW, which we acquired on April 8, 2014, and the acquisition of Wiehle Avenue, which we acquired on June 25, 2014. |
| |
(4) | Reflects the assumed NOI contribution, if any, from additional acquisitions made throughout 2014, excluding the 2014 NOI from 1401 K |
Street, NW and Wiehle Avenue. However, we can provide no assurances regarding the timing or pricing of any potential acquisitions, or that such additional acquisitions will occur at all.
| |
(5) | Assumes proceeds from properties sold, as well as the assumed additional dispositions are used to repay amounts outstanding under our unsecured revolving credit facility, and capital for additional acquisitions are drawn from the unsecured revolving credit facility, with the exception of the $37.3 million mortgage we assumed with the acquisition of 1401 K Street, NW. |
| |
(6) | Assumes Gateway Center, Girard Business Center, West Park, Patrick Center, and Corporate Campus at Ashburn Center are the only |
2014 dispositions, and 1401 K Street, NW and Wiehle Avenue are the only 2014 acquisitions. The reduction in our year-end occupancy guidance is a result of our expectation that the GSA will not take occupancy at Atlantic Corporate Park until early 2015.
| |
(7) | Assumes Gateway Center, Girard Business Center, West Park, Patrick Center, and Corporate Campus at Ashburn Center are the only 2014 dispositions. The reduction in our year-end occupancy guidance is a result of our expectation that the GSA will not take occupancy at Atlantic Corporate Park until early 2015. |
|
| | |
| | Earnings Release - Continued |
Our guidance is also based on a number of other assumptions, many of which are outside our control and all of which are subject to change. We may change our guidance as actual and anticipated results vary from these assumptions.
|
| | | | | | | | |
| Guidance Range for 2014 | | Low Range | | High Range |
| Net income attributable to common shareholders per diluted share | | $ | 0.09 |
| | $ | 0.13 |
|
Real estate depreciation(1) | | 1.08 |
| | 1.09 |
|
Net loss attributable to noncontrolling interests and items excluded from Core FFO per diluted share(2) | | (0.26 | ) | | (0.25 | ) |
| Core FFO per diluted share | | $ | 0.91 |
| | $ | 0.97 |
|
| | | | | |
(1)Includes our pro-rata share of depreciation from our unconsolidated joint ventures and depreciation related to our disposed properties.
| |
(2) | Items excluded from Core FFO consist of the gains or losses associated with disposed properties, the costs associated with the informal SEC inquiry, if any, and acquisition costs. |
Investor Conference Call and Webcast
First Potomac Realty Trust will host a conference call on July 25, 2014 at 9:00 AM ET to discuss second quarter results. The conference call can be accessed by dialing (877) 705-6003 or (201) 493-6725 for international participants. A replay of the call will be available from 12:00 Noon ET on July 25, 2014, until midnight ET on August 1, 2014. The replay can be accessed by dialing (877) 870-5176 or (858) 384-5517 for international callers, and entering pin number 13584747.
A live broadcast of the conference call will also be available online at our website, www.first-potomac.com, on July 25, 2014, beginning at 9:00 AM ET. An online replay will follow shortly after the call and will continue for 90 days.
About First Potomac Realty Trust
First Potomac Realty Trust is a self-administered, self-managed real estate investment trust that focuses on owning, operating, developing and redeveloping office and business park properties in the greater Washington, D.C. region. As of June 30, 2014, our consolidated portfolio totaled 8.7 million square feet. Based on annualized cash basis rent, our portfolio consists of 57% office properties and 43% business park and industrial properties. A key element of First Potomac's overarching strategy is its dedication to sustainability. Over one million square feet of First Potomac property is LEED Certified, with the potential for another 700,000 square feet in future development projects. Approximately half of the portfolio's multi-story office square footage is LEED or Energy Star Certified. FPO common shares (NYSE: FPO) and preferred shares (NYSE: FPO-PA) are publicly traded on the New York Stock Exchange.
Non-GAAP Financial Measures
Funds from Operations – Funds from operations (“FFO”) represents net income (computed in accordance with U.S. generally accepted accounting principles (“GAAP”)), excluding gains (losses) on sales of rental property and impairments of rental property, plus real estate-related depreciation and amortization and after adjustments for unconsolidated partnerships and joint ventures. We also exclude any depreciation and amortization related to third parties from our consolidated joint ventures from our FFO calculation.
We consider FFO a useful measure of performance for an equity REIT because it facilitates an understanding of the operating performance of our properties without giving effect to real estate depreciation and amortization, which assume that the value of real estate assets diminishes predictably over time. Since real estate values have historically risen or fallen with market conditions, we believe
|
| | |
| | Earnings Release - Continued |
that FFO provides a meaningful indication of our performance. We also consider FFO an appropriate performance measure given its wide use by investors and analysts. We compute FFO in accordance with standards established by the Board of Governors of NAREIT in its March 1995 White Paper (as amended in November 1999, April 2002 and January 2012), which may differ from the methodology for calculating FFO utilized by other equity real estate investment trusts (“REITs”) and, accordingly, may not be comparable to such other REITs. Further, FFO does not represent amounts available for management’s discretionary use because of needed capital replacement or expansion, debt service obligations or other commitments and uncertainties, nor is it indicative of funds available to fund our cash needs, including our ability to make distributions. We present FFO per diluted share calculations that are based on the outstanding dilutive common shares plus the outstanding common Operating Partnership units for the periods presented.
Core FFO – Management believes that the computation of FFO in accordance with NAREIT’s definition includes certain items that are not indicative of the results provided by our operating portfolio and affect the comparability of our period-over-period performance. These items include, but are not limited to, gains and losses on the retirement of debt, legal costs associated with the informal SEC inquiry, personnel separation costs, contingent consideration charges and acquisition costs.
Our presentation of FFO in accordance with the NAREIT white paper, or presentation of Core FFO, should not be considered as an alternative to net income (computed in accordance with GAAP) as an indicator of our financial performance or to cash flow from operating activities (computed in accordance with GAAP) as an indicator of our liquidity.
Our FFO and Core FFO calculations are reconciled to net income in our Consolidated Statements of Operations included in this release.
NOI – We define net operating income (“NOI”) as operating revenues (rental income, tenant reimbursements and other income) less property and related expenses (property expenses, real estate taxes and insurance). Management believes that NOI is a useful measure of our property operating performance as it provides a performance measure of the revenues and expenses directly associated with owning, operating, developing and redeveloping office and business park properties, and provides a perspective not immediately apparent from net income or FFO. Other REITs may use different methodologies for calculating NOI, and accordingly, our NOI may not be comparable to other REITs. Our NOI calculations are reconciled to total revenues and total operating expenses at the end of this release.
Same-Property NOI – Same-Property Net Operating Income (“Same-Property NOI”), defined as operating revenues (rental, tenant reimbursements and other revenues) less operating expenses (property operating expenses, real estate taxes and insurance) from the properties owned by us for the entirety of the periods compared, is a primary performance measure we use to assess the results of operations at our properties. As an indication of our operating performance, Same-Property NOI should not be considered an alternative to net income calculated in accordance with GAAP. A reconciliation of our Same-Property NOI to net income from our consolidated statements of operations is presented below. The Same-Property NOI results exclude corporate-level expenses, as well as certain transactions, such as the collection of termination fees, as these items vary significantly period-over-period, thus impacting trends and comparability. Also, we eliminate depreciation and amortization expense, which are property level expenses, in computing Same-Property NOI as these are non-cash expenses that are based on historical cost accounting assumptions and do not offer the investor significant insight into the operations of the property. This presentation allows management and investors to distinguish whether growth or declines in net operating income are a result of increases or decreases in property operations or the acquisition of additional properties. While this presentation provides useful information to management and investors, the results below should be read in conjunction with the results from the consolidated statements of operations to provide a complete depiction of total Company performance.
|
| | |
| | Earnings Release - Continued |
Forward Looking Statements
The forward-looking statements contained in this press release, including statements regarding our 2014 Core FFO guidance and related assumptions, potential sales and the timing of such sales, and future acquisition and growth opportunities, are subject to various risks and uncertainties. Although we believe the expectations reflected in such forward-looking statements are based on reasonable assumptions, there can be no assurance that our expectations will be achieved. Certain factors that could cause actual results to differ materially from our expectations include changes in general or regional economic conditions; our ability to timely lease or re-lease space at current or anticipated rents; changes in interest rates; changes in operating costs; our ability to complete acquisitions on acceptable terms; our ability to manage our current debt levels and repay or refinance our indebtedness upon maturity or other required payment dates; our ability to maintain financial covenant compliance under our debt agreements; our ability to maintain effective internal controls over financial reporting and disclosure controls and procedures; any impact of the informal inquiry initiated by the U.S. Securities and Exchange Commission (the “SEC”); our ability to obtain debt and/or financing on attractive terms, or at all; changes in the assumptions underlying our earnings and Core FFO guidance and other risks detailed in our Annual Report on Form 10-K and described from time to time in our filings with the SEC. Many of these factors are beyond our ability to control or predict. Forward-looking statements are not guarantees of performance. For forward-looking statements herein, we claim the protection of the safe harbor for forward-looking statements contained in the Private Securities Litigation Reform Act of 1995. We assume no obligation to update or supplement forward-looking statements that become untrue because of subsequent events.
|
| | |
| | Earnings Release - Continued |
Consolidated Statements of Operations
(unaudited, amounts in thousands, except per share amounts)
|
| | | | | | | | | | | | | | | |
| | Three Months Ended June 30, | | Six Months Ended June 30, |
| | 2014 | | 2013 | | 2014 | | 2013 |
| Revenues: | | | | | | | |
| Rental | $ | 33,130 |
| | $ | 31,087 |
| | $ | 65,070 |
| | $ | 61,780 |
|
| Tenant reimbursements and other | 8,060 |
| | 7,745 |
| | 17,534 |
| | 16,211 |
|
| | | | | | | | |
| Total revenues | 41,190 |
| | 38,832 |
| | 82,604 |
| | 77,991 |
|
| | | | | | | | |
| Operating expenses: | | | | | | | |
| Property operating | 10,869 |
| | 9,432 |
| | 23,767 |
| | 19,743 |
|
| Real estate taxes and insurance | 4,372 |
| | 3,975 |
| | 8,641 |
| | 8,487 |
|
| General and administrative | 5,218 |
| | 4,985 |
| | 10,414 |
| | 10,252 |
|
| Acquisition costs | 1,111 |
| | — |
| | 1,179 |
| | — |
|
| Depreciation and amortization | 15,610 |
| | 14,208 |
| | 30,714 |
| | 28,195 |
|
| Impairment of rental property | 3,956 |
| | — |
| | 3,956 |
| | — |
|
| Contingent consideration related to acquisition of property | — |
| | 75 |
| | — |
| | 75 |
|
| Total operating expenses | 41,136 |
| | 32,675 |
| | 78,671 |
| | 66,752 |
|
| | | | | | | | |
| Operating income | 54 |
| | 6,157 |
| | 3,933 |
| | 11,239 |
|
| | | | | | | | |
| Other (income) expenses: | | | | | | | |
| Interest expense | 6,102 |
| | 9,353 |
| | 11,914 |
| | 19,310 |
|
| Interest and other income | (1,670 | ) | | (1,574 | ) | | (3,429 | ) | | (3,103 | ) |
| Equity in (earnings) losses of affiliates | (199 | ) | | (7 | ) | | 28 |
| | (35 | ) |
| Loss on debt extinguishment | — |
| | 201 |
| | — |
| | 201 |
|
| Gain on sale of rental property | (21,230 | ) | | — |
| | (21,230 | ) | | — |
|
| | | | | | | | |
| Total other (income) expenses | (16,997 | ) | | 7,973 |
| | (12,717 | ) | | 16,373 |
|
| | | | | | | | |
| Income (loss) from continuing operations | 17,051 |
| | (1,816 | ) | | 16,650 |
| | (5,134 | ) |
| | | | | | | | |
| Discontinued operations: | | | | | | | |
| (Loss) income from operations | (1 | ) | | 1,759 |
| | (1,096 | ) | | 7,040 |
|
| Loss on debt extinguishment | — |
| | (4,414 | ) | | — |
| | (4,414 | ) |
| Gain on sale of rental property | 1,284 |
| | 18,947 |
| | 1,338 |
| | 18,947 |
|
| Income from discontinued operations | 1,283 |
| | 16,292 |
| | 242 |
| | 21,573 |
|
| | | | | | | | |
| Net income | 18,334 |
| | 14,476 |
| | 16,892 |
| | 16,439 |
|
| | | | | | | | |
| Less: Net income attributable to noncontrolling interests | (652 | ) | | (466 | ) | | (458 | ) | | (406 | ) |
| | | | | | | | |
| Net income attributable to First Potomac Realty Trust | 17,682 |
| | 14,010 |
| | 16,434 |
| | 16,033 |
|
| | | | | | | | |
| Less: Dividends on preferred shares | (3,100 | ) | | (3,100 | ) | | (6,200 | ) | | (6,200 | ) |
| | | | | | | | |
| Net income attributable to common shareholders | $ | 14,582 |
| | $ | 10,910 |
| | $ | 10,234 |
| | $ | 9,833 |
|
|
| | |
| | Earnings Release - Continued |
|
| | | | | | | | | | | | | | | |
| | Three Months Ended June 30, | | Six Months Ended June 30, |
| | 2014 | | 2013 | | 2014 | | 2013 |
| | | | | | | | |
| Net income attributable to common shareholders | $ | 14,582 |
| | $ | 10,910 |
| | $ | 10,234 |
| | $ | 9,833 |
|
| | | | | | | | |
| Depreciation and amortization: | | | | | | | |
| Rental property | 15,610 |
| | 14,208 |
| | 30,714 |
| | 28,195 |
|
| Discontinued operations | 41 |
| | 1,786 |
| | 496 |
| | 4,708 |
|
| Unconsolidated joint ventures | 1,014 |
| | 1,317 |
| | 2,302 |
| | 2,669 |
|
| Consolidated joint ventures | — |
| | (53 | ) | | — |
| | (104 | ) |
| Impairment of rental property | 3,956 |
| | 1,446 |
| | 3,956 |
| | 1,446 |
|
| Gain on sale of rental property | (22,514 | ) | | (18,947 | ) | | (22,568 | ) | | (18,947 | ) |
| Net income attributable to noncontrolling interests in the Operating Partnership | 652 |
| | 474 |
| | 458 |
| | 419 |
|
| | | | | | | | |
| Funds from operations available to common shareholders | $ | 13,341 |
| | $ | 11,141 |
| | $ | 25,592 |
| | $ | 28,219 |
|
|
| | |
| | Earnings Release - Continued |
Consolidated Statements of Operations
(unaudited, amounts in thousands, except per share amounts)
|
| | | | | | | | | | | | | | | |
| | Three Months Ended June 30, | | Six Months Ended June 30, |
| | 2014 | | 2013 | | 2014 | | 2013 |
| Funds from operations (FFO) | $ | 16,441 |
| | $ | 14,241 |
| | $ | 31,792 |
| | $ | 34,419 |
|
| Less: Dividends on preferred shares | (3,100 | ) | | (3,100 | ) | | (6,200 | ) | | (6,200 | ) |
| FFO available to common shareholders | 13,341 |
| | 11,141 |
| | 25,592 |
| | 28,219 |
|
| Loss on debt extinguishment | — |
| | 4,615 |
| | — |
| | 4,615 |
|
| Deferred abatement and straight-line amortization | — |
| | — |
| | 1,045 |
| | (1,567 | ) |
| Acquisition costs | 1,111 |
| | — |
| | 1,179 |
| | — |
|
| Contingent consideration related to acquisition of property | — |
| | 75 |
| | — |
| | 75 |
|
| Legal costs associated with informal SEC inquiry | — |
| | 55 |
| | — |
| | 391 |
|
| | | | | | | | |
| Core FFO | $ | 14,452 |
| | $ | 15,886 |
| | $ | 27,816 |
| | $ | 31,733 |
|
| | | | | | | | |
| Basic and diluted earnings per common share: | | | | | | | |
| Income (loss) from continuing operations available to common shareholders | $ | 0.23 |
| | $ | (0.09 | ) | | $ | 0.17 |
| | $ | (0.21 | ) |
| Income from discontinued operations available to common shareholders | 0.02 |
| | 0.29 |
| | — |
| | 0.40 |
|
| Net income available to common shareholders | $ | 0.25 |
| | $ | 0.20 |
| | $ | 0.17 |
| | $ | 0.19 |
|
| | | | | | | | |
| Weighted average common shares outstanding: | | | | | | | |
| Basic | 58,146 |
| | 53,586 |
| | 58,122 |
| | 52,004 |
|
| Diluted | 58,220 |
| | 53,586 |
| | 58,190 |
| | 52,004 |
|
| | | | | | | | |
| FFO available to common shareholders per share - basic and diluted | $ | 0.22 |
| | $ | 0.20 |
| | $ | 0.42 |
| | $ | 0.52 |
|
| | | | | | | | |
| Core FFO per share - diluted | $ | 0.24 |
| | $ | 0.28 |
| | $ | 0.46 |
| | $ | 0.58 |
|
| | | | | | | | |
| Weighted average common shares and units outstanding: | | | | | | | |
| Basic | 60,777 |
| | 56,184 |
| | 60,752 |
| | 54,602 |
|
| Diluted | 60,850 |
| | 56,289 |
| | 60,820 |
| | 54,703 |
|
|
| | |
| | Earnings Release - Continued |
Consolidated Balance Sheets
(Amounts in thousands, except per share amounts)
|
| | | | | | | |
| | June 30, 2014 | | December 31, 2013 |
| | (unaudited) | | |
| Assets: | | | |
| Rental property, net | $ | 1,258,646 |
| | $ | 1,203,299 |
|
| Assets held-for-sale | 13,093 |
| | 45,861 |
|
| Cash and cash equivalents | 13,398 |
| | 8,740 |
|
| Escrows and reserves | 4,753 |
| | 7,673 |
|
| Accounts and other receivables, net of allowance for doubtful accounts of $1,104 and $1,181, respectively | 10,050 |
| | 12,384 |
|
| Accrued straight-line rents, net of allowance for doubtful accounts of $199 and $92, respectively | 29,820 |
| | 30,332 |
|
| Notes receivable, net | 63,751 |
| | 54,696 |
|
| Investment in affiliates | 49,278 |
| | 49,150 |
|
| Deferred costs, net | 42,750 |
| | 43,198 |
|
| Prepaid expenses and other assets | 6,466 |
| | 8,279 |
|
| Intangible assets, net | 46,261 |
| | 38,848 |
|
| Total assets | $ | 1,538,266 |
| | $ | 1,502,460 |
|
| Liabilities: | | | |
| Mortgage loans | $ | 302,909 |
| | $ | 274,648 |
|
| Unsecured term loan | 300,000 |
| | 300,000 |
|
| Unsecured revolving credit facility | 116,000 |
| | 99,000 |
|
| Accounts payable and other liabilities | 37,604 |
| | 41,296 |
|
| Accrued interest | 1,701 |
| | 1,663 |
|
| Rents received in advance | 5,734 |
| | 6,118 |
|
| Tenant security deposits | 6,125 |
| | 5,666 |
|
| Deferred market rent, net | 2,532 |
| | 1,557 |
|
| Total liabilities | 772,605 |
| | 729,948 |
|
| | | | |
| Noncontrolling interests in the Operating Partnership | 35,214 |
| | 33,221 |
|
| Equity: | | | |
| Preferred Shares, $0.001 par value, 50,000 shares authorized; | | | |
| Series A Preferred Shares, $25 per share liquidation preference, 6,400 shares issued and outstanding | $ | 160,000 |
| | $ | 160,000 |
|
| Common shares, $0.001 par value, 150,000 shares authorized; 58,808 and 58,704 shares issued and outstanding, respectively | 59 |
| | 59 |
|
| Additional paid-in capital | 910,680 |
| | 911,533 |
|
| Noncontrolling interests in the consolidated partnership | 942 |
| | 781 |
|
| Accumulated other comprehensive loss | (4,603 | ) | | (3,836 | ) |
| Dividends in excess of accumulated earnings | (336,631 | ) | | (329,246 | ) |
| Total equity | 730,447 |
| | 739,291 |
|
| Total liabilities, noncontrolling interests and equity | $ | 1,538,266 |
| | $ | 1,502,460 |
|
|
| | |
| | Earnings Release - Continued |
Same-Property Analysis
(unaudited, dollars in thousands)
|
| | | | | | | | | | | | | | | |
Same Property NOI(1) | Three Months Ended June 30, | | Six Months Ended June 30, |
| | 2014 | | 2013 | | 2014 | | 2013 |
| Total base rent | $ | 30,116 |
| | $ | 29,725 |
| | $ | 60,290 |
| | $ | 59,073 |
|
| Tenant reimbursements and other | 7,187 |
| | 6,789 |
| | 15,820 |
| | 14,372 |
|
| Property operating expenses | (8,991 | ) | | (8,634 | ) | | (20,408 | ) | | (18,331 | ) |
| Real estate taxes and insurance | (3,914 | ) | | (3,593 | ) | | (7,921 | ) | | (7,676 | ) |
| | | | | | | | |
| Same-Property NOI - accrual basis | 24,398 |
| | 24,287 |
| | 47,781 |
| | 47,438 |
|
| | | | | | | | |
| Straight-line revenue, net | (301 | ) | | (228 | ) | | (686 | ) | | (564 | ) |
| Deferred market rental revenue, net | (20 | ) | | 9 |
| | (41 | ) | | 16 |
|
| | | | | | | | |
| Same-Property NOI - cash basis | $ | 24,077 |
| | $ | 24,068 |
| | $ | 47,054 |
| | $ | 46,890 |
|
| | | | | | | | |
| Change in same-property NOI - accrual basis | 0.5 | % | | | | 0.7 | % | | |
| Change in same-property NOI - cash basis | 0.0 | % | | | | 0.3 | % | | |
| | | | | | | | |
| Same-property percentage of total portfolio (sf) | 95.3 | % | | | | 95.3 | % | | |
| | | | | | | | |
| Reconciliation of Consolidated NOI to Same-Property NOI | Three Months Ended June 30, | | Six Months Ended June 30, |
| | 2014 | | 2013 | | 2014 | | 2013 |
| Total revenues | $ | 41,190 |
| | $ | 38,832 |
| | $ | 82,604 |
| | $ | 77,991 |
|
| Property operating expenses | (10,869 | ) | | (9,432 | ) | | (23,767 | ) | | (19,743 | ) |
| Real estate taxes and insurance | (4,372 | ) | | (3,975 | ) | | (8,641 | ) | | (8,487 | ) |
| NOI | 25,949 |
| | 25,425 |
| | 50,196 |
| | 49,761 |
|
| | | | | | | | |
Less: Non-same property NOI(2) | (1,551 | ) | | (1,138 | ) | | (2,415 | ) | | (2,323 | ) |
| | | | | | | | |
| Same-Property NOI - accrual basis | $ | 24,398 |
| | $ | 24,287 |
| | $ | 47,781 |
| | $ | 47,438 |
|
| | | | | | | | |
| Change in Same-Property NOI (accrual basis) | | | | | | | |
| By Region | Three Months Ended June 30, 2014 | | Percentage of Base Rent | | Six Months Ended June 30, 2014 | | Percentage of Base Rent |
| Washington, D.C. | (8.1)% | | 14% | | (2.0)% | | 14% |
| Maryland | 5.7% | | 28% | | (1.1)% | | 28% |
| Northern Virginia | 1.4% | | 34% | | 2.4% | | 34% |
| Southern Virgina | (0.9)% | | 24% | | 2.7% | | 24% |
| | | | | | | | |
| By Type | | | | | | | |
| Business Park/Industrial | 4.6% | | 44% | | 5.1% | | 44% |
| Office | (3.0)% | | 56% | | (2.8)% | | 56% |
| |
(1) | Same-property comparisons are based upon those consolidated properties owned and in-service for the entirety of the periods presented. Same-property results exclude the operating results of the following non same-properties that were owned as of June 30, 2014: 440 First Street, NW, Storey Park, 1401 K Street, NW, 1775 Wiehle Avenue, and a building at Redland Corporate Center. |
| |
(2) | Non-same property NOI has been adjusted to reflect a normalized management fee percentage in lieu of an administrative overhead allocation for comparative purposes, as well as Corporate Campus at Ashburn Center, which was sold in June 2014. |
|
| | |
| | Highlights (unaudited, dollars in thousands, except per share data) |
|
| | | | | | | | | | | | | | | | | | | |
| Performance Metrics | Q2-2014 | | Q1-2014 | | Q4-2013 | | Q3-2013 | | Q2-2013 |
FFO available to common shareholders(1) | | | | | | | | | |
Core FFO(1) | $ | 13,341 |
| | $ | 12,251 |
| | $ | 12,323 |
| | $ | 11,451 |
| | $ | 11,141 |
|
| FFO available to common shareholders per diluted share | $ | 14,452 |
| | $ | 13,364 |
| | $ | 13,950 |
| | $ | 13,524 |
| | $ | 15,886 |
|
| Core FFO per diluted share | $ | 0.22 |
| | $ | 0.20 |
| | $ | 0.20 |
| | $ | 0.19 |
| | $ | 0.20 |
|
| | $ | 0.24 |
| | $ | 0.22 |
| | $ | 0.23 |
| | $ | 0.22 |
| | $ | 0.28 |
|
| Operating Metrics | | | | | | | | | |
| Change in Same-Property NOI | | | | | | | | | |
| Accrual Basis | | | | | | | | | |
| Cash Basis | 0.5 | % | | 1.2 | % | | 0.6 | % | | 3.7 | % | | 0.0 | % |
| | 0.0 | % | | 1.2 | % | | (1.1 | )% | | 2.3 | % | | (0.1 | )% |
| Assets | | | | | | | | | |
| Total Assets | | | | | | | | | |
| | $ | 1,538,266 |
| | $ | 1,481,336 |
| | $ | 1,502,460 |
| | $ | 1,511,283 |
| | $ | 1,557,666 |
|
| Debt Balances | | | | | | | | | |
| Unhedged Variable-Rate Debt | | | | | | | | | |
Hedged Variable-Rate Debt(2) | $ | 161,493 |
| | $ | 141,493 |
| | $ | 92,699 |
| | $ | 76,699 |
| | $ | 43,657 |
|
| Fixed-Rate Debt | 300,000 |
| | 300,000 |
| | 350,000 |
| | 350,000 |
| | 350,000 |
|
| Total | 257,416 |
| | 229,602 |
| | 230,949 |
| | 232,275 |
| | 294,389 |
|
| | $ | 718,909 |
| | $ | 671,095 |
| | $ | 673,648 |
| | $ | 658,974 |
| | $ | 688,046 |
|
| Leasing Metrics | | | | | | | | | |
Net Absorption (Square Feet)(3) | | | | | | | | | |
| Tenant Retention Rate | 62,511 |
| | 27,707 |
| | 74,979 |
| | 19,741 |
| | 69,107(4) |
|
| Leased % | 65 | % | | 53 | % | | 59 | % | | 30%(5) |
| | 79%(4) |
|
| Occupancy % | 89.5 | % | | 88.9 | % | | 88.1 | % | | 87.4 | % | | 86.5 | % |
| Total New Leases (Square Feet) | 86.0 | % | | 86.0 | % | | 85.8 | % | | 85.1 | % | | 84.0 | % |
| Total Renewal Leases (Square Feet) | 166,209 |
| | 145,000 |
| | 165,000 |
| | 213,000 |
| | 234,000 |
|
| | 186,297 |
| | 112,000 |
| | 98,000 |
| | 87,000 |
| | 306,000 |
|
| |
(1) | See page 20 for a reconciliation of our net income (loss) attributable to common shareholders to FFO available to common shareholders and Core FFO. |
| |
(2) | As of June 30, 2014, we had fixed LIBOR at a weighted averaged interest rate of 1.5% on $300.0 million of our variable rate debt through eleven interest rate swap agreements. |
| |
(3) | Net absorption includes adjustments made for pre-leasing, deals signed in advance of existing lease expirations and unforeseen terminations. |
| |
(4) | Both the Net Absorption and Tenant Retention Rate exclude all properties that were sold in the second quarter of 2013. |
| |
(5) | During the third quarter of 2013, we had an expected tenant retention rate of 30%, primarily as a result of over 200,000 square feet of known move outs in the quarter. |
|
| | |
| | Quarterly Financial Results (unaudited, dollars in thousands) |
|
| | | | | | | | | | | | | | | | | | | |
| | Three Months Ended |
| | June 30, 2014 | | March 31, 2014 | | December 31, 2013 | | September 30, 2013 | | June 30, 2013 |
| OPERATING REVENUES | | | | | | | | | |
| Rental | $ | 33,130 |
| | $ | 31,940 |
| | $ | 31,520 |
| | $ | 31,137 |
| | $ | 31,087 |
|
| Tenant reimbursements and other | 8,060 |
| | 9,474 |
| | 7,863 |
| | 8,112 |
| | 7,745 |
|
| | | | | | | | | | |
| | 41,190 |
| | 41,414 |
| | 39,383 |
| | 39,249 |
| | 38,832 |
|
| | | | | | | | | | |
| PROPERTY EXPENSES | | | | | | | | | |
| Property operating | 10,869 |
| | 12,898 |
| | 10,675 |
| | 10,431 |
| | 9,432 |
|
| Real estate taxes and insurance | 4,372 |
| | 4,269 |
| | 4,079 |
| | 4,062 |
| | 3,975 |
|
| | | | | | | | | | |
| NET OPERATING INCOME | 25,949 |
| | 24,247 |
| | 24,629 |
| | 24,756 |
| | 25,425 |
|
| | | | | | | | | | |
| OTHER (EXPENSES) INCOME | | | | | | | | | |
| General and administrative | (5,218 | ) | | (5,196 | ) | | (5,380 | ) | | (6,346 | ) | | (4,985 | ) |
| Acquisition costs | (1,111 | ) | | (68 | ) | | (429 | ) | | (173 | ) | | — |
|
| Interest and other income | 1,670 |
| | 1,759 |
| | 1,573 |
| | 1,696 |
| | 1,574 |
|
| Equity in earnings (losses) of affiliates | 199 |
| | (227 | ) | | (101 | ) | | 19 |
| | 7 |
|
| | | | | | | | | | |
| EBITDA | 21,489 |
| | 20,515 |
| | 20,292 |
| | 19,952 |
| | 22,021 |
|
| | | | | | | | | | |
| Depreciation and amortization | (15,610 | ) | | (15,104 | ) | | (15,138 | ) | | (14,343 | ) | | (14,208 | ) |
| Interest expense | (6,102 | ) | | (5,812 | ) | | (6,104 | ) | | (7,726 | ) | | (9,353 | ) |
| Loss on debt extinguishment / modification | — |
| | — |
| | (1,486 | ) | | (123 | ) | | (201 | ) |
| Contingent consideration related to acquisition of property | — |
| | — |
| | 287 |
| | — |
| | (75 | ) |
| Impairment of rental property | (3,956 | ) | | — |
| | — |
| | — |
| | — |
|
Gain on sale of rental property(1) | 21,230 |
| | — |
| | — |
| | — |
| | — |
|
| | | | | | | | | | |
| Income (loss) from continuing operations | 17,051 |
| | (401 | ) | | (2,149 | ) | | (2,240 | ) | | (1,816 | ) |
| | | | | | | | | | |
| | | | | | | | | | |
| (Loss) income from operations | (1 | ) | | (1,096 | ) | | (1,592 | ) | | 107 |
| | 1,759 |
|
| Loss on debt extinguishment | — |
| | — |
| | — |
| | — |
| | (4,414 | ) |
Gain on sale of rental property(2) | 1,284 |
| | 54 |
| | — |
| | 416 |
| | 18,947 |
|
| | | | | | | | | | |
| Income (loss) from discontinued operations | 1,283 |
| | (1,042 | ) | | (1,592 | ) | | 523 |
| | 16,292 |
|
| | | | | | | | | | |
| NET INCOME (LOSS) | 18,334 |
| | (1,443 | ) | | (3,741 | ) | | (1,717 | ) | | 14,476 |
|
| | | | | | | | | | |
| Less: Net (income) loss attributable to noncontrolling interests | (652 | ) | | 195 |
| | 288 |
| | 211 |
| | (466 | ) |
| | | | | | | | | | |
| NET INCOME (LOSS) ATTRIBUTABLE TO | | | | | | | | | |
| FIRST POTOMAC REALTY TRUST | 17,682 |
| | (1,248 | ) | | (3,453 | ) | | (1,506 | ) | | 14,010 |
|
| | | | | | | | | | |
| Less: Dividends on preferred shares | (3,100 | ) | | (3,100 | ) | | (3,100 | ) | | (3,100 | ) | | (3,100 | ) |
| | | | | | | | | | |
| NET INCOME (LOSS) ATTRIBUTABLE TO COMMON | | | | | | | | | |
| SHAREHOLDERS | $ | 14,582 |
| | $ | (4,348 | ) | | $ | (6,553 | ) | | $ | (4,606 | ) | | $ | 10,910 |
|
| |
(1) | For the three months ended June 30, 2014, the gain on sale of rental property related to the sale of Corporate Campus at Ashburn Center is included within continuing operations due to adopting new accounting requirements pertaining to discontinued operations in the second quarter of 2014. |
| |
(2) | For the three months ended June 30, 2014, the gain on sale of rental property is related to the sale of West Park and Patrick Center. For the three months ended March 31, 2014, the gain on sale of rental property is related to the sale of Girard Business Center and Gateway Center. For the three months ended September 30, 2013, the gain on sale of rental property is related to the sale of 4200 Tech Court. For the three months ended June 30, 2013, the gain on sale of rental property includes $18.7 million related to the sale of the industrial portfolio and $0.2 million related to the sale of 4212 Tech Court. |
|
| | |
| | Supplemental Financial Results (unaudited, dollars in thousands) |
|
| | | | | | | | | | | | | | | | | | | |
| Supplemental Financial Results Items: | | | | | | | | | |
| The following items were included in the determination of net income (loss): | | | | |
| | Three Months Ended |
| | June 30, 2014 | | March 31, 2014 | | December 31, 2013 | | September 30, 2013 | | June 30, 2013 |
| Termination fees | $ | 83 |
| | $ | 77 |
| | $ | 208 |
| | $ | 61 |
| | $ | 49 |
|
| Capitalized interest | 982 |
| | 833 |
| | 916 |
| | 836 |
| | 360 |
|
Snow and ice removal costs (excluding reimbursements)(1) | 10 |
| | (2,371 | ) | | (304 | ) | | (1 | ) | | (62 | ) |
| Reserves for bad debt expense | (370 | ) | | (115 | ) | | (239 | ) | | (171 | ) | | (220 | ) |
| Legal costs associated with informal SEC inquiry | — |
| | — |
| | — |
| | — |
| | (55 | ) |
| Personnel separation costs | — |
| | — |
| | — |
| | (1,777 | ) | | — |
|
| | | | | | | | | | |
Dispositions in Continuing Operations(2) | | | | | | | | | |
| Revenues | 1,329 |
| | 1,465 |
| | 1,264 |
| | 1,317 |
| | 1,322 |
|
| Operating expenses | (400 | ) | | (548 | ) | | (391 | ) | | (364 | ) | | (365 | ) |
| Depreciation and amortization expense | (402 | ) | | (366 | ) | | (374 | ) | | (349 | ) | | (350 | ) |
Impairment of rental property(3) | (3,956 | ) | | — |
| | — |
| | — |
| | — |
|
Gain on sale of rental property(4) | 21,230 |
| | — |
| | — |
| | — |
| | — |
|
| | $ | 17,801 |
| | $ | 551 |
| | $ | 499 |
| | $ | 604 |
| | $ | 607 |
|
| | | | | | | | | | |
Dispositions in Discontinued Operations(5) | | | | | | | | | |
Revenues(6) | 65 |
| | (243 | ) | | 1,766 |
| | 1,907 |
| | 7,875 |
|
| Operating expenses | (25 | ) | | (398 | ) | | (640 | ) | | (753 | ) | | (2,522 | ) |
| Depreciation and amortization expense | (41 | ) | | (455 | ) | | (547 | ) | | (573 | ) | | (1,786 | ) |
| Interest expense, net of interest income | — |
| | — |
| | — |
| | — |
| | (362 | ) |
| Impairment of rental property | — |
| | — |
| | (2,171 | ) | | (474 | ) | | (1,446 | ) |
| Loss on debt extinguishment | — |
| | — |
| | — |
| | — |
| | (4,414 | ) |
Gain on sale of rental property(7) | 1,284 |
| | 54 |
| | — |
| | 416 |
| | 18,947 |
|
| | $ | 1,283 |
| | $ | (1,042 | ) | | $ | (1,592 | ) | | $ | 523 |
| | $ | 16,292 |
|
| |
(1) | We recovered approximately 60% to 65% of these costs for the periods presented. |
| |
(2) | Represents the operating results of properties that were sold or classified as held-for-sale after our adoption of new accounting requirements in the second quarter of 2014. For the three months ended June 30, 2014, these properties include Corporate Campus at Ashburn Center and the four remaining buildings at Owings Mills Business Park. |
| |
(3) | For the three months ended June 30, 2014, we recorded the impairment charge as a result of the anticipated sale price of Owings Mills Business Park. |
| |
(4) | For the three months ended June 30, 2014, the gain on sale of rental property is related to Corporate Campus at Ashburn Center. |
| |
(5) | Represents the operating results of properties that were sold or classified as held-for-sale prior to our adoption of new accounting requirements in the second quarter of 2014. |
| |
(6) | As the result of the sale of Girard Business Center and Gateway Center in January 2014, we accelerated $1.0 million of unamortized straight-line rent and deferred abatement costs for the three months ended March 31, 2014. |
| |
(7) | For the three months ended June 30, 2014, the gain on sale of rental property is related to the sale of West Park and Patrick Center. For the three months ended March 31, 2014, the gain on sale of rental property is related to the sale of Girard Business Center and Gateway Center. For the three months ended September 30, 2013, the gain on sale of rental property is related to the sale of 4200 Tech Court. For the three months ended June 30, 2013, the gain on sale of rental property includes $18.7 million related to the sale of the industrial portfolio and $0.2 million related to the sale of 4212 Tech Court. |
|
| | |
| | Quarterly Financial Measures (unaudited, amounts in thousands, except per share data) |
|
| | | | | | | | | | | | | | | | | | | |
| | Three Months Ended |
| FUNDS FROM OPERATIONS ("FFO") | June 30, 2014 | | March 31, 2014 | | December 31, 2013 | | September 30, 2013 | | June 30, 2013 |
| | | | | | | | | | |
| Net income (loss) attributable to common shareholders | $ | 14,582 |
| | $ | (4,348 | ) | | $ | (6,553 | ) | | $ | (4,606 | ) | | $ | 10,910 |
|
| | | | | | | | | | |
| Depreciation and amortization: | | | | | | | | | |
| Rental property | 15,610 |
| | 15,104 |
| | 15,138 |
| | 14,343 |
| | 14,208 |
|
| Discontinued operations | 41 |
| | 455 |
| | 547 |
| | 573 |
| | 1,786 |
|
| Unconsolidated joint ventures | 1,014 |
| | 1,289 |
| | 1,323 |
| | 1,332 |
| | 1,317 |
|
| Consolidated joint ventures | — |
| | — |
| | (13 | ) | | (46 | ) | | (53 | ) |
| Impairment of rental property | 3,956 |
| | — |
| | 2,171 |
| | 474 |
| | 1,446 |
|
| Gain on sale of rental property | (22,514 | ) | | (54 | ) | | — |
| | (416 | ) | | (18,947 | ) |
| Net income (loss) attributable to noncontrolling interests in the Operating Partnership | 652 |
| | (195 | ) | | (290 | ) | | (203 | ) | | 474 |
|
| | | | | | | | | | |
| FFO available to common shareholders | 13,341 |
| | 12,251 |
| | 12,323 |
| | 11,451 |
| | 11,141 |
|
| Dividends on preferred shares | 3,100 |
| | 3,100 |
| | 3,100 |
| | 3,100 |
| | 3,100 |
|
| FFO | $ | 16,441 |
| | $ | 15,351 |
| | $ | 15,423 |
| | $ | 14,551 |
| | $ | 14,241 |
|
| | | | | | | | | | |
| FFO available to common shareholders | 13,341 |
| | 12,251 |
| | 12,323 |
| | 11,451 |
| | 11,141 |
|
| Personnel separation costs | — |
| | — |
| | — |
| | 1,777 |
| | — |
|
Loss on debt extinguishment / modification(1) | — |
| | — |
| | 1,485 |
| | 123 |
| | 4,615 |
|
Deferred abatement and straight-line amortization(2) | — |
| | 1,045 |
| | — |
| | — |
| | — |
|
| Acquisition costs | 1,111 |
| | 68 |
| | 429 |
| | 173 |
| | — |
|
| Contingent consideration related to acquisition of property | — |
| | — |
| | (287 | ) | | — |
| | 75 |
|
| Legal costs associated with informal SEC inquiry | — |
| | — |
| | — |
| | — |
| | 55 |
|
| | | | | | | | | | |
| Core FFO | $ | 14,452 |
| | $ | 13,364 |
| | $ | 13,950 |
| | $ | 13,524 |
| | $ | 15,886 |
|
| | | | | | | | | | |
| ADJUSTED FUNDS FROM OPERATIONS ("AFFO") | | | | | | | | | |
| Core FFO | 14,452 |
| | 13,364 |
| | 13,950 |
| | 13,524 |
| | 15,886 |
|
| Non-cash share-based compensation expense | 867 |
| | 823 |
| | 716 |
| | 838 |
| | 891 |
|
Straight-line rent, net(3) | (333 | ) | | (364 | ) | | (556 | ) | | (446 | ) | | (459 | ) |
| Deferred market rent, net | 1 |
| | 1 |
| | 46 |
| | 50 |
| | (3 | ) |
Non-real estate depreciation and amortization(4) | 353 |
| | 340 |
| | 344 |
| | 332 |
| | 256 |
|
| Debt fair value amortization | (129 | ) | | (129 | ) | | (132 | ) | | (58 | ) | | (76 | ) |
| Amortization of finance costs | 318 |
| | 213 |
| | 426 |
| | 672 |
| | 816 |
|
Tenant improvements(5) | (4,238 | ) | | (2,588 | ) | | (4,448 | ) | | (3,190 | ) | | (6,413 | ) |
Leasing commissions(5) | (1,802 | ) | | (1,066 | ) | | (703 | ) | | (1,690 | ) | | (1,629 | ) |
Capital expenditures(5) | (1,768 | ) | | (768 | ) | | (2,320 | ) | | (2,728 | ) | | (1,627 | ) |
| | | | | | | | | | |
| AFFO | $ | 7,721 |
| | $ | 9,826 |
| | $ | 7,323 |
| | $ | 7,304 |
| | $ | 7,642 |
|
| Total weighted average common shares and OP units: | | | | | | | | | |
| Basic | 60,777 |
| | 60,726 |
| | 60,657 |
| | 60,561 |
| | 56,184 |
|
| Diluted | 60,850 |
| | 60,794 |
| | 60,697 |
| | 60,628 |
| | 56,289 |
|
| FFO available to common shareholders and unitholders per share: | | | | | | | | |
| FFO - basic and diluted | $ | 0.22 |
| | $ | 0.20 |
| | $ | 0.20 |
| | $ | 0.19 |
| | $ | 0.20 |
|
| Core FFO - diluted | $ | 0.24 |
| | $ | 0.22 |
| | $ | 0.23 |
| | $ | 0.22 |
| | $ | 0.28 |
|
| AFFO per share: | | | | | | | | | |
| AFFO - basic and diluted | $ | 0.13 |
| | $ | 0.16 |
| | $ | 0.12 |
| | $ | 0.12 |
| | $ | 0.14 |
|
| |
(1) | Reflects costs associated with amending our existing debt agreements or the charges related to prepaying / defeasing mortgage debt that encumbered properties that were subsequently sold. |
| |
(2) | During the first quarter of 2014, we accelerated $1.0 million of unamortized straight-line rent and deferred abatement costs due to the sale of Girard Business Center and Gateway Center in January 2014. |
| |
(3) | Includes our amortization of the following: straight-line rents and associated uncollectable amounts, rent abatements and lease incentives. |
| |
(4) | Most non-real estate depreciation is classified in general and administrative expense. |
| |
(5) | Does not include first-generation costs, which we define as tenant improvements, leasing commissions and capital expenditure costs that were taken into consideration when underwriting the purchase of a property or incurred to bring the property to operating standard for its intended use. |
|
| | | | | | | | | | | | | | | | | | | |
| First-generation costs | | | | | | | | | |
| Tenant improvements | $ | 862 |
| | $ | 1,977 |
| | $ | 4,611 |
| | $ | 1,420 |
| | $ | 3,265 |
|
| Leasing commissions | 970 |
| | 923 |
| | 423 |
| | 1,738 |
| | 536 |
|
| Capital expenditures | 1,258 |
| | 2,829 |
| | 2,786 |
| | 1,145 |
| | 2,215 |
|
| Total first-generation costs | 3,090 |
| | 5,729 |
| | 7,820 |
| | 4,303 |
| | 6,016 |
|
| | | | | | | | | | |
| Development and redevelopment | 2,704 |
| | 2,268 |
| | 4,332 |
| | 1,850 |
| | 5,692 |
|
| | $ | 5,794 |
| | $ | 7,997 |
| | $ | 12,152 |
| | $ | 6,153 |
| | $ | 11,708 |
|
|
| | |
| | Capitalization and Selected Ratios (unaudited, amounts in thousands, except per share data, percentages and ratios) |
|
| | | | | | |
| Total Market Capitalization |
| | | | Percent of Total Market Capitalization |
| Common Shares and Units | | | |
| Total common shares outstanding | 58,808 |
| | |
| | | | |
| Operating Partnership ("OP") units held by third parties | 2,631 |
| | |
| | | | |
| Total common shares and OP units outstanding | 61,439 |
| | |
| | | | |
| Market price per share at June 30, 2014 | $ | 13.12 |
| | |
| | | | |
| Market Value of Common Equity | $ | 806,080 |
| | 47.7 | % |
| | | | |
| Preferred Shares | | | |
| Total Series A Preferred Shares outstanding | 6,400 |
| | |
| | | | |
| Market price per share at June 30, 2014 | $ | 25.89 |
| | |
| | | | |
| Market Value of Preferred Equity | $ | 165,696 |
| | 9.8 | % |
| | | | |
| Debt | | | |
| Fixed-rate debt | $ | 257,416 |
| | 15.2 | % |
Hedged variable-rate debt(1) | 300,000 |
| | 17.7 | % |
| Unhedged variable-rate debt | 161,493 |
| | 9.6 | % |
| | | | |
| Total debt | $ | 718,909 |
| | 42.5 | % |
| | | | |
| Total Market Capitalization | $ | 1,690,685 |
| | 100 | % |
|
| | | | | | | | | | | | | | | | | | | |
| Selected Ratios |
| | Three Months Ended |
| | | | | | | | | | |
| | June 30, 2014 | | March 31, 2014 | | December 31, 2013 | | September 30, 2013 | | June 30, 2013 |
| COVERAGE RATIOS | | | | | | | | | |
| | | | | | | | | | |
| Interest Coverage Ratio | | | | | | | | | |
EBITDA, excluding acquisition costs(2) | $ | 22,600 |
| | $ | 20,583 |
| | $ | 20,721 |
| | $ | 20,125 |
| | $ | 22,021 |
|
| Interest expense | 6,102 |
| | 5,812 |
| | 6,104 |
| | 7,726 |
| | 9,353 |
|
| | 3.70x |
| | 3.54x |
| | 3.39x |
| | 2.60x |
| | 2.35x |
|
| | | | | | | | | | |
| EBITDA to Fixed Charges | | | | | | | | | |
EBITDA, excluding acquisition costs(2) | $ | 22,600 |
| | $ | 20,583 |
| | $ | 20,721 |
| | $ | 20,125 |
| | $ | 22,021 |
|
Fixed charges(3) | 10,577 |
| | 10,208 |
| | 10,479 |
| | 12,458 |
| | 14,167 |
|
| | 2.14x |
| | 2.02x |
| | 1.98x |
| | 1.62x |
| | 1.55x |
|
| | | | | | | | | | |
| OVERHEAD RATIO | | | | | | | | | |
| | | | | | | | | | |
| G&A to Real Estate Revenues | | | | | | | | | |
General and administrative expense(4) | $ | 5,218 |
| | $ | 5,196 |
| | $ | 5,380 |
| | $ | 4,569 |
| | $ | 4,924 |
|
| Total revenues | 41,190 |
| | 41,414 |
| | 39,383 |
| | 39,249 |
| | 38,832 |
|
| | 12.7 | % | | 12.5 | % | | 13.7 | % | | 11.6 | % | | 12.7 | % |
| | | | | | | | | | |
| LEVERAGE RATIOS | | | | | | | | | |
| | | | | | | | | | |
| Debt/Total Market Capitalization | | | | | | | | | |
| Total debt | $ | 718,909 |
| | $ | 671,095 |
| | $ | 673,648 |
| | $ | 658,974 |
| | $ | 688,046 |
|
| Total market capitalization | 1,690,685 |
| | 1,626,481 |
| | 1,543,024 |
| | 1,592,879 |
| | 1,658,187 |
|
| | 42.5 | % | | 41.3 | % | | 43.7 | % | | 41.4 | % | | 41.5 | % |
| | | | | | | | | | |
| Debt/Undepreciated Book Value | | | | | | | | | |
| Total debt | $ | 718,909 |
| | $ | 671,095 |
| | $ | 673,648 |
| | $ | 658,974 |
| | $ | 688,046 |
|
| Undepreciated book value | 1,477,853 |
| | 1,415,527 |
| | 1,407,272 |
| | 1,423,717 |
| | 1,422,287 |
|
| | 48.6 | % | | 47.4 | % | | 47.9 | % | | 46.3 | % | | 48.4 | % |
| |
(1) | At June 30, 2014, we had fixed LIBOR at a weighted average interest rate of 1.5% on $300.0 million of our variable rate debt through eleven interest rate swap agreements. |
| |
(2) | Acquisition costs were omitted due to their variability, which impacted the comparability of period-over-period results. |
| |
(3) | Fixed charges include interest expense, debt principal amortization and quarterly accumulated dividends on our preferred shares. |
| |
(4) | Excludes personnel separation costs and legal costs associated with informal SEC inquiry. For detail of these costs, see the reconcilation of FFO available to common shareholders to Core FFO on the Quarterly Financial Measures table. |
|
| | |
| | Outstanding Debt (unaudited, dollars in thousands)
|
|
| | | | | | | | | | | | | | | |
| Fixed-Rate Debt | Effective Interest Rate | | Balance at June 30, 2014 | | Annualized Debt Service | | Maturity Date | | Balance at Maturity |
| Encumbered Properties | | | | | | | | | |
Jackson National Life Loan (1) | 5.19% | | $ | 65,537 |
| | $ | 4,577 |
| | 8/1/2015 | | $ | 64,230 |
|
Hanover Business Center Building D (2) | 6.63% | | 179 |
| | 161 |
| | 8/1/2015 | | 13 |
|
Chesterfield Business Center Buildings C, D, G and H (2) | 6.63% | | 495 |
| | 414 |
| | 8/1/2015 | | 34 |
|
Gateway Centre Manassas Building I(2) | 5.88% | | 536 |
| | 239 |
| | 11/1/2016 | | — |
|
Hilside I and II(2) | 4.62% | | 13,150 |
| | 945 |
| | 12/6/2016 | | 12,160 |
|
| Redland Corporate Center Buildings II and III | 4.64% | | 66,434 |
| | 4,014 |
| | 11/1/2017 | | 62,064 |
|
Hanover Business Center Building C(2) | 6.63% | | 581 |
| | 186 |
| | 12/1/2017 | | 13 |
|
| 840 First Street NE | 6.01% | | 36,848 |
| | 2,722 |
| | 7/1/2020 | | 32,000 |
|
| Battlefield Corporate Center | 4.40% | | 3,772 |
| | 320 |
| | 11/1/2020 | | 2,618 |
|
Chesterfield Business Center Buildings A, B, E, and F(2) | 6.63% | | 1,775 |
| | 318 |
| | 6/1/2021 | | 26 |
|
Airpark Business Center(2) | 6.63% | | 968 |
| | 173 |
| | 6/1/2021 | | 14 |
|
| 1211 Connecticut Avenue, NW | 4.47% | | 29,973 |
| | 1,823 |
| | 7/1/2020 | | 24,668 |
|
| 1401 K Street, NW | 4.93% | | 37,168 |
| | 2,392 |
| | 6/1/2023 | | 30,414 |
|
| Total Fixed-Rate Debt | 5.03%(3) | | $ | 257,416 |
| | $ | 18,284 |
| | | | $ | 228,254 |
|
| | | | | | | | | | |
| Unamortized fair value adjustments | | | (558 | ) | | | | | | |
| | | | | | | | | | |
| Total Principal Balance | | | $ | 256,858 |
| | | | | | |
| | | | | | | | | | |
Variable-Rate Debt(4) | | | | | | | | | |
| | | | | | | | | | |
Storey Park(5) | 5.80% | | $ | 22,000 |
| | $ | 1,100 |
| | 10/16/2014 | | $ | 2,200 |
|
440 First Street, NW Construction Loan(6) | LIBOR + 2.50% | | 23,493 |
| | 625 |
| | 5/30/2016 | | 23,493 |
|
| Unsecured Revolving Credit Facility | LIBOR + 1.50% | | 116,000 |
| | 1,926 |
| | 10/16/2017 | | 116,000 |
|
| Unsecured Term Loan | | | | | | | | | |
| Tranche A | LIBOR + 1.45% | | 100,000 |
| | 1,610 |
| | 10/16/2018 | | 100,000 |
|
| Tranche B | LIBOR + 1.60% | | 100,000 |
| | 1,760 |
| | 10/16/2019 | | 100,000 |
|
| Tranche C | LIBOR + 1.90% | | 100,000 |
| | 2,060 |
| | 10/16/2020 | | 100,000 |
|
| Total Unsecured Term Loan | 1.87%(3) | | $ | 300,000 |
| | $ | 5,430 |
| | | | $ | 300,000 |
|
| | | | | | | | | | |
| Total Variable-Rate Debt | 3.14%(3)(7) | | $ | 461,493 |
| | $ | 9,081 |
| | | | $ | 461,493 |
|
| | | | | | | | | | |
| Total Debt at June 30, 2014 | 3.82%(3)(7) | | $ | 718,909 |
| | $ | 27,365 |
| (8) | | | $ | 689,747 |
|
| |
(1) | At June 30, 2014, the loan was secured by the following properties; Plaza 500, Van Buren Office Park, Rumsey Center, Snowden Center, Greenbrier Technology Center II and Norfolk Business Center. The terms of the loan allow us to substitute collateral as long as certain debt-service coverage and loan-to-value ratios are maintained, or to prepay a portion of the loan, with a prepayment penalty, subject to a debt service yield. |
| |
(2) | The balance includes the fair value impacts recorded at acquisition upon assumption of the mortgages encumbering these properties. |
| |
(3) | Represents the weighted average interest rate. |
| |
(4) | All of our variable rate debt is based on one-month LIBOR. For the purposes of calculating the annualized debt service and effective interest rate, we used the one-month LIBOR rate at June 30, 2014 which was 0.16%. |
| |
(5) | The loan has a contractual interest rate of LIBOR plus a spread of 2.75% (with a floor of 5.0%) and matures in October 2014, with a one-year extension at our option. |
| |
(6) | The loan matures in May 2016, with two one-year extension options at our discretion and has a borrowing capacity of up to $43.5 million. We can repay all or a portion of the Construction Loan, without penalty, at any time during the term of the loan. |
| |
(7) | At June 30, 2014, we had fixed LIBOR on $300.0 million of our variable rate debt through eleven interest rate swap agreements. The effective interest rate reflects the impact of our interest rate swap agreements. |
| |
(8) | During the second quarter of 2014, we paid approximately $1.4 million in principal payments on our consolidated mortgage debt, which excludes $8.0 million related to mortgage debt that was repaid in May 2014. |
|
| | |
| | Debt Maturity Schedule (unaudited, dollars in thousands)
|
NOI of Pledged Properties and Supported Indebtedness
|
| | | | | | | | | | | | | | | | | |
| Year of Maturity | | Type | | Annualized NOI | | Total Maturing Indebtedness | | Total Supported Indebtedness | | Debt Yield |
| 2014 | | Secured Property Debt | | $ | — |
| | $ | 22,000 |
| | $ | 22,000 |
| | NM |
|
| 2015 | | Secured Property Debt | | 12,456 |
| | 64,277 |
| | 64,277 |
| | 19.4 | % |
| 2016 | | Secured Property Debt | | 790 |
| | 12,160 |
| | 12,160 |
| | 6.5 | % |
| 2016 | | Construction Loan | | — |
| | 23,493 |
| | 23,493 |
| | NM |
|
| 2017 | | Secured Property Debt | | 8,966 |
| | 62,077 |
| | 62,077 |
| | 14.4 | % |
| 2017 | | Unsecured Debt | | 68,703 |
| | 116,000 |
| | 416,000 |
| | 16.5 | % |
| 2018 | | Unsecured Term Loan | | 68,703 |
| | 100,000 |
| | 416,000 |
| | 16.5 | % |
| 2019 | | Unsecured Term Loan | | 68,703 |
| | 100,000 |
| | 416,000 |
| | 16.5 | % |
| 2020 | | Unsecured Term Loan | | 68,703 |
| | 100,000 |
| | 416,000 |
| | 16.5 | % |
| 2020 | | Secured Property Debt | | 7,215 |
| | 34,618 |
| | 34,618 |
| | 20.8 | % |
| 2021 | | Secured Property Debt | | 716 |
| | 40 |
| | 40 |
| | NM |
|
| 2022 | | Secured Property Debt | | 2,567 |
| | 24,668 |
| | 24,668 |
| | 10.4 | % |
| 2023 | | Secured Property Debt | | 2,482 |
| | 30,414 |
| | 30,414 |
| | 8.2 | % |
NM= Not meaningful.
| |
(1) | At June 30, 2014, we had fixed LIBOR on $300.0 million of our variable rate debt through eleven interest rate swap agreements. |
|
| | |
| | Selected Debt Covenants (unaudited, dollars in thousands) |
|
| | | | | |
| | Unsecured Credit Facility/Unsecured Term Loan / Construction Loan |
| | | | |
| Covenants | Quarter Ended June 30, 2014 | | Covenant |
Consolidated Total Leverage Ratio (1) | 44.3 | % | | ≤ 60% |
Tangible Net Worth (1) | $ | 968,974 |
| | ≥ 601,202 |
Fixed Charge Coverage Ratio (1) | 2.03x |
| | ≥ 1.50x |
| Maximum Dividend Payout Ratio | 72.6 | % | | ≤ 95% |
| | | | |
| Restricted Investments: | | | |
| Joint Ventures | 5.5 | % | | ≤ 15% |
| Real Estate Assets Under Development | 3.3 | % | | ≤ 15% |
| Undeveloped Land | 1.3 | % | | ≤ 5% |
| Structured Finance Investments | 3.7 | % | | ≤ 5% |
| Total Restricted Investments | 8.3 | % | | ≤ 25% |
| | | | |
| Restricted Indebtedness: | | | |
| Maximum Secured Debt | 20.1 | % | | ≤ 40% |
Unencumbered Pool Leverage (1) | 44.9 | % | | ≤ 60 |
Unencumbered Pool Interest Coverage Ratio (1) | 5.55x |
| | ≥ 1.75x |
| |
(1) | These are the only covenants that apply to the Construction Loan, which are calculated in accordance with the amended and restated unsecured revolving credit facility. |
|
| | |
| | Net Asset Value Analysis (unaudited, amounts in thousands, except percentages) |
|
| | | |
Income Statement Items(1) | Three Months Ended June 30, 2014 |
| | |
| Total Portfolio In-Place Cash NOI | |
| Total GAAP Revenue | $ | 39,861 |
|
| Straight-line and Deferred Market Rents | (360 | ) |
Management Fee Adjustment(2) | 747 |
|
| Property Operating Costs | (14,841 | ) |
| Total Portfolio In-Place Cash NOI | $ | 25,407 |
|
| | |
| Occupancy as of June 30, 2014 | 86.0 | % |
| | |
| Balance Sheet Items | |
| | |
| Development & Redevelopment Assets | |
| Original Cost Basis of Land held for Future Development | $ | 22,664 |
|
| Original Cost Basis of Assets in Current Development/Redevelopment | 55,735 |
|
| Construction Costs to Date for Current Development/Redevelopment | 37,909 |
|
| Total Development & Redevelopment Assets | $ | 116,308 |
|
| | |
| Other Assets | |
| Investments in Affiliates | 49,278 |
|
| Notes Receivable, net | 63,751 |
|
| Total Other Assets | $ | 113,029 |
|
| | |
| Net Liabilities at June 30, 2014 | |
| Mortgage and Senior Debt, cash principal balances | $ | (718,351 | ) |
| Accrued interest | (1,701 | ) |
| Rents received in advance | (5,734 | ) |
| Tenant security deposits | (6,125 | ) |
| Accounts payable and other liabilities | (37,604 | ) |
| Cash, cash equivalents, escrows and reserves | 18,151 |
|
| Accounts and other receivables, net of allowance for doubtful accounts | 10,050 |
|
| Prepaid expenses and other assets | 6,466 |
|
| Total Net Liabilities | $ | (734,848 | ) |
| | |
| Preferred Shares Outstanding at June 30, 2014 | 6,400 |
|
| Par Value of Preferred Shares Outstanding at June 30, 2014 | $ | 160,000 |
|
| Weighted Average Diluted Shares and OP Units Outstanding for the quarter ended June 30, 2014 | 60,850 |
|
| |
(1) | Does not include figures from discontinued operations for West Park and Patrick Center, nor the income from Corporate Campus at Ashburn Center and Owings Mills Business Park. |
| |
(2) | Management fee adjustment is used in lieu of an administrative overhead allocation for comparative purposes. |
|
| | |
| | Investment in Joint Ventures (unaudited, dollars in thousands) |
|
| | | | | | | | | | | | | | | | | | | | | | | | | |
| Unconsolidated Joint Ventures | | | | | | | | | | | | |
| | FPO Ownership | | FPO Investment at June 30, 2014 | | Property Type | | Location | | Square Feet | | Leased at June 30, 2014 | | Occupied at June 30, 2014 |
| RiversPark I and II | 25% | | $ | 2,358 |
| | Business Park | | Columbia, MD | | 307,984 |
| | 94.7% | | 94.7% |
| Aviation Business Park | 50% | | 4,947 |
| | Office | | Glen Burnie, MD | | 120,285 |
| | 69.8% | | 45.9% |
| 1750 H Street, NW | 50% | | 17,307 |
| | Office | | Washington, DC | | 113,235 |
| | 97.0% | | 84.9% |
| Prosperity Metro Plaza | 51% | | 24,666 |
| | Office | | Fairfax, VA | | 326,414 |
| | 93.0% | | 85.8% |
| Total / Weighted Average | | $ | 49,278 |
| | | | | | 867,918 |
| | 90.9% | | 83.3% |
| | | | | | | | | | | | | | |
| Outstanding Debt | | | FPO Ownership | | Effective Interest Rate | | Principal Balance at June 30, 2014(2) | | Annualized Debt Service | | Maturity Date | | Balance at Maturity(2) |
| RiversPark I and II | | | 25% | | LIBOR + 2.50%(1) | | $ | 28,000 |
| | $ | 742 |
| | 9/26/2014(3) | | $ | 28,000 |
|
| 1750 H Street, NW | | | 50% | | 5.17% | | 27,886 |
| | 2,634 |
| | 7/10/2014(4) | | 27,886 |
|
| Prosperity Metro Plaza | | 51% | | 3.86% | | 48,928 |
| | 3,628 |
| | 1/11/2015 | | 48,140 |
|
| Total / Weighted Average | | | | 3.89% | | $ | 104,814 |
| | $ | 7,004 |
| | | | $ | 104,026 |
|
| | | | | | | | | | | | | | |
| Income Statement - Unconsolidated Joint Ventures | | | | | | | | | | | | | |
| | | | | | Three Months Ended(5) |
| | | | | | June 30, 2014 | | March 31, 2014 | | December 31, 2013 | | September 30, 2013 | | June 30, 2013 |
| | | | | | | | | | | | | | |
Cash revenues(6) | | | | | $ | 5,611 |
| | $ | 5,521 |
| | $ | 5,623 |
| | $ | 5,647 |
| | $ | 5,560 |
|
Non-cash revenues(6) | | | | 169 |
| | 231 |
| | 348 |
| | 388 |
| | 399 |
|
| Total revenues | | | | | 5,780 |
| | 5,752 |
| | 5,971 |
| | 6,035 |
| | 5,959 |
|
| Total operating expenses | | | | (1,694 | ) | | (2,226 | ) | | (2,104 | ) | | (1,879 | ) | | (1,905 | ) |
| Net operating income | | | | 4,086 |
| | 3,526 |
| | 3,867 |
| | 4,156 |
| | 4,054 |
|
| Depreciation and amortization | | | | (2,264 | ) | | (2,803 | ) | | (2,870 | ) | | (2,887 | ) | | (2,854 | ) |
| Interest expense, net of interest income | | | | (1,031 | ) | | (1,011 | ) | | (1,038 | ) | | (1,063 | ) | | (1,062 | ) |
| Other expenses | | | | | (46 | ) | | — |
| | (13 | ) | | (28 | ) | | (28 | ) |
| Net income (loss) | | | | | $ | 745 |
| | $ | (288 | ) | | $ | (54 | ) | | $ | 178 |
| | $ | 110 |
|
| |
(1) | The loan has a contractual interest rate of LIBOR plus a spread of 250 basis points. For the purposes of calculating the annualized debt service and the effective interest rate, we used the one-month LIBOR rate at June 30, 2014, which was 0.16%. |
| |
(2) | Reflects the balance of the debt secured by the properties, not our portion of the debt. |
| |
(3) | During the first quarter of 2014, the loan was extended by six months to September 26, 2014. |
| |
(4) | On July 10, 2014, our 50% owned unconsolidated joint venture repaid a $27.9 million mortgage loan with Wells Fargo that encumbered 1750 H Street, NW. Simultaneous with the repayment, the joint venture entered into a new $32.0 million mortgage loan with State Farm that has a fixed interest rate of 3.92%, a maturity date of August 1, 2024, and is repayable in full without penalty on or after August 1, 2021. The new loan requires monthly interest-only payments with a constant interest rate over the life of the loan. |
| |
(5) | Reflects the operating results of the property, not our economic interest in the properties. |
| |
(6) | Cash revenues are comprised of base rent, tenant recoveries and other miscellaneous income. Non-cash revenues are comprised of straight-line rent, rent abatement and deferred base and market rent. |
|
| | |
| | Portfolio Summary (unaudited)
|
|
| | | | | | | | | | | | | | | | | | | | | | |
| Consolidated Portfolio | | | | | | | | | | | | | | | |
| | Number of Buildings | | Square Feet(1) | | % Leased(1) | | % Occupied(1) | | Annualized Cash Basis Rent(2)(3) | | % of Annualized Cash Basis | | | | |
| By Region | | | | | | | | | | | | | | | |
Washington DC(4) | 5 | | 649,107 |
| | 95.7 | % | | 87.4 | % | | $ | 19,059,730 |
| | 16.1 | % | | | | |
| Maryland | 42 | | 2,178,379 |
| | 89.2 | % | | 85.7 | % | | 33,588,078 |
| | 28.3 | % | | | | |
| Northern VA | 49 | | 3,021,597 |
| | 91.5 | % | | 86.3 | % | | 39,877,490 |
| | 33.6 | % | | | | |
| Southern VA | 38 | | 2,851,568 |
| | 86.1 | % | | 85.5 | % | | 26,125,730 |
| | 22.0 | % | | | | |
| Richmond | 19 | | 827,900 |
| | 78.3 | % | | 77.6 | % | | 5,980,382 |
| | 5.0 | % | | | | |
| Norfolk | 19 | | 2,023,668 |
| | 89.3 | % | | 88.7 | % | | 20,145,348 |
| | 17.0 | % | | | | |
| Total / Weighted Average | 134 | | 8,700,651 |
| | 89.5 | % | | 86.0 | % | | $ | 118,651,028 |
| | 100.0 | % | | | | |
By Strategic Category(5) | | | | | | | | | | | | | | | |
| Strategic Hold | 74 | | 6,110,525 |
| | 93.0 | % | | 90.5 | % | | $ | 92,188,694 |
| | 77.7 | % | | | | |
Value-Add(4) | 4 | | 382,727 |
| | 84.4 | % | | 61.0 | % | | 5,757,717 |
| | 4.9 | % | | | | |
| Non-Core | 56 | | 2,207,399 |
| | 80.6 | % | | 77.7 | % | | 20,704,617 |
| | 17.5 | % | | | | |
| Total / Weighted Average | 134 | | 8,700,651 |
| | 89.5 | % | | 86.0 | % | | $ | 118,651,028 |
| | 100.0 | % | | | | |
| | | | | | | | | | | | | | | | |
Significant Development/Redevelopment(6) | | | | | | | | | | | | |
| (dollars in thousands) | | | | | | | | | | | | | | | |
| | Region | | Square Feet | | Leased Sq Ft | | Occupied Sq Ft | | Projected Investment Stabilization(7) | | Investment To Date(7) | | Estimated Date In Service(8) | | Expected Return on Investment |
| Redevelopment | | | | | | | | | | | | | | | |
| 440 First Street, NW | Washington DC | | 139,273 |
| | 47,501 |
| | 25,486 |
| | $66,000 | | $56,644 | | Q4-2014 | | 8% |
| | | | | | | | | | | | | | | | |
| | Number of Buildings | | Square Feet(1) | | % Leased(1) | | % Occupied(1) | | Annualized Cash Basis Rent(2)(3) | | | | | | |
Unconsolidated Joint Ventures(9) | 12 | | $ | 867,918 |
| | 90.9 | % | | 83.3 | % | | $ | 16,541,414 |
| | | | | | |
(1) Does not include space in development or redevelopment.
(2) Annualized cash basis rent at the end of the quarter, which is calculated as the contractual rent due under the terms of the lease, without taking into account rent abatements, is reflected on a triple-net equivalent basis, by deducting operating expense reimbursements that are included, along with base rent, in the contractual payments of our full service leases.
(3) Includes leased spaces that are not yet occupied.
(4) Amounts include activity at 440 First Street, NW to the extent the space is occupied. Once the entire property is placed into service, which is estimated to occur in October 2014, the entire building will be included in our consolidated portfolio metrics.
(5) "Strategic Category" reflects management's categorization of the property based on our corporate strategic plans. "Strategic Hold" represents properties that are highly aligned with the corporate strategic plans. "Value-Add" represents strategic hold properties to which we intend to add value through lease-up, development and/or redevelopment. "Non-Core" represents properties that are no longer a strategic fit, properties in submarkets where we do not have asset concentration or operating efficiencies and/or properties where we believe we have maximized value.
(6) 841,145 square feet of additional land is available for development, not including Storey Park.
(7) Total Investment includes original cost basis of property, projected base building costs, projected leasing commissions, and projected tenant improvements.
(8) Development/redevelopment is estimated to be placed in service one year from substantial completion.
(9) Represents operating results of the unconsolidated joint ventures, not our economic interest in the properties.
|
| | |
| | Leasing and Occupancy Summary (unaudited) |
|
| | | | | | | | | | | | | | | | | | | | | | | | | | | | | | | | | | |
Portfolio by Property Type and Strategic Category(1) | | | | | | | | | | | | | | |
| | | | | | | | Occupied Portfolio by Property Type and Strategic Category | | Leased Portfolio by Property Type and Strategic Category |
| | Square Feet | | % of Total Portfolio | | Number of Buildings | | Occupied Square Feet | | % Occupied | | Annualized Cash Basis Rent(2) | | % of Annualized Cash Basis Rent | | Leased Square Feet(3) | | % Leased | | Annualized Cash Basis Rent(2)(3) | | % of Annualized Cash Basis Rent |
| By Property Type | | | | | | | | | | | | | | | | | | | | | |
| Office | 3,479,289 |
| | 40.0 | % | | 49 | | 2,984,168 |
| | 85.8 | % | | $ | 63,989,807 |
| | 56.3 | % | | 3,173,854 |
| | 91.2 | % | | $ | 67,749,614 |
| | 57.1 | % |
| Business Park / Industrial | 5,221,362 |
| | 60.0 | % | | 85 | | 4,496,283 |
| | 86.1 | % | | 49,729,895 |
| | 43.7 | % | | 4,610,669 |
| | 88.3 | % | | 50,901,414 |
| | 42.9 | % |
| Total / Weighted Average | 8,700,651 |
| | 100.0 | % | | 134 | | 7,480,451 |
| | 86.0 | % | | $ | 113,719,702 |
| | 100.0 | % | | 7,784,523 |
| | 89.5 | % | | $ | 118,651,028 |
| | 100.0 | % |
| | | | | | | | | | | | | | | | | | | | | | |
By Strategic Category(4) | | | | | | | | | | | | | | | | | | | | | |
| Strategic Hold | 6,110,525 |
| | 70.2 | % | | 74 | | 5,531,958 |
| | 90.5 | % | | $ | 89,539,975 |
| | 78.7 | % | | 5,682,173 |
| | 93.0 | % | | $ | 92,188,694 |
| | 77.7 | % |
| Value-Add | 382,727 |
| | 4.4 | % | | 4 | | 233,446 |
| | 61.0 | % | | 4,123,219 |
| | 3.6 | % | | 322,984 |
| | 84.4 | % | | 5,757,717 |
| | 4.9 | % |
| Non-Core | 2,207,399 |
| | 25.4 | % | | 56 | | 1,715,047 |
| | 77.7 | % | | 20,056,507 |
| | 17.6 | % | | 1,779,366 |
| | 80.6 | % | | 20,704,617 |
| | 17.5 | % |
| Total / Weighted Average | 8,700,651 |
| | 100.0 | % | | 134 | | 7,480,451 |
| | 86.0 | % | | $ | 113,719,702 |
| | 100.0 | % | | 7,784,523 |
| | 89.5 | % | | $ | 118,651,028 |
| | 100.0 | % |
| | | | | | | | | | | | | | | | | | | | | | |
Market Concentration by Annualized Cash Basis Rent(2)(3) | | | | | | | | | | | | | | |
| | | | | | | | | | | | | | | | | | | | | | |
| | Washington DC | | Maryland | | Northern VA | | Southern VA | | | | | | | | | | |
| | | | | | | | Richmond | | Norfolk | | Subtotal | | Total | | | | | | | | |
| Office | 16.1 | % | | 18.1 | % | | 21.4 | % | | 0.0 | % | | 1.5 | % | | 1.5 | % | | 57.1 | % | | | | | | | | |
| Business Park / Industrial | 0.0 | % | | 10.2 | % | | 12.2 | % | | 5.0 | % | | 15.5 | % | | 20.5 | % | | 42.9 | % | | | | | | | | |
| Total / Weighted Average | 16.1 | % | | 28.3 | % | | 33.6 | % | | 5.0 | % | | 17.0 | % | | 22.0 | % | | 100.0 | % | | | | | | | | |
| |
(1) | Does not include space in development or redevelopment. |
| |
(2) | Annualized cash basis rent at the end of the quarter, which is calculated as the contractual rent due under the terms of the lease, without taking into account rent abatements, is reflected on a triple-net equivalent basis, by deducting operating expense reimbursements that are included, along with base rent, in the contractual payments of our full service leases. |
| |
(3) | Includes leased spaces that are not yet occupied. |
| |
(4) | "Strategic Category" reflects management's categorization of the property based on our corporate strategic plans. "Strategic Hold" represents properties that are highly aligned with the corporate strategic plans. "Value-Add" represents strategic hold properties to which we intend to add value through lease-up, development and/or redevelopment. "Non-Core" represents properties that are no longer a strategic fit, properties in submarkets where we do not have asset concentration or operating efficiencies and/or properties where we believe we have maximized value. |
|
| | |
| | Portfolio by Size (unaudited) |
|
| | | | | | | | | | | | | | | | | | | | |
Square Feet Under Lease | | Number of Leases | | Leased Square Feet | | % of Total Square Feet | | Annualized Cash Basis Rent(1) | | % of Annualized Cash Basis Rent | | Average Base Rent per Square Foot(1) |
| 0-2,500 | | 173 |
| | 267,805 |
| | 3.4 | % | | $ | 4,604,885 |
| | 3.9 | % | | $ | 17.19 |
|
| 2,501-10,000 | | 341 |
| | 1,779,652 |
| | 22.9 | % | | 24,165,498 |
| | 20.4 | % | | 13.58 |
| 10,001-20,000 | | 116 |
| | 1,592,374 |
| | 20.5 | % | | 22,087,058 |
| | 18.6 | % | | 13.87 |
| 20,001-40,000 | | 54 |
| | 1,438,267 |
| | 18.5 | % | | 19,529,823 |
| | 16.5 | % | | 13.58 |
| 40,001-100,000 | | 22 |
| | 1,325,869 |
| | 17.0 | % | | 18,862,952 |
| | 15.9 | % | | 14.23 |
| 100,000 + | | 10 |
| | 1,380,556 |
| | 17.7 | % | | 29,400,812 |
| | 24.8 | % | | 21.30 |
| | | | | | | | | | | | | |
| Total/Weighted Average | | 716 |
| | 7,784,523 |
| | 100.0 | % | | $ | 118,651,028 |
| | 100.0 | % | | $ | 15.24 |
|
| |
(1) | Annualized cash basis rent at the end of the quarter, which is calculated as the contractual rent due under the terms of the lease, without taking into account rent abatements, is reflected on a triple-net equivalent basis, by deducting operating expense reimbursements that are included, along with base rent, in the contractual payments of our full service leases. |
|
| | |
| | Top Twenty-Five Tenants (unaudited) |
|
| | | | | | | | | | | | | | | |
| Ranking | Tenant | Number of Leases | | Total Leased Square Feet | | Annualized Cash Basis Rent (1) | | % of Annualized Cash Basis Rent | | Weighted Average Remaining Lease Years |
| | | | | | | | | | | |
| 1 | U.S. Government | 24 | | 757,371 |
| | $ | 15,988,265 |
| | 13.5 | % | | 4.2 |
|
| 2 | BlueCross BlueShield | 1 | | 204,314 |
| | 5,946,076 |
| | 5.0 | % | | 9.2 |
|
| 3 | CACI International | 1 | | 214,214 |
| | 5,284,315 |
| | 4.5 | % | | 2.5 |
|
| 4 | BAE Systems Technology Solutions & Services | 3 | | 167,881 |
| | 4,004,339 |
| | 3.4 | % | | 5.9 |
|
| 5 | ICF Consulting Group, Inc. | 1 | | 127,946 |
| | 3,421,276 |
| | 2.9 | % | | 10.0 |
|
| 6 | Sentara Healthcare | 6 | | 276,974 |
| | 2,509,285 |
| | 2.1 | % | | 6.3 |
|
| 7 | Stock Building Supply, Inc. | 2 | | 171,996 |
| | 2,106,951 |
| | 1.8 | % | | 2.7 |
|
| 8 | State of Maryland - AOC | 14 | | 101,113 |
| | 1,749,206 |
| | 1.5 | % | | 5.5 |
|
| 9 | Vocus, Inc. | 1 | | 93,000 |
| | 1,675,454 |
| | 1.4 | % | | 8.8 |
|
| 10 | Montgomery County, Maryland | 2 | | 57,825 |
| | 1,430,334 |
| | 1.2 | % | | 7.4 |
|
| 11 | Siemers Corporation | 3 | | 100,745 |
| | 1,389,277 |
| | 1.2 | % | | 2.1 |
|
| 12 | First Data Corporation | 1 | | 117,336 |
| | 1,331,764 |
| | 1.1 | % | | 5.4 |
|
| 13 | Affiliated Computer Services, Inc. | 1 | | 107,422 |
| | 1,318,068 |
| | 1.1 | % | | 2.5 |
|
| 14 | Odin, Feldman & Pittle | 1 | | 53,918 |
| | 1,161,394 |
| | 1.0 | % | | 13.3 |
|
| 15 | Lyttle Corp | 1 | | 54,530 |
| | 1,112,957 |
| | 0.9 | % | | 8.6 |
|
| 16 | Harris Corporation | 3 | | 47,358 |
| | 996,748 |
| | 0.8 | % | | 0.8 |
|
| 17 | American Public University System, Inc. | 3 | | 63,455 |
| | 963,778 |
| | 0.8 | % | | 0.8 |
|
| 18 | Verizon | 5 | | 70,627 |
| | 944,192 |
| | 0.8 | % | | 4.7 |
|
| 19 | DRS Defense Solutions, LLC | 2 | | 45,675 |
| | 918,677 |
| | 0.8 | % | | 3.7 |
|
| 20 | Harris Connect | 1 | | 64,486 |
| | 862,176 |
| | 0.7 | % | | 2.3 |
|
| 21 | McLean Bible Church | 1 | | 53,559 |
| | 816,775 |
| | 0.7 | % | | 10.0 |
|
| 22 | Telogy Networks, Inc. | 1 | | 52,145 |
| | 798,861 |
| | 0.7 | % | | 3.9 |
|
| 23 | General Dynamics | 3 | | 121,811 |
| | 742,895 |
| | 0.6 | % | | 3.6 |
|
| 24 | ServiceSource, INc. | 3 | | 64,683 |
| | 724,953 |
| | 0.6 | % | | 0.5 |
|
| 25 | Internet Society | 2 | | 30,037 |
| | 699,119 |
| | 0.6 | % | | 4.6 |
|
| | | | | | |
| | | | |
| | Subtotal Total 25 Tenants | 86 | | 3,220,421 |
| | $ | 58,897,135 |
| | 49.6 | % | | 5.4 |
|
| | All Remaining Tenants | 630 | | 4,564,102 |
| | 59,753,895 |
| | 50.4 | % | | 4.8 |
|
| | | | | | | | | | | |
| | Total/ Weighted Average | 716 | | 7,784,523 |
|
| $ | 118,651,030 |
|
| 100.0 | % |
| 5.1 |
|
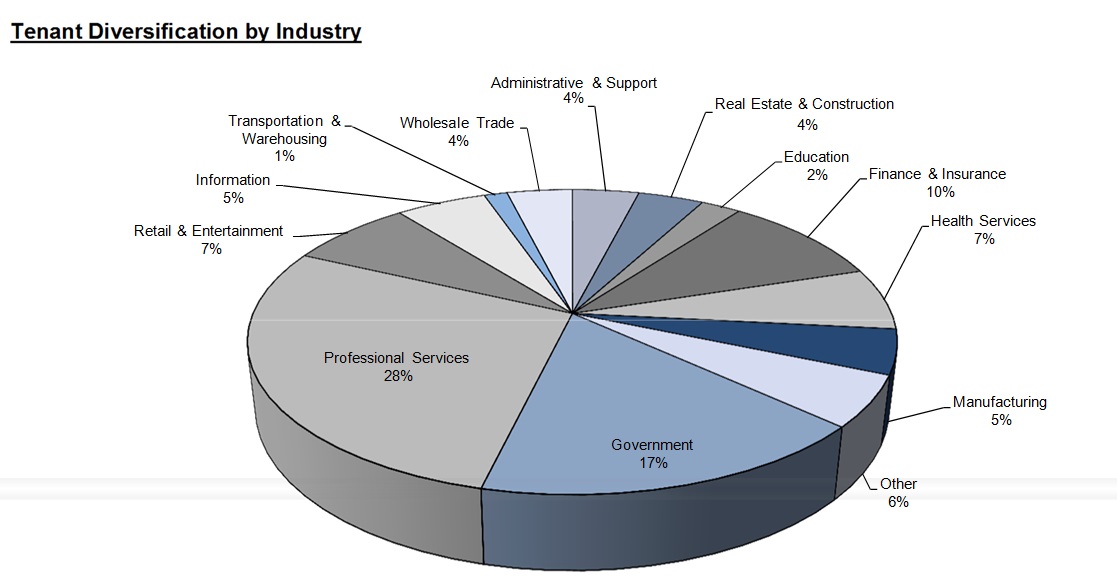
| |
(1) | Annualized cash basis rent at the end of the quarter, which is calculated as the contractual rent due under the terms of the lease, without taking into account rent abatements, is reflected in triple-net equivalent basis, by deducting operating expense reimbursements that are included, along with base rent, in the contractual payments of our full service leases. |
|
| | |
| | Annual Lease Expirations (unaudited) |
|
| | | | | | | | | | | | | | | | | | | | | | | | | | | | | | | |
| | | Total Portfolio | | Property Type |
| | | | | | | | | | | | | Office | | Business Park / Industrial |
Year of Lease Expiration(1) | | Number of Leases Expiring | | Leased Square Feet | | % of Leased Square Feet | | Annualized Cash Basis Rent(2) | | Average Base Rent per Square Foot(2) | | Leased Square Feet | | Average Base Rent per Square Foot(2) | | Leased Square Feet | | Average Base Rent per Square Foot(2) |
MTM | | 5 |
| | 24,606 |
| | 0.3 | % | | $ | 209,678 |
| | $ | 8.52 |
| | 5,981 |
| | $ | 8.51 |
| | 18,625 |
| | $ | 8.52 |
|
| 2014 | | 53 | | 287,464 |
| | 3.7 | % | | 3,576,996 |
| | 12.44 |
| | 123,313 |
| | 16.24 |
| | 164,151 |
| | 9.59 |
|
| 2015 | | 106 | | 657,966 |
| | 8.5 | % | | 9,577,766 |
| | 14.56 |
| | 238,535 |
| | 18.94 |
| | 419,431 |
| | 12.07 |
|
| 2016 | | 105 | | 769,697 |
| | 9.9 | % | | 12,699,182 |
| | 16.50 |
| | 251,530 |
| | 26.68 |
| | 518,167 |
| | 11.56 |
|
| 2017 | | 104 | | 1,276,624 |
| | 16.4 | % | | 19,146,565 |
| | 15.00 |
| | 410,178 |
| | 22.65 |
| | 866,446 |
| | 11.38 |
|
| 2018 | | 86 | | 1,038,203 |
| | 13.3 | % | | 14,014,181 |
| | 13.50 |
| | 385,116 |
| | 19.42 |
| | 653,087 |
| | 10.01 |
|
| 2019 | | 84 | | 943,079 |
| | 12.1 | % | | 12,626,139 |
| | 13.39 |
| | 227,983 |
| | 18.16 |
| | 715,096 |
| | 11.87 |
|
| 2020 | | 50 | | 910,242 |
| | 11.7 | % | | 13,589,636 |
| | 14.93 |
| | 437,772 |
| | 20.80 |
| | 472,470 |
| | 9.49 |
|
| 2021 | | 30 | | 270,803 |
| | 3.5 | % | | 3,472,700 |
| | 12.82 |
| | 53,853 |
| | 18.25 |
| | 216,950 |
| | 11.48 |
|
| 2022 | | 30 | | 258,420 |
| | 3.3 | % | | 3,913,624 |
| | 15.14 |
| | 107,836 |
| | 24.26 |
| | 150,584 |
| | 8.61 |
|
| 2023 | | 14 | | 521,779 |
| | 6.7 | % | | 10,754,741 |
| | 20.61 |
| | 287,612 |
| | 26.59 |
| | 234,167 |
| | 13.27 |
|
| Thereafter | | 49 |
| | 825,640 |
| | 10.6 | % | | 15,069,821 |
| | 18.25 |
| | 644,145 |
| | 20.50 |
| | 181,495 |
| | 10.26 |
|
| Total / Weighted Average | | 716 |
| | 7,784,523 |
| | 100.0 | % | | $ | 118,651,028 |
| | $ | 15.24 |
| | 3,173,854 |
| | $ | 21.35 |
| | 4,610,669 |
| | $ | 11.04 |
|
| |
(1) | We classify leases that expired or were terminated on the last day of the year as leased square footage since the tenant is contractually entitled to the space. |
| |
(2) | Annualized cash basis rent at the end of the quarter, which is calculated as the contractual rent due under the terms of the lease, without taking into account rent abatements, is reflected on a triple- net equivalent basis, by deducting operating expense reimbursements that are included, along with base rent, in the contractual payments of our full service leases. |
|
| | |
| | Quarterly Lease Expirations (unaudited) |
|
| | | | | | | | | | | | | | | | | |
Quarter of Lease Expiration(1) | | Number of Leases Expiring | | Leased Square Feet | | % of Leased Square Feet | | Annualized Cash Basis Rent(2) | | Average Base Rent per Square Foot (2) |
| | | | | | | | | | | |
| MTM | | 5 |
| | 24,606 |
| | 0.3 | % | | $ | 209,678 |
| | $ | 8.52 |
|
| 2014 - Q3 | | 27 |
| | 174,427 |
| | 2.2 | % | | 2,363,048 |
| | 13.55 |
|
| 2014 - Q4 | | 26 |
| | 113,037 |
| | 1.5 | % | | 1,213,948 |
| | 10.74 |
|
| 2015 - Q1 | | 30 |
| | 177,114 |
| | 2.3 | % | | 2,044,178 |
| | 11.54 |
|
| 2015 - Q2 | | 30 |
| | 209,194 |
| | 2.7 | % | | 3,369,809 |
| | 16.11 |
|
| | | | | | | | | | | |
| Total / Weighted Average | | 118 |
| | 698,378 |
| | 9.0 | % | | $ | 9,200,661 |
| | $ | 13.17 |
|
.
| |
(1) | We classify leases that expired or were terminated on the last day of the quarter as leased square footage since the tenant is contractually entitled to the space. |
| |
(2) | Annualized cash basis rent at the end of the quarter, which is calculated as the contractual rent due under the terms of the lease, without taking into account rent abatements, is reflected on a triple-net equivalent basis, by deducting operating expense reimbursements that are included, along with base rent, in the contractual payments of our full service leases. |
|
| | |
| | Leasing Analysis (unaudited)
|
|
| | | | | | | | | | | | | | | | | | | | | | | | | | | | | | |
Lease Summary(1) | | | | | | | | | | | | | | | | | |
| All Comparable and Non-comparable Leases | | | | | | | | | | | | | | | | | |
| | Three Months Ended June 30, 2014 | | | | |
| | Square Footage | | Number of Leases Signed | | Cash Basis Base Rent | | GAAP Basis Base Rent | | Average Lease Term | | Average Capital Cost Per Sq. Ft.(2) | | Average Capital Cost per Sq. Ft. per Year (2) | | | | |
| New Leases | 166,209 |
| | 30 |
| | $ | 12.61 |
| | $ | 13.14 |
| | 7.3 |
| | $ | 26.92 |
| | $ | 3.67 |
| | | | |
| First Generation New Leases | 22,041 |
| | 6 |
| | 27.86 |
| | 27.07 |
| | 6.8 |
| | 76.01 |
| | 11.12 |
| | | | |
| Second Generation New Leases | 144,168 |
| | 24 |
| | 10.28 |
| | 11.01 |
| | 7.4 |
| | 19.41 |
| | 2.62 |
| | | | |
| Renewal Leases | 186,297 |
| | 15 |
| | 12.44 |
| | 12.63 |
| | 3.3 |
| | 6.62 |
| | 2.04 |
| | | | |
| Total / Weighted Average | 352,506 |
| | 45 |
| | $ | 12.52 |
| | $ | 12.87 |
| | 5.2 |
| | $ | 16.19 |
| | $ | 3.13 |
| | | | |
| | | | | | | | | | | | | | | | | | |
| | Six Months Ended June 30, 2014 | | | | |
| | Square Footage | | Number of Leases Signed | | Cash Basis Base Rent | | GAAP Basis Base Rent | | Average Lease Term | | Average Capital Cost Per Sq. Ft.(2) | | Average Capital Cost per Sq. Ft. per Year (2) | | | | |
| New Leases | 310,763 |
| | 48 |
| | $ | 15.49 |
| | $ | 15.22 |
| | 8.1 |
| | $ | 42.48 |
| | $ | 5.25 |
| | | | |
| First Generation New Leases | 117,200 |
| | 11 |
| | 20.61 |
| | 18.27 |
| | 9.1 |
| | 63.07 |
| | 6.92 |
| | | | |
| Second Generation New Leases | 193,563 |
| | 37 |
| | 12.39 |
| | 13.37 |
| | 7.5 |
| | 30.01 |
| | 4.02 |
| | | | |
| Renewal Leases | 298,476 |
| | 33 |
| | 12.56 |
| | 12.85 |
| | 3.8 |
| | 7.06 |
| | 1.86 |
| | | | |
| Total / Weighted Average | 609,239 |
| | 81 |
| | $ | 14.05 |
| | $ | 14.06 |
| | 6.0 |
| | $ | 25.13 |
| | $ | 4.19 |
| | | | |
| | | | | | | | | | | | | | | | | | |
Lease Comparison(1) | | | | | | | | | | | | | | | | | |
Comparable Leases Only (3) | | | | | | | | | | | | | | | | | |
| | Three Months Ended June 30, 2014 | | | | |
| | | | | | Cash Basis | | GAAP Basis | | |
| | Square Footage | | Number of Leases Signed | | Base Rent | | Previous Base Rent | | Percent Change | | Base Rent | | Previous Base Rent | | Percent Change | | Average Lease Term |
| New Leases | 63,855 |
| | 11 |
| | $ | 12.48 |
| | $ | 13.78 |
| | -9.5 | % | | $ | 13.18 |
| | $ | 12.89 |
| | 2.3 | % | | 6.1 |
|
| Renewal Leases | 186,297 |
| | 15 |
| | 12.44 |
| | 13.10 |
| | -5.0 | % | | 12.63 |
| | 12.39 |
| | 1.9 | % | | 3.3 |
|
| Total / Weighted Average | 250,152 |
| | 26 |
| | $ | 12.45 |
| | $ | 13.27 |
| | -6.2 | % | | $ | 12.77 |
| | $ | 12.51 |
| | 2.0 | % | | 4.0 |
|
| | | | | | | | | | | | | | | | | | |
| | Six Months Ended June 30, 2014 | | | | |
| | | | | | Cash Basis | | GAAP Basis | | |
| | Square Footage | | Number of Leases Signed | | Base Rent | | Previous Base Rent | | Change | | Base Rent | | Previous Base Rent | | Percent Change | | Average Lease Term |
| New Leases | 102,908 |
| | 20 |
| | $ | 15.76 |
| | $ | 16.29 |
| | -3.3 | % | | $ | 16.98 |
| | $ | 15.74 |
| | 7.9 | % | | 7.0 |
|
| Renewal Leases | 298,476 |
| | 33 |
| | 12.56 |
| | 13.45 |
| | -6.6 | % | | 12.85 |
| | 12.53 |
| | 2.5 | % | | 3.8 |
|
| Total / Weighted Average | 401,384 |
| | 53 |
| | $ | 13.38 |
| | $ | 14.18 |
| | -5.6 | % | | $ | 13.91 |
| | $ | 13.35 |
| | 4.2 | % | | 4.6 |
|
| |
(1) | Excludes leasing activity at properties that have been sold, or were under contract to be sold during the second quarter of 2014. First quarter 2014 activity for properties not under contract to be sold at that time is included. |
| |
(2) | The average capital cost includes leasing commissions and tenant improvements, but does not include base building improvements needed to (1) bring a space up to code, (2) create building-standard operating efficiency, or (3) add demising walls and define the separate operations of a suite. |
| |
(3) | Comparable lease comparisons do not include comparable data for first generation spaces, suites that have been vacant for over twelve months, or leases with terms of less than one year. |
|
| | |
| | Retention Summary (unaudited)
|
|
| | | | | | | | | | | | | | | | | | |
| | | Three Months Ended June 30, 2014 (1) | | Six Months Ended June 30, 2014 (1) |
| | | Square Footage Expiring(2) | | Square Footage Renewed | | Retention Rate | | Square Footage Expiring(2) | | Square Footage Renewed | | Retention Rate |
| Total Portfolio | | 287,755 |
| | 186,297 |
| | 65 | % | | 499,599 |
| | 298,476 |
| | 60 | % |
| Washington DC | | 41,630 |
| | 7,049 |
| | 17 | % | | 46,889 |
| | 10,637 |
| | 23 | % |
| Maryland | | 24,292 |
| | 10,656 |
| | 44 | % | | 85,723 |
| | 25,367 |
| | 30 | % |
| Northern Virginia | | 26,524 |
| | 26,524 |
| | 100 | % | | 75,004 |
| | 39,361 |
| | 52 | % |
| Southern Virginia | | 195,309 |
| | 142,068 |
| | 73 | % | | 291,983 |
| | 223,111 |
| | 76 | % |
| | | | | | | | | | | | | |
| | | | | | | | | | | | | |
| | | | | | | | | | | | | |
| |
(1) | Excludes leasing activity at properties that have been sold, or were under contract to be sold during the second quarter of 2014. First quarter 2014 activity for properties not under contract to be sold at that time is included. |
| |
(2) | Leases that expire or are terminated on the last day of the quarter are classified as leased square footage and are not reported as expired until the following quarter. |
|
| | |
| | Office Properties (unaudited) |
|
| | | | | | | | | | | | | | | | | | | | | | | |
Property(1) | | Buildings | | Location | | Strategic Category(2) | | Square Feet | | Annualized Cash Basis Rent(3) | | %
Leased | | % Occupied | | Average Base Rent per Square Foot(3) |
| | | | | | | | |
| Washington DC | | | | | | | | | | | | | | | | |
440 First Street, NW(4) | | 1 | | Capitol Hill | | Value-Add | | 25,486 |
| | $ | 762,705 |
| | 100.0 | % | | 100.0 | % | | $ | 29.93 |
|
| 500 First Street, NW | | 1 | | Capitol Hill | | Strategic Hold | | 129,035 |
| | 4,353,615 |
| | 100.0 | % | | 100.0 | % | | 33.74 |
|
| 840 First Street, NE | | 1 | | NoMA(5) | | Strategic Hold | | 248,536 |
| | 7,012,332 |
| | 97.7 | % | | 88.8 | % | | 28.87 |
|
| 1211 Connecticut Avenue, NW | | 1 | | CBD(5) | | Strategic Hold | | 128,807 |
| | 3,607,468 |
| | 93.5 | % | | 68.9 | % | | 29.94 |
|
| 1401 K Street, NW | | 1 | | East End | | Strategic Hold | | 117,243 |
| | 3,323,611 |
| | 88.2 | % | | 88.2 | % | | 32.13 |
|
| Total / Weighted Average | | 5 | | | | | | 649,107 |
| | $ | 19,059,730 |
| | 95.7 | % | | 87.4 | % | | $ | 30.68 |
|
| | | | | | | | | | | | | | | | | |
| Maryland | | | | | | | | | | | | | | | | |
| Annapolis Business Center | | 2 | | Annapolis | | Strategic Hold | | 101,113 |
| | $ | 1,749,206 |
| | 100.0 | % | | 100.0 | % | | $ | 17.30 |
|
| Cloverleaf Center | | 4 | | Germantown | | Strategic Hold | | 173,766 |
| | 2,185,348 |
| | 73.0 | % | | 62.9 | % | | 17.22 |
|
Hillside I and II(6) | | 2 | | Columbia | | Strategic Hold | | 63,709 |
| | 785,003 |
| | 79.5 | % | | 79.5 | % | | 15.49 |
|
| Metro Park North | | 4 | | Rockville | | Strategic Hold | | 191,211 |
| | 2,772,677 |
| | 87.3 | % | | 87.3 | % | | 16.61 |
|
| Redland Corporate Center | | 3 | | Rockville | | Strategic Hold | | 483,162 |
| | 12,233,070 |
| | 100.0 | % | | 100.0 | % | | 25.32 |
|
| TenThreeTwenty | | 1 | | Columbia | | Value-Add | | 137,867 |
| | 1,806,495 |
| | 86.4 | % | | 81.0 | % | | 15.17 |
|
| Total / Weighted Average | | 16 | | | | | | 1,150,828 |
| | $ | 21,531,799 |
| | 91.0 | % | | 88.9 | % | | $ | 20.55 |
|
| | | | | | | | | | | | | | | | | |
| Northern Virginia | | | | | | | | | | | | | | | | |
| Atlantic Corporate Park | | 2 | | Sterling | | Value-Add | | 219,374 |
| | $ | 3,188,517 |
| | 81.3 | % | | 43.9 | % | | $ | 17.87 |
|
| Cedar Hill | | 2 | | Tyson's Corner | | Strategic Hold | | 102,632 |
| | 2,197,561 |
| | 100.0 | % | | 100.0 | % | | 21.41 |
|
| Enterprise Center | | 4 | | Chantilly | | Non-Core | | 187,860 |
| | 3,073,770 |
| | 92.3 | % | | 91.6 | % | | 17.73 |
|
| Herndon Corporate Center | | 4 | | Herndon | | Non-Core | | 128,075 |
| | 1,625,672 |
| | 88.5 | % | | 86.4 | % | | 14.34 |
|
| One Fair Oaks | | 1 | | Fairfax | | Strategic Hold | | 214,214 |
| | 5,284,315 |
| | 100.0 | % | | 100.0 | % | | 24.67 |
|
| Reston Business Campus | | 4 | | Reston | | Non-Core | | 82,372 |
| | 798,267 |
| | 66.1 | % | | 53.7 | % | | 14.65 |
|
| Three Flint Hill | | 1 | | Oakton | | Strategic Hold | | 180,819 |
| | 3,387,132 |
| | 96.3 | % | | 93.8 | % | | 19.46 |
|
| Van Buren Office Park | | 5 | | Herndon | | Non-Core | | 106,873 |
| | 979,486 |
| | 76.1 | % | | 76.1 | % | | 12.04 |
|
| Wiehle Avenue | | 1 | | Reston | | Strategic Hold | | 130,048 |
| | 2,796,272 |
| | 100.0 | % | | 100.0 | % | | 21.50 |
|
| Windsor at Battlefield | | 2 | | Manassas | | Non-Core | | 155,511 |
| | 2,081,523 |
| | 92.0 | % | | 85.5 | % | | 14.55 |
|
| Total / Weighted Average | | 26 | | | | | | 1,507,778 |
| | $ | 25,412,513 |
| | 90.5 | % | | 83.2 | % | | $ | 18.62 |
|
| | | | | | | | | | | | | | | | | |
| Southern Virginia | | | | | | | | | | | | | | | | |
| Greenbrier Towers | | 2 | | Chesapeake | | Strategic Hold | | 171,576 |
| | $ | 1,745,572 |
| | 81.5 | % | | 81.5 | % | | $ | 12.49 |
|
| | | | | | | | | | | | | | | | | |
| Total / Weighted Average | | 49 | | | | | | 3,479,289 |
| | $ | 67,749,614 |
| | 91.2 | % | | 85.8 | % | | $ | 21.35 |
|
| | | | | | | | | | | | | | | | | |
Strategic Category (2) | | | | | | | | | | | | | | | | |
| Strategic Hold | | 26 | | | | | | 2,435,871 |
| | $ | 53,433,180 |
| | 93.8 | % | | 90.7 | % | | $ | 23.38 |
|
| Value-Add | | 4 | | | | | | 382,727 |
| | 5,757,717 |
| | 84.4 | % | | 61.0 | % | | 17.83 |
|
| Non-Core | | 19 | | | | | | 660,691 |
| | 8,558,716 |
| | 85.6 | % | | 81.9 | % | | 15.13 |
|
| Total / Weighted Average | | 49 | | | | | | 3,479,289 |
| | $ | 67,749,614 |
| | 91.2 | % | | 85.8 | % | | $ | 21.35 |
|
| | | | | | | | | | | | | | | | | |
| Unconsolidated Joint Ventures | | | | | | | | | | | | | | | | |
| 1750 H Street, NW | | 1 | | CBD - DC(5) | | | | 113,235 |
| | $ | 3,800,776 |
| | 97.0 | % | | 84.9 | % | | $ | 34.59 |
|
| Aviation Business Park | | 3 | | Glen Burnie - MD | | | | 120,285 |
| | 1,235,711 |
| | 69.8 | % | | 45.9 | % | | 14.71 |
|
| Prosperity Metro Plaza | | 2 | | Merrifield - NOVA | | | | 326,414 |
| | 7,357,893 |
| | 93.0 | % | | 85.8 | % | | 24.24 |
|
| Total / Weighted Average | | 6 | | | | | | 559,934 |
| | $ | 12,394,380 |
| | 88.8 | % | | 77.1 | % | | $ | 24.91 |
|
| |
(1) | Does not include space undergoing substantial development or redevelopment. |
| |
(2) | "Strategic Category" reflects management's categorization of the property based on our corporate strategic plans. "Strategic Hold" represents properties that are highly aligned with the corporate strategic plans. "Value-Add" represents strategic hold properties to which we intend to add value through lease-up, development and/or redevelopment. "Non-Core" represents properties that are no longer a strategic fit, properties in submarkets where we do not have asset concentration or operating efficiencies and/or properties where we believe we have maximized value. |
| |
(3) | Annualized cash basis rent at the end of the quarter, which is calculated as the contractual rent due under the terms of the lease, without taking into account rent abatements, is reflected on a triple-net equivalent basis, by deducting operating expense reimbursements that are included, along with base rent, in the contractual payments of our full service leases. Includes leased spaces that are not yet occupied. |
| |
(4) | Amounts include activity at 440 First Street, NW to the extent the space is occupied. Once the entire property is placed into service, which is estimated to occur in October 2014, the entire building wil be included in our consolidated portfolio metrics. |
| |
(5) | CBD refers to the Central Business District and NoMa refers to North of Massachusetts Avenue. |
| |
(6) | Excludes 21,922 square feet of space that was placed into redevelopment during the first quarter of 2014. |
|
| | |
| | Business Park / Industrial Properties (unaudited)
|
|
| | | | | | | | | | | | | | | | | | | | | | |
Property(1) | Buildings | | Location | | Strategic Category(2) | | Square Feet | | Annualized Cash Basis Rent(3) | | % Leased | | % Occupied | | Average Base Rent per Square Foot(3) |
| | | | | | | |
| Maryland | | | | | | | | | | | | | | | |
Ammendale Business Park(4) | 7 | | Beltsville | | Strategic Hold | | 312,846 |
| | $ | 4,195,109 |
| | 100.0 | % | | 100.0 | % | | $ | 13.41 |
|
| Gateway 270 West | 6 | | Clarksburg | | Strategic Hold | | 253,916 |
| | 2,999,330 |
| | 84.0 | % | | 71.4 | % | | 14.06 |
|
Owings Mills Business Park(5) | 4 | | Owings Mills | | Non-Core | | 180,475 |
| | 1,136,117 |
| | 53.7 | % | | 53.7 | % | | 11.73 |
|
| Rumsey Center | 4 | | Columbia | | Strategic Hold | | 135,047 |
| | 1,406,779 |
| | 94.7 | % | | 80.7 | % | | 11.00 |
|
| Snowden Center | 5 | | Columbia | | Strategic Hold | | 145,267 |
| | 2,318,945 |
| | 100.0 | % | | 100.0 | % | | 15.96 |
|
| Total / Weighted Average | 26 | | | | | | 1,027,551 |
| | $ | 12,056,280 |
| | 87.2 | % | | 82.3 | % | | $ | 13.45 |
|
| | | | | | | | | | | | | | | | |
| Northern Virginia | | | | | | | | | | | | | | | |
| Gateway Centre Manassas | 3 | | Manassas | | Non-Core | | 102,446 |
| | $ | 973,871 |
| | 93.1 | % | | 67.0 | % | | $ | 10.21 |
|
| Linden Business Center | 3 | | Manassas | | Non-Core | | 109,787 |
| | 1,059,297 |
| | 97.4 | % | | 97.4 | % | | 9.91 |
|
Newington Business Park Center(6) | 7 | | Lorton | | Non-Core | | 254,727 |
| | 2,210,389 |
| | 78.6 | % | | 78.0 | % | | 11.05 |
|
Plaza 500(6) | 2 | | Alexandria | | Strategic Hold | | 500,647 |
| | 5,127,169 |
| | 96.7 | % | | 96.7 | % | | 10.60 |
|
| Prosperity Business Center | 1 | | Merrifield | | Non-Core | | 71,373 |
| | 785,846 |
| | 92.5 | % | | 84.9 | % | | 11.91 |
|
Sterling Park Business Center(7) | 7 | | Sterling | | Strategic Hold | | 474,839 |
| | 4,308,406 |
| | 94.2 | % | | 91.4 | % | | 9.63 |
|
| Total / Weighted Average | 23 | | | | | | 1,513,819 |
| | $ | 14,464,976 |
| | 92.5 | % | | 89.4 | % | | $ | 10.33 |
|
| | | | | | | | | | | | | | | | |
| Southern Virginia | | | | | | | | | | | | | | | |
| Battlefield Corporate Center | 1 | | Chesapeake | | Strategic Hold | | 96,720 |
| | $ | 811,368 |
| | 100.0 | % | | 100.0 | % | | $ | 8.39 |
|
Chesterfield Business Center(8) | 11 | | Richmond | | Non-Core | | 320,189 |
| | 1,717,408 |
| | 75.1 | % | | 75.1 | % | | 7.14 |
|
Crossways Commerce Center(9) | 9 | | Chesapeake | | Strategic Hold | | 1,082,753 |
| | 11,320,575 |
| | 94.8 | % | | 94.8 | % | | 11.03 |
|
Greenbrier Business Park(10) | 4 | | Chesapeake | | Strategic Hold | | 410,609 |
| | 3,689,242 |
| | 73.5 | % | | 73.5 | % | | 12.22 |
|
| Hanover Business Center | 4 | | Ashland | | Non-Core | | 184,032 |
| | 798,754 |
| | 66.8 | % | | 66.8 | % | | 6.50 |
|
Norfolk Commerce Park(11) | 3 | | Norfolk | | Strategic Hold | | 262,010 |
| | 2,578,592 |
| | 92.3 | % | | 88.4 | % | | 10.67 |
|
| Park Central | 3 | | Richmond | | Non-Core | | 204,696 |
| | 2,189,589 |
| | 93.3 | % | | 90.1 | % | | 11.46 |
|
| Virginia Technology Center | 1 | | Glen Allen | | Non-Core | | 118,983 |
| | 1,274,630 |
| | 79.1 | % | | 79.1 | % | | 13.54 |
|
| Total / Weighted Average | 36 | | | | | | 2,679,992 |
| | $ | 24,380,158 |
| | 86.4 | % | | 85.8 | % | | $ | 10.53 |
|
| | | | | | | | | | | | | | | | |
| Total / Weighted Average | 85 | | | | | | 5,221,362 |
| | $ | 50,901,414 |
| | 88.3 | % | | 86.1 | % | | $ | 11.04 |
|
| | | | | | | | | | | | | | | | |
Strategic Category(2) | | | | | | | | | | | | | | | |
| Strategic Hold | 48 | | | | | | 3,674,654 |
| | $ | 38,755,514 |
| | 92.4 | % | | 90.4 | % | | $ | 11.41 |
|
| Value-Add | 0 | | | | | | - |
| | - |
| | NA |
| | NA |
| | NA |
|
| Non-Core | 37 | | | | | | 1,546,708 |
| | 12,145,901 |
| | 78.5 | % | | 75.9 | % | | 10.01 |
|
| Total / Weighted Average | 85 | | | | | | 5,221,362 |
| | $ | 50,901,414 |
| | 88.3 | % | | 86.1 | % | | $ | 11.04 |
|
| | | | | | | | | | | | | | | | |
| Unconsolidated Joint Ventures | | | | | | | | | | | | | | | |
| RiversPark I and II | 6 | | Columbia - MD | | | | 307,984 |
| | $ | 4,147,034 |
| | 94.7 | % | | 94.7 | % | | $ | 14.22 |
|
| |
(1) | Does not include space in development or redevelopment. |
| |
(2) | "Strategic Category" reflects management's categorization of the property based on our corporate strategic plans. "Strategic Hold" represents properties that are highly aligned with the corporate strategic plans. "Value-Add" represents strategic hold properties to which we intend to add value through lease-up, development and/or redevelopment. "Non-Core" represents properties that are no longer a strategic fit, properties in submarkets where we do not have asset concentration or operating efficiencies and/or properties where we believe we have maximized value. |
| |
(3) | Annualized cash basis rent at the end of the quarter, which is calculated as the contractual rent due under the terms of the lease, without taking into account rent abatements, is reflected on a triple-net equivalent basis, by deducting operating expense reimbursements that are included, along with base rent, in the contractual payments of our full service leases. Includes leased spaces that are not yet occupied. |
| |
(4) | Ammendale Business Park consists of Ammendale Commerce Center and Indian Creek Court. |
| |
(5) | Owings Mills Business Park consists of Owings Mills Business Center and Owings Mills Commerce Center, which was held-for-sale as of the second quarter of 2014. |
| |
(6) | Newington Business Park Center and Plaza 500 are classified as Industrial properties. |
| |
(7) | Sterling Park Business Center consists of 22370/22400/22446/22455 Davis Drive and 403/405/22560 Glenn Drive. |
| |
(8) | Chesterfield Business Center consists of Airpark Business Center, Chesterfield Business Center and Pine Glen. |
| |
(9) | Crossways Commerce Center consists of the Coast Guard Building, Crossways Commerce Center I, Crossways Commerce Center II, Crossways Commerce Center IV, Crossways I, Crossways II, and 1434 Crossways Boulevard. |
| |
(10) | Greenbrier Business Park consists of Greenbrier Technology Center I, Greenbrier Technology Center II and Greenbrier Circle Corporate Center. |
| |
(11) | Norfolk Commerce Park consists of Norfolk Business Center, Norfolk Commerce Park II and Gateway II. |
|
| | |
| | Management Statements on Non-GAAP Supplemental Measures
|
Investors and analysts following the real estate industry utilize funds from operations ("FFO"), net operating income ("NOI"), earnings before interest, taxes, depreciation and amortization ("EBITDA") and adjusted funds from operations ("AFFO"), variously defined, as supplemental performance measures.
We believe NOI, Same-Property NOI, EBITDA, FFO, Core FFO and AFFO are appropriate measures given their wide use by and relevance to investors and analysts. FFO, reflecting the assumption that real estate asset values rise or fall with market conditions, principally adjusts for the effects of GAAP depreciation/amortization of real estate assets. NOI provides a measure of rental operations and does not factor in depreciation/amortization and non- property specific expenses such as general and administrative expenses. EBITDA provides a further tool to evaluate the ability to incur and service debt and to fund dividends and other cash needs. AFFO provides a further tool to evaluate the ability to fund dividends. In addition, FFO, NOI, EBITDA and AFFO are commonly used in various ratios, pricing multiples/yields and returns and valuation calculations used to measure financial position, performance and value.
NOI
Management believes that NOI is a useful measure of our property operating performance. We define NOI as operating revenues (rental, tenant reimbursements and other income) less property and related expenses (property expenses, real estate taxes and insurance). Other real estate investment trust ("REITs") may use different methodologies for calculating NOI, and accordingly, our NOI may not be comparable to other REITs.
Because NOI excludes general and administrative expenses, interest expense, depreciation and amortization, gains and losses from property dispositions, discontinued operations and extraordinary items, it provides a performance measure that, when compared year over year, reflects the revenues and expenses directly associated with owning and operating commercial real estate properties and the impact to operations from trends in occupancy rates, rental rates and operating costs, providing perspective not immediately apparent from net income. We use NOI to evaluate its operating performance since NOI allows us to evaluate the impact that factors such as occupancy levels, lease structure, lease rates and tenant base have on our results, margins and returns. In addition, management believes that NOI provides useful information to the investment community about our property and operating performance when compared to other REITs since NOI is generally recognized as a standard measure of property performance in the real estate industry. However, NOI should not be viewed as a measure of our overall financial performance since it does not reflect general and administrative expenses, interest expense, depreciation and amortization costs, the level of capital expenditures and leasing costs necessary to maintain the operating performance of our properties.
SAME-PROPERTY NOI
We define same-property NOI as NOI for our properties wholly owned and in-service during the entirety of the periods presented. Other REITs may use different methodologies for calculating same-property NOI and, accordingly, our same-property NOI may not be comparable to other REITs.
EBITDA
Management believes that EBITDA is a useful measure of our operating performance. EBITDA is defined as earnings before interest, taxes, depreciation and amortization.
Management considers EBITDA to be an appropriate supplemental performance measure since it represents earnings prior to the impact of depreciation, amortization, gain (loss) from property dispositions and gains or losses on the retirement of debt. This calculation facilitates the review of income from operations without considering the effect of non-cash depreciation and amortization or the cost of debt.
FFO
Management believes that FFO is a useful measure of our operating performance. We compute FFO as defined by the National Association of Real Estate Investment Trusts, or NAREIT, which states FFO should represent net income or loss before noncontrolling interests (computed in accordance with GAAP) plus real estate related depreciation and amortization (excluding amortization of deferred financing costs) and after adjustments for unconsolidated partnerships and joint ventures, gains or losses on the sale of rental property and impairments of rental property. We also exclude, from our FFO calculation, any depreciation and amortization related to third parties from our consolidated joint ventures. Further, other REITs may use different methodologies for calculating FFO and, accordingly, our FFO may not be comparable to other REITs. We present FFO per diluted share calculations that are based on the outstanding dilutive common shares plus the outstanding common Operating Partnership units for the periods presented.
Management considers FFO a useful additional measure of performance for an equity REIT because it facilitates an understanding of the operating performance of our properties without giving effect to real estate depreciation and amortization, which assumes that the value of real estate assets diminishes predictably over time. Since real estate values have historically risen or fallen with market conditions, we believe that FFO provides a more meaningful and accurate indication of our performance. In addition, management believes that FFO provides useful information to the investment community about our financial performance when compared to other REITs since FFO is generally recognized as the industry standard for reporting the operations of REITs.
CORE FFO
Management believes that the computation of FFO in accordance with NAREIT’s definition includes certain items that are not indicative of the results provided by our operating portfolio and affect the comparability of our period-over-period performance. These items include, but are not limited to, gains and losses on the retirement of debt, legal costs associated with the informal SEC inquiry, personnel separation costs, contingent consideration charges and acquisition costs.
AFFO
Management believes that AFFO is a useful measure for comparative purposes to other REIT's. We compute AFFO by adding to FFO equity based compensation expense and the non-cash amortization of deferred financing costs and non-real estate depreciation, and then subtracting cash paid for any recurring tenant improvements, leasing commissions, and recurring capital expenditures, and eliminating the net effect of straight-line rents, deferred market rent and debt fair value amortization.
First generation costs include tenant improvements, leasing commissions and capital expenditures that were taken into consideration when underwriting the purchase of a property or incurred to bring the property to operating standard for its intended use. We also exclude development and redevelopment related expenditures. AFFO provides an additional perspective on our ability to fund cash needs and make distributions to shareholders by adjusting for the effect of these non-cash items included in FFO, as well as recurring capital expenditures and leasing costs. However, other REITs may use different methodologies for calculating AFFO and, accordingly, our AFFO may not be comparable to other REITs.