Exhibit 99

| | |
Company contacts: | | Patricia J. Miller, Vice President and Corporate Secretary |
| | | 303.837.1661 or patm@whiting.com |
| | | Heather Duncan, Director of Investor Relations |
| | | 303.837.1661 or heatherd@whiting.com |
Whiting Petroleum Announces Company Record Third Quarter Results
Third Quarter Net Income Per Share Rises 63% to $0.70 Per Share
Third Quarter Production Rises 21% to 11.3 Bcfe
Whiting Exits Third Quarter Producing Approximately 177.7 MMcfe Per Day
First Nine Months Net Income Increases 101% to $37.4 Million
Whiting Highlights Third Quarter Drilling Results and Updates 2004 Capital Expenditure
Budget to $80 Million
DENVER – October 15, 2004 – (PR Newswire) – Whiting Petroleum Corporation (NYSE: WLL) today reported net income of $14.3 million, or $0.70 per basic and diluted share, on total revenues of $67.3 million for the three months ended September 30, 2004. This compares to third quarter 2003 net income of $8.0 million, or $0.43 per basic and diluted share, on total revenues of $42.2 million. Discretionary cash flow for the 2004 three-month period was $37.4 million, up 60% compared to $23.4 million during the same period in 2003.
For the first nine months of 2004, Whiting reported net income of $37.4 million, or $1.93 per basic and diluted share, on total revenues of $168.7 million. For the first nine months of 2003, Whiting reported net income of $18.6 million, or $0.99 per basic and diluted share, on total revenues of $124.9 million. Discretionary cash flow for 2004’s first nine months was $97.2 million, an increase of 42% compared to $68.2 million of discretionary cash flow for 2003’s corresponding period. A reconciliation of discretionary cash flow to net cash provided by operating activities is included in this news release.
Revenues and Production
Quarterly total revenue increased 59% over the same period last year. The increase in total revenue was due to higher crude oil and natural gas prices, net of the effect of hedges and increased quarterly production. Production in the third quarter was 11.3 billion cubic feet equivalent (Bcfe), of which 54% was natural gas. This represents an increase of 21% over the same period of 2003, in which Whiting produced 9.3 Bcfe, of which 57% was natural gas. Whiting entered the fourth quarter producing approximately 177.7 million cubic feet equivalent (MMcfe) per day. The third quarter results include the merger of Equity Oil into Whiting beginning July 20. Third quarter results also include our $44.2 million acquisition of Colorado and Wyoming properties beginning August 13, our $19 million acquisition of Louisiana and Texas Gulf Coast properties beginning August 16 and our $345 million acquisition of Permian Basin Properties beginning September 23. Our $35 million acquisition of properties in Wyoming and Utah will not be included in our operating results until October 1, 2004.
For the nine months ended September 30, 2004, Whiting produced 30.0 Bcfe compared to the 27.7 Bcfe produced during the same period in 2003. The year-to-date production increase resulted from property acquisitions, successful new well drilling and workovers.
Recent Acquisitions
The following table summarizes certain information about the purchase price, estimated proved reserves and pre-tax PV10% value as of October 1, 2004 and estimated October 2004 average daily production for the five recent acquisitions described below.
| | | | | | | | | | | | | | | | | | | | |
| | | Purchase Price (In
millions)
| | Proved Reserves
| | | Pre-Tax PV
10% Value (In millions)
| | October 2004
Average Daily
Production (MMcfe)
|
| | | Oil (MMBbl)
| | Natural
Gas (Bcf)
| | Total (Bcfe)
| | %
Natural
Gas
| | | %
Developed
| | | |
Permian Basin Properties(1) | | $ | 345.0 | | 34.2 | | 44.6 | | 250.0 | | 17.8 | % | | 59 | % | | $ | 673.6 | | 36.4 |
Equity Oil Company(2) | | $ | 72.6 | | 10.8 | | 27.4 | | 92.4 | | 29.7 | % | | 81 | % | | $ | 242.1 | | 16.1 |
Colorado/ Wyoming(3) | | $ | 44.2 | | 3.4 | | 19.4 | | 40.0 | | 48.4 | % | | 82 | % | | $ | 76.6 | | 8.6 |
Wyoming/Utah(4) | | $ | 35.0 | | 3.6 | | 11.1 | | 32.6 | | 34.1 | % | | 92 | % | | $ | 64.5 | | 6.1 |
Louisiana/Texas(5) | | $ | 19.3 | | 0.5 | | 10.7 | | 13.9 | | 76.9 | % | | 57 | % | | $ | 39.5 | | 3.5 |
| | |
|
| |
| |
| |
| |
|
| |
|
| |
|
| |
|
Subtotal Acquisitions | | $ | 516.1 | | 52.6 | | 113.2 | | 428.9 | | 26.4 | % | | 68 | % | | $ | 1,096.2 | | 70.7 |
| | |
|
| |
| |
| |
| |
|
| |
|
| |
|
| |
|
Whiting Historical | | | — | | 36.2 | | 205.4 | | 422.3 | | 48.6 | % | | 78 | % | | $ | 1,002.6 | | 107.0 |
| | |
|
| |
| |
| |
| |
|
| |
|
| |
|
| |
|
Total | | | — | | 88.8 | | 318.6 | | 851.3 | | 37.4 | % | | 73 | % | | $ | 2,098.8 | | 177.7 |
| | |
|
| |
| |
| |
| |
|
| |
|
| |
|
| |
|
| (1) | Proved reserves are based on the reserve report prepared by Cawley, Gillespie & Associates, Inc., independent petroleum engineers, as of July 1, 2004. Revenues and volumes are included in our results beginning September 23, 2004. |
| (2) | Proved reserves are based on the reserve report prepared by Ryder Scott Company, L.P., independent petroleum engineers, as of December 31, 2003. Equity’s results of operations and volumes are included in our results beginning July 20, 2004. |
2
| (3) | Proved reserves are based on reserve reports prepared by our engineering staff. Revenues and volumes are included in our results beginning August 13, 2004. |
| (4) | Proved reserves are based on reserve reports prepared by our engineering staff. Revenues and volumes are included in our results beginning September 30, 2004. |
| (5) | Proved reserves are based on reserve reports prepared by our engineering staff. Revenues and volumes are included in our results beginning August 16, 2004. |
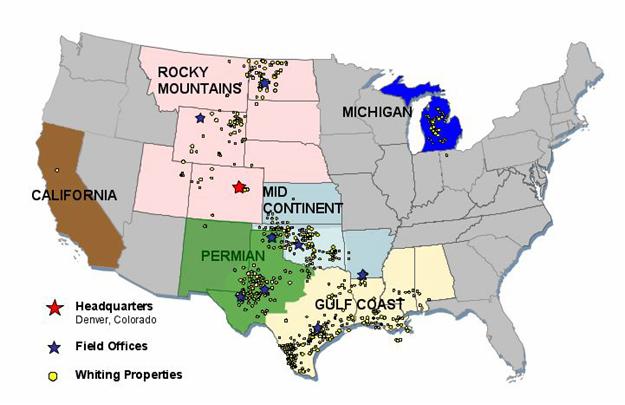
The following table summarizes our estimated proved reserves and pre-tax pv10% value within our areas of operation as of October 1, 2004.
| | | | | | | | | | | | |
| | | Net Proved Reserves as of 10/1/2004
| |
| | | Oil
(MMBbl)
| | Gas (Bcf)
| | Total (Bcfe)
| | Pre-Tax
PV10 Value
(MM$)
| | Percent
of Total
PV10
| |
Rocky Mountains* | | 43.9 | | 61.6 | | 325.0 | | | 741.6 | | 35.3 | % |
Permian | | 37.7 | | 47.9 | | 274.2 | | | 732.3 | | 34.9 | % |
Gulf Coast | | 3.2 | | 91.9 | | 111.4 | | | 312.0 | | 14.9 | % |
Michigan | | 1.9 | | 87.6 | | 98.8 | | | 218.1 | | 10.4 | % |
Mid-Continent | | 2.0 | | 15.6 | | 27.7 | | | 61.5 | | 2.9 | % |
California | | 0.0 | | 14.1 | | 14.1 | | | 33.3 | | 1.6 | % |
| | |
| |
| |
| |
|
| |
|
|
Total | | 88.8 | | 318.6 | | 851.3 | | $ | 2,098.8 | | 100.0 | % |
| * | Includes Canadian Reserves of 5.2 Bcfe and $18.6 MM PV10 |
3
Production and Prices
Third quarter 2004 crude oil production was 857,000 barrels, up 30% from 2003. For the nine months ended September 30, 2004, crude oil production was 2.2 million barrels compared to 1.9 million barrels produced during the same period in 2003. Whiting received an average price of $36.78 per barrel, net of the effect of hedges, in the third quarter of 2004. This compares to an average price of $27.01, net of the effect of hedges, for the 2003 corresponding period. Whiting’s average realized crude oil price during the first nine months of 2004 was $33.45 net of the effect of oil hedges. The comparable 2003 average realized crude oil price was $27.21 per barrel net of the effect of oil hedges.
Whiting produced 6.1 Bcf of natural gas in the third quarter, compared to 5.3 Bcf produced in the same period last year, an increase of 15%. Natural gas production for the first nine months was 17.1 Bcf, up 6.3% over the 16.1 Bcf produced in 2003. The average gas price received in the third quarter, net of the effects of hedging, was $5.28 per thousand cubic feet (Mcf) versus $4.57 per Mcf in the same quarter last year. Nine-month natural gas prices, net of the effect of hedges, were up 18.3% to $5.30 per Mcf compared to $4.48 per Mcf for the same period in 2003. On an equivalent basis, after consideration of hedging transactions, the average price Whiting received for all oil and gas production in the nine months ended September 30, 2004 increased 20.2% to $5.42 per Mcfe.
Whiting incurred a hedging loss of $3.6 million during the first nine months of 2004 compared to a $9.0 million loss recorded during the same period in 2003. A summary of Whiting’s outstanding crude oil and natural gas hedges is included in this press release.
Noteworthy events and results for the three and nine months ended September 30, 2004 include:
| | • | Whiting Petroleum’s reserve base nearly doubled from a total of one merger and four separate cash acquisitions of producing properties completed during the third quarter of 2004. After final accounting adjustments for the merger transaction, the combined purchase price for these five acquisitions was $516.1 million for total estimated proved reserves of approximately 421.9 Bcfe, or $1.22 per Mcfe. October 2004 daily production from these acquisitions is expected to be approximately 70.7 MMcfe per day. |
| | • | The acquisitions and merger provided ownership in key Texas fields such as the Parkway Field in Eddy County, New Mexico, Would Have and Signal Peak Fields in Howard |
4
| | County, Texas, Keystone Field in Winkler County, Texas and the DEB Field in Gaines County, Texas. Whiting also added key producing fields in Wyoming, Louisiana, Utah, Colorado and California. |
| | • | Total Company daily production entering the fourth quarter is approximately 177.7 MMcfe per day, a new company record. |
| | • | During the third quarter, Whiting sold all of its remaining shares of Delta Petroleum Corporation common stock, which trades publicly under the ticker symbol DPTR. In the third quarter, the Company realized gross proceeds of $2.7 million, and a gain on the sale of $2.4 million. |
| | • | Whiting entered into an amended and restated $750 million credit agreement with a syndicate of banks. The new credit agreement increases the Company’s borrowing base to $480 million from $195 million under the prior credit agreement. |
Commenting on Whiting’s 2004 year-to-date results, James J. Volker, Chairman, President and Chief Executive Officer of Whiting Petroleum, said: “Our ongoing strategy of acquire, exploit and explore was a focal point during the third quarter. We completed the acquisition of valuable properties in key markets at attractive prices. We are moving quickly to assimilate the recently acquired properties into the family of Whiting assets. We believe that the increased acreage and drilling plans that we have for each property will significantly increase Whiting’s net daily production over the next two years.”
Volker added: “For the year, we have achieved new milestones for the Company and its shareholders. Net income and net income per share for the first nine months of this year are 101% and 95% higher, respectively, than was reported for the same period in 2003. Based on our current production rate, we expect to establish new company records for production and reserves in 2004. In addition to being pleased with our 2004 acquisition cost of $1.22 per Mcfe, we are also pleased with the number of projects we have in our core areas. We believe that we have repeatable, long reserve life exploitation projects in four of our core areas: the Rockies, the Permian Basin, the Gulf Coast and Michigan. These projects position Whiting with long-term production and reserve growth potential.”
5
Selected Operating and Financial Statistics
| | | | | | | | | | | | | | | | |
| | | Three Months Ended Sept 30,
| | | Nine Months Ended Sept 30,
| |
| | | 2004
| | | 2003
| | | 2004
| | | 2003
| |
Selected operating statistics | | | | | | | | | | | | | | | | |
Production | | | | | | | | | | | | | | | | |
Natural Gas, MMcf | | | 6,128 | | | | 5,338 | | | | 17,098 | | | | 16,084 | |
Oil and condensate, MBbl | | | 857 | | | | 657 | | | | 2,158 | | | | 1,930 | |
Natural gas equivalents, MMcfe | | | 11,270 | | | | 9,280 | | | | 30,046 | | | | 27,664 | |
Average Prices | | | | | | | | | | | | | | | | |
Natural gas, Mcf (including hedging) | | $ | 5.28 | | | $ | 4.57 | | | $ | 5.30 | | | $ | 4.48 | |
Oil, Bbl (including hedging) | | $ | 36.78 | | | $ | 27.01 | | | $ | 33.45 | | | $ | 27.21 | |
Per Mcfe Data | | | | | | | | | | | | | | | | |
Sales price (including hedging) | | $ | 5.67 | | | $ | 4.54 | | | $ | 5.42 | | | $ | 4.51 | |
Lease operating | | $ | 1.15 | | | | 1.22 | | | $ | 1.15 | | | $ | 1.16 | |
Production taxes | | $ | 0.35 | | | $ | 0.28 | | | $ | 0.34 | | | $ | 0.29 | |
Depreciation, depletion and amortization | | $ | 1.15 | | | $ | 1.10 | | | $ | 1.15 | | | $ | 1.11 | |
General and administrative | | $ | 0.54 | | | $ | 0.34 | | | $ | 0.47 | | | $ | 0.34 | |
Selected Financial Data | | | | | | | | | | | | | | | | |
(In thousands, Except Per Share Data) | | | | | | | | | | | | | | | | |
Total revenues | | $ | 67,290 | | | $ | 42,208 | | | $ | 168,741 | | | $ | 124,865 | |
Total costs and expenses | | $ | 43,972 | | | $ | 29,322 | | | $ | 107,786 | | | $ | 88,564 | |
Net income | | $ | 14,317 | | | $ | 7,990 | | | $ | 37,426 | | | $ | 18,602 | |
Per share, basic and diluted | | $ | 0.70 | | | $ | 0.43 | | | $ | 1.93 | | | $ | 0.99 | |
Average shares outstanding, basic | | | 20,516 | | | | 18,750 | | | | 19,341 | | | | 18,750 | |
Average shares outstanding, diluted | | | 20,554 | | | | 18,750 | | | | 19,730 | | | | 18,750 | |
Net cash provided by operating activities | | $ | 49,585 | | | $ | 28,092 | | | $ | 96,866 | | | $ | 74,954 | |
Net cash (used) by investing activities | | $ | (465,412 | ) | | $ | (16,763 | ) | | $ | (491,958 | ) | | $ | (37,522 | ) |
Net cash provided (used) by financing activities | | $ | 400,812 | | | $ | (55 | ) | | $ | 358,868 | | | $ | 242 | |
Hedging Activities
During the third quarter of 2004, Whiting hedged 19.6% of its natural gas volumes but did not incur any hedging gain or loss. The Company hedged 35% of its oil volumes during the third quarter incurring a hedging loss of $2.1 million. For the nine month period ending September 30, 2004, Whiting hedged 22% of its natural gas volumes but did not incur any hedging gain or loss. The Company hedged 42% of its oil volumes incurring a hedging loss of $3.6 million. The Company’s currently outstanding hedges are shown on the last page of this news release.
Highlights of Third Quarter Drilling Operations
Whiting has completed two successful Edwards wells in its Stuart City reef trend properties. The Julia Mott #6H was completed in September with an initial producing rate of 3.1 MMcf per day and the Rhodes Trust #3H was completed in October with an initial producing rate of 2.8 MMcf per day. Also in this area, Whiting completed three new Wilcox wells. The current combined producing rate from these wells is 3.9 MMcf per day. From the second to the third quarter of 2004 production volumes in our Stuart City fields have increased by 45% to 14.2 MMcf per day.
6
Whiting has a significant new exploration program and acreage position in western Billings County, North Dakota, its Nisku A Drilling Program. The MOI Stillwater 21-23H discovery well was a previously existing well bore which was deepened and drilled 1,848 feet horizontally within the Nisku Formation. The initial producing rate averaged 397 barrels of oil and 256 Mcf of gas per day on a 25/64th-inch choke with 200 psi flowing tubing pressure. During the third quarter, Whiting drilled three additional wells. Production from two of these has exceeded the discovery well, bringing current daily production from the area to 1,180 barrels of oil and 1,256 Mcf of natural gas per day. In this area, Whiting is currently employing two drilling rigs and plans to drill five additional wells during the fourth quarter of 2004. Whiting has an average 93.7% working interest and 92.8% net revenue interest in these wells.
The table below summarizes our drilling activity through September 30, 2004.
2004 Drilling Activity
Gross/Net wells
| | | | | | | | | | | |
| | | Successful
| | Unsuccessful
| | Total New Drilling
| | Recompletions
| | CAPEX ($MM)
|
Q2-YTD | | 57/25 | | 4/1.9 | | 61/26.9 | | 16/10.6 | | $ | 29.2 |
Q3-YTD | | 108/46.2 | | 8/3.5 | | 116/49.7 | | 25/17.5 | | $ | 52.8 |
2004-Projected | | | | | | 175/71.2 | | | | $ | 80.0 |
Conference Call Time and Instructions
A conference call with investors, analysts and other interested parties is scheduled for 7:45 a.m. EDT (6:45 a.m. CDT, 5:45 a.m. MDT) on Monday, October 18, 2004 to discuss 2004 third quarter financial and operating results. You are invited to listen in by calling (800) 847-4038. Access to a live Internet broadcast will be available at http://www.whiting.com. A replay will be available approximately two hours after the call on Monday, October 18 to Monday, October 25, 2004. You may access this replay at (800) 642-1687 (U.S./Canada) or (706) 645-9291 (International) and entering the pass code #1507818. You may also access a web archive at http://www.whiting.com.
7
About Whiting Petroleum Corporation
Whiting Petroleum Corporation is a growing energy company based in Denver, Colorado. Whiting Petroleum Corporation is a holding company for Whiting Oil and Gas Corporation. Whiting Oil and Gas Corporation is engaged in oil and natural gas acquisition, exploitation, exploration and production activities primarily in the Rocky Mountains, Permian Basin, Gulf Coast, Michigan, Mid-Continent and California regions of the United States. The Company trades publicly under the symbol WLL on the New York Stock Exchange. For further information, please visit www.whiting.com.
Forward-Looking Statements
This press release contains statements that Whiting believes to be “forward-looking statements” within the meaning of the Private Securities Litigation Reform Act of 1995. All statements other than historical facts, including, without limitation, statements regarding Whiting’s future business strategy, projected production, reserves, costs and capital expenditures, and plans and objectives of management for future operations, are forward-looking statements. When used in this press release, words such as “expect,” “intend,” “plan,” “estimate,” “anticipate,” “believe” or “should” or the negative thereof or variations thereon or similar terminology are generally intended to identify forward-looking statements. Such forward-looking statements are subject to risks and uncertainties that could cause actual results to differ materially from those expressed in, or implied by, such statements. Some, but not all, of the risks and uncertainties include: our level of success in exploitation, exploration, development and production activities; our ability to identify and complete acquisitions and to successfully integrate acquired businesses and properties; unforeseen underperformance of or liabilities associated with acquired properties; inaccuracies of our reserve estimates or our assumptions underlying them; failure of our properties to yield oil or natural gas in commercially viable quantities; our inability to access oil and natural gas markets due to market conditions or operational impediments; and our ability to replace our oil and natural gas reserves. Whiting assumes no obligation, and disclaims any duty, to update the forward-looking statements in this press release.
8
Selected Financial Data
For further information and discussion on the selected financial data below, please refer to Whiting Petroleum Corporation’s Quarterly Report on Form10-Q for the quarter ended September 30, 2004 to be filed with the Securities and Exchange Commission.
Consolidated Balance Sheets
(In Thousands)
| | | | | | | | |
| | | September 30,
2004
| | | December 31,
2003
| |
| | | (unaudited) | | | | |
Assets | | | | | | | | |
Cash and cash equivalents | | $ | 17,361 | | | $ | 53,585 | |
Accounts receivable trade, net | | | 35,322 | | | | 24,020 | |
Prepaid expenses and other | | | 6,488 | | | | 2,666 | |
| | |
|
|
| |
|
|
|
Total current assets | | | 59,171 | | | | 80,271 | |
| | |
|
|
| |
|
|
|
Oil and gas properties, successful efforts method: | | | | | | | | |
Proved properties | | | 1,193,090 | | | | 615,764 | |
Unproved properties | | | 4,325 | | | | 1,637 | |
Other property and equipment | | | 3,616 | | | | 2,684 | |
| | |
|
|
| |
|
|
|
Total property and equipment | | | 1,201,031 | | | | 620,085 | |
Less accumulated depreciation, depletion and amortization | | | (225,275 | ) | | | (192,794 | ) |
| | |
|
|
| |
|
|
|
Property and equipment, net | | | 975,756 | | | | 427,291 | |
| | |
|
|
| |
|
|
|
Deferred income tax asset | | | — | | | | 18,735 | |
Other long-term assets | | | 19,624 | | | | 9,988 | |
| | |
|
|
| |
|
|
|
Total | | $ | 1,054,551 | | | $ | 536,285 | |
| | |
|
|
| |
|
|
|
Liabilities and Stockholders’ Equity | | | | | | | | |
Accounts payable | | $ | 23,280 | | | $ | 15,918 | |
Oil and gas sales payables | | | 4,051 | | | | 2,406 | |
Accrued employee benefits | | | 4,788 | | | | 5,275 | |
Production taxes payable | | | 7,580 | | | | 2,574 | |
Income taxes and other liabilities | | | 200 | | | | 693 | |
Derivative liability | | | 9,850 | | | | 2,145 | |
Current portion of long-term debt | | | 50,000 | | | | — | |
| | |
|
|
| |
|
|
|
Total current liabilities | | | 99,749 | | | | 29,011 | |
| | |
|
|
| |
|
|
|
Long-term debt | | | 538,827 | | | | 188,017 | |
Tax sharing liability | | | 30,590 | | | | 28,790 | |
Production participation plan liability | | | 8,833 | | | | 7,868 | |
Asset retirement obligations | | | 30,502 | | | | 23,021 | |
Deferred income tax liability | | | 11,153 | | | | — | |
Stockholders’ Equity: | | | | | | | | |
Common stock | | | 21 | | | | 19 | |
Additional paid-in capital | | | 216,120 | | | | 170,367 | |
Accumulated other comprehensive income (loss) | | | (6,050 | ) | | | (223 | ) |
Deferred compensation | | | (2,035 | ) | | | — | |
Retained earnings | | | 126,841 | | | | 89,415 | |
| | |
|
|
| |
|
|
|
Total stockholders’ equity | | | 334,897 | | | | 259,578 | |
| | |
|
|
| |
|
|
|
Total | | $ | 1,054,551 | | | $ | 536,285 | |
| | |
|
|
| |
|
|
|
9
Consolidated Income Statements
(In Thousands, Except for Per Share Data)
(unaudited)
| | | | | | | | | | | | | | | | |
| | | Three Months Ended
September 30,
| | | Nine Months Ended
September 30,
| |
| | | 2004
| | | 2003
| | | 2004
| | | 2003
| |
Revenue: | | | | | | | | | | | | | | | | |
Oil and gas sales | | $ | 65,898 | | | $ | 42,272 | | | $ | 166,408 | | | $ | 133,638 | |
Loss on oil and gas hedging activities | | | (2,040 | ) | | | (151 | ) | | | (3,615 | ) | | | (8,953 | ) |
Gain on sale of marketable securities | | | 2,380 | | | | — | | | | 4,762 | | | | — | |
Gain on sale of oil and gas properties | | | 1,000 | | | | — | | | | 1,000 | | | | — | |
Interest income and other | | | 52 | | | | 87 | | | | 186 | | | | 180 | |
| | |
|
|
| |
|
|
| |
|
|
| |
|
|
|
Total | | | 67,290 | | | | 42,208 | | | | 168,741 | | | | 124,865 | |
| | |
|
|
| |
|
|
| |
|
|
| |
|
|
|
Costs and Expenses: | | | | | | | | | | | | | | | | |
Lease operating | | | 12,957 | | | | 11,288 | | | | 34,650 | | | | 32,108 | |
Production taxes | | | 3,950 | | | | 2,560 | | | | 10,168 | | | | 8,134 | |
Depreciation, depletion and amortization | | | 13,010 | | | | 10,212 | | | | 34,500 | | | | 30,675 | |
Exploration and impairment | | | 3,766 | | | | 280 | | | | 4,686 | | | | 1,015 | |
General and administrative | | | 6,117 | | | | 3,126 | | | | 14,191 | | | | 9,522 | |
Interest expense | | | 4,172 | | | | 1,856 | | | | 9,591 | | | | 7,110 | |
| | |
|
|
| |
|
|
| |
|
|
| |
|
|
|
Total costs and expenses | | | 43,972 | | | | 29,322 | | | | 107,786 | | | | 88,564 | |
| | |
|
|
| |
|
|
| |
|
|
| |
|
|
|
Income before income taxes and cumulative change in accounting principle | | | 23,318 | | | | 12,886 | | | | 60,955 | | | | 36,301 | |
Income tax expense: | | | | | | | | | | | | | | | | |
Current | | | 400 | | | | 208 | | | | 400 | | | | 650 | |
Deferred | | | 8,601 | | | | 4,688 | | | | 23,129 | | | | 13,144 | |
| | |
|
|
| |
|
|
| |
|
|
| |
|
|
|
Total income tax expense | | | 9,001 | | | | 4,896 | | | | 23,529 | | | | 13,794 | |
| | |
|
|
| |
|
|
| |
|
|
| |
|
|
|
Income from continuing operations | | | 14,317 | | | | 7,990 | | | | 37,426 | | | | 22,507 | |
Cumulative change in accounting principle | | | — | | | | — | | | | — | | | | (3,905 | ) |
| | |
|
|
| |
|
|
| |
|
|
| |
|
|
|
Net income | | $ | 14,317 | | | $ | 7,990 | | | $ | 37,426 | | | $ | 18,602 | |
| | |
|
|
| |
|
|
| |
|
|
| |
|
|
|
Earnings per share from continuing operations, basic and diluted | | $ | 0.70 | | | $ | 0.43 | | | $ | 1.93 | | | $ | 1.20 | |
Cumulative change in accounting principle | | | — | | | | — | | | | — | | | | (0.21 | ) |
| | |
|
|
| |
|
|
| |
|
|
| |
|
|
|
Net income per common share, basic and diluted | | $ | 0.70 | | | $ | 0.43 | | | $ | 1.93 | | | $ | 0.99 | |
| | |
|
|
| |
|
|
| |
|
|
| |
|
|
|
Weighted average shares outstanding, basic | | | 20,516 | | | | 18,750 | | | | 19,341 | | | | 18,750 | |
| | |
|
|
| |
|
|
| |
|
|
| |
|
|
|
Weighted average shares outstanding, diluted | | | 20,554 | | | | 18,750 | | | | 19,370 | | | | 18,750 | |
| | |
|
|
| |
|
|
| |
|
|
| |
|
|
|
10
Reconciliation of Net Cash Provided by Operating Activities to Discretionary Cash Flow
| | | | | | | | | | | | | | | | |
| | | Three Months Ended
September 30,
| | | Nine Months Ended
September 30,
| |
| | | 2004
| | | 2003
| | | 2004
| | | 2003
| |
Net cash provided by operating activities | | $ | 49,585 | | | $ | 28,092 | | | $ | 96,866 | | | $ | 74,954 | |
Exploration | | | 1,614 | | | | 280 | | | | 2,534 | | | | 1,015 | |
Changes in working capital | | | (13,797 | ) | | | (4,944 | ) | | | (2,247 | ) | | | (7,770 | ) |
| | |
|
|
| |
|
|
| |
|
|
| |
|
|
|
Discretionary cash flow1 | | $ | 37,402 | | | $ | 23,428 | | | $ | 97,153 | | | $ | 68,199 | |
| | |
|
|
| |
|
|
| |
|
|
| |
|
|
|
| 1 | Discretionary cash flow is computed as net income plus exploration costs, depreciation, depletion and amortization, deferred income taxes, non-cash interest costs, non-cash compensation plan charges, impairment of oil and gas properties and change in accounting principle less the gain on sale of properties and marketable securities. The non-GAAP measure of discretionary cash flow is presented because management believes it provides useful information to investors for analysis of the Company’s ability to internally fund acquisitions, exploration and development. Discretionary cash flow should not be considered in isolation or as a substitute for net income, income from operations, net cash provided by operating activities or other income, cash flow or liquidity measures under GAAP and may not be comparable to other similarly titled measures of other companies. |
| | | | | | |
| Hedge Contracts at October 14, 2004 |
| | | |
Commodity
| | Period
| | Monthly Volume
(MMBtu)/(Bbl)
| | NYMEX
Floor/Ceiling
|
Natural Gas | | 10/2004 to 12/2004 | | 400,000 | | 4.50/9.40 |
Natural Gas | | 10/2004 to 12/2004 | | 400,000 | | 4.50/12.00 |
Natural Gas | | 10/2004 to 12/2004 | | 650,000 | | 4.50/8.75 |
Natural Gas | | 01/2005 to 03/2005 | | 400,000 | | 5.00/12.75 |
Natural Gas | | 01/2005 to 03/2005 | | 500,000 | | 5.00/11.00 |
Natural Gas | | 01/2005 to 03/2005 | | 600,000 | | 5.00/10.50 |
Natural Gas | | 04/2005 to 06/2005 | | 1,500,000 | | 4.50/8.25 |
Natural Gas | | 07/2005 to 09/2005 | | 1,500,000 | | 4.50/8.60 |
Natural Gas | | 10/2005 to 12/2005 | | 1,500,000 | | 4.50/10.00 |
Crude Oil | | 10/2004 to 12/2004 | | 50,000 | | 28.00/46.10 |
Crude Oil | | 10/2004 to 12/2004 | | 50,000 | | 30.00/48.50 |
Crude Oil | | 10/2004 to 12/2004 | | 44,000 | | 35.00/51.90 |
Crude Oil | | 10/2004 to 12/2004 | | 120,000 | | 37.00/49.10 |
Crude Oil | | 10/2004 to 12/2004 | | 50,000 | | 37.00/54.75 |
Crude Oil | | 01/2005 to 03/2005 | | 50,000 | | 35.00/50.75 |
Crude Oil | | 01/2005 to 03/2005 | | 94,000 | | 35.00/49.60 |
Crude Oil | | 01/2005 to 03/2005 | | 120,000 | | 37.00/46.90 |
Crude Oil | | 01/2005 to 03/2005 | | 80,000 | | 37.00/50.60 |
Crude Oil | | 04/2005 to 06/2005 | | 250,000 | | 37.00/46.65 |
Crude Oil | | 07/2005 to 09/2005 | | 250,000 | | 35.00/47.25 |
|
| Long-Term Contracts at October 14, 2004 |
| | | |
Commodity
| | Period
| | Monthly Volume
(MMBtu)/(Bbl)
| | NYMEX
Floor/Ceiling
|
Natural Gas | | 01/2002 to 12/2011 | | 51,000 | | $4.22 |
Natural Gas | | 01/2002 to 12/2012 | | 60,000 | | $3.74 |
11
| | | | |
Hedges and
Contracts Summary
| | Hedged and Contracted
(MMBtu)/(Bbl) per Month
| | As a Percentage of
Estimated Production for
October 2004 (Gas/Oil)
|
October – December 2004 | | 1,561,000/314,000 | | 56%/69% |
January – March 2005 | | 1,611,000/344,000 | | 58%/75% |
April – June 2005 | | 1,611,000/250,000 | | 58%/55% |
July – September 2005 | | 1,611,000/250,000 | | 58%/55% |
October – December 2005 | | 1,611,000/-0- | | 58%/-0- |
Thereafter | | 111,000/-0- | | 4%/-0- |
###
12