Whiting Petroleum Corporation Management Presentation June 2020 Exhibit 99
THIS CONFIDENTIAL PRESENTATION CONTAINS MATERIAL NON-PUBLIC INFORMATION CONCERNING WHITING PETROLEUM CORPORATION (“WHITING”) ITS AFFILIATES, OR THEIR RESPECTIVE SECURITIES (COLLECTIVELY, “COMPANY SECURITIES”). BY ACCEPTING THIS CONFIDENTIAL PRESENTATION, YOU AGREE TO USE ANY SUCH INFORMATION (AND TO REFRAIN FROM TRADING IN COMPANY SECURITIES, AS APPROPRIATE) IN ACCORDANCE WITH THE CONFIDENTIALITY AGREEMENT THAT YOU HAVE ENTERED INTO WITH WHITING, YOUR COMPLIANCE POLICIES AND APPLICABLE LAW, INCLUDING FEDERAL AND STATE SECURITIES LAWS. You should consult with your advisors to the extent you deem appropriate in connection with the information contained in this presentation. We make no representation as to the adequacy or appropriateness of the information contained herein for your purposes. We will have no duty to update or supplement this presentation. This presentation is being furnished on the understanding that (i) it will be kept strictly confidential, including in accordance with the confidentiality agreement that you have entered into with Whiting, (ii) any reliance you or your representatives choose to place on the information contained herein is a matter of your respective judgments and at your own respective risks and (iii) neither Whiting nor its advisors or other representatives will have any liability to you or your representatives relating to the information contained in this presentation. This presentation contains statements that Whiting believes to be “forward-looking statements” within the meaning of Section 27A of the Securities Act of 1933 and Section 21E of the Securities Exchange Act of 1934. All statements other than historical facts, including, without limitation, statements regarding our future financial position, business strategy, projected revenues, earnings, costs, capital expenditures and debt levels, and plans and objectives of management for future operations, are forward-looking statements. Such forward-looking statements are subject to risks and uncertainties that could cause actual results to differ materially from those expressed in, or implied by, such statements. These risks and uncertainties include, but are not limited to: Whiting’s ability to obtain United States Bankruptcy Court for the Southern District of Texas (the “Bankruptcy Court”) approval with respect to motions or other requests made to the Bankruptcy Court; the ability of Whiting to confirm and consummate its plan of reorganization; the effects of Whiting's voluntary cases under Chapter 11 of the United States Bankruptcy Code (the "Chapter 11 Cases") on Whiting’s liquidity or results of operations or business prospects; the effects of the Chapter 11 Cases on Whiting’s business and the interests of various constituents; the length of time that Whiting will operate under Chapter 11 protection; risks associated with third-party motions in the Chapter 11 Cases; declines in, or extended periods of low, oil, NGL or natural gas prices; Whiting’s level of success in exploration, development and production activities; risks related to Whiting’s level of indebtedness, ability to comply with debt covenants and periodic redeterminations of the borrowing base under Whiting’s credit agreement and Whiting’s ability to generate sufficient cash flow from operations to service its indebtedness; the ability to generate sufficient cash flows from operations to meet the internally funded portion of Whiting’s capital expenditures budget; the ability to obtain external capital to finance exploration and development operations; the impact of negative shifts in investor sentiment towards the oil and gas industry; impacts resulting from the allocation of resources among Whiting’s strategic opportunities; the geographic concentration of Whiting’s operations; impacts to financial statements as a result of impairment write-downs and other cash and noncash charges; federal and state initiatives relating to the regulation of hydraulic fracturing and air emissions; revisions to reserve estimates as a result of changes in commodity prices, regulation and other factors; inaccuracies of Whiting’s reserve estimates or assumptions underlying them; the timing of exploration and development expenditures; risks relating to decreases in Whiting’s credit rating; the inability to access oil and gas markets due to market conditions or operational impediments; market availability of, and risks associated with, transport of oil and gas; the ability to successfully complete asset dispositions and the risks related thereto; the ability to drill producing wells on undeveloped acreage prior to its lease expiration; shortages of or delays in obtaining qualified personnel or equipment, including drilling rigs and completion services; weakened differentials impacting the price Whiting receives for oil and natural gas; risks relating to any unforeseen liabilities; the impacts of hedging on Whiting’s results of operations; adverse weather conditions that may negatively impact development or production activities; uninsured or underinsured losses resulting from Whiting’s oil and gas operations; lack of control over non-operated properties; failure of Whiting’s properties to yield oil or gas in commercially viable quantities; the impact and costs of compliance with laws and regulations governing Whiting’s oil and gas operations; the potential impact of changes in laws that could have a negative effect on the oil and gas industry; impacts of local regulations, climate change issues, negative public perception of Whiting’s industry and corporate governance standards; the ability to replace Whiting’s oil and natural gas reserves; negative impacts from litigation and legal proceedings; unforeseen underperformance of or liabilities associated with acquired properties or other strategic partnerships or investments; competition in the oil and gas industry; any loss of Whiting’s senior management or technical personnel; cybersecurity attacks or failures of Whiting’s telecommunication and other information technology infrastructure; and other risks described under the caption “Risk Factors” in Item 1A of Whiting’s Annual Report on Form 10-K for the period ended December 31, 2019 and any subsequent reports on Form 10-Q. Whiting assumes no obligation, and disclaims any duty, to update the forward-looking statements in this presentation. Important Notice to Recipients
Predictable Asset Base Highly Leveraged to a Commodity Price Recovery Proactive Management Premier Operator Business Plan Review Next Steps Discussion Agenda
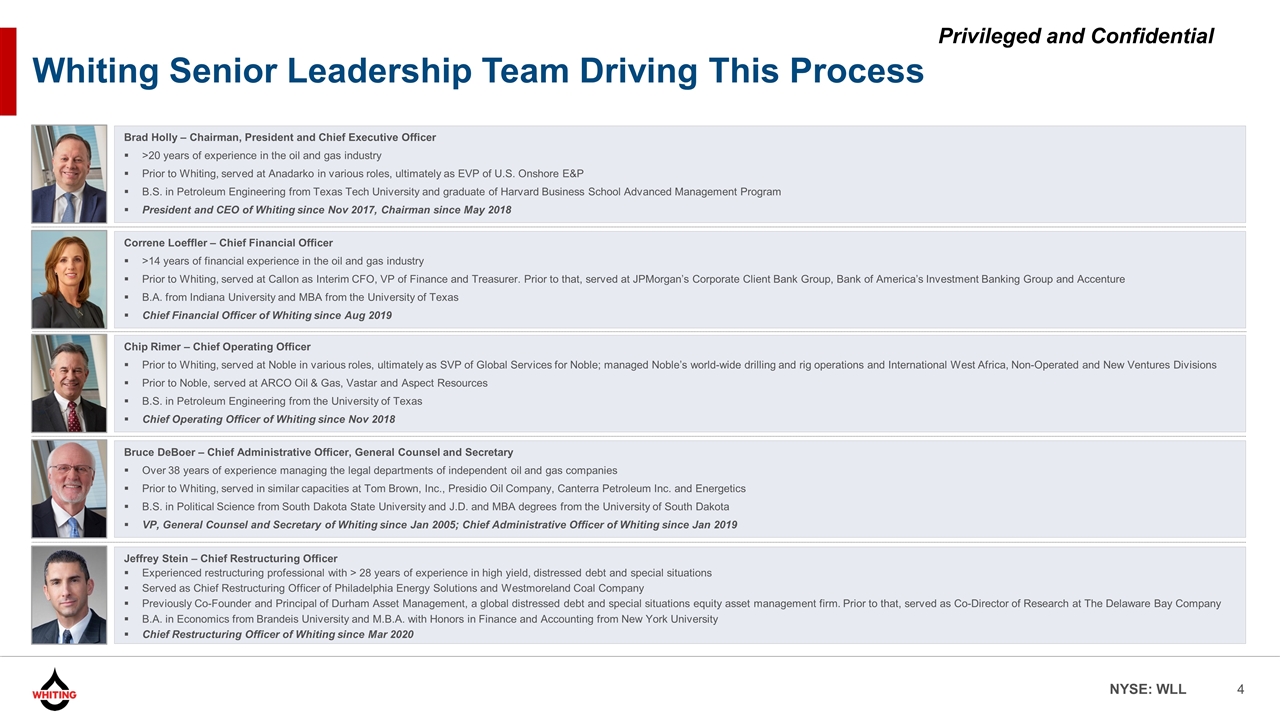
Whiting Senior Leadership Team Driving This Process Brad Holly – Chairman, President and Chief Executive Officer >20 years of experience in the oil and gas industry Prior to Whiting, served at Anadarko in various roles, ultimately as EVP of U.S. Onshore E&P B.S. in Petroleum Engineering from Texas Tech University and graduate of Harvard Business School Advanced Management Program President and CEO of Whiting since Nov 2017, Chairman since May 2018 Correne Loeffler – Chief Financial Officer >14 years of financial experience in the oil and gas industry Prior to Whiting, served at Callon as Interim CFO, VP of Finance and Treasurer. Prior to that, served at JPMorgan’s Corporate Client Bank Group, Bank of America’s Investment Banking Group and Accenture B.A. from Indiana University and MBA from the University of Texas Chief Financial Officer of Whiting since Aug 2019 Bruce DeBoer – Chief Administrative Officer, General Counsel and Secretary Over 38 years of experience managing the legal departments of independent oil and gas companies Prior to Whiting, served in similar capacities at Tom Brown, Inc., Presidio Oil Company, Canterra Petroleum Inc. and Energetics B.S. in Political Science from South Dakota State University and J.D. and MBA degrees from the University of South Dakota VP, General Counsel and Secretary of Whiting since Jan 2005; Chief Administrative Officer of Whiting since Jan 2019 Chip Rimer – Chief Operating Officer Prior to Whiting, served at Noble in various roles, ultimately as SVP of Global Services for Noble; managed Noble’s world-wide drilling and rig operations and International West Africa, Non-Operated and New Ventures Divisions Prior to Noble, served at ARCO Oil & Gas, Vastar and Aspect Resources B.S. in Petroleum Engineering from the University of Texas Chief Operating Officer of Whiting since Nov 2018 Jeffrey Stein – Chief Restructuring Officer Experienced restructuring professional with > 28 years of experience in high yield, distressed debt and special situations Served as Chief Restructuring Officer of Philadelphia Energy Solutions and Westmoreland Coal Company Previously Co-Founder and Principal of Durham Asset Management, a global distressed debt and special situations equity asset management firm. Prior to that, served as Co-Director of Research at The Delaware Bay Company B.A. in Economics from Brandeis University and M.B.A. with Honors in Finance and Accounting from New York University Chief Restructuring Officer of Whiting since Mar 2020
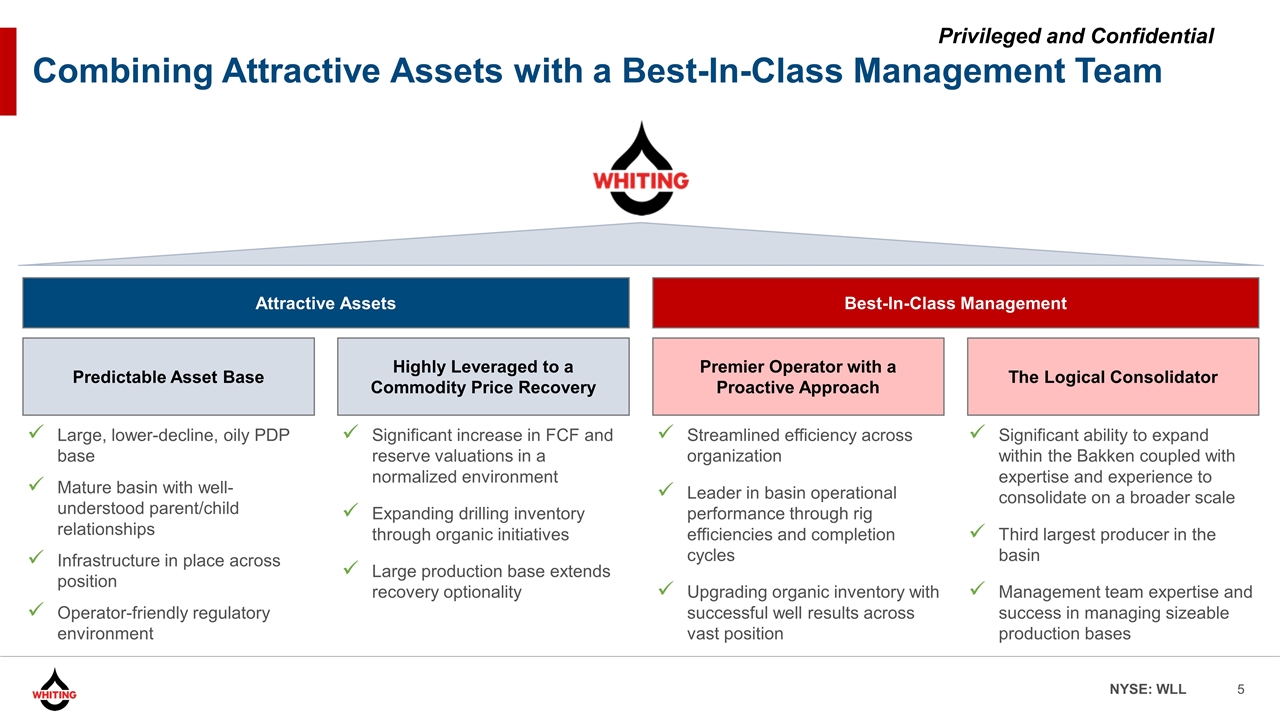
Combining Attractive Assets with a Best-In-Class Management Team Predictable Asset Base The Logical Consolidator Highly Leveraged to a Commodity Price Recovery Premier Operator with a Proactive Approach Attractive Assets Best-In-Class Management Large, lower-decline, oily PDP base Mature basin with well-understood parent/child relationships Infrastructure in place across position Operator-friendly regulatory environment Significant increase in FCF and reserve valuations in a normalized environment Expanding drilling inventory through organic initiatives Large production base extends recovery optionality Streamlined efficiency across organization Leader in basin operational performance through rig efficiencies and completion cycles Upgrading organic inventory with successful well results across vast position Significant ability to expand within the Bakken coupled with expertise and experience to consolidate on a broader scale Third largest producer in the basin Management team expertise and success in managing sizeable production bases
Predictable Asset Base
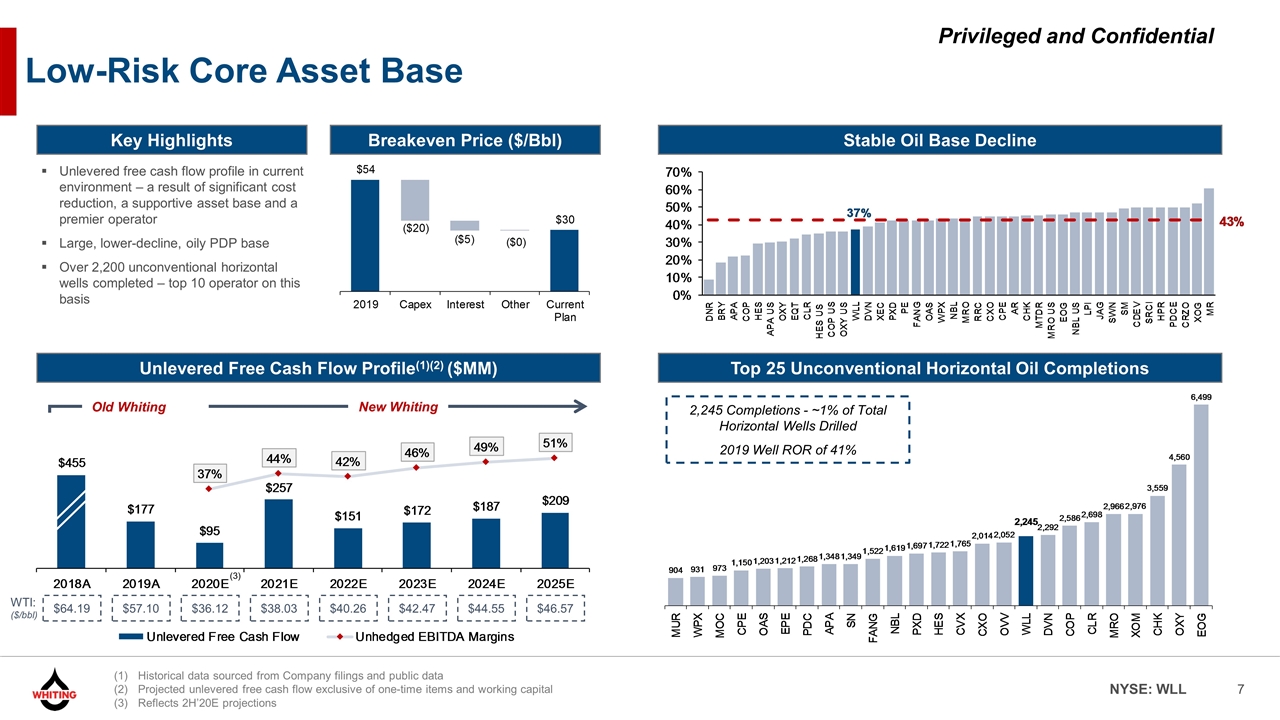
Low-Risk Core Asset Base Key Highlights Stable Oil Base Decline Top 25 Unconventional Horizontal Oil Completions Historical data sourced from Company filings and public data Projected unlevered free cash flow exclusive of one-time items and working capital Reflects 2H’20E projections Breakeven Price ($/Bbl) Unlevered free cash flow profile in current environment – a result of significant cost reduction, a supportive asset base and a premier operator Large, lower-decline, oily PDP base Over 2,200 unconventional horizontal wells completed – top 10 operator on this basis 2,245 Completions - ~1% of Total Horizontal Wells Drilled 2019 Well ROR of 41% Unlevered Free Cash Flow Profile(1)(2) ($MM) New Whiting Old Whiting $64.19 $57.10 $42.47 $44.55 $46.57 $38.03 $40.26 WTI: ($/bbl) $36.12 (3)
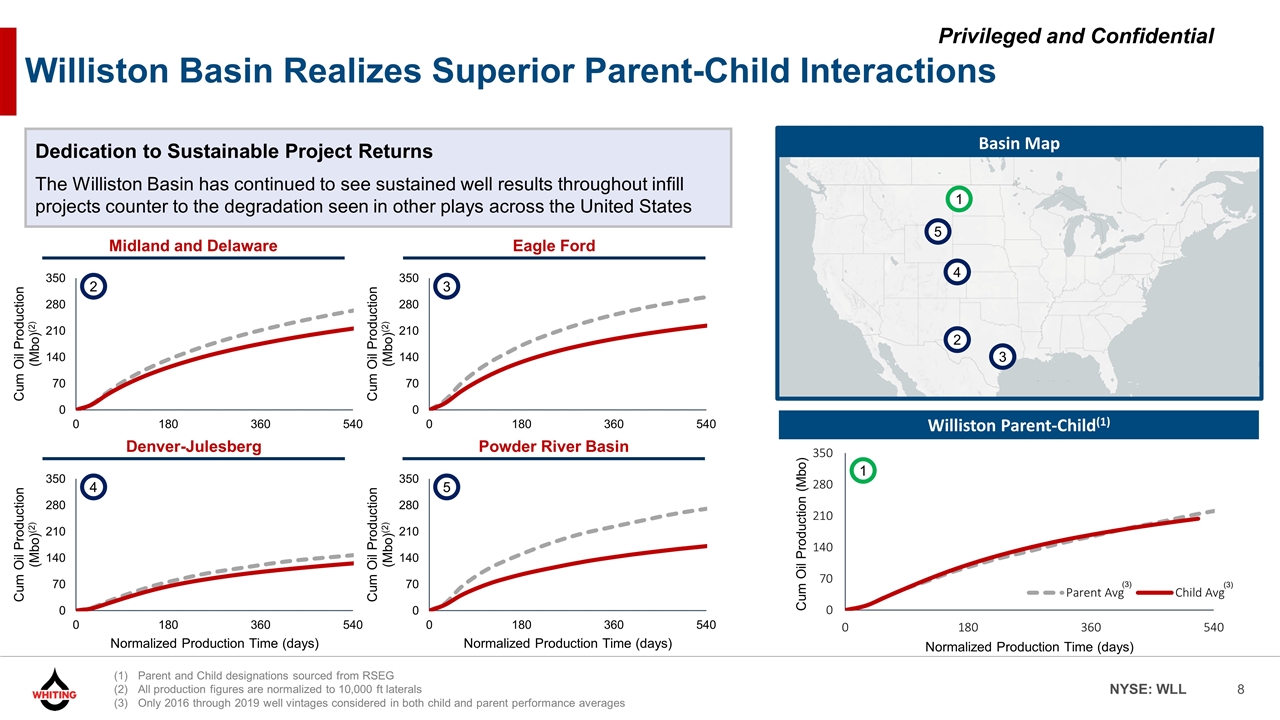
Williston Basin Realizes Superior Parent-Child Interactions Reflects SEC year-end 2018 proved reserves. As of 1/17/2020. As of Q3 2019. Dedication to Sustainable Project Returns The Williston Basin has continued to see sustained well results throughout infill projects counter to the degradation seen in other plays across the United States Basin Map Williston Parent-Child(1) Midland and Delaware Eagle Ford Denver-Julesberg Powder River Basin (3) (3) 1 2 3 4 5 1 4 2 3 5 Parent and Child designations sourced from RSEG All production figures are normalized to 10,000 ft laterals Only 2016 through 2019 well vintages considered in both child and parent performance averages
Highly Leveraged to a Commodity Price Recovery
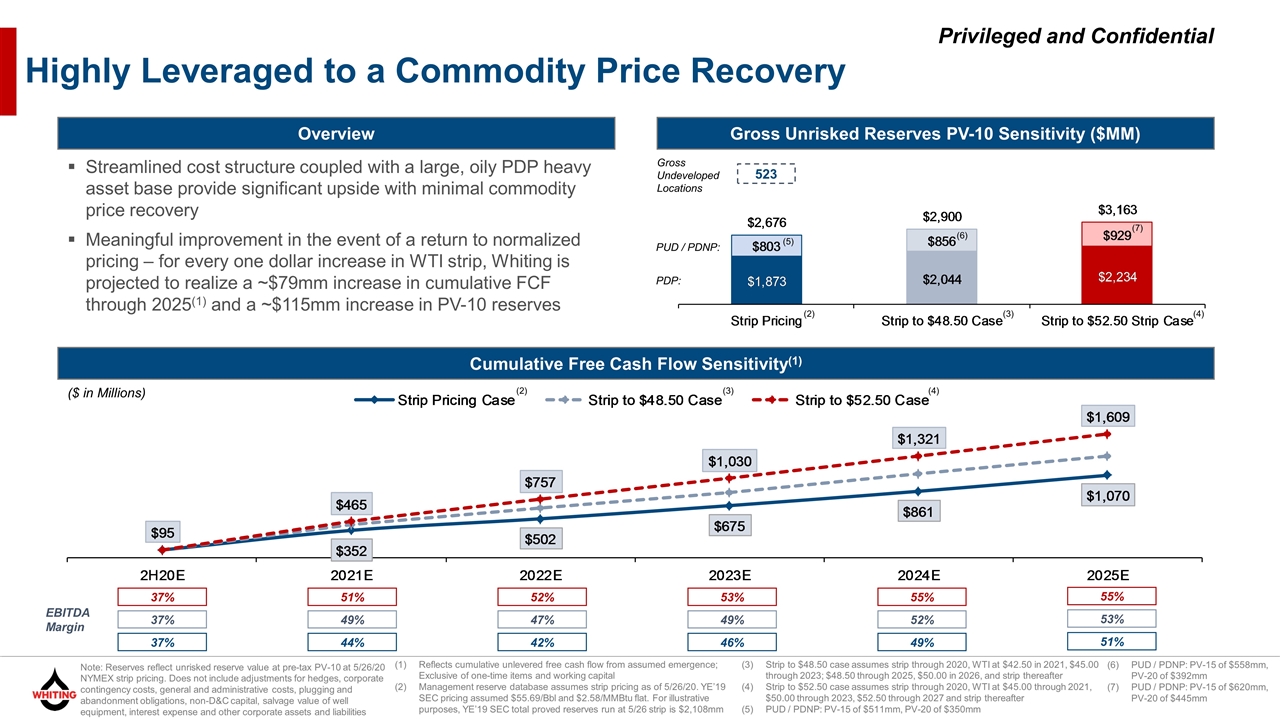
Highly Leveraged to a Commodity Price Recovery Overview Cumulative Free Cash Flow Sensitivity(1) ($ in Millions) Note: Reserves reflect unrisked reserve value at pre-tax PV-10 at 5/26/20 NYMEX strip pricing. Does not include adjustments for hedges, corporate contingency costs, general and administrative costs, plugging and abandonment obligations, non-D&C capital, salvage value of well equipment, interest expense and other corporate assets and liabilities 523 Gross Undeveloped Locations Gross Unrisked Reserves PV-10 Sensitivity ($MM) Streamlined cost structure coupled with a large, oily PDP heavy asset base provide significant upside with minimal commodity price recovery Meaningful improvement in the event of a return to normalized pricing – for every one dollar increase in WTI strip, Whiting is projected to realize a ~$79mm increase in cumulative FCF through 2025(1) and a ~$115mm increase in PV-10 reserves (2) (3) (4) EBITDA Margin 55% 55% 53% 52% 51% 37% 53% 52% 49% 47% 49% 37% 51% 49% 46% 42% 44% 37% Reflects cumulative unlevered free cash flow from assumed emergence; Exclusive of one-time items and working capital Management reserve database assumes strip pricing as of 5/26/20. YE’19 SEC pricing assumed $55.69/Bbl and $2.58/MMBtu flat. For illustrative purposes, YE’19 SEC total proved reserves run at 5/26 strip is $2,108mm (2) (3) (4) Strip to $48.50 case assumes strip through 2020, WTI at $42.50 in 2021, $45.00 through 2023; $48.50 through 2025, $50.00 in 2026, and strip thereafter Strip to $52.50 case assumes strip through 2020, WTI at $45.00 through 2021, $50.00 through 2023, $52.50 through 2027 and strip thereafter PUD / PDNP: PV-15 of $511mm, PV-20 of $350mm PDP: PUD / PDNP: (5) (6) (7) PUD / PDNP: PV-15 of $558mm, PV-20 of $392mm PUD / PDNP: PV-15 of $620mm, PV-20 of $445mm
Proactive Management
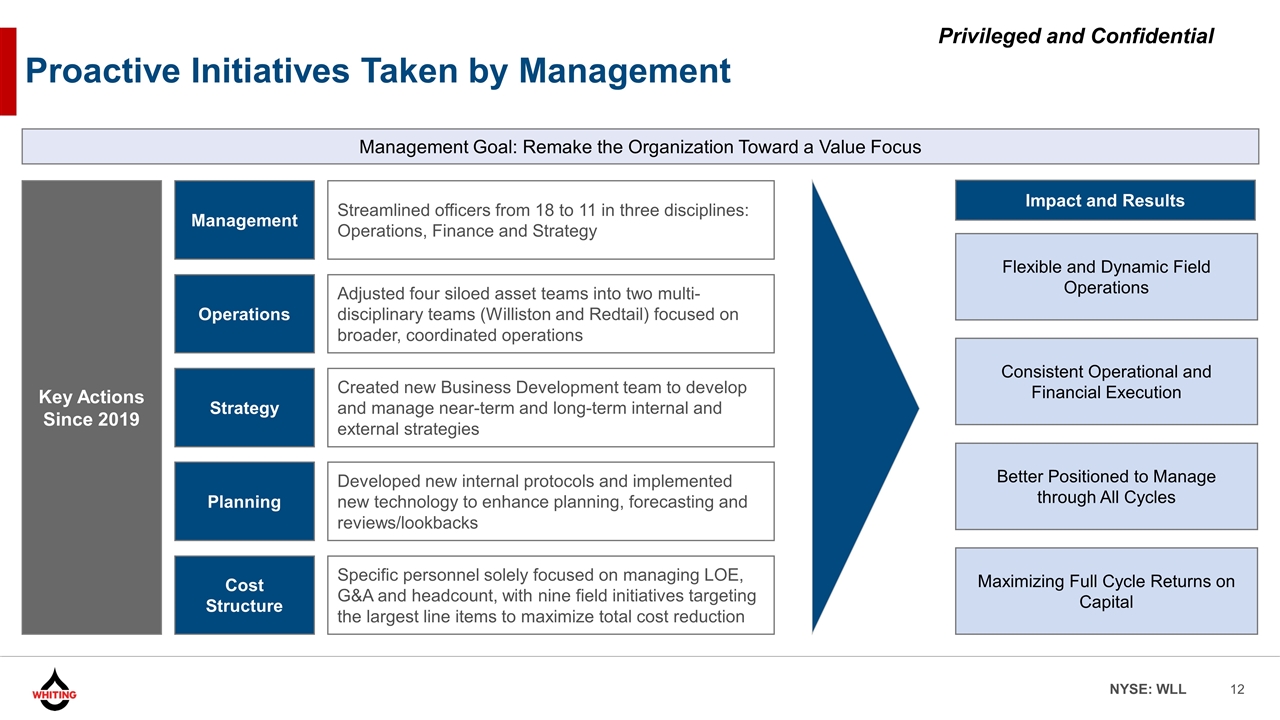
Key Actions Since 2019 Streamlined officers from 18 to 11 in three disciplines: Operations, Finance and Strategy Adjusted four siloed asset teams into two multi-disciplinary teams (Williston and Redtail) focused on broader, coordinated operations Created new Business Development team to develop and manage near-term and long-term internal and external strategies Management Operations Strategy Specific personnel solely focused on managing LOE, G&A and headcount, with nine field initiatives targeting the largest line items to maximize total cost reduction Cost Structure Developed new internal protocols and implemented new technology to enhance planning, forecasting and reviews/lookbacks Planning Impact and Results Consistent Operational and Financial Execution Maximizing Full Cycle Returns on Capital Better Positioned to Manage through All Cycles Flexible and Dynamic Field Operations Management Goal: Remake the Organization Toward a Value Focus Proactive Initiatives Taken by Management
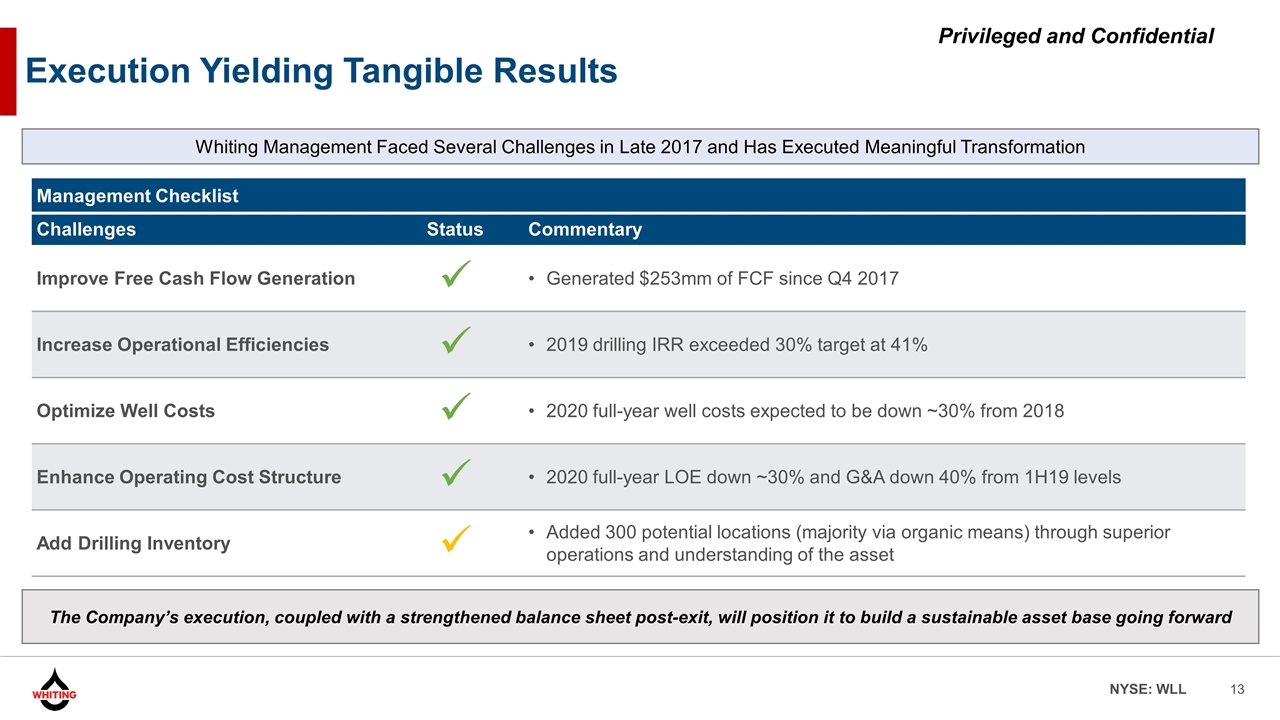
Execution Yielding Tangible Results Management Checklist Challenges Status Commentary Improve Free Cash Flow Generation ü Generated $253mm of FCF since Q4 2017 Increase Operational Efficiencies ü 2019 drilling IRR exceeded 30% target at 41% Optimize Well Costs ü 2020 full-year well costs expected to be down ~30% from 2018 Enhance Operating Cost Structure ü 2020 full-year LOE down ~30% and G&A down 40% from 1H19 levels Add Drilling Inventory ü Added 300 potential locations (majority via organic means) through superior operations and understanding of the asset Whiting Management Faced Several Challenges in Late 2017 and Has Executed Meaningful Transformation The Company’s execution, coupled with a strengthened balance sheet post-exit, will position it to build a sustainable asset base going forward
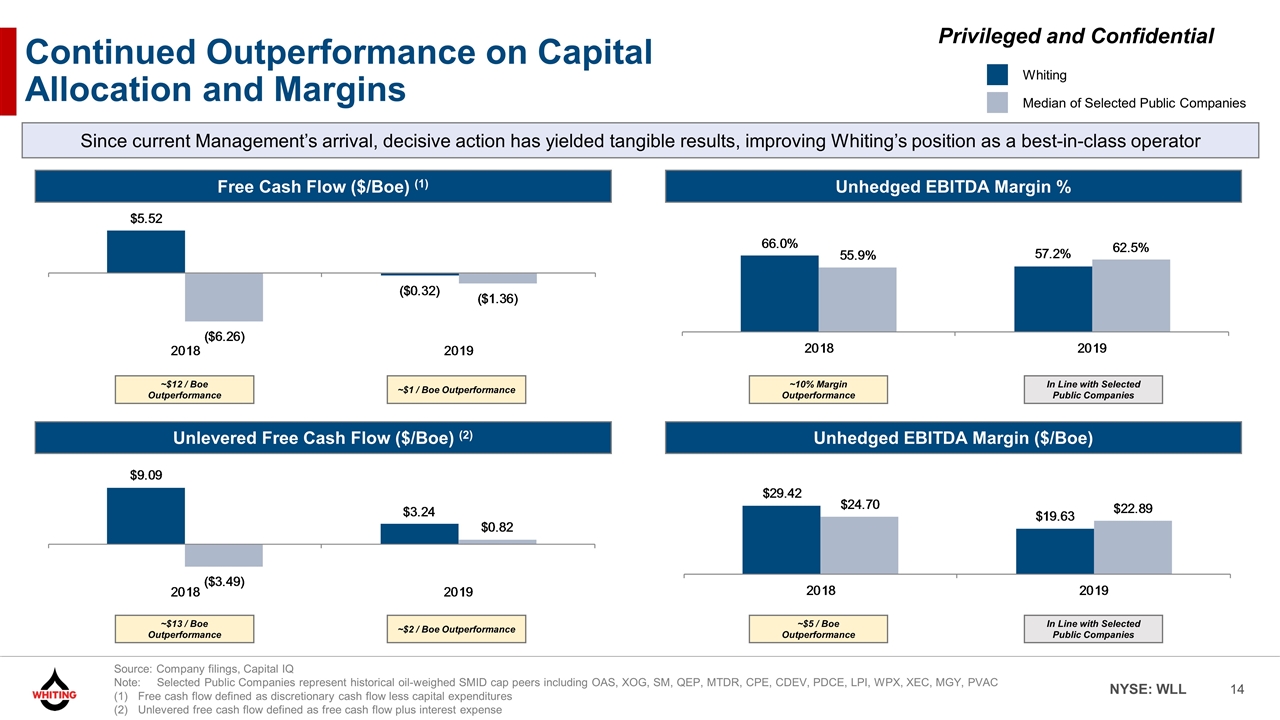
Continued Outperformance on Capital Allocation and Margins Since current Management’s arrival, decisive action has yielded tangible results, improving Whiting’s position as a best-in-class operator Source: Company filings, Capital IQ Note: Selected Public Companies represent historical oil-weighed SMID cap peers including OAS, XOG, SM, QEP, MTDR, CPE, CDEV, PDCE, LPI, WPX, XEC, MGY, PVAC Free cash flow defined as discretionary cash flow less capital expenditures Unlevered free cash flow defined as free cash flow plus interest expense Free Cash Flow ($/Boe) (1) Unhedged EBITDA Margin % Unlevered Free Cash Flow ($/Boe) (2) Unhedged EBITDA Margin ($/Boe) Whiting Median of Selected Public Companies ~$13 / Boe Outperformance ~$2 / Boe Outperformance ~$5 / Boe Outperformance In Line with Selected Public Companies ~$12 / Boe Outperformance ~$1 / Boe Outperformance ~10% Margin Outperformance In Line with Selected Public Companies
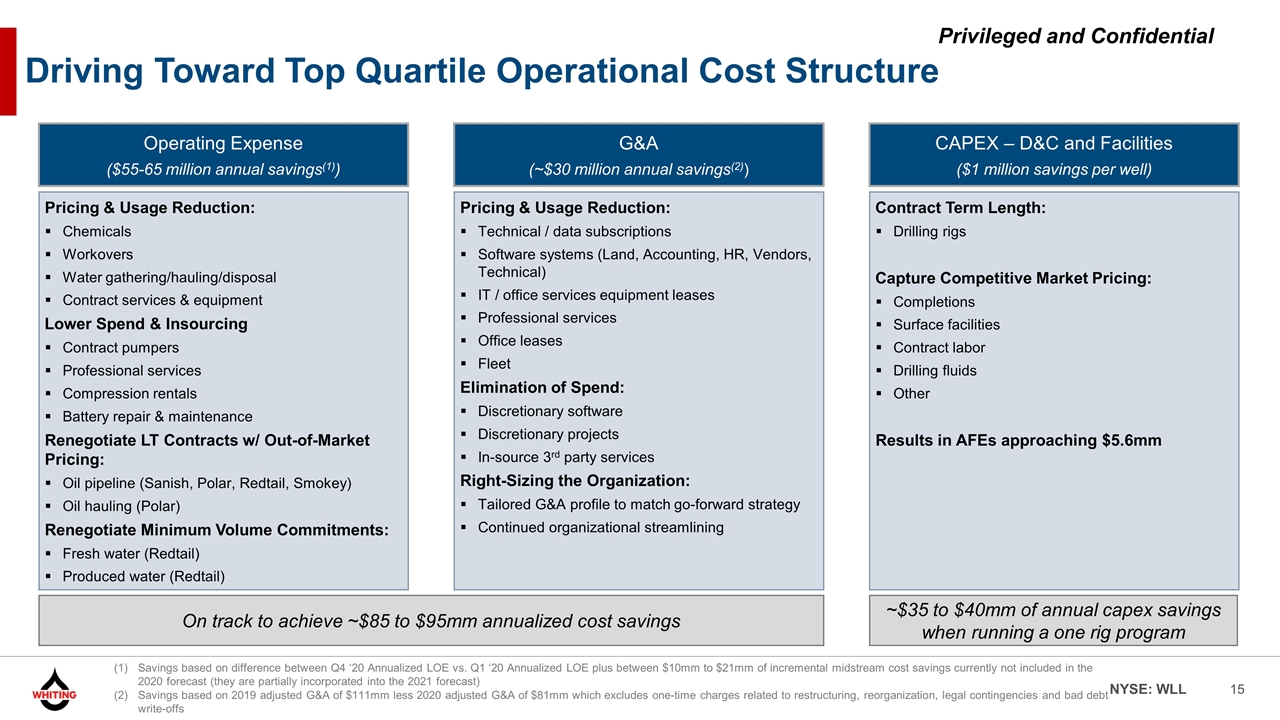
Driving Toward Top Quartile Operational Cost Structure Operating Expense ($55-65 million annual savings(1)) Pricing & Usage Reduction: Chemicals Workovers Water gathering/hauling/disposal Contract services & equipment Lower Spend & Insourcing Contract pumpers Professional services Compression rentals Battery repair & maintenance Renegotiate LT Contracts w/ Out-of-Market Pricing: Oil pipeline (Sanish, Polar, Redtail, Smokey) Oil hauling (Polar) Renegotiate Minimum Volume Commitments: Fresh water (Redtail) Produced water (Redtail) G&A (~$30 million annual savings(2)) Pricing & Usage Reduction: Technical / data subscriptions Software systems (Land, Accounting, HR, Vendors, Technical) IT / office services equipment leases Professional services Office leases Fleet Elimination of Spend: Discretionary software Discretionary projects In-source 3rd party services Right-Sizing the Organization: Tailored G&A profile to match go-forward strategy Continued organizational streamlining CAPEX – D&C and Facilities ($1 million savings per well) Contract Term Length: Drilling rigs Capture Competitive Market Pricing: Completions Surface facilities Contract labor Drilling fluids Other Results in AFEs approaching $5.6mm On track to achieve ~$85 to $95mm annualized cost savings ~$35 to $40mm of annual capex savings when running a one rig program Savings based on difference between Q4 ‘20 Annualized LOE vs. Q1 ‘20 Annualized LOE plus between $10mm to $21mm of incremental midstream cost savings currently not included in the 2020 forecast (they are partially incorporated into the 2021 forecast) Savings based on 2019 adjusted G&A of $111mm less 2020 adjusted G&A of $81mm which excludes one-time charges related to restructuring, reorganization, legal contingencies and bad debt write-offs
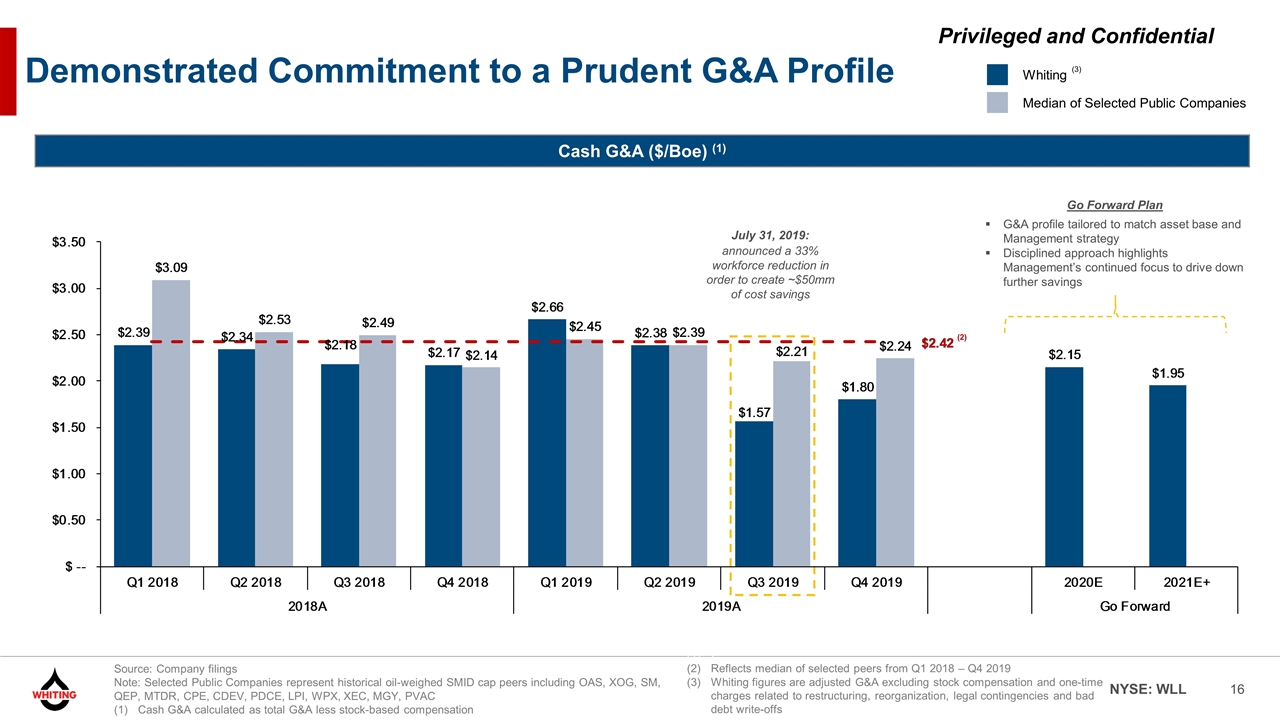
Demonstrated Commitment to a Prudent G&A Profile Cash G&A ($/Boe) (1) Whiting Median of Selected Public Companies Source: Company filings Note: Selected Public Companies represent historical oil-weighed SMID cap peers including OAS, XOG, SM, QEP, MTDR, CPE, CDEV, PDCE, LPI, WPX, XEC, MGY, PVAC Cash G&A calculated as total G&A less stock-based compensation July 31, 2019: announced a 33% workforce reduction in order to create ~$50mm of cost savings (2) Go Forward Plan G&A profile tailored to match asset base and Management strategy Disciplined approach highlights Management’s continued focus to drive down further savings ] Reflects median of selected peers from Q1 2018 – Q4 2019 Whiting figures are adjusted G&A excluding stock compensation and one-time charges related to restructuring, reorganization, legal contingencies and bad debt write-offs (3)
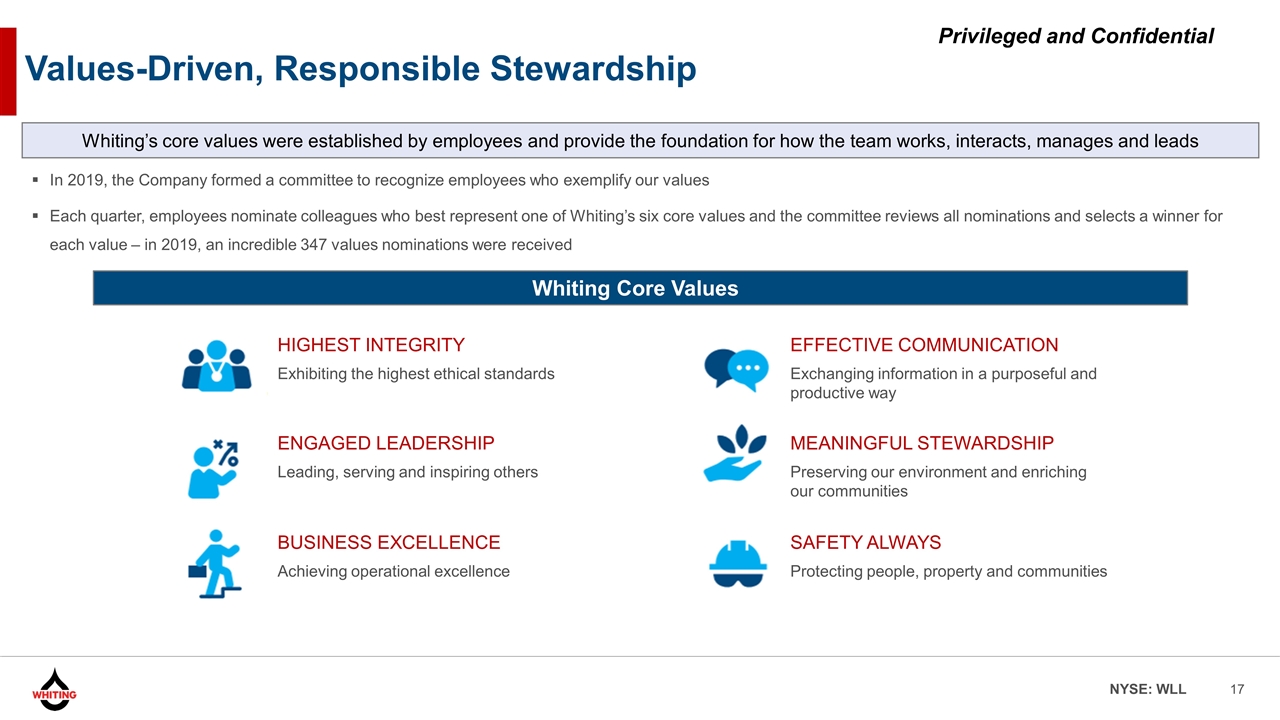
Values-Driven, Responsible Stewardship In 2019, the Company formed a committee to recognize employees who exemplify our values Each quarter, employees nominate colleagues who best represent one of Whiting’s six core values and the committee reviews all nominations and selects a winner for each value – in 2019, an incredible 347 values nominations were received Whiting’s core values were established by employees and provide the foundation for how the team works, interacts, manages and leads HIGHEST INTEGRITY Exhibiting the highest ethical standards EFFECTIVE COMMUNICATION Exchanging information in a purposeful and productive way ENGAGED LEADERSHIP Leading, serving and inspiring others MEANINGFUL STEWARDSHIP Preserving our environment and enriching our communities BUSINESS EXCELLENCE Achieving operational excellence SAFETY ALWAYS Protecting people, property and communities Whiting Core Values
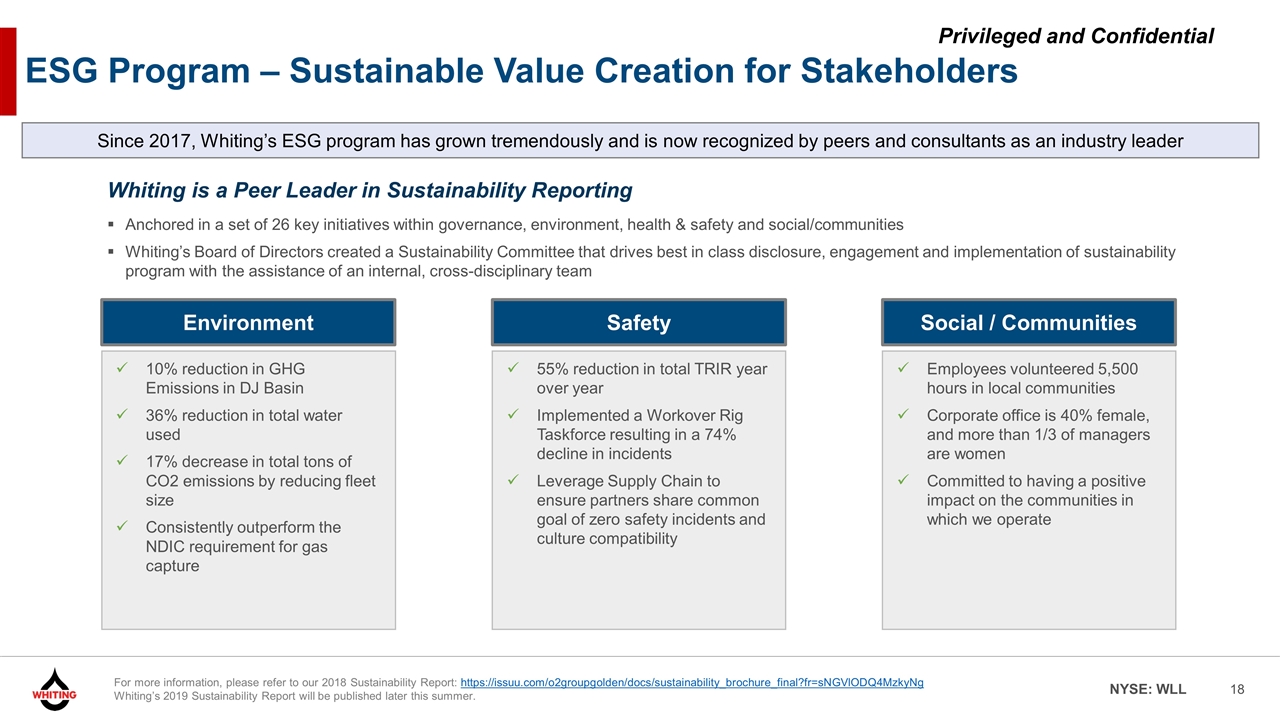
ESG Program – Sustainable Value Creation for Stakeholders Whiting is a Peer Leader in Sustainability Reporting Anchored in a set of 26 key initiatives within governance, environment, health & safety and social/communities Whiting’s Board of Directors created a Sustainability Committee that drives best in class disclosure, engagement and implementation of sustainability program with the assistance of an internal, cross-disciplinary team Environment 10% reduction in GHG Emissions in DJ Basin 36% reduction in total water used 17% decrease in total tons of CO2 emissions by reducing fleet size Consistently outperform the NDIC requirement for gas capture Safety Social / Communities 55% reduction in total TRIR year over year Implemented a Workover Rig Taskforce resulting in a 74% decline in incidents Leverage Supply Chain to ensure partners share common goal of zero safety incidents and culture compatibility Employees volunteered 5,500 hours in local communities Corporate office is 40% female, and more than 1/3 of managers are women Committed to having a positive impact on the communities in which we operate Since 2017, Whiting’s ESG program has grown tremendously and is now recognized by peers and consultants as an industry leader For more information, please refer to our 2018 Sustainability Report: https://issuu.com/o2groupgolden/docs/sustainability_brochure_final?fr=sNGVlODQ4MzkyNg Whiting’s 2019 Sustainability Report will be published later this summer.

Premier Operator
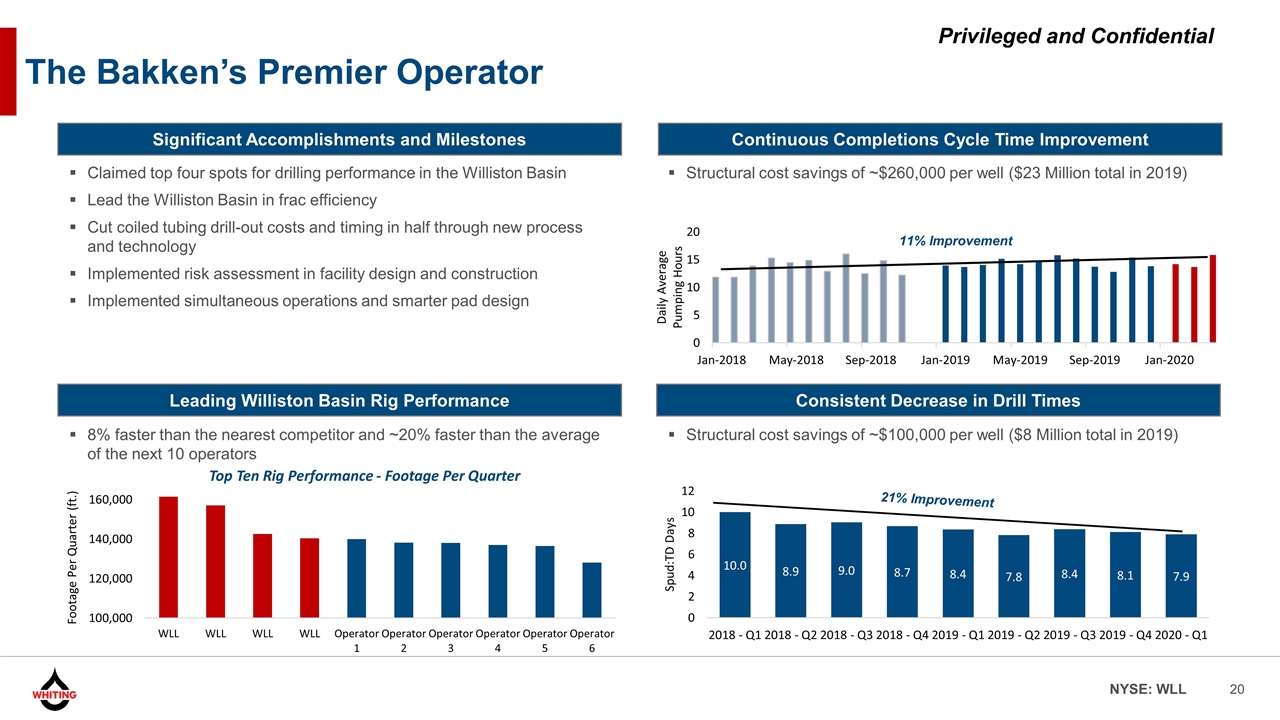
Continuous Completions Cycle Time Improvement Leading Williston Basin Rig Performance Significant Accomplishments and Milestones 8% faster than the nearest competitor and ~20% faster than the average of the next 10 operators Structural cost savings of ~$260,000 per well ($23 Million total in 2019) Claimed top four spots for drilling performance in the Williston Basin Lead the Williston Basin in frac efficiency Cut coiled tubing drill-out costs and timing in half through new process and technology Implemented risk assessment in facility design and construction Implemented simultaneous operations and smarter pad design 11% Improvement The Bakken’s Premier Operator Structural cost savings of ~$100,000 per well ($8 Million total in 2019) Consistent Decrease in Drill Times
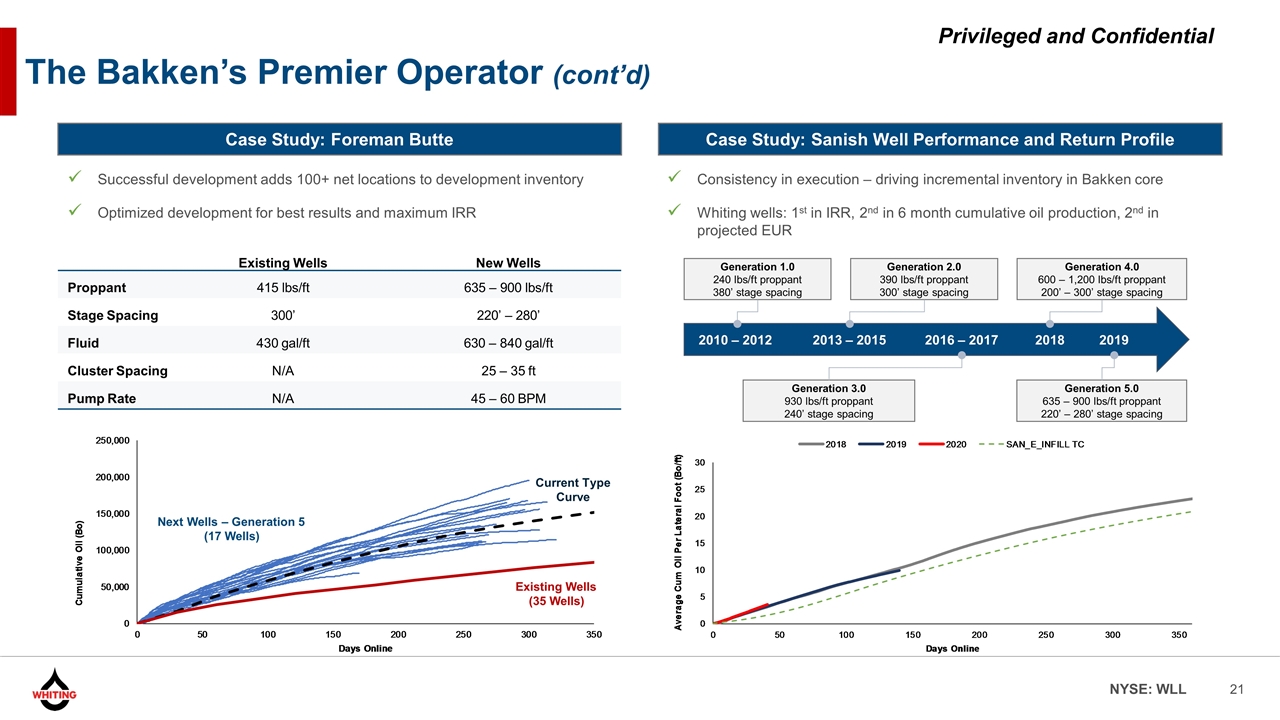
2010 – 2012 2013 – 2015 2016 – 2017 2018 2019 The Bakken’s Premier Operator (cont’d) Case Study: Foreman Butte Case Study: Sanish Well Performance and Return Profile Existing Wells New Wells Proppant 415 lbs/ft 635 – 900 lbs/ft Stage Spacing 300’ 220’ – 280’ Fluid 430 gal/ft 630 – 840 gal/ft Cluster Spacing N/A 25 – 35 ft Pump Rate N/A 45 – 60 BPM Successful development adds 100+ net locations to development inventory Optimized development for best results and maximum IRR Consistency in execution – driving incremental inventory in Bakken core Whiting wells: 1st in IRR, 2nd in 6 month cumulative oil production, 2nd in projected EUR Next Wells – Generation 5 (17 Wells) Current Type Curve Existing Wells (35 Wells) Generation 1.0 240 lbs/ft proppant 380’ stage spacing Generation 2.0 390 lbs/ft proppant 300’ stage spacing Generation 3.0 930 lbs/ft proppant 240’ stage spacing Generation 4.0 600 – 1,200 lbs/ft proppant 200’ – 300’ stage spacing Generation 5.0 635 – 900 lbs/ft proppant 220’ – 280’ stage spacing
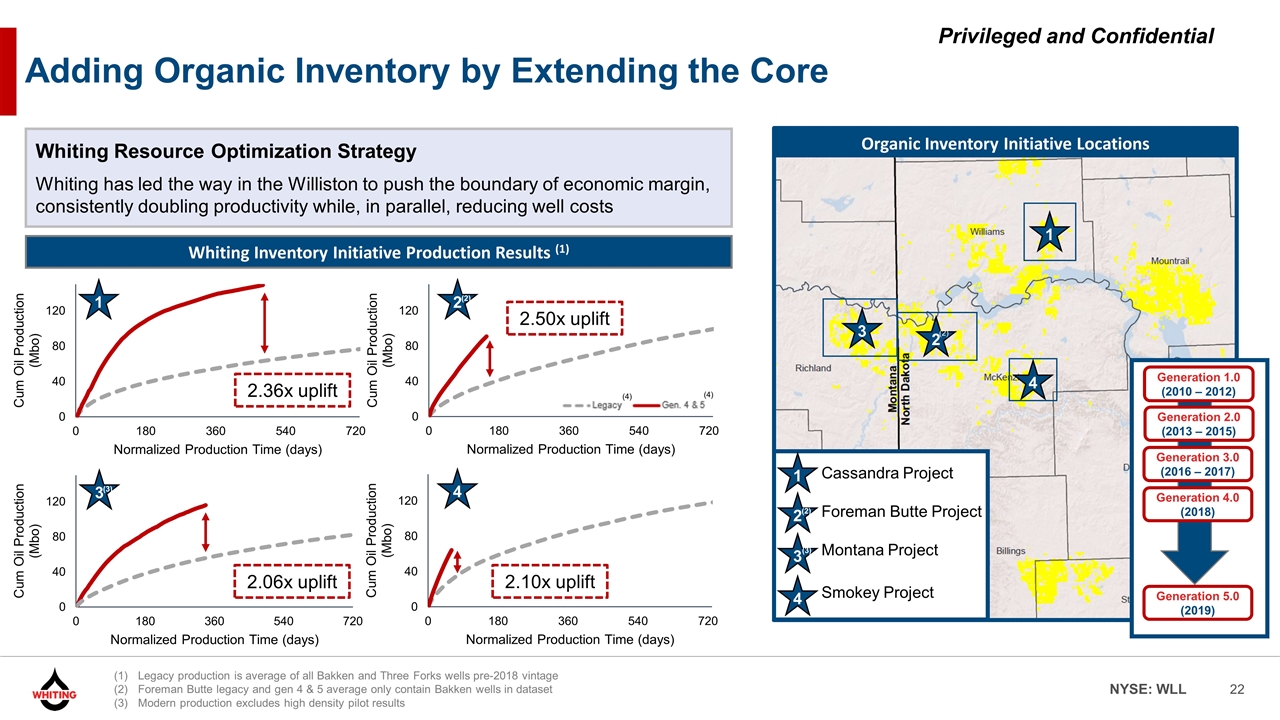
Adding Organic Inventory by Extending the Core Whiting Inventory Initiative Production Results (1) 2.50x uplift 2.36x uplift 1 2 Whiting Resource Optimization Strategy Whiting has led the way in the Williston to push the boundary of economic margin, consistently doubling productivity while, in parallel, reducing well costs 2.06x uplift 3 4 2.10x uplift Organic Inventory Initiative Locations 1 2 1 2 3 Cassandra Project Foreman Butte Project Montana Project Generation 1.0 (2010 – 2012) Generation 2.0 (2013 – 2015) Generation 3.0 (2016 – 2017) Generation 4.0 (2018) Generation 5.0 (2019) (2) (2) 3 4 4 Smokey Project (3) (2) (3) (4) (4) Legacy production is average of all Bakken and Three Forks wells pre-2018 vintage Foreman Butte legacy and gen 4 & 5 average only contain Bakken wells in dataset Modern production excludes high density pilot results
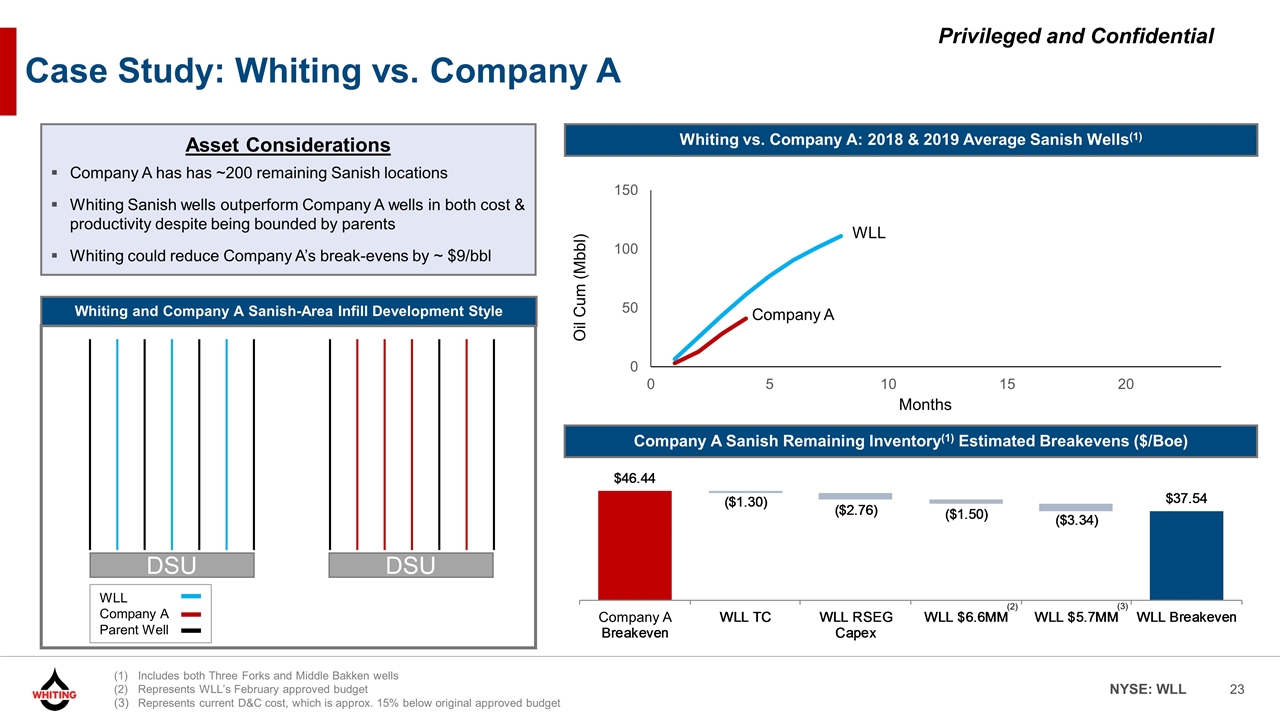
Case Study: Whiting vs. Company A Whiting vs. Company A: 2018 & 2019 Average Sanish Wells(1) Asset Considerations Company A has has ~200 remaining Sanish locations Whiting Sanish wells outperform Company A wells in both cost & productivity despite being bounded by parents Whiting could reduce Company A’s break-evens by ~ $9/bbl Whiting and Company A Sanish-Area Infill Development Style Company A Sanish Remaining Inventory(1) Estimated Breakevens ($/Boe) Oil Cum (Mbbl) Months WLL Company A WLL Company A Parent Well DSU DSU Includes both Three Forks and Middle Bakken wells Represents WLL’s February approved budget Represents current D&C cost, which is approx. 15% below original approved budget Company A (2) (3)
Business Plan Review
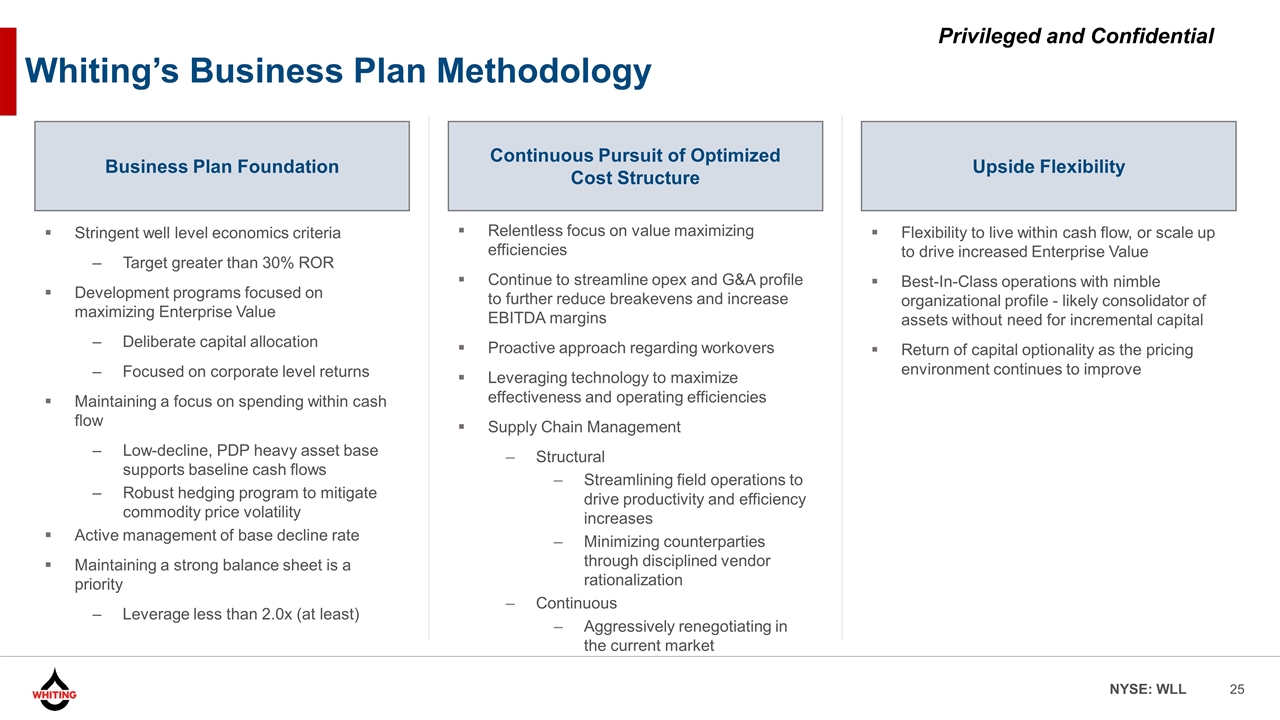
Whiting’s Business Plan Methodology Stringent well level economics criteria Target greater than 30% ROR Development programs focused on maximizing Enterprise Value Deliberate capital allocation Focused on corporate level returns Maintaining a focus on spending within cash flow Low-decline, PDP heavy asset base supports baseline cash flows Robust hedging program to mitigate commodity price volatility Active management of base decline rate Maintaining a strong balance sheet is a priority Leverage less than 2.0x (at least) Relentless focus on value maximizing efficiencies Continue to streamline opex and G&A profile to further reduce breakevens and increase EBITDA margins Proactive approach regarding workovers Leveraging technology to maximize effectiveness and operating efficiencies Supply Chain Management Structural Streamlining field operations to drive productivity and efficiency increases Minimizing counterparties through disciplined vendor rationalization Continuous Aggressively renegotiating in the current market Flexibility to live within cash flow, or scale up to drive increased Enterprise Value Best-In-Class operations with nimble organizational profile - likely consolidator of assets without need for incremental capital Return of capital optionality as the pricing environment continues to improve Business Plan Foundation Continuous Pursuit of Optimized Cost Structure Upside Flexibility
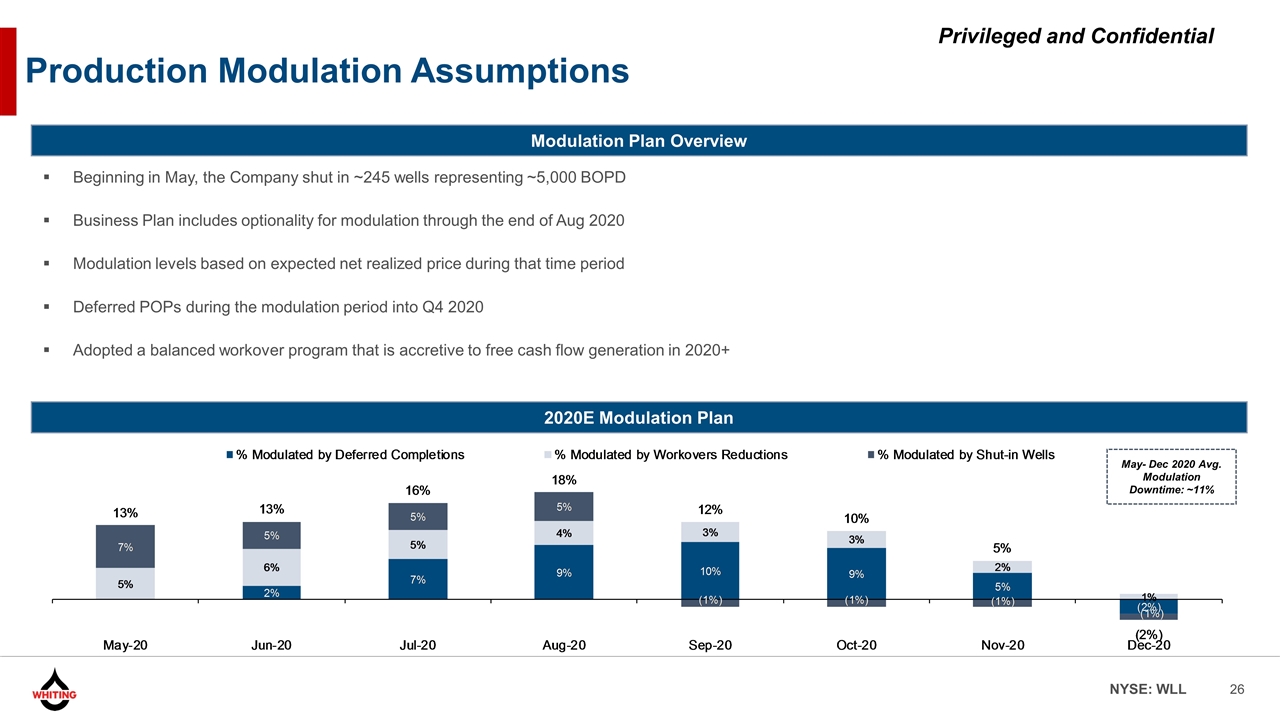
Production Modulation Assumptions Modulation Plan Overview 2020E Modulation Plan Beginning in May, the Company shut in ~245 wells representing ~5,000 BOPD Business Plan includes optionality for modulation through the end of Aug 2020 Modulation levels based on expected net realized price during that time period Deferred POPs during the modulation period into Q4 2020 Adopted a balanced workover program that is accretive to free cash flow generation in 2020+ May- Dec 2020 Avg. Modulation Downtime: ~11%
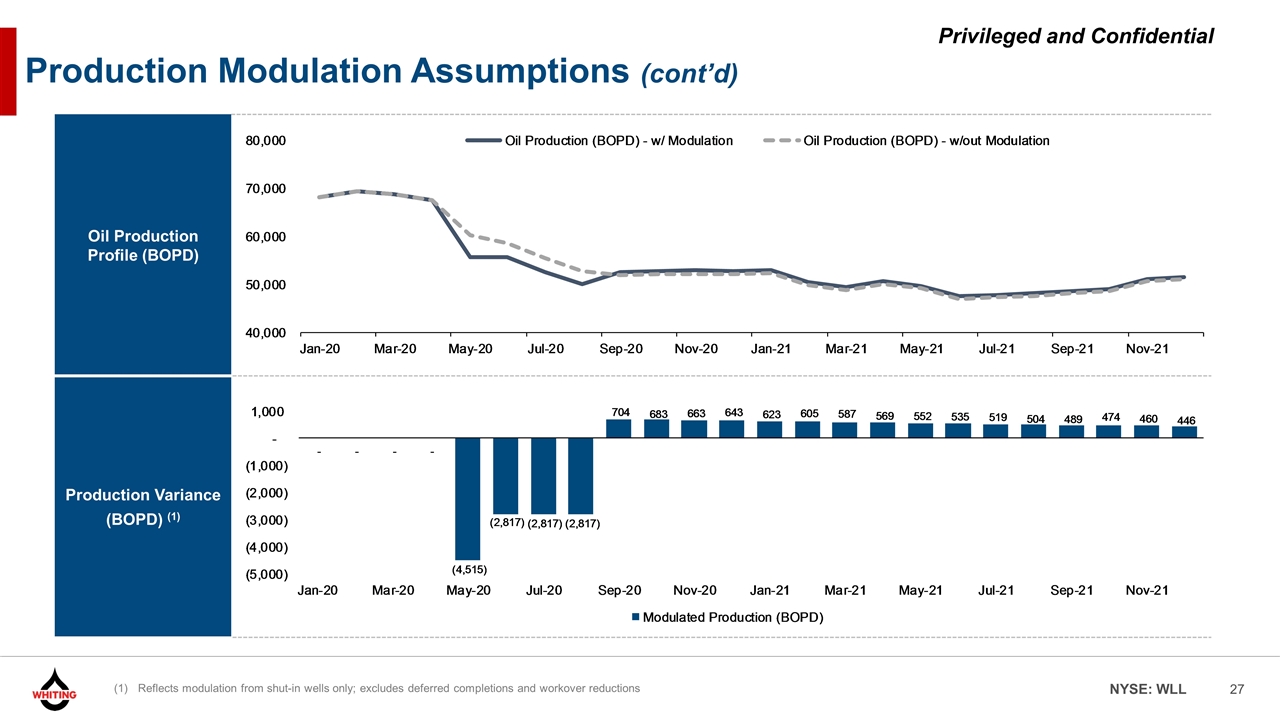
Oil Production Profile (BOPD) Production Variance (BOPD) (1) Production Modulation Assumptions (cont’d) Reflects modulation from shut-in wells only; excludes deferred completions and workover reductions
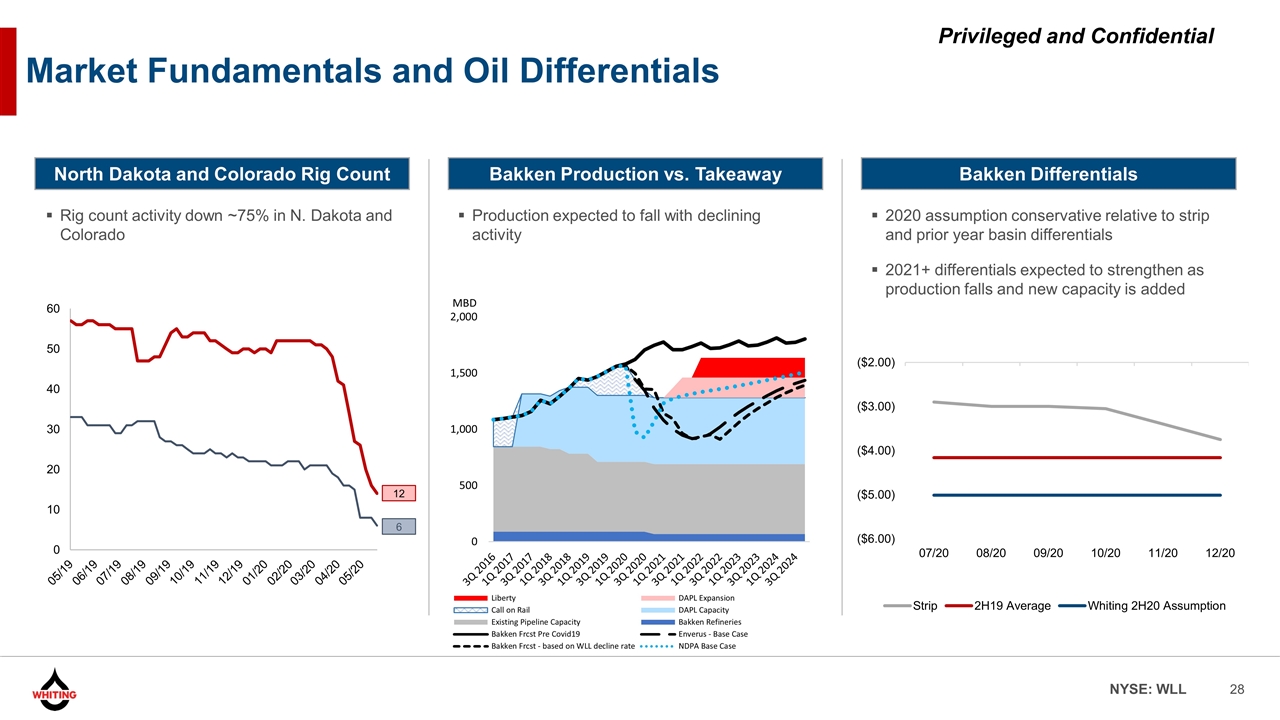
Market Fundamentals and Oil Differentials Rig count activity down ~75% in N. Dakota and Colorado 12 North Dakota and Colorado Rig Count Bakken Production vs. Takeaway Bakken Differentials 6 Production expected to fall with declining activity 2020 assumption conservative relative to strip and prior year basin differentials 2021+ differentials expected to strengthen as production falls and new capacity is added
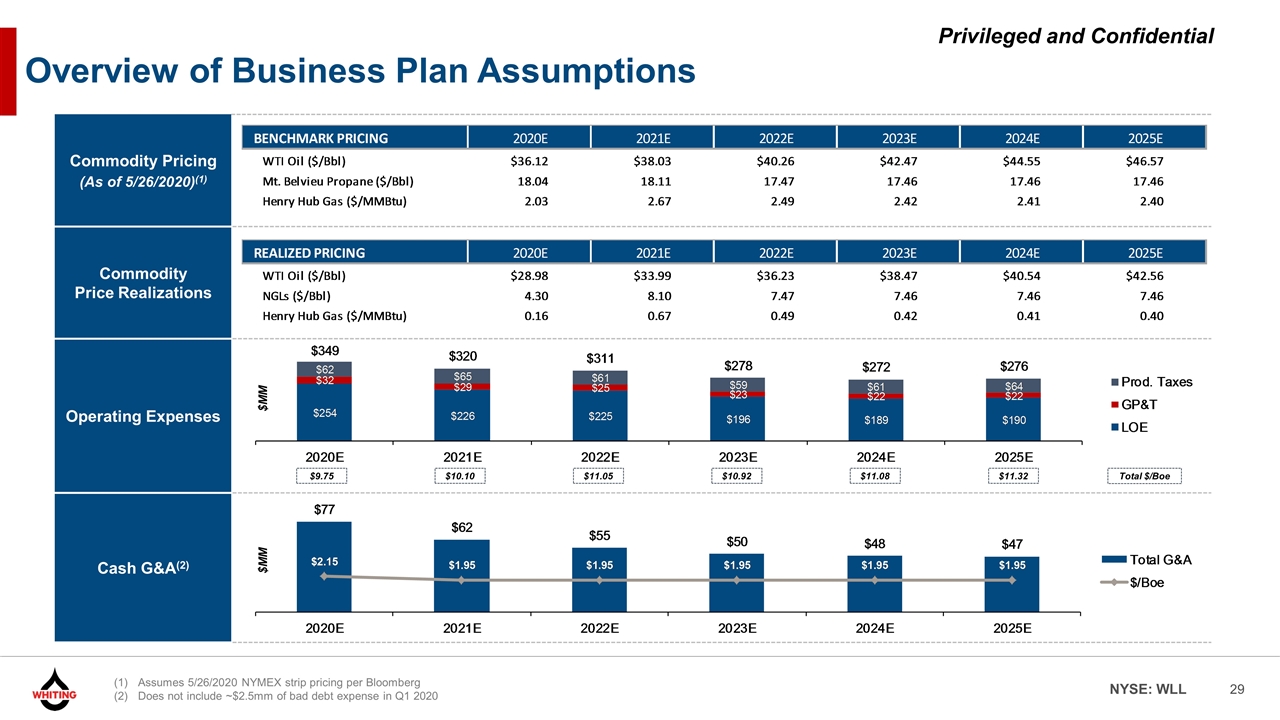
Commodity Pricing (As of 5/26/2020)(1) Commodity Price Realizations Operating Expenses Cash G&A(2) Overview of Business Plan Assumptions $MM Assumes 5/26/2020 NYMEX strip pricing per Bloomberg Does not include ~$2.5mm of bad debt expense in Q1 2020 $MM $9.75 $10.10 $11.05 $10.92 $11.08 $11.32 Total $/Boe
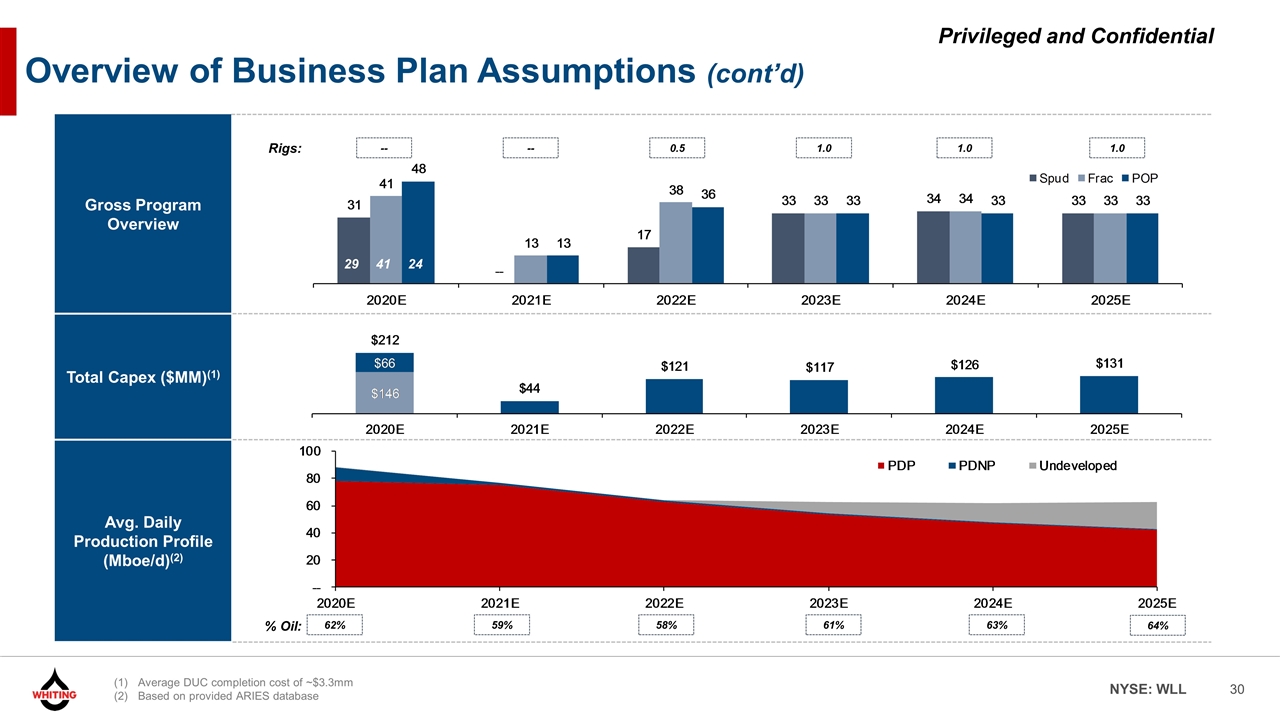
Gross Program Overview Total Capex ($MM)(1) Avg. Daily Production Profile (Mboe/d)(2) Overview of Business Plan Assumptions (cont’d) -- -- 0.5 1.0 1.0 1.0 Rigs: 62% 59% 58% 61% 63% 64% % Oil: 29 41 24 Average DUC completion cost of ~$3.3mm Based on provided ARIES database
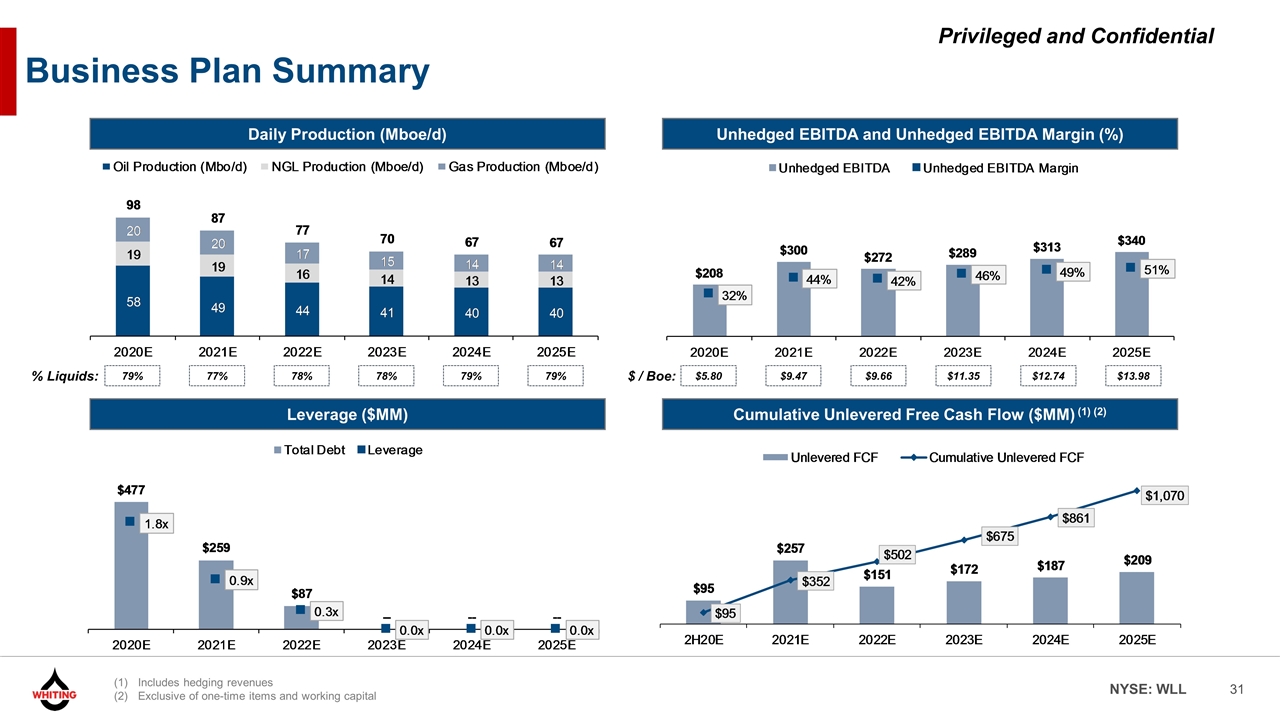
Includes hedging revenues Exclusive of one-time items and working capital Business Plan Summary Daily Production (Mboe/d) Leverage ($MM) Unhedged EBITDA and Unhedged EBITDA Margin (%) Cumulative Unlevered Free Cash Flow ($MM) (1) (2) % Liquids: 79% 77% 78% 78% 79% 79% $ / Boe: $5.80 $9.47 $9.66 $11.35 $12.74 $13.98
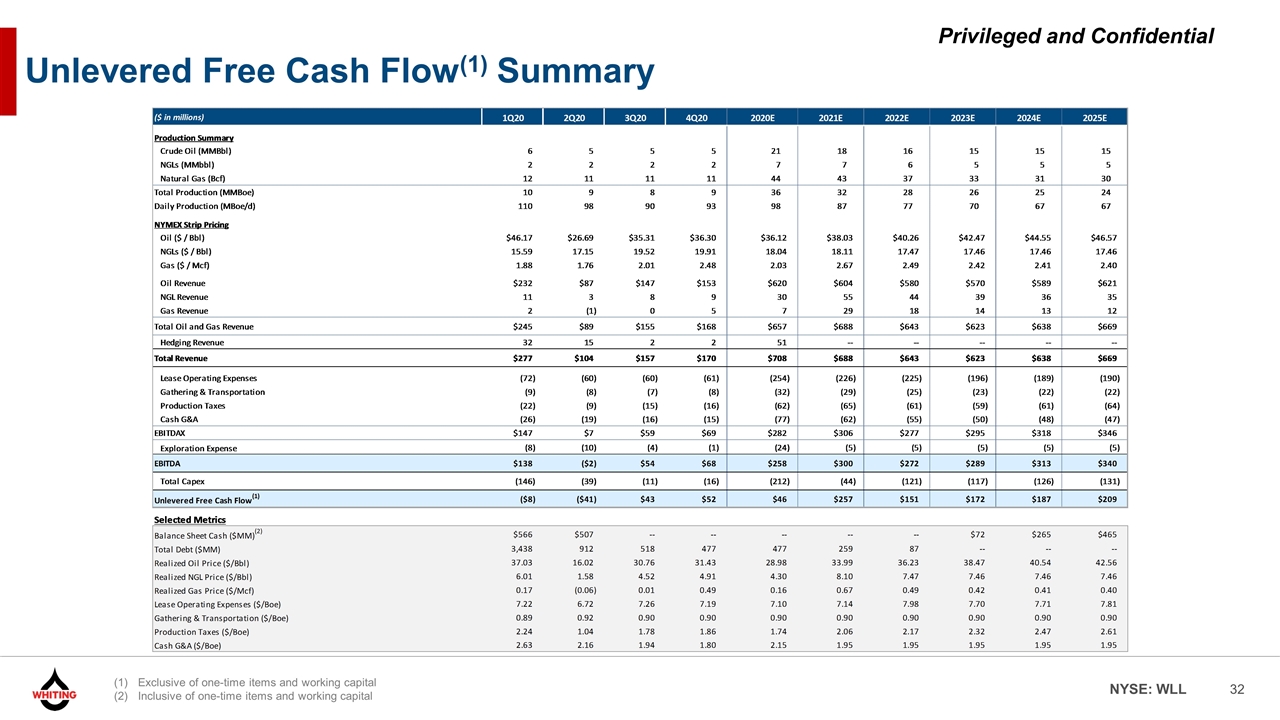
Exclusive of one-time items and working capital Inclusive of one-time items and working capital Unlevered Free Cash Flow(1) Summary

Next Steps
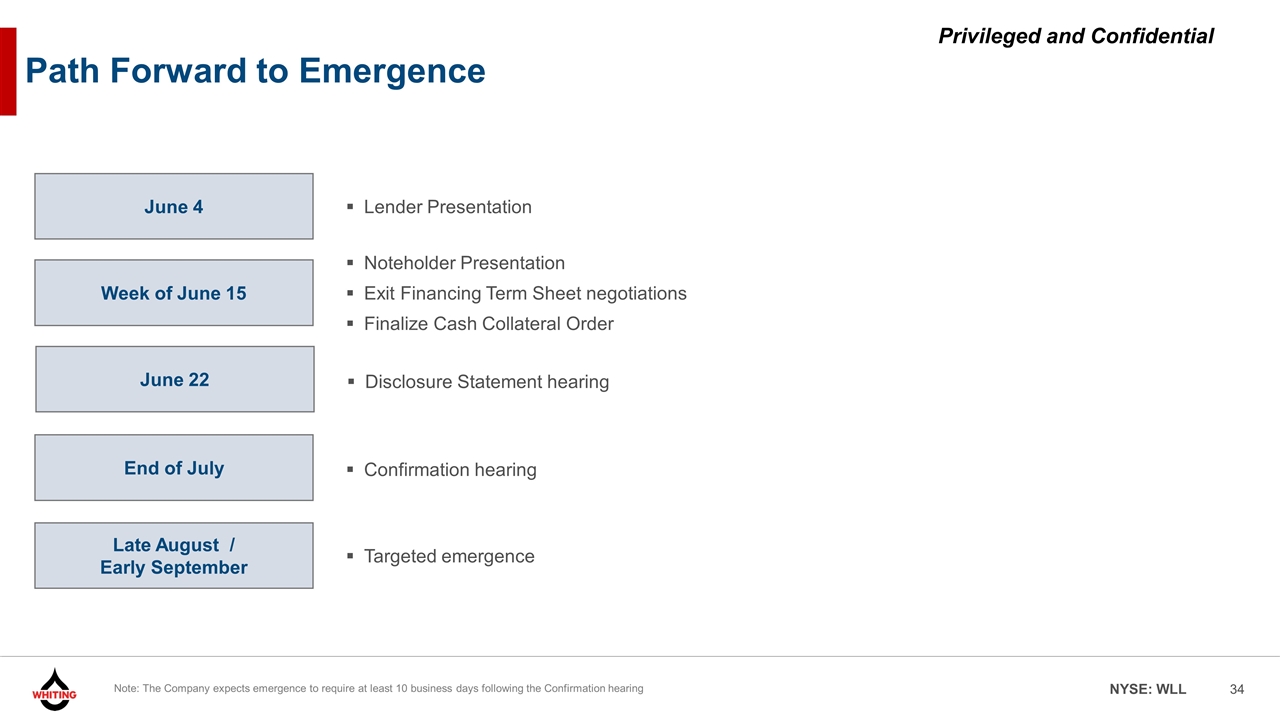
Path Forward to Emergence Week of June 15 Noteholder Presentation Exit Financing Term Sheet negotiations Finalize Cash Collateral Order End of July Confirmation hearing Late August / Early September Targeted emergence Note: The Company expects emergence to require at least 10 business days following the Confirmation hearing June 22 Disclosure Statement hearing June 4 Lender Presentation
Appendix
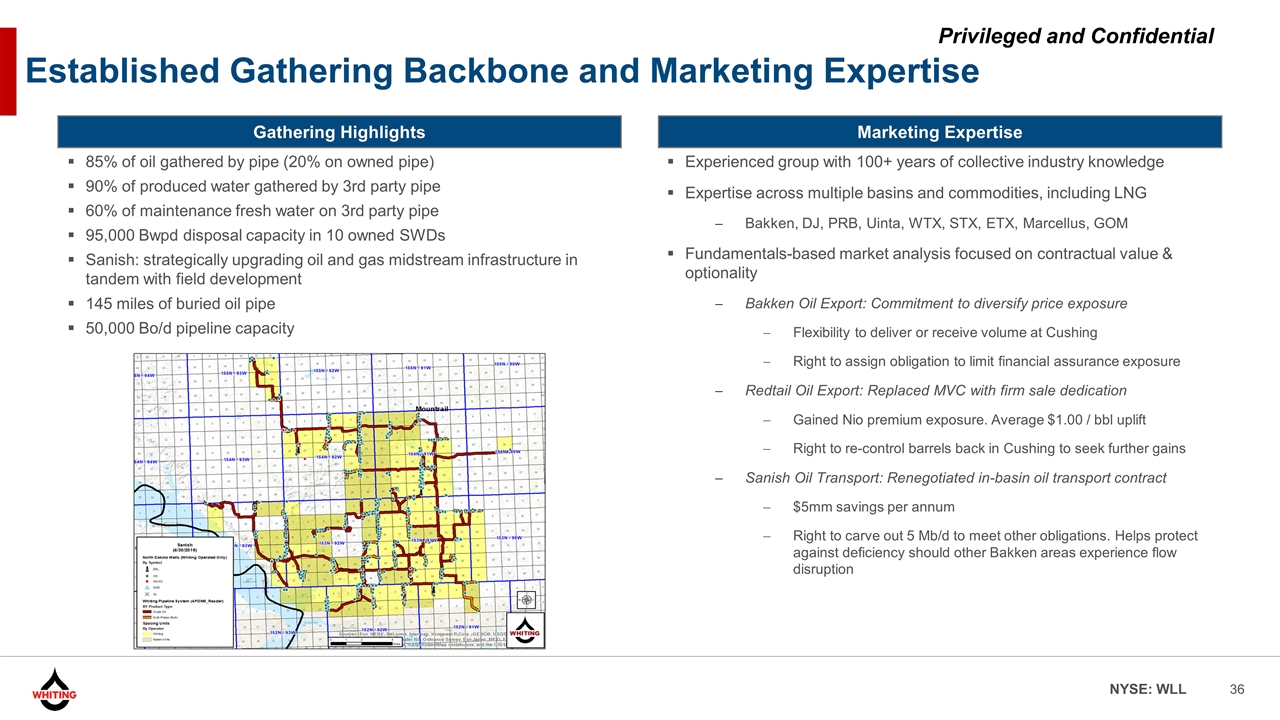
Established Gathering Backbone and Marketing Expertise Gathering Highlights Marketing Expertise 85% of oil gathered by pipe (20% on owned pipe) 90% of produced water gathered by 3rd party pipe 60% of maintenance fresh water on 3rd party pipe 95,000 Bwpd disposal capacity in 10 owned SWDs Sanish: strategically upgrading oil and gas midstream infrastructure in tandem with field development 145 miles of buried oil pipe 50,000 Bo/d pipeline capacity Experienced group with 100+ years of collective industry knowledge Expertise across multiple basins and commodities, including LNG Bakken, DJ, PRB, Uinta, WTX, STX, ETX, Marcellus, GOM Fundamentals-based market analysis focused on contractual value & optionality Bakken Oil Export: Commitment to diversify price exposure Flexibility to deliver or receive volume at Cushing Right to assign obligation to limit financial assurance exposure Redtail Oil Export: Replaced MVC with firm sale dedication Gained Nio premium exposure. Average $1.00 / bbl uplift Right to re-control barrels back in Cushing to seek further gains Sanish Oil Transport: Renegotiated in-basin oil transport contract $5mm savings per annum Right to carve out 5 Mb/d to meet other obligations. Helps protect against deficiency should other Bakken areas experience flow disruption
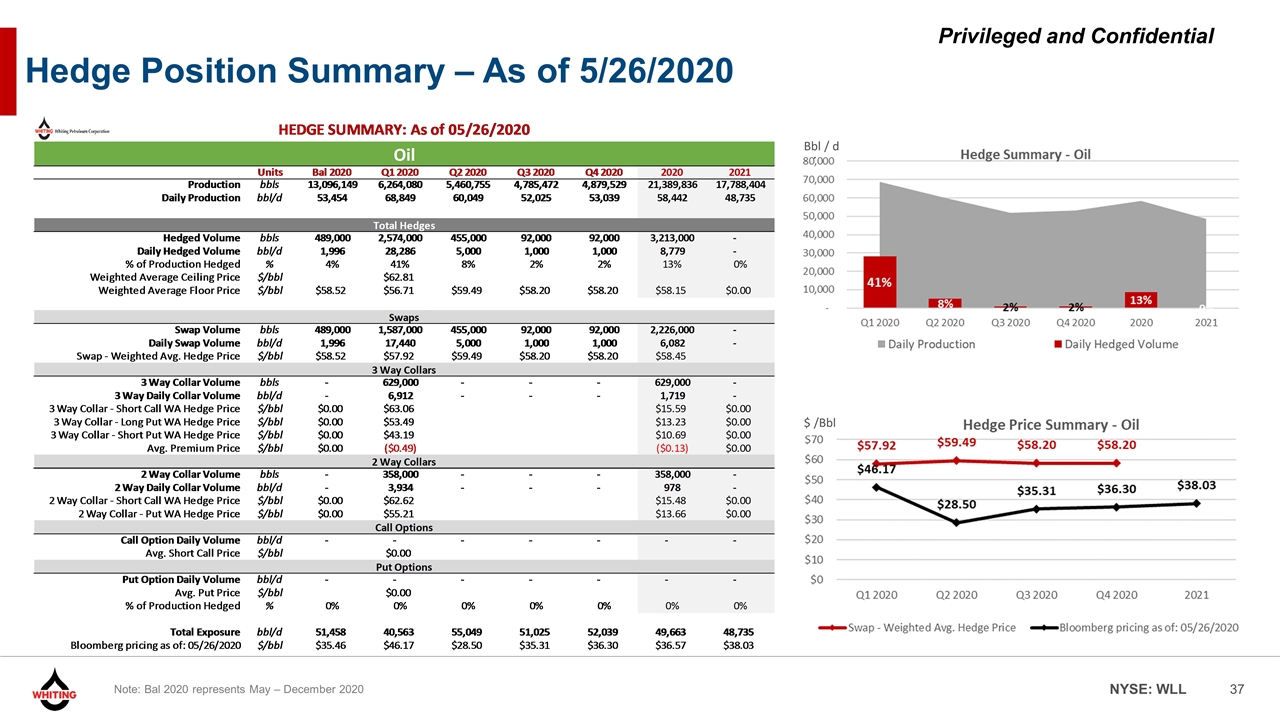
Hedge Position Summary – As of 5/26/2020 Note: Bal 2020 represents May – December 2020 $ /Bbl Bbl / d
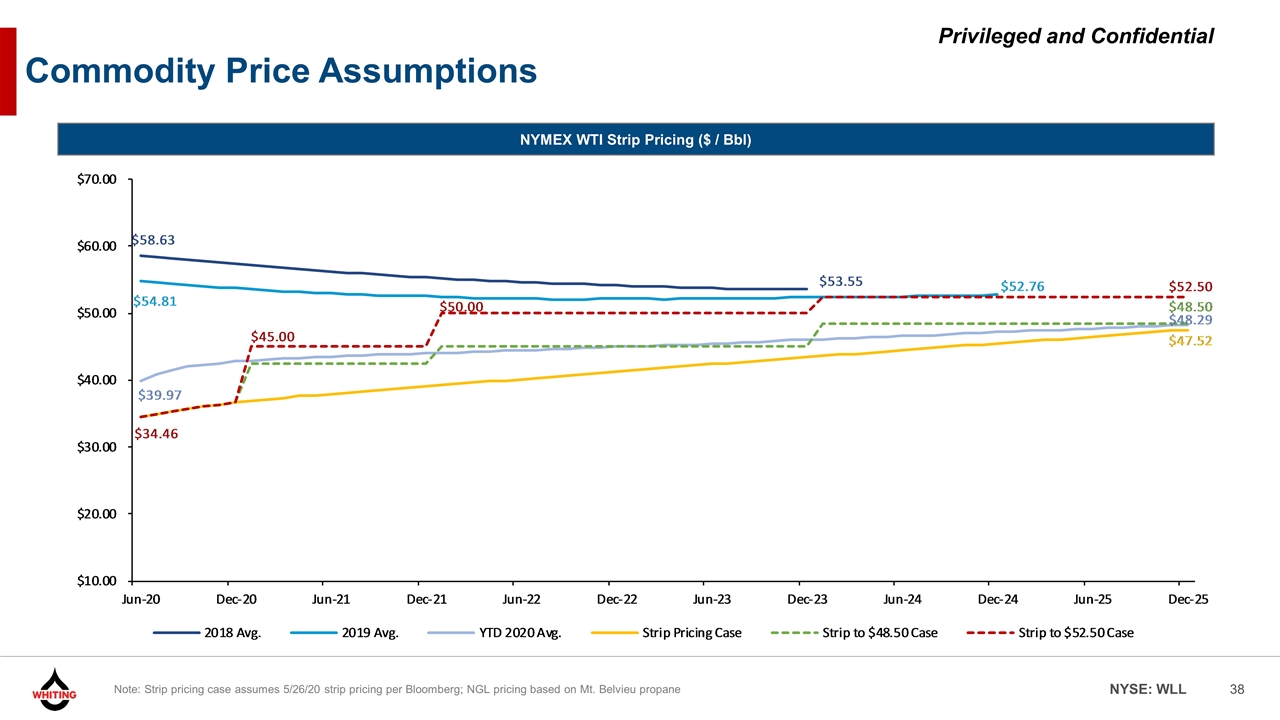
NYMEX WTI Strip Pricing ($ / Bbl) Note: Strip pricing case assumes 5/26/20 strip pricing per Bloomberg; NGL pricing based on Mt. Belvieu propane Commodity Price Assumptions
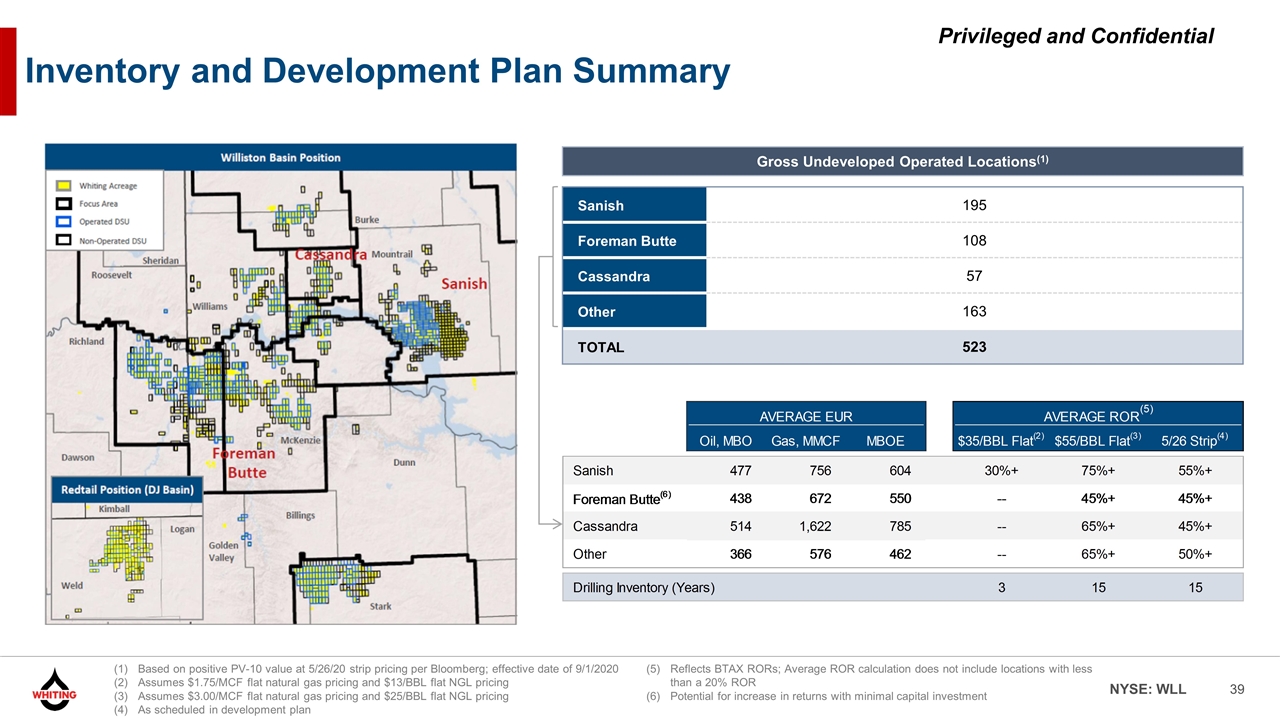
Based on positive PV-10 value at 5/26/20 strip pricing per Bloomberg; effective date of 9/1/2020 Assumes $1.75/MCF flat natural gas pricing and $13/BBL flat NGL pricing Assumes $3.00/MCF flat natural gas pricing and $25/BBL flat NGL pricing As scheduled in development plan Inventory and Development Plan Summary Sanish 195 Foreman Butte 108 Cassandra 57 Other 163 TOTAL 523 Gross Undeveloped Operated Locations(1) Reflects BTAX RORs; Average ROR calculation does not include locations with less than a 20% ROR Potential for increase in returns with minimal capital investment
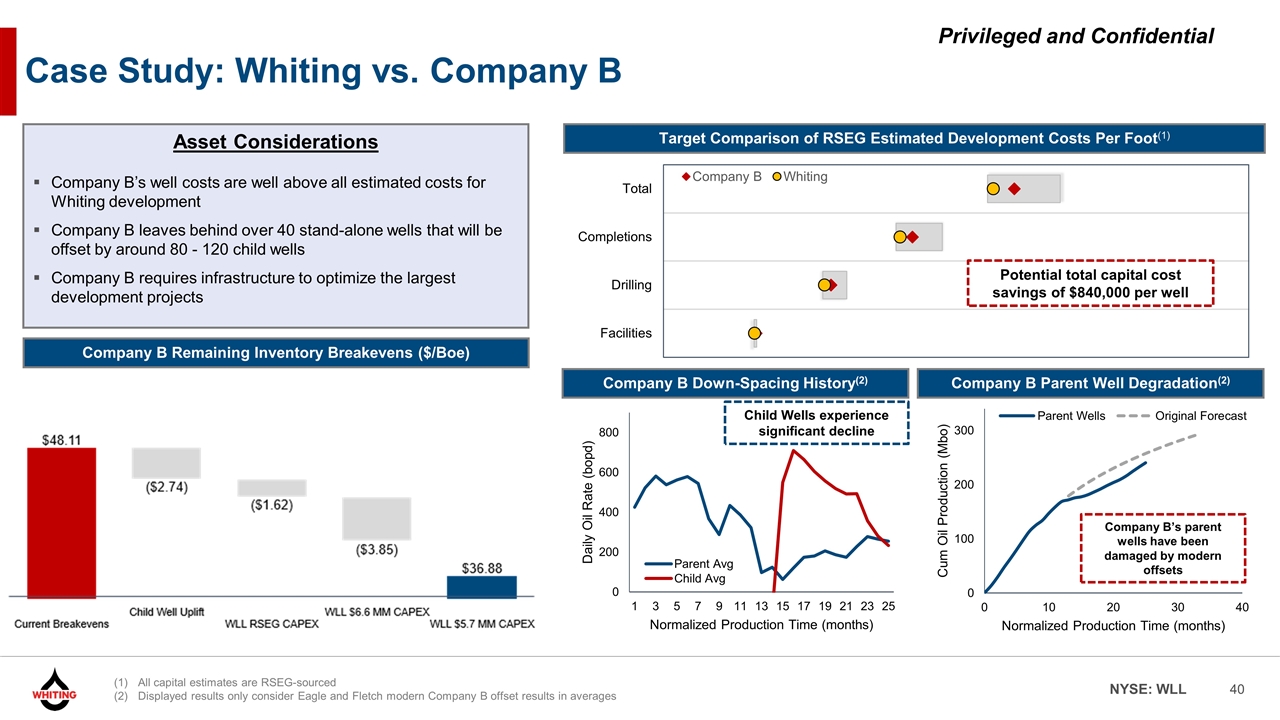
Case Study: Whiting vs. Company B Company B Parent Well Degradation(2) Company B Down-Spacing History(2) Asset Considerations Company B’s well costs are well above all estimated costs for Whiting development Company B leaves behind over 40 stand-alone wells that will be offset by around 80 - 120 child wells Company B requires infrastructure to optimize the largest development projects Target Comparison of RSEG Estimated Development Costs Per Foot(1) Company B’s parent wells have been damaged by modern offsets Child Wells experience significant decline Potential total capital cost savings of $840,000 per well Company B Remaining Inventory Breakevens ($/Boe) All capital estimates are RSEG-sourced Displayed results only consider Eagle and Fletch modern Company B offset results in averages
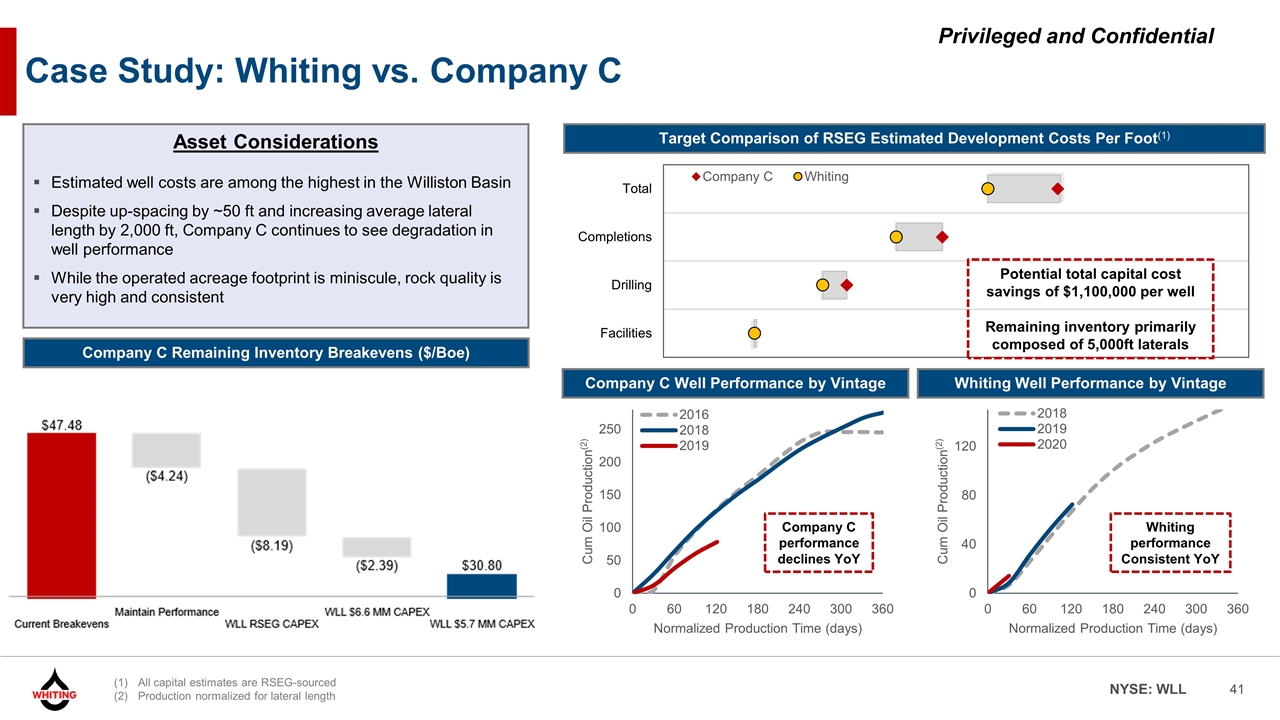
Case Study: Whiting vs. Company C Whiting Well Performance by Vintage Company C Well Performance by Vintage Asset Considerations Estimated well costs are among the highest in the Williston Basin Despite up-spacing by ~50 ft and increasing average lateral length by 2,000 ft, Company C continues to see degradation in well performance While the operated acreage footprint is miniscule, rock quality is very high and consistent Target Comparison of RSEG Estimated Development Costs Per Foot(1) Company C performance declines YoY Potential total capital cost savings of $1,100,000 per well Remaining inventory primarily composed of 5,000ft laterals All capital estimates are RSEG-sourced Production normalized for lateral length Company C Remaining Inventory Breakevens ($/Boe) Whiting performance Consistent YoY
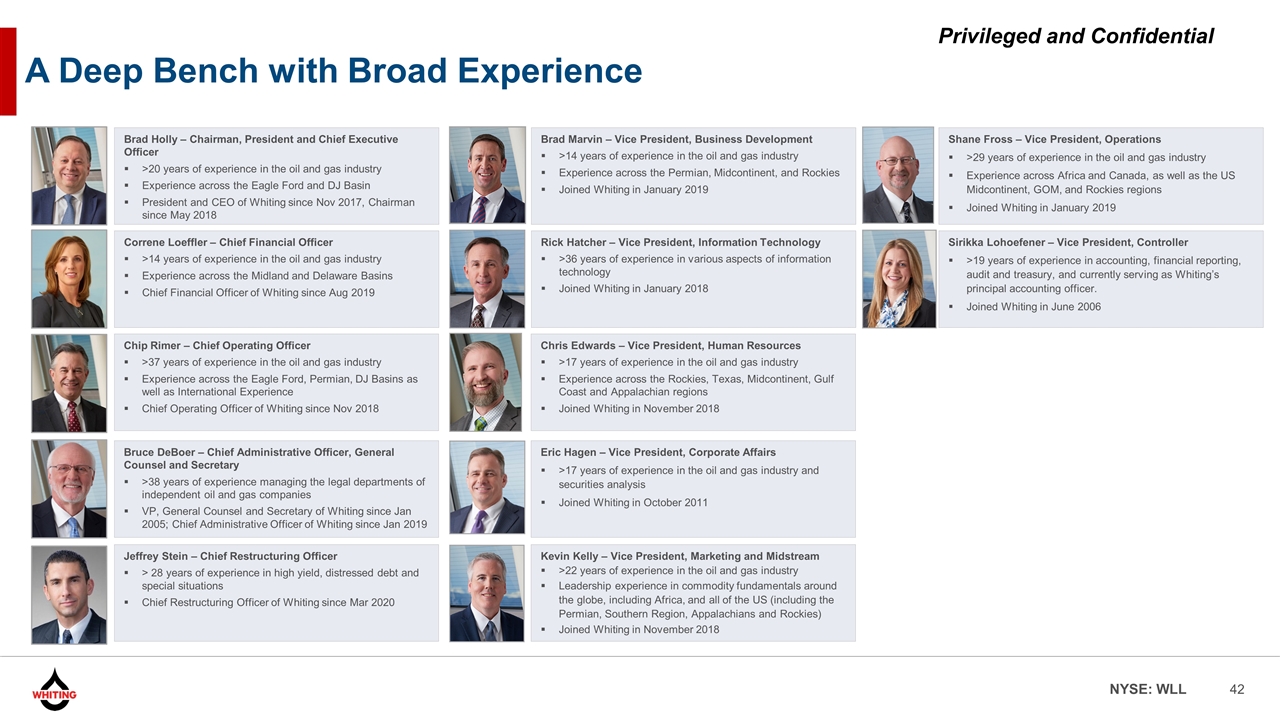
A Deep Bench with Broad Experience Brad Holly – Chairman, President and Chief Executive Officer >20 years of experience in the oil and gas industry Experience across the Eagle Ford and DJ Basin President and CEO of Whiting since Nov 2017, Chairman since May 2018 Brad Marvin – Vice President, Business Development >14 years of experience in the oil and gas industry Experience across the Permian, Midcontinent, and Rockies Joined Whiting in January 2019 Shane Fross – Vice President, Operations >29 years of experience in the oil and gas industry Experience across Africa and Canada, as well as the US Midcontinent, GOM, and Rockies regions Joined Whiting in January 2019 Correne Loeffler – Chief Financial Officer >14 years of experience in the oil and gas industry Experience across the Midland and Delaware Basins Chief Financial Officer of Whiting since Aug 2019 Rick Hatcher – Vice President, Information Technology >36 years of experience in various aspects of information technology Joined Whiting in January 2018 Sirikka Lohoefener – Vice President, Controller >19 years of experience in accounting, financial reporting, audit and treasury, and currently serving as Whiting’s principal accounting officer. Joined Whiting in June 2006 Chip Rimer – Chief Operating Officer >37 years of experience in the oil and gas industry Experience across the Eagle Ford, Permian, DJ Basins as well as International Experience Chief Operating Officer of Whiting since Nov 2018 Chris Edwards – Vice President, Human Resources >17 years of experience in the oil and gas industry Experience across the Rockies, Texas, Midcontinent, Gulf Coast and Appalachian regions Joined Whiting in November 2018 Bruce DeBoer – Chief Administrative Officer, General Counsel and Secretary >38 years of experience managing the legal departments of independent oil and gas companies VP, General Counsel and Secretary of Whiting since Jan 2005; Chief Administrative Officer of Whiting since Jan 2019 Eric Hagen – Vice President, Corporate Affairs >17 years of experience in the oil and gas industry and securities analysis Joined Whiting in October 2011 Jeffrey Stein – Chief Restructuring Officer > 28 years of experience in high yield, distressed debt and special situations Chief Restructuring Officer of Whiting since Mar 2020 Kevin Kelly – Vice President, Marketing and Midstream >22 years of experience in the oil and gas industry Leadership experience in commodity fundamentals around the globe, including Africa, and all of the US (including the Permian, Southern Region, Appalachians and Rockies) Joined Whiting in November 2018
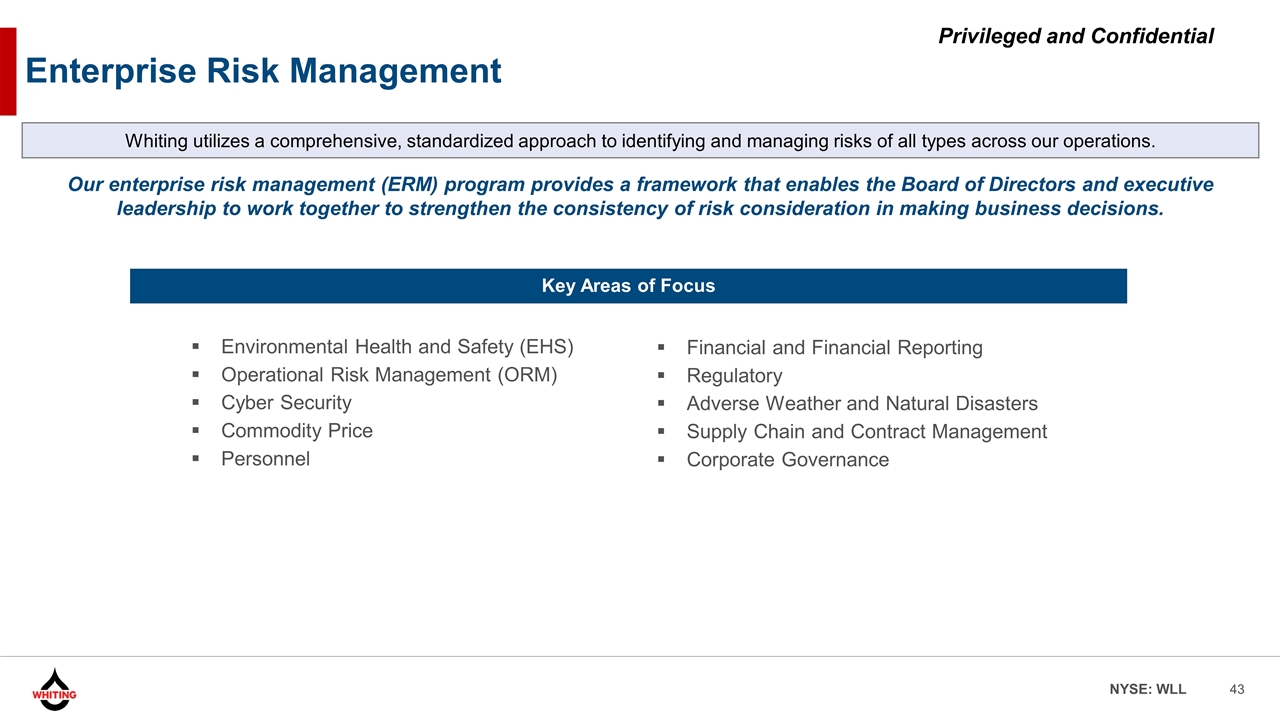
Enterprise Risk Management Our enterprise risk management (ERM) program provides a framework that enables the Board of Directors and executive leadership to work together to strengthen the consistency of risk consideration in making business decisions. Whiting utilizes a comprehensive, standardized approach to identifying and managing risks of all types across our operations. Financial and Financial Reporting Regulatory Adverse Weather and Natural Disasters Supply Chain and Contract Management Corporate Governance Environmental Health and Safety (EHS) Operational Risk Management (ORM) Cyber Security Commodity Price Personnel Key Areas of Focus
Preliminary term sheet for exit financing June 2020 J.P. Morgan
This presentation was prepared exclusively for the benefit and internal use of the J.P. Morgan client to whom it is directly addressed and delivered (including such client’s subsidiaries, the “Company”) in order to assist the Company in evaluating, on a preliminary basis, the feasibility of a possible transaction or transactions and does not carry any right of publication or disclosure, in whole or in part, to any other party. This presentation is for discussion purposes only and is incomplete without reference to, and should be viewed solely in conjunction with, the oral briefing provided by J.P. Morgan. Neither this presentation nor any of its contents may be disclosed or used for any other purpose without the prior written consent of J.P. Morgan. The information in this presentation is based upon any management forecasts supplied to us and reflects prevailing conditions and our views as of this date, all of which are accordingly subject to change. J.P. Morgan’s opinions and estimates constitute J.P. Morgan’s judgment and should be regarded as indicative, preliminary and for illustrative purposes only. In preparing this presentation, we have relied upon and assumed, without independent verification, the accuracy and completeness of all information available from public sources or which was provided to us by or on behalf of the Company or which was otherwise reviewed by us. In addition, our analyses are not and do not purport to be appraisals of the assets, stock, or business of the Company or any other entity. J.P. Morgan makes no representations as to the actual value which may be received in connection with a transaction nor the legal, tax or accounting effects of consummating a transaction. Unless expressly contemplated hereby, the information in this presentation does not take into account the effects of a possible transaction or transactions involving an actual or potential change of control, which may have significant valuation and other effects. Notwithstanding anything herein to the contrary, the Company and each of its employees, representatives or other agents may disclose to any and all persons, without limitation of any kind, the U.S. federal and state income tax treatment and the U.S. federal and state income tax structure of the transactions contemplated hereby and all materials of any kind (including opinions or other tax analyses) that are provided to the Company relating to such tax treatment and tax structure insofar as such treatment and/or structure relates to a U.S. federal or state income tax strategy provided to the Company by J.P. Morgan. J.P. Morgan’s policies on data privacy can be found at http://www.jpmorgan.com/pages/privacy. J.P. Morgan is a party to the SEC Research Settlement and as such, is generally not permitted to utilize the firm’s research capabilities in pitching for investment banking business. All views contained in this presentation are the views of J.P. Morgan’s Investment Bank, not the Research Department. J.P. Morgan’s policies prohibit employees from offering, directly or indirectly, a favorable research rating or specific price target, or offering to change a rating or price target, to a subject company as consideration or inducement for the receipt of business or for compensation. J.P. Morgan also prohibits its research analysts from being compensated for involvement in investment banking transactions except to the extent that such participation is intended to benefit investors. Changes to Interbank Offered Rates (IBORs) and other benchmark rates: Certain interest rate benchmarks are, or may in the future become, subject to ongoing international, national and other regulatory guidance, reform and proposals for reform. For more information, please consult: https://www.jpmorgan.com/global/disclosures/interbank_offered_rates JPMorgan Chase & Co. and its affiliates do not provide tax advice. Accordingly, any discussion of U.S. tax matters included herein (including any attachments) is not intended or written to be used, and cannot be used, in connection with the promotion, marketing or recommendation by anyone not affiliated with JPMorgan Chase & Co. of any of the matters addressed herein or for the purpose of avoiding U.S.tax-related penalties. J.P. Morgan is a marketing name for investment businesses of JPMorgan Chase & Co. and its subsidiaries and affiliates worldwide. Securities, syndicated loan arranging, financial advisory, lending, derivatives and other investment banking and commercial banking activities are performed by a combination of J.P. Morgan Securities LLC, J.P. Morgan Securities plc, J.P. Morgan AG, JPMorgan Chase Bank, N.A. and the appropriately licensed subsidiaries and affiliates of JPMorgan Chase & Co. worldwide. J.P. Morgan deal team members may be employees of any of the foregoing entities. J.P. Morgan Securities plc is authorized by the Prudential Regulation Authority and regulated by the Financial Conduct Authority and the Prudential Regulation Authority. J.P. Morgan AG is authorized by the German Federal Financial Supervisory Authority (BaFin) and regulated by BaFin and the German Central Bank (Deutsche Bundesbank). For information on any J.P. Morgan German legal entity see: https://www.jpmorgan.com/country/US/en/disclosures/legal-entity-information#germany. For information on any other J.P. Morgan legal entity see: https://www.jpmorgan.com/country/GB/EN/disclosures/investment-bank-legal-entity-disclosures. This presentation does not constitute a commitment by any J.P. Morgan entity to underwrite, subscribe for or place any securities or to extend or arrange credit or to provide any other services. Copyright 2020 JPMorgan Chase & Co. All rights reserved. JPMorgan Chase Bank, N.A., organized under the laws of U.S.A. with limited liability. WHITING PETROLEUM J.P.Morgan
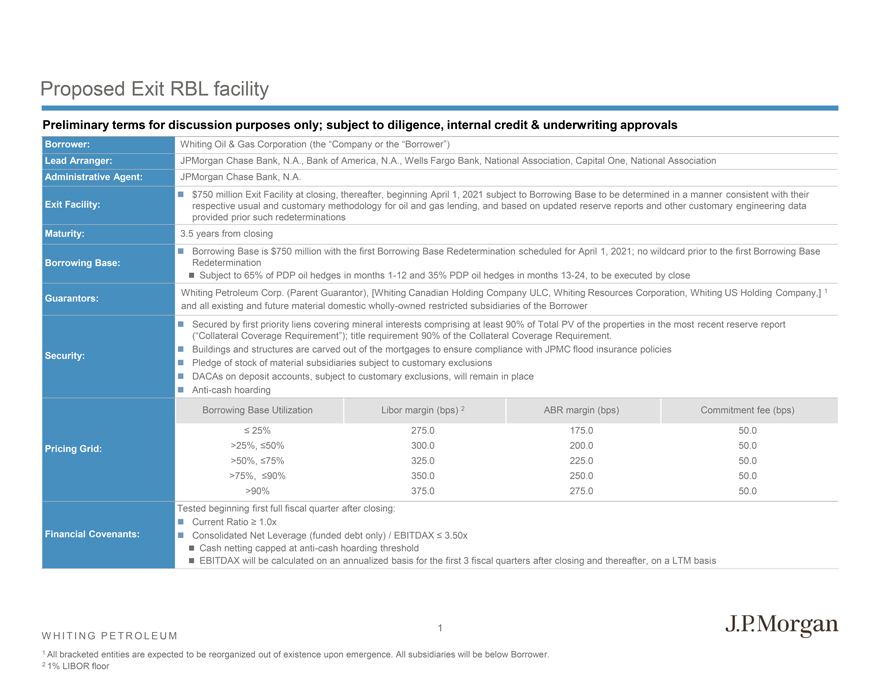
WHITING PETROLEUM Proposed Exit RBL facility Borrower: Whiting Oil & Gas Corporation (the “Company or the “Borrower”)Lead Arranger: JPMorganChase Bank, N.A., Bank of America, N.A., Wells Fargo Bank, National Association, Capital One, National AssociationAdministrative Agent: JPMorgan Chase Bank, N.A.Exit Facility: 750million Exit Facility at closing, thereafter, beginning April 1, 2021 subject to Borrowing Base to be determined in a manner consistent with theirrespective usual and customary methodology for oil and gas lending, and based on updated reserve reports and other customary engineering dataprovided prior such redeterminationsMaturity: 3.5 years from closingB Borrowing Base is $750 million with the first Borrowing Base Redetermination scheduled for April1, 2021; no wildcard prior to the first Borrowing BaseRedetermination Subject to 65% of PDP oil hedges in months 1-12 and 35% PDP oil hedges in months 13-24, to be executed by closeGuarantors: WhitingPetroleum Corp. (Parent Guarantor), [Whiting Canadian Holding Company ULC, Whiting Resources Corporation, Whiting US Holding Company,] 1and all existing and future material domestic wholly-owned restricted subsidiaries of the BorrowerSecurity: Secured by first priority liens covering mineral interests comprising at least 90% of Total PV of the properties in the most recent reserve report(“Collateral Coverage Requirement”); title requirement 90% of the Collateral Coverage Requirement. Anti-cash hoardingPricing Grid: Borrowing Base Utilization Libor margin (bps) 2 ABR margin (bps) Commitment fee (bps) 25% 275.0 175.0 50.0>25%, 50% 300.0 200.0 50.0>50%, 75% 325.0 225.0 50.0>75%, 90% 350.0 250.0 50.0>90% 375.0 275.0 50.0Financial Covenants: Tested beginning first full fiscal quarter after closing: Cash netting capped at anti-cash hoarding threshold J.P.Morgan
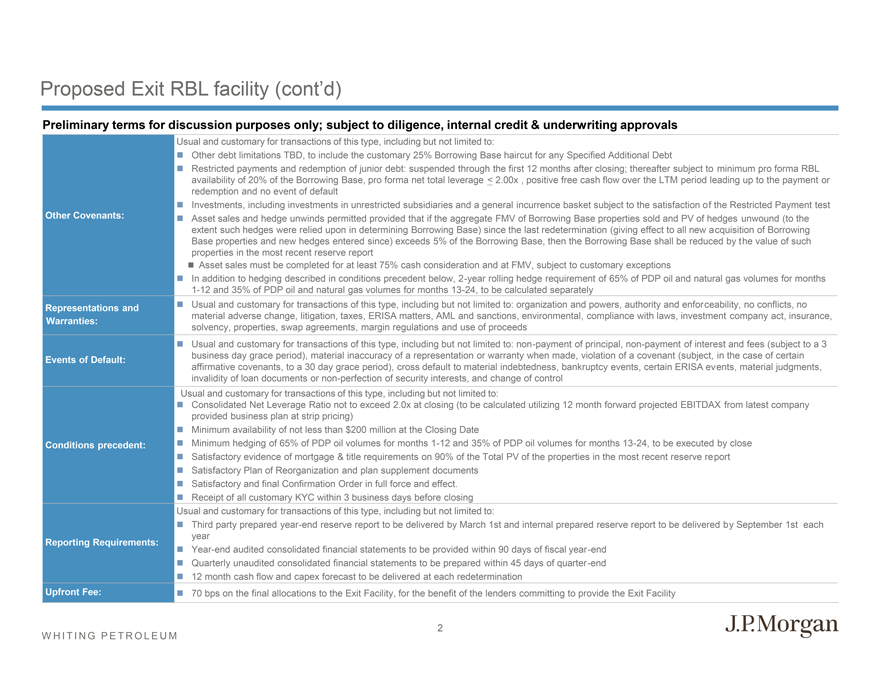
WHITING PETROLEUMOther Covenants: Usual and customary for transactions of this type, including but not limited to: Restricted payments and redemption of junior debt: suspended through the first 12 months after closing; thereafter subject tominimum pro forma RBLavailability of 20% of the Borrowing Base, pro forma net total leverage <2.00x , positive free cash flow over the LTM period leading up to the payment orredemption and no event of default Investments, including investments in unrestricted subsidiaries and a general incurrence basket subject to the satisfaction of the Restricted Payment test Asset sales and hedge unwinds permitted provided that if the aggregate FMV of Borrowing Base properties sold and PV of hedgesunwound (to theextent such hedges were relied upon in determining Borrowing Base) since the last redetermination (giving effect to all new acquisition of BorrowingBase properties and new hedges entered since) exceeds 5% of the Borrowing Base, then the Borrowing Base shall be reduced by the value of suchproperties in the most recent reserve report In addition to hedging described in conditions precedent below, 2-year rolling hedge requirement of 65% of PDP oil and natural gas volumes for months1-12 and 35% of PDP oil and natural gas volumes for months 13-24, to be calculated separately Representations and Warranties: Usual and customary for transactions of this type, including but not limited to: organization and powers, authority and enforceability, no conflicts, nomaterial adverse change, litigation, taxes, ERISA matters, AML and sanctions, environmental, compliance with laws, investmentcompany act, insurance,solvency, properties, swap agreements, margin regulations and use of proceeds Events of Default: Usual and customary for transactions of this type, including but not limited to: non-payment of principal, non-payment of interest and fees (subject to a 3business day grace period), material inaccuracy of a representation or warranty when made, violation of a covenant (subject, in the case of certainaffirmative covenants, to a 30 day grace period), cross default to material indebtedness, bankruptcy events, certain ERISA events, material judgments,invalidity of loan documents or non-perfection of security interests, and change of control Conditions precedent: Usual and customary for transactions of this type, including but not limited to: Consolidated Net Leverage Ratio not to exceed 2.0x at closing (to be calculated utilizing 12 month forward projected EBITDAX from latest companyprovided business plan at strip pricing) Minimum hedging of 65% of PDP oil volumes for months 1-12 and 35% of PDP oil volumes for months 13-24, to be executed by close Usual and customary for transactions of this type, including but not limited to: Third party prepared year-end reserve report to be delivered by March 1st and internal prepared reserve report to be delivered by September 1st eachyear Year-end audited consolidated financial statements to be provided within 90 days of fiscal year-end J.P Morgan


