| Company contact: | John B. Kelso, Director of Investor Relations |
| | 303.837.1661 or john.kelso@whiting.com |
Whiting Petroleum Corporation Announces First Quarter 2009 Financial and Operating Results
Q1 09 Daily Production of 54,320 BOE Up 32% Over Q1 08
Company Announces New 2009 Capital Budget of $420.6 Million and Closing of New Credit Agreement with Increased Borrowing Base Commitments of
$1.042 Billion
DENVER – April 29, 2009 – Whiting Petroleum Corporation (NYSE: WLL) today reported a first quarter 2009 loss of $43.8 million, or $0.92 per basic and diluted share, on total revenues of $163.8 million. This compares to first quarter 2008 net income of $62.3 million, or $1.47 per basic and diluted share, on total revenues of $264.1 million. Whiting’s net loss in the first quarter of 2009 included after-tax, non-cash losses on hedging arrangements of $14.6 million, or $0.31 per share.
Discretionary cash flow in the first quarter of 2009 totaled $71.9 million, compared to the $161.4 million reported for the same period in 2008. A reconciliation of discretionary cash flow to net cash provided by operating activities is included at the end of this news release. The decrease in discretionary cash flow and net income in the first quarter of 2009 versus the comparable 2008 period was primarily the result of a 64% decline in the Company’s wellhead oil price, including the price of natural gas liquids (NGLs), and a 52% decrease in its wellhead natural gas price.
Production in the first quarter of 2009 totaled 4.89 million barrels of oil equivalent (MMBOE), of which 3.57 million barrels were crude oil/NGLs (73%) and 1.32 MMBOE was natural gas (27%). This first quarter 2009 production total equates to a daily average production rate of 54,320 barrels of oil equivalent (BOE), which represents a 32% increase from the 41,120 BOE per day average rate in 2008’s first quarter. Production increases in the first quarter of 2009 compared to the first quarter of 2008 were due to successful drilling results in the prolific Bakken play as well as continued production increases from the Company’s CO2 flood projects at the Postle and North Ward Estes fields.
Crude oil sales volumes in the first quarter of 2009 were affected by winter weather in North Dakota, which caused delays in trucking operations and well completion activity. Despite these weather issues, Whiting increased its average net production from the Sanish field in the first quarter of 2009 to 8,890 BOE per day, up 11% from the 7,980 BOE per day average in the fourth quarter of 2008. The Company’s net production from its interests in the Parshall field during the first quarter of 2009 averaged 5,360 BOE per day, a 27% decline from the 7,320 BOE per day average in the fourth quarter of 2008. The principal operator of the Parshall field elected to defer the completion of 13 wells in the field until spring. Completion of these 13 wells would have likely offset the natural decline of the other producing wells in the Parshall field. This was the primary factor for the 2.2% drop in Whiting’s overall production from 55,540 BOE per day in the fourth quarter of 2008 to 54,320 BOE per day in the first quarter of 2009.
The following table summarizes the Company’s operated and non-operated net production from the Sanish and Parshall fields in the first quarter and in March 2009:
| | Operated and Non-operated Bakken Net Production by Field (In BOE) | |
| | | | | | |
| | | | | | | | | | | | | | | | | | |
| Whiting Operated | | 67,420 | | | | 743,815 | | | | 811,235 | | | | 20,920 | | | | 286,130 | | | | 307,050 | |
| Principal Non-Operator | | 393,935 | | | | -- | | | | 393,935 | | | | 127,575 | | | | -- | | | | 127,575 | |
| Other Non-Operators | | 21,245 | | | | 56,145 | | | | 77,390 | | | | 8,395 | | | | 19,790 | | | | 28,185 | |
| | | 482,600 | | | | 799,960 | | | | 1,282,560 | | | | 156,890 | | | | 305,920 | | | | 462,810 | |
| | | | | | | | | | | | | | | | | | | | | | | | |
| Daily BOE | | 5,360 | | | | 8,890 | | | | 14,250 | | | | 5,060 | | | | 9,870 | | | | 14,930 | |
(1) Crude oil sales volumes in the first quarter of 2009 were affected by winter weather in North Dakota, which caused delays in trucking operations and well completion activity.
At the height of our drilling activity in 2008, we were active with 18 operated drilling rigs and 51 operated workover rigs. In response to lower commodity prices, we have reduced the number of operated drilling rigs to six and the number of operated workover rigs to 35 as of April 20, 2009. We were also participating in the drilling of one non-operated well in the Parshall field. The breakdown of our operated rigs is as follows:
| | | | | | |
| Northern Rockies | | | | | | |
| Sanish Field | | | 4 | | | | 4 | |
| Central Rockies | | | | | | | | |
Hatch Point | | | 1 | | | | 0 | |
Hatfield | | | 0 | | | | 1 | |
CO2 Projects | | | | | | | | |
| Postle | | | 1 | | | | 4 | |
| North Ward Estes | | | 0 | | | | 21 | |
| Permian | | | 0 | | | | 3 | |
| Mid-Continent/Michigan | | | 0 | | | | 1 | |
| Gulf Coast | | | 0 | | | | 1 | |
| Totals | | | 6 | | | | 35 | |
We expect our operated rig count to drop to four or five drilling rigs and approximately 25 workover rigs by June 2009.
Increased Commercial Banking Facility
On April 28, 2009, Whiting entered into a Fourth Amended and Restated Credit Agreement with its bank syndicate arranged by J.P. Morgan Securities Inc. and JPMorgan Chase Bank, N.A. as administrative agent that expires April 28, 2012. The Credit Agreement replaces Whiting’s existing credit agreement and increases the borrowing base from $900 million to $1.1 billion with $1.042 billion of commitments at closing. As of April 27, 2009, $610 million was drawn on the facility and $3 million in letters of credit were outstanding, resulting in $429 million of availability. The new Whiting bank syndicate is comprised of 18 commercial banks, each holding between 1.4% and 12.0% of the total facility. The next regular borrowing base redetermination date is November 1, 2009.
Public Offering of Common Stock
In February 2009, Whiting completed a public offering of common stock at a price of $29.00 per share. The offering, including the exercise of the overallotment option, resulted in the total sale of 8,450,000 shares of Whiting’s common stock. Whiting received net proceeds of approximately $234.9 million, after deducting underwriting fees and offering expenses. Whiting initially used the net proceeds from the offering to repay a portion of the debt outstanding under its credit agreement.
2009 Exploration and Development Budget
Our current 2009 capital budget for exploration and development expenditures is $420.6 million, which we expect to fund with net cash provided by our operating activities and a portion of the proceeds from the common stock offering described above. To the extent net cash provided by operating activities or oil and natural gas prices are lower than currently anticipated, we would adjust our capital budget accordingly. If net cash provided by operating activities is higher than currently anticipated, we plan to reduce debt levels.
| | | 2009 Planned Capital Expenditures | |
| Northern Rockies | | $ | 227.9 | |
| Central Rockies | | $ | 26.0 | |
| Permian Basin | | $ | 13.5 | |
| EOR Projects: | | | | |
North Ward Estes (1) | | $ | 97.7 | |
Postle (1) | | $ | 25.2 | |
Exploration and Early Rig Termination (2) | | $ | 30.3 | |
| Total | | $ | 420.6 | |
(1) 2009 planned capital expenditures at our CO2 projects include $36.9 million for purchased CO2 at North Ward Estes and $15.3 million for Postle CO2 purchases.
(2) Comprised primarily of exploration salaries, $6.2 million of early rig termination fees, lease delay rentals and seismic surveys.
James J. Volker, Whiting’s Chairman, President and CEO, commented, “We are pleased with the closing of our new credit facility, which will provide additional financial flexibility during the remainder of 2009. With our new capital budget of $420.6 million, we believe that we can generate year-over-year production growth of between 8% and 10%. Our objective for 2009 continues to be maintaining our current liquidity by funding our remaining capital expenditures primarily through discretionary cash flow. We believe this can be accomplished by focusing our exploration and development expenditures on our Bakken play in North Dakota and on our CO2 floods at the Postle and North Ward Estes fields. We expect these areas to capture the bulk of our capital expenditures during the remainder of the year. With these key projects and declining completed well and operating costs, I am optimistic about Whiting’s operational results going forward despite the current weakness in oil and gas prices.”
Operations Update
Core Development Areas
● Bakken Play. Whiting’s net production from the Middle Bakken formation in the Sanish and Parshall fields of Mountrail County, North Dakota averaged 14,930 BOE per day in March 2009, up 5% from the 14,165 BOE average daily rate in December 2008 and up 260% from the 4,150 BOE average daily rate in March 2008.
● Sanish Field. Our net production from the Sanish field averaged 9,870 BOE per day in March 2009, a 740% increase from 1,175 BOE per day in March 2008. We recently completed two prolific oil wells in the Sanish field. During a 24-hour test of the Middle Bakken formation on April 12, 2009, the Rigel State 11-16H flowed 3,405 barrels of oil and 2.9 million cubic feet (MMcf) of gas (3,889 BOE) per day. This is the second highest initial flow rate of any Whiting-operated Bakken well. The initial 24-hour production rate was gauged on a 36/64-inch choke with a flowing casing pressure of 981 pounds per square inch (psi). Whiting drilled the Rigel State well in the east-central portion of the Sanish field. Whiting, the operator of the well, holds a 64% working interest and a 52% net revenue interest in the new producer.
Approximately two miles to the northwest, Whiting completed the TTT Ranch 11-6H on April 18, 2009 flowing at an initial daily rate of 2,825 barrels of oil and 1.7 MMcf of gas (3,102 BOE) during a 24-hour test of the Middle Bakken formation. This 24-hour initial production rate was gauged on a 34/64-inch choke with a flowing casing pressure of 900 psi. Whiting is the operator of the well, holding an 85% working interest and a 69% net revenue interest.
Whiting drilled two infill wells in the Sanish Field in 2008, the McNamara 42-26H and Fladeland 12-18H. Results from both infill wells continue to be encouraging. The Fladeland 12-18H, drilled on our primary development plan of two wells per 1,280 acre spacing unit, was completed next to the Abbott 11-18H well to the north and the Maynard Uran 11-24H and Smith 11-20H wells to the south. The results from the Fladeland well continue to show no interference with the existing offset producing wells. The Fladeland well’s initial production rates are also consistent with the production rates of other comparable wells in the area.
From January 1, 2009 through April 20, 2009, Whiting has completed 10 new producers in the Sanish field. As of April 20, four wells were being drilled in the field and four wells were being completed, including Whiting’s second Three Forks test, the Hansen 21-3H. The Company holds interests in a total of 125,557 gross (83,606 net) acres in the Sanish field.
Whiting expects its 17-mile oil line connecting the Sanish field to the Enbridge pipeline in Stanley, North Dakota to be in service in the third quarter of 2009. The 8-inch diameter line will have a daily capacity of approximately 65,000 barrels of oil per day. Enbridge Inc. has announced plans to expand its oil pipeline in Mountrail County, North Dakota to a daily capacity of 161,000 barrels of oil per day from its current capacity of 110,000 barrels per day. This expansion is expected to be completed in the first quarter of 2010.
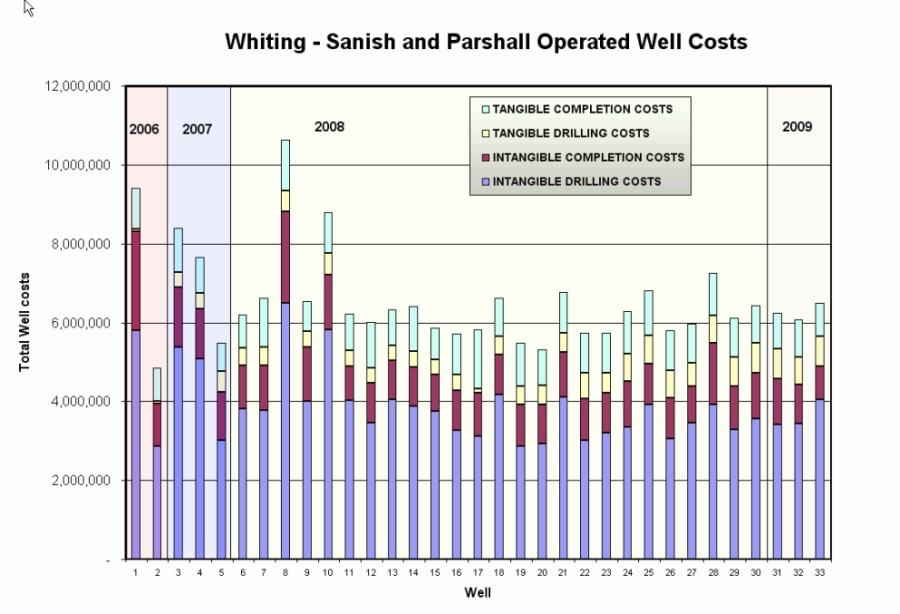
The following chart shows the completed well costs for Whiting-operated Bakken wells in the Sanish and Parshall fields. The reduction in costs are the result of drilling and completion efficiencies which have reduced the average time from spud date to rig release to approximately 41 days from 60 days earlier in our drilling program. The completed well costs for our most recent wells in the Sanish field are expected to range from approximately $5.5 million to $6.0 million per well, which is down from $8 million to $10 million per well when the development project was initiated.
In December 2008, Whiting completed the expansion of its Robinson Lake gas plant to an inlet capacity of 10 MMcf of gas per day from 3 MMcf of gas per day. Three 2,000-hp compressors will be installed at the plant between May and August 2009 in order to bring the plant’s inlet compression to 30 MMcf of gas per day. As of April 20, 2009, net gas and NGL sales had increased to 4.9 MMcf and 1,200 barrels per day, respectively, from approximately 1.0 MMcf of gas per day and approximately 130 barrels of NGLs per day prior to the expansion. Whiting expects net daily sales to reach approximately 20 MMcf of gas and 3,000 barrels of NGLs by mid-2010.
● Parshall Field. Immediately east of the Sanish field is the Parshall field, where we own interests in 73,760 gross (18,315 net) acres. Our net production from the Parshall field averaged 5,060 BOE per day in March 2009, a 70% increase from 2,978 BOE per day in March 2008. As of April 20, 2009, we have participated in 102 Bakken wells in Parshall, the majority of which are operated by EOG Resources, Inc., of which 86 are producing, 15 are awaiting completion operations and one is being drilled.
● Postle Field. The Postle field, located in Texas County, Oklahoma, includes five producing units and one producing lease covering a total of approximately 25,600 gross (24,225 net) acres with working interests of 94% to 100%. Four of the units are currently active CO2 EOR projects. As of April 20, 2009, Whiting was injecting 147 MMcf per day of CO2 in this field. Production from the field has increased 27% from a net 6,200 BOE per day in March 2008 to a net 7,900 BOE per day in March 2009. Operations are under way to expand CO2 injection in the northern part of the fourth unit, HMU, and to optimize flood patterns in the existing CO2 floods, with one drilling rig and four workover rigs in the field as of April 20, 2009. These expansion projects include the restoration of shut-in wells and the drilling of new producing and injection wells.
● North Ward Estes Field. The North Ward Estes field includes six base leases with 100% working interest in 58,000 gross and net acres in Ward and Winkler Counties, Texas. The North Ward Estes field is responding positively to Whiting’s water and CO2 floods, which Whiting initiated in Phase I in May 2007. In early March 2009, the Company began CO2 injection in Phase II. As of April 20, 2009, Whiting was injecting 170 MMcf per day of CO2 in this field. Production from the field has increased 23% from a net 5,200 BOE per day in March 2008 to a net 6,400 BOE per day in March 2009. In this field, Whiting is developing new and reactivated wells for water and CO2 injection and production purposes. Additionally, Whiting plans to install oil, gas and water processing facilities in four phases through 2015, and we estimate that the first three phases will be substantially complete by December 2009.
● Hatch Point Prospect. We have been encouraged with results during drilling operations at our Three Mile 43-18H well on the Hatch Point prospect in San Juan County, Utah in the Paradox Basin. Whiting plans to test a 5,644-foot lateral in the Cane Creek formation at a vertical depth of approximately 7,500 feet. Completion operations are under way. A fracture stimulation of the well is scheduled for the first week of May 2009. The Company owns a 53% working interest and a 44% net revenue interest in the well and holds 41,549 gross (22,438 net) acres in the Hatch Point prospect area.
The following table summarizes the Company’s net production and commodity price realizations for the quarters ended March 31, 2009 and 2008:
| | | Three Months Ended March 31, | | | |
| Production | | | | | | | | |
| Oil and condensate (MMBbls) | | | 3.57 | | | | 2.59 | | | | 38% |
| Natural gas (Bcf) | | | 7.89 | | | | 6.89 | | | | 15% |
| Total equivalent (MMBOE) | | | 4.89 | | | | 3.74 | | | | 31% |
| | | | | | | | | | | | |
| Average Sales Price | | | | | | | | | | | |
| Oil and condensate (per Bbl): | | | | | | | | | | | |
| Price received | | $ | 32.55 | | | $ | 89.58 | | | | (64%) |
Effect of crude oil hedging (1) | | | 4.10 | | | | (8.83 | ) | | | |
| Realized price | | $ | 36.65 | | | $ | 80.75 | | | | (55%) |
| | | | | | | | | | | | |
| Natural gas (per Mcf): | | | | | | | | | | | |
| Price received | | $ | 3.78 | | | $ | 7.89 | | | | (52%) |
Effect of natural gas hedging (1) | | | 0.05 | | | | - | | | | |
| Realized price | | $ | 3.83 | | | $ | 7.89 | | | | (51%) |
(1) Whiting realized pre-tax cash settlement gains on its crude oil and natural gas hedges of $15.0 million during the first quarter of 2009. A summary of Whiting’s outstanding hedges is included later in this news release.
First Quarter 2009 Costs and Margins
A summary of production, cash revenues and cash costs on a per BOE basis is as follows:
| | | Per BOE, Except Production | |
| | | Three Months | |
| | | | |
| | | | | | | |
| Production (MMBOE) | | | 4.89 | | | | 3.74 | |
| | | | | | | | | |
| Sales price, net of hedging | | $ | 32.97 | | | $ | 70.50 | |
| Lease operating expense | | | (12.47 | ) | | | (14.89 | ) |
| Production tax | | | (1.95 | ) | | | (4.73 | ) |
| General & administrative | | | (1.84 | ) | | | (3.10 | ) |
| Exploration | | | (2.58 | ) | | | (2.25 | ) |
| Cash interest expense | | | (2.68 | ) | | | (3.75 | ) |
| Cash income tax expense (benefit) | | | 0.11 | | | | (0.46 | ) |
| | | $ | 11.56 | | | $ | 41.32 | |
During the first quarter, the company-wide basis differential for crude oil compared to NYMEX was $10.66 per barrel, which compared to $11.38 per barrel in the fourth quarter of 2008. We expect our oil price differential to average between $9.00 and $10.50 during the remainder of 2009. Within the Bakken, Whiting-operated production has a current differential of $7.50 per barrel.
The company-wide basis differential for natural gas compared to NYMEX in the first quarter was $1.14 per Mcf, which compared to $2.58 per Mcf in the fourth quarter of 2008. We expect our natural gas price differential to average between $0.75 and $1.25 during the remainder of 2009.
First Quarter 2009 Drilling Summary
Whiting posted a 100% success rate for the 48 gross (22.5 net) wells that it completed in the first quarter of 2009. The table below summarizes Whiting’s drilling activity and exploration and development costs incurred for the three months ended March 31, 2009:
| | Gross/Net Wells Completed | | |
| | | | | | Total New | | % Success | | Cost |
| | | | | | | | | | |
| Q109 | 48 / 22.5 | | 0 / 0 | | 48 / 22.5 | | 100% / 100% | | $ 176.4 |
Outlook for Second Quarter and Full-Year 2009
The following table provides a summary of certain estimates for the second quarter and full-year 2009 based on current forecasts, including Whiting’s full-year 2009 capital budget of $420.6 million (excluding any potential acquisition costs).
Guidance for the second quarter and full-year 2009 is as follows:
| | | Guidance | |
| | | Second Quarter | | Full-Year | |
| | | 2009 | | 2009 | |
| Production (MMBOE) | | 4.80 - 5.00 | | 18.90 - 19.30 | |
| Lease operating expense per BOE | | $ 12.00 - $ 12.40 | | $ 12.00 - $ 12.30 | |
| General and admin. expense per BOE | | $ 1.85 - $ 2.05 | | $ 2.00 - $ 2.20 | |
| Interest expense per BOE | | $ 3.70 - $ 3.90 | | $ 3.70 - $ 3.90 | |
| Depr., depletion and amort. per BOE | | $ 20.40 - $ 20.70 | | $ 20.50 - $ 20.80 | |
| Prod. taxes (% of production revenue) | | 6.4% - 6.8% | | 6.4% - 6.8% | |
| Oil Price Differentials to NYMEX per Bbl | | $ 9.50 - $ 10.50 | | $ 9.50 - $ 10.50 | |
| Gas Price Differentials to NYMEX per Mcf | | $ 0.75 - $ 1.25 | | $ 0.75 - $ 1.25 | |
Oil Hedges
The following summarizes Whiting’s crude oil hedges as of April 1, 2009 and includes Whiting Petroleum Corporation’s 24.2% share of the Whiting USA Trust I hedges:
| | Contracted Volume (Bbls per Month) | | Weighted Average NYMEX Price Collar Range (per Bbl) | | As a Percentage of Forecasted PDP Oil Production |
| | | | | | | |
| 2009 | | | | | | |
| Q2 | | 529,808 | | $55.58 - $67.28 | | 59.7% |
| Q3 | | 507,497 | | $57.54 - $71.07 | | 62.0% |
| Q4 | | 489,190 | | $61.39 - $76.28 | | 63.9% |
| | | | | | | |
| 2010 | | | | | | |
| Q1 | | 440,910 | | $60.66 - $76.30 | | 61.8% |
| Q2 | | 425,643 | | $63.02 - $81.46 | | 62.2% |
| Q3 | | 415,398 | | $60.68 - $78.43 | | 62.9% |
| Q4 | | 400,146 | | $60.69 - $79.67 | | 62.4% |
| | | | | | | |
| 2011 | | | | | | |
| Q1 | | 369,917 | | $60.69 - $81.93 | | 61.3% |
| Q2 | | 369,696 | | $60.68 - $81.90 | | 62.8% |
| Q3 | | 369,479 | | $60.67 - $81.87 | | 64.3% |
| Q4 | | 369,255 | | $60.66 - $81.85 | | 65.5% |
| | | | | | | |
| 2012 | | | | | | |
| Q1 | | 339,054 | | $60.71 - $83.29 | | 63.5% |
| Q2 | | 338,850 | | $60.71 - $83.27 | | 64.7% |
| Q3 | | 338,650 | | $60.70 - $83.23 | | 65.9% |
| Q4 | | 338,477 | | $60.69 - $83.21 | | 66.9% |
| | | | | | | |
| 2013 | | | | | | |
| Q1 | | 290,000 | | $60.40 - $81.66 | | 60.5% |
| Q2 | | 290,000 | | $60.40 - $81.66 | | 62.1% |
| Q3 | | 290,000 | | $60.40 - $81.66 | | 63.1% |
| Oct | | 290,000 | | $60.40 - $81.66 | | 64.3% |
| Nov | | 190,000 | | $59.29 - $78.43 | | 42.2% |
Natural Gas Hedges
The following summarizes Whiting Petroleum Corporation’s 24.2% share of the Whiting USA Trust I natural gas hedges as of April 1, 2009:
| | Contracted Volume (MMBtu per Month) | | Weighted Average NYMEX Price Collar Range (per MMBtu) | | As a Percentage of Forecasted PDP Gas Production |
| | | | | | | |
| 2009 | | | | | | |
| Q2 | | 48,706 | | $6.00 - $14.85 | | 1.9% |
| Q3 | | 46,675 | | $6.00 - $15.60 | | 2.0% |
| Q4 | | 44,874 | | $7.00 - $14.85 | | 2.0% |
| | | | | | | |
| 2010 | | | | | | |
| Q1 | | 43,295 | | $7.00 - $18.65 | | 2.1% |
| Q2 | | 41,835 | | $6.00 - $13.20 | | 2.1% |
| Q3 | | 40,555 | | $6.00 - $14.00 | | 2.2% |
| Q4 | | 39,445 | | $7.00 - $14.20 | | 2.2% |
| | | | | | | |
| 2011 | | | | | | |
| Q1 | | 38,139 | | $7.00 - $17.40 | | 2.2% |
| Q2 | | 36,954 | | $6.00 - $13.05 | | 2.3% |
| Q3 | | 35,855 | | $6.00 - $13.65 | | 2.3% |
| Q4 | | 34,554 | | $7.00 - $14.25 | | 2.3% |
| | | | | | | |
| 2012 | | | | | | |
| Q1 | | 33,381 | | $7.00 - $15.55 | | 2.3% |
| Q2 | | 32,477 | | $6.00 - $13.60 | | 2.4% |
| Q3 | | 31,502 | | $6.00 - $14.45 | | 2.4% |
| Q4 | | 30,640 | | $7.00 - $13.40 | | 2.4% |
Whiting also has the following fixed-price natural gas contracts in place as of April 1, 2009:
| | Natural Gas Volumes in MMBtu per Month | | 2009 Contract Price (1) per MMBtu | | As a Percentage of Forecasted PDP Gas Production |
| Apr. 2009 – May 2011 | | 23,000 | | $ 5.14 | | 1.3% |
| Apr. 2009 – Sep. 2012 | | 67,000 | | $ 4.56 | | 3.9% |
(1) Annual 4% price escalation on fixed-price contracts.
Selected Operating and Financial Statistics
| | | Three Months Ended March 31, | |
| | | | | | | |
| Selected operating statistics | | | | | | |
| Production | | | | | | |
| Oil and condensate, MBbl | | | 3,574 | | | | 2,594 | |
| Natural gas, MMcf | | | 7,890 | | | | 6,890 | |
| Oil equivalents, MBOE | | | 4,889 | | | | 3,742 | |
| Average Prices | | | | | | | | |
| Oil, Bbl (excludes hedging) | | $ | 32.55 | | | $ | 89.58 | |
| Natural gas, Mcf (excludes hedging) | | $ | 3.78 | | | $ | 7.89 | |
| Per BOE Data | | | | | | | | |
| Sales price (including hedging) | | $ | 32.97 | | | $ | 70.50 | |
| Lease operating | | $ | 12.47 | | | $ | 14.89 | |
| Production taxes | | $ | 1.95 | | | $ | 4.73 | |
| Depreciation, depletion and amortization | | $ | 20.46 | | | $ | 13.50 | |
| General and administrative | | $ | 1.84 | | | $ | 3.10 | |
| Selected Financial Data | | | | | | | | |
| (In thousands, except per share data) | | | | | | | | |
| Total revenues and other income | | $ | 163,839 | | | $ | 264,050 | |
| Total costs and expenses | | $ | 233,642 | | | $ | 165,268 | |
| Net income (loss) | | $ | (43,759 | ) | | $ | 62,314 | |
| Net income (loss) per common share, basic and diluted | | $ | (0.92 | ) | | $ | 1.47 | |
| | | | | | | | | |
| Average shares outstanding, basic | | | 47,600 | | | | 42,272 | |
| Average shares outstanding, diluted | | | 47,600 | | | | 42,406 | |
| Net cash provided by operating activities | | $ | 34,247 | | | $ | 122,453 | |
| Net cash used in investing activities | | $ | (221,800 | ) | | $ | (170,501 | ) |
| Net cash provided by financing activities | | $ | 184,942 | | | $ | 40,000 | |
Conference Call
The Company’s management will host a conference call with investors, analysts and other interested parties on Thursday, April 30, 2009 at 11:00 a.m. EDT (10:00 a.m. CDT, 9:00 a.m. MDT) to discuss Whiting’s first quarter 2009 financial and operating results. Please call (866) 271-5140 (U.S./Canada) or (617) 213-8893 (International) and enter the pass code 69011496 to be connected to the call. Access to a live Internet broadcast will be available at www.whiting.com by clicking on the “Investor Relations” box on the menu and then on the link titled “Webcasts.” Slides for the conference call will be available on this website beginning at 11:00 a.m. (EDT) on April 30, 2009.
A telephonic replay will be available beginning approximately two hours after the call on Thursday, April 30, 2009 and continuing through Thursday, May 7, 2009. You may access this replay at (888) 286-8010 (U.S./Canada) or (617) 801-6888 (International) and entering the pass code 47779337. You may also access a web archive at http://www.whiting.com beginning approximately one hour after the conference call.
About Whiting Petroleum Corporation
Whiting Petroleum Corporation, a Delaware corporation, is an independent oil and gas company that acquires, exploits, develops and explores for crude oil, natural gas and natural gas liquids primarily in the Permian Basin, Rocky Mountains, Mid-Continent, Gulf Coast and Michigan regions of the United States. The Company trades publicly under the symbol WLL on the New York Stock Exchange. For further information, please visit www.whiting.com.
Forward-Looking Statements
This news release contains statements that we believe to be “forward-looking statements” within the meaning of the Private Securities Litigation Reform Act of 1995. All statements other than historical facts, including, without limitation, statements regarding our future financial position, business strategy, projected revenues, earnings, costs, capital expenditures and debt levels, and plans and objectives of management for future operations, are forward-looking statements. When used in this news release, words such as we “expect,” “intend,” “plan,” “estimate,” “anticipate,” “believe” or “should” or the negative thereof or variations thereon or similar terminology are generally intended to identify forward-looking statements. Such forward-looking statements are subject to risks and uncertainties that could cause actual results to differ materially from those expressed in, or implied by, such statements.
These risks and uncertainties include, but are not limited to: declines in oil or natural gas prices; impacts of the global recession and financial crisis; our level of success in exploitation, exploration, development and production activities; adverse weather conditions that may negatively impact development or production activities; the timing of our exploration and development expenditures, including our ability to obtain CO2; inaccuracies of our reserve estimates or our assumptions underlying them; revisions to reserve estimates as a result of changes in commodity prices; risks related to our level of indebtedness and periodic redeterminations of Whiting Oil and Gas Corporation’s borrowing base under our credit agreement; our ability to generate sufficient cash flows from operations to meet the internally funded portion of our capital expenditures budget; our ability to obtain external capital to finance exploration and development operations and acquisitions; our ability to identify and complete acquisitions and to successfully integrate acquired businesses; unforeseen underperformance of or liabilities associated with acquired properties; our ability to successfully complete potential asset dispositions; failure of our properties to yield oil or gas in commercially viable quantities; uninsured or underinsured losses resulting from our oil and gas operations; our inability to access oil and gas markets due to market conditions or operational impediments; the impact and costs of compliance with laws and regulations governing our oil and gas operations; our ability to replace our oil and natural gas reserves; any loss of our senior management or technical personnel; competition in the oil and gas industry in the regions in which we operate; risks arising out of our hedging transactions; and other risks described under the caption “Risk Factors” in our Form 10-K for the year ended December 31, 2008. We assume no obligation, and disclaim any duty, to update the forward-looking statements in this news release.
SELECTED FINANCIAL DATA
For further information and discussion on the selected financial data below, please refer to Whiting Petroleum Corporation’s First Quarter Form 10-Q for the three months ended March 31, 2009, to be filed with the Securities and Exchange Commission.
WHITING PETROLEUM CORPORATION
CONSOLIDATED BALANCE SHEETS (Unaudited)
(In thousands)
| | | | | | | |
| | | | | | | |
| ASSETS | | | | | | |
| | | | | | | |
| CURRENT ASSETS: | | | | | | |
| Cash and cash equivalents | | $ | 7,013 | | | $ | 9,624 | |
| Accounts receivable trade, net | | | 94,225 | | | | 123,386 | |
| Derivative assets | | | 44,647 | | | | 46,780 | |
| Deposits on oil field equipment | | | 11,317 | | | | 17,170 | |
| Prepaid expenses and other | | | 17,035 | | | | 20,114 | |
| Total current assets | | | 174,237 | | | | 217,074 | |
| | | | | | | | | |
| PROPERTY AND EQUIPMENT: | | | | | | | | |
| Oil and gas properties, successful efforts method: | | | | | | | | |
| Proved properties | | | 4,604,617 | | | | 4,423,197 | |
| Unproved properties | | | 104,109 | | | | 106,436 | |
| Other property and equipment | | | 106,813 | | | | 91,099 | |
| | | | | | | | | |
| Total property and equipment | | | 4,815,539 | | | | 4,620,732 | |
| | | | | | | | | |
| Less accumulated depreciation, depletion and amortization | | | (984,652 | ) | | | (886,065 | ) |
| | | | | | | | | |
| Total property and equipment, net | | | 3,830,887 | | | | 3,734,667 | |
| | | | | | | | | |
| DEBT ISSUANCE COSTS | | | 9,741 | | | | 10,779 | |
| | | | | | | | | |
| DERIVATIVE ASSETS | | | 39,214 | | | | 38,104 | |
| | | | | | | | | |
| OTHER LONG-TERM ASSETS | | | 26,116 | | | | 28,457 | |
| | | | | | | | | |
| TOTAL | | $ | 4,080,195 | | | $ | 4,029,081 | |
WHITING PETROLEUM CORPORATION
CONSOLIDATED BALANCE SHEETS (Unaudited)
(In thousands, except share and per share data)
| | | | | | | |
| LIABILITIES AND STOCKHOLDERS’ EQUITY | | | | | | |
| | | | | | | |
| CURRENT LIABILITIES: | | | | | | |
| Accounts payable | | $ | 46,752 | | | $ | 64,610 | |
| Accrued capital expenditures | | | 47,592 | | | | 84,960 | |
| Accrued liabilities | | | 47,107 | | | | 45,359 | |
| Accrued interest | | | 19,919 | | | | 9,673 | |
| Oil and gas sales payable | | | 23,045 | | | | 35,106 | |
| Accrued employee compensation and benefits | | | 4,958 | | | | 41,911 | |
| Production taxes payable | | | 14,487 | | | | 20,038 | |
| Deferred gain on sale | | | 14,017 | | | | 14,650 | |
| Derivative liabilities | | | 13,456 | | | | 17,354 | |
| Deferred income taxes | | | 15,835 | | | | 15,395 | |
| Tax sharing liability | | | 2,112 | | | | 2,112 | |
| | | | | | | | | |
| Total current liabilities | | | 249,280 | | | | 351,168 | |
| | | | | | | | | |
| NON-CURRENT LIABILITIES: | | | | | | | | |
| Long-term debt | | | 1,189,556 | | | | 1,239,751 | |
| Deferred income taxes | | | 376,625 | | | | 390,902 | |
| Deferred gain on sale | | | 69,834 | | | | 73,216 | |
| Production Participation Plan liability | | | 66,562 | | | | 66,166 | |
| Asset retirement obligations | | | 59,838 | | | | 47,892 | |
| Tax sharing liability | | | 21,984 | | | | 21,575 | |
| Derivative liabilities | | | 23,884 | | | | 28,131 | |
| Other long-term liabilities | | | 3,411 | | | | 1,489 | |
| | | | | | | | | |
| Total non-current liabilities | | | 1,811,694 | | | | 1,869,122 | |
| | | | | | | | | |
| COMMITMENTS AND CONTINGENCIES | | | | | | | | |
| | | | | | | | | |
| STOCKHOLDERS’ EQUITY: | | | | | | | | |
| Common stock, $0.001 par value; 75,000,000 shares authorized, 51,352,981 and 42,582,100 shares issued as of March 31, 2009 and December 31, 2008, respectively | | | 51 | | | | 43 | |
| Additional paid-in capital | | | 1,206,227 | | | | 971,310 | |
| Accumulated other comprehensive income | | | 36,535 | | | | 17,271 | |
| Retained earnings | | | 776,408 | | | | 820,167 | |
| | | | | | | | | |
| Total stockholders’ equity | | | 2,019,221 | | | | 1,808,791 | |
| | | | | | | | | |
| TOTAL | | $ | 4,080,195 | | | $ | 4,029,081 | |
WHITING PETROLEUM CORPORATION
CONSOLIDATED STATEMENTS OF INCOME (Unaudited)
(In thousands, except per share data)
| | | Three Months Ended March 31, | |
| | | | | | | |
| REVENUES AND OTHER INCOME: | | | | | | |
| Oil and natural gas sales | | $ | 146,175 | | | $ | 286,731 | |
| Gain (loss) on oil and natural gas hedging activities | | | 13,450 | | | | (22,912 | ) |
| Amortization of deferred gain on sale | | | 4,099 | | | | - | |
| Interest income and other | | | 115 | | | | 231 | |
| Total revenues and other income | | | 163,839 | | | | 264,050 | |
| COSTS AND EXPENSES: | | | | | | | | |
| Lease operating | | | 60,954 | | | | 55,706 | |
| Production taxes | | | 9,519 | | | | 17,686 | |
| Depreciation, depletion and amortization | | | 100,034 | | | | 50,511 | |
| Exploration and impairment | | | 17,314 | | | | 10,984 | |
| General and administrative | | | 8,980 | | | | 11,615 | |
| Interest expense | | | 14,680 | | | | 15,546 | |
| Change in Production Participation Plan liability | | | 396 | | | | 6,157 | |
| (Gain) loss on mark-to-market derivatives | | | 21,765 | | | | (2,937 | ) |
| Total costs and expenses | | | 233,642 | | | | 165,268 | |
| INCOME (LOSS) BEFORE INCOME TAXES | | | (69,803 | ) | | | 98,782 | |
| INCOME TAX EXPENSE (BENEFIT): | | | | | | | | |
| Current | | | (539 | ) | | | 1,709 | |
| Deferred | | | (25,505 | ) | | | 34,759 | |
| Total income tax expense (benefit) | | | (26,044 | ) | | | 36,468 | |
| NET INCOME (LOSS) | | $ | (43,759 | ) | | $ | 62,314 | |
| NET INCOME (LOSS) PER COMMON SHARE, BASIC AND DILUTED | | $ | (0.92 | ) | | $ | 1.47 | |
| WEIGHTED AVERAGE SHARES OUTSTANDING, BASIC | | | 47,600 | | | | 42,272 | |
| WEIGHTED AVERAGE SHARES OUTSTANDING, DILUTED | | | 47,600 | | | | 42,406 | |
WHITING PETROLEUM CORPORATION
Reconciliation of Net Cash Provided by Operating Activities to Discretionary Cash Flow
(In thousands)
| | | Three Months Ended | |
| | | | |
| | | | | | | |
| Net cash provided by operating activities | | $ | 34,247 | | | $ | 122,453 | |
| Exploration | | | 12,633 | | | | 8,412 | |
| Changes in working capital | | | 25,016 | | | | 30,567 | |
Discretionary cash flow (1) | | $ | 71,896 | | | $ | 161,432 | |
(1) Discretionary cash flow is computed as net income plus exploration and impairment costs, depreciation, depletion and amortization, deferred income taxes, non-cash interest costs, non-cash compensation plan charges, gain/loss on mark-to-market derivatives and other non-current items less the gain on sale of properties and amortization of deferred gain on sale. The non-GAAP measure of discretionary cash flow is presented because management believes it provides useful information to investors for analysis of the Company’s ability to internally fund acquisitions, exploration and development. Discretionary cash flow should not be considered in isolation or as a substitute for net income, income from operations, net cash provided by operating activities or other income, cash flow or liquidity measures under GAAP and may not be comparable to other similarly titled measures of other companies.