UNITED STATES
SECURITIES AND EXCHANGE COMMISSION
Washington, D.C. 20549
FORM N-CSR
CERTIFIED SHAREHOLDER REPORT OF REGISTERED
MANAGEMENT INVESTMENT COMPANIES
| | |
| Investment Company Act file number | | 811-21407 |
Nuveen Diversified Dividend and Income Fund
(Exact name of registrant as specified in charter)
Nuveen Investments
333 West Wacker Drive, Chicago, IL 60606
(Address of principal executive offices) (Zip code)
Gifford R. Zimmerman
Nuveen Investments
333 West Wacker Drive, Chicago, IL 60606
(Name and address of agent for service)
Registrant’s telephone number, including area code: (312) 917-7700
Date of fiscal year end: December 31
Date of reporting period: June 30, 2019
Form N-CSR is to be used by management investment companies to file reports with the Commission not later than 10 days after the transmission to stockholders of any report that is required to be transmitted to stockholders under Rule 30e-1 under the Investment Company Act of 1940 (17 CFR 270.30e-1). The Commission may use the information provided on Form N-CSR in its regulatory, disclosure review, inspection, and policy making roles.
A registrant is required to disclose the information specified by Form N-CSR, and the Commission will make this information public. A registrant is not required to respond to the collection of information contained in Form N-CSR unless the Form displays a currently valid Office of Management and Budget (“OMB”) control number. Please direct comments concerning the accuracy of the information collection burden estimate and any suggestions for reducing the burden to Secretary, Securities and Exchange Commission, 450 Fifth Street, NW, Washington, DC 20549-0609. The OMB has reviewed this collection of information under the clearance requirements of 44 U.S.C. ss.3507.
ITEM 1. REPORTS TO STOCKHOLDERS.

Closed-End Funds
30 June 2019
Nuveen Closed-End Funds
| | |
| JDD | | Nuveen Diversified Dividend and Income Fund |
Beginning on January 1, 2021, as permitted by regulations adopted by the Securities and Exchange Commission, paper copies of the Fund’s annual and semi-annual shareholder reports will no longer be sent by mail, unless you specifically request paper copies of the reports. Instead, the reports will be made available on the Fund’s website (www.nuveen.com), and you will be notified by mail each time a report is posted and provided with a website link to access the report.
If you have already elected to receive shareholder reports electronically, you will not be affected by this change and you need not take any action. You may elect to receive shareholder reports and other communications from the Fund electronically anytime by contacting the financial intermediary (such as a broker-dealer or bank) through which you hold your Fund shares or, if you are a direct investor, by enrolling at www.nuveen.com/e-reports.
You may elect to receive all future shareholder reports in paper free of charge at any time by contacting your financial intermediary or, if you are a direct investor, (i) by calling 800-257-8787 and selecting option #2 or (ii) by logging into your Investor Center account at www.computershare.com/investor and clicking on “Communication Preferences.” Your election to receive reports in paper will apply to all funds held in your account with your financial intermediary or, if you are a direct investor, to all your directly held Nuveen Funds and any other directly held funds within the same group of related investment companies.
Semiannual Report
Life is Complex.
Nuveen makes things e-simple.
It only takes a minute to sign up for e-Reports. Once enrolled, you’ll receive an e-mail as soon as your Nuveen Fund information is ready—no more waiting for delivery by regular mail. Just click on the link within the e-mail to see the report and save it on your computer if you wish.
Free e-Reports right to your e-mail!
www.investordelivery.com
If you receive your Nuveen Fund dividends and statements from your financial advisor or brokerage account.
or
www.nuveen.com/client-access
If you receive your Nuveen Fund dividends and statements directly from Nuveen.
NOT FDIC INSURED MAY LOSE VALUE NO BANK GUARANTEE
Table of Contents
3
Chairman’s Letter to Shareholders

Dear Shareholders,
The worries weighing on markets at the end of 2018 appeared to dissipate in early 2019 as positive economic and corporate earnings news, more dovish signals from central banks and trade progress boosted investor confidence. However, political noise and trade disputes continue to drive short-term market volatility and weigh on longer-term outlooks. Investors are concerned that increased tariffs and a protracted stalemate between the U.S. and its trading partners could dampen business and consumer sentiment, weakening spending and potentially impacting the global economy. Acknowledging similar concerns, the U.S. Federal Reserve recently lowered its benchmark interest rate 0.25% for the first time in a decade and will stop reducing its bond portfolio sooner than planned to help stimulate the U.S. economy. As the current U.S. economic expansion has reached the10-year mark this summer, it’s important to note that economic expansions don’t die of old age, but mature economic cycles can be more vulnerable to an exogenous shock.
Until a clearer picture on trade emerges, more bouts of market turbulence are likely in the meantime. While the downside risks warrant careful monitoring, we believe the likelihood of a near-term recession remains low. Global economic growth is moderating but still expanding, with demand driven by the historically low unemployment in the U.S., Japan and across Europe. Some central banks have begun to adjust monetary policy to help sustain growth and others continue to emphasize their readiness to act, while China’s authorities remain committed to keeping economic growth rates steady with fiscal and monetary policy.
The opportunity set may be narrower, but we believe there is still scope for gains in this environment. Patience and maintaining perspective can help you weather periodic market volatility. We encourage you to work with your financial advisor to assess short-term market movements in the context of your time horizon, risk tolerance and investment goals. On behalf of the other members of the Nuveen Fund Board, we look forward to continuing to earn your trust in the months and years ahead.
Sincerely,

Terence J. Toth
Chairman of the Board
August 23, 2019
4
Portfolio Managers’ Comments
Nuveen Diversified Dividend and Income Fund (JDD)
JDD invests approximately equal proportions of its managed assets across four complementary strategies, each managed by a separate, specializedsub-adviser.
NWQ Investment Management Company, LLC (NWQ), an affiliate of Nuveen, LLC (Nuveen) is thesub-adviser for the global equity income strategy portion of the Fund consisting of a portfolio focused on income producing and dividend paying equity securities. James T. Stephenson, CFA, and Thomas J. Ray, CFA serve as the Fund’s portfolio management team.
The real estate securities strategy portion of the Fund consisting of a portfolio focused on dividend-paying common Real Estate Investment Trusts (REITs) is managed by a team at Security Capital Research & Management Incorporated, (Security Capital), a wholly-owned subsidiary of JPMorgan Chase & Co. Anthony R. Manno Jr., Kenneth D. Statz and Kevin W. Bedell lead the management team. On September 3, 2019 (subsequent to the close of the reporting period), Nathan J. Gear, CFA, will be added as a portfolio manager.
Symphony Asset Management, LLC (Symphony), an affiliate of Nuveen, is thesub-adviser for the adjustable rate senior loan strategy portion of the Fund consisting of a portfolio focused on senior loans. The Symphony management team for the Fund is led by Scott Caraher. On May 23, 2019, Jenny Rhee was added as a portfolio manager to the Nuveen Diversified Dividend and Income Fund.
Wellington Management Company LLP (Wellington Management) is thesub-adviser for the emerging market debt strategy portion of the Fund consisting of a portfolio focused on emerging market sovereign debt. James W. Valone, CFA, heads the management team. On July 1, 2019 (subsequent to the close of the reporting period), Kevin Murphy was added as a portfolio manager.
Here representatives from NWQ, Security Capital, Symphony and Wellington Management review their management strategies and the performance of the Fund for thesix-month reporting period ended June 30, 2019.
What were the key strategies used to manage the Fund during thissix-month reporting period ended June 30, 2019?
The Fund’s investment objectives are high current income and total return, while utilizing equity and debt strategies focused on providing current income, total return potential and reducing U.S. interest rate sensitivity. In its efforts to achieve these objectives, the Fund is managed by specialists in severalnon-traditional asset classes and invests primarily
This material is not intended to be a recommendation or investment advice, does not constitute a solicitation to buy, sell or hold a security or an investment strategy and is not provided in a fiduciary capacity. The information provided does not take into account the specific objectives or circumstances of any particular investor, or suggest any specific course of action. Investment decisions should be made based on an investor’s objectives and circumstances and in consultation with his or her advisors.
Certain statements in this report are forward-looking statements. Discussions of specific investments are for illustration only and are not intended as recommendations of individual investments. The forward-looking statements and other views expressed herein are those of the portfolio managers as of the date of this report. Actual future results or occurrences may differ significantly from those anticipated in any forward-looking statements and the views expressed herein are subject to change at any time, due to numerous market and other factors. The Fund disclaims any obligation to update publicly or revise any forward-looking statements or views expressed herein.
For financial reporting purposes, the ratings disclosed are the highest rating given by one of the following national rating agencies: Standard & Poor’s (S&P), Moody’s Investors Service, Inc. (Moody’s) or Fitch, Inc. (Fitch). This treatment of split-rated securities may differ from that used for other purposes, such as for Fund investment policies. Credit ratings are subject to change. AAA, AA, A and BBB are investment grade ratings; BB, B, CCC, CC, C and D are below investment grade ratings. Holdings designated N/R are not rated by these national rating agencies.
Refer to the Glossary of Terms Used in this Report for further definition of the terms used within this section.
5
Portfolio Managers’ Comments(continued)
in 1) U.S. and foreign dividend paying common stocks, 2) dividend paying common stocks issued by real estate companies, 3) emerging markets sovereign debt, and 4) senior secured loans. The Fund expects to invest at least 40%, but no more than 70%, of its assets in equity security holdings and at least 30%, but no more than 60%, of its assets in debt security holdings. Under normal circumstances, the Fund’s target weighting is approximately 50% equity and 50% debt.
For the dividend paying equity portion of the Fund’s portfolio, NWQ continued to focus on obtaining an attractive total return with a dividend yield at least 100 bps above the MSCI World Index. NWQ employs a value based approach from their bottom up analysis. They look for attractive absolute valuation, positive risk/reward with downside risk management characteristics and catalysts that can drive a positive revaluation of companies. They believe improved capital allocation policies and the return of capital to shareholders can be a positive catalyst in two significant ways. Higher dividends add to the total return of a company and the discipline shown in rewarding shareholders can lead to a higher valuation. NWQ has seen many companies significantly increase their shareholder remuneration through share repurchases and higher dividends.
In managing the real estate portion of the Fund’s portfolio, Security Capital seeks to maintain property type and geographic diversification in selecting common equity securities, while taking into account important company-specific influences, including, cash flow generating potential, property location quality, balance sheet flexibility and the management team to name only a few. Investment decisions are based on a multi-layered analysis of the company, the real estate it owns, its management and the relative price of the security, with a focus on securities that Security Capital believes will be best positioned to generate sustainable net income and potential price appreciation over thelong-run. Throughout the latter half of 2018, the portfolio continued to consolidate a number of equity positions as a result of its focus on delivering a high conviction, diversified portfolio of securities. As of June 30, 2019, the portfolio allocations were 98.7% common stocks and 1.3% cash equivalents.
In the senior loan and other debt portion of the Fund’s portfolio, Symphony continued to manage and monitor senior loan market risks. The overall macroeconomic backdrop during the reporting period remained supportive of the leveraged loan (loan) asset class. The Fund’s capital remained invested in issuers with strong credit profiles among noninvestment grade debt while offering attractive current income and yield. Fundamentally, Symphony feels that many of these companies have stable businesses, good asset coverage for senior debt holders and could perform well in a stable to slow growth environment.
The emerging market debt portion of the Fund, which is managed by Wellington Management, invests in a diversified portfolio of emerging markets fixed income instruments through the combination of comprehensivetop-down quantitative and macroeconomic analysis and detailedbottom-up sovereign credit research.
How did the Fund perform during thissix-month reporting period ended June 30, 2019?
The table in the Performance Overview and Holding Summaries section of this report provides total returns for thesix-month,one-year, five-year andten-year periods ended June 30, 2019. The Fund’s total returns on net asset value (NAV) are compared with the performance of a corresponding market index. For thesix-month reporting period ended June 30, 2019, JDD underperformed the S&P 500®, but outperformed its comparative Blended Index.
NWQ
The dividend paying equity portion of the Fund’s portfolio, managed by NWQ, contributed to the Fund’s performance versus its blended benchmark, but underperformed it corresponding market index. Positive stock selection in the communications services, information technology and utilities sectors contributed to the Fund’s performance. This was offset by weakness in the financials, consumer staples and industrials sectors.
Geographically, performance benefited from stock selection in the United States. Investments in Europe, the Middle East and the Pacificex-Japan lagged and were a headwind for the Fund’s relative return for the reporting period.
6
Individual holdings that positively contributed to performance included financial sector holding, Citigroup Inc. The financial services sector saw a sharp rebound after thesell-off at the end of 2018. Also contributing to performance was technology sector holding, Cypress Semiconductor Corp, which saw strong price appreciation following the announcement of Infineon’s acquisition of the chipmaker in anall-cash deal. Lastly, Nintendo Co. Ltd. positively contributed to performance as optimism over Nintendo Switch hardware sales rose. Nintendo announced a partnership with Tencent to begin distributing the Nintendo Switch in China at a future date and the company forecasted hardware unit sales of 18 million in Fiscal 2020, an increase of 1 million units year-over-year.
Several individual holdings detracted from portfolio performance, particularly our financial sector holdings. Unicaja Banco SA was the leading detractor in the Fund’s portfolio. Unicaja detracted from performance following the announcement that the company had abandoned its plans to merge with Liberbank. Additionally the potential for European Central Bank (ECB) rate cuts and the effect on net interest income pushed shares lower. We continue to hold Unicaja. Challenger Ltd/Australia also detracted from performance coming off a weak fourth quarter 2018 in which the company lowered earnings expectations due to lower volume growth, lower yield on its investment portfolio and regulatory uncertainty regarding annuities. Lastly, Imperial Brands PLC underperformed due to investor concerns regarding the evolution of the tobacco industry, increased regulation and scrutiny in the U.S. and a slowdown in performance of its reduced nicotine risk product, myblu. Challenger Ltd/Australia and Imperial Brands were both eliminated from the Fund during the reporting period.
Security Capital
The real estate portion of the Fund managed by Security Capital contributed to the Fund’s performance, outperforming the blended benchmark but underperforming its corresponding market index. Within the Fund’s common equity holdings, there were distinctive differences by property type with the underlying themes and influences reflecting company-specific factors, earlier period performance differentials and, importantly, shifting investor expectations colored by macro-economic trends.
In this context, leading performance contributors by major property type were the office and industrial companies. Underperformance from the office companies was broad based but more centered on the New York-Washington corridor where owners faced significant pressure on new net lease economics due to competition from new construction and significant capital costs required to introduce amenities that will appeal to tenants who are focused on attracting and retaining millennial talent. The Fund benefited from a strong bias toward west coast office exposure versus east coast/New York City office in this segment. For the industrial segment, both the traditional warehouse companies and the data center companies generated strong performance. Traditional warehouse companies continued to see robust user demand, the result of a strong economy and the logistics demands of serving the booming online economy. While warehouse supply pipelines were active and a continued focus of wary investors, industrial markets remained generally balanced particularly with the shift to more infill locations closer to urban centers. The data center companies continued to be volatile quarter to quarter as investors responded to strong demand but also a capital intensive growth profile and active supply pipelines. The top three securities in the portfolio that had the biggest positive impact on the portfolio performance were an underweighted position in Simon Property Group, Inc. and overweight positions in Cyrus One Inc. and CoreSite Realty Corp. The Fund no longer holds its position in Cyrus One.
During the reporting period, the Fund’s relative performance versus the Wilshire U.S. Real Estate Securities Index portion of the Blended Index was constrained by common equity investments in self-storage, regional malls and hotel companies. Self-storage companies continue to exhibit steady property operations, though investors have been wary of moderating net operating income (NOI) growth rates and the corrosive impact on operations of elevated new construction levels. However, with healthy user demand, low capital expenditure requirements and limited obsolescence risk, equity pricing for the self-storage companies has been more insulated from many of the concerns weighing on other property segments. For the mall companies, investors have been highly cautious regarding the shifting retailing landscape in the context of
7
Portfolio Managers’ Comments(continued)
accelerating online sales and the associated shifts in strategy by retailers, including store closures and bankruptcies. In addition, gaining control and repurposing of department stores is a significant and unique challenge for mall companies. Finally, hotel companies have been volatilequarter-to-quarter and align well with a strong economy. However, investors appear focused on a number of corrosive factors notably elevated levels of new hotel construction, wage and property tax pressures weighing on operating margins and the inability to acquire assets on accretive economics. The bottom three performing companies in the portfolio for the reporting period were Taubman Centers Inc, Macerich Co and Senior Housing Properties Trust, all of which we continue to hold in the Fund.
Symphony
The senior loan sleeve managed by Symphony was positive on a total return basis during the reporting period, which was beneficial to Fund performance, returning 5.6% versus 5.4% for the corresponding market index but underperformed the Blended Index.
The senior loan portion of the Fund is invested predominantly in first-lien, senior secured corporate loans. Symphony prefers to focus on issuers that have strong asset coverage, defensible businesses and generally larger loan facilities. Throughout the reporting period, Symphony generally believed that these larger loan facilities offered better risk/return dynamics following a liquidity drivensell-off late in 2018.
Despite consistent outflows from retail investors throughout the reporting period, loans performed well in the first half of 2019. While outflows from retail investors have occurred amid a more benign rate environment, institutional demand for loans has remained strong. Further, while concerns have escalated regarding a slowdown in global growth, loan credit fundamentals remain largely intact and new issue supply has been quite manageable. However, it is worth noting that higher quality assets have generally outperformed while lower quality assets, such as those rated CCC, have lagged the market. This was particularly evident during June 2019. This is characteristic of a market in which risk aversion has remained somewhat elevated and where managers prefer to focus on performing assets with strong balance sheets and access to capital.
The Fund benefited from exposure to larger, more liquid positions and better quality assets which outperformed the overall market during the reporting period. Much of this was driven by deeper discounts of these assets at the beginning of the reporting period following thesell-off in the market in late 2018. Thesell-off late in 2018 can be characterized as putting acute pressure on larger positions and better quality assets within the market as mutual funds faced redemptions and were forced sellers of these loans to fund redemptions.
Sectors benefiting performance included information technology, as well as consumer durables and media/telecom. Thematically, many outperformers during the reporting period were larger, better quality assets thatsold-off in the fourth quarter of 2018 and led the market rally during the reporting period. These include the American Airlines, Inc. Term Loan, Burger King Corporation, as well as restaurant food supplier US Foods, Inc.
Detracting from performance was security selection within the financials sector. In particular, the loan of mortgage service company, Walter Investment Management Corporation detracted from performance. The distressed issuer has most recently been in the process of looking for buyers for the company. We continue to hold Walter Investment Management Corporation in the Fund.
Wellington Management
The emerging market debt portion of the Fund managed by Wellington contributed to performance.
In the emerging market debt portion, Wellington favored issuers in Eastern Europe and the Middle East over Asia and Latin America. In terms of external sovereign debt, Wellington favored Eastern European and former Soviet countries with strong fiscal performance aiding fundamentals such as Bulgaria, Azerbaijan and Croatia. We also favored select frontier markets with International Monetary Fund (IMF) and strong reform stories. Gulf Cooperation Council (GCC)
8
countries with reform momentum and attractive valuations relative to credit quality, specifically Saudi Arabia and Qatar, were also favored. In contrast, Wellington was underweight investment grade countries in Latin America where valuations are tight, including Panama, Chile and Peru. Wellington also maintained underweights to Asian countries where valuations were tight, including Malaysia and the Philippines.
Wellington kept relatively low exposure to local markets and corporate debt throughout the reporting period. Local markets debt exposure was primarily via currency where Wellington favored a moderate allocation to currency across a basket of countries including Brazil, Russia and Indonesia. Corporate exposure was more attractive as fundamentals remained healthy.Bottom-up pockets of opportunity in Brazil and China offered attractive value relative to sovereign debt with a more resilient credit profile.
The portfolio modestly underperformed the JPMorgan Emerging Markets Bond Index portion of the Blended Index over the first half of 2019. Developed markets duration positioning drove relative underperformance, with our underweight to credit spread duration also detracting. In contrast, country allocation contributed to performance, with security selection, currency positioning, and local rates positioning also having a positive impact.
During the reporting period, at the country level, overweight country allocations to the United Arab Emirate early in the reporting period, Qatar and Turkey, as well as an underweight to Costa Rica detracted from performance. Negative security selection, specifically an underweight exposure to short- and selectmid-dated external sovereign debt in Ecuador, also proved unfavorable. In contrast, at the country level, anout-of-benchmark allocation to Greece, an overweight to Egypt and an underweight to Lebanon contributed to performance. A lack of exposure to external debt in the Philippines also proved favorable. Finally, an allocation to local rates, an underweight exposure to external sovereign debt and favoring external quasi-sovereign debt as well as external corporate debt in Brazil, had a positive impact on performance.
Additionally, the Fund continued to utilize forward foreign currency contracts to reduce the currency risk of select local currency denominated emerging market bonds, as well as actively manage certain currency exposures in an attempt to benefit from potential appreciation. In aggregate, these contracts had a negligible impact on overall performance during the reporting period.
The Fund also used futures on U.S. and German interest rates as part of an overall portfolio construction strategy to reduce interest rate sensitivity and manage yield curve exposure. These positions had a negligible impact on performance during the reporting period.
9
Fund Leverage
IMPACT OF THE FUND’S LEVERAGE STRATEGY ON PERFORMANCE
One important factor impacting the returns of the Fund’s common shares relative to its comparative benchmark was the Fund’s use of leverage through bank borrowings. The Fund uses leverage because our research has shown that, over time, leveraging provides opportunities for additional income and total return, particularly in the recent market environment where short-term market rates are at or near historical lows, meaning that the short-term rates the Fund has been paying on its leveraging instruments in recent years have been much lower than the interest the Fund has been earning on its portfolio securities that it has bought with the proceeds of that leverage.
However, use of leverage can expose Fund common shares to additional price volatility. When the Fund uses leverage, the Fund common shares will experience a greater increase in their net asset value if the securities acquired through the use of leverage increase in value, but will also experience a correspondingly larger decline in their net asset value if the securities acquired through leverage decline in value, which will make the shares’ net asset value more volatile, and total return performance more variable, over time.
In addition, common share income in levered funds will typically decrease in comparison to unlevered funds when short-term interest rates increase and increase when short-term interest rates decrease. Over the last few quarters, short-term interest rates have indeed increased from their extended lows after the 2007-09 financial crisis. This increase has reduced common share net income, and also reduced potential for long-term total returns. Nevertheless, the ability to effectively borrow at current short-term rates is still resulting in enhanced common share income, and management believes that the advantages of continuation of leverage outweigh the associated increase in risk and volatility described above.
The Fund’s use of leverage had a positive impact on total return performance during this reporting period.
The Fund also continued to utilize forward starting interest rate swap contracts to partially hedge its future interest cost of leverage, which as mentioned previously, is through the use of bank borrowings. The swap contracts impact on total return performance was negative during this reporting period.
As of June 30, 2019, the Fund’s percentages of leverage are as shown in the accompanying table.
| | | | |
| | | JDD | |
Effective Leverage* | | | 30.15 | % |
Regulatory Leverage* | | | 30.15 | % |
| * | Effective leverage is the Fund’s effective economic leverage, and includes both regulatory leverage and the leverage effects of certain derivative and other investments in the Fund’s portfolio that increase the Fund’s investment exposure. Regulatory leverage consists of preferred shares issued or borrowings of the Fund. Both of these are part of the Fund’s capital structure. The Fund, however, may from time to time, borrow on a typically transient basis in connection with its day-to-day operations, primarily in connection with the need to settle portfolio trades. Such incidental borrowings are excluded from the calculation of the Fund’s effective leverage ratio. Regulatory leverage is subject to asset coverage limits set forth in the Investment Company Act of 1940. |
THE FUND’S REGULATORY LEVERAGE
Bank Borrowings
As noted above, the Fund employs leverage through the use of bank borrowings. The Fund’s bank borrowing activities are as shown in the accompanying table.
| | | | | | | | | | | | | | | | | | | | | | | | | | | | | | | | | | |
| Current Reporting Period | | | | | | Subsequent to the Close
of the Reporting Period | |
| January 1, 2019 | | | Draws | | | Paydowns | | | June 30, 2019 | | | Average Balance
Outstanding | | | | | | Draws | | | Paydowns | | | August 27, 2019 | |
| | $97,900,000 | | | | $ — | | | | $ — | | | | $97,900,000 | | | | $97,900,000 | | | | | | | | $ — | | | | $ — | | | | $97,900,000 | |
Refer to Notes to Financial Statements, Note 9 – Borrowing Arrangements for further details.
Common Share Information
DISTRIBUTION INFORMATION
The following information regarding the Fund’s distributions is current as of May 31, 2019, the date of the distribution data included within the Fund’s most recent distribution notice at the time this report was prepared. The Fund’s distribution levels may vary over time based on the Fund’s investment activities and portfolio investment value changes.
The Fund has adopted a managed distribution program. The goal of the Fund’s managed distribution program is to provide shareholders relatively consistent and predictable cash flow by systematically converting its expected long-term return potential into regular distributions. As a result, regular distributions throughout the year will likely include a portion of expected long-term and/or short-term gains (both realized and unrealized), along with net investment income.
Important points to understand about Nuveen fund managed distributions are:
| • | | The Fund seeks to establish a relatively stable common share distribution rate that roughly corresponds to the projected total return from its investment strategy over an extended period of time. However, you should not draw any conclusions about the Fund’s past or future investment performance from its current distribution rate. |
| • | | Actual common share returns will differ from projected long-term returns (and therefore the Fund’s distribution rate), at least over shorter time periods. Over a specific timeframe, the difference between actual returns and total distributions will be reflected in an increasing (returns exceed distributions) or a decreasing (distributions exceed returns) Fund net asset value. |
| • | | Each period’s distributions are expected to be paid from some or all of the following sources: |
| | • | | net investment income consisting of regular interest and dividends, |
| | • | | net realized gains from portfolio investments, and |
| | • | | unrealized gains, or, in certain cases, a return of principal (non-taxable distributions). |
| • | | A non-taxable distribution is a payment of a portion of the Fund’s capital. When the Fund’s returns exceed distributions, it may represent portfolio gains generated, but not realized as a taxable capital gain. In periods when the Fund’s returns fall short of distributions, it will represent a portion of your original principal unless the shortfall is offset during other time periods over the life of your investment (previous or subsequent) when the Fund’s total return exceeds distributions. |
| • | | Because distribution source estimates are updated throughout the current fiscal year based on the Fund’s performance, these estimates may differ from both the tax information reported to you in the Fund’s 1099 statement, as well as the ultimate economic sources of distributions over the life of your investment. |
The following table provides information regarding the Fund’s distributions and total return performance over various time periods. This information is intended to help you better understand whether the Fund’s returns for the specified time periods were sufficient to meet its distributions.
Data as of May 31, 2019
| | | | | | | | | | | | | | | | | | | | | | | | | | | | | | | | | | | | | | | | |
| | | Per Share
Distributions | | | | | | | | | | | | | | | Annualized Total Return
on NAV | | | | |
| Inception Date | | Quarterly | | | Monthly Equivalent | | | Monthly Net Investment Income¹ | | | YTD Net Realized Gain/Loss² | | | Inception Unrealized Gain/Loss² | | | Current Distribution Rate on NAV³ | | | 1-Year | | | 5-Year | | | YTD | | | YTD Distribution Rate on NAV4 | |
9/2003 | | | $0.2175 | | | | $0.0725 | | | | $0.0425 | | | | $(0.6856) | | | | $0.9591 | | | | 7.71% | | | | 1.69% | | | | 4.78% | | | | 11.37% | | | | 3.86% | |
| 1 | NII is net investment income, which is expressed as a monthly amount using a six-month average. Approximately 25% of JDD, net income represents net REIT cash flow which may consist of income, capital gains, and/or a return of capital. |
| 2 | These are approximations. Actual amounts may be more or less than amounts listed above. |
| 3 | Current distribution, annualized, expressed over the most recent month-end NAV. |
| 4 | Sum of year-to-date distributions expressed over the most recent month-end NAV. |
11
Common Share Information(continued)
The following table provides estimates of the Fund’s distribution sources, reflecting year-to-date cumulative experience through the latest month-end. These estimates are for informational purposes only. The Fund attributes these estimates equally to each regular distribution throughout the year. Consequently, the estimated information shown below is for the current distribution, and also represents an updated estimate for all prior months in the year.
The amounts and sources of distributions reported in this notice are only estimates and are not being provided for tax reporting purposes. The actual amounts and character of the distributions for tax reporting purposes will be reported to shareholders on Form 1099-DIV which will be sent to shareholders shortly after calendar year-end. More details about the Fund’s distributions and the basis for these estimates are available on www.nuveen.com/cef.
Data as of May 31, 20191
| | | | | | | | | | | | | | | | | | | | | | | | | | | | | | |
| | | | Current Quarter | | | Calendar YTD | |
| | | | Estimated Source of Distribution | | | Estimated Per Share Amounts | |
Per Share Distribution | | | Net Investment Income² | | | Realized Gains | | | Return of Capital³ | | | Distributions4 | | | Net Investment Income² | | | Realized Gains | | | Return of Capital³ | |
| | $0.2175 | | | | 54.4% | | | | 0.0% | | | | 45.6% | | | | $0.4350 | | | | $0.2368 | | | | $ — | | | | $0.1982 | |
| 1 | The Fund owns REIT securities which attribute their distributions to various sources, including net investment income, realized gains and return of capital. The estimates above are based on prior year attributions percentages, which can be expected to differ, at least slightly, from the actual final attributions for the current year. |
| 2 | Net investment income is a projection through the end of the current quarter based on the most recent month-end data. |
| 3 | Return of capital may represent unrealized gains, return of shareholder’s principal, or both. In certain circumstances, all or a portion of the return of capital may be characterized as ordinary income under federal tax law. The actual tax characterization will be provided to shareholders on Form 1099-DIV shortly after calendar year-end. |
| 4 | Includes the most recent quarterly distribution declaration. |
Change in Method of Publishing Nuveen Closed-End Fund Distribution Amounts
Beginning on or about November 1, 2019, the Nuveen Closed-End Funds will be discontinuing the practice of announcing Fund distribution amounts and timing via press release. Instead, information about the NuveenClosed-End Funds’ monthly and quarterly periodic distributions to shareholders will be posted and can be found on Nuveen’s enhanced closed-end fund resource page, which is atwww.nuveen.com/closed-end-fund-distributions, along with other Nuveen closed-end fund product updates. Shareholders can expect regular distribution information to be posted on www.nuveen.com on the first business day of each month. To ensure that our shareholders have timely access to the latest information, a subscribe function can be activated at this link here, or at this web page(www.nuveen.com/en-us/people/about-nuveen/for-the-media).
COMMON SHARE REPURCHASES
During August 2019, (subsequent to the close of the reporting period), the Fund’s Board of Trustees reauthorized an open-market share repurchase program, allowing the Fund to repurchase an aggregate of up to approximately 10% of its outstanding shares.
As of June 30, 2019, and since the inception of the Fund’s repurchase program, the Fund has cumulatively repurchased and retired its outstanding common shares as shown in the accompanying table.
| | | | |
| | | JDD | |
Common shares cumulatively repurchased and retired | | | 475,000 | |
Common shares authorized for repurchase | | | 1,975,000 | |
During the current reporting period, the Fund did not repurchase any of its outstanding shares.
OTHER COMMON SHARE INFORMATION
As of June 30, 2019, and during the current reporting period, the Fund’s common share price was trading at a premium/(discount) to its common share NAV as shown in the accompanying table.
| | | | |
| | | JDD | |
Common share NAV | | | $11.49 | |
Common share price | | | $10.65 | |
Premium/(Discount) to NAV | | | (7.31 | )% |
6-month average premium/(discount) to NAV | | | (8.60 | )% |
12
Risk Considerations
Fund shares are not guaranteed or endorsed by any bank or other insured depository institution, and are not federally insured by the Federal Deposit Insurance Corporation.
Nuveen Diversified Dividend and Income Fund (JDD)
Investing in closed-end funds involves risk; principal loss is possible. There is no guarantee the Fund’s investment objectives will be achieved. Closed-end fund shares may frequently trade at a discount or premium to their net asset value.Common stock returns often have experienced significant volatility.Real estate investments may suffer due to economic downturns and changes in commercial real estate values, rents, property taxes, interest rates and tax laws.Adjustable Rate Senior Loans may not be fully secured by collateral, generally do not trade on exchanges, and are typically issued by unrated or below-investment grade companies, and therefore are subject to greater liquidity and credit risk.Foreign investments involve additional risks, including currency fluctuation, political and economic instability, lack of liquidity and differing legal and accounting standards. The risks of foreign investments are magnified in emerging markets.Leverage increases return volatility and magnifies the Fund’s potential return and its risks; there is no guarantee a fund’s leverage strategy will be successful. For these and other risks, includingtax risk, please see the Fund’s web page atwww.nuveen.com/JDD.
13
| | |
| JDD | | Nuveen Diversified Dividend and Income Fund Performance Overview and Holding Summaries as of June 30, 2019 |
Refer to the Glossary of Terms Used in this Report for further definition of terms used in this section.
Average Annual Total Returns as of June 30, 2019
| | | | | | | | | | | | | | | | |
| | | Cumulative | | | Average Annual | |
| | | 6-Month | | | 1-Year | | | 5-Year | | | 10-Year | |
| JDD at Common Share NAV | | | 15.59% | | | | 5.37% | | | | 5.26% | | | | 11.57% | |
| JDD at Common Share Price | | | 20.24% | | | | (0.15)% | | | | 6.84% | | | | 13.90% | |
| Blended Index (Comparative Benchmark) | | | 12.92% | | | | 8.64% | | | | 6.26% | | | | 10.58% | |
| S&P 500® Index | | | 18.54% | | | | 10.42% | | | | 10.71% | | | | 14.70% | |
Past performance is not predictive of future results. Current performance may be higher or lower than the data shown. Returns do not reflect the deduction of taxes that shareholders may have to pay on Fund distributions or upon the sale of Fund shares. Returns at NAV are net of Fund expenses, and assume reinvestment of distributions. Comparative index return information is provided for the Fund’s shares at NAV only. Indexes are not available for direct investment.
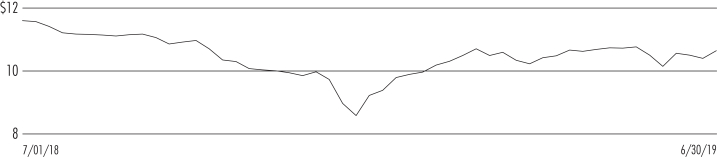
Common Share Price Performance —Weekly Closing Price
14
This data relates to the securities held in the Fund’s portfolio of investments as of the end of the reporting period. It should not be construed as a measure of performance for the Fund itself. Holdings are subject to change.
For financial reporting purposes, the ratings disclosed are the highest rating given by one of the following national rating agencies: Standard & Poor’s Group, Moody’s Investors Service, Inc. or Fitch, Inc. This treatment of split-rated securities may differ from that used for other purposes, such as for Fund investment policies. Credit ratings are subject to change. AAA, AA, A and BBB are investment grade ratings; BB, B, CCC, CC, C and D are below-investment grade ratings. Holdings designated N/R are not rated by these national rating agencies.
Fund Allocation
(% of net assets)
| | | | |
Common Stocks | | | 36.7% | |
REIT Common Stocks | | | 36.4% | |
Emerging Market Debt and Foreign Corporate Bonds | | | 36.1% | |
Variable Rate Senior Loan Interests | | | 31.8% | |
Structured Notes | | | 0.4% | |
Corporate Bonds | | | 0.0% | |
Common Stock Rights | | | 0.0% | |
Warrants | | | 0.0% | |
Repurchase Agreements | | | 3.1% | |
Investment Companies | | | 1.6% | |
Other Assets Less Liabilities | | | (2.9)% | |
Net Assets Plus Borrowings | | | 143.2% | |
Borrowings | | | (43.2)% | |
Net Assets | | | 100% | |
Portfolio Credit Quality
(% of total fixed-income investments)
| | | | |
| AAA | | | 0.2% | |
| AA | | | 1.8% | |
| A | | | 4.8% | |
| BBB | | | 28.2% | |
| BB or Lower | | | 64.6% | |
| N/R (not rated) | | | 0.4% | |
Total | | | 100% | |
Portfolio Composition
(% of total investments)
| | | | |
REIT Common Stocks | | | 24.9% | |
Emerging Market Debt and Foreign Corporate Bonds | | | 24.7% | |
Banks | | | 3.8% | |
Oil, Gas & Consumable Fuels | | | 3.0% | |
Software | | | 2.9% | |
Pharmaceuticals | | | 2.7% | |
Hotels, Restaurants & Leisure | | | 2.5% | |
Media | | | 2.5% | |
Diversified Telecommunication Services | | | 2.0% | |
Insurance | | | 1.9% | |
Capital Markets | | | 1.6% | |
| Health Care Providers & Services | | | 1.5% | |
Airlines | | | 1.5% | |
Multi-Utilities | | | 1.5% | |
Repurchase Agreements | | | 2.1% | |
Investment Companies | | | 1.1% | |
Other | | | 19.8% | |
Total | | | 100% | |
REIT Common Stocks
Top Five Industries
(% of total investments)
| | | | |
Residential | | | 5.5% | |
Specialized | | | 5.2% | |
Office | | | 4.3% | |
Retail | | | 2.9% | |
Health Care | | | 2.4% | |
Country Allocation1
(% of total investments)
| | | | |
United States | | | 57.7% | |
Germany | | | 3.8% | |
United Kingdom | | | 2.8% | |
Japan | | | 2.7% | |
Russia | | | 1.7% | |
France | | | 1.7% | |
Croatia | | | 1.2% | |
Turkey | | | 1.1% | |
Netherlands | | | 1.1% | |
Canada | | | 1.0% | |
Egypt | | | 1.0% | |
Ireland | | | 0.9% | |
Spain | | | 0.9% | |
Saudi Arabia | | | 0.9% | |
Argentina | | | 0.9% | |
Azerbaijan | | | 0.9% | |
Other | | | 19.7% | |
Total | | | 100% | |
| 1 | Includes 24.8% (as a percentage of total investments) in emerging market countries. |
| REIT | Real Estate Investment Trust |
15
Shareholder Meeting Report
The annual meeting of shareholders was held in the offices of Nuveen on April 10, 2019 for JDD; at this meeting the shareholders were asked to elect Board Members.
| | | | |
| | | JDD | |
| | | Common
Shares | |
Approval of the Board Members was reached as follows: | | | | |
Judith M. Stockdale | | | | |
For | | | 17,439,243 | |
Withhold | | | 960,768 | |
Total | | | 18,400,011 | |
Carole E. Stone | | | | |
For | | | 17,532,242 | |
Withhold | | | 867,769 | |
Total | | | 18,400,011 | |
Margaret L. Wolff | | | | |
For | | | 17,603,326 | |
Withhold | | | 796,685 | |
Total | | | 18,400,011 | |
William C. Hunter | | | | |
For | | | 17,560,842 | |
Withhold | | | 839,169 | |
Total | | | 18,400,011 | |
16
| | |
| JDD | | Nuveen Diversified Dividend and
Income Fund Portfolio of Investments June 30, 2019 |
| | | (Unaudited) |
| | | | | | | | | | | | | | | | | | | | | | | | | | | | | | |
| Shares | | | | | Description (1) | | | | | | | | | | | | | | | | | Value | |
| | |
| | | | | | LONG-TERM INVESTMENTS – 141.4% (96.8% of Total Investments) | |
| | |
| | | | | | COMMON STOCKS – 36.7% (25.1% of Total Investments) | |
| | |
| | | | | | Air Freight & Logistics – 1.2% | |
| | | | | | | | |
| | 82,675 | | | | | Deutsche Post AG, (2) | | | | | | | | | | | | | | | | | | | | | | $ | 2,719,743 | |
| | |
| | | | | | Airlines – 1.2% | |
| | | | | | | | |
| | 47,750 | | | | | Delta Air Lines Inc | | | | | | | | | | | | | | | | | | | | | | | 2,709,812 | |
| | |
| | | | | | Automobiles – 0.5% | |
| | | | | | | | |
| | 21,234 | | | | | Daimler AG, (2) | | | | | | | | | | | | | | | | | | | | | | | 1,184,259 | |
| | |
| | | | | | Banks – 5.5% | |
| | | | | | | | |
| | 646,146 | | | | | AIB Group PLC | | | | | | | | | | | | | | | | | | | | | | | 2,642,099 | |
| | 26,018 | | | | | Bank of NT Butterfield & Son Ltd | | | | | | | | | | | | | | | | | | | | | | | 883,571 | |
| | 23,958 | | | | | CIT Group Inc | | | | | | | | | | | | | | | | | | | | | | | 1,258,753 | |
| | 42,984 | | | | | Citigroup Inc | | | | | | | | | | | | | | | | | | | | | | | 3,010,170 | |
| | 224,178 | | | | | ING Groep NV | | | | | | | | | | | | | | | | | | | | | | | 2,593,739 | |
| | 11,510 | | | | | JPMorgan Chase & Co | | | | | | | | | | | | | | | | | | | | | | | 1,286,818 | |
| | 951,500 | | | | | Unicaja Banco SA, 144A, (2), (3) | | | | | | | | | | | | | | | | | | | | | | | 849,522 | |
| | | | | | Total Banks | | | | | | | | | | | | | | | | | | | | | | | 12,524,672 | |
| | |
| | | | | | Biotechnology – 0.6% | |
| | | | | | | | |
| | 18,639 | | | | | Gilead Sciences Inc | | | | | | | | | | | | | | | | | | | | | | | 1,259,251 | |
| | |
| | | | | | Capital Markets – 1.9% | |
| | | | | | | | |
| | 39,299 | | | | | AURELIUS Equity Opportunities SE & Co KGaA, (2) | | | | | | | | | | | | | | | | | | | | | | | 1,870,051 | |
| | 266,070 | | | | | Daiwa Securities Group Inc, (2) | | | | | | | | | | | | | | | | | | | | | | | 1,168,164 | |
| | 94,906 | | | | | Deutsche Boerse AG, (2) | | | | | | | | | | | | | | | | | | | | | | | 1,336,277 | |
| | | | | | Total Capital Markets | | | | | | | | | | | | | | | | | | | | | | | 4,374,492 | |
| | |
| | | | | | Chemicals – 1.3% | |
| | | | | | | | |
| | 41,225 | | | | | Corteva Inc | | | | | | | | | | | | | | | | | | | | | | | 1,219,023 | |
| | 21,553 | | | | | DuPont de Nemours Inc | | | | | | | | | | | | | | | | | | | | | | | 1,617,984 | |
| | | | | | Total Chemicals | | | | | | | | | | | | | | | | | | | | | | | 2,837,007 | |
| | |
| | | | | | Diversified Telecommunication Services – 1.2% | |
| | | | | | | | |
| | 27,720 | | | | | Nippon Telegraph & Telephone Corp, (2) | | | | | | | | | | | | | | | | | | | | | | | 1,288,841 | |
| | 112,755 | | | | | Telefonica Brasil SA | | | | | | | | | | | | | | | | | | | | | | | 1,465,541 | |
| | | | | | Total Diversified Telecommunication Services | | | | | | | | | | | | | | | | | | | | | | | 2,754,382 | |
| | |
| | | | | | Electric Utilities – 0.6% | |
| | | | | | | | |
| | 29,170 | | | | | FirstEnergy Corp | | | | | | | | | | | | | | | | | | | | | | | 1,248,768 | |
| | |
| | | | | | Electrical Equipment – 0.6% | |
| | | | | | | | |
| | 15,500 | | | | | Eaton Corp PLC | | | | | | | | | | | | | | | | | | | | | | | 1,290,840 | |
| | |
| | | | | | Energy Equipment & Services – 0.0% | |
| | | | | | | | |
| | 3,685 | | | | | Transocean Ltd | | | | | | | | | | | | | | | | | | | | | | | 23,621 | |
| | |
| | | | | | Entertainment – 1.5% | |
| | | | | | | | |
| | 6,700 | | | | | Nintendo Co Ltd, (2) | | | | | | | | | | | | | | | | | | | | | | | 2,458,221 | |
| | 28,334 | | | | | Viacom Inc | | | | | | | | | | | | | | | | | | | | | | | 846,336 | |
| | | | | | Total Entertainment | | | | | | | | | | | | | | | | | | | | | | | 3,304,557 | |
17
| | |
| |
| JDD | | Nuveen Diversified Dividend and Income Fund(continued) |
| | Portfolio of Investments June 30, 2019 |
| | (Unaudited) |
| | | | | | | | | | | | | | | | | | | | | | | | | | | | | | |
| Shares | | | | | Description (1) | | | | | | | | | | | | | | | | | Value | |
| | |
| | | | | | Food Products – 0.6% | |
| | | | | | | | |
| | 143,927 | | | | | Orkla ASA | | | | | | | | | | | | | | | | | | | | | | $ | 1,270,875 | |
| | |
| | | | | | Health Care Providers & Services – 0.0% | |
| | | | | | | | |
| | 6,594 | | | | | Millennium Health LLC, (2), (3) | | | | | | | | | | | | | | | | | | | | | | | 99 | |
| | 6,140 | | | | | Millennium Health LLC, (3), (4) | | | | | | | | | | | | | | | | | | | | | | | 6,723 | |
| | 5,767 | | | | | Millennium Health LLC, (3), (4) | | | | | | | | | | | | | | | | | | | | | | | 5,738 | |
| | | | | | Total Health Care Providers & Services | | | | | | | | | | | | | | | | | | | | | | | 12,560 | |
| | |
| | | | | | Household Durables – 0.7% | |
| | | | | | | | |
| | 101,424 | | | | | Sekisui House Ltd, (2) | | | | | | | | | | | | | | | | | | | | | | | 1,671,123 | |
| | |
| | | | | | Industrial Conglomerates – 0.9% | |
| | | | | | | | |
| | 16,319 | | | | | Siemens AG, (2) | | | | | | | | | | | | | | | | | | | | | | | 1,942,864 | |
| | |
| | | | | | Insurance – 2.7% | |
| | | | | | | | |
| | 37,666 | | | | | Ageas, (2) | | | | | | | | | | | | | | | | | | | | | | | 1,960,150 | |
| | 5,515 | | | | | Allianz SE, (2) | | | | | | | | | | | | | | | | | | | | | | | 1,330,086 | |
| | 25,755 | | | | | CNA Financial Corp | | | | | | | | | | | | | | | | | | | | | | | 1,212,288 | |
| | 9,340 | | | | | RenaissanceRe Holdings Ltd | | | | | | | | | | | | | | | | | | | | | | | 1,662,614 | |
| | | | | | Total Insurance | | | | | | | | | | | | | | | | | | | | | | | 6,165,138 | |
| | |
| | | | | | Marine – 0.0% | |
| | | | | | | | |
| | 262 | | | | | HGIM Corp, (2), (3) | | | | | | | | | | | | | | | | | | | | | | | 3,668 | |
| | |
| | | | | | Media – 0.3% | |
| | | | | | | | |
| | 24,320 | | | | | Clear Channel Outdoor Holdings Inc, (3) | | | | | | | | | | | | | | | | | | | | | | | 114,790 | |
| | 9,180 | | | | | Cumulus Media Inc, (3) | | | | | | | | | | | | | | | | | | | | | | | 170,289 | |
| | 655,185 | | | | | Hibu plc, (2), (3) | | | | | | | | | | | | | | | | | | | | | | | 144,141 | |
| | 10,343 | | | | | iHeartMedia Inc, (2), (3) | | | | | | | | | | | | | | | | | | | | | | | 163,678 | |
| | 2,099 | | | | | Metro-Goldwyn-Mayer Inc, (2), (3) | | | | | | | | | | | | | | | | | | | | | | | 140,282 | |
| | 3,185 | | | | | Tribune Co, (4) | | | | | | | | | | | | | | | | | | | | | | | 1,752 | |
| | | | | | Total Media | | | | | | | | | | | | | | | | | | | | | | | 734,932 | |
| | |
| | | | | | Multi-Utilities – 2.1% | |
| | | | | | | | |
| | 85,800 | | | | | Engie SA, (2) | | | | | | | | | | | | | | | | | | | | | | | 1,301,027 | |
| | 99,900 | | | | | National Grid PLC, (2) | | | | | | | | | | | | | | | | | | | | | | | 1,062,422 | |
| | 99,395 | | | | | Veolia Environnement SA, (2) | | | | | | | | | | | | | | | | | | | | | | | 2,420,306 | |
| | | | | | Total Multi-Utilities | | | | | | | | | | | | | | | | | | | | | | | 4,783,755 | |
| | |
| | | | | | Oil, Gas & Consumable Fuels – 4.2% | |
| | | | | | | | |
| | 15,459 | | | | | Chevron Corp | | | | | | | | | | | | | | | | | | | | | | | 1,923,718 | |
| | 98,270 | | | | | Enterprise Products Partners LP | | | | | | | | | | | | | | | | | | | | | | | 2,837,055 | |
| | 63,315 | | | | | Equitrans Midstream Corp | | | | | | | | | | | | | | | | | | | | | | | 1,247,939 | |
| | 52,725 | | | | | Suncor Energy Inc | | | | | | | | | | | | | | | | | | | | | | | 1,642,911 | |
| | 32,600 | | | | | TOTAL SA | | | | | | | | | | | | | | | | | | | | | | | 1,818,754 | |
| | | | | | Total Oil, Gas & Consumable Fuels | | | | | | | | | | | | | | | | | | | | | | | 9,470,377 | |
| | |
| | | | | | Pharmaceuticals – 3.4% | |
| | | | | | | | |
| | 31,119 | | | | | AstraZeneca PLC | | | | | | | | | | | | | | | | | | | | | | | 1,284,592 | |
| | 18,120 | | | | | Bayer AG, (2) | | | | | | | | | | | | | | | | | | | | | | | 1,256,809 | |
| | 27,910 | | | | | Bristol-Myers Squibb Co | | | | | | | | | | | | | | | | | | | | | | | 1,265,719 | |
| | 63,030 | | | | | GlaxoSmithKline PLC | | | | | | | | | | | | | | | | | | | | | | | 2,522,461 | |
| | 38,155 | | | | | Roche Holding AG, (2) | | | | | | | | | | | | | | | | | | | | | | | 1,339,240 | |
| | | | | | Total Pharmaceuticals | | | | | | | | | | | | | | | | | | | | | | | 7,668,821 | |
| | |
| | | | | | Real Estate Management & Development – 0.4% | |
| | | | | | | | |
| | 191,200 | | | | | Great Eagle Holdings Ltd, (2) | | | | | | | | | | | | | | | | | | | | | | | 821,758 | |
| | |
| | | | | | Semiconductors & Semiconductor Equipment – 1.3% | |
| | | | | | | | |
| | 3,298 | | | | | Broadcom Inc | | | | | | | | | | | | | | | | | | | | | | | 949,362 | |
| | 55,125 | | | | | Cypress Semiconductor Corp | | | | | | | | | | | | | | | | | | | | | | | 1,225,980 | |
| | 47,249 | | | | | Infineon Technologies AG, (2) | | | | | | | | | | | | | | | | | | | | | | | 839,600 | |
| | | | | | Total Semiconductors & Semiconductor Equipment | | | | | | | | | | | | | | | | | | | | | | | 3,014,942 | |
18
| | | | | | | | | | | | | | | | | | | | | | | | | | | | | | |
| Shares | | | | | Description (1) | | | | | | | | | | | | | | | | | Value | |
| | |
| | | | | | Software – 1.7% | |
| | | | | | | | |
| | 14,787 | | | | | Microsoft Corp, (10) | | | | | | | | | | | | | | | | | | | | | | $ | 1,980,867 | |
| | 34,820 | | | | | Oracle Corp, (10) | | | | | | | | | | | | | | | | | | | | | | | 1,983,695 | |
| | | | | | Total Software | | | | | | | | | | | | | | | | | | | | | | | 3,964,562 | |
| | |
| | | | | | Specialty Retail – 0.4% | |
| | | | | | | | |
| | 363,250 | | | | | Kingfisher PLC, (2) | | | | | | | | | | | | | | | | | | | | | | | 990,103 | |
| | |
| | | | | | Technology Hardware, Storage & Peripherals – 0.5% | |
| | | | | | | | |
| | 35,700 | | | | | Samsung Electronics Co Ltd, (2) | | | | | | | | | | | | | | | | | | | | | | | 1,183,967 | |
| | |
| | | | | | Tobacco – 0.8% | |
| | | | | | | | |
| | 24,190 | | | | | Philip Morris International Inc | | | | | | | | | | | | | | | | | | | | | | | 1,899,641 | |
| | |
| | | | | | Trading Companies & Distributors – 0.6% | |
| | | | | | | | |
| | 80,600 | | | | | Mitsui & Co Ltd, (2) | | | | | | | | | | | | | | | | | | | | | | | 1,315,625 | |
| | | | | | Total Common Stocks (cost $74,876,048) | | | | | | | | | | | | | | | | | | | | | | | 83,146,115 | |
| | | | | | | | |
| Shares | | | | | Description (1) | | | | | | | | | | | | | | | | | Value | |
| | |
| | | | | | REAL ESTATE INVESTMENT TRUST (REIT) COMMON STOCKS – 36.4% (24.9% of Total Investments) | |
| | |
| | | | | | Diversified – 1.8% | |
| | | | | | | | |
| | 78,950 | | | | | Liberty Property Trust | | | | | | | | | | | | | | | | | | | | | | $ | 3,950,658 | |
| | |
| | | | | | Health Care – 3.5% | |
| | | | | | | | |
| | 122,425 | | | | | HCP Inc | | | | | | | | | | | | | | | | | | | | | | | 3,915,151 | |
| | 122,800 | | | | | Senior Housing Properties Trust | | | | | | | | | | | | | | | | | | | | | | | 1,015,556 | |
| | 19,825 | | | | | Ventas Inc | | | | | | | | | | | | | | | | | | | | | | | 1,355,039 | |
| | 20,900 | | | | | Welltower Inc | | | | | | | | | | | | | | | | | | | | | | | 1,703,977 | |
| | | | | | Total Health Care | | | | | | | | | | | | | | | | | | | | | | | 7,989,723 | |
| | |
| | | | | | Hotels – 2.3% | |
| | | | | | | | |
| | 191,717 | | | | | Host Hotels & Resorts Inc | | | | | | | | | | | | | | | | | | | | | | | 3,493,084 | |
| | 32,175 | | | | | Pebblebrook Hotel Trust | | | | | | | | | | | | | | | | | | | | | | | 906,691 | |
| | 64,025 | | | | | Sunstone Hotel Investors Inc | | | | | | | | | | | | | | | | | | | | | | | 877,783 | |
| | | | | | Total Hotels | | | | | | | | | | | | | | | | | | | | | | | 5,277,558 | |
| | |
| | | | | | Industrial – 2.7% | |
| | | | | | | | |
| | 77,023 | | | | | Prologis Inc | | | | | | | | | | | | | | | | | | | | | | | 6,169,543 | |
| | |
| | | | | | Office – 6.2% | |
| | | | | | | | |
| | 18,675 | | | | | Alexandria Real Estate Equities Inc | | | | | | | | | | | | | | | | | | | | | | | 2,634,856 | |
| | 7,850 | | | | | Boston Properties Inc | | | | | | | | | | | | | | | | | | | | | | | 1,012,650 | |
| | 52,400 | | | | | Brandywine Realty Trust | | | | | | | | | | | | | | | | | | | | | | | 750,368 | |
| | 45,200 | | | | | Cousins Properties Inc | | | | | | | | | | | | | | | | | | | | | | | 1,634,884 | |
| | 81,200 | | | | | Douglas Emmett Inc | | | | | | | | | | | | | | | | | | | | | | | 3,235,008 | |
| | 64,475 | | | | | Hudson Pacific Properties Inc | | | | | | | | | | | | | | | | | | | | | | | 2,145,083 | |
| | 36,425 | | | | | Kilroy Realty Corp | | | | | | | | | | | | | | | | | | | | | | | 2,688,529 | |
| | | | | | Total Office | | | | | | | | | | | | | | | | | | | | | | | 14,101,378 | |
| | |
| | | | | | Residential – 8.0% | |
| | | | | | | | |
| | 144,325 | | | | | American Homes 4 Rent, Class A | | | | | | | | | | | | | | | | | | | | | | | 3,508,540 | |
| | 78,923 | | | | | Apartment Investment & Management Co, Class A | | | | | | | | | | | | | | | | | | | | | | | 3,955,621 | |
| | 22,150 | | | | | AvalonBay Communities Inc | | | | | | | | | | | | | | | | | | | | | | | 4,500,437 | |
| | 51,325 | | | | | Equity Residential | | | | | | | | | | | | | | | | | | | | | | | 3,896,594 | |
| | 85,875 | | | | | Invitation Homes Inc | | | | | | | | | | | | | | | | | | | | | | | 2,295,439 | |
| | | | | | Total Residential | | | | | | | | | | | | | | | | | | | | | | | 18,156,631 | |
| | |
| | | | | | Retail – 4.2% | |
| | | | | | | | |
| | 116,375 | | | | | Kimco Realty Corp | | | | | | | | | | | | | | | | | | | | | | | 2,150,610 | |
| | 37,916 | | | | | Macerich Co | | | | | | | | | | | | | | | | | | | | | | | 1,269,807 | |
19
| | |
| |
| JDD | | Nuveen Diversified Dividend and Income Fund(continued) |
| | Portfolio of Investments June 30, 2019 |
| | (Unaudited) |
| | | | | | | | | | | | | | | | | | | | | | | | | | | | | | |
| Shares | | | | | Description (1) | | | | | | | | | | | | | | | | | Value | |
| | |
| | | | | | Retail(continued) | |
| | | | | | | | |
| | 375 | | | | | Saul Centers Inc | | | | | | | | | | | | | | | | | | | | | | $ | 21,049 | |
| | 12,610 | | | | | Simon Property Group Inc | | | | | | | | | | | | | | | | | | | | | | | 2,014,573 | |
| | 49,400 | | | | | Taubman Centers Inc | | | | | | | | | | | | | | | | | | | | | | | 2,017,002 | |
| | 74,650 | | | | | Weingarten Realty Investors | | | | | | | | | | | | | | | | | | | | | | | 2,046,903 | |
| | | | | | Total Retail | | | | | | | | | | | | | | | | | | | | | | | 9,519,944 | |
| | |
| | | | | | Specialized – 7.7% | |
| | | | | | | | |
| | 24,100 | | | | | CoreSite Realty Corp | | | | | | | | | | | | | | | | | | | | | | | 2,775,597 | |
| | 27,350 | | | | | Digital Realty Trust Inc | | | | | | | | | | | | | | | | | | | | | | | 3,221,557 | |
| | 6,575 | | | | | Equinix Inc | | | | | | | | | | | | | | | | | | | | | | | 3,315,707 | |
| | 40,025 | | | | | Life Storage Inc | | | | | | | | | | | | | | | | | | | | | | | 3,805,577 | |
| | 17,849 | | | | | Public Storage | | | | | | | | | | | | | | | | | | | | | | | 4,251,096 | |
| | | | | | Total Specialized | | | | | | | | | | | | | | | | | | | | | | | 17,369,534 | |
| | | | | | Total Real Estate Investment Trust (REIT) Common Stocks (cost $62,444,588) | | | | | | | | 82,534,969 | |
| | | | | | | | |
Principal
Amount (000) (5) | | | | | Description (1) | | | | | | | | Coupon | | | Maturity | | | Ratings (6) | | | Value | |
| | |
| | | | | | EMERGING MARKET DEBT AND FOREIGN CORPORATE BONDS – 36.1% (24.7% of Total Investments) | |
| | |
| | | | | | Angola – 0.6% | |
| | | | | | | | |
| $ | 335 | | | | | Angolan Government International Bond, 144A | | | | | | | | | | | 8.250% | | | | 5/09/28 | | | | B3 | | | $ | 358,490 | |
| | 320 | | | | | Angolan Government International Bond, 144A | | | | | | | | | | | 9.375% | | | | 5/08/48 | | | | B3 | | | | 352,416 | |
| | 640 | | | | | Angolan Government International Bond, Reg S | | | | | | | | | | | 8.250% | | | | 5/09/28 | | | | B3 | | | | 685,009 | |
| | | | | | Total Angola | | | | | | | | | | | | | | | | | | | | | | | 1,395,915 | |
| | |
| | | | | | Argentina – 1.3% | |
| | | | | | |
| | 540 | | | | | Argentine Republic Government International Bond | | | | 6.875% | | | | 1/26/27 | | | | B | | | | 433,080 | |
| | 383 | | | | | Argentine Republic Government International Bond | | | | 5.875% | | | | 1/11/28 | | | | B | | | | 291,080 | |
| | 150 | | | EUR | | Argentine Republic Government International Bond | | | | 5.250% | | | | 1/15/28 | | | | B | | | | 123,509 | |
| | 150 | | | | | Argentine Republic Government International Bond | | | | | | | | 6.625% | | | | 7/06/28 | | | | B | | | | 115,726 | |
| | 160 | | | | | Argentine Republic Government International Bond | | | | | | | | 3.750% | | | | 12/31/38 | | | | B | | | | 93,402 | |
| | 150 | | | | | Argentine Republic Government International Bond | | | | | | | | 7.625% | | | | 4/22/46 | | | | B | | | | 118,875 | |
| | 200 | | | | | Argentine Republic Government International Bond | | | | | | | | 6.875% | | | | 1/11/48 | | | | B | | | | 148,002 | |
| | 231 | | | | | Autonomous City of Buenos Aires Argentina, 144A | | | | | | | | 8.950% | | | | 2/19/21 | | | | B | | | | 232,886 | |
| | 310 | | | | | Autonomous City of Buenos Aires Argentina, 144A | | | | | | | | 7.500% | | | | 6/01/27 | | | | B | | | | 290,628 | |
| | 320 | | | | | Autonomous City of Buenos Aires Argentina, Reg S | | | | | | | | 7.500% | | | | 6/01/27 | | | | B | | | | 300,003 | |
| | 210 | | | | | Provincia de Buenos Aires/Argentina, 144A | | | | | | | | | | | 9.125% | | | | 3/16/24 | | | | B | | | | 175,352 | |
| | 220 | | | | | Provincia de Buenos Aires/Argentina, 144A | | | | | | | | | | | 7.875% | | | | 6/15/27 | | | | B | | | | 163,352 | |
| | 171 | | | | | Provincia de Cordoba, 144A | | | | | | | | | | | 7.125% | | | | 6/10/21 | | | | B | | | | 148,770 | |
| | 76 | | | | | YPF SA, 144A | | | | | | | | | | | 8.750% | | | | 4/04/24 | | | | B2 | | | | 76,927 | |
| | 139 | | | | | YPF SA, 144A | | | | | | | | | | | 6.950% | | | | 7/21/27 | | | | B | | | | 126,101 | |
| | 100 | | | | | YPF SA, 144A | | | | | | | | | | | 7.000% | | | | 12/15/47 | | | | B | | | | 85,750 | |
| | 50 | | | | | YPF SA, Reg S | | | | | | | | | | | 8.500% | | | | 7/28/25 | | | | B2 | | | | 50,017 | |
| | | | | | Total Argentina | | | | | | | | | | | | | | | | | | | | | | | 2,973,460 | |
| | |
| | | | | | Armenia – 0.3% | |
| | | | | | | | |
| | 655 | | | | | Republic of Armenia International Bond, Reg S | | | | | | | | | | | 7.150% | | | | 3/26/25 | | | | B1 | | | | 752,379 | |
| | |
| | | | | | Azerbaijan – 1.3% | |
| | | | | | | | |
| | 1,110 | | | | | Republic of Azerbaijan International Bond, Reg S | | | | | | | | | | | 4.750% | | | | 3/18/24 | | | | BB+ | | | | 1,166,765 | |
| | 150 | | | | | Republic of Azerbaijan International Bond, Reg S | | | | | | | | | | | 5.125% | | | | 9/01/29 | | | | BB+ | | | | 156,726 | |
| | 615 | | | | | Republic of Azerbaijan International Bond, Reg S | | | | | | | | | | | 3.500% | | | | 9/01/32 | | | | BB+ | | | | 579,545 | |
| | 210 | | | | | Republic of Azerbaijan International Bond, Reg S | | | | | | | | | | | 3.500% | | | | 9/01/32 | | | | BB+ | | | | 197,893 | |
| | 200 | | | | | Southern Gas Corridor CJSC, 144A | | | | | | | | | | | 6.875% | | | | 3/24/26 | | | | BB+ | | | | 231,831 | |
| | 330 | | | | | Southern Gas Corridor CJSC, Reg S | | | | | | | | | | | 6.875% | | | | 3/24/26 | | | | BB+ | | | | 382,859 | |
| | 210 | | | | | State Oil Co of the Azerbaijan Republic, Reg S | | | | | | | | | | | 6.950% | | | | 3/18/30 | | | | BB+ | | | | 248,367 | |
| | | | | | Total Azerbaijan | | | | | | | | | | | | | | | | | | | | | | | 2,963,986 | |
| | |
| | | | | | Bermuda – 0.1% | |
| | | | | | | | |
| | 200 | | | | | Bermuda Government International Bond, 144A | | | | | | | | | | | 4.750% | | | | 2/15/29 | | | | A+ | | | | 220,500 | |
20
| | | | | | | | | | | | | | | | | | | | | | | | | | |
Principal
Amount (000) (5) | | | | | Description (1) | | | | | | Coupon | | | Maturity | | | Ratings (6) | | | Value | |
| | | | | | |
| | | | | | Brazil – 1.1% | | | | | | | | | | | | |
| | | | | | |
| $ | 255 | | | | | Banco do Brasil SA/Cayman, 144A | | | 4.750% | | | | 3/20/24 | | | | Ba2 | | | $ | 266,526 | |
| | 200 | | | | | Banco do Brasil SA/Cayman, Reg S | | | 4.625% | | | | 1/15/25 | | | | Ba2 | | | | 207,400 | |
| | 200 | | | | | Braskem Netherlands Finance BV, Reg S | | | 4.500% | | | | 1/10/28 | | | | BBB– | | | | 202,300 | |
| | 1,218 | | | BRL | | Brazil Notas do Tesouro Nacional Serie F | | | 10.000% | | | | 1/01/29 | | | | BB– | | | | 369,906 | |
| | 215 | | | | | Brazilian Government International Bond | | | 4.625% | | | | 1/13/28 | | | | BB– | | | | 225,535 | |
| | 225 | | | | | Centrais Eletricas Brasileiras SA, Reg S | | | 5.750% | | | | 10/27/21 | | | | BB– | | | | 235,097 | |
| | 205 | | | | | CSN Resources SA, 144A | | | 7.625% | | | | 4/17/26 | | | | B2 | | | | 217,343 | |
| | 200 | | | | | Minerva Luxembourg SA, Reg S | | | 6.500% | | | | 9/20/26 | | | | BB– | | | | 208,280 | |
| | 200 | | | | | Minerva Luxembourg SA, Reg S | | | 5.875% | | | | 1/19/28 | | | | BB– | | | | 200,000 | |
| | 91 | | | | | Petrobras Global Finance BV | | | 5.999% | | | | 1/27/28 | | | | Ba2 | | | | 96,733 | |
| | 80 | | | | | Petrobras Global Finance BV | | | 6.900% | | | | 3/19/49 | | | | Ba2 | | | | 85,200 | |
| | 200 | | | | | Suzano Austria GmbH, 144A | | | 6.000% | | | | 1/15/29 | | | | BBB– | | | | 218,000 | |
| | | | | | Total Brazil | | | | | | | | | | | | | | | 2,532,320 | |
| | | | | | |
| | | | | | British Virgin Islands – 0.4% | | | | | | | | | | | | |
| | | | | | |
| | 430 | | | | | State Grid Overseas Investment 2016 Ltd, 144A | | | 3.500% | | | | 5/04/27 | | | | A+ | | | | 445,057 | |
| | 450 | | | | | State Grid Overseas Investment 2016 Ltd, 144A | | | 4.250% | | | | 5/02/28 | | | | A+ | | | | 493,513 | |
| | | | | | Total British Virgin Islands | | | | | | | | | | | | | | | 938,570 | |
| | | | | | |
| | | | | | Bulgaria – 0.1% | | | | | | | | | | | | |
| | | | | | |
| | 185 | | | EUR | | Bulgaria Government International Bond, Reg S | | | 3.125% | | | | 3/26/35 | | | | Baa2 | | | | 254,014 | |
| | | | | | |
| | | | | | Chile – 0.6% | | | | | | | | | | | | |
| | | | | | |
| | 200 | | | | | Celulosa Arauco y Constitucion SA | | | 4.500% | | | | 8/01/24 | | | | BBB | | | | 210,250 | |
| | 200 | | | | | Celulosa Arauco y Constitucion SA, 144A | | | 5.500% | | | | 4/30/49 | | | | BBB | | | | 210,500 | |
| | 225 | | | | | Chile Government International Bond | | | 3.500% | | | | 1/25/50 | | | | A | | | | 229,275 | |
| | 260 | | | | | Corp Nacional del Cobre de Chile, 144A | | | 3.625% | | | | 8/01/27 | | | | A+ | | | | 269,038 | |
| | 200 | | | | | Empresa Nacional del Petroleo, 144A | | | 5.250% | | | | 11/06/29 | | | | A | | | | 226,479 | |
| | 200 | | | | | Empresa Nacional del Petroleo, 144A | | | 4.500% | | | | 9/14/47 | | | | A | | | | 204,250 | |
| | | | | | Total Chile | | | | | | | | | | | | | | | 1,349,792 | |
| | | | | | |
| | | | | | China – 0.5% | | | | | | | | | | | | |
| | | | | | |
| | 210 | | | | | China Evergrande Group, Reg S | | | 8.250% | | | | 3/23/22 | | | | B2 | | | | 202,348 | |
| | 200 | | | | | Industrial & Commercial Bank of China Ltd, Reg S | | | 4.875% | | | | 9/21/25 | | | | BBB+ | | | | 215,791 | |
| | 200 | | | | | Shimao Property Holdings Ltd, Reg S | | | 4.750% | | | | 7/03/22 | | | | BBB– | | | | 201,456 | |
| | 380 | | | | | Sinopec Group Overseas Development 2012 Ltd, Reg S | | | 4.875% | | | | 5/17/42 | | | | A+ | | | | 440,517 | |
| | | | | | Total China | | | | | | | | | | | | | | | 1,060,112 | |
| | | | | | |
| | | | | | Colombia – 0.6% | | | | | | | | | | | | |
| | | | | | |
| | 280 | | | | | Colombia Government International Bond | | | 4.500% | | | | 3/15/29 | | | | Baa2 | | | | 305,760 | |
| | 220 | | | | | Colombia Government International Bond | | | 5.000% | | | | 6/15/45 | | | | Baa2 | | | | 242,770 | |
| | 260 | | | | | Ecopetrol SA | | | 5.875% | | | | 9/18/23 | | | | BBB | | | | 287,950 | |
| | 200 | | | | | Millicom International Cellular SA, 144A | | | 6.250% | | | | 3/25/29 | | | | BB+ | | | | 214,622 | |
| | 200 | | | | | Transportadora de Gas Internacional SA ESP, 144A | | | 5.550% | | | | 11/01/28 | | | | BBB | | | | 224,700 | |
| | | | | | Total Colombia | | | | | | | | | | | | | | | 1,275,802 | |
| | | | | | |
| | | | | | Costa Rica – 0.1% | | | | | | | | | | | | |
| | | | | | |
| | 250 | | | | | Costa Rica Government International Bond, Reg S | | | 7.000% | | | | 4/04/44 | | | | B+ | | | | 248,128 | |
| | | | | | |
| | | | | | Cote d“Ivoire – 0.4% | | | | | | | | | | | | |
| | | | | | |
| | 390 | | | | | Ivory Coast Government International Bond, 144A | | | 6.125% | | | | 6/15/33 | | | | Ba3 | | | | 363,184 | |
| | 595 | | | | | Ivory Coast Government International Bond, Reg S | | | 6.125% | | | | 6/15/33 | | | | Ba3 | | | | 554,088 | |
| | | | | | Total Cote d’Ivoire | | | | | | | | | | | | | | | 917,272 | |
| | | | | | |
| | | | | | Croatia – 1.7% | | | | | | | | | | | | |
| | | | | | |
| | 145 | | | | | Croatia Government International Bond, Reg S | | | 6.625% | | | | 7/14/20 | | | | BBB– | | | | 150,568 | |
| | 710 | | | | | Croatia Government International Bond, Reg S | | | 6.375% | | | | 3/24/21 | | | | BBB– | | | | 753,554 | |
| | 675 | | | | | Croatia Government International Bond, Reg S | | | 5.500% | | | | 4/04/23 | | | | BBB– | | | | 746,325 | |
| | 1,155 | | | | | Croatia Government International Bond, Reg S | | | 6.000% | | | | 1/26/24 | | | | BBB– | | | | 1,324,055 | |
| | 125 | | | EUR | | Croatia Government International Bond, Reg S | | | 3.000% | | | | 3/11/25 | | | | BBB– | | | | 162,574 | |
21
| | |
| |
| JDD | | Nuveen Diversified Dividend and Income Fund(continued) |
| | Portfolio of Investments June 30, 2019 |
| | (Unaudited) |
| | | | | | | | | | | | | | | | | | | | | | | | | | |
Principal
Amount (000) (5) | | | | | Description (1) | | | | | | Coupon | | | Maturity | | | Ratings (6) | | | Value | |
| | |
| | | | | | Croatia(continued) | |
| | | | | | |
| | 335 | | | EUR | | Croatia Government International Bond, Reg S | | | 3.000% | | | | 3/20/27 | | | | BBB– | | | $ | 443,892 | |
| | 210 | | | EUR | | Croatia Government International Bond, Reg S | | | 2.750% | | | | 1/27/30 | | | | BBB– | | | | 277,014 | |
| | | | | | Total Croatia | | | | | | | | | | | | | | | 3,857,982 | |
| | | | | | |
| | | | | | Dominican Republic – 1.1% | | | | | | | | | | | | |
| | | | | | |
| | 165 | | | | | Dominican Republic International Bond, 144A | | | 6.600% | | | | 1/28/24 | | | | BB– | | | | 182,945 | |
| | 480 | | | | | Dominican Republic International Bond, 144A | | | 6.400% | | | | 6/05/49 | | | | BB– | | | | 502,205 | |
| | 423 | | | | | Dominican Republic International Bond, Reg S | | | 7.500% | | | | 5/06/21 | | | | BB– | | | | 445,558 | |
| | 285 | | | | | Dominican Republic International Bond, Reg S | | | 6.600% | | | | 1/28/24 | | | | BB– | | | | 315,997 | |
| | 100 | | | | | Dominican Republic International Bond, Reg S | | | 6.875% | | | | 1/29/26 | | | | BB– | | | | 112,876 | |
| | 545 | | | | | Dominican Republic International Bond, Reg S | | | 7.450% | | | | 4/30/44 | | | | BB– | | | | 631,524 | |
| | 290 | | | | | Dominican Republic International Bond, Reg S | | | 6.850% | | | | 1/27/45 | | | | BB– | | | | 317,191 | |
| | | | | | Total Dominican Republic | | | | | | | | | | | | | | | 2,508,296 | |
| | | | | | |
| | | | | | Ecuador – 0.6% | | | | | | | | | | | | |
| | | | | | |
| | 561 | | | | | Ecuador Government International Bond, 144A | | | 9.650% | | | | 12/13/26 | | | | B– | | | | 607,288 | |
| | 255 | | | | | Ecuador Government International Bond, 144A | | | 7.875% | | | | 1/23/28 | | | | B– | | | | 252,134 | |
| | 355 | | | | | Ecuador Government International Bond, 144A | | | 10.750% | | | | 1/31/29 | | | | B– | | | | 400,266 | |
| | 200 | | | | | Ecuador Government International Bond, Reg S | | | 7.950% | | | | 6/20/24 | | | | B– | | | | 209,502 | |
| | | | | | Total Ecuador | | | | | | | | | | | | | | | 1,469,190 | |
| | | | | | |
| | | | | | Egypt – 1.4% | | | | | | | | | | | | |
| | | | | | |
| | 305 | | | | | Egypt Government International Bond, 144A | | | 6.588% | | | | 2/21/28 | | | | B+ | | | | 307,629 | |
| | 815 | | | | | Egypt Government International Bond, 144A | | | 7.600% | | | | 3/01/29 | | | | B+ | | | | 859,295 | |
| | 200 | | | | | Egypt Government International Bond, 144A | | | 8.700% | | | | 3/01/49 | | | | B+ | | | | 215,000 | |
| | 1,045 | | | | | Egypt Government International Bond, Reg S | | | 6.588% | | | | 2/21/28 | | | | B+ | | | | 1,054,008 | |
| | 200 | | | | | Egypt Government International Bond, Reg S | | | 7.600% | | | | 3/01/29 | | | | B+ | | | | 210,913 | |
| | 400 | | | | | Egypt Government International Bond, Reg S | | | 8.500% | | | | 1/31/47 | | | | B+ | | | | 423,231 | |
| | 200 | | | | | Egypt Government International Bond, Reg S | | | 8.700% | | | | 3/01/49 | | | | B+ | | | | 214,856 | |
| | | | | | Total Egypt | | | | | | | | | | | | | | | 3,284,932 | |
| | | | | | |
| | | | | | Ethiopia – 0.3% | | | | | | | | | | | | |
| | | | | | |
| | 600 | | | | | Ethiopia International Bond, Reg S | | | 6.625% | | | | 12/11/24 | | | | B1 | | | | 625,260 | |
| | | | | | |
| | | | | | Gabon – 0.3% | | | | | | | | | | | | |
| | | | | | |
| | 200 | | | | | Gabon Government International Bond, Reg S | | | 6.375% | | | | 12/12/24 | | | | B | | | | 197,928 | |
| | 445 | | | | | Gabon Government International Bond, Reg S | | | 6.950% | | | | 6/16/25 | | | | B | | | | 444,413 | |
| | | | | | Total Gabon | | | | | | | | | | | | | | | 642,341 | |
| | | | | | |
| | | | | | Georgia – 0.2% | | | | | | | | | | | | |
| | | | | | |
| | 335 | | | | | Georgia Government International Bond, Reg S | | | 6.875% | | | | 4/12/21 | | | | Ba2 | | | | 352,655 | |
| | | | | | |
| | | | | | Ghana – 0.4% | | | | | | | | | | | | |
| | | | | | |
| | 200 | | | | | Ghana Government International Bond, 144A | | | 7.875% | | | | 3/26/27 | | | | B | | | | 210,420 | |
| | 435 | | | | | Ghana Government International Bond, 144A | | | 8.125% | | | | 3/26/32 | | | | B | | | | 441,619 | |
| | 250 | | | | | Ghana Government International Bond, 144A | | | 8.627% | | | | 6/16/49 | | | | B | | | | 252,062 | |
| | | | | | Total Ghana | | | | | | | | | | | | | | | 904,101 | |
| | | | | | |
| | | | | | Greece – 0.6% | | | | | | | | | | | | |
| | | | | | |
| | 200 | | | EUR | | Hellenic Republic Government Bond, 144A, Reg S | | | 4.375% | | | | 8/01/22 | | | | BB– | | | | 250,981 | |
| | 350 | | | EUR | | Hellenic Republic Government Bond, 144A, Reg S | | | 3.450% | | | | 4/02/24 | | | | BB– | | | | 436,917 | |
| | 490 | | | EUR | | Hellenic Republic Government Bond, Reg S | | | 3.500% | | | | 1/30/23 | | | | BB– | | | | 603,999 | |
| | | | | | Total Greece | | | | | | | | | | | | | | | 1,291,897 | |
| | | | | | |
| | | | | | Guatemala – 0.1% | | | | | | | | | | | | |
| | | | | | |
| | 205 | | | | | Guatemala Government Bond, 144A | | | 4.900% | | | | 6/01/30 | | | | BB | | | | 210,638 | |
| | | | | | |
| | | | | | Honduras – 0.2% | | | | | | | | | | | | |
| | | | | | |
| | 360 | | | | | Honduras Government International Bond, Reg S | | | 6.250% | | | | 1/19/27 | | | | BB– | | | | 386,554 | |
22
| | | | | | | | | | | | | | | | | | | | | | | | | | |
Principal
Amount (000) (5) | | | | | Description (1) | | | | | | Coupon | | | Maturity | | | Ratings (6) | | | Value | |
| | | | | | |
| | | | | | Hungary – 1.2% | | | | | | | | | | | | |
| | | | | | |
| $ | 894 | | | | | Hungary Government International Bond | | | 6.375% | | | | 3/29/21 | | | | BBB | | | $ | 954,256 | |
| | 1,084 | | | | | Hungary Government International Bond | | | 5.375% | | | | 2/21/23 | | | | BBB | | | | 1,192,433 | |
| | 196 | | | | | Hungary Government International Bond | | | 5.750% | | | | 11/22/23 | | | | BBB | | | | 222,091 | |
| | 390 | | | | | MFB Magyar Fejlesztesi Bank Zrt, Reg S | | | 6.250% | | | | 10/21/20 | | | | BBB | | | | 407,552 | |
| | | | | | Total Hungary | | | | | | | | | | | | | | | 2,776,332 | |
| | | | | | |
| | | | | | India – 0.1% | | | | | | | | | | | | |
| | | | | | |
| | 200 | | | | | Greenko Dutch BV, Reg S | | | 5.250% | | | | 7/24/24 | | | | Ba2 | | | | 196,488 | |
| | | | | | |
| | | | | | Indonesia – 0.9% | | | | | | | | | | | | |
| | | | | | |
| | 200 | | | | | Indonesia Government International Bond, Reg S | | | 4.350% | | | | 1/08/27 | | | | Baa2 | | | | 213,664 | |
| | 220 | | | | | Indonesia Government International Bond, Reg S | | | 4.625% | | | | 4/15/43 | | | | BBB | | | | 232,567 | |
| | 350 | | | | | Indonesia Government International Bond, Reg S | | | 5.250% | | | | 1/08/47 | | | | Baa2 | | | | 403,871 | |
| | 200,000 | | | IDR | | International Bank for Reconstruction & Development | | | 7.450% | | | | 8/20/21 | | | | AAA | | | | 14,370 | |
| | 3,100,000 | | | IDR | | International Finance Corp | | | 8.000% | | | | 10/09/23 | | | | AAA | | | | 230,753 | |
| | 200 | | | | | Medco Oak Tree Pte Ltd, 144A | | | 7.375% | | | | 5/14/26 | | | | B+ | | | | 200,574 | |
| | 200 | | | | | Minejesa Capital BV, Reg S | | | 4.625% | | | | 8/10/30 | | | | Baa3 | | | | 202,212 | |
| | 250 | | | | | Minejesa Capital BV, Reg S | | | 5.625% | | | | 8/10/37 | | | | Baa3 | | | | 262,288 | |
| | 200 | | | | | Perusahaan Listrik Negara PT, 144A | | | 5.450% | | | | 5/21/28 | | | | Baa2 | | | | 221,528 | |
| | | | | | Total Indonesia | | | | | | | | | | | | | | | 1,981,827 | |
| | | | | | |
| | | | | | Israel – 0.4% | | | | | | | | | | | | |
| | | | | | |
| | 875 | | | | | Israel Electric Corp Ltd, 144A, Reg S | | | 4.250% | | | | 8/14/28 | | | | BBB | | | | 909,790 | |
| | | | | | |
| | | | | | Jamaica – 0.4% | | | | | | | | | | | | |
| | | | | | |
| | 350 | | | | | Jamaica Government International Bond | | | 6.750% | | | | 4/28/28 | | | | B | | | | 397,254 | |
| | 130 | | | | | Jamaica Government International Bond | | | 8.000% | | | | 3/15/39 | | | | B | | | | 160,551 | |
| | 200 | | | | | Jamaica Government International Bond | | | 7.875% | | | | 7/28/45 | | | | B | | | | 247,002 | |
| | | | | | Total Jamaica | | | | | | | | | | | | | | | 804,807 | |
| | | | | | |
| | | | | | Jordan – 0.4% | | | | | | | | | | | | |
| | | | | | |
| | 200 | | | | | Jordan Government International Bond, 144A | | | 7.375% | | | | 10/10/47 | | | | B+ | | | | 205,880 | |
| | 400 | | | | | Jordan Government International Bond, Reg S | | | 5.750% | | | | 1/31/27 | | | | B+ | | | | 404,703 | |
| | 200 | | | | | Jordan Government International Bond, Reg S | | | 7.375% | | | | 10/10/47 | | | | B+ | | | | 205,743 | |
| | | | | | Total Jordan | | | | | | | | | | | | | | | 816,326 | |
| | | | | | |
| | | | | | Kazakhstan – 0.7% | | | | | | | | | | | | |
| | | | | | |
| | 330 | | | | | Development Bank of Kazakhstan JSC, Reg S | | | 6.500% | | | | 6/03/20 | | | | Baa3 | | | | 339,622 | |
| | 100 | | | EUR | | Kazakhstan Government International Bond, Reg S | | | 2.375% | | | | 11/09/28 | | | | BBB | | | | 123,107 | |
| | 380 | | | | | KazMunayGas National Co JSC, 144A | | | 3.875% | | | | 4/19/22 | | | | Baa3 | | | | 387,980 | |
| | 395 | | | | | KazMunayGas National Co JSC, 144A | | | 5.750% | | | | 4/19/47 | | | | Baa3 | | | | 446,765 | |
| | 200 | | | | | KazMunayGas National Co JSC, 144A | | | 6.375% | | | | 10/24/48 | | | | Baa3 | | | | 238,300 | |
| | | | | | Total Kazakhstan | | | | | | | | | | | | | | | 1,535,774 | |
| | | | | | |
| | | | | | Kenya – 0.4% | | | | | | | | | | | | |
| | | | | | |
| | 400 | | | | | Kenya Government International Bond, 144A | | | 7.000% | | | | 5/22/27 | | | | B+ | | | | 417,580 | |
| | 200 | | | | | Kenya Government International Bond, 144A | | | 8.000% | | | | 5/22/32 | | | | B+ | | | | 211,323 | |
| | 265 | | | | | Kenya Government International Bond, Reg S | | | 7.250% | | | | 2/28/28 | | | | B+ | | | | 274,450 | |
| | | | | | Total Kenya | | | | | | | | | | | | | | | 903,353 | |
| | | | | | |
| | | | | | Lebanon – 0.2% | | | | | | | | | | | | |
| | | | | | |
| | 160 | | | | | Lebanon Government International Bond, Reg S | | | 5.450% | | | | 11/28/19 | | | | B– | | | | 158,374 | |
| | 130 | | | | | Lebanon Government International Bond, Reg S | | | 5.800% | | | | 4/14/20 | | | | B– | | | | 126,100 | |
| | 130 | | | | | Lebanon Government International Bond, Reg S | | | 8.250% | | | | 4/12/21 | | | | B– | | | | 122,200 | |
| | | | | | Total Lebanon | | | | | | | | | | | | | | | 406,674 | |
| | | | | | |
| | | | | | Lithuania – 0.1% | | | | | | | | | | | | |
| | | | | | |
| | 200 | | | | | Lithuania Government International Bond, Reg S | | | 6.625% | | | | 2/01/22 | | | | A | | | | 220,774 | |
23
| | |
| |
| JDD | | Nuveen Diversified Dividend and Income Fund(continued) |
| | Portfolio of Investments June 30, 2019 |
| | (Unaudited) |
| | | | | | | | | | | | | | | | | | | | | | | | | | | | | | |
Principal
Amount (000) (5) | | | | | Description (1) | | | | | | | | Coupon | | | Maturity | | | Ratings (6) | | | Value | |
| | | | | | |
| | | | | | Luxembourg – 0.1% | | | | | | | | | | | | | |
| | | | | | |
| $ | 205 | | | | | Atento Luxco 1 SA, 144A | | | | 6.125% | | | | 8/10/22 | | | | BB | | | $ | 206,283 | |
| | | | | | |
| | | | | | Macedonia – 0.2% | | | | | | | | | | | | | |
| | | | | | |
| | 340 | | | EUR | | North Macedonia Government International Bond, Reg S | | | | 3.975% | | | | 7/24/21 | | | | BB+ | | | | 408,067 | |
| | | | | | |
| | | | | | Malaysia – 0.1% | | | | | | | | | | | | | |
| | | | | | |
| | 230 | | | | | Petronas Capital Ltd, Reg S | | | | 3.500% | | | | 3/18/25 | | | | A2 | | | | 239,824 | |
| | | | | | |
| | | | | | Mexico – 1.1% | | | | | | | | | | | | | |
| | | | | | |
| | 225 | | | | | Mexico City Airport Trust, Reg S | | | | 4.250% | | | | 10/31/26 | | | | BBB+ | | | | 223,762 | |
| | 400 | | | | | Mexico Government International Bond | | | | 4.125% | | | | 1/21/26 | | | | A3 | | | | 418,400 | |
| | 200 | | | | | Mexico Government International Bond | | | | 4.500% | | | | 4/22/29 | | | | A3 | | | | 214,400 | |
| | 310 | | | | | Petroleos Mexicanos | | | | 6.500% | | | | 3/13/27 | | | | BBB+ | | | | 305,722 | |
| | 55 | | | | | Petroleos Mexicanos | | | | 5.350% | | | | 2/12/28 | | | | BBB+ | | | | 50,056 | |
| | 205 | | | | | Petroleos Mexicanos | | | | 6.500% | | | | 1/23/29 | | | | BBB+ | | | | 198,337 | |
| | 160 | | | | | Petroleos Mexicanos | | | | 5.500% | | | | 6/27/44 | | | | BBB+ | | | | 128,120 | |
| | 792 | | | | | Petroleos Mexicanos | | | | 6.750% | | | | 9/21/47 | | | | BBB+ | | | | 705,276 | |
| | 316 | | | | | Petroleos Mexicanos | | | | 6.350% | | | | 2/12/48 | | | | BBB+ | | | | 271,286 | |
| | | | | | Total Mexico | | | | | | | | | | | | | | | | 2,515,359 | |
| | | | | | |
| | | | | | Morocco – 0.6% | | | | | | | | | | | | | |
| | | | | | |
| | 310 | | | | | Morocco Government International Bond, Reg S | | | | 5.500% | | | | 12/11/42 | | | | BBB– | | | | 352,202 | |
| | 410 | | | | | OCP SA, Reg S | | | | 5.625% | | | | 4/25/24 | | | | BBB– | | | | 441,113 | |
| | 295 | | | | | OCP SA, Reg S | | | | 4.500% | | | | 10/22/25 | | | | BBB– | | | | 301,841 | |
| | 280 | | | | | OCP SA, Reg S | | | | 6.875% | | | | 4/25/44 | | | | BBB– | | | | 321,736 | |
| | | | | | Total Morocco | | | | | | | | | | | | | | | | 1,416,892 | |
| | | | | | |
| | | | | | Netherlands – 0.2% | | | | | | | | | | | | | |
| | | | | | |
| | 425 | | | | | Petrobras Global Finance BV | | | | 5.750% | | | | 2/01/29 | | | | Ba2 | | | | 443,020 | |
| | | | | | |
| | | | | | Nigeria – 0.6% | | | | | | | | | | | | | |
| | | | | | |
| | 265 | | | | | Nigeria Government International Bond, 144A | | | | 6.500% | | | | 11/28/27 | | | | B+ | | | | 265,202 | |
| | 200 | | | | | Nigeria Government International Bond, 144A | | | | 7.143% | | | | 2/23/30 | | | | B+ | | | | 202,218 | |
| | 200 | | | | | Nigeria Government International Bond, Reg S | | | | 6.500% | | | | 11/28/27 | | | | B+ | | | | 200,153 | |
| | 645 | | | | | Nigeria Government International Bond, Reg S | | | | 7.875% | | | | 2/16/32 | | | | B+ | | | | 673,582 | |
| | | | | | Total Nigeria | | | | | | | | | | | | | | | | 1,341,155 | |
| | | | | | |
| | | | | | Oman – 0.6% | | | | | | | | | | | | | |
| | | | | | |
| | 260 | | | | | Oman Government International Bond, 144A | | | | 3.625% | | | | 6/15/21 | | | | Ba1 | | | | 256,100 | |
| | 400 | | | | | Oman Government International Bond, 144A | | | | 6.500% | | | | 3/08/47 | | | | Ba1 | | | | 345,013 | |
| | 305 | | | | | Oman Government International Bond, 144A | | | | 6.750% | | | | 1/17/48 | | | | Ba1 | | | | 268,761 | |
| | 455 | | | | | Oman Government International Bond, Reg S | | | | 3.625% | | | | 6/15/21 | | | | Ba1 | | | | 448,175 | |
| | | | | | Total Oman | | | | | | | | | | | | | | | | 1,318,049 | |
| | | | | | |
| | | | | | Panama – 0.4% | | | | | | | | | | | | | |
| | | | | | |
| | 200 | | | | | Aeropuerto Internacional de Tocumen SA, 144A | | | | 6.000% | | | | 11/18/48 | | | | BBB+ | | | | 235,600 | |
| | 365 | | | | | Panama Government International Bond | | | | 7.125% | | | | 1/29/26 | | | | BBB+ | | | | 453,622 | |
| | 330 | | | | | Panama Notas del Tesoro, 144A | | | | 3.750% | | | | 4/17/26 | | | | N/R | | | | 341,058 | |
| | | | | | Total Panama | | | | | | | | | | | | | | | | 1,030,280 | |
| | | | | | |
| | | | | | Papua New Guinea – 0.1% | | | | | | | | | | | | | |
| | | | | | |
| | 200 | | | | | Papua New Guinea Government International Bond, 144A | | | | 8.375% | | | | 10/04/28 | | | | B | | | | 213,000 | |
| | | | | | |
| | | | | | Paraguay – 0.9% | | | | | | | | | | | | | |
| | | | | | |
| | 200 | | | | | Paraguay Government International Bond, Reg S | | | | 4.625% | | | | 1/25/23 | | | | Ba1 | | | | 210,002 | |
| | 480 | | | | | Paraguay Government International Bond, Reg S | | | | 5.000% | | | | 4/15/26 | | | | Ba1 | | | | 524,405 | |
| | 360 | | | | | Paraguay Government International Bond, Reg S | | | | 4.700% | | | | 3/27/27 | | | | BB+ | | | | 389,704 | |
| | 725 | | | | | Paraguay Government International Bond, Reg S | | | | 6.100% | | | | 8/11/44 | | | | Ba1 | | | | 862,757 | |
| | | | | | Total Paraguay | | | | | | | | | | | | | | | | | | | | | | | 1,986,868 | |
24
| | | | | | | | | | | | | | | | | | | | | | | | | | | | | | |
Principal
Amount (000) (5) | | | | | Description (1) | | | | | | | | Coupon | | | Maturity | | | Ratings (6) | | | Value | |
| | |
| | | | | | Peru – 0.3% | |
| | | | | | |
| $ | 200 | | | | | Hunt Oil Co of Peru LLC Sucursal Del Peru, Reg S | | | | 6.375% | | | | 6/01/28 | | | | BBB | | | $ | 222,900 | |
| | 420 | | | | | Peru LNG Srl, 144A | | | | 5.375% | | | | 3/22/30 | | | | BBB– | | | | 450,870 | |
| | | | | | Total Peru | | | | | | | | | | | | | | | | 673,770 | |
| | | | | | |
| | | | | | Qatar – 1.2% | | | | | | | | | | | | | |
| | | | | | |
| | 540 | | | | | Qatar Government International Bond, 144A | | | | 4.000% | | | | 3/14/29 | | | | AA– | | | | 581,850 | |
| | 825 | | | | | Qatar Government International Bond, 144A | | | | 5.103% | | | | 4/23/48 | | | | AA– | | | | 982,781 | |
| | 200 | | | | | Qatar Government International Bond, 144A | | | | 4.817% | | | | 3/14/49 | | | | AA– | | | | 229,208 | |
| | 560 | | | | | Qatar Government International Bond, Reg S | | | | 2.375% | | | | 6/02/21 | | | | AA– | | | | 559,275 | |
| | 355 | | | | | Qatar Government International Bond, Reg S | | | | 4.500% | | | | 4/23/28 | | | | AA– | | | | 397,067 | |
| | | | | | Total Qatar | | | | | | | | | | | | | | | | 2,750,181 | |
| | | | | | |
| | | | | | Romania – 0.8% | | | | | | | | | | | | | |
| | | | | | |
| | 525 | | | | | Romanian Government International Bond, 144A | | | | 2.000% | | | | 12/08/26 | | | | BBB– | | | | 631,618 | |
| | 105 | | | EUR | | Romanian Government International Bond, 144A | | | | 4.625% | | | | 4/03/49 | | | | BBB– | | | | 144,091 | |
| | 150 | | | EUR | | Romanian Government International Bond, Reg S | | | | 2.875% | | | | 3/11/29 | | | | BBB– | | | | 188,872 | |
| | 395 | | | EUR | | Romanian Government International Bond, Reg S | | | | 3.875% | | | | 10/29/35 | | | | BBB– | | | | 514,384 | |
| | 196 | | | | | Romanian Government International Bond, Reg S | | | | 6.125% | | | | 1/22/44 | | | | BBB– | | | | 248,511 | |
| | | | | | Total Romania | | | | | | | | | | | | | | | | 1,727,476 | |
| | | | | | |
| | | | | | Russia – 2.5% | | | | | | | | | | | | | |
| | | | | | |
| | 14,035 | | | RUB | | Russian Federal Bond – OFZ | | | | 6.900% | | | | 5/23/29 | | | | BBB– | | | | 216,066 | |
| | 600 | | | | | Russian Foreign Bond – Eurobond, 144A | | | | 4.250% | | | | 6/23/27 | | | | BBB– | | | | 619,627 | |
| | 800 | | | | | Russian Foreign Bond – Eurobond, 144A | | | | 4.375% | | | | 3/21/29 | | | | BBB– | | | | 829,524 | |
| | 400 | | | | | Russian Foreign Bond – Eurobond, 144A | | | | 5.100% | | | | 3/28/35 | | | | BBB– | | | | 434,622 | |
| | 800 | | | | | Russian Foreign Bond – Eurobond, Reg S | | | | 4.875% | | | | 9/16/23 | | | | BBB– | | | | 855,722 | |
| | 600 | | | | | Russian Foreign Bond – Eurobond, Reg S | | | | 4.750% | | | | 5/27/26 | | | | BBB– | | | | 639,075 | |
| | 200 | | | | | Russian Foreign Bond – Eurobond, Reg S | | | | 4.750% | | | | 5/27/26 | | | | BBB– | | | | 213,025 | |
| | 800 | | | | | Russian Foreign Bond – Eurobond, Reg S | | | | 4.250% | | | | 6/23/27 | | | | BBB– | | | | 826,000 | |
| | 200 | | | | | Russian Foreign Bond – Eurobond, Reg S | | | | 4.375% | | | | 3/21/29 | | | | BBB– | | | | 207,381 | |
| | 400 | | | | | Russian Foreign Bond – Eurobond, Reg S | | | | 5.100% | | | | 3/28/35 | | | | BBB– | | | | 434,622 | |
| | 200 | | | | | Russian Foreign Bond – Eurobond, Reg S | | | | 5.625% | | | | 4/04/42 | | | | BBB– | | | | 234,520 | |
| | 200 | | | | | Russian Foreign Bond – Eurobond, Reg S | | | | 5.250% | | | | 6/23/47 | | | | BBB– | | | | 220,851 | |
| | | | | | Total Russia | | | | | | | | | | | | | | | | 5,731,035 | |
| | | | | | |
| | | | | | Saudi Arabia – 1.3% | | | | | | | | | | | | | |
| | | | | | |
| | 340 | | | | | Saudi Arabian Oil Co, 144A | | | | 2.750% | | | | 4/16/22 | | | | A1 | | | | 343,032 | |
| | 200 | | | | | Saudi Arabian Oil Co, 144A | | | | 3.500% | | | | 4/16/29 | | | | A1 | | | | 202,465 | |
| | 200 | | | | | Saudi Arabian Oil Co, 144A | | | | 4.250% | | | | 4/16/39 | | | | A1 | | | | 202,283 | |
| | 200 | | | | | Saudi Government International Bond, 144A | | | | 4.000% | | | | 4/17/25 | | | | A1 | | | | 212,750 | |
| | 350 | | | | | Saudi Government International Bond, Reg S | | | | 2.375% | | | | 10/26/21 | | | | A1 | | | | 349,363 | |
| | 885 | | | | | Saudi Government International Bond, Reg S | | | | 4.000% | | | | 4/17/25 | | | | A1 | | | | 941,415 | |
| | 200 | | | | | Saudi Government International Bond, Reg S | | | | 4.500% | | | | 4/17/30 | | | | A1 | | | | 218,046 | |
| | 545 | | | | | Saudi Government International Bond, Reg S | | | | 4.500% | | | | 10/26/46 | | | | A1 | | | | 553,814 | |
| | | | | | Total Saudi Arabia | | | | | | | | | | | | | | | | 3,023,168 | |
| | | | | | |
| | | | | | Senegal – 0.7% | | | | | | | | | | | | | |
| | | | | | |
| | 100 | | | EUR | | Senegal Government International Bond, 144A | | | | 4.750% | | | | 3/13/28 | | | | Ba3 | | | | 113,952 | |
| | 200 | | | | | Senegal Government International Bond, 144A | | | | 6.750% | | | | 3/13/48 | | | | Ba3 | | | | 187,810 | |
| | 200 | | | | | Senegal Government International Bond, Reg S | | | | 8.750% | | | | 5/13/21 | | | | Ba3 | | | | 217,952 | |
| | 365 | | | | | Senegal Government International Bond, Reg S | | | | 6.250% | | | | 7/30/24 | | | | Ba3 | | | | 390,748 | |
| | 200 | | | | | Senegal Government International Bond, Reg S | | | | 6.250% | | | | 5/23/33 | | | | Ba3 | | | | 193,423 | |
| | 210 | | | | | Senegal Government International Bond, Reg S | | | | 6.750% | | | | 3/13/48 | | | | Ba3 | | | | 197,067 | |
| | 200 | | | | | Senegal Government International Bond, Reg S | | | | 6.750% | | | | 3/13/48 | | | | Ba3 | | | | 187,683 | |
| | | | | | Total Senegal | | | | | | | | | | | | | | | | 1,488,635 | |
| | |
| | | | | | Serbia – 0.1% | |
| | | | | | | | |
| | 220 | | | | | Serbia International Bond, Reg S | | | | | | | | | | | 7.250% | | | | 9/28/21 | | | | BB | | | | 241,013 | |
| | |
| | | | | | South Africa – 0.5% | |
| | | | | | | | |
| | 270 | | | | | Eskom Holdings SOC Ltd, Reg S | | | | | | | | | | | 6.750% | | | | 8/06/23 | | | | B3 | | | | 282,571 | |
25
| | |
| |
| JDD | | Nuveen Diversified Dividend and Income Fund(continued) |
| | Portfolio of Investments June 30, 2019 |
| | (Unaudited) |
| | | | | | | | | | | | | | | | | | | | | | | | | | |
Principal
Amount (000) (5) | | | | | Description (1) | | | | | | Coupon | | | Maturity | | | Ratings (6) | | | Value | |
| | |
| | | | | | South Africa(continued) | |
| | | | | | |
| | 3,085 | | | ZAR | | Republic of South Africa Government Bond | | | 8.000% | | | | 1/31/30 | | | | Baa3 | | | $ | 206,898 | |
| | 410 | | | | | Republic of South Africa Government International Bond | | | 5.875% | | | | 6/22/30 | | | | Baa3 | | | | 444,626 | |
| | 200 | | | | | Republic of South Africa Government International Bond | | | 6.300% | | | | 6/22/48 | | | | Baa3 | | | | 219,782 | |
| | | | | | Total South Africa | | | | | | | | | | | | | | | 1,153,877 | |
| | | | | | |
| | | | | | Sri Lanka – 1.1% | | | | | | | | | | | | |
| | | | | | |
| | 305 | | | | | Sri Lanka Government International Bond, 144A | | | 6.850% | | | | 11/03/25 | | | | B | | | | 305,844 | |
| | 335 | | | | | Sri Lanka Government International Bond, 144A | | | 6.200% | | | | 5/11/27 | | | | B | | | | 317,418 | |
| | 200 | | | | | Sri Lanka Government International Bond, 144A | | | 7.850% | | | | 3/14/29 | | | | B | | | | 206,216 | |
| | 200 | | | | | Sri Lanka Government International Bond, 144A | | | 7.550% | | | | 3/28/30 | | | | B | | | | 200,432 | |
| | 200 | | | | | Sri Lanka Government International Bond, Reg S | | | 5.750% | | | | 1/18/22 | | | | B | | | | 200,541 | |
| | 415 | | | | | Sri Lanka Government International Bond, Reg S | | | 6.850% | | | | 11/03/25 | | | | B | | | | 416,148 | |
| | 200 | | | | | Sri Lanka Government International Bond, Reg S | | | 6.825% | | | | 7/18/26 | | | | B | | | | 199,296 | |
| | 680 | | | | | Sri Lanka Government International Bond, Reg S | | | 6.200% | | | | 5/11/27 | | | | B | | | | 644,310 | |
| | | | | | Total Sri Lanka | | | | | | | | | | | | | | | 2,490,205 | |
| | | | | | |
| | | | | | Tunisia – 0.4% | | | | | | | | | | | | |
| | | | | | |
| | 305 | | | EUR | | Banque Centrale de Tunisie International Bond, 144A | | | 6.750% | | | | 10/31/23 | | | | B+ | | | | 355,257 | |
| | 500 | | | | | Banque Centrale de Tunisie International Bond, Reg S | | | 5.750% | | | | 2/17/24 | | | | B+ | | | | 464,758 | |
| | 200 | | | | | Banque Centrale de Tunisie International Bond, Reg S | | | 5.750% | | | | 1/30/25 | | | | B+ | | | | 186,900 | |
| | | | | | Total Tunisia | | | | | | | | | | | | | | | 1,006,915 | |
| | | | | | |
| | | | | | Turkey – 1.7% | | | | | | | | | | | | |
| | | | | | |
| | 200 | | | | | Export Credit Bank of Turkey, 144A | | | 8.250% | | | | 1/24/24 | | | | BB– | | | | 208,798 | |
| | 870 | | | | | Turkey Government International Bond | | | 7.000% | | | | 6/05/20 | | | | BB | | | | 889,627 | |
| | 345 | | | | | Turkey Government International Bond | | | 5.625% | | | | 3/30/21 | | | | BB | | | | 349,821 | |
| | 200 | | | | | Turkey Government International Bond | | | 7.250% | | | | 12/23/23 | | | | BB | | | | 206,626 | |
| | 100 | | | EUR | | Turkey Government International Bond | | | 4.625% | | | | 3/31/25 | | | | BB | | | | 113,298 | |
| | 175 | | | EUR | | Turkey Government International Bond | | | 5.200% | | | | 2/16/26 | | | | BB | | | | 200,845 | |
| | 410 | | | | | Turkey Government International Bond | | | 4.875% | | | | 10/09/26 | | | | BB | | | | 366,950 | |
| | 250 | | | | | Turkey Government International Bond | | | 6.000% | | | | 3/25/27 | | | | BB | | | | 237,500 | |
| | 475 | | | | | Turkey Government International Bond | | | 5.125% | | | | 2/17/28 | | | | BB | | | | 424,382 | |
| | 200 | | | | | Turkey Government International Bond | | | 6.875% | | | | 3/17/36 | | | | BB | | | | 191,489 | |
| | 400 | | | | | Turkey Government International Bond | | | 6.000% | | | | 1/14/41 | | | | BB | | | | 345,000 | |
| | 495 | | | | | Turkey Government International Bond | | | 5.750% | | | | 5/11/47 | | | | BB | | | | 414,606 | |
| | | | | | Total Turkey | | | | | | | | | | | | | | | 3,948,942 | |
| | | | | | |
| | | | | | Ukraine – 0.7% | | | | | | | | | | | | |
| | | | | | |
| | 117 | | | | | Ukraine Government International Bond, 144A | | | 7.750% | | | | 9/01/21 | | | | B– | | | | 122,115 | |
| | 100 | | | | | Ukraine Government International Bond, 144A | | | 7.750% | | | | 9/01/27 | | | | B– | | | | 102,752 | |
| | 643 | | | | | Ukraine Government International Bond, 144A | | | 7.375% | | | | 9/25/32 | | | | B– | | | | 631,555 | |
| | 100 | | | | | Ukraine Government International Bond, Reg S | | | 7.750% | | | | 9/01/25 | | | | B– | | | | 103,414 | |
| | 215 | | | | | Ukraine Government International Bond, Reg S | | | 7.750% | | | | 9/01/26 | | | | B– | | | | 221,371 | |
| | 190 | | | | | Ukraine Government International Bond, Reg S | | | 7.750% | | | | 9/01/26 | | | | B– | | | | 195,630 | |
| | 255 | | | | | Ukraine Government International Bond, Reg S | | | 7.375% | | | | 9/25/32 | | | | B– | | | | 250,473 | |
| | | | | | Total Ukraine | | | | | | | | | | | | | | | 1,627,310 | |
| | | | | | |
| | | | | | United Arab Emirates – 0.4% | | | | | | | | | | | | |
| | | | | | |
| | 200 | | | | | Abu Dhabi National Energy Co PJSC, 144A | | | 4.875% | | | | 4/23/30 | | | | A | | | | 219,750 | |
| | 360 | | | | | Abu Dhabi National Energy Co PJSC, Reg S | | | 4.375% | | | | 6/22/26 | | | | A | | | | 381,606 | |
| | 200 | | | | | Abu Dhabi National Energy Co PJSC, Reg S | | | 4.875% | | | | 4/23/30 | | | | A | | | | 219,727 | |
| | 200 | | | | | Oztel Holdings SPC Ltd, 144A | | | 6.625% | | | | 4/24/28 | | | | Ba1 | | | | 196,122 | |
| | | | | | Total United Arab Emirates | | | | | | | | | | | | | | | 1,017,205 | |
| | |
| | | | | | Venezuela – 0.3% | |
| | | | | | |
| | 1,877 | | | | | Petroleos de Venezuela SA, Reg S, (7) | | | 6.000% | | | | 11/15/26 | | | | N/R | | | | 281,513 | |
| | 360 | | | | | Venezuela Government International Bond, Reg S, (7) | | | 9.000% | | | | 5/07/23 | | | | CCC | | | | 95,400 | |
| | 1,040 | | | | | Venezuela Government International Bond, Reg S, (7) | | | 9.250% | | | | 5/07/28 | | | | C | | | | 274,300 | |
| | | | | | Total Venezuela | | | | | | | | | | | | | | | 651,213 | |
| | | | | | |
| | | | | | Zambia – 0.1% | | | | | | | | | | | | |
| | | | | | |
| | 325 | | | | | Zambia Government International Bond, Reg S | | | 8.970% | | | | 7/30/27 | | | | B– | | | | 217,829 | |
| | | | | | Total Emerging Market Debt and Foreign Corporate Bonds (cost $79,708,829) | | | | | | | | 81,835,812 | |
26
| | | | | | | | | | | | | | | | | | | | | | | | | | | | | | |
Principal
Amount (000) | | | | | Description (1) | | Coupon (8) | | | Reference
Rate (8) | | | Spread (8) | | | Maturity (9) | | | Ratings (6) | | | Value | |
| | |
| | | | | | VARIABLE RATE SENIOR LOAN INTERESTS – 31.8% (21.8% of Total Investments) (8) | |
| | |
| | | | | | Aerospace & Defense – 0.3% | |
| | | | | | | | |
| $ | 186 | | | | | Rexnord LLC/ RBS Global, Inc., Term Loan, First Lien | | | 4.402% | | | | 1-Month LIBOR | | | | 2.000% | | | | 8/21/24 | | | | BBB– | | | $ | 185,944 | |
| | 485 | | | | | Transdigm, Inc., Term Loan F | | | 4.830% | | | | 3-Month LIBOR | | | | 2.500% | | | | 6/09/23 | | | | Ba3 | | | | 477,031 | |
| | 671 | | | | | Total Aerospace & Defense | | | | | | | | | | | | | | | | | | | | | | | 662,975 | |
| | |
| | | | | | Airlines – 1.0% | |
| | | | | | | | |
| | 428 | | | | | American Airlines, Inc., Term Loan 2025 | | | 4.061% | | | | 3-Month LIBOR | | | | 1.750% | | | | 6/27/25 | | | | BB+ | | | | 417,007 | |
| | 1,940 | | | | | American Airlines, Inc., Term Loan B | | | 4.402% | | | | 1-Month LIBOR | | | | 2.000% | | | | 4/28/23 | | | | BB+ | | | | 1,915,265 | |
| | 2,368 | | | | | Total Airlines | | | | | | | | | | | | | | | | | | | | | | | 2,332,272 | |
| | |
| | | | | | Auto Components – 0.1% | |
| | | | | | | | |
| | 300 | | | | | Johnson Controls Inc., Term Loan B | | | 5.902% | | | | 1-Month LIBOR | | | | 3.500% | | | | 4/30/26 | | | | Ba3 | | | | 298,219 | |
| | |
| | | | | | Beverages – 0.2% | |
| | | | | | | | |
| | 418 | | | | | Jacobs Douwe Egberts, Term Loan B | | | 4.500% | | | | 1-Month LIBOR | | | | 2.000% | | | | 11/01/25 | | | | Ba2 | | | | 416,724 | |
| | |
| | | | | | Biotechnology – 0.3% | |
| | | | | | | | |
| | 733 | | | | | Grifols, Inc., Term Loan B | | | 4.635% | | | | 1-Week LIBOR | | | | 2.250% | | | | 1/31/25 | | | | BB | | | | 731,956 | |
| | |
| | | | | | Building Products – 0.4% | |
| | | | | | | | |
| | 112 | | | | | Fairmount, Initial Term Loan | | | 6.598% | | | | 3-Month LIBOR | | | | 4.000% | | | | 6/01/25 | | | | BB– | | | | 91,540 | |
| | 865 | | | | | Quikrete Holdings, Inc., Term Loan B | | | 5.152% | | | | 1-Month LIBOR | | | | 2.750% | | | | 11/15/23 | | | | BB– | | | | 850,844 | |
| | 977 | | | | | Total Building Products | | | | | | | | | | | | | | | | | | | | | | | 942,384 | |
| | |
| | | | | | Capital Markets – 0.4% | |
| | | | | | | | |
| | 494 | | | | | Lions Gate Entertainment Corporation, Term Loan A | | | 4.152% | | | | 1-Month LIBOR | | | | 2.000% | | | | 3/22/23 | | | | Ba2 | | | | 490,356 | |
| | 468 | | | | | RPI Finance Trust, Term Loan B6 | | | 4.402% | | | | 1-Month LIBOR | | | | 2.000% | | | | 4/17/23 | | | | BBB– | | | | 468,903 | |
| | 962 | | | | | Total Capital Markets | | | | | | | | | | | | | | | | | | | | | | | 959,259 | |
| | |
| | | | | | Chemicals – 0.5% | |
| | | | | | | | |
| | 647 | | | | | Axalta Coating Systems, Term Loan, First Lien | | | 4.080% | | | | 3-Month LIBOR | | | | 1.750% | | | | 6/01/24 | | | | BBB– | | | | 640,114 | |
| | 441 | | | | | H.B. Fuller Company, Term Loan B | | | 4.383% | | | | 1-Month LIBOR | | | | 2.000% | | | | 10/21/24 | | | | BB+ | | | | 433,915 | |
| | 151 | | | | | Mineral Technologies, Inc., Term Loan B2 | | | 4.750% | | | | N/A | | | | N/A | | | | 5/07/21 | | | | BB+ | | | | 151,901 | |
| | 1,239 | | | | | Total Chemicals | | | | | | | | | | | | | | | | | | | | | | | 1,225,930 | |
| | |
| | | | | | Commercial Services & Supplies – 1.0% | |
| | | | | | | | |
| | 695 | | | | | ADS Waste Holdings, Inc., Term Loan B | | | 4.635% | | | | 1-Week LIBOR | | | | 2.250% | | | | 11/10/23 | | | | BB+ | | | | 694,901 | |
| | 200 | | | | | Brand Energy & Infrastructure Services, Inc., Term Loan B, First Lien | | | 6.788% | | | | 3-Month LIBOR | | | | 4.250% | | | | 6/21/24 | | | | B– | | | | 193,269 | |
| | 1,037 | | | | | Formula One Group, Term Loan B | | | 4.902% | | | | 1-Month LIBOR | | | | 2.500% | | | | 2/01/24 | | | | B+ | | | | 1,017,328 | |
| | 246 | | | | | Trans Union LLC, Term Loan B3, (WI/DD) | | | TBD | | | | TBD | | | | TBD | | | | TBD | | | | BB+ | | | | 245,778 | |
| | 42 | | | | | West Corporation, Incremental Term Loan B1 | | | 6.022% | | | | 3-Month LIBOR | | | | 3.500% | | | | 10/10/24 | | | | B1 | | | | 39,055 | |
| | 2,220 | | | | | Total Commercial Services & Supplies | | | | | | | | | | | | | | | | | | | | | | | 2,190,331 | |
| | |
| | | | | | Communications Equipment – 1.0% | |
| | | | | | | | |
| | 500 | | | | | CommScope, Inc., Term Loan B | | | 5.652% | | | | 1-Month LIBOR | | | | 3.250% | | | | 4/04/26 | | | | Ba1 | | | | 499,250 | |
| | 519 | | | | | Plantronics, Term Loan B | | | 4.902% | | | | 1-Month LIBOR | | | | 2.500% | | | | 7/02/25 | | | | Ba1 | | | | 517,094 | |
| | 1,347 | | | | | Univision Communications, Inc., Term Loan C5 | | | 5.152% | | | | 1-Month LIBOR | | | | 2.750% | | | | 3/15/24 | | | | B | | | | 1,284,328 | |
| | 2,366 | | | | | Total Communications Equipment | | | | | | | | | | | | | | | | | | | | | | | 2,300,672 | |
| | |
| | | | | | Consumer Finance – 0.4% | |
| | | | | | | | |
| | 494 | | | | | Vantiv LLC, Repriced Term Loan B4 | | | 4.145% | | | | 1-Week LIBOR | | | | 1.750% | | | | 8/20/24 | | | | BBB– | | | | 494,100 | |
| | 369 | | | | | Verscend Technologies, Tern Loan B, (DD1) | | | 6.902% | | | | 1-Month LIBOR | | | | 4.500% | | | | 8/27/25 | | | | B+ | | | | 369,754 | |
| | 863 | | | | | Total Consumer Finance | | | | | | | | | | | | | | | | | | | | | | | 863,854 | |
27
| | |
| |
| JDD | | Nuveen Diversified Dividend and Income Fund(continued) |
| | Portfolio of Investments June 30, 2019 |
| | (Unaudited) |
| | | | | | | | | | | | | | | | | | | | | | | | | | | | | | |
Principal
Amount (000) | | | | | Description (1) | | Coupon (8) | | | Reference
Rate (8) | | | Spread (8) | | | Maturity (9) | | | Ratings (6) | | | Value | |
| | |
| | | | | | Containers & Packaging – 0.2% | |
| | | | | | | | |
| $ | 349 | | | | | Berry Global, Inc., Term Loan Q | | | 4.412% | | | | 1-Month LIBOR | | | | 2.000% | | | | 10/03/22 | | | | BBB– | | | $ | 347,412 | |
| | |
| | | | | | Distributors – 0.2% | |
| | | | | | | | |
| | 387 | | | | | SRS Distribution, Inc., Term Loan B | | | 5.652% | | | | 1-Month LIBOR | | | | 3.250% | | | | 5/24/25 | | | | B3 | | | | 372,067 | |
| | |
| | | | | | Diversified Consumer Services – 0.2% | |
| | | | | | | | |
| | 498 | | | | | Refinitiv, Term Loan B | | | 6.152% | | | | 1-Month LIBOR | | | | 3.750% | | | | 10/01/25 | | | | B | | | | 483,274 | |
| | |
| | | | | | Diversified Financial Services – 0.2% | |
| | | | | | | | |
| | 188 | | | | | Lions Gate Entertainment Corp., Term Loan B | | | 4.652% | | | | 1-Month LIBOR | | | | 2.250% | | | | 3/24/25 | | | | Ba2 | | | | 186,425 | |
| | 9 | | | | | Veritas US, Inc., Term Loan B1 | | | 6.890% | | | | 3-Month LIBOR | | | | 4.500% | | | | 1/27/23 | | | | B | | | | 8,374 | |
| | 574 | | | | | Walter Investment Management Corporation, Tranche B, Term Loan, First Lien, (7) | | | 0.000% | | | | N/A | | | | N/A | | | | 6/30/22 | | | | Ca | | | | 209,543 | |
| | 771 | | | | | Total Diversified Financial Services | | | | | | | | | | | | | | | | | | | | | | | 404,342 | |
| | |
| | | | | | Diversified Telecommunication Services – 1.7% | |
| | | | | | | | |
| | 1,206 | | | | | CenturyLink, Inc., Term Loan B | | | 5.152% | | | | 1-Month LIBOR | | | | 2.750% | | | | 1/31/25 | | | | BBB– | | | | 1,180,330 | |
| | 760 | | | | | Frontier Communications Corporation, Term Loan B | | | 6.160% | | | | 1-Month LIBOR | | | | 3.750% | | | | 6/15/24 | | | | B2 | | | | 747,019 | |
| | 78 | | | | | Intelsat Jackson Holdings, S.A., Term Loan B4 | | | 6.904% | | | | 1-Month LIBOR | | | | 4.500% | | | | 1/02/24 | | | | B1 | | | | 78,752 | |
| | 125 | | | | | Intelsat Jackson Holdings, S.A., Term Loan B5 | | | 6.625% | | | | N/A | | | | N/A | | | | 1/02/24 | | | | B1 | | | | 126,145 | |
| | 227 | | | | | Level 3 Financing, Inc., Tranche B, Term Loan | | | 4.652% | | | | 1-Month LIBOR | | | | 2.250% | | | | 2/22/24 | | | | BBB– | | | | 225,255 | |
| | 498 | | | | | Numericable Group S.A., Term Loan B13 | | | 6.394% | | | | 1-Month LIBOR | | | | 4.000% | | | | 8/14/26 | | | | B | | | | 488,067 | |
| | 1,000 | | | | | Ziggo B.V., Term Loan E | | | 4.894% | | | | 1-Month LIBOR | | | | 2.500% | | | | 4/15/25 | | | | B+ | | | | 981,250 | |
| | 3,894 | | | | | Total Diversified Telecommunication Services | | | | | | | | | | | | | | | | | | | | 3,826,818 | |
| | |
| | | | | | Electric Utilities – 0.4% | |
| | | | | | | | |
| | 542 | | | | | Vistra Operations Co., Term Loan B1 | | | 4.402% | | | | 1-Month LIBOR | | | | 2.000% | | | | 8/04/23 | | | | BBB– | | | | 541,861 | |
| | 257 | | | | | Vistra Operations Co., Term Loan B3 | | | 4.397% | | | | 3-Month LIBOR | | | | 2.000% | | | | 12/31/25 | | | | BBB– | | | | 257,618 | |
| | 799 | | | | | Total Electric Utilities | | | | | | | | | | | | | | | | | | | | | | | 799,479 | |
| | |
| | | | | | Energy Equipment & Services – 0.1% | |
| | | | | | | | |
| | 160 | | | | | Seadrill Partners LLC, Initial Term Loan | | | 8.330% | | | | 3-Month LIBOR | | | | 6.000% | | | | 2/21/21 | | | | CCC+ | | | | 115,432 | |
| | |
| | | | | | Equity Real Estate Investment Trust – 0.6% | |
| | | | | | | | |
| | 556 | | | | | Communications Sales & Leasing, Inc., Shortfall Term Loan | | | 7.402% | | | | 1-Month LIBOR | | | | 5.000% | | | | 10/24/22 | | | | Caa1 | | | | 543,346 | |
| | 726 | | | | | MGM Growth Properties, Term Loan B | | | 4.402% | | | | 1-Month LIBOR | | | | 2.000% | | | | 3/23/25 | | | | BB+ | | | | 722,055 | |
| | 1,282 | | | | | Total Equity Real Estate Investment Trust | | | | | | | | | | | | | | | | 1,265,401 | |
| | |
| | | | | | Food & Staples Retailing – 1.6% | |
| | | | | | | | |
| | 1,373 | | | | | Albertson’s LLC, Term Loan B7 | | | 5.402% | | | | 1-Month LIBOR | | | | 3.000% | | | | 11/17/25 | | | | Ba2 | | | | 1,368,133 | |
| | 2,270 | | | | | US Foods, Inc., Term Loan B | | | 4.402% | | | | 1-Month LIBOR | | | | 2.000% | | | | 6/27/23 | | | | BBB– | | | | 2,257,226 | |
| | 3,643 | | | | | Total Food & Staples Retailing | | | | | | | | | | | | | | | | | | | | | | | 3,625,359 | |
| | |
| | | | | | Health Care Equipment & Supplies – 0.2% | |
| | | | | | | | |
| | 436 | | | | | Acelity, Term Loan B | | | 5.580% | | | | 3-Month LIBOR | | | | 3.250% | | | | 2/03/24 | | | | B1 | | | | 437,192 | |
| | |
| | | | | | Health Care Providers & Services – 2.2% | |
| | | | | | | | |
| | 775 | | | | | Acadia Healthcare, Inc., Term Loan B3 | | | 4.902% | | | | 1-Month LIBOR | | | | 2.500% | | | | 2/11/22 | | | | Ba2 | | | | 772,404 | |
| | 60 | | | | | Air Medical Group Holdings, Inc., Term Loan B, (DD1) | | | 5.644% | | | | 1-Month LIBOR | | | | 3.250% | | | | 4/28/22 | | | | B1 | | | | 57,205 | |
| | 231 | | | | | Brightspring Health, Term Loan B | | | 6.921% | | | | 1-Month LIBOR | | | | 4.500% | | | | 3/05/26 | | | | B1 | | | | 230,082 | |
| | 394 | | | | | ConvaTec Healthcare, Term Loan B | | | 4.580% | | | | 3-Month LIBOR | | | | 2.250% | | | | 10/25/23 | | | | BB | | | | 393,447 | |
| | 790 | | | | | DaVita HealthCare Partners, Inc., Tranche B, Term Loan | | | 5.135% | | | | 1-Week LIBOR | | | | 2.750% | | | | 6/24/21 | | | | BBB– | | | | 790,403 | |
28
| | | | | | | | | | | | | | | | | | | | | | | | | | | | | | |
Principal
Amount (000) | | | | | Description (1) | | Coupon (8) | | | Reference
Rate (8) | | | Spread (8) | | | Maturity (9) | | | Ratings (6) | | | Value | |
| | |
| | | | | | Health Care Providers & Services(continued) | |
| | | | | | | | |
| $ | 1,223 | | | | | HCA, Inc., Term Loan B10 | | | 4.330% | | | | 3-Month LIBOR | | | | 2.000% | | | | 3/13/25 | | | | BBB– | | | $ | 1,225,545 | |
| | 545 | | | | | HCA, Inc., Term Loan B11, (DD1) | | | 4.080% | | | | 3-Month LIBOR | | | | 1.750% | | | | 3/17/23 | | | | BBB– | | | | 545,769 | |
| | 266 | | | | | Millennium Laboratories, Inc., Term Loan B, First Lien | | | 8.902% | | | | 1-Month LIBOR | | | | 6.500% | | | | 12/21/20 | | | | Caa3 | | | | 123,152 | |
| | 910 | | | | | Select Medical Corporation, Term Loan B | | | 4.850% | | | | 3-Month LIBOR | | | | 2.500% | | | | 3/06/25 | | | | Ba2 | | | | 907,907 | |
| | 5,194 | | | | | Total Health Care Providers & Services | | | | | | | | | | | | | | | | | | | | | | | 5,045,914 | |
| | |
| | | | | | Health Care Technology – 0.6% | |
| | | | | | | | |
| | 1,279 | | | | | Emdeon, Inc., Term Loan, (DD1) | | | 4.902% | | | | 1-Month LIBOR | | | | 2.750% | | | | 3/01/24 | | | | B+ | | | | 1,270,927 | |
| | |
| | | | | | Hotels, Restaurants & Leisure – 3.7% | |
| | | | | | | | |
| | 1,016 | | | | | 24 Hour Fitness Worldwide, Inc., Term Loan B | | | 5.902% | | | | 1-Month LIBOR | | | | 3.500% | | | | 5/31/25 | | | | Ba3 | | | | 1,013,275 | |
| | 466 | | | | | Aramark Corporation, Term Loan | | | 4.080% | | | | 3-Month LIBOR | | | | 1.750% | | | | 3/11/25 | | | | BBB– | | | | 465,457 | |
| | 1,746 | | | | | Burger King Corporation, Term Loan B3 | | | 4.652% | | | | 1-Month LIBOR | | | | 2.250% | | | | 2/16/24 | | | | Ba3 | | | | 1,736,234 | |
| | 557 | | | | | Caesars Entertainment Operating Company, Inc., Term Loan B | | | 4.402% | | | | 1-Month LIBOR | | | | 2.000% | | | | 10/06/24 | | | | BB | | | | 552,652 | |
| | 989 | | | | | Caesars Resort Collection, Term Loan, First Lien, (DD1) | | | 5.152% | | | | 1-Month LIBOR | | | | 2.750% | | | | 12/22/24 | | | | BB | | | | 973,197 | |
| | 500 | | | | | Carrols Restaurant Group Inc., Term Loan B | | | 5.660% | | | | 1-Month LIBOR | | | | 3.250% | | | | 4/30/26 | | | | B | | | | 497,812 | |
| | 853 | | | | | Hilton Hotels, Term Loan B2 | | | 4.154% | | | | 1-Month LIBOR | | | | 1.750% | | | | 6/21/26 | | | | BBB– | | | | 854,038 | |
| | 494 | | | | | Las Vegas Sands Corporation, Term Loan B | | | 4.152% | | | | 1-Month LIBOR | | | | 1.750% | | | | 3/27/25 | | | | BBB– | | | | 490,709 | |
| | 497 | | | | | Marriott Ownership Resorts, Term Loan B | | | 4.652% | | | | 1-Month LIBOR | | | | 2.250% | | | | 8/29/25 | | | | Baa3 | | | | 498,331 | |
| | 771 | | | | | Seaworld Parks and Entertainment, Inc., Term Loan B5 | | | 5.402% | | | | 1-Month LIBOR | | | | 3.000% | | | | 3/31/24 | | | | B+ | | | | 770,370 | |
| | 486 | | | | | YUM Brands, Term Loan B | | | 4.132% | | | | 1-Month LIBOR | | | | 1.750% | | | | 4/03/25 | | | | BBB– | | | | 486,026 | |
| | 8,375 | | | | | Total Hotels, Restaurants & Leisure | | | | | | | | | | | | | | | | | | | | | | | 8,338,101 | |
| | |
| | | | | | Household Durables – 0.2% | |
| | | | | | | | |
| | 611 | | | | | Serta Simmons Holdings LLC, Term Loan, First Lien | | | 5.908% | | | | 1-Month LIBOR | | | | 3.500% | | | | 11/08/23 | | | | CCC+ | | | | 398,653 | |
| | |
| | | | | | Household Products – 0.5% | |
| | | | | | | | |
| | 1,242 | | | | | Reynolds Group Holdings, Inc., Term Loan, First Lien | | | 5.152% | | | | 1-Month LIBOR | | | | 2.750% | | | | 2/05/23 | | | | B+ | | | | 1,234,162 | |
| | |
| | | | | | Interactive Media & Services – 0.2% | |
| | | | | | | | |
| | 501 | | | | | Rackspace Hosting, Inc., Refinancing Term B Loan, First Lien, (DD1) | | | 5.576% | | | | 3-Month LIBOR | | | | 3.000% | | | | 11/03/23 | | | | BB– | | | | 463,532 | |
| | |
| | | | | | Internet & Direct Marketing Retail – 0.2% | |
| | | | | | | | |
| | 495 | | | | | Uber Technologies, Inc., Term Loan | | | 6.411% | | | | 1-Month LIBOR | | | | 4.000% | | | | 4/04/25 | | | | B1 | | | | 495,928 | |
| | |
| | | | | | Internet Software & Services – 0.2% | |
| | | | | | | | |
| | 486 | | | | | Ancestry.com, Inc., Term Loan, First Lien | | | 5.660% | | | | 1-Month LIBOR | | | | 3.250% | | | | 10/19/23 | | | | B | | | | 486,048 | |
| | |
| | | | | | IT Services – 1.8% | |
| | | | | | | | |
| | 492 | | | | | First Data Corporation, Term Loan, First Lien | | | 4.404% | | | | 1-Month LIBOR | | | | 2.000% | | | | 7/10/22 | | | | BB | | | | 491,972 | |
| | 412 | | | | | First Data Corporation, Term Loan, First Lien | | | 4.404% | | | | 1-Month LIBOR | | | | 2.000% | | | | 4/26/24 | | | | BB | | | | 412,476 | |
| | 349 | | | | | Gartner, Inc., Term Loan A | | | 3.902% | | | | 1-Month LIBOR | | | | 1.500% | | | | 3/20/22 | | | | BB+ | | | | 349,984 | |
| | 416 | | | | | GTT Communications, Inc., Term Loan, First Lien | | | 5.150% | | | | 1-Month LIBOR | | | | 2.750% | | | | 5/31/25 | | | | B2 | | | | 373,607 | |
| | 970 | | | | | Leidos Holdings, Inc., Term Loan B | | | 4.188% | | | | 1-Month LIBOR | | | | 1.750% | | | | 8/22/25 | | | | BBB– | | | | 970,757 | |
| | 490 | | | | | Tempo Acquisition LLC, Term Loan B | | | 5.402% | | | | 1-Month LIBOR | | | | 3.000% | | | | 5/01/24 | | | | B1 | | | | 488,775 | |
| | 300 | | | | | Travelport LLC, Term Loan B | | | 7.541% | | | | 6-Month LIBOR | | | | 5.000% | | | | 5/30/26 | | | | B+ | | | | 283,031 | |
| | 159 | | | | | West Corporation, Term Loan B | | | 6.522% | | | | 3-Month LIBOR | | | | 4.000% | | | | 10/10/24 | | | | B1 | | | | 148,330 | |
| | 485 | | | | | WEX, Inc., Term Loan B3, (WI/DD) | | | TBD | | | | TBD | | | | TBD | | | | TBD | | | | BB– | | | | 481,571 | |
| | 4,073 | | | | | Total IT Services | | | | | | | | | | | | | | | | | | | | | | | 4,000,503 | |
| | |
| | | | | | Life Sciences Tools & Services – 0.1% | |
| | | | | | | | |
| | 238 | | | | | Inventiv Health, Inc, Term Loan B | | | 4.402% | | | | 1-Month LIBOR | | | | 2.000% | | | | 8/01/24 | | | | BB | | | | 237,812 | |
29
| | |
| |
| JDD | | Nuveen Diversified Dividend and Income Fund(continued) |
| | Portfolio of Investments June 30, 2019 |
| | (Unaudited) |
| | | | | | | | | | | | | | | | | | | | | | | | | | | | | | |
Principal
Amount (000) | | | | | Description (1) | | Coupon (8) | | | Reference
Rate (8) | | | Spread (8) | | | Maturity (9) | | | Ratings (6) | | | Value | |
| | |
| | | | | | Machinery – 0.1% | |
| | | | | | | | |
| $ | 284 | | | | | Gates Global LLC, Term Loan B | | | 5.152% | | | | 1-Month LIBOR | | | | 2.750% | | | | 4/01/24 | | | | B+ | | | $ | 282,881 | |
| | |
| | | | | | Marine – 0.0% | |
| | | | | | | | |
| | 112 | | | | | Harvey Gulf International Marine, Inc., Exit Term Loan | | | 8.743% | | | | 3-Month LIBOR | | | | 6.000% | | | | 7/02/23 | | | | B | | | | 107,223 | |
| | |
| | | | | | Media – 3.1% | |
| | | | | | | | |
| | 500 | | | | | CBS Outdoor Americas Inc., Term Loan B, (WI/DD) | | | TBD | | | | TBD | | | | TBD | | | | TBD | | | | BB+ | | | | 500,080 | |
| | 881 | | | | | Cequel Communications LLC, Term Loan B | | | 4.644% | | | | 1-Month LIBOR | | | | 2.250% | | | | 1/15/26 | | | | BB | | | | 868,769 | |
| | 943 | | | | | Charter Communications Operating Holdings LLC, Term Loan B | | | 4.330% | | | | 3-Month LIBOR | | | | 2.000% | | | | 4/30/25 | | | | BBB– | | | | 943,137 | |
| | 205 | | | | | Cineworld Group PLC, Term Loan B | | | 4.652% | | | | 1-Month LIBOR | | | | 2.250% | | | | 2/28/25 | | | | BB– | | | | 202,449 | |
| | 453 | | | | | Clear Channel Communications, Inc., Exit Term Loan, (DD1) | | | 6.579% | | | | 3-Month LIBOR | | | | 4.000% | | | | 5/01/26 | | | | BB– | | | | 453,908 | |
| | 353 | | | | | Cumulus Media, Inc., Exit Term Loan | | | 6.910% | | | | 1-Month LIBOR | | | | 4.500% | | | | 5/15/22 | | | | B | | | | 352,889 | |
| | 499 | | | | | EW Scripps, Term Loan B | | | 5.152% | | | | 1-Month LIBOR | | | | 2.750% | | | | 5/01/26 | | | | BB | | | | 498,438 | |
| | 276 | | | | | Gray Television, Inc., Term Loan B2 | | | 4.681% | | | | 1-Month LIBOR | | | | 2.250% | | | | 2/07/24 | | | | BB | | | | 275,813 | |
| | 511 | | | | | Intelsat Jackson Holdings, S.A., Term Loan B | | | 6.154% | | | | 1-Month LIBOR | | | | 3.750% | | | | 11/27/23 | | | | B1 | | | | 506,422 | |
| | 386 | | | | | Meredith Corporation, Tranche Term Loan B1 | | | 5.152% | | | | 1-Month LIBOR | | | | 2.750% | | | | 1/31/25 | | | | BB | | | | 386,005 | |
| | 86 | | | | | Nexstar Broadcasting, Inc., Term Loan B3 | | | 4.690% | | | | 1-Month LIBOR | | | | 2.250% | | | | 1/17/24 | | | | BB | | | | 85,732 | |
| | 432 | | | | | Nexstar Broadcasting, Inc., Term Loan B3 | | | 4.652% | | | | 1-Month LIBOR | | | | 2.250% | | | | 1/17/24 | | | | BB | | | | 429,282 | |
| | 494 | | | | | Sinclair Television Group, Term Loan B2 | | | 4.660% | | | | 1-Month LIBOR | | | | 2.250% | | | | 1/03/24 | | | | BB+ | | | | 488,117 | |
| | 355 | | | | | Springer Science & Business Media, Inc., Term Loan B13, First Lien | | | 5.902% | | | | 1-Month LIBOR | | | | 3.500% | | | | 8/24/22 | | | | B | | | | 355,506 | |
| | 517 | | | | | UPC Financing Partnership, Term Loan AR1, First Lien | | | 4.894% | | | | 1-Month LIBOR | | | | 2.500% | | | | 1/15/26 | | | | BB | | | | 516,473 | |
| | 259 | | | | | WideOpenWest Finance LLC, Term Loan B | | | 5.654% | | | | 1-Month LIBOR | | | | 3.250% | | | | 8/19/23 | | | | B | | | | 253,686 | |
| | 7,150 | | | | | Total Media | | | | | | | | | | | | | | | | | | | | | | | 7,116,706 | |
| | |
| | | | | | Mortgage Real Estate Investment Trust – 0.2% | |
| | | | | | | | |
| | 437 | | | | | Capital Automotive LP, Term Loan, First Lien | | | 4.910% | | | | 1-Month LIBOR | | | | 2.500% | | | | 3/24/24 | | | | B1 | | | | 432,048 | |
| | |
| | | | | | Multiline Retail – 0.1% | |
| | | | | | | | |
| | 11 | | | | | Belk, Inc., Term Loan B, First Lien | | | 7.285% | | | | 3-Month LIBOR | | | | 4.750% | | | | 12/10/22 | | | | B2 | | | | 8,799 | |
| | 247 | | | | | EG America LLC, Term Loan, First Lien | | | 6.330% | | | | 3-Month LIBOR | | | | 4.000% | | | | 2/05/25 | | | | B | | | | 243,121 | |
| | 258 | | | | | Total Multiline Retail | | | | | | | | | | | | | | | | | | | | | | | 251,920 | |
| | |
| | | | | | Oil, Gas & Consumable Fuels – 0.2% | |
| | | | | | | | |
| | 208 | | | | | Fieldwood Energy LLC, Exit Term Loan | | | 7.652% | | | | 1-Month LIBOR | | | | 5.250% | | | | 4/11/22 | | | | B+ | | | | 193,853 | |
| | 267 | | | | | Fieldwood Energy LLC, Exit Term Loan, Second Lien | | | 9.652% | | | | 1-Month LIBOR | | | | 7.250% | | | | 4/11/23 | | | | B+ | | | | 224,790 | |
| | 475 | | | | | Total Oil, Gas & Consumable Fuels | | | | | | | | | | | | | | | | | | | | | | | 418,643 | |
| | |
| | | | | | Personal Products – 0.3% | |
| | | | | | | | |
| | 700 | | | | | Revlon Consumer Products Corporation, Term Loan B, First Lien | | | 6.022% | | | | 3-Month LIBOR | | | | 3.500% | | | | 9/07/23 | | | | B3 | | | | 586,920 | |
| | |
| | | | | | Pharmaceuticals – 0.6% | |
| | | | | | | | |
| | 146 | | | | | Valeant Pharmaceuticals International, Inc., Term Loan B | | | 5.162% | | | | 1-Month LIBOR | | | | 2.750% | | | | 11/27/25 | | | | Ba2 | | | | 145,419 | |
| | 1,223 | | | | | Valeant Pharmaceuticals International, Inc., Term Loan, First Lien, (DD1) | | | 5.412% | | | | 1-Month LIBOR | | | | 3.000% | | | | 6/02/25 | | | | Ba2 | | | | 1,223,384 | |
| | 1,369 | | | | | Total Pharmaceuticals | | | | | | | | | | | | | | | | | | | | | | | 1,368,803 | |
| | |
| | | | | | Professional Services – 0.3% | |
| | | | | | | | |
| | 244 | | | | | Nielsen Finance LLC, Term Loan B4 | | | 4.412% | | | | 1-Month LIBOR | | | | 2.000% | | | | 10/04/23 | | | | BBB– | | | | 241,756 | |
| | 478 | | | | | On Assignment, Inc., Term Loan B | | | 4.402% | | | | 1-Month LIBOR | | | | 2.000% | | | | 4/02/25 | | | | BB | | | | 478,713 | |
| | 722 | | | | | Total Professional Services | | | | | | | | | | | | | | | | | | | | | | | 720,469 | |
30
| | | | | | | | | | | | | | | | | | | | | | | | | | | | | | |
Principal
Amount (000) | | | | | Description (1) | | Coupon (8) | | | Reference
Rate (8) | | | Spread (8) | | | Maturity (9) | | | Ratings (6) | | | Value | |
| | |
| | | | | | Real Estate Management & Development – 0.4% | |
| | | | | | | | |
| $ | 946 | | | | | GGP, Initial Term Loan A2, (DD1) | | | 4.652% | | | | 1-Month LIBOR | | | | 2.250% | | | | 8/24/23 | | | | BB+ | | | $ | 921,409 | |
| | |
| | | | | | Road & Rail – 0.2% | |
| | | | | | | | |
| | 556 | | | | | Avolon LLC, Term Loan B3 | | | 4.133% | | | | 1-Month LIBOR | | | | 1.750% | | | | 1/15/25 | | | | Baa2 | | | | 556,220 | |
| | |
| | | | | | Semiconductors & Semiconductor Equipment – 0.4% | |
| | | | | | | | |
| | 231 | | | | | MaxLinear, Inc., Term Loan B | | | 4.894% | | | | 1-Month LIBOR | | | | 2.500% | | | | 5/12/24 | | | | BB– | | | | 229,246 | |
| | 287 | | | | | Microchip Technology., Inc, Term Loan B | | | 4.410% | | | | 1-Month LIBOR | | | | 2.000% | | | | 5/29/25 | | | | Baa3 | | | | 286,458 | |
| | 499 | | | | | MKS Instruments, Inc., Term Loan | | | 4.652% | | | | 1-Month LIBOR | | | | 2.250% | | | | 2/01/26 | | | | BB+ | | | | 499,840 | |
| | 1,017 | | | | | Total Semiconductors & Semiconductor Equipment | | | | | | | | | | | | 1,015,544 | |
| | |
| | | | | | Software – 2.4% | |
| | | | | | | | |
| | 694 | | | | | Ellucian, Term Loan B, First Lien | | | 5.580% | | | | 3-Month LIBOR | | | | 3.250% | | | | 9/30/22 | | | | B | | | | 692,986 | |
| | 250 | | | | | Epicor Software Corporation, Term Loan B, (WI/DD) | | | TBD | | | | TBD | | | | TBD | | | | TBD | | | | B2 | | | | 248,750 | |
| | 486 | | | | | Greeneden U.S. Holdings II LLC, Term Loan B | | | 5.652% | | | | 1-Month LIBOR | | | | 3.250% | | | | 12/01/23 | | | | B2 | | | | 481,492 | |
| | 607 | | | | | Infor (US), Inc., Term Loan B | | | 5.080% | | | | 3-Month LIBOR | | | | 2.750% | | | | 2/01/22 | | | | Ba3 | | | | 606,015 | |
| | 486 | | | | | Kronos Incorporated, Term Loan, First Lien | | | 5.579% | | | | 3-Month LIBOR | | | | 3.000% | | | | 11/01/23 | | | | B | | | | 486,046 | |
| | 305 | | | | | McAfee LLC, Term Loan B | | | 6.152% | | | | 1-Month LIBOR | | | | 3.750% | | | | 9/29/24 | | | | B | | | | 304,824 | |
| | 123 | | | | | Micro Focus International PLC, New Term Loan | | | 4.902% | | | | 1-Month LIBOR | | | | 2.500% | | | | 6/21/24 | | | | BB– | | | | 121,124 | |
| | 833 | | | | | Micro Focus International PLC, Term Loan B | | | 4.902% | | | | 1-Month LIBOR | | | | 2.500% | | | | 6/21/24 | | | | BB– | | | | 817,982 | |
| | 495 | | | | | Quintiles Transnational, Dollar Term Loan B3 | | | 4.152% | | | | 1-Month LIBOR | | | | 1.750% | | | | 6/11/25 | | | | BBB– | | | | 492,988 | |
| | 504 | | | | | SS&C Technologies, Inc./ Sunshine Acquisition II, Inc., Term Loan B3 | | | 4.652% | | | | 1-Month LIBOR | | | | 2.250% | | | | 4/16/25 | | | | BB+ | | | | 502,778 | |
| | 346 | | | | | SS&C Technologies, Inc./ Sunshine Acquisition II, Inc., Term Loan B4 | | | 4.652% | | | | 1-Month LIBOR | | | | 2.250% | | | | 4/16/25 | | | | BB | | | | 344,800 | |
| | 451 | | | | | TIBCO Software, Inc., Term Loan B, (WI/DD) | | | TBD | | | | TBD | | | | TBD | | | | TBD | | | | B1 | | | | 452,579 | |
| | 5,580 | | | | | Total Software | | | | | | | | | | | | | | | | | | | | | | | 5,552,364 | |
| | | | | | | | |
| | | | | | Specialty Retail – 0.8% | | | | | | | | | | | | | | | | | | |
| | | | | | | | |
| | 88 | | | | | Academy, Ltd., Term Loan B | | | 6.439% | | | | 1-Month LIBOR | | | | 4.000% | | | | 7/01/22 | | | | CCC+ | | | | 62,996 | |
| | 985 | | | | | Belron Finance US LLC, Initial Term Loan B | | | 5.065% | | | | 3-Month LIBOR | | | | 2.500% | | | | 11/07/24 | | | | BB | | | | 985,310 | |
| | 249 | | | | | Petco Animal Supplies, Inc., Term Loan B1 | | | 5.833% | | | | 3-Month LIBOR | | | | 3.250% | | | | 1/26/23 | | | | B2 | | | | 194,293 | |
| | 473 | | | | | Petsmart Inc., Term Loan B, First Lien, (DD1) | | | 6.670% | | | | 1-Month LIBOR | | | | 4.250% | | | | 3/11/22 | | | | B3 | | | | 461,466 | |
| | 1,795 | | | | | Total Specialty Retail | | | | | | | | | | | | | | | | | | | | | | | 1,704,065 | |
| | | | | | | |
| | | | | | Technology Hardware, Storage & Peripherals – 1.0% | | | | | | | | | | | | | | | | |
| | | | | | | | |
| | 469 | | | | | BMC Software, Inc., Term Loan B | | | 6.580% | | | | 3-Month LIBOR | | | | 4.250% | | | | 10/02/25 | | | | B | | | | 445,255 | |
| | 732 | | | | | Dell International LLC, Refinancing Term Loan B | | | 4.410% | | | | 1-Month LIBOR | | | | 2.000% | | | | 9/07/23 | | | | BBB– | | | | 729,480 | |
| | 1,053 | | | | | Western Digital, Term Loan B | | | 4.152% | | | | 1-Month LIBOR | | | | 1.750% | | | | 4/29/23 | | | | Baa2 | | | | 1,032,917 | |
| | 2,254 | | | | | Total Technology Hardware, Storage & Peripherals | | | | | | | | | | | | | | | | | | | | 2,207,652 | |
| | | | | | | | |
| | | | | | Trading Companies & Distributors – 0.6% | | | | | | | | | | | | | | | | | | |
| | | | | | | | |
| | 243 | | | | | Fly Funding II S.a r.l., Term Loan B | | | 4.560% | | | | 3-Month LIBOR | | | | 2.000% | | | | 2/09/23 | | | | BB+ | | | | 242,424 | |
| | 566 | | | | | HD Supply Waterworks, Ltd., Term Loan B | | | 5.520% | | | | 3-Month LIBOR | | | | 3.000% | | | | 8/01/24 | | | | B+ | | | | 565,933 | |
| | 486 | | | | | Univar, Inc., Term Loan B | | | 4.652% | | | | 1-Month LIBOR | | | | 2.250% | | | | 7/01/24 | | | | BB+ | | | | 484,926 | |
| | 1,295 | | | | | Total Trading Companies & Distributors | | | | | | | | | | | | | | | | | | | | | | | 1,293,283 | |
| | | | | | |
| | | | | | Wireless Telecommunication Services – 0.4% | | | | | | | | | | | | | |
| | | | | | | | |
| | 978 | | | | | Sprint Corporation, Term Loan, First Lien | | | 4.938% | | | | 1-Month LIBOR | | | | 2.500% | | | | 2/03/24 | | | | Ba2 | | | | 964,465 | |
| $ | 73,758 | | | | | Total Variable Rate Senior Loan Interests (cost $73,457,372) | | | | | | | | 72,073,547 | |
31
| | |
| |
| JDD | | Nuveen Diversified Dividend and Income Fund(continued) |
| | Portfolio of Investments June 30, 2019 |
| | (Unaudited) |
| | | | | | | | | | | | | | | | | | | | | | | | | | | | | | |
| Shares | | | | | Description (1) | | Coupon | | | Issue price | | | Cap Price | | | Maturity | | | | | | Value | |
| | | | |
| | | | | | STRUCTURED NOTES – 0.4% (0.3% of Total Investments) | | | | | | | | | |
| | | | | | | | |
| | 13,000 | | | | | JPMorgan Chase Bank, National Association, Mandatory Exchangeable Note, Linked to Common Stock Qorvo, Inc. (Cap 116.43% of Issue Price), 144A | | | 10.000% | | | | $65.3580 | | | | $76.0960 | | | | 8/02/19 | | | | | | | $ | 876,029 | |
| | | | | | Total Structured Notes (cost $849,654) | | | | | | | | | | | | | | | | | | | | | | | 876,029 | |
| | | | | | | | |
Principal
Amount (000) | | | | | Description (1) | | | | | | | | Coupon | | | Maturity | | | Ratings (6) | | | Value | |
| | | | | | |
| | | | | | CORPORATE BONDS – 0.0% (0.0% of Total Investments) | | | | | | | | | | | | | | | | | |
| | | | | | | | |
| | | | | | Media – 0.0% | | | | | | | | | | | | | | | | | | |
| | | | | | | | |
| $ | 132 | | | | | iHeartCommunications Inc, (4), (7) | | | | | | | | | | | 9.000% | | | | 12/15/19 | | | | N/R | | | $ | — | |
| | 106 | | | | | iHeartCommunications Inc | | | | | | | | | | | 8.375% | | | | 5/01/27 | | | | B– | | | | 111,046 | |
| $ | 238 | | | | | Total Corporate Bonds (cost $111,266) | | | | | | | | | | | | | | | | | | | | | | | 111,046 | |
| | | | | | | | |
| Shares | | | | | Description (1) | | | | | | | | | | | | | | | | | Value | |
| | | | |
| | | | | | COMMON STOCK RIGHTS – 0.0% (0.0% of Total Investments) | | | | | | | | | |
| | | | | | | | |
| | | | | | Oil, Gas & Consumable Fuels – 0.0% | | | | | | | | | | | | | | | | | | |
| | | | | | | | |
| | 388 | | | | | Fieldwood Energy LLC, (2), (3) | | | | | | | | | | | | | | | | | | | | | | $ | 11,640 | |
| | 1,923 | | | | | Fieldwood Energy LLC, (2), (3) | | | | | | | | | | | | | | | | | | | | | | | 57,690 | |
| | | | | | Total Common Stock Rights (cost $54,874) | | | | | | | | | | | | | | | | | | | | | | | 69,330 | |
| | | | | | | | |
| Shares | | | | | Description (1) | | | | | | | | | | | | | | | | | Value | |
| | | | |
| | | | | | WARRANTS – 0.0% (0.0% of Total Investments) | | | | | | | | | |
| | | | | | | | |
| | | | | | Industrials – 0.0% | | | | | | | | | | | | | | | | | | |
| | | | | | | | |
| | 1,176 | | | | | HGIM Corp, (2) | | | | | | | | | | | | | | | | | | | | | | $ | 16,464 | |
| | | | | | Total Warrants (cost $47,040) | | | | | | | | | | | | | | | | | | | | | | | 16,464 | |
| | | | | | Total Long-Term Investments (cost $291,549,671) | | | | | | | | 320,663,312 | |
| | | | | | | | |
Principal
Amount (000) | | | | | Description (1) | | | | | | | | Coupon | | | Maturity | | | | | | Value | |
| | | | | | |
| | | | | | SHORT-TERM INVESTMENTS – 4.7% (3.2% of Total Investments) | | | | | | | | | | | | | | | | | |
| | | | | | |
| | | | | | REPURCHASE AGREEMENTS – 3.1% (2.1% of Total Investments) | | | | | | | | | | | | | |
| | | | | | |
| $ | 6,992 | | | | | Repurchase Agreement with Fixed Income Clearing Corporation,
dated 6/28/19, repurchase price $6,992,938,
collateralized by $7,210,000 U.S. Treasury Notes,
1.625%, due 2/15/26, value $7,142,572 | | | | 1.200% | | | | 7/01/19 | | | | | | | $ | 6,992,239 | |
| | | | |
| | | | | | INVESTMENT COMPANIES – 1.6% (1.1% of Total Investments) | | | | | | | |
| | | | | | | |
| | 3,673 | | | | | BlackRock Liquidity FundsT-Fund Portfolio, (11) | | | | | | | | 2.218% (12) | | | | N/A | | | | | | | | 3,672,635 | |
| | | | | | Total Short-Term Investments (cost $10,664,874) | | | | | | | | | | | | | | | | 10,664,874 | |
| | | | | | Total Investments (cost $302,214,545) – 146.1% | | | | | | | | | | | | | | | | 331,328,186 | |
| | | | | | Borrowings – (43.2)% (13), (14) | | | | | | | | | | | | | | | | (97,900,000 | ) |
| | | | | | Other Assets Less Liabilities – (2.9)% (15) | | | | | | | | | | | | | | | | (6,602,376 | ) |
| | | | | | Net Assets Applicable to Common Shares – 100% | | | | | | | | | | | | | | | $ | 226,825,810 | |
32
Investments in Derivatives
Forward Foreign Currency Contracts
| | | | | | | | | | | | | | | | | | | | | | |
| Currency Purchased | | Notional
Amount
(Local Currency) | | | Currency Sold | | | Notional
Amount
(Local Currency) | | | Counterparty | | Settlement
Date | | | Unrealized
Appreciation
(Depreciation) | |
Czech Koruna | | | 4,580,000 | | | | U.S. Dollar | | | | 203,071 | | | Barclays Bank PLC | | | 9/18/19 | | | $ | 1,979 | |
Polish Zloty | | | 780,000 | | | | U.S. Dollar | | | | 207,995 | | | Barclays Bank PLC | | | 9/18/19 | | | | 1,281 | |
| U.S. Dollar | | | 5,432,256 | | | | Euro | | | | 4,762,000 | | | BNP Paribas | | | 9/18/19 | | | | (15,719 | ) |
| Hungarian Forint | | | 57,300,000 | | | | U.S. Dollar | | | | 203,570 | | | Goldman Sacks Bank USA | | | 9/18/19 | | | | (924 | ) |
| U.S. Dollar | | | 223,428 | | | | Euro | | | | 195,000 | | | Goldman Sacks Bank USA | | | 9/18/19 | | | | 338 | |
| Chilean Peso | | | 136,500,000 | | | | U.S. Dollar | | | | 196,488 | | | JPMorgan Chase Bank N.A. | | | 9/23/19 | | | | 5,039 | |
| Colombian Peso | | | 639,400,000 | | | | U.S. Dollar | | | | 195,565 | | | JPMorgan Chase Bank N.A. | | | 9/18/19 | | | | 2,484 | |
| Egyptian Pound | | | 480,000 | | | | U.S. Dollar | | | | 25,410 | | | JPMorgan Chase Bank N.A. | | | 7/09/19 | | | | 3,283 | |
| Egyptian Pound | | | 3,770,000 | | | | U.S. Dollar | | | | 220,507 | | | JPMorgan Chase Bank N.A. | | | 9/18/19 | | | | (39 | ) |
| Peruvian Sol | | | 797,000 | | | | U.S. Dollar | | | | 238,238 | | | JPMorgan Chase Bank N.A. | | | 9/18/19 | | | | 3,022 | |
| Philippine Peso | | | 4,300,000 | | | | U.S. Dollar | | | | 82,399 | | | JPMorgan Chase Bank N.A. | | | 9/18/19 | | | | 1,208 | |
| U.S. Dollar | | | 131,507 | | | | Brazilian Real | | | | 526,000 | | | JPMorgan Chase Bank N.A. | | | 9/04/19 | | | | (4,673 | ) |
Euro | | | 107,000 | | | | U.S. Dollar | | | | 122,468 | | | UBS AG | | | 9/18/19 | | | | (54 | ) |
Total | | | | | | | | | | | | | | | | | | | | $ | (2,775 | ) |
Total unrealized appreciation on forward foreign currency contracts | | | | | | $ | 18,634 | |
Total unrealized depreciation on forward foreign currency contracts | | | | | | $ | (21,409 | ) |
Futures Contracts
| | | | | | | | | | | | | | | | | | | | | | | | | | | | |
| Description | | Contract
Position | | | Number of
Contracts | | | Expiration
Date | | | Notional
Amount | | | Value | | | Unrealized
Appreciation
(Depreciation) | | | Variation
Margin
Receivable/
(Payable) | |
Eurex Euro-Bobl | | | Short | | | | (13 | ) | | | 9/19 | | | $ | (1,978,882 | ) | | $ | (1,987,332 | ) | | $ | (8,450 | ) | | $ | (8,450 | ) |
Eurex Euro-Bund | | | Short | | | | (11 | ) | | | 9/19 | | | | (2,139,500 | ) | | | (2,160,650 | ) | | | (21,150 | ) | | | (1,501 | ) |
Eurex Euro-Buxl | | | Short | | | | (1 | ) | | | 9/19 | | | | (224,190 | ) | | | (230,718 | ) | | | (6,528 | ) | | | 205 | |
Total | | | | | | | | | | | | | | $ | (4,342,572 | ) | | $ | (4,378,700 | ) | | $ | (36,128 | ) | | $ | (9,746 | ) |
Total receivable for variation margin on futures contracts | | | | | | | | | | | $ | 205 | |
Total payable for variation margin on futures contracts | | | | | | | $ | (9,951 | ) |
Interest Rate Swaps – OTC Uncleared
| | | | | | | | | | | | | | | | | | | | | | | | | | | | | | | | | | | | | | | | |
| Counterparty | | Notional
Amount | | | Fund
Pay/Receive
Floating Rate | | | Floating Rate Index | | | Fixed Rate
(Annualized) | | | Fixed Rate
Payment
Frequency | | | Effective
Date (16) | | | Optional
Termination
Date | | | Maturity
Date | | | Value | | | Unrealized
Appreciation
(Depreciation) | |
JPMorgan Chase Bank N.A. | | $ | 56,200,000 | | | | Receive | | | | 1-Month LIBOR | | | | 1.969 | % | | | Monthly | | | | 6/01/18 | | | | 7/01/25 | | | | 7/01/27 | | | $ | (1,466,328 | ) | | $ | (1,466,328 | ) |
Total unrealized depreciation on interest rate swaps | | | | | | | | | | | | | | | | | | | | | | | | | | | $ | (1,466,328 | ) |
33
| | |
| |
| JDD | | Nuveen Diversified Dividend and Income Fund(continued) |
| | Portfolio of Investments June 30, 2019 |
| | (Unaudited) |
For Fund portfolio compliance purposes, the Fund’s industry classifications refer to any one or more of the industrysub-classifications used by one or more widely recognized market indexes or ratings group indexes, and/or as defined by Fund management. This definition may not apply for purposes of this report, which may combine industrysub-classifications into sectors for reporting ease.
| (1) | All percentages shown in the Portfolio of Investments are based on net assets applicable to common shares unless otherwise noted. |
| (2) | For fair value measurement disclosure purposes, investment classified as Level 2. See Notes to Financial Statements, Note 2 – Investment Valuation and Fair Value Measurements for more information. |
| (3) | Non-income producing; issuer has not declared a dividend within the past twelve months. |
| (4) | Investment valued at fair value using methods determined in good faith by, or at the discretion of, the Board. For fair value measurement disclosure purposes, investment classified as Level 3. See Notes to Financial Statements, Note 2 – Investment Valuation and Fair Value Measurements for more information. |
| (5) | Principal Amount (000) denominated in U.S. Dollars, unless otherwise noted. |
| (6) | For financial reporting purposes, the ratings disclosed are the highest of Standard & Poor’s Group (“Standard & Poor’s”), Moody’s Investors Service, Inc. (“Moody’s”) or Fitch, Inc. (“Fitch”) rating. This treatment of split-rated securities may differ from that used for other purposes, such as for Fund investment policies. Ratings below BBB by Standard & Poor’s, Baa by Moody’s or BBB by Fitch are considered to be below investment grade. Holdings designated N/R are not rated by any of these national rating agencies. |
| (7) | Defaulted security. A security whose issuer has failed to fully pay principal and/or interest when due, or is under the protection of bankruptcy. |
| (8) | Senior Loans generally pay interest at rates which are periodically adjusted by reference to a base short-term, floating lending rate (Reference Rate) plus an assigned fixed rate (Spread). These floating lending rates are generally (i) the lending rate referenced by the London Inter-Bank Offered Rate (“LIBOR”), or (ii) the prime rate offered by one or more major United States banks. Senior Loans may be considered restricted in that the Fund ordinarily is contractually obligated to receive approval from the agent bank and/or borrower prior to the disposition of a senior loan. The rate shown is the coupon as of the end of the reporting period. |
| (9) | Senior Loans generally are subject to mandatory and/or optional prepayment. Because of these mandatory prepayment conditions and because there may be significant economic incentives for a borrower to prepay, prepayments of senior loans may occur. As a result, the actual remaining maturity of senior loans held may be substantially less than the stated maturities shown. |
| (10) | Investment, or portion of investment, has been pledged to collateralize the net payment obligations for investments in derivatives. |
| (11) | A copy of the most recent financial statements for these investment companies can be obtained directly from the Securities and Exchange Commission on its website at http://www.sec.gov. |
| (12) | The rate shown is the annualizedseven-day subsidized yield as of the end of the reporting period. |
| (13) | Borrowings as a percentage of Total Investments is 29.5%. |
| (14) | The Fund may pledge up to 100% of its eligible investments (excluding any investments separately pledged as collateral for specific investments in derivatives, when applicable) in the Portfolio of Investments as collateral for borrowings. |
| (15) | Other assets less liabilities includes the unrealized appreciation (depreciation) of certain over-the-counter (“OTC”) derivatives as presented on the Statement of Assets and Liabilities, when applicable. The unrealized appreciation (depreciation) of OTC-cleared and exchange-traded derivatives is recognized as part of cash collateral at brokers and/or the receivable or payable for variation margin as presented on the Statement of Assets and Liabilities, when applicable. |
| (16) | Effective date represents the date on which both the Fund and counterparty commence interest payment accruals on each contract. |
| 144A | Investment is exempt from registration under Rule 144A of the Securities Act of 1933, as amended. These investments may only be resold in transactions exempt from registration, which are normally those transactions with qualified institutional buyers. |
| DD1 | Portion of investment purchased on a delayed delivery basis. |
| LIBOR | London Inter-Bank Offered Rate |
| Reg S | Regulation S allows U.S. companies to sell securities to persons or entities located outside of the United States without registering those securities with the Securities and Exchange Commission. Specifically, Regulation S provides a safe harbor from the registration requirements of the Securities Act for the offers and sales of securities by both foreign and domestic issuers that are made outside the United States. |
| REIT | Real Estate Investment Trust |
| TBD | Senior loan purchased on a when-issued or delayed-delivery basis. Certain details associated with this purchase are not known prior to the settlement date of the transaction. In addition, senior loans typically trade without accrued interest and therefore a coupon rate is not available prior to settlement. At settlement, if still unknown, the borrower or counterparty will provide the Fund with the final coupon rate and maturity date. |
| WI/DD | Purchased on a when-issued or delayed delivery basis. |
See accompanying notes to financial statements.
34
Statement of Assets and Liabilities
June 30, 2019
(Unaudited)
| | | | |
Assets | | | | |
Long-term investments, at value (cost $291,549,671) | | $ | 320,663,312 | |
Short-term investments, at value (cost approximates value) | | | 10,664,874 | |
Cash denominated in foreign currencies (cost $183,811) | | | 184,727 | |
Cash collateral at brokers for investments in futures contracts(1) | | | 38,404 | |
Unrealized appreciation on forward foreign currency contracts | | | 18,634 | |
Receivable for: | | | | |
Dividends | | | 549,358 | |
Interest | | | 1,406,197 | |
Investments sold | | | 2,085,050 | |
Reclaims | | | 111,100 | |
Variation margin on futures contracts | | | 205 | |
Other assets | | | 128,603 | |
Total assets | | | 335,850,464 | |
Liabilities | | | | |
Borrowings | | | 97,900,000 | |
Unrealized depreciation on: | | | | |
Forward foreign currency contracts | | | 21,409 | |
Interest rate swaps | | | 1,466,328 | |
Payable for: | | | | |
Dividends | | | 4,249,863 | |
Investments purchased | | | 4,924,136 | |
Variation margin on futures contracts | | | 9,951 | |
Accrued expenses: | | | | |
Management fees | | | 228,603 | |
Interest on borrowings | | | 27,458 | |
Trustees fees | | | 74,611 | |
Other | | | 122,295 | |
Total liabilities | | | 109,024,654 | |
Net assets applicable to common shares | | $ | 226,825,810 | |
Common shares outstanding | | | 19,736,517 | |
Net asset value (“NAV”) per common share outstanding | | $ | 11.49 | |
Net assets applicable to common shares consist of: | | | | |
Common shares, $0.01 par value per share | | $ | 197,365 | |
Paid-in surplus | | | 205,975,512 | |
Total distributable earnings | | | 20,652,933 | |
Net assets applicable to common shares | | $ | 226,825,810 | |
Authorized shares: | | | | |
Common | | | Unlimited | |
Preferred | | | Unlimited | |
| (1) | Cash pledged to collateralize the net payment obligations for investments in derivatives. |
See accompanying notes to financial statements.
35
Statement of Operations
Six Months Ended June 30, 2019
(Unaudited)
| | | | |
Investment Income | | | | |
Dividends | | $ | 3,174,652 | |
Interest | | | 4,233,384 | |
Foreign tax withheld on dividend income | | | (165,185 | ) |
Total investment income | | | 7,242,851 | |
Expenses | | | | |
Management fees | | | 1,371,318 | |
Interest expense on borrowings | | | 1,657,474 | |
Custodian fees | | | 90,458 | |
Trustees fees | | | 4,378 | |
Professional fees | | | 25,251 | |
Shareholder reporting expenses | | | 18,819 | |
Shareholder servicing agent fees | | | 1,099 | |
Stock exchange listing fees | | | 3,403 | |
Investor relations expense | | | 9,141 | |
Other | | | 12,517 | |
Total expenses | | | 3,193,858 | |
Net investment income (loss) | | | 4,048,993 | |
Realized and Unrealized Gain (Loss) | | | | |
Net realized gain (loss) from: | | | | |
Investments and foreign currency | | | 508,659 | |
Forward foreign currency contracts | | | 223,433 | |
Futures contracts | | | (188,289 | ) |
Swaps | | | 149,152 | |
Change in net unrealized appreciation (depreciation) of: | | | | |
Investments and foreign currency | | | 29,760,670 | |
Forward foreign currency contracts | | | 24,253 | |
Futures contracts | | | (22,356 | ) |
Swaps | | | (2,824,744 | ) |
Net realized and unrealized gain (loss) | | | 27,630,778 | |
Net increase (decrease) in net assets applicable to common shares from operations | | $ | 31,679,771 | |
See accompanying notes to financial statements.
36
Statement of Changes in Net Assets
(Unaudited)
| | | | | | | | |
| | | Six Months
Ended
6/30/19 | | | Year Ended 12/31/18 | |
Operations | | | | | | | | |
Net investment income (loss) | | $ | 4,048,993 | | | $ | 7,558,751 | |
Net realized gain (loss) from: | | | | | | | | |
Investments and foreign currency | | | 508,659 | | | | 5,021,741 | |
Forward foreign currency contracts | | | 223,433 | | | | 391,667 | |
Futures contracts | | | (188,289 | ) | | | (129,806 | ) |
Swaps | | | 149,152 | | | | 55,387 | |
Change in net unrealized appreciation (depreciation) of: | | | | | | | | |
Investments and foreign currency | | | 29,760,670 | | | | (41,061,152 | ) |
Forward foreign currency contracts | | | 24,253 | | | | 57,186 | |
Futures contracts | | | (22,356 | ) | | | (50,200 | ) |
Swaps | | | (2,824,744 | ) | | | 658,625 | |
Net increase (decrease) in net assets applicable to common shares from operations | | | 31,679,771 | | | | (27,497,801 | ) |
Distributions to Common Shareholders | | | | | | | | |
Dividends | | | (8,585,385 | ) | | | (12,234,545 | ) |
Return of capital | | | — | | | | (7,313,269 | ) |
Decrease in net assets applicable to common shares from distributions to common shareholders | | | (8,585,385 | ) | | | (19,547,814 | ) |
Capital Share Transactions | | | | | | | | |
Cost of common shares repurchased or retired | | | — | | | | (88,700 | ) |
Net proceeds from common shares issued to shareholders due to reinvestment of distributions | | | — | | | | 55,017 | |
Net increase (decrease) in net assets applicable to common shares from capital share transactions | | | — | | | | (33,683 | ) |
Net increase (decrease) in net assets applicable to common shares | | | 23,094,386 | | | | (47,079,298 | ) |
Net assets applicable to common shares at the beginning of period | | | 203,731,424 | | | | 250,810,722 | |
Net assets applicable to common shares at the end of period | | $ | 226,825,810 | | | $ | 203,731,424 | |
See accompanying notes to financial statements.
37
Statement of Cash Flows
Six Months Ended June 30, 2019
(Unaudited)
| | | | |
Cash Flows from Operating Activities: | | | | |
Net Increase (Decrease) In Net Assets Applicable to Common Shares from Operations | | $ | 31,679,771 | |
Adjustments to reconcile the net increase (decrease) in net assets applicable to common shares from operations to net cash
provided by (used in) operating activities: | | | | |
Purchases of investments | | | (82,984,069 | ) |
Proceeds from sales and maturities of investments | | | 87,254,912 | |
Proceeds from (Purchases of) short-term investments, net | | | (6,961,816 | ) |
Proceeds from (Payments for) closed foreign currency spot contracts | | | 17,529 | |
Capital gain and return of capital distributions from investments | | | 573,461 | |
Amortization (Accretion) of premiums and discounts, net | | | 4,509 | |
(Increase) Decrease in: | | | | |
Receivable for dividends | | | 3,617 | |
Receivable for interest | | | (12,592 | ) |
Receivable for investments sold | | | (1,815,943 | ) |
Receivable for reclaims | | | (9,724 | ) |
Receivable for variation margin on futures contracts | | | (205 | ) |
Other assets | | | (4,657 | ) |
Increase (Decrease) in: | | | | |
Payable for investments purchased | | | 3,803,154 | |
Payable for variation margin on futures contracts | | | 9,935 | |
Accrued management fees | | | (2,209 | ) |
Accrued interest on borrowings | | | 19,893 | |
Accrued Trustees fees | | | (7,171 | ) |
Accrued other expenses | | | (22,295 | ) |
Net realized (gain) loss from investments and foreign currency | | | (508,659 | ) |
Change in net unrealized (appreciation) depreciation of: | | | | |
Investments and foreign currency | | | (29,760,670 | ) |
Forward foreign currency contracts | | | (24,253 | ) |
Swaps | | | 2,824,744 | |
Net cash provided by (used in) operating activities | | | 4,077,262 | |
Cash Flows from Financing Activities: | | | | |
Cash distributions paid to common shareholders | | | (4,335,522 | ) |
Net cash provided by (used in) financing activities | | | (4,335,522 | ) |
Net Increase (Decrease) in Cash and Cash Collateral at Brokers | | | (258,260 | ) |
Cash, cash denominated in foreign currency, and cash collateral at brokers at the beginning of period | | | 481,391 | |
Cash, cash denominated in foreign currency, and cash collateral at brokers at the end of period | | | 223,131 | |
| |
| Supplemental Disclosure of Cash Flow Information | | | |
Cash paid for interest on borrowings (excluding borrowing costs) | | $ | 1,566,596 | |
See accompanying notes to financial statements.
38
THIS PAGE INTENTIONALLY LEFT BLANK
39
Financial Highlights
(Unaudited)
Selected data for a common share outstanding throughout each period:
| | | | | | | | | | | | | | | | | | | | | | | | | | | | | | | | | | | | | | | | | | | | |
| | | | |
| | | | | | Investment Operations | | | Less Distributions to
Common Shareholders | | | Common Share | |
| | | | | | | | | | | |
| | | Beginning
Common
Share
NAV | | | Net
Invest
ment
Income
(Loss)(a) | | | Net
Realized/
Unrealized
Gain (Loss) | | | Total | | | From
Net
Invest
ment
Income | | | From
Accum-
ulated
Net
Realized
Gains | | | Return
of
Capital | | | Total | | | Discount
from
Shares
Repur
chased
and Retired | | | Ending
NAV | | | Ending
Share
Price | |
Year Ended 12/31: | |
2019(e) | | $ | 10.32 | | | $ | 0.21 | | | $ | 1.40 | | | $ | 1.61 | | | $ | (0.44 | ) | | $ | — | | | $ | — | | | $ | (0.44 | ) | | $ | — | | | $ | 11.49 | | | $ | 10.65 | |
2018 | | | 12.70 | | | | 0.38 | | | | (1.77 | ) | | | (1.39 | ) | | | (0.40 | ) | | | (0.22 | ) | | | (0.37 | ) | | | (0.99 | ) | | | — | * | | | 10.32 | | | | 9.23 | |
2017 | | | 12.54 | | | | 0.47 | | | | 1.03 | | | | 1.50 | | | | (0.51 | ) | | | (0.62 | ) | | | (0.21 | ) | | | (1.34 | ) | | | — | | | | 12.70 | | | | 12.30 | |
2016 | | | 12.53 | | | | 0.46 | | | | 0.62 | | | | 1.08 | | | | (0.49 | ) | | | (0.59 | ) | | | — | | | | (1.08 | ) | | | 0.01 | | | | 12.54 | | | | 11.17 | |
2015 | | | 13.56 | | | | 0.46 | | | | (0.42 | ) | | | 0.04 | | | | (0.85 | ) | | | (0.15 | ) | | | (0.08 | ) | | | (1.08 | ) | | | 0.01 | | | | 12.53 | | | | 10.83 | |
2014 | | | 12.84 | | | | 0.48 | | | | 1.27 | | | | 1.75 | | | | (1.03 | ) | | | — | | | | — | | | | (1.03 | ) | | | — | * | | | 13.56 | | | | 11.77 | |
| | | | | | | | |
| | | Borrowings at the End of Period | |
| | | Aggregate
Amount
Outstanding
(000) | | | Asset
Coverage
Per $1,000 | |
Year Ended 12/31: | |
2019(e) | | $ | 97,900 | | | $ | 3,317 | |
2018 | | | 97,900 | | | | 3,081 | |
2017 | | | 112,900 | | | | 3,222 | |
2016 | | | 112,400 | | | | 3,203 | |
2015 | | | 116,500 | | | | 3,135 | |
2014 | | | 116,500 | | | | 3,320 | |
40
| | | | | | | | | | | | | | | | | | | | | | |
| | | | | | | Common Share Supplemental Data/
Ratios Applicable to Common Shares | |
Common Share
Total Returns | | | | | | Ratios to Average Net Assets(c) | | | | |
| | | | | |
Based
on
NAV(b) | | | Based
on
Common
Share
Price(b) | | | Ending
Net
Assets
(000) | | | Expenses | | | Net
Investment
Income (Loss) | | | Portfolio
Turnover
Rate(d) | |
| | | | | | | | | | | | | | | | | | | | | | |
| | 15.59 | % | | | 20.24 | % | | $ | 226,826 | | | | 2.87 | %** | | | 3.64 | %** | | | 26 | % |
| | (11.47 | ) | | | (17.87 | ) | | | 203,731 | | | | 2.76 | | | | 3.21 | | | | 45 | |
| | 12.21 | | | | 22.48 | | | | 250,811 | | | | 2.30 | | | | 3.66 | | | | 46 | |
| | 8.96 | | | | 13.28 | | | | 247,632 | | | | 2.07 | | | | 3.65 | | | | 74 | |
| | 0.39 | | | | 1.24 | | | | 248,703 | | | | 1.91 | | | | 3.43 | | | | 49 | |
| | 13.97 | | | | 13.82 | | | | 270,328 | | | | 1.84 | | | | 3.56 | | | | 50 | |
| (a) | Per share Net Investment Income (Loss) is calculated using the average daily common shares method. |
| (b) | Total Return Based on Common Share NAV is the combination of changes in common share NAV, reinvested dividend income at NAV and reinvested capital gains distributions at NAV, if any. The last dividend declared in the period, which is typically paid on the first business day of the following month, is assumed to be reinvested at the ending NAV. The actual reinvest price for the last dividend declared in the period may often be based on the Fund’s market price (and not its NAV), and therefore may be different from the price used in the calculation. Total returns are not annualized. |
Total Return Based on Common Share Price is the combination of changes in the market price per common share and the effect of reinvested dividend income and reinvested capital gains distributions, if any, at the average price paid per common share at the time of reinvestment. The last dividend declared in the period, which is typically paid on the first business day of the following month, is assumed to be reinvested at the ending market price. The actual reinvestment for the last dividend declared in the period may take place over several days, and in some instances may not be based on the market price, so the actual reinvestment price may be different from the price used in the calculation. Total returns are not annualized.
| (c) | • Net Investment Income (Loss) ratios reflect income earned and expenses incurred on assets attributable to borrowings (as described in Note 9 – Borrowing Arrangements). |
| | • Each ratio includes the effect of all interest expense paid and other costs related to borrowings as follows: |
| | | | |
Ratios of Borrowings Interest Expense to Average Net Assets Applicable
to Common Shares | |
Year Ended 12/31: | | | | |
2019(e) | | | 1.49 | %** |
2018 | | | 1.34 | |
2017 | | | 0.90 | |
2016 | | | 0.64 | |
2015 | | | 0.47 | |
2014 | | | 0.41 | |
| (d) | Portfolio Turnover Rate is calculated based on the lesser of long-term purchases or sales (as disclosed in Note 5 – Investment Transactions) divided by the average long-term market value during the period. |
| (e) | For the six months ended June 30, 2019. |
| * | Rounds to less than $0.01 per common share. |
See accompanying notes to financial statements.
41
Notes to Financial Statements
(Unaudited)
1. General Information and Significant Accounting Policies
General Information
Fund Information
Nuveen Diversified Dividend and Income Fund (the “Fund”) is registered under the Investment Company Act of 1940 (the “1940 Act”), as amended, as a diversified closed-end management investment company. The Fund’s common shares are listed on the New York Stock Exchange (“NYSE”) and trade under the ticker symbol “JDD.” The Fund was organized as a Massachusetts business trust on July 18, 2003.
The end of the reporting period for the Fund is June 30, 2019, and the period covered by these Notes to Financial Statements is the six months ended June 30, 2019 (the “current fiscal period”).
Investment Adviser
The Fund’s investment adviser is Nuveen Fund Advisors, LLC (the “Adviser”), a subsidiary of Nuveen, LLC (“Nuveen”). Nuveen is the investment management arm of Teachers Insurance and Annuity Association of America (TIAA). The Adviser has overall responsibility for management of the Fund, oversees the management of the Fund’s portfolio, manages the Fund’s business affairs and provides certain clerical, bookkeeping and other administrative services, and, if necessary, asset allocation decisions.
The Adviser has entered into sub-advisory agreements with NWQ Investment Management Company, LLC (“NWQ”), Security Capital Research & Management Incorporated (“Security Capital”), Symphony Asset Management LLC (“Symphony”) and Wellington Management Company LLP (“Wellington”) (each a “Sub-Adviser” and collectively, the “Sub-Advisers”). NWQ and Symphony are each an affiliate of Nuveen. NWQ manages the global equity income strategy portion of the Fund consisting of a portfolio focused on income producing and dividend paying equity securities. Security Capital manages the real estate investment trust (“REIT”) strategy portion of the Fund consisting of a portfolio focused on dividend-paying common stock REITs. Symphony manages the adjustable rate senior loan strategy portion of the Fund consisting of a portfolio focused on senior loans. Wellington manages the emerging market debt strategy portion of the Fund consisting of a portfolio focused on emerging market sovereign debt. Wellington also manages the Fund’s forward foreign currency strategy. The Adviser is responsible for managing the Fund’s investments in swap contracts.
Investment Objectives and Principal Investment Strategies
The Fund’s investment objectives are high current income and total return. The Fund invests approximately equal proportions in U.S. and foreign dividend-paying common stocks, dividend-paying common stocks issued by REITs, emerging markets sovereign debt, and adjustable rate senior loans. The Fund expects to invest between 40% and 70% of its managed assets in equity security holdings and between 30% and 60% of its managed assets in debt security holdings. Under normal circumstances, the Fund’s target weighting is approximately 50% equity and 50% debt.
Significant Accounting Policies
The Fund is an investment company and follows accounting and reporting guidance under Financial Accounting Standards Board (“FASB”) Accounting Standards Codification (ASC) Topic 946 “Financial Services-Investment Companies.” The following is a summary of significant accounting policies followed by the Fund in the preparation of its financial statements in accordance with U.S. generally accepted accounting principles (“U.S. GAAP”).
Investment Transactions
Investment transactions are recorded on a trade date basis. Trade date for senior and subordinated loans purchased in the “primary market” is considered the date on which the loan allocations are determined. Trade date for senior and subordinated loans purchased in the “secondary market” is the date on which the transaction is entered into. Realized gains and losses from investment transactions are determined on the specific identification method, which is the same basis used for federal income tax purposes. Investments purchased on a when-issued/delayed delivery basis may have extended settlement periods. Any investments so purchased are subject to market fluctuation during this period. The Fund has earmarked securities in its portfolio with a current value at least equal to the amount of the when-issued/delayed delivery purchase commitments.
As of the end of the reporting period, the Fund’s outstanding when-issued/delayed delivery purchase commitments were as follows:
| | | | |
Outstanding when-issued/delayed delivery purchase commitments | | | $4,474,578 | |
Investment Income
Dividend income is recorded on the ex-dividend date or, for foreign securities, when information is available. Non-cash dividends received in the form of stock, if any, are recognized on the ex-dividend date and recorded at fair value. Interest income, which reflects the amortization of premiums and accretion of discounts for financial reporting purposes, is recorded on an accrual basis. Interest income also reflects payment-in-kind (“PIK”) interest and
42
fee income, if any. PIK interest represents income received in the form of securities in lieu of cash. Fee income consists primarily of amendment fees. Amendment fees are earned as compensation for evaluating and accepting changes to an original senior loan agreement and are recognized when received. Fee income and amendment fees, if any, are recognized as a component of “Interest Income” on the Statement of Operations.
Professional Fees
Professional fees presented on the Statement of Operations consist of legal fees incurred in the normal course of operations, audit fees, tax consulting fees and, in some cases, workout expenditures. Workout expenditures are incurred in an attempt to protect or enhance an investment or to pursue other claims or legal actions on behalf of Fund common shareholders. If a refund is received for workout expenditures paid in a prior reporting period, such amounts will be recognized as “Legal fee refund” on the Statement of Operations.
Dividends and Distributions to Common Shareholders
Distributions to common shareholders are recorded on the ex-dividend date. The amount and timing of distributions are determined in accordance with federal income tax regulations, which may differ from U.S. GAAP.
The Fund makes quarterly cash distributions to common shareholders of a stated dollar amount per share. Subject to approval and oversight by the Fund’s Board of Trustees (the “Board”), the Fund seeks to maintain a stable distribution level designed to deliver the long-term return potential of the Fund’s investment strategy through regular quarterly distributions (a “Managed Distribution Program”). Total distributions during a calendar year generally will be made from the Fund’s net investment income, net realized capital gains and net unrealized capital gains in the Fund’s portfolio, if any. The portion of distributions paid attributed to net unrealized gains, if any, is distributed from the Fund’s assets and is treated by common shareholders as a nontaxable distribution (“return of capital”) for tax purposes. In the event that total distributions during a calendar year exceed the Fund’s total return on net asset value (“NAV”), the difference will reduce NAV per share. If the Fund’s total return on NAV exceeds total distributions during a calendar year, the excess will be reflected as an increase in NAV per share. The final determination of the source and character of all distributions paid by the Fund during the fiscal year is made after the end of the fiscal year and is reflected in the financial statements contained in the annual report as of December 31 each year.
The tax character of Fund distributions for a fiscal year is dependent upon the amount and tax character of distributions received from securities held in the Fund’s portfolio. Distributions received from certain securities in which the Fund invests, most notably REIT securities, may be characterized for tax purposes as ordinary income, long-term capital gain and/or a return of capital. The issuer of a security reports the tax character of its distributions only once per year, generally during the first two months of the calendar year. The distribution is included in the Fund’s ordinary income until such time the Fund is notified by the issuer of the actual tax character. For the current fiscal period, dividend income, net realized gain (loss) and unrealized appreciation (depreciation) recognized on the Statement of Operations reflect the amounts of ordinary income, capital gain, and/or return of capital as reported by the issuers of such securities as of the last calendar year end.
Compensation
The Fund pays no compensation directly to those of its trustees who are affiliated with the Adviser or to its officers, all of whom receive remuneration for their services to the Fund from the Adviser or its affiliates. The Board has adopted a deferred compensation plan for independent trustees that enables trustees to elect to defer receipt of all or a portion of the annual compensation they are entitled to receive from certain Nuveen-advised funds. Under the plan, deferred amounts are treated as though equal dollar amounts had been invested in common shares of select Nuveen-advised funds.
Indemnifications
Under the Fund’s organizational documents, its officers and trustees are indemnified against certain liabilities arising out of the performance of their duties to the Fund. In addition, in the normal course of business, the Fund enters into contracts that provide general indemnifications to other parties. The Fund’s maximum exposure under these arrangements is unknown as this would involve future claims that may be made against the Fund that have not yet occurred. However, the Fund has not had prior claims or losses pursuant to these contracts and expects the risk of loss to be remote.
Netting Agreements
In the ordinary course of business, the Fund may enter into transactions subject to enforceable master repurchase agreements, International Swaps and Derivative Association, Inc. (ISDA) master agreements or other similar arrangements (“netting agreements”). Generally, the right to offset in netting agreements allows the Fund to offset certain securities and derivatives with a specific counterparty, when applicable, as well as any collateral received or delivered to that counterparty based on the terms of the agreements. Generally, the Fund manages its cash collateral and securities collateral on a counterparty basis.
The Fund’s investments subject to netting agreements as of the end of the reporting period, if any, are further described in Note 3 – Portfolio Securities and Investments in Derivatives.
43
Notes to Financial Statements(Unaudited) (continued)
Use of Estimates
The preparation of financial statements in conformity with U.S. GAAP requires management to make estimates and assumptions that affect the reported amounts of assets and liabilities at the date of the financial statements and the reported amounts of increases and decreases in net assets applicable to common shares from operations during the current fiscal period. Actual results may differ from those estimates.
2. Investment Valuation and Fair Value Measurements
The fair valuation input levels as described below are for fair value measurement purposes.
Fair value is defined as the price that would be received upon selling an investment or transferring a liability in an orderly transaction to an independent buyer in the principal or most advantageous market for the investment. A three-tier hierarchy is used to maximize the use of observable market data and minimize the use of unobservable inputs and to establish classification of fair value measurements for disclosure purposes. Observable inputs reflect the assumptions market participants would use in pricing the asset or liability. Observable inputs are based on market data obtained from sources independent of the reporting entity. Unobservable inputs reflect the reporting entity’s own assumptions about the assumptions market participants would use in pricing the asset or liability. Unobservable inputs are based on the best information available in the circumstances. The following is a summary of the three-tiered hierarchy of valuation input levels.
| | |
| Level 1 – | | Inputs are unadjusted and prices are determined using quoted prices in active markets for identical securities. |
| Level 2 – | | Prices are determined using other significant observable inputs (including quoted prices for similar securities, interest rates, credit spreads, etc.). |
| Level 3 – | | Prices are determined using significant unobservable inputs (including management’s assumptions in determining the fair value of investments). |
Common stocks and other equity-type securities are valued at the last sales price on the securities exchange on which such securities are primarily traded and are generally classified as Level 1. Securities primarily traded on the Nasdaq National Market (“Nasdaq”) are valued at the Nasdaq Official Closing Price and are generally classified as Level 1. However, securities traded on a securities exchange or Nasdaq for which there were no transactions on a given day or securities not listed on a securities exchange or Nasdaq are valued at the quoted bid price and are generally classified as Level 2. Prices of certain American Depositary Receipts (“ADR”) held by the Fund that trade in the United States are valued based on the last traded price, official closing price or the most recent bid price of the underlying non-U.S.-traded stock, adjusted as appropriate for the underlying-to-ADR conversion ratio and foreign exchange rate, and from time-to-time may also be adjusted further to take into account material events that may take place after the close of the local non-U.S. market but before the close of the NYSE, which may represent a transfer from a Level 1 to a Level 2 security.
Prices of fixed-income securities are provided by an independent pricing service (“pricing service”) approved by the Board. The pricing service establishes a security’s fair value using methods that may include consideration of the following: yields or prices of investments of comparable quality, type of issue, coupon, maturity and rating, market quotes or indications of value from security dealers, evaluations of anticipated cash flows or collateral, general market conditions and other information and analysis, including the obligor’s credit characteristics considered relevant. These securities are generally classified as Level 2. In pricing certain securities, particularly less liquid and lower quality securities, the pricing service may consider information about a security, its issuer or market activity provided by the Adviser. These securities are generally classified as Level 2 or Level 3 depending on the observability of the significant inputs.
Like most fixed-income securities, the senior and subordinated loans in which the Fund invests are not listed on an organized exchange. The secondary market of such investments may be less liquid relative to markets for other fixed-income securities. Consequently, the value of senior and subordinated loans, determined as described above, may differ significantly from the value that would have been determined had there been an active market for that senior loan. These securities are generally classified as Level 2.
Prices of forward foreign currency contracts and swap contracts are also provided by a pricing service approved by the Board using the same methods as described above and are generally classified as Level 2.
Investments in investment companies are valued at their respective NAVs on the valuation date and are generally classified as Level 1.
Futures contracts are valued using the closing settlement price or, in the absence of such a price, the last traded price, and are generally classified as Level 1.
Repurchase agreements are valued at contract amount plus accrued interest, which approximates market value. These securities are generally classified as Level 2.
Investments initially valued in currencies other than the U.S. dollar are converted to the U.S. dollar using exchange rates obtained from pricing services. As a result, the NAV of the Fund’s common shares may be affected by changes in the value of currencies in relation to the U.S. dollar. The value of securities traded in markets outside the United States or denominated in currencies other than the U.S. dollar may be affected significantly on a day that the NYSE is closed and an investor is not able to purchase, redeem or exchange common shares. If significant market events occur between the time of determination of the closing price of a foreign security on an exchange and the time that the Fund’s NAV is determined, or if under the Fund’s procedures, the closing
44
price of a foreign security is not deemed to be reliable, the security would be valued at fair value as determined in accordance with procedures established in good faith by the Board. These securities are generally classified as Level 2 or Level 3 depending on the observability of the significant inputs.
Certain securities may not be able to be priced by the pre-established pricing methods as described above. Such securities may be valued by the Board and/or its appointee at fair value. These securities generally include, but are not limited to, restricted securities (securities which may not be publicly sold without registration under the Securities Act of 1933, as amended) for which a pricing service is unable to provide a market price; securities whose trading has been formally suspended; debt securities that have gone into default and for which there is no current market quotation; a security whose market price is not available from a pre-established pricing source; a security with respect to which an event has occurred that is likely to materially affect the value of the security after the market has closed but before the calculation of the Fund’s NAV (as may be the case in non-U.S. markets on which the security is primarily traded) or make it difficult or impossible to obtain a reliable market quotation; and a security whose price, as provided by the pricing service, is not deemed to reflect the security’s fair value. As a general principle, the fair value of a security would appear to be the amount that the owner might reasonably expect to receive for it in a current sale. A variety of factors may be considered in determining the fair value of such securities, which may include consideration of the following: yields or prices of investments of comparable quality, type of issue, coupon, maturity and rating, market quotes or indications of value from security dealers, evaluations of anticipated cash flows or collateral, general market conditions and other information and analysis, including the obligor’s credit characteristics considered relevant. These securities are generally classified as Level 2 or Level 3 depending on the observability of the significant inputs. Regardless of the method employed to value a particular security, all valuations are subject to review by the Board and/or its appointee.
The inputs or methodologies used for valuing securities are not an indication of the risks associated with investing in those securities. The following is a summary of the Fund’s fair value measurements as of the end of the reporting period:
| | | | | | | | | | | | | | | | |
| | | Level 1 | | | Level 2 | | | Level 3 | | | Total | |
Long-Term Investments*: | | | | | | | | | | | | | | | | |
Common Stocks** | | $ | 50,369,876 | | | $ | 32,762,026 | | | $ | 14,213 | | | $ | 83,146,115 | |
Real Estate Investment Trust (REIT) Common Stocks | | | 82,534,969 | | | | — | | | | — | | | | 82,534,969 | |
Emerging Market Debt and Foreign Corporate Bonds | | | — | | | | 81,835,812 | | | | — | | | | 81,835,812 | |
Variable Rate Senior Loan Interests | | | — | | | | 72,073,547 | | | | — | | | | 72,073,547 | |
Structured Notes** | | | — | | | | 876,029 | | | | — | | | | 876,029 | |
Corporate Bonds | | | — | | | | 111,046 | | | | — | **** | | | 111,046 | |
Common Stock Rights** | | | — | | | | 69,330 | | | | — | | | | 69,330 | |
Warrants** | | | — | | | | 16,464 | | | | — | | | | 16,464 | |
| | | | |
Short-Term Investments: | | | | | | | | | | | | | | | | |
Repurchase Agreements | | | — | | | | 6,992,239 | | | | — | | | | 6,992,239 | |
Investment Companies | | | 3,672,635 | | | | — | | | | — | | | | 3,672,635 | |
| | | | |
Investments in Derivatives: | | | | | | | | | | | | | | | | |
Forward Foreign Currency Contracts**** | | | — | | | | (2,775 | ) | | | — | | | | (2,775 | ) |
Futures Contracts**** | | | (36,128 | ) | | | — | | | | — | | | | (36,128 | ) |
Interest Rate Swaps**** | | | — | | | | (1,466,328 | ) | | | — | | | | (1,466,328 | ) |
Total | | $ | 136,541,352 | | | $ | 193,267,390 | | | $ | 14,213 | | | $ | 329,822,955 | |
| * | Refer to the Fund’s Portfolio of Investments for industry and country classifications, where applicable. |
| ** | Refer to the Fund’s Portfolio of Investments for securities classified as Level 2 and/or Level 3, when applicable. |
| *** | Refer to the Fund’s Portfolio of Investments for securities classified as Level 3. Value equals zero as of the end of the reporting period. |
| **** | Represents net unrealized appreciation (depreciation) as reported in the Fund’s Portfolio of Investments. |
3. Portfolio Securities and Investments in Derivatives
Portfolio Securities
Foreign Currency Transactions
To the extent that the Fund invests in securities and/or contracts that are denominated in a currency other than U.S. dollars, the Fund will be subject to currency risk, which is the risk that an increase in the U.S. dollar relative to the foreign currency will reduce returns or portfolio value. Generally, when the U.S. dollar rises in value against a foreign currency, the Fund’s investments denominated in that currency will lose value because its currency is worth fewer U.S. dollars; the opposite effect occurs if the U.S. dollar falls in relative value. Investments and other assets and liabilities denominated in foreign currencies are converted into U.S. dollars on a spot (i.e. cash) basis at the spot rate prevailing in the foreign currency exchange market at the time of valuation. Purchases and sales of investments and income denominated in foreign currencies are translated into U.S. dollars on the respective dates of such transactions.
45
Notes to Financial Statements(Unaudited) (continued)
As of the end of the reporting period, the Fund’s investments in non-U.S. securities were as follows:
| | | | | | | | |
| | | Value | | | % of Total
Investments | |
Country: | | | | | | | | |
Germany | | $ | 12,479,688 | | | | 3.8 | % |
United Kingdom | | | 9,326,259 | | | | 2.8 | |
Japan | | | 8,866,440 | | | | 2.7 | |
Russia | | | 5,731,035 | | | | 1.7 | |
France | | | 5,540,087 | | | | 1.7 | |
Croatia | | | 3,857,982 | | | | 1.2 | |
Turkey | | | 3,740,144 | | | | 1.1 | |
Netherlands | | | 3,574,989 | | | | 1.1 | |
Canada | | | 3,379,145 | | | | 1.0 | |
Egypt | | | 3,284,932 | | | | 1.0 | |
Ireland | | | 3,086,735 | | | | 0.9 | |
Spain | | | 3,047,018 | | | | 0.9 | |
Saudi Arabia | | | 3,023,168 | | | | 0.9 | |
Argentina | | | 2,973,460 | | | | 0.9 | |
Azerbaijan | | | 2,963,986 | | | | 0.9 | |
Other | | | 65,388,255 | | | | 19.7 | |
Total non-U.S. securities | | $ | 140,263,323 | | | | 42.3 | % |
The books and records of the Fund are maintained in U.S. dollars. Foreign currencies, assets and liabilities are translated into U.S. dollars at 4:00 p.m. Eastern Time. Investment transactions, income and expenses are translated on the respective dates of such transactions. Net realized foreign currency gains and losses resulting from changes in exchange rates include foreign currency gains and losses between trade date and settlement date of the transactions, foreign currency transactions and the difference between the amounts of interest and dividends recorded on the books of the Fund and the amounts actually received.
The realized gains and losses resulting from changes in foreign currency exchange rates and changes in foreign exchange rates associated with (i) foreign currency (ii) investments (iii) investments in derivatives and (iv) other assets and liabilities are recognized as a component of “Net realized gain (loss) from investments and foreign currency” on the Statement of Operations, when applicable.
The unrealized gains and losses resulting from changes in foreign currency exchange rates and changes in foreign exchange rates associated with (i) investments and (ii) other assets and liabilities are recognized as a component of “Change in net unrealized appreciation (depreciation) of investments and foreign currency” on the Statement of Operations, when applicable. The unrealized gains and losses resulting from changes in foreign exchange rates associated with investments in derivatives are recognized as a component of the respective derivative’s related “Change in net unrealized appreciation (depreciation)” on the Statement of Operations, when applicable.
Repurchase Agreements
In connection with transactions in repurchase agreements, it is the Fund’s policy that its custodian take possession of the underlying collateral securities, the fair value of which exceeds the principal amount of the repurchase transaction, including accrued interest, at all times. If the counterparty defaults, and the fair value of the collateral declines, realization of the collateral may be delayed or limited.
The following table presents the repurchase agreements for the Fund that are subject to netting agreements as of the end of the reporting period, and the collateral delivered related to those repurchase agreements.
| | | | | | | | | | | | |
| Counterparty | | Short-Term
Investments, at Value | | | Collateral
Pledged (From)
Counterparty* | | | Net
Exposure | |
Fixed Income Clearing Corporation | | $ | 6,992,239 | | | $ | (6,992,239 | ) | | $ | — | |
| * | As of the end of the reporting period, the value of the collateral pledged from the counterparty exceeded the value of the repurchase agreements. Refer to the Fund’s Portfolio of Investments for details on the repurchase agreements. |
Zero Coupon Securities
A zero coupon security does not pay a regular interest coupon to its holders during the life of the security. Income to the holder of the security comes from accretion of the difference between the original purchase price of the security at issuance and the par value of the security at maturity and is effectively paid at maturity. The market prices of zero coupon securities generally are more volatile than the market prices of securities that pay interest periodically.
46
Investments in Derivatives
The Fund is authorized to invest in certain derivative instruments, such as futures, options and swap contracts. The Fund limits its investments in futures, options on futures and swap contracts to the extent necessary for the Adviser to claim the exclusion from registration by the Commodity Futures Trading Commission as a commodity pool operator with respect to the Fund. The Fund records derivative instruments at fair value, with changes in fair value recognized on the Statement of Operations, when applicable. Even though the Fund’s investments in derivatives may represent economic hedges, they are not considered to be hedge transactions for financial reporting purposes.
Forward Foreign Currency Contracts
The Fund is authorized to enter into forward foreign currency contracts (“forward contracts”) under two circumstances: (i) when the Fund enters into a contract for the purchase or sale of a security denominated in a foreign currency to “lock in” the U.S. exchange rate of the transaction, with such period being a short-dated contract covering the period between transaction date and settlement date or (ii) when the Sub-Adviser believes that the currency of a particular foreign country may experience a substantial movement against the U.S. dollar or against another foreign currency.
A forward contract is an agreement between two parties to purchase or sell a specified quantity of a currency at or before a specified date in the future at a specified price. Forward contracts are typically traded in the over-the-counter (“OTC”) markets and all details of the contract are negotiated between the counterparties to the agreement. Accordingly, the forward contracts are valued by reference to the contracts traded in the OTC markets. The contractual obligations of a buyer or seller may generally be satisfied by taking or making physical delivery of the underlying currency, establishing an opposite position in the contract and recognizing the profit or loss on both positions simultaneously on the delivery date or, in some instances, paying a cash settlement before the designated date of delivery.
Forward contracts are valued daily at the forward rate. The net amount recorded on these transactions is recognized as a component of “Unrealized appreciation and/or depreciation on forward foreign currency contracts” on the Statement of Assets and Liabilities. The change in value of the forward contracts during the reporting period is recognized as a component of “Change in net unrealized appreciation (depreciation) of forward foreign currency contracts” on the Statement of Operations. When the contract is closed or offset with the same counterparty, the Fund recognizes the difference between the value of the contract at the time it was entered and the value at the time it was closed or offset as a component of “Net realized gain (loss) from forward foreign currency contracts” on the Statement of Operations.
Forward contracts will generally not be entered into for terms greater than three months, but may have maturities of up to six months or more. The use of forward contracts does not eliminate fluctuations in the underlying prices of the Fund’s investment securities; however, it does establish a rate of exchange that can be achieved in the future. The use of forward contracts involves the risk that anticipated currency movements will not be accurately predicted. A forward contract would limit the risk of loss due to a decline in the value of a particular currency; however, it also would limit any potential gain that might result should the value of the currency increase instead of decrease. These contracts may involve market risk in excess of the unrealized appreciation or depreciation reflected on the Statement of Assets and Liabilities. Forward contracts are subject to counterparty risk if the counterparty fails to perform as specified in the contract due to financial impairment or other reason.
During the current fiscal period, the Fund continued to utilize forward foreign currency contracts to reduce the currency risk of select local currency denominated emerging market bonds, as well as to actively manage certain currency exposures in an attempt to benefit from potential appreciation.
The average notional amount of forward foreign currency contracts outstanding during the current fiscal period was as follows:
| | | | |
Average notional amount of forward foreign currency contracts outstanding* | | | $8,566,118 | |
| * | The average notional amount is calculated based on the outstanding notional at the beginning of the current fiscal period and at the end of each fiscal quarter within the current fiscal period. |
The following table presents the fair value of forward foreign currency contracts held by the Fund as of the end of the reporting period, the location of these instruments on the Statement of Assets and Liabilities and the primary underlying risk exposure.
| | | | | | | | | | | | | | | | | | |
| | | | | Location on the Statement of Assets and Liabilities | |
Underlying Risk Exposure | | Derivative Instrument | | Asset Derivatives | | | | | | (Liability) Derivatives | |
| | Location | | Value | | | | | | Location | | Value | |
Foreign currency exchange rate | | Forward contracts | | Unrealized appreciation on forward foreign currency contracts | | $ | 18,634 | | | | | | | Unrealized depreciation on forward foreign currency contracts | | $ | (21,409 | ) |
47
Notes to Financial Statements(Unaudited) (continued)
The following table presents the forward foreign currency contracts subject to netting agreements and the collateral delivered related to those forward foreign currency contracts as of the end of the reporting period.
| | | | | | | | | | | | | | | | | | | | |
| Counterparty | | Gross
Unrealized
Appreciation on
Forward Foreign
Currency Contracts* | | | Gross
Unrealized
(Depreciation) on
Forward Foreign
Currency Contracts* | | | Net Unrealized
Appreciation
(Depreciation) on
Forward Foreign
Currency Contracts | | | Collateral
Pledged
to (from)
Counterparty | | | Net
Exposure | |
Barclays Bank PLC | | $ | 3,260 | | | $ | — | | | $ | 3,260 | | | $ | — | | | $ | 3,260 | |
BNP Paribas | | | — | | | | (15,719 | ) | | | (15,719 | ) | | | — | | | | (15,719 | ) |
Goldman Sacks Bank USA | | | 338 | | | | (924 | ) | | | (586 | ) | | | — | | | | (586 | ) |
JPMorgan Chase Bank N.A | | | 15,036 | | | | (4,712 | ) | | | 10,324 | | | | — | | | | 10,324 | |
UBS AG | | | — | | | | (54 | ) | | | (54 | ) | | | — | | | | (54 | ) |
| Total | | | $18,634 | | | $ | (21,409 | ) | | $ | (2,775 | ) | | $ | — | | | $ | (2,775 | ) |
| * | Represents gross unrealized appreciation (depreciation) for the counterparty as reported in the Fund’s Portfolio of Investments. |
The following table presents the amount of net realized gain (loss) and change in net unrealized appreciation (depreciation) recognized on forward foreign currency contracts on the Statement of Operations during the current fiscal period, and the primary underlying risk exposure.
| | | | | | | | | | |
| Underlying Risk Exposure | | Derivative
Instrument | | Net Realized
Gain (Loss)
from Forward
Foreign Currency Contracts | | | Change in Net
Unrealized Appreciation
(Depreciation) of
Forward Foreign Currency
Contracts | |
Foreign currency rate | | Forward contracts | | $ | 223,433 | | | $ | 24,253 | |
Futures Contracts
Upon execution of a futures contract, the Fund is obligated to deposit cash or eligible securities, also known as “initial margin,” into an account at its clearing broker equal to a specified percentage of the contract amount. Cash held by the broker to cover initial margin requirements on open futures contracts, if any, is recognized as “Cash collateral at brokers for investments in futures contracts” on the Statement of Assets and Liabilities. Investments in futures contracts obligate the Fund and the clearing broker to settle monies on a daily basis representing changes in the prior days “mark-to-market” of the open contracts. If the Fund has unrealized appreciation the clearing broker would credit the Fund’s account with an amount equal to appreciation and conversely if the Fund has unrealized depreciation the clearing broker would debit the Fund’s account with an amount equal to depreciation. These daily cash settlements are also known as “variation margin.” Variation margin is recognized as a receivable and/or payable for “Variation margin on futures contracts” on the Statement of Assets and Liabilities.
During the period the futures contract is open, changes in the value of the contract are recognized as an unrealized gain or loss by “marking-to-market” on a daily basis to reflect the changes in market value of the contract, which is recognized as a component of “Change in net unrealized appreciation (depreciation) of futures contracts” on the Statement of Operations. When the contract is closed or expired, the Fund records a realized gain or loss equal to the difference between the value of the contract on the closing date and value of the contract when originally entered into, which is recognized as a component of “Net realized gain (loss) from futures contracts” on the Statement of Operations.
Risks of investments in futures contracts include the possible adverse movement in the price of the securities or indices underlying the contracts, the possibility that there may not be a liquid secondary market for the contracts and/or that a change in the value of the contract may not correlate with a change in the value of the underlying securities or indices.
During the current fiscal period, the Fund used futures on U.S. and German interest rates as part of an overall portfolio construction strategy to reduce interest rate sensitivity and manage yield curve exposure.
The average notional amount of futures contracts outstanding during the current fiscal period was as follows:
| | | | |
Average notional amount of futures contracts outstanding* | | | $4,275,612 | |
| * | The average notional amount is calculated based on the absolute aggregate notional of contracts outstanding at the beginning of the current fiscal period and at the end of each quarter within the current fiscal period. |
48
The following table presents the fair value of all futures contracts held by the Fund as of the end of the reporting period, the location of these instruments on the Statement of Assets and Liabilities and the primary underlying risk exposure.
| | | | | | | | | | | | | | | | | | |
| | | | | Location on the Statement of Assets and Liabilities | |
Underlying Risk Exposure | | Derivative Instrument | | Asset Derivatives | | | | | | (Liability) Derivatives | |
| | Location | | Value | | | | | | Location | | Value | |
| Interest rate | | Futures contracts | | Recievable for variation margin on futures contracts* | | | $(6,528) | | | | | | | Payable for variation margin on futures contracts* | | $ | (29,600 | ) |
| * | Value represents unrealized appreciation (depreciation) of futures contracts as reported in the Fund’s Portfolio of Investments and not the asset and/or liability derivative location as described in the table above. |
The following table presents the amount of net realized gain (loss) and change in net unrealized appreciation (depreciation) recognized on futures contracts on the Statement of Operations during the current fiscal period, and the primary underlying risk exposure.
| | | | | | | | | | |
Underlying
Risk Exposure | | Derivative
Instrument | | Net Realized
Gain (Loss)
from Futures
Contracts | | | Change in Net
Unrealized Appreciation
(Depreciation) of
Futures Contracts | |
Interest rate | | Futures contracts | | $ | (188,289 | ) | | $ | (22,356 | ) |
Interest Rate Swap Contracts
Interest rate swap contracts involve the Fund’s agreement with the counterparty to pay or receive a fixed rate payment in exchange for the counterparty receiving or paying a variable rate payment. Forward interest rate swap contracts involve the Fund’s agreement with a counterparty to pay, in the future, a fixed or variable rate payment in exchange for the counterparty paying the Fund a variable or fixed rate payment, the accruals for which would begin at a specified date in the future (the “effective date”).
The amount of the payment obligation for an interest rate swap is based on the notional amount and the termination date of the contract. Interest rate swap contracts do not involve the delivery of securities or other underlying assets or principal. Accordingly, the risk of loss with respect to the swap counterparty on such transactions is limited to the net amount of interest payments that the Fund is to receive.
Interest rate swap contracts are valued daily. Upon entering into an interest rate swap contract (and beginning on the effective date for a forward interest rate swap contract), the Fund accrues the fixed rate payment expected to be paid or received and the variable rate payment expected to be received or paid on the interest rate swap contracts on a daily basis, and recognizes the daily change in the fair value of the Fund’s contractual rights and obligations under the contracts. For an OTC swap that is not cleared through a clearing house (“OTC Uncleared”), the amount recorded on these transactions is recognized on the Statement of Assets and Liabilities as a component of “Unrealized appreciation or depreciation on interest rate swaps.”
Upon the execution of an OTC swap cleared through a clearing house (“OTC Cleared”), the Fund is obligated to deposit cash or eligible securities, also known as “initial margin,” into an account at its clearing broker equal to a specified percentage of the contract amount. Cash deposited by the Fund to cover initial margin requirements on open swap contracts, if any, is recognized as a component of “Cash collateral at brokers for investments in swaps” on the Statement of Assets and Liabilities. Investments in OTC Cleared swaps obligate the Fund and the clearing broker to settle monies on a daily basis representing changes in the prior day’s “mark-to-market” of the swap contract. If the Fund has unrealized appreciation, the clearing broker will credit the Fund’s account with an amount equal to the appreciation. Conversely, if the Fund has unrealized depreciation, the clearing broker will debit the Fund’s account with an amount equal to the depreciation. These daily cash settlements are also known as “variation margin.” Variation margin for OTC Cleared swaps is recognized as a receivable and/or payable for “Variation margin on swap contracts” on the Statement of Assets and Liabilities. Upon the execution of an OTC Uncleared swap, neither the Fund nor the counterparty is required to deposit initial margin as the trades are recorded bilaterally between both parties to the swap contract, and the terms of the variation margin are subject to a predetermined threshold negotiated by the Fund and the counterparty. Variation margin for OTC Uncleared swaps is recognized as a component of “Unrealized appreciation or depreciation on interest rate swaps” as described in the preceding paragraph.
The net amount of periodic payments settled in cash are recognized as a component of “Net realized gain (loss) from swaps” on the Statement of Operations, in addition to the net realized gain or loss recorded upon the termination of the swap contract. For tax purposes, payments expected to be received or paid on the swap contracts are treated as ordinary income or expense, respectively. Changes in the value of the swap contracts during the fiscal period are recognized as a component of “Change in net unrealized appreciation (depreciation) of swaps” on the Statement of Operations. In certain instances, payments are made or received upon entering into the swap contract to compensate for differences between the stated terms of the swap agreements and prevailing market conditions (credit spreads, currency exchange rates, interest rates, and other relevant factors). Payments received or made at the beginning of the measurement period, if any, are recognized as “Interest rate swaps premiums received and/or paid” on the Statement of Assets and Liabilities.
49
Notes to Financial Statements(Unaudited) (continued)
During the current fiscal period, the Fund continued to utilize forward starting interest rate swap contracts to partially hedge its future interest cost of leverage, which is through the use of bank borrowings.
The average notional amount of interest rate swap contracts outstanding during the current fiscal period was as follows:
| | | | |
Average notional amount of interest rate swap contracts outstanding* | | | $56,200,000 | |
| * | The average notional amount is calculated based on the outstanding notional at the beginning of the current fiscal period and at the end of each fiscal quarter within the current fiscal period. |
The following table presents the fair value of all swap contracts held by the Fund as of the end of the reporting period, the location of these instruments on the Statement of Assets and Liabilities and the primary underlying risk exposure.
| | | | | | | | | | | | | | | | | | |
| | | | | Location on the Statement of Assets and Liabilities | |
Underlying Risk Exposure | | Derivative Instrument | | Asset Derivatives | | | | | | (Liability) Derivatives | |
| | Location | | Value | | | | | | Location | | Value | |
| Interest rate | | Swaps (OTC Uncleared) | | — | | | — | | | | | | | Unrealized depreciation on interest rate swaps** | | $ | (1,466,328 | ) |
| ** | Some swap contracts require a counterparty to pay or receive a premium, which is disclosed on the Statement of Assets and Liabilities, when applicable and is not reflected in the cumulative unrealized appreciation (depreciation) presented above. |
The following table presents the swap contacts subject to netting agreements and the collateral delivered related to those swap contracts as of the end of the reporting period.
| | | | | | | | | | | | | | | | | | | | | | | | |
| | | | | | | | | | | | Gross Amount Not Offset on the
Statement of Assets and Liabilities | | | | |
| Counterparty | | Gross
Unrealized
Appreciation on
Interest Rate
Swaps*** | | | Gross
Unrealized
(Depreciation) on
Interest Rate
Swaps*** | | | Net
Unrealized
Appreciation
(Depreciation) on
Interest Rate
Swaps | | | Interest
Rate Swaps
Premiums
Paid | | | Collateral
Pledged
to (from)
Counterparty | | | Net
Exposure | |
JPMorgan Chase Bank, N.A. | | $ | — | | | $ | (1,466,328 | ) | | $ | (1,466,328 | ) | | $ | — | | | $ | 1,466,328 | | | $ | — | |
| *** | Represents gross unrealized appreciation (depreciation) for the counterparty as reported in the Fund’s Portfolio of Investments. |
The following table presents the amount of net realized gain (loss) and change in net unrealized appreciation (depreciation) recognized on swap contracts on the Statement of Operations during the current fiscal period, and the primary underlying risk exposure.
| | | | | | | | | | |
Underlying
Risk Exposure | | Derivative
Instrument | | Net Realized Gain (Loss)
from Swaps | | | Change in Net
Unrealized
Appreciation
(Depreciation) of
Swaps | |
Interest rate | | Swaps | | $ | 149,152 | | | $ | (2,824,744 | ) |
Market and Counterparty Credit Risk
In the normal course of business the Fund may invest in financial instruments and enter into financial transactions where risk of potential loss exists due to changes in the market (market risk) or failure of the other party to the transaction to perform (counterparty credit risk). The potential loss could exceed the value of the financial assets recorded on the financial statements. Financial assets, which potentially expose the Fund to counterparty credit risk, consist principally of cash due from counterparties on forward, option and swap transactions, when applicable. The extent of the Fund’s exposure to counterparty credit risk in respect to these financial assets approximates their carrying value as recorded on the Statement of Assets and Liabilities.
The Fund helps manage counterparty credit risk by entering into agreements only with counterparties the Adviser believes have the financial resources to honor their obligations and by having the Adviser monitor the financial stability of the counterparties. Additionally, counterparties may be required to pledge collateral daily (based on the daily valuation of the financial asset) on behalf of the Fund with a value approximately equal to the amount of any unrealized gain above a pre-determined threshold. Reciprocally, when the Fund has an unrealized loss, the Fund has instructed the custodian to pledge assets of the Fund as collateral with a value approximately equal to the amount of the unrealized loss above a pre-determined threshold. Collateral pledges are monitored and subsequently adjusted if and when the valuations fluctuate, either up or down, by at least the pre-determined threshold amount.
50
4. Fund Shares
Common Shares Transactions
Transactions in common shares during the current and prior fiscal period were as follows:
| | | | | | | | |
| | | Six Months
Ended
6/30/19 | | | Year Ended
12/31/18 | |
Common Shares: | | | | | | | | |
Issued to shareholders due to reinvestment of distributions | | | — | | | | 4,584 | |
Repurchased and retired | | | — | | | | (10,000 | ) |
Weighted average common share: | | | | | | | | |
Price per share repurchased and retired | | | — | | | $ | 8.85 | |
Discount per share repurchased and retired | | | — | | | | 15.63 | % |
5. Investment Transactions
Long-term purchases and sales (including maturities but excluding derivative transactions) during the current fiscal period aggregated $82,984,069 and $87,254,912, respectively.
6. Income Tax Information
The Fund intends to distribute substantially all of its net investment company taxable income to shareholders and to otherwise comply with the requirements of Subchapter M of the Internal Revenue Code applicable to regulated investment companies. In any year when the Fund realizes net capital gains, the Fund may choose to distribute all or a portion of its net capital gains to shareholders, or alternatively, to retain all or a portion of its net capital gains and pay federal corporate income taxes on such retained gains.
For all open tax years and all major taxing jurisdictions, management of the Fund has concluded that there are no significant uncertain tax positions that would require recognition in the financial statements. Open tax years are those that are open for examination by taxing authorities (i.e., generally the last four tax year ends and the interim tax period since then). Furthermore, management of the Fund is also not aware of any tax positions for which it is reasonably possible that the total amounts of unrecognized tax benefits will significantly change in the next twelve months.
The following information is presented on an income tax basis. Differences between amounts for financial statement and federal income tax purposes are primarily due to recognition of premium amortization and timing differences in recognizing certain gains and losses on investment transactions. To the extent that differences arise that are permanent in nature, such amounts are reclassified within the capital accounts as detailed below. Temporary differences do not require reclassification. Temporary and permanent differences do not impact the NAV of the Fund.
The tables below present the cost and unrealized appreciation (depreciation) of the Fund’s investment portfolio, as determined on a federal income tax basis as of June 30, 2019.
For purposes of this disclosure, derivative tax cost is generally the sum of any upfront fees or premiums exchanged and any amounts unrealized for income statement reporting but realized in income and/or capital gains for tax reporting. If a particular derivative category does not disclose any tax unrealized appreciation or depreciation, the change in value of those derivatives have generally been fully realized for tax purposes.
| | | | |
Tax cost of investments | | $ | 304,608,192 | |
Gross unrealized: | | | | |
Appreciation | | $ | 38,830,561 | |
Depreciation | | | (12,110,567 | ) |
Net unrealized appreciation (depreciation) of investments | | $ | 26,719,994 | |
| | | | |
Tax cost of forward contracts | | $ | (10,249 | ) |
Net unrealized appreciation (depreciation) of forward contracts | | | 7,474 | |
| | | | |
Tax cost of futures contracts | | $ | (36,128 | ) |
Net unrealized appreciation (depreciation) of futures contracts | | | — | |
| | | | |
Tax cost of swaps | | $ | — | |
Net unrealized appreciation (depreciation) of swaps | | | (1,466,328 | ) |
51
Notes to Financial Statements(Unaudited) (continued)
Permanent differences, primarily due to foreign currency transactions, treatment of notional principal contracts and bond premium amortization adjustments, resulted in reclassifications among the Fund’s components of common share net assets as of December 31, 2018, the Fund’s last tax year end.
The tax components of undistributed net ordinary income and net long-term capital gains as of December 31, 2018, the Fund’s last tax year end, were as follows:
| | | | |
Undistributed net ordinary income | | $ | — | |
Undistributed net long-term capital gains | | | — | |
The tax character of distributions paid during the Fund’s last tax year ended December 31, 2018 was designated for purposes of the dividends paid deduction as follows:
| | | | |
Distributions from net ordinary income1 | | | $7,847,651 | |
Distributions from net long-term capital gains | | | 4,386,894 | |
Return of capital | | | 7,313,269 | |
|
1 Net ordinary income consists of net taxable income derived from dividends, interest, and net short-term capital gains, if any. | |
The Fund has elected to defer late-year losses in accordance with federal income tax rules. These losses are treated as having arisen on the first day of the current fiscal year. The Fund has elected to defer losses as follows:
| | | | |
Post-October capital losses2 | | | $519,193 | |
Late-year ordinary losses3 | | | 15,025 | |
|
2 Capital losses incurred from November 1, 2018 through December 31, 2018, the Fund’s last tax year end. | |
3 Specified losses incurred from November 1, 2018 through December 31, 2018. | |
7. Management Fees
The Fund’s management fee compensates the Adviser for overall investment advisory and administrative services and general office facilities. The Sub-Advisers are compensated for their services to the Fund from the management fees paid to the Adviser.
The Fund’s management fee consists of two components – a fund-level fee, based only on the amount of assets within the Fund, and a complex-level fee, based on the aggregate amount of all eligible fund assets managed by the Adviser. This pricing structure enables Fund shareholders to benefit from growth in the assets within the Fund as well as from growth in the amount of complex-wide assets managed by the Adviser.
The annual fund-level fee, payable monthly, is calculated according to the following schedule:
| | | | |
| Average Daily Managed Assets* | | Fund-Level Fee Rate | |
For the first $500 million | | | 0.7000 | % |
For the next $500 million | | | 0.6750 | |
For the next $500 million | | | 0.6500 | |
For the next $500 million | | | 0.6250 | |
For managed assets over $2 billion | | | 0.6000 | |
52
The annual complex-level fee, payable monthly, is calculated by multiplying the current complex-wide fee rate, determined according to the following schedule by the Fund’s daily managed assets:
| | | | |
| Complex-Level Eligible Asset Breakpoint Level* | | Effective Complex-Level Fee
Rate at Breakpoint Level | |
$55 billion | | | 0.2000 | % |
$56 billion | | | 0.1996 | |
$57 billion | | | 0.1989 | |
$60 billion | | | 0.1961 | |
$63 billion | | | 0.1931 | |
$66 billion | | | 0.1900 | |
$71 billion | | | 0.1851 | |
$76 billion | | | 0.1806 | |
$80 billion | | | 0.1773 | |
$91 billion | | | 0.1691 | |
$125 billion | | | 0.1599 | |
$200 billion | | | 0.1505 | |
$250 billion | | | 0.1469 | |
$300 billion | | | 0.1445 | |
| * | For the complex-level fees, managed assets include closed-end fund assets managed by the Adviser that are attributable to certain types of leverage. For these purposes, leverage includes the funds’ use of preferred stock and borrowings and certain investments in the residual interest certificates (also called inverse floating rate securities) in tender option bond (TOB) trusts, including the portion of assets held by a TOB trust that has been effectively financed by the trust’s issuance of floating rate securities, subject to an agreement by the Adviser as to certain funds to limit the amount of such assets for determining managed assets in certain circumstances. The complex-level fee is calculated based upon the aggregate daily managed assets of all Nuveen open-end and closed-end funds that constitute “eligible assets.” Eligible assets do not include assets attributable to investments in other Nuveen funds or assets in excess of a determined amount (originally $2 billion) added to the Nuveen fund complex in connection with the Adviser’s assumption of the management of the former First American Funds effective January 1, 2011. As of June 30, 2019, the complex-level fee for the Fund was 0.1577%. |
8. Senior Loan Commitments
Unfunded Commitments
Pursuant to the terms of certain of the variable rate senior loan agreements, the Fund may have unfunded senior loan commitments. The Fund will maintain with its custodian, cash, liquid securities and/or liquid senior loans having an aggregate value at least equal to the amount of unfunded senior loan commitments. As of the end of the reporting period, the Fund had no such outstanding unfunded senior loan commitments.
Participation Commitments
With respect to the senior loans held in the Fund’s portfolio, the Fund may: 1) invest in assignments; 2) act as a participant in primary lending syndicates; or 3) invest in participations. If the Fund purchases a participation of a senior loan interest, the Fund would typically enter into a contractual agreement with the lender or other third party selling the participation, rather than directly with the borrower. As such, the Fund not only assumes the credit risk of the borrower, but also that of the selling participant or other persons interpositioned between the Fund and the borrower. As of the end of the reporting period, the Fund had no such outstanding participation commitments.
9. Borrowing Arrangements
Borrowing
The Fund has entered into a borrowing arrangement as a means of leverage.
As of the end of the reporting period, the Fund has a $115,000,000 (maximum commitment amount) committed 364-day revolving line of credit (“Borrowing”) with its custodian bank. As of the end of the reporting period, the outstanding balance on these Borrowings was $97,900,000.
During May 2019, the Fund renewed the Borrowings with its custodian bank through May 15, 2020. The Fund incurred a 0.05% amendment fee based on the maximum commitment amount of the Borrowings. All other terms remained unchanged.
Prior to the Renewal Date, interest is charged on the Borrowings drawn amount at a rate per annum equal to the higher of (a) one-month LIBOR rate plus 0.75% or (b) the Federal Funds rate plus 0.75%. The Fund also accrued a 0.15% per annum commitment fee on the undrawn balance based on the maximum commitment amount of the Borrowings to the extent the unused portion of the Borrowings is less than 50% of the maximum commitment amount, otherwise the per annum commitment fee is 0.25%.
Effective on the Renewal Date, Interest is charged on the Borrowings drawn amount at a rate per annum equal to the higher of (a) one-month LIBOR rate plus 0.70%. The Fund also accrued a 0.15% per annum commitment fee on the undrawn balance based on the maximum commitment amount of the Borrowings to the extent the unused portion of the Borrowings is less than 50% of the maximum commitment amount, otherwise the per annum commitment fee is 0.25%.
53
Notes to Financial Statements(Unaudited) (continued)
During the current fiscal period, the average daily balance outstanding and average annual interest rate on these Borrowings was $97,900,000 and 3.22%, respectively.
In order to maintain these Borrowings, the Fund must meet certain collateral, asset coverage and other requirements. Borrowings outstanding are fully secured by assets in the Fund’s portfolio of investments.
Borrowings outstanding are recognized as “Borrowings” on the Statement of Assets and Liabilities. Interest expense, commitment fees and the amendment fee are each recognized as a component of “Interest expense on borrowings” on the Statement of Operations.
Inter-Fund Borrowing and Lending
The Securities and Exchange Commission (“SEC”) has granted an exemptive order permitting registered open-end and closed-end Nuveen funds to participate in an inter-fund lending facility whereby the Nuveen funds may directly lend to and borrow money from each other for temporary purposes (e.g., to satisfy redemption requests or when a sale of securities “fails,” resulting in an unanticipated cash shortfall) (the “Inter-Fund Program”). The closed-end Nuveen funds, including the Fund covered by this shareholder report, will participate only as lenders, and not as borrowers, in the Inter-Fund Program because such closed-end funds rarely, if ever, need to borrow cash to meet redemptions. The Inter-Fund Program is subject to a number of conditions, including, among other things, the requirements that (1) no fund may borrow or lend money through the Inter-Fund Program unless it receives a more favorable interest rate than is typically available from a bank or other financial institution for a comparable transaction; (2) no fund may borrow on an unsecured basis through the Inter-Fund Program unless the fund’s outstanding borrowings from all sources immediately after the inter-fund borrowing total 10% or less of its total assets; provided that if the borrowing fund has a secured borrowing outstanding from any other lender, including but not limited to another fund, the inter-fund loan must be secured on at least an equal priority basis with at least an equivalent percentage of collateral to loan value; (3) if a fund’s total outstanding borrowings immediately after an inter-fund borrowing would be greater than 10% of its total assets, the fund may borrow through the inter-fund loan on a secured basis only; (4) no fund may lend money if the loan would cause its aggregate outstanding loans through the Inter-Fund Program to exceed 15% of its net assets at the time of the loan; (5) a fund’s inter-fund loans to any one fund shall not exceed 5% of the lending fund’s net assets; (6) the duration of inter-fund loans will be limited to the time required to receive payment for securities sold, but in no event more than seven days; and (7) each inter-fund loan may be called on one business day’s notice by a lending fund and may be repaid on any day by a borrowing fund. In addition, a Nuveen fund may participate in the Inter-Fund Program only if and to the extent that such participation is consistent with the fund’s investment objective and investment policies. The Board is responsible for overseeing the Inter-Fund Program.
The limitations detailed above and the other conditions of the SEC exemptive order permitting the Inter-Fund Program are designed to minimize the risks associated with Inter-Fund Program for both the lending fund and the borrowing fund. However, no borrowing or lending activity is without risk. When a fund borrows money from another fund, there is a risk that the loan could be called on one day’s notice or not renewed, in which case the fund may have to borrow from a bank at a higher rate or take other actions to payoff such loan if an inter-fund loan is not available from another fund. Any delay in repayment to a lending fund could result in a lost investment opportunity or additional borrowing costs.
During the current reporting period, the Fund did not enter into any inter-fund loan activity.
10. New Accounting Pronouncements
FASB Accounting Standards Update (“ASU”) 2017-08 (“ASU 2017-08”) Premium Amortization on Purchased Callable Debt Securities
The FASB has issued ASU2017-08, which shortens the premium amortization period for purchased non-contingently callable debt securities. ASU2017-08 specifies that the premium amortization period ends at the earliest call date, for purchased non-contingently callable debt securities. ASU2017-08 is effective for fiscal years, and interim periods within those fiscal years, beginning after December 15, 2018. During the current fiscal period, ASU2017-08 became effective for the Fund and it did not have a material impact on the Fund’s financial statements.
Fair Value Measurement: Disclosure Framework
During August 2018, the FASB issued ASU2018-13 (“ASU2018-13”),Fair Value Measurement: Disclosure Framework – Changes to the Disclosure Requirements for Fair Value Measurements. ASU2018-13 modifies the disclosures required by Topic 820,Fair Value Measurements. The amendments in ASU2018-13 are effective for all entities for fiscal years, and interim periods within those fiscal years, beginning after December 15, 2019. Management has early implemented this guidance and it did not have a material impact on the Fund’s financial statements.
11. Subsequent Event
Complex-Level Management Fee
Effective August 1, 2019 (subsequent to the close of the reporting period), “eligible assets” of the complex-level management fee will include certain assets of certain Nuveen funds that were reorganized into funds advised by an affiliate of the Adviser during the 2019 calendar year.
54
Additional Fund Information
| | | | | | | | | | |
| Board of Trustees | | | | | | | | | | |
| Margo Cook* | | Jack B. Evans | | William C. Hunter | | Albin F. Moschner | | John K. Nelson | | Judith M. Stockdale |
Carole E. Stone | | Terence J. Toth | | Margaret L. Wolff | | | | | | |
| * | Interested Board Member. |
| | | | | | | | |
| | | | | |
Fund Manager Nuveen Fund Advisors, LLC
333 West Wacker Drive
Chicago, IL 60606 | | Custodian State Street Bank
& Trust Company One Lincoln Street Boston, MA 02111 | | Legal Counsel Chapman and Cutler LLP
Chicago, IL 60603 | | Independent Registered
Public Accounting Firm KPMG LLP 200 East Randolph Street Chicago, IL 60601 | | Transfer Agent and
Shareholder Services Computershare Trust Company, N.A. 250 Royall Street Canton, MA 02021 (800) 257-8787 |
Portfolio of Investments Information
The Fund is required to file its complete schedule of portfolio holdings with the Securities and Exchange Commission (SEC) for the first and third quarters of each fiscal year as an exhibit to its report on FormN-Port. You may obtain this information directly from the SEC’s website at http://www.sec.gov.
Nuveen Funds’ Proxy Voting Information
You may obtain (i) information regarding how each fund voted proxies relating to portfolio securities held during the most recent twelve-month period ended June 30, without charge, upon request, by calling Nuveen toll-free at (800) 257-8787 or on Nuveen’s website at www.nuveen.com and (ii) a description of the policies and procedures that each fund used to determine how to vote proxies relating to portfolio securities without charge, upon request, by calling Nuveen toll free at (800) 257-8787. You may also obtain this information directly from the SEC. Visit the SEC on-line at http://www.sec.gov.
CEO Certification Disclosure
The Fund’s Chief Executive Officer (CEO) has submitted to the New York Stock Exchange (NYSE) the annual CEO certification as required by Section 303A.12(a) of the NYSE Listed Company Manual. The Fund has filed with the SEC the certification of its CEO and Chief Financial Officer required by Section 302 of the Sarbanes-Oxley Act.
Common Share Repurchases
The Fund intends to repurchase, through its open-market share repurchase program, shares of its own common stock at such times and in such amounts as is deemed advisable. During the period covered by this report, the Fund repurchased shares of its common stock as shown in the accompanying table. Any future repurchases will be reported to shareholders in the next annual or semi-annual report.
| | | | |
| | | JDD | |
Common shares repurchased | | | — | |
FINRA BrokerCheck
The Financial Industry Regulatory Authority (FINRA) provides information regarding the disciplinary history of FINRA member firms and associated investment professionals. This information as well as an investor brochure describing FINRA BrokerCheck is available to the public by calling the FINRA BrokerCheck Hotline number at (800) 289-9999 or by visiting www.FINRA.org.
55
Glossary of Terms Used in this Report
| ∎ | | Average Annual Total Return: This is a commonly used method to express an investment’s performance over a particular, usually multi-year time period. It expresses the return that would have been necessary each year to equal the investment’s actual cumulative performance (including change in NAV or market price and reinvested dividends and capital gains distributions, if any) over the time period being considered. |
| ∎ | | Beta: A measure of the variability of the change in the share price for a fund in relation to a change in the value of the fund’s market benchmark. Securities with betas higher than 1.0 have been, and are expected to be, more volatile than the benchmark; securities with betas lower than 1.0 have been, and are expected to be, less volatile than the benchmark. |
| ∎ | | Blended Index (Comparative Benchmark): The performance is a blended return consisting of: 1) 25% of the return of the Morgan Stanley Capital International (MSCI) World Index: A free float-adjusted market capitalization weighted index that is designed to measure the equity market performance of developed markets. The MSCI World Index consists of the following 23 developed market country indexes: Australia, Austria, Belgium, Canada, Denmark, Finland, France, Germany, Hong Kong, Ireland, Israel, Italy, Japan, Netherlands, New Zealand, Norway, Portugal, Singapore, Spain, Sweden, Switzerland, the U.K. and the U.S. 2) 25% of the return of the Wilshire U.S. Real Estate Securities Index, an unmanaged, market capitalization-weighted index comprised of publicly traded REITs and real estate companies, 3) 25% of the return of the JPMorgan Emerging Markets Bond Index (EMBI) Global Diversified, which tracks total returns for U.S.-dollar-denominated debt instruments issued by emerging markets sovereign and quasi-sovereign entities, and 4) 25% of the return of the Credit Suisse Leveraged Loan Index, which consists of approximately $150 billion of tradable term loans with at least one year to maturity and rated BBB or lower. Index returns assume reinvestment of dividends, but do not include the effects of any applicable sales charges or management fees. |
| ∎ | | Collateralized Loan Obligation (CLO): A security backed by a pool of debt, often low rated corporate loans. Collateralized loan obligations (CLOs) are similar to collateralized mortgage obligations, except for the different type of underlying loan. |
| ∎ | | Effective Leverage: Effective leverage is a fund’s effective economic leverage, and includes both regulatory leverage (see below) and the leverage effects of certain derivative investments in the fund’s portfolio. |
| ∎ | | Leverage: Leverage is created whenever a fund has investment exposure (both reward and/or risk) equivalent to more than 100% of the investment capital. |
| ∎ | | Net Asset Value (NAV) Per Share: A fund’s Net Assets is equal to its total assets (securities, cash, accrued earnings and receivables) less its total liabilities. NAV per share is equal to the fund’s Net Assets divided by its number of shares outstanding. |
| ∎ | | Regulatory Leverage: Regulatory leverage consists of preferred shares issued by or borrowings of the fund. Both of these are part of the fund’s capital structure. Regulatory leverage is subject to asset coverage limits set in the Investment Company Act of 1940. |
| ∎ | | S&P 500®: An unmanaged Index generally considered representative of the U.S. stock market. Index returns assume reinvestment of distributions, but do not reflect of any applicable sales charges or management fees. |
56
Reinvest Automatically, Easily and Conveniently
Nuveen makes reinvesting easy. A phone call is all it takes to set up your reinvestment account.
Nuveen Closed-End Funds Automatic Reinvestment Plan
Your Nuveen Closed-End Fund allows you to conveniently reinvest distributions in additional Fund shares.
By choosing to reinvest, you’ll be able to invest money regularly and automatically, and watch your investment grow through the power of compounding. Just like distributions in cash, there may be times when income or capital gains taxes may be payable on distributions that are reinvested.
It is important to note that an automatic reinvestment plan does not ensure a profit, nor does it protect you against loss in a declining market.
Easy and convenient
To make recordkeeping easy and convenient, each quarter you’ll receive a statement showing your total distributions, the date of investment, the shares acquired and the price per share, and the total number of shares you own.
How shares are purchased
The shares you acquire by reinvesting will either be purchased on the open market or newly issued by the Fund. If the shares are trading at or above net asset value at the time of valuation, the Fund will issue new shares at the greater of the net asset value or 95% of the then-current market price. If the shares are trading at less than net asset value, shares for your account will be purchased on the open market. If the Plan Agent begins purchasing Fund shares on the open market while shares are trading below net asset value, but the Fund’s shares subsequently trade at or above their net asset value before the Plan Agent is able to complete its purchases, the Plan Agent may cease open-market purchases and may invest the uninvested portion of the distribution in newly-issued Fund shares at a price equal to the greater of the shares’ net asset value or 95% of the shares’ market value on the last business day immediately prior to the purchase date. Distributions received to purchase shares in the open market will normally be invested shortly after the distribution payment date. No interest will be paid on distributions awaiting reinvestment. Because the market price of the shares may increase before purchases are completed, the average purchase price per share may exceed the market price at the time of valuation, resulting in the acquisition of fewer shares than if the distribution had been paid in shares issued by the Fund. A pro rata portion of any applicable brokerage commissions on open market purchases will be paid by Plan participants. These commissions usually will be lower than those charged on individual transactions.
Flexible
You may change your distribution option or withdraw from the Plan at any time, should your needs or situation change.
You can reinvest whether your shares are registered in your name, or in the name of a brokerage firm, bank, or other nominee. Ask your investment advisor if his or her firm will participate on your behalf. Participants whose shares are registered in the name of one firm may not be able to transfer the shares to another firm and continue to participate in the Plan.
The Fund reserves the right to amend or terminate the Plan at any time. Although the Fund reserves the right to amend the Plan to include a service charge payable by the participants, there is no direct service charge to participants in the Plan at this time.
Call today to start reinvesting distributions
For more information on the Nuveen Automatic Reinvestment Plan or to enroll in or withdraw from the Plan, speak with your financial advisor or call us at (800) 257-8787.
57
Annual Investment Management Agreement Approval Process
(Unaudited)
At a meeting held onMay 21-23, 2019 (the“May Meeting”), the Board of Trustees (the“Board” and each Trustee, a“Board Member”) of the Fund, including the Board Members who are not “interested persons” (as defined under the Investment Company Act of 1940 (the“1940 Act”)) (the“Independent Board Members”), approved the renewal of the management agreement (the“Investment Management Agreement”) with Nuveen Fund Advisors, LLC (the“Adviser”) pursuant to which the Adviser serves as investment adviser to the Fund and the sub-advisory agreements (the“Sub-Advisory Agreements”) with each of NWQ Investment Management Company, LLC (“NWQ”), Security Capital Research & Management Incorporated (“Security Capital”), Symphony Asset Management LLC (“Symphony”) and Wellington Management Company LLP (“Wellington,” and each of NWQ, Security Capital, Symphony and Wellington, a“Sub-Adviser”) pursuant to which theSub-Advisers serve as thesub-advisers to the Fund. Following an initialtwo-year period, the Board, including the Independent Board Members, is required under the 1940 Act to review and approve the Investment Management Agreement andSub-Advisory Agreements on behalf of the Fund on an annual basis. The Investment Management Agreement andSub-Advisory Agreements are collectively referred to as the“Advisory Agreements” and the Adviser and eachSub-Adviser are collectively, the“Fund Advisers” and each, a“Fund Adviser.”
In response to a request on behalf of the Independent Board Members by independent legal counsel, the Board received and reviewed prior to the May Meeting extensive materials specifically prepared for the annual review of Advisory Agreements by the Adviser as well as by Broadridge Financial Solutions, Inc. (“Broadridge”), an independent provider of investment company data. The materials provided in connection with the annual review covered a breadth of subject matter including, but not limited to, a description of the nature, extent and quality of services provided by the Fund Advisers; a review of eachSub-Adviser and investment team; an analysis of fund performance in absolute terms and as compared to the performance of certain peer funds and benchmarks with a focus on any performance outliers; an analysis of the fees and expense ratios of the Nuveen funds in absolute terms and as compared to those of certain peer funds with a focus on any expense outliers; a description of portfolio manager compensation; a review of the secondary market trading of shares of the Nuveenclosed-end funds (including, among other things, an analysis of performance, distribution and valuation and capital raising trends in the broaderclosed-end fund market and in particular with respect to Nuveenclosed-end funds; a review of the leverage management actions taken on behalf of the Nuveenclosed-end funds and their resulting impact on performance; and a description of the distribution management process and any capital management activities); a review of the performance of various service providers; a description of various initiatives Nuveen had undertaken or continued during the year for the benefit of particular fund(s) and/or the complex; a description of the profitability or financial data of Nuveen and theSub-Advisers; and a description of indirect benefits received by the Fund Advisers as a result of their relationships with the Nuveen funds. The Board Members held anin-person meeting onApril 17-18, 2019 (the“April Meeting”), in part, to review and discuss the performance of the Nuveen funds and the Adviser’s evaluation of the varioussub-advisers to the Nuveen funds. The Independent Board Members asked questions and requested additional information that was provided for the May Meeting.
The information prepared specifically for the annual review of the Advisory Agreements supplemented the information provided to the Board and its committees throughout the year. The Board and its committees met regularly during the year and the information provided and topics discussed were relevant to the review of the Advisory Agreements. Some of these reports and other data included, among other things, materials that outlined the investment performance of the Nuveen funds; strategic plans of the Adviser which may impact the services it provides to the Nuveen funds; the review of the Nuveen funds and applicable investment teams; the management of leverage financing forclosed-end funds; the secondary market trading of theclosed-end funds and any actions to address discounts; compliance, regulatory and risk management matters; the trading practices of the varioussub-advisers; valuation of securities; fund expenses; and overall market and regulatory developments. The Board further continued its practice of seeking to meet periodically with the varioussub-advisers to the Nuveen funds and their investment teams, when feasible. The Independent Board Members considered the review of the Advisory Agreements to be an ongoing process and employed the accumulated information, knowledge, and experience the Board Members had gained during their tenure on the boards governing the Nuveen funds and working with the Fund Advisers in their review of the Advisory Agreements. The contractual arrangements are a result of multiple years of review, negotiation and information provided in connection with the boards’ annual review of the Nuveen funds’ advisory arrangements and oversight of the Nuveen funds.
58
The Independent Board Members were advised by independent legal counsel during the annual review process as well as throughout the year, including meeting in executive sessions with such counsel at which no representatives from the Adviser or aSub-Adviser were present. In connection with their annual review, the Independent Board Members also received a memorandum from independent legal counsel outlining their fiduciary duties and legal standards in reviewing the Advisory Agreements.
In deciding to renew the Advisory Agreements, the Independent Board Members did not identify a particular factor or information as determinative or controlling, but rather the decision reflected the comprehensive consideration of all the information provided, and each Board Member may have attributed different levels of importance to the various factors and information considered in connection with the approval process. The following summarizes the principal factors and information, but not all the factors, the Board considered in deciding to renew the Advisory Agreements and its conclusions.
| A. | | Nature, Extent and Quality of Services |
In evaluating the renewal of the Advisory Agreements, the Independent Board Members received and considered information regarding the nature, extent and quality of the applicable Fund Adviser’s services provided to the Fund with particular focus on the services and enhancements to such services provided during the last year. The Board recognized that the Adviser provides a comprehensive set of services necessary to operate the Nuveen funds in a highly regulated industry and noted that the scope of such services has expanded over the years as a result of regulatory, market and other developments, such as the development of the liquidity management program and expanded compliance programs. Some of the functions the Adviser is responsible for include, but are not limited to: product management (such as analyzing a fund’s position in the marketplace, setting dividends, preparing shareholder and intermediary communications and other due diligence support); investment oversight (such as analyzing fund performance,sub-advisers and investment teams and analyzing trade executions of portfolio transactions, soft dollar practices and securities lending activities); securities valuation services (such as executing the daily valuation process for portfolio securities and developing and recommending changes to valuation policies and procedures); risk management (such as overseeing operational and investment risks, including stress testing); fund administration (such as preparing fund tax returns and other tax compliance services, overseeing the Nuveen funds’ independent public accountants and other service providers; managing fund budgets and expenses; and helping to fulfill the funds’ regulatory filing requirements); oversight of shareholder services and transfer agency functions (such as oversight and liaison of transfer agent service providers which include registered shareholder customer service and transaction processing); Board relations services (such as organizing and administering Board and committee meetings, preparing various reports to the Board and committees and providing other support services); compliance and regulatory oversight services (such as developing and maintaining a compliance program to ensure compliance with applicable laws and regulations, monitoring compliance with applicable fund policies and procedures and adherence to investment restrictions, and evaluating the compliance programs of the Nuveen fundsub-advisers and certain other service providers); legal support and oversight of outside law firms (such as with respect to filing and updating registration statements; maintaining various regulatory registrations; and providing legal interpretations regarding fund activities, applicable regulations and implementation of policies and procedures); and leverage, capital and distribution management services. In reviewing the scope and quality of services, the Board recognized the continued efforts and resources the Adviser and its affiliates have employed to continue to enhance their services for the benefit of the complex as well as particular Nuveen funds over recent years. Such service enhancements have included, but are not limited to:
| | • | | Fund Improvements and Product Management Initiatives – continuing to proactively manage the Nuveen fund complex as a whole and at the individual fund level with an aim to enhance the shareholder outcomes through, among other things, repositioning funds, merging funds, reviewing and updating investment policies and benchmarks, modifying the composition of certain portfolio management teams and analyzing various data to help devise such improvements; |
| | • | | Capital Initiatives – continuing to invest capital to support new funds with initial capital as well as to facilitate modifications to the strategies or structure of existing funds; |
| | • | | Compliance Program Initiatives – continuing efforts to enhance the compliance program through, among other things, internally integrating various portfolio management teams and aligning compliance support accordingly, completing a |
59
Annual Investment Management Agreement Approval Process(continued)
(Unaudited)
| | comprehensive review of existing policies and procedures and revising such policies and procedures as appropriate, enhancingcompliance-related technologies and workflows, and optimizing compliance shared services across the organization and affiliates; |
| | • | | Risk Management and Valuation Services – continuing efforts to strengthen the risk management functions, including through, among other things, enhancing the interaction and reporting between the investment risk management team and various affiliates, increasing the efficiency of risk monitoring performed on the Nuveen funds through improved reporting, continuing to implement risk programs designed to provide a more disciplined and consistent approach to identifying and mitigating operational risks, continuing progress on implementing a liquidity program that complies with the new liquidity regulatory requirements and continuing to oversee the daily valuation process; |
| | • | | Additional Compliance Services – continuing investment of time and resources necessary to develop the compliance policies and procedures and other related tools necessary to meet the various new regulatory requirements affecting the Nuveen funds that have been adopted over recent years; |
| | • | | Government Relations – continuing efforts of various Nuveen teams and affiliates to advocate and communicate their positions with lawmakers and other regulatory bodies on issues that will impact the Nuveen funds; |
| | • | | Business Continuity, Disaster Recovery and Information Services – establishing an information security program to help identify and manage information security risks, periodically testing disaster recovery plans, maintaining and updating business continuity plans and providing reports to the Board, at least annually, addressing, among other things, management’s security risk assessment, cyber risk profile, incident tracking and other relevant information technology risk-related reports; |
| | • | | Expanded Dividend Management Services – continuing to expand the services necessary to manage the dividends among the varying types of Nuveen funds that have developed as the Nuveen complex has grown in size and scope; and |
| | • | | with respect specifically toclosed-end funds, such initiatives also included: |
| | • | | Leverage Management Services – continuing to actively manage leverage including developing new leverage instruments, refinancing existing leverage and negotiating reductions in associated leverage expenses; |
| | • | | Capital Management Services – ongoing capital management efforts through a share repurchase program as well as a shelf offering program that raises additional equity capital in seeking to enhance shareholder value; |
| | • | | Data and Market Analytics – continuing focus on analyzing data and market analytics to better understand the ownership cycles and secondary market experience ofclosed-end funds; and |
| | • | | Closed-end Fund Investor Relations Program – maintaining theclosed-end fund investor relations program which, among other things, raises awareness, provides educational materials and cultivates advocacy forclosed-end funds and the Nuveenclosed-end fund product line. |
In addition to the services provided by the Adviser, the Board also considered the risks borne by the Adviser and its affiliates in managing the Nuveen funds, including entrepreneurial, operational, reputational, regulatory and litigation risks.
The Board further considered the division of responsibilities between the Adviser and theSub-Advisers and recognized that theSub-Advisers and their investment personnel generally are responsible for the management of a portion of the Fund’s portfolio. The Board noted that the Adviser oversees theSub-Advisers and considered an analysis of eachSub-Adviser provided by the Adviser which included, among other things, theSub-Adviser’s assets under management and changes thereto, a summary of the investment team and changes thereto, the investment approach of the team and the performance of the Nuveen fundssub-advised by eachSub-Adviser over various periods. The Board further considered at the May Meeting or prior meetings evaluations of eachSub-Adviser’s compliance program and trade execution. The Board noted that the Adviser recommended the renewal of theSub-Advisory Agreements.
Based on its review, the Board determined, in the exercise of its reasonable business judgment, that it was satisfied with the nature, extent and quality of services provided to the Fund under each applicable Advisory Agreement.
60
| B. | | The Investment Performance of the Fund and Fund Advisers |
In evaluating the quality of the services provided by the Fund Advisers, the Board also received and considered the investment performance of the Nuveen funds they advise. In this regard, the Board reviewed Fund performance over the quarter,one-,three- andfive-year periods ending December 31, 2018 as well as performance data for the first quarter of 2019 ending March 29, 2019. Unless otherwise indicated, the performance data referenced below reflects the periods ended December 31, 2018. The Board considered the Adviser’s analysis of each fund’s performance, with particular focus on funds that were considered performance outliers and the factors contributing to their performance. The Board also noted that it received performance data of the Nuveen funds during its quarterly meetings throughout the year and took into account the discussions that occurred at these Board meetings regarding fund performance. In this regard, in its evaluation of Nuveen fund performance at meetings throughout the year, the Board considered performance information for the funds for different time periods, both absolute and relative to appropriate benchmarks and peers, with particular attention to information indicating underperformance of the respective funds and discussed with the Adviser the reasons for such underperformance.
The Board reviewed both absolute and relative fund performance during the annual review. With respect to the latter, the Board considered fund performance in comparison to the performance of peer funds (the“Performance Peer Group”) and recognized and/or customized benchmarks (i.e., generally benchmarks derived from multiple recognized benchmarks). The Independent Board Members also reviewed, among other things, the returns of each sleeve of the Fund relative to the benchmark of such sleeve for the quarter,one-,three- andfive-year periods ending December 31, 2018, as well as performance information reflecting the first quarter of 2019. In considering performance data, the Board is aware of certain inherent limitations with such data, including that differences between the objective(s), strategies and other characteristics of the Nuveen funds compared to the respective Performance Peer Group and/or benchmark(s) (such as differences in the use of leverage) will necessarily contribute to differences in performance results and limit the value of the comparative information. To assist the Board in its review of the comparability of the relative performance, the Adviser has ranked the relevancy of the peer group to the funds as low, medium or high. Depending on the facts and circumstances, however, the Board may be satisfied with a fund’s performance notwithstanding that its performance may be below its benchmark or peer group for certain periods. In addition, the performance data may vary significantly depending on the end date selected, and shareholders may evaluate fund performance based on their own holding period which may differ from the performance periods reviewed by the Board leading to different results. Further, the Board considered a fund’s performance in light of the overall financial market conditions during the respective periods. As noted above, the Board reviewed, among other things, Nuveen fund performance over various periods ended December 31, 2018, and the Board was aware of the market decline in the fourth quarter of 2018 and considered performance from the first quarter of 2019 as well. The Board also noted that a shorter period of underperformance may significantly impact longer term performance.
In addition to the foregoing, the Board recognized the importance of secondary market trading to shareholders and considered the evaluation of premiums and discounts at which the shares of the Nuveenclosed-end funds trade to be a continuing priority for the Board. The Board and/or itsClosed-end Fund committee consider premium and discount data at each quarterly meeting throughout the year as well as during the annual review.
In their review of performance, the Independent Board Members focused, in particular, on the Adviser’s analysis of Nuveen funds determined to be underperforming performance outliers. The Board recognized that some periods of underperformance may only be temporary while other periods of underperformance may indicate a broader issue that may require a corrective action. Accordingly, with respect to any Nuveen funds for which the Board had identified performance issues, the Board monitors such funds closely until performance improves, discusses with the Adviser the reasons for such results, considers whether any steps are necessary or appropriate to address such issues, and reviews the results of any efforts undertaken.
The Board noted that the Fund’s performance was below its blended benchmark for theone-, three- and five-year periods and the Fund ranked in the fourth quartile of its Performance Peer Group in theone- and five-year periods and third quartile in the three-year period. In considering performance, the Board, however, recognized that the Fund’s Performance Peer Group was ranked low for relevancy. The Board considered the Adviser’s explanation of the various factors that detracted from the Fund’s performance and was satisfied with the Adviser’s explanation but noted that it would continue to monitor the performance of the Fund.
61
Annual Investment Management Agreement Approval Process(continued)
(Unaudited)
| C. | | Fees, Expenses and Profitability |
In its annual review, the Board considered the fees paid to the Fund Advisers and the total operating expense ratio of each Nuveen fund. More specifically, the Independent Board Members reviewed, among other things, each fund’s gross and net management fee rates and net total expense ratio in relation to those of a comparable universe of funds (the“Peer Universe”) established by Broadridge. The Independent Board Members reviewed the methodology Broadridge employed to establish its Peer Universe and recognized that differences between the applicable fund and its respective Peer Universe as well as changes to the composition of the Peer Universe from year to year may limit some of the value of the comparative data. The Independent Board Members also considered a fund’s operating expense ratio as it more directly reflected the shareholder’s costs in investing in the respective fund.
In their review, the Independent Board Members considered, in particular, each fund with a net expense ratio (excluding investment-related costs of leverage) of six basis points or higher compared to that of its peer average (each, an“Expense Outlier Fund”), and an analysis as to the factors contributing to each such fund’s higher relative net expense ratio. In addition, although the Board reviewed a fund’s total net expenses both including and excludinginvestment-related expenses (i.e., leverage costs) and taxes for certain of theclosed-end funds, the Board recognized that leverage expenses will vary across the Nuveen funds and in comparison to peers because of differences in the forms and terms of leverage employed by the respective fund. Accordingly, in reviewing the comparative data between a fund and its peers, the Board generally considered the fund’s net expense ratio and fees (excluding leverage costs and leveraged assets) to be higher if they were over 10 basis points higher, slightly higher if they were 6 to 10 basis points higher, in line if they were within approximately 5 basis points higher than the peer average and below if they were below the peer average of the Peer Universe. The Independent Board Members also considered, in relevant part, a fund’s net management fee and net total expense ratio in light of its performance history.
In their review of the fee arrangements for the Nuveen funds, the Independent Board Members considered the management fee schedules, including thecomplex-wide andfund-level breakpoint schedules, as applicable. The Board noted that across the Nuveen fund complex, the complex-wide fee breakpoints reduced fees by $51.5 million and fund-level breakpoints reduced fees by $55.1 million in 2018.
With respect to theSub-Advisers, the Board considered thesub-advisory fee paid to eachSub-Adviser, including any breakpoint schedule, and as described below, comparative data of the fees theSub-Adviser charges to other clients, if any.
The Independent Board Members noted that the Fund had a net management fee and net expense ratio in line with its respective peer average. Based on its review of the information provided, the Board determined that the Fund’s management fees (as applicable) to a Fund Adviser were reasonable in light of the nature, extent and quality of services provided to the Fund.
| | 2. | | Comparisons with the Fees of Other Clients |
In determining the appropriateness of fees, the Board also reviewed information regarding the fee rates the respective Fund Advisers charged to certain other types of clients and the type of services provided to these other clients. With respect to the Adviser and/or the affiliatedSub-Advisers, such other clients may include: retail and institutional managed accounts (with respect to NWQ and Symphony); hedge funds (with respect to Symphony);sub-advised funds outside the Nuveen family (with respect to NWQ and Symphony); foreign investment companies offered by Nuveen (with respect to NWQ); and collective investment trusts (with respect to NWQ). The Board further noted that the Adviser also advised certain exchange-traded funds (“ETFs”) sponsored by Nuveen.
The Board recognized that NWQ and Symphony were affiliatedsub-advisers and reviewed, among other things, the range of fees assessed for managed accounts, hedge funds (along with their performance fee), and foreign investment companies offered by Nuveen, as applicable. The Board also reviewed the fee range and average fee rate of certain selected investment strategies offered in retail and institutional managed accounts by NWQ and Symphony, the hedge funds advised by Symphony (along with their performance fee) and of thenon-Nuveen investment companiessub-advised by affiliatedsub-advisers.
62
In addition to the comparative fee data, the Board also reviewed, among other things, a description of the different levels of services provided to certain other clients compared to the services provided to the Nuveen funds as well as the differences in portfolio investment policies, investor profiles, account sizes and regulatory requirements, all of which contribute to the variations in the fee schedules. The Board noted, among other things, the wide range of services in addition to investment management services provided to the Nuveen funds when the Adviser is principally responsible for all aspects of operating the funds, including the increased regulatory requirements that must be met in managing the funds, the larger account sizes of managed accounts and hedge funds and the increased entrepreneurial, legal and regulatory risks that the Adviser incurs in sponsoring and managing the funds. Further, with respect to ETFs, the Board considered that Nuveen ETFs are passively managed compared to the active management of other Nuveen funds which contributed to the differences in fee levels between the Nuveen ETFs and other Nuveen funds. In general, higher fee levels reflect higher levels of service provided by the Adviser, increased investment management complexity, greater product management requirements, and higher levels of business risk or some combination of these factors. The Board further considered that eachSub-Adviser’s fee is essentially for portfolio management services and therefore, with respect to NWQ and Symphony, more comparable to the fees it receives for retail wrap accounts and other externalsub-advisory mandates. The Board concluded the varying levels of fees were justified given, among other things, the inherent differences in the products and the level of services provided to the Nuveen funds versus other clients, the differing regulatory requirements and legal liabilities and the entrepreneurial, legal and regulatory risks incurred in sponsoring and advising a registered investment company.
The Board recognized that Security Capital and Wellington were unaffiliatedsub-advisers. With respect to Security Capital, the Independent Board Members reviewed the average fee rates that suchSub-Adviser charges for other clients and noted that itssub-advisory fees with respect to the Fund were reasonable in relation to the fees it assessed other clients. With respect to Wellington, the Independent Board Members considered suchSub-Adviser’s financial information for its advisory activities with respect to the applicable Nuveen funds. The Independent Board Members noted that theSub-Advisory Agreements with Security Capital and Wellington, including the fees thereunder, were the result of arm’s length negotiations.
| | 3. | | Profitability of Fund Advisers |
In conjunction with their review of fees, the Independent Board Members considered information regarding Nuveen’s level of profitability for its advisory services to the Nuveen funds for the calendar years 2018 and 2017. The Board reviewed, among other things, Nuveen’s net margins(pre-tax) (both including and excluding distribution expenses); gross and net revenue margins(pre- andpost-tax); revenues, expenses, and net income(pre-tax andafter-tax and before distribution) of Nuveen for fund advisory services; and comparative profitability data comparing the adjusted margins of Nuveen compared to the adjusted margins of certain peers with publicly available data and with the most comparable assets under management (based on asset size and asset composition) for each of the last two calendar years. The Board also reviewed the revenues and expenses the Adviser derived from its ETF product line that was launched in 2016. The Independent Board Members noted that Nuveen’s net margins were higher in 2018 than the previous year and considered the key drivers behind the revenue and expense changes that impacted Nuveen’s net margins between the years. The Board considered the costs of investments in the Nuveen business, including the investment of seed capital in certain Nuveen funds and additional investments in infrastructure and technology. The Independent Board Members also noted that Nuveen’s adjusted margins from its relationships with the Nuveen funds were on the low range compared to the adjusted margins of the peers; however, the Independent Board Members recognized the inherent limitations of the comparative data of other publicly traded peers given that the calculation of profitability is rather subjective and numerous factors (such as types of funds, business mix, cost of capital, methodology to allocate expenses and other factors) can have a significant impact on the results.
The Independent Board Members also reviewed a description of the expense allocation methodology employed to develop the financial information and a summary of the history of changes to the methodology over theten-year period from 2008 to 2018, and recognized that other reasonable allocation methodologies could be employed and lead to significantly different results. The Board noted that two Independent Board Members, along with independent counsel, serve as the Board’s liaisons to review profitability and discuss any proposed changes to the methodology prior to the full Board’s review.
Aside from Nuveen’s profitability, the Board recognized that the Adviser is a subsidiary of Nuveen, LLC, the investment management arm of Teachers Insurance and Annuity Association of America (“TIAA”). As such, the Board also reviewed a
63
Annual Investment Management Agreement Approval Process(continued)
(Unaudited)
balance sheet for TIAA reflecting its assets, liabilities and capital and contingency reserves for the 2018 and 2017 calendar years to consider the financial strength of TIAA having recognized the importance of having an adviser with significant resources.
In addition to Nuveen, the Independent Board Members also considered the profitability of theSub-Advisers from their relationships with the Nuveen funds. With respect to NWQ and Symphony, the Independent Board Members reviewed theSub-Advisers’ revenues, expenses and revenue margins(pre- andpost-tax) for their advisory activities for the calendar year ended December 31, 2018. With respect to Security Capital, the Independent Board Members considered a profitability and margin analysis for theSub-Adviser, including revenues, expenses and operating margins for its advisory services to the applicable Nuveen funds for the calendar years 2018 and 2017. With respect to Wellington, the Board reviewed certain unaudited financial data of theSub-Adviser, including the revenues, expenses and net income(pre-tax andpost-tax) for the years ended December 31, 2018, 2017 and 2016.
In evaluating the reasonableness of the compensation, the Independent Board Members also considered any other ancillary benefits derived by the respective Fund Adviser from its relationship with the Nuveen funds as discussed in further detail below.
Based on a consideration of all the information provided, the Board noted that Nuveen’s and eachSub-Adviser’s level of profitability was acceptable and not unreasonable in light of the services provided.
| D. | | Economies of Scale and Whether Fee Levels Reflect These Economies of Scale |
With respect to economies of scale, the Independent Board Members noted that although economies of scale are difficult to measure, the Adviser shares the benefits of economies of scale in various ways including breakpoints in the management fee schedule (subject to limited exceptions), fee waivers and/or expense limitations, the pricing of Nuveen funds at scale at inception and investments in its business which can enhance the services provided to the funds for the fees paid. With respect to breakpoint schedules, because the Board had previously recognized that economies of scale may occur not only when the assets of a particular Nuveen fund grow but also when the assets in the complex grow, the Nuveen funds generally pay the Adviser a management fee comprised of afund-level component and acomplex-level component each with its own breakpoint schedule, subject to certain exceptions. In general terms, the breakpoint schedule at the fund level reduces fees as assets in the particular fund pass certain thresholds and the breakpoint schedule at the complex level reduces fees on the Nuveen funds as the eligible assets in the complex pass certain thresholds. The Independent Board Members reviewed, among other things, the fund-level and complex-level fee schedules. With respect to the Nuveenclosed-end funds, the Independent Board Members noted that, although such funds may fromtime-to-time make additional share offerings, the growth of their assets would occur primarily through the appreciation of such funds’ investment portfolios.
In addition, the Independent Board Members recognized the Adviser’s continued reinvestment in its business through, among other things, investments in its business infrastructure and information technology, portfolio accounting system as well as other systems and platforms that will, among other things, support growth, simplify and enhance information sharing, and enhance the investment process to the benefit of all of the Nuveen funds.
Based on its review, the Board concluded that the current fee arrangements together with the Adviser’s reinvestment in its business appropriately shared any economies of scale with shareholders.
The Independent Board Members received and considered information regarding other benefits the respective Fund Adviser or its affiliates may receive as a result of their relationship with the Nuveen funds. The Board considered that an affiliate of the Adviser serves asco-manager in the initial public offerings of newclosed-end funds for which it may receive revenue and serves as an underwriter on shelf offerings of existingclosed-end funds for which it receives compensation. In addition, the Independent Board Members also noted that NWQ, Symphony and Security Capital engage in soft dollar transactions pursuant to which they may receive the benefit of research products and other services provided by broker-dealers executing portfolio transactions on behalf of the applicable Nuveen funds. The Board, however, noted that the benefits for suchSub-Advisers when transacting in fixed-income securities may be more limited as such securities generally trade on a
64
principal basis and therefore do not generate brokerage commissions. Further, the Board noted that although NWQ, Symphony and Security Capital may benefit from the receipt of research and other services that they may otherwise have to pay for out of their own resources, the research may also benefit the Nuveen funds to the extent it enhances the ability of suchSub-Advisers to manage such funds or is acquired through the commissions paid on portfolio transactions of other clients. The Board noted that Wellington does not participate in soft dollar arrangements with respect to Fund portfolio transactions.
Based on their review, the Board concluded that any indirect benefits received by a Fund Adviser as a result of its relationship with the Fund were reasonable and within acceptable parameters.
The Board Members did not identify any single factor discussed previously asall-important or controlling. The Board Members, including the Independent Board Members, concluded that the terms of each Advisory Agreement were fair and reasonable, that the respective Fund Adviser’s fees were reasonable in light of the services provided to the Fund and that the Advisory Agreements be renewed.
65
Notes
66
Notes
67
Nuveen:
Serving Investors for Generations
Since 1898, financial advisors and their clients have relied on Nuveen to provide
dependable investment solutions through continued adherence to proven, long-term investing
principles. Today, we offer a range of high quality solutions designed to
be integral components of awell-diversified core portfolio.
Focused on meeting investor needs.
Nuveen is the investment manager of TIAA. We have grown into one of the world’s premier global asset managers, with specialist knowledge across all major asset classes and particular strength in solutions that provide income for investors and that draw on our expertise in alternatives and responsible investing. Nuveen is driven not only by the independent investment processes across the firm, but also the insights, risk management, analytics and other tools and resources that a truly world-class platform provides. As a global asset manager, our mission is to work in partnership with our clients to create solutions which help them secure their financial future.
Find out how we can help you.
To learn more about how the products and services of Nuveen may be able to help you meet your financial goals, talk to your financial advisor, or call us at(800) 257-8787. Please read the information provided carefully before you invest. Investors should consider the investment objective and policies, risk considerations, charges and expenses of any investment carefully. Where applicable, be sure to obtain a prospectus, which contains this and other relevant information. To obtain a prospectus, please contact your securities representative or Nuveen, 333 W. Wacker Dr., Chicago, IL 60606. Please read the prospectus carefully before you invest or send money.
Learn more about Nuveen Funds at:www.nuveen.com/
closed-end-funds
| | | | |
Nuveen Investments, LLC |
333 West Wacker Drive | Chicago, IL 60606 | www.nuveen.com | | | | ESA-B-0619D 915389-INV-B-08/20 |
Item 2. Code of Ethics.
Not applicable to this filing.
Item 3. Audit Committee Financial Expert.
Not applicable to this filing.
Item 4. Principal Accountant Fees and Services.
Not applicable to this filing.
Item 5. Audit Committee of Listed Registrants.
Not applicable to this filing.
Item 6. Schedule of Investments.
(a) See Portfolio of Investments in Item 1.
(b) Not applicable.
Item 7. Disclosure of Proxy Voting Policies and Procedures for Closed-End Management Investment Companies.
Not applicable to this filing.
Item 8. Portfolio Managers of Closed-End Management Investment Companies.
Not applicable to this filing.
Item 9. Purchases of Equity Securities by Closed-End Management Investment Company and Affiliated Purchasers.
Not applicable.
Item 10. Submission of Matters to a Vote of Security Holders.
There have been no material changes to the procedures by which shareholders may recommend nominees to the registrant’s Board implemented after the registrant last provided disclosure in response to this item.
Item 11. Controls and Procedures.
| (a) | The registrant’s principal executive and principal financial officers, or persons performing similar functions, have concluded that the registrant’s disclosure controls and procedures (as defined in Rule 30a-3(c) under the Investment Company Act of 1940, as amended (the “1940 Act”) (17 CFR 270.30a-3(c))) are effective, as of a date within 90 days of the filing date of this report that includes the disclosure required by this paragraph, based on their evaluation of the controls and procedures required by Rule 30a-3(b) under the 1940 Act (17 CFR 270.30a-3(b)) and Rules 13a-15(b) or 15d-15(b) under the Securities Exchange Act of 1934, as amended (the “Exchange Act”) (17 CFR 240.13a-15(b) or 240.15d-15(b)). |
| (b) | There were no changes in the registrant’s internal control over financial reporting (as defined in Rule 30a-3(d) under the 1940 Act (17 CFR 270.30a-3(d)) that occurred during the period covered by this report that has materially affected, or is reasonably likely to materially affect, the registrant’s internal control over financial reporting. |
Item 12. Disclosure of Securities Lending Activities for Closed-End Management Investment Companies.
Not applicable.
Item 13. Exhibits.
File the exhibits listed below as part of this Form.
(a)(1) Any code of ethics, or amendment thereto, that is the subject of the disclosure required by Item 2, to the extent that the registrant intends to satisfy the Item 2 requirements through filing of an exhibit: Not applicable to this filing.
(a)(2) A separate certification for each principal executive officer and principal financial officer of the registrant as required by Rule 30a-2(a) under the 1940 Act (17 CFR 270.30a-2(a)) in the exact form set forth below: See EX-99.CERT attached hereto.
(a)(3) Any written solicitation to purchase securities under Rule 23c-1 under the 1940 Act (17 CFR 270.23c-1) sent or given during the period covered by the report by or on behalf of the registrant to 10 or more persons: Not applicable.
(a)(4) Change in the registrant’s independent public accountant. Not applicable.
(b) If the report is filed under Section 13(a) or 15(d) of the Exchange Act, provide the certifications required by Rule 30a-2 (b) under the 1940 Act (17 CFR 270.30a-2(b)), Rule 13a-14(b) or Rule 15d-14(b) under the Exchange Act (17 CFR 240.13a-14(b) or 240.15d-14(b)), and Section 1350 of Chapter 63 of Title 18 of the United States Code (18 U.S.C. 1350) as an Exhibit. A certification furnished pursuant to this paragraph will not be deemed “filed” for purposes of Section 18 of the Exchange Act (15 U.S.C. 78r), or otherwise subject to the liability of that section. Such certification will not be deemed to be incorporated by reference into any filing under the Securities Act of 1933 or the Exchange Act, except to the extent that the registration specifically incorporates it by reference: See EX-99.906 CERT attached hereto.
SIGNATURES
Pursuant to the requirements of the Securities Exchange Act of 1934 and the Investment Company Act of 1940, the registrant has duly caused this report to be signed on its behalf by the undersigned, thereunto duly authorized.
(Registrant) Nuveen Diversified Dividend and Income Fund
| | | | |
| By (Signature and Title) | | /s/ Gifford R. Zimmerman | | |
| | Gifford R. Zimmerman | | |
| | Vice President and Secretary | | |
Date: September 5, 2019
Pursuant to the requirements of the Securities Exchange Act of 1934 and the Investment Company Act of 1940, this report has been signed below by the following persons on behalf of the registrant and in the capacities and on the dates indicated.
| | | | |
| By (Signature and Title) | | /s/ Cedric H. Antosiewicz | | |
| | Cedric H. Antosiewicz | | |
| | Chief Administrative Officer | | |
| | (principal executive officer) | | |
Date: September 5, 2019
| | | | |
| By (Signature and Title) | | /s/ E. Scott Wickerham | | |
| | E. Scott Wickerham | | |
| | Vice President and Controller | | |
| | (principal financial officer) | | |
Date: September 5, 2019