UNITED STATES
SECURITIES AND EXCHANGE COMMISSION
Washington, D.C. 20549
FORM N-CSR
CERTIFIED SHAREHOLDER REPORT OF REGISTERED
MANAGEMENT INVESTMENT COMPANIES
| | |
Investment Company Act file number | | 811-21407 |
Nuveen Diversified Dividend and Income Fund
(Exact name of registrant as specified in charter)
Nuveen Investments
333 West Wacker Drive
Chicago, IL 60606
(Address of principal executive offices) (Zip code)
Gifford R. Zimmerman
Nuveen Investments
333 West Wacker Drive
Chicago, IL 60606
(Name and address of agent for service)
Registrant’s telephone number, including area code: (312) 917-7700
Date of fiscal year end: December 31
Date of reporting period: December 31, 2019
Form N-CSR is to be used by management investment companies to file reports with the Commission not later than 10 days after the transmission to stockholders of any report that is required to be transmitted to stockholders under Rule 30e-1 under the Investment Company Act of 1940 (17 CFR 270.30e-1). The Commission may use the information provided on Form N-CSR in its regulatory, disclosure review, inspection, and policymaking roles.
A registrant is required to disclose the information specified by Form N-CSR, and the Commission will make this information public. A registrant is not required to respond to the collection of information contained in Form N-CSR unless the Form displays a currently valid Office of Management and Budget (“OMB”) control number. Please direct comments concerning the accuracy of the information collection burden estimate and any suggestions for reducing the burden to Secretary, Securities and Exchange Commission, 450 Fifth Street, NW, Washington, DC 20549-0609. The OMB has reviewed this collection of information under the clearance requirements of 44 U.S.C. ss. 3507.
ITEM 1. REPORTS TO STOCKHOLDERS.

Closed-End Funds
31 December 2019
Nuveen Closed-End Funds
| | |
| JDD | | Nuveen Diversified Dividend and Income Fund |
Beginning on January 1, 2021, as permitted by regulations adopted by the Securities and Exchange Commission, paper copies of the Fund’s annual and semi-annual shareholder reports will no longer be sent by mail, unless you specifically request paper copies of the reports. Instead, the reports will be made available on the Fund’s website (www.nuveen.com), and you will be notified by mail each time a report is posted and provided with a website link to access the report.
If you have already elected to receive shareholder reports electronically, you will not be affected by this change and you need not take any action. You may elect to receive shareholder reports and other communications from the Fund electronically anytime by contacting the financial intermediary (such as a broker-dealer or bank) through which you hold your Fund shares or, if you are a direct investor, by enrolling at www.nuveen.com/e-reports.
You may elect to receive all future shareholder reports in paper free of charge at any time by contacting your financial intermediary or, if you are a direct investor, (i) by calling 800-257-8787 and selecting option #2 or (ii) by logging into your Investor Center account at www.computershare.com/investor and clicking on “Communication Preferences.” Your election to receive reports in paper will apply to all funds held in your account with your financial intermediary or, if you are a direct investor, to all your directly held Nuveen Funds and any other directly held funds within the same group of related investment companies.
Annual Report
Life is Complex.
Nuveen makes things e-simple.
It only takes a minute to sign up for e-Reports. Once enrolled, you’ll receive an e-mail as soon as your Nuveen Fund information is ready—no more waiting for delivery by regular mail. Just click on the link within the e-mail to see the report and save it on your computer if you wish.
Free e-Reports right to your e-mail!
www.investordelivery.com
If you receive your Nuveen Fund dividends and statements from your financial advisor or brokerage account.
or
www.nuveen.com/client-access
If you receive your Nuveen Fund dividends and statements directly from Nuveen.
NOT FDIC INSURED MAY LOSE VALUE NO BANK GUARANTEE
Table of Contents
3
Chair’s Letter to Shareholders

Dear Shareholders,
Financial markets finished 2019 on a high note, despite the challenges of a weak start to the year, a slower global economy and heightened geopolitical risks. While global manufacturing languished, consumers remained resilient amid tight labor markets, growing wages and tame inflation. Global business sentiment, however, was less optimistic due to trade frictions and weaker global demand. Across advanced economies growth in corporate profits and earnings was subdued in 2019. Nevertheless, the Federal Reserve’s (Fed) pivot to easing monetary conditions, along with liquidity provided by other central banks around the world, provided confidence that the economic cycle could be extended. Additionally, the year ended with a reduction in trade tensions and Brexit uncertainty, although the next phase of U.S.-China trade negotiations are expected to be more challenging and the U.K. has a relatively short transition window in which to redefine its relationship with the European Union.
We continue to anticipate muted economic growth and increased market volatility this year. The U.S. economy held steady in the second half of 2019, although growth for the year overall moderated from 2018’s pace. Consumer confidence remains underpinned by low unemployment and modest wage growth. Looser financial conditions, in part driven by the Fed’s three interest rate cuts in 2019, have revived momentum in the housing market and should continue to encourage borrowing by consumers and businesses. Although consumer spending in Europe and Japan, like in the U.S., has remained supported by jobs growth and rising wages, economic growth there appears more fragile. The COVID-19 coronavirus outbreak poses a new downside risk to the global economy, as disruptions to both demand and production ripple through global supply chains. We are closely monitoring the situation.
At Nuveen, we still see investment opportunities in the maturing economic environment, but we are taking a selective approach. If you’re concerned about where the markets are headed from here, we encourage you to work with your financial advisor to review your time horizon, risk tolerance and investment goals. On behalf of the other members of the Nuveen Fund Board, we look forward to continuing to earn your trust in the months and years ahead.
Sincerely,

Terence J. Toth
Chair of the Board
February 21, 2020
4
Portfolio Managers’ Comments
Nuveen Diversified Dividend and Income Fund (JDD)
JDD invests approximately equal proportions of its managed assets across four complementary strategies, each managed by a separate, specializedsub-adviser.
NWQ Investment Management Company, LLC (NWQ), an affiliate of Nuveen Fund Advisors, LLC, the Fund’s investment adviser, is thesub-adviser for the global equity income strategy portion of the Fund consisting of a portfolio focused on income producing and dividend paying equity securities. James T. Stephenson, CFA, and Thomas J. Ray, CFA serve as the Fund’s portfolio management team.
The real estate securities strategy portion of the Fund consisting of a portfolio focused on dividend-paying common Real Estate Investment Trusts (REITs) is managed by a team at Security Capital Research & Management Incorporated, (Security Capital), a wholly-owned subsidiary of JPMorgan Chase & Co. Anthony R. Manno Jr., Kenneth D. Statz, Kevin W. Bedell and Nathan J. Gear, CFA lead the management team. On September 3, 2019, Nathan J. Gear, CFA, was added as a portfolio manager.
Symphony Asset Management, LLC (Symphony), an affiliate of Nuveen Fund Advisors, LLC, the Fund’s investment adviser, is thesub-adviser for the adjustable rate senior loan strategy portion of the Fund consisting of a portfolio focused on senior loans. The Symphony management team for the Fund is led by Scott Caraher and Jenny Rhee. On May 23, 2019, Jenny Rhee was added as a portfolio manager.
Wellington Management Company LLP (Wellington Management) is thesub-adviser for the emerging market debt strategy portion of the Fund consisting of a portfolio focused on emerging market sovereign debt. James W. Valone, CFA, and Kevin Murphy lead the management team. On July 1, 2019, Kevin Murphy was added as a portfolio manager.
Here representatives from NWQ, Security Capital, Symphony and Wellington Management review U.S. economy and financial markets, their management strategies and the performance of the Fund for the twelve-month reporting period ended December 31, 2019.
What factors affected the U.S. economy and domestic and global markets during the twelve-month reporting period ended December 31, 2019?
The U.S. economy reached the tenth year of expansion since the previous recession ended in June 2009, marking the longest expansion in U.S. history. In the fourth quarter of 2019, gross domestic product (GDP) grew at an annualized rate of 2.1%, according to the “advance” estimate by the Bureau of Economic Analysis. GDP measures the value of
This material is not intended to be a recommendation or investment advice, does not constitute a solicitation to buy, sell or hold a security or an investment strategy and is not provided in a fiduciary capacity. The information provided does not take into account the specific objectives or circumstances of any particular investor, or suggest any specific course of action. Investment decisions should be made based on an investor’s objectives and circumstances and in consultation with his or her advisors.
Certain statements in this report are forward-looking statements. Discussions of specific investments are for illustration only and are not intended as recommendations of individual investments. The forward-looking statements and other views expressed herein are those of the portfolio managers as of the date of this report. Actual future results or occurrences may differ significantly from those anticipated in any forward-looking statements and the views expressed herein are subject to change at any time, due to numerous market and other factors. The Fund disclaims any obligation to update publicly or revise any forward-looking statements or views expressed herein.
For financial reporting purposes, the ratings disclosed are the highest rating given by one of the following national rating agencies: Standard & Poor’s (S&P), Moody’s Investors Service, Inc. (Moody’s) or Fitch, Inc. (Fitch). This treatment of split-rated securities may differ from that used for other purposes, such as for Fund investment policies. Credit ratings are subject to change. AAA, AA, A and BBB are investment grade ratings; BB, B, CCC, CC, C and D are below investment grade ratings. Holdings designated N/R are not rated by these national rating agencies.
Refer to the Glossary of Terms Used in this Report for further definition of the terms used within this section.
5
Portfolio Managers’ Comments(continued)
goods and services produced by the nation’s economy less the value of the goods and services used up in production, adjusted for price changes. In the final months of the year, the economy was boosted by moderate consumer spending, along with positive contributions from government spending and trade, which offset weakness in business investment. For 2019 as a whole, U.S. GDP grew 2.3%, a decline from 2.9% in 2018 and the slowest pace since 2016.
Consumer spending, the largest driver of the economy, remained well supported by low unemployment, wage gains and tax cuts. As reported by the Bureau of Labor Statistics, the unemployment rate fell to 3.5% in December 2019 from 3.9% in December 2018 and job gains averaged around 176,000 per month for the past twelve months. As the jobs market has tightened, average hourly earnings grew at an annualized rate of 2.9% in December 2019. However, inflation remained subdued. The Bureau of Labor Statistics said the Consumer Price Index (CPI) increased 2.3% over the twelve-month reporting period ended December 31, 2019 before seasonal adjustment.
Low mortgage rates and low inventory drove home prices moderately higher in this reporting period, despite declining new home sales and housing starts. The S&P CoreLogic Case-Shiller U.S. National Home Price Index, which covers all nine U.S. census divisions, was up 3.5% year-over-year in November 2019 (most recent data available at the time this report was prepared). The10-City and20-City Composites reported year-over-year increases of 2.0% and 2.6%, respectively.
As data pointed to slower momentum in the overall economy, the Federal Reserve (Fed) notably shifted its stance. Although the Fed had indicated in December 2018 that there could be two more rate hikes in 2019, global growth concerns kept the central bank on the sidelines. As expected by the markets, the Fed left rates unchanged throughout the first half of 2019 while speculation increased that the Fed’s next move would be a rate cut. At the July 2019, September 2019 and October 2019 policy committee meetings, the Fed announced a 0.25% cut to its main policy rate. Markets registered disappointment with the Fed’s explanation that the rate cuts were a“mid-cycle adjustment,” rather than a prolonged easing period, and its signal that there would be no additional rate cuts in 2019. Also in the latter half of 2019, the Fed announced it would stop shrinking its bond portfolio sooner than scheduled, as well as began buying short-term Treasury bills to help money markets operate smoothly and maintain short-term borrowing rates at low levels. Fed Chairman Powell emphasized that the Treasury bill purchases were not a form of quantitative easing.
During the twelve-month reporting period, geopolitical news remained a prominent market driver. Tariff and trade policy topped the list of concerns, most prominently the U.S.-China relations. After several rounds of talks, escalating rhetoric from both sides and a series of tariff increases, tensions appeared to ease in the later months of 2019. The U.S. and China signaled their agreement on a partial trade deal, which included rolling back some tariffs, increasing China’s purchases of U.S. agriculture products and the consideration of intellectual property, technology and financial services rights. (Subsequent to the close of the reporting period, the “phase one” deal was signed on January 15, 2020.) While much of the focus remained on the U.S.-China relationship, trade spats between the U.S. and Mexico, the European Union, Brazil and Argentina also arose throughout the period. More than a year after the three countries signed onto the U.S., Mexico and Canada Agreement (USMCA) trade deal, which replaces the North American Free Trade Agreement, the U.S. House of Representatives approved the deal in December 2019 (and, subsequent to the close of the reporting period, the Senate voted in January 2020 to approve it). Global manufacturing and export data continued to show evidence of trade-related slumps, which increased worries that the slowdown would spread into other segments of the global economy.
The Brexit saga also appeared to make a breakthrough by the end of 2019. After former Prime Minister Theresa May was unable to secure a Brexit deal by the original March 29, 2019 deadline, she resigned as of June 7, 2019. When her successor, Boris Johnson, failed to meet the EU’s first deadline extension of October 31, 2019, the EU approved a “flextension” to January 31, 2020. A U.K. general election was scheduled for December 2019, wherein the Conservative Party won a large majority and bolstered Prime Minister Johnson’s mandate to get Brexit done. A few days later, the British Parliament passed the Brexit Bill. In Italy, investors worried about another potential budget clash between the
6
eurosceptic coalition government and the EU. However, following the unexpected resignation of the prime minister in August 2019, the newly formed coalition government appeared to take a less antagonistic stance. Europe also contended with the “yellow vest” protests in France, immigration policy concerns, Russian sanctions and political risk in Turkey.
Elsewhere, anti-government protests erupted across Latin America, Hong Kong and Lebanon during 2019, and Venezuela’s economic and political crisis deepened. In Argentina, markets were shocked by the defeat of incumbent President Macri, prompting concerns about the economic policies favored by the incoming Fernandez administration. Brazil’s Bolsonaro administration achieved a legislative win on pension reform and kept the economy on a path of modest growth. Europe’s traditional centrist parties lost seats in the May 2019 Parliamentary elections and populist parties saw marginal gains. The ruling parties in India and South Africa maintained their majorities, where slower economic growth could complicate their respective reform mandates.
Equity markets experienced solid gains capping off an impressive year. The Russell 1000® Value Index returned 26.54% for the reporting period. 2019 was the best performance year for the Russell 1000® Value since 2013. The performance can largely be attributed to the steepsell-off in December 2018 creating a lower base starting point for 2019 and the change to a more accommodative fed policy with the Fed reversing from raising rates to lowering rates three times. Information technology was the best performing sector of the Index during the reporting period. International markets also had a strong year as well. Energy was the worst performing sector. The MSCI EAFE Index gained 22.01% and MSCI Emerging Markets Index gained 18.42% for the reporting period.
U.S. REITS rebounded from 2018 lows when U.S. real estate investment trusts (REITs) common equities generated negative returns for reporting period. U.S. REITs were priced to generate highly attractive returns after a couple of lackluster years in an otherwise buoyant period for U.S. equities and private real estate. To be sure, low and falling long-term interest rates during 2019 provided strong support for valuations, particularly against the backdrop of a healthy economy. The Wilshire U.S. Real Estate Securities Index ended the reporting period up 25.79%.
During the reporting period, the U.S. senior loan market, as measured by the Credit Suisse Leveraged Loan Index (“the Index”), generated positive returns each quarter and a solid return of 8.17%. The performance reflected investors’ positive sentiment towards accommodative monetary policy, solid corporate fundamentals with low default rates, as well as good U.S. economic growth.
This strength occurred despite ongoing geopolitical uncertainties. The U.S.-China trade war took many turns during the course of 2019, particularly in May, August and October 2019, creating periodic volatility in the capital markets as investors’ anxiety over a resolution heightened. Market reaction was most notable in energy prices, with the West Texas Intermediate (WTI) crude price tumbling 14.6% in May 2019 due to perceived disruption in long-term global demand. Further exacerbating market volatility was the increased likelihood of a “Hard-Brexit” after Theresa May’s resignation as U.K.’s prime minister in June 2019.
Amid global uncertainties, the Fed cut interest rates three times during the course of the reporting period. While such moves created outflows in loan mutual funds and exchange-traded funds (ETFs), it provided support to capital markets and boosted risk asset returns. Additionally, loan issuance declined as most issuers took advantage of investors’ demand for high yield bonds. In terms of defaults, the default rate including distressed exchanges increased 44bps to 2.18%, well below the historical average of 3.07%. Excluding commodities, the 2019 default rate was 1.52%.
Performance across emerging markets (EM) fixed income sectors was positive during 2019. Emerging markets external debt, as measured by the JPMorgan EMBI Global Diversified Index, returned 15.04% during the reporting period. Local markets debt also had positive performance during the reporting period, with the JPMorganGBI-EM Global Diversified Index posting a return of 13.47%. A decrease in EM rates drove positive performance while appreciation of emerging markets currencies versus the U.S. dollar also had a positive impact. In addition, emerging markets corporate debt posted positive results, with the JPMorgan CEMBI Broad Diversified Index generating a return of 13.09%.
7
Portfolio Managers’ Comments(continued)
What key strategies were used to manage the Fund during this twelve-month reporting period ended December 31, 2019?
The Fund’s investment objectives are high current income and total return, while utilizing equity and debt strategies focused on providing current income, total return potential and reducing U.S. interest rate sensitivity. In its efforts to achieve these objectives, the Fund is managed by specialists in severalnon-traditional asset classes and invests primarily in 1) U.S. and foreign dividend paying common stocks, 2) dividend paying common stocks issued by real estate companies, 3) emerging markets sovereign debt, and 4) senior secured loans. The Fund expects to invest at least 40%, but no more than 70%, of its assets in equity security holdings and at least 30%, but no more than 60%, of its assets in debt security holdings. Under normal circumstances, the Fund’s target weighting is approximately 50% equity and 50% debt.
For the dividend paying equity portion of the Fund’s portfolio, NWQ continued to focus on obtaining an attractive total return with a dividend yield above the MSCI World Index. NWQ employs a value based approach from their bottom up analysis. They look for attractive absolute valuation, positive risk/reward with downside protection characteristics and catalysts that can drive a positive revaluation of companies. They believe improved capital allocation policies and the return of capital to shareholders can be a positive catalyst in two significant ways. Higher dividends add to the total return of a company and the discipline shown in rewarding shareholders can lead to a higher valuation.
In managing the real estate portion of the Fund’s portfolio, Security Capital seeks to maintain property type and geographic diversification in selecting common equity securities, while taking into account important company-specific influences, including, cash flow generating potential, property location quality, balance sheet flexibility and the management team to name only a few. Investment decisions are based on a multi-layered analysis of the company, the real estate it owns, its management and the relative price of the security, with a focus on securities that Security Capital believes will be best positioned to generate sustainable net income and potential price appreciation over thelong-run. Throughout 2019, the portfolio continued its focus on delivering a high conviction, diversified portfolio of securities.
In the senior loan and other debt portion of the Fund’s portfolio, Symphony continued to manage and monitor senior loan market risks. The overall macroeconomic backdrop during the reporting period remained supportive of the leveraged loan (loan) asset class. The Fund’s capital remained invested in issuers with strong credit profiles among noninvestment grade debt while offering attractive current income and yield. Fundamentally, Symphony feels that many of these companies have stable businesses, good asset coverage for senior debt holders and could perform well in a stable to slow growth environment.
The emerging market debt portion of the Fund, which is managed by Wellington Management, invests in a diversified portfolio of emerging markets fixed income instruments through the combination of comprehensivetop-down quantitative and macroeconomic analysis and detailedbottom-up sovereign credit research.
How did the Fund perform during this twelve-month reporting period ended December 31, 2019?
The table in the Performance Overview and Holding Summaries section of this report provides total returns for theone-year, five-year andten-year periods ended December 31, 2019. The Fund’s total returns on net asset value (NAV) are compared with the performance of a corresponding market index. For the twelve-month reporting period ended December 31, 2019, JDD underperformed the S&P 500® Index, but outperformed its comparative Blended Index.
NWQ
The equity portion of the Fund’s portfolio, managed by NWQ contributed to the Fund’s performance on an absolute basis but underperformed the broader equity market, as measured by the MSCI World Index. The health care, information technology and utilities sectors were the largest contributors. This was partially offset by security selection in the financials and consumer staples sectors. Geographically, performance benefitted from an allocation to Japan and
8
emerging markets. Investments in the United States, Europe, the Middle East and the Pacific excluding Japan lagged and were a headwind for the Fund’s relative return for the reporting period.
Individual holdings that positively contributed to performance included financial sector holding, Citigroup Inc. Citigroup outperformed alongside most large cap banks as the company benefited from an improved earnings outlook owed to higher interest rates and improving credit quality as fears of recession abated. The company continues to generate operating leverage and benefit from scale, allowing the company to continue compounding book value faster than peers. Also contributing to performance was Deutsche Post AG, which performed well as 2019 third quarter results showed improved operating performance across all divisions. The company appears well positioned to beat the 2020 guidance they had laid out in their turnaround plan. This looked aspirational when they first put it out. An improving economic backdrop and secular growth ine-commerce should continue to drive Deutsche Post’s results going forward. Lastly, Nintendo Co. Ltd. positively contributed to performance as optimism over switch hardware sales rose. Nintendo announced a partnership with Tencent to begin distributing the Nintendo Switch in China at a future date and the company forecasted hardware unit sales of 18 million in Fiscal 2020, an increase of 1 million units year-over-year.
Several individual holdings detracted from portfolio performance, particularly from our financial sector holdings. AIB Group PLC has had difficulty reducing costs prior to Brexit thereby increasing its overall earnings risk. Company valuation, capital return element and a strong balance sheet are elements to holding the stock. NWQ reduced its exposure in the company given the earnings downgrades and continues to monitor the company. Challenger Limited/Australia also detracted from performance coming off a weak fourth quarter 2018 in which the company lowered earnings expectations due to lower volume growth, lower yield on its investment portfolio and regulators uncertainty regarding annuities. The Fund no longer holds Challenger Limited/Australia. Lastly, energy sector holding Equitrans Midstream Corp. was another top detractor. The company’s stock lagged on increased concerns around leverage, payout sustainability and ability to navigate a challenging 2020 if the Mountain Valley Pipeline project remained in regulatory limbo. The Fund continues to hold Equitrans Midstream Corp.
Security Capital
The real estate portion of the Fund managed by Security Capital contributed to the Fund’s performance. For common equity investors in 2019, there were distinctive performance differences by property type with the underlying themes and influences reflecting company-specific factors, relative pricing and, importantly, shifting investor expectations colored by macro-economic trends.
In this context, the Fund’s leading performance contributors relative to index by major property type in 2019 were the office, industrial and strip center companies. Outperformance from the office companies was primarily centered on west coast focused companies. Lease and development economics continue to benefit from strong demand in primary west coast office markets and owners there are not burdened with older buildings facing competition from new construction and creative redevelopment versus east coast/New York City offices in this segment. For the industrial segment, outperformance was driven by both the data center companies as well as the traditional warehouse companies. Demand for data center assets and the associated operational expertise appears nearly inexhaustible. Traditional warehouse companies continue to see robust user demand, the result of a healthy economy and the logistics demands of serving the booming online economy. While warehouse supply pipelines are active and a continued focus of wary investors, industrial markets have remained generally balanced particularly with the shift to more infill locations closer to urban centers. Strip centers rebounded sharply as bankruptcy pace for retailers was unexpectedly slow. The top three securities in the portfolio that had the biggest positive impact on portfolio performance were underweighted positions in regional mall company Simon Property Group, Inc. and health care company Ventas, Inc., as well as an overweight position in Prologis, Inc. The Fund no longer holds Ventas, Inc.
During the reporting period, the Fund’s benchmark relative performance was constrained by common equity investments in the hotel and self-storage sectors. For the self-storage companies, healthy user demand, low capital
9
Portfolio Managers’ Comments(continued)
expenditure requirements and limited obsolescence risk have been key positives. But the weight of new supply continues to erode net operating income growth rates and investors see evidence of adverse trends continuing in 2020. Hotel companies have been volatilequarter-to-quarter with equity prices often moving with shifting sentiment on the broader U.S. and global economies. Investors appear increasingly focused on a number of corrosive factors for cash flow, notably elevated levels of new hotel construction, wage and property tax pressures weighing on operating margins and the inability to acquire assets at accretive economics. The bottom three performing companies in the portfolio relative to index for the reporting period were regional mall companies Taubman Centers Inc. and Macerich Co, as well as Diversified Healthcare Trust. The Fund no long holds Taubman Centers Inc., Macerich Co, or Diversified Healthcare Trust.
Symphony
The senior loan portfolio managed by Symphony was positive on a total return basis during the reporting period, outperforming the broader loan market as measured by the Credit Suisse Leveraged Loan Index.
The senior loan portfolio of the Fund is invested predominantly in first-lien, senior secured corporate loans. Symphony generally focuses on issuers that have strong asset coverage, defensible businesses, and larger loan facilities. The loan portfolio was conservatively positioned throughout the reporting period. The investment team believed that while credit fundamentals remained sound, the binary outcome of major macro events (U.S.-China trade, Brexit, etc.) increased the potential for downside volatility in the loan market. Being more conservatively positioned, the strategy generally attributed positively during the first three quarters of the reporting period, as investors’ concerns around macro risks and global growth were elevated. However, the positioning was less advantageous in the fourth quarter 2019 when major macro risks subsided and risk assets generally rallied.
The Fund’s underlying loan portfolio generally benefited from its exposure to larger, more liquid and higher quality loans. These profiles, including American Airlines, Inc., US Foods Inc. and Albertson’s LLC, contributed positively to the loan portfolio’s performance. In addition, issuer selection within media/telecom and consumer services contributed positively to performance, including Univision Communications, Inc. within media/telecom and Burger King Corporation within consumer services. The Fund continues to hold these positions. Finally, an active underweight in energy added to benchmark relative performance during the reporting period.
During the reporting period, the Fund’s exposure to equities received from reorganizations detracted from performance. Also serving as a detractor to the loan portfolio’s performance was disappointing issue selection within the financials sector. In particular, exposure to the loan of a residential mortgage service company, Ditech Holding Corp. (formerly Walter Investment Management Corp.), went into a formal restructuring process seeking buyers for the company. Sales offers from potential bidders fell well below expectations. The company’s loan issue declined on the lowered outlook for asset sales proceeds. The Fund continues to hold Ditech Holdings Corp. as it is expected to distribute proceeds from the sale of its businesses over the near term and we anticipate value from these distributions to be at or above current trading levels.
Wellington Management
The emerging market debt portion of the Fund managed by Wellington contributed to performance.
In the emerging market debt portion, Wellington favored issuers in Eastern Europe and the Middle East over Asia and Latin America. In terms of external sovereign debt, Wellington preferred Central and Eastern European markets with improving fundamentals such as Romania, Azerbaijan, and Croatia. Additionally, Wellington favored Russia, as valuations are attractive due to significant buffers, budget/trade surpluses and a substantial savings fund, and expectations for growth supportive policies. In contrast, Wellington was underweight Latin American countries where valuations were tight, including Peru, Colombia and Chile. Wellington was also underweight tight valuations in Asian countries, specifically the Philippines, Indonesia, and Malaysia.
10
Wellington kept relatively low exposure to local markets and corporate debt throughout the period. Within local interest rates, Wellington favored an allocation to Brazil, given an attractive risk premium, and Russia, where inflation pressures have turned providing room for more accommodative monetary policies. Wellington primarily allocated to local exposure via emerging markets currencies. Wellington maintained emerging markets currency exposure across a basket of emerging markets such as the Brazilian real (optimism around growth), Egyptian pound(stable-to-improving fundamentals and attractive valuation), Indonesian rupiah (more robustbalance-of-payments), Russian ruble (sanction risks balanced with strong growth expectations and budget/trade surpluses), and Polish Zloty (strong balance of payments). Corporate exposure was less early in the reporting period but increased throughout the reporting period as emerging markets corporate fundamentals continued to improve as management teams have prudently emphasized debt reduction and moderated capex programs. The Fund eliminated its holdings in Taubman Centers Inc. and Macerich Co.
Country allocation drove relative outperformance, with security selection, local interest rates positioning and currency positioning also contributing. In contrast, developed markets duration positioning weighed on performance.
At the country level, overweight country allocations to Russia and Egypt throughout the reporting period, along with anout-of-index allocation to Greece, aided results. In addition, an underweight country allocation to Lebanon, also proved favorable. In Brazil, an allocation to local interest rates, external corporate debt and to external quasi-sovereign debt in the oil and gas industry, proved favorable. In contrast, overweight country allocations to Argentina and the United Arab Emirates, detracted from results. Underweight country allocations to Bahrain and underweight country allocation to Turkey during the second half of the reporting period, also weighed on results. In addition, an underweight exposure to external sovereign debt in Oman, detracted from results.
Additionally, the Fund continued to utilize forward foreign currency exchange contracts to reduce the currency risk of select local currency denominated emerging market bonds, as well as actively manage certain currency exposures in an attempt to benefit from potential appreciation. In aggregate, these contracts had a negligible impact on overall performance during the reporting period.
The Fund also utilized futures on U.S. and German interest rates as part of an overall portfolio construction strategy to reduce interest rate sensitivity and manage yield curve exposure. These positions had a negligible impact on performance during the reporting period.
11
Fund Leverage
IMPACT OF THE FUND’S LEVERAGE STRATEGY ON PERFORMANCE
One important factor impacting the returns of the Fund’s common shares relative to its comparative benchmarks was the Fund’s use of leverage through bank borrowings. The Fund uses leverage because our research has shown that, over time, leveraging provides opportunities for additional income. The opportunity arises when short-term rates that the Fund pays on its leveraging instruments are lower than the interest the Fund earns on its portfolio securities that it has bought with the proceeds of that leverage. This has been particularly true in the recent market environment where short-term rates have been low by historical standards.
However, use of leverage can expose Fund common shares to additional price volatility. When the Fund uses leverage, the Fund’s common shares will experience a greater increase in their net asset value if the securities acquired through the use of leverage increase in value, but will also experience a correspondingly larger decline in their net asset value if the securities acquired through leverage decline in value, which will make the shares’ net asset value more volatile, and total return performance more variable, over time.
In addition, common share income in levered funds will typically decrease in comparison to unlevered funds when short-term interest rates increase and increase when short-term interest rates decrease. In recent quarters, fund leverage expenses have generally tracked the overall movement of short-term tax-exempt interest rates. While fund leverage expenses are somewhat higher than their all-time lows after the 2007-2009 financial crisis, which has contributed to a reduction in common share net income and long-term total return potential, leverage nevertheless continues to provide the opportunity for incremental common share income. Management believes that the potential benefits from leverage continue to outweigh the associated increase in risk and volatility previously described.
The Fund’s use of leverage had a positive impact on total return performance during this reporting period.
The Fund also continued to utilize forward starting interest rate swap contracts to partially hedge its future interest cost of leverage, which as mentioned previously, is through the use of bank borrowings. The swap contracts impact on total return performance was negative during this reporting period.
As of December 31, 2019, the Fund’s percentages of leverage are as shown in the accompanying table.
| | | | |
| | | JDD | |
Effective Leverage* | | | 29.47 | % |
Regulatory Leverage* | | | 29.47 | % |
| * | Effective leverage is the Fund’s effective economic leverage, and includes both regulatory leverage and the leverage effects of certain derivative and other investments in the Fund’s portfolio that increase the Fund’s investment exposure. Regulatory leverage consists of preferred shares issued or borrowings of the Fund. Both of these are part of the Fund’s capital structure. The Fund, however, may from time to time, borrow on a typically transient basis in connection with its day-to-day operations, primarily in connection with the need to settle portfolio trades. Such incidental borrowings are excluded from the calculation of the Fund’s effective leverage ratio. Regulatory leverage is subject to asset coverage limits set forth in the Investment Company Act of 1940. |
THE FUND’S REGULATORY LEVERAGE
Bank Borrowings
As noted above, the Fund employs leverage through the use of bank borrowings. The Fund’s bank borrowing activities are as shown in the accompanying table.
| | | | | | | | | | | | | | | | | | | | | | | | | | | | | | | | | | |
| Current Reporting Period | | | | | | Subsequent to the Close
of the Reporting Period | |
| January 1, 2019 | | | Draws | | | Paydowns | | | December 31, 2019 | | | Average Balance
Outstanding | | | | | | Draws | | | Paydowns | | | February 27, 2020 | |
| | $97,900,000 | | | | $ — | | | | $ — | | | | $97,900,000 | | | | $97,900,000 | | | | | | | | $ — | | | | $ — | | | | $97,900,000 | |
Refer to Notes to Financial Statements, Note 9 – Borrowing Arrangements for further details.
Common Share Information
DISTRIBUTION INFORMATION
The following information regarding the Fund’s distributions is current as of December 31, 2019, the Fund’s fiscal and tax year end, and may differ from previously issued distribution notifications. The Fund’s distribution levels may vary over time based on the Fund’s investment activities and portfolio investment value changes.
The Fund has adopted a managed distribution program. The goal of the Fund’s managed distribution program is to provide shareholders relatively consistent and predictable cash flow by systematically converting its expected long-term return potential into regular distributions. As a result, regular distributions throughout the year will likely include a portion of expected long-term and/or short-term gains (both realized and unrealized), along with net investment income.
Important points to understand about Nuveen fund managed distributions are:
| • | | The Fund seeks to establish a relatively stable common share distribution rate that roughly corresponds to the projected total return from its investment strategy over an extended period of time. However, you should not draw any conclusions about the Fund’s past or future investment performance from its current distribution rate. |
| • | | Actual common share returns will differ from projected long-term returns (and therefore the Fund’s distribution rate), at least over shorter time periods. Over a specific timeframe, the difference between actual returns and total distributions will be reflected in an increasing (returns exceed distributions) or a decreasing (distributions exceed returns) Fund net asset value. |
| • | | Each period’s distributions are expected to be paid from some or all of the following sources: |
| | • | | net investment income consisting of regular interest and dividends, |
| | • | | net realized gains from portfolio investments, and |
| | • | | unrealized gains, or, in certain cases, a return of principal (non-taxable distributions). |
| • | | A non-taxable distribution is a payment of a portion of the Fund’s capital. When the Fund’s returns exceed distributions, it may represent portfolio gains generated, but not realized as a taxable capital gain. In periods when the Fund’s returns fall short of distributions, it will represent a portion of your original principal unless the shortfall is offset during other time periods over the life of your investment (previous or subsequent) when the Fund’s total return exceeds distributions. |
| • | | Because distribution source estimates are updated throughout the current fiscal year based on the Fund’s performance, these estimates may differ from both the tax information reported to you in the Fund’s 1099 statement, as well as the ultimate economic sources of distributions over the life of your investment. |
The following table provides information regarding the Fund’s distributions and total return performance over various time periods. This information is intended to help you better understand whether the Fund’s returns for the specified time periods were sufficient to meet its distributions.
Data as of December 31, 2019
| | | | | | | | | | | | | | | | | | | | | | | | | | | | | | | | | | | | |
| | | Per Share Regular
Distributions | | | | | | | | | | | | | | | | | | Annualized Total Return
on NAV | |
| Inception Date | | Latest
Quarter | | | Total
Current Year | | | Total
Current Year
Net Investment
Income | | | Total
Current Year
Net Realized
Gain/Loss | | | Current
Unrealized
Gain/Loss | | | Current
Distribution
Rate on NAV1,3 | | | Actual
Full-Year
Distribution
Rate on NAV2,3 | | | 1-Year | | | 5-Year | |
9/2003 | | | $0.2175 | | | | $0.8700 | | | | $0.3927 | | | | $0.3407 | | | | $1.7276 | | | | 7.33% | | | | 7.33% | | | | 23.91% | | | | 6.13% | |
| 1 | Current distribution per share, annualized, divided, by the NAV per share on the stated date. |
| 2 | Actual total per share distributions made during the full fiscal year, divided by the NAV per share on the stated date. |
| 3 | Each distribution represents a “managed distribution” rate. |
13
Common Share Information(continued)
The following table provides the Fund’s distribution sources as of December 31, 2019.
The amounts and sources of distributions reported in this notice are for financial reporting purposes and are not being provided for tax reporting purposes. The actual amounts and character of the distributions for tax reporting purposes will be reported to shareholders on Form 1099-DIV which will be sent to shareholders shortly after calendar year-end. More details about the Fund’s distributions and the basis for these estimates are available on www.nuveen.com/cef.
Data as of December 31, 2019
| | | | | | | | | | | | | | | | | | | | | | | | | | | | | | |
| Fiscal Year Source of Distribution | | | Fiscal Year Per Share Amounts | |
Net Investment Income | | | Realized Gains | | | Return of Capital1 | | | | | | Distributions | | | Net Investment Income | | | Realized Gains | | | Return of Capital1 | |
| | 44.88% | | | | 29.05% | | | | 26.07% | | | | | | | | $0.8700 | | | | $0.3905 | | | | $0.2527 | | | | $0.2268 | |
| 1 | Return of capital may represent unrealized gains, return of shareholder’s principal, or both. In certain circumstances, all or a portion of the return of capital may be characterized as ordinary income under federal tax law. The actual tax characterization will be provided to shareholders on Form 1099-DIV shortly after calendar year-end. |
Change in Method of Publishing Nuveen Closed-End Fund Distribution
During November 2019, the Nuveen Closed-End Funds discontinued the practice of announcing Fund distribution amounts and timing via press release. Instead, information about the Nuveen Closed-End Funds’ monthly and quarterly periodic distributions to shareholders are posted and can be found on Nuveen’s enhanced closed-end fund resource page, which is at www.nuveen.com/closed-end-fund-distributions, along with other Nuveen closed-end fund product updates. Shareholders can expect regular distribution information to be posted on www.nuveen.com on the first business day of each month. To ensure that our shareholders have timely access to the latest information, a subscribe function can be activated at this link here, or at this web page (www.nuveen.com/en-us/people/about-nuveen/for-the-media).
COMMON SHARE REPURCHASES
During August 2019, the Fund’s Board of Trustees reauthorized an open-market share repurchase program, allowing the Fund to repurchase an aggregate of up to approximately 10% of its outstanding shares.
As of December 31, 2019, and since the inception of the Fund’s repurchase program, the Fund has cumulatively repurchased and retired its outstanding common shares as shown in the accompanying table.
| | | | |
| | | JDD | |
Common shares cumulatively repurchased and retired | | | 475,000 | |
Common shares authorized for repurchase | | | 1,975,000 | |
During the current reporting period, the Fund did not repurchase any of its outstanding shares.
OTHER COMMON SHARE INFORMATION
As of December 31, 2019, and during the current reporting period, the Fund’s common share price was trading at a premium/(discount) to its common share NAV as shown in the accompanying table.
| | | | |
| | | JDD | |
Common share NAV | | | $11.87 | |
Common share price | | | $10.89 | |
Premium/(Discount) to NAV | | | (8.26 | )% |
12-month average premium/(discount) to NAV | | | (7.17 | )% |
14
Risk Considerations and Investment Policy Updates
Risk Considerations
Fund shares are not guaranteed or endorsed by any bank or other insured depository institution, and are not federally insured by the Federal Deposit Insurance Corporation.
Nuveen Diversified Dividend and Income Fund (JDD)
Investing in closed-end funds involves risk; principal loss is possible. There is no guarantee the Fund’s investment objectives will be achieved. Closed-end fund shares may frequently trade at a discount or premium to their net asset value.Common stock returns often have experienced significant volatility.Real estate investments may suffer due to economic downturns and changes in commercial real estate values, rents, property taxes, interest rates and tax laws.Adjustable Rate Senior Loans may not be fully secured by collateral, generally do not trade on exchanges, and are typically issued by unrated or below-investment grade companies, and therefore are subject to greater liquidity and credit risk.Foreign investments involve additional risks, including currency fluctuation, political and economic instability, lack of liquidity and differing legal and accounting standards. The risks of foreign investments are magnified in emerging markets.Leverage increases return volatility and magnifies the Fund’s potential return and its risks; there is no guarantee a fund’s leverage strategy will be successful. For these and other risks, includingtax risk, please see the Fund’s web page atwww.nuveen.com/JDD.
Investment Policy Updates
Change in Investment Policy
The Fund has recently adopted the following policy regarding limits on investments in illiquid securities:
While there are no such limits imposed by applicable regulations, certain Nuveen Closed-End Funds formerly had investment policies that placed limits on the Fund’s ability to invest in illiquid securities. All exchange-listed Nuveen Closed-End Funds now have no formal limit on their ability to invest in such illiquid securities, but the Fund’s portfolio management team will monitor such investments in the regular, overall management of the Fund’s portfolio securities.
15
| | |
| JDD | | Nuveen Diversified Dividend and Income Fund Performance Overview and Holding Summaries as of December 31, 2019 |
Refer to the Glossary of Terms Used in this Report for further definition of terms used in this section.
Average Annual Total Returns as of December 31, 2019
| | | | | | | | | | | | |
| | | Average Annual | |
| | | 1-Year | | | 5-Year | | | 10-Year | |
| JDD at Common Share NAV | | | 23.91% | | | | 6.13% | | | | 9.35% | |
| JDD at Common Share Price | | | 27.97% | | | | 8.11% | | | | 10.66% | |
| Blended Index (Comparative Benchmark) | | | 19.16% | | | | 6.97% | | | | 8.79% | |
| S&P 500® Index | | | 31.49% | | | | 11.70% | | | | 13.56% | |
Past performance is not predictive of future results. Current performance may be higher or lower than the data shown. Returns do not reflect the deduction of taxes that shareholders may have to pay on Fund distributions or upon the sale of Fund shares. Returns at NAV are net of Fund expenses, and assume reinvestment of distributions. Comparative index return information is provided for the Fund’s shares at NAV only. Indexes are not available for direct investment.
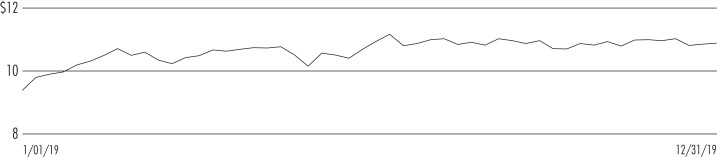
Common Share Price Performance —Weekly Closing Price
16
This data relates to the securities held in the Fund’s portfolio of investments as of the end of the reporting period. It should not be construed as a measure of performance for the Fund itself. Holdings are subject to change.
For financial reporting purposes, the ratings disclosed are the highest rating given by one of the following national rating agencies: Standard & Poor’s Group, Moody’s Investors Service, Inc. or Fitch, Inc. This treatment of split-rated securities may differ from that used for other purposes, such as for Fund investment policies. Credit ratings are subject to change. AAA, AA, A and BBB are investment grade ratings; BB, B, CCC, CC, C and D are below-investment grade ratings. Holdings designated N/R are not rated by these national rating agencies.
Fund Allocation
(% of net assets)
| | | | |
| REIT Common Stocks | | | 37.9% | |
| Common Stocks | | | 35.9% | |
| Emerging Market Debt and Foreign Corporate Bonds | | | 34.7% | |
Variable Rate Senior Loan Interests | | | 29.4% | |
| Convertible Preferred Securities | | | 0.8% | |
| Structured Notes | | | 0.5% | |
| Corporate Bonds | | | 0.1% | |
| Common Stock Rights | | | 0.0% | |
| Warrants | | | 0.0% | |
| Repurchase Agreements | | | 1.4% | |
| Investment Companies | | | 1.9% | |
| Other Assets Less Liabilities | | | (0.8)% | |
Net Assets Plus Borrowings | | | 141.8% | |
| Borrowings | | | (41.8)% | |
Net Assets | | | 100% | |
Portfolio Credit Quality
(% of total fixed-income investments)
| | | | |
| AAA | | | 0.2% | |
| AA | | | 3.3% | |
| A | | | 5.5% | |
| BBB | | | 24.3% | |
| BB or Lower | | | 64.7% | |
| N/R (not rated) | | | 2.0% | |
Total | | | 100% | |
Portfolio Composition
(% of total investments)
| | | | |
| REIT Common Stock | | | 26.6% | |
| Emerging Market Debt and Foreign Corporate Bonds | | | 24.4% | |
| Banks | | | 3.5% | |
| Pharmaceuticals | | | 3.4% | |
| Media | | | 3.0% | |
| Software | | | 2.8% | |
| Oil, Gas & Consumable Fuels | | | 2.6% | |
| Hotels, Restaurants & Leisure | | | 2.4% | |
| Insurance | | | 2.2% | |
| Diversified Telecommunication Services | | | 2.0% | |
| Capital Markets | | | 1.6% | |
| Airlines | | | 1.5% | |
| Health Care Providers & Services | | | 1.4% | |
| Multi-Utilities | | | 1.4% | |
| Investment Companies | | | 1.3% | |
| Repurchase Agreements | | | 1.0% | |
| Structured Notes | | | 0.3% | |
| Other | | | 18.6% | |
Total | | | 100% | |
REIT Common Stocks
Top Five Industries
(% of total investments)
| | | | |
| Specialized | | | 5.9% | |
| Office | | | 5.5% | |
| Residential | | | 5.4% | |
| Retail | | | 2.9% | |
| Industrial | | | 2.5% | |
Country Allocation1
(% of total investments)
| | | | |
| United States | | | 58.1% | |
| Germany | | | 3.5% | |
| Japan | | | 3.1% | |
| United Kingdom | | | 2.8% | |
| Russia | | | 2.1% | |
| France | | | 1.7% | |
| China | | | 1.4% | |
| South Korea | | | 1.0% | |
| Mexico | | | 1.0% | |
| United Arab Emirates | | | 0.9% | |
| Netherlands | | | 0.9% | |
| Canada | | | 0.8% | |
| Bermuda | | | 0.8% | |
| Spain | | | 0.8% | |
| Turkey | | | 0.7% | |
| Brazil | | | 0.7% | |
| Other | | | 19.7% | |
Total | | | 100% | |
| 1 | Includes 25.7% (as a percentage of total investments) in emerging market countries. |
| REIT | Real Estate Investment Trust |
17
Report of Independent Registered Public Accounting Firm
To the Shareholders and Board of Trustees of
Nuveen Diversified Dividend and Income Fund:
Opinion on the Financial Statements
We have audited the accompanying statement of assets and liabilities of Nuveen Diversified Dividend and Income Fund (the Fund), including the portfolio of investments, as of December 31, 2019, the related statements of operations and cash flows for the year then ended, the statements of changes in net assets for each of the years in the two-year period then ended, and the related notes (collectively, the financial statements) and the financial highlights for each of the years in the five-year period then ended. In our opinion, the financial statements and financial highlights present fairly, in all material respects, the financial position of the Fund as of December 31, 2019, the results of its operations and cash flows for the year then ended, the changes in its net assets for each of the years in the two-year period then ended, and the financial highlights for each of the years in the five-year period then ended, in conformity with U.S. generally accepted accounting principles.
Basis for Opinion
These financial statements and financial highlights are the responsibility of the Fund’s management. Our responsibility is to express an opinion on these financial statements and financial highlights based on our audits. We are a public accounting firm registered with the Public Company Accounting Oversight Board (United States) (PCAOB) and are required to be independent with respect to the Fund in accordance with the U.S. federal securities laws and the applicable rules and regulations of the Securities and Exchange Commission and the PCAOB.
We conducted our audits in accordance with the standards of the PCAOB. Those standards require that we plan and perform the audit to obtain reasonable assurance about whether the financial statements and financial highlights are free of material misstatement, whether due to error or fraud. Our audits included performing procedures to assess the risks of material misstatement of the financial statements and financial highlights, whether due to error or fraud, and performing procedures that respond to those risks. Such procedures included examining, on a test basis, evidence regarding the amounts and disclosures in the financial statements and financial highlights. Such procedures also included confirmation of securities owned as of December 31, 2019, by correspondence with custodians and brokers or other appropriate auditing procedures. Our audits also included evaluating the accounting principles used and significant estimates made by management, as well as evaluating the overall presentation of the financial statements and financial highlights. We believe that our audits provide a reasonable basis for our opinion.
/s/ KPMG LLP
We have served as the auditor of one or more Nuveen investment companies since 2014.
Chicago, Illinois
February 27, 2020
18
| | |
| JDD | | Nuveen Diversified Dividend and
Income Fund Portfolio of Investments December 31, 2019 |
| | | | | | | | | | | | | | | | | | | | | | | | | | | | | | |
| Shares | | | | | Description (1) | | | | | | | | | | | | | | | | | Value | |
| | |
| | | | | | LONG-TERM INVESTMENTS – 139.3% (97.7% of Total Investments) | |
| | |
| | | | | | REAL ESTATE INVESTMENT TRUST (REIT) COMMON STOCKS – 37.9% (26.6% of Total Investments) | |
| | | | | | | | |
| | | | | | Health Care – 3.4% | | | | | | | | | | | | | | | | | | |
| | | | | | | | |
| | 117,970 | | | | | Healthpeak Properties Inc | | | | | | | | | | | | | | | | | | | | | | $ | 4,066,426 | |
| | 48,235 | | | | | Welltower Inc | | | | | | | | | | | | | | | | | | | | | | | 3,944,658 | |
| | | | | | Total Health Care | | | | | | | | | | | | | | | | | | | | | | | 8,011,084 | |
| | | | | | | | |
| | | | | | Hotels – 2.7% | | | | | | | | | | | | | | | | | | |
| | | | | | | | |
| | 130,765 | | | | | DiamondRock Hospitality Co | | | | | | | | | | | | | | | | | | | | | | | 1,448,876 | |
| | 161,810 | | | | | Host Hotels & Resorts Inc | | | | | | | | | | | | | | | | | | | | | | | 3,001,576 | |
| | 58,300 | | | | | MGM Growth Properties LLC | | | | | | | | | | | | | | | | | | | | | | | 1,805,551 | |
| | | | | | Total Hotels | | | | | | | | | | | | | | | | | | | | | | | 6,256,003 | |
| | | | | | | | |
| | | | | | Industrial – 3.6% | | | | | | | | | | | | | | | | | | |
| | | | | | | | |
| | 43,730 | | | | | Duke Realty Corp | | | | | | | | | | | | | | | | | | | | | | | 1,516,119 | |
| | 77,513 | | | | | Prologis Inc | | | | | | | | | | | | | | | | | | | | | | | 6,909,509 | |
| | | | | | Total Industrial | | | | | | | | | | | | | | | | | | | | | | | 8,425,628 | |
| | | | | | | | |
| | | | | | Office – 7.8% | | | | | | | | | | | | | | | | | | |
| | | | | | | | |
| | 23,825 | | | | | Alexandria Real Estate Equities Inc | | | | | | | | | | | | | | | | | | | | | | | 3,849,643 | |
| | 25,625 | | | | | Boston Properties Inc | | | | | | | | | | | | | | | | | | | | | | | 3,532,662 | |
| | 95,470 | | | | | Brandywine Realty Trust | | | | | | | | | | | | | | | | | | | | | | | 1,503,653 | |
| | 23,300 | | | | | Cousins Properties Inc | | | | | | | | | | | | | | | | | | | | | | | 959,960 | |
| | 49,545 | | | | | Douglas Emmett Inc | | | | | | | | | | | | | | | | | | | | | | | 2,175,026 | |
| | 100,425 | | | | | Hudson Pacific Properties Inc | | | | | | | | | | | | | | | | | | | | | | | 3,781,001 | |
| | 27,875 | | | | | SL Green Realty Corp | | | | | | | | | | | | | | | | | | | | | | | 2,561,155 | |
| | | | | | Total Office | | | | | | | | | | | | | | | | | | | | | | | 18,363,100 | |
| | | | | | | | |
| | | | | | Residential – 7.7% | | | | | | | | | | | | | | | | | | |
| | | | | | | | |
| | 145,230 | | | | | American Homes 4 Rent | | | | | | | | | | | | | | | | | | | | | | | 3,806,479 | |
| | 73,348 | | | | | Apartment Investment & Management Co | | | | | | | | | | | | | | | | | | | | | | | 3,788,424 | |
| | 18,450 | | | | | AvalonBay Communities Inc | | | | | | | | | | | | | | | | | | | | | | | 3,868,965 | |
| | 36,835 | | | | | Equity Residential | | | | | | | | | | | | | | | | | | | | | | | 2,980,688 | |
| | 118,140 | | | | | Invitation Homes Inc | | | | | | | | | | | | | | | | | | | | | | | 3,540,656 | |
| | | | | | Total Residential | | | | | | | | | | | | | | | | | | | | | | | 17,985,212 | |
| | | | | | | | |
| | | | | | Retail – 4.2% | | | | | | | | | | | | | | | | | | |
| | | | | | | | |
| | 38,885 | | | | | Regency Centers Corp | | | | | | | | | | | | | | | | | | | | | | | 2,453,254 | |
| | 179,225 | | | | | Retail Properties of America Inc | | | | | | | | | | | | | | | | | | | | | | | 2,401,615 | |
| | 22,080 | | | | | Simon Property Group Inc | | | | | | | | | | | | | | | | | | | | | | | 3,289,037 | |
| | 53,275 | | | | | Weingarten Realty Investors | | | | | | | | | | | | | | | | | | | | | | | 1,664,311 | |
| | | | | | Total Retail | | | | | | | | | | | | | | | | | | | | | | | 9,808,217 | |
| | | | | | | | |
| | | | | | Specialized – 8.5% | | | | | | | | | | | | | | | | | | |
| | | | | | | | |
| | 26,290 | | | | | CoreSite Realty Corp | | | | | | | | | | | | | | | | | | | | | | | 2,947,635 | |
| | 126,515 | | | | | CubeSmart | | | | | | | | | | | | | | | | | | | | | | | 3,982,692 | |
| | 31,010 | | | | | Digital Realty Trust Inc | | | | | | | | | | | | | | | | | | | | | | | 3,713,137 | |
| | 8,950 | | | | | Equinix Inc | | | | | | | | | | | | | | | | | | | | | | | 5,224,115 | |
| | 36,625 | | | | | Life Storage Inc | | | | | | | | | | | | | | | | | | | | | | | 3,965,755 | |
| | | | | | Total Specialized | | | | | | | | | | | | | | | | | | | | | | | 19,833,334 | |
| | | | | | Total Real Estate Investment Trust (REIT) Common Stocks (cost $68,847,208) | | | | | | | | | | | | | | | | 88,682,578 | |
| | | | | | | | |
| Shares | | | | | Description (1) | | | | | | | | | | | | | | | | | Value | |
| | | | | | |
| | | | | | COMMON STOCKS – 35.9% (25.2% of Total Investments) | | | | | | | | | | | | | | | | | |
| | | | | | | | |
| | | | | | Aerospace & Defense – 0.3% | | | | | | | | | | | | | | | | | | |
| | | | | | | | |
| | 6,700 | | | | | Thales SA, (2) | | | | | | | | | | | | | | | | | | | | | | $ | 697,167 | |
19
| | |
| |
| JDD | | Nuveen Diversified Dividend and Income Fund(continued) |
| | Portfolio of Investments December 31, 2019 |
| | | | | | | | | | | | | | | | | | | | | | | | | | | | | | |
| Shares | | | | | Description (1) | | | | | | | | | | | | | | | | | Value | |
| | | | | | | | |
| | | | | | Air Freight & Logistics – 1.2% | | | | | | | | | | | | | | | | | | |
| | | | | | | | |
| | 71,690 | | | | | Deutsche Post AG, (2) | | | | | | | | | | | | | | | | | | | | | | $ | 2,725,952 | |
| | | | | | | | |
| | | | | | Airlines – 1.1% | | | | | | | | | | | | | | | | | | |
| | | | | | | | |
| | 44,492 | | | | | Delta Air Lines Inc | | | | | | | | | | | | | | | | | | | | | | | 2,601,892 | |
| | | | | | | | |
| | | | | | Banks – 4.9% | | | | | | | | | | | | | | | | | | |
| | | | | | | | |
| | 422,116 | | | | | AIB Group PLC | | | | | | | | | | | | | | | | | | | | | | | 1,470,652 | |
| | 41,060 | | | | | Bank of America Corp | | | | | | | | | | | | | | | | | | | | | | | 1,446,133 | |
| | 30,618 | | | | | Bank of NT Butterfield & Son Ltd | | | | | | | | | | | | | | | | | | | | | | | 1,133,479 | |
| | 39,179 | | | | | Citigroup Inc | | | | | | | | | | | | | | | | | | | | | | | 3,130,010 | |
| | 160,562 | | | | | ING Groep NV, Sponsored ADR | | | | | | | | | | | | | | | | | | | | | | | 1,934,772 | |
| | 10,800 | | | | | JPMorgan Chase & Co | | | | | | | | | | | | | | | | | | | | | | | 1,505,520 | |
| | 892,030 | | | | | Unicaja Banco SA,144A | | | | | | | | | | | | | | | | | | | | | | | 968,571 | |
| | | | | | Total Banks | | | | | | | | | | | | | | | | | | | | | | | 11,589,137 | |
| | | | | | | | |
| | | | | | Biotechnology – 0.6% | | | | | | | | | | | | | | | | | | |
| | | | | | | | |
| | 22,926 | | | | | Gilead Sciences Inc | | | | | | | | | | | | | | | | | | | | | | | 1,489,731 | |
| | | | | | | | |
| | | | | | Capital Markets – 1.7% | | | | | | | | | | | | | | | | | | |
| | | | | | | | |
| | 32,145 | | | | | AURELIUS Equity Opportunities SE & Co KGaA, (2) | | | | | | | | | | | | | | | | | | | | | | | 1,405,526 | |
| | 265,770 | | | | | Daiwa Securities Group Inc, (2) | | | | | | | | | | | | | | | | | | | | | | | 1,341,716 | |
| | 86,981 | | | | | Deutsche Boerse AG, ADR, (2) | | | | | | | | | | | | | | | | | | | | | | | 1,355,164 | |
| | | | | | Total Capital Markets | | | | | | | | | | | | | | | | | | | | | | | 4,102,406 | |
| | | | | | | | |
| | | | | | Chemicals – 0.7% | | | | | | | | | | | | | | | | | | |
| | | | | | | | |
| | 24,243 | | | | | DuPont de Nemours Inc | | | | | | | | | | | | | | | | | | | | | | | 1,556,401 | |
| | | | | | | | |
| | | | | | Diversified Telecommunication Services – 1.3% | | | | | | | | | | | | | | | | | | |
| | | | | | | | |
| | 25,690 | | | | | Nippon Telegraph & Telephone Corp, ADR, (2) | | | | | | | | | | | | | | | | | | | | | | | 1,297,345 | |
| | 113,094 | | | | | Telefonica Brasil SA, (2) | | | | | | | | | | | | | | | | | | | | | | | 1,634,614 | |
| | | | | | Total Diversified Telecommunication Services | | | | | | | | | | | | | | | | | | | | | | | 2,931,959 | |
| | | | | | | | |
| | | | | | Electric Utilities – 0.6% | | | | | | | | | | | | | | | | | | |
| | | | | | | | |
| | 28,310 | | | | | FirstEnergy Corp | | | | | | | | | | | | | | | | | | | | | | | 1,375,866 | |
| | | | | | | | |
| | | | | | Electrical Equipment – 0.6% | | | | | | | | | | | | | | | | | | |
| | | | | | | | |
| | 15,015 | | | | | Eaton Corp PLC | | | | | | | | | | | | | | | | | | | | | | | 1,422,221 | |
| | | | | | | | |
| | | | | | Energy Equipment & Services – 0.0% | | | | | | | | | | | | | | | | | | |
| | | | | | | | |
| | 3,685 | | | | | Transocean Ltd | | | | | | | | | | | | | | | | | | | | | | | 25,353 | |
| | | | | | | | |
| | | | | | Entertainment – 1.1% | | | | | | | | | | | | | | | | | | |
| | | | | | | | |
| | 6,161 | | | | | Nintendo Co Ltd, (2) | | | | | | | | | | | | | | | | | | | | | | | 2,464,154 | |
| | | | | | | | |
| | | | | | Health Care Providers & Services – 0.0% | | | | | | | | | | | | | | | | | | |
| | | | | | | | |
| | 6,594 | | | | | Millennium Health LLC, (2), (3) | | | | | | | | | | | | | | | | | | | | | | | 40 | |
| | 6,140 | | | | | Millennium Health LLC, (3), (4) | | | | | | | | | | | | | | | | | | | | | | | 6,779 | |
| | 5,767 | | | | | Millennium Health LLC, (3), (4) | | | | | | | | | | | | | | | | | | | | | | | 5,790 | |
| | | | | | Total Health Care Providers & Services | | | | | | | | | | | | | | | | | | | | | | | 12,609 | |
| | | | | | | | |
| | | | | | Household Durables – 0.6% | | | | | | | | | | | | | | | | | | |
| | | | | | | | |
| | 60,524 | | | | | Sekisui House Ltd, (2) | | | | | | | | | | | | | | | | | | | | | | | 1,292,481 | |
| | | | | | | | |
| | | | | | Household Products – 0.4% | | | | | | | | | | | | | | | | | | |
| | | | | | | | |
| | 10,025 | | | | | Henkel AG & Co KGaA, (2) | | | | | | | | | | | | | | | | | | | | | | | 1,035,587 | |
| | | | | | | | |
| | | | | | Industrial Conglomerates – 0.6% | | | | | | | | | | | | | | | | | | |
| | | | | | | | |
| | 10,148 | | | | | Siemens AG, (2) | | | | | | | | | | | | | | | | | | | | | | | 1,325,243 | |
| | | | | | | | |
| | | | | | Insurance – 3.1% | | | | | | | | | | | | | | | | | | |
| | | | | | | | |
| | 33,472 | | | | | Ageas, (2) | | | | | | | | | | | | | | | | | | | | | | | 1,979,285 | |
| | 5,357 | | | | | Allianz SE, (2) | | | | | | | | | | | | | | | | | | | | | | | 1,312,614 | |
20
| | | | | | | | | | | | | | | | | | | | | | | | | | | | | | |
| Shares | | | | | Description (1) | | | | | | | | | | | | | | | | | Value | |
| | | | | | | | |
| | | | | | Insurance(continued) | | | | | | | | | | | | | | | | | | |
| | | | | | | | |
| | 28,920 | | | | | CNA Financial Corp | | | | | | | | | | | | | | | | | | | | | | $ | 1,295,905 | |
| | 54,310 | | | | | Old Republic International Corp | | | | | | | | | | | | | | | | | | | | | | | 1,214,915 | |
| | 6,932 | | | | | RenaissanceRe Holdings Ltd | | | | | | | | | | | | | | | | | | | | | | | 1,358,811 | |
| | | | | | Total Insurance | | | | | | | | | | | | | | | | | | | | | | | 7,161,530 | |
| | | | | | | | |
| | | | | | Machinery – 0.5% | | | | | | | | | | | | | | | | | | |
| | | | | | | | |
| | 53,500 | | | | | Komatsu Ltd, (2) | | | | | | | | | | | | | | | | | | | | | | | 1,284,077 | |
| | | | | | | | |
| | | | | | Marine – 0.0% | | | | | | | | | | | | | | | | | | |
| | | | | | | | |
| | 262 | | | | | HGIM Corp, (2), (3) | | | | | | | | | | | | | | | | | | | | | | | 2,554 | |
| | | | | | | | |
| | | | | | Media – 0.8% | | | | | | | | | | | | | | | | | | |
| | | | | | | | |
| | 24,320 | | | | | Clear Channel Outdoor Holdings Inc, (3) | | | | | | | | | | | | | | | | | | | | | | | 69,555 | |
| | 8,232 | | | | | Cumulus Media Inc, (3) | | | | | | | | | | | | | | | | | | | | | | | 144,636 | |
| | 655,185 | | | | | Hibu plc, (2), (3) | | | | | | | | | | | | | | | | | | | | | | | 78,622 | |
| | 10,343 | | | | | iHeartMedia Inc, (3) | | | | | | | | | | | | | | | | | | | | | | | 174,797 | |
| | 2,099 | | | | | Metro-Goldwyn-Mayer Inc, (2), (3) | | | | | | | | | | | | | | | | | | | | | | | 159,524 | |
| | 3,185 | | | | | Tribune Co, (4) | | | | | | | | | | | | | | | | | | | | | | | 702 | |
| | 30,100 | | | | | ViacomCBS Inc | | | | | | | | | | | | | | | | | | | | | | | 1,263,297 | |
| | | | | | Total Media | | | | | | | | | | | | | | | | | | | | | | | 1,891,133 | |
| | | | | | | | |
| | | | | | Multi-Utilities – 1.4% | | | | | | | | | | | | | | | | | | |
| | | | | | | | |
| | 145,323 | | | | | National Grid PLC, (2) | | | | | | | | | | | | | | | | | | | | | | | 1,816,125 | |
| | 51,658 | | | | | Veolia Environnement SA, (2) | | | | | | | | | | | | | | | | | | | | | | | 1,374,534 | |
| | | | | | Total Multi-Utilities | | | | | | | | | | | | | | | | | | | | | | | 3,190,659 | |
| | | | | | | | |
| | | | | | Oil, Gas & Consumable Fuels – 3.5% | | | | | | | | | | | | | | | | | | |
| | | | | | | | |
| | 15,573 | | | | | Chevron Corp, (5) | | | | | | | | | | | | | | | | | | | | | | | 1,876,702 | |
| | 121,140 | | | | | Enterprise Products Partners LP | | | | | | | | | | | | | | | | | | | | | | | 3,411,302 | |
| | 69,810 | | | | | Equitrans Midstream Corp | | | | | | | | | | | | | | | | | | | | | | | 932,662 | |
| | 34,940 | | | | | TOTAL SA, Sponsored ADR | | | | | | | | | | | | | | | | | | | | | | | 1,932,182 | |
| | | | | | Total Oil, Gas & Consumable Fuels | | | | | | | | | | | | | | | | | | | | | | | 8,152,848 | |
| | | | | | | | |
| | | | | | Pharmaceuticals – 4.3% | | | | | | | | | | | | | | | | | | |
| | | | | | | | |
| | 27,636 | | | | | AstraZeneca PLC, Sponsored ADR | | | | | | | | | | | | | | | | | | | | | | | 1,377,931 | |
| | 17,440 | | | | | Bayer AG, (2) | | | | | | | | | | | | | | | | | | | | | | | 1,417,812 | |
| | 28,215 | | | | | Bristol-Myers Squibb Co | | | | | | | | | | | | | | | | | | | | | | | 1,811,121 | |
| | 60,785 | | | | | GlaxoSmithKline PLC, Sponsored ADR | | | | | | | | | | | | | | | | | | | | | | | 2,856,287 | |
| | 25,260 | | | | | Roche Holding AG, Sponsored ADR, (2) | | | | | | | | | | | | | | | | | | | | | | | 1,027,072 | |
| | 15,955 | | | | | Sanofi, (2) | | | | | | | | | | | | | | | | | | | | | | | 1,602,320 | |
| | | | | | Total Pharmaceuticals | | | | | | | | | | | | | | | | | | | | | | | 10,092,543 | |
| | | | | | | | |
| | | | | | Real Estate Management & Development – 0.3% | | | | | | | | | | | | | | | | | | |
| | | | | | | | |
| | 214,100 | | | | | Great Eagle Holdings Ltd, (2) | | | | | | | | | | | | | | | | | | | | | | | 721,389 | |
| | | | | | |
| | | | | | Semiconductors & Semiconductor Equipment – 1.3% | | | | | | | | | | | | | |
| | | | | | | | |
| | 4,353 | | | | | Broadcom Inc | | | | | | | | | | | | | | | | | | | | | | | 1,375,635 | |
| | 37,425 | | | | | Cypress Semiconductor Corp | | | | | | | | | | | | | | | | | | | | | | | 873,125 | |
| | 39,804 | | | | | Infineon Technologies AG, (2) | | | | | | | | | | | | | | | | | | | | | | | 899,346 | |
| | | | | | Total Semiconductors & Semiconductor Equipment | | | | | | | | | | | | | | | | | | | | | | | 3,148,106 | |
| | | | | | | | |
| | | | | | Software – 1.7% | | | | | | | | | | | | | | | | | | |
| | | | | | | | |
| | 14,107 | | | | | Microsoft Corp, (5) | | | | | | | | | | | | | | | | | | | | | | | 2,224,674 | |
| | 33,690 | | | | | Oracle Corp | | | | | | | | | | | | | | | | | | | | | | | 1,784,896 | |
| | | | | | Total Software | | | | | | | | | | | | | | | | | | | | | | | 4,009,570 | |
| | | | | | | | |
| | | | | | Specialty Retail – 0.6% | | | | | | | | | | | | | | | | | | |
| | | | | | | | |
| | 498,100 | | | | | Kingfisher PLC, (2) | | | | | | | | | | | | | | | | | | | | | | | 1,433,894 | |
| | | | | | |
| | | | | | Technology Hardware, Storage & Peripherals – 0.6% | | | | | | | | | | | | | |
| | | | | | | | |
| | 37,800 | | | | | Samsung Electronics Co Ltd, (2) | | | | | | | | | | | | | | | | | | | | | | | 1,479,940 | |
21
| | |
| |
| JDD | | Nuveen Diversified Dividend and Income Fund(continued) |
| | Portfolio of Investments December 31, 2019 |
| | | | | | | | | | | | | | | | | | | | | | | | | | | | | | |
| Shares | | | | | Description (1) | | | | | | | | | | | | | | | | | Value | |
| | | | | | | | |
| | | | | | Tobacco – 0.5% | | | | | | | | | | | | | | | | | | |
| | | | | | | | |
| | 12,955 | | | | | Philip Morris International Inc | | | | | | | | | | | | | | | | | | | | | | $ | 1,102,341 | |
| | | | | | | | |
| | | | | | Trading Companies & Distributors – 0.8% | | | | | | | | | | | | | | | | | | |
| | | | | | | | |
| | 100,500 | | | | | Mitsui & Co Ltd, (2) | | | | | | | | | | | | | | | | | | | | | | | 1,786,440 | |
| | | | | | | | |
| | | | | | Wireless Telecommunication Services – 0.8% | | | | | | | | | | | | | | | | | | |
| | | | | | | | |
| | 85,360 | | | | | SK Telecom Co Ltd, Sponsored ADR | | | | | | | | | | | | | | | | | | | | | | | 1,972,670 | |
| | | | | | Total Common Stocks (cost $69,845,597) | | | | | | | | | | | | | | | | | | | | | | | 84,077,853 | |
| | | | | | | | |
Principal
Amount (000) (6) | | | | | Description (1) | | | | | | | | Coupon | | | Maturity | | | Ratings (7) | | | Value | |
| | |
| | | | | | EMERGING MARKET DEBT AND FOREIGN CORPORATE BONDS – 34.7% (24.4% of Total Investments) | |
| | | | | | | | |
| | | | | | Angola – 0.5% | | | | | | | | | | | | | | | | | | |
| | | | | | | | |
| $ | 335 | | | | | Angolan Government International Bond, 144A | | | | | | | | | | | 8.250% | | | | 5/09/28 | | | | B3 | | | $ | 361,194 | |
| | 200 | | | | | Angolan Government International Bond, 144A | | | | | | | | | | | 8.000% | | | | 11/26/29 | | | | B | | | | 213,091 | |
| | 320 | | | | | Angolan Government International Bond, 144A | | | | | | | | | | | 9.375% | | | | 5/08/48 | | | | B3 | | | | 350,558 | |
| | 200 | | | | | Angolan Government International Bond, 144A | | | | | | | | | | | 9.125% | | | | 11/26/49 | | | | B | | | | 213,610 | |
| | | | | | Total Angola | | | | | | | | | | | | | | | | | | | | | | | 1,138,453 | |
| | | | | | | | |
| | | | | | Argentina – 0.7% | | | | | | | | | | | | | | | | | | |
| | | | | | | | |
| | 45 | | | | | Argentine Republic Government International Bond | | | | | | | | | | | 5.625% | | | | 1/26/22 | | | | Caa2 | | | | 23,288 | |
| | 5 | | | | | Argentine Republic Government International Bond | | | | | | | | | | | 4.625% | | | | 1/11/23 | | | | Caa2 | | | | 2,468 | |
| | 155 | | | | | Argentine Republic Government International Bond | | | | | | | | | | | 6.875% | | | | 1/26/27 | | | | Caa2 | | | | 77,112 | |
| | 493 | | | | | Argentine Republic Government International Bond | | | | | | | | | | | 5.875% | | | | 1/11/28 | | | | Caa2 | | | | 231,710 | |
| | 360 | | | | | Argentine Republic Government International Bond | | | | | | | | | | | 6.625% | | | | 7/06/28 | | | | Caa2 | | | | 170,550 | |
| | 160 | | | | | Argentine Republic Government International Bond | | | | | | | | | | | 3.750% | | | | 12/31/38 | | | | Caa2 | | | | 78,002 | |
| | 200 | | | | | Argentine Republic Government International Bond | | | | | | | | | | | 6.875% | | | | 1/11/48 | | | | Caa2 | | | | 95,750 | |
| | 150 | | | EUR | | Argentine Republic Government International Bond, Reg S | | | | | | | | | | | 5.250% | | | | 1/15/28 | | | | Caa2 | | | | 72,287 | |
| | 231 | | | | | Ciudad Autonoma De Buenos Aires/Government Bonds, 144A | | | | | | | | | | | 8.950% | | | | 2/19/21 | | | | B– | | | | 238,662 | |
| | 310 | | | | | Ciudad Autonoma De Buenos Aires/Government Bonds, 144A | | | | | | | | | | | 7.500% | | | | 6/01/27 | | | | B– | | | | 299,150 | |
| | 171 | | | | | Provincia de Cordoba, 144A | | | | | | | | | | | 7.125% | | | | 6/10/21 | | | | B– | | | | 125,685 | |
| | 76 | | | | | YPF SA, 144A | | | | | | | | | | | 8.750% | | | | 4/04/24 | | | | Caa2 | | | | 74,101 | |
| | 139 | | | | | YPF SA, 144A | | | | | | | | | | | 6.950% | | | | 7/21/27 | | | | B– | | | | 123,710 | |
| | 100 | | | | | YPF SA, 144A | | | | | | | | | | | 7.000% | | | | 12/15/47 | | | | B– | | | | 79,000 | |
| | 50 | | | | | YPF SA, Reg S | | | | | | | | | | | 8.500% | | | | 7/28/25 | | | | Caa2 | | | | 47,000 | |
| | | | | | Total Argentina | | | | | | | | | | | | | | | | | | | | | | | 1,738,475 | |
| | | | | | | | |
| | | | | | Armenia – 0.3% | | | | | | | | | | | | | | | | | | |
| | | | | | | | |
| | 655 | | | | | Republic of Armenia International Bond, Reg S | | | | | | | | | | | 7.150% | | | | 3/26/25 | | | | Ba3 | | | | 767,894 | |
| | | | | | | | |
| | | | | | Azerbaijan – 1.0% | | | | | | | | | | | | | | | | | | |
| | | | | | | | |
| | 390 | | | | | Republic of Azerbaijan International Bond, Reg S | | | | | | | | | | | 4.750% | | | | 3/18/24 | | | | BB+ | | | | 417,335 | |
| | 150 | | | | | Republic of Azerbaijan International Bond, Reg S | | | | | | | | | | | 5.125% | | | | 9/01/29 | | | | BB+ | | | | 162,811 | |
| | 825 | | | | | Republic of Azerbaijan International Bond, Reg S | | | | | | | | | | | 3.500% | | | | 9/01/32 | | | | BB+ | | | | 807,878 | |
| | 200 | | | | | Southern Gas Corridor CJSC, 144A | | | | | | | | | | | 6.875% | | | | 3/24/26 | | | | BB+ | | | | 236,848 | |
| | 330 | | | | | Southern Gas Corridor CJSC, Reg S | | | | | | | | | | | 6.875% | | | | 3/24/26 | | | | BB+ | | | | 390,902 | |
| | 210 | | | | | State Oil Co of the Azerbaijan Republic, Reg S | | | | | | | | | | | 6.950% | | | | 3/18/30 | | | | BB+ | | | | 257,634 | |
| | | | | | Total Azerbaijan | | | | | | | | | | | | | | | | | | | | | | | 2,273,408 | |
| | | | | | | | |
| | | | | | Bahrain – 0.4% | | | | | | | | | | | | | | | | | | |
| | | | | | | | |
| | 475 | | | | | Bahrain Government International Bond, 144A | | | | | | | | | | | 5.625% | | | | 9/30/31 | | | | BB– | | | | 509,024 | |
| | 310 | | | | | Bahrain Government International Bond, Reg S | | | | | | | | | | | 5.625% | | | | 9/30/31 | | | | BB– | | | | 331,445 | |
| | | | | | Total Bahrain | | | | | | | | | | | | | | | | | | | | | | | 840,469 | |
| | | | | | | | |
| | | | | | Bermuda – 0.1% | | | | | | | | | | | | | | | | | | |
| | | | | | | | |
| | 200 | | | | | Bermuda Government International Bond, 144A | | | | | | | | | | | 4.750% | | | | 2/15/29 | | | | A+ | | | | 225,750 | |
| | | | | | | | |
| | | | | | Brazil – 1.3% | | | | | | | | | | | | | | | | | | |
| | | | | | | | |
| | 255 | | | | | Banco do Brasil SA, 144A | | | | | | | | | | | 4.750% | | | | 3/20/24 | | | | Ba2 | | | | 267,753 | |
| | 200 | | | | | Banco do Brasil SA, Reg S | | | | | | | | | | | 4.625% | | | | 1/15/25 | | | | Ba2 | | | | 208,802 | |
| | 200 | | | | | Braskem Netherlands Finance BV, 144A | | | | | | | | | | | 4.500% | | | | 1/31/30 | | | | BBB– | | | | 199,100 | |
22
| | | | | | | | | | | | | | | | | | | | | | | | | | | | | | |
Principal
Amount (000) (6) | | | | | Description (1) | | | | | | | | Coupon | | | Maturity | | | Ratings (7) | | | Value | |
| | | | | | | | |
| | | | | | Brazil(continued) | | | | | | | | | | | | | | | | | | |
| | | | | | | | |
| $ | 200 | | | | | Braskem Netherlands Finance BV, Reg S | | | | | | | | | | | 4.500% | | | | 1/10/28 | | | | BBB– | | | $ | 199,052 | |
| | 1,218 | | | BRL | | Brazil Notas do Tesouro Nacional Serie F | | | | | | | | | | | 10.000% | | | | 1/01/29 | | | | BB– | | | | 365,479 | |
| | 265 | | | | | Brazilian Government International Bond | | | | | | | | | | | 4.500% | | | | 5/30/29 | | | | Ba2 | | | | 280,767 | |
| | 225 | | | | | Centrais Eletricas Brasileiras SA, Reg S | | | | | | | | | | | 5.750% | | | | 10/27/21 | | | | BB– | | | | 234,790 | |
| | 205 | | | | | CSN Resources SA, 144A | | | | | | | | | | | 7.625% | | | | 4/17/26 | | | | B2 | | | | 218,327 | |
| | 200 | | | | | Minerva Luxembourg SA, Reg S | | | | | | | | | | | 5.875% | | | | 1/19/28 | | | | BB– | | | | 210,002 | |
| | 300 | | | | | Petrobras Global Finance BV | | | | | | | | | | | 6.900% | | | | 3/19/49 | | | | Ba2 | | | | 351,900 | |
| | 190 | | | | | Petrobras Global Finance BV, 144A | | | | | | | | | | | 5.093% | | | | 1/15/30 | | | | Ba2 | | | | 203,587 | |
| | 200 | | | | | Suzano Austria GmbH | | | | | | | | | | | 5.000% | | | | 1/15/30 | | | | BBB– | | | | 210,244 | |
| | | | | | Total Brazil | | | | | | | | | | | | | | | | | | | | | | | 2,949,803 | |
| | | | | | | | |
| | | | | | British Virgin Islands – 0.4% | | | | | | | | | | | | | | | | | | |
| | | | | | | | |
| | 430 | | | | | State Grid Overseas Investment 2016 Ltd, 144A | | | | | | | | | | | 3.500% | | | | 5/04/27 | | | | A+ | | | | 449,612 | |
| | 450 | | | | | State Grid Overseas Investment 2016 Ltd, 144A | | | | | | | | | | | 4.250% | | | | 5/02/28 | | | | A+ | | | | 497,556 | |
| | | | | | Total British Virgin Islands | | | | | | | | | | | | | | | | | | | | | | | 947,168 | |
| | | | | | | | |
| | | | | | Chile – 0.6% | | | | | | | | | | | | | | | | | | |
| | | | | | | | |
| | 200 | | | | | Celulosa Arauco y Constitucion SA | | | | | | | | | | | 4.500% | | | | 8/01/24 | | | | BBB | | | | 209,502 | |
| | 205 | | | | | Celulosa Arauco y Constitucion SA, 144A | | | | | | | | | | | 5.150% | | | | 1/29/50 | | | | BBB | | | | 203,463 | |
| | 655 | | | | | Chile Government International Bond | | | | | | | | | | | 3.500% | | | | 1/25/50 | | | | A+ | | | | 676,818 | |
| | 200 | | | | | Empresa Nacional del Petroleo, 144A | | | | | | | | | | | 5.250% | | | | 11/06/29 | | | | A | | | | 223,878 | |
| | 200 | | | | | Empresa Nacional del Petroleo, 144A | | | | | | | | | | | 4.500% | | | | 9/14/47 | | | | A | | | | 203,035 | |
| | | | | | Total Chile | | | | | | | | | | | | | | | | | | | | | | | 1,516,696 | |
| | | | | | | | |
| | | | | | China – 1.3% | | | | | | | | | | | | | | | | | | |
| | | | | | | | |
| | 200 | | | | | BRF SA, 144A | | | | | | | | | | | 4.875% | | | | 1/24/30 | | | | Ba2 | | | | 206,252 | |
| | 450 | | | | | CNOOC Finance 2013 Ltd | | | | | | | | | | | 2.875% | | | | 9/30/29 | | | | A+ | | | | 450,185 | |
| | 200 | | | | | Industrial & Commercial Bank of China Ltd, Reg S | | | | | | | | | | | 4.875% | | | | 9/21/25 | | | | BBB+ | | | | 219,309 | |
| | 380 | | | | | Sinopec Group Overseas Development 2012 Ltd, Reg S | | | | | | | | | | | 4.875% | | | | 5/17/42 | | | | A+ | | | | 457,062 | |
| | 925 | | | | | Sinopec Group Overseas Development 2018 Ltd, 144A | | | | | | | | | | | 2.500% | | | | 8/08/24 | | | | A+ | | | | 927,767 | |
| | 205 | | | | | Sinopec Group Overseas Development 2018 Ltd, 144A | | | | | | | | | | | 2.950% | | | | 8/08/29 | | | | A+ | | | | 206,200 | |
| | 555 | | | | | Sinopec Group Overseas Development 2018 Ltd, 144A | | | | | | | | | | | 3.680% | | | | 8/08/49 | | | | A+ | | | | 567,659 | |
| | | | | | Total China | | | | | | | | | | | | | | | | | | | | | | | 3,034,434 | |
| | | | | | | | |
| | | | | | Colombia – 0.4% | | | | | | | | | | | | | | | | | | |
| | | | | | | | |
| | 220 | | | | | Colombia Government International Bond | | | | | | | | | | | 5.000% | | | | 6/15/45 | | | | Baa2 | | | | 255,530 | |
| | 225 | | | | | Ecopetrol SA | | | | | | | | | | | 5.875% | | | | 9/18/23 | | | | BBB | | | | 248,956 | |
| | 80 | | | | | Ecopetrol SA | | | | | | | | | | | 5.375% | | | | 6/26/26 | | | | BBB | | | | 89,601 | |
| | 200 | | | | | Millicom International Cellular SA, 144A | | | | | | | | | | | 6.250% | | | | 3/25/29 | | | | BB+ | | | | 220,598 | |
| | 200 | | | | | Transportadora de Gas Internacional SA ESP, 144A | | | | | | | | | | | 5.550% | | | | 11/01/28 | | | | BBB | | | | 228,752 | |
| | | | | | Total Colombia | | | | | | | | | | | | | | | | | | | | | | | 1,043,437 | |
| | | | | | | | |
| | | | | | Costa Rica – 0.4% | | | | | | | | | | | | | | | | | | |
| | | | | | | | |
| | 765 | | | | | Costa Rica Government International Bond, 144A | | | | | | | | | | | 6.125% | | | | 2/19/31 | | | | B+ | | | | 813,769 | |
| | 200 | | | | | Costa Rica Government International Bond, 144A | | | | | | | | | | | 7.158% | | | | 3/12/45 | | | | B+ | | | | 213,000 | |
| | | | | | Total Costa Rica | | | | | | | | | | | | | | | | | | | | | | | 1,026,769 | |
| | | | | | | | |
| | | | | | Cote d“Ivoire – 0.2% | | | | | | | | | | | | | | | | | | |
| | | | | | | | |
| | 100 | | | EUR | | Ivory Coast Government International Bond, 144A | | | | | | | | | | | 5.875% | | | | 10/17/31 | | | | Ba3 | | | | 116,344 | |
| | 395 | | | | | Ivory Coast Government International Bond, Reg S | | | | | | | | | | | 6.125% | | | | 6/15/33 | | | | Ba3 | | | | 396,656 | |
| | | | | | Total Cote d’Ivoire | | | | | | | | | | | | | | | | | | | | | | | 513,000 | |
| | | | | | | | |
| | | | | | Croatia – 0.7% | | | | | | | | | | | | | | | | | | |
| | | | | | | | |
| | 675 | | | | | Croatia Government International Bond, Reg S | | | | | | | | | | | 5.500% | | | | 4/04/23 | | | | BBB– | | | | 743,886 | |
| | 660 | | | EUR | | Croatia Government International Bond, Reg S | | | | | | | | | | | 3.000% | | | | 3/20/27 | | | | BBB– | | | | 864,516 | |
| | | | | | Total Croatia | | | | | | | | | | | | | | | | | | | | | | | 1,608,402 | |
| | | | | | | | |
| | | | | | Dominican Republic – 0.9% | | | | | | | | | | | | | | | | | | |
| | | | | | | | |
| | 250 | | | | | Dominican Republic International Bond, 144A | | | | | | | | | | | 6.400% | | | | 6/05/49 | | | | BB– | | | | 274,063 | |
| | 423 | | | | | Dominican Republic International Bond, Reg S | | | | | | | | | | | 7.500% | | | | 5/06/21 | | | | BB– | | | | 439,742 | |
| | 285 | | | | | Dominican Republic International Bond, Reg S | | | | | | | | | | | 6.600% | | | | 1/28/24 | | | | BB– | | | | 316,709 | |
| | 100 | | | | | Dominican Republic International Bond, Reg S | | | | | | | | | | | 6.875% | | | | 1/29/26 | | | | BB– | | | | 114,126 | |
23
| | |
| |
| JDD | | Nuveen Diversified Dividend and Income Fund(continued) |
| | Portfolio of Investments December 31, 2019 |
| | | | | | | | | | | | | | | | | | | | | | | | | | | | | | |
Principal
Amount (000) (6) | | | | | Description (1) | | | | | | | | Coupon | | | Maturity | | | Ratings (7) | | | Value | |
| | | | | | | | |
| | | | | | Dominican Republic(continued) | | | | | | | | | | | | | | | | | | |
| | | | | | | | |
| $ | 545 | | | | | Dominican Republic International Bond, Reg S | | | | | | | | | | | 7.450% | | | | 4/30/44 | | | | BB– | | | $ | 657,406 | |
| | 290 | | | | | Dominican Republic International Bond, Reg S | | | | | | | | | | | 6.850% | | | | 1/27/45 | | | | BB– | | | | 330,962 | |
| | | | | | Total Dominican Republic | | | | | | | | | | | | | | | | | | | | | | | 2,133,008 | |
| | | | | | | | |
| | | | | | Ecuador – 0.8% | | | | | | | | | | | | | | | | | | |
| | | | | | | | |
| | 346 | | | | | Ecuador Government International Bond, 144A | | | | | | | | | | | 9.650% | | | | 12/13/26 | | | | B– | | | | 328,700 | |
| | 255 | | | | | Ecuador Government International Bond, 144A | | | | | | | | | | | 7.875% | | | | 1/23/28 | | | | B– | | | | 227,410 | |
| | 400 | | | | | Ecuador Government International Bond, 144A | | | | | | | | | | | 9.500% | | | | 3/27/30 | | | | B– | | | | 373,000 | |
| | 200 | | | | | Ecuador Government International Bond, Reg S | | | | | | | | | | | 7.950% | | | | 6/20/24 | | | | B– | | | | 189,500 | |
| | 400 | | | | | Ecuador Government International Bond, Reg S | | | | | | | | | | | 8.875% | | | | 10/23/27 | | | | B– | | | | 367,000 | |
| | 555 | | | | | Ecuador Government International Bond, Reg S | | | | | | | | | | | 7.875% | | | | 1/23/28 | | | | B– | | | | 494,952 | |
| | | | | | Total Ecuador | | | | | | | | | | | | | | | | | | | | | | | 1,980,562 | |
| | | | | | | | |
| | | | | | Egypt – 1.1% | | | | | | | | | | | | | | | | | | |
| | | | | | | | |
| | 615 | | | | | Egypt Government International Bond, 144A | | | | | | | | | | | 7.600% | | | | 3/01/29 | | | | B+ | | | | 672,398 | |
| | 735 | | | | | Egypt Government International Bond, Reg S | | | | | | | | | | | 7.600% | | | | 3/01/29 | | | | B+ | | | | 802,152 | |
| | 200 | | | | | Egypt Government International Bond, Reg S | | | | | | | | | | | 8.500% | | | | 1/31/47 | | | | B+ | | | | 220,936 | |
| | 740 | | | | | Egypt Government International Bond, Reg S | | | | | | | | | | | 7.903% | | | | 2/21/48 | | | | B+ | | | | 772,164 | |
| | | | | | Total Egypt | | | | | | | | | | | | | | | | | | | | | | | 2,467,650 | |
| | | | | | | | |
| | | | | | El Salvador – 0.2% | | | | | | | | | | | | | | | | | | |
| | | | | | | | |
| | 190 | | | | | El Salvador Government International Bond, 144A | | | | | | | | | | | 7.125% | | | | 1/20/50 | | | | B– | | | | 202,232 | |
| | 55 | | | | | El Salvador Government International Bond, Reg S | | | | | | | | | | | 8.625% | | | | 2/28/29 | | | | B– | | | | 66,000 | |
| | 80 | | | | | El Salvador Government International Bond, Reg S | | | | | | | | | | | 7.650% | | | | 6/15/35 | | | | B+ | | | | 91,200 | |
| | | | | | Total El Salvador | | | | | | | | | | | | | | | | | | | | | | | 359,432 | |
| | | | | | | | |
| | | | | | Ethiopia – 0.3% | | | | | | | | | | | | | | | | | | |
| | | | | | | | |
| | 600 | | | | | Ethiopia International Bond, Reg S | | | | | | | | | | | 6.625% | | | | 12/11/24 | | | | B1 | | | | 646,916 | |
| | | | | | | | |
| | | | | | Gabon – 0.4% | | | | | | | | | | | | | | | | | | |
| | | | | | | | |
| | 620 | | | | | Gabon Government International Bond, Reg S | | | | | | | | | | | 6.375% | | | | 12/12/24 | | | | B | | | | 647,395 | |
| | 245 | | | | | Gabon Government International Bond, Reg S | | | | | | | | | | | 6.950% | | | | 6/16/25 | | | | B | | | | 257,914 | |
| | | | | | Total Gabon | | | | | | | | | | | | | | | | | | | | | | | 905,309 | |
| | | | | | | | |
| | | | | | Georgia – 0.2% | | | | | | | | | | | | | | | | | | |
| | | | | | | | |
| | 535 | | | | | Georgia Government International Bond, Reg S | | | | | | | | | | | 6.875% | | | | 4/12/21 | | | | BB | | | | 562,931 | |
| | | | | | | | |
| | | | | | Ghana – 0.5% | | | | | | | | | | | | | | | | | | |
| | | | | | | | |
| | 250 | | | | | Ghana Government International Bond, 144A | | | | | | | | | | | 8.627% | | | | 6/16/49 | | | | B | | | | 249,280 | |
| | 755 | | | | | Ghana Government International Bond, Reg S | | | | | | | | | | | 7.625% | | | | 5/16/29 | | | | B | | | | 767,680 | |
| | 200 | | | | | Ghana Government International Bond, Reg S | | | | | | | | | | | 8.125% | | | | 3/26/32 | | | | B | | | | 203,074 | |
| | | | | | Total Ghana | | | | | | | | | | | | | | | | | | | | | | | 1,220,034 | |
| | | | | | | | |
| | | | | | Greece – 0.2% | | | | | | | | | | | | | | | | | | |
| | | | | | | | |
| | 60 | | | EUR | | Hellenic Republic Government Bond, 144A, Reg S | | | | | | | | | | | 3.450% | | | | 4/02/24 | | | | BB– | | | | 75,415 | |
| | 380 | | | EUR | | Hellenic Republic Government Bond, Reg S | | | | | | | | | | | 3.500% | | | | 1/30/23 | | | | BB– | | | | 467,966 | |
| | | | | | Total Greece | | | | | | | | | | | | | | | | | | | | | | | 543,381 | |
| | | | | | | | |
| | | | | | Hungary – 0.5% | | | | | | | | | | | | | | | | | | |
| | | | | | | | |
| | 406 | | | | | Hungary Government International Bond | | | | | | | | | | | 5.375% | | | | 2/21/23 | | | | BBB | | | | 445,301 | |
| | 306 | | | | | Hungary Government International Bond | | | | | | | | | | | 5.750% | | | | 11/22/23 | | | | BBB | | | | 344,925 | |
| | 390 | | | | | MFB Magyar Fejlesztesi Bank Zrt, Reg S | | | | | | | | | | | 6.250% | | | | 10/21/20 | | | | BBB | | | | 402,341 | |
| | | | | | Total Hungary | | | | | | | | | | | | | | | | | | | | | | | 1,192,567 | |
| | | | | | | | |
| | | | | | India – 0.2% | | | | | | | | | | | | | | | | | | |
| | | | | | | | |
| | 200 | | | | | Bharti Airtel Ltd, Reg S | | | | | | | | | | | 4.375% | | | | 6/10/25 | | | | BBB– | | | | 203,478 | |
| | 200 | | | | | Greenko Dutch BV, Reg S | | | | | | | | | | | 5.250% | | | | 7/24/24 | | | | Ba1 | | | | 202,780 | |
| | | | | | Total India | | | | | | | | | | | | | | | | | | | | | | | 406,258 | |
24
| | | | | | | | | | | | | | | | | | | | | | | | | | | | | | |
Principal
Amount (000) (6) | | | | | Description (1) | | | | | | | | Coupon | | | Maturity | | | Ratings (7) | | | Value | |
| | | | | | | | |
| | | | | | Indonesia – 0.8% | | | | | | | | | | | | | | | | | | |
| | | | | | | | |
| $ | 235 | | | | | Indonesia Government International Bond, Reg S | | | | | | | | | | | 4.750% | | | | 1/08/26 | | | | BBB | | | $ | 261,016 | |
| | 200,000 | | | IDR | | International Bank for Reconstruction & Development | | | | | | | | | | | 7.450% | | | | 8/20/21 | | | | AAA | | | | 14,750 | |
| | 3,100,000 | | | IDR | | International Finance Corp | | | | | | | | | | | 8.000% | | | | 10/09/23 | | | | AAA | | | | 237,426 | |
| | 200 | | | | | Medco Oak Tree Pte Ltd, 144A | | | | | | | | | | | 7.375% | | | | 5/14/26 | | | | B+ | | | | 203,751 | |
| | 200 | | | | | Minejesa Capital BV, Reg S | | | | | | | | | | | 4.625% | | | | 8/10/30 | | | | Baa3 | | | | 206,918 | |
| | 250 | | | | | Minejesa Capital BV, Reg S | | | | | | | | | | | 5.625% | | | | 8/10/37 | | | | Baa3 | | | | 271,473 | |
| | 200 | | | | | Perusahaan Listrik Negara PT, 144A | | | | | | | | | | | 5.450% | | | | 5/21/28 | | | | Baa2 | | | | 230,000 | |
| | 375 | | | | | Perusahaan Listrik Negara PT, Reg S | | | | | | | | | | | 4.125% | | | | 5/15/27 | | | | Baa2 | | | | 395,156 | |
| | | | | | Total Indonesia | | | | | | | | | | | | | | | | | | | | | | | 1,820,490 | |
| | | | | | | | |
| | | | | | Israel – 0.5% | | | | | | | | | | | | | | | | | | |
| | | | | | | | |
| | 200 | | | | | Israel Electric Corp Ltd, 144A, Reg S | | | | | | | | | | | 5.000% | | | | 11/12/24 | | | | BBB | | | | 219,760 | |
| | 875 | | | | | Israel Electric Corp Ltd, 144A, Reg S | | | | | | | | | | | 4.250% | | | | 8/14/28 | | | | BBB | | | | 951,886 | |
| | | | | | Total Israel | | | | | | | | | | | | | | | | | | | | | | | 1,171,646 | |
| | | | | | | | |
| | | | | | Jamaica – 0.5% | | | | | | | | | | | | | | | | | | |
| | | | | | | | |
| | 310 | | | | | Jamaica Government International Bond | | | | | | | | | | | 8.000% | | | | 3/15/39 | | | | B+ | | | | 421,600 | |
| | 600 | | | | | Jamaica Government International Bond | | | | | | | | | | | 7.875% | | | | 7/28/45 | | | | B+ | | | | 810,000 | |
| | | | | | Total Jamaica | | | | | | | | | | | | | | | | | | | | | | | 1,231,600 | |
| | | | | | | | |
| | | | | | Jordan – 0.3% | | | | | | | | | | | | | | | | | | |
| | | | | | | | |
| | 200 | | | | | Jordan Government International Bond, 144A | | | | | | | | | | | 7.375% | | | | 10/10/47 | | | | B+ | | | | 213,024 | |
| | 425 | | | | | Jordan Government International Bond, Reg S | | | | | | | | | | | 7.375% | | | | 10/10/47 | | | | B+ | | | | 450,453 | |
| | | | | | Total Jordan | | | | | | | | | | | | | | | | | | | | | | | 663,477 | |
| | | | | | | | |
| | | | | | Kazakhstan – 0.3% | | | | | | | | | | | | | | | | | | |
| | | | | | | | |
| | 330 | | | | | Development Bank of Kazakhstan JSC, Reg S | | | | | | | | | | | 6.500% | | | | 6/03/20 | | | | Baa3 | | | | 334,875 | |
| | 395 | | | | | KazMunayGas National Co JSC, 144A | | | | | | | | | | | 5.750% | | | | 4/19/47 | | | | Baa3 | | | | 471,037 | |
| | | | | | Total Kazakhstan | | | | | | | | | | | | | | | | | | | | | | | 805,912 | |
| | | | | | | | |
| | | | | | Kenya – 0.7% | | | | | | | | | | | | | | | | | | |
| | | | | | | | |
| | 200 | | | | | Kenya Government International Bond, 144A | | | | | | | | | | | 7.000% | | | | 5/22/27 | | | | B+ | | | | 212,819 | |
| | 200 | | | | | Kenya Government International Bond, 144A | | | | | | | | | | | 8.000% | | | | 5/22/32 | | | | B+ | | | | 217,580 | |
| | 200 | | | | | Kenya Government International Bond, Reg S | | | | | | | | | | | 7.000% | | | | 5/22/27 | | | | N/R | | | | 212,537 | |
| | 830 | | | | | Kenya Government International Bond, Reg S | | | | | | | | | | | 8.000% | | | | 5/22/32 | | | | B+ | | | | 900,899 | |
| | | | | | Total Kenya | | | | | | | | | | | | | | | | | | | | | | | 1,543,835 | |
| | | | | | | | |
| | | | | | Lebanon – 0.1% | | | | | | | | | | | | | | | | | | |
| | | | | | | | |
| | 215 | | | | | Lebanon Government International Bond, Reg S | | | | | | | | | | | 6.200% | | | | 2/26/25 | | | | CCC | | | | 94,984 | |
| | 50 | | | | | Lebanon Government International Bond, Reg S | | | | | | | | | | | 6.250% | | | | 6/12/25 | | | | CCC | | | | 22,441 | |
| | 70 | | | | | Lebanon Government International Bond, Reg S | | | | | | | | | | | 6.600% | | | | 11/27/26 | | | | CCC | | | | 31,009 | |
| | 30 | | | | | Lebanon Government International Bond, Reg S | | | | | | | | | | | 6.750% | | | | 11/29/27 | | | | CC | | | | 13,330 | |
| | 25 | | | | | Lebanon Government International Bond, Reg S | | | | | | | | | | | 6.650% | | | | 11/03/28 | | | | CCC | | | | 10,873 | |
| | | | | | Total Lebanon | | | | | | | | | | | | | | | | | | | | | | | 172,637 | |
| | | | | | | | |
| | | | | | Lithuania – 0.1% | | | | | | | | | | | | | | | | | | |
| | | | | | | | |
| | 200 | | | | | Lithuania Government International Bond, Reg S | | | | | | | | | | | 6.625% | | | | 2/01/22 | | | | A | | | | 219,084 | |
| | | | | | | | |
| | | | | | Luxembourg – 0.1% | | | | | | | | | | | | | | | | | | |
| | | | | | | | |
| | 205 | | | | | Atento Luxco 1 SA, 144A | | | | | | | | | | | 6.125% | | | | 8/10/22 | | | | BB | | | | 201,925 | |
| | | | | | | | |
| | | | | | Macedonia – 0.3% | | | | | | | | | | | | | | | | | | |
| | | | | | | | |
| | 515 | | | EUR | | North Macedonia Government International Bond, Reg S | | | | | | | | | | | 3.975% | | | | 7/24/21 | | | | BB+ | | | | 607,926 | |
| | | | | | | | |
| | | | | | Malaysia – 0.1% | | | | | | | | | | | | | | | | | | |
| | | | | | | | |
| | 230 | | | | | Petronas Capital Ltd, Reg S | | | | | | | | | | | 3.500% | | | | 3/18/25 | | | | A2 | | | | 240,862 | |
| | | | | | | | |
| | | | | | Mexico – 1.5% | | | | | | | | | | | | | | | | | | |
| | | | | | | | |
| | 225 | | | | | Mexico City Airport Trust, Reg S | | | | | | | | | | | 4.250% | | | | 10/31/26 | | | | BBB+ | | | | 235,127 | |
| | 597 | | | | | Mexico Government International Bond | | | | | | | | | | | 4.500% | | | | 4/22/29 | | | | A3 | | | | 654,611 | |
| | 185 | | | | | Petroleos Mexicanos | | | | | | | | | | | 6.500% | | | | 3/13/27 | | | | BBB+ | | | | 196,418 | |
| | 55 | | | | | Petroleos Mexicanos | | | | | | | | | | | 5.350% | | | | 2/12/28 | | | | BBB+ | | | | 54,725 | |
25
| | |
| |
| JDD | | Nuveen Diversified Dividend and Income Fund(continued) |
| | Portfolio of Investments December 31, 2019 |
| | | | | | | | | | | | | | | | | | | | | | | | | | | | | | |
Principal
Amount (000) (6) | | | | | Description (1) | | | | | | | | Coupon | | | Maturity | | | Ratings (7) | | | Value | |
| | | | | | | | |
| | | | | | Mexico(continued) | | | | | | | | | | | | | | | | | | |
| | | | | | | | |
| $ | 305 | | | | | Petroleos Mexicanos | | | | | | | | | | | 6.500% | | | | 1/23/29 | | | | BBB+ | | | $ | 320,860 | |
| | 702 | | | | | Petroleos Mexicanos | | | | | | | | | | | 6.750% | | | | 9/21/47 | | | | BBB+ | | | | 703,320 | |
| | 86 | | | | | Petroleos Mexicanos | | | | | | | | | | | 6.350% | | | | 2/12/48 | | | | BBB+ | | | | 82,990 | |
| | 475 | | | | | Petroleos Mexicanos, 144A | | | | | | | | | | | 6.840% | | | | 1/23/30 | | | | BBB+ | | | | 506,512 | |
| | 760 | | | | | Petroleos Mexicanos, 144A | | | | | | | | | | | 7.690% | | | | 1/23/50 | | | | BBB+ | | | | 829,418 | |
| | | | | | Total Mexico | | | | | | | | | | | | | | | | | | | | | | | 3,583,981 | |
| | | | | | | | |
| | | | | | Mongolia – 0.1% | | | | | | | | | | | | | | | | | | |
| | | | | | | | |
| | 275 | | | | | Mongolia Government International Bond, Reg S | | | | | | | | | | | 5.125% | | | | 12/05/22 | | | | B | | | | 281,040 | |
| | | | | | | | |
| | | | | | Morocco – 0.5% | | | | | | | | | | | | | | | | | | |
| | | | | | | | |
| | 310 | | | | | Morocco Government International Bond, Reg S | | | | | | | | | | | 5.500% | | | | 12/11/42 | | | | BBB– | | | | 379,629 | |
| | 410 | | | | | OCP SA, Reg S | | | | | | | | | | | 5.625% | | | | 4/25/24 | | | | BBB– | | | | 452,666 | |
| | 295 | | | | | OCP SA, Reg S | | | | | | | | | | | 4.500% | | | | 10/22/25 | | | | BBB– | | | | 314,901 | |
| | | | | | Total Morocco | | | | | | | | | | | | | | | | | | | | | | | 1,147,196 | |
| | | | | | | | |
| | | | | | Nigeria – 0.5% | | | | | | | | | | | | | | | | | | |
| | | | | | | | |
| | 390 | | | | | Nigeria Government International Bond, Reg S | | | | | | | | | | | 8.747% | | | | 1/21/31 | | | | B+ | | | | 429,273 | |
| | 655 | | | | | Nigeria Government International Bond, Reg S | | | | | | | | | | | 7.875% | | | | 2/16/32 | | | | B+ | | | | 677,306 | |
| | | | | | Total Nigeria | | | | | | | | | | | | | | | | | | | | | | | 1,106,579 | |
| | | | | | | | |
| | | | | | Oman – 0.8% | | | | | | | | | | | | | | | | | | |
| | | | | | | | |
| | 260 | | | | | Oman Government International Bond, 144A | | | | | | | | | | | 3.625% | | | | 6/15/21 | | | | Ba1 | | | | 261,149 | |
| | 200 | | | | | Oman Government International Bond, 144A | | | | | | | | | | | 4.875% | | | | 2/01/25 | | | | Ba1 | | | | 206,774 | |
| | 230 | | | | | Oman Government International Bond, 144A | | | | | | | | | | | 6.000% | | | | 8/01/29 | | | | Ba1 | | | | 240,065 | |
| | 400 | | | | | Oman Government International Bond, 144A | | | | | | | | | | | 6.500% | | | | 3/08/47 | | | | Ba1 | | | | 395,500 | |
| | 305 | | | | | Oman Government International Bond, 144A | | | | | | | | | | | 6.750% | | | | 1/17/48 | | | | Ba1 | | | | 306,347 | |
| | 455 | | | | | Oman Government International Bond, Reg S | | | | | | | | | | | 3.625% | | | | 6/15/21 | | | | Ba1 | | | | 457,010 | |
| | | | | | Total Oman | | | | | | | | | | | | | | | | | | | | | | | 1,866,845 | |
| | | | | | | | |
| | | | | | Panama – 0.9% | | | | | | | | | | | | | | | | | | |
| | | | | | | | |
| | 200 | | | | | Aeropuerto Internacional de Tocumen SA, 144A | | | | | | | | | | | 6.000% | | | | 11/18/48 | | | | BBB+ | | | | 247,752 | |
| | 125 | | | | | Panama Government International Bond | | | | | | | | | | | 7.125% | | | | 1/29/26 | | | | BBB+ | | | | 156,250 | |
| | 505 | | | | | Panama Government International Bond | | | | | | | | | | | 3.160% | | | | 1/23/30 | | | | BBB+ | | | | 520,150 | |
| | 860 | | | | | Panama Government International Bond | | | | | | | | | | | 3.870% | | | | 7/23/60 | | | | BBB+ | | | | 925,790 | |
| | 330 | | | | | Panama Notas del Tesoro, 144A, Reg S | | | | | | | | | | | 3.750% | | | | 4/17/26 | | | | N/R | | | | 347,325 | |
| | | | | | Total Panama | | | | | | | | | | | | | | | | | | | | | | | 2,197,267 | |
| | | | | | | | |
| | | | | | Paraguay – 1.0% | | | | | | | | | | | | | | | | | | |
| | | | | | | | |
| | 795 | | | | | Paraguay Government International Bond, Reg S | | | | | | | | | | | 4.625% | | | | 1/25/23 | | | | Ba1 | | | | 839,520 | |
| | 640 | | | | | Paraguay Government International Bond, Reg S | | | | | | | | | | | 5.000% | | | | 4/15/26 | | | | Ba1 | | | | 707,200 | |
| | 725 | | | | | Paraguay Government International Bond, Reg S | | | | | | | | | | | 6.100% | | | | 8/11/44 | | | | Ba1 | | | | 889,213 | |
| | | | | | Total Paraguay | | | | | | | | | | | | | | | | | | | | | | | 2,435,933 | |
| | | | | | | | |
| | | | | | Peru – 0.3% | | | | | | | | | | | | | | | | | | |
| | | | | | | | |
| | 200 | | | | | Hunt Oil Co of Peru LLC Sucursal Del Peru, Reg S | | | | | | | | | | | 6.375% | | | | 6/01/28 | | | | BBB | | | | 220,250 | |
| | 420 | | | | | Peru LNG Srl, 144A | | | | | | | | | | | 5.375% | | | | 3/22/30 | | | | BBB– | | | | 413,704 | |
| | | | | | Total Peru | | | | | | | | | | | | | | | | | | | | | | | 633,954 | |
| | | | | | | | |
| | | | | | Qatar – 1.2% | | | | | | | | | | | | | | | | | | |
| | | | | | | | |
| | 540 | | | | | Qatar Government International Bond, 144A | | | | | | | | | | | 4.000% | | | | 3/14/29 | | | | AA– | | | | 602,642 | |
| | 825 | | | | | Qatar Government International Bond, 144A | | | | | | | | | | | 5.103% | | | | 4/23/48 | | | | AA– | | | | 1,059,378 | |
| | 355 | | | | | Qatar Government International Bond, Reg S | | | | | | | | | | | 4.500% | | | | 4/23/28 | | | | AA– | | | | 405,725 | |
| | 455 | | | | | Qatar Government International Bond, Reg S | | | | | | | | | | | 4.625% | | | | 6/02/46 | | | | AA– | | | | 551,757 | |
| | 200 | | | | | Qatar Government International Bond, Reg S | | | | | | | | | | | 4.817% | | | | 3/14/49 | | | | AA– | | | | 247,500 | |
| | | | | | Total Qatar | | | | | | | | | | | | | | | | | | | | | | | 2,867,002 | |
| | | | | | | | |
| | | | | | Romania – 0.7% | | | | | | | | | | | | | | | | | | |
| | | | | | | | |
| | 275 | | | EUR | | Romanian Government International Bond, 144A | | | | | | | | | | | 2.124% | | | | 7/16/31 | | | | BBB– | | | | 314,432 | |
| | 60 | | | EUR | | Romanian Government International Bond, Reg S | | | | | | | | | | | 2.124% | | | | 7/16/31 | | | | BBB– | | | | 68,603 | |
| | 45 | | | EUR | | Romanian Government International Bond, Reg S | | | | | | | | | | | 3.875% | | | | 10/29/35 | | | | BBB– | | | | 58,483 | |
| | 75 | | | EUR | | Romanian Government International Bond, Reg S | | | | | | | | | | | 3.375% | | | | 2/08/38 | | | | BBB– | | | | 91,489 | |
26
| | | | | | | | | | | | | | | | | | | | | | | | | | | | | | |
Principal
Amount (000) (6) | | | | | Description (1) | | | | | | | | Coupon | | | Maturity | | | Ratings (7) | | | Value | |
| | | | | | | | |
| | | | | | Romania(continued) | | | | | | | | | | | | | | | | | | |
| | | | | | | | |
| $ | 196 | | | | | Romanian Government International Bond, Reg S | | | | | | | | | | | 6.125% | | | | 1/22/44 | | | | BBB– | | | $ | 253,641 | |
| | 800 | | | | | Romanian Government International Bond, Reg S | | | | | | | | | | | 5.125% | | | | 6/15/48 | | | | BBB– | | | | 915,225 | |
| | | | | | Total Romania | | | | | | | | | | | | | | | | | | | | | | | 1,701,873 | |
| | | | | | | | |
| | | | | | Russia – 3.0% | | | | | | | | | | | | | | | | | | |
| | | | | | | | |
| | 25,890 | | | RUB | | Russian Federal Bond – OFZ | | | | | | | | | | | 7.950% | | | | 10/07/26 | | | | N/R | | | | 459,057 | |
| | 14,035 | | | RUB | | Russian Federal Bond – OFZ | | | | | | | | | | | 6.900% | | | | 5/23/29 | | | | BBB | | | | 238,347 | |
| | 800 | | | | | Russian Foreign Bond – Eurobond, 144A | | | | | | | | | | | 4.375% | | | | 3/21/29 | | | | BBB | | | | 887,447 | |
| | 600 | | | | | Russian Foreign Bond – Eurobond, 144A | | | | | | | | | | | 4.250% | | | | 6/23/27 | | | | BBB | | | | 653,620 | |
| | 600 | | | | | Russian Foreign Bond – Eurobond, 144A | | | | | | | | | | | 5.100% | | | | 3/28/35 | | | | BBB | | | | 715,556 | |
| | 600 | | | | | Russian Foreign Bond – Eurobond, Reg S | | | | | | | | | | | 4.750% | | | | 5/27/26 | | | | BBB | | | | 668,496 | |
| | 1,800 | | | | | Russian Foreign Bond – Eurobond, Reg S | | | | | | | | | | | 4.250% | | | | 6/23/27 | | | | BBB | | | | 1,964,063 | |
| | 600 | | | | | Russian Foreign Bond – Eurobond, Reg S | | | | | | | | | | | 4.375% | | | | 3/21/29 | | | | BBB | | | | 665,585 | |
| | 400 | | | | | Russian Foreign Bond – Eurobond, Reg S | | | | | | | | | | | 5.100% | | | | 3/28/35 | | | | BBB | | | | 477,038 | |
| | 200 | | | | | Russian Foreign Bond – Eurobond, Reg S | | | | | | | | | | | 5.625% | | | | 4/04/42 | | | | BBB | | | | 261,600 | |
| | | | | | Total Russia | | | | | | | | | | | | | | | | | | | | | | | 6,990,809 | |
| | | | | | | | |
| | | | | | Saudi Arabia – 0.7% | | | | | | | | | | | | | | | | | | |
| | | | | | | | |
| | 340 | | | | | Saudi Arabian Oil Co, 144A | | | | | | | | | | | 2.750% | | | | 4/16/22 | | | | A1 | | | | 343,663 | |
| | 225 | | | | | Saudi Arabian Oil Co, Reg S | | | | | | | | | | | 4.250% | | | | 4/16/39 | | | | A | | | | 240,426 | |
| | 200 | | | | | Saudi Government International Bond, Reg S | | | | | | | | | | | 3.625% | | | | 3/04/28 | | | | A1 | | | | 211,089 | |
| | 545 | | | | | Saudi Government International Bond, Reg S | | | | | | | | | | | 4.500% | | | | 10/26/46 | | | | A1 | | | | 603,374 | |
| | 200 | | | | | Saudi Government International Bond, Reg S | | | | | | | | | | | 4.625% | | | | 10/04/47 | | | | A1 | | | | 225,000 | |
| | | | | | Total Saudi Arabia | | | | | | | | | | | | | | | | | | | | | | | 1,623,552 | |
| | | | | | | | |
| | | | | | Senegal – 0.6% | | | | | | | | | | | | | | | | | | |
| | | | | | | | |
| | 200 | | | | | Senegal Government International Bond, 144A | | | | | | | | | | | 6.750% | | | | 3/13/48 | | | | Ba3 | | | | 201,066 | |
| | 200 | | | | | Senegal Government International Bond, Reg S | | | | | | | | | | | 8.750% | | | | 5/13/21 | | | | Ba3 | | | | 216,407 | |
| | 365 | | | | | Senegal Government International Bond, Reg S | | | | | | | | | | | 6.250% | | | | 7/30/24 | | | | Ba3 | | | | 403,299 | |
| | 615 | | | | | Senegal Government International Bond, Reg S | | | | | | | | | | | 6.750% | | | | 3/13/48 | | | | Ba3 | | | | 615,556 | |
| | | | | | Total Senegal | | | | | | | | | | | | | | | | | | | | | | | 1,436,328 | |
| | | | | | | | |
| | | | | | Serbia – 0.2% | | | | | | | | | | | | | | | | | | |
| | | | | | | | |
| | 150 | | | EUR | | Serbia International Bond, 144A | | | | | | | | | | | 1.500% | | | | 6/26/29 | | | | BB+ | | | | 170,832 | |
| | 220 | | | | | Serbia International Bond, Reg S | | | | | | | | | | | 7.250% | | | | 9/28/21 | | | | BB+ | | | | 239,712 | |
| | | | | | Total Serbia | | | | | | | | | | | | | | | | | | | | | | | 410,544 | |
| | | | | | | | |
| | | | | | South Africa – 0.4% | | | | | | | | | | | | | | | | | | |
| | | | | | | | |
| | 200 | | | | | Eskom Holdings SOC Ltd, Reg S | | | | | | | | | | | 5.750% | | | | 1/26/21 | | | | CCC+ | | | | 200,250 | |
| | 270 | | | | | Eskom Holdings SOC Ltd, Reg S | | | | | | | | | | | 6.750% | | | | 8/06/23 | | | | CCC+ | | | | 274,634 | |
| | 420 | | | | | Republic of South Africa Government International Bond | | | | | | | | | | | 5.750% | | | | 9/30/49 | | | | Baa3 | | | | 409,047 | |
| | | | | | Total South Africa | | | | | | | | | | | | | | | | | | | | | | | 883,931 | |
| | | | | | | | |
| | | | | | Sri Lanka – 0.8% | | | | | | | | | | | | | | | | | | |
| | | | | | | | |
| | 335 | | | | | Sri Lanka Government International Bond, 144A | | | | | | | | | | | 6.200% | | | | 5/11/27 | | | | B | | | | 314,028 | |
| | 395 | | | | | Sri Lanka Government International Bond, Reg S | | | | | | | | | | | 6.250% | | | | 7/27/21 | | | | B | | | | 401,518 | |
| | 415 | | | | | Sri Lanka Government International Bond, Reg S | | | | | | | | | | | 6.850% | | | | 11/03/25 | | | | B | | | | 414,966 | |
| | 200 | | | | | Sri Lanka Government International Bond, Reg S | | | | | | | | | | | 6.825% | | | | 7/18/26 | | | | B | | | | 197,487 | |
| | 465 | | | | | Sri Lanka Government International Bond, Reg S | | | | | | | | | | | 6.200% | | | | 5/11/27 | | | | B | | | | 435,890 | |
| | | | | | Total Sri Lanka | | | | | | | | | | | | | | | | | | | | | | | 1,763,889 | |
| | | | | | | | |
| | | | | | Tunisia – 0.2% | | | | | | | | | | | | | | | | | | |
| | | | | | | | |
| | 105 | | | EUR | | Banque Centrale de Tunisie International Bond, 144A | | | | | | | | | | | 6.750% | | | | 10/31/23 | | | | B+ | | | | 121,612 | |
| | 475 | | | | | Banque Centrale de Tunisie International Bond, Reg S | | | | | | | | | | | 5.750% | | | | 1/30/25 | | | | B+ | | | | 442,796 | |
| | | | | | Total Tunisia | | | | | | | | | | | | | | | | | | | | | | | 564,408 | |
| | | | | | | | |
| | | | | | Turkey – 1.2% | | | | | | | | | | | | | | | | | | |
| | | | | | | | |
| | 200 | | | | | Export Credit Bank of Turkey, 144A | | | | | | | | | | | 8.250% | | | | 1/24/24 | | | | B+ | | | | 217,480 | |
| | 870 | | | | | Turkey Government International Bond | | | | | | | | | | | 7.000% | | | | 6/05/20 | | | | BB– | | | | 885,982 | |
| | 415 | | | | | Turkey Government International Bond | | | | | | | | | | | 3.250% | | | | 3/23/23 | | | | BB– | | | | 398,379 | |
| | 260 | | | | | Turkey Government International Bond | | | | | | | | | | | 4.875% | | | | 10/09/26 | | | | BB– | | | | 248,139 | |
| | 250 | | | | | Turkey Government International Bond | | | | | | | | | | | 6.000% | | | | 3/25/27 | | | | BB– | | | | 253,272 | |
27
| | |
| |
| JDD | | Nuveen Diversified Dividend and Income Fund(continued) |
| | Portfolio of Investments December 31, 2019 |
| | | | | | | | | | | | | | | | | | | | | | | | | | | | | | |
Principal
Amount (000) (6) | | | | | Description (1) | | | | | | | | Coupon | | | Maturity | | | Ratings (7) | | | Value | |
| | | | | | | | |
| | | | | | Turkey(continued) | | | | | | | | | | | | | | | | | | |
| | | | | | | | |
| $ | 475 | | | | | Turkey Government International Bond | | | | | | | | | | | 5.125% | | | | 2/17/28 | | | | BB– | | | $ | 454,458 | |
| | 295 | | | | | Turkey Government International Bond | | | | | | | | | | | 5.750% | | | | 5/11/47 | | | | BB– | | | | 261,181 | |
| | | | | | Total Turkey | | | | | | | | | | | | | | | | | | | | | | | 2,718,891 | |
| | | | | | | | |
| | | | | | Ukraine – 1.0% | | | | | | | | | | | | | | | | | | |
| | | | | | | | |
| | 210 | | | | | Metinvest BV, 144A | | | | | | | | | | | 7.750% | | | | 10/17/29 | | | | BB– | | | | 214,559 | |
| | 200 | | | | | NAK Naftogaz Ukraine via Kondor Finance PLC, 144A | | | | 7.625% | | | | 11/08/26 | | | | B | | | | 203,999 | |
| | 100 | | | | | Ukraine Government International Bond, 144A | | | | | | | | 7.750% | | | | 9/01/27 | | | | B | | | | 109,458 | |
| | 643 | | | | | Ukraine Government International Bond, 144A | | | | | | | | 7.375% | | | | 9/25/32 | | | | B | | | | 685,556 | |
| | 315 | | | | | Ukraine Government International Bond, Reg S | | | | | | | | 7.750% | | | | 9/01/22 | | | | B | | | | 339,050 | |
| | 100 | | | | | Ukraine Government International Bond, Reg S | | | | | | | | 7.750% | | | | 9/01/25 | | | | B | | | | 109,074 | |
| | 245 | | | | | Ukraine Government International Bond, Reg S | | | | | | | | 7.750% | | | | 9/01/26 | | | | B | | | | 267,702 | |
| | 455 | | | | | Ukraine Government International Bond, Reg S | | | | | | | | 7.375% | | | | 9/25/32 | | | | B | | | | 483,896 | |
| | | | | | Total Ukraine | | | | | | | | | | | | | | | | | | | | | | | 2,413,294 | |
| | | | | | | | |
| | | | | | United Arab Emirates – 1.4% | | | | | | | | | | | | | | | | | | |
| | | | | | | |
| | 430 | | | | | Abu Dhabi Government International Bond, 144A | | | | | | | | 2.125% | | | | 9/30/24 | | | | AA | | | | 428,516 | |
| | 1,305 | | | | | Abu Dhabi Government International Bond, 144A | | | | | | | | 3.125% | | | | 9/30/49 | | | | AA | | | | 1,272,375 | |
| | 425 | | | | | Abu Dhabi Government International Bond, Reg S | | | | | | | | 3.125% | | | | 5/03/26 | | | | AA | | | | 442,046 | |
| | 200 | | | | | Abu Dhabi National Energy Co PJSC, 144A | | | | | | | | 4.875% | | | | 4/23/30 | | | | A | | | | 228,315 | |
| | 360 | | | | | Abu Dhabi National Energy Co PJSC, Reg S | | | | | | | | 4.375% | | | | 6/22/26 | | | | A | | | | 391,050 | |
| | 200 | | | | | Abu Dhabi National Energy Co PJSC, Reg S | | | | | | | | 4.875% | | | | 4/23/30 | | | | A | | | | 228,323 | |
| | 200 | | | | | Oztel Holdings SPC Ltd, 144A | | | | | | | | 6.625% | | | | 4/24/28 | | | | Ba1 | | | | 212,250 | |
| | | | | | Total United Arab Emirates | | | | | | | | | | | | | | | | | | | | | | | 3,202,875 | |
| | | | | | | | |
| | | | | | Venezuela – 0.1% | | | | | | | | | | | | | | | | | | |
| | | | | | | | |
| | 1,877 | | | | | Petroleos de Venezuela SA, Reg S, (8) | | | | | | | | | | | 6.000% | | | | 11/15/26 | | | | N/R | | | | 145,448 | |
| | 360 | | | | | Venezuela Government International Bond, Reg S, (8) | | | | | | | | 9.000% | | | | 5/07/23 | | | | C | | | | 41,400 | |
| | 1,040 | | | | | Venezuela Government International Bond, Reg S, (8) | | | | | | | | 9.250% | | | | 5/07/28 | | | | C | | | | 119,600 | |
| | | | | | Total Venezuela | | | | | | | | | | | | | | | | | | | | | | | 306,448 | |
| | | | | | | | |
| | | | | | Vietnam – 0.1% | | | | | | | | | | | | | | | | | | |
| | | | | | | | |
| | 250 | | | | | Mong Duong Finance Holdings BV, 144A | | | | | | | | | | | 5.125% | | | | 5/07/29 | | | | BB | | | | 255,626 | |
| | | | | | | | |
| | | | | | Zambia – 0.1% | | | | | | | | | | | | | | | | | | |
| | | | | | |
| | 325 | | | | | Zambia Government International Bond, Reg S | | | | 8.970% | | | | 7/30/27 | | | | CCC+ | | | | 222,763 | |
| | | | | | Total Emerging Market Debt and Foreign Corporate Bonds (cost $79,090,768) | | | | | | | | | | | | 81,336,628 | |
| | | | | | | | |
Principal
Amount (000) | | | | | Description (1) | | Coupon (9) | | | Reference
Rate (9) | | | Spread (9) | | | Maturity (10) | | | Ratings (7) | | | Value | |
| | | | |
| | | | | | VARIABLE RATE SENIOR LOAN INTERESTS – 29.4% (20.6% of Total Investments) (9) | | | | | | | | | |
| | | | | | | | |
| | | | | | Aerospace & Defense – 0.2% | | | | | | | | | | | | | | | | | | |
| | | | | | | | |
| $ | 483 | | | | | Transdigm, Inc., Term Loan F | | | 4.299% | | | | 1-Month LIBOR | | | | 2.500% | | | | 6/09/23 | | | | Ba3 | | | $ | 485,047 | |
| | | | | | | | |
| | | | | | Airlines – 1.0% | | | | | | | | | | | | | | | | | | |
| | | | | | | | |
| | 428 | | | | | American Airlines, Inc., Term Loan 2025 | | | 3.542% | | | | 1-Month LIBOR | | | | 1.750% | | | | 6/27/25 | | | | BB+ | | | | 429,609 | |
| | 1,940 | | | | | American Airlines, Inc., Term Loan B | | | 3.805% | | | | 1-Month LIBOR | | | | 2.000% | | | | 4/28/23 | | | | BB+ | | | | 1,947,828 | |
| | 2,368 | | | | | Total Airlines | | | | | | | | | | | | | | | | | | | | | | | 2,377,437 | |
| | | | | | | | |
| | | | | | Auto Components – 0.1% | | | | | | | | | | | | | | | | | | |
| | | | | | | | |
| | 299 | | | | | Johnson Controls Inc., Term Loan B | | | 5.305% | | | | 1-Month LIBOR | | | | 3.500% | | | | 4/30/26 | | | | Ba3 | | | | 300,841 | |
| | | | | | | | |
| | | | | | Beverages – 0.2% | | | | | | | | | | | | | | | | | | |
| | | | | | | | |
| | 418 | | | | | Jacobs Douwe Egberts, Term Loan B | | | 3.750% | | | | 1-Month LIBOR | | | | 2.000% | | | | 11/01/25 | | | | Ba1 | | | | 420,293 | |
| | | | | | | | |
| | | | | | Biotechnology – 0.3% | | | | | | | | | | | | | | | | | | |
| | | | | | | | |
| | 625 | | | | | Grifols, Inc., Term Loan B, First Lien | | | 3.740% | | | | 1-Month LIBOR | | | | 2.000% | | | | 11/15/27 | | | | BB+ | | | | 631,087 | |
| | | | | | | | |
| | | | | | Building Products – 0.5% | | | | | | | | | | | | | | | | | | |
| | | | | | | | |
| | 232 | | | | | Advanced Drainage Systems, Term Loan B | | | 4.000% | | | | 1-Month LIBOR | | | | 2.250% | | | | 7/31/26 | | | | Ba1 | | | | 234,658 | |
28
| | | | | | | | | | | | | | | | | | | | | | | | | | | | | | |
Principal
Amount (000) | | | | | Description (1) | | Coupon (9) | | | Reference
Rate (9) | | | Spread (9) | | | Maturity (10) | | | Ratings (7) | | | Value | |
| | | | | | | | |
| | | | | | Building Products(continued) | | | | | | | | | | | | | | | | | | |
| | | | | | | | |
| $ | 87 | | | | | Fairmount, Initial Term Loan | | | 6.043% | | | | 3-Month LIBOR | | | | 4.000% | | | | 6/01/25 | | | | BB– | | | $ | 67,576 | |
| | 865 | | | | | Quikrete Holdings, Inc., Term Loan B | | | 4.549% | | | | 1-Month LIBOR | | | | 2.750% | | | | 11/15/23 | | | | BB– | | | | 869,667 | |
| | 1,184 | | | | | Total Building Products | | | | | | | | | | | | | | | | | | | | | | | 1,171,901 | |
| | | | | | | | |
| | | | | | Capital Markets – 0.5% | | | | | | | | | | | | | | | | | | |
| | | | | | | | |
| | 330 | | | | | Capital Automotive LP, Term Loan, First Lien | | | 4.300% | | | | 1-Month LIBOR | | | | 2.500% | | | | 3/25/24 | | | | B1 | | | | 331,103 | |
| | 481 | | | | | Lions Gate Entertainment Corporation, Term Loan A | | | 3.549% | | | | 1-Month LIBOR | | | | 1.750% | | | | 3/22/23 | | | | Ba2 | | | | 478,242 | |
| | 460 | | | | | RPI Finance Trust, Term Loan B6 | | | 3.799% | | | | 1-Month LIBOR | | | | 2.000% | | | | 3/27/23 | | | | BBB– | | | | 464,233 | |
| | 1,271 | | | | | Total Capital Markets | | | | | | | | | | | | | | | | 1,273,578 | |
| | | | | | | | |
| | | | | | Chemicals – 0.5% | | | | | | | | | | | | | | | | | | |
| | | | | | | | |
| | 643 | | | | | Axalta Coating Systems, Term Loan, First Lien | | | 3.695% | | | | 3-Month LIBOR | | | | 1.750% | | | | 6/01/24 | | | | BBB– | | | | 645,830 | |
| | 390 | | | | | H.B. Fuller Company, Term Loan B | | | 3.765% | | | | 1-Month LIBOR | | | | 2.000% | | | | 10/22/24 | | | | BB+ | | | | 391,492 | |
| | 118 | | | | | Mineral Technologies, Inc., Term Loan B2 | | | 4.750% | | | | N/A | | | | N/A | | | | 5/07/21 | | | | BB+ | | | | 118,589 | |
| | 1,151 | | | | | Total Chemicals | | | | | | | | | | | | | | | | | | | | | | | 1,155,911 | |
| | | | | | | | |
| | | | | | Commercial Services & Supplies – 1.1% | | | | | | | | | | | | | | | | | | |
| | | | | | | | |
| | 691 | | | | | ADS Waste Holdings, Inc., Term Loan B | | | 3.853% | | | | 1-Week LIBOR | | | | 2.250% | | | | 11/10/23 | | | | BB+ | | | | 694,497 | |
| | 75 | | | | | Brand Energy & Infrastructure Services, Inc., Term Loan B, First Lien | | | 6.235% | | | | 3-Month LIBOR | | | | 4.250% | | | | 6/21/24 | | | | B– | | | | 75,060 | |
| | 1,037 | | | | | Formula One Group, Term Loan B | | | 4.299% | | | | 1-Month LIBOR | | | | 2.500% | | | | 2/01/24 | | | | B+ | | | | 1,043,679 | |
| | 499 | | | | | GFL Environmental, Term Loan, (WI/DD) | | | TBD | | | | TBD | | | | TBD | | | | TBD | | | | B+ | | | | 500,380 | |
| | 100 | | | | | Sabert Corporation, Initial Term Loan | | | 6.250% | | | | 1-Month LIBOR | | | | 4.500% | | | | 12/10/26 | | | | B | | | | 101,042 | |
| | 216 | | | | | Trans Union LLC, Term Loan B5 | | | 3.549% | | | | 1-Month LIBOR | | | | 1.750% | | | | 11/16/26 | | | | BB+ | | | | 217,283 | |
| | 42 | | | | | West Corporation, Incremental Term Loan B1 | | | 5.427% | | | | 3-Month LIBOR | | | | 3.500% | | | | 10/10/24 | | | | B2 | | | | 35,462 | |
| | 2,660 | | | | | Total Commercial Services & Supplies | | | | | | | | | | | | | | | | | | | | | | | 2,667,403 | |
| | | | | | | | |
| | | | | | Communications Equipment – 0.8% | | | | | | | | | | | | | | | | | | |
| | | | | | | | |
| | 457 | | | | | Avaya, Inc., Term Loan B | | | 5.990% | | | | 1-Month LIBOR | | | | 4.250% | | | | 12/15/24 | | | | B | | | | 449,314 | |
| | 396 | | | | | CommScope, Inc., Term Loan B | | | 5.049% | | | | 1-Month LIBOR | | | | 3.250% | | | | 4/06/26 | | | | Ba3 | | | | 399,309 | |
| | 508 | | | | | Plantronics, Term Loan B | | | 4.299% | | | | 1-Month LIBOR | | | | 2.500% | | | | 7/02/25 | | | | Ba1 | | | | 498,732 | |
| | 527 | | | | | Univision Communications, Inc., Term Loan C5 | | | 4.549% | | | | 1-Month LIBOR | | | | 2.750% | | | | 3/15/24 | | | | B | | | | 521,644 | |
| | 1,888 | | | | | Total Communications Equipment | | | | | | | | | | | | | | | | | | | | | | | 1,868,999 | |
| | | | | | | | |
| | | | | | Consumer Finance – 0.2% | | | | | | | | | | | | | | | | | | |
| | | | | | | | |
| | 367 | | | | | Verscend Technologies, Tern Loan B | | | 6.299% | | | | 1-Month LIBOR | | | | 4.500% | | | | 8/27/25 | | | | B+ | | | | 370,278 | |
| | | | | | | | |
| | | | | | Containers & Packaging – 0.2% | | | | | | | | | | | | | | | | | | |
| | | | | | | | |
| | 349 | | | | | Berry Global, Inc., Term Loan W | | | 3.715% | | | | 1-Month LIBOR | | | | 2.000% | | | | 10/01/22 | | | | BBB– | | | | 351,106 | |
| | | | | | | | |
| | | | | | Distributors – 0.2% | | | | | | | | | | | | | | | | | | |
| | | | | | | | |
| | 385 | | | | | SRS Distribution, Inc., Term Loan B | | | 5.049% | | | | 1-Month LIBOR | | | | 3.250% | | | | 5/23/25 | | | | B3 | | | | 382,853 | |
| | | | | | |
| | | | | | Diversified Consumer Services – 0.2% | | | | | | | | | | | | | |
| | | | | | | | |
| | 495 | | | | | Refinitiv, Term Loan B | | | 5.049% | | | | 1-Month LIBOR | | | | 3.250% | | | | 10/19/25 | | | | B | | | | 499,826 | |
| | | | | | | | |
| | | | | | Diversified Financial Services – 0.6% | | | | | | | | | | | | | | | | | | |
| | | | | | | | |
| | 323 | | | | | Ditech Holding Corp., Term Loan, (8) | | | 0.000% | | | | N/A | | | | N/A | | | | 6/30/22 | | | | D | | | | 133,763 | |
| | 236 | | | | | Fly Funding II S.a r.l., Replacement Term Loan | | | 3.650% | | | | 3-Month LIBOR | | | | 1.750% | | | | 8/09/25 | | | | BBB– | | | | 237,003 | |
| | 500 | | | | | Genesee & Wyoming Inc., Term Loan, First Lien | | | 3.906% | | | | 3-Month LIBOR | | | | 2.000% | | | | 11/06/26 | | | | BB | | | | 505,445 | |
| | 169 | | | | | Lions Gate Entertainment Corp., Term Loan B | | | 4.049% | | | | 1-Month LIBOR | | | | 2.250% | | | | 3/24/25 | | | | Ba2 | | | | 168,948 | |
| | 299 | | | | | Travelport LLC, Term Loan B | | | 6.945% | | | | 3-Month LIBOR | | | | 5.000% | | | | 5/29/26 | | | | B+ | | | | 280,697 | |
| | 1,527 | | | | | Total Diversified Financial Services | | | | | | | | | | | | | | | | | | | | | | | 1,325,856 | |
| | | | | | |
| | | | | | Diversified Telecommunication Services – 1.6% | | | | | | | | | | | | | |
| | | | | | | | |
| | 1,200 | | | | | CenturyLink, Inc., Term Loan B | | | 4.549% | | | | 1-Month LIBOR | | | | 2.750% | | | | 1/31/25 | | | | BBB– | | | | 1,206,750 | |
| | 756 | | | | | Frontier Communications Corporation, Term Loan B | | | 5.550% | | | | 1-Month LIBOR | | | | 3.750% | | | | 1/14/22 | | | | B3 | | | | 761,427 | |
| | 79 | | | | | Intelsat Jackson Holdings, S.A., Term Loan B4 | | | 6.432% | | | | 6-Month LIBOR | | | | 4.500% | | | | 1/02/24 | | | | B1 | | | | 79,186 | |
| | | | | | | | |
| | 125 | | | | | Intelsat Jackson Holdings, S.A., Term Loan B5 | | | 6.625% | | | | N/A | | | | N/A | | | | 1/02/24 | | | | B1 | | | | 127,257 | |
29
| | |
| |
| JDD | | Nuveen Diversified Dividend and Income Fund(continued) |
| | Portfolio of Investments December 31, 2019 |
| | | | | | | | | | | | | | | | | | | | | | | | | | | | | | |
Principal
Amount (000) | | | | | Description (1) | | Coupon (9) | | | Reference
Rate (9) | | | Spread (9) | | | Maturity (10) | | | Ratings (7) | | | Value | |
| | | | | | |
| | | | | | Diversified Telecommunication Services(continued) | | | | | | | | | | | | | |
| | | | | | | | |
| $ | 495 | | | | | Numericable Group S.A., Term Loan B13 | | | 5.740% | | | | 1-Month LIBOR | | | | 4.000% | | | | 8/14/26 | | | | B | | | $ | 496,908 | |
| | 1,000 | | | | | Ziggo B.V., Term Loan E | | | 4.240% | | | | 1-Month LIBOR | | | | 2.500% | | | | 4/15/25 | | | | B+ | | | | 1,004,630 | |
| | 3,655 | | | | | Total Diversified Telecommunication Services | | | | | | | | | | | | | | | | 3,676,158 | |
| | | | | | | | |
| | | | | | Electric Utilities – 0.3% | | | | | | | | | | | | | | | | | | |
| | | | | | | | |
| | 606 | | | | | Vistra Operations Co., Term Loan B3 | | | 3.537% | | | | 1-Month LIBOR | | | | 1.750% | | | | 12/13/25 | | | | BBB– | | | | 610,497 | |
| | | | | | | | |
| | | | | | Entertainment – 0.2% | | | | | | | | | | | | | | | | | | |
| | | | | | | | |
| | 499 | | | | | AMC Entertainment, Inc., Term Loan B | | | 4.800% | | | | 1-Month LIBOR | | | | 3.000% | | | | 4/22/26 | | | | Ba2 | | | | 503,375 | |
| | | | | | |
| | | | | | Equity Real Estate Investment Trust – 0.5% | | | | | | | | | | | | | |
| | | | | | | | |
| | 553 | | | | | Communications Sales & Leasing, Inc., Shortfall Term Loan | | | 6.799% | | | | 1-Month LIBOR | | | | 5.000% | | | | 10/24/22 | | | | Caa1 | | | | 544,737 | |
| | 529 | | | | | MGM Growth Properties, Term Loan B | | | 3.799% | | | | 1-Month LIBOR | | | | 2.000% | | | | 3/21/25 | | | | BB+ | | | | 532,022 | |
| | 1,082 | | | | | Total Equity Real Estate Investment Trust | | | | | | | | | | | | | | | | 1,076,759 | |
| | | | | | | | |
| | | | | | Food & Staples Retailing – 1.2% | | | | | | | | | | | | | | | | | | |
| | | | | | | | |
| | 520 | | | | | Albertson’s LLC, Term Loan B7 | | | 4.549% | | | | 1-Month LIBOR | | | | 2.750% | | | | 11/17/25 | | | | BB | | | | 525,483 | |
| | 2,258 | | | | | US Foods, Inc., New Term Loan | | | 3.549% | | | | 1-Month LIBOR | | | | 1.750% | | | | 6/27/23 | | | | BB+ | | | | 2,269,099 | |
| | 2,778 | | | | | Total Food & Staples Retailing | | | | | | | | | | | | | | | | | | | | | | | 2,794,582 | |
| | | | | | | | |
| | | | | | Food Products – 0.1% | | | | | | | | | | | | | | | | | | |
| | | | | | | | |
| | 249 | | | | | B&G Foods Inc., Term Loan, First Lien | | | 4.299% | | | | 1-Month LIBOR | | | | 2.500% | | | | 10/10/26 | | | | BB | | | | 251,869 | |
| | | | | | |
| | | | | | Health Care Providers & Services – 2.0% | | | | | | | | | | | | | |
| | | | | | | | |
| | 759 | | | | | Acadia Healthcare, Inc., Term Loan B3 | | | 4.299% | | | | 1-Month LIBOR | | | | 2.500% | | | | 2/11/22 | | | | Ba2 | | | | 762,138 | |
| | 60 | | | | | Air Medical Group Holdings, Inc., Term Loan B | | | 5.035% | | | | 1-Month LIBOR | | | | 3.250% | | | | 4/28/22 | | | | B1 | | | | 59,204 | |
| | 230 | | | | | Brightspring Health, Term Loan B | | | 6.210% | | | | 1-Month LIBOR | | | | 4.500% | | | | 3/05/26 | | | | B1 | | | | 231,753 | |
| | 542 | | | | | HCA, Inc., Term Loan B13 | | | 3.549% | | | | 1-Month LIBOR | | | | 1.750% | | | | 3/18/26 | | | | BBB– | | | | 546,111 | |
| | 1,218 | | | | | HCA, Inc., Term Loan B12 | | | 3.549% | | | | 1-Month LIBOR | | | | 1.750% | | | | 3/13/25 | | | | BBB– | | | | 1,225,833 | |
| | 250 | | | | | Lifepoint Health, Inc., Term Loan | | | 6.299% | | | | 1-Month LIBOR | | | | 4.500% | | | | 11/16/25 | | | | B+ | | | | 251,710 | |
| | 219 | | | | | Millennium Laboratories, Inc., Term Loan B, First Lien | | | 8.299% | | | | 1-Month LIBOR | | | | 6.500% | | | | 12/21/20 | | | | Caa3 | | | | 107,922 | |
| | 1,404 | | | | | Select Medical Corporation, Term Loan B | | | 4.580% | | | | 3-Month LIBOR | | | | 2.500% | | | | 3/06/25 | | | | Ba2 | | | | 1,408,613 | |
| | 4,682 | | | | | Total Health Care Providers & Services | | | | | | | | | | | | | | | | | | | | | | | 4,593,284 | |
| | | | | | | | |
| | | | | | Health Care Technology – 0.5% | | | | | | | | | | | | | | | | | | |
| | | | | | | | |
| | 1,006 | | | | | Emdeon, Inc., Term Loan | | | 4.299% | | | | 1-Month LIBOR | | | | 2.500% | | | | 3/01/24 | | | | B+ | | | | 1,010,796 | |
| | 250 | | | | | Zelis, Term Loan B | | | 6.549% | | | | 1-Month LIBOR | | | | 4.750% | | | | 9/30/26 | | | | B | | | | 251,694 | |
| | 1,256 | | | | | Total Health Care Technology | | | | | | | | | | | | | | | | | | | | | | | 1,262,490 | |
| | | | | | | | |
| | | | | | Hotels, Restaurants & Leisure – 3.4% | | | | | | | | | | | | | | | | | | |
| | | | | | | | |
| | 1,011 | | | | | 24 Hour Fitness Worldwide, Inc., Term Loan B | | | 5.299% | | | | 1-Month LIBOR | | | | 3.500% | | | | 5/30/25 | | | | B | | | | 770,891 | |
| | 466 | | | | | Aramark Corporation, Term Loan | | | 3.549% | | | | 1-Month LIBOR | | | | 1.750% | | | | 3/11/25 | | | | BBB– | | | | 468,954 | |
| | 1,748 | | | | | Burger King Corporation, Term Loan B4, (DD1) | | | 3.549% | | | | 1-Month LIBOR | | | | 1.750% | | | | 11/19/26 | | | | BB+ | | | | 1,751,402 | |
| | 542 | | | | | Caesars Entertainment Operating Company, Inc., Term Loan B | | | 3.799% | | | | 1-Month LIBOR | | | | 2.000% | | | | 10/06/24 | | | | BB | | | | 546,592 | |
| | 1,008 | | | | | Caesars Resort Collection, Term Loan, First Lien | | | 4.549% | | | | 1-Month LIBOR | | | | 2.750% | | | | 12/23/24 | | | | BB | | | | 1,011,230 | |
| | 497 | | | | | Carrols Restaurant Group Inc., Term Loan B | | | 5.050% | | | | 1-Month LIBOR | | | | 3.250% | | | | 4/30/26 | | | | B | | | | 491,334 | |
| | 853 | | | | | Hilton Hotels, Term Loan B2 | | | 3.542% | | | | 1-Month LIBOR | | | | 1.750% | | | | 6/22/26 | | | | BBB– | | | | 859,388 | |
| | 496 | | | | | Marriott Ownership Resorts, Inc., Term Loan B | | | 3.549% | | | | 1-Month LIBOR | | | | 1.750% | | | | 8/29/25 | | | | BBB– | | | | 499,972 | |
| | 220 | | | | | PCI Gaming, Term Loan, First Lien, (WI/DD) | | | TBD | | | | TBD | | | | TBD | | | | TBD | | | | BB+ | | | | 221,374 | |
| | 767 | | | | | Seaworld Parks and Entertainment, Inc., Term Loan B5 | | | 4.799% | | | | 1-Month LIBOR | | | | 3.000% | | | | 4/01/24 | | | | B+ | | | | 772,141 | |
| | 484 | | | | | YUM Brands, Term Loan B | | | 3.495% | | | | 1-Month LIBOR | | | | 1.750% | | | | 4/03/25 | | | | BBB– | | | | 486,175 | |
| | 8,092 | | | | | Total Hotels, Restaurants & Leisure | | | | | | | | | | | | | | | | | | | | | | | 7,879,453 | |
| | | | | | | | |
| | | | | | Household Durables – 0.2% | | | | | | | | | | | | | | | | | | |
| | | | | | | | |
| | 608 | | | | | Serta Simmons Holdings LLC, Term Loan, First Lien | | | 5.250% | | | | 1-Month LIBOR | | | | 3.500% | | | | 11/08/23 | | | | Caa1 | | | | 396,234 | |
30
| | | | | | | | | | | | | | | | | | | | | | | | | | | | | | |
Principal
Amount (000) | | | | | Description (1) | | Coupon (9) | | | Reference
Rate (9) | | | Spread (9) | | | Maturity (10) | | | Ratings (7) | | | Value | |
| | | | | | | | |
| | | | | | Household Products – 0.5% | | | | | | | | | | | | | | | | | | |
| | | | | | | | |
| $ | 1,235 | | | | | Reynolds Group Holdings, Inc., Term Loan, First Lien | | | 4.549% | | | | 1-Month LIBOR | | | | 2.750% | | | | 2/05/23 | | | | B+ | | | $ | 1,240,630 | |
| | | | | | | | |
| | | | | | Insurance – 0.2% | | | | | | | | | | | | | | | | | | |
| | | | | | | | |
| | 349 | | | | | Asurion LLC, Term Loan B6, (WI/DD) | | | TBD | | | | TBD | | | | TBD | | | | TBD | | | | Ba3 | | | | 351,576 | |
| | | | | | | | |
| | | | | | Interactive Media & Services – 0.2% | | | | | | | | | | | | | | | | | | |
| | | | | | | | |
| | 498 | | | | | Rackspace Hosting, Inc., Refinancing Term B Loan, First Lien | | | 4.902% | | | | 3-Month LIBOR | | | | 3.000% | | | | 11/03/23 | | | | B+ | | | | 485,153 | |
| | | | | | | | |
| | | | | | Internet & Direct Marketing Retail – 0.1% | | | | | | | | | | | | | | | | | | |
| | | | | | | | |
| | 290 | | | | | Uber Technologies, Inc., Term Loan | | | 5.745% | | | | 1-Month LIBOR | | | | 4.000% | | | | 4/04/25 | | | | B1 | | | | 290,741 | |
| | | | | | | | |
| | | | | | Internet Software & Services – 0.2% | | | | | | | | | | | | | | | | | | |
| | | | | | | | |
| | 484 | | | | | Ancestry.com, Inc., Term Loan, First Lien | | | 5.550% | | | | 1-Month LIBOR | | | | 3.750% | | | | 10/19/23 | | | | B | | | | 478,612 | |
| | | | | | | | |
| | | | | | IT Services – 1.0% | | | | | | | | | | | | | | | | | | |
| | | | | | | | |
| | 334 | | | | | Gartner, Inc., Term Loan A | | | 3.299% | | | | 1-Month LIBOR | | | | 1.500% | | | | 3/21/22 | | | | BB+ | | | | 335,926 | |
| | 965 | | | | | Leidos Holdings, Inc., Term Loan B | | | 3.563% | | | | 1-Month LIBOR | | | | 1.750% | | | | 8/22/25 | | | | BBB– | | | | 973,026 | |
| | 487 | | | | | Tempo Acquisition LLC, Term Loan B | | | 4.549% | | | | 1-Month LIBOR | | | | 2.750% | | | | 5/01/24 | | | | B1 | | | | 491,259 | |
| | 158 | | | | | West Corporation, Term Loan B | | | 5.927% | | | | 3-Month LIBOR | | | | 4.000% | | | | 10/10/24 | | | | B2 | | | | 134,077 | |
| | 483 | | | | | WEX, Inc., Term Loan B3 | | | 4.049% | | | | 1-Month LIBOR | | | | 2.250% | | | | 5/15/26 | | | | Ba2 | | | | 486,375 | |
| | 2,427 | | | | | Total IT Services | | | | | | | | | | | | | | | | | | | | | | | 2,420,663 | |
| | | | | | | | |
| | | | | | Life Sciences Tools & Services – 0.1% | | | | | | | | | | | | | | | | | | |
| | | | | | | | |
| | 194 | | | | | Inventiv Health, Inc., Term Loan B | | | 3.799% | | | | 1-Month LIBOR | | | | 2.000% | | | | 8/01/24 | | | | BB | | | | 195,257 | |
| | | | | | | | |
| | | | | | Machinery – 0.1% | | | | | | | | | | | | | | | | | | |
| | | | | | | | |
| | 283 | | | | | Gates Global LLC, Term Loan B | | | 4.549% | | | | 1-Month LIBOR | | | | 2.750% | | | | 4/01/24 | | | | B+ | | | | 283,353 | |
| | | | | | | | |
| | | | | | Marine – 0.0% | | | | | | | | | | | | | | | | | | |
| | | | | | | | |
| | 112 | | | | | Harvey Gulf International Marine, Inc., Exit Term Loan | | | 8.034% | | | | 3-Month LIBOR | | | | 6.000% | | | | 7/02/23 | | | | B | | | | 85,588 | |
| | | | | | | | |
| | | | | | Media – 3.4% | | | | | | | | | | | | | | | | | | |
| | | | | | | | |
| | 463 | | | | | CBS Outdoor Americas Inc., Term Loan B | | | 3.486% | | | | 1-Month LIBOR | | | | 1.750% | | | | 11/18/26 | | | | BB+ | | | | 465,703 | |
| | 877 | | | | | Cequel Communications LLC, Term Loan B | | | 3.990% | | | | 1-Month LIBOR | | | | 2.250% | | | | 1/15/26 | | | | BB | | | | 879,429 | |
| | 938 | | | | | Charter Communications Operating Holdings LLC, Term Loan B2 | | | 3.550% | | | | 1-Month LIBOR | | | | 1.750% | | | | 2/01/27 | | | | BBB– | | | | 945,435 | |
| | 204 | | | | | Cineworld Group PLC, Term Loan B | | | 4.049% | | | | 1-Month LIBOR | | | | 2.250% | | | | 2/28/25 | | | | BB– | | | | 204,502 | |
| | 497 | | | | | Clear Channel Communications, Inc., Exit Term Loan | | | 5.691% | | | | 1-Month LIBOR | | | | 4.000% | | | | 5/01/26 | | | | BB– | | | | 501,812 | |
| | 743 | | | | | Clear Channel Outdoor Holdings, Inc., Term Loan B | | | 5.299% | | | | 1-Month LIBOR | | | | 3.500% | | | | 8/21/26 | | | | B+ | | | | 748,870 | |
| | 500 | | | | | Cox Media/Terrier Media, Term Loan, First Lien | | | 6.148% | | | | 3-Month LIBOR | | | | 4.250% | | | | 12/12/26 | | | | BB– | | | | 505,627 | |
| | 100 | | | | | CSC Holdings LLC, Refinancing Term Loan | | | 3.990% | | | | 1-Month LIBOR | | | | 2.250% | | | | 7/17/25 | | | | BB | | | | 100,063 | |
| | 197 | | | | | Cumulus Media, Inc., Term Loan B | | | 5.549% | | | | 1-Month LIBOR | | | | 3.750% | | | | 3/31/26 | | | | B2 | | | | 199,242 | |
| | 496 | | | | | EW Scripps, Term Loan B2 | | | 4.299% | | | | 1-Month LIBOR | | | | 2.500% | | | | 5/01/26 | | | | Ba2 | | | | 498,971 | |
| | 277 | | | | | Gray Television, Inc., Term Loan B2 | | | 3.947% | | | | 1-Month LIBOR | | | | 2.250% | | | | 2/07/24 | | | | BB | | | | 277,801 | |
| | 511 | | | | | Intelsat Jackson Holdings, S.A., Term Loan B | | | 5.682% | | | | 6-Month LIBOR | | | | 3.750% | | | | 11/30/23 | | | | B1 | | | | 512,750 | |
| | 386 | | | | | Meredith Corporation, Term Loan B1 | | | 4.549% | | | | 1-Month LIBOR | | | | 2.750% | | | | 1/31/25 | | | | BB | | | | 388,451 | |
| | 25 | | | | | Metro-Goldwyn-Mayer, Inc., Term Loan, First Lien | | | 4.300% | | | | 1-Month LIBOR | | | | 2.500% | | | | 7/03/25 | | | | BB | | | | 24,967 | |
| | 86 | | | | | Nexstar Broadcasting, Inc., Term Loan B3 | | | 3.941% | | | | 1-Month LIBOR | | | | 2.250% | | | | 1/17/24 | | | | BB | | | | 86,319 | |
| | 432 | | | | | Nexstar Broadcasting, Inc., Term Loan B3 | | | 4.055% | | | | 1-Month LIBOR | | | | 2.250% | | | | 1/17/24 | | | | BB | | | | 434,407 | |
| | 491 | | | | | Sinclair Television Group, Term Loan B2 | | | 4.050% | | | | 1-Month LIBOR | | | | 2.250% | | | | 1/03/24 | | | | BB+ | | | | 491,139 | |
| | 352 | | | | | Springer SBM Two GmbH, Term Loan B16 | | | 5.305% | | | | 1-Month LIBOR | | | | 3.500% | | | | 8/14/24 | | | | B+ | | | | 352,992 | |
| | 258 | | | | | WideOpenWest Finance LLC, Term Loan B | | | 5.030% | | | | 1-Month LIBOR | | | | 3.250% | | | | 8/18/23 | | | | B | | | | 256,605 | |
| | 7,833 | | | | | Total Media | | | | | | | | | | | | | | | | | | | | | | | 7,875,085 | |
| | | | | | | | |
| | | | | | Multiline Retail – 0.1% | | | | | | | | | | | | | | | | | | |
| | | | | | | | |
| | 10 | | | | | Belk, Inc., Term Loan, First Lien | | | 8.803% | | | | 3-Month LIBOR | | | | 6.750% | | | | 7/31/25 | | | | B2 | | | | 7,399 | |
| | 246 | | | | | EG America LLC, Term Loan, First Lien | | | 5.961% | | | | 3-Month LIBOR | | | | 4.000% | | | | 2/07/25 | | | | B | | | | 245,142 | |
| | 256 | | | | | Total Multiline Retail | | | | | | | | | | | | | | | | | | | | | | | 252,541 | |
31
| | |
| |
| JDD | | Nuveen Diversified Dividend and Income Fund(continued) |
| | Portfolio of Investments December 31, 2019 |
| | | | | | | | | | | | | | | | | | | | | | | | | | | | | | |
Principal
Amount (000) | | | | | Description (1) | | Coupon (9) | | | Reference
Rate (9) | | | Spread (9) | | | Maturity (10) | | | Ratings (7) | | | Value | |
| | | | | | | | |
| | | | | | Oil, Gas & Consumable Fuels – 0.1% | | | | | | | | | | | | | | | | | | |
| | | | | | | | |
| $ | 208 | | | | | Fieldwood Energy LLC, Exit Term Loan | | | 7.177% | | | | 3-Month LIBOR | | | | 5.250% | | | | 4/11/22 | | | | B+ | | | $ | 175,031 | |
| | 267 | | | | | Fieldwood Energy LLC, Exit Term Loan, second Lien | | | 9.177% | | | | 3-Month LIBOR | | | | 7.250% | | | | 4/11/23 | | | | B+ | | | | 153,766 | |
| | 475 | | | | | Total Oil, Gas & Consumable Fuels | | | | | | | | | | | | | | | | | | | | | | | 328,797 | |
| | | | | | | | |
| | | | | | Personal Products – 0.2% | | | | | | | | | | | | | | | | | | |
| | | | | | | | |
| | 750 | | | | | Revlon Consumer Products Corporation, Term Loan B, First Lien | | | 5.409% | | | | 3-Month LIBOR | | | | 3.500% | | | | 11/16/20 | | | | B3 | | | | 576,938 | |
| | | | | | | | |
| | | | | | Pharmaceuticals – 0.6% | | | | | | | | | | | | | | | | | | |
| | | | | | | | |
| | 133 | | | | | Valeant Pharmaceuticals International, Inc., Term Loan B | | | 4.490% | | | | 1-Month LIBOR | | | | 2.750% | | | | 11/27/25 | | | | BB | | | | 133,337 | |
| | 1,142 | | | | | Valeant Pharmaceuticals International, Inc., Term Loan, First Lien | | | 4.740% | | | | 1-Month LIBOR | | | | 3.000% | | | | 6/02/25 | | | | BB | | | | 1,150,173 | |
| | 1,275 | | | | | Total Pharmaceuticals | | | | | | | | | | | | | | | | | | | | | | | 1,283,510 | |
| | | | | | | | |
| | | | | | Professional Services – 0.2% | | | | | | | | | | | | | | | | | | |
| | | | | | | | |
| | 242 | | | | | Nielsen Finance LLC, Term Loan B4 | | | 3.710% | | | | 1-Month LIBOR | | | | 2.000% | | | | 10/04/23 | | | | BBB– | | | | 243,688 | |
| | 299 | | | | | On Assignment, Inc., Term Loan B3 | | | 3.549% | | | | 1-Month LIBOR | | | | 1.750% | | | | 4/02/25 | | | | BBB– | | | | 300,457 | |
| | 541 | | | | | Total Professional Services | | | | | | | | | | | | | | | | | | | | | | | 544,145 | |
| | | | | | |
| | | | | | Real Estate Management & Development – 0.4% | | | | | | | | | | | | | |
| | | | | | | | |
| | 896 | | | | | GGP, Initial Term Loan A2 | | | 4.049% | | | | 1-Month LIBOR | | | | 2.250% | | | | 8/28/23 | | | | BB+ | | | | 894,192 | |
| | | | | | | | |
| | | | | | Road & Rail – 0.2% | | | | | | | | | | | | | | | | | | |
| | | | | | | | |
| | 556 | | | | | Avolon LLC, Term Loan B3 | | | 3.515% | | | | 1-Month LIBOR | | | | 1.750% | | | | 1/15/25 | | | | Baa2 | | | | 560,332 | |
| | | | | | |
| | | | | | Semiconductors & Semiconductor Equipment – 0.4% | | | | | | | | | | | | | |
| | | | | | | | |
| | 211 | | | | | MaxLinear, Inc., Term Loan B | | | 4.240% | | | | 1-Month LIBOR | | | | 2.500% | | | | 5/13/24 | | | | BB– | | | | 212,125 | |
| | 288 | | | | | Microchip Technology, Inc., Term Loan B | | | 3.800% | | | | 1-Month LIBOR | | | | 2.000% | | | | 5/29/25 | | | | Baa3 | | | | 289,513 | |
| | 470 | | | | | MKS Instruments, Inc., Term Loan B6 | | | 3.549% | | | | 1-Month LIBOR | | | | 1.750% | | | | 2/02/26 | | | | BB+ | | | | 472,400 | |
| | 969 | | | | | Total Semiconductors & Semiconductor Equipment | | | | | | | | | | | | 974,038 | |
| | | | | | | | |
| | | | | | Software – 2.3% | | | | | | | | | | | | | | | | | | |
| | | | | | | | |
| | 660 | | | | | Ellucian, Term Loan B, First Lien | | | 5.195% | | | | 3-Month LIBOR | | | | 3.250% | | | | 9/30/22 | | | | B | | | | 662,086 | |
| | 248 | | | | | Epicor Software Corporation, Term Loan B | | | 5.050% | | | | 1-Month LIBOR | | | | 3.250% | | | | 6/01/22 | | | | B2 | | | | 249,842 | |
| | 484 | | | | | Greeneden U.S. Holdings II LLC, Term Loan B | | | 5.049% | | | | 1-Month LIBOR | | | | 3.250% | | | | 12/01/23 | | | | B2 | | | | 486,230 | |
| | 604 | | | | | Infor (US), Inc., Term Loan B | | | 4.695% | | | | 3-Month LIBOR | | | | 2.750% | | | | 2/01/22 | | | | Ba3 | | | | 607,064 | |
| | 486 | | | | | Kronos Incorporated, Term Loan B | | | 4.909% | | | | 3-Month LIBOR | | | | 3.000% | | | | 11/01/23 | | | | B | | | | 489,464 | |
| | 303 | | | | | McAfee LLC, Term Loan B | | | 5.555% | | | | 1-Month LIBOR | | | | 3.750% | | | | 9/30/24 | | | | B | | | | 304,948 | |
| | 123 | | | | | Micro Focus International PLC, New Term Loan | | | 4.299% | | | | 1-Month LIBOR | | | | 2.500% | | | | 6/21/24 | | | | BB– | | | | 123,719 | |
| | 833 | | | | | Micro Focus International PLC, Term Loan B | | | 4.299% | | | | 1-Month LIBOR | | | | 2.500% | | | | 6/21/24 | | | | BB– | | | | 835,504 | |
| | 493 | | | | | Quintiles Transnational Corporation, Dollar Term Loan B3 | | | 3.695% | | | | 3-Month LIBOR | | | | 1.750% | | | | 6/11/25 | | | | BBB– | | | | 495,733 | |
| | 454 | | | | | SS&C Technologies, Inc./ Sunshine Acquisition II, Inc., Term Loan B3 | | | 4.049% | | | | 1-Month LIBOR | | | | 2.250% | | | | 4/16/25 | | | | BB+ | | | | 457,867 | |
| | 315 | | | | | SS&C Technologies, Inc./ Sunshine Acquisition II, Inc., Term Loan B4 | | | 4.049% | | | | 1-Month LIBOR | | | | 2.250% | | | | 4/16/25 | | | | BB | | | | 317,462 | |
| | 450 | | | | | TIBCO Software, Inc., Term Loan B | | | 5.710% | | | | 1-Month LIBOR | | | | 4.000% | | | | 6/30/26 | | | | B1 | | | | 452,645 | |
| | 5,453 | | | | | Total Software | | | | | | | | | | | | | | | | | | | | | | | 5,482,564 | |
| | | | | | | | |
| | | | | | Specialty Retail – 0.7% | | | | | | | | | | | | | | | | | | |
| | | | | | | | |
| | 87 | | | | | Academy, Ltd., Term Loan B | | | 5.692% | | | | 1-Month LIBOR | | | | 4.000% | | | | 7/01/22 | | | | CCC+ | | | | 72,146 | |
| | 980 | | | | | Belron Finance US LLC, Initial Term Loan B | | | 4.144% | | | | 3-Month LIBOR | | | | 2.250% | | | | 11/07/24 | | | | BB | | | | 985,311 | |
| | 132 | | | | | Petco Animal Supplies, Inc., Term Loan B1 | | | 5.177% | | | | 3-Month LIBOR | | | | 3.250% | | | | 1/26/23 | | | | B2 | | | | 112,407 | |
| | 473 | | | | | Petsmart Inc., Term Loan B, First Lien | | | 5.740% | | | | 1-Month LIBOR | | | | 4.000% | | | | 3/11/22 | | | | B | | | | 468,655 | |
| | 1,672 | | | | | Total Specialty Retail | | | | | | | | | | | | | | | | | | | | | | | 1,638,519 | |
| | | | | | |
| | | | | | Technology Hardware, Storage & Peripherals – 1.0% | | | | | | | | | | | | | |
| | | | | | | | |
| | 442 | | | | | BMC Software, Inc., Term Loan B | | | 6.049% | | | | 1-Month LIBOR | | | | 4.250% | | | | 10/02/25 | | | | B2 | | | | 438,323 | |
| | 706 | | | | | Dell International LLC, Refinancing Term Loan B1 | | | 3.800% | | | | 1-Month LIBOR | | | | 2.000% | | | | 9/19/25 | | | | BBB– | | | | 712,184 | |
| | 249 | | | | | NCR Corporation, Term Loan B | | | 4.300% | | | | 1-Month LIBOR | | | | 2.500% | | | | 8/28/26 | | | | BBB– | | | | 252,492 | |
32
| | | | | | | | | | | | | | | | | | | | | | | | | | | | | | |
Principal
Amount (000) | | | | | Description (1) | | Coupon (9) | | | Reference
Rate (9) | | | Spread (9) | | | Maturity (10) | | | Ratings (7) | | | Value | |
| | | | | | |
| | | | | | Technology Hardware, Storage & Peripherals(continued) | | | | | | | | | | | | | |
| | | | | | | | |
| $ | 942 | | | | | Western Digital, Term Loan B | | | 3.452% | | | | 1-Month LIBOR | | | | 1.750% | | | | 4/29/23 | | | | Baa2 | | | $ | 948,117 | |
| | 2,339 | | | | | Total Technology Hardware, Storage & Peripherals | | | | | | | | | | | | 2,351,116 | |
| | | | | | |
| | | | | | Trading Companies & Distributors – 0.4% | | | | | | | | | | | | | |
| | | | | | | | |
| | 564 | | | | | HD Supply Waterworks, Ltd., Term Loan B | | | 4.528% | | | | 3-Month LIBOR | | | | 2.750% | | | | 8/01/24 | | | | B+ | | | | 565,142 | |
| | 429 | | | | | Univar, Inc., Term Loan B | | | 4.049% | | | | 1-Month LIBOR | | | | 2.250% | | | | 7/01/24 | | | | BB+ | | | | 431,551 | |
| | 993 | | | | | Total Trading Companies & Distributors | | | | | | | | | | | | 996,693 | |
| | | | | | |
| | | | | | Wireless Telecommunication Services – 0.4% | | | | | | | | | | | | | |
| | | | | | | | |
| | 972 | | | | | Sprint Corporation, Term Loan, First Lien | | | 4.313% | | | | 1-Month LIBOR | | | | 2.500% | | | | 2/02/24 | | | | Ba2 | | | | 965,692 | |
| $ | 69,829 | | | | | Total Variable Rate Senior Loan Interests (cost $69,503,643) | | | | | | | | | | | | 68,882,852 | |
| | | | | | | | |
| Shares | | | | | Description (1) | | | | | | | | Coupon | | | | | | Ratings (7) | | | Value | |
| | | |
| | | | | | CONVERTIBLE PREFERRED SECURITIES – 0.8% (0.6% of Total Investments) | | | | | |
| | | | | | |
| | | | | | Health Care Technology – 0.2% | | | | | | | | | | | | | |
| | | | | | |
| | 8,450 | | | | | Change Healthcare Inc | | | | 6.000% | | | | | | | | N/R | | | $ | 506,915 | |
| | | | | | | | |
| | | | | | Multi-Utilities – 0.6% | | | | | | | | | | | | | | | | | | |
| | | | | | | | |
| | 28,170 | | | | | CenterPoint Energy Inc | | | | | | | | | | | 7.000% | | | | | | | | N/R | | | | 1,373,006 | |
| | | | | | Total Convertible Preferred Securities (cost $1,890,266) | | | | | | | | | | | | | | | | 1,879,921 | |
| | | | | | | | |
| Shares | | | | | Description (1) | | Coupon | | | Issue Price | | | Cap Price | | | Maturity | | | | | | Value | |
| | | | | | |
| | | | | | STRUCTURED NOTES – 0.5% (0.3% of Total Investments) | | | | | | | | | | | | | | | | | |
| | | | | | | | |
| | 2,579 | | | | | Merrill Lynch International & Co. C.V., Mandatory Exchangeable Note, Linked to Common Stock of Broadcom Inc. (Cap 115.50% of Issue Price), 144A | | | 10.000% | | | | $ 280.9170 | | | $ | 324.4591 | | | | 2/20/20 | | | | | | | $ | 807,611 | |
| | 7,500 | | | | | Merrill Lynch International & Co. C.V., Mandatory Exchangeable Note, Linked to Common Stock of Activision Blizzard (Cap 116.71% of Issue Price), 144A | | | 10.000% | | | | 55.7410 | | | | 65.0550 | | | | 5/20/20 | | | | | | | | 442,234 | |
| | | | | | Total Structured Notes (cost $1,142,542) | | | | | | | | | | | | | | | | 1,249,845 | |
| | | | | | | | |
Principal
Amount (000) | | | | | Description (1) | | | | | | | | Coupon | | | Maturity | | | Ratings (7) | | | Value | |
| | | | | | |
| | | | | | CORPORATE BONDS – 0.1% (0.0% of Total Investments) | | | | | | | | | | | | | | | | | |
| | | | | | | | |
| | | | | | Media – 0.1% | | | | | | | | | | | | | | | | | | |
| | | | | | | | |
| $ | 106 | | | | | iHeartCommunications Inc | | | | | | | | | | | 8.375% | | | | 5/01/27 | | | | B– | | | $ | 117,140 | |
| | 132 | | | | | iHeartCommunications Inc, (4), (8) | | | | | | | | | | | 9.000% | | | | 12/15/49 | | | | N/R | | | | — | |
| $ | 238 | | | | | Total Corporate Bonds (cost $111,134) | | | | | | | | | | | | | | | | 117,140 | |
| | | | | | | | |
| Shares | | | | | Description (1) | | | | | | | | | | | | | | | | | Value | |
| | | | |
| | | | | | COMMON STOCK RIGHTS – 0.0% (0.0% of Total Investments) | | | | | | | |
| | | | | | | | |
| | | | | | Oil, Gas & Consumable Fuels – 0.0% | | | | | | | | | | | | | | | | | | |
| | | | | | | | |
| | 388 | | | | | Fieldwood Energy LLC, (2), (3) | | | | | | | | | | | | | | | | | | | | | | $ | 7,049 | |
| | 1,923 | | | | | Fieldwood Energy LLC, (2), (3) | | | | | | | | | | | | | | | | | | | | | | | 34,935 | |
| | | | | | Total Common Stock Rights (cost $54,874) | | | | | | | | | | | | 41,984 | |
| | | | | | | | |
| Shares | | | | | Description (1) | | | | | | | | | | | | | | | | | Value | |
| | | | | |
| | | | | | WARRANTS – 0.0% (0.0% of Total Investments) | | | | | | | | | | |
| | | | | | | | |
| | | | | | Industrials – 0.0% | | | | | | | | | | | | | | | | | | |
| | | | | | | | |
| | 1,176 | | | | | HGIM, (2) | | | | | | | | | | | | | | | | | | | | | | $ | 11,466 | |
| | | | | | Total Warrants (cost $47,040) | | | | | | | | | | | | | | | | 11,466 | |
| | | | | | Total Long-Term Investments (cost $290,533,072) | | | | | | | | | | | | | | | | 326,280,267 | |
33
| | |
| |
| JDD | | Nuveen Diversified Dividend and Income Fund(continued) |
| | Portfolio of Investments December 31, 2019 |
| | | | | | | | | | | | | | | | | | | | | | | | | | | | | | |
Principal
Amount (000)/
Shares | | | | | Description (1) | | | | | | | | Coupon | | | Maturity | | | | | | Value | |
| | | | | | |
| | | | | | SHORT-TERM INVESTMENTS – 3.3% (2.3% of Total Investments) | | | | | | | | | | | | | | | | | |
| | | | | | |
| | | | | | INVESTMENT COMPANIES – 1.9% (1.3% of Total Investments) | | | | | | | | | | | | | |
| | | | | | | | |
| $ | 4,388,063 | | | | | BlackRock Liquidity FundsT-Fund Portfolio, (11) | | | | | | | | | | | 1.522% (12) | | | | N/A | | | | | | | $ | 4,388,063 | |
| | | | | | |
| | | | | | REPURCHASE AGREEMENTS – 1.4% (1.0% of Total Investments) | | | | | | | | | | | | | |
| | | | | | | | |
| | 3,354 | | | | | Repurchase Agreement with Fixed Income Clearing Corporation,
dated 12/31/19, repurchase price $3,354,076,
collateralized by $3,085,000 U.S. Treasury Bonds,
2.875%, due 8/15/45, value $3,433,324 | | | | | | | | | | | 0.650% | | | | 1/01/20 | | | | | | | | 3,353,955 | |
| | | | | | Total Short-Term Investments (cost $7,742,018) | | | | | | | | | | | | | | | | 7,742,018 | |
| | | | | | Total Investments (cost $298,275,090) – 142.6% | | | | | | | | | | | | | | | | 334,022,285 | |
| | | | | | Borrowings – (41.8)% (13), (14) | | | | | | | | | | | | | | | | | | | | | | | (97,900,000 | ) |
| | | | | | Other Assets Less Liabilities – (0.8)% (15) | | | | | | | | | | | | | | | | | | | | | | | (1,836,719 | ) |
| | | | | | Net Assets Applicable to Common Shares – 100% | | | | | | | | | | | | | | | | | | | $ | 234,285,566 | |
Investments in Derivatives
Forward Foreign Currency Contracts
| | | | | | | | | | | | | | | | | | | | |
| Currency Purchased | | Notional
Amount
(Local Currency) | | | Currency Sold | | Notional
Amount
(Local Currency) | | | Counterparty | | Settlement
Date | | | Unrealized
Appreciation
(Depreciation) | |
Czech Koruna | | | 978,000 | | | U.S. Dollar | | | 42,754 | | | Bank of America, N.A. | | | 3/18/20 | | | $ | 395 | |
Polish Zloty | | | 163,000 | | | U.S. Dollar | | | 42,472 | | | Bank of America, N.A. | | | 3/18/20 | | | | 499 | |
South African Rand | | | 527,000 | | | U.S. Dollar | | | 35,814 | | | Bank of America, N.A. | | | 3/18/20 | | | | 1,444 | |
South African Rand | | | 702,000 | | | U.S. Dollar | | | 47,951 | | | Bank of America, N.A. | | | 3/18/20 | | | | 1,679 | |
Turkish Lira | | | 209,000 | | | U.S. Dollar | | | 35,203 | | | Bank of America, N.A. | | | 3/18/20 | | | | (734 | ) |
Turkish Lira | | | 279,000 | | | U.S. Dollar | | | 46,687 | | | Bank of America, N.A. | | | 3/18/20 | | | | (673 | ) |
Czech Koruna | | | 1,304,000 | | | U.S. Dollar | | | 57,182 | | | Barclays Bank PLC | | | 3/18/20 | | | | 350 | |
Polish Zloty | | | 217,000 | | | U.S. Dollar | | | 56,763 | | | Barclays Bank PLC | | | 3/18/20 | | | | 445 | |
Czech Koruna | | | 1,374,000 | | | U.S. Dollar | | | 59,757 | | | Citibank N.A. | | | 3/18/20 | | | | 863 | |
Czech Koruna | | | 2,061,000 | | | U.S. Dollar | | | 89,407 | | | Citibank N.A. | | | 3/18/20 | | | | 1,523 | |
Euro | | | 258,000 | | | U.S. Dollar | | | 286,421 | | | Citibank N.A. | | | 3/18/20 | | | | 4,337 | |
Polish Zloty | | | 542,000 | | | U.S. Dollar | | | 141,844 | | | Citibank N.A. | | | 3/18/20 | | | | 1,044 | |
U.S. Dollar | | | 2,735,090 | | | Euro | | | 2,450,051 | | | Citibank N.A. | | | 3/18/20 | | | | (26,040 | ) |
U.S. Dollar | | | 48,608 | | | Turkish Lira | | | 295,000 | | | Citibank N.A. | | | 3/18/20 | | | | (45 | ) |
Czech Koruna | | | 1,145,000 | | | U.S. Dollar | | | 49,873 | | | Goldman Sachs Bank USA | | | 3/18/20 | | | | 643 | |
Czech Koruna | | | 3,260,000 | | | U.S. Dollar | | | 143,259 | | | Goldman Sachs Bank USA | | | 3/18/20 | | | | 570 | |
Czech Koruna | | | 978,000 | | | U.S. Dollar | | | 42,874 | | | Goldman Sachs Bank USA | | | 3/18/20 | | | | 275 | |
Polish Zloty | | | 163,000 | | | U.S. Dollar | | | 42,632 | | | Goldman Sachs Bank USA | | | 3/18/20 | | | | 339 | |
South African Rand | | | 1,754,000 | | | U.S. Dollar | | | 120,346 | | | Goldman Sachs Bank USA | | | 3/18/20 | | | | 3,657 | |
South African Rand | | | 527,000 | | | U.S. Dollar | | | 35,939 | | | Goldman Sachs Bank USA | | | 3/18/20 | | | | 1,318 | |
Turkish Lira | | | 69,800 | | | U.S. Dollar | | | 116,791 | | | Goldman Sachs Bank USA | | | 3/18/20 | | | | (1,674 | ) |
Turkish Lira | | | 209,000 | | | U.S. Dollar | | | 34,979 | | | Goldman Sachs Bank USA | | | 3/18/20 | | | | (510 | ) |
U.S. Dollar | | | 397,168 | | | Euro | | | 357,000 | | | HSBC Bank USA, National Association | | | 3/18/20 | | | | (5,160 | ) |
U.S. Dollar | | | 77,069 | | | Euro | | | 69,000 | | | HSBC Bank USA, National Association | | | 3/18/20 | | | | (691 | ) |
Brazilian Real | | | 70,000 | | | U.S. Dollar | | | 16,499 | | | JPMorgan Chase Bank N.A. | | | 3/3/20 | | | | 863 | |
Brazilian Real | | | 135,000 | | | U.S. Dollar | | | 32,785 | | | JPMorgan Chase Bank N.A. | | | 3/3/20 | | | | 700 | |
Brazilian Real | | | 180,000 | | | U.S. Dollar | | | 43,974 | | | JPMorgan Chase Bank N.A. | | | 3/3/20 | | | | 671 | |
Brazilian Real | | | 450,000 | | | U.S. Dollar | | | 110,297 | | | JPMorgan Chase Bank N.A. | | | 3/3/20 | | | | 1,317 | |
Brazilian Real | | | 135,000 | | | U.S. Dollar | | | 32,928 | | | JPMorgan Chase Bank N.A. | | | 3/3/20 | | | | 557 | |
Colombian Peso | | | 122,280,000 | | | U.S. Dollar | | | 35,966 | | | JPMorgan Chase Bank N.A. | | | 3/18/20 | | | | 1,101 | |
Colombian Peso | | | 285,320,000 | | | U.S. Dollar | | | 84,166 | | | JPMorgan Chase Bank N.A. | | | 3/18/20 | | | | 2,324 | |
Colombian Peso | | | 407,600,000 | | | U.S. Dollar | | | 121,054 | | | JPMorgan Chase Bank N.A. | | | 3/18/20 | | | | 2,502 | |
Egyptian Pound | | | 1,063,000 | | | U.S. Dollar | | | 64,075 | | | JPMorgan Chase Bank N.A. | | | 3/18/20 | | | | 1,331 | |
Egyptian Pound | | | 1,063,000 | | | U.S. Dollar | | | 64,113 | | | JPMorgan Chase Bank N.A. | | | 3/18/20 | | | | 1,293 | |
Egyptian Pound | | | 1,063,000 | | | U.S. Dollar | | | 64,113 | | | JPMorgan Chase Bank N.A. | | | 3/18/20 | | | | 1,293 | |
Egyptian Pound | | | 1,061,000 | | | U.S. Dollar | | | 64,031 | | | JPMorgan Chase Bank N.A. | | | 3/18/20 | | | | 1,251 | |
Philippine Peso | | | 1,839,000 | | | U.S. Dollar | | | 36,224 | | | JPMorgan Chase Bank N.A. | | | 3/18/20 | | | | (37 | ) |
Philippine Peso | | | 2,452,000 | | | U.S. Dollar | | | 48,249 | | | JPMorgan Chase Bank N.A. | | | 3/18/20 | | | | — | |
Philippine Peso | | | 6,130,000 | | | U.S. Dollar | | | 120,741 | | | JPMorgan Chase Bank N.A. | | | 3/18/20 | | | | (119 | ) |
Philippine Peso | | | 1,839,000 | | | U.S. Dollar | | | 36,197 | | | JPMorgan Chase Bank N.A. | | | 3/18/20 | | | | (11 | ) |
34
| | | | | | | | | | | | | | | | | | | | | | | | |
| Currency Purchased | | Notional
Amount
(Local Currency) | | | Currency Sold | | | Notional
Amount
(Local Currency) | | | Counterparty | | | Settlement
Date | | | Unrealized
Appreciation
(Depreciation) | |
U.S. Dollar | | | 351,434 | | | | Brazilian Real | | | | 1,506,000 | | | | JPMorgan Chase Bank N.A. | | | | 3/3/20 | | | $ | (22,101 | ) |
U.S. Dollar | | | 467,576 | | | | Russian Ruble | | | | 30,370,000 | | | | JPMorgan Chase Bank N.A. | | | | 3/18/20 | | | | (17,694 | ) |
Euro | | | 124,000 | | | | U.S. Dollar | | | | 139,140 | | | | Morgan Stanley Capital Services LLC | | | | 3/18/20 | | | | 604 | |
Polish Zloty | | | 390,000 | | | | U.S. Dollar | | | | 100,917 | | | | Morgan Stanley Capital Services LLC | | | | 3/18/20 | | | | 1,898 | |
Polish Zloty | | | 390,000 | | | | U.S. Dollar | | | | 101,061 | | | | Morgan Stanley Capital Services LLC | | | | 3/18/20 | | | | 1,755 | |
Mexican Peso | | | 4,020,000 | | | | U.S. Dollar | | | | 204,596 | | | | Royal Bank of Canada | | | | 3/18/20 | | | | 5,666 | |
U.S. Dollar | | | 239,789 | | | | Euro | | | | 215,000 | | | | State Street Bank and Trust Company | | | | 3/18/20 | | | | (2,510 | ) |
Total | | | | | | | | | | | | | | | | | | | | | | $ | (33,492 | ) |
Total unrealized appreciation on forward foreign currency contracts | | | | | | | $ | 44,507 | |
Total unrealized depreciation on forward foreign currency contracts | | | | | | | $ | (77,999 | ) |
Futures Contracts
| | | | | | | | | | | | | | | | | | | | | | | | | | | | |
| Description | | Contract
Position | | | Number of
Contracts | | | Expiration
Date | | | Notional
Amount | | | Value | | | Unrealized
Appreciation
(Depreciation) | | | Variation
Margin
Receivable/
(Payable) | |
Eurex Euro-Bobl | | | Short | | | | (3 | ) | | | 3/20 | | | $ | (450,831 | ) | | $ | (449,678 | ) | | $ | 1,153 | | | $ | — | |
Eurex Euro-Bund | | | Short | | | | (8 | ) | | | 3/20 | | | | (1,543,450 | ) | | | (1,529,909 | ) | | | 13,541 | | | | — | |
Total | | | | | | | | | | | | | | $ | (1,994,281 | ) | | $ | (1,979,587 | ) | | $ | 14,694 | | | $ | — | |
Interest Rate Swaps – OTC Uncleared
| | | | | | | | | | | | | | | | | | | | | | | | | | | | | | | | | | | | | | | | |
| Counterparty | | Notional
Amount | | | Fund
Pay/Receive
Floating Rate | | | Floating Rate Index | | | Fixed Rate
(Annualized) | | | Fixed Rate
Payment
Frequency | | | Effective
Date (16) | | | Optional
Termination
Date | | | Maturity
Date | | | Value | | | Unrealized
Appreciation
(Depreciation) | |
JPMorgan Chase Bank N.A. | | $ | 56,200,000 | | | | Receive | | | | 1-Month LIBOR | | | | 1.969 | % | | | Monthly | | | | 6/01/18 | | | | 7/01/25 | | | | 7/01/27 | | | $ | (1,633,704 | ) | | $ | (1,633,704 | ) |
Total unrealized depreciation on interest rate swaps | | | | | | | | | | | $ | (1,633,704 | ) |
35
| | |
| |
| JDD | | Nuveen Diversified Dividend and Income Fund(continued) |
| | Portfolio of Investments December 31, 2019 |
For Fund portfolio compliance purposes, the Fund’s industry classifications refer to any one or more of the industrysub-classifications used by one or more widely recognized market indexes or ratings group indexes, and/or as defined by Fund management. This definition may not apply for purposes of this report, which may combine industrysub-classifications into sectors for reporting ease.
| (1) | All percentages shown in the Portfolio of Investments are based on net assets applicable to common shares unless otherwise noted. |
| (2) | For fair value measurement disclosure purposes, investment classified as Level 2. See Notes to Financial Statements, Note 3 – Investment Valuation and Fair Value Measurements for more information. |
| (3) | Non-income producing; issuer has not declared a dividend within the past twelve months. |
| (4) | Investment valued at fair value using methods determined in good faith by, or at the discretion of, the Board. For fair value measurement disclosure purposes, investment classified as Level 3. See Notes to Financial Statements, Note 3 – Investment Valuation and Fair Value Measurements for more information. |
| (5) | Investment, or portion of investment, has been pledged to collateralize the net payment obligations for investments in derivatives. |
| (6) | Principal Amount (000) denominated in U.S. Dollars, unless otherwise noted. |
| (7) | For financial reporting purposes, the ratings disclosed are the highest of Standard & Poor’s Group (“Standard & Poor’s”), Moody’s Investors Service, Inc. (“Moody’s”) or Fitch, Inc. (“Fitch”) rating. This treatment of split-rated securities may differ from that used for other purposes, such as for Fund investment policies. Ratings below BBB by Standard & Poor’s, Baa by Moody’s or BBB by Fitch are considered to be below investment grade. Holdings designated N/R are not rated by any of these national rating agencies. Ratings are not covered by the report of independent registered public accounting firm. |
| (8) | Defaulted security. A security whose issuer has failed to fully pay principal and/or interest when due, or is under the protection of bankruptcy. |
| (9) | Senior loans generally pay interest at rates which are periodically adjusted by reference to a base short-term, floating lending rate (Reference Rate) plus an assigned fixed rate (Spread). These floating lending rates are generally (i) the lending rate referenced by the London Inter-Bank Offered Rate (“LIBOR”), or (ii) the prime rate offered by one or more major United States banks. Senior loans may be considered restricted in that the Fund ordinarily is contractually obligated to receive approval from the agent bank and/or borrower prior to the disposition of a senior loan. The rate shown is the coupon as of the end of the reporting period. |
| (10) | Senior Loans generally are subject to mandatory and/or optional prepayment. Because of these mandatory prepayment conditions and because there may be significant economic incentives for a borrower to prepay, prepayments of senior loans may occur. As a result, the actual remaining maturity of senior loans held may be substantially less than the stated maturities shown. |
| (11) | A copy of the most recent financial statements for these investment companies can be obtained directly from the Securities and Exchange Commission on its website at http://www.sec.gov. |
| (12) | The rate shown is the annualizedseven-day subsidized yield as of the end of the reporting period. |
| (13) | Borrowings as a percentage of Total Investments is 29.3%. |
| (14) | The Fund may pledge up to 100% of its eligible investments (excluding any investments separately pledged as collateral for specific investments in derivatives, when applicable) in the Portfolio of Investments as collateral for borrowings. |
| (15) | Other assets less liabilities includes the unrealized appreciation (depreciation) of certainover-the-counter (“OTC”) derivatives as presented on the Statement of Assets and Liabilities, when applicable. The unrealized appreciation (depreciation) of OTC cleared and exchange-traded derivatives is recognized as part of the cash collateral at brokers and/or the receivable or payable for variation margin as presented on the Statement of Assets and Liabilities, when applicable. |
| (16) | Effective date represents the date on which both the Fund and counterparty commence interest payment accruals on each contract. |
| 144A | Investment is exempt from registration under Rule 144A of the Securities Act of 1933, as amended. These investments may only be resold in transactions exempt from registration, which are normally those transactions with qualified institutional buyers. |
| ADR | American Depositary Receipt |
| DD1 | Portion of investment purchased on a delayed delivery basis. |
| LIBOR | London Inter-Bank Offered Rate |
| Reg S | Regulation S allows U.S. companies to sell securities to persons or entities located outside of the United States without registering those securities with the Securities and Exchange Commission. Specifically, Regulation S provides a safe harbor from the registration requirements of the Securities Act for the offers and sales of securities by both foreign and domestic issuers that are made outside the United States. |
| REIT | Real Estate Investment Trust |
| TBD | Senior loan purchased on a when-issued or delayed-delivery basis. Certain details associated with this purchase are not known prior to the settlement date of the transaction. In addition, senior loans typically trade without accrued interest and therefore a coupon rate is not available prior to settlement. At settlement, if still unknown, the borrower or counterparty will provide the Fund with the final coupon rate and maturity date. |
| WI/DD | Purchased on a when-issued or delayed delivery basis. |
See accompanying notes to financial statements.
36
Statement of Assets and Liabilities
December 31, 2019
| | | | |
Assets | | | | |
Long-term investments, at value (cost $290,533,072) | | $ | 326,280,267 | |
Short-term investments, at value (cost approximates value) | | | 7,742,018 | |
Cash denominated in foreign currencies (cost $23,490) | | | 24,267 | |
Cash collateral at brokers for investments in futures contracts(1) | | | 25,974 | |
Unrealized appreciation on forward foreign currency contracts | | | 44,507 | |
Receivable for: | | | | |
Dividends | | | 482,680 | |
Interest | | | 1,304,562 | |
Investments sold | | | 322,323 | |
Reclaims | | | 83,333 | |
Other assets | | | 101,505 | |
Total assets | | | 336,411,436 | |
Liabilities | | | | |
Cash overdraft | | | 783,731 | |
Borrowings | | | 97,900,000 | |
Unrealized depreciation on: | | | | |
Forward foreign currency contracts | | | 77,999 | |
Interest rate swaps | | | 1,633,704 | |
Payable for: | | | | |
Investments purchased – regular settlement | | | 29,767 | |
Investments purchased – when-issued/delayed-delivery settlement | | | 1,219,505 | |
Accrued expenses: | | | | |
Management fees | | | 239,742 | |
Interest on borrowings | | | 6,626 | |
Trustees fees | | | 85,194 | |
Other | | | 149,602 | |
Total liabilities | | | 102,125,870 | |
Net assets applicable to common shares | | $ | 234,285,566 | |
Common shares outstanding | | | 19,736,517 | |
Net asset value (“NAV”) per common share outstanding | | $ | 11.87 | |
Net assets applicable to common shares consist of: | | | | |
Common shares, $0.01 par value per share | | $ | 197,365 | |
Paid-in surplus | | | 201,498,639 | |
Total distributable earnings | | | 32,589,562 | |
Net assets applicable to common shares | | $ | 234,285,566 | |
Authorized shares: | | | | |
Common | | | Unlimited | |
Preferred | | | Unlimited | |
| (1) | Cash pledged to collateralize the net payment obligations for investments in derivatives. |
See accompanying notes to financial statements.
37
Statement of Operations
Year Ended December 31, 2019
| | | | |
Investment Income | | | | |
Dividends | | $ | 5,753,547 | |
Interest | | | 8,451,168 | |
Foreign tax withheld on dividend income | | | (224,095 | ) |
Total investment income | | | 13,980,620 | |
Expenses | | | | |
Management fees | | | 2,781,984 | |
Interest expense on borrowings | | | 3,071,820 | |
Custodian fees | | | 210,247 | |
Trustees fees | | | 8,211 | |
Professional fees | | | 56,689 | |
Shareholder reporting expenses | | | 41,295 | |
Shareholder servicing agent fees | | | 1,415 | |
Stock exchange listing fees | | | 6,862 | |
Investor relations expense | | | 29,087 | |
Other | | | 22,473 | |
Total expenses | | | 6,230,083 | |
Net investment income (loss) | | | 7,750,537 | |
Realized and Unrealized Gain (Loss) | | | | |
Net realized gain (loss) from: | | | | |
Investments and foreign currency | | | 6,434,133 | |
Forward foreign currency contracts | | | 352,936 | |
Futures contracts | | | (277,649 | ) |
Swaps | | | 214,335 | |
Change in net unrealized appreciation (depreciation) of: | | | | |
Investments and foreign currency | | | 36,220,738 | |
Forward foreign currency contracts | | | (6,464 | ) |
Futures contracts | | | 28,466 | |
Swaps | | | (2,992,120 | ) |
Net realized and unrealized gain (loss) | | | 39,974,375 | |
Net increase (decrease) in net assets applicable to common shares from operations | | $ | 47,724,912 | |
See accompanying notes to financial statements.
38
Statement of Changes in Net Assets
| | | | | | | | |
| | | Year
Ended
12/31/19 | | | Year Ended 12/31/18 | |
Operations | | | | | | | | |
Net investment income (loss) | | $ | 7,750,537 | | | $ | 7,558,751 | |
Net realized gain (loss) from: | | | | | | | | |
Investments and foreign currency | | | 6,434,133 | | | | 5,021,741 | |
Forward foreign currency contracts | | | 352,936 | | | | 391,667 | |
Futures contracts | | | (277,649 | ) | | | (129,806 | ) |
Swaps | | | 214,335 | | | | 55,387 | |
Change in net unrealized appreciation (depreciation) of: | | | | | | | | |
Investments and foreign currency | | | 36,220,738 | | | | (41,061,152 | ) |
Forward foreign currency contracts | | | (6,464 | ) | | | 57,186 | |
Futures contracts | | | 28,466 | | | | (50,200 | ) |
Swaps | | | (2,992,120 | ) | | | 658,625 | |
Net increase (decrease) in net assets applicable to common shares from operations | | | 47,724,912 | | | | (27,497,801 | ) |
Distributions to Common Shareholders | | | | | | | | |
Dividends | | | (12,694,070 | ) | | | (12,234,545 | ) |
Return of capital | | | (4,476,700 | ) | | | (7,313,269 | ) |
Decrease in net assets applicable to common shares from distributions to common shareholders | | | (17,170,770 | ) | | | (19,547,814 | ) |
Capital Share Transactions | | | | | | | | |
Cost of common shares repurchased or retired | | | — | | | | (88,700 | ) |
Net proceeds from common shares issued to shareholders due to reinvestment of distributions | | | — | | | | 55,017 | |
Net increase (decrease) in net assets applicable to common shares from capital share transactions | | | — | | | | (33,683 | ) |
Net increase (decrease) in net assets applicable to common shares | | | 30,554,142 | | | | (47,079,298 | ) |
Net assets applicable to common shares at the beginning of period | | | 203,731,424 | | | | 250,810,722 | |
Net assets applicable to common shares at the end of period | | $ | 234,285,566 | | | $ | 203,731,424 | |
See accompanying notes to financial statements.
39
Statement of Cash Flows
Year Ended December 31, 2019
| | | | |
Cash Flows from Operating Activities: | | | | |
Net Increase (Decrease) In Net Assets Applicable to Common Shares from Operations | | $ | 47,724,912 | |
Adjustments to reconcile the net increase (decrease) in net assets applicable to common shares from operations to net cash
provided by (used in) operating activities: | | | | |
Purchases of investments | | | (195,342,788 | ) |
Proceeds from sales and maturities of investments | | | 206,331,189 | |
Proceeds from (Purchases of) short-term investments, net | | | (4,038,960 | ) |
Proceeds from (Payments for) closed foreign currency spot contracts | | | 10,033 | |
Capital gain and return of capital distributions from investments | | | 797,234 | |
Amortization (Accretion) of premiums and discounts, net | | | (160,739 | ) |
(Increase) Decrease in: | | | | |
Receivable for dividends | | | 70,295 | |
Receivable for interest | | | 89,043 | |
Receivable for investments sold | | | (53,216 | ) |
Receivable for reclaims | | | 18,043 | |
Other assets | | | 22,441 | |
Increase (Decrease) in: | | | | |
Payable for investments purchased – regular settlement | | | (1,091,215 | ) |
Payable for investments purchased – when-issued/delayed delivery settlement | | | 1,219,505 | |
Payable for variation margin on futures contracts | | | (16 | ) |
Accrued management fees | | | 8,930 | |
Accrued interest on borrowings | | | (939 | ) |
Accrued Trustees fees | | | 3,412 | |
Accrued other expenses | | | 5,012 | |
Net realized (gain) loss from investments and foreign currency | | | (6,434,133 | ) |
Change in net unrealized (appreciation) depreciation of: | | | | |
Investments and foreign currency | | | (36,220,738 | ) |
Forward foreign currency contracts | | | 6,464 | |
Swaps | | | 2,992,120 | |
Net cash provided by (used in) operating activities | | | 15,955,889 | |
Cash Flows from Financing Activities: | | | | |
Increase (Decrease) in cash overdraft | | | 783,731 | |
Cash distributions paid to common shareholders | | | (17,170,770 | ) |
Net cash provided by (used in) financing activities | | | (16,387,039 | ) |
Net Increase (Decrease) in Cash, Cash Denominated in Foreign Currency and Cash Collateral at Brokers | | | (431,150 | ) |
Cash, cash denominated in foreign currency, and cash collateral at brokers at the beginning of period | | | 481,391 | |
Cash, cash denominated in foreign currency, and cash collateral at brokers at the end of period | | | 50,241 | |
| |
| Supplemental Disclosure of Cash Flow Information | | | |
Cash paid for interest on borrowings (excluding borrowing costs) | | $ | 2,961,553 | |
See accompanying notes to financial statements.
40
THIS PAGE INTENTIONALLY LEFT BLANK
41
Financial Highlights
Selected data for a common share outstanding throughout each period:
| | | | | | | | | | | | | | | | | | | | | | | | | | | | | | | | | | | | | | | | | | | | |
| | | | |
| | | | | | Investment Operations | | | Less Distributions to
Common Shareholders | | | Common Share | |
| | | | | | | | | | | |
| | | Beginning
Common
Share
NAV | | | Net
Invest
ment
Income
(Loss)(a) | | | Net
Realized/
Unrealized
Gain (Loss) | | | Total | | | From
Net
Invest
ment
Income | | | From
Accum-
ulated
Net
Realized
Gains | | | Return
of
Capital | | | Total | | | Discount
from
Shares
Repur
chased
and Retired | | | Ending
NAV | | | Ending
Share
Price | |
Year Ended 12/31: | |
2019 | | $ | 10.32 | | | $ | 0.39 | | | $ | 2.03 | | | $ | 2.42 | | | $ | (0.39 | ) | | $ | (0.25 | ) | | $ | (0.23 | ) | | $ | (0.87 | ) | | $ | — | | | $ | 11.87 | | | $ | 10.89 | |
2018 | | | 12.70 | | | | 0.38 | | | | (1.77 | ) | | | (1.39 | ) | | | (0.40 | ) | | | (0.22 | ) | | | (0.37 | ) | | | (0.99 | ) | | | — | * | | | 10.32 | | | | 9.23 | |
2017 | | | 12.54 | | | | 0.47 | | | | 1.03 | | | | 1.50 | | | | (0.51 | ) | | | (0.62 | ) | | | (0.21 | ) | | | (1.34 | ) | | | — | | | | 12.70 | | | | 12.30 | |
2016 | | | 12.53 | | | | 0.46 | | | | 0.62 | | | | 1.08 | | | | (0.49 | ) | | | (0.59 | ) | | | — | | | | (1.08 | ) | | | 0.01 | | | | 12.54 | | | | 11.17 | |
2015 | | | 13.56 | | | | 0.46 | | | | (0.42 | ) | | | 0.04 | | | | (0.85 | ) | | | (0.15 | ) | | | (0.08 | ) | | | (1.08 | ) | | | 0.01 | | | | 12.53 | | | | 10.83 | |
| | | | | | | | |
| | | Borrowings at the End of Period | |
| | | Aggregate
Amount
Outstanding
(000) | | | Asset
Coverage
Per $1,000 | |
Year Ended 12/31: | |
2019 | | $ | 97,900 | | | $ | 3,393 | |
2018 | | | 97,900 | | | | 3,081 | |
2017 | | | 112,900 | | | | 3,222 | |
2016 | | | 112,400 | | | | 3,203 | |
2015 | | | 116,500 | | | | 3,135 | |
42
| | | | | | | | | | | | | | | | | | | | | | |
| | | | | | | Common Share Supplemental Data/
Ratios Applicable to Common Shares | |
Common Share
Total Returns | | | | | | Ratios to Average Net Assets(c) | | | | |
| | | | | |
Based
on
NAV(b) | | | Based
on
Common
Share
Price(b) | | | Ending
Net
Assets
(000) | | | Expenses | | | Net
Investment
Income (Loss) | | | Portfolio
Turnover
Rate(d) | |
| | | | | | | | | | | | | | | | | | | | | | |
| | 23.91 | % | | | 27.97 | % | | $ | 234,286 | | | | 2.75 | % | | | 3.42 | % | | | 62 | % |
| | (11.47 | ) | | | (17.87 | ) | | | 203,731 | | | | 2.76 | | | | 3.21 | | | | 45 | |
| | 12.21 | | | | 22.48 | | | | 250,811 | | | | 2.30 | | | | 3.66 | | | | 46 | |
| | 8.96 | | | | 13.28 | | | | 247,632 | | | | 2.07 | | | | 3.65 | | | | 74 | |
| | 0.39 | | | | 1.24 | | | | 248,703 | | | | 1.91 | | | | 3.43 | | | | 49 | |
| (a) | Per share Net Investment Income (Loss) is calculated using the average daily common shares method. |
| (b) | Total Return Based on Common Share NAV is the combination of changes in common share NAV, reinvested dividend income at NAV and reinvested capital gains distributions at NAV, if any. The last dividend declared in the period, which is typically paid on the first business day of the following month, is assumed to be reinvested at the ending NAV. The actual reinvest price for the last dividend declared in the period may often be based on the Fund’s market price (and not its NAV), and therefore may be different from the price used in the calculation. Total returns are not annualized. |
Total Return Based on Common Share Price is the combination of changes in the market price per common share and the effect of reinvested dividend income and reinvested capital gains distributions, if any, at the average price paid per common share at the time of reinvestment. The last dividend declared in the period, which is typically paid on the first business day of the following month, is assumed to be reinvested at the ending market price. The actual reinvestment for the last dividend declared in the period may take place over several days, and in some instances may not be based on the market price, so the actual reinvestment price may be different from the price used in the calculation. Total returns are not annualized.
| (c) | • Net Investment Income (Loss) ratios reflect income earned and expenses incurred on assets attributable to borrowings (as described in Note 9 – Borrowing Arrangements). |
| | • Each ratio includes the effect of all interest expense paid and other costs related to borrowings as follows: |
| | | | |
Ratios of Borrowings Interest Expense to Average Net Assets Applicable
to Common Shares | |
Year Ended 12/31: | | | | |
2019 | | | 1.36 | % |
2018 | | | 1.34 | |
2017 | | | 0.90 | |
2016 | | | 0.64 | |
2015 | | | 0.47 | |
| (d) | Portfolio Turnover Rate is calculated based on the lesser of long-term purchases or sales (as disclosed in Note 4 – Portfolio Securities and Investments in Derivatives) divided by the average long-term market value during the period. |
| * | Rounds to less than $0.01 per common share. |
See accompanying notes to financial statements.
43
Notes to Financial Statements
1. General Information
Fund Information
Nuveen Diversified Dividend and Income Fund (the “Fund”) is registered under the Investment Company Act of 1940 (the “1940 Act”), as amended, as a diversified closed-end management investment company. The Fund’s common shares are listed on the New York Stock Exchange (“NYSE”) and trade under the ticker symbol “JDD.” The Fund was organized as a Massachusetts business trust on July 18, 2003.
The end of the reporting period for the Fund is December 31, 2019, and the period covered by these Notes to Financial Statements is the fiscal year ended December 31, 2019 (the “current fiscal period”).
Investment Adviser and Sub-Adviser
The Fund’s investment adviser is Nuveen Fund Advisors, LLC (the “Adviser”), a subsidiary of Nuveen, LLC (“Nuveen”). Nuveen is the investment management arm of Teachers Insurance and Annuity Association of America (TIAA). The Adviser has overall responsibility for management of the Fund, oversees the management of the Fund’s portfolio, manages the Fund’s business affairs and provides certain clerical, bookkeeping and other administrative services, and, if necessary, asset allocation decisions.
The Adviser has entered into sub-advisory agreements with NWQ Investment Management Company, LLC (“NWQ”), Security Capital Research & Management Incorporated (“Security Capital”), Symphony Asset Management LLC (“Symphony”) and Wellington Management Company LLP (“Wellington”) (each a “Sub-Adviser” and collectively, the “Sub-Advisers”). NWQ and Symphony are each an affiliate of Nuveen. NWQ manages the global equity income strategy portion of the Fund consisting of a portfolio focused on income producing and dividend paying equity securities. Security Capital manages the real estate investment trust (“REIT”) strategy portion of the Fund consisting of a portfolio focused on dividend-paying common stock REITs. Symphony manages the adjustable rate senior loan strategy portion of the Fund consisting of a portfolio focused on senior loans. Wellington manages the emerging market debt strategy portion of the Fund consisting of a portfolio focused on emerging market sovereign debt. Wellington also manages the Fund’s forward foreign currency strategy. The Adviser is responsible for managing the Fund’s investments in swap contracts.
2. Significant Accounting Policies
The accompanying financial statements were prepared in accordance with accounting principles generally accepted in the United States of America (“U.S. GAAP”), which may require the use of estimates made by management and the evaluation of subsequent events. Actual results may differ from those estimates. The Fund is an investment company and follows the accounting guidance in the Financial Accounting Standards Board (“FASB”) Accounting Standards Codification 946, Financial Services – Investment Companies. The net asset value (“NAV”) for financial reporting purposes may differ from the NAV for processing security and common share transactions. The NAV for financial reporting purposes includes security and common share transactions through the date of the report. Total return is computed based on the NAV used for processing security and common share transactions. The following is a summary of the significant accounting policies consistently followed by the Fund.
Compensation
The Fund pays no compensation directly to those of its trustees who are affiliated with the Adviser or to its officers, all of whom receive remuneration for their services to the Fund from the Adviser or its affiliates. The Fund’s Board of Trustees (the “Board”) has adopted a deferred compensation plan for independent trustees that enables trustees to elect to defer receipt of all or a portion of the annual compensation they are entitled to receive from certain Nuveen-advised funds. Under the plan, deferred amounts are treated as though equal dollar amounts had been invested in common shares of select Nuveen-advised funds.
The Fund makes quarterly cash distributions to common shareholders of a stated dollar amount per share. Subject to approval and oversight by the Board, the Fund seeks to maintain a stable distribution level designed to deliver the long-term return potential of the Fund’s investment strategy through regular quarterly distributions (a “Managed Distribution Program”). Total distributions during a calendar year generally will be made from the Fund’s net investment income, net realized capital gains and net unrealized capital gains in the Fund’s portfolio, if any. The portion of distributions paid attributed to net unrealized gains, if any, is distributed from the Fund’s assets and is treated by shareholders as a nontaxable distribution (“return of capital”) for tax purposes. In the event that total distributions during a calendar year exceed the Fund’s total return on NAV, the difference will reduce NAV per share. If the Fund’s total return on NAV exceeds total distributions during a calendar year, the excess will be reflected as an increase in NAV per share. The final determination of the source and character of all distributions paid by the Fund during the fiscal year is made after the end of the fiscal year and is reflected in the financial statements contained in the annual report as of December 31 each year.
The tax character of Fund distributions for a fiscal year is dependent upon the amount and tax character of distributions received from securities held in the Fund’s portfolio. Distributions received from certain securities in which the Fund invests, most notably real estate investment trust securities, may be characterized for tax purposes as ordinary income, long-term capital gain and/or a return of capital. The issuer of a security reports the tax character of its distributions only once per year, generally during the first two months of the calendar year. The distribution is included in the Fund’s ordinary income until such time the Fund is notified by the issuer of the actual tax character. Dividend income, net realized gain (loss) and unrealized appreciation (depreciation) recognized on the Statement of Operations reflect the amounts of ordinary income, capital gain, and/or return of capital as reported by the issuers of such securities for distributions during the current fiscal period.
44
Distributions to Common Shareholders
Distributions to shareholders are recorded on theex-dividend date. The amount, character and timing of distributions are determined in accordance with federal income tax regulations, which may differ from U.S. GAAP.
Foreign Currency Transactions and Translation
To the extent that the Fund invests in securities and/or contracts that are denominated in a currency other than U.S. dollars, the Fund will be subject to currency risk, which is the risk that an increase in the U.S. dollar relative to the foreign currency will reduce returns or portfolio value. Generally, when the U.S. dollar rises in value against a foreign currency, the Fund’s investments denominated in that currency will lose value because its currency is worth fewer U.S. dollars; the opposite effect occurs if the U.S. dollar falls in relative value. Investments and other assets and liabilities denominated in foreign currencies are converted into U.S. dollars on a spot (i.e. cash) basis at the spot rate prevailing in the foreign currency exchange market at the time of valuation. Purchases and sales of investments and income denominated in foreign currencies are translated into U.S. dollars on the respective dates of such transactions.
The books and records of the Fund are maintained in U.S. dollars. Assets, including investments, and liabilities denominated in foreign currencies are translated into U.S. dollars at the end of each day. Purchases and sales of securities, income and expenses are translated into U.S. dollars at the prevailing exchange rate on the respective dates of the transactions.
Net realized foreign currency gains and losses resulting from changes in exchange rates associated with (i) foreign currency, (ii) investments and (iii) derivatives include foreign currency gains and losses between trade date and settlement date of the transactions, foreign currency transactions, and the difference between the amounts of interest and dividends recorded on the books of the Fund and the amounts actually received are recognized as a component of “Net realized gain (loss) from investments and foreign currency” on the Statement of Operations, when applicable.
The unrealized gains and losses resulting from changes in foreign currency exchange rates and changes in foreign exchange rates associated with (i) investments and (ii) other assets and liabilities are recognized as a component of “Change in net unrealized appreciation (depreciation) of investments and foreign currency” on the Statement of Operations, when applicable. The unrealized gains and losses resulting from changes in foreign exchange rates associated with investments in derivatives are recognized as a component of the respective derivative’s related “Change in net unrealized appreciation (depreciation)” on the Statement of Operations, when applicable.
As of the end of the reporting period, the Fund’s investments in non-U.S. securities were as follows:
| | | | | | | | |
| | | Value | | | % of Total
Investments | |
Country: | | | | | | | | |
Germany | | $ | 11,830,235 | | | | 3.5 | % |
Japan | | | 10,431,905 | | | | 3.1 | |
United Kingdom | | | 9,459,406 | | | | 2.8 | |
Russia | | | 6,990,809 | | | | 2.1 | |
France | | | 5,606,203 | | | | 1.7 | |
China | | | 4,541,935 | | | | 1.4 | |
South Korea | | | 3,452,609 | | | | 1.0 | |
Mexico | | | 3,348,853 | | | | 1.0 | |
United Arab Emirates | | | 2,990,625 | | | | 0.9 | |
Netherlands | | | 2,939,402 | | | | 0.9 | |
Canada | | | 2,755,157 | | | | 0.8 | |
Bermuda | | | 2,718,039 | | | | 0.8 | |
Spain | | | 2,603,186 | | | | 0.8 | |
Turkey | | | 2,501,411 | | | | 0.7 | |
Brazil | | | 2,472,049 | | | | 0.7 | |
Other | | | 65,400,183 | | | | 19.7 | |
Totalnon-U.S. securities | | $ | 140,042,007 | | | | 41.9 | % |
Indemnifications
Under the Fund’s organizational documents, its officers and trustees are indemnified against certain liabilities arising out of the performance of their duties to the Fund. In addition, in the normal course of business, the Fund enters into contracts that provide general indemnifications to other parties. The Fund’s maximum exposure under these arrangements is unknown as this would involve future claims that may be made against the Fund that have not yet occurred. However, the Fund has not had prior claims or losses pursuant to these contracts and expects the risk of loss to be remote.
Investments and Investment Income
Securities transactions are accounted for as of the trade date for financial reporting purposes. Realized gains and losses on securities transactions are based upon the specific identification method. Dividend income is recorded on the ex-dividend date or, for foreign securities, when information is available. Non-cash dividends received in the form of stock, if any, are recognized on the ex-dividend date and recorded at fair value. Interest income, which reflects the amortization of premiums and accretion of discounts for financial reporting purposes, is recorded on an accrual basis. Interest income also reflects payment-in-kind (“PIK”) interest and fee income, if any. PIK interest represents income received in the form of securities in lieu of cash. Fee income consists primarily of amendment fees. Amendment fees are earned as compensation for evaluating and accepting changes to an original senior loan agreement and are recognized when received. Fee income and amendment fees, if any, are recognized as a component of “Interest Income” on the Statement of Operations.
45
Notes to Financial Statements(continued)
Netting Agreements
In the ordinary course of business, the Fund may enter into transactions subject to enforceable master repurchase agreements, International Swaps and Derivative Association, Inc. (ISDA) master agreements or other similar arrangements (“netting agreements”). Generally, the right to offset in netting agreements allows the Fund to offset certain securities and derivatives with a specific counterparty, when applicable, as well as any collateral received or delivered to that counterparty based on the terms of the agreements. Generally, the Fund manages its cash collateral and securities collateral on a counterparty basis.
The Fund’s investments subject to netting agreements as of the end of the reporting period, if any, are further described in Note 4 – Portfolio Securities and Investments in Derivatives.
New Accounting Pronouncements and Rule Issuances
FASB Accounting Standards Update (“ASU”)2017-08 (“ASU2017-08”) Premium Amortization on Purchased Callable Debt Securities
The FASB has issued ASU2017-08, which shortens the premium amortization period for purchasednon-contingently callable debt securities.ASU 2017-08 specifies that the premium amortization period ends at the earliest call date, for purchasednon-contingently callable debt securities.ASU 2017-08 is effective for fiscal years, and interim periods within those fiscal years, beginning after December 15, 2018. During the current fiscal period, ASU 2017- 08 became effective for the Fund and it did not have a material impact on Fund’s financial statements.
Fair Value Measurement: Disclosure Framework
During August 2018, the FASB issued ASU2018-13 (“ASU2018-13”), Fair Value Measurement: Disclosure Framework – Changes to the Disclosure Requirements for Fair Value Measurements. ASU2018-13 modifies the disclosures required by Topic 820, Fair Value Measurements. The amendments in ASU2018-13 are effective for all entities for fiscal years, and interim periods within those fiscal years, beginning after December 15, 2019. Management has early implemented this guidance and it did not have a material impact on the Fund’s financial statements.
3. Investment Valuation and Fair Value Measurements
The fair valuation input levels as described below are for fair value measurement purposes.
The Fund’s investments in securities are recorded at their estimated fair value. Fair value is defined as the price that would be received upon selling an investment or transferring a liability in an orderly transaction to an independent buyer in the principal or most advantageous market for the investment. A three-tier hierarchy is used to maximize the use of observable market data and minimize the use of unobservable inputs and to establish classification of fair value measurements for disclosure purposes. Observable inputs reflect the assumptions market participants would use in pricing the asset or liability. Observable inputs are based on market data obtained from sources independent of the reporting entity. Unobservable inputs reflect the reporting entity’s own assumptions about the assumptions market participants would use in pricing the asset or liability. Unobservable inputs are based on the best information available in the circumstances. The following is a summary of the three-tiered hierarchy of valuation input levels.
| | |
| Level 1 – | | Inputs are unadjusted and prices are determined using quoted prices in active markets for identical securities. |
| Level 2 – | | Prices are determined using other significant observable inputs (including quoted prices for similar securities, interest rates, credit spreads, etc.). |
| Level 3 – | | Prices are determined using significant unobservable inputs (including management’s assumptions in determining the fair value of investments). |
Common stocks and other equity-type securities are valued at the last sales price on the securities exchange on which such securities are primarily traded and are generally classified as Level 1. Securities primarily traded on the Nasdaq National Market (“Nasdaq”) are valued at the Nasdaq Official Closing Price and are generally classified as Level 1. However, securities traded on a securities exchange or Nasdaq for which there were no transactions on a given day or securities not listed on a securities exchange or Nasdaq are valued at the quoted bid price and are generally classified as Level 2. Prices of certain American Depositary Receipts (“ADR”) held by the Fund that trade in the United States are valued based on the last traded price, official closing price or the most recent bid price of the underlying non-U.S.-traded stock, adjusted as appropriate for the underlying-to-ADR conversion ratio and foreign exchange rate, and from time-to-time may also be adjusted further to take into account material events that may take place after the close of the local non-U.S. market but before the close of the NYSE, which may represent a transfer from a Level 1 to a Level 2 security.
Prices of fixed-income securities are provided by an independent pricing service (“pricing service”) approved by the Board. The pricing service establishes a security’s fair value using methods that may include consideration of the following: yields or prices of investments of comparable quality, type of issue, coupon, maturity and rating, market quotes or indications of value from security dealers, evaluations of anticipated cash flows or collateral, general market conditions and other information and analysis, including the obligor’s credit characteristics considered relevant. These securities are generally classified as Level 2. In pricing certain securities, particularly less liquid and lower quality securities, the pricing service may consider information about a security, its issuer or market activity provided by the Adviser. These securities are generally classified as Level 2 or Level 3 depending on the observability of the significant inputs.
Like most fixed-income securities, the senior and subordinated loans in which the Fund invests are not listed on an organized exchange. The secondary market of such investments may be less liquid relative to markets for other fixed-income securities. Consequently, the value of senior and subordinated loans, determined as described above, may differ significantly from the value that would have been determined had there been an active market for that senior loan. These securities are generally classified as Level 2.
46
Prices of forward foreign currency contracts and swap contracts are also provided by a pricing service approved by the Board using the same methods as described above and are generally classified as Level 2.
Investments in investment companies are valued at their respective NAVs on the valuation date and are generally classified as Level 1.
Futures contracts are valued using the closing settlement price or, in the absence of such a price, the last traded price, and are generally classified as Level 1.
Repurchase agreements are valued at contract amount plus accrued interest, which approximates market value. These securities are generally classified as Level 2.
Investments initially valued in currencies other than the U.S. dollar are converted to the U.S. dollar using exchange rates obtained from pricing services. As a result, the NAV of the Fund’s common shares may be affected by changes in the value of currencies in relation to the U.S. dollar. The value of securities traded in markets outside the United States or denominated in currencies other than the U.S. dollar may be affected significantly on a day that the NYSE is closed and an investor is not able to purchase, redeem or exchange common shares. If significant market events occur between the time of determination of the closing price of a foreign security on an exchange and the time that the Fund’s NAV is determined, or if under the Fund’s procedures, the closing price of a foreign security is not deemed to be reliable, the security would be valued at fair value as determined in accordance with procedures established in good faith by the Board. These securities are generally classified as Level 2 or Level 3 depending on the observability of the significant inputs.
Certain securities may not be able to be priced by the pre-established pricing methods as described above. Such securities may be valued by the Board and/or its appointee at fair value. These securities generally include, but are not limited to, restricted securities (securities which may not be publicly sold without registration under the Securities Act of 1933, as amended) for which a pricing service is unable to provide a market price; securities whose trading has been formally suspended; debt securities that have gone into default and for which there is no current market quotation; a security whose market price is not available from a pre-established pricing source; a security with respect to which an event has occurred that is likely to materially affect the value of the security after the market has closed but before the calculation of the Fund’s NAV (as may be the case in non-U.S. markets on which the security is primarily traded) or make it difficult or impossible to obtain a reliable market quotation; and a security whose price, as provided by the pricing service, is not deemed to reflect the security’s fair value. As a general principle, the fair value of a security would appear to be the amount that the owner might reasonably expect to receive for it in a current sale. A variety of factors may be considered in determining the fair value of such securities, which may include consideration of the following: yields or prices of investments of comparable quality, type of issue, coupon, maturity and rating, market quotes or indications of value from security dealers, evaluations of anticipated cash flows or collateral, general market conditions and other information and analysis, including the obligor’s credit characteristics considered relevant. These securities are generally classified as Level 2 or Level 3 depending on the observability of the significant inputs. Regardless of the method employed to value a particular security, all valuations are subject to review by the Board and/or its appointee.
The inputs or methodologies used for valuing securities are not an indication of the risks associated with investing in those securities. The following is a summary of the Fund’s fair value measurements as of the end of the reporting period:
| | | | | | | | | | | | | | | | |
| | �� | Level 1 | | | Level 2 | | | Level 3 | | | Total | |
Long-Term Investments*: | | | | | | | | | | | | | | | | |
Real Estate Investment Trust (REIT) Common Stocks | | $ | 88,682,578 | | | $ | — | | | $ | — | | | $ | 88,682,578 | |
Common Stocks** | | | 49,114,045 | | | | 34,950,537 | | | | 13,271 | | | | 84,077,853 | |
Emerging Market Debt and Foreign Corporate Bonds | | | — | | | | 81,336,628 | | | | — | | | | 81,336,628 | |
Variable Rate Senior Loan Interests | | | — | | | | 68,882,852 | | | | — | | | | 68,882,852 | |
Convertible Preferred Securities | | | 1,879,921 | | | | — | | | | — | | | | 1,879,921 | |
Structured Notes** | | | — | | | | 1,249,845 | | | | — | | | | 1,249,845 | |
Corporate Bonds | | | — | | | | 117,140 | | | | — | *** | | | 117,140 | |
Common Stock Rights** | | | — | | | | 41,984 | | | | — | | | | 41,984 | |
Warrants** | | | — | | | | 11,466 | | | | — | | | | 11,466 | |
| | | | |
Short-Term Investments: | | | | | | | | | | | | | | | | |
Investment Companies | | | 4,388,063 | | | | — | | | | — | | | | 4,388,063 | |
Repurchase Agreements | | | — | | | | 3,353,955 | | | | — | | | | 3,353,955 | |
| | | | |
Investments in Derivatives: | | | | | | | | | | | | | | | | |
Forward Foreign Currency Contracts**** | | | — | | | | (33,492 | ) | | | — | | | | (33,492 | ) |
Futures Contracts**** | | | 14,694 | | | | — | | | | — | | | | 14,694 | |
Interest Rate Swaps**** | | | — | | | | (1,633,704 | ) | | | — | | | | (1,633,704 | ) |
Total | | $ | 144,079,301 | | | $ | 188,277,211 | | | $ | 13,271 | | | $ | 332,369,783 | |
| * | Refer to the Fund’s Portfolio of Investments for industry and country classifications, where applicable. |
| ** | Refer to the Fund’s Portfolio of Investments for securities classified as Level 2 and/or Level 3, when applicable. |
| *** | Refer to the Fund’s Portfolio of Investments for securities classified as Level 3. Value equals zero as of the end of the reporting period. |
| **** | Represents net unrealized appreciation (depreciation) as reported in the Fund’s Portfolio of Investments. |
47
Notes to Financial Statements(continued)
4. Portfolio Securities and Investments in Derivatives
Portfolio Securities
Repurchase Agreements
In connection with transactions in repurchase agreements, it is the Fund’s policy that its custodian take possession of the underlying collateral securities, the fair value of which exceeds the principal amount of the repurchase transaction, including accrued interest, at all times. If the counterparty defaults, and the fair value of the collateral declines, realization of the collateral may be delayed or limited.
The following table presents the repurchase agreements for the Fund that are subject to netting agreements as of the end of the reporting period, and the collateral delivered related to those repurchase agreements.
| | | | | | | | | | | | |
| Counterparty | | Short-Term
Investments, at Value | | | Collateral
Pledged (From)
Counterparty* | | | Net
Exposure | |
Fixed Income Clearing Corporation | | $ | 3,353,955 | | | $ | (3,353,955 | ) | | $ | — | |
| * | As of the end of the reporting period, the value of the collateral pledged from the counterparty exceeded the value of the repurchase agreements. Refer to the Fund’s Portfolio of Investments for details on the repurchase agreements. |
Zero Coupon Securities
A zero coupon security does not pay a regular interest coupon to its holders during the life of the security. Income to the holder of the security comes from accretion of the difference between the original purchase price of the security at issuance and the par value of the security at maturity and is effectively paid at maturity. The market prices of zero coupon securities generally are more volatile than the market prices of securities that pay interest periodically.
Investment Transactions
Long-term purchases and sales (including maturities but excluding derivative transactions) during the current fiscal period aggregated $195,342,788 and $206,331,189, respectively.
The Fund may purchase securities on a when-issued or delayed-delivery basis. Securities purchased on a when-issued or delayed-delivery basis may have extended settlement periods; interest income is not accrued until settlement date. Any securities so purchased are subject to market fluctuation during this period. The Fund has earmarked securities in its portfolio with a current value at least equal to the amount of the when-issued/delayed-delivery purchase commitments. If the Fund has outstanding when-issued/delayed-delivery purchases commitments as of the end of the reporting period, such amounts are recognized on the Statement of Assets and Liabilities.
Investments in Derivatives
The Fund is authorized to invest in certain derivative instruments, such as futures, options and swap contracts. The Fund limits its investments in futures, options on futures and swap contracts to the extent necessary for the Adviser to claim the exclusion from registration by the Commodity Futures Trading Commission as a commodity pool operator with respect to the Fund. The Fund records derivative instruments at fair value, with changes in fair value recognized on the Statement of Operations, when applicable. Even though the Fund’s investments in derivatives may represent economic hedges, they are not considered to be hedge transactions for financial reporting purposes.
Forward Foreign Currency Contracts
The Fund is authorized to enter into forward foreign currency contracts (“forward contracts”) under two circumstances: (i) when the Fund enters into a contract for the purchase or sale of a security denominated in a foreign currency to “lock in” the U.S. exchange rate of the transaction, with such period being a short-dated contract covering the period between transaction date and settlement date or (ii) when the Sub-Adviser believes that the currency of a particular foreign country may experience a substantial movement against the U.S. dollar or against another foreign currency.
A forward contract is an agreement between two parties to purchase or sell a specified quantity of a currency at or before a specified date in the future at a specified price. Forward contracts are typically traded in the over-the-counter (“OTC”) markets and all details of the contract are negotiated between the counterparties to the agreement. Accordingly, the forward contracts are valued by reference to the contracts traded in the OTC markets. The contractual obligations of a buyer or seller may generally be satisfied by taking or making physical delivery of the underlying currency, establishing an opposite position in the contract and recognizing the profit or loss on both positions simultaneously on the delivery date or, in some instances, paying a cash settlement before the designated date of delivery.
Forward contracts are valued daily at the forward rate. The net amount recorded on these transactions is recognized as a component of “Unrealized appreciation and/or depreciation on forward foreign currency contracts” on the Statement of Assets and Liabilities. The change in value of the forward contracts during the reporting period is recognized as a component of “Change in net unrealized appreciation (depreciation) of forward foreign currency
48
contracts” on the Statement of Operations. When the contract is closed or offset with the same counterparty, the Fund recognizes the difference between the value of the contract at the time it was entered and the value at the time it was closed or offset as a component of “Net realized gain (loss) from forward foreign currency contracts” on the Statement of Operations.
Forward contracts will generally not be entered into for terms greater than three months, but may have maturities of up to six months or more. The use of forward contracts does not eliminate fluctuations in the underlying prices of the Fund’s investment securities; however, it does establish a rate of exchange that can be achieved in the future. The use of forward contracts involves the risk that anticipated currency movements will not be accurately predicted. A forward contract would limit the risk of loss due to a decline in the value of a particular currency; however, it also would limit any potential gain that might result should the value of the currency increase instead of decrease. These contracts may involve market risk in excess of the unrealized appreciation or depreciation reflected on the Statement of Assets and Liabilities. Forward contracts are subject to counterparty risk if the counterparty fails to perform as specified in the contract due to financial impairment or other reason.
During the current fiscal period, the Fund continued to utilize forward foreign currency contracts to reduce the currency risk of select local currency denominated emerging market bonds, as well as to actively manage certain currency exposures in an attempt to benefit from potential appreciation.
The average notional amount of forward foreign currency contracts outstanding during the current fiscal period was as follows:
| | | | |
Average notional amount of forward foreign currency contracts outstanding* | | | $8,069,668 | |
| * | The average notional amount is calculated based on the outstanding notional at the beginning of the current fiscal period and at the end of each fiscal quarter within the current fiscal period. |
The following table presents the fair value of forward foreign currency contracts held by the Fund as of the end of the reporting period, the location of these instruments on the Statement of Assets and Liabilities and the primary underlying risk exposure.
| | | | | | | | | | | | | | | | | | |
| | | | | Location on the Statement of Assets and Liabilities | |
Underlying Risk Exposure | | Derivative Instrument | | Asset Derivatives | | | | | | (Liability) Derivatives | |
| | Location | | Value | | | | | | Location | | Value | |
Foreign currency exchange rate | | Forward contracts | | Unrealized appreciation on forward foreign currency contracts | | $ | 44,507 | | | | | | | Unrealized depreciation on forward foreign currency contracts | | $ | (77,999 | ) |
The following table presents the forward foreign currency contracts subject to netting agreements and the collateral delivered related to those forward foreign currency contracts as of the end of the reporting period.
| | | | | | | | | | | | | | | | | | | | |
| Counterparty | | Gross
Unrealized
Appreciation on
Forward Foreign
Currency Contracts* | | | Gross
Unrealized
(Depreciation) on
Forward Foreign
Currency Contracts* | | | Net Unrealized
Appreciation
(Depreciation) on
Forward Foreign
Currency Contracts | | | Collateral
Pledged
to (from)
Counterparty | | | Net
Exposure | |
Bank of America, N.A. | | $ | 4,017 | | | $ | (1,407 | ) | | $ | 2,610 | | | $ | — | | | $ | 2,610 | |
Barclays Bank PLC | | | 795 | | | | — | | | | 795 | | | | — | | | | 795 | |
Citibank N.A. | | | 7,767 | | | | (26,085 | ) | | | (18,318 | ) | | | — | | | | (18,318 | ) |
Goldman Sachs Bank USA | | | 6,802 | | | | (2,184 | ) | | | 4,618 | | | | — | | | | 4,618 | |
HSBC Bank USA, National Association | | | — | | | | (5,851 | ) | | | (5,851 | ) | | | — | | | | (5,851 | ) |
JPMorgan Chase Bank N.A. | | | 15,203 | | | | (39,962 | ) | | | (24,759 | ) | | | — | | | | (24,759 | ) |
Morgan Stanley Capital Services LLC | | | 4,257 | | | | — | | | | 4,257 | | | | — | | | | 4,257 | |
Royal Bank of Canada | | | 5,666 | | | | — | | | | 5,666 | | | | — | | | | 5,666 | |
State Street Bank and Trust Company | | | — | | | | (2,510 | ) | | | (2,510 | ) | | | — | | | | (2,510 | ) |
| Total | | $ | 44,507 | | | $ | (77,999 | ) | | $ | (33,492 | ) | | $ | — | | | $ | (33,492 | ) |
| * | Represents gross unrealized appreciation (depreciation) for the counterparty as reported in the Fund’s Portfolio of Investments. |
The following table presents the amount of net realized gain (loss) and change in net unrealized appreciation (depreciation) recognized on forward foreign currency contracts on the Statement of Operations during the current fiscal period, and the primary underlying risk exposure.
| | | | | | | | | | |
| Underlying Risk Exposure | | Derivative
Instrument | | Net Realized
Gain (Loss)
from Forward
Foreign Currency Contracts | | | Change in Net
Unrealized Appreciation
(Depreciation) of
Forward Foreign Currency
Contracts | |
Foreign currency rate | | Forward contracts | | $ | 352,936 | | | $ | (6,464 | ) |
49
Notes to Financial Statements(continued)
Futures Contracts
Upon execution of a futures contract, the Fund is obligated to deposit cash or eligible securities, also known as “initial margin,” into an account at its clearing broker equal to a specified percentage of the contract amount. Cash held by the broker to cover initial margin requirements on open futures contracts, if any, is recognized as “Cash collateral at brokers for investments in futures contracts” on the Statement of Assets and Liabilities. Investments in futures contracts obligate the Fund and the clearing broker to settle monies on a daily basis representing changes in the prior days “mark-to-market” of the open contracts. If the Fund has unrealized appreciation the clearing broker would credit the Fund’s account with an amount equal to appreciation and conversely if the Fund has unrealized depreciation the clearing broker would debit the Fund’s account with an amount equal to depreciation. These daily cash settlements are also known as “variation margin.” Variation margin is recognized as a receivable and/or payable for “Variation margin on futures contracts” on the Statement of Assets and Liabilities.
During the period the futures contract is open, changes in the value of the contract are recognized as an unrealized gain or loss by “marking-to-market” on a daily basis to reflect the changes in market value of the contract, which is recognized as a component of “Change in net unrealized appreciation (depreciation) of futures contracts” on the Statement of Operations. When the contract is closed or expired, the Fund records a realized gain or loss equal to the difference between the value of the contract on the closing date and value of the contract when originally entered into, which is recognized as a component of “Net realized gain (loss) from futures contracts” on the Statement of Operations.
Risks of investments in futures contracts include the possible adverse movement in the price of the securities or indices underlying the contracts, the possibility that there may not be a liquid secondary market for the contracts and/or that a change in the value of the contract may not correlate with a change in the value of the underlying securities or indices.
During the current fiscal period, the Fund used futures on U.S. and German interest rates as part of an overall portfolio construction strategy to reduce interest rate sensitivity and manage yield curve exposure.
The average notional amount of futures contracts outstanding during the current fiscal period was as follows:
| | | | |
Average notional amount of futures contracts outstanding* | | | $3,453,691 | |
| * | The average notional amount is calculated based on the absolute aggregate notional of contracts outstanding at the beginning of the current fiscal period and at the end of each quarter within the current fiscal period. |
The following table presents the fair value of all futures contracts held by the Fund as of the end of the reporting period, the location of these instruments on the Statement of Assets and Liabilities and the primary underlying risk exposure.
| | | | | | | | | | | | | | | | | | |
| | | | | Location on the Statement of Assets and Liabilities | |
Underlying Risk Exposure | | Derivative Instrument | | Asset Derivatives | | | | | | (Liability) Derivatives | |
| | Location | | Value | | | | | | Location | | Value | |
| Interest rate | | Futures contracts | | Cash collateral at brokers for investments in futures contracts* | | | $14,694 | | | | | | | — | | $ | — | |
| * | Value represents unrealized appreciation (depreciation) of futures contracts as reported in the Fund’s Portfolio of Investments and not the asset and/or liability derivative location as described in the table above. |
The following table presents the amount of net realized gain (loss) and change in net unrealized appreciation (depreciation) recognized on futures contracts on the Statement of Operations during the current fiscal period, and the primary underlying risk exposure.
| | | | | | | | | | |
| Underlying Risk Exposure | | Derivative
Instrument | | Net Realized
Gain (Loss)
from Futures
Contracts | | | Change in Net
Unrealized Appreciation
(Depreciation) of
Futures Contracts | |
Interest rate | | Futures contracts | | $ | (277,649 | ) | | $ | 28,466 | |
Interest Rate Swap Contracts
Interest rate swap contracts involve the Fund’s agreement with the counterparty to pay or receive a fixed rate payment in exchange for the counterparty receiving or paying a variable rate payment. Forward interest rate swap contracts involve the Fund’s agreement with a counterparty to pay, in the future, a fixed or variable rate payment in exchange for the counterparty paying the Fund a variable or fixed rate payment, the accruals for which would begin at a specified date in the future (the “effective date”).
The amount of the payment obligation for an interest rate swap is based on the notional amount and the termination date of the contract. Interest rate swap contracts do not involve the delivery of securities or other underlying assets or principal. Accordingly, the risk of loss with respect to the swap counterparty on such transactions is limited to the net amount of interest payments that the Fund is to receive.
50
Interest rate swap contracts are valued daily. Upon entering into an interest rate swap contract (and beginning on the effective date for a forward interest rate swap contract), the Fund accrues the fixed rate payment expected to be paid or received and the variable rate payment expected to be received or paid on the interest rate swap contracts on a daily basis, and recognizes the daily change in the fair value of the Fund’s contractual rights and obligations under the contracts. For an OTC swap that is not cleared through a clearing house (“OTC Uncleared”), the amount recorded on these transactions is recognized on the Statement of Assets and Liabilities as a component of “Unrealized appreciation or depreciation on interest rate swaps.”
Upon the execution of an OTC swap cleared through a clearing house (“OTC Cleared”), the Fund is obligated to deposit cash or eligible securities, also known as “initial margin,” into an account at its clearing broker equal to a specified percentage of the contract amount. Cash deposited by the Fund to cover initial margin requirements on open swap contracts, if any, is recognized as a component of “Cash collateral at brokers for investments in swaps” on the Statement of Assets and Liabilities. Investments in OTC Cleared swaps obligate the Fund and the clearing broker to settle monies on a daily basis representing changes in the prior day’s “mark-to-market” of the swap contract. If the Fund has unrealized appreciation, the clearing broker will credit the Fund’s account with an amount equal to the appreciation. Conversely, if the Fund has unrealized depreciation, the clearing broker will debit the Fund’s account with an amount equal to the depreciation. These daily cash settlements are also known as “variation margin.” Variation margin for OTC Cleared swaps is recognized as a receivable and/or payable for “Variation margin on swap contracts” on the Statement of Assets and Liabilities. Upon the execution of an OTC Uncleared swap, neither the Fund nor the counterparty is required to deposit initial margin as the trades are recorded bilaterally between both parties to the swap contract, and the terms of the variation margin are subject to a predetermined threshold negotiated by the Fund and the counterparty. Variation margin for OTC Uncleared swaps is recognized as a component of “Unrealized appreciation or depreciation on interest rate swaps” as described in the preceding paragraph.
The net amount of periodic payments settled in cash are recognized as a component of “Net realized gain (loss) from swaps” on the Statement of Operations, in addition to the net realized gain or loss recorded upon the termination of the swap contract. For tax purposes, payments expected to be received or paid on the swap contracts are treated as ordinary income or expense, respectively. Changes in the value of the swap contracts during the fiscal period are recognized as a component of “Change in net unrealized appreciation (depreciation) of swaps” on the Statement of Operations. In certain instances, payments are made or received upon entering into the swap contract to compensate for differences between the stated terms of the swap agreements and prevailing market conditions (credit spreads, currency exchange rates, interest rates, and other relevant factors). Payments received or made at the beginning of the measurement period, if any, are recognized as “Interest rate swaps premiums received and/or paid” on the Statement of Assets and Liabilities.
During the current fiscal period, the Fund continued to utilize forward starting interest rate swap contracts to partially hedge its future interest cost of leverage, which is through the use of bank borrowings.
The average notional amount of interest rate swap contracts outstanding during the current fiscal period was as follows:
| | | | |
Average notional amount of interest rate swap contracts outstanding* | | | $56,200,000 | |
| * | The average notional amount is calculated based on the outstanding notional at the beginning of the current fiscal period and at the end of each fiscal quarter within the current fiscal period. |
The following table presents the fair value of all swap contracts held by the Fund as of the end of the reporting period, the location of these instruments on the Statement of Assets and Liabilities and the primary underlying risk exposure.
| | | | | | | | | | | | | | | | | | |
| | | | | Location on the Statement of Assets and Liabilities | |
Underlying Risk Exposure | | Derivative Instrument | | Asset Derivatives | | | | | | (Liability) Derivatives | |
| | Location | | Value | | | | | | Location | | Value | |
| Interest rate | | Swaps (OTC Uncleared) | | — | | | — | | | | | | | Unrealized depreciation on interest rate swaps** | | $ | (1,633,704 | ) |
| ** | Some swap contracts require a counterparty to pay or receive a premium, which is disclosed on the Statement of Assets and Liabilities, when applicable and is not reflected in the cumulative unrealized appreciation (depreciation) presented above. |
The following table presents the swap contacts subject to netting agreements and the collateral delivered related to those swap contracts as of the end of the reporting period.
| | | | | | | | | | | | | | | | | | | | | | | | |
| | | | | | | | | | | | Gross Amount Not Offset on the
Statement of Assets and Liabilities | | | | |
| Counterparty | | Gross
Unrealized
Appreciation on
Interest Rate
Swaps*** | | | Gross
Unrealized
(Depreciation) on
Interest Rate
Swaps*** | | | Net
Unrealized
Appreciation
(Depreciation) on
Interest Rate
Swaps | | | Interest
Rate Swaps
Premiums
Paid | | | Collateral
Pledged
to (from)
Counterparty | | | Net
Exposure | |
JPMorgan Chase Bank, N.A. | | $ | — | | | $ | (1,633,704 | ) | | $ | (1,633,704 | ) | | $ | — | | | $ | 1,633,704 | | | $ | — | |
| *** | Represents gross unrealized appreciation (depreciation) for the counterparty as reported in the Fund’s Portfolio of Investments. |
51
Notes to Financial Statements(continued)
The following table presents the amount of net realized gain (loss) and change in net unrealized appreciation (depreciation) recognized on swap contracts on the Statement of Operations during the current fiscal period, and the primary underlying risk exposure.
| | | | | | | | | | |
| Underlying Risk Exposure | | Derivative
Instrument | | Net Realized Gain (Loss)
from Swaps | | | Change in Net
Unrealized Appreciation
(Depreciation) of
Swaps | |
Interest rate | | Swaps | | $ | 214,335 | | | $ | (2,992,120 | ) |
Market and Counterparty Credit Risk
In the normal course of business the Fund may invest in financial instruments and enter into financial transactions where risk of potential loss exists due to changes in the market (market risk) or failure of the other party to the transaction to perform (counterparty credit risk). The potential loss could exceed the value of the financial assets recorded on the financial statements. Financial assets, which potentially expose the Fund to counterparty credit risk, consist principally of cash due from counterparties on forward, option and swap transactions, when applicable. The extent of the Fund’s exposure to counterparty credit risk in respect to these financial assets approximates their carrying value as recorded on the Statement of Assets and Liabilities.
The Fund helps manage counterparty credit risk by entering into agreements only with counterparties the Adviser believes have the financial resources to honor their obligations and by having the Adviser monitor the financial stability of the counterparties. Additionally, counterparties may be required to pledge collateral daily (based on the daily valuation of the financial asset) on behalf of the Fund with a value approximately equal to the amount of any unrealized gain above a pre-determined threshold. Reciprocally, when the Fund has an unrealized loss, the Fund has instructed the custodian to pledge assets of the Fund as collateral with a value approximately equal to the amount of the unrealized loss above a pre-determined threshold. Collateral pledges are monitored and subsequently adjusted if and when the valuations fluctuate, either up or down, by at least the pre-determined threshold amount.
5. Fund Shares
Common Shares Transactions
Transactions in common shares during the current and prior fiscal period were as follows:
| | | | | | | | |
| | | Year Ended
12/31/19 | | | Year Ended
12/31/18 | |
Common shares: | | | | | | | | |
Issued to shareholders due to reinvestment of distributions | | | — | | | | 4,584 | |
Repurchased and retired | | | — | | | | (10,000 | ) |
Weighted average common share: | | | | | | | | |
Price per share repurchased and retired | | $ | — | | | $ | 8.85 | |
Discount per share repurchased and retired | | | — | % | | | 15.63 | % |
6. Income Tax Information
The Fund intends to distribute substantially all of its net investment company taxable income to shareholders and to otherwise comply with the requirements of Subchapter M of the Internal Revenue Code applicable to regulated investment companies. In any year when the Fund realizes net capital gains, the Fund may choose to distribute all or a portion of its net capital gains to shareholders, or alternatively, to retain all or a portion of its net capital gains and pay federal corporate income taxes on such retained gains.
For all open tax years and all major taxing jurisdictions, management of the Fund has concluded that there are no significant uncertain tax positions that would require recognition in the financial statements. Open tax years are those that are open for examination by taxing authorities (i.e., generally the last four tax year ends and the interim tax period since then). Furthermore, management of the Fund is also not aware of any tax positions for which it is reasonably possible that the total amounts of unrecognized tax benefits will significantly change in the next twelve months.
The following information is presented on an income tax basis. Differences between amounts for financial statement and federal income tax purposes are primarily due to recognition of premium amortization and timing differences in recognizing certain gains and losses on investment transactions. To the extent that differences arise that are permanent in nature, such amounts are reclassified within the capital accounts as detailed below. Temporary differences do not require reclassification. Temporary and permanent differences do not impact the NAV of the Fund.
The table below presents the cost and unrealized appreciation (depreciation) of the Fund’s investment portfolio, as determined on a federal income tax basis as of December 31, 2019.
52
For purposes of this disclosure, derivative tax cost is generally the sum of any upfront fees or premiums exchanged and any amounts unrealized for income statement reporting but realized in income and/or capital gains for tax reporting. If a particular derivative category does not disclose any tax unrealized appreciation or depreciation, the change in value of those derivatives have generally been fully realized for tax purposes.
| | | | |
Tax cost of investments | | $ | 299,706,806 | |
Gross unrealized: | | | | |
Appreciation | | $ | 43,217,718 | |
Depreciation | | | (10,554,741 | ) |
Net unrealized appreciation (depreciation) of investments | | $ | 32,662,977 | |
Permanent differences, primarily due to foreign currency transactions, distributions reallocations, investments in partnerships, investments in passive foreign investment companies, treatment of notional principal contracts, and bond premium amortization adjustments, resulted in reclassifications among the Fund’s components of common share net assets as of December 31, 2019, the Fund’s tax year end.
The tax components of undistributed net ordinary income and net long-term capital gains as of December 31, 2019, the Fund’s tax year end, were as follows:
| | | | |
Undistributed net ordinary income | | $ | — | |
Undistributed net long-term capital gains | | | — | |
The tax character of distributions paid during the Fund’s tax years ended December 31, 2019 and December 31, 2018 was designated for purposes of the dividends paid deduction as follows:
| | | | |
| 2019 | | | |
Distributions from net ordinary income¹ | | $ | 8,740,744 | |
Distributions from net long-term capital gains2 | | | 3,953,326 | |
Return of capital | | | 4,476,700 | |
| |
| 2018 | | | |
Distributions from net ordinary income1 | | $ | 7,847,651 | |
Distributions from net long-term capital gains | | | 4,386,894 | |
Return of capital | | | 7,313,269 | |
|
1 Net ordinary income consists of net taxable income derived from dividends, interest, and net short-term capital gains, if any. | |
|
2 The Fund designates as long-term capital gain dividend, pursuant to Internal Revenue Code Section 852(b)(3), the amount necessary to reduce earnings and profits of the Fund related to net capital gain to zero for the tax year ended December 31, 2019. | |
7. Management Fees
The Fund’s management fee compensates the Adviser for overall investment advisory and administrative services and general office facilities. The Sub-Advisers are compensated for their services to the Fund from the management fees paid to the Adviser.
The Fund’s management fee consists of two components – a fund-level fee, based only on the amount of assets within the Fund, and a complex-level fee, based on the aggregate amount of all eligible fund assets managed by the Adviser. This pricing structure enables Fund shareholders to benefit from growth in the assets within the Fund as well as from growth in the amount of complex-wide assets managed by the Adviser.
The annual fund-level fee, payable monthly, is calculated according to the following schedule:
| | | | |
| Average Daily Managed Assets* | | Fund-Level Fee Rate | |
For the first $500 million | | | 0.7000 | % |
For the next $500 million | | | 0.6750 | |
For the next $500 million | | | 0.6500 | |
For the next $500 million | | | 0.6250 | |
For managed assets over $2 billion | | | 0.6000 | |
53
Notes to Financial Statements(continued)
The annual complex-level fee, payable monthly, is calculated by multiplying the current complex-wide fee rate, determined according to the following schedule by the Fund’s daily managed assets:
| | | | |
| Complex-Level Eligible Asset Breakpoint Level* | | Effective Complex-Level Fee
Rate at Breakpoint Level | |
$55 billion | | | 0.2000 | % |
$56 billion | | | 0.1996 | |
$57 billion | | | 0.1989 | |
$60 billion | | | 0.1961 | |
$63 billion | | | 0.1931 | |
$66 billion | | | 0.1900 | |
$71 billion | | | 0.1851 | |
$76 billion | | | 0.1806 | |
$80 billion | | | 0.1773 | |
$91 billion | | | 0.1691 | |
$125 billion | | | 0.1599 | |
$200 billion | | | 0.1505 | |
$250 billion | | | 0.1469 | |
$300 billion | | | 0.1445 | |
| * | For the complex-level fees, managed assets include closed-end fund assets managed by the Adviser that are attributable to certain types of leverage. For these purposes, leverage includes the funds’ use of preferred stock and borrowings and certain investments in the residual interest certificates (also called inverse floating rate securities) in tender option bond (TOB) trusts, including the portion of assets held by a TOB trust that has been effectively financed by the trust’s issuance of floating rate securities, subject to an agreement by the Adviser as to certain funds to limit the amount of such assets for determining managed assets in certain circumstances. The complex-level fee is calculated based upon the aggregate daily managed assets of all Nuveen open-end and closed-end funds that constitute “eligible assets.” Eligible assets do not include assets attributable to investments in other Nuveen funds or assets in excess of a determined amount (originally $2 billion) added to the Nuveen fund complex in connection with the Adviser’s assumption of the management of the former First American Funds effective January 1, 2011, but do not included certain assets of certain Nuveen funds that were reorganized into funds advised by an affiliate of the Adviser during the 2019 calendar year. As of December 31, 2019, the complex-level fee for the Fund was 0.1562%. |
8. Senior Loan Commitments
Unfunded Commitments
Pursuant to the terms of certain of the variable rate senior loan agreements, the Fund may have unfunded senior loan commitments. The Fund will maintain with its custodian, cash, liquid securities and/or liquid senior loans having an aggregate value at least equal to the amount of unfunded senior loan commitments. As of the end of the reporting period, the Fund had no such outstanding unfunded senior loan commitments.
Participation Commitments
With respect to the senior loans held in the Fund’s portfolio, the Fund may: 1) invest in assignments; 2) act as a participant in primary lending syndicates; or 3) invest in participations. If the Fund purchases a participation of a senior loan interest, the Fund would typically enter into a contractual agreement with the lender or other third party selling the participation, rather than directly with the borrower. As such, the Fund not only assumes the credit risk of the borrower, but also that of the selling participant or other persons interpositioned between the Fund and the borrower. As of the end of the reporting period, the Fund had no such outstanding participation commitments.
9. Borrowing Arrangements
Borrowing
The Fund has entered into a borrowing arrangement as a means of leverage.
As of the end of the reporting period, the Fund has a $115,000,000 (maximum commitment amount) committed 364-day revolving line of credit (“Borrowing”) with its custodian bank. As of the end of the reporting period, the outstanding balance on these Borrowings was $97,900,000.
During May 2019, the Fund renewed the Borrowings with its custodian bank through May 15, 2020. The Fund incurred a 0.05% upfront fee based on the maximum commitment amount of the Borrowings.
Prior to the Renewal Date, interest was charged on the Borrowings drawn amount at a rate per annum equal to the higher of (a) one-month LIBOR rate plus 0.75% or (b) the Federal Funds rate plus 0.75%. The Fund also accrued a 0.15% per annum commitment fee on the undrawn balance based on the maximum commitment amount of the Borrowings to the extent the unused portion of the Borrowings is less than 50% of the maximum commitment amount, otherwise the per annum commitment fee is 0.25%.
54
Effective on the Renewal Date, Interest is charged on the Borrowings drawn amount at a rate per annum equal to the higher of (a) one-month LIBOR rate plus 0.70% or (b) the Federal Funds Rate plus 0.70%. The Fund also accrued a 0.15% per annum commitment fee on the undrawn balance based on the maximum commitment amount of the Borrowings to the extent the unused portion of the Borrowings is less than 50% of the maximum commitment amount, otherwise the per annum commitment fee is 0.25%.
During the current fiscal period, the average daily balance outstanding (which was for the entire reporting period) and average annual interest rate on these Borrowings was $97,900,000 and 2.98%, respectively.
In order to maintain these Borrowings, the Fund must meet certain collateral, asset coverage and other requirements. Borrowings outstanding are fully secured by assets in the Fund’s portfolio of investments.
Borrowings outstanding are recognized as “Borrowings” on the Statement of Assets and Liabilities. Interest expense, commitment fees and the amendment fee are each recognized as a component of “Interest expense on borrowings” on the Statement of Operations.
Inter-Fund Borrowing and Lending
The Securities and Exchange Commission (“SEC”) has granted an exemptive order permitting registered open-end and closed-end Nuveen funds to participate in an inter-fund lending facility whereby the Nuveen funds may directly lend to and borrow money from each other for temporary purposes (e.g., to satisfy redemption requests or when a sale of securities “fails,” resulting in an unanticipated cash shortfall) (the “Inter-Fund Program”). The closed-end Nuveen funds, including the Fund covered by this shareholder report, will participate only as lenders, and not as borrowers, in the Inter-Fund Program because such closed-end funds rarely, if ever, need to borrow cash to meet redemptions. The Inter-Fund Program is subject to a number of conditions, including, among other things, the requirements that (1) no fund may borrow or lend money through the Inter-Fund Program unless it receives a more favorable interest rate than is typically available from a bank or other financial institution for a comparable transaction; (2) no fund may borrow on an unsecured basis through the Inter-Fund Program unless the fund’s outstanding borrowings from all sources immediately after the inter-fund borrowing total 10% or less of its total assets; provided that if the borrowing fund has a secured borrowing outstanding from any other lender, including but not limited to another fund, the inter-fund loan must be secured on at least an equal priority basis with at least an equivalent percentage of collateral to loan value; (3) if a fund’s total outstanding borrowings immediately after an inter-fund borrowing would be greater than 10% of its total assets, the fund may borrow through the inter-fund loan on a secured basis only; (4) no fund may lend money if the loan would cause its aggregate outstanding loans through the Inter-Fund Program to exceed 15% of its net assets at the time of the loan; (5) a fund’s inter-fund loans to any one fund shall not exceed 5% of the lending fund’s net assets; (6) the duration of inter-fund loans will be limited to the time required to receive payment for securities sold, but in no event more than seven days; and (7) each inter-fund loan may be called on one business day’s notice by a lending fund and may be repaid on any day by a borrowing fund. In addition, a Nuveen fund may participate in the Inter-Fund Program only if and to the extent that such participation is consistent with the fund’s investment objective and investment policies. The Board is responsible for overseeing the Inter-Fund Program.
The limitations detailed above and the other conditions of the SEC exemptive order permitting the Inter-Fund Program are designed to minimize the risks associated with Inter-Fund Program for both the lending fund and the borrowing fund. However, no borrowing or lending activity is without risk. When a fund borrows money from another fund, there is a risk that the loan could be called on one day’s notice or not renewed, in which case the fund may have to borrow from a bank at a higher rate or take other actions to payoff such loan if an inter-fund loan is not available from another fund. Any delay in repayment to a lending fund could result in a lost investment opportunity or additional borrowing costs.
During the current reporting period, the Fund did not enter into any inter-fund loan activity.
55
Additional Fund Information(Unaudited)
| | | | | | | | | | |
| Board of Trustees | | | | | | | | | | |
Jack B. Evans | | William C. Hunter | | Albin F. Moschner | | John K. Nelson | | Judith M. Stockdale | | |
Carole E. Stone | | Terence J. Toth | | Margaret L. Wolff | | Robert C. Young* | | | | |
| * | Effective February 27, 2020. |
| | | | | | | | |
| | | | | |
Investment Adviser Nuveen Fund Advisors, LLC
333 West Wacker Drive
Chicago, IL 60606 | | Custodian State Street Bank
& Trust Company One Lincoln Street Boston, MA 02111 | | Legal Counsel Chapman and Cutler LLP
Chicago, IL 60603 | | Independent Registered
Public Accounting Firm KPMG LLP 200 East Randolph Street Chicago, IL 60601 | | Transfer Agent and
Shareholder Services Computershare Trust Company, N.A. 150 Royall Street Canton, MA 02021 (800) 257-8787 |
Distribution Information
The Fund hereby designates its percentage of dividends paid from net ordinary income as dividends qualifying for the dividends received deduction (“DRD”) for corporations, its percentage of qualified dividend income (“QDI”) for individuals under Section 1(h)(11) of the Internal Revenue Code, and its percentage of qualified business income (“QBI”) for individuals under Section 199A of the Internal Revenue Code as shown in the accompanying table. The actual qualified dividend and business income distributions will be reported to shareholders on Form 1099-DIV which will be sent to shareholders shortly after calendar year end.
| | | | |
| | | JDD | |
% DRD | | | 13.4% | |
% QDI | | | 35.8% | |
% QBI | | | 13.4% | |
The Fund hereby designates its percentage of dividends paid from net ordinary income as dividends qualifying as Interest-Related Dividends and/or short-term capital gain dividends as defined in the Internal Revenue Code Section 871(k) for the taxable year ended December 31, 2019:
| | | | |
| | | JDD | |
% of Interest-Related Dividends | |
| 23.3%
|
|
Portfolio of Investments Information
The Fund is required to file its complete schedule of portfolio holdings with the Securities and Exchange Commission (SEC) for the first and third quarters of each fiscal year as an exhibit to its report on FormN-Port. You may obtain this information directly from the SEC’s website at http://www.sec.gov.
Nuveen Funds’ Proxy Voting Information
You may obtain (i) information regarding how each fund voted proxies relating to portfolio securities held during the most recent twelve-month period ended June 30, without charge, upon request, by calling Nuveen toll-free at (800) 257-8787 or on Nuveen’s website at www.nuveen.com and (ii) a description of the policies and procedures that each fund used to determine how to vote proxies relating to portfolio securities without charge, upon request, by calling Nuveen toll free at (800) 257-8787. You may also obtain this information directly from the SEC. Visit the SEC on-line at http://www.sec.gov.
CEO Certification Disclosure
The Fund’s Chief Executive Officer (CEO) has submitted to the New York Stock Exchange (NYSE) the annual CEO certification as required by Section 303A.12(a) of the NYSE Listed Company Manual. The Fund has filed with the SEC the certification of its CEO and Chief Financial Officer required by Section 302 of the Sarbanes-Oxley Act.
Common Share Repurchases
The Fund intends to repurchase, through its open-market share repurchase program, shares of its own common stock at such times and in such amounts as is deemed advisable. During the period covered by this report, the Fund repurchased shares of its common stock as shown in the accompanying table. Any future repurchases will be reported to shareholders in the next annual or semi-annual report.
| | | | |
| | | JDD | |
Common shares repurchased | | | — | |
FINRA BrokerCheck
The Financial Industry Regulatory Authority (FINRA) provides information regarding the disciplinary history of FINRA member firms and associated investment professionals. This information as well as an investor brochure describing FINRA BrokerCheck is available to the public by calling the FINRA BrokerCheck Hotline number at (800) 289-9999 or by visiting www.FINRA.org.
56
Glossary of Terms Used in this Report(Unaudited)
| ∎ | | Average Annual Total Return: This is a commonly used method to express an investment’s performance over a particular, usually multi-year time period. It expresses the return that would have been necessary each year to equal the investment’s actual cumulative performance (including change in NAV or market price and reinvested dividends and capital gains distributions, if any) over the time period being considered. |
| ∎ | | Beta: A measure of the variability of the change in the share price for a fund in relation to a change in the value of the fund’s market benchmark. Securities with betas higher than 1.0 have been, and are expected to be, more volatile than the benchmark; securities with betas lower than 1.0 have been, and are expected to be, less volatile than the benchmark. |
| ∎ | | Blended Index (Comparative Benchmark): The performance is a blended return consisting of: 1) 25% of the return of the Morgan Stanley Capital International (MSCI) World Index: A free float-adjusted market capitalization weighted index that is designed to measure the equity market performance of developed markets. The MSCI World Index consists of the following 23 developed market country indexes: Australia, Austria, Belgium, Canada, Denmark, Finland, France, Germany, Hong Kong, Ireland, Israel, Italy, Japan, Netherlands, New Zealand, Norway, Portugal, Singapore, Spain, Sweden, Switzerland, the U.K. and the U.S. 2) 25% of the return of the Wilshire U.S. Real Estate Securities Index, an unmanaged, market capitalization-weighted index comprised of publicly traded REITs and real estate companies, 3) 25% of the return of the JPMorgan Emerging Markets Bond Index (EMBI) Global Diversified, which tracks total returns for U.S.-dollar-denominated debt instruments issued by emerging markets sovereign and quasi-sovereign entities, and 4) 25% of the return of the Credit Suisse Leveraged Loan Index, which consists of approximately $150 billion of tradable term loans with at least one year to maturity and rated BBB or lower. Index returns assume reinvestment of dividends, but do not include the effects of any applicable sales charges or management fees. |
| ∎ | | Collateralized Loan Obligation (CLO): A security backed by a pool of debt, often low rated corporate loans. Collateralized loan obligations (CLOs) are similar to collateralized mortgage obligations, except for the different type of underlying loan. |
| ∎ | | Effective Leverage: Effective leverage is a fund’s effective economic leverage, and includes both regulatory leverage (see below) and the leverage effects of certain derivative investments in the fund’s portfolio. |
| ∎ | | Gross Domestic Product (GDP): The total market value of all final goods and services produced in a country/region in a given year, equal to total consumer, investment and government spending, plus the value of exports, minus the value of imports. |
| ∎ | | J.P. Morgan Corporate Emerging Markets Bond Index Broad Diversified (CEMBI Broad Diversified): This index is an expansion of the J.P. Morgan Corporate Emerging Markets Bond Index (CEMBI). The CEMBI is a market capitalization weighted index consisting of U.S. dollar denominated emerging market corporate bonds. The index returns assume reinvestment of dividends and do not reflect any applicable sales charges. You cannot invest directly in an index. |
| ∎ | | J.P. Morgan Emerging Markets Bond Index Global Diversified (EMBI Global Diversified):An Index that tracks total returns for U.S. dollar-denominated debt instruments issued by emerging market sovereign and quasisovereign entities: Brady bonds, loans, Eurobonds. The index limits the exposure of some of the larger countries. The index returns assume reinvestment of dividends and do not reflect any applicable sales charges. You cannot invest directly in an index. |
| ∎ | | JPMorgan Government Bond Index-Emerging Markets (GBI-EM): A comprehensive emerging market debt index that tracks local currency bonds issued by emerging market governments. It limits the weights of those index countries with larger debt stocks by only including specified portions of these countries’ eligible current face amounts of debt outstanding. The countries covered in the GBI-EM Global Diversified are identical to those covered by the GBI-EM Global Index. The index returns assume reinvestment of distributions, but do not reflect any applicable sales charges or management fees. |
| ∎ | | Leverage: Leverage is created whenever a fund has investment exposure (both reward and/or risk) equivalent to more than 100% of the investment capital. |
57
Glossary of Terms Used in this Report (continued)
(Unaudited)
| ∎ | | MSCI ACWI (All Country World Index): A free-float adjusted market capitalization index that is designed to measure equity market performance in the global developed and emerging markets. The index returns assume reinvestment of dividends and do not reflect any applicable sales charges. You cannot invest directly in an index. |
| ∎ | | MSCI EAFE Index: The MSCI (Morgan Stanley Capital International) EAFE (Europe, Australasia, Far East) Index is a free float-adjusted market capitalization weighted index designed to measure developed market equity performance, excluding the U.S. and Canada. The index returns assume reinvestment of distributions, but do not reflect any applicable sales charges or management fees. |
| ∎ | | MSCI Emerging Markets Index: An unmanaged index considered representative of stocks of developing countries. The index returns assume reinvestment of distributions, but do not reflect any applicable sales charges or management fees. |
| ∎ | | Net Asset Value (NAV) Per Share: A fund’s Net Assets is equal to its total assets (securities, cash, accrued earnings and receivables) less its total liabilities. NAV per share is equal to the fund’s Net Assets divided by its number of shares outstanding. |
| ∎ | | Regulatory Leverage: Regulatory leverage consists of preferred shares issued by or borrowings of the fund. Both of these are part of the fund’s capital structure. Regulatory leverage is subject to asset coverage limits set in the Investment Company Act of 1940. |
| ∎ | | Russell 1000® Growth Index: A market-capitalization weighted index of those firms in the Russell 1000® Index with lower price-to-book ratios and lower forecasted growth values. The index returns assume reinvestment of dividends and do not reflect any applicable sales charges. You cannot invest directly in an index. |
| ∎ | | Russell 1000® Value Index: A market-capitalization weighted index of those firms in the Russell 1000® Index with lower price-to-book ratios and lower forecasted growth values. The index returns assume reinvestment of dividends and do not reflect any applicable sales charges. You cannot invest directly in an index. |
| ∎ | | S&P 500®: An unmanaged Index generally considered representative of the U.S. stock market. Index returns assume reinvestment of distributions, but do not reflect of any applicable sales charges or management fees. |
58
Reinvest Automatically, Easily and Conveniently
Nuveen makes reinvesting easy. A phone call is all it takes to set up your reinvestment account.
Nuveen Closed-End Funds Automatic Reinvestment Plan
Your Nuveen Closed-End Fund allows you to conveniently reinvest distributions in additional Fund shares.
By choosing to reinvest, you’ll be able to invest money regularly and automatically, and watch your investment grow through the power of compounding. Just like distributions in cash, there may be times when income or capital gains taxes may be payable on distributions that are reinvested.
It is important to note that an automatic reinvestment plan does not ensure a profit, nor does it protect you against loss in a declining market.
Easy and convenient
To make recordkeeping easy and convenient, each quarter you’ll receive a statement showing your total distributions, the date of investment, the shares acquired and the price per share, and the total number of shares you own.
How shares are purchased
The shares you acquire by reinvesting will either be purchased on the open market or newly issued by the Fund. If the shares are trading at or above net asset value at the time of valuation, the Fund will issue new shares at the greater of the net asset value or 95% of the then-current market price. If the shares are trading at less than net asset value, shares for your account will be purchased on the open market. If the Plan Agent begins purchasing Fund shares on the open market while shares are trading below net asset value, but the Fund’s shares subsequently trade at or above their net asset value before the Plan Agent is able to complete its purchases, the Plan Agent may cease open-market purchases and may invest the uninvested portion of the distribution in newly-issued Fund shares at a price equal to the greater of the shares’ net asset value or 95% of the shares’ market value on the last business day immediately prior to the purchase date. Distributions received to purchase shares in the open market will normally be invested shortly after the distribution payment date. No interest will be paid on distributions awaiting reinvestment. Because the market price of the shares may increase before purchases are completed, the average purchase price per share may exceed the market price at the time of valuation, resulting in the acquisition of fewer shares than if the distribution had been paid in shares issued by the Fund. A pro rata portion of any applicable brokerage commissions on open market purchases will be paid by Plan participants. These commissions usually will be lower than those charged on individual transactions.
Flexible
You may change your distribution option or withdraw from the Plan at any time, should your needs or situation change.
You can reinvest whether your shares are registered in your name, or in the name of a brokerage firm, bank, or other nominee. Ask your investment advisor if his or her firm will participate on your behalf. Participants whose shares are registered in the name of one firm may not be able to transfer the shares to another firm and continue to participate in the Plan.
The Fund reserves the right to amend or terminate the Plan at any time. Although the Fund reserves the right to amend the Plan to include a service charge payable by the participants, there is no direct service charge to participants in the Plan at this time.
Call today to start reinvesting distributions
For more information on the Nuveen Automatic Reinvestment Plan or to enroll in or withdraw from the Plan, speak with your financial advisor or call us at (800) 257-8787.
59
Board Members & Officers
(Unaudited)
The management of the Funds, including general supervision of the duties performed for the Funds by the Adviser, is the responsibility of the Board of Trustees of the Funds. The number of trustees of the Funds is set at nine. None of the trustees who are not “interested” persons of the Funds (referred to herein as “independent board members”) has ever been a director or employee of, or consultant to, Nuveen or its affiliates. The names and business addresses of the trustees and officers of the Funds, their principal occupations and other affiliations during the past five years, the number of portfolios each Trustee oversees and other directorships they hold are set forth below.
| | | | | | | | |
| | | | |
| | | | | | | | | |
Name, Year of Birth & Address | | Position(s) Held with the Funds | | Year First Elected or Appointed and Term(1)
| | Principal Occupation(s) Including other Directorships During Past 5 Years | | Number of Portfolios in Fund Complex Overseen by Board Member |
| | | | |
| | | | | | | | | |
|
| Independent Board Members: |
| | | | |
∎ TERENCE J. TOTH | | | | | | Formerly, aCo-Founding Partner, Promus Capital (2008-2017); Director, Quality Control Corporation (since 2012); member: Catalyst Schools of Chicago Board (since 2008) and Mather Foundation Board (since 2012), and chair of its Investment Committee; formerly, Director, Fulcrum IT Services LLC (2010-2019); formerly, Director, Legal & General Investment Management America, Inc. (2008-2013); formerly, CEO and President, Northern Trust Global Investments (2004-2007): Executive Vice President, Quantitative Management & Securities Lending (2000-2004); prior thereto, various positions with Northern Trust Company (since 1994); formerly, Member, Northern Trust Mutual Funds Board (2005-2007), Northern Trust Global Investments Board (2004-2007), Northern Trust Japan Board (2004-2007), Northern Trust Securities Inc. Board (2003-2007) and Northern Trust Hong Kong Board (1997-2004). | | |
1959 333 W. Wacker Drive Chicago, IL 60606 | | Chairman and Board Member | | 2008 Class II | | 157 |
| | | | | | |
| | | | |
∎ JACK B. EVANS | | | | | | Chairman (since 2019), formerly, President (1996-2019), The Hall-Perrine Foundation, a private philanthropic corporation; Director and Chairman, United Fire Group, a publicly held company; Director, Public Member, American Board of Orthopaedic Surgery (since 2015); Life Trustee of Coe College and the Iowa College Foundation; formerly, PresidentPro-Tem of the Board of Regents for the State of Iowa University System; formerly, Director, Alliant Energy and The Gazette Company; formerly, Director, Federal Reserve Bank of Chicago; formerly, President and Chief Operating Officer, SCI Financial Group, Inc., a regional financial services firm. | | |
1948 333 W. Wacker Drive Chicago, IL 60606 | | Board Member | | 1999 Class III | | 157 |
| | | | | | |
| | | | |
∎ WILLIAM C. HUNTER | | | | | | Dean Emeritus, formerly, Dean, Tippie College of Business, University of Iowa (2006-2012); Director of Wellmark, Inc. (since 2009); past Director (2005-2015), and past President (2010-2014) Beta Gamma Sigma, Inc., The International Business Honor Society; formerly, Director (2004-2018) of Xerox Corporation; Dean and Distinguished Professor of Finance, School of Business at the University of Connecticut (2003-2006); previously, Senior Vice President and Director of Research at the Federal Reserve Bank of Chicago (1995-2003); formerly, Director (1997-2007), Credit Research Center at Georgetown University. | | |
1948 333 W. Wacker Drive Chicago, IL 60606 | | Board Member | | 2003 Class I | | 157 |
| | | | |
| | | | |
∎ ALBIN F. MOSCHNER | | | | | | Founder and Chief Executive Officer, Northcroft Partners, LLC, a management consulting firm (since 2012); formerly, Chairman (2019), and Director (2012-2019), USA Technologies, Inc., a provider of solutions and services to facilitate electronic payment transactions; formerly, Director, Wintrust Financial Corporation (1996-2016); previously, held positions at Leap Wireless International, Inc., including Consultant (2011-2012), Chief Operating Officer (2008-2011), and Chief Marketing Officer (2004-2008); formerly, President, Verizon Card Services division of Verizon Communications, Inc. (2000-2003); formerly, President, One Point Services at One Point Communications (1999-2000); formerly, Vice Chairman of the Board, Diba, Incorporated (1996-1997); formerly, various executive positions (1991-1996) and Chief Executive Officer (1995-1996) of Zenith Electronics Corporation. | | |
1952 333 W. Wacker Drive Chicago, IL 60606 | | Board Member | | 2016 Class III | | 157 |
| | | | | | |
60
| | | | | | | | |
| | | | |
| | | | | | | | | |
Name, Year of Birth & Address | | Position(s) Held with the Funds | | Year First Elected or Appointed and Term(1)
| | Principal Occupation(s) Including other Directorships During Past 5 Years | | Number of Portfolios in Fund Complex Overseen by Board Member |
| | | | |
| | | | | | | | | |
|
| Independent Board Members (continued): |
| | | | |
∎ JOHN K. NELSON | | | | | | Member of Board of Directors of Core12 LLC. (since 2008), a private firm which develops branding, marketing and communications strategies for clients; served The President’s Council of Fordham University (2010-2019) and previously a Director of the Curran Center for Catholic American Studies (2009-2018); formerly, senior external advisor to the Financial Services practice of Deloitte Consulting LLP. (2012-2014); former Chair of the Board of Trustees of Marian University (2010-2014 as trustee, 2011-2014 as Chair); formerly Chief Executive Officer of ABN AMRO Bank N.V., North America, and Global Head of the Financial Markets Division (2007-2008), with various executive leadership roles in ABN AMRO Bank N.V. between 1996 and 2007. | | |
1962 333 W. Wacker Drive Chicago, IL 60606 | | Board Member | | 2013 Class II | | 157 |
| | | | | | |
| | | | |
∎ JUDITH M. STOCKDALE | | | | | | Board Member, Land Trust Alliance (since 2013); formerly, Board Member, U.S. Endowment for Forestry and Communities (2013-2019); formerly, Executive Director(1994-2012), Gaylord and Dorothy Donnelley Foundation; prior thereto, Executive Director, Great Lakes Protection Fund (1990-1994). | | |
1947 333 W. Wacker Drive Chicago, IL 60606 | | Board Member | | 1997 Class I | | 157 |
| | | | |
∎ CAROLE E. STONE | | | | | | Former Director, Chicago Board Options Exchange, Inc. (2006-2017); and C2 Options Exchange, Incorporated (2009-2017); Director, Cboe, Global Markets, Inc., formerly, CBOE Holdings, Inc. (since 2010); formerly, Commissioner, New York State Commission on Public Authority Reform (2005-2010). | | |
1947 333 W. Wacker Drive Chicago, IL 60606 | | Board Member | | 2007 Class I | | 157 |
| | | | |
∎ MARGARET L. WOLFF | | | | | | Formerly, member of the Board of Directors (2013-2017) of Travelers Insurance Company of Canada and The Dominion of Canada General Insurance Company (each, a part of Travelers Canada, the Canadian operation of The Travelers Companies, Inc.); formerly, Of Counsel, Skadden, Arps, Slate, Meagher & Flom LLP (Mergers & Acquisitions Group) (2005-2014); Member of the Board of Trustees of New York-Presbyterian Hospital (since 2005); Member (since 2004) and Chair (since 2015) of the Board of Trustees of The John A. Hartford Foundation (a philanthropy dedicated to improving the care of older adults); formerly, Member (2005-2015) and Vice Chair (2011-2015) of the Board of Trustees of Mt. Holyoke College. | | |
1955 333 W. Wacker Drive Chicago, IL 60606 | | Board Member | | 2016 Class I | | 157 |
| | | | | | |
| | | | |
∎ ROBERT L. YOUNG(2) | | | | | | Formerly, Chief Operating Officer and Director, J.P.Morgan Investment Management Inc. (2010-2016); formerly, President and Principal Executive Officer (2013-2016), and Senior Vice President and Chief Operating Officer (2005-2010), of J.P.Morgan Funds; formerly, Director and various officer positions for J.P.Morgan Investment Management Inc. (formerly, JPMorgan Funds Management, Inc. and formerly, One Group Administrative Services) and JPMorgan Distribution Services, Inc. (formerly, One Group Dealer Services, Inc.) (1999-2017). | | |
1963 333 W. Wacker Drive Chicago, IL 60606 | | Board Member | | 2017 Class II | | 157 |
| | | | | | |
61
Board Members & Officers(continued)
(Unaudited)
| | | | | | | | |
| | | | |
| | | | | | | | | |
Name, Year of Birth & Address | | Position(s) Held
with the Funds | | Year First
Elected or
Appointed(3) | | Principal Occupation(s) During Past 5 Years | | |
| | | | |
| | | | | | | | | |
| | | | |
| Officers of the Funds: | | | | | | | | |
| | | | |
∎ CEDRIC H. ANTOSIEWICZ | | | | | | Senior Managing Director (since 2017), formerly, Managing Director (2004-2017) of Nuveen Securities, LLC; Senior Managing Director (since 2017), formerly, Managing Director (2014-2017) of Nuveen Fund Advisors, LLC. | | |
1962 333 W. Wacker Drive Chicago, IL 60606 | | Chief Administrative Officer | | 2007 | | |
| | | | |
∎ NATHANIEL T. JONES | | | | | | Managing Director (since 2017), formerly, Senior Vice President (2016-2017), formerly, Vice President (2011-2016) of Nuveen; Managing Director (since 2015) of Nuveen Fund Advisors, LLC; Chartered Financial Analyst. | | |
1979 333 W. Wacker Drive Chicago, IL 60606 | | Vice President and Treasurer | | 2016 | | |
| | | | |
∎ WALTER M. KELLY | | | | | | Managing Director (since 2017), formerly, Senior Vice President(2008-2017) of Nuveen. | | |
1970 333 W. Wacker Drive Chicago, IL 60606 | | Chief Compliance Officer and Vice President | | 2003 | | |
| | | | |
∎ DAVID J. LAMB | | | | | | Managing Director (since 2017), formerly, Senior Vice President of Nuveen (since 2006), Vice President prior to 2006. | | |
1963 333 W. Wacker Drive Chicago, IL 60606 | | Vice President | | 2015 | | |
| | | | |
∎ TINA M. LAZAR | | | | | | Managing Director (since 2017), formerly, Senior Vice President(2014-2017) of Nuveen Securities, LLC. | | |
1961 333 W. Wacker Drive Chicago, IL 60606 | | Vice President | | 2002 | | |
| | | | |
∎ BRIAN J. LOCKHART | | | | | | Managing Director (since 2019) of Nuveen Fund Advisors, LLC; Managing Director (since 2017), formerly, Vice President (2010-2017) of Nuveen; Head of Investment Oversight (since 2017), formerly, Team Leader of Manager Oversight (2015-2017); Chartered Financial Analyst and Certified Financial Risk Manager. | | |
1974 333 W. Wacker Drive Chicago, IL 60606 | | Vice President | | 2019 | | |
| | | | | | |
| | | | |
∎ JACQUES M. LONGERSTAEY | | | | | | Senior Managing Director, Chief Risk Officer, Nuveen, LLC (since May 2019); Senior Managing Director (since May 2019) of Nuveen Fund Advisors, LLC; formerly, Chief Investment and Model Risk Officer, Wealth & Investment Management Division, Wells Fargo Bank (NA) (from 2013-2019). | | |
1963 8500 Andrew Carnegie Blvd. Charlotte, NC 28262 | | Vice President | | 2019 | | |
| | | | | | |
62
| | | | | | | | |
| | | | |
| | | | | | | | | |
Name, Year of Birth & Address | | Position(s) Held with the Funds | | Year First Elected or Appointed(3) | | Principal Occupation(s) During Past 5 Years | | |
| | | | |
| | | | | | | | | |
| | |
| Officers of the Funds (continued): | | | | |
| | | | |
∎ KEVIN J. MCCARTHY | | | | | | Senior Managing Director (since 2017) and Secretary and General Counsel (since 2016) of Nuveen Investments, Inc., formerly, Executive Vice President (2016-2017) and Managing Director and Assistant Secretary (2008-2016); Senior Managing Director (since 2017) and Assistant Secretary (since 2008) of Nuveen Securities, LLC, formerly Executive Vice President (2016-2017) and Managing Director (2008-2016); Senior Managing Director (since 2017), Secretary (since 2016) andCo-General Counsel (since 2011) of Nuveen Fund Advisors, LLC, formerly, Executive Vice President (2016-2017), Managing Director (2008-2016) and Assistant Secretary (2007-2016); Senior Managing Director (since 2017), Secretary (since 2016) and Associate General Counsel (since 2011) of Nuveen Asset Management, LLC, formerly Executive Vice President (2016-2017) and Managing Director and Assistant Secretary (2011-2016); Senior Managing Director (since 2017) and Secretary (since 2016) of Nuveen Investments Advisers, LLC, formerly Executive Vice President (2016-2017); Vice President (since 2007) and Secretary (since 2016), formerly, Assistant Secretary, of NWQ Investment Management Company, LLC, Symphony Asset Management LLC, Santa Barbara Asset Management, LLC and Winslow Capital Management, LLC (since 2010). Senior Managing Director (since 2017) and Secretary (since 2016) of Nuveen Alternative Investments, LLC. | | |
1966 333 W. Wacker Drive Chicago, IL 60606 | | Vice President and Assistant Secretary | | 2007 | | |
| | | | | | |
| | | | |
∎ JON SCOTT MEISSNER | | | | | | Managing Director of Mutual Fund Tax and Financial Reporting groups at Nuveen (since 2017); Managing Director of Nuveen Fund Advisors, LLC (since 2019); Senior Director of Teachers Advisors, LLC and TIAA-CREF Investment Management, LLC (since 2016); Senior Director (since 2015) Mutual Fund Taxation to the TIAA-CREF Funds, the TIAA-CREF Life Funds, the TIAA Separate AccountVA-1 and the CREF Accounts; has held various positions with TIAA since 2004. | | |
1973 8500 Andrew Carnegie Blvd. Charlotte, NC 28262 | | Vice President | | 2019 | | |
| | | | | | |
| | | | |
∎ WILLIAM T. MEYERS | | | | | | Senior Managing Director (since 2017), formerly, Managing Director(2016-2017), Senior Vice President (2010-2016) of Nuveen Securities, LLC and Nuveen Fund Advisors, LLC; Senior Managing Director (since 2017), formerly, Managing Director (2016-2017), Senior Vice President (2010-2016) of Nuveen, has held various positions with Nuveen since 1991. | | |
1966 333 W. Wacker Drive Chicago, IL 60606 | | Vice President | | 2018 | | |
| | | | | | |
| | | | |
∎ MICHAEL A. PERRY | | | | | | Executive Vice President (since 2017), previously Managing Director (from 2016), of Nuveen Fund Advisors, LLC and Nuveen Alternative Investments, LLC; Executive Vice President (since 2017), formerly, Managing Director(2015-2017), of Nuveen Securities, LLC; formerly, Managing Director(2010-2015) of UBS Securities, LLC. | | |
1967 333 W. Wacker Drive Chicago, IL 60606 | | Vice President | | 2017 | | |
| | | | | | |
| | | |
∎ CHRISTOPHER M. ROHRBACHER | | | | Managing Director (since 2017) and Assistant Secretary of Nuveen Securities, LLC; Managing Director (since 2017), formerly, Senior Vice President(2016-2017),Co-General Counsel (since 2019) and Assistant Secretary (since 2016) of Nuveen Fund Advisors, LLC; Managing Director (since 2017), formerly, Senior Vice President (2012-2017) and Associate General Counsel (since 2016), formerly, Assistant General Counsel (2008-2016) of Nuveen. | | |
1971 333 W. Wacker Drive Chicago, IL 60606 | | Vice President and Assistant Secretary | | 2008 | | |
| | | | | | |
| | | | |
∎ WILLIAM A. SIFFERMANN | | | | | | Managing Director (since 2017), formerly Senior Vice President (2016-2017) and Vice President (2011-2016) of Nuveen. | | |
1975 333 W. Wacker Drive Chicago, IL 60606 | | Vice President | | 2017 | | |
63
Board Members & Officers(continued)
(Unaudited)
| | | | | | | | |
| | | | |
| | | | | | | | | |
Name, Year of Birth & Address | | Position(s) Held with the Funds | | Year First Elected or Appointed(3) | | Principal Occupation(s) During Past 5 Years | | |
| | | | |
| | | | | | | | | |
| | |
| Officers of the Funds (continued): | | | | |
| | | | |
∎ E. SCOTT WICKERHAM | | | | | | Senior Managing Director, Head of Fund Administration at Nuveen, LLC (since 2019), formerly, Managing Director; Senior Managing Director (since 2019), Nuveen Fund Advisers, LLC; Principal Financial Officer, Principal Accounting Officer and Treasurer (since 2017) to the TIAA-CREF Funds, the TIAA-CREF Life Funds, the TIAA Separate AccountVA-1 and the Treasurer (since 2017) to the CREF Accounts; Senior Director, TIAA-CREF Fund Administration (2014-2015); has held various positions with TIAA since 2006. | | |
1973 TIAA 730 Third Avenue New York, NY 10017 | | Vice President and Controller | | 2019 | | |
| | | | | | |
| | | | |
∎ MARK L. WINGET | | | | | | Vice President and Assistant Secretary of Nuveen Securities, LLC (since 2008); Vice President and Assistant Secretary of Nuveen Fund Advisors, LLC (since 2019); Vice President (since 2010) and Associate General Counsel (since 2016), formerly, Assistant General Counsel (2008-2016) of Nuveen. | | |
1968 333 W. Wacker Drive Chicago, IL 60606 | | Vice President and Assistant Secretary | | 2008 | | |
| | | | |
∎ GIFFORD R. ZIMMERMAN | | | | | | Managing Director (since 2002), and Assistant Secretary of Nuveen Securities, LLC; Managing Director (since 2004) and Assistant Secretary (since 1994) of Nuveen Investments, Inc.; Managing Director (since 2002), Assistant Secretary (since 1997) andCo-General Counsel (since 2011) of Nuveen Fund Advisors, LLC; Managing Director, Assistant Secretary and Associate General Counsel of Nuveen Asset Management, LLC (since 2011); Vice President (since 2017), formerly, Managing Director (2003-2017) and Assistant Secretary (since 2003) of Symphony Asset Management LLC; Managing Director and Assistant Secretary (since 2002) of Nuveen Investments Advisers, LLC; Vice President and Assistant Secretary of NWQ Investment Management Company, LLC (since 2002), Santa Barbara Asset Management, LLC (since 2006), and of Winslow Capital Management, LLC, (since 2010); Chartered Financial Analyst. | | |
1956 333 W. Wacker Drive Chicago, IL 60606 | | Vice President Secretary | | 1988 | | |
| | | | | | |
| (1) | The Board of Trustees is divided into three classes, Class I, Class II, and Class III, with each being elected to serve until the third succeeding annual shareholders’ meeting subsequent to its election or thereafter in each case when its respective successors are duly elected or appointed, except two board members are elected by the holders of Preferred Shares, when applicable, to serve until the next annual shareholders’ meeting subsequent to its election or thereafter in each case when its respective successors are duly elected or appointed. The year first elected or appointed represents the year in which the board member was first elected or appointed to any fund in the Nuveen complex. |
| (2) | Effective July 1, 2017, Mr. Young was appointed as a Board Member of each of the Nuveen Funds except Nuveen Diversified Dividend and Income Fund (JDD) and Nuveen Real Estate Income Fund (JRS). Effective February 27, 2020, Mr. Young was appointed as a Board Member of JDD and JRS. |
| (3) | Officers serve one year terms through August of each year. The year first elected or appointed represents the year in which the Officer was first elected or appointed to any fund in the Nuveen complex. |
64
Notes
65
Notes
66
Notes
67
Nuveen:
Serving Investors for Generations
Since 1898, financial advisors and their clients have relied on Nuveen to provide
dependable investment solutions through continued adherence to proven, long-term investing
principles. Today, we offer a range of high quality solutions designed to
be integral components of awell-diversified core portfolio.
Focused on meeting investor needs.
Nuveen is the investment manager of TIAA. We have grown into one of the world’s premier global asset managers, with specialist knowledge across all major asset classes and particular strength in solutions that provide income for investors and that draw on our expertise in alternatives and responsible investing. Nuveen is driven not only by the independent investment processes across the firm, but also the insights, risk management, analytics and other tools and resources that a truly world-class platform provides. As a global asset manager, our mission is to work in partnership with our clients to create solutions which help them secure their financial future.
Find out how we can help you.
To learn more about how the products and services of Nuveen may be able to help you meet your financial goals, talk to your financial advisor, or call us at(800) 257-8787. Please read the information provided carefully before you invest. Investors should consider the investment objective and policies, risk considerations, charges and expenses of any investment carefully. Where applicable, be sure to obtain a prospectus, which contains this and other relevant information. To obtain a prospectus, please contact your securities representative or Nuveen, 333 W. Wacker Dr., Chicago, IL 60606. Please read the prospectus carefully before you invest or send money.
Learn more about Nuveen Funds at:www.nuveen.com/
closed-end-funds
| | | | |
Nuveen Investments, LLC |
333 West Wacker Drive | Chicago, IL 60606 | www.nuveen.com | | | | EAN-B-1219D 1077288-INV-Y-02/21 |
ITEM 2. CODE OF ETHICS.
As of the end of the period covered by this report, the registrant has adopted a code of ethics that applies to the registrant’s principal executive officer, principal financial officer, principal accounting officer or controller, or persons performing similar functions. There were no amendments to or waivers from the Code during the period covered by this report. The registrant has posted the code of ethics on its website at www.nuveen.com/fund-governance. (To view the code, click on Code of Conduct.)
ITEM 3. AUDIT COMMITTEE FINANCIAL EXPERT.
As of the end of the period covered by this report, the registrant’s Board of Directors or Trustees (“Board”) determined that the registrant has at least one “audit committee financial expert” (as defined in Item 3 of Form N-CSR) serving on its Audit Committee. The registrant’s audit committee financial experts are Carole E. Stone, Jack B. Evans and William C. Hunter who are “independent” for purposes of Item 3 of Form N-CSR.
Ms. Stone served for five years as Director of the New York State Division of the Budget. As part of her role as Director, Ms. Stone was actively involved in overseeing the development of the State’s operating, local assistance and capital budgets, its financial plan and related documents; overseeing the development of the State’s bond-related disclosure documents and certifying that they fairly presented the State’s financial position; reviewing audits of various State and local agencies and programs; and coordinating the State’s system of internal audit and control. Prior to serving as Director, Ms. Stone worked as a budget analyst/examiner with increasing levels of responsibility over a 30 year period, including approximately five years as Deputy Budget Director. Ms. Stone has also served as Chair of the New York State Racing Association Oversight Board, as Chair of the Public Authorities Control Board, as a Commissioner on the New York State Commission on Public Authority Reform and as a member of the Boards of Directors of several New York State public authorities. These positions have involved overseeing operations and finances of certain entities and assessing the adequacy of project/entity financing and financial reporting. Currently, Ms. Stone is on the Board of Directors of CBOE Holdings, Inc., of the Chicago Board Options Exchange, and of C2 Options Exchange. Ms. Stone’s position on the boards of these entities and as a member of both CBOE Holdings’ Audit Committee and its Finance Committee has involved, among other things, the oversight of audits, audit plans and preparation of financial statements.
Mr. Evans was formerly President and Chief Operating Officer of SCI Financial Group, Inc., a full service registered broker-dealer and registered investment adviser (“SCI”). As part of his role as President and Chief Operating Officer, Mr. Evans actively supervised the Chief Financial Officer (the “CFO”) and actively supervised the CFO’s preparation of financial statements and other filings with various regulatory authorities. In such capacity, Mr. Evans was actively involved in the preparation of SCI’s financial statements and the resolution of issues raised in connection therewith. Mr. Evans has also served on the audit committee of various reporting companies. At such companies, Mr. Evans was involved in the oversight of audits, audit plans, and the preparation of financial statements. Mr. Evans also formerly chaired the audit committee of the Federal Reserve Bank of Chicago.
Mr. Hunter was formerly a Senior Vice President at the Federal Reserve Bank of Chicago. As part of his role as Senior Vice President, Mr. Hunter was the senior officer responsible for all operations of each of the Economic Research, Statistics, and Community and Consumer Affairs units at the Federal Reserve Bank of Chicago. In such capacity, Mr. Hunter oversaw the subunits of the Statistics and Community and Consumer Affairs divisions responsible for the analysis and evaluation of bank and bank holding company financial statements and financial filings. Prior to serving as Senior Vice President at the Federal Reserve Bank of Chicago, Mr. Hunter was the Vice President of the Financial Markets unit at the Federal Reserve Bank of Atlanta where he supervised financial staff and bank holding company analysts who analyzed and evaluated bank and bank holding company financial statements. Mr. Hunter also currently serves on the Boards of Directors of Xerox Corporation and Wellmark, Inc. as well as on the Audit Committees of such Boards. As an Audit Committee member, Mr. Hunter’s responsibilities include, among other things, reviewing financial statements, internal audits and internal controls over financial reporting. Mr. Hunter also formerly was a Professor of Finance at the University of Connecticut School of Business and has authored numerous scholarly articles on the topics of finance, accounting and economics.
ITEM 4. PRINCIPAL ACCOUNTANT FEES AND SERVICES.
The following tables show the amount of fees that KPMG LLP, the Funds’ auditor, billed to the Funds’ during the Funds’ last two full fiscal years. The Audit Committee approved in advance all audit services and non-audit services that KPMG LLP provided to the Funds, except for those non-audit services that were subject to the pre-approval exception under Rule 2-01 of Regulation S-X (the “pre-approval exception”). The preapproval exception for services provided directly to the Funds waives the pre-approval requirement for services other than audit, review or attest services if: (A) the aggregate amount of all such services provided constitutes no more than 5% of the total amount of revenues paid by the Funds during the fiscal year in which the services are provided; (B) the Funds did not recognize the services as non-audit services at the time of the engagement; and (C) the services are promptly brought to the Audit Committee’s attention, and the Committee (or its delegate) approves the services before the audit is completed.
The Audit Committee has delegated certain pre-approval responsibilities to its Chair (or, in her absence, any other member of the Audit Committee).
SERVICES THAT THE FUND’S AUDITOR BILLED TO THE FUND
| | | | | | | | | | | | | | | | |
Fiscal Year Ended | | Audit Fees Billed
to Fund1 | | | Audit-Related Fees
Billed to Fund2 | | | Tax Fees
Billed to Fund 3 | | | All Other Fees
Billed to Fund 4 | |
December 31, 2019 | | $ | 37,770 | | | $ | 0 | | | $ | 0 | | | $ | 0 | |
| | | | | | | | | | | | | | | | |
| | | | | | | | | | | | | | | | |
Percentage approved pursuant to pre-approval exception | | | 0 | % | | | 0 | % | | | 0 | % | | | 0 | % |
| | | | | | | | | | | | | | | | |
| | | | | | | | | | | | | | | | |
December 31, 2018 | | $ | 37,770 | | | $ | 0 | | | $ | 0 | | | $ | 0 | |
| | | | | | | | | | | | | | | | |
| | | | | | | | | | | | | | | | |
Percentage approved pursuant to pre-approval exception | | | 0 | % | | | 0 | % | | | 0 | % | | | 0 | % |
| | | | | | | | | | | | | | | | |
1 “Audit Fees” are the aggregate fees billed for professional services for the audit of the Fund’s annual financial statements and services provided in connection with statutory and regulatory filings or engagements.
2 “Audit Related Fees” are the aggregate fees billed for assurance and related services reasonably related to the performance of the audit or review of financial statements that are not reported under “Audit Fees”. These fees include offerings related to the Fund’s common shares and leverage.
3 “Tax Fees” are the aggregate fees billed for professional services for tax advice, tax compliance, and tax planning. These fees include: all global withholding tax services; excise and state tax reviews; capital gain, tax equalization and taxable basis calculation performed by the principal accountant.
4 “All Other Fees” are the aggregate fees billed for products and services other than “Audit Fees”, “Audit-Related Fees” and “Tax Fees”. These fees represent all “Agreed-Upon Procedures” engagements pertaining to the Fund’s use of leverage.
SERVICES THAT THE FUND’S AUDITOR BILLED TO THE
ADVISER AND AFFILIATED FUND SERVICE PROVIDERS
The following tables show the amount of fees billed by KPMG LLP to Nuveen Fund Advisors, LLC (formerly Nuveen Fund Advisors, Inc.) (the “Adviser”), and any entity controlling, controlled by or under common control with the Adviser that provides ongoing services to the Fund (“Affiliated Fund Service Provider”), for engagements directly related to the Fund’s operations and financial reporting, during the Fund’s last two full fiscal years.
The tables also show the percentage of fees subject to the pre-approval exception. The pre-approval exception for services provided to the Adviser and any Affiliated Fund Service Provider (other than audit, review or attest services) waives the pre-approval requirement if: (A) the aggregate amount of all such services provided constitutes no more than 5% of the total amount of revenues paid to KPMG LLP by the Fund, the Adviser and Affiliated Fund Service Providers during the fiscal year in which the services are provided that would have to be pre-approved by the Audit Committee; (B) the Fund did not recognize the services as non-audit services at the time of the engagement; and (C) the services are promptly brought to the Audit Committee’s attention, and the Committee (or its delegate) approves the services before the Fund’s audit is completed.
| | | | | | | | | | | | |
Fiscal Year Ended | | Audit-Related Fees
Billed to Adviser and
Affiliated Fund Service
Providers | | | Tax Fees Billed to
Adviser and
Affiliated Fund
Service
Providers | | | All Other Fees
Billed to Adviser
and Affiliated Fund
Service Providers | |
December 31, 2019 | | $ | 0 | | | $ | 0 | | | $ | 0 | |
| | | | | | | | | | | | |
| | | | | | | | | | | | |
Percentage approved pursuant to pre-approval exception | | | 0 | % | | | 0 | % | | | 0 | % |
| | | | | | | | | | | | |
| | | | | | | | | | | | |
December 31, 2018 | | $ | 0 | | | $ | 0 | | | $ | 0 | |
| | | | | | | | | | | | |
| | | | | | | | | | | | |
Percentage approved pursuant to pre-approval exception | | | 0 | % | | | 0 | % | | | 0 | % |
| | | | | | | | | | | | |
NON-AUDIT SERVICES
The following table shows the amount of fees that KPMG LLP billed during the Fund’s last two full fiscal years for non-audit services. The Audit Committee is required to pre-approve non-audit services that KPMG LLP provides to the Adviser and any Affiliated Fund Services Provider, if the engagement related directly to the Fund’s operations and financial reporting (except for those subject to the pre-approval exception described above). The Audit Committee requested and received information from KPMG LLP about any non-audit services that KPMG LLP rendered during the Fund’s last fiscal year to the Adviser and any Affiliated Fund Service Provider. The Committee considered this information in evaluating KPMG LLP’s independence.
| | | | | | | | | | | | | | | | |
Fiscal Year Ended | | Total Non-Audit Fees
Billed to Fund | | | Total Non-Audit Fees
billed to Adviser and
Affiliated Fund Service
Providers (engagements
related directly to the
operations and financial
reporting of the Fund) | | | Total Non-Audit Fees
billed to Adviser and
Affiliated Fund Service
Providers (all other
engagements) | | | Total | |
December 31, 2019 | | $ | 0 | | | $ | 0 | | | $ | 0 | | | $ | 0 | |
December 31, 2018 | | $ | 0 | | | $ | 0 | | | $ | 0 | | | $ | 0 | |
“Non-Audit Fees billed to Fund” for both fiscal year ends represent “Tax Fees” and “All Other Fees” billed to Fund in their respective amounts from the previous table.
Less than 50 percent of the hours expended on the principal accountant’s engagement to audit the registrant’s financial statements for the most recent fiscal year were attributed to work performed by persons other than the principal accountant’s full-time, permanent employees.
Audit Committee Pre-Approval Policies and Procedures. Generally, the Audit Committee must approve (i) all non-audit services to be performed for the Fund by the Fund’s independent accountants and (ii) all audit and non-audit services to be performed by the Fund’s independent accountants for the Affiliated Fund Service Providers with respect to operations and financial reporting of the Fund. Regarding tax and research projects conducted by the independent accountants for the Fund and Affiliated Fund Service Providers (with respect to operations and financial reports of the Fund) such engagements will be (i) pre-approved by the Audit Committee if they are expected to be for amounts greater than $10,000; (ii) reported to the Audit Committee chair for her verbal approval prior to engagement if they are expected to be for amounts under $10,000 but greater than $5,000; and (iii) reported to the Audit Committee at the next Audit Committee meeting if they are expected to be for an amount under $5,000.
ITEM 5. AUDIT COMMITTEE OF LISTED REGISTRANTS.
The registrant’s Board has a separately designated Audit Committee established in accordance with Section 3(a)(58)(A) of the Securities Exchange Act of 1934, as amended (15 U.S.C. 78c(a)(58)(A)). As of the end of the period covered by this report, the members of the audit committee are Jack B. Evans, William C. Hunter, John K. Nelson, Judith M. Stockdale and Carole E. Stone, Chair.
ITEM 6. SCHEDULE OF INVESTMENTS.
(a) See Portfolio of Investments in Item 1.
(b) Not applicable.
ITEM 7. DISCLOSURE OF PROXY VOTING POLICIES AND PROCEDURES FOR CLOSED-END MANAGEMENT INVESTMENT COMPANIES.
Nuveen Fund Advisors, LLC is the registrant’s investment adviser (also referred to as the “Adviser”). The Adviser is responsible for the on-going monitoring of the Fund’s investment portfolio, managing the Fund’s business affairs and providing certain clerical, bookkeeping and administrative services. The Adviser has engaged Security Capital Research & Management Incorporated (“Security Capital”) for a portion of the registrant’s equity investments, Wellington Management Company LLP (“Wellington Management”) for a portion of the registrant’s debt investments, Symphony Asset Management LLC (“Symphony”) for an additional portion of the registrant’s debt investments and NWQ Investment Management Company, LLC (“NWQ”) for an additional portion of the registrant’s equity investments, (Security Capital, Wellington Management, Symphony and NWQ are also collectively referred to as “Sub-Advisers”) as Sub-Advisers to provide discretionary investment advisory services. As part of these services, the Adviser has delegated to the Sub-Advisers the full responsibility for proxy voting on securities held in the registrant’s portfolio and related duties in accordance with each Sub-Adviser’s policies and procedures. The Adviser periodically monitors each Sub-Adviser’s voting to ensure that it is carrying out its duties. Wellington Management and NWQ’s voting policies and procedures are attached to this filing as an exhibit. Security Capital and Symphony’s proxy voting policies and procedures are summarized as follows:
Security Capital
The Adviser has engaged Security Capital Research & Management Incorporated (“Security Capital”) as Sub-Adviser to provide discretionary investment advisory services. As part of these services, the Adviser has also delegated to the Sub-Adviser the full responsibility for proxy voting and related duties in accordance with the Sub-Adviser’s policy and procedures. The Adviser periodically will monitor the Sub-Adviser’s voting to ensure that they are carrying out their duties. The Sub-Adviser’s proxy voting policies and procedures are summarized as follows:
Security Capital may be granted by its clients the authority to vote the proxies of the securities held in client portfolios. To ensure that the proxies are voted in the best interests of its clients, Security Capital has adopted detailed proxy voting procedures (“Procedures”) that incorporate detailed proxy guidelines (“Guidelines”) for voting proxies on specific types of issues.
Pursuant to the Procedures, most routine proxy matters will be voted in accordance with the Guidelines, which have been developed with the objective of encouraging corporate action that enhances shareholder value. For proxy matters that are not covered by the Guidelines (including matters that require a case-by-case determination) or where a vote contrary to the Guidelines is considered appropriate, the Procedures require a certification and review process to be completed before the vote is cast. That process is designed to identify actual or potential material conflicts of interest and ensure that the proxy is cast in the best interest of clients. For proxy matters that are not covered by the Guidelines or where a vote contrary to the Guidelines is considered appropriate, the investment analyst who covers that company will document on a proxy summary how Security Capital is voting and that summary is signed-off by the investment analyst, as well as two Portfolio Managers. In addition, this summary is provided to Security Capital’s Chief Compliance Officer.
To oversee and monitor the proxy-voting process, Security Capital has established a proxy committee and appointed a proxy administrator. The proxy committee meets periodically to review general proxy-voting matters, review and approve the Guidelines annually, and provide advice and recommendations on general proxy-voting matters as well as on specific voting issues.
A copy of the Security Capital’s proxy voting procedures and guidelines are available upon request by contacting your client service representative.
SYMPHONY
Symphony has adopted and implemented proxy voting guidelines to ensure that proxies are voted in the best interest of its Clients. These are merely guidelines and specific situations may call for a vote which does not follow the guidelines. In determining how to vote proxies, Symphony will follow the Proxy Voting Guidelines of the independent third party which Symphony has retained to provide proxy voting services (“Symphony’s Proxy Guidelines”).
Symphony has created a Proxy Voting Committee to periodically review Symphony’s Proxy Guidelines, address conflicts of interest, specific situations and any portfolio manager’s decision to deviate from Symphony’s Proxy Guideline, (including the third party’s guidelines). Under certain circumstances, Symphony may vote one way for some Clients and another way for other Clients. For example, votes for a Client who provides specific voting instructions may differ from votes for Clients who do not provide proxy voting instructions. However, when Symphony has discretion, proxies will generally be voted the same way for all Clients. In addition, conflicts of interest in voting proxies may arise between Clients, between Symphony and its employees, or a lending or other material relationship. As a general rule, conflicts will be resolved by Symphony voting in accordance with Symphony’s Proxy Guidelines when:
| | • | | Symphony manages the account of a corporation or a pension fund sponsored by a corporation in which Clients of Symphony also own stock. Symphony will vote the proxy for its other Clients in accordance with Symphony’s Proxy Guidelines and will follow any directions from the corporation or the pension plan, if different than Symphony’s Proxy Guidelines; |
| | • | | An employee or a member of his/her immediate family is on the Board of Directors or a member of senior management of the company that is the issuer of securities held in Client’s account; |
| | • | | Symphony has a borrowing or other material relationship with a corporation whose securities are the subject of the proxy. |
Proxies will always be voted in the best interest of Symphony’s Clients. Those situations that do not fit within the general rules for the resolution of conflicts of interest will be reviewed by the Proxy Voting Committee. The Proxy Voting Committee, after consulting with senior management, if appropriate, will determine how the proxy should be voted. For example, when a portfolio manager decides not to follow Symphony’s Proxy Guidelines, the Proxy Voting Committee will review a portfolio manager’s recommendation and determine how to vote the proxy. Decisions by the Proxy Voting Committee will be documented and kept with records related to the voting of proxies. A summary of specific votes will be retained in accordance with Symphony’s Books and Records Requirements which are set forth Symphony’s Compliance Manual and Code of Ethics.
ITEM 8. PORTFOLIO MANAGERS OF CLOSED-END MANAGEMENT INVESTMENT COMPANIES.
Nuveen Fund Advisors, LLC is the registrant’s investment adviser (also referred to as the “Adviser”). The Adviser is responsible for the selection and on-going monitoring of the Fund’s investment portfolio, managing the Fund’s business affairs and providing certain clerical, bookkeeping and administrative services. The Adviser has engaged Security Capital Research & Management Incorporated (“Security Capital”) for a portion of the registrant’s equity investments, Wellington Management Company LLP (“Wellington Management”) for a portion of the registrant’s debt investments, Symphony Asset Management LLC (“Symphony”) for an additional portion of the registrant’s debt investments and NWQ Investment Management Company, LLC (“NWQ”) for an additional portion of the registrant’s equity investments, (Security Capital, Wellington Management, Symphony and NWQ are also collectively referred to as “Sub-Advisers”) as Sub-Advisers to provide discretionary investment advisory services. The following section provides information on the portfolio managers at each Sub-Adviser:
SECURITY CAPITAL RESEARCH & MANAGEMENT INCORPORATED
Item 8(a)(1). PORTFOLIO MANAGER BIOGRAPHIES
As of the date of filing this report, the following individuals at the Sub-Adviser have primary responsibility for the day-to-day implementation of the Fund’s investment strategy:
ANTHONY R. MANNO JR. is CEO, President and Chief Investment Officer of Security Capital Research & Management Incorporated. He is Chairman, President and Managing Director of SC-Preferred Growth LLC. Prior to joining Security Capital in 1994, Mr. Manno spent 14 years with LaSalle Partners Limited as a Managing Director, responsible for real estate investment banking activities. Mr. Manno began his career in real estate finance at The First National Bank of Chicago and has 46 years of experience in the real estate investment business. He received an MBA in Finance with honors (Beta Gamma Sigma) from the University of Chicago and graduated Phi Beta Kappa from Northwestern University with a BA and MA in Economics. Mr. Manno is a Certified Public Accountant and was awarded an Elijah Watt Sells Award and is a recipient of the President’s Call to Service Award, December 2008.
KENNETH D. STATZ is a Managing Director and Senior Market Strategist of Security Capital Research & Management Incorporated where he is responsible for the development and implementation of portfolio investment strategy. Prior to joining Security Capital in 1995, Mr. Statz was a Vice President in the Investment Research Department of Goldman, Sachs & Co., concentrating on research and underwriting for the REIT
industry. Previously, he was a REIT Portfolio Manager and a Managing Director of Chancellor Capital Management. Mr. Statz has 38 years of experience in the real estate securities industry and received an MBA and a BBA in Finance from the University of Wisconsin.
KEVIN W. BEDELL is a Managing Director of Security Capital Research & Management Incorporated where he directs the Investment Analysis Team, which provides in-depth proprietary research on publicly listed companies. Prior to joining Security Capital in 1996, Mr. Bedell spent nine years with LaSalle Partners Limited where he was Equity Vice President and Portfolio Manager, with responsibility for strategic, operational and financial management of a private real estate investment trust with commercial real estate investments in excess of $1 billion. Mr. Bedell has 32 years of experience in the real estate securities industry and received an MBA in Finance from the University of Chicago and a BA from Kenyon College.
NATHAN J. GEARis an Executive Director of Security Capital Research & Management Incorporated where, as a senior member of the Investment Analysis Team, he leads the fundamental analysis and pricing of REIT fixed income senior securities. Prior to joining Security Capital in 2006, Mr. Gear was involved in the underwriting and analysis of real estate loans for JPMorgan. Mr. Gear received his BS with honors from Pensacola Christian College and is a member of the Chartered Financial Analyst Institute.
Item 8 (a)(2). Other Accounts Managed by Security Capital Research & Management Incorporated– AS OF DECEMBER 31, 2019
| | | | | | | | | | | | | | | | | | | | | | | | | | | | | | | | | | | | | | | | | | | | | | | | |
Nuveen Diversified Dividend and Income Fund (“Fund”) Security Capital Research & Management Incorporated (“Adviser”) | |
(a)(1) Identify portfolio manager(s) of the Adviser to be named in the Fund prospectus | | (a)(2) For each person identified in column (a)(1), provide number of
accounts other than the Fund managed by the person within each
category below and the total assets in the accounts managed within each
category below | | | (a)(3) Performance Fee Accounts. For each of the categories
in column (a)(2), provide number of accounts and the total
assets in the accounts with respect to which the advisory fee is
based on the performance of the account | |
| | Registered
Investment
Companies | | | Other Pooled Investment
Vehicles | | | Other Accounts | | | Registered
Investment
Companies | | | Other Pooled Investment
Vehicles | | | Other Accounts | |
| | Number
of
Accounts | | | Total Assets
($billions) | | | Number of
Accounts | | | Total Assets
($billions) | | | Number
of
Accounts | | | Total Assets
($billions) | | | Number
of
Accounts | | | Total Assets | | | Number
of
Accounts | | | Total Assets | | | Number
of
Accounts | | | Total Assets
($billions) | |
Anthony R. Manno Jr. | | | 2 | | | $ | 0.6 | | | | 2 | | | $ | 0.8 | | | | 45 | | | $ | 2.3 | | | | — | | | | — | | | | — | | | | — | | | | 3 | | | $ | 0.4 | |
Kenneth D. Statz | | | 2 | | | $ | 0.6 | | | | 2 | | | $ | 0.8 | | | | 45 | | | $ | 2.3 | | | | — | | | | — | | | | — | | | | — | | | | 3 | | | $ | 0.4 | |
Kevin W. Bedell | | | 2 | | | $ | 0.6 | | | | 2 | | | $ | 0.8 | | | | 45 | | | $ | 2.3 | | | | | | | | | | | | | | | | | | | | 3 | | | $ | 0.4 | |
Nathan J. Gear | | | 2 | | | $ | 0.6 | | | | 2 | | | $ | 0.8 | | | | 45 | | | $ | 2.3 | | | | — | | | | — | | | | — | | | | — | | | | 3 | | | $ | 0.4 | |
POTENTIAL MATERIAL CONFLICTS OF INTEREST
As shown in the above tables, the portfolio managers may manage accounts in addition to the Nuveen Funds (the “Funds”). The potential for conflicts of interest exists when portfolio managers manage other accounts with similar investment objectives and strategies as the Funds (“Similar Accounts”). Potential conflicts may include, for example, conflicts between investment strategies and conflicts in the allocation of investment opportunities.
Responsibility for managing Security Capital’s clients’ portfolios is organized according to investment strategies within asset classes. Generally, client portfolios with similar strategies are managed using the same objectives, approach and philosophy. Therefore, portfolio holdings, relative position sizes and sector exposures tend to be similar across similar portfolios, which minimizes the potential for conflicts of interest.
Security Capital may receive more compensation with respect to certain Similar Accounts than that received with respect to the Nuveen Funds or may receive compensation based in part on the performance of certain Similar Accounts. This may create a potential conflict of interest for Security Capital or its portfolio managers by providing an incentive to favor these Similar Accounts when, for example, placing securities transactions. Potential conflicts of interest may arise with both the aggregation and allocation of securities transactions and allocation of limited investment opportunities. Allocations of aggregated trades, particularly trade orders that were only partially completed due to limited availability, and allocation of investment
opportunities generally, could raise a potential conflict of interest, as Security Capital may have an incentive to allocate securities that are expected to increase in value to favored accounts. Initial public offerings, in particular, are frequently of very limited availability. Security Capital may be perceived as causing accounts it manages to participate in an offering to increase Security Capital’s overall allocation of securities in that offering. A potential conflict of interest also may be perceived to arise if transactions in one account closely follow related transactions in a different account, such as when a purchase increases the value of securities previously purchased by another account, or when a sale in one account lowers the sale price received in a sale by a second account. If Security Capital manages accounts that engage in short sales of securities of the type in which the Funds invests, Security Capital could be seen as harming the performance of the Funds for the benefit of the accounts engaging in short sales if the short sales cause the market value of the securities to fall.
Security Capital has policies and procedures designed to manage these conflicts described above such as allocation of investment opportunities to achieve fair and equitable allocation of investment opportunities among its clients over time. For example:
Orders placed for the same equity security within a reasonable time period are aggregated consistent with Security Capital’s duty of best execution for its clients. If aggregated trades are fully executed, accounts participating in the trade will be allocated their pro rata share on an average price basis. Partially completed orders will be allocated among the participating accounts on a pro-rata average price basis as well.
| Item 8(a)(3). | FUND MANAGER COMPENSATION |
As of the most recently completed fiscal year end, the primary portfolio managers compensation is as follows:
The principal form of compensation of Security Capital’s professionals is a base salary and annual bonus. Base salaries are fixed for each portfolio manager. Each professional is paid a cash salary and, in addition, a year-end bonus based on achievement of specific objectives that the professional’s manager and the professional agree upon at the commencement of the year. The annual bonus is paid partially in cash and partially in either: (i) restricted stock of Security Capital’s parent company, JPMorgan Chase & Co., and/or (ii) in self-directed parent company mutual funds, all vesting over a three-year period (50% each after the second and third years). The annual bonus is a function of Security Capital achieving its financial, operating and investment performance goals, as well as the individual achieving measurable objectives specific to that professional’s role within the firm and the investment performance of all accounts managed by the portfolio manager. None of the portfolio managers’ compensation is based on the performance of, or the value of assets held in, the Funds.
| Item 8(a)(4). | OWNERSHIP OF JDD SECURITIES AS OF DECEMBER 31, 2019 |
| | | | | | | | | | | | | | |
Portfolio Manager | | None | | $1-
$10,000 | | $10,001-
$50,000 | | $50,001-
$100,000 | | $100,001-
$500,000 | | $500,001 -
$1,000,000 | | over
$1,000,000 |
Anthony R. Manno Jr. | | X | | | | | | | | | | | | |
Kenneth D. Statz | | X | | | | | | | | | | | | |
Kevin W. Bedell | | X | | | | | | | | | | | | |
Nathan J. Gear | | X | | | | | | | | | | | | |
Wellington Management
| Item 8(a)(1). | PORTFOLIO MANAGER BIOGRAPHY |
As of the date of filing this report, the following individuals at the Sub-Adviser (the “Portfolio Managers”) have primary responsibility for the day-to-day implementation of the Fund’s investment strategy:
James W. Valone, CFA, Senior Managing Director and Fixed Income Portfolio Manager, has served as a portfolio manager of the registrant since 2007. Mr. Valone joined Wellington Management as an investment professional in 1999.
Kevin Murphy, Senior Managing Director and Fixed Income Portfolio Manager, has served as a portfolio manager of the registrant since 2019. Mr. Murphy joined Wellington Management as an investment professional in 2016.
| Item 8(a)(2). | OTHER ACCOUNTS MANAGED BY THE PORTFOLIO MANAGER AS OF DECEMBER 31, 2019 |
| | | | | | | | | | | | | | | | | | | | | | | | | | | | | | | | | | | | | | | | | | | | | | | | |
| | | All Accounts (includes registrant) | | | Accounts with Performance Fees | |
| | Registered
Investment Companies | | | Other Pooled Investment
Vehicles | | | Other Accounts | | | Registered
Investment Companies | | | Other Pooled Investment
Vehicles | | | Other Accounts | |
Portfolio Manager | | Number of
Accounts | | | Total Assets
($millions) | | | Number of
Accounts | | | Total
Assets
($billions) | | | Number of
Accounts | | | Total
Assets
($billions) | | | Number of
Accounts | | | Total Assets | | | Number of
Accounts | | | Total
Assets
($billions) | | | Number of
Accounts | | | Total
Assets
($billions) | |
James W. Valone | | | 3 | | | $ | 796.8 | | | | 37 | | | $ | 16,572.0 | | | | 25 | | | $ | 11,453.1 | | | | 0 | | | $ | 0 | | | | 6 | | | $ | 6.4 | | | | 5 | | | $ | 2.0 | |
Kevin Murphy | | | 3 | | | $ | 731.1 | | | | 26 | | | $ | 3,116.8 | | | | 10 | | | $ | 3,385.6 | | | | 0 | | | $ | 0 | | | | 2 | | | $ | 864.2 | | | | 1 | | | $ | 208.7 | |
POTENTIAL MATERIAL CONFLICTS OF INTEREST
Individual investment professionals at Wellington Management manage multiple accounts for multiple clients. These accounts may include mutual funds, separate accounts (assets managed on behalf of institutions, such as pension funds, insurance companies, foundations, or separately managed account programs sponsored by financial intermediaries), bank common trust accounts, and hedge funds. The Fund’s manager listed in the prospectus who is primarily responsible for the day-to-day management of the Fund (“Portfolio Manager”) generally manages accounts in several different investment styles. These accounts may have investment
objectives, strategies, time horizons, tax considerations and risk profiles that differ from those of the Fund. The Portfolio Manager makes investment decisions for each account, including the Fund, based on the investment objectives, policies, practices, benchmarks, cash flows, tax and other relevant investment considerations applicable to that account. Consequently, the Portfolio Manager may purchase or sell securities, including IPOs, for one account and not another account, and the performance of securities purchased for one account may vary from the performance of securities purchased for other accounts. Alternatively, these accounts may be managed in a similar fashion to the Fund and thus the accounts may have similar, and in some cases nearly identical, objectives, strategies and/or holdings to that of the Fund.
The Portfolio Manager or other investment professionals at Wellington Management may place transactions on behalf of other accounts that are directly or indirectly contrary to investment decisions made on behalf of the Fund, or make investment decisions that are similar to those made for the Fund, both of which have the potential to adversely impact the Fund depending on market conditions. For example, an investment professional may purchase a security in one account while appropriately selling that same security in another account. Similarly, the Portfolio Manager may purchase the same security for the Fund and one or more other accounts at or about the same time. In those instances the other accounts will have access to their respective holdings prior to the public disclosure of the Fund’s holdings. In addition, some of these accounts have fee structures, including performance fees, which are or have the potential to be higher, in some cases significantly higher, than the fees Wellington Management receives for managing the Fund. Mr. Valone also manages accounts which pay performance allocations to Wellington Management or its affiliates. Because incentive payments paid by Wellington Management to the Portfolio Manager are tied to revenues earned by Wellington Management and, where noted, to the performance achieved by the manager in each account, the incentives associated with any given account may be significantly higher or lower than those associated with other accounts managed by the Portfolio Manager. Finally, the Portfolio Manager may hold shares or investments in the other pooled investment vehicles and/or other accounts identified above.
Wellington Management’s goal is to meet its fiduciary obligation to treat all clients fairly and provide high quality investment services to all of its clients. Wellington Management has adopted and implemented policies and procedures, including brokerage and trade allocation policies and procedures, which it believes address the conflicts associated with managing multiple accounts for multiple clients. In addition, Wellington Management monitors a variety of areas, including compliance with primary account guidelines, the allocation of IPOs, and compliance with the firm’s Code of Ethics, and places additional investment restrictions on investment professionals who manage hedge funds and certain other accounts. Furthermore, senior investment and business personnel at Wellington Management periodically review the performance of Wellington Management’s investment professionals. Although Wellington Management does not track the time an investment professional spends on a single account, Wellington Management does periodically assess whether an investment professional has adequate time and resources to effectively manage the investment professional’s various client mandates.
Item 8(a)(3). FUND MANAGER COMPENSATION
As of the most recently completed fiscal year end, the primary portfolio managers compensation is as follows:
Wellington Management receives a fee based on the assets under management of the Fund as set forth in the Investment Sub-Advisory Agreement between Wellington Management and Nuveen Asset Management on behalf of the Fund. Wellington Management pays its investment professionals out of its total revenues, including the advisory fees earned with respect to the Fund. The following information relates to the fiscal year ended December 31, 2019.
Wellington Management’s compensation structure is designed to attract and retain high-caliber investment professionals necessary to deliver high quality investment management services to its clients. Wellington Management’s compensation of the Fund’s managers listed in the prospectus who are primarily responsible for the day-to-day management of the Fund (“Portfolio Managers”) includes a base salary and incentive components. The base salary for each Portfolio Manager who is a partner (a “Partner”) of Wellington Management Group LLP, the ultimate holding company of Wellington Management, is generally a fixed amount that is determined by the managing partners of Wellington Management Group LLP. Each Portfolio Manager is eligible to receive an incentive payment based on the revenues earned by Wellington Management from the Fund managed by the Portfolio Manager and generally each other account managed by such Portfolio Manager. Each Portfolio Manager’s incentive payment relating to the Fund is linked to the gross pre-tax performance of the Fund compared to the JP Morgan Emerging Markets Bond Index Global Diversified over one, three and five year periods, with an emphasis on five year results. Wellington Management applies similar incentive compensation structures (although the benchmarks or peer groups, time periods and rates may differ) to other accounts managed by the Portfolio Managers, including accounts with performance fees.
Portfolio-based incentives across all accounts managed by an investment professional can, and typically do, represent a significant portion of an investment professional’s overall compensation; incentive compensation varies significantly by individual and can vary significantly from year to year. The Portfolio Manager may also be eligible for bonus payments based on their overall contribution to Wellington Management’s business operations. Senior management at Wellington Management may reward individuals as it deems appropriate based on other factors. Each Partner is eligible to participate in a Partner-funded tax qualified retirement plan, the contributions to which are made pursuant to an actuarial formula. Messrs. Murphy and Valone are Partners.
Item 8(a)(4). OWNERSHIP OF JDD SECURITIES AS OF DECEMBER 31, 2019
| | | | | | | | | | | | | | | | | | | | | | | | | | |
Name of Portfolio Manager | | None | | $1 -
$10,000 | | | $10,001-
$50,000 | | | $50,001-
$100,000 | | | $100,001-
$500,000 | | | $500,001-
$1,000,000 | | | Over
$1,000,000 | |
James W. Valone | | X | | | | | | | | | | | | | | | | | | | | | | | | |
Kevin Murphy | | X | | | | | | | | | | | | | | | | | | | | | | | | |
Symphony
Item 8(a)(1). PORTFOLIO MANAGER BIOGRAPHIES
As of the date of filing this report, the following individuals at the Sub-Adviser (the “Portfolio Managers”) have primary responsibility for the day-to-day implementation of the Fund’s investment strategy:
Scott Caraher, Portfolio Manager of the Fund, is a member of Symphony’s fixed-income team and his responsibilities include portfolio management and trading for Symphony’s bank loan strategies and research for its fixed-income strategies. Prior to joining Symphony in 2002, Mr. Caraher was an Investment Banking Analyst in the industrial group at Deutsche Banc Alex Brown in New York.
Jenny Rhee, Co-Portfolio Manager of the Fund, joined Symphony in 2001. Her responsibilities include portfolio management for Symphony’s long-short credit strategy, credit trading, and research. Previously, Ms. Rhee was a Senior Vice President and Portfolio Manager at Basso Capital Management in London where she helped launch their European credit platform.
Item 8(a)(2). OTHER ACCOUNTS MANAGED BY PORTFOLIO MANAGERS
| | | | | | | | |
| Other Accounts Managed by Symphony PM | | | | | |
| As of 12/31/19 | | | | | | | | |
| | |
| | | Scott Caraher | | | Jenny Rhee | |
(a) RICs | | | | | | | | |
Number of accts | | | 11 | | | | 9 | |
Assets | | $ | 7 billion | | | $ | 6.2 billion | |
| | |
(b) Other pooled accts | | | | | | | | |
Non-performance fee accts | | | | | | | | |
Number of accts | | | 5 | | | | 1 | |
Assets | | $ | 940.9 million | | | $ | 103.7 million | |
Performance fee accts | | | | | | | | |
Number of accts | | | 1 | | | | 1 | |
Assets | | $ | 345 thousand | | | $ | 826.6 million | |
| | |
(c) Other | | | | | | | | |
Non-performance fee accts | | | | | | | | |
Number of accts | | | 5 | | | | 8 | |
Assets | | $ | 1.3 billion | | | $ | 8.6 million | |
Performance fee accts | | | | | | | | |
Number of accts | | | 0 | | | | 0 | |
Assets | | $ | 0 | | | $ | 0 | |
POTENTIAL MATERIAL CONFLICTS OF INTEREST
As described below, the portfolio manager may manage other accounts with investment strategies similar to the Fund, including other investment companies and separately managed accounts. Fees earned by the sub-adviser may vary among these accounts and the portfolio managers may personally invest in some but not all of these accounts. These factors could create conflicts of interest because a portfolio manager may have incentives to favor certain accounts over others, resulting in other accounts outperforming the Fund. A conflict may also exist if a portfolio manager identified a limited investment opportunity that may be appropriate for more than one account, but the Fund is not able to take full advantage of that opportunity due to the need to allocate that opportunity among multiple accounts. In addition, the portfolio manager may execute transactions for another account that may adversely impact the value of securities held by the Fund. However, the sub-adviser believes that these risks are mitigated by the fact that accounts with like investment strategies managed by a particular portfolio manager are generally managed in a similar fashion, subject to exceptions to account for particular investment restrictions or policies applicable only to certain accounts, differences in cash flows and account sizes, and other factors. In addition, the sub-adviser has adopted trade allocation procedures that require equitable allocation of trade orders for a particular security among participating accounts.
Item 8(a)(3). FUND MANAGER COMPENSATION
As of the most recently completed fiscal year end, the primary portfolio managers compensation is as follows:
Symphony investment professionals receive compensation based on three elements: fixed-base salary, participation in a bonus pool and certain long-term incentives.
The fixed-base salary is set at a level determined by Symphony and is reviewed periodically to ensure that it is competitive with base salaries paid by similar financial services companies for persons playing similar roles.
The portfolio manager is also eligible to receive an annual bonus from a pool based on Symphony’s aggregate asset-based and performance fees after all operating expenses. Bonus compensation for each individual is based on a variety of factors, including the
performance of Symphony, the Fund, the team and the individual. Fund performance is assessed on a pre-tax total return risk-adjusted basis, and generally measured relative to the Fund’s primary benchmark and/or industry peer group for one, three or five year periods as applicable. Finally, certain key employees of Symphony, including the portfolio managers, have received profits interests in Symphony which entitle their holders to participate in the firm’s growth over time.
Item 8(a)(4). OWNERSHIP OF JDD SECURITIES AS OF DECEMBER 31, 2019
| | | | | | | | | | | | | | |
Name of Portfolio Manager | | None | | $1 -
$10,000 | | $10,001-
$50,000 | | $50,001-
$100,000 | | $100,001-
$500,000 | | $500,001-
$1,000,000 | | Over
$1,000,000 |
Scott Caraher | | X | | | | | | | | | | | | |
Jenny Rhee | | X | | | | | | | | | | | | |
NWQ
Item 8(a)(1). PORTFOLIO MANAGER BIOGRAPHIES
As of the date of filing this report, the following individuals at the Sub-Adviser (the “Portfolio Managers”) have primary responsibility for the day-to-day implementation of the Fund’s investment strategy:
James T. Stephenson, CFA, Managing Director, Portfolio Manager and Equity Analyst
Prior to joining NWQ in 2006, Jim spent seven years at Bel Air Investment Advisors, LLC, formerly a State Street Global Advisors Company, where he was a Managing Director and Partner. Most recently, Jim was Chairman of the firm’s Equity Policy Committee and the Portfolio Manager for Bel Air’s Large Cap Core and Select strategies. Previous to this, he spent five years as an Analyst and Portfolio Manager at ARCO Investment Management Company. Prior to that, he was an Equity Analyst at Trust Company of the West. Jim received his B.B.A. and M.S. in Business from the University of Wisconsin-Madison, where he participated in the Applied Security Analysis Program. In addition, he earned the designation of Chartered Financial Analyst in 1993 and is a member of the CFA Institute and the Los Angeles Society of Financial Analysts.
Thomas J. Ray, CFA, Managing Director, Co-Head of Fixed Income, Portfolio Manager/Analyst
Prior to joining NWQ in 2015, Tom was a Private Investor. Prior to that, he served as Chief Investment Officer, President and founding member of Inflective Asset Management; a boutique investment firm specializing in convertible securities. Prior to founding Inflective, Tom also served as portfolio manager at Transamerica Investment Management. Tom graduated from University of Wisconsin with a B.B.A in Finance, Investment & Banking and an M.S. in Finance. He holds the Chartered Financial Analyst designation and is a member of the CFA Institute.
Item 8(a)(2). OTHER ACCOUNTS MANAGED – AS OF DECEMBER 31, 2019
| | | | | | | | |
| | | James T. Stephenson | | | Thomas J. Ray | |
(a) RICs | | | | | | | | |
Number of accts | | | 5 | | | | 6 | |
Assets ($000s) | | $ | 1.3 billion | | | $ | 2.9 billion | |
| | |
(b) Other pooled accts | | | | | | | | |
Non-performance fee accts | | | | | | | | |
Number of accts | | | 1 | | | | 3 | |
Assets ($000s) | | $ | 99.2 million | | | $ | 1.6 billion | |
Performance fee accts | | | | | | | | |
Number of accts | | | 0 | | | | 0 | |
| | |
(c) Other | | | | | | | | |
Non-performance fee accts | | | | | | | | |
Number of accts | | | 478 | | | | 1182 | |
Assets ($000s) | | $ | 779 million | * | | $ | 921 million | ** |
Performance fee accts | | | | | | | | |
Number of accts | | | 0 | | | | 0 | |
Assets ($000s) | | | 0 | | | | 0 | |
* includes approximately $404 million in model-based assets as of 12/31/19
** includes approximately $150 million in model-based assets as of 12/31/19.
POTENTIAL MATERIAL CONFLICTS OF INTEREST
Actual or perceived conflicts of interest may arise when a portfolio manager has day-to-day management responsibilities with respect to more than one account. More specifically, portfolio managers who manage multiple accounts are presented with the following potential conflicts, which are not intended to be an exhaustive list:
| • | | The management of multiple accounts may result in a portfolio manager devoting unequal time and attention to the management of each account. NWQ seeks to manage such competing interests for the time and attention of the portfolio manager by utilizing investment models for the management of most investment strategies. |
| • | | If a portfolio manager identifies a limited investment opportunity which may be suitable for more than one account, an account may not be able to take full advantage of that opportunity due to an allocation of filled purchase or sale orders across all eligible accounts. To deal with these situations, NWQ has adopted procedures for allocating limited opportunities across multiple accounts. |
| • | | With respect to many of its clients’ accounts, NWQ determines which broker to utilize when placing orders for execution, consistent with its duty to seek to obtain best execution of the transaction. However, with respect to certain other accounts, NWQ may be limited by the client with respect to the selection of brokers or may be instructed to direct trades through a particular broker. In these cases, NWQ may place separate transactions for certain accounts which may temporarily affect the market price of the security or the execution of the transaction, or both, to the detriment of other accounts. NWQ seeks to minimize market impact by using its discretion in releasing orders in a manner which seeks to cause the least possible impact while keeping within the approximate price range of the discretionary block trade. |
| • | | Finally, the appearance of a conflict of interest may arise where NWQ has an incentive, such as a performance-based management fee, which relates to the management of some accounts, with respect to which the portfolio manager has day-to-day management responsibilities. NWQ periodically performs a comparative analysis of the performance between accounts with performance fees and those without performance fees. |
NWQ has adopted certain compliance procedures which are designed to address these types of conflicts common among investment managers. However, there is no guarantee that such procedures will detect each and every situation in which a conflict arises.
Item 8(a)(3). FUND MANAGER COMPENSATION
NWQ Investment Management Company, LLC (“NWQ”)’s philosophy is to provide performance-based and market-competitive compensation, while mitigating inappropriate or excessive risk taking. There are three primary components of compensation: (1) base and benefits, (2) annual cash award, and (3) equity-like performance-based plans.
Base pay is determined based upon an analysis of the employee’s general performance, experience, and market levels of base pay for such positions. Base salary and annual variable compensation targets are reviewed annually, while other benefit plans are periodically reviewed to ensure competitiveness.
The variable compensation is an annual cash award that can be a multiple of the base salary. NWQ’s annual variable compensation program includes both subjective and objective criteria with emphasis placed on sustained, long-term performance. The subjective portion of the incentive compensation is based on a qualitative evaluation made by each investment professional’s supervisor taking into consideration a number of factors, including the investment professional’s team collaboration, expense management, support of personnel responsible for asset growth, and his or her compliance with NWQ’s policies and procedures.
Senior employees participate in equity-like profits interest plans, which provide a meaningful opportunity to participate in the long-term success of the business. These profits interests vest over time and entitle participants to a percentage of NWQ’s annual profitability, enabling employees to participate in the growth of the overall value of NWQ. These awards allow participants to benefit directly from the financial performance and growth of NWQ over time and ensure that they have a strong alignment of interests with the firm’s clients over the long term. The profits interests are designed to provide senior personnel with strong incentives to remain with the firm and participate in its success and include non-compete and non-solicitation terms. Additional details regarding the program are proprietary.
Item 8(a)(4). OWNERSHIP OF JDD SECURITIES AS OF DECEMBER 31, 2019
| | | | | | | | | | | | | | |
Name of Portfolio Manager | | None | | $1 -
$10,000 | | $10,001-
$50,000 | | $50,001-
$100,000 | | $100,001-
$500,000 | | $500,001-
$1,000,000 | | Over
$1,000,000 |
James Stephenson | | X | | | | | | | | | | | | |
Thomas Ray | | X | | | | | | | | | | | | |
ITEM 9. PURCHASES OF EQUITY SECURITIES BYCLOSED-END MANAGEMENT INVESTMENT COMPANY AND AFFILIATED PURCHASERS.
Not applicable.
ITEM 10. SUBMISSION OF MATTERS TO A VOTE OF SECURITY HOLDERS.
There have been no material changes to the procedures by which shareholders may recommend nominees to the registrant’s Board implemented after the registrant last provided disclosure in response to this Item.
ITEM 11. CONTROLS AND PROCEDURES.
| | (a) | The registrant’s principal executive and principal financial officers, or persons performing similar functions, have concluded that the registrant’s disclosure controls and procedures (as defined in Rule 30a-3(c) under the Investment Company Act of 1940, as amended (the “1940 Act”) (17 CFR 270.30a-3(c))) are effective, as of a date within 90 days of the filing date of this report that includes the disclosure required by this paragraph, based on their evaluation of the controls and procedures required by Rule 30a-3(b) under the 1940 Act (17 CFR 270.30a-3(b)) and Rules 13a-15(b) or 15d-15 (b) under the Securities Exchange Act of 1934, as amended (the “Exchange Act”) (17 CFR 240.13a-15(b) or 240.15d-15 (b)). |
| | (b) | There were no changes in the registrant’s internal control over financial reporting (as defined in Rule 30a-3(d) under the 1940 Act (17 CFR 270.30a-3(d)) that occurred during the period covered by this report that has materially affected, or is reasonably likely to materially affect, the registrant’s internal control over financial reporting. |
ITEM 12. DISCLOSURE OF SECURITIES LENDING ACTIVITIES FOR CLOSED-END MANAGEMENT INVESTMENT COMPANIES.
Not applicable.
ITEM 13. EXHIBITS.
File the exhibits listed below as part of this Form.
(a)(1) Any code of ethics, or amendment thereto, that is the subject of the disclosure required by Item 2, to the extent that the registrant intends to satisfy the Item 2 requirements through filing of an exhibit: Not applicable because the code is posted on registrant’s website at www.nuveen.com/fund-governance and there were no amendments during the period covered by this report. (To view the code, click on Code of Conduct.)
(a)(2) A separate certification for each principal executive officer and principal financial officer of the registrant as required by Rule 30a-2(a) under the 1940 Act (17 CFR 270.30a-2(a)) in the exact form set forth below: Ex-99.CERT Attached hereto.
(a)(3) Any written solicitation to purchase securities under Rule 23c-1 under the 1940 Act (17 CFR 270.23c-1) sent or given during the period covered by the report by or on behalf of the registrant to 10 or more persons. Not applicable.
(a)(4) Change in registrant’s independent public accountant. Not applicable.
(b) If the report is filed under Section 13(a) or 15(d) of the Exchange Act, provide the certifications required by Rule 30a-2(b) under the 1940 Act (17 CFR 270.30a-2(b)); Rule 13a-14(b) or Rule 15d-14(b) under the Exchange Act (17 CFR 240.13a-14(b) or 240.15d-14(b)), and Section 1350 of Chapter 63 of Title 18 of the United States Code (18 U.S.C. 1350) as an exhibit. A certification furnished pursuant to this paragraph will not be deemed “filed” for purposes of Section 18 of the Exchange Act (15 U.S.C. 78r), or otherwise subject to the liability of that section. Such certification will not be deemed to be incorporated by reference into any filing under the Securities Act of 1933 or the Exchange Act, except to the extent that the registrant specifically incorporates it by reference. Ex-99.906 CERT attached hereto.
SIGNATURES
Pursuant to the requirements of the Securities Exchange Act of 1934 and the Investment Company Act of 1940, the registrant has duly caused this report to be signed on its behalf by the undersigned, thereunto duly authorized.
(Registrant) Nuveen Diversified Dividend and Income Fund
| | | | |
| By (Signature and Title) | | /s/ Gifford R. Zimmerman | | |
| | Gifford R. Zimmerman | | |
| | Vice President and Secretary | | |
| |
| Date: March 6, 2020 | | |
Pursuant to the requirements of the Securities Exchange Act of 1934 and the Investment Company Act of 1940, this report has been signed below by the following persons on behalf of the registrant and in the capacities and on the dates indicated.
| | | | |
| By (Signature and Title) | | /s/ Cedric H. Antosiewicz | | |
| | Cedric H. Antosiewicz | | |
| | Chief Administrative Officer | | |
| | (principal executive officer) | | |
| |
| Date: March 6, 2020 | | |
| | |
| By (Signature and Title) | | /s/ E. Scott Wickerham | | |
| | E. Scott Wickerham | | |
| | Vice President and Controller | | |
| | (principal financial officer) | | |
| |
| Date: March 6, 2020 | | |