UNITED STATES
SECURITIES AND EXCHANGE COMMISSION
Washington, D.C. 20549
FORM N-CSR
CERTIFIED SHAREHOLDER REPORT OF REGISTERED
MANAGEMENT INVESTMENT COMPANIES
Investment Company Act file number 811-21410
(Exact name of registrant as specified in charter)
Blackstone Plaza, 3555 Farnam Street, Suite 800 Omaha, NE 68131
(Address of principal executive offices) (Zip code)
Weitz Investment Management, Inc., Blackstone Plaza, 3555 Farnam Street, Suite 800, Omaha, NE 68131
(Name and address of agent for service)
Registrant’s telephone number, including area code: (402) 391-1980
Date of fiscal year end: March 31
Date of reporting period: September 30, 2024
Item 1. Reports to Stockholders.
Weitz Conservative Allocation Fund
Institutional Class (WBAIX)
Semi-annual shareholder report — September 30, 2024
This semi-annual shareholder report contains important information about the Weitz Conservative Allocation Fund (the "Fund") for the period of April 1, 2024 to September 30, 2024. You can find additional information about the Fund at weitz.investments/reports. You can also request information by contacting us at 888-859-0698.
What were the Fund's costs for the last six months?
(based on a hypothetical $10,000 investment)
| Costs of a $10,000 investment ($) | Costs paid as a percentage of a $10,000 investment (%) |
|---|
| Weitz Conservative Allocation Fund - Institutional | 36 | 0.70 |
How did the Fund perform for the period?
The Fund (Ticker: WBAIX) returned 4.25% for the 6-month period ended September 30, 2024.
Equity holdings were the primary drivers, with top contributors including Oracle Corporation, Analog Devices, Inc., Veralto Corporation, S&P Global Inc., and Danaher Corporation, supported by robust performance across technology and industrial sectors. Notable equity detractors included Fortive Corporation, Microchip Technology Incorporated, and Martin Marietta Materials, Inc. The fixed income portfolio, anchored by U.S. Treasuries, provided stable contributions through income and modest price appreciation.
For additional manager insights, visit weitzinvestments.com.
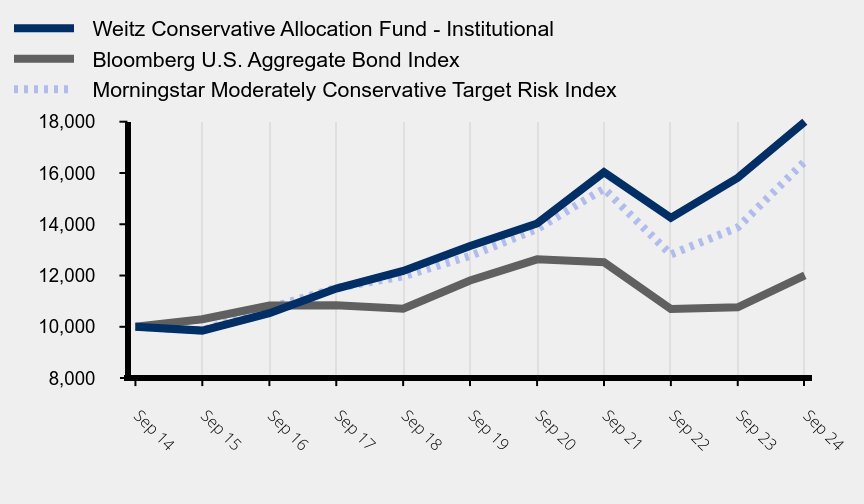
How did the Fund perform during the past 10 years?
Growth of $10,000 investment
| Weitz Conservative Allocation Fund - Institutional | Bloomberg U.S. Aggregate Bond Index | Morningstar Moderately Conservative Target Risk Index |
|---|
| Sep 24 | 17,996 | 12,004 | 16,448 |
| Sep 23 | 15,811 | 10,760 | 13,877 |
| Sep 22 | 14,251 | 10,691 | 12,822 |
| Sep 21 | 16,029 | 12,518 | 15,386 |
| Sep 20 | 14,031 | 12,632 | 13,814 |
| Sep 19 | 13,149 | 11,807 | 12,764 |
| Sep 18 | 12,179 | 10,704 | 11,969 |
| Sep 17 | 11,491 | 10,838 | 11,516 |
| Sep 16 | 10,533 | 10,829 | 10,736 |
| Sep 15 | 9,852 | 10,294 | 9,857 |
| Sep 14 | 10,000 | 10,000 | 10,000 |
Average Annual Total Returns
| 6 Month (%) | 1 Year (%) | 5 Year (%) | 10 Year (%) |
|---|
| Weitz Conservative Allocation Fund - Institutional - WBAIX | 4.25 | 13.81 | 6.48 | 6.05 |
| Bloomberg U.S. Aggregate Bond Index | 5.26 | 11.57 | 0.33 | 1.84 |
| Morningstar Moderately Conservative Target Risk Index | 6.70 | 18.53 | 5.20 | 5.10 |
The above line chart and returns table compares the fund’s results to (i) the Bloomberg U.S. Aggregate Bond Index, a broad measure of market performance and (ii) the Morningstar Moderately Conservative Target Risk Index, an additional index that the investment adviser believes more closely reflects the market segments in which the fund invests. Performance for the Institutional Class before inception (3/29/2019) is derived from historical performance of the Investor Class and has not been adjusted for expenses of the Institutional Class, had it, returns would have been different.
The fund’s past performance is not a predictor of its future performance. Investment results reflect applicable fees and expenses, assumes all distributions are reinvested, and include fee waivers and/or expense reimbursements, without which results would have been lower; however, they do not reflect the deduction of taxes an investor would pay on distributions or share redemptions.
| Net Assets ($) | 239,584,665 |
| Number of Portfolio Holdings | 206 |
| Net Investment Advisory Fees Paid ($) | 707,339 |
| Portfolio Turnover Rate (%) | 12 |
| 30-Day SEC Yield (Subsidized) (%) | 2.20 |
| 30-Day SEC Yield (Unsubsidized) (%) | 2.12 |
| Average Effective Maturity (yrs) | 2.30 |
| Average Effective Duration (yrs) | 1.50 |
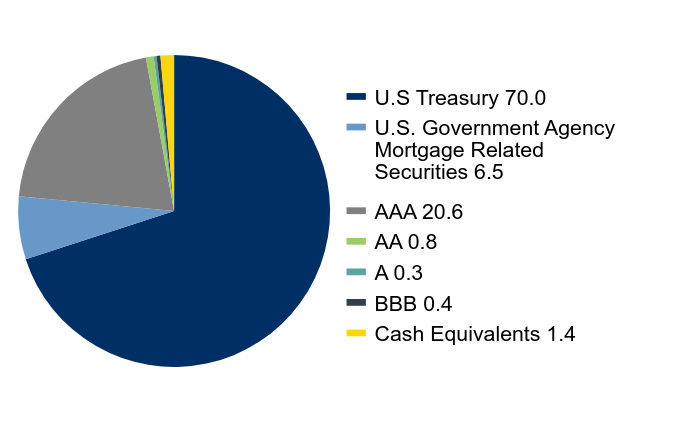
What did the Fund invest in?
(as of September 30, 2023)
| Security | % of Net Assets |
|---|
| Berkshire Hathaway, Inc. | 2.6 |
| Danaher Corp. | 2.4 |
| Aon plc | 2.4 |
| Thermo Fisher Scientific, Inc. | 2.3 |
| Mastercard, Inc. | 2.2 |
| Accenture plc | 2.1 |
| Visa, Inc. | 1.9 |
| Analog Devices, Inc. | 1.9 |
| Vulcan Materials Co. | 1.8 |
| Martin Marietta Materials, Inc. | 1.7 |
| 21.3 |
Credit Quality (% of Portfolio)
| Value | Value |
|---|
| U.S Treasury | 70.0 |
| U.S. Government Agency Mortgage Related Securities | 6.5 |
| AAA | 20.6 |
| AA | 0.8 |
| A | 0.3 |
| BBB | 0.4 |
| Cash Equivalents | 1.4 |
| Return (%) | Average Weight (%) | Contribution (%) |
| Oracle Corp. | 36.3 | 1.5 | 0.50 |
| Analog Devices, Inc. | 17.2 | 2.0 | 0.40 |
| Veralto Corp. | 26.4 | 1.4 | 0.34 |
| S&P Global, Inc. | 21.9 | 1.4 | 0.30 |
| Danaher Corp. | 11.6 | 2.3 | 0.26 |
| % of Net Assets |
| Financials | 11.6 |
| Information Technology | 10.6 |
| Health Care | 7.4 |
| Industrials | 6.3 |
| Materials | 4.7 |
| Communication Services | 2.4 |
| Consumer Staples | 1.4 |
| U.S. Treasuries | 32.5 |
| Asset-Backed Securities | 7.0 |
| Mortgage-Backed Securities | 6.6 |
| Commercial Mortgage-Backed Securities | 2.1 |
| Corporate Bonds | 0.2 |
| Cash Equivalents/Other | 7.2 |
| 100.0 |
| Return (%) | Average Weight (%) | Contribution (%) |
| Martin Marietta Materials, Inc. | (12.1) | 1.8 | (0.25) |
| Vulcan Materials Co. | (7.9) | 1.8 | (0.17) |
| IDEX Corp. | (11.6) | 1.2 | (0.14) |
| Fortive Corp. | (8.1) | 1.1 | (0.12) |
| Michrochip Technology, Inc. | (9.5) | 1.1 | (0.11) |
Credit quality disclosure: Credit ratings are assigned to underlying securities utilizing ratings from a Nationally Recognized Statistical Rating Organization (NRSRO) such as Moody's and Fitch, or other rating agencies and applying the following hierarchy: security is determined to be Investment Grade if it has been rated at least BBB- by one credit rating agency; once determined to be Investment Grade (BBB- and above) or Non-Investment Grade (BB+ and below) where multiple ratings are available, then the lowest rating is assigned. Mortgage-related securities issued and guaranteed by government-sponsored agencies such as Fannie Mae and Freddie Mac are generally not rated by rating agencies. Securities that are not rated do not necessarily indicate low quality. Ratings are shown in the Fitch scale (e.g., AAA). Ratings and portfolio credit quality may change over time. The Fund itself has not been rated by a credit rating agency.
Material fund changes: There were no material fund changes during the reporting period.
Changes in or disagreements with accountants: On September 27, 2024, The Fund replaced its existing independent registered public accounting firm, Ernst & Young LLP ("E&Y"), with Deloitte & Touche LLP. There were no disagreements with E&Y on any matter of accounting principles or practices, financial statement disclosure, or auditing scope or procedure.
Weitz Conservative Allocation Fund
Institutional Class (WBAIX)
Semi-annual shareholder report — September 30, 2024
Additional information about the Fund (e.g. Financial Statements, Prospectus and Statement of Additional Information) is available on the Fund's website at weitz.investments/reports or upon request, by calling 888-859-0698. Additional information about the Fund's Proxy Voting Record is available on the Fund's website at weitz.investments/proxy.
Weitz Conservative Allocation Fund
Semi-annual shareholder report — September 30, 2024
This semi-annual shareholder report contains important information about the Weitz Conservative Allocation Fund (the "Fund") for the period of April 1, 2024 to September 30, 2024. You can find additional information about the Fund at weitz.investments/reports. You can also request information by contacting us at 888-859-0698.
What were the Fund's costs for the last six months?
(based on a hypothetical $10,000 investment)
| Costs of a $10,000 investment ($) | Costs paid as a percentage of a $10,000 investment (%) |
|---|
| Weitz Conservative Allocation Fund - Investor | 44 | 0.85 |
How did the Fund perform for the period?
The Fund (Ticker: WBALX) returned 4.23% for the 6-month period ended September 30, 2024.
Equity holdings were the primary drivers, with top contributors including Oracle Corporation, Analog Devices, Inc., Veralto Corporation, S&P Global Inc., and Danaher Corporation, supported by robust performance across technology and industrial sectors. Notable equity detractors included Fortive Corporation, Microchip Technology Incorporated, and Martin Marietta Materials, Inc. The fixed income portfolio, anchored by U.S. Treasuries, provided stable contributions through income and modest price appreciation.
For additional manager insights, visit weitzinvestments.com.
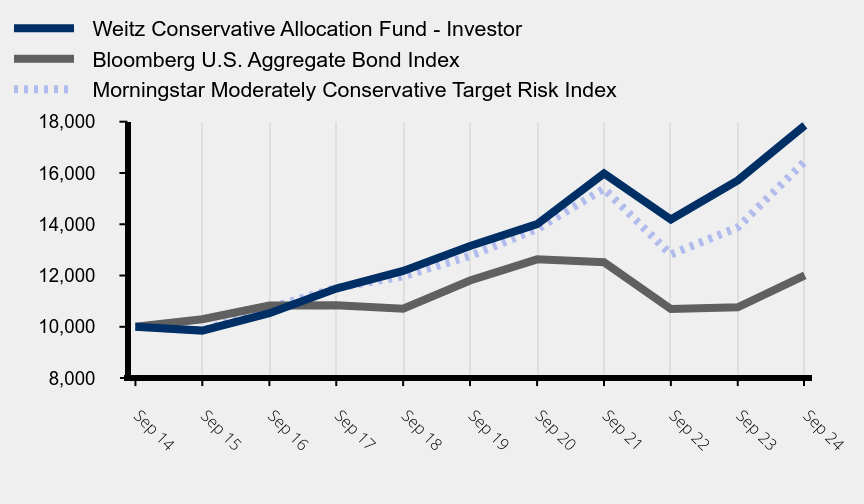
How did the Fund perform during the past 10 years?
Growth of $10,000 investment
| Weitz Conservative Allocation Fund - Investor | Bloomberg U.S. Aggregate Bond Index | Morningstar Moderately Conservative Target Risk Index |
|---|
| Sep 24 | 17,859 | 12,004 | 16,448 |
| Sep 23 | 15,712 | 10,760 | 13,877 |
| Sep 22 | 14,183 | 10,691 | 12,822 |
| Sep 21 | 15,981 | 12,518 | 15,386 |
| Sep 20 | 14,004 | 12,632 | 13,814 |
| Sep 19 | 13,149 | 11,807 | 12,764 |
| Sep 18 | 12,179 | 10,704 | 11,969 |
| Sep 17 | 11,491 | 10,838 | 11,516 |
| Sep 16 | 10,533 | 10,829 | 10,736 |
| Sep 15 | 9,852 | 10,294 | 9,857 |
| Sep 14 | 10,000 | 10,000 | 10,000 |
Average Annual Total Returns
| 6 Month (%) | 1 Year (%) | 5 Year (%) | 10 Year (%) |
|---|
| Weitz Conservative Allocation Fund - Investor - WBALX | 4.23 | 13.66 | 6.31 | 5.97 |
| Bloomberg U.S. Aggregate Bond Index | 5.26 | 11.57 | 0.33 | 1.84 |
| Morningstar Moderately Conservative Target Risk Index | 6.70 | 18.53 | 5.20 | 5.10 |
The above line chart and returns table compares the fund’s results to (i) the Bloomberg U.S. Aggregate Bond Index, a broad measure of market performance and (ii) the Morningstar Moderately Conservative Target Risk Index, an additional index that the investment adviser believes more closely reflects the market segments in which the fund invests.
The fund’s past performance is not a predictor of its future performance. Investment results reflect applicable fees and expenses, assumes all distributions are reinvested, and include fee waivers and/or expense reimbursements, without which results would have been lower; however, they do not reflect the deduction of taxes an investor would pay on distributions or share redemptions.
| Net Assets ($) | 239,584,665 |
| Number of Portfolio Holdings | 206 |
| Net Investment Advisory Fees Paid ($) | 707,339 |
| Portfolio Turnover Rate (%) | 12 |
| 30-Day SEC Yield (Subsidized) (%) | 2.06 |
| 30-Day SEC Yield (Unsubsidized) (%) | 1.92 |
| Average Effective Maturity (yrs) | 2.30 |
| Average Effective Duration (yrs) | 1.50 |
What did the Fund invest in?
(as of September 30, 2023)
| Security | % of Net Assets |
|---|
| Berkshire Hathaway, Inc. | 2.6 |
| Danaher Corp. | 2.4 |
| Aon plc | 2.4 |
| Thermo Fisher Scientific, Inc. | 2.3 |
| Mastercard, Inc. | 2.2 |
| Accenture plc | 2.1 |
| Visa, Inc. | 1.9 |
| Analog Devices, Inc. | 1.9 |
| Vulcan Materials Co. | 1.8 |
| Martin Marietta Materials, Inc. | 1.7 |
| 21.3 |
Credit Quality (% of Portfolio)
| Value | Value |
|---|
| U.S Treasury | 70.0 |
| U.S. Government Agency Mortgage Related Securities | 6.5 |
| AAA | 20.6 |
| AA | 0.8 |
| A | 0.3 |
| BBB | 0.4 |
| Cash Equivalents | 1.4 |
| Return (%) | Average Weight (%) | Contribution (%) |
| Oracle Corp. | 36.3 | 1.5 | 0.50 |
| Analog Devices, Inc. | 17.2 | 2.0 | 0.40 |
| Veralto Corp. | 26.4 | 1.4 | 0.34 |
| S&P Global, Inc. | 21.9 | 1.4 | 0.30 |
| Danaher Corp. | 11.6 | 2.3 | 0.26 |
| % of Net Assets |
| Financials | 11.6 |
| Information Technology | 10.6 |
| Health Care | 7.4 |
| Industrials | 6.3 |
| Materials | 4.7 |
| Communication Services | 2.4 |
| Consumer Staples | 1.4 |
| U.S. Treasuries | 32.5 |
| Asset-Backed Securities | 7.0 |
| Mortgage-Backed Securities | 6.6 |
| Commercial Mortgage-Backed Securities | 2.1 |
| Corporate Bonds | 0.2 |
| Cash Equivalents/Other | 7.2 |
| 100.0 |
| Return (%) | Average Weight (%) | Contribution (%) |
| Martin Marietta Materials, Inc. | (12.1) | 1.8 | (0.25) |
| Vulcan Materials Co. | (7.9) | 1.8 | (0.17) |
| IDEX Corp. | (11.6) | 1.2 | (0.14) |
| Fortive Corp. | (8.1) | 1.1 | (0.12) |
| Michrochip Technology, Inc. | (9.5) | 1.1 | (0.11) |
Credit quality disclosure: Credit ratings are assigned to underlying securities utilizing ratings from a Nationally Recognized Statistical Rating Organization (NRSRO) such as Moody's and Fitch, or other rating agencies and applying the following hierarchy: security is determined to be Investment Grade if it has been rated at least BBB- by one credit rating agency; once determined to be Investment Grade (BBB- and above) or Non-Investment Grade (BB+ and below) where multiple ratings are available, then the lowest rating is assigned. Mortgage-related securities issued and guaranteed by government-sponsored agencies such as Fannie Mae and Freddie Mac are generally not rated by rating agencies. Securities that are not rated do not necessarily indicate low quality. Ratings are shown in the Fitch scale (e.g., AAA). Ratings and portfolio credit quality may change over time. The Fund itself has not been rated by a credit rating agency.
Material fund changes: There were no material fund changes during the reporting period.
Changes in or disagreements with accountants: On September 27, 2024, The Fund replaced its existing independent registered public accounting firm, Ernst & Young LLP ("E&Y"), with Deloitte & Touche LLP. There were no disagreements with E&Y on any matter of accounting principles or practices, financial statement disclosure, or auditing scope or procedure.
Weitz Conservative Allocation Fund
Semi-annual shareholder report — September 30, 2024
Additional information about the Fund (e.g. Financial Statements, Prospectus and Statement of Additional Information) is available on the Fund's website at weitz.investments/reports or upon request, by calling 888-859-0698. Additional information about the Fund's Proxy Voting Record is available on the Fund's website at weitz.investments/proxy.
Weitz Core Plus Income Fund
Institutional Class (WCPBX)
Semi-annual shareholder report — September 30, 2024
This semi-annual shareholder report contains important information about the Weitz Core Plus Income Fund (the "Fund") for the period of April 1, 2024 to September 30, 2024. You can find additional information about the Fund at weitz.investments/reports. You can also request information by contacting us at 888-859-0698.
What were the Fund's costs for the last six months?
(based on a hypothetical $10,000 investment)
| Costs of a $10,000 investment ($) | Costs paid as a percentage of a $10,000 investment (%) |
|---|
| Weitz Core Plus Income Fund - Institutional | 23 | 0.45 |
How did the Fund perform for the period?
The Fund (Ticker: WCPBX) returned 5.51% for the 6-month period ended September 30, 2024.
U.S. Treasuries, Agency mortgage-backed securities (MBS), corporate bonds, asset-backed securities (ABS), and collateralized loan obligations (CLOs) were top contributors. Treasuries saw gains from longer durations as interest rates declined. MBS benefited from strong coupon income and modestly tighter spreads, while corporate bonds, led by REITs and financials, gained as credit spreads narrowed. ABS and CLOs also delivered solid returns from sector and security selections, with notable contributions from investments in data centers and fiber networks. No segments detracted materially from performance.
For additional manager insights, visit weitzinvestments.com.
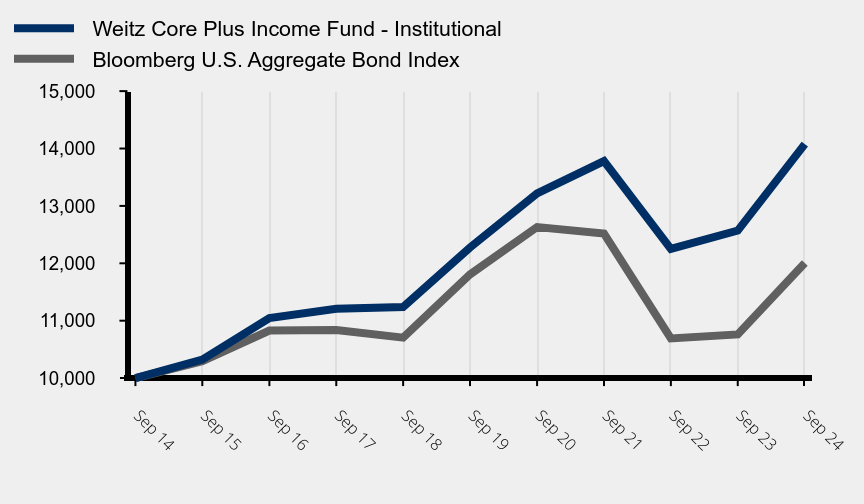
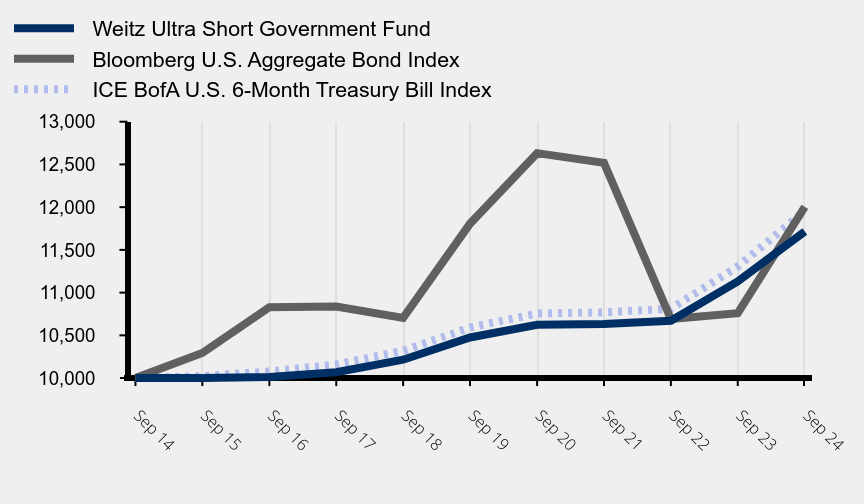
How did the Fund perform during the past 10 years?
Growth of $10,000 investment
| Weitz Core Plus Income Fund - Institutional | Bloomberg U.S. Aggregate Bond Index |
|---|
| Sep 24 | 14,076 | 12,004 |
| Sep 23 | 12,570 | 10,760 |
| Sep 22 | 12,251 | 10,691 |
| Sep 21 | 13,781 | 12,518 |
| Sep 20 | 13,218 | 12,632 |
| Sep 19 | 12,276 | 11,807 |
| Sep 18 | 11,238 | 10,704 |
| Sep 17 | 11,208 | 10,838 |
| Sep 16 | 11,047 | 10,829 |
| Sep 15 | 10,321 | 10,294 |
| Sep 14 | 10,000 | 10,000 |
Average Annual Total Returns
| 6 Month (%) | 1 Year (%) | 5 Year (%) | 10 Year (%) |
|---|
| Weitz Core Plus Income Fund - Institutional - WCPBX | 5.51 | 11.98 | 2.77 | 3.48 |
| Bloomberg U.S. Aggregate Bond Index | 5.26 | 11.57 | 0.33 | 1.84 |
The above line chart and returns table compares the fund’s results to the Bloomberg U.S. Aggregate Bond Index, a broad measure of market performance.
The fund’s past performance is not a predictor of its future performance. Investment results reflect applicable fees and expenses, assumes all distributions are reinvested, and include fee waivers and/or expense reimbursements, without which results would have been lower; however, they do not reflect the deduction of taxes an investor would pay on distributions or share redemptions.
| Net Assets ($) | 2,685,443,145 |
| Number of Portfolio Holdings | 539 |
| Net Investment Advisory Fees Paid ($) | 4,290,636 |
| Portfolio Turnover Rate (%) | 5 |
| 30-Day SEC Yield (Subsidized) (%) | 5.06 |
| 30-Day SEC Yield (Unsubsidized) (%) | 4.97 |
| Average Effective Maturity (yrs) | 9.00 |
| Average Effective Duration (yrs) | 5.50 |
What did the Fund invest in?
(as of September 30, 2023)
| Maturity | % of Portfolio |
| Cash Equivalents | 0.5 |
| Less than 1 Year | 4.5 |
| 1-3 Years | 8.9 |
| 3-5 Years | 21.9 |
| 5-7 Years | 15.5 |
| 7-10 Years | 15.8 |
| 10 Years or more | 32.9 |
| 100.0 |
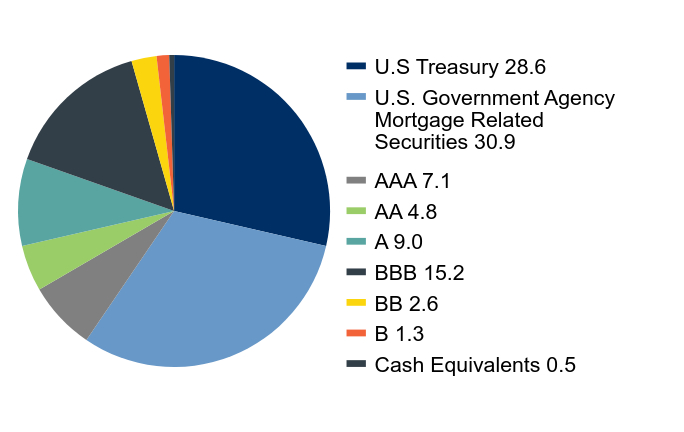
Credit Quality (% of Portfolio)
| Value | Value |
|---|
| U.S Treasury | 28.6 |
| U.S. Government Agency Mortgage Related Securities | 30.9 |
| AAA | 7.1 |
| AA | 4.8 |
| A | 9.0 |
| BBB | 15.2 |
| BB | 2.6 |
| B | 1.3 |
| Cash Equivalents | 0.5 |
| Maturity | | | % of Portfolio |
| Less than 1 Year | | | 16.6 |
| 1-3 Years | | | 20.9 |
| 3-5 Years | | | 27.1 |
| 5-7 Years | | | 9.5 |
7-10 Years | | | 2.9 |
| 10 Years or more | | | 23.0 |
| | | 100.0 |
| % of Net Assets |
| Mortgage-Backed Securities | 34.1 |
| U.S. Treasuries | 28.4 |
| Asset-Backed Securities | 18.0 |
| Corporate Bonds | 12.2 |
| Commercial Mortgage-Backed Securities | 6.3 |
| Short-Term Securities Held as Collateral for Securities on Loan | 0.2 |
| Municipal Bonds | 0.0 |
| Corporate Convertible Bonds | 0.0 |
| Cash Equivalents/Other | 0.8 |
| 100.0 |
Credit quality disclosure: Credit ratings are assigned to underlying securities utilizing ratings from a Nationally Recognized Statistical Rating Organization (NRSRO) such as Moody's and Fitch, or other rating agencies and applying the following hierarchy: security is determined to be Investment Grade if it has been rated at least BBB- by one credit rating agency; once determined to be Investment Grade (BBB- and above) or Non-Investment Grade (BB+ and below) where multiple ratings are available, then the lowest rating is assigned. Mortgage-related securities issued and guaranteed by government-sponsored agencies such as Fannie Mae and Freddie Mac are generally not rated by rating agencies. Securities that are not rated do not necessarily indicate low quality. Ratings are shown in the Fitch scale (e.g., AAA). Ratings and portfolio credit quality may change over time. The Fund itself has not been rated by a credit rating agency.
Material fund changes: There were no material fund changes during the reporting period.
Changes in or disagreements with accountants: On September 27, 2024, The Fund replaced its existing independent registered public accounting firm, Ernst & Young LLP ("E&Y"), with Deloitte & Touche LLP. There were no disagreements with E&Y on any matter of accounting principles or practices, financial statement disclosure, or auditing scope or procedure.
Weitz Core Plus Income Fund
Institutional Class (WCPBX)
Semi-annual shareholder report — September 30, 2024
Additional information about the Fund (e.g. Financial Statements, Prospectus and Statement of Additional Information) is available on the Fund's website at weitz.investments/reports or upon request, by calling 888-859-0698. Additional information about the Fund's Proxy Voting Record is available on the Fund's website at weitz.investments/proxy.
Weitz Core Plus Income Fund
Semi-annual shareholder report — September 30, 2024
This semi-annual shareholder report contains important information about the Weitz Core Plus Income Fund (the "Fund") for the period of April 1, 2024 to September 30, 2024. This report describes changes to the Fund that occurred during the reporting period. You can find additional information about the Fund at weitz.investments/reports. You can also request information by contacting us at 888-859-0698.
What were the Fund's costs for the last six months?
(based on a hypothetical $10,000 investment)
| Costs of a $10,000 investment ($) | Costs paid as a percentage of a $10,000 investment (%) |
|---|
| Weitz Core Plus Income Fund - Investor | 30 | 0.59 |
How did the Fund perform for the period?
The Fund (Ticker: WCPNX) returned 5.45% for the 6-month period ended September 30, 2024.
U.S. Treasuries, Agency mortgage-backed securities (MBS), corporate bonds, asset-backed securities (ABS), and collateralized loan obligations (CLOs) were top contributors. Treasuries saw gains from longer durations as interest rates declined. MBS benefited from strong coupon income and modestly tighter spreads, while corporate bonds, led by REITs and financials, gained as credit spreads narrowed. ABS and CLOs also delivered solid returns from sector and security selections, with notable contributions from investments in data centers and fiber networks. No segments detracted materially from performance.
For additional manager insights, visit weitzinvestments.com.
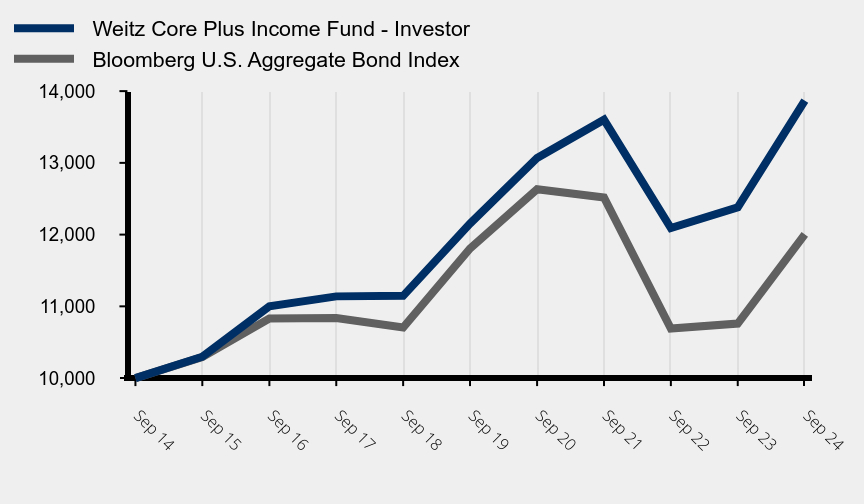
How did the Fund perform during the past 10 years?
Growth of $10,000 investment
| Weitz Core Plus Income Fund - Investor | Bloomberg U.S. Aggregate Bond Index |
|---|
| Sep 24 | 13,868 | 12,004 |
| Sep 23 | 12,381 | 10,760 |
| Sep 22 | 12,091 | 10,691 |
| Sep 21 | 13,602 | 12,518 |
| Sep 20 | 13,069 | 12,632 |
| Sep 19 | 12,153 | 11,807 |
| Sep 18 | 11,146 | 10,704 |
| Sep 17 | 11,139 | 10,838 |
| Sep 16 | 11,000 | 10,829 |
| Sep 15 | 10,298 | 10,294 |
| Sep 14 | 10,000 | 10,000 |
Average Annual Total Returns
| 6 Month (%) | 1 Year (%) | 5 Year (%) | 10 Year (%) |
|---|
| Weitz Core Plus Income Fund - Investor - WCPNX | 5.45 | 12.01 | 2.67 | 3.32 |
| Bloomberg U.S. Aggregate Bond Index | 5.26 | 11.57 | 0.33 | 1.84 |
The above line chart and returns table compares the fund’s results to the Bloomberg U.S. Aggregate Bond Index, a broad measure of market performance.
The fund’s past performance is not a predictor of its future performance. Investment results reflect applicable fees and expenses, assumes all distributions are reinvested, and include fee waivers and/or expense reimbursements, without which results would have been lower; however, they do not reflect the deduction of taxes an investor would pay on distributions or share redemptions.
| Net Assets ($) | 2,685,443,145 |
| Number of Portfolio Holdings | 539 |
| Net Investment Advisory Fees Paid ($) | 4,290,636 |
| Portfolio Turnover Rate (%) | 5 |
| 30-Day SEC Yield (Subsidized) (%) | 4.86 |
| 30-Day SEC Yield (Unsubsidized) (%) | 4.79 |
| Average Effective Maturity (yrs) | 9.00 |
| Average Effective Duration (yrs) | 5.50 |
What did the Fund invest in?
(as of September 30, 2023)
| Maturity | % of Portfolio |
| Cash Equivalents | 0.5 |
| Less than 1 Year | 4.5 |
| 1-3 Years | 8.9 |
| 3-5 Years | 21.9 |
| 5-7 Years | 15.5 |
| 7-10 Years | 15.8 |
| 10 Years or more | 32.9 |
| 100.0 |
Credit Quality (% of Portfolio)
| Value | Value |
|---|
| U.S Treasury | 28.6 |
| U.S. Government Agency Mortgage Related Securities | 30.9 |
| AAA | 7.1 |
| AA | 4.8 |
| A | 9.0 |
| BBB | 15.2 |
| BB | 2.6 |
| B | 1.3 |
| Cash Equivalents | 0.5 |
| Maturity | | | % of Portfolio |
| Less than 1 Year | | | 16.6 |
| 1-3 Years | | | 20.9 |
| 3-5 Years | | | 27.1 |
| 5-7 Years | | | 9.5 |
| 7-10 Years | | | 2.9 |
| 10 Years or more | | | 23.0 |
| | | 100.0 |
| % of Net Assets |
| Mortgage-Backed Securities | 34.1 |
| U.S. Treasuries | 28.4 |
| Asset-Backed Securities | 18.0 |
| Corporate Bonds | 12.2 |
| Commercial Mortgage-Backed Securities | 6.3 |
| Short-Term Securities Held as Collateral for Securities on Loan | 0.2 |
| Municipal Bonds | 0.0 |
| Corporate Convertible Bonds | 0.0 |
| Cash Equivalents/Other | 0.8 |
| 100.0 |
Credit quality disclosure: Credit ratings are assigned to underlying securities utilizing ratings from a Nationally Recognized Statistical Rating Organization (NRSRO) such as Moody's and Fitch, or other rating agencies and applying the following hierarchy: security is determined to be Investment Grade if it has been rated at least BBB- by one credit rating agency; once determined to be Investment Grade (BBB- and above) or Non-Investment Grade (BB+ and below) where multiple ratings are available, then the lowest rating is assigned. Mortgage-related securities issued and guaranteed by government-sponsored agencies such as Fannie Mae and Freddie Mac are generally not rated by rating agencies. Securities that are not rated do not necessarily indicate low quality. Ratings are shown in the Fitch scale (e.g., AAA). Ratings and portfolio credit quality may change over time. The Fund itself has not been rated by a credit rating agency.
Material fund changes: Effective July 31, 2024, the annual operating expense ratio cap was updated to 0.65%. Prior to July 31, 2024, the annual operating expense ratio cap was 0.55%.
Changes in or disagreements with accountants: On September 27, 2024, The Fund replaced its existing independent registered public accounting firm, Ernst & Young LLP ("E&Y"), with Deloitte & Touche LLP. There were no disagreements with E&Y on any matter of accounting principles or practices, financial statement disclosure, or auditing scope or procedure.
Weitz Core Plus Income Fund
Semi-annual shareholder report — September 30, 2024
Additional information about the Fund (e.g. Financial Statements, Prospectus and Statement of Additional Information) is available on the Fund's website at weitz.investments/reports or upon request, by calling 888-859-0698. Additional information about the Fund's Proxy Voting Record is available on the Fund's website at weitz.investments/proxy.
Weitz Large Cap Equity Fund
Institutional Class (WVAIX)
Semi-annual shareholder report — September 30, 2024
This semi-annual shareholder report contains important information about the Weitz Large Cap Equity Fund (the "Fund") for the period of April 1, 2024 to September 30, 2024. You can find additional information about the Fund at weitz.investments/reports. You can also request information by contacting us at 888-859-0698.
What were the Fund's costs for the last six months?
(based on a hypothetical $10,000 investment)
| Costs of a $10,000 investment ($) | Costs paid as a percentage of a $10,000 investment (%) |
|---|
| Weitz Large Cap Equity Fund - Institutional | 45 | 0.87 |
How did the Fund perform for the period?
The Fund (Ticker: WVAIX) returned 5.23% for the 6-month period ended September 30, 2024.
Top contributors included Oracle Corporation, Meta Platforms, Inc., Analog Devices, Inc., S&P Global Inc., and Alphabet Inc., benefiting from diverse sector strengths. Primary detractors were CoStar Group, Inc., Global Payments Inc., Salesforce, Inc., Vulcan Materials Company, and Liberty Media Corp-Liberty SiriusXM (sold during the period). Recent additions like IDEX Corporation, Constellation Software Inc., and Old Dominion Freight Line, Inc., reflect the Fund’s focus on high-quality, long-term investments across varied industries.
For additional manager insights, visit weitzinvestments.com.
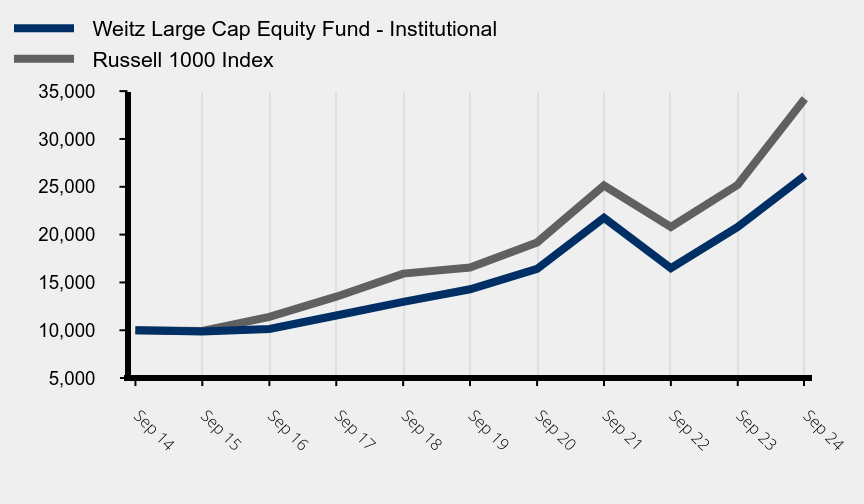
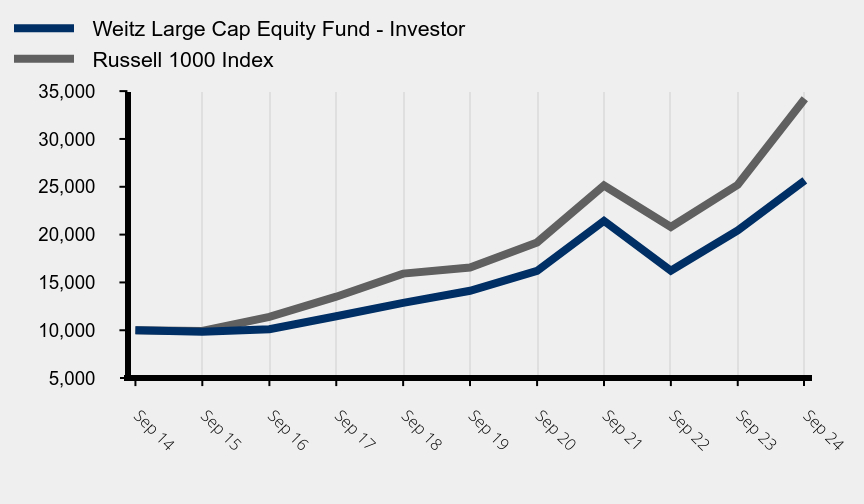
How did the Fund perform during the past 10 years?
Growth of $10,000 investment
| Weitz Large Cap Equity Fund - Institutional | Russell 1000 Index |
|---|
| Sep 24 | 26,172 | 34,203 |
| Sep 23 | 20,805 | 25,209 |
| Sep 22 | 16,500 | 20,800 |
| Sep 21 | 21,756 | 25,130 |
| Sep 20 | 16,424 | 19,185 |
| Sep 19 | 14,282 | 16,554 |
| Sep 18 | 12,972 | 15,921 |
| Sep 17 | 11,543 | 13,510 |
| Sep 16 | 10,142 | 11,405 |
| Sep 15 | 9,871 | 9,923 |
| Sep 14 | 10,000 | 10,000 |
Average Annual Total Returns
| 6 Month (%) | 1 Year (%) | 5 Year (%) | 10 Year (%) |
|---|
| Weitz Large Cap Equity Fund - Institutional - WVAIX | 5.23 | 25.80 | 12.88 | 10.10 |
| Russell 1000 Index | 9.87 | 35.68 | 15.62 | 13.09 |
The above line chart and returns table compares the fund’s results to the Russell 1000 Index, a broad measure of market performance.
The fund’s past performance is not a predictor of its future performance. Investment results reflect applicable fees and expenses, assumes all distributions are reinvested, and include fee waivers and/or expense reimbursements, without which results would have been lower; however, they do not reflect the deduction of taxes an investor would pay on distributions or share redemptions.
| Net Assets ($) | 959,709,050 |
| Number of Portfolio Holdings | 31 |
| Net Investment Advisory Fees Paid ($) | 3,441,005 |
| Portfolio Turnover Rate (%) | 15 |
What did the Fund invest in?
(as of September 30, 2023)
| Security | % of Net Assets |
|---|
| Berkshire Hathaway, Inc. | 5.2 |
| Danaher Corp. | 4.9 |
| Mastercard, Inc. | 4.9 |
| Visa, Inc. | 4.9 |
| Thermo Fisher Scientific, Inc. | 4.9 |
| Global Payments, Inc. | 4.5 |
| Meta Platforms, Inc. | 4.5 |
| Aon plc | 4.4 |
| Alphabet, Inc. | 4.3 |
| Charter Communications, Inc. | 3.7 |
| 46.2 |
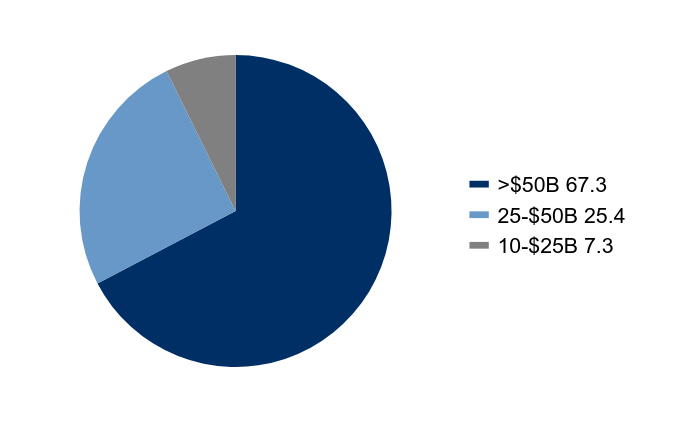
Capitalization (% of Common Stock)
| Value | Value |
|---|
| >$50B | 67.3 |
| 25-$50B | 25.4 |
| 10-$25B | 7.3 |
| Return (%) | Average Weight (%) | Contribution (%) |
| Oracle Corp. | 36.2 | 3.0 | 0.97 |
| Meta Platforms, Inc. - Class A | 18.6 | 4.8 | 0.92 |
| Analog Devices, Inc. | 17.1 | 3.4 | 0.82 |
| Alphabet, Inc. - Class C | 10.0 | 5.0 | 0.65 |
| S&P Global, Inc. | 21.9 | 2.9 | 0.63 |
| % of Net Assets |
| Financials | 28.8 |
| Information Technology | 22.9 |
| Communication Services | 12.5 |
| Health Care | 11.5 |
| Industrials | 10.6 |
| Consumer Discretionary | 6.1 |
| Real Estate | 3.4 |
| Materials | 2.6 |
| Cash Equivalents/Other | 1.6 |
| 100.0 |
| Return (%) | Average Weight (%) | Contribution (%) |
| CoStar Group, Inc. | (21.9) | 3.8 | (1.08) |
| Global Payments, Inc. | (23.1) | 3.6 | (0.76) |
| Liberty Media Corp. - SiriusXM | (25.3) | 0.5 | (0.47) |
| Salesforce, Inc. | (9.0) | 2.8 | (0.38) |
| Vulcan Materials Co. | (8.0) | 3.0 | (0.33) |
Material fund changes: There were no material fund changes during the reporting period.
Changes in or disagreements with accountants: On September 27, 2024, The Fund replaced its existing independent registered public accounting firm, Ernst & Young LLP ("E&Y"), with Deloitte & Touche LLP. There were no disagreements with E&Y on any matter of accounting principles or practices, financial statement disclosure, or auditing scope or procedure.
Weitz Large Cap Equity Fund
Institutional Class (WVAIX)
Semi-annual shareholder report — September 30, 2024
Additional information about the Fund (e.g. Financial Statements, Prospectus and Statement of Additional Information) is available on the Fund's website at weitz.investments/reports or upon request, by calling 888-859-0698. Additional information about the Fund's Proxy Voting Record is available on the Fund's website at weitz.investments/proxy.
Weitz Large Cap Equity Fund
Semi-annual shareholder report — September 30, 2024
This semi-annual shareholder report contains important information about the Weitz Large Cap Equity Fund (the "Fund") for the period of April 1, 2024 to September 30, 2024. You can find additional information about the Fund at weitz.investments/reports. You can also request information by contacting us at 888-859-0698.
What were the Fund's costs for the last six months?
(based on a hypothetical $10,000 investment)
| Costs of a $10,000 investment ($) | Costs paid as a percentage of a $10,000 investment (%) |
|---|
| Weitz Large Cap Equity Fund - Investor | 52 | 1.02 |
How did the Fund perform for the period?
The Fund (Ticker: WVALX) returned 5.15% for the 6-month period ended September 30, 2024.
Top contributors included Oracle Corporation, Meta Platforms, Inc., Analog Devices, Inc., S&P Global Inc., and Alphabet Inc., benefiting from diverse sector strengths. Primary detractors were CoStar Group, Inc., Global Payments Inc., Salesforce, Inc., Vulcan Materials Company, and Liberty Media Corp-Liberty SiriusXM (sold during the period). Recent additions like IDEX Corporation, Constellation Software Inc., and Old Dominion Freight Line, Inc., reflect the Fund’s focus on high-quality, long-term investments across varied industries.
For additional manager insights, visit weitzinvestments.com.
How did the Fund perform during the past 10 years?
Growth of $10,000 investment
| Weitz Large Cap Equity Fund - Investor | Russell 1000 Index |
|---|
| Sep 24 | 25,666 | 34,203 |
| Sep 23 | 20,437 | 25,209 |
| Sep 22 | 16,226 | 20,800 |
| Sep 21 | 21,432 | 25,130 |
| Sep 20 | 16,210 | 19,185 |
| Sep 19 | 14,124 | 16,554 |
| Sep 18 | 12,860 | 15,921 |
| Sep 17 | 11,469 | 13,510 |
| Sep 16 | 10,101 | 11,405 |
| Sep 15 | 9,850 | 9,923 |
| Sep 14 | 10,000 | 10,000 |
Average Annual Total Returns
| 6 Month (%) | 1 Year (%) | 5 Year (%) | 10 Year (%) |
|---|
| Weitz Large Cap Equity Fund - Investor - WVALX | 5.15 | 25.59 | 12.69 | 9.88 |
| Russell 1000 Index | 9.87 | 35.68 | 15.62 | 13.09 |
The above line chart and returns table compares the fund’s results to the Russell 1000 Index, a broad measure of market performance.
The fund’s past performance is not a predictor of its future performance. Investment results reflect applicable fees and expenses, assumes all distributions are reinvested, and include fee waivers and/or expense reimbursements, without which results would have been lower; however, they do not reflect the deduction of taxes an investor would pay on distributions or share redemptions.
| Net Assets ($) | 959,709,050 |
| Number of Portfolio Holdings | 31 |
| Net Investment Advisory Fees Paid ($) | 3,441,005 |
| Portfolio Turnover Rate (%) | 15 |
What did the Fund invest in?
(as of September 30, 2023)
| Security | % of Net Assets |
|---|
| Berkshire Hathaway, Inc. | 5.2 |
| Danaher Corp. | 4.9 |
| Mastercard, Inc. | 4.9 |
| Visa, Inc. | 4.9 |
| Thermo Fisher Scientific, Inc. | 4.9 |
| Global Payments, Inc. | 4.5 |
| Meta Platforms, Inc. | 4.5 |
| Aon plc | 4.4 |
| Alphabet, Inc. | 4.3 |
| Charter Communications, Inc. | 3.7 |
| 46.2 |
Capitalization (% of Common Stock)
| Value | Value |
|---|
| >$50B | 67.3 |
| 25-$50B | 25.4 |
| 10-$25B | 7.3 |
| Return (%) | Average Weight (%) | Contribution (%) |
| Oracle Corp. | 36.2 | 3.0 | 0.97 |
| Meta Platforms, Inc. - Class A | 18.6 | 4.8 | 0.92 |
| Analog Devices, Inc. | 17.1 | 3.4 | 0.82 |
| Alphabet, Inc. - Class C | 10.0 | 5.0 | 0.65 |
| S&P Global, Inc. | 21.9 | 2.9 | 0.63 |
| % of Net Assets |
| Financials | 28.8 |
| Information Technology | 22.9 |
| Communication Services | 12.5 |
| Health Care | 11.5 |
| Industrials | 10.6 |
| Consumer Discretionary | 6.1 |
| Real Estate | 3.4 |
| Materials | 2.6 |
| Cash Equivalents/Other | 1.6 |
| 100.0 |
| Return (%) | Average Weight (%) | Contribution (%) |
| CoStar Group, Inc. | (21.9) | 3.8 | (1.08) |
| Global Payments, Inc. | (23.1) | 3.6 | (0.76) |
| Liberty Media Corp. - SiriusXM | (25.3) | 0.5 | (0.47) |
| Salesforce, Inc. | (9.0) | 2.8 | (0.38) |
| Vulcan Materials Co. | (8.0) | 3.0 | (0.33) |
Material fund changes: There were no material fund changes during the reporting period.
Changes in or disagreements with accountants: On September 27, 2024, The Fund replaced its existing independent registered public accounting firm, Ernst & Young LLP ("E&Y"), with Deloitte & Touche LLP. There were no disagreements with E&Y on any matter of accounting principles or practices, financial statement disclosure, or auditing scope or procedure.
Weitz Large Cap Equity Fund
Semi-annual shareholder report — September 30, 2024
Additional information about the Fund (e.g. Financial Statements, Prospectus and Statement of Additional Information) is available on the Fund's website at weitz.investments/reports or upon request, by calling 888-859-0698. Additional information about the Fund's Proxy Voting Record is available on the Fund's website at weitz.investments/proxy.
Weitz Multi Cap Equity Fund
Institutional Class (WPVIX)
Semi-annual shareholder report — September 30, 2024
This semi-annual shareholder report contains important information about the Weitz Multi Cap Equity Fund (the "Fund") for the period of April 1, 2024 to September 30, 2024. You can find additional information about the Fund at weitz.investments/reports. You can also request information by contacting us at 888-859-0698.
What were the Fund's costs for the last six months?
(based on a hypothetical $10,000 investment)
| Costs of a $10,000 investment ($) | Costs paid as a percentage of a $10,000 investment (%) |
|---|
| Weitz Multi Cap Equity Fund - Institutional | 45 | 0.87 |
How did the Fund perform for the period?
The Fund (Ticker: WPVIX) returned 6.87% for the 6-month period ended September 30, 2024.
Top contributors over the period included Perimeter Solutions SA, HEICO Corporation, Guidewire Software Inc., ACI Worldwide Inc., and Meta Platforms Inc., reflecting robust operating momentum and company-specific strategies. Detractors included CoStar Group Inc., LKQ Corporation, Liberty Media Corp-Liberty SiriusXM, Martin Marietta Materials Inc., and CarMax Inc., impacted by sector-specific challenges.
For additional manager insights, visit weitzinvestments.com.
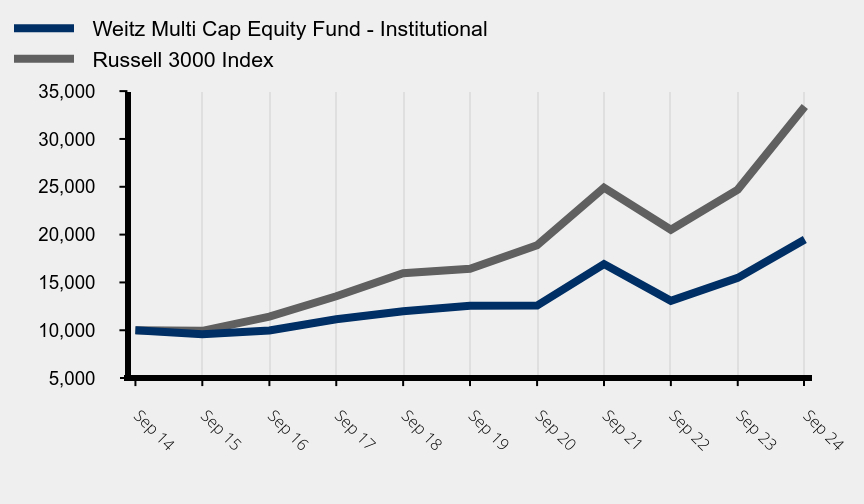
How did the Fund perform during the past 10 years?
Growth of $10,000 investment
| Weitz Multi Cap Equity Fund - Institutional | Russell 3000 Index |
|---|
| Sep 24 | 19,489 | 33,401 |
| Sep 23 | 15,475 | 24,706 |
| Sep 22 | 13,074 | 20,510 |
| Sep 21 | 16,918 | 24,902 |
| Sep 20 | 12,576 | 18,880 |
| Sep 19 | 12,564 | 16,426 |
| Sep 18 | 11,977 | 15,952 |
| Sep 17 | 11,143 | 13,556 |
| Sep 16 | 9,981 | 11,429 |
| Sep 15 | 9,588 | 9,941 |
| Sep 14 | 10,000 | 10,000 |
Average Annual Total Returns
| 6 Month (%) | 1 Year (%) | 5 Year (%) | 10 Year (%) |
|---|
| Weitz Multi Cap Equity Fund - Institutional - WPVIX | 6.87 | 25.94 | 9.18 | 6.90 |
| Russell 3000 Index | 9.65 | 35.19 | 15.25 | 12.82 |
The above line chart and returns table compares the fund’s results to the Russell 3000 Index, a broad measure of market performance.
The fund’s past performance is not a predictor of its future performance. Investment results reflect applicable fees and expenses, assumes all distributions are reinvested, and include fee waivers and/or expense reimbursements, without which results would have been lower; however, they do not reflect the deduction of taxes an investor would pay on distributions or share redemptions.
| Net Assets ($) | 593,976,885 |
| Number of Portfolio Holdings | 34 |
| Net Investment Advisory Fees Paid ($) | 2,108,990 |
| Portfolio Turnover Rate (%) | 6 |
What did the Fund invest in?
(as of September 30, 2023)
| Security | % of Net Assets |
|---|
| Berkshire Hathaway, Inc. | 7.0 |
| Meta Platforms, Inc. | 6.2 |
| Alphabet, Inc. | 5.5 |
| HEICO Corp. | 5.5 |
| Visa, Inc. | 4.3 |
| Mastercard, Inc. | 4.2 |
| Aon plc | 3.9 |
| Liberty Broadband Corp. | 3.9 |
| CoStar Group, Inc. | 3.8 |
| Danaher Corp. | 3.5 |
| 47.8 |
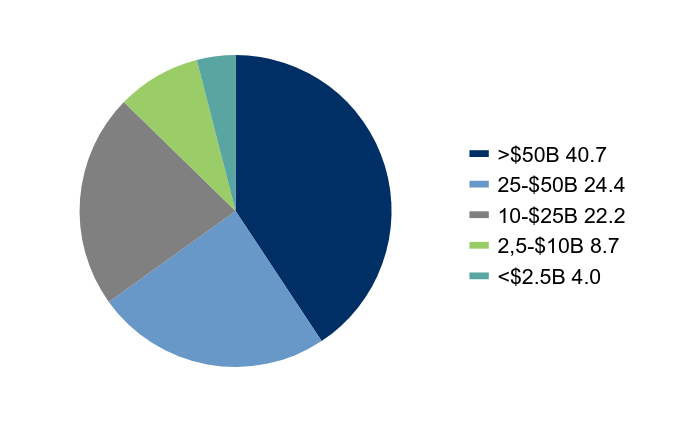
Capitalization (% of Common Stock)
| Value | Value |
|---|
| >$50B | 40.7 |
| 25-$50B | 24.4 |
| 10-$25B | 22.2 |
| 2,5-$10B | 8.7 |
| 4.0 |
| Return (%) | Average Weight (%) | Contribution (%) |
| Perimeter Solutions SA | 80.7 | 2.8 | 1.86 |
| HEICO Corp. - Class A | 32.4 | 5.3 | 1.66 |
| Guidewire Software, Inc. | 56.6 | 2.6 | 1.28 |
| ACI Worldwide, Inc. | 53.3 | 2.6 | 1.23 |
| Liberty Broadband Corp. - Class C | 34.9 | 3.0 | 1.07 |
| % of Net Assets |
| Communication Services | 20.3 |
| Financials | 19.4 |
| Information Technology | 15.7 |
| Industrials | 14.6 |
| Materials | 8.7 |
| Health Care | 6.6 |
| Consumer Discretionary | 6.4 |
| Real Estate | 3.8 |
| Warrants | 0.0 |
| Cash Equivalents/Other | 4.5 |
| 100.0 |
| Return (%) | Average Weight (%) | Contribution (%) |
| CoStar Group, Inc. | (21.9) | 4.3 | (1.27) |
| LKQ Corp. | (24.3) | 3.4 | (1.07) |
| Liberty Media Corp. - SiriusXM | (25.0) | 2.9 | (1.04) |
| CarMax, Inc. | (11.3) | 3.6 | (0.46) |
| Martin Marietta Materials, Inc. | (12.1) | 3.1 | (0.46) |
Material fund changes: There were no material fund changes during the reporting period.
Changes in or disagreements with accountants: On September 27, 2024, The Fund replaced its existing independent registered public accounting firm, Ernst & Young LLP ("E&Y"), with Deloitte & Touche LLP. There were no disagreements with E&Y on any matter of accounting principles or practices, financial statement disclosure, or auditing scope or procedure.
Weitz Multi Cap Equity Fund
Institutional Class (WPVIX)
Semi-annual shareholder report — September 30, 2024
Additional information about the Fund (e.g. Financial Statements, Prospectus and Statement of Additional Information) is available on the Fund's website at weitz.investments/reports or upon request, by calling 888-859-0698. Additional information about the Fund's Proxy Voting Record is available on the Fund's website at weitz.investments/proxy.
Weitz Multi Cap Equity Fund
Semi-annual shareholder report — September 30, 2024
This semi-annual shareholder report contains important information about the Weitz Multi Cap Equity Fund (the "Fund") for the period of April 1, 2024 to September 30, 2024. You can find additional information about the Fund at weitz.investments/reports. You can also request information by contacting us at 888-859-0698.
What were the Fund's costs for the last six months?
(based on a hypothetical $10,000 investment)
| Costs of a $10,000 investment ($) | Costs paid as a percentage of a $10,000 investment (%) |
|---|
| Weitz Multi Cap Equity Fund - Investor | 55 | 1.06 |
How did the Fund perform for the period?
The Fund (Ticker: WPVLX) returned 6.73% for the 6-month period ended September 30, 2024.
Top contributors over the period included Perimeter Solutions SA, HEICO Corporation, Guidewire Software Inc., ACI Worldwide Inc., and Meta Platforms Inc., reflecting robust operating momentum and company-specific strategies. Detractors included CoStar Group Inc., LKQ Corporation, Liberty Media Corp-Liberty SiriusXM, Martin Marietta Materials Inc., and CarMax Inc., impacted by sector-specific challenges.
For additional manager insights, visit weitzinvestments.com.
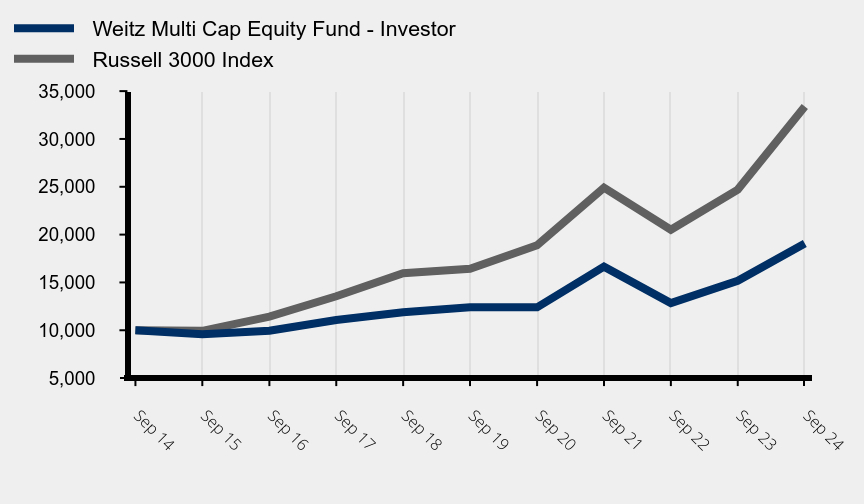
How did the Fund perform during the past 10 years?
Growth of $10,000 investment
| Weitz Multi Cap Equity Fund - Investor | Russell 3000 Index |
|---|
| Sep 24 | 19,075 | 33,401 |
| Sep 23 | 15,179 | 24,706 |
| Sep 22 | 12,844 | 20,510 |
| Sep 21 | 16,652 | 24,902 |
| Sep 20 | 12,400 | 18,880 |
| Sep 19 | 12,417 | 16,426 |
| Sep 18 | 11,872 | 15,952 |
| Sep 17 | 11,073 | 13,556 |
| Sep 16 | 9,945 | 11,429 |
| Sep 15 | 9,572 | 9,941 |
| Sep 14 | 10,000 | 10,000 |
Average Annual Total Returns
| 6 Month (%) | 1 Year (%) | 5 Year (%) | 10 Year (%) |
|---|
| Weitz Multi Cap Equity Fund - Investor - WPVLX | 6.73 | 25.67 | 8.97 | 6.67 |
| Russell 3000 Index | 9.65 | 35.19 | 15.25 | 12.82 |
The above line chart and returns table compares the fund’s results to the Russell 3000 Index, a broad measure of market performance.
The fund’s past performance is not a predictor of its future performance. Investment results reflect applicable fees and expenses, assumes all distributions are reinvested, and include fee waivers and/or expense reimbursements, without which results would have been lower; however, they do not reflect the deduction of taxes an investor would pay on distributions or share redemptions.
| Net Assets ($) | 593,976,885 |
| Number of Portfolio Holdings | 34 |
| Net Investment Advisory Fees Paid ($) | 2,108,990 |
| Portfolio Turnover Rate (%) | 6 |
What did the Fund invest in?
(as of September 30, 2023)
| Security | % of Net Assets |
|---|
| Berkshire Hathaway, Inc. | 7.0 |
| Meta Platforms, Inc. | 6.2 |
| Alphabet, Inc. | 5.5 |
| HEICO Corp. | 5.5 |
| Visa, Inc. | 4.3 |
| Mastercard, Inc. | 4.2 |
| Aon plc | 3.9 |
| Liberty Broadband Corp. | 3.9 |
| CoStar Group, Inc. | 3.8 |
| Danaher Corp. | 3.5 |
| 47.8 |
Capitalization (% of Common Stock)
| Value | Value |
|---|
| >$50B | 40.7 |
| 25-$50B | 24.4 |
| 10-$25B | 22.2 |
| 2,5-$10B | 8.7 |
| 4.0 |
| Return (%) | Average Weight (%) | Contribution (%) |
| Perimeter Solutions SA | 80.7 | 2.8 | 1.86 |
| HEICO Corp. - Class A | 32.4 | 5.3 | 1.66 |
| Guidewire Software, Inc. | 56.6 | 2.6 | 1.28 |
| ACI Worldwide, Inc. | 53.3 | 2.6 | 1.23 |
| Liberty Broadband Corp. - Class C | 34.9 | 3.0 | 1.07 |
| % of Net Assets |
| Communication Services | 20.3 |
| Financials | 19.4 |
| Information Technology | 15.7 |
| Industrials | 14.6 |
| Materials | 8.7 |
| Health Care | 6.6 |
| Consumer Discretionary | 6.4 |
| Real Estate | 3.8 |
| Warrants | 0.0 |
| Cash Equivalents/Other | 4.5 |
| 100.0 |
| Return (%) | Average Weight (%) | Contribution (%) |
| CoStar Group, Inc. | (21.9) | 4.3 | (1.27) |
| LKQ Corp. | (24.3) | 3.4 | (1.07) |
| Liberty Media Corp. - SiriusXM | (25.0) | 2.9 | (1.04) |
| CarMax, Inc. | (11.3) | 3.6 | (0.46) |
| Martin Marietta Materials, Inc. | (12.1) | 3.1 | (0.46) |
Material fund changes: There were no material fund changes during the reporting period.
Changes in or disagreements with accountants: On September 27, 2024, The Fund replaced its existing independent registered public accounting firm, Ernst & Young LLP ("E&Y"), with Deloitte & Touche LLP. There were no disagreements with E&Y on any matter of accounting principles or practices, financial statement disclosure, or auditing scope or procedure.
Weitz Multi Cap Equity Fund
Semi-annual shareholder report — September 30, 2024
Additional information about the Fund (e.g. Financial Statements, Prospectus and Statement of Additional Information) is available on the Fund's website at weitz.investments/reports or upon request, by calling 888-859-0698. Additional information about the Fund's Proxy Voting Record is available on the Fund's website at weitz.investments/proxy.
Weitz Nebraska Tax Free Income Fund
Semi-annual shareholder report — September 30, 2024
This semi-annual shareholder report contains important information about the Weitz Nebraska Tax Free Income Fund (the "Fund") for the period of April 1, 2024 to September 30, 2024. You can find additional information about the Fund at weitz.investments/reports. You can also request information by contacting us at 888-859-0698.
What were the Fund's costs for the last six months?
(based on a hypothetical $10,000 investment)
| Costs of a $10,000 investment ($) | Costs paid as a percentage of a $10,000 investment (%) |
|---|
| Weitz Nebraska Tax Free Income Fund | 23 | 0.45 |
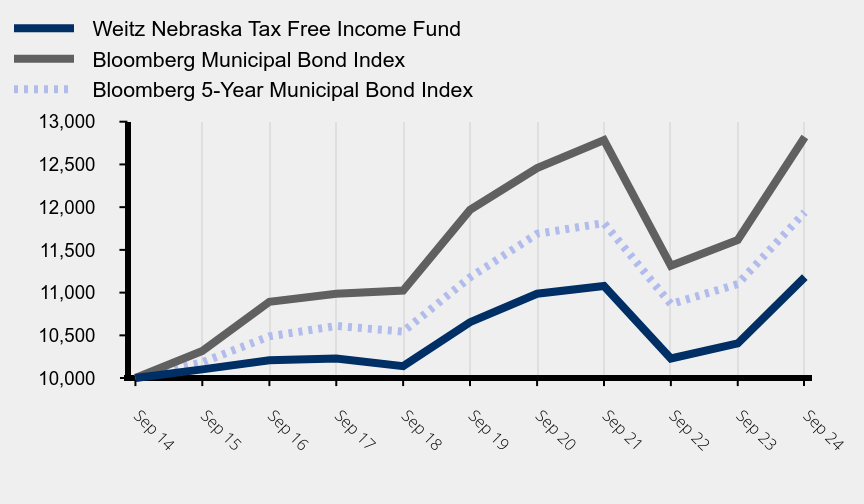
How did the Fund perform for the period?
The Fund (Ticker: WNTFX) returned 2.26% for the 6-month period ended September 30, 2024.
Top contributors included school district bonds, utility bonds, appropriation-backed bonds, city general obligations, and hospital revenue bonds across Nebraska. No segments detracted from performance.
Credit conditions across most municipal bond sectors remain supportive as the U.S. economy continues to grow, unemployment remains low, and tax receipts continue to be strong. Nebraska's fiscal, educational, employment, and economic stability further support state and local bond conditions.
For additional manager insights, visit weitzinvestments.com.
How did the Fund perform during the past 10 years?
Growth of $10,000 investment
| Weitz Nebraska Tax Free Income Fund | Bloomberg Municipal Bond Index | Bloomberg 5-Year Municipal Bond Index |
|---|
| Sep 24 | 11,182 | 12,821 | 11,940 |
| Sep 23 | 10,405 | 11,616 | 11,100 |
| Sep 22 | 10,229 | 11,315 | 10,866 |
| Sep 21 | 11,077 | 12,785 | 11,814 |
| Sep 20 | 10,987 | 12,458 | 11,688 |
| Sep 19 | 10,654 | 11,968 | 11,179 |
| Sep 18 | 10,139 | 11,025 | 10,544 |
| Sep 17 | 10,228 | 10,987 | 10,610 |
| Sep 16 | 10,209 | 10,892 | 10,488 |
| Sep 15 | 10,102 | 10,316 | 10,185 |
| Sep 14 | 10,000 | 10,000 | 10,000 |
Average Annual Total Returns
| 6 Month (%) | 1 Year (%) | 5 Year (%) | 10 Year (%) |
|---|
| Weitz Nebraska Tax Free Income Fund - WNTFX | 2.26 | 7.46 | 0.97 | 1.12 |
| Bloomberg Municipal Bond Index | 2.69 | 10.37 | 1.39 | 2.52 |
| Bloomberg 5-Year Municipal Bond Index | 2.61 | 7.56 | 1.32 | 1.79 |
The above line chart and returns table compares the fund’s results to (i) the Bloomberg Municipal Bond Index, a broad measure of market performance and (ii) the Bloomberg 5-Year Municipal Bond Index, an additional index that the investment adviser believes more closely reflects the market segments in which the fund invests.
The fund’s past performance is not a predictor of its future performance. Investment results reflect applicable fees and expenses, assumes all distributions are reinvested, and include fee waivers and/or expense reimbursements, without which results would have been lower; however, they do not reflect the deduction of taxes an investor would pay on distributions or share redemptions.
| Net Assets ($) | 23,238,721 |
| Number of Portfolio Holdings | 94 |
| Net Investment Advisory Fees Paid ($) | 45,772 |
| Portfolio Turnover Rate (%) | - |
| 30-Day SEC Yield (Subsidized) (%) | 2.55 |
| 30-Day SEC Yield (Unsubsidized) (%) | 1.86 |
| Average Effective Maturity (yrs) | 2.90 |
| Average Effective Duration (yrs) | 2.70 |
What did the Fund invest in?
(as of September 30, 2023)
| Maturity | % of Portfolio |
| Cash Equivalents | 4.8 |
| Less than 1 Year | 21.2 |
| 1-3 Years | 39.7 |
| 3-5 Years | 13.6 |
| 5-7 Years | 11.7 |
| 7-10 Years | 4.9 |
| 10 Years or more | 4.1 |
| 100.0 |
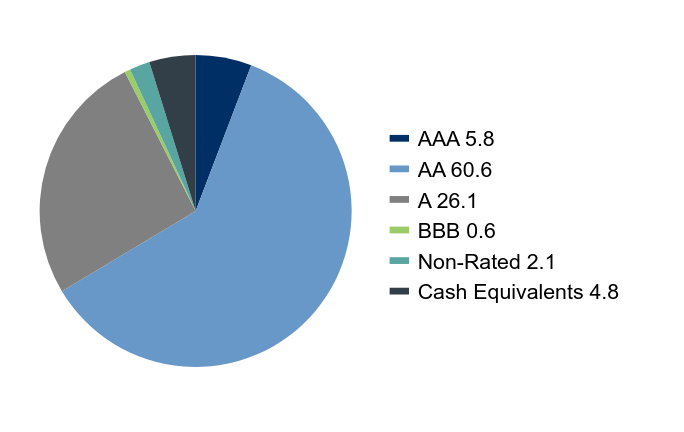
Credit Quality (% of Portfolio)
| Value | Value |
|---|
| AAA | 5.8 |
| AA | 60.6 |
| A | 26.1 |
| BBB | 0.6 |
| Non-Rated | 2.1 |
| Cash Equivalents | 4.8 |
| Maturity | | | % of Portfolio |
| Less than 1 Year | | | 26.3 |
| 1-3 Years | | | 41.3 |
| 3-5 Years | | | 14.5 |
| 5-7 Years | | | 13.0 |
| 7-10 Years | | | 4.5 |
| 10 Years or more | | | 0.4 |
| | | 100.0 |
| % of Net Assets |
| Revenue | 61.0 |
| General Obligation | 27.8 |
| Escrow/Pre-Refunded | 5.5 |
| Cash Equivalents/Other | 5.7 |
| 100.0 |
Credit quality disclosure: Credit ratings are assigned to underlying securities utilizing ratings from a Nationally Recognized Statistical Rating Organization (NRSRO) such as Moody's and Fitch, or other rating agencies and applying the following hierarchy: security is determined to be Investment Grade if it has been rated at least BBB- by one credit rating agency; once determined to be Investment Grade (BBB- and above) or Non-Investment Grade (BB+ and below) where multiple ratings are available, then the lowest rating is assigned. Mortgage-related securities issued and guaranteed by government-sponsored agencies such as Fannie Mae and Freddie Mac are generally not rated by rating agencies. Securities that are not rated do not necessarily indicate low quality. Ratings are shown in the Fitch scale (e.g., AAA). Ratings and portfolio credit quality may change over time. The Fund itself has not been rated by a credit rating agency.
Material fund changes: There were no material fund changes during the reporting period.
Changes in or disagreements with accountants: On September 27, 2024, The Fund replaced its existing independent registered public accounting firm, Ernst & Young LLP ("E&Y"), with Deloitte & Touche LLP. There were no disagreements with E&Y on any matter of accounting principles or practices, financial statement disclosure, or auditing scope or procedure.
Weitz Nebraska Tax Free Income Fund
Semi-annual shareholder report — September 30, 2024
Additional information about the Fund (e.g. Financial Statements, Prospectus and Statement of Additional Information) is available on the Fund's website at weitz.investments/reports or upon request, by calling 888-859-0698. Additional information about the Fund's Proxy Voting Record is available on the Fund's website at weitz.investments/proxy.
Weitz Partners III Opportunity Fund
Institutional Class (WPOPX)
Semi-annual shareholder report — September 30, 2024
This semi-annual shareholder report contains important information about the Weitz Partners III Opportunity Fund (the "Fund") for the period of April 1, 2024 to September 30, 2024. You can find additional information about the Fund at weitz.investments/reports. You can also request information by contacting us at 888-859-0698.
What were the Fund's costs for the last six months?
(based on a hypothetical $10,000 investment)
| Costs of a $10,000 investment ($) | Costs paid as a percentage of a $10,000 investment (%) |
|---|
| Weitz Partners III Opportunity Fund - Institutional | 61 | 1.18 |
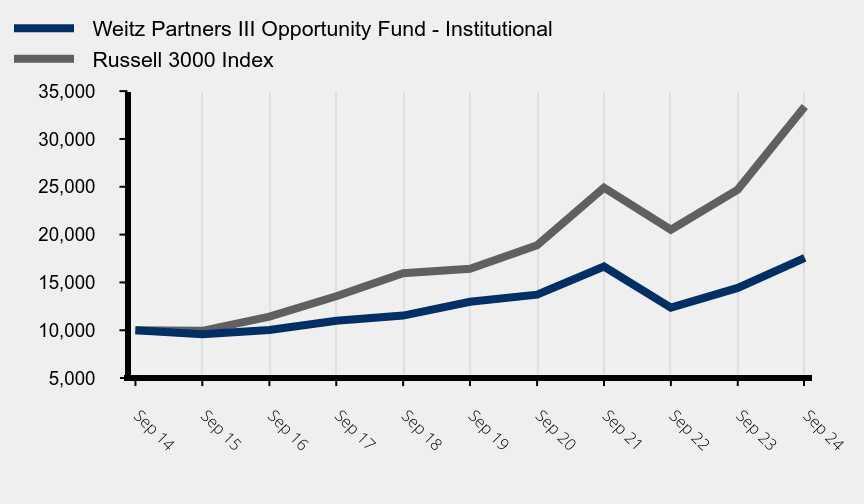
How did the Fund perform for the period?
The Fund (Ticker: WPOPX) returned 6.15% for the 6-month period ended September 30, 2024.
Top contributors over this period included Perimeter Solutions SA, Liberty Broadband Corporation, Berkshire Hathaway Inc., Aon plc, and Alphabet Inc., driven by strong operating momentum and effective company-specific execution. Primary detractors were Liberty Media Corp-Liberty SiriusXM, Global Payments Inc., CoStar Group Inc., Sirius XM Holdings Inc., and CarMax Inc.
For additional manager insights, visit weitzinvestments.com.
How did the Fund perform during the past 10 years?
Growth of $10,000 investment
| Weitz Partners III Opportunity Fund - Institutional | Russell 3000 Index |
|---|
| Sep 24 | 17,562 | 33,401 |
| Sep 23 | 14,427 | 24,706 |
| Sep 22 | 12,359 | 20,510 |
| Sep 21 | 16,656 | 24,902 |
| Sep 20 | 13,722 | 18,880 |
| Sep 19 | 12,981 | 16,426 |
| Sep 18 | 11,535 | 15,952 |
| Sep 17 | 10,995 | 13,556 |
| Sep 16 | 10,029 | 11,429 |
| Sep 15 | 9,595 | 9,941 |
| Sep 14 | 10,000 | 10,000 |
Average Annual Total Returns
| 6 Month (%) | 1 Year (%) | 5 Year (%) | 10 Year (%) |
|---|
| Weitz Partners III Opportunity Fund - Institutional - WPOPX | 6.15 | 21.73 | 6.23 | 5.79 |
| Russell 3000 Index | 9.65 | 35.19 | 15.25 | 12.82 |
The above line chart and returns table compares the fund’s results to the Russell 3000 Index, a broad measure of market performance.
The fund’s past performance is not a predictor of its future performance. Investment results reflect applicable fees and expenses, assumes all distributions are reinvested, and include fee waivers and/or expense reimbursements, without which results would have been lower; however, they do not reflect the deduction of taxes an investor would pay on distributions or share redemptions.
| Net Assets ($) | 438,289,958 |
| Number of Portfolio Holdings | 33 |
| Net Investment Advisory Fees Paid ($) | 2,078,906 |
| Portfolio Turnover Rate (%) | 14 |
What did the Fund invest in?
(as of September 30, 2023)
| Security | % of Net Assets |
|---|
| Berkshire Hathaway, Inc. | 11.3 |
| Liberty Broadband Corp. | 6.4 |
| Danaher Corp. | 5.1 |
| Mastercard, Inc. | 5.1 |
| Thermo Fisher Scientific, Inc. | 4.9 |
| Visa, Inc. | 4.7 |
| Global Payments, Inc. | 4.2 |
| Alphabet, Inc. | 4.0 |
| Aon plc | 4.0 |
| CarMax, Inc. | 3.9 |
| 53.6 |
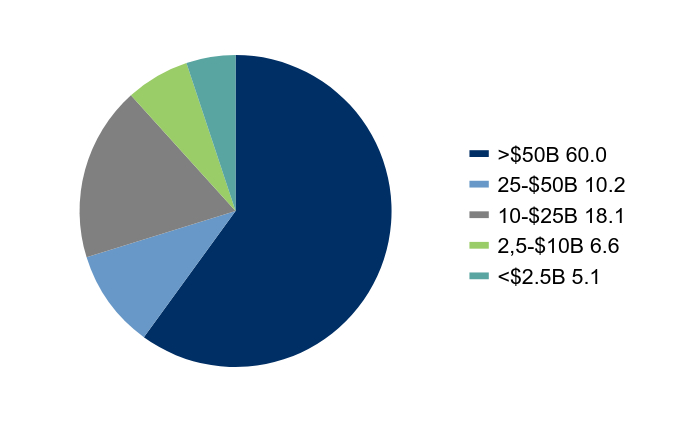
Capitalization (% of Common Stock)
| Value | Value |
|---|
| >$50B | 60.0 |
| 25-$50B | 10.2 |
| 10-$25B | 18.1 |
| 2,5-$10B | 6.6 |
| 5.1 |
| Return (%) | Average Weight (%) | Contribution (%) |
| Perimeter Solutions SA | 80.9 | 3.1 | 2.06 |
| Liberty Broadband Corp. - Class C | 35.0 | 4.9 | 1.95 |
| Berkshire Hathaway, Inc. - Class B | 9.5 | 11.1 | 1.09 |
| Aon plc - Class A | 19.9 | 2.8 | 0.75 |
| Alphabet, Inc. - Class C | 10.0 | 5.2 | 0.73 |
| % of Net Assets |
| Financials | 31.2 |
| Communication Services | 17.1 |
| Information Technology | 14.1 |
| Health Care | 13.1 |
| Consumer Discretionary | 7.5 |
| Industrials | 4.3 |
| Materials | 3.1 |
| Real Estate | 2.4 |
| Warrants | 0.1 |
| Securities Sold Short | (4.6) |
| Short Proceeds/Other | 11.7 |
| 100.0 |
| Return (%) | Average Weight (%) | Contribution (%) |
| Liberty Media Corp. - SiriusXM | (25.0) | 3.1 | (1.14) |
| Global Payments, Inc. | (24.5) | 4.0 | (1.04) |
| CoStar Group, Inc. | (21.9) | 2.7 | (0.80) |
| CarMax, Inc. | (12.2) | 4.2 | (0.51) |
| Sirius XM Holdings, Inc. | (13.6) | 0.3 | (0.46) |
Material fund changes: There were no material fund changes during the reporting period.
Changes in or disagreements with accountants: On September 27, 2024, The Fund replaced its existing independent registered public accounting firm, Ernst & Young LLP ("E&Y"), with Deloitte & Touche LLP. There were no disagreements with E&Y on any matter of accounting principles or practices, financial statement disclosure, or auditing scope or procedure.
Weitz Partners III Opportunity Fund
Institutional Class (WPOPX)
Semi-annual shareholder report — September 30, 2024
Additional information about the Fund (e.g. Financial Statements, Prospectus and Statement of Additional Information) is available on the Fund's website at weitz.investments/reports or upon request, by calling 888-859-0698. Additional information about the Fund's Proxy Voting Record is available on the Fund's website at weitz.investments/proxy.
Weitz Partners III Opportunity Fund
Semi-annual shareholder report — September 30, 2024
This semi-annual shareholder report contains important information about the Weitz Partners III Opportunity Fund (the "Fund") for the period of April 1, 2024 to September 30, 2024. You can find additional information about the Fund at weitz.investments/reports. You can also request information by contacting us at 888-859-0698.
What were the Fund's costs for the last six months?
(based on a hypothetical $10,000 investment)
| Costs of a $10,000 investment ($) | Costs paid as a percentage of a $10,000 investment (%) |
|---|
| Weitz Partners III Opportunity Fund - Investor | 101 | 1.96 |
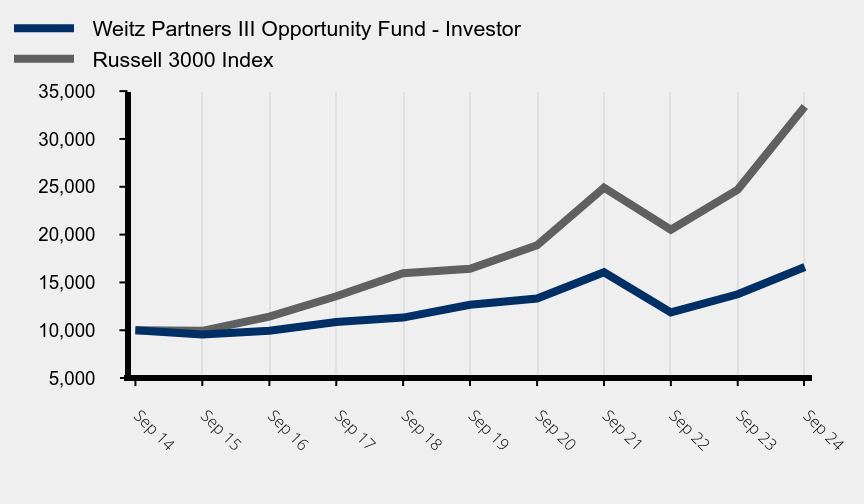
How did the Fund perform for the period?
The Fund (Ticker: WPOIX) returned 5.76% for the 6-month period ended September 30, 2024.
Top contributors over this period included Perimeter Solutions SA, Liberty Broadband Corporation, Berkshire Hathaway Inc., Aon plc, and Alphabet Inc., driven by strong operating momentum and effective company-specific execution. Primary detractors were Liberty Media Corp-Liberty SiriusXM, Global Payments Inc., CoStar Group Inc., Sirius XM Holdings Inc., and CarMax Inc.
For additional manager insights, visit weitzinvestments.com.
How did the Fund perform during the past 10 years?
Growth of $10,000 investment
| Weitz Partners III Opportunity Fund - Investor | Russell 3000 Index |
|---|
| Sep 24 | 16,611 | 33,401 |
| Sep 23 | 13,757 | 24,706 |
| Sep 22 | 11,874 | 20,510 |
| Sep 21 | 16,060 | 24,902 |
| Sep 20 | 13,310 | 18,880 |
| Sep 19 | 12,670 | 16,426 |
| Sep 18 | 11,324 | 15,952 |
| Sep 17 | 10,853 | 13,556 |
| Sep 16 | 9,948 | 11,429 |
| Sep 15 | 9,560 | 9,941 |
| Sep 14 | 10,000 | 10,000 |
Average Annual Total Returns
| 6 Month (%) | 1 Year (%) | 5 Year (%) | 10 Year (%) |
|---|
| Weitz Partners III Opportunity Fund - Investor - WPOIX | 5.76 | 20.75 | 5.57 | 5.21 |
| Russell 3000 Index | 9.65 | 35.19 | 15.25 | 12.82 |
The above line chart and returns table compares the fund’s results to the Russell 3000 Index, a broad measure of market performance.
The fund’s past performance is not a predictor of its future performance. Investment results reflect applicable fees and expenses, assumes all distributions are reinvested, and include fee waivers and/or expense reimbursements, without which results would have been lower; however, they do not reflect the deduction of taxes an investor would pay on distributions or share redemptions.
| Net Assets ($) | 438,289,958 |
| Number of Portfolio Holdings | 33 |
| Net Investment Advisory Fees Paid ($) | 2,078,906 |
| Portfolio Turnover Rate (%) | 14 |
What did the Fund invest in?
(as of September 30, 2023)
| Security | % of Net Assets |
|---|
| Berkshire Hathaway, Inc. | 11.3 |
| Liberty Broadband Corp. | 6.4 |
| Danaher Corp. | 5.1 |
| Mastercard, Inc. | 5.1 |
| Thermo Fisher Scientific, Inc. | 4.9 |
| Visa, Inc. | 4.7 |
| Global Payments, Inc. | 4.2 |
| Alphabet, Inc. | 4.0 |
| Aon plc | 4.0 |
| CarMax, Inc. | 3.9 |
| 53.6 |
Capitalization (% of Common Stock)
| Value | Value |
|---|
| >$50B | 60.0 |
| 25-$50B | 10.2 |
| 10-$25B | 18.1 |
| 2,5-$10B | 6.6 |
| 5.1 |
| Return (%) | Average Weight (%) | Contribution (%) |
| Perimeter Solutions SA | 80.9 | 3.1 | 2.06 |
| Liberty Broadband Corp. - Class C | 35.0 | 4.9 | 1.95 |
| Berkshire Hathaway, Inc. - Class B | 9.5 | 11.1 | 1.09 |
| Aon plc - Class A | 19.9 | 2.8 | 0.75 |
| Alphabet, Inc. - Class C | 10.0 | 5.2 | 0.73 |
| % of Net Assets |
| Financials | 31.2 |
| Communication Services | 17.1 |
| Information Technology | 14.1 |
| Health Care | 13.1 |
| Consumer Discretionary | 7.5 |
| Industrials | 4.3 |
| Materials | 3.1 |
| Real Estate | 2.4 |
| Warrants | 0.1 |
| Securities Sold Short | (4.6) |
| Short Proceeds/Other | 11.7 |
| 100.0 |
| Return (%) | Average Weight (%) | Contribution (%) |
| Liberty Media Corp. - SiriusXM | (25.0) | 3.1 | (1.14) |
| Global Payments, Inc. | (24.5) | 4.0 | (1.04) |
| CoStar Group, Inc. | (21.9) | 2.7 | (0.80) |
| CarMax, Inc. | (12.2) | 4.2 | (0.51) |
| Sirius XM Holdings, Inc. | (13.6) | 0.3 | (0.46) |
Material fund changes: There were no material fund changes during the reporting period.
Changes in or disagreements with accountants: On September 27, 2024, The Fund replaced its existing independent registered public accounting firm, Ernst & Young LLP ("E&Y"), with Deloitte & Touche LLP. There were no disagreements with E&Y on any matter of accounting principles or practices, financial statement disclosure, or auditing scope or procedure.
Weitz Partners III Opportunity Fund
Semi-annual shareholder report — September 30, 2024
Additional information about the Fund (e.g. Financial Statements, Prospectus and Statement of Additional Information) is available on the Fund's website at weitz.investments/reports or upon request, by calling 888-859-0698. Additional information about the Fund's Proxy Voting Record is available on the Fund's website at weitz.investments/proxy.
Weitz Short Duration Income Fund
Institutional Class (WEFIX)
Semi-annual shareholder report — September 30, 2024
This semi-annual shareholder report contains important information about the Weitz Short Duration Income Fund (the "Fund") for the period of April 1, 2024 to September 30, 2024. You can find additional information about the Fund at weitz.investments/reports. You can also request information by contacting us at 888-859-0698.
What were the Fund's costs for the last six months?
(based on a hypothetical $10,000 investment)
| Costs of a $10,000 investment ($) | Costs paid as a percentage of a $10,000 investment (%) |
|---|
| Weitz Short Duration Income Fund - Institutional | 23 | 0.45 |
How did the Fund perform for the period?
The Fund (Ticker: WEFIX) returned 3.97% for the 6-month period ended September 30, 2024.
Top contributors included asset-backed securities (ABS), U.S. Treasuries, collateralized loan obligations (CLOs), non-Agency CMOs (Collateralized Mortgage Obligations), and corporate bonds. ABS performed strongly due to stable prices and robust coupon income, especially in auto, equipment, fleet, and consumer loans. U.S. Treasuries and CLOs added positive returns, benefiting from favorable rates and sector selection. No segments detracted from performance.
For additional manager insights, visit weitzinvestments.com.
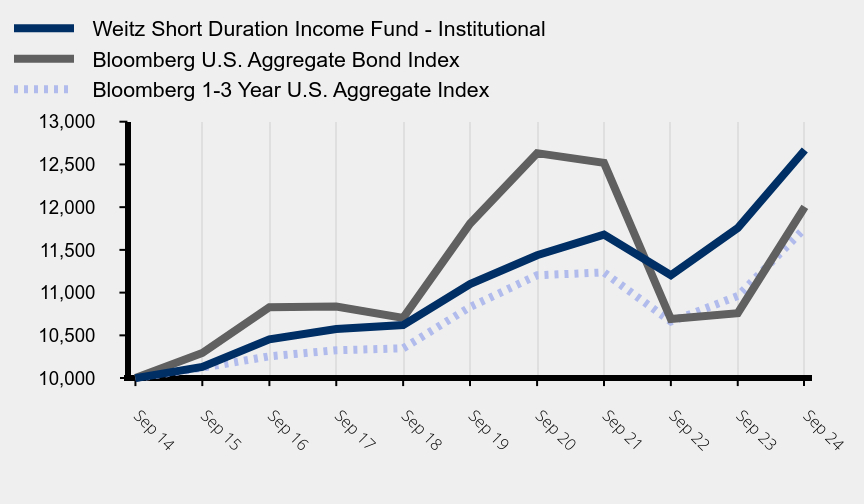
How did the Fund perform during the past 10 years?
Growth of $10,000 investment
| Weitz Short Duration Income Fund - Institutional | Bloomberg U.S. Aggregate Bond Index | Bloomberg 1-3 Year U.S. Aggregate Index |
|---|
| Sep 24 | 12,669 | 12,004 | 11,753 |
| Sep 23 | 11,756 | 10,760 | 10,960 |
| Sep 22 | 11,204 | 10,691 | 10,661 |
| Sep 21 | 11,678 | 12,518 | 11,236 |
| Sep 20 | 11,437 | 12,632 | 11,203 |
| Sep 19 | 11,099 | 11,807 | 10,831 |
| Sep 18 | 10,620 | 10,704 | 10,348 |
| Sep 17 | 10,574 | 10,838 | 10,326 |
| Sep 16 | 10,454 | 10,829 | 10,255 |
| Sep 15 | 10,131 | 10,294 | 10,121 |
| Sep 14 | 10,000 | 10,000 | 10,000 |
Average Annual Total Returns
| 6 Month (%) | 1 Year (%) | 5 Year (%) | 10 Year (%) |
|---|
| Weitz Short Duration Income Fund - Institutional - WEFIX | 3.97 | 7.77 | 2.68 | 2.39 |
| Bloomberg U.S. Aggregate Bond Index | 5.26 | 11.57 | 0.33 | 1.84 |
| Bloomberg 1-3 Year U.S. Aggregate Index | 3.93 | 7.23 | 1.65 | 1.63 |
The above line chart and returns table compares the fund’s results to (i) the Bloomberg U.S. Aggregate Bond Index, a broad measure of market performance and (ii) the Bloomberg 1-3 Year U.S. Aggregate Index, an additional index that the investment adviser believes more closely reflects the market segments in which the fund invests.
The fund’s past performance is not a predictor of its future performance. Investment results reflect applicable fees and expenses, assumes all distributions are reinvested, and include fee waivers and/or expense reimbursements, without which results would have been lower; however, they do not reflect the deduction of taxes an investor would pay on distributions or share redemptions.
| Net Assets ($) | 941,993,324 |
| Number of Portfolio Holdings | 334 |
| Net Investment Advisory Fees Paid ($) | 1,788,005 |
| Portfolio Turnover Rate (%) | 22 |
| 30-Day SEC Yield (Subsidized) (%) | 4.83 |
| 30-Day SEC Yield (Unsubsidized) (%) | 4.69 |
| Average Effective Maturity (yrs) | 3.40 |
| Average Effective Duration (yrs) | 1.30 |
What did the Fund invest in?
(as of September 30, 2023)
| Maturity | % of Portfolio |
| Cash Equivalents | 3.3 |
| Less than 1 Year | 23.0 |
| 1-3 Years | 44.0 |
| 3-5 Years | 7.9 |
| 5-7 Years | 6.1 |
| 7-10 Years | 6.0 |
| 10 Years or more | 9.7 |
| 100.0 |
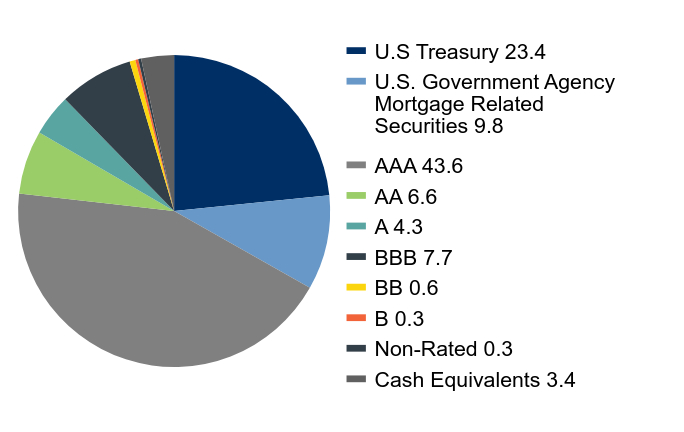
Credit Quality (% of Portfolio)
| Value | Value |
|---|
| U.S Treasury | 23.4 |
| U.S. Government Agency Mortgage Related Securities | 9.8 |
| AAA | 43.6 |
| AA | 6.6 |
| A | 4.3 |
| BBB | 7.7 |
| BB | 0.6 |
| B | 0.3 |
| Non-Rated | 0.3 |
| Cash Equivalents | 3.4 |
| Maturity | | | % of Portfolio |
| Less than 1 Year | | | 49.4 |
| 1-3 Years | | | 39.9 |
| 3-5 Years | | | 5.7 |
| 5-7 Years | | | 5.0 |
| | | 100.0 |
| % of Net Assets |
| Asset-Backed Securities | 37.2 |
| U.S. Treasuries | 22.9 |
| Mortgage-Backed Securities | 19.3 |
| Corporate Bonds | 7.7 |
| Commercial Mortgage-Backed Securities | 6.8 |
| Corporate Convertible Bonds | 0.3 |
| Cash Equivalents/Other | 5.8 |
| 100.0 |
Credit quality disclosure: Credit ratings are assigned to underlying securities utilizing ratings from a Nationally Recognized Statistical Rating Organization (NRSRO) such as Moody's and Fitch, or other rating agencies and applying the following hierarchy: security is determined to be Investment Grade if it has been rated at least BBB- by one credit rating agency; once determined to be Investment Grade (BBB- and above) or Non-Investment Grade (BB+ and below) where multiple ratings are available, then the lowest rating is assigned. Mortgage-related securities issued and guaranteed by government-sponsored agencies such as Fannie Mae and Freddie Mac are generally not rated by rating agencies. Securities that are not rated do not necessarily indicate low quality. Ratings are shown in the Fitch scale (e.g., AAA). Ratings and portfolio credit quality may change over time. The Fund itself has not been rated by a credit rating agency.
Materialfund changes: There were no material fund changes during the reporting period.
Changes in or disagreements with accountants: On September 27, 2024, The Fund replaced its existing independent registered public accounting firm, Ernst & Young LLP ("E&Y"), with Deloitte & Touche LLP. There were no disagreements with E&Y on any matter of accounting principles or practices, financial statement disclosure, or auditing scope or procedure.
Weitz Short Duration Income Fund
Institutional Class (WEFIX)
Semi-annual shareholder report — September 30, 2024
Additional information about the Fund (e.g. Financial Statements, Prospectus and Statement of Additional Information) is available on the Fund's website at weitz.investments/reports or upon request, by calling 888-859-0698. Additional information about the Fund's Proxy Voting Record is available on the Fund's website at weitz.investments/proxy.
Weitz Short Duration Income Fund
Semi-annual shareholder report — September 30, 2024
This semi-annual shareholder report contains important information about the Weitz Short Duration Income Fund (the "Fund") for the period of April 1, 2024 to September 30, 2024. This report describes changes to the Fund that occurred during the reporting period. You can find additional information about the Fund at weitz.investments/reports. You can also request information by contacting us at 888-859-0698.
What were the Fund's costs for the last six months?
(based on a hypothetical $10,000 investment)
| Costs of a $10,000 investment ($) | Costs paid as a percentage of a $10,000 investment (%) |
|---|
| Weitz Short Duration Income Fund - Investor | 30 | 0.58 |
How did the Fund perform for the period?
The Fund (Ticker: WSHNX) returned 3.90% for the 6-month period ended September 30, 2024.
Top contributors included asset-backed securities (ABS), U.S. Treasuries, collateralized loan obligations (CLOs), non-Agency CMOs (Collateralized Mortgage Obligations), and corporate bonds. ABS performed strongly due to stable prices and robust coupon income, especially in auto, equipment, fleet, and consumer loans. U.S. Treasuries and CLOs added positive returns, benefiting from favorable rates and sector selection. No segments detracted from performance.
For additional manager insights, visit weitzinvestments.com.
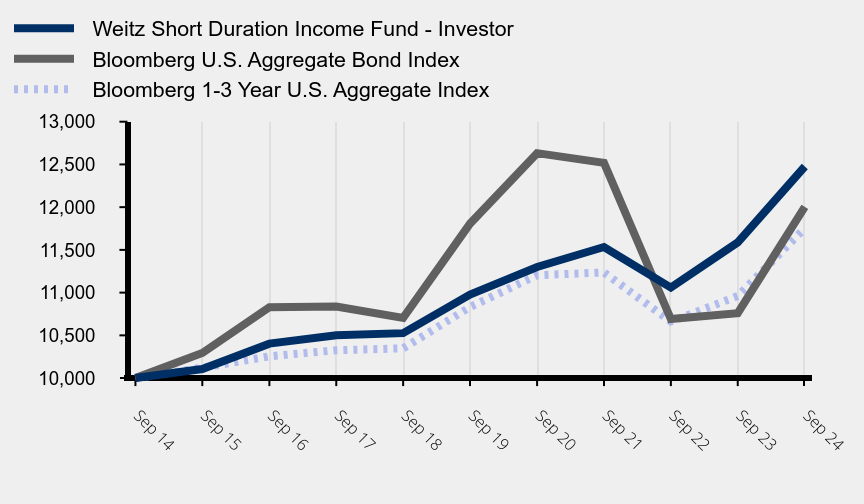
How did the Fund perform during the past 10 years?
Growth of $10,000 investment
| Weitz Short Duration Income Fund - Investor | Bloomberg U.S. Aggregate Bond Index | Bloomberg 1-3 Year U.S. Aggregate Index |
|---|
| Sep 24 | 12,476 | 12,004 | 11,753 |
| Sep 23 | 11,588 | 10,760 | 10,960 |
| Sep 22 | 11,059 | 10,691 | 10,661 |
| Sep 21 | 11,534 | 12,518 | 11,236 |
| Sep 20 | 11,300 | 12,632 | 11,203 |
| Sep 19 | 10,978 | 11,807 | 10,831 |
| Sep 18 | 10,526 | 10,704 | 10,348 |
| Sep 17 | 10,502 | 10,838 | 10,326 |
| Sep 16 | 10,403 | 10,829 | 10,255 |
| Sep 15 | 10,106 | 10,294 | 10,121 |
| Sep 14 | 10,000 | 10,000 | 10,000 |
Average Annual Total Returns
| 6 Month (%) | 1 Year (%) | 5 Year (%) | 10 Year (%) |
|---|
| Weitz Short Duration Income Fund - Investor - WSHNX | 3.90 | 7.66 | 2.59 | 2.24 |
| Bloomberg U.S. Aggregate Bond Index | 5.26 | 11.57 | 0.33 | 1.84 |
| Bloomberg 1-3 Year U.S. Aggregate Index | 3.93 | 7.23 | 1.65 | 1.63 |
The above line chart and returns table compares the fund’s results to (i) the Bloomberg U.S. Aggregate Bond Index, a broad measure of market performance and (ii) the Bloomberg 1-3 Year U.S. Aggregate Index, an additional index that the investment adviser believes more closely reflects the market segments in which the fund invests.
The fund’s past performance is not a predictor of its future performance. Investment results reflect applicable fees and expenses, assumes all distributions are reinvested, and include fee waivers and/or expense reimbursements, without which results would have been lower; however, they do not reflect the deduction of taxes an investor would pay on distributions or share redemptions.
| Net Assets ($) | 941,993,324 |
| Number of Portfolio Holdings | 334 |
| Net Investment Advisory Fees Paid ($) | 1,788,005 |
| Portfolio Turnover Rate (%) | 22 |
| 30-Day SEC Yield (Subsidized) (%) | 4.63 |
| 30-Day SEC Yield (Unsubsidized) (%) | 4.42 |
| Average Effective Maturity (yrs) | 3.40 |
| Average Effective Duration (yrs) | 1.30 |
What did the Fund invest in?
(as of September 30, 2023)
| Maturity | % of Portfolio |
| Cash Equivalents | 3.3 |
| Less than 1 Year | 23.0 |
| 1-3 Years | 44.0 |
| 3-5 Years | 7.9 |
| 5-7 Years | 6.1 |
| 7-10 Years | 6.0 |
| 10 Years or more | 9.7 |
| 100.0 |
Credit Quality (% of Portfolio)
| Value | Value |
|---|
| U.S Treasury | 23.4 |
| U.S. Government Agency Mortgage Related Securities | 9.8 |
| AAA | 43.6 |
| AA | 6.6 |
| A | 4.3 |
| BBB | 7.7 |
| BB | 0.6 |
| B | 0.3 |
| Non-Rated | 0.3 |
| Cash Equivalents | 3.4 |
| Maturity | | | % of Portfolio |
| Less than 1 Year | | | 49.4 |
| 1-3 Years | | | 39.9 |
| 3-5 Years | | | 5.7 |
| 5-7 Years | | | 5.0 |
| | | 100.0 |
| % of Net Assets |
| Asset-Backed Securities | 37.2 |
| U.S. Treasuries | 22.9 |
| Mortgage-Backed Securities | 19.3 |
| Corporate Bonds | 7.7 |
| Commercial Mortgage-Backed Securities | 6.8 |
| Corporate Convertible Bonds | 0.3 |
| Cash Equivalents/Other | 5.8 |
| 100.0 |
Credit quality disclosure: Credit ratings are assigned to underlying securities utilizing ratings from a Nationally Recognized Statistical Rating Organization (NRSRO) such as Moody's and Fitch, or other rating agencies and applying the following hierarchy: security is determined to be Investment Grade if it has been rated at least BBB- by one credit rating agency; once determined to be Investment Grade (BBB- and above) or Non-Investment Grade (BB+ and below) where multiple ratings are available, then the lowest rating is assigned. Mortgage-related securities issued and guaranteed by government-sponsored agencies such as Fannie Mae and Freddie Mac are generally not rated by rating agencies. Securities that are not rated do not necessarily indicate low quality. Ratings are shown in the Fitch scale (e.g., AAA). Ratings and portfolio credit quality may change over time. The Fund itself has not been rated by a credit rating agency.
Materialfund changes: Effective July 31, 2024, the annual operating expense ratio cap was updated to 0.65%. Prior to July 31, 2024, the annual operating expense ratio cap was 0.55%.
Changes in or disagreements with accountants: On September 27, 2024, The Fund replaced its existing independent registered public accounting firm, Ernst & Young LLP ("E&Y"), with Deloitte & Touche LLP. There were no disagreements with E&Y on any matter of accounting principles or practices, financial statement disclosure, or auditing scope or procedure.
Weitz Short Duration Income Fund
Semi-annual shareholder report — September 30, 2024
Additional information about the Fund (e.g. Financial Statements, Prospectus and Statement of Additional Information) is available on the Fund's website at weitz.investments/reports or upon request, by calling 888-859-0698. Additional information about the Fund's Proxy Voting Record is available on the Fund's website at weitz.investments/proxy.
Weitz Ultra Short Government Fund
Semi-annual shareholder report — September 30, 2024
This semi-annual shareholder report contains important information about the Weitz Ultra Short Government Fund (the "Fund") for the period of April 1, 2024 to September 30, 2024. You can find additional information about the Fund at weitz.investments/reports. You can also request information by contacting us at 888-859-0698.
What were the Fund's costs for the last six months?
(based on a hypothetical $10,000 investment)
| Costs of a $10,000 investment ($) | Costs paid as a percentage of a $10,000 investment (%) |
|---|
| Weitz Ultra Short Government Fund | 16 | 0.32 |
How did the Fund perform for the period?
The Fund (Ticker: SAFEX) returned 2.58% for the 6-month period ended September 30, 2024.
As of September 30, the fund held 90.3% in U.S. Treasury notes, 0.2% in investment-grade asset-backed securities, and 9.4% in a high-quality money market fund. The Fund maintained a low average effective duration to reduce rate sensitivity, focusing on short-term Treasuries that provided steady gains through favorable reinvestment rates. No segments detracted from performance.
For additional manager insights, visit weitzinvestments.com.
How did the Fund perform during the past 10 years?
Growth of $10,000 investment
| Weitz Ultra Short Government Fund | Bloomberg U.S. Aggregate Bond Index | ICE BofA U.S. 6-Month Treasury Bill Index |
|---|
| Sep 24 | 11,715 | 12,004 | 11,954 |
| Sep 23 | 11,131 | 10,760 | 11,306 |
| Sep 22 | 10,671 | 10,691 | 10,811 |
| Sep 21 | 10,632 | 12,518 | 10,769 |
| Sep 20 | 10,623 | 12,632 | 10,756 |
| Sep 19 | 10,475 | 11,807 | 10,592 |
| Sep 18 | 10,215 | 10,704 | 10,319 |
| Sep 17 | 10,069 | 10,838 | 10,159 |
| Sep 16 | 10,012 | 10,829 | 10,078 |
| Sep 15 | 10,001 | 10,294 | 10,023 |
| Sep 14 | 10,000 | 10,000 | 10,000 |
Average Annual Total Returns
| 6 Month (%) | 1 Year (%) | 5 Year (%) | 10 Year (%) |
|---|
| Weitz Ultra Short Government Fund - SAFEX | 2.58 | 5.25 | 2.26 | 1.60 |
| Bloomberg U.S. Aggregate Bond Index | 5.26 | 11.57 | 0.33 | 1.84 |
| ICE BofA U.S. 6-Month Treasury Bill Index | 2.90 | 5.73 | 2.45 | 1.80 |
The above line chart and returns table compares the fund’s results to (i) the Bloomberg U.S. Aggregate Bond Index, a broad measure of market performance and (ii) the ICE BofA U.S. 6-Month Treasury Bill Index, an additional index that the investment adviser believes more closely reflects the market segments in which the fund invests.
The fund’s past performance is not a predictor of its future performance. Investment results reflect applicable fees and expenses, assumes all distributions are reinvested, and include fee waivers and/or expense reimbursements, without which results would have been lower; however, they do not reflect the deduction of taxes an investor would pay on distributions or share redemptions.
| Net Assets ($) | 143,216,920 |
| Number of Portfolio Holdings | 15 |
| Net Investment Advisory Fees Paid ($) | 257,117 |
| Portfolio Turnover Rate (%) | 2 |
| 30-Day SEC Yield (Subsidized) (%) | 4.51 |
| 30-Day SEC Yield (Unsubsidized) (%) | 4.27 |
| Average Effective Maturity (yrs) | 0.30 |
| Average Effective Duration (yrs) | 0.30 |
What did the Fund invest in?
(as of September 30, 2023)
| Maturity | % of Portfolio |
| Cash Equivalents | 9.4 |
| Less than 1 Year | 90.6 |
| 100.0 |
Credit Quality (% of Portfolio)
| Value | Value |
|---|
| U.S Treasury | 90.3 |
| AAA | 0.2 |
| AA | 0.1 |
| Cash Equivalents | 9.4 |
| Maturity | | | % of Portfolio |
| Less than 1 Year | | | 100.0 |
| | | 100.0 |
| % of Net Assets |
| U.S. Treasuries | 65.5 |
| Asset-Backed Securities | 0.3 |
| Cash Equivalents/Other | 34.2 |
| 100.0 |
Credit quality disclosure: Credit ratings are assigned to underlying securities utilizing ratings from a Nationally Recognized Statistical Rating Organization (NRSRO) such as Moody's and Fitch, or other rating agencies and applying the following hierarchy: security is determined to be Investment Grade if it has been rated at least BBB- by one credit rating agency; once determined to be Investment Grade (BBB- and above) or Non-Investment Grade (BB+ and below) where multiple ratings are available, then the lowest rating is assigned. Mortgage-related securities issued and guaranteed by government-sponsored agencies such as Fannie Mae and Freddie Mac are generally not rated by rating agencies. Securities that are not rated do not necessarily indicate low quality. Ratings are shown in the Fitch scale (e.g., AAA). Ratings and portfolio credit quality may change over time. The Fund itself has not been rated by a credit rating agency.
Material fund changes: There were no material fund changes during the reporting period.
Changes in or disagreements with accountants: On September 27, 2024, The Fund replaced its existing independent registered public accounting firm, Ernst & Young LLP ("E&Y"), with Deloitte & Touche LLP. There were no disagreements with E&Y on any matter of accounting principles or practices, financial statement disclosure, or auditing scope or procedure.
Weitz Ultra Short Government Fund
Semi-annual shareholder report — September 30, 2024
Additional information about the Fund (e.g. Financial Statements, Prospectus and Statement of Additional Information) is available on the Fund's website at weitz.investments/reports or upon request, by calling 888-859-0698. Additional information about the Fund's Proxy Voting Record is available on the Fund's website at weitz.investments/proxy.
(b) Not applicable.
Item 2. Code of Ethics.
Not applicable – only for annual reports.
Item 3. Audit Committee Financial Expert.
Not applicable – only for annual reports.
Item 4. Principal Accountant Fees and Services.
Not applicable – only for annual reports.
Item 5. Audit Committee of Listed Registrants.
Not applicable.
Item 6. Investments.
(a) The Schedule of Investments are included as part of the Financial Statements filed under Item 7(a) of this Form.
(b) Not applicable.
Item 7. Financial Statements and Financial Highlights for Open-End Management Investment Companies.
SEMI-ANNUAL
FINANCIAL
STATEMENTS
AND
OTHER
INFORMATION
September
30,
2024
Conservative
Allocation
Fund
Investor
Class
(WBALX)
Institutional
Class
(WBAIX)
Core
Plus
Income
Fund
Investor
Class
(WCPNX)
Institutional
Class
(WCPBX)
Large
Cap
Equity
Fund
Investor
Class
(WVALX)
Institutional
Class
(WVAIX)
Multi
Cap
Equity
Fund
Investor
Class
(WPVLX)
Institutional
Class
(WPVIX)
Nebraska
Tax
Free
Income
Fund
(WNTFX)
Partners
III
Opportunity
Fund
Investor
Class
(WPOIX)
Institutional
Class
(WPOPX)
Short
Duration
Income
Fund
Investor
Class
(WSHNX)
Institutional
Class
(WEFIX)
Ultra
Short
Government
Fund
(SAFEX)
Schedule
of
Investments
3
Financial
Statements
30
Notes
to
Financial
Statements
38
Other
Information
47
Portfolio
composition
is
subject
to
change
at
any
time
and
references
to
specific
securities,
industries,
and
sectors
referenced
in
this
report
are
not
recommendations
to
purchase
or
sell
any
particular
security.
Current
and
future
portfolio
holdings
are
subject
to
risk.
See
the
Schedules
of
Investments
included
in
this
report
for
the
percent
of
assets
in
each
of
the
Funds
invested
in
particular
industries
or
sectors.
Conservative
Allocation
Fund
Schedule
of
Investments
(Unaudited)
September
30,
2024
The
accompanying
notes
form
an
integral
part
of
these
financial
statements.
Common
Stocks
-
44.4%
a
Financials
%
of
Net
Assets
Shares
$
Value
Transaction
&
Payment
Processing
Services
5.3
Mastercard,
Inc.
-
Class
A
10,500
5,184,900
Visa,
Inc.
-
Class
A
17,000
4,674,150
Fidelity
National
Information
Services,
Inc.
34,000
2,847,500
a
Multi-Sector
Holdings
2.6
Berkshire
Hathaway,
Inc.
-
Class
B
(a)
13,500
6,213,510
a
Insurance
Brokers
2.4
Aon
plc
-
Class
A
16,750
5,795,332
a
Financial
Exchanges
&
Data
1.3
S&P
Global,
Inc.
6,100
3,151,382
a
11.6
27,866,774
Information
Technology
Semiconductor
Materials
&
Equipment
3.9
Analog
Devices,
Inc.
20,000
4,603,400
Microchip
Technology,
Inc.
30,000
2,408,700
Texas
Instruments,
Inc.
11,000
2,272,270
a
Systems
Software
3.3
Microsoft
Corp.
9,250
3,980,275
Oracle
Corp.
23,000
3,919,200
a
IT
Consulting
&
Other
Services
2.1
Accenture
plc
-
Class
A
(b)
14,250
5,037,090
a
Application
Software
1.3
Roper
Technologies,
Inc.
5,500
3,060,420
a
10.6
25,281,355
Health
Care
Life
Sciences
Tools
&
Services
6.0
Danaher
Corp.
21,000
5,838,420
Thermo
Fisher
Scientific,
Inc.
8,750
5,412,488
Bio-Techne
Corp.
40,000
3,197,200
a
Health
Care
Services
1.4
Labcorp
Holdings,
Inc.
15,000
3,352,200
a
7.4
17,800,308
Industrials
Industrial
Machinery
&
Supplies
&
Components
2.6
IDEX
Corp.
16,000
3,432,000
Fortive
Corp.
35,000
2,762,550
a
Environmental
&
Facilities
Services
1.5
Veralto
Corp.
32,500
3,635,450
a
Cargo
Ground
Transportation
1.4
Old
Dominion
Freight
Line,
Inc.
16,000
3,178,240
a
Industrial
Conglomerates
0.8
Honeywell
International,
Inc.
9,500
1,963,745
a
6.3
14,971,985
a
Materials
%
of
Net
Assets
Shares
$
Value
Construction
Materials
3.5
Vulcan
Materials
Co.
17,000
4,257,310
Martin
Marietta
Materials,
Inc.
7,500
4,036,875
a
Industrial
Gases
1.2
Linde
plc
6,000
2,861,160
a
4.7
11,155,345
Communication
Services
Cable
&
Satellite
1.4
Comcast
Corp.
-
Class
A
80,000
3,341,600
a
Interactive
Media
&
Services
1.0
Alphabet,
Inc.
-
Class
C
15,000
2,507,850
a
2.4
5,849,450
Consumer
Staples
Distillers
&
Vintners
1.4
Diageo
plc
-
ADR
(b)
24,000
3,368,160
a
Total
Common
Stocks
(Cost
$52,133,187)
106,293,377
Corporate
Bonds
-
0.2%
a
a
a
$
Principal
Amount
$
Value
a
a
a
a
a
AutoZone,
Inc.
3.63%
4/15/25
(Cost
$499,949)
500,000
496,680
Asset-Backed
Securities
-
7.0%
a
a
a
a
a
Automobile
AmeriCredit
Automobile
Receivables
Trust
(AMCAR)
Series
2020-2
Class
D
–2.13%
3/18/26
595,000
594,105
ARI
Fleet
Lease
Trust
(ARIFL)
Series
2022-A
Class
A2
–3.12%
1/15/31
(c)
5,081
5,075
Series
2023-B
Class
A2
–6.05%
7/15/32
(c)
133,716
135,290
Series
2024-A
Class
A2
–5.3%
11/15/32
(c)
85,000
85,636
Series
2024-B
Class
A2
–5.54%
4/15/33
(c)
220,000
222,674
BOF
URSA
VI
Funding
Trust
I
(BVABS)
Series
2023-CAR1
Class
A2
–5.54%
10/27/31
(c)
67,200
67,577
Series
2023-CAR2
Class
A2
–5.54%
10/27/31
(c)
155,976
156,849
CarMax
Auto
Owner
Trust
(CARMX)
Series
2021-3
Class
C
–1.25%
5/17/27
380,000
366,639
CFMT
LLC
(CFMT)
Series
2021-AL1
Class
B
–1.39%
9/22/31
(c)
107,596
105,186
Chesapeake
Funding
II
LLC
(CFII)
Series
2021-1A
Class
A1
–0.47%
4/15/33
(c)
34,419
34,251
Series
2023-1A
Class
A1
–5.65%
5/15/35
(c)
324,660
327,570
Series
2023-2A
Class
A1
–6.16%
10/15/35
(c)
114,460
116,427
Series
S2-1A
Class
A1
–5.52%
5/15/36
(c)
104,351
105,630
Enterprise
Fleet
Financing
LLC
(EFF)
Series
2023-1
Class
A2
–5.51%
1/22/29
(c)
159,882
160,775
Series
2023-2
Class
A2
–5.56%
4/22/30
(c)
304,874
307,891
Series
2023-3
Class
A2
–6.4%
3/20/30
(c)
569,633
582,468
Series
2024-1
Class
A2
–5.23%
3/20/30
(c)
180,000
181,797
Series
2024-2
Class
A3
–5.61%
4/20/28
(c)
300,000
309,033
The
accompanying
notes
form
an
integral
part
of
these
financial
statements.
Conservative
Allocation
Fund
(Continued)
Schedule
of
Investments
(Unaudited)
September
30,
2024
a
a
a
$
Principal
Amount
$
Value
a
a
a
a
a
Series
24-3
Class
A3
–4.98%
8/21/28
(c)
130,000
132,429
Flagship
Credit
Auto
Trust
(FCAT)
Series
2020-4
Class
C
–1.28%
2/16/27
(c)
53,443
53,142
JPMorgan
Chase
Auto
Credit
Linked
Note
(CACLN)
Series
2021-2
Class
A4
–0.89%
12/26/28
(c)
10,711
10,664
LAD
Auto
Receivables
Trust
(LADAR)
Series
2022-1A
Class
A
–5.21%
6/15/27
(c)
156,122
156,375
Series
2023-1A
Class
A2
–5.68%
10/15/26
(c)
47,835
47,877
Series
2023-2A
Class
A2
–5.93%
6/15/27
(c)
140,771
141,195
Series
2023-4A
Class
A3
–6.1%
12/15/27
(c)
225,000
227,614
Merchants
Fleet
Funding
LLC
(MFF)
Series
2023-1A
Class
A
–7.21%
5/20/36
(c)
367,629
372,294
OneMain
Direct
Auto
Receivables
Trust
(ODART)
Series
2021-1A
Class
A
–0.87%
7/14/28
(c)
204,818
200,867
Series
2022-1A
Class
C
–1.42%
7/14/28
(c)
447,000
427,417
SFS
Auto
Receivables
Securitization
Trust
(SFAST)
Series
2023-1A
Class
A2A
–5.89%
3/22/27
(c)
37,315
37,432
Wheels
Fleet
Lease
Funding
LLC
(WFLF)
Series
2023-2A
Class
A
–6.46%
8/18/38
(c)
652,443
660,405
Series
24-2A
Class
A1
–4.87%
6/21/39
(c)
700,000
706,732
a
7,039,316
a
Collateralized
Loan
Obligations
Audax
Senior
Debt
CLO
6
LLC
(AUDAX)
Series
2021-6A
Class
A1
–7.04%
10/20/33
Floating
Rate
(TSFR3M
+
176)
(c)
(d)
500,000
500,363
BlackRock
Rainier
CLO
VI
Ltd.
(BLKMM)
Series
2021-6A
Class
A
–7.24%
4/20/33
Floating
Rate
(TSFR3M
+
196)
(b)
(c)
(d)
500,000
500,530
Churchill
Middle
Market
CLO
III
Ltd.
(CHMML)
Series
2021-1A
Class
A1
–7.04%
10/24/33
Floating
Rate
(TSFR3M
+
176)
(b)
(c)
(d)
250,000
250,183
Fortress
Credit
Opportunities
XV
CLO
Ltd.
(FCO)
Series
2021-15A
Class
A2
–7.1%
4/25/33
Floating
Rate
(TSFR3M
+
181)
(b)
(c)
(d)
500,000
500,160
Golub
Capital
Partners
CLO
54M
LP
(GOCAP)
Series
2021-54A
Class
A2
–7.03%
8/5/33
Floating
Rate
(TSFR3M
+
179)
(b)
(c)
(d)
500,000
500,195
Monroe
Capital
MML
CLO
XII
Ltd.
(MCMML)
Series
2021-2A
Class
A1
–6.71%
9/14/33
Floating
Rate
(TSFR3M
+
176)
(b)
(c)
(d)
500,000
500,491
Palmer
Square
Loan
Funding
Ltd.
(PSTAT)
Series
2021-1A
Class
A2
–6.79%
4/20/29
Floating
Rate
(TSFR3M
+
151)
(b)
(c)
(d)
382,044
382,693
a
3,134,615
a
Consumer
&
Specialty
Finance
Foundation
Finance
Trust
(FFIN)
Series
2021-2A
Class
A
–2.19%
1/15/42
(c)
93,558
88,037
Series
2023-2A
Class
A
–6.53%
6/15/49
(c)
166,309
171,424
Series
2024-1A
Class
A
–5.5%
12/15/49
(c)
138,039
141,150
Lendingpoint
Asset
Securitization
Trust
(LDPT)
Series
2022-C
Class
A
–6.56%
2/15/30
(c)
13,284
13,288
Marlette
Funding
Trust
(MFT)
Series
2023-3A
Class
A
–6.49%
9/15/33
(c)
27,619
27,650
Octane
Receivables
Trust
(OCTL)
Series
2021-2A
Class
A
–1.21%
9/20/28
(c)
26,031
25,729
Series
2022-1A
Class
A2
–4.18%
3/20/28
(c)
49,634
49,510
Series
2022-2A
Class
A
–5.11%
2/22/28
(c)
55,346
55,346
a
a
a
$
Principal
Amount
$
Value
a
a
a
a
a
Series
2024-2A
Class
A2
–5.8%
7/20/32
(c)
340,000
344,838
a
916,972
a
Equipment
Amur
Equipment
Finance
Receivables
XI
LLC
(AXIS)
Series
2022-2A
Class
A2
–5.3%
6/21/28
(c)
71,573
71,811
Amur
Equipment
Finance
Receivables
XII
LLC
(AXIS)
Series
2023-1A
Class
A2
–6.09%
12/20/29
(c)
180,835
183,667
Amur
Equipment
Finance
Receivables
XIII
LLC
(AXIS)
Series
2024-1A
Class
A2
–5.38%
1/21/31
(c)
161,210
163,247
Amur
Equipment
Finance
Receivables
XIV
LLC
(AXIS)
Series
24-2A
Class
A2
–5.19%
7/21/31
(c)
270,000
274,258
Dell
Equipment
Finance
Trust
(DEFT)
Series
2023-2
Class
A2
–5.84%
1/22/29
(c)
83,283
83,458
Series
2023-3
Class
A2
–6.1%
4/23/29
(c)
90,715
91,087
Series
2024-1
Class
A3
–5.39%
3/22/30
(c)
170,000
172,979
Dext
ABS
LLC
(DEXT)
Series
2023-2
Class
A2
–6.56%
5/15/34
(c)
437,674
443,143
DLLMT
LLC
(DLLMT)
Series
24-1A
Class
A3
–4.84%
8/21/28
(c)
230,000
233,230
DLLST
LLC
(DLLST)
Series
2024-1A
Class
A3
–5.05%
8/20/27
(c)
110,000
110,985
Granite
Park
Equipment
Leasing
LLC
(SCFGP)
Series
2023-1A
Class
A2
–6.51%
5/20/30
(c)
317,008
321,239
GreatAmerica
Leasing
Receivables
Funding
LLC
(GALC)
Series
2021-1
Class
B
–0.72%
12/15/26
(c)
500,000
495,360
Series
24-2
Class
A3
–5%
9/15/28
(c)
240,000
244,708
HPEFS
Equipment
Trust
(HPEFS)
Series
2023-1A
Class
A2
–5.43%
8/20/25
(c)
174,002
174,117
Series
2024-2A
Class
A3
–5.36%
10/20/31
(c)
125,000
127,273
Kubota
Credit
Owner
Trust
(KCOT)
Series
2024-2A
Class
A3
–5.26%
11/15/28
(c)
190,000
195,060
M&T
Equipment
Notes
(MTLFR)
Series
24-1
Class
A2
–4.99%
8/18/31
(c)
300,000
301,889
MMAF
Equipment
Finance
LLC
(MMAF)
Series
2022-B
Class
A3
–5.61%
7/10/28
(c)
164,856
165,480
Series
2023-A
Class
A2
–5.79%
11/13/26
(c)
117,580
118,270
SCF
Equipment
Leasing
LLC
(SCFET)
Series
2022-2A
Class
A3
–6.5%
10/21/30
(c)
242,276
245,839
SCF
Equipment
Trust
LLC
(SCFET)
Series
2023-1A
Class
A2
–6.56%
1/22/30
(c)
933,135
946,680
a
5,163,780
a
Other
Verizon
Master
Trust
(VZMT)
Series
2023-7
Class
A1A
–5.67%
11/20/29
465,000
479,895
a
Total
Asset-Backed
Securities
(Cost
$16,562,232)
16,734,578
Commercial
Mortgage-Backed
Securities
-
2.1%
a
a
a
a
a
AREIT
LLC
(AREIT)
Series
2023-CRE8
Class
AS
–7.95%
8/17/41
Floating
Rate
(TSFR1M
+
287)
(b)
(c)
500,000
502,582
AREIT
Trust
(AREIT)
Series
2021-CRE5
Class
A
–6.28%
11/17/38
Floating
Rate
(TSFR1M
+
119)
(b)
(c)
58,526
58,544
The
accompanying
notes
form
an
integral
part
of
these
financial
statements.
a
a
a
$
Principal
Amount
$
Value
a
a
a
a
a
FS
Rialto
Issuer
LLC
(FSRIA)
Series
2022-FL5
Class
A
–7.27%
6/19/37
Floating
Rate
(TSFR1M
+
230)
(c)
429,722
431,467
GPMT
Ltd.
(GPMT)
Series
2021-FL3
Class
A
–6.38%
7/16/35
Floating
Rate
(TSFR1M
+
136)
(b)
(c)
188,874
187,013
HERA
Commercial
Mortgage
Ltd.
(HERA)
Series
2021-FL1
Class
A
–6.18%
2/18/38
Floating
Rate
(TSFR1M
+
116)
(b)
(c)
240,554
239,159
HGI
CRE
CLO
Ltd.
(HGI)
Series
2021-FL1
Class
A4
–6.26%
6/16/36
Floating
Rate
(TSFR1M
+
116)
(b)
(c)
37,160
37,067
Series
2021-FL1
Class
AS
–6.61%
6/16/36
Floating
Rate
(TSFR1M
+
151)
(b)
(c)
500,000
495,474
Series
2021-FL2
Class
A4
–6.21%
9/17/36
Floating
Rate
(TSFR1M
+
111)
(b)
(c)
121,411
120,766
HIG
RCP
Trust
(HIG)
Series
2023-FL1
Class
A
–7.37%
9/19/38
Floating
Rate
(TSFR1M
+
227)
(c)
279,967
281,192
KREF
Ltd.
(KREF)
Series
2021-FL2
Class
A4
–6.27%
2/15/39
Floating
Rate
(TSFR1M
+
118)
(b)
(c)
498,988
493,530
Series
2022-FL3
Class
A
–6.41%
2/17/39
Floating
Rate
(TSFR1M
+
145)
(b)
(c)
500,000
499,688
LoanCore
Issuer
Ltd.
(LNCR)
Series
2021-CRE5
Class
A
–6.51%
7/15/36
Floating
Rate
(TSFR1M
+
141)
(b)
(c)
302,401
301,739
PFP
Ltd.
(PFP)
Series
2022-9
Class
A
–7.37%
8/19/35
Floating
Rate
(TSFR1M
+
227)
(b)
(c)
204,615
205,575
Series
24-11
Class
A
–6.92%
9/17/39
Floating
Rate
(TSFR1M
+
183)
(c)
200,000
200,288
STWD
Ltd.
(STWD)
Series
2022-FL3
Class
A
–6.69%
11/15/38
Floating
Rate
(SOFR30A
+
135)
(b)
(c)
494,182
490,258
VMC
Finance
LLC
(VMC)
Series
2021-FL4
Class
A
–6.23%
6/16/36
Floating
Rate
(TSFR1M
+
121)
(c)
24,442
24,415
Series
22-FL5
Class
AS
–7.74%
2/18/39
Floating
Rate
(SOFR30A
+
240)
(c)
500,000
496,644
a
Total
Commercial
Mortgage-Backed
Securities
(Cost
$5,052,680)
5,065,401
Mortgage-Backed
Securities
-
6.6%
a
a
a
a
a
Federal
Home
Loan
Mortgage
Corporation
Collateralized
Mortgage
Obligations
Series
3649
Class
A
–4%
3/15/25
608
606
a
Pass-Through
Securities
Pool#
J14649
–
3.5%
4/1/26
4,875
4,817
Pool#
E02948
–
3.5%
7/1/26
11,885
11,731
Pool#
J16663
–
3.5%
9/1/26
8,764
8,672
Pool#
ZS8692
–
2.5%
4/1/33
102,869
98,325
Pool#
SB8257
–
5.5%
9/1/38
1,069,517
1,092,272
Pool#
SB8287
–
5%
3/1/39
869,739
880,637
Pool#
SB8293
–
5%
4/1/39
672,317
680,743
Series
5407
Class
DA
–5.5%
11/25/49
946,013
961,146
Series
5450
4.5%
6/25/51
991,051
982,883
4,721,832
a
a
a
$
Principal
Amount
$
Value
a
a
a
a
a
a
Federal
National
Mortgage
Association
Collateralized
Mortgage
Obligations
Series
2024-20
Class
HD
–5.5%
3/25/46
463,582
471,212
Series
2024-20
Class
CA
–5.5%
1/25/47
892,453
904,106
Series
2024-20
Class
EA
–5.5%
8/25/49
875,527
889,275
a
Pass-Through
Securities
Pool#
AB1769
–
3%
11/1/25
3,422
3,366
Pool#
AB3902
–
3%
11/1/26
13,971
13,772
Pool#
AK3264
–
3%
2/1/27
12,555
12,363
Pool#
AB6291
–
3%
9/1/27
80,487
79,139
Pool#
MA3189
–
2.5%
11/1/27
66,113
64,512
Pool#
MA3791
–
2.5%
9/1/29
174,857
169,418
Pool#
BM5708
–
3%
12/1/29
78,037
76,657
Pool#
AS7701
–
2.5%
8/1/31
511,407
491,613
Pool#
MA3540
–
3.5%
12/1/33
62,086
61,234
Pool#
MA5311
–
5%
3/1/39
667,285
675,647
3,912,314
a
Government
National
Mortgage
Association
Pass-Through
Securities
Pool#
5255
–
3%
12/20/26
13,590
13,411
a
Non-Government
Agency
Collateralized
Mortgage
Obligations
Chase
Home
Lending
Mortgage
Trust
(CHASE)
Series
2024-1
Class
A4A
–6%
1/25/55
(c)
(d)
896,323
908,454
Series
2024-2
Class
A4A
–6%
2/25/55
(c)
(d)
571,345
579,708
Flagstar
Mortgage
Trust
(FSMT)
Series
2021-7
Class
B
–2.5%
8/25/51
(c)
(d)
358,506
321,379
GS
Mortgage-Backed
Securities
Trust
(GSMBS)
Series
2022-PJ1
Class
AB
–2.5%
5/28/52
(c)
(d)
400,875
356,795
Series
24-PJ8
Class
A8
–5.5%
2/25/55
(c)
(d)
1,000,000
998,671
JPMorgan
Mortgage
Trust
(JPMMT)
Series
2014-5
Class
B
–2.71%
10/25/29
(c)
(d)
29,108
28,318
Series
2016-3
Class
A
–2.96%
10/25/46
(c)
(d)
104,703
99,393
Series
2017-3
Class
A
–2.5%
8/25/47
(c)
(d)
139,340
124,487
Series
2020-7
Class
A
–3%
1/25/51
(c)
(d)
11,578
11,455
Series
2020-8
Class
A
–3%
3/25/51
(c)
(d)
43,217
42,192
Series
2021-6
Class
B
–2.5%
10/25/51
(c)
(d)
469,473
421,402
Series
2021-8
Class
B
–2.5%
12/25/51
(c)
(d)
346,135
311,115
Series
2022-2
Class
A4A
–2.5%
8/25/52
(c)
(d)
279,312
249,592
Series
2023-6
Class
A4A
–5.5%
12/26/53
(c)
(d)
579,335
582,860
Series
2024-2
Class
A6A
–6%
8/25/54
(c)
(d)
543,509
547,540
JPMorgan
Wealth
Management
(JPMWM)
Series
2020-ATR1
Class
A
–3%
2/25/50
(c)
(d)
5,656
5,625
RCKT
Mortgage
Trust
(RCKT)
Series
2021-3
Class
A5
–2.5%
7/25/51
(c)
(d)
323,076
290,770
Sequoia
Mortgage
Trust
(SEMT)
Series
2019-CH2
Class
A
–4.5%
8/25/49
(c)
(d)
11,398
11,298
Series
2020-3
Class
A
–3%
4/25/50
(c)
(d)
22,138
21,652
Series
2023-3
Class
A4
–6%
9/25/53
(c)
(d)
416,444
422,236
Series
2024-3
Class
A4
–6%
4/25/54
(c)
(d)
431,872
438,065
Series
2024-5
Class
A5
–6%
6/25/54
(c)
(d)
344,675
349,420
7,122,427
a
Total
Mortgage-Backed
Securities
(Cost
$15,883,098)
15,769,984
The
accompanying
notes
form
an
integral
part
of
these
financial
statements.
Conservative
Allocation
Fund
(Continued)
Schedule
of
Investments
(Unaudited)
September
30,
2024
U.S.
Treasuries
-
32.5%
a
a
a
$
Principal
Amount
$
Value
a
a
a
a
a
U.S.
Treasury
Notes
2.25%
10/31/24
2,000,000
1,995,683
1.13%
1/15/25
2,000,000
1,980,375
1.38%
1/31/25
2,000,000
1,979,361
2%
2/15/25
2,000,000
1,981,490
2.63%
3/31/25
2,000,000
1,983,362
2.75%
5/15/25
3,000,000
2,972,320
0.25%
6/30/25
2,000,000
1,943,392
0.25%
7/31/25
2,000,000
1,938,174
3.13%
8/15/25
2,000,000
1,984,200
2.75%
8/31/25
2,000,000
1,976,848
3.5%
9/15/25
2,000,000
1,991,076
3%
10/31/25
2,000,000
1,980,625
2.25%
11/15/25
2,000,000
1,964,609
0.38%
11/30/25
2,000,000
1,921,328
0.38%
1/31/26
1,000,000
955,820
4%
2/15/26
2,000,000
2,005,703
2.38%
4/30/26
2,000,000
1,958,672
0.75%
5/31/26
2,000,000
1,905,234
1.5%
8/15/26
2,000,000
1,922,344
4.63%
9/15/26
2,000,000
2,036,172
1.63%
10/31/26
4,000,000
3,840,000
2%
11/15/26
3,000,000
2,900,859
1.88%
2/28/27
2,000,000
1,921,016
2.38%
5/15/27
2,000,000
1,939,648
4.63%
6/15/27
2,000,000
2,054,258
0.5%
8/31/27
2,000,000
1,831,484
4.13%
9/30/27
2,000,000
2,032,422
4.13%
10/31/27
2,000,000
2,032,070
2.25%
11/15/27
2,000,000
1,922,383
3.5%
1/31/28
2,000,000
1,995,898
4%
2/29/28
2,000,000
2,027,617
3.5%
4/30/28
2,000,000
1,995,508
3.63%
5/31/28
2,000,000
2,003,516
4.13%
7/31/28
2,000,000
2,039,219
4.63%
9/30/28
2,000,000
2,077,930
3.13%
11/15/28
2,000,000
1,965,430
4%
1/31/29
2,000,000
2,034,141
2.88%
4/30/29
1,000,000
970,469
4%
10/31/29
1,000,000
1,018,711
a
Total
U.S.
Treasuries
(Cost
$77,925,981)
77,979,367
Cash
Equivalents
-
9.5%
a
a
a
a
a
U.S.
Treasury
Bills,
4.40%
to
4.63%,
10/15/24
to
11/26/24
(e)
15,000,000
14,932,228
JPMorgan
U.S.
Government
Money
Market
Fund
-
Institutional
Class
4.77%
(f)
7,768,128
7,768,128
a
Total
Cash
Equivalents
(Cost
$22,700,419)
22,700,356
Total
Investments
in
Securities
-
102.3%
(Cost
$190,757,546)
245,039,743
Other
Liabilities
in
Excess
of
Other
Assets
- (2.3%)
(5,455,078)
Net
Assets
-
100%
239,584,665
Net
Asset
Value
Per
Share
-
Investor
Class
17.80
Net
Asset
Value
Per
Share
-
Institutional
Class
17.84
(a)
Non-income
producing.
(b)
Foreign
domiciled
entity.
(c)
Security
is
exempt
from
registration
under
Rule
144A
of
the
Securities
Act
of
1933.
This
security
may
be
resold
in
transactions
that
are
exempt
from
registration,
normally
to
qualified
institutional
buyers.
(d)
The
interest
rate
resets
periodically
based
on
the
weighted
average
coupons
of
the
underlying
mortgage-related
or
asset-backed
obligations.
(e)
Interest
rates
presented
represent
the
effective
yield
at
September
30,
2024.
(f)
Rate
presented
represents
the
7
day
average
yield
at
September
30,
2024.
Core
Plus
Income
Fund
Schedule
of
Investments
(Unaudited)
September
30,
2024
The
accompanying
notes
form
an
integral
part
of
these
financial
statements.
Corporate
Bonds
-
12.2%
a
a
a
$
Principal
Amount
$
Value
a
Agree,
LP
5.63%
6/15/34
10,650,000
11,146,838
Aircastle,
Ltd.
5.25%
8/11/25
(a)
(b)
5,171,000
5,175,284
Allegion
U.S.
Holding
Co.,
Inc.
5.6%
5/29/34
3,000,000
3,137,015
Ally
Financial,
Inc.
8%
11/1/31
2,000,000
2,264,876
American
Airlines
Group,
Inc.
3.75%
3/1/25
(b)
1,000,000
990,643
American
Airlines,
Inc./AAdvantage
Loyalty
IP
Ltd.
5.5%
4/20/26
(a)
(b)
1,925,000
1,921,087
5.75%
4/20/29
(a)
(b)
1,000,000
999,168
Americold
Realty
Operating
Partnership,
LP
5.41%
9/12/34
5,000,000
5,018,401
Antares
Holdings,
LP
7.95%
8/11/28
(b)
3,000,000
3,186,476
Apollo
Debt
Solutions
BDC
6.9%
4/13/29
(b)
500,000
519,961
Ares
Capital
Corp.
2.88%
6/15/28
1,000,000
922,686
6.35%
8/15/29
(b)
5,000,000
5,113,339
Ashtead
Capital,
Inc.
4.38%
8/15/27
(b)
1,000,000
992,762
4%
5/1/28
(b)
1,070,000
1,043,852
2.45%
8/12/31
(b)
500,000
427,221
5.55%
5/30/33
(b)
250,000
256,001
5.95%
10/15/33
(b)
1,000,000
1,053,935
AT&T,
Inc.
6.8%
5/15/36
713,000
807,427
Axalta
Coating
Systems
LLC
3.38%
2/15/29
(b)
624,000
584,819
Barings
BDC,
Inc.
7%
2/15/29
7,000,000
7,316,203
Bath
&
Body
Works,
Inc.
6.95%
3/1/33
3,675,000
3,725,524
6.88%
11/1/35
301,000
313,978
6.75%
7/1/36
2,756,000
2,843,291
Berkshire
Hathaway
Finance
Corp.
4.25%
1/15/49
500,000
463,803
Blue
Owl
Credit
Income
Corp
5.5%
3/21/25
11,807,000
11,798,946
Blue
Owl
Credit
Income
Corp.
7.75%
1/15/29
5,000,000
5,335,232
Boeing
Co.
6.26%
5/1/27
(b)
2,500,000
2,582,792
6.3%
5/1/29
(b)
3,000,000
3,157,303
Broadcom,
Inc.
3.42%
4/15/33
(b)
350,000
318,126
3.14%
11/15/35
(b)
1,014,000
867,501
Cantor
Fitzgerald
LP
4.5%
4/14/27
(b)
1,500,000
1,486,403
7.2%
12/12/28
(b)
1,000,000
1,061,682
Carlisle
Cos.,
Inc.
3.5%
12/1/24
532,000
530,588
3.75%
12/1/27
500,000
491,835
CDW
LLC
/
CDW
Finance
Corp.
4.25%
4/1/28
4,000,000
3,956,557
3.28%
12/1/28
1,000,000
947,835
5.55%
8/22/34
5,000,000
5,121,954
a
a
a
$
Principal
Amount
$
Value
a
Charles
Schwab
Corp.
(The)
1.95%
12/1/31
5,000,000
4,260,631
Charter
Communications
Operating
LLC/Charter
Communications
Operating
Capital
4.2%
3/15/28
650,000
632,096
6.1%
6/1/29
5,000,000
5,176,996
Choice
Hotels
International,
Inc.
3.7%
1/15/31
250,000
231,388
5.85%
8/1/34
3,000,000
3,095,150
Cinemark
USA,
Inc.
5.25%
7/15/28^
(b)
3,000,000
2,952,225
7%
8/1/32
(b)
3,000,000
3,134,292
CNX
Resources
Corp.
7.25%
3/1/32
(b)
3,000,000
3,152,949
Compass
Group
Diversified
Holdings
LLC
5.25%
4/15/29
(b)
2,581,000
2,509,661
Concentrix
Corp.
6.6%
8/2/28^
3,165,000
3,303,309
6.85%
8/2/33^
4,812,000
4,987,083
CoStar
Group,
Inc.
2.8%
7/15/30
(b)
5,846,000
5,268,572
Cousins
Properties,
LP
5.88%
10/1/34
2,000,000
2,054,216
Delta
Air
Lines,
Inc./SkyMiles
IP
Ltd.
4.5%
10/20/25
(a)
(b)
231,250
229,881
4.75%
10/20/28
(a)
(b)
1,100,000
1,099,022
Devon
Energy
Corp.
5.25%
10/15/27
325,000
326,582
4.5%
1/15/30
920,000
912,197
Diamondback
Energy,
Inc.
3.25%
12/1/26
75,000
73,439
3.5%
12/1/29
100,000
95,149
Dick's
Sporting
Goods,
Inc.
3.15%
1/15/32
1,700,000
1,532,884
Dow
Chemical
Co.
(The)
4.25%
10/1/34
1,052,000
1,019,597
Element
Fleet
Management
Corp.
3.85%
6/15/25
(a)
(b)
1,000,000
990,769
Energy
Transfer
LP
2.9%
5/15/25
500,000
493,910
6%
2/1/29
(b)
1,000,000
1,025,101
7.38%
2/1/31
(b)
900,000
958,202
Enterprise
Products
Operating
LLC
4.45%
2/15/43
990,000
901,224
EPR
Properties
4.75%
12/15/26
1,250,000
1,245,551
4.5%
6/1/27
3,330,000
3,282,308
4.95%
4/15/28
3,830,000
3,797,359
3.6%
11/15/31
350,000
312,312
Essential
Properties
LP
2.95%
7/15/31
12,121,000
10,558,525
Expedia
Group,
Inc.
3.8%
2/15/28
484,000
475,036
3.25%
2/15/30
90,000
84,905
Gap,
Inc.
(The)
3.88%
10/1/31
(b)
106,000
92,773
Gartner,
Inc.
3.75%
10/1/30
(b)
5,000,000
4,697,184
Golub
Capital
Private
Credit
Fund
5.8%
9/12/29
(b)
5,000,000
4,983,406
The
accompanying
notes
form
an
integral
part
of
these
financial
statements.
Core
Plus
Income
Fund
(Continued)
Schedule
of
Investments
(Unaudited)
September
30,
2024
a
a
a
$
Principal
Amount
$
Value
a
HEICO
Corp.
5.25%
8/1/28
3,000,000
3,098,519
5.35%
8/1/33
1,000,000
1,040,122
Hercules
Capital,
Inc.
2.63%
9/16/26
1,000,000
945,555
Highwoods
Realty
LP
3.88%
3/1/27
750,000
733,620
3.05%
2/15/30
1,600,000
1,440,641
2.6%
2/1/31
500,000
426,584
Host
Hotels
&
Resorts
LP
Series
H
3.38%
12/15/29
612,000
570,205
5.5%
4/15/35
5,000,000
5,074,542
IDEX
Corp.
4.95%
9/1/29
2,000,000
2,046,399
Indiana
Bell
Telephone
Co.,
Inc.
7.3%
8/15/26
535,000
555,684
Ingersoll
Rand,
Inc.
5.4%
8/14/28
1,000,000
1,042,710
International
Flavors
&
Fragrances,
Inc.
4.45%
9/26/28
1,662,000
1,669,378
5%
9/26/48
1,500,000
1,382,607
Kilroy
Realty,
LP
2.65%
11/15/33
280,000
219,520
Kite
Realty
Group
Trust
4.75%
9/15/30
2,315,000
2,316,527
Kroger
Co.
The
4.9%
9/15/31
7,000,000
7,047,619
Lennar
Corp.
4.75%
5/30/25
622,000
621,055
LKQ
Corp.
6.25%
6/15/33
5,000,000
5,305,040
LPL
Holdings,
Inc.
6.75%
11/17/28
3,000,000
3,227,698
LXP
Industrial
Trust
6.75%
11/15/28
3,000,000
3,211,099
2.7%
9/15/30
500,000
445,488
Manitowoc
Co.,
Inc.
The
9.25%
10/1/31
(b)
1,000,000
1,026,250
Markel
Group,
Inc.
3.5%
11/1/27
550,000
537,782
Marriott
International,
Inc.
Series
HH
2.85%
4/15/31
500,000
450,375
MasTec,
Inc.
4.5%
8/15/28
(b)
3,881,000
3,814,303
Micron
Technology,
Inc.
4.19%
2/15/27
500,000
498,756
Mileage
Plus
Holdings
LLC/Mileage
Plus
Intellectual
Property
Assets
Ltd.
6.5%
6/20/27
(b)
1,083,000
1,097,278
MPLX
LP
4.88%
6/1/25
190,000
189,864
4%
3/15/28
85,000
83,848
4.8%
2/15/29
250,000
254,012
5.5%
6/1/34
5,000,000
5,139,185
4.7%
4/15/48
551,000
480,856
NNN
REIT,
Inc.
5.5%
6/15/34
5,000,000
5,205,492
OneMain
Finance
Corp.
3.88%
9/15/28
1,994,000
1,851,149
5.38%
11/15/29
3,303,000
3,176,865
a
a
a
$
Principal
Amount
$
Value
a
Oracle
Corp.
4.13%
5/15/45
1,000,000
848,885
3.6%
4/1/50
470,000
358,123
Owens
Corning
3.5%
2/15/30
(b)
200,000
190,057
Penske
Truck
Leasing
Co.
Lp
/
PTL
Finance
Corp.
5.35%
1/12/27
(b)
250,000
254,854
6.05%
8/1/28
(b)
2,000,000
2,105,823
Phillips
Edison
Grocery
Center
Operating
Partnership
I
LP
2.63%
11/15/31
4,100,000
3,532,598
5.75%
7/15/34
8,000,000
8,360,311
Physicians
Realty
LP
4.3%
3/15/27
1,271,000
1,269,971
2.63%
11/1/31
7,577,000
6,619,712
Plains
All
American
Pipeline
LP/PAA
Finance
Corp.
3.55%
12/15/29
798,000
759,267
4.3%
1/31/43
75,000
63,519
Polaris,
Inc.
6.95%
3/15/29
1,000,000
1,086,052
Realty
Income
Corp.
4%
7/15/29
2,000,000
1,970,040
4.85%
3/15/30
1,000,000
1,025,284
RELX
Capital,
Inc.
4%
3/18/29
500,000
495,693
4.75%
5/20/32
250,000
252,939
Retail
Opportunity
Investments
Partnership
LP
6.75%
10/15/28
3,445,000
3,698,201
Rithm
Capital
Corp.
8%
4/1/29
(b)
11,000,000
11,140,711
Rocket
Mortgage
LLC
/
Rocket
Mortgage
Co-Issuer,
Inc.
3.88%
3/1/31
(b)
200,000
184,324
4%
10/15/33
(b)
1,450,000
1,296,489
Store
Capital
LLC
4.5%
3/15/28
503,000
493,770
4.63%
3/15/29
14,538,000
14,258,672
2.7%
12/1/31
1,250,000
1,064,563
Tempur
Sealy
International,
Inc.
4%
4/15/29
(b)
400,000
373,431
3.88%
10/15/31
(b)
1,500,000
1,338,664
T-Mobile
USA,
Inc.
2.63%
4/15/26
250,000
243,829
3.38%
4/15/29
4,000,000
3,842,217
Twilio,
Inc.
3.88%
3/15/31
300,000
277,464
United
Rentals
North
America,
Inc.
6.13%
3/15/34
(b)
2,800,000
2,897,152
United
Wholesale
Mortgage
LLC
5.75%
6/15/27
(b)
200,000
198,866
5.5%
4/15/29
(b)
700,000
682,420
VICI
Properties
LP
4.95%
2/15/30
500,000
503,375
5.75%
4/1/34
5,000,000
5,240,830
VICI
Properties
LP/VICI
Note
Co.,
Inc.
4.13%
8/15/30
(b)
1,120,000
1,064,494
VistaJet
Malta
Finance
PLC
/
Vista
Management
Holding,
Inc.
7.88%
5/1/27
(a)
(b)
4,462,000
4,359,269
6.38%
2/1/30
(a)
(b)
100,000
86,002
The
accompanying
notes
form
an
integral
part
of
these
financial
statements.
a
a
a
$
Principal
Amount
$
Value
a
Vontier
Corp.
2.95%
4/1/31
100,000
87,088
a
Total
Corporate
Bonds
(Cost
$314,751,417)
326,578,814
Corporate
Convertible
Bonds
-
0.0%
a
Redwood
Trust,
Inc.
5.75%
10/1/25
(Cost
$500,000)
500,000
492,500
Asset-Backed
Securities
-
18.0%
a
Automobile
ACM
Auto
Trust
(ACMAT)
Series
2023-1A
Class
C
–8.59%
1/22/30
(b)
1,718,867
1,730,369
Series
2023-2A
Class
A
–7.97%
6/20/30
(b)
1,688,265
1,698,946
Series
2023-2A
Class
B
–9.85%
6/20/30
(b)
7,000,000
7,208,643
Series
2024-1A
Class
A
–7.71%
1/21/31
(b)
899,833
905,670
AmeriCredit
Automobile
Receivables
Trust
(AMCAR)
Series
2020-2
Class
D
–2.13%
3/18/26
1,500,000
1,497,744
Series
2020-3
Class
D
–1.49%
9/18/26
1,250,000
1,225,851
Series
2022-1
Class
C
–2.98%
9/20/27
450,000
439,649
Arivo
Acceptance
Auto
Loan
Receivables
Trust
(ARIVO)
Series
2022-2A
Class
C
–9.84%
3/15/29
(b)
1,000,000
976,619
Avid
Automobile
Receivables
Trust
(AVID)
Series
2023-1
Class
A
–6.63%
7/15/26
(b)
75,433
75,466
Series
2023-1
Class
B
–7.12%
3/15/27
(b)
1,500,000
1,504,098
Bayview
Opportunity
Master
Fund
VII
Trust
(BVABS)
Series
2024-CAR1
Class
C
–6.78%
12/26/31
Floating
Rate
(SOFR30A
+
150)
(b)
(c)
1,463,037
1,463,687
Series
2024-CAR1F
Class
A
–6.97%
7/29/32
(b)
1,767,483
1,774,529
BOF
URSA
VI
Funding
Trust
I
(BVABS)
Series
2023-CAR1
Class
A2
–5.54%
10/27/31
(b)
336,001
337,885
Series
2023-CAR2
Class
A2
–5.54%
10/27/31
(b)
779,879
784,247
BOF
VII
AL
Funding
Trust
I
(BVABS)
Series
2023-CAR3
Class
A2
–6.29%
7/26/32
(b)
2,854,439
2,908,803
CFMT
LLC
(CFMT)
Series
2021-AL1
Class
B
–1.39%
9/22/31
(b)
251,056
245,433
Drive
Auto
Receivables
Trust
(DRIVE)
Series
2021-1
Class
D
–1.45%
1/16/29
418,690
412,000
Enterprise
Fleet
Financing
LLC
(EFF)
Series
2023-2
Class
A2
–5.56%
4/22/30
(b)
1,524,371
1,539,456
Exeter
Automobile
Receivables
Trust
(EART)
Series
2021-4A
Class
C
–1.46%
10/15/27
250,087
248,961
First
Help
Financial
Trust
(FHF)
Series
2023-1A
Class
A2
–6.57%
6/15/28
(b)
1,975,703
2,004,821
Series
2023-2A
Class
A2
–6.79%
10/15/29
(b)
1,305,015
1,332,906
First
Investors
Auto
Owner
Trust
(FIAOT)
Series
2022-1A
Class
A
–2.03%
1/15/27
(b)
36,645
36,434
Series
2022-2A
Class
D
–8.71%
10/16/28
(b)
1,000,000
1,061,336
Flagship
Credit
Auto
Trust
(FCAT)
Series
2021-1
Class
E
–2.72%
4/17/28
(b)
1,500,000
1,431,462
Series
2021-2
Class
C
–1.27%
6/15/27
(b)
1,768,599
1,737,004
Series
2021-3
Class
C
–1.46%
9/15/27
(b)
255,000
248,551
Series
2021-4
Class
D
–2.26%
12/15/27
(b)
350,000
329,747
GLS
Auto
Receivables
Issuer
Trust
(GCAR)
Series
2021-2A
Class
D
–1.42%
4/15/27
(b)
370,729
363,043
Series
2021-3A
Class
C
–1.11%
9/15/26
(b)
199,334
198,094
Series
2021-4A
Class
D
–2.48%
10/15/27
(b)
455,000
441,397
a
a
a
$
Principal
Amount
$
Value
a
JPMorgan
Chase
Bank
NA
(CACLN)
Series
2021-2
Class
E
–2.28%
12/26/28
(b)
21,422
21,355
LAD
Auto
Receivables
Trust
(LADAR)
Series
2021-1A
Class
C
–2.35%
4/15/27
(b)
6,500,000
6,402,923
Series
2021-1A
Class
D
–3.99%
11/15/29
(b)
3,740,000
3,700,798
Series
2022-1A
Class
B
–5.87%
9/15/27
(b)
1,720,000
1,742,259
Series
2022-1A
Class
C
–6.85%
4/15/30
(b)
2,000,000
2,059,650
Series
2023-1A
Class
D
–7.3%
6/17/30
(b)
3,000,000
3,104,641
Series
2023-2A
Class
A2
–5.93%
6/15/27
(b)
1,407,706
1,411,952
Series
2023-4A
Class
C
–6.76%
3/15/29
(b)
1,510,000
1,575,391
Lendbuzz
Securitization
Trust
(LBZZ)
Series
2023-1A
Class
A2
–6.92%
8/15/28
(b)
2,831,478
2,884,608
Series
2023-3A
Class
A2
–7.5%
12/15/28
(b)
6,093,904
6,249,400
Series
2024-1A
Class
A2
–6.19%
8/15/29
(b)
2,262,925
2,288,995
Series
2024-2A
Class
A2
–5.99%
5/15/29
(b)
5,875,000
5,950,120
Series
2024-2A
Class
C
–7.45%
5/15/31
(b)
1,500,000
1,568,439
Series
24-3A
Class
A2
–4.97%
10/15/29
(b)
2,250,000
2,254,180
Lobel
Automobile
Receivables
Trust
(LOBEL)
Series
2023-1
Class
A
–6.97%
7/15/26
(b)
397,967
399,031
Series
2023-2
Class
A
–7.59%
4/16/29
(b)
467,614
472,884
OneMain
Direct
Auto
Receivables
Trust
(ODART)
Series
2021-1A
Class
D
–1.62%
11/14/30
(b)
1,000,000
956,739
Series
2022-1A
Class
C
–1.42%
7/14/28
(b)
4,000,000
3,824,756
Prestige
Auto
Receivables
Trust
(PART)
Series
2022-1A
Class
C
–7.09%
8/15/28
(b)
1,000,000
1,014,167
Research-Driven
Pagaya
Motor
Asset
Trust
(RPM)
Series
2023-3A
Class
A
–7.13%
1/26/32
(b)
3,679,064
3,721,968
SAFCO
Auto
Receivables
Trust
(SAFCO)
Series
2024-1A
Class
A
–6.51%
3/20/28
(b)
5,282,657
5,319,179
Santander
Bank
NA
(SBCLN)
Series
2021-1A
Class
C
–3.27%
12/15/31
(b)
26,368
26,313
Tricolor
Auto
Securitization
Trust
(TAST)
Series
2023-1A
Class
A
–6.48%
8/17/26
(b)
73,708
73,735
Series
2023-1A
Class
B
–6.84%
11/16/26
(b)
1,480,000
1,482,717
Series
2024-2A
Class
A
–6.36%
12/15/27
(b)
2,903,811
2,929,856
United
Auto
Credit
Securitization
Trust
(UACST)
Series
2024-1
Class
B
–6.57%
6/10/27
(b)
2,000,000
2,026,304
Series
2024-1
Class
C
–7.06%
10/10/29
(b)
4,000,000
4,079,007
Series
2024-1
Class
D
–8.3%
11/12/29
(b)
8,660,000
8,933,704
a
112,637,922
a
Cell
Tower
VB-S1
Issuer
LLC
(VBTEL)
Series
2024-1A
Class
C2
–5.59%
5/15/54
(b)
7,500,000
7,634,548
a
Collateralized
Loan
Obligations
ABPCI
Direct
Lending
Fund
CLO
XI
LP
(ABPCI)
Series
2022-11A
Class
B1
–8.86%
10/27/34
Floating
Rate
(TSFR3M
+
360)
(b)
(c)
1,500,000
1,507,285
ABPCI
Direct
Lending
Fund
CLO
XII
Ltd.
(ABPCI)
Series
2023-12A
Class
B
–8.76%
4/29/35
Floating
Rate
(TSFR3M
+
350)
(a)
(b)
(c)
2,000,000
2,022,724
ABPCI
Direct
Lending
Fund
CLO
XVI
Ltd.
(ABPCI)
Series
2023-16A
Class
C
–9.5%
2/1/36
Floating
Rate
(TSFR3M
+
425)
(b)
(c)
2,000,000
2,051,343
Antares
CLO
Ltd.
(ANTR)
Series
2017-2A
Class
DR
–9.29%
10/20/33
Floating
Rate
(TSFR3M
+
401)
(a)
(b)
(c)
2,000,000
1,973,331
The
accompanying
notes
form
an
integral
part
of
these
financial
statements.
Core
Plus
Income
Fund
(Continued)
Schedule
of
Investments
(Unaudited)
September
30,
2024
a
a
a
$
Principal
Amount
$
Value
a
Audax
Senior
Debt
CLO
6
LLC
(AUDAX)
Series
2021-6A
Class
B
–7.49%
10/20/33
Floating
Rate
(TSFR3M
+
221)
(b)
(c)
3,000,000
3,003,367
Audax
Senior
Debt
CLO
9
LLC
(AUDAX)
Series
2024-9A
Class
A1
–7.38%
4/20/36
Floating
Rate
(TSFR3M
+
210)
(b)
(c)
4,000,000
4,039,592
AUF
Funding
LLC
(ANTF)
Series
2022-1A
Class
B1
–9.03%
1/20/31
Floating
Rate
(TSFR3M
+
375)
(b)
(c)
1,500,000
1,508,224
Barings
Middle
Market
CLO,
Ltd.
(BMM)
Series
2023-IIA
Class
A2
–8.48%
1/20/32
Floating
Rate
(TSFR3M
+
320)
(a)
(b)
(c)
3,000,000
3,019,765
Series
2023-IIA
Class
B
–9.43%
1/20/32
Floating
Rate
(TSFR3M
+
415)
(a)
(b)
(c)
3,000,000
3,007,849
Series
2023-IIA
Class
C
–11.53%
1/20/32
Floating
Rate
(TSFR3M
+
625)
(a)
(b)
(c)
2,500,000
2,524,579
BCC
Middle
Market
CLO
LLC
(BCMM)
Series
2023-1A
Class
B1
–9.08%
7/20/35
Floating
Rate
(TSFR3M
+
380)
(b)
(c)
3,750,000
3,812,869
BCRED
MML
CLO
LLC
(BXCMM)
Series
2022-1A
Class
A1
–6.93%
4/20/35
Floating
Rate
(TSFR3M
+
165)
(b)
(c)
1,000,000
1,001,715
BlackRock
Elbert
CLO
V
LLC
(ELB)
Series
5A
Class
AR
–6.8%
6/15/34
Floating
Rate
(TSFR3M
+
185)
(b)
(c)
1,039,740
1,041,254
BlackRock
Rainier
CLO
VI
Ltd.
(BLKMM)
Series
2021-6A
Class
B
–7.59%
4/20/33
Floating
Rate
(TSFR3M
+
231)
(a)
(b)
(c)
1,800,000
1,802,239
Brightwood
Capital
MM
CLO
Ltd.
(BWCAP)
Series
2020-1A
Class
A1R
–8.1%
1/15/31
Floating
Rate
(TSFR3M
+
280)
(a)
(b)
(c)
940,035
942,926
Cerberus
Loan
Funding
LP
(CERB)
Series
2020-1A
Class
B
–8.11%
10/15/31
Floating
Rate
(TSFR3M
+
281)
(a)
(b)
(c)
482,530
483,419
Series
2020-1A
Class
C
–9.26%
10/15/31
Floating
Rate
(TSFR3M
+
396)
(a)
(b)
(c)
500,000
501,230
Series
2021-2A
Class
B
–7.46%
4/22/33
Floating
Rate
(TSFR3M
+
216)
(a)
(b)
(c)
1,500,000
1,501,518
Series
2022-1A
Class
A2
–4.02%
4/15/34
(b)
1,750,000
1,712,538
Cerberus
Loan
Funding
XLII
LLC
(CERB)
Series
2023-3A
Class
B
–8.64%
9/13/35
Floating
Rate
(TSFR3M
+
335)
(b)
(c)
1,750,000
1,776,421
Churchill
Middle
Market
CLO
III
Ltd.
(CHMML)
Series
2021-1A
Class
A1
–7.04%
10/24/33
Floating
Rate
(TSFR3M
+
176)
(a)
(b)
(c)
1,000,000
1,000,733
CIFC-LBC
Middle
Market
CLO
LLC
(CLBC)
Series
2023-1A
Class
B1
–8.83%
10/20/35
Floating
Rate
(TSFR3M
+
355)
(b)
(c)
4,500,000
4,581,634
Series
2023-1A
Class
C
–9.58%
10/20/35
Floating
Rate
(TSFR3M
+
430)
(b)
(c)
5,000,000
5,110,510
Deerpath
Capital
CLO
Ltd.
(DPATH)
Series
2021-2A
Class
A1
–7.16%
1/15/34
Floating
Rate
(TSFR3M
+
186)
(a)
(b)
(c)
1,000,000
1,000,854
Series
2021-2A
Class
C
–8.46%
1/15/34
Floating
Rate
(TSFR3M
+
316)
(a)
(b)
(c)
2,300,000
2,306,774
Series
2022-1A
Class
A1
–7.25%
7/15/33
Floating
Rate
(TSFR3M
+
195)
(a)
(b)
(c)
750,000
750,768
Series
2023-1A
Class
B1
–9.2%
4/15/35
Floating
Rate
(TSFR3M
+
390)
(a)
(b)
(c)
2,500,000
2,533,825
Series
2023-1A
Class
C
–10.55%
4/15/35
Floating
Rate
(TSFR3M
+
525)
(a)
(b)
(c)
1,500,000
1,528,807
Series
2024-1A
Class
A1
–7.38%
7/15/36
Floating
Rate
(TSFR3M
+
205)
(a)
(b)
(c)
5,000,000
5,052,457
a
a
a
$
Principal
Amount
$
Value
a
Fortress
Credit
Opportunities
IX
CLO
Ltd.
(FCO)
Series
2017-9A
Class
A1TR
–7.11%
10/15/33
Floating
Rate
(TSFR3M
+
181)
(a)
(b)
(c)
1,500,000
1,500,491
Fortress
Credit
Opportunities
XV
CLO
Ltd.
(FCO)
Series
2021-15A
Class
B
–7.4%
4/25/33
Floating
Rate
(TSFR3M
+
211)
(a)
(b)
(c)
1,500,000
1,501,434
Fortress
Credit
Opportunities
XXI
CLO
LLC
(FCO)
Series
2023-21A
Class
AT
–7.93%
1/21/35
Floating
Rate
(TSFR3M
+
265)
(b)
(c)
2,000,000
2,011,169
Series
2023-21A
Class
C
–10.18%
1/21/35
Floating
Rate
(TSFR3M
+
490)
(b)
(c)
1,000,000
1,012,727
Golub
Capital
Partners
CLO
31M
Ltd.
(GOCAP)
Series
2016-31A
Class
CR
–8.4%
8/5/30
Floating
Rate
(TSFR3M
+
316)
(a)
(b)
(c)
1,000,000
1,000,000
Golub
Capital
Partners
CLO
54M
LP
(GOCAP)
Series
2021-54A
Class
B
–7.35%
8/5/33
Floating
Rate
(TSFR3M
+
211)
(a)
(b)
(c)
500,000
500,491
Series
2021-54A
Class
C
–8.15%
8/5/33
Floating
Rate
(TSFR3M
+
291)
(a)
(b)
(c)
1,000,000
1,002,859
Guggenheim
MM
CLO
Ltd.
(GUGG)
Series
2021-4A
Class
B
–7.81%
1/15/34
Floating
Rate
(TSFR3M
+
251)
(a)
(b)
(c)
2,500,000
2,504,348
Ivy
Hill
Middle
Market
Credit
Fund
IX
Ltd.
(IVYH)
Series
9A
Class
A1TR
–6.9%
4/23/34
Floating
Rate
(TSFR3M
+
162)
(a)
(b)
(c)
1,500,000
1,500,997
KKR
Lending
Partners
III
CLO
LLC
(KKRLP)
Series
2021-1A
Class
B
–7.44%
10/20/30
Floating
Rate
(TSFR3M
+
216)
(b)
(c)
3,000,000
3,003,276
Maranon
Loan
Funding
Ltd.
(MRNON)
Series
2021-2RA
Class
BR
–7.61%
7/15/33
Floating
Rate
(TSFR3M
+
231)
(a)
(b)
(c)
2,500,000
2,503,037
Monroe
Capital
ABS
Funding
II
Ltd.
(MCAF)
Series
23-1A
Class
A1R
–6.77%
7/22/34
(b)
5,250,000
5,294,390
Series
23-1A
Class
B1R
–7.83%
7/22/34
(b)
2,500,000
2,564,668
Monroe
Capital
Funding
CLO
X
Ltd.
(MCFCL)
Series
2023-1A
Class
B
–8.8%
4/15/35
Floating
Rate
(TSFR3M
+
350)
(a)
(b)
(c)
1,500,000
1,515,886
Monroe
Capital
MML
CLO
XII
Ltd.
(MCMML)
Series
2021-2A
Class
C
–7.86%
9/14/33
Floating
Rate
(TSFR3M
+
291)
(a)
(b)
(c)
2,000,000
2,007,064
Monroe
Capital
MML
CLO
XV
LLC
(MCMML)
Series
2023-1A
Class
A1
–7.78%
9/23/35
Floating
Rate
(TSFR3M
+
250)
(b)
(c)
3,000,000
3,033,126
Series
2023-1A
Class
B
–8.73%
9/23/35
Floating
Rate
(TSFR3M
+
345)
(b)
(c)
3,000,000
3,050,906
New
Mountain
Guardian
IV
Income
Rated
Feeder
II,
Ltd.
(NMRF)
Series
2024-1A
Class
B
–9.3%
4/5/37
Floating
Rate
(TSFR3M
+
400)
(a)
(b)
(c)
#
4,765,000
4,757,286
Series
2024-1A
Class
C
–11.3%
4/5/37
Floating
Rate
(TSFR3M
+
600)
(a)
(b)
(c)
#
3,825,000
3,813,230
Series
2024-1A
Class
D
–13.7%
4/5/37
Floating
Rate
(TSFR3M
+
840)
(a)
(b)
(c)
#
3,000,000
2,985,688
Owl
Rock
CLO
IX
LLC
(OR)
Series
2022-9A
Class
B
–9.13%
11/20/34
Floating
Rate
(TSFR3M
+
400)
(b)
(c)
1,000,000
1,007,005
Owl
Rock
CLO
VIII
LLC
(OR)
Series
2022-8A
Class
AT
–7.83%
11/20/34
Floating
Rate
(TSFR3M
+
250)
(b)
(c)
1,000,000
1,003,010
Owl
Rock
CLO
XII
LLC
(OR)
Series
2023-12A
Class
B
–8.83%
7/20/34
Floating
Rate
(TSFR3M
+
355)
(b)
(c)
1,000,000
1,007,846
The
accompanying
notes
form
an
integral
part
of
these
financial
statements.
a
a
a
$
Principal
Amount
$
Value
a
Palmer
Square
Loan
Funding
Ltd.
(PSTAT)
Series
2021-1A
Class
A2
–6.79%
4/20/29
Floating
Rate
(TSFR3M
+
151)
(a)
(b)
(c)
191,022
191,347
Series
2021-1A
Class
B
–7.34%
4/20/29
Floating
Rate
(TSFR3M
+
206)
(a)
(b)
(c)
1,000,000
1,001,014
PennantPark
CLO
VI
LLC
(PNTPK)
Series
2023-6A
Class
B1
–9.03%
4/22/35
Floating
Rate
(TSFR3M
+
375)
(b)
(c)
2,000,000
2,025,261
Starwood
Commercial
Mortgage
Trust
(STWD)
Series
24-SIF4A
Class
D
10/17/36
Floating
Rate
(TSFR3M
+
400)
(a)
(b)
(c)
13,200,000
13,200,000
Starwood
Property
Mortgage
Trust
(STWD)
Series
2024-SIF3A
Class
B
–7.57%
4/17/36
Floating
Rate
(TSFR3M
+
225)
(b)
(c)
5,000,000
5,030,915
Series
2024-SIF3A
Class
C
–8.17%
4/17/36
Floating
Rate
(TSFR3M
+
285)
(b)
(c)
5,000,000
5,058,822
Series
2024-SIF3A
Class
D
–9.82%
4/17/36
Floating
Rate
(TSFR3M
+
450)
(b)
(c)
5,000,000
5,114,793
Twin
Brook
CLO
(TWBRK)
Series
2023-1A
Class
B
–8.48%
4/20/35
Floating
Rate
(TSFR3M
+
320)
(b)
(c)
1,000,000
1,003,884
Series
2023-1A
Class
C
–9.38%
4/20/35
Floating
Rate
(TSFR3M
+
410)
(b)
(c)
3,000,000
3,008,430
Windhill
CLO
1,
Ltd.
(WNDHL)
Series
2023-1A
Class
C
–9.78%
10/22/35
Floating
Rate
(TSFR3M
+
450)
(a)
(b)
(c)
9,200,000
9,421,450
Windhill
CLO
2,
Ltd.
(WNDHL)
Series
24-1A
Class
A
–6.26%
10/20/36
Floating
Rate
(TSFR3M
+
170)
(a)
(b)
(c)
4,000,000
3,980,800
a
162,218,200
a
Consumer
&
Specialty
Finance
Affirm
Asset
Securitization
Trust
(AFFRM)
Series
2022-Z1
Class
A
–4.55%
6/15/27
(b)
159,690
159,349
Series
2023-X1
Class
A
–7.11%
11/15/28
(b)
294,141
295,346
Bankers
Healthcare
Group
Securitization
Trust
(BHG)
Series
2021-A
Class
A
–1.42%
11/17/33
(b)
122,950
119,519
Series
2022-B
Class
B
–4.84%
6/18/35
(b)
1,100,360
1,097,218
Series
2023-A
Class
A
–5.55%
4/17/36
(b)
545,943
548,219
Series
2023-B
Class
A
–6.92%
12/17/36
(b)
1,259,043
1,313,323
Driven
Brands
Funding
LLC
(HONK)
Series
2019-2A
Class
A2
–3.98%
10/20/49
(b)
476,250
465,613
Foundation
Finance
Trust
(FFIN)
Series
2021-1A
Class
B
–1.87%
5/15/41
(b)
2,534,492
2,365,383
FREED
ABS
Trust
(FREED)
Series
2022-4FP
Class
C
–8.59%
12/18/29
(b)
1,108,377
1,114,593
Hilton
Grand
Vacations
Trust
(HGVT)
Series
2020-AA
Class
B
–4.22%
2/25/39
(b)
121,300
119,980
Lendingpoint
Asset
Securitization
Trust
(LDPT)
Series
2022-C
Class
A
–6.56%
2/15/30
(b)
66,420
66,439
LendingPoint
Asset
Securitization
Trust
(LDPT)
Series
2020-REV1
Class
C
–7.7%
10/15/28
(b)
6,328,297
6,211,125
LP
LMS
Asset
Securitization
Trust
(LPMS)
Series
2023-1A
Class
A
–8.18%
10/17/33
(b)
702,995
704,988
Octane
Receivables
Trust
(OCTL)
Series
2021-1A
Class
B
–1.53%
4/20/27
(b)
644,020
636,007
Series
2022-1A
Class
A2
–4.18%
3/20/28
(b)
115,813
115,523
Pagaya
AI
Debt
Selection
Trust
(PAID)
Series
2021
Class
B
–1.82%
1/16/29
(b)
95,755
92,563
Series
2023-7
Class
C
–8.8%
7/15/31
(b)
7,997,020
8,223,469
Series
2023-7
Class
D
–9%
7/15/31
(b)
4,998,138
5,080,433
a
a
a
$
Principal
Amount
$
Value
a
Pagaya
AI
Debt
Trust
(PAID)
Series
2022-2
Class
A
–4.97%
1/15/30
(b)
64,490
64,458
Series
2022-3
Class
A
–6.06%
3/15/30
(b)
138,313
138,351
Series
2022-5
Class
A
–8.1%
6/17/30
(b)
381,653
386,096
Series
2023-1
Class
A
–7.56%
7/15/30
(b)
527,372
529,283
Series
2023-3
Class
A
–7.6%
12/16/30
(b)
1,476,700
1,485,661
Series
2023-5
Class
B
–7.63%
4/15/31
(b)
1,749,985
1,764,456
Series
2023-5
Class
C
–9.1%
4/15/31
(b)
2,999,975
3,078,126
Series
2023-5
Class
D
–9%
4/15/31
(b)
3,499,970
3,545,136
Series
2024-1
Class
A
–6.66%
7/15/31
(b)
868,843
884,028
Series
2024-3
Class
B
–6.57%
10/15/31
(b)
9,000,000
9,110,815
Prosper
Marketplace
Issuance
Trust
(PMIT)
Series
2023-1A
Class
A
–7.06%
7/16/29
(b)
226,293
227,230
Reach
ABS
Trust
(REACH)
Series
2024-1A
Class
A
–6.3%
2/18/31
(b)
1,068,910
1,076,204
Theorem
Funding
Trust
(THRM)
Series
2022-2A
Class
B
–9.27%
12/15/28
(b)
1,000,000
1,035,487
Series
2022-3A
Class
A
–7.6%
4/15/29
(b)
216,207
218,341
Upstart
Securitization
Trust
(UPST)
Series
2021-1
Class
C
–4.06%
3/20/31
(b)
80,133
79,450
Series
2023-2
Class
A
–6.77%
6/20/33
(b)
2,135,526
2,146,053
a
54,498,265
a
Consumer
and
Specialty
Finance
ACHV
ABS
Trust
(ACHV)
Series
24-2PL
Class
C
–5.72%
10/27/31
(b)
7,134,000
7,169,809
a
Data
Center
Compass
Datacenters
Issuer
II
LLC
(CMPDC)
Series
2024-1A
Class
A1
–5.25%
2/25/49
(b)
3,250,000
3,282,993
Series
24-2A
Class
A1
–5.02%
8/25/49
(b)
7,750,000
7,817,300
Databank
Issuer
LLC
(COLO)
Series
2024-1A
Class
A2
–5.3%
1/26/54
(b)
5,750,000
5,735,348
Retained
Vantage
Data
Centers
Issuer
LLC
(VDCR)
Series
24-1A
Class
A2
–4.99%
9/15/49
(b)
3,500,000
3,490,783
Series
24-1A
Class
B
–5.78%
9/15/49
(b)
2,000,000
2,000,000
Stack
Infrastructure
Issuer
LLC
(SIDC)
Series
2023-3A
Class
A2
–5.9%
10/25/48
(b)
4,250,000
4,328,533
Switch
ABS
Issuer,
LLC
(SWTCH)
Series
2024-1A
Class
A2
–6.28%
3/25/54
(b)
6,600,000
6,750,567
Series
2024-2A
Class
C
–10.03%
6/25/54
(b)
10,000,000
10,472,020
a
43,877,544
a
Equipment
Amur
Equipment
Finance
Receivables
IX
LLC
(AXIS)
Series
2021-1A
Class
B
–1.38%
2/22/27
(b)
199,631
199,233
Series
2021-1A
Class
D
–2.3%
11/22/27
(b)
500,000
496,497
Amur
Equipment
Finance
Receivables
XII
LLC
(AXIS)
Series
2023-1A
Class
A2
–6.09%
12/20/29
(b)
723,339
734,667
a
1,430,397
a
Fiber
ALLO
Issuer
LLC
(ALLO)
Series
24-1A
Class
A2
–5.94%
7/20/54
(b)
3,000,000
3,053,437
Series
24-1A
Class
B
–7.15%
7/20/54
(b)
2,500,000
2,575,121
Series
24-1A
Class
C
–11.19%
7/20/54
(b)
7,500,000
8,009,922
Frontier
Issuer
LLC
(FYBR)
Series
2023-1
Class
A2
–6.6%
8/20/53
(b)
10,000,000
10,287,158
The
accompanying
notes
form
an
integral
part
of
these
financial
statements.
Core
Plus
Income
Fund
(Continued)
Schedule
of
Investments
(Unaudited)
September
30,
2024
a
a
a
$
Principal
Amount
$
Value
a
Series
2023-1
Class
B
–8.3%
8/20/53
(b)
2,650,000
2,774,176
Series
2023-1
Class
C
–11.5%
8/20/53
(b)
4,750,000
5,137,010
Hotwire
Funding
LLC
(HWIRE)
Series
2024-1A
Class
C
–9.19%
6/20/54
(b)
6,000,000
6,341,470
a
38,178,294
a
Other
Adams
Outdoor
Advertising,
LP
(ADMSO)
Series
2023-1
Class
A2
–6.97%
7/15/53
(b)
6,000,000
6,385,325
Cogent
Ipv4
LLC
(CGNT)
Series
2024-1A
Class
A2
–7.92%
5/25/54
(b)
2,250,000
2,364,238
ExteNet
Issuer
LLC
(EXTNT)
Series
24-1A
Class
A2
–5.34%
7/25/54
(b)
2,000,000
2,024,869
Series
24-1A
Class
C
–9.05%
7/25/54
(b)
5,000,000
5,086,881
Golub
Capital
Partners
ABS
Funding
(GCPAF)
Series
2023-1A
Class
A
–7.46%
7/25/33
(b)
5,000,000
5,121,599
Series
2024-1A
Class
A1
–8.18%
1/25/34
Floating
Rate
(TSFR3M
+
290)
(b)
(c)
5,000,000
5,002,764
Series
2024-1A
Class
A2
–6.89%
1/25/34
(b)
5,000,000
5,118,697
Jersey
Mike's
Funding
LLC
(JMIKE)
Series
2019-1A
Class
A2
–4.43%
2/15/50
(b)
2,649,975
2,608,173
Oxford
Finance
Funding
Trust
(OXFIN)
Series
2023-1A
Class
A2
–6.72%
2/15/31
(b)
5,000,000
5,074,866
TSC
SPV
Funding
LLC
(TROP)
Series
24-1A
Class
A2
–6.29%
8/20/54
(b)
17,000,000
17,312,066
Zaxby's
Funding
LLC
(ZAXBY)
Series
2021-1A
Class
A2
–3.24%
7/30/51
(b)
1,212,500
1,116,884
57,216,362
a
Total
Asset-Backed
Securities
(Cost
$475,698,710)
484,861,341
Commercial
Mortgage-Backed
Securities
-
6.3%
a
ACREC,
Ltd.
(ACREC)
Series
2021-FL1
Class
E
–8.13%
10/16/36
Floating
Rate
(TSFR1M
+
311)
(a)
(b)
5,000,000
4,759,182
AREIT
LLC
(AREIT)
Series
2023-CRE8
Class
B
–8.41%
8/17/41
Floating
Rate
(TSFR1M
+
332)
(a)
(b)
5,000,000
5,029,913
Series
2023-CRE8
Class
C
–9.11%
8/17/41
Floating
Rate
(TSFR1M
+
402)
(a)
(b)
5,000,000
5,048,576
Series
2023-CRE8
Class
D
–10.45%
8/17/41
Floating
Rate
(TSFR1M
+
537)
(a)
(b)
3,000,000
3,033,773
AREIT
Trust
(AREIT)
Series
2021-CRE5
Class
A
–6.28%
11/17/38
Floating
Rate
(TSFR1M
+
119)
(a)
(b)
117,051
117,088
Series
2021-CRE5
Class
B
–7.02%
11/17/38
Floating
Rate
(TSFR1M
+
193)
(a)
(b)
5,561,000
5,528,041
AREIT,
Ltd.
(AREIT)
Series
2024-CRE9
Class
AS
–7.32%
5/17/41
Floating
Rate
(TSFR1M
+
224)
(a)
(b)
5,000,000
5,031,687
Series
2024-CRE9
Class
B
–7.62%
5/17/41
Floating
Rate
(TSFR1M
+
254)
(a)
(b)
3,000,000
3,030,634
BDS
LLC
(BDS)
Series
24-FL13
Class
A
–6.78%
9/19/39
Floating
Rate
(TSFR1M
+
158)
(b)
5,000,000
4,987,500
BDS
Ltd.
(BDS)
Series
2021-FL10
Class
C
–7.43%
12/16/36
Floating
Rate
(TSFR1M
+
241)
(a)
(b)
1,250,000
1,242,839
a
a
a
$
Principal
Amount
$
Value
a
BPCRE
Ltd.
(BPCRE)
Series
2022-FL2
Class
AS
–8.11%
1/16/37
Floating
Rate
(TSFR1M
+
310)
(a)
(b)
1,550,000
1,550,245
Series
2022-FL2
Class
C
–9.51%
1/16/37
Floating
Rate
(TSFR1M
+
450)
(a)
(b)
4,000,000
3,984,389
BPR
Trust
(BPR)
Series
2021-TY
Class
B
–6.36%
9/15/38
Floating
Rate
(TSFR1M
+
126)
(b)
3,250,000
3,188,400
Brightspire
Capital,
Inc.
(BRSP)
Series
2021-FL1
Class
D
–7.78%
8/19/38
Floating
Rate
(TSFR1M
+
281)
(a)
(b)
1,000,000
976,378
BRSP
Ltd.
(BRSP)
Series
2021-FL1
Class
B
–6.98%
8/19/38
Floating
Rate
(TSFR1M
+
201)
(a)
(b)
1,100,000
1,090,469
Series
2021-FL1
Class
E
–8.53%
8/19/38
Floating
Rate
(TSFR1M
+
356)
(a)
(b)
4,000,000
3,860,660
Series
21-FL1
Class
C
–7.23%
8/19/38
Floating
Rate
(TSFR1M
+
226)
(a)
(b)
5,050,000
4,974,712
Series
24-FL2
Class
A
–6.91%
8/19/37
Floating
Rate
(TSFR1M
+
195)
(a)
(b)
5,000,000
5,003,750
Series
24-FL2
Class
D
–9.81%
8/19/37
Floating
Rate
(TSFR1M
+
484)
(a)
(b)
10,000,000
9,986,241
BSPRT
Issuer
LLC
(BSPRT)
Series
24-FL11
Class
A
–6.8%
7/15/39
Floating
Rate
(TSFR1M
+
164)
(b)
10,000,000
9,986,880
FS
Rialto
Issuer
LLC
(FSRIA)
Series
2021-FL2
Class
D
–8.01%
5/16/38
Floating
Rate
(TSFR1M
+
291)
(b)
2,080,000
1,997,530
Series
2021-FL2
Class
E
–8.66%
5/16/38
Floating
Rate
(TSFR1M
+
356)
(b)
1,000,000
926,050
Series
2022-FL7
Class
A
–7.99%
10/19/39
Floating
Rate
(TSFR1M
+
290)
(b)
1,000,000
1,005,310
Series
22-FL7
Class
B
–9.01%
10/19/39
Floating
Rate
(TSFR1M
+
391)
(b)
4,333,000
4,350,978
Government
National
Mortgage
Association
(GNR)
Series
2018-52
Class
AE
–2.75%
5/16/51
78,829
73,664
GPMT
Ltd.
(GPMT)
Series
2021-FL3
Class
A
–6.38%
7/16/35
Floating
Rate
(TSFR1M
+
136)
(a)
(b)
755,496
748,052
Series
2021-FL4
Class
C
–7.38%
12/15/36
Floating
Rate
(TSFR1M
+
246)
(a)
(b)
8,000,000
7,518,586
HERA
Commercial
Mortgage
Ltd.
(HERA)
Series
2021-FL1
Class
C
–7.08%
2/18/38
Floating
Rate
(TSFR1M
+
206)
(a)
(b)
650,000
629,777
HGI
CRE
CLO
Ltd.
(HGI)
Series
2021-FL1
Class
A4
–6.26%
6/16/36
Floating
Rate
(TSFR1M
+
116)
(a)
(b)
136,187
135,847
Series
2021-FL1
Class
AS
–6.61%
6/16/36
Floating
Rate
(TSFR1M
+
151)
(a)
(b)
2,000,000
1,981,898
Series
2021-FL1
Class
B
–6.81%
6/16/36
Floating
Rate
(TSFR1M
+
171)
(a)
(b)
5,100,000
5,031,370
Series
2021-FL1
Class
C
–6.91%
6/16/36
Floating
Rate
(TSFR1M
+
181)
(a)
(b)
450,000
439,473
Series
2021-FL1
Class
E
–8.16%
6/16/36
Floating
Rate
(TSFR1M
+
306)
(a)
(b)
750,000
715,702
Series
2021-FL2
Class
D
–7.36%
9/17/36
Floating
Rate
(TSFR1M
+
226)
(a)
(b)
1,000,000
967,398
HIG
RCP
LLC
(HIG)
Series
2023-FL1
Class
C
–9.66%
9/19/38
Floating
Rate
(TSFR1M
+
456)
(b)
5,000,000
5,048,809
Series
2023-FL1
Class
D
–10.96%
9/19/38
Floating
Rate
(TSFR1M
+
586)
(b)
5,000,000
5,056,389
The
accompanying
notes
form
an
integral
part
of
these
financial
statements.
a
a
a
$
Principal
Amount
$
Value
a
HIG
RCP
Trust
(HIG)
Series
2023-FL1
Class
B
–8.71%
9/19/38
Floating
Rate
(TSFR1M
+
361)
(b)
3,000,000
3,021,915
Hilton
USA
Trust
(HILT)
Series
2016-SFP
Class
E
–5.52%
11/5/35
(b)
840,000
105,085
ILPT
Commercial
Mortgage
Trust
(ILPT)
Series
2022-LPF2
Class
B
–7.84%
10/15/39
Floating
Rate
(TSFR1M
+
274)
(b)
3,000,000
2,999,111
Loancore
Issuer
Ltd.
(LNCR)
Series
2022-CRE7
Class
E
–9.09%
1/17/37
Floating
Rate
(SOFR30A
+
375)
(a)
(b)
2,250,000
2,198,488
Series
21-CRE6
Class
AS
–6.86%
11/15/38
Floating
Rate
(TSFR1M
+
176)
(a)
(b)
5,500,000
5,480,008
LoanCore
Issuer
Ltd.
(LNCR)
Series
2021-CRE5
Class
B
–7.21%
7/15/36
Floating
Rate
(TSFR1M
+
211)
(a)
(b)
1,407,000
1,394,833
PFP
Ltd.
(PFP)
Series
2021-8
Class
C
–7.01%
8/9/37
Floating
Rate
(TSFR1M
+
191)
(a)
(b)
7,500,000
7,525,441
Series
2021-8
Class
E
–7.71%
8/9/37
Floating
Rate
(TSFR1M
+
261)
(a)
(b)
750,000
719,583
Series
2022-9
Class
A
–7.37%
8/19/35
Floating
Rate
(TSFR1M
+
227)
(a)
(b)
613,846
616,725
Series
24-11
Class
C
–8.07%
9/17/39
Floating
Rate
(TSFR1M
+
299)
(b)
4,000,000
3,994,861
Series
24-11
Class
D
–9.17%
9/17/39
Floating
Rate
(TSFR1M
+
409)
(b)
5,000,000
5,002,570
STWD
Ltd.
(STWD)
Series
2021-FL2
Class
C
–7.23%
4/18/38
Floating
Rate
(TSFR1M
+
221)
(a)
(b)
2,109,000
2,075,993
Series
2022-FL3
Class
B
–7.29%
11/15/38
Floating
Rate
(SOFR30A
+
195)
(a)
(b)
3,525,000
3,428,520
Series
2022-FL3
Class
E
–8.59%
11/15/38
Floating
Rate
(SOFR30A
+
325)
(a)
(b)
2,320,000
2,147,821
TRTX
Issuer,
Ltd.
(TRTX)
Series
21-FL4
Class
C
–7.6%
3/15/38
Floating
Rate
(TSFR1M
+
251)
(a)
(b)
3,750,000
3,705,329
Series
22-FL5
Class
C
–7.83%
2/15/39
Floating
Rate
(TSFR1M
+
275)
(a)
(b)
5,000,000
4,875,501
VMC
Finance
LLC
(VMC)
Series
2021-FL4
Class
A
–6.23%
6/16/36
Floating
Rate
(TSFR1M
+
121)
(b)
97,768
97,658
a
Total
Commercial
Mortgage-Backed
Securities
(Cost
$168,757,438)
168,427,632
Mortgage-Backed
Securities
-
34.1%
a
Federal
Home
Loan
Mortgage
Corporation
Collateralized
Mortgage
Obligations
Series
5026
Class
DH
–1.75%
9/25/43
383,585
351,093
Series
4949
Class
BC
–2.25%
3/25/49
194,407
175,641
a
Pass-Through
Securities
Pool#
C91945
–
3%
8/1/37
207,874
197,100
Pool#
RA7183
–
4%
4/1/52
11,468,196
11,024,605
Pool#
SD8245
–
4.5%
9/1/52
19,040,152
18,734,621
Pool#
SD8257
–
4.5%
10/1/52
51,974,686
51,110,375
Pool#
SD8258
–
Series
8258
5%
10/1/52
8,637,147
8,650,354
Pool#
SD8266
–
4.5%
11/1/52
10,759,415
10,584,636
Pool#
SD8267
–
Series
8267
5%
11/1/52
3,508,728
3,513,099
Pool#
SD4712
–
4.5%
12/1/52
26,691,094
26,281,304
a
a
a
$
Principal
Amount
$
Value
a
Pool#
SD8290
–
6%
1/1/53
4,052,944
4,150,520
Pool#
SD2473
–
5%
2/1/53
13,276,779
13,287,155
Pool#
SD8323
–
Series
8323
5%
5/1/53
6,428,846
6,431,726
Pool#
SD8324
–
Series
8324
5.5%
5/1/53
8,084,252
8,183,124
Pool#
SD8329
–
5%
6/1/53
13,821,561
13,826,684
Pool#
SD3386
–
5.5%
7/1/53
4,739,885
4,806,683
Pool#
SD8341
–
Series
8341
5%
7/1/53
4,632,581
4,633,940
Pool#
SD8342
–
Series
8342
5.5%
7/1/53
12,769,383
12,921,017
Pool#
SD8350
–
6%
8/1/53
8,066,062
8,251,027
Pool#
SD8347
–
4.5%
8/1/53
40,147,534
39,535,117
Pool#
SD3857
–
6%
9/1/53
8,372,300
8,563,766
Pool#
SD8362
–
5.5%
9/1/53
18,589,507
18,814,652
Pool#
SD8366
–
5%
10/1/53
24,783,805
24,779,590
Pool#
SD6291
–
4.5%
10/1/53
8,000,000
7,873,706
Pool#
SD8374
–
6.5%
11/1/53
4,347,449
4,489,935
Pool#
SD8372
–
5.5%
11/1/53
4,702,826
4,760,107
Pool#
SD8371
–
5%
11/1/53
12,445,607
12,444,452
Pool#
SD8383
–
5.5%
12/1/53
21,963,445
22,226,681
Pool#
SD8395
–
5.5%
1/1/54
24,797,340
25,097,093
Pool#
SD8400
–
5%
2/1/54
19,352,343
19,347,558
Pool#
SD8408
–
5.5%
3/1/54
9,527,882
9,642,571
Pool#
SD8417
–
4.5%
3/1/54
14,542,234
14,298,358
Pool#
SD8421
–
6%
4/1/54
4,681,884
4,786,166
Pool#
SD8420
–
5.5%
4/1/54
11,493,701
11,630,849
Pool#
SD8419
–
5%
4/1/54
22,277,835
22,268,847
Pool#
SD8430
–
5%
5/1/54
5,844,849
5,842,492
Pool#
SD8438
–
5.5%
6/1/54
10,567,924
10,693,485
Pool#
SD8447
–
6%
7/1/54
4,848,099
4,956,085
Pool#
SD8461
–
5%
9/1/54
7,991,341
7,988,135
487,154,349
a
Federal
National
Mortgage
Association
Collateralized
Mortgage
Obligations
Series
2013-130
Class
CA
–2.5%
6/25/43
85,789
81,615
Series
2013-130
Class
CD
–3%
6/25/43
155,980
151,336
a
Pass-Through
Securities
Pool#
932836
–
3%
12/1/25
3,235
3,199
Pool#
468516
–
5.17%
6/1/28
193,126
195,803
Pool#
MA3443
–
4%
8/1/48
87,882
85,515
Pool#
FM5733
–
2%
1/1/51
1,112,040
936,411
Pool#
MA4733
–
4.5%
9/1/52
6,367,286
6,265,113
Pool#
MA4785
–
Series
4785
5%
10/1/52
11,699,440
11,711,546
Pool#
MA4806
–
Series
4806
5%
11/1/52
3,493,099
3,501,515
Pool#
MA4840
–
4.5%
12/1/52
12,420,842
12,219,081
Pool#
MA4941
–
5.5%
3/1/53
6,963,447
7,049,712
Pool#
MA5009
–
5%
5/1/53
28,462,309
28,475,057
Pool#
MA5040
–
6%
6/1/53
1,717,057
1,758,878
Pool#
MA5039
–
5.5%
6/1/53
7,187,890
7,274,404
Pool#
MA5038
–
Series
5038
5%
6/1/53
3,169,800
3,170,975
Pool#
MA5072
–
5.5%
7/1/53
20,015,423
20,257,804
Pool#
MA5071
–
5%
7/1/53
21,968,897
21,975,343
Pool#
MA5167
–
6.5%
10/1/53
2,583,821
2,665,217
Pool#
MA5166
–
6%
10/1/53
6,323,063
6,466,147
Pool#
MA5164
–
5%
10/1/53
9,742,928
9,741,271
Pool#
MA5192
–
6.5%
11/1/53
5,786,649
5,968,139
Pool#
MA5191
–
6%
11/1/53
4,600,853
4,705,415
Pool#
MA5216
–
6%
12/1/53
9,172,736
9,380,344
Pool#
MA5215
–
5.5%
12/1/53
21,851,333
22,112,100
Pool#
MA5271
–
5.5%
2/1/54
16,759,633
16,963,092
The
accompanying
notes
form
an
integral
part
of
these
financial
statements.
Core
Plus
Income
Fund
(Continued)
Schedule
of
Investments
(Unaudited)
September
30,
2024
a
a
a
$
Principal
Amount
$
Value
a
Pool#
CB7972
–
5%
2/1/54
9,752,008
9,759,785
Pool#
MA5296
–
5.5%
3/1/54
14,282,994
14,455,655
Pool#
MA5294
–
5%
3/1/54
9,698,600
9,694,688
Pool#
MA5331
–
5.5%
4/1/54
14,410,241
14,582,931
Pool#
MA5326
–
4.5%
4/1/54
6,339,637
6,233,453
Pool#
DB1847
–
5.5%
5/1/54
4,889,100
4,947,240
Pool#
MA5387
–
5%
6/1/54
30,467,135
30,454,846
Pool#
MA5420
–
5.5%
7/1/54
9,757,541
9,873,977
Pool#
MA5419
–
5%
7/1/54
12,870,468
12,865,277
Pool#
MA5443
–
5%
8/1/54
7,931,150
7,927,951
Pool#
MA5468
–
4.5%
9/1/54
17,882,769
17,583,233
341,494,068
a
Government
National
Mortgage
Association
Collateralized
Mortgage
Obligations
Series
2021-29
Class
CY
–3%
9/20/50
999,599
820,010
a
Non-Government
Agency
Collateralized
Mortgage
Obligations
Chase
Home
Lending
Mortgage
Trust
(CHASE)
Series
2024-1
Class
A3
–6%
1/25/55
(b)
(c)
6,455,697
6,511,984
Series
2024-2
Class
A3
–6%
2/25/55
(b)
(c)
8,275,908
8,348,066
Series
2024-5
Class
A2
–6%
4/25/55
(b)
(c)
7,774,574
7,842,361
Series
24-8
Class
A3
–5.5%
8/25/55
(b)
(c)
4,000,000
3,988,936
Flagstar
Mortgage
Trust
(FSMT)
Series
2017-1
Class
2A2
–3%
3/25/47
(b)
(c)
31,845
29,896
GS
Mortgage-Backed
Securities
Trust
(GSMBS)
Series
2023-PJ3
Class
A3
–5%
10/27/53
(b)
(c)
4,618,061
4,555,470
Series
2024-PJ5
Class
A3
–6%
9/25/54
(b)
(c)
6,974,632
7,035,444
JPMorgan
Mortgage
Trust
(JPMMT)
Series
2016-3
Class
A
–2.96%
10/25/46
(b)
(c)
41,881
39,757
Series
2017-3
Class
A
–2.5%
8/25/47
(b)
(c)
48,769
43,570
Series
2018-6
Class
2A2
–3%
12/25/48
(b)
(c)
14,222
13,589
Series
2023-3
Class
A3A
–5%
10/25/53
(b)
(c)
4,246,739
4,191,789
Series
2023-4
Class
1A2
–6%
11/25/53
(b)
(c)
2,558,489
2,577,599
Series
2023-9
Class
A2
–6%
4/25/54
(b)
(c)
2,858,500
2,883,423
Series
2023-10
Class
A2
–6%
5/25/54
(b)
(c)
2,041,390
2,059,189
Series
2024-2
Class
A3
–6%
8/25/54
(b)
(c)
3,339,230
3,355,823
Series
2024-4
Class
A3
–6%
10/25/54
(b)
(c)
4,528,090
4,567,571
Series
24-6
Class
A3
–6%
12/25/54
(b)
(c)
5,296,686
5,336,247
Morgan
Stanley
Residential
Mortgage
Loan
Trust
(MSRM)
Series
2023-1
Class
A1
–4%
2/25/53
(b)
(c)
5,346,333
5,024,441
RCKT
Mortgage
Trust
(RCKT)
Series
2021-3
Class
A5
–2.5%
7/25/51
(b)
(c)
1,292,302
1,163,080
Sequoia
Mortgage
Trust
(SEMT)
Series
2019-CH2
Class
A
–4.5%
8/25/49
(b)
(c)
4,885
4,842
Series
2023-3
Class
A1
–6%
9/25/53
(b)
(c)
4,373,330
4,411,461
Series
2024-1
Class
A1
–6%
1/25/54
(b)
(c)
13,161,292
13,259,593
a
Pass-Through
Securities
Greenpoint
Mortgage
Pass-Through
Certificates
(GMSI)
Series
2003-1
Class
A1
–7.37%
10/25/33
(c)
28,576
27,468
87,271,599
a
Total
Mortgage-Backed
Securities
(Cost
$898,009,135)
916,740,026
Municipal
Bonds
-
0.0%
a
a
a
$
Principal
Amount
$
Value
a
Detroit,
MI
City
School
District
General
Obligation
SBLF,
6.65%
5/1/29
(Cost
$543,739)
460,000
500,864
U.S.
Treasuries
-
28.4%
a
U.S.
Treasury
Bonds
3.5%
2/15/39
2,100,000
2,005,336
1.88%
2/15/41
11,500,000
8,437,900
4.38%
5/15/41
5,000,000
5,219,141
1.75%
8/15/41
4,000,000
2,837,734
2%
11/15/41
7,500,000
5,517,334
2.38%
2/15/42
28,000,000
21,818,125
3.25%
5/15/42
15,000,000
13,342,676
4%
11/15/42
90,000,000
88,593,750
3.88%
2/15/43
10,000,000
9,650,000
3.13%
2/15/43
25,000,000
21,639,648
3.88%
5/15/43
49,000,000
47,191,211
2.88%
5/15/43
2,000,000
1,661,094
4.38%
8/15/43
75,500,000
77,657,354
3.63%
8/15/43
17,000,000
15,748,906
4.75%
11/15/43
25,000,000
26,975,586
3.75%
11/15/43
6,000,000
5,646,563
4.5%
2/15/44
70,000,000
73,062,500
3.63%
2/15/44
15,500,000
14,310,859
4.63%
5/15/44
5,000,000
5,300,781
3.38%
5/15/44
15,500,000
13,778,047
4.13%
8/15/44
40,000,000
39,693,750
3.13%
8/15/44
27,500,000
23,459,863
3%
11/15/44
24,000,000
20,032,500
2.5%
2/15/45
21,000,000
16,056,797
3%
5/15/45
23,000,000
19,128,633
3%
11/15/45
9,500,000
7,882,031
2.5%
5/15/46
8,400,000
6,333,961
2.25%
8/15/46
2,500,000
1,790,527
3%
2/15/47
1,000,000
819,766
4.13%
8/15/53
13,000,000
12,949,727
U.S.
Treasury
Notes
2.25%
2/15/27
3,500,000
3,392,539
2.25%
8/15/27
3,000,000
2,892,305
1.13%
2/29/28
6,500,000
5,993,203
1.25%
5/31/28
8,000,000
7,364,844
1.25%
9/30/28
7,000,000
6,397,754
2.38%
10/15/28
13,000,000
13,868,345
1.5%
11/30/28
3,000,000
2,760,469
1.88%
2/28/29
3,500,000
3,259,170
4%
10/31/29
10,000,000
10,187,109
1.75%
11/15/29
3,000,000
2,748,984
1.5%
2/15/30
5,250,000
4,715,156
4%
2/28/30
20,000,000
20,386,328
0.88%
11/15/30
8,000,000
6,810,156
1.13%
2/15/31
4,500,000
3,870,791
1.38%
11/15/31
5,500,000
4,711,094
1.88%
2/15/32
1,000,000
883,320
4.13%
11/15/32
42,000,000
43,214,063
4.5%
11/15/33
10,000,000
10,562,891
a
Total
U.S.
Treasuries
(Cost
$763,315,149)
762,560,621
The
accompanying
notes
form
an
integral
part
of
these
financial
statements.
Cash
Equivalents
-
1.1%
a
a
a
$
Principal
Amount
$
Value
a
a
JPMorgan
U.S.
Government
Money
Market
Fund
-
Institutional
Class
4.77%
(Cost
$29,155,870)
(d)
29,155,870
29,155,870
Short-Term
Securities
Held
as
Collateral
for
Securities
on
Loan
-
0.2%
a
a
Shares
$
Value
Goldman
Sachs
Financial
Square
Government
Fund
Institutional
Class
–4.78%
(d)
4,651,565
4,651,565
Citibank
N.A.
DDCA
4.83%
516,840
516,840
a
Total
Short-Term
Securities
Held
as
Collateral
for
Securities
on
Loan
(Cost
$5,168,405)
5,168,405
Total
Investments
in
Securities
100.3%
(Cost
$2,655,899,863)
2,694,486,073
Other
Liabilities
in
Excess
of
Other
Assets
- (0.3%)
(9,042,928)
Net
Assets
-
100%
2,685,443,145
Net
Asset
Value
Per
Share
-
Investor
Class
9.89
Net
Asset
Value
Per
Share
-
Institutional
Class
9.89
^
This
security
or
a
partial
position
of
this
security
was
on
loan
as
of
September
30,
2024.
The
total
value
of
securities
on
loan
as
of
September
30,
2024
was
$5,064,734.
#
This
security,
in
part
or
entirely,
represents
a
delayed-settlement
security.
(a)
Foreign
domiciled
entity.
(b)
Security
is
exempt
from
registration
under
Rule
144A
of
the
Securities
Act
of
1933.
This
security
may
be
resold
in
transactions
that
are
exempt
from
registration,
normally
to
qualified
institutional
buyers.
(c)
The
interest
rate
resets
periodically
based
on
the
weighted
average
coupons
of
the
underlying
mortgage-related
or
asset-backed
obligations.
(d)
Rate
presented
represents
the
7
day
average
yield
at
September
30,
2024.
Large
Cap
Equity
Fund
Schedule
of
Investments
(Unaudited)
September
30,
2024
The
accompanying
notes
form
an
integral
part
of
these
financial
statements.
Common
Stocks
-
98.4%
a
Financials
%
of
Net
Assets
Shares
$
Value
Transaction
&
Payment
Processing
Services
16.7
Mastercard,
Inc.
-
Class
A
95,000
46,911,000
Visa,
Inc.
-
Class
A
170,000
46,741,500
Global
Payments,
Inc.
425,000
43,528,500
Fidelity
National
Information
Services,
Inc.
272,500
22,821,875
a
Multi-Sector
Holdings
5.2
Berkshire
Hathaway,
Inc.
-
Class
B
(a)
107,500
49,477,950
a
Insurance
Brokers
4.4
Aon
plc
-
Class
A
122,500
42,383,775
a
Financial
Exchanges
&
Data
2.5
S&P
Global,
Inc.
47,000
24,281,140
a
28.8
276,145,740
Information
Technology
Application
Software
9.5
Salesforce,
Inc.
95,000
26,002,450
Constellation
Software,
Inc.
Canada
(b)
7,500
24,400,163
Adobe,
Inc.
(a)
40,000
20,711,200
Roper
Technologies,
Inc.
35,000
19,475,400
a
IT
Consulting
&
Other
Services
5.4
Accenture
plc
-
Class
A
(b)
90,000
31,813,200
Gartner,
Inc.
(a)
40,000
20,270,400
a
Semiconductor
Materials
&
Equipment
4.7
Analog
Devices,
Inc.
117,500
27,044,975
Microchip
Technology,
Inc.
225,000
18,065,250
a
Systems
Software
3.3
Oracle
Corp.
187,500
31,950,000
a
22.9
219,733,038
Communication
Services
Interactive
Media
&
Services
8.8
Meta
Platforms,
Inc.
-
Class
A
75,000
42,933,000
Alphabet,
Inc.
-
Class
C
245,000
40,961,550
a
Cable
&
Satellite
3.7
Charter
Communications,
Inc.
-
Class
A
(a)
110,000
35,648,800
a
12.5
119,543,350
Health
Care
Life
Sciences
Tools
&
Services
9.8
Danaher
Corp.
170,000
47,263,400
Thermo
Fisher
Scientific,
Inc.
75,000
46,392,750
a
Health
Care
Services
1.7
Labcorp
Holdings,
Inc.
75,000
16,761,000
a
11.5
110,417,150
a
Industrials
%
of
Net
Assets
Shares
$
Value
Research
&
Consulting
Services
3.7
Equifax,
Inc.
120,000
35,263,200
a
Industrial
Machinery
&
Supplies
&
Components
2.5
IDEX
Corp.
112,250
24,077,625
a
Environmental
&
Facilities
Services
2.2
Veralto
Corp.
190,000
21,253,400
a
Cargo
Ground
Transportation
2.2
Old
Dominion
Freight
Line,
Inc.
105,000
20,857,200
a
10.6
101,451,425
Consumer
Discretionary
Broadline
Retail
3.2
Amazon.com,
Inc.
(a)
167,500
31,210,275
a
Automotive
Retail
2.9
CarMax,
Inc.
(a)
360,000
27,856,800
a
6.1
59,067,075
Real
Estate
Real
Estate
Services
3.4
CoStar
Group,
Inc.
(a)
435,000
32,816,400
Materials
Construction
Materials
2.6
Vulcan
Materials
Co.
100,000
25,043,000
a
Total
Common
Stocks
(Cost
$463,407,564)
944,217,178
Cash
Equivalents
-
1.7%
a
a
$
Principal
Amount
$
Value
a
a
a
a
a
JPMorgan
U.S.
Government
Money
Market
Fund
-
Institutional
Class
4.77
%
(Cost
$16,731,095)
(c)
16,731,095
16,731,095
a
Total
Investments
in
Securities
-
100.1%
(Cost
$480,138,659)
960,948,273
Other
Liabilities
in
Excess
of
Other
Assets
- (0.1%)
(1,239,223)
Net
Assets
-
100%
959,709,050
Net
Asset
Value
Per
Share
-
Investor
Class
58.43
Net
Asset
Value
Per
Share
-
Institutional
Class
60.14
(a)
Non-income
producing.
(b)
Foreign
domiciled
entity.
(c)
Rate
presented
represents
the
7
day
average
yield
at
September
30,
2024.
Multi
Cap
Equity
Fund
Schedule
of
Investments
(Unaudited)
September
30,
2024
The
accompanying
notes
form
an
integral
part
of
these
financial
statements.
Common
Stocks
-
95.5%
a
Communication
Services
%
of
Net
Assets
Shares
$
Value
Interactive
Media
&
Services
11.7
Meta
Platforms,
Inc.
-
Class
A
64,000
36,636,160
Alphabet,
Inc.
-
Class
C
195,000
32,602,050
a
Cable
&
Satellite
5.3
Liberty
Broadband
Corp.
(a)
Class
C
200,000
15,458,000
Class
A
100,000
7,682,000
Charter
Communications,
Inc.
-
Class
A
(a)
25,000
8,102,000
a
Alternative
Carriers
2.5
Liberty
Global,
Ltd.
-
Class
C
(a)
(b)
695,000
15,018,950
a
Integrated
Telecommunication
Services
0.8
LICT
Corp.
(a)
381
5,067,304
a
20.3
120,566,464
Financials
Transaction
&
Payment
Processing
Services
8.5
Visa,
Inc.
-
Class
A
92,500
25,432,875
Mastercard,
Inc.
-
Class
A
50,000
24,690,000
a
Multi-Sector
Holdings
7.0
Berkshire
Hathaway,
Inc.
-
Class
B
(a)
90,000
41,423,400
a
Insurance
Brokers
3.9
Aon
plc
-
Class
A
67,500
23,354,325
a
19.4
114,900,600
Information
Technology
Application
Software
5.9
ACI
Worldwide,
Inc.
(a)
350,000
17,815,000
Guidewire
Software,
Inc.
(a)
95,000
17,379,300
a
Semiconductor
Materials
&
Equipment
3.0
Texas
Instruments,
Inc.
85,000
17,558,450
a
Communications
Equipment
2.8
Sirius
XM
Holdings,
Inc.
(a)
700,001
16,555,012
a
IT
Consulting
&
Other
Services
2.0
Gartner,
Inc.
(a)
24,000
12,162,240
a
Internet
Services
&
Infrastructure
2.0
VeriSign,
Inc.
(a)
62,000
11,777,520
a
15.7
93,247,522
Industrials
Aerospace
&
Defense
5.5
HEICO
Corp.
-
Class
A
160,000
32,601,600
a
Industrial
Machinery
&
Supplies
&
Components
2.9
IDEX
Corp.
80,000
17,160,000
a
Research
&
Consulting
Services
2.7
Equifax,
Inc.
55,000
16,162,300
a
Industrials
%
of
Net
Assets
Shares
$
Value
a
Cargo
Ground
Transportation
2.2
Old
Dominion
Freight
Line,
Inc.
65,000
12,911,600
a
Environmental
&
Facilities
Services
1.3
Veralto
Corp.
70,000
7,830,200
a
14.6
86,665,700
Materials
Construction
Materials
5.8
Vulcan
Materials
Co.
70,000
17,530,100
Martin
Marietta
Materials,
Inc.
31,200
16,793,400
a
Specialty
Chemicals
2.9
Perimeter
Solutions
SA
(a)
(b)
1,306,931
17,578,222
a
8.7
51,901,722
Health
Care
Life
Sciences
Tools
&
Services
3.5
Danaher
Corp.
75,000
20,851,500
a
Health
Care
Services
3.1
Labcorp
Holdings,
Inc.
82,000
18,325,360
a
6.6
39,176,860
Consumer
Discretionary
Automotive
Retail
3.4
CarMax,
Inc.
(a)
260,000
20,118,800
a
Distributors
3.0
LKQ
Corp.
450,000
17,964,000
a
6.4
38,082,800
Real
Estate
Real
Estate
Services
3.8
CoStar
Group,
Inc.
(a)
300,000
22,632,000
a
Total
Common
Stocks
(Cost
$233,507,329)
567,173,668
Warrants
-
0.0%
a
Perimeter
Solutions
SA
Expires
11/8/24
(Cost
$5,000)
(a)
(b)
(c)
500,000
90,625
Cash
Equivalents
-
4.6%
a
a
$
Principal
Amount
$
Value
a
a
a
a
a
U.S.
Treasury
Bills,
4.18%
to
4.58%,
10/10/24
to
11/7/24
(d)
17,000,000
16,954,728
The
accompanying
notes
form
an
integral
part
of
these
financial
statements.
Multi
Cap
Equity
Fund
(Continued)
Schedule
of
Investments
(Unaudited)
September
30,
2024
a
a
$
Principal
Amount
$
Value
a
a
a
a
a
JPMorgan
U.S.
Government
Money
Market
Fund
-
Institutional
Class
4.77%
(e)
10,247,261
10,247,261
a
Total
Cash
Equivalents
(Cost
$27,197,851)
27,201,989
Total
Investments
in
Securities
-
100.1%
(Cost
$260,710,180)
594,466,282
Other
Liabilities
in
Excess
of
Other
Assets
- (0.1%)
(489,397)
Net
Assets
-
100%
593,976,885
Net
Asset
Value
Per
Share
-
Investor
Class
34.87
Net
Asset
Value
Per
Share
-
Institutional
Class
35.94
(a)
Non-income
producing.
(b)
Foreign
domiciled
entity.
(c)
This
security
is
classified
as
Level
3
within
the
fair
value
hierarchy.
(d)
Interest
rates
presented
represent
the
effective
yield
at
September
30,
2024.
(e)
Rate
presented
represents
the
7
day
average
yield
at
September
30,
2024.
Nebraska
Tax
Free
Income
Fund
Schedule
of
Investments
(Unaudited)
September
30,
2024
The
accompanying
notes
form
an
integral
part
of
these
financial
statements.
Municipal
Bonds
-
94
.3
%
a
a
%
of
Net
Assets
$
Principal
Amount
$
Value
a
a
a
a
a
California
0.9
San
Diego
County
Regional
Airport
Authority
Revenue
Series
B
5%
7/1/25
200,000
202,514
a
Florida
0.9
State
of
Florida
General
Obligation
4%
6/1/36
200,000
200,773
a
Nebraska
87.5
Ashland-Greenwood
Public
Schools
General
Obligation
3%
12/15/42
100,000
84,312
Cass
County
School
District
No.
22
General
Obligation
2.05%
12/15/25
375,000
369,846
2.2%
12/15/26
250,000
245,879
City
of
Bellevue
NE
General
Obligation
Series
A
3%
9/15/32
500,000
498,514
City
of
Blair
NE
General
Obligation
5%
6/15/34
360,000
384,272
City
of
Blair
NE
Water
System
Revenue
2.65%
12/15/24
100,000
99,636
2.85%
12/15/25
100,000
98,846
3%
12/15/26
100,000
98,396
3.1%
12/15/27
100,000
97,686
3.2%
12/15/28
100,000
97,255
City
of
Columbus
NE
Combined
Utilities
System
Revenue
4%
6/15/33
200,000
208,394
AGC,
4%
12/15/26
100,000
103,248
4%
12/15/27
100,000
103,176
City
of
Columbus
NE
General
Obligation
3%
12/15/29
150,000
150,346
3%
12/15/30
150,000
149,716
City
of
Grand
Island
NE
Combined
Utility
System
Revenue
Series
A
AGC,
4%
8/15/35
205,000
212,899
4%
8/15/36
125,000
129,064
City
of
Grand
Island
NE
General
Obligation
3%
11/15/27
150,000
150,514
3%
11/15/30
150,000
150,024
City
of
Gretna
NE
Certificates
of
Participation
4%
12/15/25
500,000
500,956
City
of
Kearney
NE
General
Obligation
4%
5/15/34
220,000
222,674
City
of
Lincoln
NE
Electric
System
Revenue
3%
9/1/28
30,000
30,092
City
of
Norfolk
NE
General
Obligation
3.38%
5/15/34
500,000
501,002
City
of
Omaha
NE
General
Obligation
Series
A
3%
4/15/35
100,000
96,437
Series
A
Class
A
–
3%
4/15/34
100,000
97,743
City
of
Omaha
NE
Riverfront
Redevelopment
Special
Tax
Revenue
Series
A
4%
1/15/33
260,000
270,687
City
of
Omaha
NE
Sewer
Revenue
5%
4/1/26
250,000
259,012
4%
4/1/31
350,000
354,771
Series
A
4%
4/1/34
100,000
104,601
County
of
Saline
NE
Revenue
3%
2/15/31
200,000
196,883
County
of
Sarpy
NE
Certificates
of
Participation
1.75%
6/15/26
500,000
488,811
County
of
Seward
NE
General
Obligation
3%
12/15/30
605,000
604,979
Cozad
City
School
District
General
Obligation
4%
6/15/26
250,000
255,147
Dawson
County
Public
Power
District
Revenue
Series
A
a
a
%
of
Net
Assets
$
Principal
Amount
$
Value
a
a
a
a
a
2%
6/15/26
170,000
166,222
2.1%
6/15/27
105,000
101,770
Series
B
2.5%
6/15/28
135,000
131,220
3%
6/15/29
245,000
243,678
3%
6/15/30
355,000
347,237
Dodge
County
School
District
No.
595
General
Obligation
1.9%
6/15/32
200,000
176,822
Douglas
County
Hospital
Authority
No.
2
Revenue
5%
5/15/26
500,000
500,411
5%
5/15/30
140,000
145,405
4%
5/15/32
700,000
705,937
Douglas
County
Hospital
Authority
No.
3
Revenue
5%
11/1/26
250,000
255,138
Douglas
County
School
District
No.
59
NE
General
Obligation
3%
12/15/32
100,000
98,065
Lincoln
Airport
Authority
Revenue
5%
7/1/27
150,000
157,322
Madison
County
Hospital
Authority
No.
1
Revenue
5%
7/1/35
140,000
140,172
Metropolitan
Utilities
District
of
Omaha
Gas
System
Revenue
4%
12/1/27
450,000
451,143
Municipal
Energy
Agency
of
Nebraska
Revenue
5%
4/1/27
350,000
366,796
5%
4/1/28
225,000
235,798
Nebraska
Cooperative
Republican
Platte
Enhancement
Project
Revenue
Series
A
2%
12/15/29
250,000
232,167
Nebraska
Educational
Health
Cultural
&
Social
Services
Finance
Authority
Revenue
4%
1/1/34
110,000
110,941
Nebraska
Investment
Finance
Authority
Revenue
4.45%
9/1/43
180,000
183,663
Series
B
1.35%
9/1/26
200,000
190,879
Series
C
GNMA,
2%
9/1/35
325,000
266,772
Nebraska
Public
Power
District
Revenue
Series
C
5%
1/1/32
65,000
66,511
Nebraska
State
College
Facilities
Corp.
Revenue
AGC,
4%
7/15/28
250,000
256,527
Omaha
Public
Facilities
Corp.
Revenue
4%
6/1/28
85,000
87,011
Series
A
4%
6/1/31
155,000
163,917
Series
C
4%
4/1/33
340,000
354,066
4%
4/1/39
500,000
503,752
Omaha
Public
Power
District
Revenue
Series
A
2.85%
2/1/27
500,000
499,997
Series
C
5%
2/1/39
150,000
151,027
Omaha
School
District
General
Obligation
5%
12/15/28
130,000
130,578
5%
12/15/29
350,000
367,688
5%
12/15/31
135,000
141,437
Papillion
Municipal
Facilities
Corp.
Revenue
2%
12/15/32
100,000
88,624
2%
12/15/34
200,000
171,622
Papillion-La
Vista
School
District
No.
27
General
Obligation
Series
A
2.05%
12/1/24
150,000
149,435
2.2%
12/1/25
150,000
148,365
2.3%
12/1/26
275,000
274,266
The
accompanying
notes
form
an
integral
part
of
these
financial
statements.
Nebraska
Tax
Free
Income
Fund
(Continued)
Schedule
of
Investments
(Unaudited)
September
30,
2024
a
a
%
of
Net
Assets
$
Principal
Amount
$
Value
a
a
a
a
a
Series
B
4%
12/1/35
400,000
420,025
Public
Power
Generation
Agency
Revenue
5%
1/1/28
500,000
502,049
5%
1/1/32
140,000
144,779
State
of
Nebraska
Certificates
of
Participation
3%
2/1/26
60,000
60,158
Series
A
2%
4/1/26
150,000
147,534
University
of
Nebraska
Facilities
Corp.
(The)
Revenue
5%
7/15/29
380,000
395,408
University
of
Nebraska
Revenue
PRE-REFUNDED/ESCROWED
TO
MATURITY,
3%
7/1/25
100,000
100,114
2.5%
7/1/26
210,000
210,007
3%
7/1/27
100,000
101,545
5%
5/15/30
100,000
107,745
Upper
Republican
Natural
Resource
District
Revenue
AGC,
4%
12/15/25
245,000
245,264
4%
12/15/27
395,000
395,474
Village
of
Boys
Town
NE
Revenue
3%
9/1/28
700,000
706,922
3%
7/1/35
325,000
316,655
Winside
Public
Schools
General
Obligation
2%
6/15/31
350,000
311,386
a
20,343,264
a
New
Mexico
1.6
New
Mexico
Finance
Authority
Revenue
Series
C
4%
6/1/34
365,000
369,107
a
Texas
1.6
City
of
Austin
Tx
Airport
System
Revenue
Series
B
5%
11/15/26
250,000
260,065
City
of
Austin
Tx
Electric
Utility
Revenue
Series
A
5%
11/15/35
100,000
111,136
a
371,201
a
Utah
0.5
City
of
Salt
Lake
City
UT
Public
Utilities
Revenue
5%
2/1/35
100,000
109,063
a
Washington
1.3
Pierce
County
School
District
No.
10
Tacoma
General
Obligation
Series
B
AMBAC,
4%
12/1/35
100,000
105,085
Port
of
Seattle
WA
Revenue
Series
C
5%
5/1/26
200,000
205,761
a
310,846
a
Total
Municipal
Bonds
(Cost
$22,513,687)
21,906,768
Cash
Equivalents
-
4
.7
%
a
a
$
Principal
Amount
$
Value
a
a
a
a
a
JPMorgan
U.S.
Government
Money
Market
Fund
-
Institutional
Class
4.77%
(Cost
$1,100,823)
(a)
1,100,824
1,100,824
a
Total
Investments
in
Securities
-
99.0%
(Cost
$23,614,510)
23,007,592
Other
Assets
Less
Other
Liabilities
- 1.0%
231,129
Net
Assets
-
100%
23,238,721
Net
Asset
Value
Per
Share
-
Investor
Class
9.71
(a)
Rate
presented
represents
the
7
day
average
yield
at
September
30,
2024.
Partners
III
Opportunity
Fund
Schedule
of
Investments
(Unaudited)
September
30,
2024
The
accompanying
notes
form
an
integral
part
of
these
financial
statements.
Common
Stocks
-
92.8%
a
Financials
%
of
Net
Assets
Shares
$
Value
Transaction
&
Payment
Processing
Services
15.9
Mastercard,
Inc.
-
Class
A
45,000
22,221,000
Visa,
Inc.
-
Class
A
75,000
20,621,250
Global
Payments,
Inc.
180,000
18,435,600
Fidelity
National
Information
Services,
Inc.
100,000
8,375,000
a
Multi-Sector
Holdings
11.3
Berkshire
Hathaway,
Inc.
-
Class
B
(a)(b)
108,000
49,708,080
a
Insurance
Brokers
4.0
Aon
plc
-
Class
A
50,000
17,299,500
a
31.2
136,660,430
Communication
Services
Interactive
Media
&
Services
7.5
Alphabet,
Inc.
-
Class
C
105,000
17,554,950
Meta
Platforms,
Inc.
-
Class
A
27,000
15,455,880
a
Cable
&
Satellite
6.4
Liberty
Broadband
Corp.
(a)
Class
C
325,000
25,119,250
Class
A
40,000
3,072,800
a
Alternative
Carriers
3.2
Liberty
Global,
Ltd.
-
Class
C
(a)
(c)
640,000
13,830,400
a
17.1
75,033,280
Information
Technology
Application
Software
4.9
Roper
Technologies,
Inc.
25,000
13,911,000
CoreCard
Corp.
†
(a)
515,000
7,477,800
a
Semiconductor
Materials
&
Equipment
3.3
Texas
Instruments,
Inc.
70,000
14,459,900
a
Communications
Equipment
3.0
Sirius
XM
Holdings,
Inc.
(a)
550,000
13,007,500
a
Systems
Software
2.9
Microsoft
Corp.
30,000
12,909,000
a
14.1
61,765,200
Health
Care
Life
Sciences
Tools
&
Services
10.0
Danaher
Corp.
80,000
22,241,600
Thermo
Fisher
Scientific,
Inc.
35,000
21,649,950
a
Health
Care
Services
3.1
Labcorp
Holdings,
Inc.
60,000
13,408,800
a
13.1
57,300,350
Consumer
Discretionary
Automotive
Retail
3.9
CarMax,
Inc.
(a)
220,000
17,023,600
a
Consumer
Discretionary
%
of
Net
Assets
Shares
$
Value
a
Broadline
Retail
3.6
Amazon.com,
Inc.
(a)(b)
85,000
15,838,050
a
7.5
32,861,650
Industrials
Industrial
Machinery
&
Supplies
&
Components
3.4
IDEX
Corp.
70,000
15,015,000
a
Cargo
Ground
Transportation
0.9
Old
Dominion
Freight
Line,
Inc.
20,000
3,972,800
a
4.3
18,987,800
Materials
Specialty
Chemicals
3.1
Perimeter
Solutions
SA
(a)
(c)
1,006,930
13,543,208
Real
Estate
Real
Estate
Services
2.4
CoStar
Group,
Inc.
(a)
140,000
10,561,600
a
Total
Common
Stocks
(Cost
$201,462,269)
406,713,518
Warrants
-
0.1%
a
Perimeter
Solutions
SA
Expires
11/8/24
(Cost
$15,000)
(a)
(c)
(d)
1,500,000
271,875
Cash
Equivalents
-
9.5%
a
a
$
Principal
Amount
$
Value
a
a
a
a
a
U.S.
Treasury
Bills,
4.18%
to
4.63%,
10/10/24
to
11/26/24
(e)
23,000,000
22,901,267
JPMorgan
U.S.
Government
Money
Market
Fund
-
Institutional
Class
4.77%
(f)
18,769,272
18,769,272
Northern
U.S.
Government
Select
Money
Market
Fund
4.66%
(f)
154,233
154,233
a
Total
Cash
Equivalents
(Cost
$41,823,156)
41,824,772
Total
Investments
in
Securities
-
102.4%
(Cost
$243,300,425)
448,810,165
Due
from
Broker
-
4.6%
20,030,500
Securities
Sold
Short
-
(4.6)%
(20,081,600)
Options
Written
-
(0.0)%
(70,560)
Other
Assets
Less
Other
Liabilities
- (2.4%)
(10,398,547)
Net
Assets
-
100%
438,289,958
Net
Asset
Value
Per
Share
-
Investor
Class
12.67
Net
Asset
Value
Per
Share
-
Institutional
Class
13.99
The
accompanying
notes
form
an
integral
part
of
these
financial
statements.
Partners
III
Opportunity
Fund
(Continued)
Schedule
of
Investments
(Unaudited)
September
30,
2024
Securities
Sold
Short
-
(4.6)%
Shares
$
Value
a
SPDR
S&P
500
ETF
Trust
35,000
(20,081,600)
Total
Securities
Sold
Short
(proceeds
$7,361,008)
(20,081,600)
Options
Written-
(0.0)%
$
Notional
Shares
subject
to
option
$
Value
Covered
Call
Options
Old
Dominion
Freight
Call
Option
November
2024
/
$210
2,352,000
11,200
(70,560)
Total
Options
Written
(premiums
received
$80,182)
(70,560)
†
Non-controlled
affiliate.
(a)
Non-income
producing.
(b)
Fully
or
partially
pledged
as
collateral
on
securities
sold
short
and
outstanding
written
options.
(c)
Foreign
domiciled
entity.
(d)
This
security
is
classified
as
Level
3
within
the
fair
value
hierarchy.
(e)
Interest
rates
presented
represent
the
effective
yield
at
September
30,
2024.
(f)
Rate
presented
represents
the
7
day
average
yield
at
September
30,
2024.
Short
Duration
Income
Fund
Schedule
of
Investments
(Unaudited)
September
30,
2024
The
accompanying
notes
form
an
integral
part
of
these
financial
statements.
Corporate
Bonds
-
7.7%
a
a
a
$
Principal
Amount
$
Value
a
a
a
a
a
Agree,
LP
2%
6/15/28
2,239,000
2,046,727
American
Airlines
Group,
Inc.
3.75%
3/1/25
(a)
750,000
742,982
American
Airlines,
Inc./AAdvantage
Loyalty
IP
Ltd.
5.5%
4/20/26
(a)
(b)
1,210,417
1,207,956
Ares
Capital
Corp.
7%
1/15/27
1,000,000
1,041,206
Ashtead
Capital,
Inc.
1.5%
8/12/26
(a)
4,800,000
4,537,727
4.38%
8/15/27
(a)
3,000,000
2,978,287
Bath
&
Body
Works,
Inc.
9.38%
7/1/25
(a)
1,000,000
1,029,150
6.69%
1/15/27
945,000
976,768
Blackstone
Secured
Lending
Fund
5.88%
11/15/27
250,000
254,300
Boardwalk
Pipelines
LP
4.95%
12/15/24
2,580,000
2,577,145
Boeing
Co.
6.26%
5/1/27
(a)
2,500,000
2,582,792
Cantor
Fitzgerald
LP
4.5%
4/14/27
(a)
1,500,000
1,486,404
Carlisle
Cos.,
Inc.
3.5%
12/1/24
500,000
498,673
Concentrix
Corp.
6.65%
8/2/26
2,910,000
2,991,202
Delta
Air
Lines,
Inc./SkyMiles
IP
Ltd.
4.5%
10/20/25
(a)
(b)
1,248,750
1,241,354
Devon
Energy
Corp.
5.25%
10/15/27
390,000
391,899
Energy
Transfer
LP
5.63%
5/1/27
(a)
610,000
612,558
EPR
Properties
4.75%
12/15/26
4,869,000
4,851,670
4.5%
6/1/27
1,000,000
985,678
Expedia
Group,
Inc.
6.25%
5/1/25
(a)
1,672,000
1,676,469
FS
KKR
Capital
Corp.
1.65%
10/12/24
6,000,000
5,990,210
Gartner,
Inc.
4.5%
7/1/28
(a)
1,200,000
1,188,738
Hercules
Capital,
Inc.
2.63%
9/16/26
1,500,000
1,418,333
Highwoods
Realty
LP
3.88%
3/1/27
750,000
733,620
Kite
Realty
Group
Trust
4%
3/15/25
2,083,000
2,071,998
Mileage
Plus
Holdings
LLC/Mileage
Plus
Intellectual
Property
Assets
Ltd.
6.5%
6/20/27
(a)
1,372,200
1,390,291
MPLX
LP
4.88%
6/1/25
1,961,000
1,959,601
Penske
Truck
Leasing
Co.
Lp
/
PTL
Finance
Corp.
5.35%
3/30/29
(a)
6,000,000
6,199,459
Retail
Opportunity
Investments
Partnership
LP
6.75%
10/15/28
3,500,000
3,757,244
Starwood
Property
Trust,
Inc.
4.75%
3/15/25
1,765,000
1,757,860
Synchrony
Bank
5.4%
8/22/25
1,000,000
1,002,373
VICI
Properties
LP/VICI
Note
Co.,
Inc.
3.5%
2/15/25
(a)
6,323,000
6,279,621
a
a
a
$
Principal
Amount
$
Value
a
a
a
a
a
4.63%
6/15/25
(a)
3,100,000
3,083,538
Vontier
Corp.
1.8%
4/1/26
1,004,000
962,101
a
Total
Corporate
Bonds
(Cost
$71,505,925)
72,505,934
Corporate
Convertible
Bonds
-
0.3%
a
a
a
a
a
Redwood
Trust,
Inc.
5.75%
10/1/25
(Cost
$3,000,000)
3,000,000
2,955,000
Asset-Backed
Securities
-
37.2%
a
a
a
a
a
Automobile
ACM
Auto
Trust
(ACMAT)
Series
2023-2A
Class
A
–7.97%
6/20/30
(a)
1,688,265
1,698,945
Series
2023-2A
Class
B
–9.85%
6/20/30
(a)
3,000,000
3,089,419
Series
2024-1A
Class
A
–7.71%
1/21/31
(a)
451,847
454,779
AmeriCredit
Automobile
Receivables
Trust
(AMCAR)
Series
2020-2
Class
D
–2.13%
3/18/26
1,320,000
1,318,014
Series
2020-3
Class
D
–1.49%
9/18/26
3,000,000
2,942,042
ARI
Fleet
Lease
Trust
(ARIFL)
Series
2022-A
Class
A2
–3.12%
1/15/31
(a)
66,058
65,970
Series
2023-B
Class
A2
–6.05%
7/15/32
(a)
2,540,610
2,570,516
Series
2024-A
Class
A2
–5.3%
11/15/32
(a)
1,165,000
1,173,720
Series
2024-B
Class
A2
–5.54%
4/15/33
(a)
1,530,000
1,548,596
Arivo
Acceptance
Auto
Loan
Receivables
Trust
(ARIVO)
Series
2022-1A
Class
A
–4.01%
5/15/28
(a)
1,159,212
1,151,694
Avid
Automobile
Receivables
Trust
(AVID)
Series
2023-1
Class
A
–6.63%
7/15/26
(a)
113,150
113,199
Bayview
Opportunity
Master
Fund
VII
Trust
(BVABS)
Series
2024-CAR1
Class
A
–6.38%
12/26/31
Floating
Rate
(SOFR30A
+
110)
(a)
(c)
2,404,992
2,409,839
Series
2024-CAR1
Class
B
–6.58%
12/26/31
Floating
Rate
(SOFR30A
+
130)
(a)
(c)
1,402,912
1,404,402
Series
2024-CAR1F
Class
A
–6.97%
7/29/32
(a)
1,767,483
1,774,529
BOF
URSA
VI
Funding
Trust
I
(BVABS)
Series
2023-CAR1
Class
A2
–5.54%
10/27/31
(a)
268,801
270,308
Series
2023-CAR2
Class
A2
–5.54%
10/27/31
(a)
623,903
627,398
BOF
VII
AL
Funding
Trust
I
(BVABS)
Series
2023-CAR3
Class
A2
–6.29%
7/26/32
(a)
2,854,439
2,908,803
CFMT
LLC
(CFMT)
Series
2021-AL1
Class
B
–1.39%
9/22/31
(a)
1,004,224
981,732
Chesapeake
Funding
II
LLC
(CFII)
Series
2021-1A
Class
A1
–0.47%
4/15/33
(a)
172,094
171,252
Series
2023-1A
Class
A1
–5.65%
5/15/35
(a)
1,623,297
1,637,851
Series
2023-2A
Class
A1
–6.16%
10/15/35
(a)
1,030,139
1,047,841
Series
S2-1A
Class
A1
–5.52%
5/15/36
(a)
2,617,841
2,649,941
Enterprise
Fleet
Financing
LLC
(EFF)
Series
2023-1
Class
A2
–5.51%
1/22/29
(a)
479,646
482,324
Series
2023-2
Class
A2
–5.56%
4/22/30
(a)
3,315,507
3,348,316
Series
2023-3
Class
A2
–6.4%
3/20/30
(a)
2,943,105
3,009,418
Series
2024-1
Class
A2
–5.23%
3/20/30
(a)
1,820,000
1,838,173
Series
2024-2
Class
A3
–5.61%
4/20/28
(a)
2,700,000
2,781,295
Series
24-3
Class
A3
–4.98%
8/21/28
(a)
1,870,000
1,904,935
Exeter
Automobile
Receivables
Trust
(EART)
Series
2020-1A
Class
D
–2.73%
12/15/25
(a)
183,532
183,372
Series
2021-1A
Class
D
–1.08%
11/16/26
631,308
621,821
First
Help
Financial
Trust
(FHF)
Series
2022-1A
Class
A
–4.43%
1/18/28
(a)
1,281,317
1,277,171
Series
2022-2A
Class
A
–6.14%
12/15/27
(a)
321,906
323,995
The
accompanying
notes
form
an
integral
part
of
these
financial
statements.
Short
Duration
Income
Fund
(Continued)
Schedule
of
Investments
(Unaudited)
September
30,
2024
a
a
a
$
Principal
Amount
$
Value
a
a
a
a
a
Series
2023-1A
Class
A2
–6.57%
6/15/28
(a)
1,128,973
1,145,612
Series
2023-2A
Class
A2
–6.79%
10/15/29
(a)
1,305,015
1,332,907
Series
2024-2A
Class
A2
–5.89%
6/15/30
(a)
3,000,000
3,053,462
First
Investors
Auto
Owner
Trust
(FIAOT)
Series
2022-1A
Class
A
–2.03%
1/15/27
(a)
256,512
255,035
Foursight
Capital
Automobile
Receivables
Trust
(FCRT)
Series
2023-1
Class
A2
–5.43%
10/15/26
(a)
221,546
221,578
JPMorgan
Chase
Auto
Credit
Linked
Note
(CACLN)
Series
2021-2
Class
A4
–0.89%
12/26/28
(a)
96,401
95,977
LAD
Auto
Receivables
Trust
(LADAR)
Series
2022-1A
Class
A
–5.21%
6/15/27
(a)
1,338,191
1,340,360
Series
2023-1A
Class
A2
–5.68%
10/15/26
(a)
621,849
622,396
Series
2023-1A
Class
B
–5.59%
8/16/27
(a)
2,500,000
2,520,228
Series
2023-2A
Class
A2
–5.93%
6/15/27
(a)
739,046
741,275
Series
2023-4A
Class
A3
–6.1%
12/15/27
(a)
3,625,000
3,667,112
Lendbuzz
Securitization
Trust
(LBZZ)
Series
2023-1A
Class
A2
–6.92%
8/15/28
(a)
3,964,070
4,038,451
Series
2023-3A
Class
A2
–7.5%
12/15/28
(a)
6,093,904
6,249,400
Series
2024-1A
Class
A2
–6.19%
8/15/29
(a)
2,262,925
2,288,995
Series
2024-2A
Class
A2
–5.99%
5/15/29
(a)
5,875,000
5,950,120
Series
24-3A
Class
A2
–4.97%
10/15/29
(a)
2,250,000
2,254,180
Lobel
Automobile
Receivables
Trust
(LOBEL)
Series
2023-2
Class
A
–7.59%
4/16/29
(a)
467,614
472,884
Merchants
Fleet
Funding
LLC
(MFF)
Series
2023-1A
Class
A
–7.21%
5/20/36
(a)
7,352,587
7,445,883
OneMain
Direct
Auto
Receivables
Trust
(ODART)
Series
2021-1A
Class
A
–0.87%
7/14/28
(a)
1,024,091
1,004,336
Series
2022-1A
Class
C
–1.42%
7/14/28
(a)
4,100,000
3,920,376
Prestige
Auto
Receivables
Trust
(PART)
Series
2022-1A
Class
B
–6.55%
7/17/28
(a)
2,681,827
2,689,726
Research-Driven
Pagaya
Motor
Asset
Trust
(RPM)
Series
2023-3A
Class
A
–7.13%
1/26/32
(a)
3,679,064
3,721,967
Series
2023-4A
Class
A
–7.54%
3/25/32
(a)
4,086,942
4,154,442
SAFCO
Auto
Receivables
Trust
(SAFCO)
Series
2024-1A
Class
A
–6.51%
3/20/28
(a)
2,641,328
2,659,590
Santander
Bank
NA
(SBCLN)
Series
2021-1A
Class
B
–1.83%
12/15/31
(a)
149,036
148,509
SFS
Auto
Receivables
Securitization
Trust
(SFAST)
Series
2023-1A
Class
A2A
–5.89%
3/22/27
(a)
708,982
711,208
Tricolor
Auto
Securitization
Trust
(TAST)
Series
2023-1A
Class
A
–6.48%
8/17/26
(a)
110,562
110,601
United
Auto
Credit
Securitization
Trust
(UACST)
Series
2024-1
Class
A
–6.17%
8/10/26
(a)
1,639,477
1,643,298
Series
2024-1
Class
B
–6.57%
6/10/27
(a)
6,000,000
6,078,912
Wheels
Fleet
Lease
Funding
LLC
(WFLF)
Series
2023-2A
Class
A
–6.46%
8/18/38
(a)
6,151,604
6,226,678
Series
2024-1A
Class
A1
–5.49%
2/18/39
(a)
4,500,000
4,570,016
Series
24-2A
Class
A1
–4.87%
6/21/39
(a)
6,300,000
6,360,587
a
135,477,711
a
Collateralized
Loan
Obligations
ABPCI
Direct
Lending
Fund
CLO
I
LLC
(ABPCI)
Series
2016-1A
Class
A1A2
–7.24%
7/20/33
Floating
Rate
(TSFR3M
+
196)
(a)
(b)
(c)
2,000,000
2,005,409
Audax
Senior
Debt
CLO
6
LLC
(AUDAX)
Series
2021-6A
Class
A1
–7.04%
10/20/33
Floating
Rate
(TSFR3M
+
176)
(a)
(c)
6,000,000
6,004,352
AUF
Funding
LLC
(ANTF)
Series
2022-1A
Class
B1
–9.03%
1/20/31
Floating
Rate
(TSFR3M
+
375)
(a)
(c)
2,500,000
2,513,707
a
a
a
$
Principal
Amount
$
Value
a
a
a
a
a
BlackRock
Elbert
CLO
V
LLC
(ELB)
Series
5A
Class
AR
–6.8%
6/15/34
Floating
Rate
(TSFR3M
+
185)
(a)
(c)
1,999,501
2,002,412
BlackRock
Rainier
CLO
VI
Ltd.
(BLKMM)
Series
2021-6A
Class
A
–7.24%
4/20/33
Floating
Rate
(TSFR3M
+
196)
(a)
(b)
(c)
5,500,000
5,505,833
Brightwood
Capital
MM
CLO
Ltd.
(BWCAP)
Series
2020-1A
Class
A1R
–8.1%
1/15/31
Floating
Rate
(TSFR3M
+
280)
(a)
(b)
(c)
940,035
942,926
Cerberus
Loan
Funding
LP
(CERB)
Series
2021-2A
Class
A
–7.18%
4/22/33
Floating
Rate
(TSFR3M
+
188)
(a)
(b)
(c)
3,000,000
3,002,649
Cerberus
Loan
Funding
XLII
LLC
(CERB)
Series
2023-4A
Class
A
–7.73%
10/15/35
Floating
Rate
(TSFR3M
+
243)
(a)
(c)
3,000,000
3,077,772
Churchill
Middle
Market
CLO
III
Ltd.
(CHMML)
Series
2021-1A
Class
A1
–7.04%
10/24/33
Floating
Rate
(TSFR3M
+
176)
(a)
(b)
(c)
2,750,000
2,752,016
CIFC-LBC
Middle
Market
CLO
(CLBC)
Series
2023-1A
Class
A1
–7.88%
10/20/35
Floating
Rate
(TSFR3M
+
260)
(a)
(c)
5,000,000
5,059,976
Deerpath
Capital
CLO
Ltd.
(DPATH)
Series
2021-2A
Class
A1
–7.16%
1/15/34
Floating
Rate
(TSFR3M
+
186)
(a)
(b)
(c)
4,000,000
4,003,416
Series
2023-1A
Class
A1
–8.1%
4/15/35
Floating
Rate
(TSFR3M
+
280)
(a)
(b)
(c)
3,000,000
3,026,224
Fortress
Credit
Opportunities
IX
CLO
Ltd.
(FCO)
Series
2017-9A
Class
A1TR
–7.11%
10/15/33
Floating
Rate
(TSFR3M
+
181)
(a)
(b)
(c)
1,500,000
1,500,490
Fortress
Credit
Opportunities
XV
CLO
Ltd.
(FCO)
Series
2021-15A
Class
A2
–7.1%
4/25/33
Floating
Rate
(TSFR3M
+
181)
(a)
(b)
(c)
3,500,000
3,501,123
Golub
Capital
Partners
CLO
31M
Ltd.
(GOCAP)
Series
2016-31A
Class
CR
–8.4%
8/5/30
Floating
Rate
(TSFR3M
+
316)
(a)
(b)
(c)
1,000,000
1,000,000
Golub
Capital
Partners
CLO
54M
LP
(GOCAP)
Series
2021-54A
Class
A2
–7.03%
8/5/33
Floating
Rate
(TSFR3M
+
179)
(a)
(b)
(c)
4,500,000
4,501,753
Series
2021-54A
Class
B
–7.35%
8/5/33
Floating
Rate
(TSFR3M
+
211)
(a)
(b)
(c)
2,500,000
2,502,457
Ivy
Hill
Middle
Market
Credit
Fund
IX
Ltd.
(IVYH)
Series
9A
Class
A1TR
–6.9%
4/23/34
Floating
Rate
(TSFR3M
+
162)
(a)
(b)
(c)
3,500,000
3,502,326
KKR
Lending
Partners
III
CLO
LLC
(KKRLP)
Series
2021-1A
Class
B
–7.44%
10/20/30
Floating
Rate
(TSFR3M
+
216)
(a)
(c)
2,000,000
2,002,184
Maranon
Loan
Funding
Ltd.
(MRNON)
Series
2021-2RA
Class
A1R
–7.25%
7/15/33
Floating
Rate
(TSFR3M
+
195)
(a)
(b)
(c)
5,000,000
5,004,997
Monroe
Capital
Funding
CLO
X
Ltd.
(MCFCL)
Series
2023-1A
Class
A
–7.7%
4/15/35
Floating
Rate
(TSFR3M
+
240)
(a)
(b)
(c)
3,000,000
3,018,083
Monroe
Capital
MML
CLO
XII
Ltd.
(MCMML)
Series
2021-2A
Class
A1
–6.71%
9/14/33
Floating
Rate
(TSFR3M
+
176)
(a)
(b)
(c)
7,500,000
7,507,371
New
Mountain
Guardian
IV
Income
Rated
Feeder
II,
Ltd.
(NMRF)
Series
2024-1A
Class
A
–8.05%
4/5/37
Floating
Rate
(TSFR3M
+
275)
(a)
(b)
(c)
#
5,000,000
4,992,778
Owl
Rock
CLO
VIII
LLC
(OR)
Series
2022-8A
Class
AT
–7.83%
11/20/34
Floating
Rate
(TSFR3M
+
250)
(a)
(c)
2,000,000
2,006,021
The
accompanying
notes
form
an
integral
part
of
these
financial
statements.
a
a
a
$
Principal
Amount
$
Value
a
a
a
a
a
Starwood
Property
Mortgage
Trust
(STWD)
Series
2024-SIF3A
Class
A1
–7.27%
4/17/36
Floating
Rate
(TSFR3M
+
195)
(a)
(c)
5,000,000
5,044,074
Twin
Brook
CLO
(TWBRK)
Series
2021-1A
Class
A
–7.07%
1/20/34
Floating
Rate
(TSFR3M
+
179)
(a)
(c)
1,200,000
1,200,944
Series
2023-1A
Class
B
–8.48%
4/20/35
Floating
Rate
(TSFR3M
+
320)
(a)
(c)
3,000,000
3,011,652
a
90,192,945
a
Consumer
&
Specialty
Finance
Affirm
Asset
Securitization
Trust
(AFFRM)
Series
2022-Z1
Class
A
–4.55%
6/15/27
(a)
399,224
398,373
Series
2023-X1
Class
A
–7.11%
11/15/28
(a)
294,141
295,346
Bankers
Healthcare
Group
Securitization
Trust
(BHG)
Series
2021-A
Class
A
–1.42%
11/17/33
(a)
245,900
239,039
Series
2022-B
Class
B
–4.84%
6/18/35
(a)
1,100,360
1,097,218
Series
2022-C
Class
A
–5.28%
10/17/35
(a)
233,689
233,651
Series
2023-A
Class
A
–5.55%
4/17/36
(a)
2,183,772
2,192,876
Series
2023-B
Class
A
–6.92%
12/17/36
(a)
1,259,043
1,313,323
Series
2024-1A
Class
A
–5.81%
4/17/35
(a)
1,587,781
1,624,990
Foundation
Finance
Trust
(FFIN)
Series
2021-2A
Class
A
–2.19%
1/15/42
(a)
1,029,136
968,406
Series
2023-1A
Class
A
–5.67%
12/15/43
(a)
1,353,171
1,383,638
Series
2023-2A
Class
A
–6.53%
6/15/49
(a)
3,159,879
3,257,064
Series
2024-1A
Class
A
–5.5%
12/15/49
(a)
2,881,570
2,946,507
Series
24-2A
Class
A
–4.6%
3/15/50
(a)
1,750,000
1,754,790
GreenSky
Home
Improvement
Trust
(GSKY)
Series
24-1
Class
A2
–5.88%
6/25/59
(a)
5,000,000
5,058,221
Hilton
Grand
Vacations
Trust
(HGVT)
Series
2020-AA
Class
A
–2.74%
2/25/39
(a)
121,300
117,893
Lendingpoint
Asset
Securitization
Trust
(LDPT)
Series
2022-B
Class
A
–4.77%
10/15/29
(a)
98,257
98,033
Series
2022-C
Class
A
–6.56%
2/15/30
(a)
185,977
186,031
LP
LMS
Asset
Securitization
Trust
(LPMS)
Series
2023-1A
Class
A
–8.18%
10/17/33
(a)
351,497
352,494
Marlette
Funding
Trust
(MFT)
Series
2023-3A
Class
A
–6.49%
9/15/33
(a)
469,521
470,048
Octane
Receivables
Trust
(OCTL)
Series
2021-2A
Class
A
–1.21%
9/20/28
(a)
286,336
283,019
Series
2022-1A
Class
A2
–4.18%
3/20/28
(a)
827,232
825,160
Series
2022-2A
Class
A
–5.11%
2/22/28
(a)
498,113
498,112
Series
2023-1A
Class
A
–5.87%
5/21/29
(a)
503,445
506,234
Series
2023-2A
Class
A2
–5.88%
6/20/31
(a)
2,788,910
2,803,994
Series
2024-2A
Class
A2
–5.8%
7/20/32
(a)
6,410,000
6,501,222
Pagaya
AI
Debt
Selection
Trust
(PAID)
Series
2021-HG1
Class
A
–1.22%
1/16/29
(a)
368,705
364,123
Series
2023-7
Class
A
–7.23%
7/15/31
(a)
230,356
230,688
Pagaya
AI
Debt
Trust
(PAID)
Series
2022-2
Class
A
–4.97%
1/15/30
(a)
64,490
64,458
Series
2022-3
Class
A
–6.06%
3/15/30
(a)
248,963
249,033
Series
2022-5
Class
A
–8.1%
6/17/30
(a)
636,089
643,493
Series
2023-1
Class
A
–7.56%
7/15/30
(a)
351,581
352,855
Series
2023-3
Class
A
–7.6%
12/16/30
(a)
738,350
742,831
Series
2023-5
Class
A
–7.18%
4/15/31
(a)
841,032
842,379
Series
2024-1
Class
A
–6.66%
7/15/31
(a)
408,867
416,013
Series
2024-3
Class
B
–6.57%
10/15/31
(a)
5,400,000
5,466,489
Series
24-8
Class
B
–5.46%
1/15/32
(a)
9,000,000
9,040,891
Prosper
Marketplace
Issuance
Trust
(PMIT)
Series
2023-1A
Class
A
–7.06%
7/16/29
(a)
226,293
227,230
a
a
a
$
Principal
Amount
$
Value
a
a
a
a
a
Reach
ABS
Trust
(REACH)
Series
2024-1A
Class
A
–6.3%
2/18/31
(a)
1,068,910
1,076,204
Series
24-2A
Class
A
–5.88%
7/15/31
(a)
1,779,186
1,790,771
Sierra
Timeshare
Receivables
Funding
LLC
(SRFC)
Series
2020-2A
Class
A
–1.33%
7/20/37
(a)
274,927
269,009
SoFi
Consumer
Loan
Program
Trust
(SCLP)
Series
2023-1S
Class
A
–5.81%
5/15/31
(a)
5,892
5,893
Theorem
Funding
Trust
(THRM)
Series
2022-3A
Class
A
–7.6%
4/15/29
(a)
864,828
873,364
Upstart
Securitization
Trust
(UPST)
Series
2023-1
Class
A
–6.59%
2/20/33
(a)
135,500
135,694
Series
2023-2
Class
A
–6.77%
6/20/33
(a)
1,423,684
1,430,702
a
59,627,802
a
Equipment
Amur
Equipment
Finance
Receivables
IX
LLC
(AXIS)
Series
2021-1A
Class
B
–1.38%
2/22/27
(a)
192,880
192,495
Amur
Equipment
Finance
Receivables
XI
LLC
(AXIS)
Series
2022-2A
Class
A2
–5.3%
6/21/28
(a)
1,002,017
1,005,356
Amur
Equipment
Finance
Receivables
XII
LLC
(AXIS)
Series
2023-1A
Class
A2
–6.09%
12/20/29
(a)
2,531,685
2,571,333
Amur
Equipment
Finance
Receivables
XIII
LLC
(AXIS)
Series
2024-1A
Class
A2
–5.38%
1/21/31
(a)
1,687,962
1,709,292
Amur
Equipment
Finance
Receivables
XIV
LLC
(AXIS)
Series
24-2A
Class
A2
–5.19%
7/21/31
(a)
3,230,000
3,280,935
Auxilior
Term
Funding
LLC
(XCAP)
Series
2023-1A
Class
A2
–6.18%
12/15/28
(a)
3,511,263
3,546,303
Series
2024-1A
Class
A3
–5.49%
7/15/31
(a)
3,500,000
3,598,019
Crossroads
Asset
Trust
(XROAD)
Series
2024-A
Class
A2
–5.9%
8/20/30
(a)
1,500,000
1,519,953
Dell
Equipment
Finance
Trust
(DEFT)
Series
2023-2
Class
A2
–5.84%
1/22/29
(a)
749,542
751,123
Series
2023-3
Class
A2
–6.1%
4/23/29
(a)
967,624
971,599
Series
2023-3
Class
A3
–5.93%
4/23/29
(a)
3,500,000
3,558,890
Series
2024-1
Class
A3
–5.39%
3/22/30
(a)
1,830,000
1,862,064
Dext
ABS
LLC
(DEXT)
Series
2021-1
Class
A
–1.12%
2/15/28
(a)
58,862
58,760
Series
2023-2
Class
A2
–6.56%
5/15/34
(a)
3,939,068
3,988,285
DLLMT
LLC
(DLLMT)
Series
24-1A
Class
A3
–4.84%
8/21/28
(a)
3,520,000
3,569,429
DLLST
LLC
(DLLST)
Series
2024-1A
Class
A3
–5.05%
8/20/27
(a)
1,140,000
1,150,209
Granite
Park
Equipment
Leasing
LLC
(SCFGP)
Series
2023-1A
Class
A2
–6.51%
5/20/30
(a)
3,758,812
3,808,979
Series
2023-1A
Class
A3
–6.46%
9/20/32
(a)
1,400,000
1,464,645
GreatAmerica
Leasing
Receivables
Funding
LLC
(GALC)
Series
24-2
Class
A3
–5%
9/15/28
(a)
2,160,000
2,202,373
HPEFS
Equipment
Trust
(HPEFS)
Series
2023-1A
Class
A2
–5.43%
8/20/25
(a)
870,008
870,585
Series
2024-2A
Class
A3
–5.36%
10/20/31
(a)
1,125,000
1,145,454
Kubota
Credit
Owner
Trust
(KCOT)
Series
2024-2A
Class
A3
–5.26%
11/15/28
(a)
2,060,000
2,114,860
M&T
Equipment
Notes
(MTLFR)
Series
24-1
Class
A2
–4.99%
8/18/31
(a)
2,700,000
2,717,003
MMAF
Equipment
Finance
LLC
(MMAF)
Series
2022-B
Class
A3
–5.61%
7/10/28
(a)
2,802,553
2,813,159
Series
2023-A
Class
A2
–5.79%
11/13/26
(a)
1,562,138
1,571,308
Pawnee
Equipment
Receivables
Series
LLC
(PWNE)
Series
2021-1
Class
A2
–1.1%
7/15/27
(a)
210,548
209,800
SCF
Equipment
Leasing
LLC
(SCFET)
Series
2022-2A
Class
A3
–6.5%
10/21/30
(a)
2,665,037
2,704,226
The
accompanying
notes
form
an
integral
part
of
these
financial
statements.
Short
Duration
Income
Fund
(Continued)
Schedule
of
Investments
(Unaudited)
September
30,
2024
a
a
a
$
Principal
Amount
$
Value
a
a
a
a
a
Series
2023-1A
Class
A3
–6.17%
5/20/32
(a)
3,500,000
3,665,141
a
58,621,578
a
Fiber
ALLO
Issuer
LLC
(ALLO)
Series
24-1A
Class
A2
–5.94%
7/20/54
(a)
3,000,000
3,053,437
a
Other
Verizon
Master
Trust
(VZMT)
Series
2023-7
Class
A1A
–5.67%
11/20/29
3,000,000
3,096,098
a
Total
Asset-Backed
Securities
(Cost
$346,437,805)
350,069,571
Commercial
Mortgage-Backed
Securities
-
6.8%
a
a
a
a
a
AREIT
LLC
(AREIT)
Series
2023-CRE8
Class
AS
–7.95%
8/17/41
Floating
Rate
(TSFR1M
+
287)
(a)
(b)
5,000,000
5,025,822
AREIT
Trust
(AREIT)
Series
2021-CRE5
Class
A
–6.28%
11/17/38
Floating
Rate
(TSFR1M
+
119)
(a)
(b)
702,307
702,526
AREIT,
Ltd.
(AREIT)
Series
2024-CRE9
Class
AS
–7.32%
5/17/41
Floating
Rate
(TSFR1M
+
224)
(a)
(b)
5,000,000
5,031,687
BRSP
Ltd.
(BRSP)
Series
2021-FL1
Class
A
–6.23%
8/19/38
Floating
Rate
(TSFR1M
+
126)
(a)
(b)
1,568,322
1,563,565
Series
24-FL2
Class
A
–6.91%
8/19/37
Floating
Rate
(TSFR1M
+
195)
(a)
(b)
5,000,000
5,003,750
FS
Rialto
Issuer
LLC
(FSRIA)
Series
2022-FL5
Class
A
–7.27%
6/19/37
Floating
Rate
(TSFR1M
+
230)
(a)
3,867,501
3,883,203
Series
2022-FL7
Class
A
–7.99%
10/19/39
Floating
Rate
(TSFR1M
+
290)
(a)
1,500,000
1,507,965
GPMT
Ltd.
(GPMT)
Series
2021-FL3
Class
A
–6.38%
7/16/35
Floating
Rate
(TSFR1M
+
136)
(a)
(b)
1,888,739
1,870,129
HERA
Commercial
Mortgage
Ltd.
(HERA
)
Series
2021-FL1
Class
A
–6.18%
2/18/38
Floating
Rate
(TSFR1M
+
116)
(a)
(b)
2,164,985
2,152,431
HGI
CRE
CLO
Ltd.
(HGI)
Series
2021-FL1
Class
A4
–6.26%
6/16/36
Floating
Rate
(TSFR1M
+
116)
(a)
(b)
706,033
704,268
Series
2021-FL1
Class
AS
–6.61%
6/16/36
Floating
Rate
(TSFR1M
+
151)
(a)
(b)
4,000,000
3,963,797
Series
2021-FL2
Class
A4
–6.21%
9/17/36
Floating
Rate
(TSFR1M
+
111)
(a)
(b)
1,335,521
1,328,427
HIG
RCP
Trust
(HIG)
Series
2023-FL1
Class
A
–7.37%
9/19/38
Floating
Rate
(TSFR1M
+
227)
(a)
3,919,531
3,936,681
Hilton
USA
Trust
(HILT)
Series
2016-SFP
Class
E
–5.52%
11/5/35
(a)
4,300,000
537,933
ILPT
Commercial
Mortgage
Trust
(ILPT)
Series
2022-LPF2
Class
A
–7.34%
10/15/39
Floating
Rate
(TSFR1M
+
225)
(a)
1,000,000
1,000,625
KREF
Ltd.
(KREF)
Series
2021-FL2
Class
A4
–6.27%
2/15/39
Floating
Rate
(TSFR1M
+
118)
(a)
(b)
4,490,896
4,441,774
LoanCore
Issuer
Ltd.
(LNCR)
Series
2021-CRE5
Class
A
–6.51%
7/15/36
Floating
Rate
(TSFR1M
+
141)
(a)
(b)
3,024,007
3,017,393
a
a
a
$
Principal
Amount
$
Value
a
a
a
a
a
PFP
Ltd.
(PFP)
Series
24-11
Class
A
–6.92%
9/17/39
Floating
Rate
(TSFR1M
+
183)
(a)
3,800,000
3,805,472
Series
24-11
Class
AS
–7.27%
9/17/39
Floating
Rate
(TSFR1M
+
219)
(a)
5,000,000
4,993,604
STWD
Ltd.
(STWD)
Series
2022-FL3
Class
A
–6.69%
11/15/38
Floating
Rate
(SOFR30A
+
135)
(a)
(b)
6,424,367
6,373,350
VMC
Finance
LLC
(VMC)
Series
2021-FL4
Class
A
–6.23%
6/16/36
Floating
Rate
(TSFR1M
+
121)
(a)
244,421
244,144
Series
22-FL5
Class
AS
–7.74%
2/18/39
Floating
Rate
(SOFR30A
+
240)
(a)
3,500,000
3,476,510
a
Total
Commercial
Mortgage-Backed
Securities
(Cost
$68,212,424)
64,565,056
Mortgage-Backed
Securities
-
19.3%
a
a
a
a
a
Federal
Home
Loan
Mortgage
Corporation
Collateralized
Mortgage
Obligations
Series
3649
Class
A
–4%
3/15/25
15,632
15,579
Series
4107
Class
LW
–1.75%
8/15/27
3,901,436
3,773,973
Series
4281
Class
AG
–2.5%
12/15/28
1,929
1,915
Series
3003
Class
LD
–5%
12/15/34
316,719
325,633
Series
2952
Class
PA
–5%
2/15/35
91,471
90,854
Series
3620
Class
PA
–4.5%
12/15/39
213,268
213,867
Series
3842
Class
PH
–4%
4/15/41
322,966
321,041
Series
5413
Class
JA
–5.5%
1/25/50
5,194,471
5,285,142
Series
5407
Class
AB
–5.5%
11/25/50
4,593,077
4,665,766
a
Pass-Through
Securities
Pool#
J13949
–
3.5%
12/1/25
134,672
133,003
Pool#
E02804
–
3%
12/1/25
123,024
121,732
Pool#
J14649
–
3.5%
4/1/26
134,419
132,820
Pool#
E02948
–
3.5%
7/1/26
463,525
457,513
Pool#
J16663
–
3.5%
9/1/26
526,236
520,750
Pool#
E03033
–
3%
2/1/27
331,141
326,626
Pool#
ZS8692
–
2.5%
4/1/33
514,345
491,625
Pool#
G01818
–
5%
5/1/35
388,552
398,942
Pool#
SB8257
–
5.5%
9/1/38
5,805,948
5,929,474
Pool#
SB8278
–
5.5%
1/1/39
4,226,560
4,316,511
Pool#
SB8287
–
5%
3/1/39
6,957,909
7,045,097
Pool#
SB8293
–
5%
4/1/39
6,184,764
6,262,271
Series
5440
Class
NG
–5.5%
9/25/49
4,590,038
4,620,473
Series
5407
Class
DA
–5.5%
11/25/49
4,730,066
4,805,728
Series
5450
4.5%
6/25/51
8,919,461
8,856,746
59,113,081
a
Federal
National
Mortgage
Association
Collateralized
Mortgage
Obligations
Series
2024-20
Class
HD
–5.5%
3/25/46
4,635,816
4,712,120
Series
2024-20
Class
CA
–5.5%
1/25/47
3,227,109
3,269,249
Series
2024-9
Class
CE
–5%
10/25/48
3,587,059
3,611,012
Series
2024-20
Class
EA
–5.5%
8/25/49
4,377,635
4,446,373
a
Pass-Through
Securities
Pool#
AE0031
–
5%
6/1/25
17
17
Pool#
AD7073
–
4%
6/1/25
15,553
15,458
Pool#
AL0471
–
5.5%
7/1/25
2,042
2,084
Pool#
310139
–
3.5%
11/1/25
186,022
184,427
Pool#
AB1769
–
3%
11/1/25
78,716
77,410
The
accompanying
notes
form
an
integral
part
of
these
financial
statements.
a
a
a
$
Principal
Amount
$
Value
a
a
a
a
a
Pool#
AH3429
–
3.5%
1/1/26
424,236
420,464
Pool#
AB2251
–
3%
2/1/26
121,497
120,084
Pool#
AB3902
–
3%
11/1/26
142,721
140,679
Pool#
AB4482
–
3%
2/1/27
815,895
803,542
Pool#
AL1366
–
2.5%
2/1/27
304,350
298,229
Pool#
AB6291
–
3%
9/1/27
189,992
186,809
Pool#
MA3189
–
2.5%
11/1/27
311,673
304,128
Pool#
MA3791
–
2.5%
9/1/29
863,140
836,291
Pool#
BM5708
–
3%
12/1/29
546,259
536,599
Pool#
MA0587
–
4%
12/1/30
906,714
903,348
Pool#
BA4767
–
2.5%
1/1/31
479,589
461,437
Pool#
AS7701
–
2.5%
8/1/31
1,583,298
1,522,118
Pool#
555531
–
5.5%
6/1/33
781,333
803,851
Pool#
MA3540
–
3.5%
12/1/33
558,774
551,108
Pool#
725232
–
5%
3/1/34
72,339
74,208
Pool#
995112
–
5.5%
7/1/36
368,482
381,028
Pool#
MA5311
–
5%
3/1/39
5,560,705
5,630,388
30,292,461
a
Government
National
Mortgage
Association
Pass-Through
Securities
Pool#
5255
–
3%
12/20/26
615,413
607,299
a
Non-Government
Agency
Collateralized
Mortgage
Obligations
AD
Mortgage
Trust
(ADMT)
Series
2024-NQM3
Class
A1
–6.45%
7/25/69
(a)
(c)
3,881,242
3,953,412
Bunker
Hill
Loan
Depositary
Trust
(BHLD)
Series
2019-3A
Class
A1
–2.72%
11/25/59
(a)
(c)
318,543
314,603
Chase
Home
Lending
Mortgage
Trust
(CHASE)
Series
2024-1
Class
A4A
–6%
1/25/55
(a)
(c)
4,481,617
4,542,269
Series
2024-2
Class
A4A
–6%
2/25/55
(a)
(c)
4,785,018
4,855,058
Series
2024-4
Class
A4
–6%
3/25/55
(a)
(c)
3,765,402
3,818,163
Citigroup
Mortgage
Loan
Trust
(CMLTI)
Series
2014-A
Class
A
–4%
1/25/35
(a)
(c)
282,751
276,125
Flagstar
Mortgage
Trust
(FSMT)
Series
2017-1
Class
2A2
–3%
3/25/47
(a)
(c)
332,093
311,775
Series
2021-7
Class
B
–2.5%
8/25/51
(a)
(c)
4,660,577
4,177,928
Series
2021-10IN
Class
A6
–2.5%
10/25/51
(a)
(c)
4,244,405
3,805,751
GS
Mortgage-Backed
Securities
Trust
(GSMBS)
Series
2021-PJ9
Class
A8
–2.5%
2/26/52
(a)
(c)
2,934,514
2,626,753
Series
2022-PJ1
Class
AB
–2.5%
5/28/52
(a)
(c)
3,607,870
3,211,154
Series
2022-PJ2
Class
A24
–3%
6/25/52
(a)
(c)
2,295,133
2,100,594
Series
2024-PJ5
Class
A15
–6%
9/25/54
(a)
(c)
4,650,935
4,716,030
Series
24-PJ8
Class
A8
–5.5%
2/25/55
(a)
(c)
8,000,000
7,989,366
Series
2020-NQM1
Class
A1
–1.38%
9/27/60
(a)
(c)
293,985
276,969
JPMorgan
Mortgage
Trust
(JPMMT)
Series
2014-2
Class
2A2
–3.5%
6/25/29
(a)
(c)
255,863
251,766
Series
2014-5
Class
B
–2.71%
10/25/29
(a)
(c)
844,115
821,228
Series
2016-3
Class
A
–2.96%
10/25/46
(a)
(c)
821,496
779,840
Series
2017-3
Class
A
–2.5%
8/25/47
(a)
(c)
1,901,992
1,699,243
Series
2018-6
Class
2A2
–3%
12/25/48
(a)
(c)
222,816
212,893
Series
2020-7
Class
A
–3%
1/25/51
(a)
(c)
34,734
34,366
Series
2020-8
Class
A
–3%
3/25/51
(a)
(c)
129,650
126,575
Series
2021-4
Class
A4
–2.5%
8/25/51
(a)
(c)
1,875,601
1,696,836
Series
2021-6
Class
B
–2.5%
10/25/51
(a)
(c)
4,225,251
3,792,619
Series
2021-8
Class
B
–2.5%
12/25/51
(a)
(c)
1,384,540
1,244,458
Series
2022-2
Class
A4A
–2.5%
8/25/52
(a)
(c)
1,715,775
1,533,211
Series
2023-6
Class
A4A
–5.5%
12/26/53
(a)
(c)
2,510,452
2,525,726
Series
2024-2
Class
A6A
–6%
8/25/54
(a)
(c)
4,529,245
4,562,829
a
a
a
$
Principal
Amount
$
Value
a
a
a
a
a
Series
2024-4
Class
A4A
–6%
10/25/54
(a)
(c)
3,496,630
3,546,107
JPMorgan
Wealth
Management
(JPMWM)
Series
2020-ATR1
Class
A
–3%
2/25/50
(a)
(c)
69,761
69,375
Rate
Mortgage
Trust
(RATE)
Series
2021-J3
Class
A7
–2.5%
10/25/51
(a)
(c)
3,882,982
3,463,310
RCKT
Mortgage
Trust
(RCKT)
Series
2021-3
Class
A5
–2.5%
7/25/51
(a)
(c)
4,846,134
4,361,549
Sequoia
Mortgage
Trust
(SEMT)
Series
2019-CH2
Class
A
–4.5%
8/25/49
(a)
(c)
70,018
69,401
Series
2020-3
Class
A
–3%
4/25/50
(a)
(c)
199,242
194,873
Series
2023-3
Class
A4
–6%
9/25/53
(a)
(c)
2,915,109
2,955,653
Series
2024-3
Class
A4
–6%
4/25/54
(a)
(c)
4,318,717
4,380,649
Series
2024-4
Class
A4
–6%
5/25/54
(a)
(c)
3,513,079
3,564,222
Series
2024-5
Class
A5
–6%
6/25/54
(a)
(c)
3,102,071
3,144,776
92,007,455
a
Total
Mortgage-Backed
Securities
(Cost
$184,573,230)
182,020,296
U.S.
Treasuries
-
22.9%
a
a
a
a
a
U.S.
Treasury
Notes
2.13%
11/30/24
2,500,000
2,489,213
2.75%
2/28/25
2,000,000
1,986,687
0.25%
8/31/25
20,000,000
19,324,231
3.5%
9/15/25
7,000,000
6,968,765
4.25%
10/15/25
12,000,000
12,036,368
4%
2/15/26
12,000,000
12,034,219
4.63%
3/15/26
10,000,000
10,121,289
4.88%
4/30/26
20,000,000
20,344,531
4.5%
7/15/26
22,000,000
22,307,227
1.88%
7/31/26
15,000,000
14,525,391
4.63%
9/15/26
12,000,000
12,217,031
1.63%
10/31/26
17,000,000
16,320,000
2.25%
2/15/27
2,000,000
1,938,594
1.13%
2/28/27
10,000,000
9,433,203
4.13%
9/30/27
10,000,000
10,162,110
1.13%
2/29/28
16,000,000
14,752,500
1.25%
3/31/28
7,000,000
6,469,941
4.38%
8/31/28
2,000,000
2,058,047
4.63%
9/30/28
4,000,000
4,155,859
4.63%
9/30/30
15,000,000
15,800,391
a
Total
U.S.
Treasuries
(Cost
$217,140,956)
215,445,597
Cash
Equivalents
-
4.1%
a
a
a
a
a
JPMorgan
U.S.
Government
Money
Market
Fund
-
Institutional
Class
4.77%
(Cost
$38,322,041)
(d)
38,322,041
38,322,041
a
Total
Investments
in
Securities
-
98.3%
(Cost
$929,192,381)
925,883,495
Other
Assets
Less
Other
Liabilities
- 1.7%
16,109,829
Net
Assets
-
100%
941,993,324
The
accompanying
notes
form
an
integral
part
of
these
financial
statements.
Short
Duration
Income
Fund
(Continued)
Schedule
of
Investments
(Unaudited)
September
30,
2024
Net
Asset
Value
Per
Share
-
Investor
Class
12.02
Net
Asset
Value
Per
Share
-
Institutional
Class
12.05
#
This
security,
in
part
or
entirely,
represent
a
delayed-settlement
security.
(a)
Security
is
exempt
from
registration
under
Rule
144A
of
the
Securities
Act
of
1933.
This
security
may
be
resold
in
transactions
that
are
exempt
from
registration,
normally
to
qualified
institutional
buyers.
(b)
Foreign
domiciled
entity.
(c)
The
interest
rate
resets
periodically
based
on
the
weighted
average
coupons
of
the
underlying
mortgage-related
or
asset-backed
obligations.
(d)
Rate
presented
represents
the
7
day
average
yield
at
September
30,
2024.
Ultra
Short
Government
Fund
Schedule
of
Investments
(Unaudited)
September
30,
2024
The
accompanying
notes
form
an
integral
part
of
these
financial
statements.
Asset-Backed
Securities
-
0
.3
%
a
a
a
$
Principal
Amount
$
Value
a
a
a
a
a
Automobile
Avid
Automobile
Receivables
Trust
(AVID)
Series
2023-1
Class
A
–6.63%
7/15/26
(a)
7,543
7,546
CFMT
LLC
(CFMT)
Series
2021-AL1
Class
B
–1.39%
9/22/31
(a)
71,730
70,124
Enterprise
Fleet
Financing
LLC
(EFF)
Series
2024-1
Class
A1
–5.55%
2/20/25
(a)
85,680
85,713
LAD
Auto
Receivables
Trust
(LADAR)
Series
2022-1A
Class
A
–5.21%
6/15/27
(a)
66,910
67,018
United
Auto
Credit
Securitization
Trust
(UACST)
Series
2024-1
Class
A
–6.17%
8/10/26
(a)
117,106
117,378
a
347,779
a
Consumer
&
Specialty
Finance
Affirm
Asset
Securitization
Trust
(AFFRM)
Series
2023-X1
Class
A
–7.11%
11/15/28
(a)
36,074
36,222
SoFi
Consumer
Loan
Program
Trust
(SCLP)
Series
2023-1S
Class
A
–5.81%
5/15/31
(a)
5,892
5,893
42,115
a
Total
Asset-Backed
Securities
(Cost
$390,886)
389,894
U.S.
Treasuries
-
65
.5
%
a
a
a
a
a
U.S.
Treasury
Notes
4.38%
10/31/24
11,000,000
10,994,850
4.25%
12/31/24
16,000,000
15,982,737
4.13%
1/31/25
30,000,000
29,950,431
4.63%
2/28/25
17,000,000
17,013,691
3.88%
3/31/25
20,000,000
19,952,377
a
Total
U.S.
Treasuries
(Cost
$93,670,287)
93,894,086
Cash
Equivalents
-
49
.6
%
a
a
a
a
a
JPMorgan
U.S.
Government
Money
Market
Fund
-
Institutional
Class
4.77%
(b)
36,225,223
36,225,223
U.S.
Treasury
Bills,
4.52%
to
4.63%,
11/5/24
to
11/26/24
(c)
35,000,000
34,778,942
a
Total
Cash
Equivalents
(Cost
$71,000,506)
71,004,165
Total
Investments
in
Securities
-
115.4%
(Cost
$165,061,679)
165,288,145
Other
Liabilities
in
Excess
of
Other
Assets
- (15.4%)
(
22,071,225
)
Net
Assets
-
100%
143,216,920
Net
Asset
Value
Per
Share
-
Institutional
Class
10.00
(a)
Security
is
exempt
from
registration
under
Rule
144A
of
the
Securities
Act
of
1933.
This
security
may
be
resold
in
transactions
that
are
exempt
from
registration,
normally
to
qualified
institutional
buyers.
(b)
Rate
presented
represents
the
7
day
average
yield
at
September
30,
2024.
(c)
Interest
rates
presented
represent
the
effective
yield
at
September
30,
2024.
STATEMENTS
OF
ASSETS
AND
LIABILITIES
September
30,
2024
(Unaudited)
The
accompanying
notes
form
an
integral
part
of
these
financial
statements.
(In
U.S.
dollars,
except
share
data)
Conservative
Allocation
Core
Plus
Income
Large
Cap
Equity
Multi
Cap
Equity
Nebraska
Tax
Free
Income
Partners
III
Opportunity
Short
Duration
Income
Ultra
Short
Government
Assets:
Investments
in
securities
at
value*
#
:
Unaffiliated
issuers
245,039,743
2,694,486,073
960,948,273
594,466,282
23,007,592
441,332,365
925,883,495
165,288,145
Non-controlled
affiliates
—
—
—
—
—
7,477,800
—
—
245,039,743
2,694,486,073
960,948,273
594,466,282
23,007,592
448,810,165
925,883,495
165,288,145
Accrued
interest
and
dividends
receivable
741,012
20,178,468
195,057
71,443
247,529
180,383
4,946,994
689,412
Due
from
broker
—
—
—
—
—
20,030,500
—
—
Receivable
for
securities
sold
—
—
—
—
—
80,438
—
—
Receivable
for
fund
shares
sold
139,830
4,958,665
4,949
666
—
318
24,665,526
190,966
Receivable
from
adviser
—
—
—
—
3,181
—
—
—
Prepaid
expenses
23,333
190,995
39,359
30,398
1,502
21,154
49,645
25,718
Cash
—
—
—
24,662
—
—
—
—
Total
assets
245,943,918
2,719,814,201
961,187,638
594,593,451
23,259,804
469,122,958
955,545,660
166,194,241
Liabilities:
Bank
Overdraft
—
3,454
—
—
—
—
—
—
Distributions
payable
—
388,651
—
—
—
—
50,073
25,497
Dividends
payable
on
securities
sold
short
—
—
—
—
—
61,093
—
—
Due
to
adviser
119,382
723,066
703,305
419,250
—
377,091
284,177
18,373
Options
written,
at
value†
—
—
—
—
—
70,560
—
—
Payable
for
collateral
received
on
loaned
securities
—
5,168,405
—
—
—
—
—
—
Payable
for
securities
purchased
5,968,770
24,810,898
—
—
—
9,926,869
11,168,571
22,832,527
Payable
for
fund
shares
redeemed
222,303
3,142,731
661,503
120,015
2,487
254,278
1,949,890
68,171
Securities
sold
short^
—
—
—
—
—
20,081,600
—
—
Other
48,798
133,851
113,780
77,301
18,596
61,509
99,625
32,753
Total
liabilities
6,359,253
34,371,056
1,478,588
616,566
21,083
30,833,000
13,552,336
22,977,321
Net
assets
239,584,665
2,685,443,145
959,709,050
593,976,885
23,238,721
438,289,958
941,993,324
143,216,920
Composition
of
net
assets:
Paid-in
capital
177,575,335
2,652,849,456
363,633,675
219,825,769
24,235,421
217,497,361
947,355,518
142,994,881
Total
distributable
earnings
62,009,330
32,593,689
596,075,375
374,151,116
(996,700)
220,792,597
(5,362,194)
222,039
Net
assets
239,584,665
2,685,443,145
959,709,050
593,976,885
23,238,721
438,289,958
941,993,324
143,216,920
Net
assets
(a)
:
Investor
Class
51,812,675
381,972,052
566,122,212
239,647,246
23,238,721
6,186,726
30,390,728
Institutional
Class
187,771,990
2,303,471,093
393,586,838
354,329,639
432,103,232
911,602,596
143,216,920
Shares
outstanding
(a)(b)
:
Investor
Class
2,910,784
38,635,624
9,688,822
6,872,504
2,392,195
488,185
2,528,267
Institutional
Class
10,523,356
232,935,329
6,544,952
9,859,371
30,888,819
75,661,823
14,319,115
Net
asset
value,
offering
and
redemption
price
(a)
:
Investor
Class
17.80
9.89
58.43
34.87
9.71
12.67
12.02
Institutional
Class
17.84
9.89
60.14
35.94
13.99
12.05
10.00
*
Cost
of
investments
in
securities:
Unaffiliated
Issuers
190,757,546
2,655,899,863
480,138,659
260,710,180
23,614,510
242,665,891
929,192,381
165,061,679
Non-controlled
affiliates
—
—
—
—
—
634,534
—
—
190,757,546
2,655,899,863
480,138,659
260,710,180
23,614,510
243,300,425
929,192,381
165,061,679
†
Premiums
from
options
written
—
—
—
—
—
80,182
—
—
^
Proceeds
from
short
sales
—
—
—
—
—
7,361,008
—
—
#
Includes
securities
on
loan
as
shown
in
the
Schedule
of
Investments.
(a)
Funds
with
a
single
share
class
are
shown
with
the
Investor
Class,
except
for
the
Ultra
Short
Government
Fund
which
has
been
designated
Institutional
Class.
(b)
Indefinite
number
of
no
par
value
shares
authorized.
Statements
of
Operations
Period
ended
September
30,
2024
(Unaudited)
The
accompanying
notes
form
an
integral
part
of
these
financial
statements.
(In
U.S.
dollars)
Conservative
Allocation
Core
Plus
Income
Large
Cap
Equity
Multi
Cap
Equity
Nebraska
Tax
Free
Income
Partners
III
Opportunity
Short
Duration
Income
Ultra
Short
Government
Investment
Income:
Dividends
720,179
1,750,431
2,968,895
1,630,317
22,646
1,381,804
592,557
95,626
Interest
2,662,776
61,422,615
158,014
333,173
256,905
1,011,451
22,996,258
4,366,305
Income
from
securities
lending
—
28,313
—
—
—
13,289
—
—
Total
investment
income
3,382,955
63,201,359
3,126,909
1,963,490
279,551
2,406,544
23,588,815
4,461,931
Fees
and
expenses*:
Investment
advisory
services
707,339
4,290,636
3,441,005
2,108,990
45,772
2,078,906
1,788,005
257,117
Business
administration
services
(1)
43,326
406,045
169,243
103,658
4,204
76,621
164,278
30,740
Administrative
services:
(2)
Investor
Class
48,806
355,390
441,518
204,771
7,650
6,540
39,385
Institutional
Class
30,538
540,192
28,865
22,706
28,303
371,215
41,343
Transfer
agent
services:
Investor
Class
14,357
10,689
52,671
32,797
17,136
9,914
9,512
Institutional
Class
10,838
10,284
15,920
15,628
16,476
13,607
20,736
Registration:
Investor
Class
9,170
22,529
15,342
10,638
3,074
6,680
4,271
Institutional
Class
15,752
83,654
14,612
12,620
13,319
30,820
22,271
Custody
and
fund
accounting
47,256
132,187
80,088
59,586
36,191
51,807
87,344
37,528
Auditing
and
legal
19,444
65,260
34,921
26,466
12,212
22,665
35,831
15,740
Trustees
10,831
89,727
39,817
24,552
1,050
17,939
40,480
8,175
Dividends
on
securities
sold
short
—
—
—
—
—
122,659
—
—
Printing
6,419
39,031
18,662
12,264
430
8,732
19,786
3,310
Other
10,217
43,821
40,034
24,558
1,373
14,966
43,666
5,241
974,293
6,089,445
4,392,698
2,659,234
129,092
2,475,527
2,648,200
442,201
Less
expenses
waived/reimbursed
by
investment
adviser
(109,556)
(1,034,648)
—
—
(77,596)
—
(616,329)
(168,311)
Net
expenses
864,737
5,054,797
4,392,698
2,659,234
51,496
2,475,527
2,031,871
273,890
Net
investment
income
(loss)
2,518,218
58,146,562
(1,265,789)
(695,744)
228,055
(68,983)
21,556,944
4,188,041
Realized
and
unrealized
gain
(loss)
on
investments:
Net
realized
gain
(loss):
Unaffiliated
issuers
3,009,382
(1,410,122)
57,928,891
22,821,713
—
13,274,221
(339,762)
(5,027)
Options
written
—
—
—
—
—
279,041
—
—
Securities
sold
short
—
—
—
—
—
(333,809)
—
—
Net
realized
gain
(loss)
3,009,382
(1,410,122)
57,928,891
22,821,713
—
13,219,453
(339,762)
(5,027)
Change
in
net
unrealized
appreciation
(depreciation):
Unaffiliated
issuers
4,417,543
67,633,900
(10,152,184)
15,746,795
281,520
11,725,913
13,822,767
221,017
Non-controlled
affiliates
—
—
—
—
—
1,787,050
—
—
Options
written
—
—
—
—
—
129,576
—
—
Securities
sold
short
—
—
—
—
—
(1,293,422)
—
—
Change
in
net
unrealized
appreciation
(depreciation)
4,417,543
67,633,900
(10,152,184)
15,746,795
281,520
12,349,117
13,822,767
221,017
Net
realized
and
unrealized
gain
(loss)
on
investments
7,426,925
66,223,778
47,776,707
38,568,508
281,520
25,568,570
13,483,005
215,990
Net
increase
(decrease)
in
net
assets
resulting
from
operations
9,945,143
124,370,340
46,510,918
37,872,764
509,575
25,499,587
35,039,949
4,404,031
*
Additional
information
related
to
fees
and
expenses
is
included
in
the
notes
to
the
financial
statements.
(1)
The
trust
has
a
business
administration
agreement
with
the
Advisor
under
which
the
Trust
compensates
the
Adviser
for
providing
business
administration
services
for
all
share
classes
of
the
funds.
Services
encompass
supervising
all
aspects
of
the
management
and
operations
of
the
Trust,
Including
monitoring
Trust's
relationships
with
third-party
services
providers
that
may
be
retained
from
time
to
time
by
the
Trust.
(2)
The
trust
has
administrative
services
plans
under
which
the
Trust
compensates
the
Adviser
for
administrative
services
provided
to
all
share
classes
of
the
Funds.
Effective
July
31,
2024,
this
plan
was
terminated
for
the
Institutional
share
classes.
Administrative
services
are
provided
by
the
Adviser
or
by
certain
financial
intermediaries
with
respect
to
non-distribution
services
to
fund
stakeholders.
These
services
include,
but
are
not
limited
to,
providing
shareholder
statements,
assisting
with
shareholder
communications
and
sub-accounting
services
in
connection
with
omnibus
accounts.
STATEMENTS
OF
CHANGES
IN
NET
ASSETS
The
accompanying
notes
form
an
integral
part
of
these
financial
statements.
Conservative
Allocation
Core
Plus
Income
Large
Cap
Equity
Multi
Cap
Equity
(In
U.S.
dollars)
Six
months
ended
Sept.
30,
2024
(Unaudited)
Year
ended
March
31,
2024
Six
months
ended
Sept.
30,
2024
(Unaudited)
Year
ended
March
31,
2024
Six
months
ended
Sept.
30,
2024
(Unaudited)
Year
ended
March
31,
2024
Six
months
ended
Sept.
30,
2024
(Unaudited)
Year
ended
March
31,
2024
Increase
(decrease)
in
net
assets:
From
operations:
Net
investment
income
(loss)
2,518,218
4,143,293
58,146,562
57,012,684
(1,265,789)
(1,941,639)
(695,744)
(1,732,938)
Net
realized
gain
(loss)
3,009,382
4,766,350
(1,410,122)
(378,815)
57,928,891
83,608,655
22,821,713
37,100,040
Change
in
net
unrealized
appreciation
(depreciation)
4,417,543
17,077,473
67,633,900
(265,622)
(10,152,184)
153,878,485
15,746,795
89,151,362
Net
increase
(decrease)
in
net
assets
resulting
from
operations
9,945,143
25,987,116
124,370,340
56,368,247
46,510,918
235,545,501
37,872,764
124,518,464
Distributions
to
shareholders
(a)
:
Investor
Class
(461,755)
(1,053,227)
(8,227,143)
(9,719,018)
—
(27,767,688)
—
(4,131,787)
Institutional
Class
(1,649,898)
(3,775,302)
(49,517,332)
(47,419,319)
—
(17,636,165)
—
(5,373,514)
Total
distributions
(2,111,653)
(4,828,529)
(57,744,475)
(57,138,337)
—
(45,403,853)
—
(9,505,301)
Fund
share
transactions
(a)
:
Investor
Class
(2,778,133)
(5,215,655)
101,809,690
147,789,199
(24,157,024)
(54,538,381)
(13,566,368)
(39,216,714)
Institutional
Class
(715,554)
13,812,832
806,414,909
964,997,725
(2,054,537)
30,146,294
(5,012,170)
(22,965,104)
Net
increase
(decrease)
from
fund
share
transactions
(3,493,687)
8,597,177
908,224,599
1,112,786,924
(26,211,561)
(24,392,087)
(18,578,538)
(62,181,818)
Total
increase
(decrease)
in
net
assets
4,339,803
29,755,764
974,850,464
1,112,016,834
20,299,357
165,749,561
19,294,226
52,831,345
Net
assets:
Beginning
of
period
235,244,862
205,489,098
1,710,592,681
598,575,847
939,409,693
773,660,132
574,682,659
521,851,314
End
of
period
239,584,665
235,244,862
2,685,443,145
1,710,592,681
959,709,050
939,409,693
593,976,885
574,682,659
(a)
Funds
with
a
single
share
class
are
shown
with
the
Investor
Class,
except
for
the
Ultra
Short
Government
Fund
which
has
been
designated
Institutional
Class.
The
accompanying
notes
form
an
integral
part
of
these
financial
statements.
Nebraska
Tax
Free
Income
Partners
III
Opportunity
Short
Duration
Income
Ultra
Short
Government
Six
months
ended
Sept.
30,
2024
(Unaudited)
Year
ended
March
31,
2024
Six
months
ended
Sept.
30,
2024
(Unaudited)
Year
ended
March
31,
2024
Six
months
ended
Sept.
30,
2024
(Unaudited)
Year
ended
March
31,
2024
Six
months
ended
Sept.
30,
2024
(Unaudited)
Year
ended
March
31,
2024
228,055
520,030
(68,983)
513,627
21,556,944
35,292,497
4,188,041
6,950,345
—
(295,684)
13,219,453
33,002,185
(339,762)
(1,334,633)
(5,027)
(2,173)
281,520
(15,935)
12,349,117
52,970,650
13,822,767
9,625,978
221,017
52,429
509,575
208,411
25,499,587
86,486,462
35,039,949
43,583,842
4,404,031
7,000,601
(226,037)
(524,705)
—
(396,963)
(683,038)
(1,400,471)
—
(26,395,168)
(20,631,620)
(33,951,721)
(4,187,418)
(6,922,114)
(226,037)
(524,705)
—
(26,792,131)
(21,314,658)
(35,352,192)
(4,187,418)
(6,922,114)
(78,917)
(5,548,252)
140,482
(1,828,965)
840,707
(12,243,151)
(11,147,048)
(46,846,220)
70,399,862
90,054,810
(39,946,464)
96,203,287
(78,917)
(5,548,252)
(11,006,566)
(48,675,185)
71,240,569
77,811,659
(39,946,464)
96,203,287
204,621
(5,864,546)
14,493,021
11,019,146
84,965,860
86,043,309
(39,729,851)
96,281,774
23,034,100
28,898,646
423,796,937
412,777,791
857,027,464
770,984,155
182,946,771
86,664,997
23,238,721
23,034,100
438,289,958
423,796,937
941,993,324
857,027,464
143,216,920
182,946,771
FINANCIAL
HIGHLIGHTS
The
following
financial
information
provides
selected
data,
in
U.S.
dollars,
for
a
share
outstanding
throughout
the
periods
indicated.
The
accompanying
notes
form
an
integral
part
of
these
financial
statements.
Income
(loss)
from
Investment
Operations
Distributions
Years
ended
March
31,
unless
otherwise
noted
Net
asset
value,
beginning
of
period
Net
investment
income
(loss)
Net
gain
(loss)
on
securities
(realized
and
unrealized)
Total
from
investment
operations
Dividends
from
net
investment
income
Distributions
from
realized
gains
Total
distributions
Conservative
Allocation
-
Investor
Class
Six
months
ended
9/30/2024
(Unaudited)
17.23
0.17
(d)
0.55
0.72
(0.15)
—
(0.15)
2024
15.69
0.29
(d)
1.59
1.88
(0.27)
(0.07)
(0.34)
2023
16.68
0.17
(d)
(0.86)
(0.69)
(0.15)
(0.15)
(0.30)
2022
16.30
0.05
(d)
0.78
0.83
(0.04)
(0.41)
(0.45)
2021
13.54
0.07
(d)
2.86
2.93
(0.08)
(0.09)
(0.17)
2020
13.76
0.13
(d)
(0.07)
0.06
(0.15)
(0.13)
(0.28)
Conservative
Allocation
-
Institutional
Class
Six
months
ended
9/30/2024
(Unaudited)
17.27
0.19
(d)
0.54
0.73
(0.16)
—
(0.16)
2024
15.71
0.31
(d)
1.60
1.91
(0.28)
(0.07)
(0.35)
2023
16.70
0.20
(d)
(0.88)
(0.68)
(0.16)
(0.15)
(0.31)
2022
16.31
0.08
(d)
0.77
0.85
(0.05)
(0.41)
(0.46)
2021
13.55
0.09
(d)
2.87
2.96
(0.11)
(0.09)
(0.20)
2020
(e)
13.75
0.16
(d)
(0.08)
0.08
(0.15)
(0.13)
(0.28)
Core
Plus
Income
-
Investor
Class
Six
months
ended
9/30/2024
(Unaudited)
9.63
0.26
(d)
0.26
0.52
(0.26)
—
(0.26)
2024
9.76
0.49
(d)
(0.13)
0.36
(0.49)
—
(0.49)
2023
10.45
0.37
(d)
(0.70)
(0.33)
(0.35)
(0.01)
(0.36)
2022
10.86
0.23
(d)
(0.40)
(0.17)
(0.21)
(0.03)
(0.24)
2021
10.14
0.37
(d)
0.91
1.28
(0.37)
(0.19)
(0.56)
2020
10.31
0.30
(d)
(0.16)
0.14
(0.29)
(0.02)
(0.31)
Core
Plus
Income
-
Institutional
Class
Six
months
ended
9/30/2024
(Unaudited)
9.63
0.26
(d)
0.26
0.52
(0.26)
—
(0.26)
2024
9.76
0.51
(d)
(0.14)
0.37
(0.50)
—
(0.50)
2023
10.45
0.37
(d)
(0.69)
(0.32)
(0.36)
(0.01)
(0.37)
2022
10.87
0.24
(d)
(0.41)
(0.17)
(0.22)
(0.03)
(0.25)
2021
10.15
0.38
(d)
0.91
1.29
(0.38)
(0.19)
(0.57)
2020
10.32
0.32
(d)
(0.16)
0.16
(0.31)
(0.02)
(0.33)
Large
Cap
Equity
-
Investor
Class
Six
months
ended
9/30/2024
(Unaudited)
55.57
(0.09)
(d)
2.95
2.86
—
—
—
2024
44.48
(0.14)
(d)
14.00
13.86
—
(2.77)
(2.77)
2023
56.83
(0.18)
(d)
(6.23)
(6.41)
—
(5.94)
(5.94)
2022
54.30
(0.32)
(d)
5.18
4.86
—
(2.33)
(2.33)
2021
37.98
(0.21)
(d)
21.14
20.93
—
(4.61)
(4.61)
2020
42.31
(0.15)
(d)
(1.98)
(2.13)
—
(2.20)
(2.20)
Large
Cap
Equity
-
Institutional
Class
Six
months
ended
9/30/2024
(Unaudited)
57.14
(0.05)
(d)
3.05
3.00
—
—
—
2024
45.61
(0.07)
(d)
14.37
14.30
—
(2.77)
(2.77)
2023
58.02
(0.11)
(d)
(6.36)
(6.47)
—
(5.94)
(5.94)
2022
55.31
(0.23)
(d)
5.27
5.04
—
(2.33)
(2.33)
2021
38.55
(0.11)
(d)
21.48
21.37
—
(4.61)
(4.61)
2020
42.82
(0.05)
(d)
(2.02)
(2.07)
—
(2.20)
(2.20)
Multi
Cap
Equity
-
Investor
Class
Six
months
ended
9/30/2024
(Unaudited)
32.66
(0.06)
(d)
2.27
2.21
—
—
—
2024
26.44
(0.12)
(d)
6.88
6.76
—
(0.54)
(0.54)
2023
32.18
(0.16)
(d)
(3.68)
(3.84)
—
(1.90)
(1.90)
2022
33.01
(0.27)
(d)
1.81
1.54
—
(2.37)
(2.37)
2021
23.32
(0.28)
(d)
13.30
13.02
—
(3.33)
(3.33)
2020
29.45
(0.09)
(d)
(3.80)
(3.89)
—
(2.24)
(2.24)
Multi
Cap
Equity
-
Institutional
Class
Six
months
ended
9/30/2024
(Unaudited)
33.63
(0.03)
(d)
2.34
2.31
—
—
—
2024
27.16
(0.07)
(d)
7.08
7.01
—
(0.54)
(0.54)
2023
32.94
(0.11)
(d)
(3.77)
(3.88)
—
(1.90)
(1.90)
2022
33.67
(0.21)
(d)
1.85
1.64
—
(2.37)
(2.37)
2021
23.70
(0.23)
(d)
13.53
13.30
—
(3.33)
(3.33)
2020
29.82
(0.01)
(d)
(3.87)
(3.88)
—
(2.24)
(2.24)
(a)
Not
annualized
for
periods
less
than
one
year.
(b)
Annualized
for
periods
less
than
one
year.
(c)
Portfolio
turnover
is
calculated
on
the
basis
of
the
Fund
as
a
whole
without
distinguishing
between
the
classes
of
shares.
(d)
(e)
The
accompanying
notes
form
an
integral
part
of
these
financial
statements.
Ratios/Supplemental
Data
Ratio
of
expenses
to
average
net
assets
Net
asset
value,
end
of
period
Total
return
(%)
(a)
Net
assets,
end
of
period
($000)
Prior
to
fee
waivers
(%)
(b)
Net
of
fee
waivers
(%)
(b)
Ratio
of
net
investment
income
(loss)
to
average
net
assets
(%)
(b)
Portfolio
turnover
rate
(%)
(a)(c)
17.80
4.23
51,813
0.99
0.85
2.02
12
17.23
12.09
52,884
1.00
0.85
1.76
27
15.69
(4.12)
53,269
0.99
0.85
1.12
20
16.68
4.98
64,732
1.01
0.85
0.31
26
16.30
21.74
64,736
1.14
0.85
0.44
29
13.54
0.35
47,591
1.20
0.85
0.94
32
17.84
4.25
187,772
0.78
0.70
2.17
12
17.27
12.32
182,360
0.79
0.70
1.91
27
15.71
(4.01)
152,221
0.79
0.70
1.29
20
16.70
5.15
145,835
0.82
0.70
0.46
26
16.31
21.93
141,277
0.89
0.70
0.58
29
13.55
0.45
84,682
1.00
0.70
1.09
32
9.89
5.45
381,972
0.72
0.59
5.29
5
9.63
3.88
271,029
0.77
0.54
5.16
12
9.76
(3.06)
124,729
0.82
0.50
3.72
24
10.45
(1.67)
54,279
0.89
0.50
2.07
46
10.86
12.79
53,944
1.09
0.50
3.42
38
10.14
1.38
25,921
1.18
0.57
2.85
51
9.89
5.51
2,303,471
0.54
0.45
5.43
5
9.63
3.97
1,439,564
0.57
0.44
5.28
12
9.76
(2.98)
473,847
0.59
0.40
3.76
24
10.45
(1.67)
293,326
0.62
0.40
2.16
46
10.87
12.88
110,303
0.80
0.40
3.54
38
10.15
1.56
78,128
0.80
0.40
3.02
51
58.43
5.15
566,122
1.02
1.02
(0.34)
15
55.57
31.74
562,750
1.01
1.01
(0.28)
20
44.48
(11.01)
499,565
1.04
1.04
(0.37)
9
56.83
8.63
633,358
1.04
1.04
(0.53)
15
54.30
56.97
616,462
1.11
1.09
(0.43)
14
37.98
(5.77)
448,259
1.24
1.20
(0.33)
16
60.14
5.23
393,587
0.87
0.87
(0.18)
15
57.14
31.94
376,660
0.87
0.87
(0.14)
20
45.61
(10.88)
274,095
0.89
0.89
(0.23)
9
58.02
8.80
315,413
0.90
0.89
(0.37)
15
55.31
57.28
311,177
0.97
0.89
(0.23)
14
38.55
(5.55)
210,729
1.09
0.97
(0.10)
16
34.87
6.73
239,647
1.06
1.06
(0.36)
6
32.66
25.84
238,197
1.05
1.05
(0.43)
10
26.44
(11.97)
228,650
1.07
1.07
(0.56)
6
32.18
4.13
214,991
1.09
1.09
(0.78)
8
33.01
58.17
231,482
1.18
1.09
(0.97)
7
23.32
(14.82)
183,718
1.29
1.24
(0.31)
26
35.94
6.87
354,330
0.87
0.87
(0.17)
6
33.63
26.04
336,486
0.87
0.87
(0.24)
10
27.16
(11.81)
293,201
0.89
0.89
(0.38)
6
32.94
4.35
279,181
0.91
0.89
(0.59)
8
33.67
58.43
277,133
0.99
0.89
(0.77)
7
23.70
(14.59)
216,400
1.08
0.97
(0.04)
26
Per
share
net
investment
income
(loss)
has
been
calculated
using
the
average
daily
shares
method.
Initial
offering
of
shares
on
March
29,
2019.
FINANCIAL
HIGHLIGHTS
(Continued)
The
following
financial
information
provides
selected
data,
in
U.S.
dollars,
for
a
share
outstanding
throughout
the
periods
indicated.
The
accompanying
notes
form
an
integral
part
of
these
financial
statements.
Income
(loss)
from
Investment
Operations
Distributions
Years
ended
March
31,
unless
otherwise
noted
Net
asset
value,
beginning
of
period
Net
investment
income
(loss)
Net
gain
(loss)
on
securities
(realized
and
unrealized)
Total
from
investment
operations
Dividends
from
net
investment
income
Distributions
from
realized
gains
Total
distributions
Nebraska
Tax
Free
Income
Six
months
ended
9/30/2024
(Unaudited)
9.59
0.10
(d)
0.12
0.22
(0.10)
—
(0.10)
2024
9.65
0.19
(d)
(0.05)
0.14
(0.20)
—
(0.20)
2023
9.73
0.17
(d)
(0.09)
0.08
(0.16)
—
(0.16)
2022
10.18
0.14
(d)
(0.45)
(0.31)
(0.14)
—
(0.14)
2021
10.07
0.16
0.11
0.27
(0.16)
—
(0.16)
2020
9.95
0.13
0.12
0.25
(0.13)
—
(0.13)
Partners
III
Opportunity
-
Investor
Class
Six
months
ended
9/30/2024
(Unaudited)
11.98
(0.05)
(d)
0.74
0.69
—
—
—
2024
10.55
(0.06)
(d)
2.32
2.26
—
(0.83)
(0.83)
2023
13.74
(0.11)
(d)
(2.14)
(2.25)
—
(0.94)
(0.94)
2022
15.67
(0.20)
(d)
0.11
(0.09)
—
(1.84)
(1.84)
2021
12.84
(0.16)
(d)
4.92
4.76
—
(1.93)
(1.93)
2020
14.67
(0.20)
(d)
(0.59)
(0.79)
—
(1.04)
(1.04)
Partners
III
Opportunity
-
Institutional
Class
Six
months
ended
9/30/2024
(Unaudited)
13.18
—
#
(d)
0.81
0.81
—
—
—
2024
11.46
0.02
(d)
2.54
2.56
(0.01)
(0.83)
(0.84)
2023
14.74
(0.04)
(d)
(2.30)
(2.34)
—
(0.94)
(0.94)
2022
16.60
(0.13)
(d)
0.11
(0.02)
—
(1.84)
(1.84)
2021
13.43
(0.07)
(d)
5.17
5.10
—
(1.93)
(1.93)
2020
15.21
(0.11)
(d)
(0.63)
(0.74)
—
(1.04)
(1.04)
Short
Duration
Income
-
Investor
Class
Six
months
ended
9/30/2024
(Unaudited)
11.84
0.28
(d)
0.18
0.46
(0.28)
—
(0.28)
2024
11.73
0.50
(d)
0.12
0.62
(0.51)
—
(0.51)
2023
11.98
0.32
(d)
(0.22)
0.10
(0.34)
(0.01)
(0.35)
2022
12.37
0.19
(d)
(0.37)
(0.18)
(0.19)
(0.02)
(0.21)
2021
11.93
0.27
(d)
0.48
0.75
(0.29)
(0.02)
(0.31)
2020
12.17
0.27
(d)
(0.23)
0.04
(0.28)
—
(0.28)
Short
Duration
Income
-
Institutional
Class
Six
months
ended
9/30/2024
(Unaudited)
11.87
0.29
(d)
0.18
0.47
(0.29)
—
(0.29)
2024
11.76
0.52
(d)
0.11
0.63
(0.52)
—
(0.52)
2023
12.00
0.33
(d)
(0.22)
0.11
(0.34)
(0.01)
(0.35)
2022
12.39
0.20
(d)
(0.37)
(0.17)
(0.20)
(0.02)
(0.22)
2021
11.95
0.28
(d)
0.47
0.75
(0.29)
(0.02)
(0.31)
2020
12.19
0.29
(d)
(0.23)
0.06
(0.30)
—
(0.30)
Ultra
Short
Government
Six
months
ended
9/30/2024
(Unaudited)
9.99
0.25
(d)
—
#
0.25
(0.24)
—
(0.24)
2024
9.99
0.49
(d)
(0.01)
0.48
(0.48)
—
(0.48)
2023
9.99
0.25
(d)
(0.01)
0.24
(0.24)
—
(0.24)
2022
10.00
0.01
(d)
(0.01)
—
#
(0.01)
—
(0.01)
2021
10.03
0.06
(0.03)
0.03
(0.06)
—
(0.06)
2020
10.01
0.21
0.03
0.24
(0.21)
(0.01)
(0.22)
#
Amount
less
than
$0.01.
(a)
Not
annualized
for
periods
less
than
one
year.
(b)
Annualized
for
periods
less
than
one
year.
(c)
Portfolio
turnover
is
calculated
on
the
basis
of
the
Fund
as
a
whole
without
distinguishing
between
the
classes
of
shares.
(d)
Per
share
net
investment
income
(loss)
has
been
calculated
using
the
average
daily
shares
method.
The
accompanying
notes
form
an
integral
part
of
these
financial
statements.
Ratios/Supplemental
Data
Ratio
of
expenses
to
average
net
assets
Net
asset
value,
end
of
period
Total
return
(%)
(a)
Net
assets,
end
of
period
($000)
Prior
to
fee
waivers
(%)
(b)
Net
of
fee
waivers
(%)
(b)
Ratio
of
net
investment
income
(loss)
to
average
net
assets
(%)
(b)
Portfolio
turnover
rate
(%)
(a)(c)
9.71
2.26
23,239
1.13
0.45
1.99
–
9.59
1.44
23,034
1.05
0.45
2.00
5
9.65
0.91
28,899
0.95
0.45
1.73
5
9.73
(3.08)
32,880
1.02
0.45
1.42
9
10.18
2.67
35,638
1.09
0.45
1.54
13
10.07
2.55
31,465
1.10
0.94
1.29
7
12.67
5.76
6,187
1.96
1.96
(0.80)
14
11.98
22.29
5,710
1.90
1.90
(0.57)
19
10.55
(16.31)
6,732
1.75
1.75
(0.92)
33
13.74
(1.02)
14,147
1.86
1.86
(1.25)
26
15.67
39.25
22,791
2.09
2.09
(1.08)
23
12.84
(6.40)
19,287
2.04
2.04
(1.29)
32
13.99
6.15
432,103
1.18
1.18
(0.02)
14
13.18
23.19
418,087
1.19
1.19
0.13
19
11.46
(15.80)
406,046
1.19
1.19
(0.30)
33
14.74
(0.53)
559,234
1.43
1.43
(0.81)
26
16.60
40.11
592,471
1.46
1.46
(0.46)
23
13.43
(5.83)
541,433
1.44
1.44
(0.69)
32
12.02
3.90
30,391
0.85
0.58
4.69
22
11.84
5.40
29,104
0.93
0.55
4.25
37
11.73
0.83
41,089
0.86
0.55
2.69
43
11.98
(1.46)
60,017
0.90
0.55
1.55
51
12.37
6.29
36,857
1.02
0.55
2.23
45
11.93
0.26
60,845
0.95
0.65
2.20
51
12.05
3.97
911,603
0.58
0.45
4.83
22
11.87
5.46
827,923
0.60
0.46
4.39
37
11.76
0.98
729,895
0.60
0.48
2.82
43
12.00
(1.41)
722,024
0.62
0.48
1.65
51
12.39
6.32
658,216
0.65
0.48
2.27
45
11.95
0.44
675,245
0.64
0.48
2.37
51
10.00
2.58
143,217
0.52
0.32
4.89
2
9.99
4.94
182,947
0.53
0.29
4.87
55
9.99
2.41
86,665
0.63
0.18
2.47
206
9.99
0.01
62,574
0.68
0.09
0.08
84
10.00
0.29
79,937
0.69
0.17
0.53
138
10.03
2.44
72,102
0.71
0.20
2.18
46
NOTES
TO
FINANCIAL
STATEMENTS
September
30,
2024
(Unaudited)
(1)
Organization
The
Weitz
Funds
(the
“Trust”)
is
registered
under
the
Investment
Company
Act
of
1940
(the
“’40
Act”)
as
an
open-end
management
investment
company
issuing
shares
in
series,
each
series
representing
a
distinct
portfolio
with
its
own
investment
objectives
and
policies.
At
September
30,
2024,
the
Trust
had
eight
series
in
operation:
Conservative
Allocation
Fund,
Core
Plus
Income
Fund,
Large
Cap
Equity
Fund,
Multi
Cap
Equity
Fund,
Nebraska
Tax
Free
Income
Fund,
Partners
III
Opportunity
Fund,
Short
Duration
Income
Fund,
and
Ultra
Short
Government
Fund
(individually,
a
“Fund”,
collectively,
the
“Funds”).
On
March
29,
2019,
the
Conservative
Allocation
Fund
divided
their
outstanding
shares
whereby
the
shares
held
in
accounts
with
balances
exceeding
$1.0
million
were
designated
Institutional
Class
shares.
All
remaining
shares,
that
were
not
designated
as
new
Institutional
Class
shares,
were
renamed
Investor
Class
shares.
Currently,
the
Conservative
Allocation,
Core
Plus
Income,
Large
Cap
Equity,
Multi
Cap
Equity,
Partners
III
Opportunity
and
Short
Duration
Income
Funds
each
offer
two
classes
of
shares:
Institutional
Class
and
Investor
Class
shares.
Each
class
of
shares
has
identical
rights
and
privileges,
except
with
respect
to
certain
class
specific
expenses
such
as
business
administration
and
administrative
servicing
fees,
voting
rights
on
matters
affecting
a
single
class
of
shares
and
exchange
privileges.
All
other
Funds
offer
one
class
of
shares.
The
investment
objective
of
the
Large
Cap
Equity,
Multi
Cap
Equity
and
Partners
III
Opportunity
Funds
(the
“Weitz
Equity
Funds”)
is
capital
appreciation.
The
investment
objectives
of
the
Conservative
Allocation
Fund
are
long-term
capital
appreciation,
capital
preservation
and
current
income.
The
investment
objectives
of
the
Core
Plus
Income
Fund
are
current
income
and
capital
preservation.
The
investment
objective
of
the
Nebraska
Tax
Free
Income
Fund
is
current
income
that
is
exempt
from
both
federal
and
Nebraska
personal
income
taxes,
consistent
with
the
preservation
of
capital.
The
investment
objective
of
the
Short
Duration
Income
Fund
is
current
income
consistent
with
the
preservation
of
capital.
The
investment
objective
of
the
Ultra
Short
Government
Fund
is
current
income
consistent
with
the
preservation
of
capital
and
maintenance
of
liquidity.
Investment
strategies
and
risk
factors
of
each
Fund
are
discussed
in
the
Funds’
Prospectus.
(2)
Significant
Accounting
Policies
The
Funds
are
investment
companies
and
apply
the
accounting
and
reporting
guidance
of
the
Financial
Accounting
Standards
Board
(“FASB”)
Accounting
Standards
Codification
Topic
946
Financial
Services
–
Investment
Companies.
The
following
accounting
policies
are
in
accordance
with
accounting
principles
generally
accepted
in
the
United
States.
(a)
Valuation
of
Investments
Investments
are
carried
at
fair
value
determined
using
the
following
valuation
methods:
Securities
traded
on
a
national
or
regional
securities
exchange
are
valued
at
the
last
sales
price;
if
there
were
no
sales
on
that
day,
securities
are
valued
at
the
mean
between
the
latest
available
and
representative
bid
and
ask
prices;
securities
listed
on
the
NASDAQ
exchange
are
valued
using
the
NASDAQ
Official
Closing
Price
(“NOCP”).
Generally,
the
NOCP
will
be
the
last
sales
price
unless
the
reported
trade
for
the
security
is
outside
the
range
of
the
bid/ask
price.
In
such
cases,
the
NOCP
will
be
normalized
to
the
nearer
of
the
bid
or
ask
price.
Short
sales
traded
on
a
national
or
regional
securities
exchange
are
valued
at
the
last
sales
price;
if
there
were
no
sales
on
that
day,
short
sales
are
valued
at
the
mean
between
the
latest
available
and
representative
bid
and
ask
prices.
Securities
not
listed
on
an
exchange
are
valued
at
the
mean
between
the
latest
available
and
representative
bid
and
ask
prices,
if
available.
The
value
of
certain
debt
securities
for
which
market
quotations
are
not
readily
available
may
be
based
upon
current
market
prices
of
securities
that
are
comparable
in
coupon,
rating
and
maturity
or
an
appropriate
matrix
utilizing
similar
factors.
The
value
of
a
traded
option
is
the
last
sales
price
at
which
such
option
is
traded
or,
in
the
absence
of
a
sale
on
or
about
the
close
of
the
exchange,
the
mean
of
the
closing
bid
and
ask
prices.
Money
market
funds
are
valued
at
the
quoted
net
asset
value.
The
value
of
securities
for
which
market
quotations
are
not
readily
available
or
are
deemed
unreliable,
including
restricted
and
not
readily
marketable
securities,
is
determined
in
good
faith
in
accordance
with
procedures
approved
by
the
Trust’s
Board
of
Trustees.
Such
valuation
procedures
and
methods
for
valuing
securities
may
include,
but
are
not
limited
to:
multiple
of
earnings,
multiple
of
book
value,
discount
from
value
of
a
similar
freely-traded
security,
purchase
price,
private
transaction
in
the
security
or
related
securities,
the
nature
and
duration
of
restrictions
on
disposition
of
the
security
and
a
combination
of
these
and
other
factors.
The
Board
of
Trustees
has
adopted
a
Valuation
Policy
with
regard
to
the
Trust's
valuation
of
portfolio
investments.
The
Valuation
Policy
notes
that
the
Board
of
Trustees
has
(i)
designated
Weitz
Investment
Management,
Inc.
(the
"Adviser")
as
the
valuation
designee
to
perform
fair
valuation
determinations
for
the
Funds
for
all
Fund
investments
and
(ii)
established
a
Valuation
Committee
(composed
of
Independent
Trustees)
to
oversee
the
Adviser's
activities
as
valuation
designee.
The
Adviser
has
contracted
with
Citi
Fund
Services
Ohio,
Inc.
to
perform
portfolio
accounting
services
for
the
Funds,
which
services
include
valuation
services
for
portfolio
securities.
The
Adviser
has
established
a
Pricing
Committee
(composed
of
certain
employees)
to
assist
the
Adviser,
as
valuation
designee,
with
pricing
and
valuation
matters.
The
Adviser
has
adopted
Procedures
for
Valuation
of
Portfolio
Securities
to
govern
the
Adviser
and
the
Pricing
Committee
in
carrying
out
their
valuation
responsibilities
for
the
Funds.
(b)
Option
Transactions
The
Funds,
except
for
the
Ultra
Short
Government
Fund,
may
purchase
put
or
call
options.
When
a
Fund
purchases
an
option,
an
amount
equal
to
the
premium
paid
is
recorded
as
an
asset
and
is
subsequently
marked-to-market
daily.
Premiums
paid
for
purchasing
options
that
expire
unexercised
are
recognized
on
the
expiration
date
as
realized
losses.
If
an
option
is
exercised,
the
premium
paid
is
subtracted
from
the
proceeds
of
the
sale
or
added
to
the
cost
of
the
purchase
to
determine
whether
a
Fund
has
realized
a
gain
or
loss
on
the
related
investment
transaction.
When
a
Fund
enters
into
a
closing
transaction,
a
Fund
realizes
a
gain
or
loss
depending
upon
whether
the
amount
from
the
closing
transaction
is
greater
or
less
than
the
premium
paid.
The
Funds,
except
for
the
Ultra
Short
Government
Fund,
may
write
put
or
call
options.
When
a
Fund
writes
an
option,
an
amount
equal
to
the
premium
received
is
recorded
as
a
liability
and
is
subsequently
marked-to-market
daily.
Premiums
received
for
writing
options
that
expire
unexercised
are
recognized
on
the
expiration
date
as
realized
gains.
If
an
option
is
exercised,
the
premium
received
is
subtracted
from
the
cost
of
the
purchase
or
added
to
the
proceeds
of
the
sale
to
determine
whether
a
Fund
has
realized
a
gain
or
loss
on
the
related
investment
transaction.
When
a
Fund
enters
into
a
closing
transaction,
a
Fund
realizes
a
gain
or
loss
depending
upon
whether
the
amount
from
the
closing
transaction
is
greater
or
less
than
the
premium
received.
The
Funds
attempt
to
limit
market
risk
and
enhance
their
income
by
writing
(selling)
covered
call
options.
The
risk
in
writing
a
covered
call
option
is
that
a
Fund
gives
up
the
opportunity
of
profit
if
the
market
price
of
the
financial
instrument
increases.
A
Fund
also
has
the
additional
risk
of
not
being
able
to
enter
into
a
closing
transaction
if
a
liquid
secondary
market
does
not
exist.
The
risk
in
writing
a
put
option
is
that
a
Fund
is
obligated
to
purchase
the
financial
instrument
underlying
the
option
at
prices
which
may
be
significantly
different
than
the
current
market
price.
(c)
Securities
Sold
Short
The
Funds,
except
for
the
Ultra
Short
Government
Fund,
may
engage
in
selling
securities
short,
which
obligates
a
Fund
to
replace
a
security
borrowed
by
purchasing
the
same
security
at
the
current
market
value.
A
Fund
incurs
a
loss
if
the
price
of
the
security
increases
between
the
date
of
the
short
sale
and
the
date
on
which
the
Fund
replaces
the
borrowed
security.
A
Fund
realizes
a
gain
if
the
price
of
the
security
declines
between
those
dates.
(d)
When-Issued
and
Delayed
Delivery
Transactions
The
Funds
may
purchase
securities
on
a
when-issued
basis.
Securities
may
be
purchased
on
a
when-issued
or
delayed
delivery
basis,
where
payment
and
delivery
take
place
at
a
future
date.
Since
the
market
price
of
the
security
may
fluctuate
during
the
time
before
payment
and
delivery,
the
Funds
assume
the
risk
that
the
value
of
the
security
at
delivery
may
be
more
or
less
than
the
purchase
price.
The
Funds
will
not
pay
for
such
securities
or
start
earning
interest
on
them
until
they
are
received.
Securities
purchased
on
a
when-issued
basis
are
recorded
as
an
asset
and
are
subject
to
changes
in
the
value
based
upon
changes
in
the
general
level
of
interest
rates.
The
Funds
may
sell
when-issued
securities
before
they
are
delivered,
which
may
result
in
a
capital
gain
or
loss.
All
or
a
portion
of
any
when-
issued
securities
may
be
unfunded.
The
Funds
reflect
both
the
funded
portion
of
a
when-issued
security,
as
well
as
its
unfunded
commitment
in
the
Schedule
of
Investments.
The
Funds
are
obligated
to
cover
all
commitments,
therefore,
the
Funds
must
have
resources
sufficient
to
meet
their
contractual
obligations.
Unfunded
commitments,
if
applicable,
are
included
in
“Payable
for
securities
purchased”
on
the
Statements
of
Assets
and
Liabilities.
(e)
Securities
Lending
For
the
purpose
of
generating
income,
the
Funds,
other
than
Ultra
Short
Government
Fund,
may
lend
portfolio
securities,
provided
(1)
the
loan
is
secured
continuously
by
collateral
consisting
of
cash
and/or
U.S.
Government
securities
maintained
on
a
daily
mark-to-market
basis
in
an
amount
at
least
equal
to
the
current
market
value
of
the
securities
loaned,
(2)
a
Fund
may
at
any
time
call
the
loan
and
obtain
the
return
of
securities
loaned,
(3)
a
Fund
will
receive
any
interest
or
dividends
received
on
the
loaned
securities,
and
(4)
the
aggregate
value
of
the
securities
loaned
will
not
at
any
time
exceed
one-third
of
the
total
assets
of
the
lending
Fund.
Gain
or
loss
in
the
value
of
securities
loaned
that
may
occur
during
the
term
of
the
loan
will
be
for
the
account
of
the
Funds.
Cash
collateral
received
in
connection
with
securities
lending
is
invested
by
Citibank,
NA
(the
“Securities
Lending
Agent”)
on
behalf
of
the
Funds
in
demand
deposit
accounts
and
money
market
funds.
Such
investments
are
subject
to
risk
of
payment
delays
or
default
on
the
part
of
the
issuer
or
counterparty
or
otherwise
may
not
generate
sufficient
interest
to
support
the
costs
associated
with
securities
lending.
The
Funds
could
also
experience
delays
in
recovering
their
securities
and
possible
loss
of
income
or
value
if
the
borrower
fails
to
return
the
borrowed
securities,
although
the
Funds
are
indemnified
from
this
risk
by
contract
with
the
Securities
Lending
Agent.
The
Funds
pay
the
Securities
Lending
Agent
a
portion
of
the
investment
income
(net
of
rebates)
on
cash
collateral
delivered.
Such
fees
are
netted
against
“Income
from
securities
lending”
on
the
Statements
of
Operations.
The
Core
Plus
Income
Fund
had
securities
on
loan
of
$5,064,734,
accounted
for
as
secured
borrowings
with
cash
collateral
of
overnight
and
continuous
maturities
in
the
amounts
of
$5,168,405,
as
of
September
30,
2024.
(f)
Federal
Income
Taxes
It
is
the
policy
of
each
Fund
to
comply
with
all
sections
of
the
Internal
Revenue
Code
applicable
to
regulated
investment
companies
and
to
distribute
all
of
its
taxable
income
to
shareholders;
therefore,
no
provision
for
income
or
excise
taxes
is
required.
Net
investment
income
and
net
realized
gains
may
differ
for
financial
statement
and
tax
purposes.
The
character
of
distributions
made
during
the
year
from
net
investment
income
or
net
realized
gains
may
differ
from
their
ultimate
characterization
for
federal
income
tax
purposes.
Also,
due
to
the
timing
of
dividend
distributions,
the
fiscal
year
in
which
amounts
are
distributed
may
differ
from
the
year
that
the
income
or
realized
gains
were
recorded
by
the
Funds.
The
Funds
have
reviewed
their
tax
positions
taken
on
federal
income
tax
returns,
for
each
of
the
three
open
tax
years
and
as
of
September
30,
2024,
and
have
determined
that
no
provisions
for
income
taxes
are
required
in
the
Funds’
financial
statements.
(g)
Securities
Transactions
Securities
transactions
are
accounted
for
on
the
date
the
securities
are
purchased
or
sold
(trade
date).
Realized
gains
or
losses
are
determined
by
specifically
identifying
the
security
sold.
Income
dividends
less
foreign
tax
withholding
(if
any),
dividends
on
short
positions
and
distributions
to
shareholders
are
recorded
on
the
ex-dividend
date.
Interest,
including
amortization
of
discount
or
premium,
is
accrued
as
earned.
(h)
Dividend
Policy
The
Funds
declare
and
distribute
income
dividends
and
capital
gains
distributions
as
may
be
required
to
qualify
as
a
regulated
investment
company
under
the
Internal
Revenue
Code.
Generally,
the
Nebraska
Tax
Free
Income
Fund
pays
income
dividends
on
a
quarterly
basis.
The
Conservative
Allocation
Fund
pays
dividends
on
a
semi-annual
basis.
The
Core
Plus
Income,
Short
Duration
Income
and
Ultra
Short
Government
Funds
declares
dividends
daily
and
pay
dividends
monthly.
All
dividends
and
distributions
are
reinvested
automatically,
unless
the
shareholder
elects
otherwise.
(i)
Other
Expenses
that
are
directly
related
to
a
Fund
are
charged
directly
to
that
Fund.
Other
operating
expenses
of
the
Trust
are
prorated
to
each
Fund
on
the
basis
of
relative
net
assets
or
another
appropriate
basis.
Income,
realized
and
unrealized
gains
and
losses
and
expenses
(other
than
class
specific
expenses)
are
allocated
to
each
class
of
shares
based
on
its
relative
net
assets,
except
that
each
class
separately
bears
expenses
related
specifically
to
that
class,
such
as
business
administration,
administrative
servicing
fees,
transfer
agent
fees
and
registration
fees.
(j)
Use
of
Estimates
The
preparation
of
financial
statements
in
conformity
with
accounting
principles
generally
accepted
in
the
United
States
requires
management
to
make
estimates
and
assumptions
that
affect
the
reported
amounts
of
assets
and
liabilities
and
disclosure
of
contingent
assets
and
liabilities
at
the
date
of
the
financial
statements
and
the
reported
amounts
of
increase
and
decrease
in
net
assets
from
operations
during
the
period.
Actual
results
could
differ
from
those
estimates.
(k)
In-Kind
Redemptions
The
Funds
may
meet
redemption
requests
through
an
in-
kind
distribution
of
portfolio
securities
and
cash.
For
financial
reporting
purposes,
in-kind
transactions
are
treated
as
a
sale
of
securities.
The
resulting
gains
and
losses
are
recognized
based
on
the
market
value
of
the
securities
on
the
date
of
the
redemption.
For
the
period
ended
September
30,
2024,
there
was
no
in-kind
redemption
activity.
The
net
realized
gain
(loss)
from
in-kind
transactions,
if
any,
can
be
found
on
the
Statements
of
Operations.
For
tax
purposes,
no
gains
or
losses
were
recognized.
(3)
Fund
Share
Transactions
Six
months
ended
September
30,
2024
Year
ended
March
31,
2024
Shares
$
Amount
Shares
$
Amount
Conservative
Allocation
-
Investor
Class
Sales
210,658
3,631,757
687,787
11,266,705
Redemptions
(394,454)
(6,852,52
8
)
(1,076,814)
(17,500,060)
Reinvestment
of
distributions
25,992
442,638
62,653
1,017,700
Net
increase
(decrease)
(157,804)
(2,778,133
)
(326,374)
(5,215,655)
Conservative
Allocation
-
Institutional
Class
Sales
507,861
8,702,69
8
2,632,007
42,707,371
Redemptions
(642,030)
(11,065,453)
(1,990,157)
(32,663,767)
Reinvestment
of
distributions
96,553
1,647,201
231,376
3,769,228
Net
increase
(decrease)
(37,616)
(715,554
)
873,226
13,812,832
Core
Plus
Income
-
Investor
Class
Sales
15,060,145
146,142,95
1
19,859,364
190,698,991
Redemptions
(5,413,846)
(52,551,016)
(5,519,804)
(52,614,348)
Reinvestment
of
distributions
851,240
8,217,755
1,017,441
9,704,556
Net
increase
(decrease)
10,497,539
101,809,6
90
15,357,001
147,789,199
Core
Plus
Income
-
Institutional
Class
Sales
96,525,336
932,537,47
3
118,797,883
1,135,472,689
Redemptions
(17,871,872)
(173,115,874)
(22,428,891)
(213,504,504)
Reinvestment
of
distributions
4,862,761
46,993,310
4,508,990
43,029,540
Net
increase
(decrease)
83,516,225
806,414,9
09
100,877,982
964,997,725
Large
Cap
Equity
-
Investor
Class
Sales
44,592
2,462,406
112,568
5,689,296
Redemptions
(483,388)
(26,619,430)
(1,739,419)
(86,863,680)
Reinvestment
of
distributions
—
—
523,301
26,636,003
Net
increase
(decrease)
(438,796)
(24,157,024)
(1,103,550)
(54,538,381)
Large
Cap
Equity
-
Institutional
Class
Sales
360,149
20,606,15
7
1,000,330
51,490,577
Redemptions
(406,661)
(22,660,694)
(716,378)
(36,945,072)
Reinvestment
of
distributions
—
—
298,123
15,600,789
Net
increase
(decrease)
(46,512)
(2,054,537)
582,075
30,146,294
Multi
Cap
Equity
-
Investor
Class
Sales
28,489
913,310
48,133
1,393,436
Redemptions
(448,387)
(14,479,678)
(1,536,852)
(44,478,470)
Reinvestment
of
distributions
—
—
131,980
3,868,320
Net
increase
(decrease)
(419,898)
(13,566,368)
(1,356,739)
(39,216,714)
Multi
Cap
Equity
-
Institutional
Class
Sales
114,060
3,756,500
483,272
14,379,819
Redemptions
(259,441)
(8,768,670)
(1,404,107)
(41,235,504)
Reinvestment
of
distributions
—
—
128,998
3,890,581
Net
increase
(decrease)
(145,381)
(5,012,170)
(791,837)
(22,965,104)
Nebraska
Tax
Free
Income
Sales
55,31
7
532,835
156,757
1,501,352
Redemptions
(86,839
)
(830,841)
(805,279)
(7,557,934)
Reinvestment
of
distributions
22,835
219,089
53,353
508,330
Net
increase
(decrease)
(8,687)
(78,917)
(595,169)
(5,548,252)
(4)
Related
Party
Transactions
Each
Fund
has
retained
Weitz
Investment
Management,
Inc.
as
its
investment
adviser.
In
addition,
the
Trust
has
an
agreement
with
Weitz
Securities,
Inc.
(the
“Distributor”),
a
company
affiliated
with
the
Adviser,
to
act
as
distributor
for
shares
of
the
Trust.
Certain
officers
of
the
Trust
are
also
officers
and
directors
of
the
Adviser
and
the
Distributor.
Under
the
terms
of
management
and
investment
advisory
agreements,
the
Adviser
is
paid
a
monthly
fee
based
on
average
daily
net
assets.
The
annual
investment
advisory
fee
schedule
for
each
of
the
Funds
is
as
follows:
Business
administration
services
:
The
Trust
has
a
business
administration
agreement
with
the
Adviser
under
which
the
Trust
compensates
the
Adviser
for
providing
business
administration
services
for
all
share
classes
of
the
Funds.
Services
encompass
supervising
all
aspects
of
the
management
and
operations
of
the
Trust,
including
monitoring
the
Trust’s
relationships
with
third-party
service
providers
that
may
be
retained
from
time
to
time
by
the
Trust.
Administrative
services
:
The
Trust
has
administrative
services
plans
under
which
the
Trust
compensates
the
Adviser
for
administrative
services
provided
to
all
share
classes
of
the
Funds.
Effective
July
31,
2024,
this
plan
was
terminated
for
the
Institutional
share
classes.
Administrative
services
are
provided
by
the
Adviser
or
by
certain
financial
intermediaries
with
respect
to
non-distribution
services
to
fund
shareholders.
These
services
include,
but
are
not
limited
to,
providing
shareholder
statements,
assisting
with
shareholder
communications
and
sub-accounting
services
in
connection
with
omnibus
accounts.
Under
the
terms
of
a
services
agreement
between
the
Adviser
and
Citi
Fund
Services
Ohio,
Inc.
(“CFSO”),
CFSO
provides
certain
accounting
and
administrative
services
to
the
Funds.
These
services
include,
among
other
things,
arranging
for
the
payment
of
direct
operating
expenses
of
the
Funds
from
the
accounts
of
the
Funds.
Six
months
ended
September
30,
2024
Year
ended
March
31,
2024
Shares
$
Amount
Shares
$
Amount
Partners
III
Opportunity
-
Investor
Class
Sales
49,412
589,377
54,188
598,793
Redemptions
(37,715)
(448,895)
(252,082)
(2,822,694)
Reinvestment
of
distributions
—
—
36,400
394,936
Net
increase
(decrease)
11,697
140,482
(161,494)
(1,828,965)
Partners
III
Opportunity
-
Institutional
Class
Sales
393,370
5,048,354
713,609
8,726,930
Redemptions
(1,236,080)
(16,195,402)
(6,240,320)
(77,210,364)
Reinvestment
of
distributions
—
—
1,818,252
21,637,214
Net
increase
(decrease)
(842,710)
(11,147,048)
(3,708,459)
(46,846,220)
Short
Duration
Income
-
Investor
Class
Sales
414,690
4,929,141
1,237,907
14,523,956
Redemptions
(399,648)
(4,743,39
2
)
(2,400,049)
(28,145,397)
Reinvestment
of
distributions
55,066
654,958
117,985
1,378,290
Net
increase
(decrease)
70,108
840,70
7
(1,044,157)
(12,243,151)
Short
Duration
Income
-
Institutional
Class
Sales
16,325,198
194,680,62
2
26,991,109
317,586,932
Redemptions
(12,124,085)
(144,496,841)
(22,126,143)
(260,620,887)
Reinvestment
of
distributions
1,695,214
20,216,081
2,820,151
33,088,765
Net
increase
(decrease)
5,896,327
70,399,86
2
7,685,117
90,054,810
Ultra
Short
Government
Sales
1,624,900
16,237,807
14,687,735
146,687,546
Redemptions
(6,014,023)
(60,108,169)
(5,682,534)
(56,765,673)
Reinvestment
of
distributions
392,668
3,923,898
631,018
6,281,414
Net
increase
(decrease)
(3,996,455)
(39,946,464)
9,636,219
96,203,287
Greater
Than
($)
Less
Than
or
Equal
To
($)
Rate
(%)
Conservative
Allocation
0
0.60
Core
Plus
Income
0
0.40
Large
Cap
Equity
0
5,000,000,000
5,000,000,000
0.75
0.70
Multi
Cap
Equity
0
5,000,000,000
5,000,000,000
0.75
0.70
Nebraska
Tax
Free
Income
0
0.40
Partners
III
Opportunity
0
1,000,000,000
2,000,000,000
3,000,000,000
5,000,000,000
1,000,000,000
2,000,000,000
3,000,000,000
5,000,000,000
1.00
0.95
0.90
0.85
0.80
Short
Duration
Income
0
0.40
Ultra
Short
Government
0
0.30
Through
July
31,
2025,
the
Adviser
has
agreed
in
writing
to
reimburse
or
to
pay
directly
a
portion
of
the
Funds’
expenses
to
limit
the
net
annual
operating
expense
ratio
(excluding
taxes,
interest,
brokerage
costs,
acquired
fund
fees
and
expenses
and
extraordinary
expenses).
The
amount
listed
under
“Due
to
Adviser”
is
net
of
any
expenses
waived/reimbursed
by
the
Adviser.
The
current
expense
caps
and
dollar
amount
of
expenses
reimbursed
during
the
period
ended
September
30,
2024,
are
as
follows:
As
of
September
30,
2024,
the
controlling
shareholder
of
the
Adviser
held
shares
totaling
approximately
1%,
1%,
4%,
2%
and
6%
of
the
Core
Plus
Income,
Large
Cap
Equity,
Multi
Cap
Equity,
Partners
III
Opportunity
and
Ultra
Short
Government
Funds,
respectively.
(5)
Distributions
to
Shareholders
and
Distributable
Earnings
The
tax
character
of
distributions
paid
by
the
Funds
for
the
past
two
tax
years
are
summarized
as
follows
(in
U.S.
dollars):
As
of
the
tax
year
ended
March
31,
2024,
the
components
of
net
assets
on
a
tax
basis
were
as
follows
(in
U.S.
dollars):
Annual
Operating
Expense
Ratio
Cap*
Conservative
Allocation
Core
Plus
Income
#
Large
Cap
Equity
Multi
Cap
Equity
Nebraska
Tax
Free
Income
Short
Duration
Income
#
Ultra
Short
Government
Annual
Operating
Expense
Cap(%):
Investor
Class
0.85
0.6
5
1.09
1.09
0.45
0.
6
5
Institutional
Class
0.70
0.45
0.89
0.89
0.
45
0.
32
Expenses
Reimbursed
by
the
Adviser
(in
U.S.
dollars):
Investor
Class
37,260
205,691
—
—
77,596
39,041
Institutional
Class
72,296
828,957
—
—
577,288
168,311
*
Funds
with
a
single
share
class
are
shown
with
the
Investor
Class,
except
for
the
Ultra
Short
Government
Fund
which
has
been
designated
Institutional
Class.
#
Prior
to
July
31,
2024,
the
annual
operating
expense
ratio
cap
was
0.55%
for
the
Investor
Class.
Conservative
Allocation
Core
Plus
Income
Large
Cap
Equity
Multi
Cap
Equity
Year
Ended
March
31,
Year
Ended
March
31,
Year
Ended
March
31,
Year
Ended
March
31,
Distributions
paid
from:
2024
2023
2024
2023
2024
2023
2024
2023
Ordinary
income
3,862,637
2,020,621
57,138
,
337
15,602,351
–
–
–
–
Long-term
capital
gains
965,892
1,964,516
–
464,955
45,403,853
93,222,998
9,505,301
26,233,063
Total
distributions
+
4,828,529
3,985,137
57,138,337
16,067,306
45,403,853
93,222,998
9,505,301
26,233,063
Nebraska
Tax
Free
Income
Partners
III
Opportunity
Short
Duration
Income
Ultra
Short
Government
Year
Ended
March
31,
Year
Ended
March
31,
Year
Ended
March
31,
Year
Ended
March
31,
Distributions
paid
from:
2024
2023
2024
2023
2024
2023
2024
2023
Ordinary
income
75,387
55,647
1,803,150
–
35,352
,
192
22,619,297
6,922
,
114
1,647,995
Tax-exempt
income
449,318
451,594
–
–
–
–
–
–
Long-term
capital
gains
–
–
24,988,981
33,098,892
–
572,444
–
–
Total
distributions
+
524,705
507,241
26,792,131
33,098,892
35,352
,
192
23,191,741
6,922
,
114
1,647,995
+
Total
distributions
paid
may
differ
from
the
Statements
of
Changes
in
Net
Assets
because
dividends
are
recognized
when
actually
paid
for
tax
purposes.
Conservative
Allocation
Core
Plus
Income
Large
Cap
Equity
Multi
Cap
Equity
Nebraska
Tax
Free
Income
Cost
of
investments
184,713,873
1,785,893
,
63
5
449,790,859
257,258,
525
23,654,979
Gross
unrealized
appreciation
54,366,
219
15,813,
500
495,734,93
5
318,519,74
6
3,989
Gross
unrealized
depreciation
(4,501,699)
(44,887,640)
(4,773,136)
(510,495)
(892,426)
Net
unrealized
appreciation
(depreciation)
49,864,520
(29,074,140
)
490,961,79
9
318,009,2
51
(888,437)
Undistributed
ordinary
income
1,172,3
48
109,28
1
—
—
—
Qualified
late
year
ordinary
loss
deferral
—
—
(517,199)
(364,3
80
)
—
Undistributed
tax-exempt
income
—
—
—
—
30,94
7
Undistributed
long-term
gains
3,138,972
—
59,119,85
7
19,237,553
—
Capital
loss
carryforwards
—
(5,067,31
7
)
—
(604,072
)
(422,748)
Paid-in
capital
181,069,02
2
1,744,624
,
857
389,845,236
238,404,307
24,314,33
8
Net
assets
235,244,862
1,710,592,681
939,409,693
574,682,6
59
23,034,100
The
Large
Cap
Equity
and
Multi
Cap
Equity
Funds
elected
to
defer
ordinary
losses
arising
after
December
31,
2023,
and
the
Partners
III
Opportunity
Fund
elected
to
defer
post-October
capital
losses
incurred
after
October
31,
2023.
These
losses
are
treated
for
tax
purposes
as
arising
on
April
1,
2024.
Capital
loss
carryforwards
represent
tax
basis
capital
losses
that
may
be
carried
over
to
offset
future
realized
capital
gains,
if
any.
To
the
extent
that
carryforwards
are
used,
no
capital
gains
distributions
will
be
made.
The
character
and
utilization
of
the
carryforwards
are
as
follows
(in
U.S.
Dollars):
(6)
Securities
Transactions
Purchases
and
proceeds
from
maturities
or
sales
of
investment
securities
of
the
Funds
for
the
six
months
ended
September
30,
2024,
excluding
fund
merger
transactions,
in-kind
transactions,
short-term
securities
and
U.S.
government
obligations,
are
summarized
as
follows
(in
U.S.
dollars):
(a)
Options
Written
The
locations
in
the
Statements
of
Assets
and
Liabilities
as
of
September
30,
2024,
of
the
Funds’
derivative
positions,
none
of
which
are
designated
as
hedging
instruments,
are
as
follows
(in
U.S.
dollars):
Transactions
in
derivative
instruments
during
the
period
ended
September
30,
2024,
are
recorded
in
the
following
locations
in
the
Statements
of
Operations
(in
U.S.
dollars):
Partners
III
Opportunity
Short
Duration
Income
Ultra
Short
Government
Cost
of
investments
222,173,204
892,278,
968
182,042,729
Gross
unrealized
appreciation
203,568,344
3,684,094
16,898
Gross
unrealized
depreciation
(23,118,690)
(20,816,373)
(11,449)
Net
unrealized
appreciation
(depreciation)
180,449,654
(17,132,279)
5,449
Undistributed
ordinary
income
91,741
287,084
788
,6
01
Undistributed
long-term
gains
16,317,025
—
—
Capital
loss
carryforwards
—
(2,242,290)
(18,043)
Dividend
payable
—
—
(770,581)
Post
October
capital
loss
deferral
(1,565,410)
—
—
Paid-in
capital
228,503,927
876,114
,
949
182,941
,
345
Net
assets
423,796,937
857,027,464
182,946,771
Core
Plus
Income
Multi
Cap
Equity
Nebraska
Tax
Free
Income
Short
Duration
Income
Ultra
Short
Government
Short
term
(no
expirations)
869,095
22,332
—
150,901
14,141
Long
term
(no
expirations)
4,198,222
581,740
442,748
2,091,389
3,902
Capital
loss
carryforwards
utilized
—
8,357,243
—
—
—
Conservative
Allocation
Core
Plus
Income
Large
Cap
Equity
Multi
Cap
Equity
Nebraska
Tax
Free
Income
Partners
III
Opportunity
Short
Duration
Income
Ultra
Short
Government
Purchases
13,997,700
372,704,194
132,627,471
29,987,315
—
53,204,039
152,491,189
199,996
Proceeds
20,053,593
82,804,519
148,006,789
47,777,512
120,000
61,895,425
137,665,775
1,407,527
Fund
Type
of
Derivative
Location
Value
of
Asset
Derivatives
Value
of
Liability
Derivative
Average
Month-End
Notional
Amount
Gross
Notional
Amount
Outstanding
Partners
III
Opportunity
Equity
call
options
written
Options
written,
at
value
—
(70,560)
2,092,000
2,352,000
Fund
Type
of
Derivative
Location
Realized
Gain
(Loss)
Location
Change
in
Unrealized
Gain
(Loss)
Partners
III
Opportunity
Equity
call
options
written
Net
realized
gain
(loss)
-
options
written
279,041
Net
unrealized
appreciation
(depreciation)
-
options
written
129,576
(7)
Illiquid
Restricted
Securities
A
restricted
security
is
a
security
which
has
been
purchased
through
a
private
offering
and
cannot
be
resold
to
the
general
public
without
prior
registration
under
the
Securities
Act
of
1933
(the
“1933
Act”)
or
pursuant
to
the
resale
limitations
provided
by
Rule
144A
under
the
1933
Act,
or
an
exemption
from
the
registration
requirements
of
the
1933
Act.
The
Adviser
preliminarily
identifies
illiquid
investments
based
on,
among
other
things,
the
trading
characteristics
and
market
depth
of
a
particular
investment.
Not
all
restricted
securities
are
considered
illiquid.
The
illiquid
restricted
securities
held
as
of
September
30,
2024,
are
as
follows
(in
U.S.
dollars):
(8)
Affiliated
Issuers
Affiliated
issuers,
as
defined
under
the
Investment
Company
Act
of
1940,
are
those
in
which
a
Fund’s
holdings
of
an
issuer
represent
5%
or
more
of
the
outstanding
voting
securities
of
the
issuer.
A
summary
of
each
Fund’s
holdings
in
the
securities
of
such
issuers
is
set
forth
below:
(9)
Contingencies
Each
Fund
indemnifies
the
Trust’s
officers
and
trustees
for
certain
liabilities
that
might
arise
from
their
performance
of
their
duties
to
each
of
the
Funds.
Additionally,
in
the
normal
course
of
business
the
Funds
enter
into
contracts
that
contain
a
variety
of
representations
and
warranties
and
which
provide
general
indemnifications.
The
Funds’
maximum
exposure
under
these
arrangements
is
unknown,
as
this
would
involve
future
claims
that
may
be
made
against
the
Funds
that
have
not
yet
occurred.
However,
based
on
experience,
the
Funds
expect
the
risk
of
loss
to
be
remote.
(10)
Financial
Instruments
With
Off-Balance
Sheet
Risks
Option
contracts
written
and
securities
sold
short
result
in
off-
balance
sheet
risk
as
the
Funds’
ultimate
obligation
to
satisfy
the
terms
of
the
contract
or
the
sale
of
securities
sold
short
may
exceed
the
amount
recognized
in
the
Statements
of
Assets
and
Liabilities.
The
Funds
are
required
to
maintain
collateral
in
a
segregated
account
to
provide
adequate
margin
as
determined
by
the
broker.
(11)
Margin
Borrowing
Agreement
The
Partners
III
Opportunity
Fund
has
a
margin
account
with
its
prime
broker,
Northern
Trust
Securities,
Inc.,
under
which
the
Fund
may
borrow
against
the
value
of
its
securities,
subject
to
regulatory
limitations.
Interest
accrues
at
the
National
Finance
Base
Lending
Rate
(“NFBLR”)
plus
a
minimum
of
0.75%
to
a
maximum
of
2.25%
depending
on
the
average
balance.
The
NFBLR
was
9.50%
at
September
30,
2024.
Interest
is
accrued
daily
and
paid
monthly.
The
Partners
III
Opportunity
Fund
held
a
cash
balance
of
$20,030,500
with
the
broker
at
September
30,
2024.
The
Partners
III
Opportunity
Fund
is
exposed
to
credit
risk
from
its
prime
broker
who
effects
transactions
and
extends
credit
pursuant
to
a
prime
brokerage
agreement.
The
Adviser
attempts
to
minimize
the
credit
risk
by
monitoring
credit
exposure
and
the
creditworthiness
of
the
prime
broker.
(12)
Concentration
of
Credit
Risk
Approximately
87.5%
of
the
Nebraska
Tax
Free
Income
Fund’s
net
assets
are
in
obligations
of
political
subdivisions
of
the
State
of
Nebraska,
which
are
subject
to
the
credit
risk
associated
with
the
non-performance
of
such
issuers.
(13)
Fair
Value
Measurements
Various
inputs
are
used
in
determining
the
value
of
the
Funds’
investments.
These
inputs
are
used
in
determining
the
value
of
the
Funds’
investments
and
are
summarized
in
the
following
fair
value
hierarchy:
Level
1
–
quoted
prices
in
active
markets
for
identical
securities;
Level
2
–
other
significant
observable
inputs
(including
quoted
prices
for
similar
securities);
Level
3
–
significant
unobservable
inputs
(including
the
Funds’
own
assumptions
in
determining
the
fair
value
of
investments).
The
inputs
or
methodology
used
for
valuing
securities
are
not
an
indication
of
the
risk
associated
with
investing
in
those
securities.
A
description
of
the
valuation
techniques
applied
to
the
Funds’
major
categories
of
assets
and
liabilities
measured
at
fair
value
on
a
recurring
basis
follows.
Equity
securities
and
Exchange-traded
funds.
Securities
traded
on
a
national
securities
exchange
(or
reported
on
the
NASDAQ
national
market)
are
stated
at
the
last
reported
sales
price
on
the
day
of
valuation.
To
the
extent
these
securities
are
actively
traded
and
valuation
adjustments
are
not
applied,
they
are
categorized
in
Level
1
of
the
fair
value
hierarchy.
Preferred
stock
and
other
equities
traded
on
inactive
markets
or
valued
by
reference
to
similar
instruments
are
categorized
in
Level
2.
Corporate
and
Municipal
bonds.
The
fair
values
of
corporate
and
municipal
bonds
are
estimated
using
various
techniques,
which
may
consider
recently
executed
transactions
in
securities
of
the
issuer
or
comparable
issuers,
market
price
quotations
(where
observable),
bond
spreads
and
fundamental
data
relating
to
the
issuer.
Although
most
Fund
Security
Acquisition
Date
(a)
Acquisition
Cost
Principal
Amount
Value
Percentage
of
Net
Assets(%)
Core
Plus
Income
New
Mountain
Guardian
IV
Income
Rated
Feeder
II,
Ltd.,
Series
2024-1A
Class
B
3/28/24
4,765,000
4,765,000
4,757,286
0.2
Core
Plus
Income
New
Mountain
Guardian
IV
Income
Rated
Feeder
II,
Ltd.,
Series
2024-1A
Class
C
3/28/24
3,825,000
3,825,000
3,813,230
0.1
Core
Plus
Income
New
Mountain
Guardian
IV
Income
Rated
Feeder
II,
Ltd.,
Series
2024-1A
Class
D
3/28/24
3,000,000
3,000,000
2,985,688
0.1
Short
Duration
Income
New
Mountain
Guardian
IV
Income
Rated
Feeder
II,
Ltd.,
Series
2024-1A
Class
A
3/28/24
5,000,000
5,000,000
4,992,778
0.5
(a)
Acquisition
date
represents
the
initial
purchase
date
of
the
security.
Value
3/31/2024
Purchases
at
Cost
Proceeds
from
Sales
Net
Realized
Gain(Loss)
Net
Change
in
Unrealized
Appreciation/
(Depreciation)
Value
9/30/2024
Shares
as
of
9/30/2024
Dividend
Income
Partners
III
Opportunity
CoreCard
Corp.
$5,690,750
$
—
$
—
$
—
$1,787,050
$7,477,800
515,000
$
—
corporate
and
municipal
bonds
are
categorized
in
Level
2
of
the
fair
value
hierarchy,
in
instances
where
lower
relative
weight
is
placed
on
transaction
prices,
quotations,
or
similar
observable
inputs,
they
are
categorized
in
Level
3.
Asset-backed
securities.
The
fair
values
of
asset-backed
securities
(including
non-government
agency
mortgage-
backed
securities
and
interest-only
securities)
are
generally
estimated
based
on
models
that
consider
the
estimated
cash
flows
of
each
tranche
of
the
entity,
a
benchmark
yield
and
an
estimated
tranche
specific
spread
to
the
benchmark
yield
based
on
the
unique
attributes
of
the
tranche.
Certain
securities
are
valued
principally
using
dealer
quotations.
To
the
extent
the
inputs
are
observable
and
timely,
the
values
are
categorized
in
Level
2
of
the
fair
value
hierarchy;
otherwise
they
are
categorized
as
Level
3.
U.S.
Government
securities.
U.S.
Government
securities
are
normally
valued
using
a
model
that
incorporates
market
observable
data
such
as
reported
sales
of
similar
securities,
broker
quotes,
yields,
bids,
offers
and
reference
data.
Certain
securities
are
valued
principally
using
dealer
quotations.
U.S.
Government
securities
are
categorized
in
Level
1
or
Level
2
of
the
fair
value
hierarchy
depending
on
the
inputs
used
and
market
activity
levels
for
specific
securities.
U.S.
agency
securities.
U.S.
agency
securities
are
comprised
of
two
main
categories
consisting
of
agency
issued
debt
and
mortgage-backed
securities.
Agency
issued
debt
securities
are
generally
valued
in
a
manner
similar
to
U.S.
Government
securities.
Mortgage-backed
securities
include
collateralized
mortgage
obligations,
to-be-announced
(TBA)
securities
and
mortgage
pass-through
certificates.
Mortgage-backed
securities
are
generally
valued
using
dealer
quotations.
Depending
on
market
activity
levels
and
whether
quotations
or
other
data
are
used,
these
securities
are
typically
categorized
in
Level
2
of
the
fair
value
hierarchy.
Restricted
and/or
illiquid
securities.
Restricted
and/or
illiquid
securities
for
which
quotations
are
not
readily
available
are
valued
in
accordance
with
procedures
approved
by
the
Trust’s
Board
of
Trustees.
Restricted
securities
issued
by
publicly
traded
companies
are
generally
valued
at
a
discount
to
similar
publicly
traded
securities.
Restricted
or
illiquid
securities
issued
by
nonpublic
entities
are
valued
by
reference
to
comparable
public
entities
or
fundamental
data
relating
to
the
issuer
or
both.
Depending
on
the
relative
significance
of
valuation
inputs,
these
instruments
are
classified
in
either
Level
2
or
Level
3
of
the
fair
value
hierarchy.
Derivative
instruments.
Listed
derivatives,
such
as
the
Funds’
equity
option
contracts
and
warrants,
that
are
valued
based
on
closing
prices
from
the
exchange
or
the
mean
of
the
closing
bid
and
ask
prices
are
generally
categorized
in
Level
1
or
Level
2
of
the
fair
value
hierarchy
depending
on
the
market
activity
levels.
The
following
is
a
summary
of
inputs
used,
in
U.S.
dollars,
as
of
September
30,
2024,
in
valuing
the
Funds’
assets
and
liabilities
carried
at
fair
value.
The
Schedule
of
Investments
for
each
Fund
provides
a
detailed
breakdown
of
each
category.
For
the
period
ended
September
30,
2024,
there
were
no
transfers
into
or
out
of
Level
3.
Conservative
Allocation
Level
1
Level
2
Level
3
Total
Assets:
Investments
in
Securities:
Common
Stocks
106,293,377
—
—
106,293,377
Corporate
Bonds
—
496,680
—
496,680
Asset-Backed
Securities
—
16,734,578
—
16,734,578
Commercial
Mortgage-Backed
Securities
—
5,065,401
—
5,065,401
Mortgage-Backed
Securities
—
15,769,984
—
15,769,984
U.S.
Treasuries
—
77,979,367
—
77,979,367
Cash
Equivalents
7,768,128
14,932,228
—
22,700,356
Total
Investments
in
Securities
114,061,505
130,978,238
—
245,039,743
Core
Plus
Income
Level
1
Level
2
Level
3
Total
Assets:
Investments
in
Securities:
Corporate
Bonds
—
326,578,814
—
326,578,814
Corporate
Convertible
Bonds
—
492,500
—
492,500
Asset-Backed
Securities
—
484,861,341
—
484,861,341
Commercial
Mortgage-Backed
Securities
—
168,427,632
—
168,427,632
Mortgage-Backed
Securities
—
916,740,026
—
916,740,026
Municipal
Bonds
—
500,864
—
500,864
U.S.
Treasuries
—
762,560,621
—
762,560,621
Cash
Equivalents
29,155,870
—
—
29,155,870
Short-Term
Securities
Held
as
Collateral
for
Securities
on
Loan
5,168,405
—
—
5,168,405
Total
Investments
in
Securities
34,324,275
2,660,161,798
—
2,694,486,073
Large
Cap
Equity
Level
1
Level
2
Level
3
Total
Assets:
Investments
in
Securities:
Common
Stocks
944,217,178
—
—
944,217,178
Cash
Equivalents
16,731,095
—
—
16,731,095
Total
Investments
in
Securities
960,948,273
—
—
960,948,273
Multi
Cap
Equity
Level
1
Level
2
Level
3
Total
Assets:
Investments
in
Securities:
Common
Stocks
562,106,364
5,067,304
—
567,173,668
Warrants
—
—
90,625
#
90,625
Cash
Equivalents
10,247,261
16,954,728
—
27,201,989
Total
Investments
in
Securities
572,353,625
22,022,032
90,625
594,466,282
Nebraska
Tax
Free
Income
Level
1
Level
2
Level
3
Total
Assets:
Investments
in
Securities:
Municipal
Bonds
—
21,906,768
—
21,906,768
Cash
Equivalents
1,100,824
—
—
1,100,824
Total
Investments
in
Securities
1,100,824
21,906,768
—
23,007,592
(14)
Changes
in
Accountants
On
September
27,
2024,
The
Funds
replaced
their
existing
independent
registered
public
accounting
firm,
Ernst
&
Young
LLP
(“E&Y”),
with
Deloitte
&
Touche
LLP.
There
were
no
disagreements
with
E&Y
on
any
matter
of
accounting
principles
or
practices,
financial
statement
disclosure,
or
auditing
scope
or
procedure.
(15)
Subsequent
Events
Management
have
evaluated
the
impact
of
all
subsequent
events
on
the
Funds
through
the
date
the
financial
statements
were
issued
and
has
determined
that
there
were
no
subsequent
events
requiring
recognition
or
disclosure
in
the
financial
statements.
Partners
III
Opportunity
Level
1
Level
2
Level
3
Total
Assets:
Investments
in
Securities:
Common
Stocks
406,713,518
—
—
406,713,518
Warrants
—
—
271,875
#
271,875
Cash
Equivalents
18,923,505
22,901,267
—
41,824,772
Total
Investments
in
Securities
425,637,023
22,901,267
271,875
448,810,165
Liabilities:
Securities
Sold
Short
(20,081,600)
—
—
(20,081,600)
Options
(70,560)
—
—
(70,560)
Short
Duration
Income
Level
1
Level
2
Level
3
Total
Assets:
Investments
in
Securities:
Corporate
Bonds
—
72,505,934
—
72,505,934
Corporate
Convertible
Bonds
—
2,955,000
—
2,955,000
Asset-Backed
Securities
—
350,069,571
—
350,069,571
Commercial
Mortgage-Backed
Securities
—
64,565,056
—
64,565,056
Mortgage-Backed
Securities
—
182,020,296
—
182,020,296
U.S.
Treasuries
—
215,445,597
—
215,445,597
Cash
Equivalents
38,322,041
—
—
38,322,041
Total
Investments
in
Securities
38,322,041
887,561,454
—
925,883,495
Ultra
Short
Government
Level
1
Level
2
Level
3
Total
Assets:
Investments
in
Securities:
Asset-Backed
Securities
—
389,894
—
389,894
U.S.
Treasuries
—
93,894,086
—
93,894,086
Cash
Equivalents
36,225,223
34,778,942
—
71,004,165
Total
Investments
in
Securities
36,225,223
129,062,922
—
165,288,145
#
A
reconciliation
of
assets
in
which
Level
3
inputs
are
used
in
determining
fair
value,
along
with
the
additional
quantitative
disclosures,
are
presented
when
there
are
significant
Level
3
investments
at
the
end
of
the
period..
Factors
Considered
by
the
Board
of
Trustees
in
Connection
with
the
Approval
of
the
Continuation
of
the
Management
and
Investment
Advisory
Agreements
with
Weitz
Investment
Management,
Inc.
for
each
of
the
Funds
In
accordance
with
the
Investment
Company
Act
of
1940,
as
amended
(the
“1940
Act”),
the
Board
of
Trustees
(the
“Trustees”
or
“Board”)
of
the
Funds
is
required,
on
an
annual
basis,
to
consider
the
continuation
of
the
Management
and
Investment
Advisory
Agreements
(the
“Agreements”)
between
the
Funds
and
Weitz
Investment
Management,
Inc.
(“Weitz
Inc.”
or
the
“Adviser”),
and
this
must
take
place
at
an
in-person
meeting
of
the
Board.
The
relevant
provisions
of
the
1940
Act
specifically
provide
that
it
is
the
duty
of
the
Board
to
request
and
evaluate
such
information
as
the
Board
determines
is
necessary
to
allow
them
to
properly
consider
the
continuation
of
the
Agreements,
and
it
is
the
duty
of
Weitz
Inc.
to
furnish
the
Trustees
with
such
information
that
is
responsive
to
their
request.
Accordingly,
in
determining
whether
to
approve
the
continuation
of
the
Agreements
between
the
Funds
and
Weitz
Inc.,
the
Board
requested,
and
Weitz
Inc.
provided,
information
and
data
relevant
to
the
Board’s
consideration.
This
included
materials
prepared
by
Weitz
Inc.
and
materials
prepared
by
an
independent
informational
services
firm
that
produced
materials
specifically
for
the
Board
that
provided
the
Board
with
information
regarding
the
investment
performance
of
the
Funds
and
information
regarding
the
fees
and
expenses
of
the
Funds,
as
compared
to
other
similar
mutual
funds.
As
part
of
its
deliberations,
the
Board
also
considered
and
relied
upon
information
about
the
Funds
and
Weitz
Inc.
that
they
had
received
during
the
past
year
in
connection
with
their
regular
Board
meetings
at
which
they
engage
in
the
ongoing
oversight
of
the
Funds
and
their
operations.
The
Board
most
recently
considered
the
continuation
of
the
Agreements
for
each
of
the
Funds
at
an
in-person
meeting
held
on
May
23,
2024.
At
this
meeting
the
Board
engaged
in
a
thorough
review
process
in
connection
with
determining
whether
to
continue
the
Agreements.
During
the
meeting
the
Board
discussed
the
Agreements
with
representatives
of
Weitz
Inc.
and
they
reviewed
various
factors
with
them
concerning
the
proposed
continuation
of
the
Agreements.
As
discussed
more
fully
below,
among
the
factors
considered
by
the
Board
were:
(1)
the
nature,
extent
and
quality
of
the
advisory
services
provided,
including
the
investment
performance
of
the
Funds;
(2)
the
cost
of
advisory
services
provided
and
the
expected
level
of
profitability,
which
included
comparative
information
on
fees
and
expenses
borne
by
other
similar
mutual
funds;
(3)
the
extent
to
which
economies
of
scale
may
be
realized
as
the
Funds
grow
and
whether
the
advisory
fees
reflect
possible
economies
of
scale;
(4)
benefits
to
Weitz
Inc.
from
its
relationship
with
the
Funds
(and
any
corresponding
benefits
to
the
Funds);
and
(5)
such
other
considerations
deemed
appropriate
by
the
Board
in
making
an
informed
business
decision
regarding
the
continuation
of
the
Agreements.
With
respect
to
the
equity
funds
managed
by
Weitz
Inc.,
consisting
of
the
Large
Cap
Equity
Fund,
the
Multi
Cap
Equity
Fund
and
the
Partners
III
Opportunity
Fund
(the
“Equity
Funds”),
the
Board
noted
the
applicable
investment
objectives,
strategies
and
fee
arrangements
for
each
Equity
Fund
and
they
also
noted
Weitz
Inc.’s
investment
expertise
and
the
investment
strategies
utilized
by
the
firm
with
respect
to
each
Equity
Fund.
Among
the
factors
the
Board
considered
for
each
Equity
Fund
was
the
overall
performance
of
each
Fund
relative
to
its
peer
group
on
a
long-term
basis
and
over
shorter
time
periods.
The
Board
discussed
with
the
representatives
of
management
the
fact
that
the
Adviser
maintains
a
particular
focus
on
long-term
investment
performance
results
and
they
reviewed
the
reasons
why
this
may,
from
time
to
time,
cause
the
longer-term
performance
results
and
the
shorter-term
performance
results
to
compare
differently
when
compared
to
similar
funds
for
similar
time
periods.
In
connection
with
this,
the
Board
took
note
of
management’s
stated
position
that
achieving
favorable
long-term
investment
results
is
a
primary
objective
of
the
firm
and
that
as
a
result
of
this
emphasis
on
longer-term
results,
shorter-term
results
which
lag
their
peers
and
their
relative
indexes
are
likely
to
occur
from
time
to
time
over
various
investment
cycles.
With
respect
to
the
Trustees’
review
of
the
performance
results
of
the
Equity
Funds
over
various
time
periods,
it
was
noted
by
the
Adviser
representatives
that
the
Adviser
seeks
risk
adjusted
returns
and
that
depending
on
their
view
of
the
markets
at
any
particular
time,
the
Adviser
may
take
a
more
conservative
investment
approach.
It
was
also
noted
that
during
the
bull
market
in
the
equity
markets
that
has
been
ongoing
over
the
past
few
years,
the
value
style
of
investing
adhered
to
by
the
Adviser
has
generally
been
out
of
favor,
which
has
negatively
impacted
the
performance
of
the
Equity
Funds.
The
Trustees
took
into
consideration
that
the
Adviser
has
continued
to
invest
in
a
manner
that
is
fully
consistent
with
the
Prospectus
disclosure
for
the
Equity
Funds
and
the
Adviser’s
public
statements
referring
to
its
investment
strategies,
and
the
Trustees
acknowledged
that
the
Adviser
has,
in
fact,
consistently
maintained
its
adherence
to
value-oriented
investment
strategies
and
has
not
attempted
to
deviate
from
this
style
of
investing
in
response
to
developments
in
the
equity
markets.
The
Adviser
representatives
informed
the
Trustees
that
they
intend
to
continue
to
seek
investment
opportunities
that
are
intended
to
help
enhance
the
investment
performance
results
for
the
Equity
Funds.
The
Board
also
considered
the
Adviser’s
acknowledgment
of
each
Fund’s
relative
performance
against
its
peers
and
the
Adviser’s
commitment
to
improving
the
performance
of
the
Funds.
In
addition,
the
Board
compared
expenses
of
each
Equity
Fund
to
the
expenses
of
its
peer
group,
noting
that:
(i)
the
net
expenses
for
the
Institutional
Class
shares
of
the
Large
Cap
Equity
Fund
(after
fee
waivers)
are
above
industry
averages
for
operating
expenses
of
other
funds
of
similar
size
and
investment
objective,
(ii)
the
net
expenses
for
the
Institutional
Class
shares
of
the
Multi
Cap
Equity
Fund
(after
fee
waivers)
are
above
industry
averages
for
operating
expenses
of
other
funds
of
similar
size
and
investment
objective,
and
(iii)
the
total
expenses
for
the
Institutional
Class
shares
of
the
Partners
III
Fund
(exclusive
of
the
dividend
and
interest
expense
incurred
by
the
Fund)
are
below
industry
averages
for
total
operating
expenses
of
other
funds
of
similar
size
and
investment
objective.
In
considering
the
investment
advisory
fees
applicable
to
each
Equity
Fund,
the
Board
discussed
with
the
Adviser
representatives
their
reasons
for
assessing
the
applicable
fees
in
connection
with
each
Equity
Fund.
The
Board
then
considered
and
discussed
the
fees
charged
by
similar
funds
in
each
respective
investment
category.
The
Board
also
considered
the
fact
that
the
investment
advisory
fees
for
each
Equity
Fund
are
subject
to
breakpoints
which
result
in
reduced
investment
advisory
fees
as
assets
increase,
and
the
Board
agreed
that
this
type
of
fee
structure
is
reasonable
and
fair
to
shareholders.
The
members
of
the
Board
also
reviewed
matters
with
respect
to
the
terms
of
the
Expense
Limitation
Agreements
that
are
in
effect
between
the
Large
Cap
Equity
Fund
and
the
Multi
Cap
Equity
Fund
and
Weitz
Inc.,
and
it
was
noted
that
Weitz
Inc.
was
proposing
to
extend
the
terms
of
the
Expense
Limitation
Agreements
for
another
year.
The
Board
next
reviewed
matters
with
respect
to
the
proposed
continuation
of
the
Management
and
Investment
Advisory
Agreement
for
the
Conservative
Allocation
Fund.
Management
of
the
Adviser
reviewed
with
the
Board
the
fact
that
the
Conservative
Allocation
Fund
utilizes
an
investment
style
that
combines
equity
investments
and
fixed
income
investments.
The
Board
then
reviewed
the
investment
advisory
fee
for
the
Conservative
Allocation
Fund,
as
well
as
performance
information
for
the
Fund.
The
Board
discussed
with
the
representatives
of
Weitz
Inc.
the
currently
effective
investment
advisory
fee
for
the
Conservative
Allocation
Fund,
including
the
terms
of
the
Expense
Limitation
Agreement
currently
in
effect,
and
it
was
noted
that
Weitz
Inc.
was
proposing
to
extend
the
term
of
the
Expense
Limitation
Agreement
for
another
year.
It
was
also
noted
that
the
Conservative
Allocation
Fund
is
not
currently
subject
to
breakpoints
on
its
advisory
fee.
Management
of
the
Adviser
indicated
that
they
would
be
willing
to
consider
the
introduction
of
breakpoints
for
the
Fund
in
the
event
that
assets
in
the
Fund
were
to
become
more
substantial
and
economies
of
scale
were
able
to
be
realized.
The
Board
next
compared
expenses
of
the
Conservative
Allocation
Fund
to
the
expenses
of
its
peer
group,
noting
that
the
net
expenses
for
the
Institutional
Class
shares
of
the
Conservative
Allocation
Fund
(after
fee
waivers)
are
below
industry
averages
for
total
operating
expenses
of
other
funds
of
similar
size
and
investment
objective.
The
Board
then
considered
various
matters
with
respect
to
each
of
the
income
funds
managed
by
Weitz
Inc.,
consisting
of
the
Core
Plus
Income
Fund,
the
Short
Duration
Income
Fund,
the
Ultra
Short
Government
Fund
and
the
Nebraska
Tax
Free
Income
Fund
(the
“Income
Funds”),
noting
the
applicable
investment
objectives,
strategies
and
fee
arrangements
for
each
Income
Fund,
and
noting
Weitz
Inc.’s
investment
expertise
and
the
investment
strategies
utilized
by
the
firm
with
respect
to
each
Income
Fund.
Among
the
factors
the
Board
considered
was
the
overall
performance
of
each
Income
Fund
relative
to
its
peer
group
on
a
long-term
basis
and
over
shorter
time
periods,
taking
into
consideration
the
facts
that:
(i)
the
Core
Plus
Income
Fund
had
commenced
operations
on
July
31,
2014
and
(ii)
the
Ultra
Short
Government
Fund
had
operated
as
a
“government
money
market
fund”
until
December
16,
2016.
The
Board
also
took
into
consideration
the
strong
long-
and
short-term
performance
of
the
Core
Plus
Income
Fund
as
well
as
the
strong
long-term
performance
of
the
Short
Duration
Income
Fund.
The
Board
also
noted
the
proposed
increase
in
expense
caps
for
the
Investor
Class
shares
for
both
the
Core
Plus
Income
Fund
and
the
Short
Duration
Income
Fund.
In
addition,
the
Board
compared
expenses
of
each
Income
Fund
to
the
expenses
of
its
peer
group,
noting
that
the
net
expenses
(after
fee
waivers)
of
the
Core
Plus
Income
Fund,
the
Ultra
Short
Government
Fund
and
the
Nebraska
Tax
Free
Income
Fund
each
are
below
industry
averages
for
other
funds
of
similar
size
and
investment
objective,
while
the
net
expenses
(after
fee
waivers)
of
the
Short
Duration
Income
Fund
are
above
industry
averages
for
other
funds
of
similar
size
and
investment
objective.
In
considering
the
investment
advisory
fees
applicable
to
each
Income
Fund,
the
Board
discussed
with
the
Adviser
representatives
their
reasons
for
assessing
the
applicable
fees
in
connection
with
each
Income
Fund,
and
the
Board
considered
and
discussed
the
fees
charged
by
similar
funds
in
each
respective
investment
category.
The
members
of
the
Board
also
reviewed
matters
with
respect
to
the
terms
of
the
Expense
Limitation
Agreements
that
are
in
effect
between
each
of
the
Income
Funds
and
Weitz
Inc.
and
it
was
noted
that
Weitz
Inc.
was
proposing
to
continue
through
July
31,
2025
the
Expense
Limitation
Agreement
that
is
currently
in
effect
for
the
Core
Plus
Income
Fund-Institutional
Class,
the
Nebraska
Tax
Free
Income
Fund,
the
Short
Duration
Income
Fund-Institutional
Class
and
the
Ultra
Short
Government
Fund,
so
that:
(i)
the
limit
on
the
Core
Plus
Income
Fund-Institutional
Class
total
annual
operating
expenses
would
continue
to
be
0.45%;
(ii)
the
limit
on
the
Nebraska
Tax
Free
Income
Fund’s
total
annual
operating
expenses
would
continue
to
be
0.45%;
(iii)
the
limit
on
the
Short
Duration
Fund-Institutional
Class
total
annual
operating
expenses
would
continue
to
be
0.45%;
(iv)
the
limit
on
the
Ultra
Short
Government
Fund’s
total
annual
operating
expenses
would
continue
to
be
0.32%;
(v)
the
limit
on
the
Core
Plus
Income
Fund-Investor
Class
would
be
revised
from
0.55%
to
0.65%
and
(vi)
the
limit
on
the
Short
Duration
Income
Fund-Investor
Class
would
be
revised
from
0.55%
to
0.65%
(in
each
case,
of
average
daily
net
assets
and
excluding
brokerage
costs,
interest,
taxes
and
dividend
expenses,
acquired
fund
fees
and
expenses
and
extraordinary
expenses).
The
Board
also
reviewed
with
representatives
of
Weitz
Inc.
various
other
factors
relating
to
the
management
of
the
Funds.
The
Board
took
note
of
the
long-term
relationship
between
Weitz
Inc.
and
the
Funds
and
the
efforts
that
have
been
undertaken
by
the
Adviser
to
foster
the
growth
and
development
of
the
Funds
since
the
inception
of
each
Fund.
They
also
noted
the
range
of
investment
advisory,
shareholder
servicing
and
business
administrative
services
provided
by
Weitz
Inc.
to
the
Funds
and
the
level
and
quality
of
these
services,
and
in
particular,
they
noted
the
quality
of
the
personnel
providing
these
services
and
determined
that
the
quality
of
the
services
was
very
high.
They
also
took
note
of
the
fact
that:
(i)
Weitz
Inc.
pays
all
of
the
distribution
expenses
of
the
Funds
from
its
own
resources,
including
third-party
intermediary
expenses
that
are
deemed
to
be
distribution
related,
and
the
Funds
do
not
pay
for
any
such
expenses,
and
(ii)
the
Adviser
pays
for
all
marketing
efforts
for
the
Funds
from
its
own
resources
and
the
Funds
do
not
pay
for
any
such
efforts.
The
Board
also
reviewed
financial
information
concerning
Weitz
Inc.
relating
to
its
operation
of
the
Funds,
noting
the
overall
profitability
of
the
relationship
with
the
Funds
to
Weitz
Inc.
and
the
financial
soundness
of
Weitz
Inc.
as
demonstrated
by
the
financial
information
provided,
and
reached
a
finding
that
the
level
of
profitability
was
consistent
with
relevant
industry
averages
and
not
excessive.
In
reviewing
the
profitability
of
Weitz
Inc.
relating
to
its
management
of
the
Funds,
the
Board
reviewed
the
level
of
profitability
including
the
various
marketing
and
distribution
expenses
that
are
incurred
by
Weitz
Inc.
from
its
own
resources
and
they
also
considered
the
level
of
profitability
without
taking
into
consideration
the
impact
of
these
marketing
and
distribution
costs.
The
Board
also
considered
that
Weitz
Inc.
had
agreed
to
fee
breakpoints
and
to
contractual
fee
waivers
with
respect
to
certain
of
the
Funds
in
order
to
limit
their
overall
operating
expenses.
The
Board
further
reviewed
Weitz
Inc.’s
brokerage
practices,
including
its
soft
dollar
practices
and
best-execution
procedures,
and
noted
that
these
were
reasonable
and
consistent
with
standard
industry
practice.
The
Board
took
note
of
the
current
portfolio
managers
for
each
of
the
Funds
and
their
overall
management
of
each
of
the
Funds.
The
Board
also
considered
information
regarding
the
fees
that
Weitz
Inc.
charges
other
clients
for
investment
advisory
services
that
are
similar
to
the
advisory
services
provided
to
the
Funds,
including
certain
institutional
accounts,
and
it
was
noted
that
the
fees
were
comparable
based
on
the
relevant
circumstances
of
the
types
of
accounts
involved.
In
considering
information
regarding
the
investment
management
fees
payable
by
the
Funds
to
Weitz
Inc.
under
the
Agreements,
the
Board
also
took
note
of
the
business
administration
fees
that
are
payable
by
the
Funds
to
Weitz
Inc.
under
the
terms
of
the
Business
Administration
Agreement
that
is
applicable
to
the
Funds.
In
considering
the
approval
of
the
Business
Administration
Agreement
and
in
determining
the
reasonableness
of
the
total
fees
paid
by
the
Funds
to
Weitz
Inc.
for
the
overall
level
of
services
that
Weitz
Inc.
provides
to
the
Funds
and
their
shareholders,
the
Board
members
considered
and
discussed
various
factors
related
to
the
business
administration
services
that
are
provided
to
the
Funds
by
Weitz
Inc.,
including
the
nature
and
extent
of
these
fees
and
the
services
provided
by
Weitz
Inc.
and
the
firm’s
reasons
for
implementing
a
fee
increase
with
respect
to
level
of
fees
to
be
paid
pursuant
to
the
Business
Administration
Agreement.
In
connection
with
their
review
of
these
matters,
the
Trustees
took
into
consideration
the
third-party
service
provider
arrangements
in
place
on
behalf
of
the
Funds
to
provide
certain
of
the
administration
services
for
the
Funds,
and
the
Trustees
further
considered
the
nature
of
the
fee
arrangements
in
place
with
these
third-party
firms
to
provide
services
to
the
Funds,
as
well
as
the
supervision
that
is
required
of
these
third-party
service
providers.
In
considering
the
nature
and
extent
of
these
non-
advisory
administrative
services
provided
to
the
Funds
by
Weitz
Inc.,
the
Board
took
into
consideration:
(i)
whether
the
Business
Administration
Agreement
is
in
the
best
interest
of
the
Funds
and
their
shareholders;
(ii)
whether
the
services
performed
under
the
Business
Administration
Agreement
are
required
for
the
operation
of
the
Funds;
(iii)
whether
the
services
provided
are
of
a
nature
and
quality
at
least
equal
to
the
same
or
similar
services
provided
by
independent
third-parties;
and
(iv)
whether
the
fees
for
the
services
are
fair
and
reasonable
in
light
of
the
usual
and
customary
charges
made
by
others
for
services
of
the
same
nature
and
quality.
The
Board
also
took
into
consideration
the
fact
that
an
affiliate
of
Weitz
Inc.,
Weitz
Securities,
Inc.,
provides
underwriting
and
distribution
services
to
the
Funds.
The
Board
took
into
consideration
that
Weitz
Securities,
Inc.
does
not
charge
the
Funds
any
fees
for
its
services
as
distributor
and
that
Weitz
Securities,
Inc.
incurs
various
costs
and
expenses
in
order
to
provide
for
the
distribution
and
sales
of
the
shares
of
the
Funds
which
in
turn
are
incurred
by
Weitz
Inc.
from
its
own
financial
resources.
The
members
of
the
Board
also
took
note
of
the
fact
that
Weitz
Inc.
pays
for
all
of
the
marketing
and
distribution
efforts
related
to
the
offer
and
sale
of
the
Funds.
The
Board
also
considered
and
discussed
the
level
and
quality
of
the
distribution
services
performed
by
Weitz
Securities,
Inc.
In
addition,
the
members
of
the
Board
considered
the
nature
and
extent
of
the
revenue
sharing
payments
that
Weitz
Inc.
makes
to
those
third-
party
intermediaries
that
provide
various
types
of
distribution
related
services
to
the
Funds,
noting
these
payments
are
made
entirely
from
Weitz
Inc.’s
own
financial
resources
and
are
not
paid
by
the
Funds.
In
connection
with
these
matters,
the
Board
also
took
into
consideration
the
Adviser’s
proposal
to
continue
the
use
of
the
Administrative
Services
Plan
for
Investor
Class
shares
as
well
as
the
Adviser’s
proposal
to
discontinue
the
use
of
the
Administrative
Services
Plan
for
Institutional
Class
shares,
pursuant
to
which
proposal
the
Adviser
agreed
to
undertake
the
payment
for
the
non-distribution
shareholder
administrative
services
that
are
attributable
to
the
Institutional
Class
shares
from
its
own
financial
resources.
The
Board
considered
the
amount
of
the
fees
that
are
payable
to
Weitz
Inc.
for
providing
the
types
of
non-distribution
shareholder
administrative
services
that
are
eligible
to
be
compensated
under
the
terms
of
the
Administrative
Services
Plan
for
Investor
Class
shares
and
the
nature
of
the
related
services,
and
they
also
took
into
consideration
the
Adviser’s
undertaking
that
the
level
and
quality
of
the
shareholder
administrative
services
for
the
Institutional
Class
shares
would
remain
the
same
following
the
Adviser’s
assumption
of
the
related
costs
for
such
services.
In
reaching
their
conclusion
with
respect
to
the
continuation
of
the
Agreements
for
each
Fund
and
the
level
of
investment
advisory
fees
payable
under
the
Management
and
Investment
Advisory
Agreement
for
each
Fund,
the
Trustees
did
not
identify
any
one
single
factor
as
being
controlling.
Rather,
the
Board
took
note
of
a
combination
of
factors
that
influenced
their
decision-making
process.
The
Board
did,
however,
identify
the
overall
performance
results
of
the
Funds,
the
commitment
of
the
Adviser
and
its
affiliates
to
the
successful
operation
of
the
Funds,
and
the
level
of
expenses
of
the
Funds,
as
being
important
elements
of
their
consideration.
They
noted
that:
(i)
the
Adviser
has
been
willing
to
maintain
breakpoints
for
the
Equity
Funds,
and
contractual
expense
limitation
agreements
for
seven
of
the
Funds
in
order
to
limit
the
overall
operating
expenses
of
the
Funds,
as
applicable.
They
also
noted
the
overall
level
and
quality
of
investment
advisory,
shareholder
servicing
and
business
administration
services
provided
by
the
Adviser
to
the
Funds,
as
well
as
the
distribution
services
provided
by
the
Distributor,
including
the
increased
marketing
efforts
on
behalf
of
the
Funds,
and
they
found
that
these
services
continued
to
benefit
the
shareholders
of
the
Funds
and
reflected
the
firm’s
overall
commitment
to
the
continued
successful
growth
and
development
of
the
Funds.
The
Trustees
also
took
into
consideration
the
effectiveness
of
the
compliance
program
maintained
with
respect
to
the
Funds
and
the
Adviser
and
the
compliance
oversight
process.
The
Trustees
also
took
into
consideration
their
discussions
with
the
Adviser’s
representatives
regarding
the
factors
that
have
impacted
the
performance
of
the
Funds
on
a
short-term
basis
and
over
longer
time
periods
and
the
Adviser’s
commitment
to
improving
the
performance
for
certain
of
the
Funds.
The
Trustees
also
considered
the
business,
regulatory
and
entrepreneurial
risks
undertaken
by
the
Adviser
in
managing
and
sponsoring
the
Funds
and
the
increasingly
competitive
business
environment
in
the
mutual
fund
industry
as
well
as
the
efforts
that
have
been
undertaken
by
smaller
fund
groups
to
remain
competitive
in
the
face
of
increasing
consolidation
within
the
investment
management
industry.
Based
upon
their
review
and
consideration
of
these
factors
and
other
matters
deemed
relevant
by
the
Board
in
reaching
an
informed
business
judgment,
a
majority
of
the
Board
of
Trustees,
including
a
majority
of
the
Independent
Trustees,
concluded
that
the
terms
of
the
Management
and
Investment
Advisory
Agreements
are
fair
and
reasonable
and
the
Board
voted
to
renew
the
Agreements
for
an
additional
one-year
period.
In
reaching
these
conclusions
with
respect
to
each
of
the
Agreements,
the
members
of
the
Board,
including
all
of
the
Independent
Trustees,
took
into
consideration
the
following
factors:
The
nature,
extent
and
quality
of
the
advisory
services
provided.
The
Trustees
concluded
that
the
Adviser
is
capable
of
providing
high
quality
services
to
the
Funds,
as
indicated
by
the
nature,
extent
and
quality
of
the
services
provided
in
the
past
by
the
Adviser
to
each
of
the
Funds,
the
Adviser’s
management
capabilities
demonstrated
with
respect
to
the
Funds,
the
professional
qualifications
and
experience
of
each
of
the
portfolio
managers
of
the
Funds,
and
the
Adviser’s
investment
management
and
compliance
oversight
processes.
On
the
basis
of
the
Trustees’
assessment
of
the
nature,
extent
and
quality
of
the
advisory
services
provided
by
the
Adviser,
the
Trustees
concluded
that
the
Adviser
is
capable
of
generating
a
level
of
long-term
investment
performance
that
is
appropriate
in
light
of
the
Funds’
investment
objectives,
policies
and
strategies.
The
investment
performance
of
the
Funds.
The
Board
received
and
reviewed
performance
information
for
each
of
the
Funds
separately,
including
total
return
performance
information,
for
applicable
one-,
five-
and
ten-year
periods
ended
March
31,
2024,
and
for
shorter
periods
as
applicable,
with
respect
to
the
Funds’
shares.
The
Board
also
reviewed
with
the
representatives
of
the
Adviser
other
information
and
data,
including
each
Fund’s
performance
against
its
primary
comparative
index,
and
against
each
Fund’s
peer
group,
as
follows:
1.
Conservative
Allocation.
The
Board
noted
that
the
Investor
and
Institutional
Class
shares
of
the
Fund
had
outperformed
its
primary
comparative
index,
the
Morningstar
Moderately
Conservative
Target
Risk
Index,
for
the
one-
five-
and
ten-year
periods
ended
March
31,
2024.
The
Board
also
noted
that
the
Institutional
Class
shares
of
the
Fund
had
outperformed
its
peer
group
median
for
the
one-
two-,
three-,
four-
and
five-year
periods
ended
March
31,
2024.
2.
Core
Plus
Income.
The
Board
noted
that
the
Investor
and
Institutional
Class
shares
of
the
Fund,
which
commenced
operations
July
31,
2014,
had
outperformed
its
primary
comparative
index,
the
Bloomberg
U.S.
Aggregate
Bond
Index,
for
the
one-,
five-year
and
since
inception
periods
ended
March
31,
2024.
The
Board
also
noted
that
the
Institutional
Class
shares
of
the
Fund
had
outperformed
its
peer
group
median
for
the
one-,
two-,
three-,
four-
and
five-year
periods
ended
March
31,
2024.
3.
Large
Cap
Equity
.
The
Board
noted
that
the
Investor
and
Institutional
Class
shares
of
the
Fund
had
outperformed
its
primary
comparative
index,
the
Russell
1000
Index,
for
the
one-
year
period
ended
March
31,
2024
and
had
underperformed
its
index
for
the
five-
and
ten-year
periods
ended
March
31,
2024.
The
Board
also
noted
that
the
Institutional
Class
shares
of
the
Fund
had
underperformed
its
peer
group
median
for
the
two-,
three,
four-
and
five-year
periods
ended
March
31,
2024,
and
had
outperformed
the
peer
group
median
for
the
one-year
period
ended
March
31,
2024.
The
Trustees
also
took
into
consideration
their
discussions
with
the
Adviser’s
representatives
regarding
the
factors
that
have
impacted
the
performance
of
the
Fund
on
a
short-term
basis
and
over
longer
time
periods.
4.
Multi
Cap
Equity
.
The
Board
noted
that
the
Investor
and
Institutional
Class
shares
of
the
Fund
had
underperformed
its
primary
comparative
index,
the
Russell
3000
Index,
for
the
one-,
five-
and
ten-year
periods
ended
March
31,
2024.
The
Board
also
noted
that
the
Institutional
Class
shares
of
the
Fund
had
underperformed
its
peer
group
median
for
the
one-,
two-,
three-,
four-
and
five-year
periods
ended
March
31,
2024.
The
Trustees
also
took
into
consideration
their
discussions
with
the
Adviser’s
representatives
regarding
the
factors
that
have
impacted
the
performance
of
the
Fund
on
a
short-term
basis
and
over
longer
time
periods.
5.
Nebraska
Tax
Free
Income.
The
Board
noted
that
the
Fund
had
underperformed
its
primary
comparative
index,
the
Bloomberg
5-Year
Municipal
Bond
Index,
for
the
one-,
five-
and
ten-year
periods
ended
March
31,
2024.
The
Board
also
noted
that
the
Fund
had
outperformed
its
peer
group
median
for
the
three-,
four-,
and
five-year
periods
ended
March
31,
2024,
and
had
underperformed
its
peer
group
median
for
the
one-,
two-
and
ten-year
periods
ended
March
31,
2024.
The
Trustees
also
took
into
consideration
their
discussions
with
the
Adviser’s
representatives
regarding
the
factors
that
have
impacted
the
performance
of
the
Fund.
6.
Partners
III
Opportunity.
The
Board
noted
that
the
Investor
and
Institutional
Class
shares
of
the
Fund
had
underperformed
its
primary
comparative
index,
the
Russell
3000
Index,
for
the
one-,
five-
and
ten-year
periods
ended
March
31,
2024.
The
Board
also
noted
that
the
Institutional
Class
shares
of
the
Fund
had
underperformed
its
peer
group
median
for
the
two-,
three-,
four-,
five-
and
ten-year
periods
ended
March
31,
2024,
and
had
outperformed
its
peer
group
median
for
the
one-year
period
ended
March
31,
2024.
The
Trustees
also
took
into
consideration
their
discussions
with
the
Adviser’s
representatives
regarding
the
factors
that
have
impacted
the
performance
of
the
Fund
on
a
short-term
basis
and
over
longer
time
periods.
7.
Short
Duration
Income.
The
Board
noted
that
Investor
and
Institutional
Class
shares
of
the
Fund
had
outperformed
its
primary
comparative
index,
the
Bloomberg
U.S.
Aggregate
1-3
Year
Index,
for
the
one-,
five-
and
ten-year
periods
ended
March
31,
2024.
The
Board
noted
that
Institutional
Class
shares
of
the
Fund
had
outperformed
its
peer
group
median
for
the
one-,
two-,
three-,
four-,
five-
and
ten-year
periods
ended
March
31,
2024.
8.
Ultra
Short
Government.
The
Board
noted
that
the
Fund
had
underperformed
its
primary
comparative
index,
the
ICE
Bank
of
America
U.S.
6-Month
Treasury
Bill
Index,
for
the
one-,
five-
and
ten-year
periods
ended
March
31,
2024.
The
Board
also
noted
that
the
Fund
had
underperformed
its
peer
group
median
for
the
one-,
two-,
three-,
five-
and
ten-year
periods
ended
March
31,
2024.
In
connection
with
the
Board’s
review
of
the
performance
results
presented
for
the
Ultra
Short
Government
Fund,
the
Trustees
took
into
consideration
the
fact
that,
prior
to
December
16,
2016,
the
Fund
had
been
operated
as
a
government
money
market
fund
and,
as
a
result,
the
performance
returns
for
periods
prior
to
that
date
were
achieved
while
the
Fund
was
operated
as
a
government
money
market
fund
with
investment
objectives
and
strategies
different
from
the
investment
objectives
and
strategies
that
the
Fund
implemented
effective
December
16,
2016.
The
Trustees
also
took
into
consideration
their
discussions
with
the
Adviser’s
representatives
regarding
the
factors
that
have
impacted
the
performance
of
the
Fund
on
a
short-term
basis
and
over
longer
time
periods.
The
cost
of
advisory
services
provided
and
the
expected
level
of
profitability.
The
Board
considered
the
advisory
fees
and
overall
expenses
of
the
Funds
(including
Institutional
Class
shares
and
Investor
Class
shares
of
the
dual-class
Funds),
based
upon
the
relevant
information
presented,
as
compared
to
the
advisory
fees
and
overall
expenses
of
each
Fund’s
peer
group
as
follows:
1.
Conservative
Allocation.
The
Board
noted
that
the
Advisory
Agreement
provided
for
an
investment
advisory
fee
for
the
Fund
would
be
at
a
rate
of
0.60%
on
the
Fund’s
assets,
and
this
rate
was
below
median
compared
to
its
peer
funds.
The
Board
also
noted
that
the
net
expense
ratio
of
the
Fund’s
Institutional
Class
shares
was
0.70%,
which
was
lower
than
the
median
net
expense
ratio
of
its
peer
funds.
2.
Core
Plus
Income.
The
Board
noted
that
the
Advisory
Agreement
provided
for
an
investment
advisory
fee
for
the
Fund
at
a
rate
of
0.40%
on
the
Fund’s
assets,
which
was
below
median
compared
to
its
peer
funds.
The
Board
also
noted
that
the
net
expense
ratio
of
the
Fund’s
Institutional
Class
shares
was
0.40%,
which
is
lower
than
the
median
net
expense
ratio
of
its
peer
funds.
3.
Large
Cap
Equity
.
The
Board
noted
that
the
Advisory
Agreement
provided
for
an
investment
advisory
fee
for
the
Fund
would
be
at
a
rate
of
0.75%
on
the
Fund’s
assets
that
are
less
than
or
equal
to
$5
billion,
with
a
breakpoint
in
the
investment
advisory
fee
on
assets
in
the
Fund
in
excess
of
$5
billion,
and
this
rate
of
0.75%
was
above
median
compared
to
its
peer
funds.
The
Board
also
noted
that
the
net
expense
ratio
of
the
Fund’s
Institutional
Class
shares
was
0.87%,
which
is
above
the
median
net
expense
ratio
of
its
peer
funds.
4.
Multi
Cap
Equity
.
The
Board
noted
that
the
Advisory
Agreement
provided
for
an
investment
advisory
fee
for
the
Fund
at
a
rate
of
0.75%
on
the
Fund’s
assets
that
are
less
than
or
equal
to
$5
billion,
with
a
breakpoint
in
the
investment
advisory
fee
on
assets
in
the
Fund
in
excess
of
$5
billion,
and
this
rate
of
0.75%
was
equal
to
the
median
compared
to
its
peer
funds.
The
Board
also
noted
that
the
net
expense
ratio
of
the
Fund’s
Institutional
Class
shares
was
0.87%,
which
is
above
than
the
median
net
expense
ratio
of
its
peer
funds.
5.
Nebraska
Tax
Free
Income.
The
Board
noted
that
the
Advisory
Agreement
provided
for
an
investment
advisory
fee
for
the
Fund
at
a
rate
of
0.40%
on
the
Fund’s
assets,
which
was
below
median
compared
to
its
peer
funds.
The
Board
also
noted
that
the
net
expense
ratio
of
the
Fund
was
0.45%,
which
is
below
the
median
net
expense
ratio
of
its
peer
funds.
6.
Partners
III
Opportunity.
The
Board
noted
that
the
Advisory
Agreement
provided
for
an
investment
advisory
fee
for
the
Fund
at
a
rate
of
1.00%
on
the
Fund’s
assets
that
are
less
than
or
equal
to
$1
billion,
with
breakpoints
in
the
investment
advisory
fee
on
differing
levels
of
assets
in
the
Fund
in
excess
of
$1
billion,
which
is
lower
than
the
median
compared
to
its
peer
funds.
The
Board
also
noted
that
the
net
expense
ratio
of
the
Fund’s
Institutional
Class
shares
(exclusive
of
the
dividend
and
interest
expense
incurred
by
the
Fund
during
the
fiscal
year)
was
1.13%,
which
is
lower
than
the
median
net
expense
ratio
of
its
peer
funds.
7.
Short
Duration
Income.
The
Board
noted
that
the
Advisory
Agreement
provided
for
an
investment
advisory
fee
for
the
Fund
at
a
rate
of
0.40%
on
the
Fund’s
assets,
which
was
equal
to
the
median
compared
to
its
peer
funds.
The
Board
also
noted
that
the
net
expense
ratio
of
the
Fund’s
Institutional
Class
shares
was
0.46%,
which
is
above
the
median
net
expense
ratio
of
its
peer
funds.
8.
Ultra
Short
Government.
The
Board
noted
that
the
Advisory
Agreement
provided
for
an
investment
advisory
fee
for
the
Fund
at
a
rate
of
0.30%
on
the
Fund’s
assets,
which
is
below
the
median
compared
to
its
peer
funds.
The
Board
also
noted
that
the
net
expense
ratio
of
the
Fund’s
Institutional
Class
shares
was
0.29%,
which
is
lower
than
the
median
net
expense
ratio
of
its
peer
funds.
On
the
basis
of
the
fee
and
expense
information
provided,
the
Board
determined
that
the
investment
management
fees
payable
by
the
Funds
to
Weitz
Inc.
are
reasonable
and
that
Weitz
Inc.’s
level
of
profitability
from
its
management
of
each
of
the
Funds
is
reasonable
and
not
excessive.
The
extent
to
which
economies
of
scale
may
be
realized
as
the
Funds
grow
and
whether
the
advisory
fees
reflect
possible
economies
of
scale.
The
Trustees
took
into
consideration
that
each
of
the
Equity
Funds
are
currently
operated
pursuant
to
investment
management
fees
that
are
subject
to
breakpoints
on
the
fees
as
assets
in
the
Equity
Funds
increase
over
various
established
levels
of
assets.
In
addition,
while
it
was
noted
that
the
investment
advisory
fees
for
the
Income
Funds
and
for
the
Conservative
Allocation
Fund
will
not
decrease
as
the
Funds’
assets
grow
because
they
are
not
subject
to
investment
advisory
fee
breakpoints,
the
Trustees
concluded
that
these
Funds’
investment
advisory
fees
are
appropriate
in
light
of
the
size
of
the
Funds,
and
appropriately
reflect
the
current
economic
environment
for
the
Adviser
and
the
competitive
nature
of
the
mutual
fund
marketplace.
The
Trustees
then
noted
that
they
will
have
the
opportunity
to
periodically
re-examine
whether
any
of
these
Funds
have
achieved
economies
of
scale,
and
the
appropriateness
of
the
investment
advisory
fees
payable
to
the
Adviser
with
respect
to
the
Income
Funds
and
the
Conservative
Allocation
Fund,
in
the
future
at
which
time
the
implementation
of
fee
breakpoints
on
these
particular
Funds
could
be
further
considered.
Benefits
to
Weitz
Inc.
from
its
relationship
with
the
Funds
(and
any
corresponding
benefits
to
the
Funds).
The
Trustees
concluded
that
other
benefits
that
may
be
derived
by
Weitz
Inc.
from
its
relationship
with
the
Funds,
including
“soft
dollar”
benefits
in
connection
with
Fund
brokerage
transactions
and
use
of
the
Funds’
performance
track
record
in
advertising
materials,
are
reasonable
and
fair,
and
consistent
with
industry
practice
and
are
in
the
best
interests
of
the
Funds
and
their
shareholders.
In
addition,
the
Trustees
determined
that
the
Funds
benefit
from
their
relationship
with
the
Adviser
by
virtue
of
the
Adviser’s
provision
of
business
administration
and
shareholder
services,
in
addition
to
investment
advisory
services,
at
a
cost
to
the
Funds
that
is
generally
comparable
to
the
costs
of
an
outside
service
provider,
which
the
Trustees
have
previously
determined
to
be
reasonable,
fair
and
in
the
best
interests
of
the
shareholders
of
the
Funds
in
light
of
the
nature
and
quality
of
the
services
provided
and
the
necessity
of
the
services
for
the
Funds’
operations.
Other
Considerations.
In
approving
the
continuation
of
the
Advisory
Agreements,
the
Trustees
determined
that
the
Adviser
has
made
a
substantial
commitment
to
the
recruitment
and
retention
of
high
quality
personnel,
and
maintains
the
financial,
compliance
and
operational
resources
reasonably
necessary
to
manage
the
Funds
in
a
professional
manner
that
is
consistent
with
the
best
interests
of
the
Funds
and
their
shareholders.
The
Board
also
acknowledged
the
experience
and
expertise
of
members
of
the
Adviser’s
management
team
and
the
focus
these
individuals
have
on
ensuring
that
the
Funds
operate
successfully.
The
Trustees
also
concluded
that
the
Adviser
has
made
a
significant
entrepreneurial
commitment
to
the
management
and
success
of
the
Funds,
which
entails
a
substantial
financial
and
professional
commitment,
including
the
efforts
to
market
and
distribute
the
Funds,
as
well
as
the
Expense
Limitation
Agreements
under
which
the
Adviser
has
undertaken
to
waive
a
portion
of
its
fees
and
to
reimburse
expenses
of
seven
of
the
Funds
to
the
benefit
of
Fund
shareholders
to
the
extent
necessary
in
accordance
with
the
terms
of
the
Expense
Limitation
Agreements.
The
Board
also
considered
matters
with
respect
to
the
brokerage
practices
of
the
Adviser,
including
its
soft
dollar
arrangements
and
its
best-execution
procedures,
and
noted
that
these
were
reasonable
and
consistent
with
standard
industry
practice.
The
Board
also
took
into
consideration
the
investments
made
by
the
Adviser
into
the
Funds
to
enhance
services
and
improve
efficiencies.
Board
of
Trustees
Lorraine
Chang
Steven
M.
Hill
Alison
L.
Maloy
Elizabeth
L.
Sylvester
Dana
E.
Washington
Andrew
(Drew)
S.
Weitz
Wallace
R.
Weitz
Justin
B.
Wender
Officers
Wallace
R.
Weitz,
President
Shar
M.
Bennett,
Vice
President
&
Assistant
Treasurer
James
J.
Boyne,
Vice
President
&
Treasurer
Thomas
D.
Carney,
Vice
President
John
R.
Detisch,
Vice
President,
Secretary
&
Chief
Compliance
Officer
Bradley
P.
Hinton,
Vice
President
Andrew
S.
Weitz,
Vice
President
Investment
Adviser
Weitz
Investment
Management,
Inc.
Blackstone
Plaza
3555
Farnam
Street,
Suite
800
Omaha,
NE
68131
888-859-0698
Custodian
Citibank,
N.A.
Distributor
Weitz
Securities,
Inc.
Transfer
Agent
and
Dividend
Paying
Agent
Ultimus
Fund
Solutions,
LLC
Investors
should
consider
carefully
the
investment
objectives,
risks,
and
charges
and
expenses
of
a
fund
before
investing.
This
and
other
important
information
is
contained
in
the
prospectus
and
summary
prospectus,
which
may
be
obtained
at
weitzinvestments.com
or
from
a
financial
advisor.
Please
read
the
prospectus
carefully
before
investing.
11/27/2024
(b) The Financial Highlights are included as a part of the Financial Statements filed under Item 7(a) of this form.
Item 8. Changes in and Disagreements with Accountants for Open-End Management Investment Companies.
Changes in and disagreements with accountants, if any, are included as part of the Financial Statements filed under Item 7(a) of this Form.
Item 9. Proxy Disclosures for Open-End Management Investment Companies.
Proxy disclosures, if any, are included as part of the Financial Statements filed under Item 7(a) of this Form.
Item 10. Renumeration Paid to Directors, Officers, and Others of Open-End Management Investment Companies.
Not applicable.
Item 11. Statement Regarding Basis for Approval of Investment Advisory Contract.
Approval of Investment Advisory Contract is a part of the Financial Statements filed under Item 7(a) of this Form.
Item 12. Disclosure of Proxy Voting Policies and Procedures for Closed-End Management Investment Companies.
Not applicable.
Item 13. Portfolio Managers of Closed-End Management Investment Companies.
Not applicable.
Item 14. Purchases of Equity Securities by Closed-End Management Investment Company and Affiliated Purchasers.
Not applicable.
Item 15. Submission of Matters to a Vote of Security Holders.
Not applicable.
Item 16. Controls and Procedures.
(a) The Registrant’s principal executive officer and principal financial officer have concluded, based on their evaluation of the Registrant’s disclosure controls and procedures as conducted within 90 days of the filing date of this report, that those disclosure controls and procedures provide reasonable assurance that material information required to be disclosed by the Registrant on this report is recorded, processed, summarized and reported within the time periods specified in the Securities and Exchange Commission's rules and forms.
(b) There were no changes in the Registrant’s internal control over financial reporting (as defined in Rule 30a-3(d) under the Act (17CFR 270.30a-3(d)) that occurred during the period covered by this report that have materially affected or are reasonably likely to materially affect, the Registrant’s internal control over financial reporting.
Item 17. Disclosure of Securities Lending Activities for Closed-End Management Investment Companies.
Not applicable.
Item 18. Recovery of Erroneously Awarded Compensation.
Not applicable.
Item 19. Exhibits.
(a)(1) Not applicable – only for annual reports.
(a)(3) Not applicable.
(a)(4) Not applicable.
SIGNATURES
Pursuant to the requirements of the Securities Exchange Act of 1934 and the Investment Company Act of 1940, the Registrant has duly caused this report to be signed on its behalf by the undersigned, thereunto duly authorized.
(Registrant) Weitz Funds
By (Signature and Title) /s/ Wallace R. Weitz
Wallace R. Weitz, Principal Executive Officer
Date 11/26/2024
Pursuant to the requirements of the Securities Exchange Act of 1934 and the Investment Company Act of 1940, this report has been signed below by the following persons on behalf of the Registrant and in the capacities and on the dates indicated.
By (Signature and Title) /s/ Wallace R. Weitz
Wallace R. Weitz, Principal Executive Officer
Date 11/26/2024
By (Signature and Title) /s/ James J. Boyne
James J. Boyne, Principal Financial Officer
Date 11/26/2024