| FREE WRITING PROSPECTUS | ||
| FILED PURSUANT TO RULE 433 | ||
| REGISTRATION FILE NO.: 333-207132-16 | ||
February 28, 2018
Free Writing Prospectus
Structural and Collateral Term Sheet
$1,062,384,703
(Approximate Initial Mortgage Pool Balance)
$880,584,000
(Offered Certificates)
Citigroup Commercial Mortgage Trust 2018-B2
As Issuing Entity
Citigroup Commercial Mortgage Securities Inc.
As Depositor
Commercial Mortgage Pass-Through Certificates, Series 2018-B2
Morgan Stanley Mortgage Capital Holdings LLC
Citi Real Estate Funding Inc.
Starwood Mortgage Funding V LLC
Bank of America, National Association
As Sponsors and Mortgage Loan Sellers
STATEMENT REGARDING THIS FREE WRITING PROSPECTUS
The depositor has filed a registration statement (including a prospectus) with the Securities and Exchange Commission (“SEC”) (SEC File No. 333-207132) for the offering to which this communication relates. Before you invest, you should read the prospectus in the registration statement and other documents the depositor has filed with the SEC for more complete information about the depositor, the issuing entity and this offering. You may get these documents for free by visiting EDGAR on the SEC website at www.sec.gov. Alternatively, the depositor or Citigroup Global Markets Inc., Morgan Stanley & Co. LLC, Merrill Lynch, Pierce, Fenner & Smith Incorporated, Drexel Hamilton, LLC, The Williams Capital Group, L.P. or any other underwriter or dealer participating in this offering will arrange to send you the prospectus if you request it by calling toll-free 1-800-831-9146.
IMPORTANT NOTICE RELATING TO AUTOMATICALLY GENERATED EMAIL DISCLAIMERS
Any legends, disclaimers or other notices that may appear at the bottom of the email communication to which this free writing prospectus is attached relating to (1) these materials not constituting an offer (or a solicitation of an offer), (2) no representation being made that these materials are accurate or complete and that these materials may not be updated or (3) these materials possibly being confidential, are, in each case, not applicable to these materials and should be disregarded. Such legends, disclaimers or other notices have been automatically generated as a result of these materials having been sent via Bloomberg or another system.
| Citigroup | BofA Merrill Lynch | Morgan Stanley | |
| Co-Lead Managers and Joint Bookrunners | |||
| Drexel Hamilton | The Williams Capital Group, L.P. | ||
| Co-Manager | Co-Manager | ||
The securities offered by this structural and collateral term sheet (this “Term Sheet”) are described in greater detail in the preliminary prospectus, dated on or about February 28, 2018, included as part of our registration statement (SEC File No. 333-207132) (the “Preliminary Prospectus”). The Preliminary Prospectus contains material information that is not contained in this Term Sheet (including, without limitation, a detailed discussion of risks associated with an investment in the offered securities under the heading“Risk Factors” in the Preliminary Prospectus). The Preliminary Prospectus is available upon request from Citigroup Global Markets Inc., Morgan Stanley & Co. LLC, Merrill Lynch, Pierce, Fenner & Smith Incorporated, Drexel Hamilton, LLC or The Williams Capital Group, L.P. This Term Sheet is subject to change.
For information regarding certain risks associated with an investment in this transaction, refer to “Risk Factors” in the Preliminary Prospectus. Capitalized terms used but not otherwise defined in this Term Sheet have the respective meanings assigned to those terms in the Preliminary Prospectus.
The Securities May Not Be a Suitable Investment for You
The securities offered by this Term Sheet are not suitable investments for all investors. In particular, you should not purchase any class of securities unless you understand and are able to bear the prepayment, credit, liquidity and market risks associated with that class of securities. For those reasons and for the reasons set forth under the heading “Risk Factors” in the Preliminary Prospectus, the yield to maturity of, the aggregate amount and timing of distributions on and the market value of the offered securities are subject to material variability from period to period and give rise to the potential for significant loss over the life of those securities. The interaction of these factors and their effects are impossible to predict and are likely to change from time to time. As a result, an investment in the offered securities involves substantial risks and uncertainties and should be considered only by sophisticated institutional investors with substantial investment experience with similar types of securities and who have conducted appropriate due diligence on the mortgage loans and the securities. Potential investors are advised and encouraged to review the Preliminary Prospectus in full and to consult with their legal, tax, accounting and other advisors prior to making any investment in the offered securities described in this Term Sheet.
The securities offered by these materials are being offered when, as and if issued. This Term Sheet is not to be construed as an offer to sell or the solicitation of any offer to buy any security in any jurisdiction where such an offer or solicitation would be illegal. The information contained in this Term Sheet may not pertain to any securities that will actually be sold. The information contained in this Term Sheet may be based on assumptions regarding market conditions and other matters as reflected in this Term Sheet. We make no representations regarding the reasonableness of such assumptions or the likelihood that any of such assumptions will coincide with actual market conditions or events, and this Term Sheet should not be relied upon for such purposes. We and our affiliates, officers, directors, partners and employees, including persons involved in the preparation or issuance of this Term Sheet may, from time to time, have long or short positions in, and buy or sell, the securities mentioned in this Term Sheet or derivatives thereof (including options). Information contained in this Term Sheet is current as of the date appearing on this Term Sheet only. Information in this Term Sheet regarding the securities and the mortgage loans backing any securities discussed in this Term Sheet supersedes all prior information regarding such securities and mortgage loans. None ofCitigroup Global Markets Inc., Morgan Stanley & Co. LLC, Merrill Lynch, Pierce, Fenner & Smith Incorporated, Drexel Hamilton, LLC or The Williams Capital Group, L.P.,provides accounting, tax or legal advice.
The depositor has filed a registration statement (including a prospectus) with the Securities and Exchange Commission (“SEC”) (SEC File No. 333-207132) for the offering to which this communication relates. Before you invest, you should read the prospectus in the registration statement and other documents the depositor has filed with the SEC for more complete information about the depositor, the issuing entity and this offering. You may get these documents for free by visiting EDGAR on the SEC website at www.sec.gov. Alternatively, the depositor or Citigroup Global Markets Inc., Morgan Stanley & Co. LLC, Merrill Lynch, Pierce, Fenner & Smith Incorporated, Drexel Hamilton, LLC, The Williams Capital Group, L.P. or any other underwriter or dealer participating in this offering will arrange to send you the prospectus if you request it by calling toll-free 1-800-831-9146.
2
The issuing entity will be relying on an exclusion or exemption from the definition of “investment company” under the Investment Company Act of 1940, as amended (the “Investment Company Act”), contained in Section 3(c)(5) of the Investment Company Act or Rule 3a-7 under the Investment Company Act, although there may be additional exclusions or exemptions available to the issuing entity. The issuing entity is being structured so as not to constitute a “covered fund” for purposes of the Volcker Rule under the Dodd-Frank Act (both as defined in “Risk Factors—Legal and Regulatory Provisions Affecting Investors Could Adversely Affect the Liquidity and Other Aspects of the Offered Certificates” in the Preliminary Prospectus). See also “Legal Investment” in the Preliminary Prospectus.
The depositor has filed a registration statement (including a prospectus) with the Securities and Exchange Commission (“SEC”) (SEC File No. 333-207132) for the offering to which this communication relates. Before you invest, you should read the prospectus in the registration statement and other documents the depositor has filed with the SEC for more complete information about the depositor, the issuing entity and this offering. You may get these documents for free by visiting EDGAR on the SEC website at www.sec.gov. Alternatively, the depositor or Citigroup Global Markets Inc., Morgan Stanley & Co. LLC, Merrill Lynch, Pierce, Fenner & Smith Incorporated, Drexel Hamilton, LLC, The Williams Capital Group, L.P. or any other underwriter or dealer participating in this offering will arrange to send you the prospectus if you request it by calling toll-free 1-800-831-9146.
3
CERTIFICATE SUMMARY
| OFFERED CERTIFICATES | |||||||
Offered Classes | Expected Ratings | Approximate Initial | Approximate Initial | Initial | Pass-Through | Expected | Expected |
| Class A-1 | Aaa(sf) / AAAsf / AAA(sf) | $28,000,000 | 30.000% | % | (6) | 2.79 | 4/18 - 1/23 |
| Class A-2 | Aaa(sf) / AAAsf / AAA(sf) | $69,000,000 | 30.000% | % | (6) | 4.91 | 1/23 - 3/23 |
| Class A-3 | Aaa(sf) / AAAsf / AAA(sf) | (7) | 30.000% | % | (6) | (7) | (7) |
| Class A-4 | Aaa(sf) / AAAsf / AAA(sf) | (7) | 30.000% | % | (6) | (7) | (7) |
| Class A-AB | Aaa(sf) / AAAsf / AAA(sf) | $49,000,000 | 30.000 % | % | (6) | 7.37 | 3/23 - 10/27 |
| Class X-A | Aa1(sf) / AAAsf / AAA(sf) | $783,442,000(8) | N/A | % | Variable IO(9) | N/A | N/A |
| Class X-B | NR / A-sf / AAA(sf) | $97,142,000(8) | N/A | % | Variable IO(9) | N/A | N/A |
| Class A-S | Aa3(sf) / AAAsf / AAA(sf) | $76,957,000 | 22.375% | % | (6) | 9.93 | 2/28 - 3/28 |
| Class B | NR / AA-sf / AA-(sf) | $49,202,000 | 17.500% | % | (6) | 9.97 | 3/28 - 3/28 |
| Class C | NR / A-sf / A-(sf) | $47,940,000 | 12.750% | % | (6) | 9.97 | 3/28 - 3/28 |
| NON-OFFERED CERTIFICATES | |||||||
Non-Offered Classes | Expected Ratings | Approximate Initial | Approximate Initial | Initial | Pass-Through | Expected | Expected |
| Class X-D | NR / BBB-sf / BBB-(sf) | $52,986,000(8) | N/A | % | Variable IO(9) | N/A | N/A |
| Class X-E | NR / BB-sf / NR | $25,232,000(8) | N/A | % | Variable IO(9) | N/A | N/A |
| Class X-F | NR / B-sf / NR | $10,092,000(8) | N/A | % | Variable IO(9) | N/A | N/A |
| Class X-G | NR / NR / NR | $40,371,466(8) | N/A | % | Variable IO(9) | N/A | N/A |
| Class D | NR / BBB-sf / BBB-(sf) | $52,986,000 | 7.500% | % | (6) | 9.97 | 3/28 - 3/28 |
| Class E | NR / BB-sf / NR | $25,232,000 | 5.000% | % | (6) | 9.97 | 3/28 - 3/28 |
| Class F | NR / B-sf / NR | $10,092,000 | 4.000% | % | (6) | 9.97 | 3/28 - 3/28 |
| Class G | NR / NR / NR | $40,371,466 | 0.000% | % | (6) | 9.97 | 3/28 - 3/28 |
| Class R(10) | N/A | N/A | N/A | N/A | N/A | N/A | N/A |
NON-OFFERED VERTICAL RISK RETENTION INTEREST | |||||||
Non-Offered Eligible Vertical Interest | Expected Ratings | Approximate Initial | Approximate Initial | Initial | Pass-Through | Expected | Expected |
| VRR Interest(11) | NR / NR / NR | $53,119,236 | N/A | % | WAC(12) | 9.22 | 4/18 - 3/28 |
| (1) | It is a condition of issuance that the offered certificates and certain classes of non-offered certificates receive the ratings set forth above. The anticipated ratings shown are those of Moody’s Investors Service, Inc. (“Moody’s”), Fitch Ratings, Inc. (“Fitch”) and Kroll Bond Rating Agency, Inc. (“KBRA”). Subject to the discussion under “Ratings” in the Preliminary Prospectus, the ratings on the certificates address the likelihood of the timely receipt by holders of all payments of interest to which they are entitled on each distribution date and, except in the case of the interest only certificates, the ultimate receipt by holders of all payments of principal to which they are entitled on or before the applicable rated final distribution date. Certain nationally recognized statistical rating organizations, as defined in Section 3(a)(62) of the Securities Exchange Act of 1934, as amended, that were not hired by the depositor may use information they receive pursuant to Rule 17g-5 under the Securities Exchange Act of 1934, as amended, or otherwise to rate the offered certificates. We cannot assure you as to what ratings a non-hired nationally recognized statistical rating organization would assign. See “Risk Factors—Nationally Recognized Statistical Rating Organizations May Assign Different Ratings to the Certificates; Ratings of the Certificates Reflect Only the Views of the Applicable Rating Agencies as of the Dates Such Ratings Were Issued; Ratings May Affect ERISA Eligibility; Ratings May Be Downgraded” in the Preliminary Prospectus. Moody’s, Fitch and KBRA have informed us that the “sf” designation in the ratings represents an identifier of structured finance product ratings. For additional information about this identifier, prospective investors can go to the related rating agency’s website. The depositor and the underwriters have not verified, do not adopt and do not accept responsibility for any statements made by the rating agencies on those websites. Credit ratings referenced throughout this Term Sheet are forward-looking opinions about credit risk and express a rating agency’s opinion about the willingness and ability of an issuer of securities to meet its financial obligations in full and on time. Ratings are not indications of investment merit and are not buy, sell or hold recommendations, a measure of asset value or an indication of the suitability of an investment. |
| (2) | Approximate, subject to a variance of plus or minus 5%, and further subject to the discussion in footnote (7) below. The certificate balance of the VRR Interest (as defined in footnote (11) below) is not included in the certificate balance or notional amount of any other class of certificates listed in the table above, and the VRR Interest is not offered hereby. In addition, the notional amounts of the Class X-A, Class X-B, Class X-D, Class X-E, Class X-F and Class X-G certificates may vary depending upon the final pricing of the classes of Principal Balance Certificates (as defined in footnote (3) below) whose certificate balances comprise such notional amounts, and, if as a result of such pricing the pass-through rate of any class of the Class X-A, Class X-B, Class X-D, Class X-E, Class X-F or Class X-G certificates, as applicable, would be equal to zero at all times, such class of certificates will not be issued on the closing date of this securitization. |
| (3) | The approximate initial credit support percentages set forth for the Class A-1, Class A-2, Class A-3, Class A-4 and Class A-AB certificates are represented in the aggregate. The approximate initial credit support percentages shown in the table above do not take into account the VRR Interest. However, losses incurred on the mortgage loans will be allocated between the VRR Interest, on the one hand, and the Class A-1, Class A-2, Class A-3, Class A-4, Class A-AB, Class A-S, Class B, Class C, Class D, Class E, Class F and Class G certificates (collectively, the “Non-Vertically Retained Principal Balance Certificates”), on the other hand,pro rata in accordance with their respective outstanding certificate balances. See “Credit Risk Retention” and “Description of the Certificates” in the Preliminary Prospectus. The VRR Interest and the Non-Vertically Retained Principal Balance Certificates are collectively referred to in this Term Sheet as the “Principal Balance Certificates”. |
| (4) | Approximateper annum rate as of the Closing Date. |
| (5) | Determined assuming no prepayments prior to the maturity date or any anticipated repayment date, as applicable, for anymortgage loan and based on the modeling assumptions described under“Yield, Prepayment and Maturity Considerations” in the Preliminary Prospectus. |
The depositor has filed a registration statement (including a prospectus) with the Securities and Exchange Commission (“SEC”) (SEC File No. 333-207132) for the offering to which this communication relates. Before you invest, you should read the prospectus in the registration statement and other documents the depositor has filed with the SEC for more complete information about the depositor, the issuing entity and this offering. You may get these documents for free by visiting EDGAR on the SEC website at www.sec.gov. Alternatively, the depositor or Citigroup Global Markets Inc., Morgan Stanley & Co. LLC, Merrill Lynch, Pierce, Fenner & Smith Incorporated, Drexel Hamilton, LLC, The Williams Capital Group, L.P. or any other underwriter or dealer participating in this offering will arrange to send you the prospectus if you request it by calling toll-free 1-800-831-9146.
4
CERTIFICATE SUMMARY (continued)
| (6) | For any distribution date, the pass-through rate on each class of the Non-Vertically Retained Principal Balance Certificates will generally be equal to one of (i) a fixedper annumrate, (ii) the weighted average of the net interest rates on the mortgage loans (in each case, adjusted, if necessary, to accrue on the basis of a 360-day year consisting of twelve 30-day months) as in effect from time to time, (iii) a rate equal to the lesser of a specifiedper annum rate and the weighted average rate described in clause (ii), or (iv) the weighted average rate described in clause (ii) less a specified percentage, but no less than 0.000%, as describedunder“Description of the Certificates—Distributions—Pass Through Rates” in the Preliminary Prospectus. |
| (7) | The exact initial certificate balances of the Class A-3 and Class A-4 certificates are unknown and will be determined based on the final pricing of those classes of certificates. However, the respective initial certificate balances, weighted average lives and principal windows of the Class A-3 and Class A-4 certificates are expected to be within the applicable ranges reflected in the following chart. The aggregate initial certificate balance of the Class A-3 and Class A-4 certificates is expected to be approximately $560,485,000, subject to a variance of plus or minus 5%. |
Class of | Expected Range of Initial | Expected Range of | Expected Range of Principal |
| Class A-3 | $70,000,000 - $170,000,000 | 9.68 - 9.74 | 10/27 - 12/27 / 10/27 - 1/28 |
| Class A-4 | $390,485,000 - $490,485,000 | 9.86 - 9.85 | 1/28 - 2/28 / 12/27 - 2/28 |
| (8) | The Class X-A, Class X-B, Class X-D, Class X-E, Class X-F and Class X-G certificates (collectively, the “Class X Certificates”) will not have certificate balances and will not be entitled to receive distributions of principal. Interest will accrue on each class of Class X Certificates at the related pass-through rate based upon the related notional amount. The notional amount of each class of the Class X Certificates will be equal to the certificate balance or the aggregate of the certificate balances, as applicable, from time to time of the class or classes of the Non-Vertically Retained Principal Balance Certificates identified in the same row as such class of Class X Certificates in the chart below (as to such class of Class X Certificates, the “Corresponding Principal Balance Certificates”): |
| Class of Class X Certificates | Class(es) of Corresponding Principal Balance Certificates |
| Class X-A | Class A-1, Class A-2, Class A-3, Class A-4, Class A-AB and Class A-S |
| Class X-B | Class B and Class C |
| Class X-D | Class D |
| Class X-E | Class E |
| Class X-F | Class F |
| Class X-G | Class G |
| (9) | The pass-through rate on each class of Class X Certificates will generally be aper annum rate equal to the excess, if any, of (i) the weighted average of the net interest rates on the mortgage loans (in each case, adjusted, if necessary, to accrue on the basis of a 360-day year consisting of twelve 30-day months) as in effect from time to time, over (ii) the pass-through rate (or, if applicable, the weighted average of the pass-through rates) of the class or classes of Corresponding Principal Balance Certificates as in effect from time to time, as described in the Preliminary Prospectus. |
| (10) | The Class R certificates will not have a certificate balance, notional amount, pass-through rate, rating or rated final distribution date. The Class R certificates will represent the residual interests in each of two separate REMICs, as further described in the Preliminary Prospectus. The Class R certificates will not be entitled to distributions of principal or interest. |
| (11) | Citi Real Estate Funding Inc. (as retaining sponsor) is expected to acquire (or cause one or more other retaining parties to acquire) from the depositor, on the Closing Date (as defined below), portions of an “eligible vertical interest” (as defined in Regulation RR) in the form of a “single vertical security” (as defined in Regulation RR) with an initial certificate balance of approximately $53,119,236 (the “VRR Interest”), which is expected to represent approximately 5.0% of the aggregate initial certificate balance of all of the “ABS interests” (as defined in Regulation RR) issued by the issuing entity on the Closing Date. The VRR Interest will be retained by certain retaining parties in accordance with the credit risk retention rules applicable to this securitization transaction. See “Credit Risk Retention” in the Preliminary Prospectus. The VRR Interest is a class of certificates. |
| (12) | Although it does not have a specified pass-through rate (other than for tax reporting purposes), the effective interest rate for the VRR Interest will be the weighted average of the net mortgage interest rates on the mortgage loans (in each case, adjusted, if necessary, to accrue on the basis of a 360-day year consisting of twelve 30-day months) as in effect from time to time. |
The depositor has filed a registration statement (including a prospectus) with the Securities and Exchange Commission (“SEC”) (SEC File No. 333-207132) for the offering to which this communication relates. Before you invest, you should read the prospectus in the registration statement and other documents the depositor has filed with the SEC for more complete information about the depositor, the issuing entity and this offering. You may get these documents for free by visiting EDGAR on the SEC website at www.sec.gov. Alternatively, the depositor or Citigroup Global Markets Inc., Morgan Stanley & Co. LLC, Merrill Lynch, Pierce, Fenner & Smith Incorporated, Drexel Hamilton, LLC, The Williams Capital Group, L.P. or any other underwriter or dealer participating in this offering will arrange to send you the prospectus if you request it by calling toll-free 1-800-831-9146.
5
MORTGAGE POOL CHARACTERISTICS
| Mortgage Pool Characteristics(1) | |
| Initial Pool Balance(2) | $1,062,384,703 |
| Number of Mortgage Loans | 52 |
| Number of Mortgaged Properties | 142 |
| Average Cut-off Date Balance | $20,430,475 |
| Weighted Average Mortgage Rate | 4.69063% |
| Weighted Average Remaining Term to Maturity/ARD (months) | 115 |
| Weighted Average Remaining Amortization Term (months)(3) | 351 |
| Weighted Average Cut-off Date LTV Ratio(4) | 60.1% |
| Weighted Average Maturity Date/ARD LTV Ratio(4) | 54.9% |
| Weighted Average UW NCF DSCR(5) | 1.80x |
| Weighted Average Debt Yield on Underwritten NOI(6) | 10.8% |
| % of Initial Pool Balance of Mortgage Loans that are Amortizing Balloon | 22.4% |
| % of Initial Pool Balance of Mortgage Loans that are Interest Only then Amortizing Balloon | 33.8% |
| % of Initial Pool Balance of Mortgage Loans that are Interest Only | 43.8% |
| % of Initial Pool Balance of Mortgaged Properties with Single Tenants | 8.8% |
| % of Initial Pool Balance of Mortgage Loans with Mezzanine Debt | 0.9% |
| % of Initial Pool Balance of Mortgage Loans with Subordinate Debt | 3.8% |
| (1) | The Cut-off Date LTV Ratio, Maturity Date/ARD LTV Ratio, UW NCF DSCR, Debt Yield on Underwritten NOI and Cut-off Date Balance Per SF / Rooms information for each mortgage loan is presented in this Term Sheet (i) if such mortgage loan is part of a loan combination (as defined under “Collateral Overview—Loan Combination Summary” below), based on both that mortgage loan and any related pari passu companion loan(s) but, unless otherwise specifically indicated, without regard to any related subordinate companion loan(s), and (ii) unless otherwise specifically indicated, without regard to any other indebtedness (whether or not secured by the related mortgaged property, ownership interests in the related borrower or otherwise) that currently exists or that may be incurred by the related borrower or its owners in the future. |
| (2) | Subject to a permitted variance of plus or minus 5%. |
| (3) | Excludes mortgage loans that are interest-only for the entire term. |
| (4) | The Cut-off Date LTV Ratios and Maturity Date/ARD LTV Ratios presented in this Term Sheet are generally based on the “as-is” appraised values of the related mortgaged properties (as set forth on Annex A to the Preliminary Prospectus),provided that such LTV ratios may be calculated (i) based on “as-stabilized” or similar values in certain cases where the completion of certain hypothetical conditions or other events at the property are assumed and/or where reserves have been established at origination to satisfy the applicable condition or event that is expected to occur, (ii) based on an “as-is portfolio value”, which represents the appraised value for a portfolio of mortgaged properties as a whole and not the sum of the appraised values for each of the individual mortgaged properties or (iii) based on the Cut-off Date Balance net of a related earnout or holdback reserve, in each case as further described in the definitions of “Appraised Value”, “Cut-off Date LTV Ratio” and “Maturity Date/ARD LTV Ratio” under “Description of the Mortgage Pool—Certain Calculations and Definitions” in the Preliminary Prospectus. |
| (5) | The UW NCF DSCR for each mortgage loan is generally calculated by dividing the UW NCF for the related mortgaged property or mortgaged properties by the annual debt service for such mortgage loan, as adjusted in the case of mortgage loans with a partial interest only period by using the first 12 amortizing payments due instead of the actual interest only payment due. |
| (6) | The Debt Yield on Underwritten NOI for each mortgage loan is generally calculated as the related mortgaged property’s Underwritten NOI divided by the Cut-off Date Balance of such mortgage loan, and the Debt Yield on Underwritten NCF for each mortgage loan is generally calculated as the related mortgaged property’s Underwritten NCF divided by the Cut-off Date Balance of such mortgage loan;provided, that such Debt Yields may be calculated based on the Cut-off Date Balance net of a related earnout or holdback reserve, as further described in the definitions of “Debt Yield on Underwritten NOI” and “Debt Yield on Underwritten NCF” under“Description of the Mortgage Pool—Certain Calculations and Definitions” in the Preliminary Prospectus. |
The depositor has filed a registration statement (including a prospectus) with the Securities and Exchange Commission (“SEC”) (SEC File No. 333-207132) for the offering to which this communication relates. Before you invest, you should read the prospectus in the registration statement and other documents the depositor has filed with the SEC for more complete information about the depositor, the issuing entity and this offering. You may get these documents for free by visiting EDGAR on the SEC website at www.sec.gov. Alternatively, the depositor or Citigroup Global Markets Inc., Morgan Stanley & Co. LLC, Merrill Lynch, Pierce, Fenner & Smith Incorporated, Drexel Hamilton, LLC, The Williams Capital Group, L.P. or any other underwriter or dealer participating in this offering will arrange to send you the prospectus if you request it by calling toll-free 1-800-831-9146.
6
KEY FEATURES OF THE CERTIFICATES
| Co-Lead Managers and Joint Bookrunners: | Citigroup Global Markets Inc. Morgan Stanley & Co. LLC Merrill Lynch, Pierce, Fenner & Smith Incorporated
|
| Co-Managers: | Drexel Hamilton, LLC The Williams Capital Group, L.P.
|
| Depositor: | Citigroup Commercial Mortgage Securities Inc.
|
| Initial Pool Balance: | $1,062,384,703 |
| Master Servicer: | Midland Loan Services, a Division of PNC Bank, National Association
|
| Special Servicer: | LNR Partners, LLC
|
| Certificate Administrator: | Citibank, N.A.
|
| Trustee: | Wilmington Trust, National Association
|
| Operating Advisor: | Park Bridge Lender Services LLC
|
| Asset Representations Reviewer: | Park Bridge Lender Services LLC
|
| Risk Retention Consultation Party: | Citi Real Estate Funding Inc.
|
| Credit Risk Retention: | For a discussion on the manner in which the U.S. credit risk retention requirements are being satisfied by Citi Real Estate Funding Inc., as retaining sponsor, see “Credit Risk Retention” in the Preliminary Prospectus. Note that this securitization transaction is not structured to satisfy the EU risk retention and due diligence requirements.
|
| Closing Date: | On or about March 20, 2018
|
| Cut-off Date: | With respect to each mortgage loan, the due date in March 2018 for that mortgage loan (or, in the case of any mortgage loan that has its first due date subsequent to March 2018, the date that would have been its due date in March 2018 under the terms of that mortgage loan if a monthly payment were scheduled to be due in that month) |
| Determination Date: | The 6th day of each month or next business day, commencing in April 2018 |
| Distribution Date: | The 4th business day after the Determination Date, commencing in April 2018 |
| Interest Accrual: | Preceding calendar month
|
| ERISA Eligible: | The offered certificates are expected to be ERISA eligible, subject to the exemption conditions described in the Preliminary Prospectus
|
| SMMEA Eligible: | No |
| Payment Structure: | Sequential Pay |
| Day Count: | 30/360 |
| Tax Structure: | REMIC |
| Rated Final Distribution Date: | March 2051 |
| Cleanup Call: | 1.0% |
| Minimum Denominations: | $10,000 minimum for the offered certificates (other than the Class X-A and Class X-B certificates); $1,000,000 minimum for the Class X-A and Class X-B certificates; and integral multiples of $1 thereafter for all the offered certificates |
| Delivery: | Book-entry through DTC |
| Bond Information: | Cash flows are expected to be modeled by TREPP, INTEX and BLOOMBERG |
The depositor has filed a registration statement (including a prospectus) with the Securities and Exchange Commission (“SEC”) (SEC File No. 333-207132) for the offering to which this communication relates. Before you invest, you should read the prospectus in the registration statement and other documents the depositor has filed with the SEC for more complete information about the depositor, the issuing entity and this offering. You may get these documents for free by visiting EDGAR on the SEC website at www.sec.gov. Alternatively, the depositor or Citigroup Global Markets Inc., Morgan Stanley & Co. LLC, Merrill Lynch, Pierce, Fenner & Smith Incorporated, Drexel Hamilton, LLC, The Williams Capital Group, L.P. or any other underwriter or dealer participating in this offering will arrange to send you the prospectus if you request it by calling toll-free 1-800-831-9146.
7
TRANSACTION HIGHLIGHTS
| ■ | $1,062,384,702 (Approximate) New-Issue Multi-Borrower CMBS: |
| — | Overview: The mortgage pool consists of 52 fixed-rate commercial mortgage loans that have an aggregate Cut-off Date Balance of $1,062,384,703 (the “Initial Pool Balance”), have an average mortgage loan Cut-off Date Balance of $20,430,475 and are secured by 142 mortgaged properties located throughout 30 states and the District of Columbia. |
| — | LTV: 60.1% weighted average Cut-off Date LTV Ratio |
| — | DSCR: 1.80x weighted average Underwritten Debt Service Coverage Ratio |
| — | Debt Yield: 10.8% weighted average Debt Yield on Underwritten NOI |
| — | Credit Support: 30.000% credit support to Class A-1 / A-2 / A-3 / A-4 / A-AB |
| ■ | Loan Structural Features: |
| — | Amortization: 56.2% of the mortgage loans by Initial Pool Balance have scheduled amortization: |
| – | 22.4% of the mortgage loans by Initial Pool Balance have amortization for the entire term with a balloon payment due at maturity |
| – | 33.8% of the mortgage loans by Initial Pool Balance have scheduled amortization following a partial interest only period with a balloon payment due at maturity |
| — | Hard Lockboxes: 35.1% of the mortgage loans by Initial Pool Balance have a Hard Lockbox in place |
| — | Cash Traps: 98.3% of the mortgage loans by Initial Pool Balance have cash traps triggered by certain declines in cash flow, all at levels equal to or greater than a 1.05x coverage, that fund an excess cash flow reserve |
| — | Reserves: The mortgage loans require amounts to be escrowed for reserves as follows: |
| – | Real Estate Taxes: 45 mortgage loans representing 77.6% of the Initial Pool Balance |
| – | Insurance: 31 mortgage loans representing 54.1% of the Initial Pool Balance |
| – | Replacement Reserves (Including FF&E Reserves): 44 mortgage loans representing 78.7% of the Initial Pool Balance |
| – | Tenant Improvements / Leasing Commissions: 29 mortgage loans representing 80.8% of the portion of the Initial Pool Balance that is secured by office, retail, industrial and mixed use properties |
| — | Predominantly Defeasance Mortgage Loans: 84.4% of the mortgage loans by Initial Pool Balance permit defeasance only after an initial lockout period |
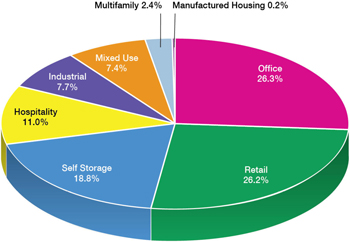
| ■ | Multiple-Asset Types > 5.0% of the Initial Pool Balance: |
| — | Office: 26.3% of the mortgaged properties by allocated Initial Pool Balance are office properties |
| — | Retail: 26.2% of the mortgaged properties by allocated Initial Pool Balance are retail properties (21.9% are anchored retail properties) |
| — | Self Storage: 18.8% of the mortgaged properties by allocated Initial Pool Balance are self-storage properties |
| — | Hospitality: 11.0% of the mortgaged properties by allocated Initial Pool Balance are hospitality properties |
| — | Industrial: 7.7% of the mortgaged properties by allocated Initial Pool Balance are industrial properties |
| — | Mixed Use: 7.4% of the mortgaged properties by allocated Initial Pool Balance are mixed use properties |
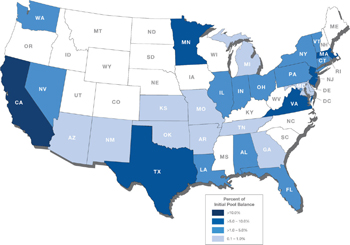
| ■ | Geographic Diversity: The 142 mortgaged properties are located throughout 30 states and the District of Columbia, with only one state having greater than 10.0% of the allocated Initial Pool Balance: California (19.7%) |
The depositor has filed a registration statement (including a prospectus) with the Securities and Exchange Commission (“SEC”) (SEC File No. 333-207132) for the offering to which this communication relates. Before you invest, you should read the prospectus in the registration statement and other documents the depositor has filed with the SEC for more complete information about the depositor, the issuing entity and this offering. You may get these documents for free by visiting EDGAR on the SEC website at www.sec.gov. Alternatively, the depositor or Citigroup Global Markets Inc., Morgan Stanley & Co. LLC, Merrill Lynch, Pierce, Fenner & Smith Incorporated, Drexel Hamilton, LLC, The Williams Capital Group, L.P. or any other underwriter or dealer participating in this offering will arrange to send you the prospectus if you request it by calling toll-free 1-800-831-9146.
8
| COLLATERAL OVERVIEW |
Mortgage Loans by Loan Seller
Mortgage Loan Seller | Mortgage Loans | Mortgaged Properties | Aggregate Cut-off | % of Initial | ||||||||
| Morgan Stanley Mortgage Capital Holdings LLC | 12 | 48 | $299,400,517 | 28.2 | % | |||||||
| Citi Real Estate Funding Inc. | 13 | 40 | 292,166,622 | 27.5 | ||||||||
| Starwood Mortgage Funding V LLC | 18 | 20 | 256,817,564 | 24.2 | ||||||||
| Bank of America, National Association | 9 | 34 | 214,000,000 | 20.1 | ||||||||
| Total | 52 | 142 | $1,062,384,703 | 100.0 | % | |||||||
Ten Largest Mortgage Loans(1)(2)
# | Mortgage Loan Name | Cut-off Date | % of | Property | Property | Cut-off Date Balance Per SF/Rooms | UW | UW | Cut-off Date LTV | |||||||||||||||||
| 1 | Extra Space - TIAA Self Storage Portfolio | $105,000,000 | 9.9 | % | Self Storage | 1,614,702 | $142 | 1.97 | x | 9.2 | % | 58.1 | % | |||||||||||||
| 2 | Park Place East and Park Place West | 54,250,000 | 5.1 | Office | 397,968 | $136 | 1.32 | x | 9.7 | % | 68.9 | % | ||||||||||||||
| 3 | The SoCal Portfolio | 50,000,000 | 4.7 | Various | 2,194,425 | $104 | 1.48 | x | 10.2 | % | 59.4 | % | ||||||||||||||
| 4 | Westin Tysons Corner | 48,000,000 | 4.5 | Hospitality | 407 | $117,936 | 1.61 | x | 12.5 | % | 60.8 | % | ||||||||||||||
| 5 | Extra Space Self Storage Portfolio | 42,400,000 | 4.0 | Self Storage | 2,668,218 | $73 | 2.01 | x | 8.7 | % | 65.0 | % | ||||||||||||||
| 6 | Red Building | 40,000,000 | 3.8 | Office | 411,547 | $194 | 3.31 | x | 16.1 | % | 27.9 | % | ||||||||||||||
| 7 | Town Center at Levis Commons | 37,000,000 | 3.5 | Retail | 309,532 | $120 | 1.98 | x | 10.6 | % | 62.2 | % | ||||||||||||||
| 8 | Oxford Exchange | 36,900,000 | 3.5 | Retail | 333,866 | $111 | 1.63 | x | 10.4 | % | 68.3 | % | ||||||||||||||
| 9 | 3rd & Pine Seattle Retail & Parking | 35,200,000 | 3.3 | Mixed Use | 349,184 | $101 | 1.78 | x | 8.4 | % | 59.7 | % | ||||||||||||||
| 10 | Axcelis Corporate Center | 33,932,928 | 3.2 | Industrial | 417,313 | $122 | 1.33 | x | 10.2 | % | 62.0 | % | ||||||||||||||
| Top 10 Total / Wtd. Avg. | $482,682,928 | 45.4 | % | 1.84 | x | 10.4 | % | 59.3 | % | |||||||||||||||||
| Remaining Total / Wtd. Avg. | 579,701,775 | 54.6 | 1.77 | x | 11.1 | % | 60.7 | % | ||||||||||||||||||
| Total / Wtd. Avg. | $1,062,384,703 | 100.0 | % | 1.80 | x | 10.8 | % | 60.1 | % | |||||||||||||||||
| (1) | See footnotes to table entitled“Mortgage Pool Characteristics” above. |
| (2) | With respect to each mortgage loan that is part of a loan combination (as identified under “Collateral Overview—Loan Combination Summary” below), the UW NCF DSCR, UW NOI Debt Yield and Cut-off Date LTV Ratio are calculated based on both that mortgage loan and any related pari passu companion loan(s), but without regard to any related subordinate companion loan(s) or other indebtedness. With respect to the Red Building mortgage loan, the mortgaged property is also encumbered by three subordinate companion loans with an aggregate outstanding principal balance as of the Cut-off Date of $116,000,000. The UW NCF DSCR, UW NOI Debt Yield and Cut-off Date LTV Ratio for the Red Building mortgage loan, inclusive of the subordinate companion loans, are 1.15x, 6.6% and 68.4%, respectively. |
| (3) | With respect to certain of the mortgage loans identified above, the Cut-off Date LTV Ratios have been calculated using “as-stabilized”, “portfolio premium” or similar hypothetical values. Such mortgage loans are identified under the definition of “Appraised Value” set forth under “Description of the Mortgage Pool—Certain Calculations and Definitions” in the Preliminary Prospectus. |
The depositor has filed a registration statement (including a prospectus) with the Securities and Exchange Commission (“SEC”) (SEC File No. 333-207132) for the offering to which this communication relates. Before you invest, you should read the prospectus in the registration statement and other documents the depositor has filed with the SEC for more complete information about the depositor, the issuing entity and this offering. You may get these documents for free by visiting EDGAR on the SEC website at www.sec.gov. Alternatively, the depositor or Citigroup Global Markets Inc., Morgan Stanley & Co. LLC, Merrill Lynch, Pierce, Fenner & Smith Incorporated, Drexel Hamilton, LLC, The Williams Capital Group, L.P. or any other underwriter or dealer participating in this offering will arrange to send you the prospectus if you request it by calling toll-free 1-800-831-9146.
9
COLLATERAL OVERVIEW (continued) |
Loan Combination Summary
Mortgaged Property Name(1) | Mortgage Loan | Mortgage | Aggregate Pari Passu | Aggregate Subordinate Companion Loan Cut-off Date Balance | Loan | Controlling | Master | Special | ||||||||||||
| Extra Space - TIAA Self Storage Portfolio | $105,000,000 | 9.9 | % | $124,000,000 | — | $229,000,000 | CGCMT 2018-B2 | Midland | LNR Partners | |||||||||||
| The SoCal Portfolio | $50,000,000 | 4.7 | % | $179,300,000 | — | $229,300,000 | CGCMT 2018-B2 | Midland | LNR Partners | |||||||||||
| Extra Space Self Storage Portfolio | $42,400,000 | 4.0 | % | $152,000,000 | — | $194,400,000 | MSC 2017-HR2 | Wells Fargo | LNR Partners | |||||||||||
| Red Building | $40,000,000 | 3.8 | % | $40,000,000 | $116,000,000 | $196,000,000 | Benchmark 2018-B2(3) | KeyBank | CWCapital | |||||||||||
| Axcelis Corporate Center | $33,932,928 | 3.2 | % | $16,966,464 | — | $50,899,391 | CGCMT 2018-B2 | Midland | LNR Partners | |||||||||||
| One Newark Center | $32,000,000 | 3.0 | % | $34,580,000 | — | $66,580,000 | BANK 2018-BNK10 | Wells Fargo | Torchlight | |||||||||||
| Braddock Metro Center | $30,000,000 | 2.8 | % | $44,200,000 | — | $74,200,000 | Benchmark 2018-B2 | KeyBank | CWCapital | |||||||||||
| Cross Point | $25,000,000 | 2.4 | % | $125,000,000 | — | $150,000,000 | UBS 2018-C8(4) | Midland(4) | Midland(4) | |||||||||||
| Fort Knox Executive Park | $19,000,000 | 1.8 | % | $16,000,000 | — | $35,000,000 | CGCMT 2018-B2 | Midland | LNR Partners | |||||||||||
| Warwick Mall | $17,500,000 | 1.6 | % | $57,500,000 | — | $75,000,000 | BANK 2017-BNK9 | Wells Fargo | Rialto | |||||||||||
| Two Harbor Point Square | $10,000,000 | 0.9 | % | $39,500,000 | — | 49,500,000 | CGCMT 2018-B2 | Midland | LNR Partners | |||||||||||
| (1) | Each of the mortgage loans included in the issuing entity that is secured by a mortgaged property or portfolio of mortgaged properties identified in the table above, together with the related companion loan(s) (none of which is included in the issuing entity), is referred to in this Term Sheet as a “loan combination”. See “Description of the Mortgage Pool—The Loan Combinations” in the Preliminary Prospectus. |
| (2) | Each loan combination will be serviced under the related Controlling PSA, and the controlling class representative (or an equivalent entity), if any, under the related Controlling PSA (or such other party as is designated under the related Controlling PSA) will be entitled to exercise the rights of controlling note holder for the subject loan combination, except as otherwise discussed in footnotes (3) and (4) below. |
| (3) | With respect to the Red Building mortgage loan, the control rights and the right to replace the applicable special servicer are held by the holder of the subordinate companion loan evidenced by note C so long as no “note C control appraisal period” under the related co-lender agreement is in effect. If a “note C control appraisal period” under the related co-lender agreement is in effect and no “note B control appraisal period” is in effect, then note B-1 will be the controlling note. If a “note B control appraisal period” under the related co-lender agreement is in effect, then note A-1 will be the controlling note. Unless and until a “note B control appraisal period” is in effect, the controlling class representative (or equivalent entity) under the applicable Controlling PSA will not be entitled to exercise control rights or the right to replace the applicable special servicer for the Red Building mortgage loan. |
| (4) | The Cross Point loan combination is expected to be initially serviced pursuant to the UBS 2018-C8 pooling and servicing agreement (which will be the initial Controlling PSA for such loan combination), by the outside servicer and outside special servicer set forth in the table above. Notwithstanding the foregoing, upon the inclusion of the related controlling pari passu companion loan in a future securitization transaction, such loan combination will be serviced under the pooling and servicing agreement entered into in connection with that future securitization, which will then be the applicable Controlling PSA for such loan combination. With respect to the Cross Point mortgage loan, the controlling class representative (or equivalent entity) under the initial Controlling PSA will only have non-binding consultation rights regarding major servicing decisions. The holder of the related controlling pari passu companion loan currently has consent rights regarding major servicing decisions, and termination rights with respect to the related outside special servicer, in connection with such mortgage loan. |
Mortgage Loans with Existing Mezzanine Debt or Subordinate Debt(1)
Mortgaged Property Name | Mortgage | Aggregate | Aggregate | Mezzanine | Cut-off Date | Wtd. Avg Cut-off | Cut-off Date | Cut-off | Cut-off | Cut-off | |||||||||||||
| Red Building | $40,000,000 | $40,000,000 | $116,000,000 | — | $196,000,000 | 5.14600 | % | 27.9 | % | 68.4 | % | 3.31x | 1.15x | ||||||||||
| Two Harbor Point Square | $10,000,000 | $39,500,000 | — | $11,500,000 | $61,000,000 | 5.26003 | %(4) | 61.9 | % | 76.3 | % | 1.78x | 1.28x | ||||||||||
| (1) | See footnotes to table entitled “Mortgage Pool Characteristics” above. |
| (2) | All “Total Debt” calculations set forth in the table above include any related pari passu companion loan(s), any related subordinate companion loan(s) and any related mezzanine debt. |
| (3) | “Cut-off Date Mortgage Loan LTV” and “Cut-off Date Mortgage Loan UW NCF DSCR” calculations include any related pari passu companion loan(s). |
| (4) | The Two Harbor Point Square Wtd. Avg. Cut-off Date Total Debt Interest Rate to full precision is 5.26002540983607%. |
The depositor has filed a registration statement (including a prospectus) with the Securities and Exchange Commission (“SEC”) (SEC File No. 333-207132) for the offering to which this communication relates. Before you invest, you should read the prospectus in the registration statement and other documents the depositor has filed with the SEC for more complete information about the depositor, the issuing entity and this offering. You may get these documents for free by visiting EDGAR on the SEC website at www.sec.gov. Alternatively, the depositor or Citigroup Global Markets Inc., Morgan Stanley & Co. LLC, Merrill Lynch, Pierce, Fenner & Smith Incorporated, Drexel Hamilton, LLC, The Williams Capital Group, L.P. or any other underwriter or dealer participating in this offering will arrange to send you the prospectus if you request it by calling toll-free 1-800-831-9146.
10
COLLATERAL OVERVIEW (continued) |
Loan Combination Controlling Notes and Non-Controlling Notes
Mortgaged Property Name / | Controlling | Current Holder of | Current or Anticipated Holder | Cut-off Date Balance |
| Extra Space - TIAA Self Storage Portfolio | ||||
| Note A-1 | Yes | — | CGCMT 2018-B2 | $105,000,000 |
| Note A-2 | No | Bank of America, National Association | Not Identified | $80,000,000 |
| Note A-3 | No | Bank of America, National Association | Not Identified | $44,000,000 |
| The SoCal Portfolio | ||||
| Note A-1-1 | Yes | — | CGCMT 2018-B2 | $50,000,000 |
| Note A-1-2 | No | Citi Real Estate Funding Inc. | Not Identified | $35,000,000 |
| Note A-1-3 | No | Citi Real Estate Funding Inc. | Not Identified | $15,000,000 |
| Note A-1-4 | No | Citi Real Estate Funding Inc. | Not Identified | $37,580,000 |
| Note A-2-1 | No | Barclays Bank PLC | Not Identified | $45,000,000 |
| Note A-2-2 | No | Barclays Bank PLC | Not Identified | $46,720,000 |
| Extra Space Self Storage Portfolio | ||||
| Note A-1 | Yes | — | MSC 2017-HR2 | $92,000,000 |
| Note A-2 | No | — | BANK 2018-BNK10 | $60,000,000 |
| Note A-3 | No | — | CGCMT 2018-B2 | $42,400,000 |
| Red Building | ||||
| Note A-1 | (5) | — | Benchmark 2018-B2 | $40,000,000 |
| Note A-2 | No | — | CGCMT 2018-B2 | $40,000,000 |
| Note B-1 | (5) | Athene Annuity and Life Company | Not Applicable | $40,800,000 |
| Note B-2 | No | American Equity Investment Life Insurance Company | Not Applicable | $10,200,000 |
| Note C | (5) | Senior Real Estate Finance Account (N) LP | Not Applicable | $65,000,000 |
| Axcelis Corporate Center | ||||
| Note A-1 | Yes | — | CGCMT 2018-B2 | $33,932,928 |
| Note A-2 | No | Morgan Stanley Bank, N.A. | Not Identified | $16,966,464 |
| One Newark Center | ||||
| Note A-1 | No | — | CGCMT 2018-B2 | $32,000,000 |
| Note A-2 | Yes | — | BANK 2018-BNK10 | $20,000,000 |
| Note A-3 | No | — | BANK 2018-BNK10 | $14,580,000 |
| Braddock Metro Center | ||||
| Note A-1 | Yes | — | Benchmark 2018-B2 | $44,200,000 |
| Note A-2 | No | — | CGCMT 2018-B2 | $30,000,000 |
| Cross Point | ||||
| Note A-1 | Yes | Cantor Commercial Real Estate Lending, L.P. | Not Identified | $30,000,000 |
| Note A-2 | No | — | UBS 2018-C8 | $25,000,000 |
| Note A-3 | No | — | UBS 2018-C8 | $20,000,000 |
| Note A-4 | No | Cantor Commercial Real Estate Lending, L.P. | Not Identified | $20,000,000 |
| Note A-5 | No | — | CGCMT 2018-B2 | $15,000,000 |
| Note A-6 | No | — | CGCMT 2018-B2 | $10,000,000 |
| Note A-7 | No | Cantor Commercial Real Estate Lending, L.P. | Not Identified | $10,000,000 |
| Note A-8 | No | Cantor Commercial Real Estate Lending, L.P. | Not Identified | $10,000,000 |
| Note A-9 | No | — | UBS 2018-C8 | $5,000,000 |
| Note A-10 | No | Cantor Commercial Real Estate Lending, L.P. | Not Identified | $5,000,000 |
| Fort Knox Executive Park | ||||
| Note A-1 | Yes | — | CGCMT 2018-B2 | $19,000,000 |
| Note A-2 | No | Starwood Mortgage Funding II LLC | Not Identified | $16,000,000 |
| Warwick Mall | ||||
| Note A-1 | Yes | — | BANK 2017-BNK9 | $30,000,000 |
| Note A-2 | No | — | BANK 2018-BNK10 | $27,500,000 |
| Note A-3 | No | — | CGCMT 2018-B2 | $17,500,000 |
| Two Harbor Point Square | ||||
| Note A-1-A | Yes | — | CGCMT 2018-B2 | $10,000,000 |
| Note A-1-B | No | — | Benchmark 2018-B1 | $14,750,000 |
| Note A-2 | No | — | Benchmark 2018-B2 | $24,750,000 |
| (1) | The holder(s) of one or more specified controlling notes (collectively, the “Controlling Note”) will be the “controlling note holder(s)” entitled (directly or through a representative) to (a) approve or, in some cases, direct material servicing decisions involving the related loan combination (while the remaining such holder(s) generally are only entitled to non-binding consultation rights in such regard), and (b) in some cases, replace the applicable special servicer with respect to such loan combination with or without cause. See “Description of the Mortgage Pool—The Loan Combinations” and “The Pooling and Servicing Agreement—Directing Holder” in the Preliminary Prospectus. |
| (2) | The holder(s) of the note(s) other than the Controlling Note (each, a “Non-Controlling Note”) will be the “non-controlling note holder(s)” generally entitled (directly or through a representative) to certain non-binding consultation rights with respect to any decisions as to which the holder of the Controlling Note has consent rights involving the related loan combination, subject to certain exceptions, including that in certain cases where the related Controlling Note is a B-note or C-note such consultation rights will not be afforded to the holder(s) of the Non-Controlling Notes until after a control trigger event has occurred with respect to either such Controlling Note or certain certificates backed thereby, in each case as set forth in the related co-lender agreement. See “Description of the Mortgage Pool—The Loan Combinations“ in the Preliminary Prospectus. |
| (3) | Unless otherwise specified, with respect to each loan combination, any related unsecuritized Controlling Note and/or Non-Controlling Note may be further split, modified, combined and/or reissued (prior to its inclusion in a securitization transaction) as one or multiple Controlling Notes or Non-Controlling Notes, as the case may be, subject to the terms of the related co-lender agreement (including that the aggregate principal balance, weighted average interest rate and certain other material terms cannot be changed). In connection with the foregoing, any such split, modified or combined Controlling Note or Non-Controlling Note, as the case may be, may be transferred to one or multiple parties (not identified in the table above) prior to its inclusion in a future commercial mortgage securitization transaction. |
| (4) | Unless otherwise specified, with respect to each loan combination, each related unsecuritized pari passu companion loan (whether controlling or non-controlling) is expected to be contributed to one or more future commercial mortgage securitization transactions. Under the column “Current or Anticipated Holder of Securitized Note”, (i) the identification of a securitization trust means we have identified an outside securitization that has closed or as to which a preliminary prospectus or final prospectus has printed that has included or is expected to include the subject Controlling Note or Non-Controlling Note, as the case may be, (ii) “Not Identified” means the subject Controlling Note or Non-Controlling Note, as the case may be, has not been securitized and no preliminary prospectus or final prospectus has printed that identifies the future outside securitization that is expected to include the subject Controlling Note or Non-Controlling Note, and (iii) “Not Applicable” means the subject Controlling Note or Non-Controlling Note is not intended to be contributed to a future commercial mortgage securitization transaction. Under the column “Current Holder of Unsecuritized Note”, “—” means the subjectControlling Note or Non-Controlling Note is not an unsecuritized note and is currently held by the securitization trust referenced under the “Current or Anticipated Holder of Securitized Note” column. |
| (5) | With respect to the Red Building loan combination, pursuant to the related co-lender agreement, (i) the Controlling Note (so long as no “note C control appraisal period” is in effect) is note C, (ii) if a note C control appraisal period under the related co-lender agreement is in effect and no “note B control appraisal period” is in effect, then note B-1 will be the Controlling Note, and (iii) if a note B control appraisal period under the related co-lender agreement is in effect, then note A-1 will be the Controlling Note. |
The depositor has filed a registration statement (including a prospectus) with the Securities and Exchange Commission (“SEC”) (SEC File No. 333-207132) for the offering to which this communication relates. Before you invest, you should read the prospectus in the registration statement and other documents the depositor has filed with the SEC for more complete information about the depositor, the issuing entity and this offering. You may get these documents for free by visiting EDGAR on the SEC website at www.sec.gov. Alternatively, the depositor or Citigroup Global Markets Inc., Morgan Stanley & Co. LLC, Merrill Lynch, Pierce, Fenner & Smith Incorporated, Drexel Hamilton, LLC, The Williams Capital Group, L.P. or any other underwriter or dealer participating in this offering will arrange to send you the prospectus if you request it by calling toll-free 1-800-831-9146.
11
COLLATERAL OVERVIEW (continued) |
Previously Securitized Mortgaged Properties(1)
Mortgaged Property Name | Mortgage | City | State | Property Type | Cut-off Date Balance / | % of Initial Pool | Previous | |||||||||
| Westin Tysons Corner | SMF V | Falls Church | Virginia | Hospitality | $48,000,000 | 4.5 | % | WBCMT 2006-C28 | ||||||||
| Oxford Exchange | SMF V | Oxford | Alabama | Retail | $36,900,000 | 3.5 | % | WFCG 2015-BXRP | ||||||||
| Axcelis Corporate Center | MSMCH | Beverly | Massachusetts | Industrial | $33,932,928 | 3.2 | % | COMM 2015-DC1 | ||||||||
| One Newark Center | MSMCH | Newark | New Jersey | Office | $32,000,000 | 3.0 | % | BSCMS 2006-PW14 | ||||||||
| Ingram Festival Shopping Center | SMF V | San Antonio | Texas | Retail | $27,424,564 | 2.6 | % | BSCMS 2007-PW18 | ||||||||
| Willows Hotel | CREFI | Chicago | Illinois | Hospitality | $8,828,031 | 0.8 | % | LBUBS 2008-C1 | ||||||||
| Majestic Hotel | CREFI | Chicago | Illinois | Hospitality | $8,678,404 | 0.8 | % | LBUBS 2008-C1 | ||||||||
| City Suites Hotel | CREFI | Chicago | Illinois | Hospitality | $6,683,368 | 0.6 | % | LBUBS 2008-C1 | ||||||||
| Stor-All Tchoupitoulas | BANA | New Orleans | Louisiana | Self Storage | $13,350,000 | 1.3 | % | CGCMT 2013-GC11 | ||||||||
| Stor-All Gentilly Woods | BANA | New Orleans | Louisiana | Self Storage | $10,150,000 | 1.0 | % | CGCMT 2013-GC11 | ||||||||
| Fort Knox Executive Park | SMF V | Tallahassee | Florida | Office | $19,000,000 | 1.8 | % | JPMCC 2005-LDP2 | ||||||||
| 8800 Queen Avenue South | CREFI | Bloomington | Minnesota | Mixed Use | $18,500,000 | 1.7 | % | LSPT 2015-LSMZ; LSPT 2015-LSP | ||||||||
| Boulder Ridge Apartments | SMF V | Tulsa | Oklahoma | Multifamily | $6,450,000 | 0.6 | % | FNA 2015-M10 | ||||||||
| (1) | The table above includes mortgaged properties securing mortgage loans for which the most recent prior financing of all or a significant portion of such mortgaged properties was included in a securitization. Information under “Previous Securitization” represents the most recent such securitization with respect to each of those mortgaged properties. The information in the above table is based solely on information provided by the related borrower or obtained through searches of a third-party database, and has not otherwise been confirmed by the mortgage loan sellers. |
The depositor has filed a registration statement (including a prospectus) with the Securities and Exchange Commission (“SEC”) (SEC File No. 333-207132) for the offering to which this communication relates. Before you invest, you should read the prospectus in the registration statement and other documents the depositor has filed with the SEC for more complete information about the depositor, the issuing entity and this offering. You may get these documents for free by visiting EDGAR on the SEC website at www.sec.gov. Alternatively, the depositor or Citigroup Global Markets Inc., Morgan Stanley & Co. LLC, Merrill Lynch, Pierce, Fenner & Smith Incorporated, Drexel Hamilton, LLC, The Williams Capital Group, L.P. or any other underwriter or dealer participating in this offering will arrange to send you the prospectus if you request it by calling toll-free 1-800-831-9146.
12
(THIS PAGE INTENTIONALLY LEFT BLANK)
The depositor has filed a registration statement (including a prospectus) with the Securities and Exchange Commission (“SEC”) (SEC File No. 333-207132) for the offering to which this communication relates. Before you invest, you should read the prospectus in the registration statement and other documents the depositor has filed with the SEC for more complete information about the depositor, the issuing entity and this offering. You may get these documents for free by visiting EDGAR on the SEC website at www.sec.gov. Alternatively, the depositor or Citigroup Global Markets Inc., Morgan Stanley & Co. LLC, Merrill Lynch, Pierce, Fenner & Smith Incorporated, Drexel Hamilton, LLC, The Williams Capital Group, L.P. or any other underwriter or dealer participating in this offering will arrange to send you the prospectus if you request it by calling toll-free 1-800-831-9146.
13
COLLATERAL OVERVIEW (continued) |
Property Types
Property Type / Detail | Number of Mortgaged Properties | Aggregate | % of Initial | Wtd. Avg. | Wtd. Avg. | Wtd. Avg. Debt Yield on | ||||||||||||||||||
| Office | 20 | $279,665,327 | 26.3 | % | 1.88 | x | 59.1 | % | 11.8 | % | ||||||||||||||
| Suburban | 17 | 197,665,327 | 18.6 | 1.66 | x | 63.3 | % | 11.0 | % | |||||||||||||||
| CBD | 3 | 82,000,000 | 7.7 | 2.42 | x | 48.8 | % | 13.6 | % | |||||||||||||||
| Retail | 27 | $278,804,818 | 26.2 | % | 1.74 | x | 61.2 | % | 10.4 | % | ||||||||||||||
| Anchored | 12 | 177,913,679 | 16.7 | 1.74 | X | 62.0 | % | 10.5 | % | |||||||||||||||
| Lifestyle Center | 1 | 37,000,000 | 3.5 | 1.98 | x | 62.2 | % | 10.6 | % | |||||||||||||||
| Unanchored | 10 | 36,627,351 | 3.4 | 1.50 | x | 62.6 | % | 9.0 | % | |||||||||||||||
| Regional Mall | 1 | 17,500,000 | 1.6 | 2.01 | x | 47.5 | % | 13.3 | % | |||||||||||||||
| Single Tenant Retail | 2 | 9,000,000 | 0.8 | 1.30 | x | 63.5 | % | 7.6 | % | |||||||||||||||
| Shadow Anchored | 1 | 763,788 | 0.1 | 1.48 | x | 59.4 | % | 10.2 | % | |||||||||||||||
| Self Storage | 64 | $199,550,000 | 18.8 | % | 1.96 | x | 59.7 | % | 9.1 | % | ||||||||||||||
| Hospitality | 7 | $116,991,622 | 11.0 | % | 1.68 | x | 59.4 | % | 12.9 | % | ||||||||||||||
| Limited Service | 5 | 54,166,622 | 5.1 | 1.68 | x | 59.9 | % | 12.8 | % | |||||||||||||||
| Full Service | 1 | 48,000,000 | 4.5 | 1.61 | x | 60.8 | % | 12.5 | % | |||||||||||||||
| Extended Stay | 1 | 14,825,000 | 1.4 | 1.92 | x | 53.5 | % | 14.5 | % | |||||||||||||||
| Industrial | 10 | $81,762,367 | 7.7 | % | 1.70 | x | 58.8 | % | 10.9 | % | ||||||||||||||
| Flex | 8 | 60,709,598 | 5.7 | 1.62 | x | 58.2 | % | 11.1 | % | |||||||||||||||
| Warehouse/Distribution | 2 | 21,052,769 | 2.0 | 1.93 | x | 60.6 | % | 10.1 | % | |||||||||||||||
| Mixed Use | 7 | $78,400,569 | 7.4 | % | 1.72 | x | 61.6 | % | 9.9 | % | ||||||||||||||
| Parking/Retail | 2 | 45,700,000 | 4.3 | 1.67 | x | 60.4 | % | 8.5 | % | |||||||||||||||
| Office/Education | 1 | 18,500,000 | 1.7 | 1.77 | x | 69.5 | % | 12.6 | % | |||||||||||||||
| Office/Retail | 2 | 7,332,176 | 0.7 | 1.48 | x | 59.4 | % | 10.2 | % | |||||||||||||||
| Retail/Education | 1 | 3,543,393 | 0.3 | 1.48 | x | 59.4 | % | 10.2 | % | |||||||||||||||
| Multifamily/Retail | 1 | 3,325,000 | 0.3 | 3.02 | x | 41.8 | % | 14.0 | % | |||||||||||||||
| Multifamily (Garden) | 6 | $25,210,000 | 2.4 | % | 1.65 | x | 63.4 | % | 10.8 | % | ||||||||||||||
| Manufactured Housing | 1 | $2,000,000 | 0.2 | % | 1.30 | x | 69.7 | % | 10.4 | % | ||||||||||||||
| Total | 142 | $1,062,384,703 | 100.0 | % | 1.80 | x | 60.1 | % | 10.8 | % | ||||||||||||||
| (1) | Calculated based on the mortgaged property’s allocated loan amount for mortgage loans secured by more than one mortgaged property. |
| (2) | Weighted average based on the mortgaged property’s allocated loan amount for mortgage loans secured by more than one mortgaged property. |
| (3) | See footnotes to the table entitled “Mortgage Pool Characteristics” above. |
The depositor has filed a registration statement (including a prospectus) with the Securities and Exchange Commission (“SEC”) (SEC File No. 333-207132) for the offering to which this communication relates. Before you invest, you should read the prospectus in the registration statement and other documents the depositor has filed with the SEC for more complete information about the depositor, the issuing entity and this offering. You may get these documents for free by visiting EDGAR on the SEC website at www.sec.gov. Alternatively, the depositor or Citigroup Global Markets Inc., Morgan Stanley & Co. LLC, Merrill Lynch, Pierce, Fenner & Smith Incorporated, Drexel Hamilton, LLC, The Williams Capital Group, L.P. or any other underwriter or dealer participating in this offering will arrange to send you the prospectus if you request it by calling toll-free 1-800-831-9146.
14
COLLATERAL OVERVIEW (continued) |
Geographic Distribution
Property Location | Number of Mortgaged Properties | Aggregate Cut-off Date Balance(1) | % of Initial | Aggregate Appraised Value(2) | % of Total Appraised | Underwritten NOI(2) | % of Total Underwritten NOI | ||||||||||||||
| California | 45 | $209,152,086 | 19.7 | % | $1,001,980,000 | 31.0 | % | $53,930,603 | 26.6 | % | |||||||||||
| Texas | 11 | 79,275,179 | 7.5 | 131,880,000 | 4.1 | 9,175,459 | 4.5 | ||||||||||||||
| Virginia | 2 | 78,000,000 | 7.3 | 190,140,000 | 5.9 | 13,049,610 | 6.4 | ||||||||||||||
| Minnesota | 3 | 72,750,000 | 6.8 | 105,300,000 | 3.3 | 7,612,240 | 3.8 | ||||||||||||||
| New Jersey | 9 | 70,779,362 | 6.7 | 203,200,000 | 6.3 | 14,527,312 | 7.2 | ||||||||||||||
| Massachusetts | 6 | 70,041,470 | 6.6 | 373,400,000 | 11.6 | 25,412,651 | 12.5 | ||||||||||||||
| Ohio | 4 | 49,423,493 | 4.7 | 81,920,000 | 2.5 | 6,565,951 | 3.2 | ||||||||||||||
| Florida | 5 | 49,113,576 | 4.6 | 130,700,000 | 4.0 | 8,575,863 | 4.2 | ||||||||||||||
| Nevada | 5 | 45,988,397 | 4.3 | 86,480,000 | 2.7 | 6,477,489 | 3.2 | ||||||||||||||
| Illinois | 6 | 41,739,804 | 3.9 | 73,300,000 | 2.3 | 4,118,794 | 2.0 | ||||||||||||||
| Alabama | 2 | 40,199,017 | 3.8 | 63,250,000 | 2.0 | 4,519,852 | 2.2 | ||||||||||||||
| Pennsylvania | 5 | 37,689,806 | 3.5 | 94,590,000 | 2.9 | 5,623,724 | 2.8 | ||||||||||||||
| Washington | 1 | 35,200,000 | 3.3 | 59,000,000 | 1.8 | 2,958,191 | 1.5 | ||||||||||||||
| New York | 4 | 33,718,724 | 3.2 | 79,500,000 | 2.5 | 4,537,569 | 2.2 | ||||||||||||||
| Louisiana | 2 | 23,500,000 | 2.2 | 37,850,000 | 1.2 | 2,167,950 | 1.1 | ||||||||||||||
| Connecticut | 4 | 19,869,587 | 1.9 | 111,480,000 | 3.5 | 7,673,201 | 3.8 | ||||||||||||||
| Rhode Island | 1 | 17,500,000 | 1.6 | 158,000,000 | 4.9 | 9,999,062 | 4.9 | ||||||||||||||
| Indiana | 3 | 15,560,000 | 1.5 | 23,080,000 | 0.7 | 1,717,915 | 0.8 | ||||||||||||||
| District of Columbia | 1 | 14,141,070 | 1.3 | 47,490,000 | 1.5 | 2,768,131 | 1.4 | ||||||||||||||
| Vermont | 1 | 12,750,000 | 1.2 | 18,600,000 | 0.6 | 1,762,581 | 0.9 | ||||||||||||||
| Maryland | 2 | 7,854,825 | 0.7 | 25,690,000 | 0.8 | 1,574,865 | 0.8 | ||||||||||||||
| Oklahoma | 1 | 6,450,000 | 0.6 | 11,100,000 | 0.3 | 686,807 | 0.3 | ||||||||||||||
| Georgia | 3 | 6,254,177 | 0.6 | 28,250,000 | 0.9 | 1,636,879 | 0.8 | ||||||||||||||
| Arkansas | 1 | 5,750,000 | 0.5 | 8,860,000 | 0.3 | 560,664 | 0.3 | ||||||||||||||
| Michigan | 1 | 4,000,000 | 0.4 | 6,380,000 | 0.2 | 315,176 | 0.2 | ||||||||||||||
| Delaware | 1 | 3,756,616 | 0.4 | 12,590,000 | 0.4 | 748,464 | 0.4 | ||||||||||||||
| Tennessee | 6 | 3,500,617 | 0.3 | 21,900,000 | 0.7 | 1,396,158 | 0.7 | ||||||||||||||
| Kansas | 2 | 3,273,799 | 0.3 | 11,290,000 | 0.3 | 670,852 | 0.3 | ||||||||||||||
| Arizona | 2 | 2,673,220 | 0.3 | 13,570,000 | 0.4 | 785,446 | 0.4 | ||||||||||||||
| New Mexico | 2 | 1,714,321 | 0.2 | 11,400,000 | 0.4 | 688,636 | 0.3 | ||||||||||||||
| Missouri | 1 | 765,556 | 0.1 | 5,100,000 | 0.2 | 304,396 | 0.2 | ||||||||||||||
| Total | 142 | $1,062,384,703 | 100.0 | % | $3,227,270,000 | 100.0 | % | $202,542,492 | 100.0 | % | |||||||||||
| (1) | Calculated based on the mortgaged property’s allocated loan amount for mortgage loans secured by more than one mortgaged property. |
| (2) | Aggregate Appraised Values and Underwritten NOI reflect the aggregate values without any reduction for the pari passu companion loan(s). |
The depositor has filed a registration statement (including a prospectus) with the Securities and Exchange Commission (“SEC”) (SEC File No. 333-207132) for the offering to which this communication relates. Before you invest, you should read the prospectus in the registration statement and other documents the depositor has filed with the SEC for more complete information about the depositor, the issuing entity and this offering. You may get these documents for free by visiting EDGAR on the SEC website at www.sec.gov. Alternatively, the depositor or Citigroup Global Markets Inc., Morgan Stanley & Co. LLC, Merrill Lynch, Pierce, Fenner & Smith Incorporated, Drexel Hamilton, LLC, The Williams Capital Group, L.P. or any other underwriter or dealer participating in this offering will arrange to send you the prospectus if you request it by calling toll-free 1-800-831-9146.
15
| COLLATERAL OVERVIEW (continued) |
| Distribution of Cut-off Date Balances | ||||||||||
| Number | % of | |||||||||
| of | Initial | |||||||||
| Range of Cut-off Date | Mortgage | Cut-off Date | Pool | |||||||
| Balances ($) | Loans | Balance | Balance | |||||||
| 2,000,000 – 4,999,999 | 6 | $18,525,000 | 1.7 | % | ||||||
| 5,000,000 – 9,999,999 | 12 | 82,884,237 | 7.8 | |||||||
| 10,000,000 – 19,999,999 | 14 | 219,681,818 | 20.7 | |||||||
| 20,000,000 – 29,999,999 | 8 | 196,610,720 | 18.5 | |||||||
| 30,000,000 – 39,999,999 | 6 | 205,032,928 | 19.3 | |||||||
| 40,000,000 – 49,999,999 | 3 | 130,400,000 | 12.3 | |||||||
| 50,000,000 – 59,999,999 | 2 | 104,250,000 | 9.8 | |||||||
| 60,000,000 – 105,000,000 | 1 | 105,000,000 | 9.9 | |||||||
| Total | 52 | $1,062,384,703 | 100.0 | % | ||||||
| Distribution of UW NCF DSCRs(1) | ||||||||||
| Number | % of | |||||||||
| of | Initial | |||||||||
| Mortgage | Cut-off Date | Pool | ||||||||
| Range of UW DSCR (x) | Loans | Balance | Balance | |||||||
| 1.17 – 1.20 | 1 | $4,000,000 | 0.4 | % | ||||||
| 1.21 – 1.50 | 9 | 195,915,239 | 18.4 | |||||||
| 1.51 – 2.00 | 30 | 647,044,464 | 60.9 | |||||||
| 2.01 – 2.50 | 9 | 166,600,000 | 15.7 | |||||||
| 2.51 – 3.00 | 1 | 5,500,000 | 0.5 | |||||||
| 3.01 – 3.31 | 2 | 43,325,000 | 4.1 | |||||||
| Total | 52 | $1,062,384,703 | 100.0 | % | ||||||
| (1) See footnotes (1) and (5) to the table entitled “Mortgage Pool Characteristics” above. | ||||||||||
| Distribution of Amortization Types(1) | ||||||||||
| Number | % of | |||||||||
| of | Initial | |||||||||
| Mortgage | Cut-off Date | Pool | ||||||||
| Amortization Type | Loans | Balance | Balance | |||||||
| Amortizing (15 Years) | 1 | $9,958,925 | 0.9 | % | ||||||
| Amortizing (22 Years) | 1 | 2,000,000 | 0.2 | |||||||
| Amortizing (25 Years) | 2 | 52,932,928 | 5.0 | |||||||
| Amortizing (30 Years) | 8 | 173,094,851 | 16.3 | |||||||
| Interest Only, Then Amortizing(2) | 20 | 358,623,000 | 33.8 | |||||||
| Interest Only | 20 | 465,775,000 | 43.8 | |||||||
| Total | 52 | $1,062,384,703 | 100.0 | % | ||||||
| (1) All of the mortgage loans will have balloon payments at maturity date or have an anticipated repayment date, as applicable. | ||||||||||
| (2) Original partial interest only periods range from 12 to 60 months. | ||||||||||
| Distribution of Lockboxes | ||||||||||
| Number | % of | |||||||||
| of | Initial | |||||||||
| Mortgage | Cut-off Date | Pool | ||||||||
| Lockbox Type | Loans | Balance | Balance | |||||||
| Springing | 32 | $632,710,153 | 59.6 | % | ||||||
| Hard | 17 | 373,224,550 | 35.1 | |||||||
| Soft | 1 | 48,000,000 | 4.5 | |||||||
| None | 2 | 8,450,000 | 0.8 | |||||||
| Total | 52 | $1,062,384,703 | 100.0 | % | ||||||
| Distribution of Cut-off Date LTV Ratios(1) | ||||||||||
| Number | % of | |||||||||
| of | Initial | |||||||||
| Range of Cut-off Date | Mortgage | Cut-off Date | Pool | |||||||
| LTV (%) | Loans | Balance | Balance | |||||||
| 27.9 – 49.9 | 6 | $76,775,000 | 7.2 | % | ||||||
| 50.0 – 59.9 | 16 | 384,856,729 | 36.2 | |||||||
| 60.0 – 69.9 | 27 | 545,990,663 | 51.4 | |||||||
| 70.0 – 74.1 | 3 | 54,762,312 | 5.2 | |||||||
| Total | 52 | $1,062,384,703 | 100.0 | % | ||||||
| (1) See footnotes (1) and (4) to the table entitled “Mortgage Pool Characteristics” above. | ||||||||||
| Distribution of Maturity Date/ARD LTV Ratios(1) | ||||||||||
| Number | % of | |||||||||
| of | Initial | |||||||||
| Range of Maturity | Mortgage | Cut-off Date | Pool | |||||||
| Date/ARD LTV (%) | Loans | Balance | Balance | |||||||
| 25.0 – 49.9 | 13 | $205,681,656 | 19.4 | % | ||||||
| 50.0 – 59.9 | 25 | 529,540,735 | 49.8 | |||||||
| 60.0 – 66.8 | 14 | 327,162,312 | 30.8 | |||||||
| Total | 52 | $1,062,384,703 | 100.0 | % | ||||||
| (1) See footnotes (1) and (4) to the table entitled “Mortgage Pool Characteristics” above. | ||||||||||
| Distribution of Loan Purpose | ||||||||||
| Number | % of | |||||||||
| of | Initial | |||||||||
| Mortgage | Cut-off Date | Pool | ||||||||
| Loan Purpose | Loans | Balance | Balance | |||||||
| Refinance | 24 | $559,914,220 | 52.7 | % | ||||||
| Acquisition | 24 | 444,210,483 | 41.8 | |||||||
| Recapitalization | 4 | 58,260,000 | 5.5 | |||||||
| Total | 52 | $1,062,384,703 | 100.0 | % | ||||||
| Distribution of Mortgage Rates | ||||||||||
| Number | % of | |||||||||
| of | Initial | |||||||||
| Range of Mortgage | Mortgage | Cut-off Date | Pool | |||||||
| Rates (%) | Loans | Balance | Balance | |||||||
| 4.073 – 4.490 | 13 | $237,305,000 | 22.3 | % | ||||||
| 4.491 – 4.999 | 27 | 650,838,081 | 61.3 | |||||||
| 5.000 – 5.499 | 10 | 154,514,804 | 14.5 | |||||||
| 5.500 – 5.890 | 2 | 19,726,818 | 1.9 | |||||||
| Total | 52 | $1,062,384,703 | 100.0 | % | ||||||
The depositor has filed a registration statement (including a prospectus) with the Securities and Exchange Commission (“SEC”) (SEC File No. 333-207132) for the offering to which this communication relates. Before you invest, you should read the prospectus in the registration statement and other documents the depositor has filed with the SEC for more complete information about the depositor, the issuing entity and this offering. You may get these documents for free by visiting EDGAR on the SEC website at www.sec.gov. Alternatively, the depositor or Citigroup Global Markets Inc., Morgan Stanley & Co. LLC, Merrill Lynch, Pierce, Fenner & Smith Incorporated, Drexel Hamilton, LLC, The Williams Capital Group, L.P. or any other underwriter or dealer participating in this offering will arrange to send you the prospectus if you request it by calling toll-free 1-800-831-9146.
16
| COLLATERAL OVERVIEW (continued) |
| Distribution of Debt Yield on Underwritten NOI(1) | ||||||||||
| Number | % of | |||||||||
| Range of | of | Initial | ||||||||
| Debt Yields on | Mortgage | Cut-off Date | Pool | |||||||
| Underwritten NOI (%) | Loans | Balance | Balance | |||||||
| 7.4 – 7.9 | 3 | $26,550,000 | 2.5 | % | ||||||
| 8.0 – 8.9 | 4 | 108,650,000 | 10.2 | |||||||
| 9.0 – 9.9 | 9 | 252,782,312 | 23.8 | |||||||
| 10.0 – 10.9 | 15 | 306,250,492 | 28.8 | |||||||
| 11.0 – 22.5 | 21 | 368,151,900 | 34.7 | |||||||
| Total | 52 | $1,062,384,703 | 100.0 | % | ||||||
| (1) See footnotes (1) and (6) to the table entitled “Mortgage Pool Characteristics” above. | ||||||||||
| Distribution of Debt Yield on Underwritten NCF(1) | ||||||||||
| Number | % of | |||||||||
| Range of | of | Initial | ||||||||
| Debt Yields on | Mortgage | Cut-off Date | Pool | |||||||
| Underwritten NCF (%) | Loans | Balance | Balance | |||||||
| 7.1 – 7.9 | 3 | $26,550,000 | 2.5 | % | ||||||
| 8.0 – 8.9 | 8 | 190,450,000 | 17.9 | |||||||
| 9.0 – 9.9 | 17 | 437,232,803 | 41.2 | |||||||
| 10.0 – 10.9 | 14 | 265,566,156 | 25.0 | |||||||
| 11.0 – 18.6 | 10 | 142,585,743 | 13.4 | |||||||
| Total | 52 | $1,062,384,703 | 100.0 | % | ||||||
| (1) See footnotes (1) and (6) to the table entitled “Mortgage Pool Characteristics” above. | ||||||||||
| Mortgage Loans with Original Partial Interest Only Periods | ||||||||||
| Number | % of | |||||||||
| Original Partial | of | Initial | ||||||||
| Interest Only Period | Mortgage | Cut-off Date | Pool | |||||||
| (months) | Loans | Balance | Balance | |||||||
| 12 | 2 | $40,400,000 | 3.8 | % | ||||||
| 24 | 4 | $41,030,000 | 3.9 | % | ||||||
| 36 | 6 | $128,560,000 | 12.1 | % | ||||||
| 60 | 8 | $148,633,000 | 14.0 | % | ||||||
| Distribution of Original Terms to Maturity/ARD | ||||||||||
| Number | % of | |||||||||
| of | Initial | |||||||||
| Original Term to | Mortgage | Cut-off Date | Pool | |||||||
| Maturity/ARD (months) | Loans | Balance | Balance | |||||||
| 60 | 4 | $72,756,818 | 6.8 | % | ||||||
| 120 | 48 | 989,627,885 | 93.2 | |||||||
| Total | 52 | $1,062,384,703 | 100.0 | % | ||||||
| Distribution of Remaining Terms to Maturity/ARD | ||||||||||
| Number | % of | |||||||||
| Range of Remaining | of | Initial | ||||||||
| Terms to Maturity/ARD | Mortgage | Cut-off Date | Pool | |||||||
| (months) | Loans | Balance | Balance | |||||||
| 58 – 60 | 4 | $72,756,818 | 6.8 | % | ||||||
| 115 – 120 | 48 | 989,627,885 | 93.2 | |||||||
| Total | 52 | $1,062,384,703 | 100.0 | % | ||||||
| Distribution of Original Amortization Terms(1) | ||||||||||
| Number | % of | |||||||||
| of | Initial | |||||||||
| Original Amortization | Mortgage | Cut-off Date | Pool | |||||||
| Term (months) | Loans | Balance | Balance | |||||||
| Interest Only | 20 | $465,775,000 | 43.8 | % | ||||||
| 180 – 180 | 1 | 9,958,925 | 0.9 | |||||||
| 264 – 264 | 1 | 2,000,000 | 0.2 | |||||||
| 300 – 300 | 2 | 52,932,928 | 5.0 | |||||||
| 360 – 360 | 28 | 531,717,851 | 50.0 | |||||||
| Total | 52 | $1,062,384,703 | 100.0 | % | ||||||
| (1) All of the mortgage loans will have balloon payments at maturity or have an anticipated repayment date, as applicable. | ||||||||||
| Distribution of Remaining Amortization Terms(1) | ||||||||||
| Number | % of | |||||||||
| Range of Remaining | of | Initial | ||||||||
| Amortization Terms | Mortgage | Cut-off Date | Pool | |||||||
| (months) | Loans | Balance | Balance | |||||||
| Interest Only | 20 | $465,775,000 | 43.8 | % | ||||||
| 179 – 179 | 1 | 9,958,925 | 0.9 | |||||||
| 264 – 264 | 1 | 2,000,000 | 0.2 | |||||||
| 299 – 300 | 2 | 52,932,928 | 5.0 | |||||||
| 358 – 360 | 28 | 531,717,851 | 50.0 | |||||||
| Total | 52 | $1,062,384,703 | 100.0 | % | ||||||
| (1) All of the mortgage loans will have balloon payments at maturity or have an anticipated repayment date, as applicable. | ||||||||||
| Distribution of Prepayment Provisions | ||||||||||
| Number | % of | |||||||||
| of | Initial | |||||||||
| Mortgage | Cut-off Date | Pool | ||||||||
| Prepayment Provision | Loans | Balance | Balance | |||||||
| Defeasance | 43 | $896,760,139 | 84.4 | % | ||||||
| Yield Maintenance | 5 | 71,574,564 | 6.7 | |||||||
| Defeasance or Yield Maintenance | 4 | 94,050,000 | 8.9 | |||||||
| Total | 52 | $1,062,384,703 | 100.0 | % | ||||||
| Distribution of Escrow Types | ||||||||||
| Number | % of | |||||||||
| of | Initial | |||||||||
| Mortgage | Cut-off Date | Pool | ||||||||
| Escrow Type | Loans | Balance | Balance | |||||||
| Real Estate Tax | 45 | $824,642,851 | 77.6 | % | ||||||
| Replacement Reserves(1) | 44 | $836,192,851 | 78.7 | % | ||||||
| Insurance | 31 | $574,941,498 | 54.1 | % | ||||||
| TI/LC(2) | 29 | $580,825,153 | 80.8 | % | ||||||
| (1) Includes mortgage loans with FF&E reserves. | ||||||||||
| (2) Percentage of the portion of the Initial Pool Balance secured by office, retail, industrial and mixed use properties. | ||||||||||
The depositor has filed a registration statement (including a prospectus) with the Securities and Exchange Commission (“SEC”) (SEC File No. 333-207132) for the offering to which this communication relates. Before you invest, you should read the prospectus in the registration statement and other documents the depositor has filed with the SEC for more complete information about the depositor, the issuing entity and this offering. You may get these documents for free by visiting EDGAR on the SEC website at www.sec.gov. Alternatively, the depositor or Citigroup Global Markets Inc., Morgan Stanley & Co. LLC, Merrill Lynch, Pierce, Fenner & Smith Incorporated, Drexel Hamilton, LLC, The Williams Capital Group, L.P. or any other underwriter or dealer participating in this offering will arrange to send you the prospectus if you request it by calling toll-free 1-800-831-9146.
17
| SHORT TERM CERTIFICATE PRINCIPAL PAY DOWN SCHEDULE |
Class A-2 Principal Pay Down(1)(2)
| Mortgage Loan Name | Property Type | Cut-off Date Balance | % of Initial Pool Balance | Remaining Loan Term | Underwritten NCF DSCR | Debt Yield on Underwritten NOI | Cut-off Date LTV Ratio | ||||||||
| Town Center at Levis Commons | Retail | $37,000,000 | 3.5% | 60 | 1.98x | 10.6% | 62.2% | ||||||||
| Courtyard Reno | Hospitality | $17,226,818 | 1.6% | 59 | 1.75x | 13.6% | 63.3% | ||||||||
| 5000 South Hulen | Retail | $16,030,000 | 1.5% | 58 | 1.79x | 11.5% | 70.3% | ||||||||
| Sherman Plaza | Industrial | $2,500,000 | 0.2% | 59 | 1.91x | 15.8% | 45.5% | ||||||||
| (1) | The table above presents the mortgage loans whose balloon payments would be applied to pay down the certificate balance of the Class A-2 certificates assuming no prepayments prior to the maturity date or any anticipated repayment date, as applicable, for any mortgage loan and applying the modeling assumptions described under “Yield, Prepayment and Maturity Considerations” in the Preliminary Prospectus, including the assumptions that (i) no mortgage loan in the pool experiences prepayments prior to its stated maturity date or anticipated repayment date, as applicable, or defaults or losses; (ii) there are no extensions of the maturity date of any mortgage loan in the pool; and (iii) each mortgage loan in the pool is paid in full on its stated maturity date or, if applicable, anticipated repayment date. Each class of certificates, including the Class A-2 certificates, evidences undivided ownership interests in the entire pool of mortgage loans. Debt service coverage ratio, debt yield and loan-to-value ratio information does not take into account any subordinate debt (whether or not secured by the mortgaged property) that currently exists or is allowed under the terms of any mortgage loan. See Annex A to the Preliminary Prospectus. See the footnotes to the table entitled “Mortgage Pool Characteristics” above. |
| (2) | See footnotes to the table entitled “Mortgage Pool Characteristics” above. |
The depositor has filed a registration statement (including a prospectus) with the Securities and Exchange Commission (“SEC”) (SEC File No. 333-207132) for the offering to which this communication relates. Before you invest, you should read the prospectus in the registration statement and other documents the depositor has filed with the SEC for more complete information about the depositor, the issuing entity and this offering. You may get these documents for free by visiting EDGAR on the SEC website at www.sec.gov. Alternatively, the depositor or Citigroup Global Markets Inc., Morgan Stanley & Co. LLC, Merrill Lynch, Pierce, Fenner & Smith Incorporated, Drexel Hamilton, LLC, The Williams Capital Group, L.P. or any other underwriter or dealer participating in this offering will arrange to send you the prospectus if you request it by calling toll-free 1-800-831-9146.
18
STRUCTURAL OVERVIEW
| Allocation Between |
| VRR Interest and |
| Non-Vertically |
| Retained Certificates | The aggregate amount available for distribution to holders of the certificates (including the VRR Interest) on each distribution date will be: (i) the gross amount of interest, principal, yield maintenance charges and prepayment premiums collected with respect to the mortgage loans in the applicable one-month collection period, net of specified expenses of the issuing entity, including fees payable therefrom to, and losses, liabilities, advances, costs and expenses reimbursable or indemnifiable therefrom to, the master servicer, the special servicer, the certificate administrator, the trustee, the operating advisor, the asset representations reviewer and CREFC®; and (ii) allocated to amounts available for distribution to the holders of the VRR Interest, on the one hand, and amounts available for distribution to the holders of the remaining certificates (the “Non-Vertically Retained Certificates”), on the other hand. On each distribution date, the portion of such aggregate available funds allocable to: (a) the VRR Interest will be the product of such aggregate available funds multiplied by a fraction, expressed as a percentage, the numerator of which is the initial certificate balance of the VRR Interest, and the denominator of which is the aggregate initial certificate balance of all the classes of Principal Balance Certificates (the “Vertically Retained Percentage”); and (b) the Non-Vertically Retained Certificates will at all times be the product of such aggregate available funds multiplied by the difference between 100% and the Vertically Retained Percentage (such difference, the “Non-Vertically Retained Percentage”). See “Credit Risk Retention” and “Description of the Certificates” in the Preliminary Prospectus. |
| Distributions | On each Distribution Date, funds available for distribution to holders of the Non-Vertically Retained Certificates (exclusive of any portion thereof that represents the Non-Vertically Retained Percentage of any yield maintenance charges and prepayment premiums) (“Non-Vertically Retained Available Funds”) will be distributed in the following amounts and order of priority (in each case to the extent of remaining available funds): |
| 1. | Class A-1, A-2, A-3, A-4, A-AB, X-A, X-B, X-D, X-E, X-F and X-G certificates: to interest on the Class A-1, Class A-2, Class A-3, Class A-4, Class A-AB, Class X-A, Class X-B, Class X-D, Class X-E, Class X-F and Class X-G certificates, up to, andpro rata in accordance with, their respective interest entitlements. |
| 2. | Class A-1, A-2, A-3, A-4 and A-AB certificates: to the extent of Non-Vertically Retained Available Funds allocable to principal received or advanced on the mortgage loans, (i) to principal on the Class A-AB certificates until their certificate balance is reduced to the Class A-AB scheduled principal balance set forth in Annex F to the Preliminary Prospectus for the relevant Distribution Date, then (ii) to principal on the Class A-1 certificates until their certificate balance is reduced to zero, all funds available for distribution of principal remaining after the distributions to the Class A-AB certificates in clause (i) above, then (iii) to principal on the Class A-2 certificates until their certificate balance is reduced to zero, all funds available for distribution of principal remaining after the distributions to the Class A-1 certificates in clause (ii) above, then (iv) to principal on the Class A-3 certificates until their certificate balance is reduced to zero, all funds available for distribution of principal remaining after the distributions to the Class A-2 certificates in clause (iii) above, then (v) to principal on the Class A-4 certificates until their certificate balance is reduced to zero, all funds available for distribution of principal remaining after the distributions to the Class A-3 certificates in clause (iv) above and then (vi) to principal on the Class A-AB certificates until their certificate balance is reduced to zero, all funds available for distribution of principal remaining after the distributions to the Class A-4 certificates in clause (v) above. However, if the certificate balances of each and every class of the Class A-S, Class B, Class C, Class D, Class E, Class F and Class G certificates have been reduced to zero as a result of the allocation of mortgage loan losses and other unanticipated expenses to those certificates, then Non-Vertically Retained Available Funds allocable to principal will be distributed to the Class A-1, Class A-2, Class A-3, Class A-4 and Class A-AB certificates,pro rata, based on their respective certificate balances (and the schedule for the Class A-AB principal distributions will be disregarded). |
| 3. | Class A-1, A-2, A-3, A-4 and A-AB certificates: to reimburse the Class A-1, Class A-2, Class A-3, Class A-4 and Class A-AB certificates,pro rata, for any unreimbursed losses on the mortgage loans that were previously allocated to reduce the certificate balances of those classes, together with interest at their respective pass-through rates. |
| 4. | Class A-S certificates: (i) first, to interest on the Class A-S certificates in the amount of their interest entitlement; (ii) next, to the extent of Non-Vertically Retained Available Funds allocable to principal remaining after distributions in respect of principal to each class of Non-Vertically Retained Principal Balance Certificates with a higher principal payment priority (in this case, the Class A-1, Class A-2, Class A-3, Class A-4 and Class A-AB certificates), to principal on the Class A-S certificates until their certificate balance is reduced to zero; and (iii) next, to reimburse the Class A-S certificates for any unreimbursed losses on the mortgage loans that were previously allocated to reduce the certificate balance of that class, together with interest at its pass-through rate. |
The depositor has filed a registration statement (including a prospectus) with the Securities and Exchange Commission (“SEC”) (SEC File No. 333-207132) for the offering to which this communication relates. Before you invest, you should read the prospectus in the registration statement and other documents the depositor has filed with the SEC for more complete information about the depositor, the issuing entity and this offering. You may get these documents for free by visiting EDGAR on the SEC website at www.sec.gov. Alternatively, the depositor or Citigroup Global Markets Inc., Morgan Stanley & Co. LLC, Merrill Lynch, Pierce, Fenner & Smith Incorporated, Drexel Hamilton, LLC, The Williams Capital Group, L.P. or any other underwriter or dealer participating in this offering will arrange to send you the prospectus if you request it by calling toll-free 1-800-831-9146.
19
STRUCTURAL OVERVIEW (continued)
| Distributions |
| (continued) | 5. | Class B certificates: (i) first, to interest on the Class B certificates in the amount of their interest entitlement; (ii) next, to the extent of Non-Vertically Retained Available Funds allocable to principal remaining after distributions in respect of principal to each class of Non-Vertically Retained Principal Balance Certificates with a higher principal payment priority (in this case, the Class A-1, Class A-2, Class A-3, Class A-4, Class A-AB and Class A-S certificates), to principal on the Class B certificates until their certificate balance is reduced to zero; and (iii) next, to reimburse Class B certificates for any unreimbursed losses on the mortgage loans that were previously allocated to reduce the certificate balance of that class, together with interest at its pass-through rate. |
| 6. | Class C certificates: (i) first, to interest on the Class C certificates in the amount of their interest entitlement; (ii) next, to the extent of Non-Vertically Retained Available Funds allocable to principal remaining after distributions in respect of principal to each class of Non-Vertically Retained Principal Balance Certificates with a higher principal payment priority (in this case, the Class A-1, Class A-2, Class A-3, Class A-4, Class A-AB, Class A-S and Class B certificates), to principal on the Class C certificates until their certificate balance is reduced to zero; and (iii) next, to reimburse the Class C certificates for any unreimbursed losses on the mortgage loans that were previously allocated to reduce the certificate balance of that class, together with interest at its pass-through rate. |
| 7. | After the Class A-1, Class A-2, Class A-3, Class A-4, Class A-AB, Class X-A, Class X-B, Class X-D, Class X-E, Class X-F, Class X-G, Class A-S, Class B and Class C certificates are paid all amounts to which they are entitled on such Distribution Date, the remaining Non-Vertically Retained Available Funds will be used to pay interest and principal and to reimburse (with interest) any unreimbursed losses to the Class D, Class E, Class F and Class G certificates, sequentially in that order and in a manner analogous to the Class C certificates pursuant to clause 6 above. |
| Realized Losses | The certificate balances of the Principal Balance Certificates will each be reduced without distribution on any Distribution Date as a write-off to the extent of any loss realized on the mortgage loans allocated to such class on such Distribution Date. On each Distribution Date, the Vertically Retained Percentage of any such losses will be applied to the VRR Interest until the related certificate balance is reduced to zero, and the Non-Vertically Retained Percentage of any such losses will be applied to the respective classes of Non-Vertically Retained Principal Balance Certificates in the following order, in each case until the related certificate balance is reduced to zero: first, to the Class G certificates; second to the Class F certificates; third, to the Class E certificates; fourth, to the Class D certificates; fifth, to the Class C certificates; sixth, to the Class B certificates; seventh, to the Class A-S certificates; and, finallypro rata, to the Class A-1, Class A-2, Class A-3, Class A-4 and Class A-AB certificates, based on their then current respective certificate balances. The notional amount of each class of Class X Certificates will be reduced to reflect reductions in the certificate balance(s) of the class (or classes, as applicable) of Corresponding Principal Balance Certificatesas a result of allocations of losses realized on the mortgage loans to such class(es) of Principal Balance Certificates. |
The depositor has filed a registration statement (including a prospectus) with the Securities and Exchange Commission (“SEC”) (SEC File No. 333-207132) for the offering to which this communication relates. Before you invest, you should read the prospectus in the registration statement and other documents the depositor has filed with the SEC for more complete information about the depositor, the issuing entity and this offering. You may get these documents for free by visiting EDGAR on the SEC website at www.sec.gov. Alternatively, the depositor or Citigroup Global Markets Inc., Morgan Stanley & Co. LLC, Merrill Lynch, Pierce, Fenner & Smith Incorporated, Drexel Hamilton, LLC, The Williams Capital Group, L.P. or any other underwriter or dealer participating in this offering will arrange to send you the prospectus if you request it by calling toll-free 1-800-831-9146.
20
STRUCTURAL OVERVIEW (continued)
| Prepayment Premiums |
| and Yield Maintenance |
| Charges | On each Distribution Date, until the notional amounts of the Class X-A, Class X-B and Class X-D certificates and the certificate balances of the Class A-1, Class A-2, Class A-3, Class A-4, Class A-AB, Class A-S, Class B, Class C and Class D certificates have been reduced to zero, each yield maintenance charge collected on the mortgage loans during the related one-month collection period (or, in the case of an outside serviced mortgage loan, that accompanied a principal prepayment included in the aggregate available funds for such Distribution Date) is required to be distributed to certificateholders (excluding holders of the Class X-E, Class X-F, Class X-G, Class E, Class F, Class G and Class R certificates) as follows: (1)(a) first the Non-Vertically Retained Percentage of such yield maintenance charge will be allocated between (i) the group (the “YM Group A”) of the Class A-1, Class A-2, Class A-3, Class A-4, Class A-AB, Class X-A and Class A-S certificates, (ii) the group (the “YM Group BC”) of the Class X-B, Class B and Class C certificates, and (iii) the group (the “YM Group D” and, together with the YM Group A and the YM Group BC, the “YM Groups”) of the Class X-D and Class D certificates,pro rata, based upon the aggregate amount of principal distributed to the class or classes of Non-Vertically Retained Principal Balance Certificates in each YM Group on such Distribution Date, and (b) then the portion of such yield maintenance charge allocated to each YM Group will be further allocated as among the classes of certificates in such YM Group, in the following manner: (i) each class of Non-Vertically Retained Principal Balance Certificates in such YM Group will entitle the applicable certificateholders to receive on the applicable Distribution Date that portion of such yield maintenance charge equal to the product of (X) a fraction whose numerator is the amount of principal distributed to such class of certificates on such Distribution Date and whose denominator is the total amount of principal distributed to all of the Non-Vertically Retained Principal Balance Certificates in that YM Group on such Distribution Date, (Y) the Base Interest Fraction (as defined in the Preliminary Prospectus) for the related principal prepayment and such class of certificates, and (Z) the portion of such yield maintenance charge allocated to such YM Group, and (ii) the portion of such yield maintenance charge allocated to such YM Group and remaining after such distributions with respect to the Non-Vertically Retained Principal Balance Certificates in such YM Group will be distributed to the class of Class X Certificates in such YM Group; and (2) the Vertically Retained Percentage of such yield maintenance charge will be distributed to holders of the VRR Interest. If there is more than one class of Non-Vertically Retained Principal Balance Certificates in any YM Group entitled to distributions of principal on any particular Distribution Date on which yield maintenance charges are distributable to such classes, the aggregate portion of such yield maintenance charges allocated to such YM Group will be allocated among all such classes of Non-Vertically Retained Principal Balance Certificates up to, and on apro rata basis in accordance with, their respective entitlements in those yield maintenance charges in accordance with the prior sentence of this paragraph. |
| If a prepayment premium (calculated as a percentage of the amount prepaid) is imposed in connection with a prepayment rather than a yield maintenance charge, then the prepayment premium so collected will be allocated as described above. For this purpose, the discount rate used to calculate the Base Interest Fraction will be the discount rate used to determine the yield maintenance charge for mortgage loans that require payment at the greater of a yield maintenance charge or a minimum amount equal to a fixed percentage of the principal balance of the mortgage loan or, for mortgage loans that only have a prepayment premium based on a fixed percentage of the principal balance of the mortgage loan, such other discount rate as may be specified in the related loan documents. |
| After the notional amounts of the Class X-A, Class X-B and Class X-D certificates and the certificate balances of the Class A-1, Class A-2, Class A-3, Class A-4, Class A-AB, Class A-S, Class B, Class C and Class D certificates have been reduced to zero, all prepayment premiums and yield maintenance charges with respect to the mortgage loans will be allocated: (1) to the extent of the Non-Vertically Retained Percentage thereof, to the holders of the Class E, Class F and Class G certificates (collectively), allocable between such classes as provided in the CGCMT 2018-B2 pooling and servicing agreement; and (2) to the extent of the Vertically Retained Percentage thereof, to the holders of the VRR Interest. No yield maintenance charges or prepayment premiums will be distributed to the holders of the Class X-E, Class X-F, Class X-G or Class R certificates. For a description of prepayment premiums and yield maintenance charges required on the mortgage loans, see Annex A to the Preliminary Prospectus. See also “Certain Legal Aspects of the Mortgage Loans—Default Interest and Limitations on Prepayments” in the Preliminary Prospectus. |
The depositor has filed a registration statement (including a prospectus) with the Securities and Exchange Commission (“SEC”) (SEC File No. 333-207132) for the offering to which this communication relates. Before you invest, you should read the prospectus in the registration statement and other documents the depositor has filed with the SEC for more complete information about the depositor, the issuing entity and this offering. You may get these documents for free by visiting EDGAR on the SEC website at www.sec.gov. Alternatively, the depositor or Citigroup Global Markets Inc., Morgan Stanley & Co. LLC, Merrill Lynch, Pierce, Fenner & Smith Incorporated, Drexel Hamilton, LLC, The Williams Capital Group, L.P. or any other underwriter or dealer participating in this offering will arrange to send you the prospectus if you request it by calling toll-free 1-800-831-9146.
21
STRUCTURAL OVERVIEW (continued)
| Advances | The master servicer and, if it fails to do so, the trustee, will be obligated to make P&I advances with respect to each mortgage loan in the issuing entity and, with respect to all of the mortgage loans serviced under the pooling and servicing agreement for this transaction, servicing advances, including paying delinquent property taxes, condominium assessments, insurance premiums and ground lease rents, but only to the extent that those advances are not deemed non-recoverable from collections on the related mortgage loan and, in the case of servicing advances, any related companion loans as described below. P&I advances are subject to reduction in connection with any appraisal reductions that may occur. The special servicer will have no obligation to make any advances, provided that, in an urgent or emergency situation requiring the making of a property protection advance, the special servicer may, in its sole discretion, make a property protection advance and will be entitled to reimbursement from the master servicer for such advance. |
| Serviced Mortgage |
| Loans/Outside Serviced |
| Mortgage Loans | Each loan combination for which the CGCMT 2018-B2 pooling and servicing agreement is not the Controlling PSA (such other servicing agreement, an “outside servicing agreement”) constitutes an “outside serviced loan combination,” each related mortgage loan constitutes an “outside serviced mortgage loan” and each related companion loan constitutes an “outside serviced companion loan.” |
| All of the mortgage loans transferred to the issuing entity (other than any outside serviced mortgage loan) are sometimes referred to in this Term Sheet as the “serviced mortgage loans” and, together with any related companion loans, as the “serviced loans” (which signifies that they are being serviced by the master servicer and the special servicer under the CGCMT 2018-B2 pooling and servicing agreement); each related loan combination constitutes a “serviced loan combination”; and each related companion loan constitutes a “serviced companion loan.” See “Description of the Mortgage Pool—The Loan Combinations” in the Preliminary Prospectus. |
| Appraisal Reduction |
| Amounts | An Appraisal Reduction Amount generally will be created with respect to a required appraisal loan (which is a serviced loan as to which certain defaults, modifications or insolvency events have occurred (as further described in the Preliminary Prospectus)) in the amount, if any, by which the principal balance of such required appraisal loan, plus other amounts overdue or advanced in connection with such required appraisal loan, exceeds 90% of the appraised value of the related mortgaged property plus certain escrows and reserves (including letters of credit) held with respect to such required appraisal loan. In the case of an outside serviced mortgage loan, any Appraisal Reduction Amounts will be calculated pursuant to, and by a party to, the related outside servicing agreement. In general, any Appraisal Reduction Amount calculated with respect to a loan combination will be allocatedfirst, to any related subordinate companion loan(s) (up to the outstanding principal balance(s) thereof), andthen, to the related mortgage loan and any relatedpari passucompanion loan(s) on apro rata basis in accordance with their respective outstanding principal balances. As a result of an Appraisal Reduction Amount being calculated for and/or allocated to a given mortgage loan, the interest portion of any P&I advance for such mortgage loan will be reduced, which will have the effect of reducing the amount of interest available for distribution to the VRR Interest (to the extent of the Vertically Retained Percentage of the reduction in such P&I advance) and to the most subordinate class(es) of Non-Vertically Retained Certificates (exclusive of the Class R certificates) then outstanding (i.e., first, to the Class G certificates, then, to the Class F certificates, then, to the Class E certificates, then, to the Class D certificates, then, to the Class C certificates, then, to the Class B certificates, then, to the Class A-S certificates, and then,pro rata based on interest entitlements, to the Class A-1, Class A-2, Class A-3, Class A-4, Class A-AB, Class X-A, Class X-B, Class X-D, Class X-E, Class X-F and Class X-G certificates) (to the extent of the Non-Vertically Retained Percentage of the reduction in such P&I advance). In general, a serviced loan will cease to be a required appraisal loan, and no longer be subject to an Appraisal Reduction Amount, when the same has ceased to be a specially serviced loan (if applicable), has been brought current for at least three consecutive months and no other circumstances exist that would cause such serviced loan to be a required appraisal loan. |
| For purposes of determining the identity of the Controlling Class and the existence of a Control Termination Event, as well as the allocation and/or exercise of voting rights for certain purposes, the Vertically Retained Percentage of Appraisal Reduction Amounts will be allocated to notionally reduce the certificate balance of the VRR Interest, and the Non-Vertically Retained Percentage of Appraisal Reduction Amounts will be allocated to notionally reduce the certificate balances of the Non-Vertically Retained Principal Balance Certificates as follows: first, to the Class G, Class F, Class E, Class D, Class C, Class B and Class A-S certificates, in that order, in each case until the related certificate balance is notionally reduced to zero; and then to the Class A-1, Class A-2, Class A-3, Class A-4 and Class A-AB certificates,pro rata based on certificate balance. |
The depositor has filed a registration statement (including a prospectus) with the Securities and Exchange Commission (“SEC”) (SEC File No. 333-207132) for the offering to which this communication relates. Before you invest, you should read the prospectus in the registration statement and other documents the depositor has filed with the SEC for more complete information about the depositor, the issuing entity and this offering. You may get these documents for free by visiting EDGAR on the SEC website at www.sec.gov. Alternatively, the depositor or Citigroup Global Markets Inc., Morgan Stanley & Co. LLC, Merrill Lynch, Pierce, Fenner & Smith Incorporated, Drexel Hamilton, LLC, The Williams Capital Group, L.P. or any other underwriter or dealer participating in this offering will arrange to send you the prospectus if you request it by calling toll-free 1-800-831-9146.
22
STRUCTURAL OVERVIEW (continued)
| Cumulative Appraisal |
| Reduction Amounts | A “Cumulative Appraisal Reduction Amount”, as of any date of determination, is equal to the sum of (i) all Appraisal Reduction Amounts then in effect, and (ii) with respect to any AB Modified Loans, any Collateral Deficiency Amounts then in effect. |
| “Collateral Deficiency Amount” means, with respect to any AB Modified Loan as of any date of determination, the excess of (i) the stated principal balance of such AB Modified Loan (taking into account the related junior note(s) included therein), over (ii) the sum of (in the case of a loan combination, solely to the extent allocable to the subject mortgage loan) (x) the most recent appraised value for the related mortgaged property or mortgaged properties, plus (y) solely to the extent not reflected or taken into account in such appraised value and to the extent on deposit with, or otherwise under the control of, the lender as of the date of such determination, any capital or additional collateral contributed by the related borrower at the time the mortgage loan became (and as part of the modification related to) such AB Modified Loan for the benefit of the related mortgaged property or mortgaged properties (provided, that in the case of an outside serviced mortgage loan, the amounts set forth in this clause (y) will be taken into account solely to the extent relevant information is received), plus (z) any other escrows or reserves (in addition to any amounts set forth in the immediately preceding clause (y)) held by the lender in respect of such AB Modified Loan as of the date of such determination. For purposes of determining the identity of the Controlling Class and the existence of a Control Termination Event, the Non-Vertically Retained Percentage of Collateral Deficiency Amounts will be allocable to the respective classes of Control Eligible Certificates (as defined below), in reverse alphabetical order of class designation, in a manner similar to the allocation of Appraisal Reduction Amounts to such classes. |
| “AB Modified Loan” means any corrected mortgage loan that became a corrected mortgage loan (which includes for purposes of this definition any outside serviced mortgage loan that became a “corrected” mortgage loan (or any term substantially similar thereto) pursuant to the related outside servicing agreement) due to a modification thereto that resulted in the creation of an A/B note structure (or similar structure) and as to which the new junior note(s) did not previously exist or the principal amount of the new junior note(s) was previously part of either an A note held by the trust or the original unmodified mortgage loan. |
| Age of Appraisals | Appraisals (which can be an update of a prior appraisal) with respect to a serviced loan are required to be no older than 9 months for purposes of determining appraisal reductions (other than the annual re-appraisal), market value, and other calculations as described in the Preliminary Prospectus. |
| Sale of Defaulted Loans | There will be no “Fair Market Value Purchase Option”. Instead defaulted mortgage loans will be sold in a process similar to the sale process for REO property. With respect to an outside serviced loan combination, the party acting as special servicer with respect to such outside serviced loan combination pursuant to the related outside servicing agreement (the “outside special servicer”) may offer to sell to any person (or may offer to purchase) for cash such outside serviced loan combination in accordance with the terms of the related outside servicing agreement during such time as such outside serviced loan combination constitutes a sufficiently defaulted mortgage loan thereunder and, in connection with any such sale, the related outside special servicer is required to sell both the applicable outside serviced mortgage loan and the related outside serviced companion loan(s) as one loan combination. |
| Directing Holder | The “Directing Holder” with respect to any mortgage loan or loan combination serviced under the CGCMT 2018-B2 pooling and servicing agreement will be the Controlling Class Representative. |
| The applicable directing holder (or equivalent party) with respect to any outside serviced mortgage loan will be (or, if the applicable outside servicing agreement has not yet been executed, is anticipated to be) the controlling class representative (or equivalent entity), if any, under, or such other party as may be designated in, the related outside servicing agreement, except that the applicable directing holder (or equivalent party) with respect to the following outside serviced mortgage loans will be: |
| (a)in the case of the Cross Point mortgage loan, until the securitization of the related controlling pari passu companion loan, the applicable directing holder will be the holder of such controlling pari passu companion loan; and |
| (b) in the case of the Red Building mortgage loan, (i) so long as no “note C control appraisal period” under the related co-lender agreement is in effect, the holder of note C, (ii) if a “note C control appraisal period” under the related co-lender agreement is in effect and no “note B control appraisal period” is in effect, the holder of note B-1, or (iii) if a “note B control appraisal period” under the related co-lender agreement is in effect, the holder of note A-1. |
The depositor has filed a registration statement (including a prospectus) with the Securities and Exchange Commission (“SEC”) (SEC File No. 333-207132) for the offering to which this communication relates. Before you invest, you should read the prospectus in the registration statement and other documents the depositor has filed with the SEC for more complete information about the depositor, the issuing entity and this offering. You may get these documents for free by visiting EDGAR on the SEC website at www.sec.gov. Alternatively, the depositor or Citigroup Global Markets Inc., Morgan Stanley & Co. LLC, Merrill Lynch, Pierce, Fenner & Smith Incorporated, Drexel Hamilton, LLC, The Williams Capital Group, L.P. or any other underwriter or dealer participating in this offering will arrange to send you the prospectus if you request it by calling toll-free 1-800-831-9146.
23
STRUCTURAL OVERVIEW (continued)
| Controlling Class |
| Representative | The “Controlling Class Representative” will be the controlling class certificateholder or other representative designated by at least a majority of the controlling class certificateholders, by certificate balance. The “Controlling Class” is, as of any time of determination, the most subordinate class of the Control Eligible Certificates that has an aggregate outstanding certificate balance as notionally reduced by any Cumulative Appraisal Reduction Amount allocable to such class, at least equal to 25% of the initial certificate balance of that class of certificates;provided that (except under the circumstances set forth in the next proviso) if no such class meets the preceding requirement, then the Class E certificates will be the controlling class;provided,further,however, that if, at any time, the aggregate outstanding certificate balance of the classes of Non-Vertically Retained Principal Balance Certificates senior to the Control Eligible Certificates has been reduced to zero (without regard to the allocation of any Cumulative Appraisal Reduction Amounts), then the “Controlling Class” will be the most subordinate class of Control Eligible Certificates with an outstanding certificate balance greater than zero (without regard to the allocation of any Cumulative Appraisal Reduction Amounts). The “Control Eligible Certificates” consist of the Class E, Class F and Class G certificates. See “The Pooling and Servicing Agreement—Directing Holder” in the Preliminary Prospectus. No other class of certificates will be eligible to act as the controlling class or appoint a Controlling Class Representative. No person may exercise any of the rights and powers of the Controlling Class Representative with respect to an excluded mortgage loan. |
| On the Closing Date, LNR Securities Holdings, LLC (or an affiliate) is expected (i) to purchase a majority interest in each class of the Class X-E, Class X-F, Class X-G, Class E, Class F and Class G certificates and may retain, as a “majority-owned affiliate” (as defined in Regulation RR) of Starwood Mortgage Capital LLC, Starwood Mortgage Capital LLC’s portion of the VRR Interest, and (ii) to be appointed the initial Controlling Class Representative. It is also expected that, on the Closing Date, Stream Asset Management L.P. or an affiliate thereof will purchase the remaining interest in each class of the Class X-E, Class X-F, Class X-G, Class E, Class F and Class G certificates (and may purchase certain other classes of certificates), thereby becoming an initial controlling class certificateholder. |
| Control Termination |
| Event | A “Control Termination Event” will either (a) occur when none of the classes of Control Eligible Certificates has an outstanding certificate balance (as notionally reduced by any Cumulative Appraisal Reduction Amount then allocable to such class) that is at least equal to 25% of the initial certificate balance of that class of certificates or (b) be deemed to occur as described in the Preliminary Prospectus;provided,however, that a Control Termination Event will in no event exist at any time that the certificate balance of each class of Non-Vertically Retained Principal Balance Certificates senior to the Control Eligible Certificates has been reduced to zero (without regard to the allocation of Cumulative Appraisal Reduction Amounts). With respect to excluded mortgage loans, a Control Termination Event will be deemed to exist. |
| The holders of Certificates representing the majority of the certificate balance of the most senior class of Control Eligible Certificates whose certificate balance is notionally reduced to less than 25% of the initial certificate balance of that class as a result of an allocation of an Appraisal Reduction Amount or a Collateral Deficiency Amount, as applicable, to such class will have the right to challenge the Special Servicer’s Appraisal Reduction Amount determination or a Collateral Deficiency Amount determination, as applicable, and, at their sole expense, obtain a second appraisal of any serviced loan for which an Appraisal Reduction Event has occurred or as to which there exists a Collateral Deficiency Amount, under the circumstances described in the Preliminary Prospectus. |
| Consultation Termination |
| Event | A “Consultation Termination Event” will occur when none of the classes of Control Eligible Certificates has an outstanding certificate balance, without regard to the allocation of any Cumulative Appraisal Reduction Amount, that is equal to or greater than 25% of the initial certificate balance of that class of certificates;provided,however, that a Consultation Termination Event will in no event exist at any time that the certificate balance of each class of Non-Vertically Retained Principal Balance Certificates senior to the Control Eligible Certificates has been reduced to zero (without regard to the allocation of Cumulative Appraisal Reduction Amounts). With respect to excluded mortgage loans, a Consultation Termination Event will be deemed to exist. |
The depositor has filed a registration statement (including a prospectus) with the Securities and Exchange Commission (“SEC”) (SEC File No. 333-207132) for the offering to which this communication relates. Before you invest, you should read the prospectus in the registration statement and other documents the depositor has filed with the SEC for more complete information about the depositor, the issuing entity and this offering. You may get these documents for free by visiting EDGAR on the SEC website at www.sec.gov. Alternatively, the depositor or Citigroup Global Markets Inc., Morgan Stanley & Co. LLC, Merrill Lynch, Pierce, Fenner & Smith Incorporated, Drexel Hamilton, LLC, The Williams Capital Group, L.P. or any other underwriter or dealer participating in this offering will arrange to send you the prospectus if you request it by calling toll-free 1-800-831-9146.
24
STRUCTURAL OVERVIEW (continued)
| Control/Consultation |
| Rights | So long as a Control Termination Event does not exist, the Controlling Class Representative will be entitled to have consent and/or consultation rights under the CGCMT 2018-B2 pooling and servicing agreement with respect to certain major decisions (including with respect to assumptions, waivers, loan modifications and workouts) and other matters with respect to each serviced mortgage loan, except with respect to any serviced mortgage loan as to which the Controlling Class Representative or a holder of more than 50% of the Controlling Class (by certificate balance) is a Borrower Party (as defined in the Preliminary Prospectus) (any such mortgage loan, an “excluded mortgage loan”). |
| After the occurrence and during the continuance of a Control Termination Event, the consent rights of the Controlling Class Representative will terminate, and the Controlling Class Representative will retain consultation rights under the CGCMT 2018-B2 pooling and servicing agreement with respect to certain major decisions and other matters with respect to the serviced mortgage loans, other than any excluded mortgage loan. |
| After the occurrence and during the continuance of a Consultation Termination Event, all of these rights of the Controlling Class Representative with respect to the serviced mortgage loans will terminate. |
| With respect to each outside serviced loan combination, the applicable outside controlling class representative or other related controlling noteholder pursuant to, and subject to the limitations set forth in, the related outside servicing agreement and the related co-lender agreement will have consent, consultation, approval and direction rights with respect to certain major decisions (including with respect to assumptions, waivers, loan modifications and workouts) regarding such outside serviced loan combination, as provided for in the related co-lender agreement and in the related outside servicing agreement, and as described under “Description of the Mortgage Pool—The Loan Combinations” in the Preliminary Prospectus. To the extent permitted under the related co-lender agreement, the Controlling Class Representative (so long as a Consultation Termination Event does not exist) may have certain consultation rights with respect to each outside serviced loan combination. |
Risk Retention
| Consultation Party | The risk retention consultation party will have certain non-binding consultation rights with respect to certain major decisions: (i) for so long as no Consultation Termination Event is continuing, with respect to any specially serviced loan (other than any outside serviced mortgage loan); and (ii) during the continuance of a Consultation Termination Event, with respect to any mortgage loan (other than any outside serviced mortgage loan), as further described in the Preliminary Prospectus. Notwithstanding the foregoing, the risk retention consultation party will not have any consultation rights with respect to any excluded RRCP mortgage loan. Citi Real Estate Funding Inc. is expected to appoint itself as the initial risk retention consultation party. |
| With respect to the risk retention consultation party, an “excluded RRCP mortgage loan” is a mortgage loan or loan combination with respect to which the risk retention consultation party or the person(s) entitled to appoint the risk retention consultation party is a Borrower Party. |
The depositor has filed a registration statement (including a prospectus) with the Securities and Exchange Commission (“SEC”) (SEC File No. 333-207132) for the offering to which this communication relates. Before you invest, you should read the prospectus in the registration statement and other documents the depositor has filed with the SEC for more complete information about the depositor, the issuing entity and this offering. You may get these documents for free by visiting EDGAR on the SEC website at www.sec.gov. Alternatively, the depositor or Citigroup Global Markets Inc., Morgan Stanley & Co. LLC, Merrill Lynch, Pierce, Fenner & Smith Incorporated, Drexel Hamilton, LLC, The Williams Capital Group, L.P. or any other underwriter or dealer participating in this offering will arrange to send you the prospectus if you request it by calling toll-free 1-800-831-9146.
25
STRUCTURAL OVERVIEW (continued)
| Termination of |
| Special Servicer | At any time, prior to the occurrence and continuance of a Control Termination Event, the special servicer (but not any outside special servicer for any outside serviced loan combination) may be removed and replaced by the Controlling Class Representative (except with respect to any excluded mortgage loan) with or without cause upon satisfaction of certain conditions specified in the CGCMT 2018-B2 pooling and servicing agreement, provided that such termination may be without cause only if either (i) LNR Partners, LLC or an affiliate thereof is no longer the special servicer or (ii) LNR Securities Holdings, LLC or an affiliate thereof owns less than 25% of the certificate balance of the then Controlling Class of certificates. |
| After the occurrence and during the continuance of a Control Termination Event, the holders of at least 25% of the voting rights of the certificates (other than the Class R certificates) may request a vote to replace the special servicer (but not any outside special servicer for any outside serviced loan combination). The subsequent vote may result in the termination and replacement of the special servicer if, within 180 days of the initial request for that vote, the holders of (a) at least 66-2/3% of the voting rights allocable to the certificates of those holders that voted on the matter (provided that holders representing the applicable Certificateholder Quorum voted on the matter), or (b) more than 50% of the voting rights of each class of Non-Reduced Certificates vote affirmatively to so replace. |
| “Non-Reduced Certificates” means each class of Principal Balance Certificates that has an outstanding certificate balance as may be notionally reduced by any Appraisal Reduction Amounts allocated to that class, equal to or greater than 25% of an amount equal to the initial certificate balance of that class of certificates minus all principal payments made on such class of certificates. |
| At any time after the occurrence and during the continuance of a Consultation Termination Event, if the operating advisor determines, in its sole discretion exercised in good faith, that (1) the special servicer has failed to comply with the servicing standard and (2) a replacement of the special servicer would be in the best interest of the certificateholders (as a collective whole), the operating advisor will have the right to recommend the replacement of the special servicer with respect to the serviced mortgage loans (but not any outside special servicer for any outside serviced loan combination), resulting in a solicitation of a certificateholder vote. The subsequent vote may result in the termination and replacement of the special servicer if, within 180 days of the initial request for that vote, the holders of at least a majority of the voting rights allocable to each class of Non-Reduced Certificates affirmatively vote to so replace. |
| “Certificateholder Quorum” means a quorum that, for purposes of a vote to terminate and replace the special servicer or the asset representations reviewer at the request of the holders of certificates evidencing not less than 25% of the voting rights (without regard to the application of any Appraisal Reduction Amounts), consists of the holders of certificates evidencing at least 50% of the aggregate voting rights (taking into account the allocation of any Appraisal Reduction Amounts to notionally reduce the certificate balances of the respective classes of Principal Balance Certificates) of all certificates (other than the Class R certificates), on an aggregate basis. |
| The related outside special servicer under each outside servicing agreement generally may be (or, if the applicable outside servicing agreement has not yet been executed, it is anticipated that such outside special servicer may be) replaced by the related outside controlling class representative (or an equivalent party), or the vote of the requisite holders of certificates issued, under the applicable outside servicing agreement (depending on whether or not the equivalent of a control termination event or a consultation termination event exists under that outside servicing agreement) or by any applicable other controlling noteholder in a manner generally similar to the manner in which the special servicer may be replaced under the CGCMT 2018-B2 pooling and servicing agreement as described in the four preceding paragraphs (although there will be differences, in particular as regards certificateholder votes and the timing of when an outside special servicer may be terminated based on the recommendation of an operating advisor, and termination of an outside special servicer by the related Directing Holder may not be limited in the manner contemplated by the proviso to the fourth preceding paragraph). |
The depositor has filed a registration statement (including a prospectus) with the Securities and Exchange Commission (“SEC”) (SEC File No. 333-207132) for the offering to which this communication relates. Before you invest, you should read the prospectus in the registration statement and other documents the depositor has filed with the SEC for more complete information about the depositor, the issuing entity and this offering. You may get these documents for free by visiting EDGAR on the SEC website at www.sec.gov. Alternatively, the depositor or Citigroup Global Markets Inc., Morgan Stanley & Co. LLC, Merrill Lynch, Pierce, Fenner & Smith Incorporated, Drexel Hamilton, LLC, The Williams Capital Group, L.P. or any other underwriter or dealer participating in this offering will arrange to send you the prospectus if you request it by calling toll-free 1-800-831-9146.
26
STRUCTURAL OVERVIEW (continued)
| Termination of |
| Special Servicer |
| (continued) | If the special servicer, to its knowledge, becomes a Borrower Party with respect to a mortgage loan, the special servicer will not be permitted to act as special servicer with respect to that mortgage loan. Subject to certain limitations described in the Preliminary Prospectus, the Directing Holder (so long as it is not itself a Borrower Party with respect to the applicable mortgage loan and, if the Directing Holder is the Controlling Class Representative, so long as no Control Termination Event shall have occurred and be continuing) will be entitled to appoint a replacement special servicer for that mortgage loan. If the Directing Holder is precluded from appointing a replacement special servicer or, if not so precluded, does not take action to appoint a replacement special servicer, a replacement special servicer will be appointed in the manner specified in the CGCMT 2018-B2 pooling and servicing agreement. |
| Voting Rights | At all times during the term of the CGCMT 2018-B2 pooling and servicing agreement, the voting rights for the certificates will be allocated among the respective classes of certificateholders as follows: |
| (1) | 1% in the aggregate in the case of the respective classes of the Class X Certificates, allocatedpro rata based upon their respective notional amounts as of the date of determination (for so long as the notional amount of at least one class of the Class X Certificates is greater than zero), and |
| (2) | in the case of any class of Principal Balance Certificates, a percentage equal to the product of 99% (or, if the notional amounts of all classes of the Class X Certificates have been reduced to zero, 100%) and a fraction, the numerator of which is equal to the certificate balance of such class of Principal Balance Certificates as of the date of determination, and the denominator of which is equal to the aggregate of the certificate balances of all classes of the Principal Balance Certificates, in each case, as of the date of determination, |
| provided, that in certain circumstances described under “The Pooling and ServicingAgreement” in the Preliminary Prospectus, voting rights will only be exercisable by holders of the Non-Reduced Certificates and/or may otherwise be exercisable or allocated in a manner that takes into account the allocation of Appraisal Reduction Amounts. |
| The voting rights of any class of certificates are required to be allocated among certificateholders of such class in proportion to their respective percentage interests. |
| The Class R certificates will not be entitled to any voting rights. |
| Servicing |
| Compensation | Modification Fees: Certain fees resulting from modifications, amendments, waivers or other changes to the terms of the loan documents, as more fully described in the Preliminary Prospectus, will be used to offset expenses on the related serviced mortgage loan (i.e. reimburse the trust for certain expenses including unreimbursed advances and interest on unreimbursed advances previously incurred (other than special servicing fees, workout fees and liquidation fees) on the related serviced mortgage loan but not yet reimbursed to the trust or servicers or to pay expenses (other than special servicing fees, workout fees and liquidation fees) that are still outstanding in each case unless as part of the written modification the related borrower is required to pay these amounts on a going forward basis or in the future). Any excess modification fees not so applied to offset expenses will be available as compensation to the master servicer and/or special servicer. Within any prior 12 month period, all such excess modification fees earned by the master servicer or by the special servicer (after taking into account the offset described below applied during such 12-month period) with respect to any serviced mortgage loan will be subject to a cap equal to the greater of (i) 1% of the outstanding principal balance of such mortgage loan after giving effect to such transaction and (ii) $25,000. |
| All excess modification fees earned by the special servicer will be required to offset any future workout fees or liquidation fees payable with respect to the related serviced mortgage loan or related REO property; provided, that if the serviced mortgage loan ceases being a corrected loan, and is subject to a subsequent modification, any excess modification fees earned by the special servicer prior to such serviced mortgage loan ceasing to be a corrected loan will no longer be offset against future liquidation fees and workout fees unless such serviced mortgage loan ceased to be a corrected loan within 18 months of it becoming a modified mortgage loan. |
| Servicing |
| Compensation | Penalty Fees: All late fees and default interest will first be used to reimburse certain expenses previously incurred with respect to the related mortgage loan (other than special servicing fees, workout fees and liquidation fees) but not yet reimbursed to the trust, the master servicer or the special servicer or to pay certain expenses (other than special servicing fees, workout fees and liquidation fees) that are still outstanding on the related mortgage loan, and any excess received with respect to a serviced loan will be paid to the master servicer (for penalty fees accrued while a non-specially serviced loan) and the special servicer (for penalty fees accrued while a specially serviced loan). To the extent any amounts reimbursed out of penalty charges are subsequently recovered on a related serviced loan, they will be paid to the master servicer or special servicer who would have been entitled to the related penalty charges that were previously used to reimburse such expense. |
| Liquidation / Workout Fees: Liquidation fees will be calculated at the lesser of (a) 1.0% and (b) such rate as would result in a liquidation fee of $1,000,000, for each serviced loan that is a specially serviced loan and any REO property, subject in any case to a minimum liquidation fee of $25,000. For any serviced loan that is a corrected loan, workout fees will be calculated at the lesser of (a) 1.0% and (b) such rate as would result in a workout fee of $1,000,000 when applied to each expected payment of principal and interest (other than default interest and excess interest) on the related serviced loan from the date such serviced loan becomes a corrected mortgage loan through and including the then related maturity date, subject in any case to a minimum workout fee of $25,000. |
The depositor has filed a registration statement (including a prospectus) with the Securities and Exchange Commission (“SEC”) (SEC File No. 333-207132) for the offering to which this communication relates. Before you invest, you should read the prospectus in the registration statement and other documents the depositor has filed with the SEC for more complete information about the depositor, the issuing entity and this offering. You may get these documents for free by visiting EDGAR on the SEC website at www.sec.gov. Alternatively, the depositor or Citigroup Global Markets Inc., Morgan Stanley & Co. LLC, Merrill Lynch, Pierce, Fenner & Smith Incorporated, Drexel Hamilton, LLC, The Williams Capital Group, L.P. or any other underwriter or dealer participating in this offering will arrange to send you the prospectus if you request it by calling toll-free 1-800-831-9146.
27
STRUCTURAL OVERVIEW (continued)
| Notwithstanding the foregoing, in connection with a maturity default, no liquidation or workout fee will be payable in connection with a payoff or refinancing of the related serviced loan within 90 days of the maturity default, but the special servicer may collect and retain appropriate fees from the related borrower in connection with the subject liquidation or workout. |
| In the case of an outside serviced loan combination, calculation of the foregoing amounts payable to the related outside servicer or outside special servicer may be different than as described above. For example, the extent to which modification fees and penalty fees are applied to offset expenses may be different and liquidation fees and workout fees may be subject to different caps or no caps. |
| Operating Advisor | The operating advisor will, in general and under certain circumstances described in the Preliminary Prospectus, have the following rights and responsibilities with respect to the serviced mortgage loans: |
| ● | after the occurrence and during the continuance of a Control Termination Event, reviewing the actions of the special servicer with respect to specially serviced loans; |
| ● | reviewingreports provided by the special servicer to the extent set forth in the CGCMT 2018-B2 pooling and servicing agreement; |
| ● | reviewing foraccuracy certain calculations made by the special servicer; |
| ● | after the occurrence and during the continuance of a Control Termination Event, under certain conditions described in the CGCMT 2018-B2 pooling and servicing agreement, issuing anannual report generally setting forth, among other things, its assessment of whether the special servicer is performing its duties in compliance with the servicing standard and the CGCMT 2018-B2 pooling and servicing agreement and identifying any material deviations therefrom; |
| ● | after the occurrence and during the continuance of a Consultation Termination Event, recommending the replacement of the special servicer if the operating advisor determines, in its sole discretion exercised in good faith, that (1) the special servicer has failed to comply with the servicing standard and (2) a replacement of the special servicer would be in the best interest of the certificateholders (as a collective whole); and |
| ● | after theoccurrence and during the continuance of a Control Termination Event, consulting on a non-binding basis with the special servicer with respect to certain major decisions (and such other matters as are set forth in the CGCMT 2018-B2 pooling and servicing agreement) in respect of the applicable serviced mortgage loan(s) and/or related companion loan(s). |
| Notwithstanding the foregoing, the operating advisor will generally have no obligations or consultation rights as operating advisor under the CGCMT 2018-B2 pooling and servicing agreement with respect to any outside serviced mortgage loan or any related REO property. |
| The operating advisor will be subject to termination and replacement if the holders of at least 15% of the voting rights of Non-Reduced Certificates vote to terminate and replace the operating advisor and such termination and replacement is affirmatively voted for by the holders of more than 50% of the voting rights allocable to the Non-Reduced Certificates of those holders that exercise their right to vote (provided that holders entitled to exercise at least 50% of the voting rights allocable to the Non-Reduced Certificates exercise their right to vote within 180 days of the initial request for a vote). The holders initiating such vote will be responsible for the fees and expenses in connection with the vote and replacement. |
| See “The Pooling and Servicing Agreement—Operating Advisor”in the Preliminary Prospectus. |
The depositor has filed a registration statement (including a prospectus) with the Securities and Exchange Commission (“SEC”) (SEC File No. 333-207132) for the offering to which this communication relates. Before you invest, you should read the prospectus in the registration statement and other documents the depositor has filed with the SEC for more complete information about the depositor, the issuing entity and this offering. You may get these documents for free by visiting EDGAR on the SEC website at www.sec.gov. Alternatively, the depositor or Citigroup Global Markets Inc., Morgan Stanley & Co. LLC, Merrill Lynch, Pierce, Fenner & Smith Incorporated, Drexel Hamilton, LLC, The Williams Capital Group, L.P. or any other underwriter or dealer participating in this offering will arrange to send you the prospectus if you request it by calling toll-free 1-800-831-9146.
28
STRUCTURAL OVERVIEW (continued)
| Asset Representations |
| Reviewer | The asset representations reviewer will be required to review certain delinquent mortgage loans after a specified delinquency threshold has been exceeded and the required percentage of certificateholders vote to direct a review of such delinquent mortgage loans. An asset review will occur when either (1) mortgage loans with an aggregate outstanding principal balance of 25% or more of the aggregate outstanding principal balance of all of the mortgage loans (including any REO loans) held by the issuing entity as of the end of the applicable collection period are at least 60 days delinquent in respect of their related monthly payments or balloon payment, if any (for purposes of this paragraph, “delinquent loans”) or (2) at least 15 mortgage loans are delinquent loans as of the end of the applicable collection period and the aggregate outstanding principal balance of such delinquent loans constitutes at least 20% of the aggregate outstanding principal balance of all of the mortgage loans (including any REO loans) held by the issuing entity as of the end of the applicable collection period. |
| The asset representations reviewer may be terminated and replaced without cause. Upon (i) the written direction of certificateholders evidencing not less than 25% of the voting rights requesting a vote to terminate and replace the asset representations reviewer with a proposed successor asset representations reviewer that is an eligible asset representations reviewer, and (ii) payment by such holders to the certificate administrator of the reasonable fees and expenses to be incurred by the certificate administrator in connection with administering such vote, the certificate administrator will promptly provide notice of such request to all certificateholders and the asset representations reviewer by posting such notice on its internet website, and by mailing such notice to all certificateholders and the asset representations reviewer. Upon the affirmative vote of certificateholders evidencing at least 75% of the voting rights allocable to those holders that exercise their right to vote (provided that holders representing the applicable Certificateholder Quorum exercise their right to vote within 180 days of the initial request for a vote), the trustee will be required to terminate all of the rights and obligations of the asset representations reviewer under the CGCMT 2018-B2 pooling and servicing agreement by written notice to the asset representations reviewer, and the proposed successor asset representations reviewer will be appointed. See “The Pooling and Servicing Agreement—The Asset Representations Reviewer” in the Preliminary Prospectus. |
| Dispute Resolution |
| Provisions | The mortgage loan sellers will be subject to the dispute resolution provisions set forth in the CGCMT 2018-B2 pooling and servicing agreement to the extent those provisions are triggered with respect to any mortgage loan sold to the depositor by a mortgage loan seller and such mortgage loan seller will be obligated under the related mortgage loan purchase agreement to comply with all applicable provisions and to take part in any mediation or arbitration proceedings that may result. |
| Generally, in the event that a Repurchase Request (as defined in the Preliminary Prospectus) is not “Resolved” (as defined below) within 180 days after the related mortgage loan seller receives such Repurchase Request, then the enforcing servicer will be required to send a notice to the “Initial Requesting Certificateholder” (if any) indicating the enforcing servicer’s intended course of action with respect to the Repurchase Request. If (a) the enforcing servicer’s intended course of action with respect to the Repurchase Request does not involve pursuing further action to exercise rights against the applicable mortgage loan seller with respect to the Repurchase Request and the Initial Requesting Certificateholder, if any, or any other certificateholder or certificate owner wishes to exercise its right to refer the matter to mediation (including nonbinding arbitration) or arbitration, or (b) the enforcing servicer’s intended course of action is to pursue further action to exercise rights against the related mortgage loan seller with respect to the Repurchase Request but the Initial Requesting Certificateholder, if any, or any other certificateholder or certificate owner does not agree with the dispute resolution method selected by the enforcing servicer, then the Initial Requesting Certificateholder, if any, or such other certificateholder or certificate owner may deliver a written notice to the enforcing servicer indicating its intent to exercise its right to refer the matter to either mediation or arbitration. In addition, any other certificateholder or certificate owner may deliver, within the time frame provided in the CGCMT 2018-B2 pooling and servicing agreement, a written notice requesting the right to participate in any dispute resolution consultation that is conducted by the enforcing servicer following the enforcing servicer’s receipt of the notice described in the preceding sentence. |
| “Resolved” means, with respect to a Repurchase Request, (i) that any material breach of representations and warranties or a material document defect has been cured, (ii) the related mortgage loan has been repurchased in accordance with the related mortgage loan purchase agreement, (iii) a mortgage loan has been substituted for the related mortgage loan in accordance with the related mortgage loan purchase agreement, (iv) the applicable mortgage loan seller has made a “loss of value payment”, (v) a contractually binding agreement has been entered into between the enforcing servicer, on behalf of the issuing entity, and the related mortgage loan seller that settles the related mortgage loan seller’s obligations under the related mortgage loan purchase agreement, or (vi) the related mortgage loan is no longer property of the issuing entity as a result of a sale or other disposition in accordance with the CGCMT 2018-B2 pooling and servicing agreement. See “The Pooling and Servicing Agreement—Dispute Resolution Provisions” in the Preliminary Prospectus. |
| Liquidated Loan Waterfall | On liquidation of any mortgage loan, all net liquidation proceeds related to the mortgage loan (but not any related companion loan) will be applied (after allocation to offset certain advances) so that amounts allocated as a recovery of accrued and unpaid interest will not, in the first instance, include any delinquent interest that was not advanced as a result of Appraisal Reduction Amounts or interest that accrued on any junior note(s) if such mortgage loan is an AB Modified Loan. After the adjusted interest amount is so allocated, any remaining liquidation proceeds will be allocated to pay principal on the mortgage loan until the unpaid principal amount of the mortgage loan has been reduced to zero. Any remaining liquidation proceeds will then be allocated to pay delinquent interest that was not |
The depositor has filed a registration statement (including a prospectus) with the Securities and Exchange Commission (“SEC”) (SEC File No. 333-207132) for the offering to which this communication relates. Before you invest, you should read the prospectus in the registration statement and other documents the depositor has filed with the SEC for more complete information about the depositor, the issuing entity and this offering. You may get these documents for free by visiting EDGAR on the SEC website at www.sec.gov. Alternatively, the depositor or Citigroup Global Markets Inc., Morgan Stanley & Co. LLC, Merrill Lynch, Pierce, Fenner & Smith Incorporated, Drexel Hamilton, LLC, The Williams Capital Group, L.P. or any other underwriter or dealer participating in this offering will arrange to send you the prospectus if you request it by calling toll-free 1-800-831-9146.
29
STRUCTURAL OVERVIEW (continued)
| advanced as a result of Appraisal Reduction Amounts and any interest that accrued on any junior note(s) if such mortgage loan is an AB Modified Loan. |
| Credit Risk Retention | This securitization transaction will be subject to the credit risk retention rules of Section 15G of the Securities Exchange Act of 1934, as amended. An economic interest in the credit risk of the mortgage loans in this transaction is expected to be retained pursuant to Regulation RR (17 CFR § 246.1et seq) promulgated under Section 15G (“Regulation RR”), as an “eligible vertical interest” in the form of the VRR Interest. Citi Real Estate Funding Inc. will act as retaining sponsor under Regulation RR and is expected, on the Closing Date, to offset portions of its risk retention obligation by the acquisition by each of Morgan Stanley Bank, N.A., Starwood Mortgage Capital LLC and Bank of America, National Association (or, in each case, a “majority-owned affiliate” (as defined in Regulation RR) thereof) of a pro rata portion (based on the respective percentages of the mortgage loans originated by Morgan Stanley Bank, N.A., Starwood Mortgage Capital LLC and Bank of America, National Association, respectively) of the VRR Interest. For a further discussion of the manner in which the credit risk retention requirements are expected to be satisfied by Citi Real Estate Funding Inc., as retaining sponsor, see “Credit Risk Retention” in the Preliminary Prospectus. |
| Investor Communications | The certificate administrator is required to include on any Form 10–D any request received from a certificateholder to communicate with other certificateholders related to certificateholders exercising their rights under the terms of the CGCMT 2018-B2 pooling and servicing agreement. Any certificateholder wishing to communicate with other certificateholders regarding the exercise of its rights under the terms of the CGCMT 2018-B2 pooling and servicing agreement will be able to deliver a written request signed by an authorized representative of the requesting investor to the certificate administrator. |
| Deal Website | The certificate administrator will maintain a deal website including, but not limited to: |
| —all special notices delivered. |
| —summaries of final asset status reports. |
| —all appraisals in connection with an appraisal reduction plus any subsequent appraisal updates. |
| —an “Investor Q&A Forum” and a voluntary investor registry. |
| Cleanup Call | On any Distribution Date on which the aggregate unpaid principal balance of the mortgage loans remaining in the issuing entity is less than 1% of the aggregate principal balance of the pool of mortgage loans as of the Cut-off Date, certain specified persons will have the option to purchase all of the remaining mortgage loans (and all property acquired through exercise of remedies in respect of any mortgage loan) at the price specified in the Preliminary Prospectus. Exercise of the option will terminate the issuing entity and retire the then outstanding certificates. |
| If the aggregate certificate balances of the Class A-1, Class A-2, Class A-3, Class A-4, Class A-AB, Class A-S, Class B, Class C and Class D certificates and the notional amounts of the Class X-A, Class X-B and Class X-D certificates have been reduced to zero and if the master servicer has received from the remaining certificateholders the payment specified in the CGCMT 2018-B2 pooling and servicing agreement, the issuing entity could also be terminated in connection with an exchange of all the then-outstanding certificates (excluding the Class R certificates) for the mortgage loans remaining in the issuing entity, as further described under “The Pooling and Servicing Agreement—Optional Termination; Optional Mortgage Loan Purchase” in the Preliminary Prospectus. |
The Certificates involve certain risks and may not be suitable for all investors. For information regarding certain risks associated with an investment in the Certificates, see “Risk Factors” in the Preliminary Prospectus. Capitalized terms used but not otherwise defined in this Term Sheet have the respective meanings assigned to those terms in the Preliminary Prospectus.
The depositor has filed a registration statement (including a prospectus) with the Securities and Exchange Commission (“SEC”) (SEC File No. 333-207132) for the offering to which this communication relates. Before you invest, you should read the prospectus in the registration statement and other documents the depositor has filed with the SEC for more complete information about the depositor, the issuing entity and this offering. You may get these documents for free by visiting EDGAR on the SEC website at www.sec.gov. Alternatively, the depositor or Citigroup Global Markets Inc., Morgan Stanley & Co. LLC, Merrill Lynch, Pierce, Fenner & Smith Incorporated, Drexel Hamilton, LLC, The Williams Capital Group, L.P. or any other underwriter or dealer participating in this offering will arrange to send you the prospectus if you request it by calling toll-free 1-800-831-9146.
30
(THIS PAGE INTENTIONALLY LEFT BLANK)
The depositor has filed a registration statement (including a prospectus) with the Securities and Exchange Commission (“SEC”) (SEC File No. 333-207132) for the offering to which this communication relates. Before you invest, you should read the prospectus in the registration statement and other documents the depositor has filed with the SEC for more complete information about the depositor, the issuing entity and this offering. You may get these documents for free by visiting EDGAR on the SEC website at www.sec.gov. Alternatively, the depositor or Citigroup Global Markets Inc., Morgan Stanley & Co. LLC, Merrill Lynch, Pierce, Fenner & Smith Incorporated, Drexel Hamilton, LLC, The Williams Capital Group, L.P. or any other underwriter or dealer participating in this offering will arrange to send you the prospectus if you request it by calling toll-free 1-800-831-9146.
31
| LOAN #1: extra space - tiaa self storage portfolio |
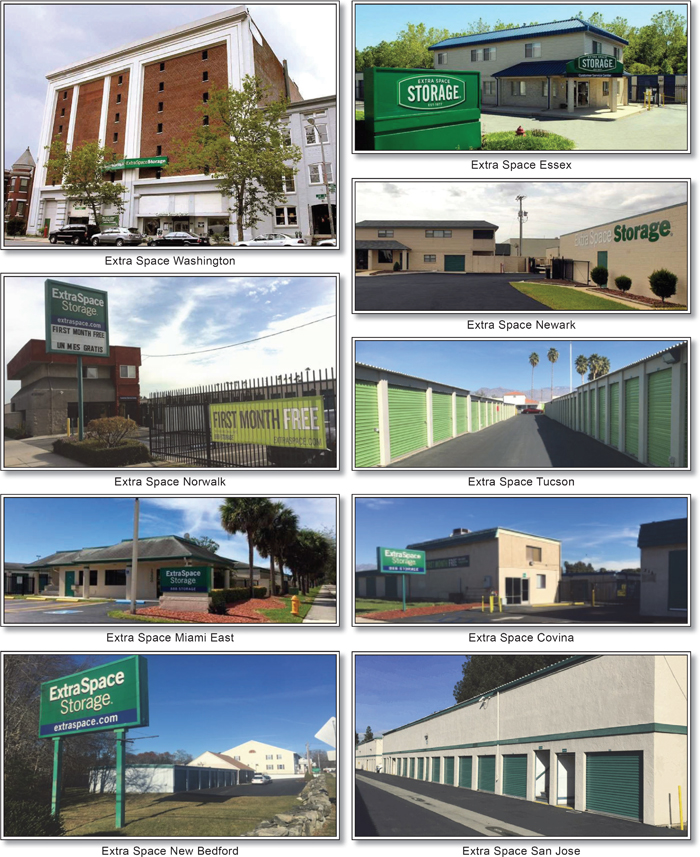
The depositor has filed a registration statement (including a prospectus) with the Securities and Exchange Commission (“SEC”) (SEC File No. 333-207132) for the offering to which this communication relates. Before you invest, you should read the prospectus in the registration statement and other documents the depositor has filed with the SEC for more complete information about the depositor, the issuing entity and this offering. You may get these documents for free by visiting EDGAR on the SEC website at www.sec.gov. Alternatively, the depositor or Citigroup Global Markets Inc., Morgan Stanley & Co. LLC, Merrill Lynch, Pierce, Fenner & Smith Incorporated, Drexel Hamilton, LLC, The Williams Capital Group, L.P. or any other underwriter or dealer participating in this offering will arrange to send you the prospectus if you request it by calling toll-free 1-800-831-9146.
32
| LOAN #1: extra space - tiaa self storage portfolio |
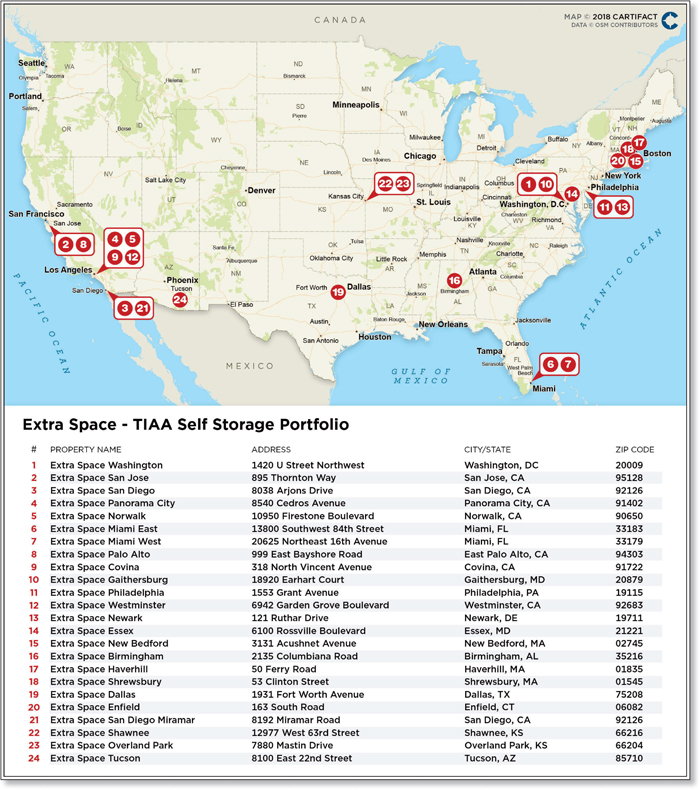
The depositor has filed a registration statement (including a prospectus) with the Securities and Exchange Commission (“SEC”) (SEC File No. 333-207132) for the offering to which this communication relates. Before you invest, you should read the prospectus in the registration statement and other documents the depositor has filed with the SEC for more complete information about the depositor, the issuing entity and this offering. You may get these documents for free by visiting EDGAR on the SEC website at www.sec.gov. Alternatively, the depositor or Citigroup Global Markets Inc., Morgan Stanley & Co. LLC, Merrill Lynch, Pierce, Fenner & Smith Incorporated, Drexel Hamilton, LLC, The Williams Capital Group, L.P. or any other underwriter or dealer participating in this offering will arrange to send you the prospectus if you request it by calling toll-free 1-800-831-9146.
33
| LOAN #1: extra space - tiaa self storage portfolio |
| Mortgaged Property Information | Mortgage Loan Information | |||||
| Number of Mortgaged Properties | 24 | Loan Seller | BANA | |||
| Location (City/State) | Various | Cut-off Date Balance(4) | $105,000,000 | |||
| Property Type | Self Storage | Cut-off Date Balance per SF(3) | $141.82 | |||
| Size (SF) | 1,614,702 | Percentage of Initial Pool Balance | 9.9% | |||
| Total Occupancy as of 12/31/2017 | 92.2% | Number of Related Mortgage Loans(2) | 2 | |||
| Owned Occupancy as of 12/31/2017 | 92.2% | Type of Security | Fee Simple | |||
| Year Built / Latest Renovation | Various | Mortgage Rate | 4.53250% | |||
| Appraised Value(1) | $394,160,000 | Original Term to Maturity (Months) | 120 | |||
| Appraisal Date(1) | Various | Original Amortization Term (Months) | NAP | |||
| Borrower Sponsors(2) | Extra Space Storage Inc. and TH Real Estate | Original Interest Only Term (Months) First Payment Date | 120 4/1/2018 | |||
| Property Management | Extra Space Management, Inc. | Maturity Date | 3/1/2028 | |||
| Underwritten Revenues | $29,418,170 | |||||
| Underwritten Expenses | $8,461,563 | |||||
| Underwritten Net Operating Income (NOI) | $20,956,607 | Escrows(5) | ||||
| Underwritten Net Cash Flow (NCF) | $20,714,398 | Upfront | Monthly | |||
| Cut-off Date LTV Ratio(1)(3) | 58.1% | Taxes | $0 | $0 | ||
| Maturity Date LTV Ratio(1)(3) | 58.1% | Insurance | $915 | $457 | ||
| DSCR Based on Underwritten NOI / NCF(3) | 1.99x / 1.97x | Replacement Reserves | $0 | $0 | ||
| Debt Yield Based on Underwritten NOI / NCF(3) | 9.2% / 9.0% | Other | $0 | $0 | ||
| Sources and Uses | |||||
| Sources | $ | % | Uses | $ | % |
| Loan Combination Amount | $229,000,000 | 100.0% | Principal Equity Distribution | $140,845,793 | 61.5% |
| Loan Payoff | 83,536,796 | 36.5 | |||
| Closing Costs | 4,616,496 | 2.0 | |||
| Reserves | 915 | 0.0 | |||
| Total Sources | $229,000,000 | 100.0% | Total Uses | $229,000,000 | 100.0% |
| (1) | The Appraised Value represents the “As Is Portfolio” combined appraised value based on individual valuations dated between November 25, 2017 and December 4, 2017, plus a $36,170,000 portfolio premium. The Cut-off Date LTV Ratio and Maturity Date LTV Ratio are calculated based upon the Appraised Value of $394,160,000. The Cut-off Date LTV Ratio and Maturity Date LTV Ratio based on the sum of the individual “as-is” appraised values of $357,990,000 are each 64.0%. |
| (2) | The Extra Space - TIAA Self Storage Portfolio Loan Combination borrower sponsors are also the borrower sponsors of the Extra Space Self Storage Portfolio Loan Combination, as to which Morgan Stanley Mortgage Capital Holdings LLC is the mortgage loan seller. |
| (3) | Calculated based on the aggregate outstanding principal balance of the Extra Space - TIAA Self Storage Portfolio Loan Combination (as defined below). |
| (4) | The Cut-off Date Balance of $105,000,000 represents the controlling note A-1, which is part of a loan combination evidenced by threepari passu notes having an aggregate outstanding principal balance as of the Cut-off Date of $229,000,000. The related companion loans, which are evidenced by the non-controlling notes A-2 and A-3, have an aggregate outstanding principal balance as of the Cut-off Date of $124,000,000 and are expected to be contributed to one or more future securitization transactions. See “—The Mortgage Loan” below. |
| (5) | See “—Escrows” below. |
| ■ | The Mortgage Loan.The mortgage loan (the “Extra Space - TIAA Self Storage Portfolio Loan”) is part of a loan combination (the “Extra Space - TIAA Self Storage Portfolio Loan Combination”) evidenced by threepari passunotes that are together secured by a first mortgage encumbering the borrower’s fee simple interest in a 24-property self-storage portfolio located across 11 states and Washington, D.C. (the “Extra Space - TIAA Self Storage Portfolio Properties”). The Extra Space - TIAA Self Storage Portfolio Loan Combination was originated by Bank of America, N.A. on February 2, 2018, had an original principal balance of $229,000,000 and has an outstanding principal balance as of the Cut-off Date of $229,000,000. The Extra Space - TIAA Self Storage Portfolio Loan is evidenced by the controlling note A-1 with an original principal balance of $105,000,000 and a Cut-off Date Balance of $105,000,000, and represents approximately 9.9% of the Initial Pool Balance. The related companion loans (the “Extra Space - TIAA Self Storage Portfolio Companion Loans”), which are evidenced by the non-controlling notes A-2 and A-3, had an aggregate original principal balance of $124,000,000, have an aggregate outstanding principal balance as of the Cut-off Date of $124,000,000, and are expected to be contributed to one or more future commercial mortgage securitization transactions. The Extra Space - TIAA Self Storage Portfolio Loan Combination accrues interest at an interest rate of 4.53250%per annum. The proceeds of the Extra Space - TIAA Self Storage Portfolio Loan Combination were primarily used to refinance a prior debt secured by the Extra Space - TIAA Self Storage Portfolio Properties, return equity to the borrower sponsor, fund reserves and pay origination costs. |
Loan Combination Summary
| Note | Original Balance | Cut-off Date Balance | Note Holder | Controlling Piece | |||
| A-1 | $105,000,000 | $105,000,000 | CGCMT 2018-B2 | Yes | |||
| A-2(1) | $80,000,000 | $80,000,000 | BANA | No | |||
| A-3(1) | $44,000,000 | $44,000,000 | BANA | No | |||
| Total / Wtd. Avg. | $229,000,000 | $229,000,000 | |||||
| (1) | Expected to be contributed to one or more future securitization transactions. |
The depositor has filed a registration statement (including a prospectus) with the Securities and Exchange Commission (“SEC”) (SEC File No. 333-207132) for the offering to which this communication relates. Before you invest, you should read the prospectus in the registration statement and other documents the depositor has filed with the SEC for more complete information about the depositor, the issuing entity and this offering. You may get these documents for free by visiting EDGAR on the SEC website at www.sec.gov. Alternatively, the depositor or Citigroup Global Markets Inc., Morgan Stanley & Co. LLC, Merrill Lynch, Pierce, Fenner & Smith Incorporated, Drexel Hamilton, LLC, The Williams Capital Group, L.P. or any other underwriter or dealer participating in this offering will arrange to send you the prospectus if you request it by calling toll-free 1-800-831-9146.
34
| LOAN #1: extra space - tiaa self storage portfolio |
The Extra Space - TIAA Self Storage Portfolio Loan Combination had an initial term of 120 months and has a remaining term of 120 months as of the Cut-off Date. The Extra Space - TIAA Self Storage Portfolio Loan requires payments of interest only during its term. The scheduled maturity date of the Extra Space - TIAA Self Storage Portfolio Loan Combination is the due date occurring in March 2028. Voluntary prepayment of the Extra Space - TIAA Self Storage Portfolio Loan Combination without payment of any prepayment premium is permitted on or after the due date occurring in September 2027. The Extra Space - TIAA Self Storage Portfolio Loan Combination may be defeased in full or in part with certain direct full faith and credit obligations of the United States of America or other obligations which are “government securities” permitted under the Extra Space - TIAA Self Storage Portfolio Loan Combination documents at any time after the earlier to occur of (i) the fourth anniversary of the closing date of the Extra Space – TIAA Self Storage Portfolio Loan Combination and (ii) the date that is two years from the “startup day” of the REMIC trust established in connection with the last securitization involving any portion of the Extra Space - TIAA Self Storage Portfolio Loan Combination. See “—Release of Collateral” below.
| ■ | The Mortgaged Properties.The Extra Space - TIAA Self Storage Portfolio Properties consist of 24 Extra Space-branded self-storage properties located in 11 states and Washington, D.C. The Extra Space - TIAA Self Storage Portfolio Properties consist of 15,465 traditional storage units (of which 1,100 units (approximately 7.1%) are climate-controlled) and 303 parking spaces. The Extra Space - TIAA Self Storage Portfolio Properties range in size from 36,384 SF to 119,335 SF, inclusive of parking square footage, with an average size across the portfolio for traditional storage units of approximately 104 SF. Each of the Extra Space - TIAA Self Storage Portfolio Properties includes perimeter fencing, security cameras, gated entry, on-site managers and on-site leasing offices. The weighted average occupancy of the Extra Space - TIAA Self Storage Portfolio Properties was 92.2% as of December 31, 2017. |
The Extra Space - TIAA Self Storage Portfolio Properties have been jointly owned by the Extra Space - TIAA Self Storage Portfolio sponsors since 2004 and since 2012, the Extra Space – TIAA Self Storage Portfolio Sponsors have invested over $5.7 million in capital expenditures to theExtra Space - TIAA Self Storage Portfolio Properties. Under the Extra Space – TIAA Self Storage Portfolio Sponsor’s ownership, historical occupancy has increased from 85.9% in 2010 to 92.2% in 2017, averaging 90.2% between 2010 and 2017, and the Extra Space - TIAA Self Storage Portfolio Properties’ effective gross income has grown each year since 2010 by between 2.2% and 6.3% with cumulative growth of 37.0% from 2010 to 2017.
The Extra Space - TIAA Self Storage Portfolio Properties’ revenue is diversely generated from 24 different properties across 17 various major metropolitan statistical areas. Only five properties individually represent greater than 5.4% of the portfolio’s underwritten net cash flow. The five largest properties based on allocated Cut-off Date Balance account for approximately 37.6% of underwritten net cash flow while the 10 largest properties based on allocated Cut-off Date Balance account for approximately 61.9% of the portfolio’s underwritten net cash flow.
The depositor has filed a registration statement (including a prospectus) with the Securities and Exchange Commission (“SEC”) (SEC File No. 333-207132) for the offering to which this communication relates. Before you invest, you should read the prospectus in the registration statement and other documents the depositor has filed with the SEC for more complete information about the depositor, the issuing entity and this offering. You may get these documents for free by visiting EDGAR on the SEC website at www.sec.gov. Alternatively, the depositor or Citigroup Global Markets Inc., Morgan Stanley & Co. LLC, Merrill Lynch, Pierce, Fenner & Smith Incorporated, Drexel Hamilton, LLC, The Williams Capital Group, L.P. or any other underwriter or dealer participating in this offering will arrange to send you the prospectus if you request it by calling toll-free 1-800-831-9146.
35
| LOAN #1: extra space - tiaa self storage portfolio |
The following table presents certain information relating to the Extra Space - TIAA Self Storage Portfolio Properties:
Extra Space - TIAA Self Storage Portfolio Summary
Property Name City State/Jurisdiction | Year Built / Renovated | Total GLA | Total Units | Occupancy As of 12/31/2017 | Cut-off Date Allocated Loan Combination Amount | % of Allocated Loan Combination Amount | Appraised Value(1) | % of Appraised Value | UW NCF | ||||||||||||||||
| Extra Space Washington Washington, D.C. | 1910 / NAP | 104,382 | 1,689 | 92.1 | % | $30,841,000 | 13.5 | % | $47,490,000 | 13.3 | % | $2,752,474 | |||||||||||||
| Extra Space San Jose San Jose, CA | 1985, 2016 / NAP | 66,854 | 795 | 89.9 | 14,955,000 | 6.5 | 24,750,000 | 6.9 | 1,355,104 | ||||||||||||||||
| Extra Space San Diego San Diego, CA | 1986 / NAP | 119,335 | 898 | 88.1 | 14,730,000 | 6.4 | 21,760,000 | 6.1 | 1,325,851 | ||||||||||||||||
| Extra Space Panorama City Panorama City, CA | 1987 / NAP | 77,395 | 900 | 92.7 | 12,980,000 | 5.7 | 21,550,000 | 6.0 | 1,182,697 | ||||||||||||||||
| Extra Space Norwalk Norwalk, CA | 1977 / NAP | 79,529 | 893 | 92.8 | 12,885,000 | 5.6 | 22,150,000 | 6.2 | 1,174,461 | ||||||||||||||||
| Extra Space Miami East Miami, FL | 1987 / 2009 | 80,390 | 831 | 91.8 | 12,126,000 | 5.3 | 19,600,000 | 5.5 | 1,111,182 | ||||||||||||||||
| Extra Space Miami West Miami, FL | 1987 / 2009 | 75,564 | 684 | 95.7 | 12,105,000 | 5.3 | 19,000,000 | 5.3 | 1,107,307 | ||||||||||||||||
| Extra Space Palo Alto East Palo Alto, CA | 1989 / NAP | 45,836 | 592 | 92.1 | 10,862,000 | 4.7 | 18,230,000 | 5.1 | 978,172 | ||||||||||||||||
| Extra Space Covina Covina, CA | 1973 / NAP | 74,537 | 729 | 91.9 | 10,639,000 | 4.6 | 17,450,000 | 4.9 | 966,181 | ||||||||||||||||
| Extra Space Gaithersburg Gaithersburg, MD | 1988 / NAP | 74,341 | 642 | 91.5 | 9,687,000 | 4.2 | 14,350,000 | 4.0 | 875,499 | ||||||||||||||||
| Extra Space Philadelphia Philadelphia, PA | 1970, 1988 / NAP | 68,425 | 593 | 93.9 | 9,310,000 | 4.1 | 13,860,000 | 3.9 | 842,713 | ||||||||||||||||
| Extra Space Westminster Westminster, CA | 1988 / NAP | 65,997 | 685 | 94.7 | 9,150,000 | 4.0 | 15,680,000 | 4.4 | 840,721 | ||||||||||||||||
| Extra Space Newark Newark, DE | 1988 / NAP | 64,300 | 519 | 91.1 | 8,193,000 | 3.6 | 12,590,000 | 3.5 | 738,819 | ||||||||||||||||
| Extra Space Essex Essex, MD | 1991 / NAP | 60,425 | 522 | 93.5 | 7,444,000 | 3.3 | 11,340,000 | 3.2 | 679,151 | ||||||||||||||||
| Extra Space New Bedford New Bedford, MA | 1989, 2003 / NAP | 65,350 | 535 | 93.6 | 7,215,000 | 3.2 | 10,300,000 | 2.9 | 654,243 | ||||||||||||||||
| Extra Space Birmingham Birmingham, AL | 1988 / NAP | 73,366 | 604 | 94.8 | 7,195,000 | 3.1 | 9,250,000 | 2.6 | 655,749 | ||||||||||||||||
| Extra Space Haverhill Haverhill, MA | 1989 / NAP | 53,490 | 553 | 86.6 | 6,895,000 | 3.0 | 11,680,000 | 3.3 | 616,849 | ||||||||||||||||
| Extra Space Shrewsbury Shrewsbury, MA | 1982 / NAP | 65,300 | 417 | 92.1 | 6,483,000 | 2.8 | 9,020,000 | 2.5 | 585,168 | ||||||||||||||||
| Extra Space Dallas Dallas, TX | 1973 / NAP | 47,472 | 478 | 90.0 | 5,340,000 | 2.3 | 7,650,000 | 2.1 | 480,768 | ||||||||||||||||
| Extra Space Enfield Enfield, CT | 1982 / NAP | 65,650 | 511 | 93.0 | 4,911,000 | 2.1 | 7,680,000 | 2.1 | 427,883 | ||||||||||||||||
| Extra Space San Diego Miramar San Diego, CA | 1986 / NAP | 36,384 | 455 | 92.3 | 4,819,000 | 2.1 | 7,050,000 | 2.0 | 432,728 | ||||||||||||||||
| Extra Space Shawnee Shawnee, KS | 1987 / NAP | 56,240 | 472 | 95.1 | 3,570,000 | 1.6 | 5,670,000 | 1.6 | 330,987 | ||||||||||||||||
| Extra Space Overland Park Overland Park, KS | 1990 / NAP | 46,890 | 346 | 94.3 | 3,570,000 | 1.6 | 5,620,000 | 1.6 | 324,395 | ||||||||||||||||
| Extra Space Tucson Tucson, AZ | 1984 / NAP | 47,250 | 425 | 91.3 | 3,095,000 | 1.4 | 4,270,000 | 1.2 | 275,296 | ||||||||||||||||
| Total / Wtd. Avg. | 1,614,702 | 15,768 | 92.2 | % | $229,000,000 | 100.0 | % | $357,990,000 | 100.0 | % | $20,714,398 | ||||||||||||||
| (1) | The Appraised Value of $394,160,000 represents the “As Is Portfolio” combined appraised value based on individual valuations dated between November 25, 2017 and December 4, 2017, plus a $36,170,000 portfolio premium. The sum of the individual “as-is” appraisal values of the Extra Space - TIAA Self Storage Portfolio Properties is $357,990,000. |
The depositor has filed a registration statement (including a prospectus) with the Securities and Exchange Commission (“SEC”) (SEC File No. 333-207132) for the offering to which this communication relates. Before you invest, you should read the prospectus in the registration statement and other documents the depositor has filed with the SEC for more complete information about the depositor, the issuing entity and this offering. You may get these documents for free by visiting EDGAR on the SEC website at www.sec.gov. Alternatively, the depositor or Citigroup Global Markets Inc., Morgan Stanley & Co. LLC, Merrill Lynch, Pierce, Fenner & Smith Incorporated, Drexel Hamilton, LLC, The Williams Capital Group, L.P. or any other underwriter or dealer participating in this offering will arrange to send you the prospectus if you request it by calling toll-free 1-800-831-9146.
36
| LOAN #1: extra space - tiaa self storage portfolio |
The following table presents certain information relating to the type of units offered at theExtra Space - TIAA Self Storage Portfolio Properties:
Unit Summary
| Property Name | Total | % of GLA | Total Number | Number | Number of Climate Controlled Units | % of | ||||||||||||
| Extra Space Washington | 104,382 | 6.5 | % | 1,689 | 0 | 121 | 7.2 | % | ||||||||||
| Extra Space San Jose | 66,854 | 4.1 | 791 | 4 | 0 | 0.0 | % | |||||||||||
| Extra Space San Diego | 119,335 | 7.4 | 877 | 21 | 0 | 0.0 | % | |||||||||||
| Extra Space Panorama City | 77,395 | 4.8 | 896 | 4 | 0 | 0.0 | % | |||||||||||
| Extra Space Norwalk | 79,529 | 4.9 | 871 | 22 | 0 | 0.0 | % | |||||||||||
| Extra Space Miami East | 80,390 | 5.0 | 789 | 42 | 193 | 24.5 | % | |||||||||||
| Extra Space Miami West | 75,564 | 4.7 | 653 | 31 | 214 | 32.8 | % | |||||||||||
| Extra Space Palo Alto | 45,836 | 2.8 | 592 | 0 | 0 | 0.0 | % | |||||||||||
| Extra Space Covina | 74,537 | 4.6 | 726 | 3 | 0 | 0.0 | % | |||||||||||
| Extra Space Gaithersburg | 74,341 | 4.6 | 622 | 20 | 0 | 0.0 | % | |||||||||||
| Extra Space Philadelphia | 68,425 | 4.2 | 586 | 7 | 137 | 23.4 | % | |||||||||||
| Extra Space Westminster | 65,997 | 4.1 | 681 | 4 | 0 | 0.0 | % | |||||||||||
| Extra Space Newark | 64,300 | 4.0 | 476 | 43 | 96 | 20.2 | % | |||||||||||
| Extra Space Essex | 60,425 | 3.7 | 502 | 20 | 155 | 30.9 | % | |||||||||||
| Extra Space New Bedford | 65,350 | 4.0 | 514 | 21 | 0 | 0.0 | % | |||||||||||
| Extra Space Birmingham | 73,366 | 4.5 | 592 | 12 | 13 | 2.2 | % | |||||||||||
| Extra Space Haverhill | 53,490 | 3.3 | 553 | 0 | 119 | 21.5 | % | |||||||||||
| Extra Space Shrewsbury | 65,300 | 4.0 | 414 | 3 | 0 | 0.0 | % | |||||||||||
| Extra Space Dallas | 47,472 | 2.9 | 474 | 4 | 0 | 0.0 | % | |||||||||||
| Extra Space Enfield | 65,650 | 4.1 | 498 | 13 | 0 | 0.0 | % | |||||||||||
| Extra Space San Diego Miramar | 36,384 | 2.3 | 455 | 0 | 0 | 0.0 | % | |||||||||||
| Extra Space Shawnee | 56,240 | 3.5 | 472 | 0 | 0 | 0.0 | % | |||||||||||
| Extra Space Overland Park | 46,890 | 2.9 | 317 | 29 | 52 | 16.4 | % | |||||||||||
Extra Space Tucson | 47,250 | 2.9 | 425 | 0 | 0 | 0.0 | % | |||||||||||
| Total / Wtd. Avg. | 1,614,702 | 100.0 | % | 15,465 | 303 | 1,100 | 7.1 | % | ||||||||||
The following table presents certain information relating to historical leasing at the Extra Space - TIAA Self Storage Portfolio Properties:
Historical Leased %(1)
Property Name | 2010 | 2011 | 2012 | 2013 | 2014 | 2015 | 2016 | 2017 | Average |
| Extra Space Washington | 94.0% | 91.9% | 91.4% | 92.4% | 92.5% | 91.4% | 91.6% | 92.1% | 92.2% |
| Extra Space San Jose | 89.5% | 88.9% | 92.0% | 92.8% | 92.9% | 95.7% | 94.3% | 89.9% | 92.0% |
| Extra Space San Diego | 88.9% | 88.8% | 86.8% | 87.1% | 89.9% | 93.9% | 95.9% | 88.1% | 89.9% |
| Extra Space Panorama City | 85.3% | 87.8% | 92.2% | 93.6% | 93.7% | 94.8% | 89.8% | 92.7% | 91.2% |
| Extra Space Norwalk | 79.4% | 83.0% | 84.6% | 88.8% | 88.2% | 92.9% | 96.6% | 92.8% | 88.3% |
| Extra Space Miami East | 85.4% | 81.2% | 88.7% | 91.3% | 92.1% | 93.7% | 92.9% | 91.8% | 89.6% |
| Extra Space Miami West | 85.7% | 88.0% | 86.5% | 89.6% | 88.7% | 91.5% | 92.4% | 95.7% | 89.8% |
| Extra Space Palo Alto | 80.0% | 86.2% | 92.7% | 92.3% | 93.7% | 95.2% | 96.3% | 92.1% | 91.1% |
| Extra Space Covina | 85.5% | 85.5% | 88.7% | 90.4% | 91.8% | 93.7% | 95.1% | 91.9% | 90.3% |
| Extra Space Gaithersburg | 85.4% | 91.2% | 92.5% | 92.8% | 90.7% | 92.6% | 93.3% | 91.5% | 91.3% |
| Extra Space Philadelphia | 89.7% | 90.7% | 89.9% | 88.2% | 87.0% | 87.0% | 85.8% | 93.9% | 89.0% |
| Extra Space Westminster | 79.8% | 84.1% | 88.9% | 91.8% | 90.4% | 93.4% | 95.3% | 94.7% | 89.8% |
| Extra Space Newark | 90.7% | 89.3% | 92.4% | 91.8% | 91.9% | 87.5% | 84.6% | 91.1% | 89.9% |
| Extra Space Essex | 87.1% | 89.3% | 91.0% | 94.3% | 92.9% | 93.7% | 93.6% | 93.5% | 91.9% |
| Extra Space New Bedford | 78.0% | 80.4% | 75.2% | 87.3% | 91.7% | 92.4% | 95.9% | 93.6% | 86.8% |
| Extra Space Birmingham | 83.4% | 83.3% | 89.1% | 89.7% | 90.8% | 93.8% | 92.9% | 94.8% | 89.7% |
| Extra Space Haverhill | 87.4% | 90.0% | 90.9% | 94.2% | 92.2% | 91.6% | 92.1% | 86.6% | 90.6% |
| Extra Space Shrewsbury | 85.3% | 88.0% | 90.9% | 91.6% | 93.0% | 95.1% | 92.5% | 92.1% | 91.1% |
| Extra Space Dallas | 85.2% | 85.1% | 91.3% | 90.7% | 91.1% | 94.9% | 90.7% | 90.0% | 89.9% |
| Extra Space Enfield | 87.7% | 92.5% | 89.1% | 92.4% | 91.9% | 91.3% | 94.6% | 93.0% | 91.6% |
| Extra Space San Diego Miramar | 89.1% | 89.7% | 88.5% | 90.1% | 90.7% | 94.2% | 94.9% | 92.3% | 91.2% |
| Extra Space Shawnee | 79.0% | 78.1% | 81.7% | 80.4% | 89.1% | 91.7% | 92.7% | 95.1% | 86.0% |
| Extra Space Overland Park | 89.9% | 87.1% | 89.7% | 91.5% | 89.1% | 90.5% | 91.5% | 94.3% | 90.5% |
| Extra Space Tucson | 84.2% | 84.5% | 94.4% | 91.0% | 89.5% | 90.4% | 92.2% | 91.3% | 89.7% |
| Total / Wtd. Avg. | 85.9% | 87.0% | 89.0% | 90.6% | 91.1% | 92.6% | 92.9% | 92.2% | 90.2% |
| (1) | As provided by the borrower and which represents occupancy as of December 31 for the indicated year. |
The depositor has filed a registration statement (including a prospectus) with the Securities and Exchange Commission (“SEC”) (SEC File No. 333-207132) for the offering to which this communication relates. Before you invest, you should read the prospectus in the registration statement and other documents the depositor has filed with the SEC for more complete information about the depositor, the issuing entity and this offering. You may get these documents for free by visiting EDGAR on the SEC website at www.sec.gov. Alternatively, the depositor or Citigroup Global Markets Inc., Morgan Stanley & Co. LLC, Merrill Lynch, Pierce, Fenner & Smith Incorporated, Drexel Hamilton, LLC, The Williams Capital Group, L.P. or any other underwriter or dealer participating in this offering will arrange to send you the prospectus if you request it by calling toll-free 1-800-831-9146.
37
| LOAN #1: extra space - tiaa self storage portfolio |
| ■ | Operating History and Underwritten Net Cash Flow. The following table presents certain information relating to the historical operating performance and the Underwritten Net Cash Flow at the Extra Space - TIAA Self Storage Portfolio Properties: |
Cash Flow Analysis
2013 | 2014 | 2015 | 2016 | 2017 | Underwritten | Underwritten | |
| Base Rent | $25,753,599 | $26,338,467 | $27,783,482 | $29,791,412 | $32,117,467 | $32,379,189 | $20.05 |
| Concessions | (1,133,033) | (1,015,854) | (801,904) | (832,704) | (1,001,751) | (980,303) | (0.61) |
| Vacancy & Credit Loss | (2,818,702) | (2,552,762) | (2,677,225) | (3,084,078) | (4,104,590) | (3,946,418) | (2.44) |
| Other Income(1) | 1,845,128 | 1,854,466 | 1,861,602 | 1,894,673 | 1,980,586 | 1,965,702 | 1.22 |
| Effective Gross Income | $23,646,992 | $24,624,317 | $26,165,955 | $27,769,303 | $28,991,712 | $29,418,170 | $18.22 |
| Real Estate Taxes | $2,238,633 | $2,195,330 | $2,244,766 | $2,319,185 | $2,410,172 | $2,822,137 | $1.75 |
| Insurance | 443,540 | 377,116 | 343,145 | 317,428 | 234,729 | 232,079 | 0.14 |
| Management Fee | 1,189,888 | 1,235,841 | 1,311,832 | 1,397,277 | 1,450,390 | 882,543 | 0.55 |
| Other Operating Expenses | 4,344,712 | 4,571,945 | 4,683,900 | 4,557,127 | 4,524,804 | 4,524,804 | 2.80 |
| Total Operating Expenses | $8,216,773 | $8,380,232 | $8,583,643 | $8,591,017 | $8,620,095 | $8,461,563 | $5.24 |
| Net Operating Income | $15,430,219 | $16,244,085 | $17,582,312 | $19,178,286 | $20,371,617 | $20,956,607 | $12.98 |
| Replacement Reserves | 0 | 0 | 0 | 0 | 0 | 242,209 | 0.15 |
| Net Cash Flow | $15,430,219 | $16,244,085 | $17,582,312 | $19,178,286 | $20,371,617 | $20,714,398 | $12.83 |
| Occupancy | 90.6% | 91.1% | 92.6% | 92.9% | 92.2% | 92.2%(2) | |
| NOI Debt Yield(3) | 6.7% | 7.1% | 7.7% | 8.4% | 8.9% | 9.2% | |
| NCF DSCR(3) | 1.47x | 1.54x | 1.67x | 1.82x | 1.94x | 1.97x |
| (1) | Other Income includes administrative fees, late fees, merchandise sales, parking income, and cell tower and billboard commercial leases. |
| (2) | The underwritten economic vacancy is 12.0%. As of December 31, 2017, the Extra Space – TIAA Self Storage Portfolio Properties were 92.2% physically occupied. |
| (3) | Calculated based on the aggregate outstanding principal balance as of the Cut-off Date of the Extra Space - TIAA Self Storage Portfolio Loan Combination. |
| ■ | Appraisal.As of the appraisal valuation dates ranging from November 25, 2017 to December 4, 2017, the Extra Space - TIAA Self Storage Portfolio Properties had an aggregate “as-is” appraised value of $357,990,000. The “As Is Portfolio” combined appraisal value for the Extra Space - TIAA Self Storage Portfolio Properties is $394,160,000 which includes a portfolio premium of $36,170,000. |
| ■ | Environmental Matters.According to the Phase I environmental reports dated between November 7, 2017 and January 2, 2018, there were no recognized environmental conditions or recommendations for further action at the Extra Space - TIAA Self Storage Portfolio Properties. |
| ■ | Market Overview and Competition. The Extra Space - TIAA Self Storage Portfolio Properties are geographically diverse, located across 22 cities in 11 states and Washington, D.C. The largest concentration is located in California (eight properties, 35.0% of SF, 39.9% of UW NCF), Massachusetts (three properties, 11.4% of SF, 9.0% of UW NCF), Florida (two properties, 9.7% of SF, 10.7% of UW NCF), and Maryland (two properties, 8.3% of SF, 7.5% of UW NCF), with the remaining properties (35.5% of SF, 33.0% of UW NCF) located in seven states and Washington, D.C. |
The following table presents the geographical distribution of the Extra Space - TIAA Self Storage Portfolio Properties:
Market Summary
State/Jurisdiction | Property | Allocated | % of | Total SF | % of SF | Total Units | Occupancy | UW NCF | % of UW NCF | ||||||||||||||
| California | 8 | $91,020,000 | 39.7 | % | 565,867 | 35.0 | % | 5,947 | 91.5 | % | $8,255,915 | 39.9 | % | ||||||||||
| Massachusetts | 3 | 20,593,000 | 9.0 | 184,140 | 11.4 | 1,505 | 91.0 | % | 1,856,260 | 9.0 | |||||||||||||
| Florida | 2 | 24,231,000 | 10.6 | 155,954 | 9.7 | 1,515 | 93.7 | % | 2,218,489 | 10.7 | |||||||||||||
| Maryland | 2 | 17,131,000 | 7.5 | 134,766 | 8.3 | 1,164 | 92.4 | % | 1,554,650 | 7.5 | |||||||||||||
| Washington, D.C. | 1 | 30,841,000 | 13.5 | 104,382 | 6.5 | 1,689 | 92.1 | % | 2,752,474 | 13.3 | |||||||||||||
| Kansas | 2 | 7,140,000 | 3.1 | 103,130 | 6.4 | 818 | 94.7 | % | 655,382 | 3.2 | |||||||||||||
| Alabama | 1 | 7,195,000 | 3.1 | 73,366 | 4.5 | 604 | 94.8 | % | 655,749 | 3.2 | |||||||||||||
| Pennsylvania | 1 | 9,310,000 | 4.1 | 68,425 | 4.2 | 593 | 93.9 | % | 842,713 | 4.1 | |||||||||||||
| Connecticut | 1 | 4,911,000 | 2.1 | 65,650 | 4.1 | 511 | 93.0 | % | 427,883 | 2.1 | |||||||||||||
| Delaware | 1 | 8,193,000 | 3.6 | 64,300 | 4.0 | 519 | 91.1 | % | 738,819 | 3.6 | |||||||||||||
| Texas | 1 | 5,340,000 | 2.3 | 47,472 | 2.9 | 478 | 90.0 | % | 480,768 | 2.3 | |||||||||||||
| Arizona | 1 | 3,095,000 | 1.4 | 47,250 | 2.9 | 425 | 91.3 | % | 275,296 | 1.3 | |||||||||||||
| Total / Wtd. Avg. | 24 | $229,000,000 | 100.0 | % | 1,614,702 | 100.0 | % | 15,768 | 92.2 | % | $20,714,398 | 100.0 | % | ||||||||||
The depositor has filed a registration statement (including a prospectus) with the Securities and Exchange Commission (“SEC”) (SEC File No. 333-207132) for the offering to which this communication relates. Before you invest, you should read the prospectus in the registration statement and other documents the depositor has filed with the SEC for more complete information about the depositor, the issuing entity and this offering. You may get these documents for free by visiting EDGAR on the SEC website at www.sec.gov. Alternatively, the depositor or Citigroup Global Markets Inc., Morgan Stanley & Co. LLC, Merrill Lynch, Pierce, Fenner & Smith Incorporated, Drexel Hamilton, LLC, The Williams Capital Group, L.P. or any other underwriter or dealer participating in this offering will arrange to send you the prospectus if you request it by calling toll-free 1-800-831-9146.
38
| LOAN #1: extra space - tiaa self storage portfolio |
The following table presents the local demographics data at the Extra Space - TIAA Self Storage Portfolio Properties:
Local Demographics Summary(1)
Property Name | City | State/Jurisdiction | 2017 Population (within 1-mi. / 3-mi. / 5-mi. Radius) | 2017 Median Household Income (within 1-mi. / 3-mi. / 5-mi. Radius) |
| Extra Space Washington | Washington | D.C. | 103,098 / 396,332 / 776,753 | $91,607 / $86,799 / $85,537 |
| Extra Space San Jose | San Jose | CA | 29,673 / 250,116 / 604,289 | $73,531 / $85,535 / $90,169 |
| Extra Space San Diego | San Diego | CA | 11,296 / 89,230 / 231,408 | $82,606 / $90,172 / $95,726 |
| Extra Space Panorama City | Panorama City | CA | 70,965 / 337,834 / 757,901 | $36,615 / $47,468 / $52,390 |
| Extra Space Norwalk | Norwalk | CA | 29,213 / 257,233 / 682,041 | $61,064 / $59,950 / $59,825 |
| Extra Space Miami East | Miami | FL | 32,678 / 217,329 / 421,919 | $52,240 / $58,326 / $59,634 |
| Extra Space Miami West | Miami | FL | 18,416 / 209,400 / 486,980 | $57,632 / $43,368 / $44,671 |
| Extra Space Palo Alto | East Palo Alto | CA | 32,002 / 120,107 / 241,797 | $72,803 / $101,384 / $98,992 |
| Extra Space Covina | Covina | CA | 25,705 / 215,002 / 491,057 | $73,888 / $64,913 / $64,265 |
| Extra Space Gaithersburg | Gaithersburg | MD | 14,199 / 109,881 / 223,144 | $94,923 / $79,610 / $87,213 |
| Extra Space Philadelphia | Philadelphia | PA | 23,889 / 172,998 / 476,472 | $45,365 / $52,400 / $51,878 |
| Extra Space Westminster | Westminster | CA | 24,050 / 200,548 / 614,766 | $64,768 / $65,221 / $65,395 |
| Extra Space Newark | Newark | DE | 9,435 / 71,666 / 194,717 | $56,169 / $61,267 / $63,727 |
| Extra Space Essex | Essex | MD | 7,749 / 101,747 / 286,150 | $61,708 / $57,325 / $57,523 |
| Extra Space New Bedford | New Bedford | MA | 8,150 / 92,571 / 201,358 | $63,485 / $46,772 / $55,431 |
| Extra Space Birmingham | Birmingham | AL | 8,820 / 65,688 / 163,572 | $63,978 / $65,543 / $53,616 |
| Extra Space Haverhill | Haverhill | MA | 6,734 / 65,267 / 176,022 | $67,010 / $64,825 / $59,859 |
| Extra Space Shrewsbury | Shrewsbury | MA | 8,242 / 202,685 / 381,663 | $30,475 / $57,152 / $66,557 |
| Extra Space Dallas | Dallas | TX | 10,819 / 122,018 / 341,303 | $47,347 / $41,440 / $48,008 |
| Extra Space Enfield | Enfield | CT | 4,379 / 35,521 / 77,407 | $63,609 / $70,516 / $75,869 |
| Extra Space San Diego Miramar | San Diego | CA | 9,630 / 80,429 / 226,274 | $74,425 / $88,667 / $93,486 |
| Extra Space Shawnee | Shawnee | KS | 10,793 / 71,788 / 171,869 | $70,625 / $66,051 / $60,493 |
| Extra Space Overland Park | Overland Park | KS | 13,979 / 104,377 / 241,367 | $49,313 / $58,588 / $65,127 |
| Extra Space Tucson | Tucson | AZ | 15,994 / 122,452 / 201,345 | $39,867 / $47,082 / $47,238 |
| (1) | Source: Appraisals. |
The following table presents certain information relating to certain self-storage lease comparables provided in the appraisals for the Extra Space - TIAA Self Storage Portfolio Properties:
Competitive Set Summary(1)
Property Name | Metropolitan Statistical Area | Occupancy | Competitive | Average | Competitive |
| Extra Space Washington | Washington-Arlington-Alexandria, DC-VA-MD-WV | 92.1% | 81.5% | $188 | $181 |
| Extra Space San Jose | San Jose-Sunnyvale-Santa Clara, CA | 89.9% | 92.9% | $199 | $204 |
| Extra Space San Diego | San Diego-Carlsbad, CA | 88.1% | 94.4% | $159 | $170 |
| Extra Space Panorama City | Los Angeles-Long Beach-Santa Ana, CA | 92.7% | 94.8% | $172 | $172 |
| Extra Space Norwalk | Los Angeles-Long Beach-Santa Ana, CA | 92.8% | 93.4% | $159 | $160 |
| Extra Space Miami East | Miami-Fort Lauderdale-Pompano Beach, FL | 91.8% | 94.9% | $157 | $158 |
| Extra Space Miami West | Miami-Fort Lauderdale-Pompano Beach, FL | 95.7% | 91.5% | $181 | $182 |
| Extra Space Palo Alto | San Francisco-Oakland-Hayward, CA | 92.1% | 93.3% | $198 | $198 |
| Extra Space Covina | Los Angeles-Long Beach-Santa Ana, CA | 91.9% | 94.1% | $164 | $169 |
| Extra Space Gaithersburg | Washington-Arlington-Alexandria, DC-VA-MD-WV | 91.5% | 91.5% | $144 | $156 |
| Extra Space Philadelphia | Philadelphia-Camden-Wilmington, PA-NJ-DE | 93.9% | 91.4% | $162 | $167 |
| Extra Space Westminster | Los Angeles-Long Beach-Anaheim, CA | 94.7% | 94.0% | $155 | $160 |
| Extra Space Newark | Philadelphia-Camden-Wilmington, PA-NJ-DE | 91.1% | 88.3% | $182 | $183 |
| Extra Space Essex | Baltimore-Towson, MD | 93.5% | 90.4% | $149 | $152 |
| Extra Space New Bedford | Providence-Warwick, RI-MA | 93.6% | 95.5% | $145 | $156 |
| Extra Space Birmingham | Birmingham-Hoover, AL | 94.8% | 93.6% | $113 | $122 |
| Extra Space Haverhill | Boston-Cambridge-Newton, MA-NH | 86.6% | 91.4% | $150 | $154 |
| Extra Space Shrewsbury | Worcester, MA-CT | 92.1% | 91.2% | $161 | $184 |
| Extra Space Dallas | Dallas-Fort Worth-Arlington, TX | 90.0% | 92.2% | $120 | $126 |
| Extra Space Enfield | Hartford-West Hartford-East Hartford, CT | 93.0% | 92.8% | $119 | $124 |
| Extra Space San Diego Miramar | San Diego-Carlsbad, CA | 92.3% | 94.8% | $116 | $121 |
| Extra Space Shawnee | Kansas City, MO-KS | 95.1% | 94.2% | $106 | $112 |
| Extra Space Overland Park | Kansas City, MO-KS | 94.3% | 92.7% | $133 | $134 |
| Extra Space Tucson | Tucson, AZ | 91.3% | 89.5% | $90 | $100 |
| Total / Wtd. Avg. | 92.2% | 92.1% | $157 | $161 |
| (1) | Source: Appraisals. |
The depositor has filed a registration statement (including a prospectus) with the Securities and Exchange Commission (“SEC”) (SEC File No. 333-207132) for the offering to which this communication relates. Before you invest, you should read the prospectus in the registration statement and other documents the depositor has filed with the SEC for more complete information about the depositor, the issuing entity and this offering. You may get these documents for free by visiting EDGAR on the SEC website at www.sec.gov. Alternatively, the depositor or Citigroup Global Markets Inc., Morgan Stanley & Co. LLC, Merrill Lynch, Pierce, Fenner & Smith Incorporated, Drexel Hamilton, LLC, The Williams Capital Group, L.P. or any other underwriter or dealer participating in this offering will arrange to send you the prospectus if you request it by calling toll-free 1-800-831-9146.
39
| LOAN #1: extra space - tiaa self storage portfolio |
| ■ | The Borrower. The borrower is Storage Portfolio I LLC, a single-purpose Delaware limited liability company. Legal counsel to the borrower delivered a non-consolidation opinion in connection with the origination of the Extra Space - TIAA Self Storage Portfolio Loan Combination. The borrower is approximately 66.0% indirectly owned by Teachers Insurance and Annuity Association of America (“TIAA”) for the benefit of The Separate Real Estate Account (“TIAA Real Estate”) and approximately 34.0% indirectly owned by Extra Space Storage Inc. (“Extra Space Storage”). The borrower sponsors are Extra Space Storage and TH Real Estate. TH Real Estate is an affiliate of Nuveen, LLC, an investment management arm of TIAA. As of September 30, 2017, TH Real Estate had approximately $107 billion of assets under management globally. |
The non-recourse carveout guarantor for the Extra Space - TIAA Self Storage Portfolio Loan Combination is Extra Space Storage. If a buy/sell event occurs or is anticipated to occur such that TIAA Real Estate becomes the sole indirect owner of the borrower, Teachers REA, LLC has been approved as a replacement guarantor so long as at the time of such replacement it satisfies a minimum net worth of $5 billion and minimum liquidity of $10 million and is acceptable to the lender based on the lender’s underwriting standards and there has been no material adverse change in its financial conditions or status since the origination of the Extra Space - TIAA Self Storage Portfolio Loan Combination.
| ■ | Escrows.On each due date, the borrower is required to fund one-twelfth of the taxes and one-twelfth of the property insurance premiums that the lender estimates will be payable over the then-succeeding 12-month period, notwithstanding, so long as Extra Space Storage Inc. is the nonrecourse carve-out guarantor, the borrower will not be required to make such monthly deposits provided (x) no event of default or Cash Sweep Period (as defined below) has occurred and is continuing, (y) borrower provides to lender evidence of direct payment of taxes and insurance premiums, and (z) as it relates to the insurance requirements, the Extra Space - TIAA Self Storage Portfolio Properties are covered by a blanket policy. Notwithstanding, the borrower is required to escrow for flood insurance coverage as required under the National Flood Insurance Program. |
| ■ | Lockbox and Cash Management. The Extra Space - TIAA Self Storage Portfolio Loan Combination documents provide for a springing lockbox and springing cash management, in each case upon the occurrence of a Cash Sweep Period (as defined below). Upon the occurrence of a Cash Sweep Period, the borrower is required to establish (i) a lockbox account, into which, during a Cash Sweep Period, all rents are required to be deposited and (ii) a lender-controlled cash management account, into which, during a Cash Sweep Period, all deposits in the lockbox account are required to be transferred on each business day. |
Provided no event of default is continuing, funds in the cash management account are required to be applied to payment of de minimis revenue (tenant insurance premiums, sales tax and packing supply cash receipts) to the borrower, to payment of debt service, operating expenses and extraordinary expenses, and to funding of required reserves, with the remainder being deposited to an excess cash flow reserveto be held as additional security for theExtra Space - TIAA Self Storage Portfolio Loan Combination until the discontinuance of the Cash Sweep Period at which time the excess cash will be swept to the borrower’s operating account. Notwithstanding, should a Cash Sweep Period occur more than once during the Extra Space - TIAA Self Storage Portfolio Loan Combination loan term, the lender will continue to hold any excess cash for the remainder of the loan term.
A “Cash Sweep Period” will commence upon the earlier of (i) an event of default or (ii) the debt service coverage ratio being less than 1.10x for 12 consecutive months and will continue until; in the case of clause (i), the cure of such event of default, and in the case of clause (ii), the debt service coverage ratio being equal to or greater than 1.25x for the immediately preceding six consecutive calendar months. Notwithstanding the foregoing, a Cash Sweep Period will not be deemed to expire in the event that a Cash Sweep Period then exists for any other reason.
| ■ | Property Management.The Extra Space - TIAA Self Storage Portfolio Properties are currently managed by Extra Space Management, Inc., an affiliate of the borrower. Extra Space Storage Inc. (NYSE: EXR) is a real estate investment trust with over 1,400 self-storage locations across 38 states, Washington, D.C. and Puerto Rico as of June 30, 2017. |
| ■ | Mezzanine or Secured Subordinate Indebtedness. Not permitted. |
| ■ | Release of Collateral.After the Release Date (as defined below) and prior to September 1, 2027, provided no event of default has occurred and is continuing, the borrower may obtain a release of any of the individual properties comprising theExtra Space - TIAA Self Storage Portfolio Propertiesin connection with a sale to a third party upon defeasance of an amount equal to 125% of the allocated loan amount of such individual property; provided that the |
The depositor has filed a registration statement (including a prospectus) with the Securities and Exchange Commission (“SEC”) (SEC File No. 333-207132) for the offering to which this communication relates. Before you invest, you should read the prospectus in the registration statement and other documents the depositor has filed with the SEC for more complete information about the depositor, the issuing entity and this offering. You may get these documents for free by visiting EDGAR on the SEC website at www.sec.gov. Alternatively, the depositor or Citigroup Global Markets Inc., Morgan Stanley & Co. LLC, Merrill Lynch, Pierce, Fenner & Smith Incorporated, Drexel Hamilton, LLC, The Williams Capital Group, L.P. or any other underwriter or dealer participating in this offering will arrange to send you the prospectus if you request it by calling toll-free 1-800-831-9146.
40
| LOAN #1: extra space - tiaa self storage portfolio |
following conditions, among others, are satisfied: (i) after giving effect to the release, the debt yield with respect to the remaining properties is not less than the greater of (a) 9.08% and (b) the debt yield of all of the properties immediately prior to the related release; and (ii) the partial defeasance is permitted under REMIC requirements (and the lender receives an opinion of counsel that the partial defeasance will not cause a REMIC trust formed pursuant to a securitization of any portion of theExtra Space - TIAA Self Storage PortfolioLoan Combination to fail to maintain its status as a REMIC).
“Release Date” means the earlier to occur of (i) the fourth anniversary of the closing date of the Extra Space - TIAA Self Storage Portfolio Loan Combination and (ii) the date that is two years from the “startup day” of the REMIC trust established in connection with the last securitization involving any portion of the Extra Space - TIAA Self Storage Portfolio Loan Combination.
| ■ | Terrorism Insurance. The borrower is required to maintain insurance coverage for perils and acts of terrorism in an amount equal to the full replacement cost of the Extra Space - TIAA Self Storage Portfolio Properties (plus 18 months of rental loss and/or business interruption coverage plus an additional period of indemnity covering (i) the 12 months following restoration or (ii) the period of time until such income returns to the same level it was at prior to the loss, whichever occurs first). |
| ■ | Earthquake Insurance. The borrower is required to maintain coverage for earthquake insurance, if any individual property is located in an area with a high degree of seismic risk, as determined by the lender which includes the Extra Space Panorama City individual property, in amounts and in form and substance satisfactory to the lender and with a deductible not to exceed $100,000 with respect to any individual property located in California. |
The depositor has filed a registration statement (including a prospectus) with the Securities and Exchange Commission (“SEC”) (SEC File No. 333-207132) for the offering to which this communication relates. Before you invest, you should read the prospectus in the registration statement and other documents the depositor has filed with the SEC for more complete information about the depositor, the issuing entity and this offering. You may get these documents for free by visiting EDGAR on the SEC website at www.sec.gov. Alternatively, the depositor or Citigroup Global Markets Inc., Morgan Stanley & Co. LLC, Merrill Lynch, Pierce, Fenner & Smith Incorporated, Drexel Hamilton, LLC, The Williams Capital Group, L.P. or any other underwriter or dealer participating in this offering will arrange to send you the prospectus if you request it by calling toll-free 1-800-831-9146.
41
| LOAN #2: PARK PLACE EAST AND PARK PLACE WEST |
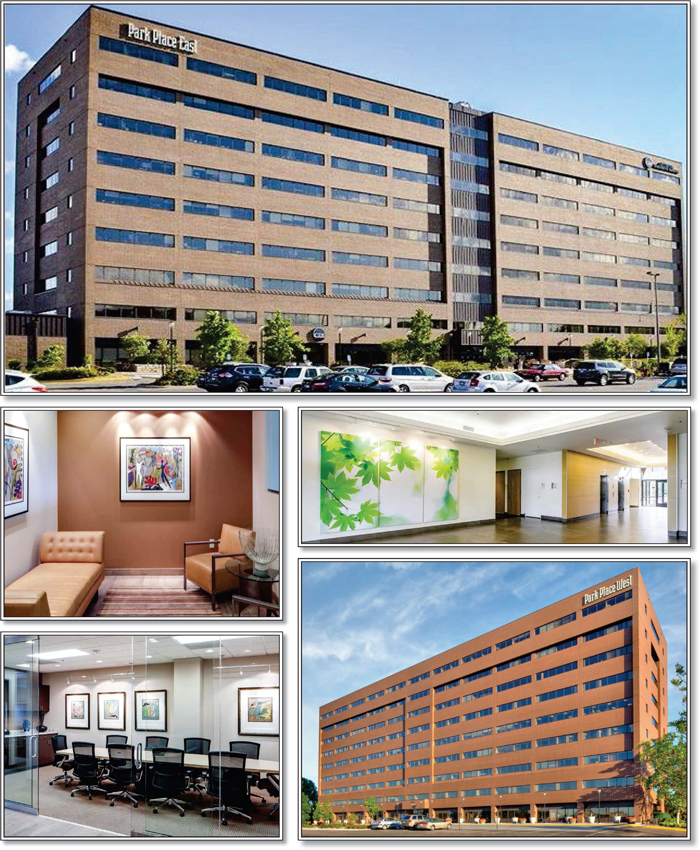
The depositor has filed a registration statement (including a prospectus) with the Securities and Exchange Commission (“SEC”) (SEC File No. 333-207132) for the offering to which this communication relates. Before you invest, you should read the prospectus in the registration statement and other documents the depositor has filed with the SEC for more complete information about the depositor, the issuing entity and this offering. You may get these documents for free by visiting EDGAR on the SEC website at www.sec.gov. Alternatively, the depositor or Citigroup Global Markets Inc., Morgan Stanley & Co. LLC, Merrill Lynch, Pierce, Fenner & Smith Incorporated, Drexel Hamilton, LLC, The Williams Capital Group, L.P. or any other underwriter or dealer participating in this offering will arrange to send you the prospectus if you request it by calling toll-free 1-800-831-9146.
42
| LOAN #2: PARK PLACE EAST AND PARK PLACE WEST |
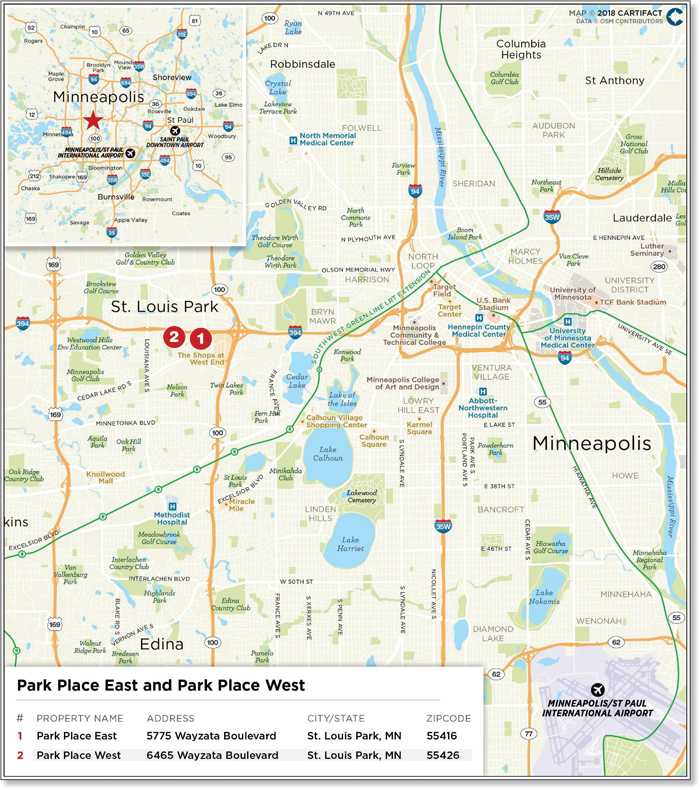
The depositor has filed a registration statement (including a prospectus) with the Securities and Exchange Commission (“SEC”) (SEC File No. 333-207132) for the offering to which this communication relates. Before you invest, you should read the prospectus in the registration statement and other documents the depositor has filed with the SEC for more complete information about the depositor, the issuing entity and this offering. You may get these documents for free by visiting EDGAR on the SEC website at www.sec.gov. Alternatively, the depositor or Citigroup Global Markets Inc., Morgan Stanley & Co. LLC, Merrill Lynch, Pierce, Fenner & Smith Incorporated, Drexel Hamilton, LLC, The Williams Capital Group, L.P. or any other underwriter or dealer participating in this offering will arrange to send you the prospectus if you request it by calling toll-free 1-800-831-9146.
43
| LOAN #2: PARK PLACE EAST AND PARK PLACE WEST |
| Mortgaged Property Information | Mortgage Loan Information | |||||||||||||||
| Number of Mortgaged Properties | 2 | Loan Seller | MSMCH | |||||||||||||
| Location (City/State) | St. Louis Park, Minnesota | Cut-off Date Balance | $54,250,000 | |||||||||||||
| Property Type | Office | Cut-off Date Balance per SF | $136.32 | |||||||||||||
| Size (SF) | 397,968 | Percentage of Initial Pool Balance | 5.1% | |||||||||||||
| Total Occupancy as of 12/7/2017 | 90.5% | Number of Related Mortgage Loans(1) | 2 | |||||||||||||
| Owned Occupancy as of 12/7/2017 | 90.5% | Type of Security | Fee Simple | |||||||||||||
| Year Built / Latest Renovation | 1980, 1983 / 2016 | Mortgage Rate | 4.62000% | |||||||||||||
| Appraised Value | $78,700,000 | Original Term to Maturity (Months) | 120 | |||||||||||||
| Appraisal Date | 11/16/2017 | Original Amortization Term (Months) | 360 | |||||||||||||
| Borrower Sponsors(1) | Mitchel Greenberg, | Original Interest Only Term (Months) | 36 | |||||||||||||
| Keith Jaffee, Peter Holstein and | First Payment Date | 3/1/2018 | ||||||||||||||
| Middleton Partners LLC | Maturity Date | 2/1/2028 | ||||||||||||||
| Property Management | CBRE, Inc. | |||||||||||||||
| Underwritten Revenues | $10,715,768 | |||||||||||||||
| Underwritten Expenses | $5,434,255 | Escrows(2) | ||||||||||||||
| Underwritten Net Operating Income (NOI) | $5,281,513 | Upfront | Monthly | |||||||||||||
| Underwritten Net Cash Flow (NCF) | $4,429,248 | Taxes | $184,172 | $184,172 | ||||||||||||
| Cut-off Date LTV Ratio | 68.9% | Insurance | $0 | $0 | ||||||||||||
| Maturity Date LTV Ratio | 60.5% | Replacement Reserve | $0 | $6,633 | ||||||||||||
| DSCR Based on Underwritten NOI / NCF | 1.58x / 1.32x | TI/LC(3) | $512,195 | $58,037 | ||||||||||||
| Debt Yield Based on Underwritten NOI / NCF | 9.7% / 8.2% | Other(4) | $411,533 | $0 | ||||||||||||
| Sources and Uses | ||||||||||||||||
| Sources | $ | % | Uses | $ | % | |||||||||||
| Loan Amount | $54,250,000 | 100.0% | Loan Payoff | $45,614,363 | 84.1% | |||||||||||
| Principal Equity Distribution | 6,823,456 | 12.6 | ||||||||||||||
| Reserves | 1,107,900 | 2.0 | ||||||||||||||
| Closing Costs | 704,282 | 1.3 | ||||||||||||||
| Total Sources | $54,250,000 | 100.0% | Total Uses | $54,250,000 | 100.0% | |||||||||||
| (1) | The Park Place East and Park Place West Loan borrower sponsors are also the borrower sponsors of the Axcelis Corporate Center Loan Combination. |
| (2) | See“—Escrows” below. |
| (3) | The borrower is not required to make the monthly deposit to the TI/LC reserve if it would cause the amount then on deposit to exceed the TI/LC reserve cap of $2,839,332. |
| (4) | The Upfront Other Reserve includes $292,722 in outstanding tenant improvements and leasing commissions and $118,811 in outstanding free rent. |
| ■ | The Mortgage Loan. The mortgage loan (the“Park Place East and Park Place West Loan”) is evidenced by a note secured by a first mortgage encumbering the borrower’s fee simple interest in a portfolio of two office buildings located in St. Louis Park, Minnesota (the“Park Place East and Park Place West Properties”). The Park Place East and Park Place West Loan was originated by Morgan Stanley Bank, N.A. on January 12, 2018 and represents approximately 5.1% of the Initial Pool Balance. The note evidencing the Park Place East and Park Place West Loan has an outstanding principal balance as of the Cut-off Date of $54,250,000 and an interest rate of 4.62000%per annum. The proceeds of the Park Place East and Park Place West Loan were primarily used to refinance the Park Place East and Park Place West Properties, fund reserves, pay loan origination costs and return equity to the Park Place East and Park Place West Loan borrower sponsors. |
The Park Place East and Park Place West Loan had an initial term of 120 months and has a remaining term of 119 months as of the Cut-off Date. The Park Place East and Park Place West Loan requires monthly payments of interest only through the due date in February 2021, after which it requires monthly payments of interest and principal sufficient to amortize the Park Place East and Park Place West Loan over a 30-year amortization schedule. The scheduled maturity date of the Park Place East and Park Place West Loan is the due date in February 2028. At any time after the second anniversary of the securitization Closing Date, the Park Place East and Park Place West Loan may be defeased with certain direct, non-callable full faith and credit obligations of the United States of America or other obligations which are “government securities” permitted under the Park Place East and Park Place West Loan documents. Voluntary prepayment of the Park Place East and Park Place West Loan is permitted on or after the due date occurring in November 2027 without payment of any prepayment premium.
| ■ | The Mortgaged Property. The Park Place East and Park Place West Properties consist of two, Class B, multi-tenant office buildings totaling 397,968 SF in St. Louis Park, Minnesota, approximately six miles from the Minneapolis central business district. Park Place East (the “Park Place East Property”) consists of a 10-story building, totaling 197,966 SF, situated on 11.44 acres. Park Place West (the “Park Place West Property”) consists of a nine-story building, totaling 200,002 SF, situated on 8.88 acres. The Park Place East and Park Place West Properties are located directly off Interstate 394, within half a mile of each other. The Park Place East and Park Place West Properties feature tenants from a variety of industries including healthcare, consulting, politics, and law. |
The depositor has filed a registration statement (including a prospectus) with the Securities and Exchange Commission (“SEC”) (SEC File No. 333-207132) for the offering to which this communication relates. Before you invest, you should read the prospectus in the registration statement and other documents the depositor has filed with the SEC for more complete information about the depositor, the issuing entity and this offering. You may get these documents for free by visiting EDGAR on the SEC website at www.sec.gov. Alternatively, the depositor or Citigroup Global Markets Inc., Morgan Stanley & Co. LLC, Merrill Lynch, Pierce, Fenner & Smith Incorporated, Drexel Hamilton, LLC, The Williams Capital Group, L.P. or any other underwriter or dealer participating in this offering will arrange to send you the prospectus if you request it by calling toll-free 1-800-831-9146.
44
| LOAN #2: PARK PLACE EAST AND PARK PLACE WEST |
Built in 1980, the Park Place East Property averaged occupancy of 92.1% between 2008 and 2016 and was 93.7% occupied by 26 tenants as of December 7, 2017. Sixteen tenants (82.2% of GLA) have been at the Park Place East Property for more than five years while nine tenants (67.7% of GLA) have been at the Park Place East Property for more than 10 years. The Park Place East Property contains 846 parking spaces that provide a parking ratio of 4.3 spaces per 1,000 SF of GLA.
Built in 1983, the Park Place West Property averaged occupancy of 82.7% between 2008 and 2016 and was 87.3% occupied by 33 tenants as of December 7, 2017. Eighteen tenants (61.7% of GLA) have been at the Park Place West Property for more than five years while eight tenants (23.3% of GLA) have been at the Park Place West Property for more than 10 years. The Park Place West Property contains 500 parking spaces that provide a parking ratio of 2.5 spaces per 1,000 SF of GLA.
The largest tenant, CDI Management Corp. (17.7% of GLA) has been a tenant at the Park Place East Property since 2005 and has renewed and expanded its space multiple times. The second largest tenant, Metropolitan Council (8.6% of GLA), has been a tenant at the Park Place West Property since 2012. The third largest tenant, US Administrative Services (5.5% of GLA), has been a tenant at the Park Place East Property since 2002 and has renewed its lease three times.
According to the borrower sponsors, over $3.3 million has been spent on capital improvements at the Park Place East and Park Place West Properties since December 2016. Notable improvements at the Park Place East Property include building automation upgrades ($305,000), 1st and 5th floor renovations ($310,810) and café renovations ($48,341). Notable improvements at the Park Place West Property include roof replacement ($363,375), 1st, 5th and 8th floor renovations ($521,028) and lower level plus fitness center renovations ($223,187). Additionally, the borrower has indicated that it plans to install monument signs at both properties, at a combined cost of $65,000 in 2018.
The following table presents certain information relating to the Park Place East and Park Place West Properties:
Park Place East and Park Place West Properties Summary
Property Name | Year Built / | Total SF | Occupancy(1) | Appraised | UW NOI | Cut-off Date |
| Park Place East | 1980 / 2016 | 197,966 | 93.7% | $40,400,000 | $2,798,324 | $27,848,793 |
Park Place West | 1983 / 2016 | 200,002 | 87.3% | 38,300,000 | 2,483,190 | 26,401,207 |
| Total / Wtd. Avg. | 397,968 | 90.5% | $78,700,000 | $5,281,513 | $54,250,000 |
| (1) | Occupancy is as of December 7, 2017. |
| (2) | Appraised Values are as of November 16, 2017. |
The depositor has filed a registration statement (including a prospectus) with the Securities and Exchange Commission (“SEC”) (SEC File No. 333-207132) for the offering to which this communication relates. Before you invest, you should read the prospectus in the registration statement and other documents the depositor has filed with the SEC for more complete information about the depositor, the issuing entity and this offering. You may get these documents for free by visiting EDGAR on the SEC website at www.sec.gov. Alternatively, the depositor or Citigroup Global Markets Inc., Morgan Stanley & Co. LLC, Merrill Lynch, Pierce, Fenner & Smith Incorporated, Drexel Hamilton, LLC, The Williams Capital Group, L.P. or any other underwriter or dealer participating in this offering will arrange to send you the prospectus if you request it by calling toll-free 1-800-831-9146.
45
| LOAN #2: PARK PLACE EAST AND PARK PLACE WEST |
The following table presents certain information relating to the major tenants at the Park Place East and Park Place West Properties:
Ten Largest Owned Tenants Based on Underwritten Base Rent(1)
Tenant Name | Credit Rating | Tenant | % of | UW Base | % of Total | UW Base | Lease | Renewal / Extension | ||||||||||
| CDI Management Corp. | NR / NR / NR | 70,559 | 17.7% | $1,044,057 | 18.6% | $14.80 | 12/31/2022 | 2, 3-year options | ||||||||||
| Metropolitan Council | AAA / Aa1 / AA+ | 34,385 | 8.6 | 521,991 | 9.3 | 15.18 | 7/31/2019 | 2, 1-year options | ||||||||||
| US Administrative Services | NR / NR / NR | 21,752 | 5.5 | 320,842 | 5.7 | 14.75 | 12/31/2019 | 1, 5-year option | ||||||||||
| Strayer University(3) | NR / NR / NR | 16,000 | 4.0 | 252,000 | 4.5 | 15.75 | 8/31/2019 | 1, 5-year option | ||||||||||
| Dispute Mgmt. Services | NR / NR / NR | 14,892 | 3.7 | 245,718 | 4.4 | 16.50 | 5/31/2024 | 1, 5-year option | ||||||||||
| University of MN Physicians | NR / Aa2 / AA | 11,129 | 2.8 | 214,233 | 3.8 | 19.25 | 7/31/2021 | None | ||||||||||
| McKinley Group, Inc.(4) | NR / NR / NR | 10,040 | 2.5 | 160,640 | 2.9 | 16.00 | 5/31/2025 | 1, 5-year option | ||||||||||
| Stanley Consultants, Inc. | NR / NR / NR | 10,807 | 2.7 | 159,403 | 2.8 | 14.75 | 3/31/2019 | 1, 5-year option | ||||||||||
| Examworks, Inc.(5) | NR / B2 / B | 8,483 | 2.1 | 139,121 | 2.5 | 16.40 | 3/31/2023 | 1, 5-year option | ||||||||||
| Sentage Corporation | NR / NR / NR | 7,770 | 2.0 | 122,720 | 2.2 | 15.79 | 5/31/2018 | 1, 5-year option | ||||||||||
| Ten Largest Owned Tenants | 205,817 | 51.7% | $3,180,726 | 56.5% | $15.45 | |||||||||||||
| Remaining Tenants(6) | 154,304 | 38.8 | 2,447,273 | 43.5 | 16.66 | |||||||||||||
| Vacant | 37,847 | 9.5 | 0 | 0.0 | 0.00 | |||||||||||||
| Total / Wtd. Avg. All Tenants(6) | 397,968 | 100.0% | $5,627,999 | 100.0% | $15.95 | |||||||||||||
| (1) | Based on the underwritten rent roll dated December 7, 2017. |
| (2) | Certain ratings are those of the parent company, whether or not the parent guarantees the lease. |
| (3) | Strayer University is subleasing 7,246 SF to Bureau of Engraving, Incorporated (dba Art Instruction Schools) at $13.75 per SF and 8,574 SF to Premia at $15.75 per SF. Both subleases are co--terminous with the prime lease. Bureau of Engraving, Incorporated (dba Art Instruction Schools) is sub-subleasing 4,500 SF to Equals 3, at an unspecified rent amount. The prime lease rent of $15.75 was underwritten for Strayer University. |
| (4) | McKinley Group, Inc. may terminate its lease effective July, 31 2023 with 12-months’notice and payment of a termination fee. McKinley Group, Inc. has free rent from February through June 2018 on 9,040 SF and free rent from February 2018 through May 2019 on 1,000 SF. |
| (5) | Examworks, Inc. has free rent in February and March 2018. |
| (6) | Remaining Tenants Tenant GLA includes, among other tenants, café space (4,290 SF), management office space (2,277 SF) and conference room space (809 SF). Remaining Tenants and Total / Wtd. Avg. All Tenants UW Base Rent $ per SF exclude such café space (4,290 SF), management office space (2,277 SF) and conference room space (809 SF), as no rent is attributed to any such space. |
The depositor has filed a registration statement (including a prospectus) with the Securities and Exchange Commission (“SEC”) (SEC File No. 333-207132) for the offering to which this communication relates. Before you invest, you should read the prospectus in the registration statement and other documents the depositor has filed with the SEC for more complete information about the depositor, the issuing entity and this offering. You may get these documents for free by visiting EDGAR on the SEC website at www.sec.gov. Alternatively, the depositor or Citigroup Global Markets Inc., Morgan Stanley & Co. LLC, Merrill Lynch, Pierce, Fenner & Smith Incorporated, Drexel Hamilton, LLC, The Williams Capital Group, L.P. or any other underwriter or dealer participating in this offering will arrange to send you the prospectus if you request it by calling toll-free 1-800-831-9146.
46
| LOAN #2: PARK PLACE EAST AND PARK PLACE WEST |
The following table presents certain information relating to the lease rollover schedule at the Park Place East and Park Place West Properties, based on initial lease expiration dates:
Lease Expiration Schedule(1)(2)
| Year Ending December 31, | Expiring Owned GLA | % of Owned GLA | Cumulative % of GLA | UW Base Rent | % of Total UW Base Rent | UW Base Rent | # of Expiring Tenants | ||||||||||||||
| MTM | 717 | 0.2 | % | 0.2 | % | $12,368 | 0.2 | % | $17.25 | 1 | |||||||||||
| 2018 | 36,007 | 9.0 | 9.2 | % | 570,082 | 10.1 | 15.83 | 10 | |||||||||||||
| 2019 | 107,334 | 27.0 | 36.2 | % | 1,653,031 | 29.4 | 15.40 | 11 | |||||||||||||
| 2020 | 21,336 | 5.4 | 41.6 | % | 349,114 | 6.2 | 16.36 | 8 | |||||||||||||
| 2021 | 23,664 | 5.9 | 47.5 | % | 443,331 | 7.9 | 18.73 | 7 | |||||||||||||
| 2022 | 116,390 | 29.2 | 76.8 | % | 1,811,954 | 32.2 | 15.57 | 13 | |||||||||||||
| 2023 | 13,112 | 3.3 | 80.0 | % | 217,409 | 3.9 | 16.58 | 2 | |||||||||||||
| 2024 | 24,089 | 6.1 | 86.1 | % | 410,071 | 7.3 | 17.02 | 3 | |||||||||||||
| 2025 | 10,040 | 2.5 | 88.6 | % | 160,640 | 2.9 | 16.00 | 1 | |||||||||||||
| 2026 | 0 | 0.0 | 88.6 | % | 0 | 0.0 | 0.00 | 0 | |||||||||||||
| 2027 | 0 | 0.0 | 88.6 | % | 0 | 0.0 | 0.00 | 0 | |||||||||||||
| 2028 | 0 | 0.0 | 88.6 | % | 0 | 0.0 | 0.00 | 0 | |||||||||||||
| 2029 & Thereafter(4) | 7,432 | 1.9 | 90.5 | % | 0 | 0.0 | 0.00 | 0 | |||||||||||||
| Vacant | 37,847 | 9.5 | 100.0 | % | 0 | 0.0 | 0.00 | 0 | |||||||||||||
| Total / Wtd. Avg. | 397,968 | 100.0 | % | $5,627,999 | 100.0 | % | $15.95 | 56 | |||||||||||||
| (1) | Calculated based on approximate square footage occupied by each Owned Tenant. |
| (2) | Certain tenants have lease termination options that are exercisable prior to the originally stated expiration date of the subject lease and which are not reflected in the Lease Expiration Schedule. |
| (3) | Wtd. Avg. UW Base Rent $ per SF excludes vacant space, café space (4,290 SF), management office space (2,277 SF) and conference room space (809 SF), as no rent is attributed to any such space. |
| (4) | 2029 & Thereafter Expiring Owned GLA is made up of café space (4,290 SF), management office space (2,277 SF), conference room space (809 SF) and miscellaneous additional space (56 SF) for which no rent is underwritten. |
The following table presents certain information relating to historical leasing at the Park Place East and Park Place West Properties:
Historical Leased %(1)
| 2010 | 2011 | 2012 | 2013 | 2014 | 2015 | 2016 | As of 12/7/2017(2) | |||||||||
| Park Place East | 88.0% | 89.2% | 94.2% | 97.5% | 97.3% | 98.6% | 97.5% | 93.7% | ||||||||
| Park Place West | 80.4% | 71.2% | 67.4% | 70.9% | 89.3% | 98.1% | 96.2% | 87.3% |
| (1) | As provided by the borrower which reflects occupancy as of December 31 for the indicated year unless otherwise specified. |
| (2) | Based on the underwritten rent roll dated December 7, 2017. |
The depositor has filed a registration statement (including a prospectus) with the Securities and Exchange Commission (“SEC”) (SEC File No. 333-207132) for the offering to which this communication relates. Before you invest, you should read the prospectus in the registration statement and other documents the depositor has filed with the SEC for more complete information about the depositor, the issuing entity and this offering. You may get these documents for free by visiting EDGAR on the SEC website at www.sec.gov. Alternatively, the depositor or Citigroup Global Markets Inc., Morgan Stanley & Co. LLC, Merrill Lynch, Pierce, Fenner & Smith Incorporated, Drexel Hamilton, LLC, The Williams Capital Group, L.P. or any other underwriter or dealer participating in this offering will arrange to send you the prospectus if you request it by calling toll-free 1-800-831-9146.
47
| LOAN #2: PARK PLACE EAST AND PARK PLACE WEST |
| ■ | Operating History and Underwritten Net Cash Flow. The following table presents certain information relating to the historical operating performance and the Underwritten Net Cash Flow at the Park Place East and Park Place West Properties: |
Cash Flow Analysis(1)
| 2014 | 2015 | 2016 | TTM 10/31/2017 | Underwritten | Underwritten $ per SF | |||||||
| Gross Potential Rent(2) | $4,968,493 | $4,851,810 | $5,489,518 | $5,246,823 | $6,290,460 | $15.81 | ||||||
| Reimbursements | 3,739,067 | 4,130,027 | 4,210,958 | 4,468,670 | 4,877,769 | 12.26 | ||||||
| Other Income(3) | 196,736 | 217,474 | 197,641 | 182,214 | 210,000 | 0.53 | ||||||
| Vacancy, Credit Loss & Concessions | (478,601) | (182,789) | 0 | 0 | (662,461) | (1.66) | ||||||
| Effective Gross Income(4) | $8,425,695 | $9,016,522 | $9,898,117 | $9,897,707 | $10,715,768 | $26.93 | ||||||
| Real Estate Taxes | $1,520,255 | $1,559,234 | $1,658,387 | $1,909,115 | $2,300,000 | $5.78 | ||||||
| Insurance | 64,356 | 35,441 | 62,570 | 54,410 | 64,000 | 0.16 | ||||||
| Management Fee | 234,520 | 252,310 | 296,230 | 309,718 | 349,879 | 0.88 | ||||||
| Other Expenses | 2,409,905 | 2,488,377 | 2,641,086 | 2,720,376 | 2,720,376 | 6.84 | ||||||
| Total Operating Expenses | $4,229,037 | $4,335,363 | $4,658,273 | $4,993,619 | $5,434,255 | $13.66 | ||||||
| Net Operating Income | $4,196,658 | $4,681,159 | $5,239,844 | $4,904,088 | $5,281,513 | $13.27 | ||||||
| TI/LC | 0 | 0 | 0 | 0 | 772,672 | 1.94 | ||||||
| Replacement Reserves | 0 | 0 | 0 | 0 | 79,594 | 0.20 | ||||||
| Net Cash Flow | $4,196,658 | $4,681,159 | $5,239,844 | $4,904,088 | $4,429,248 | $11.13 | ||||||
| Occupancy | 93.3% | 98.4% | 96.8% | 90.5%(5) | 89.5%(5) | |||||||
| NOI Debt Yield | 7.7% | 8.6% | 9.7% | 9.0% | 9.7% | |||||||
| NCF DSCR | 1.25x | 1.40x | 1.57x | 1.47x | 1.32x |
| (1) | Certain items such as straight line rent, interest expense, interest income, lease cancellation income, depreciation, amortization, debt service payments and any other non-recurring or non-operating items were excluded from the historical presentation and are not considered for the underwritten cash flow. |
| (2) | Underwritten Gross Potential Rent is based on the rent roll as of December 7, 2017 and includes rent steps of $76,396 through December 31, 2018. |
| (3) | Other Income includes parking revenue, storage rent, rental operations and other miscellaneous income. |
| (4) | The increase in Underwritten Effective Gross Income from TTM 10/31/2017 is attributed to increased reimbursements, contractual rent increases and a new lease signing. |
| (5) | TTM 10/31/2017 Occupancy represents occupancy as of December 7, 2017. Underwritten Occupancy represents economic occupancy. |
| ■ | Appraisal. According to the appraisals, the Park Place East and Park Place West Properties had an aggregate “as-is” appraised value of $78,700,000 as of November 16, 2017. |
| ■ | Environmental Matters. Based on the Phase I environmental reports dated November 27, 2017, there were no recognized environmental conditions or recommendations for further action related to the Park Place East and Park Place West Properties. |
| ■ | Market Overview and Competition. The Park Place East and Park Place West Properties are located in the I-394 Corridor office submarket of the Minneapolis/St. Paul metropolitan area, according to the appraisal. According to the appraisal, as of the third quarter of 2017, the Minneapolis/St. Paul metropolitan area Class B office market contained 98,833,208 SF of office space, with a vacancy of 7.9% and effective rent of $17.96 per SF. According to the appraisal, as of the third quarter of 2017, the I-394 Corridor Class B office submarket contained 13,463,204 SF with a vacancy of 6.9% and effective rent of $22.58 per SF, which is the highest rent per SF of any submarket in the Minneapolis/St. Paul metropolitan area. |
The estimated 2017 population within a one-, three- and five-mile radius of the Park Place East and Park Place West Properties is 9,413, 103,059 and 380,220, respectively, according to the appraisal. The estimated 2017 median household income within a one-, three- and five-mile radius of the Park Place East and Park Place West Properties is $68,715, $70,906 and $60,217, respectively, according to the appraisal.
The depositor has filed a registration statement (including a prospectus) with the Securities and Exchange Commission (“SEC”) (SEC File No. 333-207132) for the offering to which this communication relates. Before you invest, you should read the prospectus in the registration statement and other documents the depositor has filed with the SEC for more complete information about the depositor, the issuing entity and this offering. You may get these documents for free by visiting EDGAR on the SEC website at www.sec.gov. Alternatively, the depositor or Citigroup Global Markets Inc., Morgan Stanley & Co. LLC, Merrill Lynch, Pierce, Fenner & Smith Incorporated, Drexel Hamilton, LLC, The Williams Capital Group, L.P. or any other underwriter or dealer participating in this offering will arrange to send you the prospectus if you request it by calling toll-free 1-800-831-9146.
48
| LOAN #2: PARK PLACE EAST AND PARK PLACE WEST |
The following table presents certain information relating to office lease comparables for the Park Place East and Park Place West Properties:
Office Lease Comparables(1)
| Property Name | Property Location | Tenant Name | Lease Date(s) | GLA | Lease Term (months) | Base Rent per SF | Lease Type | |||||||
| 505 Waterford Park | Plymouth, MN | Wealth Enhancement Group | Jul. 2018 | 27,622 | 64 | $17.25 | Triple Net | |||||||
| Crescent Ridge Corporate Center I | Minnetonka, MN | Watermark Title Agency | Jun. 2017 | 2,062 | 51 | $17.50 | Triple Net | |||||||
| West End 3 | St. Louis Park, MN | MI Homes | Apr. 2017 | 8,568 | 60 | $16.00 | Triple Net | |||||||
| 600 Metropoint | St. Louis Park, MN | Prudential | Jan. 2017 | 11,000 | 65 | $15.50 | Triple Net | |||||||
| 505 Waterford Park | Plymouth, MN | Allen Lund | Nov. 2016 | 1,988 | 63 | $16.50 | Triple Net | |||||||
| Crescent Ridge Corporate Center I | Minnetonka, MN | Liberty Mutual Insurance Company | Jun. 2016 | 15,626 | 65 | $18.00 | Triple Net |
| (1) | Source: Appraisal. |
| ■ | The Borrower. The borrower is Middleton Park Place Investors LLC, a special purpose Delaware limited liability company structured to be bankruptcy remote, with two independent directors in its borrower structure. Legal counsel to the borrower delivered a non-consolidation opinion in connection with the origination of the Park Place East and Park Place West Loan. The borrower sponsors are Mitchel Greenberg, Keith Jaffee, Peter Holstein and Middleton Partners LLC. The non-recourse carveout guarantors for the Park Place East and Park Place West Loan are Mitchel Greenberg, Keith Jaffee and Peter Holstein, jointly and severally (together, the “Park Place East and Park Place West Non-Recourse Carveout Guarantors”). |
The borrower has issued class A and class B shares. The cash equity contribution was provided by the class A shares and control of the borrower is held by the class B shares. The Park Place East and Park Place West Non-Recourse Carveout Guarantors own 100.0% of the class B shares indirectly through family trusts and affiliated entities. Middleton Partners LLC is a private real estate investment company, which serves as the platform for the investment activities of Mitchel Greenberg, Keith Jaffee and Peter Holstein, whose family trusts have invested in the class B shares of the borrower through such entity or its affiliates.
| ■ | Escrows. In connection with the origination of the Park Place East and Park Place West Loan, the borrower funded reserves of approximately (i) $184,172 for real estate taxes, (ii) $292,722 for outstanding tenant improvements and leasing commissions obligations, (iii) $118,811 for outstanding free rent with respect to five tenants and (iv) $512,195 for rollover tenant improvements and leasing commissions. |
Additionally, on each due date, the borrower is required to fund the following reserves with respect to the Park Place East and Park Place West Properties: (i) a tax reserve in an amount equal to one-twelfth of the amount that the lender estimates will be necessary to pay taxes over the then succeeding 12-month period, initially $184,172, (ii) an insurance reserve in an amount equal to one-twelfth of the amount that the lender estimates will be necessary to pay insurance premiums over the then succeeding 12-month period, provided that the monthly insurance reserve deposit is waived if the borrower is maintaining blanket insurance policies in accordance with the Park Place East and Park Place West Loan documents, (iii) a replacement reserve for capital expenditures in a monthly amount equal to $6,633; and (iv) a tenant improvements and leasing commissions reserve in a monthly amount equal to $58,037; provided that the borrower is not required to make the monthly deposit to the tenant improvements and leasing commissions reserve if it would cause the amount then on deposit (which calculation includes the upfront deposit described above) to exceed a cap of $2,839,332.
| ■ | Lockbox and Cash Management. The Park Place East and Park Place West Loan is structured with a springing lockbox with springing cash management. Upon the first occurrence of a Park Place East and Park Place West Cash Sweep Event Period (as defined below), the Park Place East and Park Place WestLoan documents require the borrower to establish a lender-controlled lockbox account and direct tenants to pay rent directly therein, and require that all other money received by the borrower or property manager with respect to thePark Place East and Park Place WestProperty be deposited into such lockbox account within one business day following receipt. If no Park Place East and Park Place West Cash Sweep Event Period is continuing, all funds in the lockbox account are required to be swept into the borrower’s operating account. Upon the first occurrence of a Park Place East and Park Place West Cash Sweep Event Period, the lender is required to establish, and the borrower is required to cooperate with the cash management bank to establish, a lender controlled cash management account. During the continuance |
The depositor has filed a registration statement (including a prospectus) with the Securities and Exchange Commission (“SEC”) (SEC File No. 333-207132) for the offering to which this communication relates. Before you invest, you should read the prospectus in the registration statement and other documents the depositor has filed with the SEC for more complete information about the depositor, the issuing entity and this offering. You may get these documents for free by visiting EDGAR on the SEC website at www.sec.gov. Alternatively, the depositor or Citigroup Global Markets Inc., Morgan Stanley & Co. LLC, Merrill Lynch, Pierce, Fenner & Smith Incorporated, Drexel Hamilton, LLC, The Williams Capital Group, L.P. or any other underwriter or dealer participating in this offering will arrange to send you the prospectus if you request it by calling toll-free 1-800-831-9146.
49
| LOAN #2: PARK PLACE EAST AND PARK PLACE WEST |
| of a Park Place East and Park Place West Cash Sweep Event Period, all cash flow is required to be swept from the lockbox account into such lender-controlled cash management account and applied in accordance with the Park Place East and Park Place West Loan documents to make deposits into reserve funds, as described under “—Escrows” above; to pay debt service on the Park Place East and Park Place West Loan; in the case of a Park Place East and Park Place West Cash Sweep Event Period under clause (ii), (iii) or (iv) of the definition thereof, to pay approved operating expenses in accordance with the approved annual budget and extraordinary expenses approved by the lender; and to deposit the remainder into a cash sweep account to be held as additional collateral for the Park Place East and Park Place West Loan during the continuance of such Park Place East and Park Place West Cash Sweep Event Period. |
A “Park Place East and Park Place West Cash Sweep Event Period”means the period:
| (i) | commencing upon the occurrence of an event of default under the Park Place East and Park Place West Loan and ending upon the acceptance by the lender in its sole discretion of a cure of such event of default; |
| (ii) | commencing upon the debt service coverage ratio of the Park Place East and Park Place West Loan falling below 1.15x for the immediately preceding six calendar months based on the trailing six months operating statements and rent rolls and ending upon the debt service coverage ratio being equal to or greater than 1.15x for the immediately preceding six calendar months based on the trailing six months operating statements and rent rolls; |
| (iii) | commencing upon a Major Underwritten Tenant (as defined below) terminating or cancelling its lease (including, without limitation, any rejection of its lease in a bankruptcy or similar proceeding) or a Major Underwritten Tenant filing for bankruptcy or becoming involved in an insolvency proceeding, and ending upon either (x) such Major Underwritten Tenant’s lease being affirmed in bankruptcy and such Major Underwritten Tenant being in occupancy of the entirety of its space, open for business and paying full contractual rent, or (y) the entirety of such Major Underwritten Tenant’s space being re-let to one or more replacement tenant(s) pursuant to a replacement lease(s), which replacement tenant(s) and lease(s) are acceptable to the lender, and the borrower delivering a reasonably acceptable tenant estoppel certificate(s) from each such replacement tenant(s) stating that such replacement tenant(s) is/are in occupancy of the entirety of such Major Underwritten Tenant’s space, open for business and either paying full contractual rent or the lender has received sufficient amounts to escrow for the same (a “Park Place East and Park Place West Replacement Tenant Cure”); or |
| (iv) | commencing upon (A) any Major Underwritten Tenant’s lease terminating or failing to be in full force and effect for any reason, (B) any Major Underwritten Tenant going dark, vacating or otherwise failing to occupy its premises, or failing to be open for business during customary hours, (C) any Major Underwritten Tenant giving a termination notice or notice to vacate under its lease for all or any portion of its premises or (D) one year prior to the stated expiration date of any Major Underwritten Tenant’s lease unless it has been renewed or extended in accordance with its terms or on other terms acceptable to the lender and in all events in compliance with the requirements of the Park Place East and Park Place West Loan agreement and ending upon either (x) such Major Underwritten Tenant being open for business either pursuant to its lease or pursuant to a replacement lease acceptable to the lender, as evidenced by a reasonably acceptable tenant estoppel certificate stating that such Major Underwritten Tenant is in occupancy of the entirety of such Major Underwritten Tenant’s space, open for business and paying full contractual rent or (y) the occurrence of a Park Place East and Park Place West Replacement Tenant Cure. |
A “Major Underwritten Tenant” meansCDI Management Corp. or any replacement tenant for all or a portion of such tenant’s space which has been approved by the lender.
| ■ | Property Management. The Park Place East and Park Place West Properties are managed by CBRE, Inc., a Delaware corporation, pursuant to the terms of the management agreement. If (a) an event of default under the Park Place East and Park Place West Loan has occurred and is continuing, (b) the property manager (I) is insolvent or a debtor in a bankruptcy proceeding or (II) has engaged in gross negligence, fraud or willful misconduct, (c) an event of default by the property manager occurs under the related management agreement (subject to any applicable grace periods) or (d) the debt service coverage ratio of the Park Place East and Park Place West Loan falls below 1.10x, then the lender, at its option, may require the borrower to engage a replacement management agent that is an unaffiliated |
The depositor has filed a registration statement (including a prospectus) with the Securities and Exchange Commission (“SEC”) (SEC File No. 333-207132) for the offering to which this communication relates. Before you invest, you should read the prospectus in the registration statement and other documents the depositor has filed with the SEC for more complete information about the depositor, the issuing entity and this offering. You may get these documents for free by visiting EDGAR on the SEC website at www.sec.gov. Alternatively, the depositor or Citigroup Global Markets Inc., Morgan Stanley & Co. LLC, Merrill Lynch, Pierce, Fenner & Smith Incorporated, Drexel Hamilton, LLC, The Williams Capital Group, L.P. or any other underwriter or dealer participating in this offering will arrange to send you the prospectus if you request it by calling toll-free 1-800-831-9146.
50
| LOAN #2: PARK PLACE EAST AND PARK PLACE WEST |
Qualified Manager (as defined below) chosen by the borrower and terminate the property manager without fee or obligation to the lender.
A “Qualified Manager” means a manager that is a reputable and experienced professional management organization reasonably approved by the lender (which may be conditioned on a rating agency confirmation). The borrower may not replace the property manager without the consent of the lender, which may not be unreasonably withheld (and may be conditioned upon receipt of a rating agency confirmation).
| ■ | Mezzanine or Secured Subordinate Indebtedness. Not permitted. |
| ■ | Release of Collateral. Not permitted. |
| ■ | Terrorism Insurance. The borrower is required to maintain an “all-risk” insurance policy (with a deductible that is acceptable to the lender and is no greater than $25,000) that provides coverage for terrorism in an amount equal to 100.0% of the full replacement cost of the Park Place East and Park Place West Properties, plus a business interruption insurance policy that provides 18 months of business interruption coverage with an additional 12-month extended period of indemnity; provided that if the policies contain an exclusion for loss or damage incurred as a result of an act of terrorism or similar acts of sabotage, the borrower is required to maintain separate insurance against such loss or damage provided such insurance is commercially available. For so long as TRIPRA is in effect and continues to cover both domestic and foreign acts of terrorism, the lender is required to accept terrorism insurance coverage which covers against “covered acts” as defined by TRIPRA. See“Risk Factors—Terrorism Insurance May Not Be Available for All Mortgaged Properties” in the Preliminary Prospectus. |
The depositor has filed a registration statement (including a prospectus) with the Securities and Exchange Commission (“SEC”) (SEC File No. 333-207132) for the offering to which this communication relates. Before you invest, you should read the prospectus in the registration statement and other documents the depositor has filed with the SEC for more complete information about the depositor, the issuing entity and this offering. You may get these documents for free by visiting EDGAR on the SEC website at www.sec.gov. Alternatively, the depositor or Citigroup Global Markets Inc., Morgan Stanley & Co. LLC, Merrill Lynch, Pierce, Fenner & Smith Incorporated, Drexel Hamilton, LLC, The Williams Capital Group, L.P. or any other underwriter or dealer participating in this offering will arrange to send you the prospectus if you request it by calling toll-free 1-800-831-9146.
51
LOAN #3: the socal portfolio
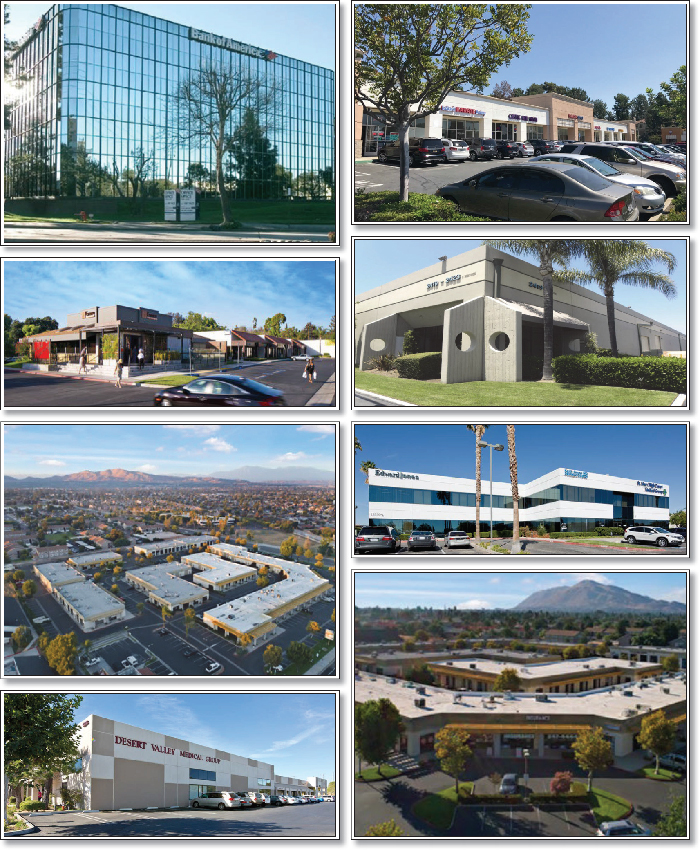
The depositor has filed a registration statement (including a prospectus) with the Securities and Exchange Commission (“SEC”) (SEC File No. 333-207132) for the offering to which this communication relates. Before you invest, you should read the prospectus in the registration statement and other documents the depositor has filed with the SEC for more complete information about the depositor, the issuing entity and this offering. You may get these documents for free by visiting EDGAR on the SEC website at www.sec.gov. Alternatively, the depositor or Citigroup Global Markets Inc., Morgan Stanley & Co. LLC, Merrill Lynch, Pierce, Fenner & Smith Incorporated, Drexel Hamilton, LLC, The Williams Capital Group, L.P. or any other underwriter or dealer participating in this offering will arrange to send you the prospectus if you request it by calling toll-free 1-800-831-9146.
52
LOAN #3: the socal portfolio
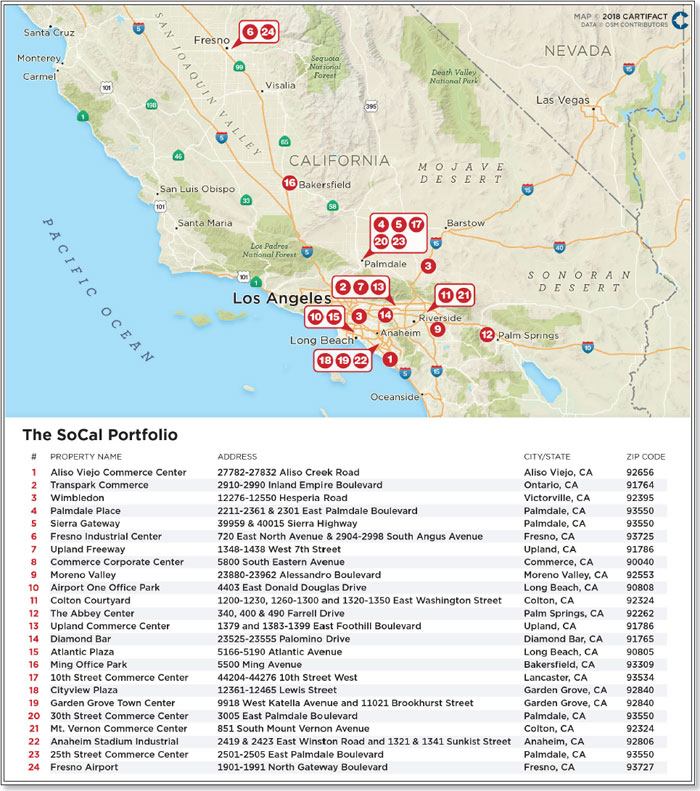
The depositor has filed a registration statement (including a prospectus) with the Securities and Exchange Commission (“SEC”) (SEC File No. 333-207132) for the offering to which this communication relates. Before you invest, you should read the prospectus in the registration statement and other documents the depositor has filed with the SEC for more complete information about the depositor, the issuing entity and this offering. You may get these documents for free by visiting EDGAR on the SEC website at www.sec.gov. Alternatively, the depositor or Citigroup Global Markets Inc., Morgan Stanley & Co. LLC, Merrill Lynch, Pierce, Fenner & Smith Incorporated, Drexel Hamilton, LLC, The Williams Capital Group, L.P. or any other underwriter or dealer participating in this offering will arrange to send you the prospectus if you request it by calling toll-free 1-800-831-9146.
53
LOAN #3: the socal portfolio
| Mortgaged Property Information | Mortgage Loan Information | ||||
| Number of Mortgaged Properties | 24 | Loan Seller | CREFI | ||
| Location (City/State) | Various, California | Cut-off Date Balance(2) | $50,000,000 | ||
| Property Type | Various | Cut-off Date Balance per SF(1) | $104.49 | ||
| Size (SF) | 2,194,425 | Percentage of Initial Pool Balance | 4.7% | ||
| Total Occupancy as of 1/31/2018 | 83.8% | Number of Related Mortgage Loans | None | ||
| Owned Occupancy as of 1/31/2018 | 83.8% | Type of Security(3) | Various | ||
| Year Built / Latest Renovation | Various | Mortgage Rate | 4.89000% | ||
| Appraised Value | $386,140,000 | Original Term to Maturity (Months) | 120 | ||
| Appraisal Date | Various | Original Amortization Term (Months) | 360 | ||
| Borrower Sponsor | Donald G. Abbey | Original Interest Only Period (Months) | 60 | ||
| Property Management | The Abbey Management Company LLC | First Payment Date | 3/6/2018 | ||
| Maturity Date | 2/6/2028 | ||||
| Underwritten Revenues | $35,466,096 | ||||
| Underwritten Expenses | $12,079,824 | Escrows(4) | |||
| Underwritten Net Operating Income (NOI) | $23,386,272 | Upfront | Monthly | ||
| Underwritten Net Cash Flow (NCF) | $21,584,994 | Taxes | $0 | $219,172 | |
| Cut-off Date LTV Ratio(1) | 59.4% | Insurance | $0 | $0 | |
| Maturity Date LTV Ratio(1) | 54.7% | Replacement Reserve(5) | $0 | $35,400 | |
| DSCR Based on Underwritten NOI / NCF(1) | 1.60x / 1.48x | TI/LC(6) | $8,000,000 | $0 | |
| Debt Yield Based on Underwritten NOI / NCF(1) | 10.2% / 9.4% | Other(7) | $4,863,915 | $109,872 | |
| Sources and Uses | |||||
| Sources | $ | % | Uses | $ | % |
| Loan Combination Amount | $229,300,000 | 98.6% | Loan Payoff | $215,200,917 | 92.6% |
| Other Sources(8) | 1,635,345 | 0.7 | Reserves | 12,863,915 | 5.5 |
| Principal’s New Cash Contribution | 1,560,056 | 0.7 | Closing Costs | 4,430,569 | 1.9 |
| Total Sources | $232,495,401 | 100.0% | Total Uses | $232,495,401 | 100.0% |
| (1) | Calculated based on the outstanding principal balance as of the Cut-off Date of the SoCal Portfolio Loan Combination (as defined below). |
| (2) | The Cut-off Date Balance of $50,000,000 represents the controlling note A-1-1 of the $229,300,000 SoCal Portfolio Loan Combination, which is evidenced by sixpari passu notes and was co-originated by Citi Real Estate Funding Inc. (“CREFI”) and Barclays Bank PLC (“Barclays”). See the “Loan Combination Summary” table in“—The Mortgage Loan” below. |
| (3) | Twenty (20) of the SoCal Portfolio Properties are fee simple interests, three are leasehold interests and one property has both a fee simple and leasehold interest. See the “SoCal Portfolio Property Summary” table in“—The Mortgaged Properties”below. |
| (4) | See“—Escrows”below. |
| (5) | The Replacement Reserve is capped at $1,000,000. The borrowers are not required to make a monthly Replacement Reserve deposit unless the Replacement Reserve account balance falls below the Replacement Reserve cap of $1,000,000, after which, on each monthly payment date, the borrowers must make an ongoing Replacement Reserve deposit equal to $35,400 until the Replacement Reserve balance equals or exceeds the Replacement Reserve cap of $1,000,000. |
| (6) | The borrowers are required to make monthly TI/LC reserve deposits (i) through and including the monthly payment date occurring in February 2023 of approximately $1.25 per SFper annum (initially $228,586 per month) and (ii) from and after the monthly payment date occurring in March 2023 of approximately $0.75 per SFper annum. If the amount in the TI/LC reserve equals or exceeds (i) $5,000,000 through and including the monthly payment date occurring in February 2023 or (ii) $2,000,000 from and after the monthly payment date in March 2023 through the Maturity Date, then monthly TI/LC reserve payments will be waived, provided monthly TI/LC reserve payments will be reinstated up to the respective TI/LC reserve cap amount once the amount in the TI/LC reserve falls below $5,000,000 through and including the monthly payment date occurring in February 2023 or $2,000,000 from and after the monthly payment date occurring in March 2023 through the Maturity Date. |
| (7) | Upfront Other Reserve includes $1,559,061 related to outstanding tenant improvements and leasing commissions for existing tenants, $1,107,960 for free rent related to existing tenants, $1,000,000 to be used in connection with extending the ground leases of the Cityview Plaza Property and/or Anaheim Stadium Industrial Property, $977,151 of deferred maintenance and $219,743 for payment of ground rent under the terms of the existing ground leases. Monthly Other Reserve includes approximately $109,872 in monthly payments of ground rent under the terms of the existing ground leases. |
| (8) | Other Sources represents the return of taxes and insurance funds that were held in reserve in connection with the prior loan encumbering the SoCal Portfolio Properties. |
| ■ | The Mortgage Loan. The mortgage loan (the “SoCal Portfolio Loan”) is part of a loan combination (the “SoCal Portfolio Loan Combination”) evidenced by sixpari passu notes that are together secured by a first mortgage encumbering the borrowers’ fee simple and leasehold interests in 24 properties (each, a “SoCal Portfolio Property” and collectively the “SoCal Portfolio Properties”) primarily located in southern California. The SoCal Portfolio Properties consist of ten retail, eight office, three mixed-use and three industrial properties totaling 2,194,425 SF. The SoCal Portfolio Loan, which is evidenced by the controlling note A-1-1, had an original principal balance of $50,000,000, has an outstanding principal balance as of the Cut-off Date of $50,000,000 and represents approximately 4.7% of the Initial Pool Balance. The “Loan Combination Summary” table below summarizes the remaining promissory notes. The SoCal Portfolio Loan Combination, which accrues interest at a rate of 4.89000%per annum, was co-originated by CREFI and Barclays on February 6, 2018, had an original principal balance of $229,300,000 and has an outstanding principal balance as of the Cut-off Date of $229,300,000. The proceeds of the SoCal Portfolio Loan Combination were primarily used to refinance the SoCal Portfolio Properties, fund reserves and pay origination costs. |
The depositor has filed a registration statement (including a prospectus) with the Securities and Exchange Commission (“SEC”) (SEC File No. 333-207132) for the offering to which this communication relates. Before you invest, you should read the prospectus in the registration statement and other documents the depositor has filed with the SEC for more complete information about the depositor, the issuing entity and this offering. You may get these documents for free by visiting EDGAR on the SEC website at www.sec.gov. Alternatively, the depositor or Citigroup Global Markets Inc., Morgan Stanley & Co. LLC, Merrill Lynch, Pierce, Fenner & Smith Incorporated, Drexel Hamilton, LLC, The Williams Capital Group, L.P. or any other underwriter or dealer participating in this offering will arrange to send you the prospectus if you request it by calling toll-free 1-800-831-9146.
54
LOAN #3: the socal portfolio
Loan Combination Summary
| Note | Original Balance | Cut-off Date Balance | Note Holder | Controlling Piece | ||||
| A-1-1 | $50,000,000 | $50,000,000 | CGCMT 2018-B2 | Yes | ||||
| A-1-2 | $35,000,000 | $35,000,000 | CREFI(1) | No | ||||
| A-1-3 | $15,000,000 | $15,000,000 | CREFI(1) | No | ||||
| A-1-4 | $37,580,000 | $37,580,000 | CREFI(1) | No | ||||
| A-2-1 | $45,000,000 | $45,000,000 | Barclays(1) | No | ||||
| A-2-2 | $46,720,000 | $46,720,000 | Barclays(1) | No | ||||
| Total / Wtd. Avg. | $229,300,000 | $229,300,000 |
| (1) | Expected to be contributed to one or more future securitization transactions. |
The SoCal Portfolio Loan Combination had an initial term of 120 months and has a remaining term of 119 months as of the Cut-off Date. The SoCal Portfolio Loan Combination requires interest only payments through and including the monthly payment date in February 2023 followed by payments of principal and interest for the remaining term of the SoCal Portfolio Loan Combination. The scheduled maturity date of the SoCal Portfolio Loan Combination is the due date in February 2028. At any time after the earlier of February 6, 2021 and the second anniversary of the securitization of the last portion of the SoCal Portfolio Loan Combination, the SoCal Portfolio Loan Combination may be defeased with certain direct full faith and credit obligations of the United States of America or other obligations which are “government securities” permitted under the SoCal Portfolio Loan Combination documents. Voluntary prepayment of the SoCal Portfolio Loan Combination is permitted on or after the due date occurring in September 2027 without payment of any prepayment premium.
| ■ | The Mortgaged Properties.The SoCal Portfolio Properties are 24 properties totaling 2,194,425 SF located primarily in southern California. The SoCal Portfolio Properties were built between 1968 and 1992 and range in size from 12,610 SF to 265,898 SF. The breakdown of property types across the SoCal Portfolio Properties is ten retail, eight office, three mixed use and three industrial properties. The borrower sponsor has owned all of the SoCal Portfolio Properties for at least 16 years with 20 of the 24 properties being acquired by the borrower sponsor prior to 2000. The SoCal Portfolio properties exhibited a total portfolio occupancy of 83.8% as of January 31, 2018 with individual property occupancy rates ranging from 47.0% at the Fresno Airport Property (0.4% of the allocated loan combination amount) to 100.0% at five of the SoCal Portfolio Properties (with a combined allocated loan combination amount of 12.8%). No individual tenant makes up more than 4.8% of total UW base rent or 4.0% of total SF across the SoCal Portfolio Properties. See the tables below for additional information related to the SoCal Portfolio Properties. |
The following table presents certain information related to the property types of the SoCal Portfolio Properties:
SoCal Portfolio Property Type Summary
Property Type | # of Properties | Building | % of Total | Cut-off Date Allocated | % of Cut-off | UW NCF | % of UW NCF |
| Office | 8 | 880,804 | 40.1% | $82,634,684 | 36.0% | $7,980,791 | 37.0% |
| Retail | 10 | 563,890 | 25.7 | 79,285,474 | 34.6 | 6,943,789 | 32.2 |
| Mixed Use | 3 | 364,302 | 16.6 | 49,875,359 | 21.8 | 5,116,034 | 23.7 |
| Industrial | 3 | 385,429 | 17.6 | 17,504,484 | 7.6 | 1,544,381 | 7.2 |
| Total / Wtd. Avg. | 24 | 2,194,425 | 100.0% | $229,300,000 | 100.0% | $21,584,994 | 100.0% |
The depositor has filed a registration statement (including a prospectus) with the Securities and Exchange Commission (“SEC”) (SEC File No. 333-207132) for the offering to which this communication relates. Before you invest, you should read the prospectus in the registration statement and other documents the depositor has filed with the SEC for more complete information about the depositor, the issuing entity and this offering. You may get these documents for free by visiting EDGAR on the SEC website at www.sec.gov. Alternatively, the depositor or Citigroup Global Markets Inc., Morgan Stanley & Co. LLC, Merrill Lynch, Pierce, Fenner & Smith Incorporated, Drexel Hamilton, LLC, The Williams Capital Group, L.P. or any other underwriter or dealer participating in this offering will arrange to send you the prospectus if you request it by calling toll-free 1-800-831-9146.
55
LOAN #3: the socal portfolio
The following table presents certain information related to the individual SoCal Portfolio Properties:
SoCal Portfolio Property Summary
Property | Property Type | City(1) | County(1) | Building | Occupancy as of 1/31/2018 | Cut-off Date Allocated | % of Cut-off Date Allocated Loan Combination Amount | Ownership Interest |
| Aliso Viejo Commerce Center | Retail | Aliso Viejo | Orange | 65,107 | 89.7% | $27,761,791 | 12.1% | Fee Simple |
| Transpark Commerce | Office | Ontario | San Bernardino | 204,099 | 74.4% | 25,143,236 | 11.0 | Fee Simple |
| Wimbledon | Mixed Use | Victorville | San Bernardino | 123,948 | 94.7% | 22,230,241 | 9.7 | Fee Simple |
| Palmdale Place | Mixed Use | Palmdale | Los Angeles | 129,294 | 89.1% | 16,250,000 | 7.1 | Fee Simple/Leasehold(2) |
| Sierra Gateway | Office | Palmdale | Los Angeles | 133,851 | 76.6% | 14,800,000 | 6.5 | Fee Simple |
| Fresno Industrial Center | Industrial | Fresno | Fresno | 265,898 | 97.2% | 14,000,000 | 6.1 | Fee Simple |
| Upland Freeway | Retail | Upland | San Bernardino | 116,061 | 94.4% | 13,032,927 | 5.7 | Fee Simple |
| Commerce Corporate Center | Office | Commerce | Los Angeles | 68,513 | 93.1% | 13,000,000 | 5.7 | Fee Simple |
| Moreno Valley | Mixed Use | Moreno Valley | Riverside | 111,060 | 94.0% | 11,395,118 | 5.0 | Fee Simple |
| Airport One Office Park | Office | Long Beach | Los Angeles | 88,284 | 100.0% | 11,394,743 | 5.0 | Leasehold(3) |
| Colton Courtyard | Retail | Colton | San Bernardino | 122,082 | 65.2% | 7,375,987 | 3.2 | Fee Simple |
| The Abbey Center | Office | Palm Springs | Riverside | 67,335 | 86.5% | 7,244,116 | 3.2 | Fee Simple |
| Upland Commerce Center | Retail | Upland | San Bernardino | 47,677 | 86.0% | 6,879,276 | 3.0 | Fee Simple |
| Diamond Bar | Retail | Diamond Bar | Los Angeles | 20,528 | 100.0% | 6,650,000 | 2.9 | Fee Simple |
| Atlantic Plaza | Retail | Long Beach | Los Angeles | 32,728 | 100.0% | 6,000,000 | 2.6 | Fee Simple |
| Ming Office Park | Office | Bakersfield | Kern | 117,924 | 56.5% | 5,552,589 | 2.4 | Fee Simple |
| 10th Street Commerce Center | Retail | Lancaster | Los Angeles | 96,589 | 52.3% | 4,913,128 | 2.1 | Fee Simple |
| Cityview Plaza | Office | Garden Grove | Orange | 148,271 | 96.4% | 4,500,000 | 2.0 | Leasehold(4)(6) |
| Garden Grove Town Center | Retail | Garden Grove | Orange | 12,610 | 100.0% | 3,502,732 | 1.5 | Fee Simple |
| 30th Street Commerce Center | Retail | Palmdale | Los Angeles | 33,020 | 49.5% | 1,875,896 | 0.8 | Fee Simple |
| Mt. Vernon Commerce Center | Industrial | Colton | San Bernardino | 29,600 | 77.8% | 1,754,484 | 0.8 | Fee Simple |
| Anaheim Stadium Industrial | Industrial | Anaheim | Orange | 89,931 | 100.0% | 1,750,000 | 0.8 | Leasehold(5)(6) |
| 25th Street Commerce Center | Retail | Palmdale | Los Angeles | 17,488 | 58.8% | 1,293,737 | 0.6 | Fee Simple |
| Fresno Airport | Office | Fresno | Fresno | 52,527 | 47.0% | 1,000,000 | 0.4 | Fee Simple |
| Total / Wtd. Avg. | 2,194,425 | 83.8% | $229,300,000 | 100.0% |
| (1) | All of the properties are located in the state of California. |
| (2) | One of the eight buildings of the Palmdale Place Property is encumbered by a ground lease with an initial expiration date of March 31, 2052. Thereafter, the ground lease has three, 10-year renewal options remaining. |
| (3) | The Airport One Office Park Property is encumbered by a ground lease with an initial expiration of January 12, 2040. Thereafter, the ground lease has two, five-year renewal options remaining. |
| (4) | The Cityview Plaza Property is encumbered by a ground lease with an expiration date of September 30, 2035. |
| (5) | The Anaheim Stadium Industrial Property is encumbered by a ground lease with an expiration date of April 30, 2034. |
| (6) | In connection with the origination of the SoCal Portfolio Loan Combination, the borrowers funded $1,000,000 into a ground lease extension reserve which funds are to be used to extend the terms of both the Cityview Plaza Property and Anaheim Stadium Industrial Property ground leases. Should the borrowers not extend the terms of either the Cityview Plaza Property or Anaheim Stadium Industrial Property ground leases on or prior to February 6, 2020 pursuant to terms reasonably acceptable by the lender, the borrowers must commence making monthly deposits into the ground lease extension reserve of $55,000 until the ground lease extension reserve funds reach an amount equal to the allocated loan amount of the applicable property or properties. |
The depositor has filed a registration statement (including a prospectus) with the Securities and Exchange Commission (“SEC”) (SEC File No. 333-207132) for the offering to which this communication relates. Before you invest, you should read the prospectus in the registration statement and other documents the depositor has filed with the SEC for more complete information about the depositor, the issuing entity and this offering. You may get these documents for free by visiting EDGAR on the SEC website at www.sec.gov. Alternatively, the depositor or Citigroup Global Markets Inc., Morgan Stanley & Co. LLC, Merrill Lynch, Pierce, Fenner & Smith Incorporated, Drexel Hamilton, LLC, The Williams Capital Group, L.P. or any other underwriter or dealer participating in this offering will arrange to send you the prospectus if you request it by calling toll-free 1-800-831-9146.
56
LOAN #3: the socal portfolio
The following table presents certain information relating to the major tenants at the SoCal Portfolio Properties:
Ten Largest Owned Tenants Based on Underwritten Base Rent
Tenant Name | Credit Rating (Fitch/MIS/S&P)(1) | Tenant GLA | % of GLA | UW Base Rent(2) | % of Total UW Base Rent(2) | UW Base Rent | Lease Expiration | Renewal / Extension Options | ||||||||||
| The Capital Group Companies | NR / NR / NR | 88,284 | 4.0 | % | $1,517,300 | 4.8 | % | $17.19 | 4/30/2025 | NAP | ||||||||
| County of Los Angeles(3) | AA- / Aa2 / AA | 58,755 | 2.7 | 1,252,415 | 3.9 | $21.32 | 2/29/2020 | NAP | ||||||||||
| Antelope Valley Community College District | NR / Aa2 / AA | 50,720 | 2.3 | 1,092,031 | 3.4 | $21.53 | 10/31/2046 | 4, 15-year options | ||||||||||
| County of San Bernardino | AA+ / A1 / AA- | 34,469 | 1.6 | 992,034 | 3.1 | $28.78 | 9/30/2024 | 2, 5-year options | ||||||||||
| GSA (United States of America)(4)(5) | AAA / Aaa / AA+ | 30,483 | 1.4 | 884,656 | 2.8 | $29.02 | Various | NAP | ||||||||||
| Heritage Victor Valley Medical Group(6) | NR / NR / NR | 41,875 | 1.9 | 814,387 | 2.6 | $19.45 | Various | Various | ||||||||||
| Fiat Chrysler Automobiles | BB / Baa3 / BB+ | 27,965 | 1.3 | 630,690 | 2.0 | $22.55 | 7/31/2028 | 2, 5-year options | ||||||||||
| The Abbey Management Co LLC(7) | NR / NR / NR | 27,663 | 1.3 | 616,225 | 1.9 | $22.28 | Various | NAP | ||||||||||
| Stantec Consulting Services Inc. | NR / NR / NR | 25,203 | 1.1 | 553,458 | 1.7 | $21.96 | 3/31/2023 | 3, 5-year options | ||||||||||
| Candor-AGS, Inc. | NR / NR / NR | 125,183 | 5.7 | 527,796 | 1.7 | $4.22 | 5/31/2020 | 2, 3-year options | ||||||||||
| Ten Largest Tenants | 510,600 | 23.3 | % | $8,880,993 | 27.8 | % | $17.39 | |||||||||||
| Remaining Owned Tenants | 1,328,177 | 60.5 | 23,013,546 | 72.2 | $17.33 | |||||||||||||
| Vacant | 355,648 | 16.2 | 0 | 0.0 | $0.00 | |||||||||||||
| Total / Wtd. Avg. All Owned Tenants | 2,194,425 | 100.0 | % | $31,894,539 | 100.0 | % | $17.35 | |||||||||||
| (1) | Certain ratings are those of the parent company whether or not the parent guarantees the lease. |
| (2) | UW Base Rent, % of Total UW Base Rent and UW Base Rent $ per SF include contractual rent steps ($599,679) through February 2019 and the present value of rent steps for credit tenants ($487,998). |
| (3) | The County of Los Angeles leases 49,500 SF used by the Department of Children and Family Services expiring February 29, 2020 and 9,255 SF used by the Department of Mental Health on a month-to-month basis. The 9,255 SF space has been month-to-month since August 31, 2017 while the County of Los Angeles has been negotiating a lease renewal at the Palmdale Place Property. |
| (4) | GSA (United States of America) leases 30,483 SF across four of the SoCal Portfolio Properties. 8,892 SF expires on January 14, 2019, 8,434 SF expires on January 31, 2022, 4,996 SF expires on May 16, 2025, 3,929 SF expires on March 31, 2018, 3,000 SF expires on August 5, 2022, and 1,232 SF expires on December 20, 2022. |
| (5) | GSA (United States of America) has the option to terminate the 8,892 SF space that expires on January 14, 2019 at any time by giving at least 180 days’ prior written notice. GSA (United States of America) has the option to terminate the 4,996 SF that expires on May 16, 2025 at any time after May 16, 2020 by giving at least 90 days’ prior written notice. |
| (6) | Heritage Victor Valley Medical Group leases 12,915 SF that expires September 30, 2024, 12,283 SF that expires October 31, 2018, 5,151 SF that expires November 30, 2018, 4,384 SF that expires April 30, 2020, 3,942 SF that expires January 31, 2020 and 3,200 SF that expires February 29, 2024. Heritage Victor Valley Medical Group has one, three-year renewal option with 180 days’ notice related to the 12,283 SF space that expires October 31, 2018. |
| (7) | The Abbey Management Co LLC leases 27,663 SF across eight of the SoCal Portfolio Properties. 10,018 SF expires on May 31, 2020, 5,519 SF expires on August 31, 2022, 3,715 SF expires on May 31, 2018, 3,199 SF expires on January 31, 2021, 2,368 SF expires on August 31, 2018, 1,278 SF expires on November 30, 2022, 945 SF expires on November 30, 2020 and 621 SF expires on September 30, 2022. The Abbey Management Co LLC may terminate any of its space upon 30 days’ notice. |
The following table presents the lease rollover schedule at the SoCal Portfolio Properties, based on initial lease expiration dates:
Lease Expiration Schedule(1)(2)
Year Ending December 31 | Expiring Owned GLA | % of Owned GLA | Cumulative % of | UW Base Rent(3) | % of Total UW Base Rent(3) | UW Base Rent $ per SF(3)(4) | # of Expiring Tenants | |||||||||||||
| MTM | 25,194 | 1.1 | % | 1.1% | $399,849 | 1.3 | % | $15.87 | 9 | |||||||||||
| 2018 | 214,118 | 9.8 | 10.9% | 3,593,142 | 11.3 | $16.78 | 67 | |||||||||||||
| 2019 | 249,933 | 11.4 | 22.3% | 4,039,741 | 12.7 | $16.16 | 97 | |||||||||||||
| 2020 | 398,320 | 18.2 | 40.4% | 5,610,555 | 17.6 | $14.09 | 93 | |||||||||||||
| 2021 | 165,102 | 7.5 | 48.0% | 3,246,167 | 10.2 | $19.66 | 62 | |||||||||||||
| 2022 | 212,902 | 9.7 | 57.7% | 4,015,405 | 12.6 | $18.86 | 65 | |||||||||||||
| 2023 | 170,313 | 7.8 | 65.4% | 2,710,868 | 8.5 | $15.92 | 29 | |||||||||||||
| 2024 | 90,138 | 4.1 | 69.5% | 2,167,815 | 6.8 | $24.05 | 13 | |||||||||||||
| 2025 | 156,516 | 7.1 | 76.7% | 2,858,241 | 9.0 | $18.26 | 11 | |||||||||||||
| 2026 | 24,625 | 1.1 | 77.8% | 479,916 | 1.5 | $19.49 | 4 | |||||||||||||
| 2027 | 35,657 | 1.6 | 79.4% | 519,565 | 1.6 | $14.57 | 5 | |||||||||||||
| 2028 | 45,239 | 2.1 | 81.5% | 1,161,245 | 3.6 | $25.67 | 4 | |||||||||||||
| 2029 & Thereafter | 50,720 | 2.3 | 83.8% | 1,092,031 | 3.4 | $21.53 | 1 | |||||||||||||
| Vacant | 355,648 | 16.2 | 100.0% | 0 | 0.0 | $0.00 | 0 | |||||||||||||
| Total / Wtd. Avg. | 2,194,425 | 100.0 | % | $31,894,539 | 100.0 | % | $17.35 | 460 | ||||||||||||
| (1) | Calculated based on the approximate square footage occupied by each Owned Tenant. |
| (2) | Certain tenants may have lease termination options that are exercisable prior to the originally stated expiration date of the subject lease and that are not considered in the Lease Expiration Schedule. |
| (3) | UW Base Rent, % of Total UW Base Rent and UW Base Rent $ per SF include contractual rent steps ($599,679) through February 2019 and the present value of rent steps for credit tenants ($487,998). |
| (4) | Total / Wtd. Avg. UW Base Rent $ per SF excludes vacant space. |
The depositor has filed a registration statement (including a prospectus) with the Securities and Exchange Commission (“SEC”) (SEC File No. 333-207132) for the offering to which this communication relates. Before you invest, you should read the prospectus in the registration statement and other documents the depositor has filed with the SEC for more complete information about the depositor, the issuing entity and this offering. You may get these documents for free by visiting EDGAR on the SEC website at www.sec.gov. Alternatively, the depositor or Citigroup Global Markets Inc., Morgan Stanley & Co. LLC, Merrill Lynch, Pierce, Fenner & Smith Incorporated, Drexel Hamilton, LLC, The Williams Capital Group, L.P. or any other underwriter or dealer participating in this offering will arrange to send you the prospectus if you request it by calling toll-free 1-800-831-9146.
57
LOAN #3: the socal portfolio
The following table presents certain information relating to historical leasing at the SoCal Portfolio Properties:
Historical Leased %(1)
| 2013 | 2014 | 2015 | 2016 | As of 1/31/2018(2) |
| Owned Space | 71.4% | 73.5% | 73.8% | 80.5% | 83.8% |
| (1) | As provided by the borrower and which represents average occupancy for the entire portfolio for the indicated year unless otherwise specified. |
| (2) | Based on the underwritten rent roll dated January 31, 2018. |
| ■ | Operating History and Underwritten Net Cash Flow. The following table presents certain information relating to the historical operating performance and the Underwritten Net Cash Flow at the SoCal Portfolio Properties: |
Cash Flow Analysis
2014 | 2015 | 2016 | TTM 10/31/2017 | Underwritten | Underwritten $ per SF | ||||||
| Base Rent(1) | $22,635,136 | $24,966,236 | $26,195,773 | $27,378,658 | $30,806,862 | $14.04 | |||||
| Rent Steps(2) | 0 | 0 | 0 | 0 | 1,087,677 | 0.50 | |||||
| Gross Up Vacancy | 0 | 0 | 0 | 0 | 7,076,821 | 3.22 | |||||
| Reimbursements | 3,383,522 | 3,469,630 | 4,056,635 | 4,228,189 | 3,599,321 | 1.64 | |||||
| Other Income | 209,157 | 165,397 | 187,042 | 177,985 | 0 | 0.00 | |||||
| Gross Revenue | $26,227,815 | $ 28,601,263 | $30,439,450 | $31,784,832 | $42,570,681 | $19.40 | |||||
| Vacancy & Credit Loss | 0 | 0 | 0 | 0 | (7,104,585) | (3.24) | |||||
| Effective Gross Income | $26,227,815 | $28,601,263 | $30,439,450 | $31,784,832 | $35,466,096 | $16.16 | |||||
| Real Estate Taxes | $2,619,257 | $2,422,015 | $2,628,392 | $2,586,760 | $2,633,658 | $1.20 | |||||
| Insurance | 405,884 | 435,705 | 430,089 | 437,377 | 419,250 | 0.19 | |||||
| Management Fee | 786,834 | 858,038 | 913,184 | 953,545 | 1,063,983 | 0.48 | |||||
| Other Operating Expenses | 7,155,517 | 7,382,192 | 7,398,260 | 7,733,951 | 7,962,933 | 3.63 | |||||
| Total Operating Expenses | $10,967,492 | $11,097,950 | $11,369,925 | $11,711,633 | $12,079,824 | $5.50 | |||||
| Net Operating Income | $15,260,323 | $17,503,313 | $19,069,526 | $20,073,199 | $23,386,272 | $10.66 | |||||
| TI/LC | 0 | 0 | 0 | 0 | 1,376,463 | 0.63 | |||||
| Capital Expenditures | 0 | 0 | 0 | 0 | 424,815 | 0.19 | |||||
| Net Cash Flow | $15,260,323 | $17,503,313 | $19,069,526 | $20,073,199 | $21,584,994 | $9.84 | |||||
| Occupancy(3) | 73.5% | 73.8% | 80.5% | NAV | 83.3% | ||||||
| NOI Debt Yield | 6.7% | 7.6% | 8.3% | 8.8% | 10.2% | ||||||
| NCF DSCR | 1.05x | 1.20x | 1.31x | 1.38x | 1.48x |
| (1) | The Increase from TTM 10/31/2017 Base Rent to Underwritten Base Rent is primarily from (i) rent abatements and (ii) new leasing at the 24 SoCal Portfolio Properties. |
| (2) | Underwritten Rent Steps includes contractual rent steps ($599,679) through February 2019 and the present value of rent steps for credit tenants ($487,998). |
| (3) | Underwritten Occupancy represents the underwritten economic vacancy of 16.7%. |
| ■ | Appraisal. According to the appraisal, the SoCal Portfolio Properties had an aggregate “as-is” appraised value of $386,140,000 with value dates ranging from of November 23, 2017 through December 9, 2017. |
| ■ | Environmental Matters.According to the Phase I environmental reports, dated between December 6, 2017 and December 15, 2017, there are no recognized environmental conditions or recommendations for further action for the SoCal Portfolio Properties with the exception of the 30th Street Commerce Center Property. At the 30th Street Commerce Center property, a drycleaner has operated from approximately 1987 to the present, which previously utilized Tetrachloroethene (“PCE”) as a cleaning solvent until the former PCE dry cleaning machine was replaced with the existing hydrocarbon machine. A sub slab depressurization (“SSD”) system was installed and has been operating with monthly monitoring since January 2016. The phase I environmental report noted that since July 2016, the data has indicated stable to decreasing trends but the continued presence of PCE in soil vapor and the ongoing operation of the SSD system are considered a recognized environmental condition. The phase I environmental report recommended the continued operation of the onsite SSD system. |
The depositor has filed a registration statement (including a prospectus) with the Securities and Exchange Commission (“SEC”) (SEC File No. 333-207132) for the offering to which this communication relates. Before you invest, you should read the prospectus in the registration statement and other documents the depositor has filed with the SEC for more complete information about the depositor, the issuing entity and this offering. You may get these documents for free by visiting EDGAR on the SEC website at www.sec.gov. Alternatively, the depositor or Citigroup Global Markets Inc., Morgan Stanley & Co. LLC, Merrill Lynch, Pierce, Fenner & Smith Incorporated, Drexel Hamilton, LLC, The Williams Capital Group, L.P. or any other underwriter or dealer participating in this offering will arrange to send you the prospectus if you request it by calling toll-free 1-800-831-9146.
58
LOAN #3: the socal portfolio
| ■ | Market Overview and Competition.The SoCal Portfolio Properties are located primarily in southern California within four different metropolitan statistical areas (“each aMSA”), the Los Angeles-Long Beach-Anaheim, California MSA, the Riverside-San Bernardino-Ontario, California MSA, the Fresno, California MSA and the Bakersfield, California MSA. See the tables below for demographic summaries of each MSA as well as each SoCal Portfolio Property’s three-mile radius demographics and third quarter 2017 CoStar data for each SoCal Portfolio Property’s submarket related to vacancy rates and average asking rents. |
The following table presents certain information relating to the four MSAs containing the 24 SoCal Portfolio Properties:
MSA | Estimated 2017 | Average Household |
| Los Angeles-Long Beach-Anaheim, California MSA | 13,505,354 | $95,979 |
| Riverside-San Bernardino-Ontario, California MSA | 4,542,092 | $80,989 |
| Fresno, California MSA | 989,303 | $71,247 |
| Bakersfield, California MSA | 897,549 | $71,956 |
(1) Source: Appraisals.
The following table presents certain information relating to the markets and submarkets for the SoCal Portfolio Properties:
SoCal Portfolio Market and Submarket Summary(1)
MSA/Property Name | Property | Allocated Loan Combination Original Balance | % Allocated Loan Combination Original Balance | Estimated 2017 3-mile population(1) | Estimated 2017 3-mile average household income(1) | CoStar third quarter 2017 Submarket Vacancy | CoStar third quarter 2017 Submarket Average Asking | |||||||||||
| Los Angeles-Long Beach-Anaheim, California MSA | ||||||||||||||||||
| 1. Aliso Viejo Commerce Center | Retail | $27,761,791 | 12.1 | % | 117,048 | $143,075 | 6.1% | $36.24 | ||||||||||
| 2. Palmdale Place | Mixed Use | 16,250,000 | 7.1 | 91,940 | $56,970 | 7.1% | $20.64 | |||||||||||
| 3. Sierra Gateway | Office | 14,800,000 | 6.5 | 45,569 | $64,815 | 11.7% | $27.36 | |||||||||||
| 4. Commerce Corporate Center | Office | 13,000,000 | 5.7 | 285,547 | $54,922 | 5.7% | $26.88 | |||||||||||
| 5. Airport One Office Park | Office | 11,394,743 | 5.0 | 209,537 | $92,984 | 5.9% | $27.48 | |||||||||||
| 6. Diamond Bar | Retail | 6,650,000 | 2.9 | 88,780 | $117,892 | 4.8% | $23.76 | |||||||||||
| 7. Atlantic Plaza | Retail | 6,000,000 | 2.6 | 222,506 | $75,864 | 4.0% | $25.44 | |||||||||||
| 8. 10th Street Commerce Center | Retail | 4,913,128 | 2.1 | 108,567 | $65,180 | 7.1% | $20.64 | |||||||||||
| 9. Cityview Plaza | Office | 4,500,000 | 2.0 | 285,041 | $74,770 | 5.1% | $20.88 | |||||||||||
| 10. Garden Grove Town Center | Retail | 3,502,732 | 1.5 | 307,079 | $74,560 | 5.0% | $26.52 | |||||||||||
| 11. 30th Street Commerce Center | Retail | 1,875,896 | 0.8 | 94,574 | $56,656 | 7.1% | $20.64 | |||||||||||
| 12. Anaheim Stadium Industrial | Industrial | 1,750,000 | 0.8 | 242,186 | $77,761 | 1.2% | $10.92 | |||||||||||
| 13. 25th Street Commerce Center | Retail | 1,293,737 | 0.6 | 94,574 | $56,656 | 7.1% | $20.64 | |||||||||||
| Total / Wtd. Avg. | $113,692,027 | 49.6 | % | 150,040 | $88,865 | |||||||||||||
| Riverside-San Bernardino-Ontario, California MSA | ||||||||||||||||||
| 1. Transpark Commerce | Office | $25,143,236 | 11.0 | % | 90,310 | $66,638 | 8.2% | $22.10 | ||||||||||
| 2. Wimbledon | Mixed Use | 22,230,241 | 9.7 | 61,223 | $63,876 | 5.8% | $14.52 | |||||||||||
| 3. Upland Freeway | Retail | 13,032,927 | 5.7 | 197,498 | $73,803 | 7.9% | $20.52 | |||||||||||
| 4. Moreno Valley | Mixed Use | 11,395,118 | 5.0 | 148,277 | $63,775 | 8.3% | $21.60 | |||||||||||
| 5. Colton Courtyard | Retail | 7,375,987 | 3.2 | 72,483 | $68,123 | 8.3% | $21.60 | |||||||||||
| 6. The Abbey Center | Office | 7,244,116 | 3.2 | 57,711 | $77,681 | 10.2% | $21.39 | |||||||||||
| 7. Upland Commerce Center | Retail | 6,879,276 | 3.0 | 187,747 | $82,335 | 7.9% | $20.52 | |||||||||||
| 8. Mt. Vernon Commerce Center | Industrial | 1,754,484 | 0.8 | 83,332 | $65,052 | 6.8% | $11.64 | |||||||||||
| Total / Wtd. Avg. | $95,055,384 | 41.5 | % | 108,208 | $68,695 | |||||||||||||
| Fresno, California MSA | ||||||||||||||||||
| 1. Fresno Industrial Center | Industrial | $14,000,000 | 6.1 | % | 52,913 | $41,851 | 4.0% | $4.08 | ||||||||||
| 2. Fresno Airport | Office | 1,000,000 | 0.4 | 156,366 | �� | $47,342 | 9.3% | $13.92 | ||||||||||
| Total / Wtd. Avg. | $15,000,000 | 6.5 | % | 59,810 | $42,217 | |||||||||||||
| Bakersfield, California MSA | ||||||||||||||||||
| 1. Ming Office Park | Office | $5,552,589 | 2.4 | % | 137,102 | $68,911 | 9.2% | $19.80 | ||||||||||
| Total / Wtd. Avg. | $5,552,589 | 2.4 | % | 137,102 | $68,911 | |||||||||||||
| (1) | Source: Appraisals. |
The depositor has filed a registration statement (including a prospectus) with the Securities and Exchange Commission (“SEC”) (SEC File No. 333-207132) for the offering to which this communication relates. Before you invest, you should read the prospectus in the registration statement and other documents the depositor has filed with the SEC for more complete information about the depositor, the issuing entity and this offering. You may get these documents for free by visiting EDGAR on the SEC website at www.sec.gov. Alternatively, the depositor or Citigroup Global Markets Inc., Morgan Stanley & Co. LLC, Merrill Lynch, Pierce, Fenner & Smith Incorporated, Drexel Hamilton, LLC, The Williams Capital Group, L.P. or any other underwriter or dealer participating in this offering will arrange to send you the prospectus if you request it by calling toll-free 1-800-831-9146.
59
LOAN #3: the socal portfolio
| ■ | The Borrowers. The borrowers are 27 different single-purpose, single-asset entities that are 99.0% owned by Abbey-Properties LLC and 1.0% owned by DGA Properties LLC. DGA Properties LLC is wholly owned by Abbey-Properties LLC, which is wholly owned by The Abbey Companies LLC (“The Abbey Company”), which is wholly owned by Donald G. Abbey, an individual. A non-consolidation opinion has been delivered in connection with the origination of the SoCal Portfolio Loan Combination. Donald G. Abbey is the non-recourse carveout guarantor of the SoCal Portfolio Loan Combination. |
The Abbey Company is a privately-held real estate investment and management firm founded in 1990 by Donald G. Abbey, who possesses 33 years of experience in the real estate industry. The Abbey Company acquires multi-tenant commercial properties in southern California and has established a local presence in the southern California market with offices in Los Angeles, Orange, Riverside, San Bernardino, San Diego and Sacramento counties. The Abbey Company handles all aspects of real estate ownership, including in-house leasing, management, construction, property services and acquisitions. The Abbey Company has a senior management team of eight professionals and over 75 total employees with a current portfolio size of over 34 properties encompassing around 2.3 million SF and near 1,000 tenants.
| ■ | Escrows. On the origination date of the SoCal Portfolio Loan Combination, proceeds from the SoCal Portfolio Loan Combination funded reserves of (i) $8,000,000 for future tenant improvements and leasing commissions, (ii) $1,559,061 related to outstanding tenant improvements and leasing commissions for existing tenants, (iii) $1,107,960 for free rent related to existing tenants, (iv) $1,000,000 for costs related to extending the ground leases at the Anaheim Stadium Industrial Property and Cityview Plaza Property, (v) $977,151 for deferred maintenance and (vi) $219,743 to pay for ground rent payable under the existing terms of the ground leases encumbering the SoCal Portfolio Properties with a leasehold ownership interest. |
On each due date, the borrowers will be required to fund (i) one-twelfth of the taxes that the lender estimates will be payable over the then-succeeding 12-month period (initially estimated to be $219,172), (ii) one-twelfth of the amount that the lender estimates will be necessary to pay insurance premiums over the then-succeeding 12-month period, provided that insurance is not covered under an acceptable blanket policy, (iii) $35,400 for replacement reserves subject to a cap of $1,000,000, (iv) $109,872 ground rent payable under the existing terms of the ground leases encumbering the SoCal Portfolio Properties with a leasehold interest, and (v) monthly TI/LC reserve deposits (a) through and including the monthly payment date occurring in February 2023 of approximately $1.25 per SF per annum (initially $228,586) and (b) from and after the monthly payment date occurring in March 2023 of approximately $0.75 per SF per annum. If the amount in the TI/LC reserve equals or exceeds (a) $5,000,000 through and including the monthly payment date occurring in February 2023 or (b) $2,000,000 from and after the monthly payment date in March 2023 through the Maturity Date, monthly TI/LC reserve payments will be waived, provided monthly TI/LC reserve payments will be reinstated up to the respective TI/LC reserve cap amount once the amount in the TI/LC reserve falls below $5,000,000 through and including the monthly payment date occurring in February 2023 or $2,000,000 from and after the monthly payment date occurring in March 2023 through the Maturity Date. As of the origination date of the SoCal Portfolio Loan Combination, the borrowers satisfied conditions for the monthly insurance reserve to be waived.
Should the borrowers not extend the term of either the Cityview Plaza Property or Anaheim Stadium Industrial Property ground leases on or prior to February 6, 2020 pursuant to terms reasonably acceptable by the lender, the borrowers must commence making monthly deposits into the ground lease extension reserve of $55,000 until the ground lease extension reserve funds reach an amount equal to the allocated loan amount of the applicable property or properties.
| ■ | Lockbox and Cash Management. The SoCal Portfolio Loan Combination is structured with a hard lockbox and springing cash management. The borrowers were required to send tenant direction letters to all tenants under Major Leases (as defined below) instructing them to deposit all rents and other payments into the lockbox account controlled by the lender, and any funds received by the borrowers or the property manager are required to be deposited in the lockbox within two business days of receipt. During a SoCal Portfolio Cash Management Trigger Event (as defined below), all funds in the lockbox account are required to be transferred on a daily basis into a deposit account established and maintained by the lender, and applied to all required payments and reserves as set forth in the SoCal Portfolio Loan Combination documents. Provided no SoCal Portfolio Trigger Period (as defined below) is continuing, excess cash in the deposit account is required to be disbursed to the borrowers in accordance with the SoCal Portfolio Loan Combination documents. To the extent a SoCal Portfolio Trigger Period has occurred and is |
The depositor has filed a registration statement (including a prospectus) with the Securities and Exchange Commission (“SEC”) (SEC File No. 333-207132) for the offering to which this communication relates. Before you invest, you should read the prospectus in the registration statement and other documents the depositor has filed with the SEC for more complete information about the depositor, the issuing entity and this offering. You may get these documents for free by visiting EDGAR on the SEC website at www.sec.gov. Alternatively, the depositor or Citigroup Global Markets Inc., Morgan Stanley & Co. LLC, Merrill Lynch, Pierce, Fenner & Smith Incorporated, Drexel Hamilton, LLC, The Williams Capital Group, L.P. or any other underwriter or dealer participating in this offering will arrange to send you the prospectus if you request it by calling toll-free 1-800-831-9146.
60
LOAN #3: the socal portfolio
continuing, excess cash is held by the lender as an additional reserve. Upon an event of default under the SoCal Portfolio Loan documents, the lender may apply funds held in such order of priority as it may determine.
A “Major Lease” means as to each individual property (i) any lease which, individually or when aggregated with all other leases at the applicable individual property with the same tenant or its affiliate, either (a) accounts for 15% or more of the total gross revenues for the applicable individual property (provided that such lease does not constitute a Major Lease pursuant to this clause (a) if such lease accounts for less than 0.50% of the total gross revenues for the portfolio), or (b) demises 15,000 rentable square feet or more of the applicable individual property’s gross leasable area (provided that such lease does not constitute a major lease pursuant to this clause (b) if such lease demises less than 0.75% of the total rentable square feet for the portfolio), (ii) any lease which contains any option, offer, right of first refusal or other similar entitlement to purchase all or any portion of any individual property, (iii) any lease entered into during the continuance of an event of default and (iv) any instrument guaranteeing or providing credit support for any lease meeting the requirements of (i), (ii) and/or (iii) above.
A “SoCal Portfolio Cash Management Trigger Event” will commence upon the earliest to occur of (i) an event of default or (ii) the debt yield falling below 7.75%, and will end upon (a) with respect to clause (i) above, the date on which such event of default is cured and (b) with respect to clause (ii) above, the debt yield being at least 8.0% for two consecutive calendar quarters. A cure of any SoCal Portfolio Cash Management Trigger Event may occur no more than one time during the term of the SoCal Portfolio Loan.
A “SoCal Portfolio Trigger Period” will commence upon the earliest to occur of (i) an event of default or (ii) the debt yield falling below 7.25%, and will end upon (a) with respect to clause (i) above, the date on which such event of default is cured and (b) with respect to clause (ii) above, the debt yield being at least 7.5% for two consecutive calendar quarters.
| ■ | Property Management. The SoCal Portfolio Properties are currently managed by The Abbey Management Company LLC, an affiliate of the borrowers. The lender has the right to, or to direct the borrowers to, terminate the property management agreement and replace the property manager if: (i) the property manager becomes insolvent or a debtor in an involuntary bankruptcy action or proceeding that is not dismissed within 90 days or any voluntary bankruptcy proceeding; (ii) there exists a continuing event of default (beyond any applicable notice and cure periods); (iii) the property manager has engaged in gross negligence, fraud, willful misconduct or misappropriation of funds; or (iv) a default by the property manager has occurred and is continuing under the property management agreement after the expiration of all applicable notice and cure periods. The borrowers have the right to replace the property manager if (i) no event of default has occurred and is continuing under the SoCal Portfolio Loan documents, (ii) the lender receives at least sixty days’ prior written notice, (iii) such replacement or assignment (as applicable) will not result in any event that would, directly or indirectly, cause a termination right, right of first refusal, first offer or any other similar right, cause any termination fees to be due or would cause a material adverse effect to occur under any reciprocal easement agreement, and (iv) the applicable new manager is approved by the lender in writing (which approval may be conditioned upon receipt of a rating agency confirmation) and engaged pursuant to a management agreement approved by the lender in writing (which approval may be conditioned upon receipt of a rating agency confirmation). The borrowers cannot permit the property manager to resign as manager or otherwise cease managing the applicable property until a new manager is engaged to manage such property in accordance with the applicable terms and conditions of theSoCal Portfolio Loan documents. |
| ■ | Mezzanine or Secured Subordinate Indebtedness. Not permitted. |
| ■ | Release of Collateral. Provided that no event of default is then continuing under the SoCal Portfolio Loan Combination, the SoCal Portfolio Loan Combination documents permit a partial release of one or more of the individual SoCal Portfolio Properties at any time after the earlier of February 6, 2021 and the second anniversary of the securitization of the last piece of the SoCal Portfolio Loan Combination, subject to certain conditions, including, without limitation, the following: (i) delivery of the partial defeasance collateral with respect to the SoCal Portfolio Property in accordance with the SoCal Portfolio Loan Combination documents, in each case in an amount equal to the greater of (A) 120% of the allocated loan amount for the individual SoCal Portfolio Property to be released and (B) the net sales proceeds applicable to such property, (ii) as of the release date, after giving effect to the release, the debt yield for the remaining individual SoCal Portfolio Properties is at least equal to the greater of (x) the debt yield for all individual SoCal Portfolio Properties securing the SoCal Portfolio Loan Combination immediately prior to the release and (y) the debt yield of all SoCal Portfolio Properties at origination of the SoCal Portfolio Loan, (iii) as of the release date, after giving effect to the release, the loan-to-value ratio for the remaining individual SoCal Portfolio Properties is no greater than the lesser of (a) 59.5% and (b) the loan-to-value ratio for the individual SoCal Portfolio |
The depositor has filed a registration statement (including a prospectus) with the Securities and Exchange Commission (“SEC”) (SEC File No. 333-207132) for the offering to which this communication relates. Before you invest, you should read the prospectus in the registration statement and other documents the depositor has filed with the SEC for more complete information about the depositor, the issuing entity and this offering. You may get these documents for free by visiting EDGAR on the SEC website at www.sec.gov. Alternatively, the depositor or Citigroup Global Markets Inc., Morgan Stanley & Co. LLC, Merrill Lynch, Pierce, Fenner & Smith Incorporated, Drexel Hamilton, LLC, The Williams Capital Group, L.P. or any other underwriter or dealer participating in this offering will arrange to send you the prospectus if you request it by calling toll-free 1-800-831-9146.
61
LOAN #3: the socal portfolio
Properties securing the SoCal Portfolio Loan Combination immediately prior to the release date, as applicable, and (v) delivery to lender of a REMIC opinion and rating agency confirmation.
| ■ | Terrorism Insurance. The borrowers are required to maintain an “all-risk” insurance policy that provides coverage for terrorism in an amount equal to 100% of the full replacement cost of the SoCal Portfolio Properties, plus a business interruption insurance policy that provides 18 months of business interruption coverage with an additional 6-month extended period of indemnity, with no deductible in excess of $25,000 (provided, however, that higher deductibles for damage caused by flood, earth movement, wind or terrorism are permitted so long as such higher deductibles are commercially reasonable and 5% of the total insurable value of the applicable individual property with respect to flood, earth movement or wind). See“Risk Factors—Terrorism Insurance May Not Be Available for All Mortgaged Properties” in the Preliminary Prospectus. |
The depositor has filed a registration statement (including a prospectus) with the Securities and Exchange Commission (“SEC”) (SEC File No. 333-207132) for the offering to which this communication relates. Before you invest, you should read the prospectus in the registration statement and other documents the depositor has filed with the SEC for more complete information about the depositor, the issuing entity and this offering. You may get these documents for free by visiting EDGAR on the SEC website at www.sec.gov. Alternatively, the depositor or Citigroup Global Markets Inc., Morgan Stanley & Co. LLC, Merrill Lynch, Pierce, Fenner & Smith Incorporated, Drexel Hamilton, LLC, The Williams Capital Group, L.P. or any other underwriter or dealer participating in this offering will arrange to send you the prospectus if you request it by calling toll-free 1-800-831-9146.
62
(THIS PAGE INTENTIONALLY LEFT BLANK)
The depositor has filed a registration statement (including a prospectus) with the Securities and Exchange Commission (“SEC”) (SEC File No. 333-207132) for the offering to which this communication relates. Before you invest, you should read the prospectus in the registration statement and other documents the depositor has filed with the SEC for more complete information about the depositor, the issuing entity and this offering. You may get these documents for free by visiting EDGAR on the SEC website at www.sec.gov. Alternatively, the depositor or Citigroup Global Markets Inc., Morgan Stanley & Co. LLC, Merrill Lynch, Pierce, Fenner & Smith Incorporated, Drexel Hamilton, LLC, The Williams Capital Group, L.P. or any other underwriter or dealer participating in this offering will arrange to send you the prospectus if you request it by calling toll-free 1-800-831-9146.
63
| LOAN #4: westin tysons corner |
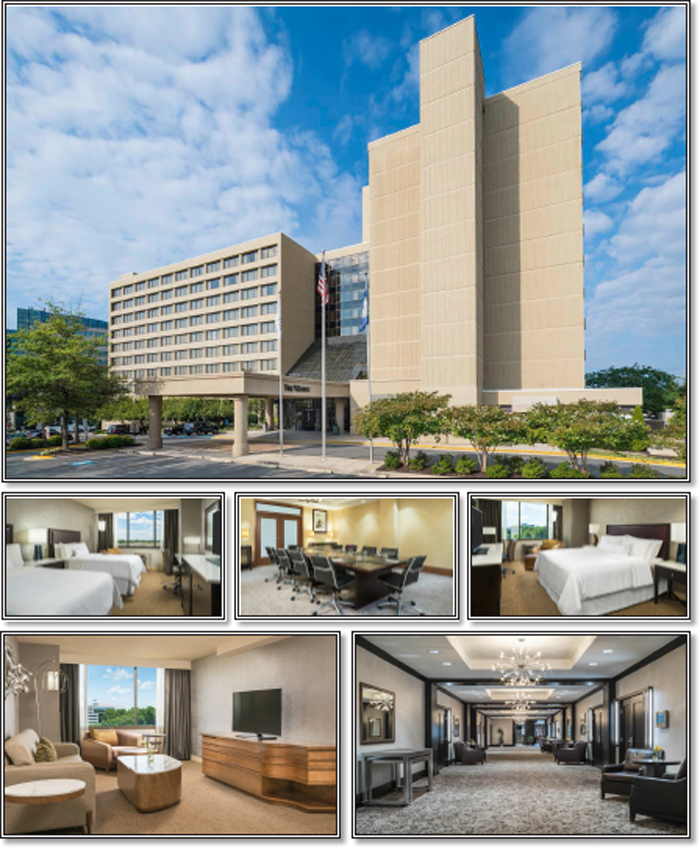
The depositor has filed a registration statement (including a prospectus) with the Securities and Exchange Commission (“SEC”) (SEC File No. 333-207132) for the offering to which this communication relates. Before you invest, you should read the prospectus in the registration statement and other documents the depositor has filed with the SEC for more complete information about the depositor, the issuing entity and this offering. You may get these documents for free by visiting EDGAR on the SEC website at www.sec.gov. Alternatively, the depositor or Citigroup Global Markets Inc., Morgan Stanley & Co. LLC, Merrill Lynch, Pierce, Fenner & Smith Incorporated, Drexel Hamilton, LLC, The Williams Capital Group, L.P. or any other underwriter or dealer participating in this offering will arrange to send you the prospectus if you request it by calling toll-free 1-800-831-9146.
64
| LOAN #4: westin tysons corner |
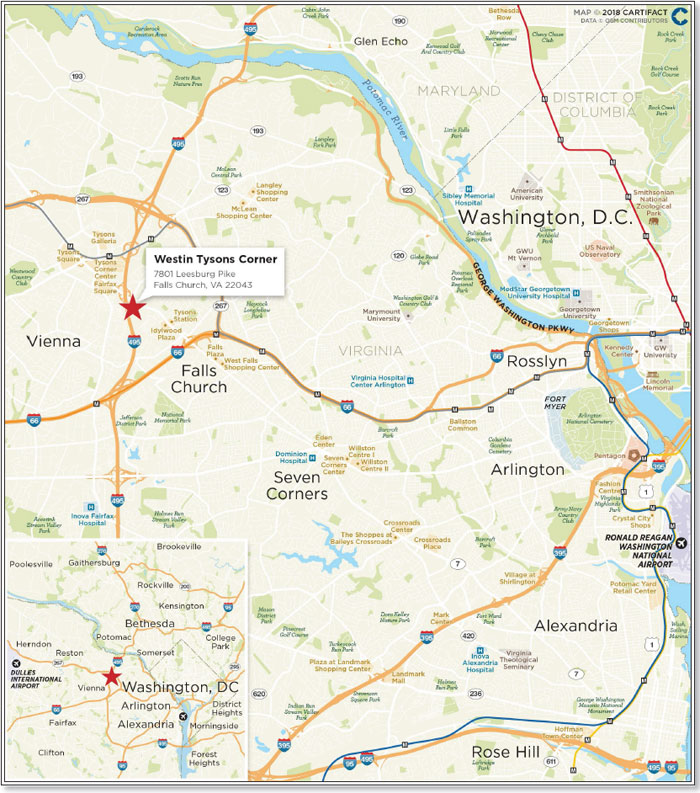
The depositor has filed a registration statement (including a prospectus) with the Securities and Exchange Commission (“SEC”) (SEC File No. 333-207132) for the offering to which this communication relates. Before you invest, you should read the prospectus in the registration statement and other documents the depositor has filed with the SEC for more complete information about the depositor, the issuing entity and this offering. You may get these documents for free by visiting EDGAR on the SEC website at www.sec.gov. Alternatively, the depositor or Citigroup Global Markets Inc., Morgan Stanley & Co. LLC, Merrill Lynch, Pierce, Fenner & Smith Incorporated, Drexel Hamilton, LLC, The Williams Capital Group, L.P. or any other underwriter or dealer participating in this offering will arrange to send you the prospectus if you request it by calling toll-free 1-800-831-9146.
65
| LOAN #4: westin tysons corner |
| Mortgaged Property Information | Mortgage Loan Information | |||||||||||||||||||
| Number of Mortgaged Properties | 1 | Loan Seller | SMF V | |||||||||||||||||
| Location (City/State) | Falls Church, Virginia | Cut-off Date Balance | $48,000,000 | |||||||||||||||||
| Property Type | Hospitality | Cut-off Date Balance per Room | $117,936.12 | |||||||||||||||||
| Size (Rooms) | 407 | Percentage of Initial Pool Balance | 4.5% | |||||||||||||||||
| Total TTM Occupancy as of 12/31/2017 | 67.3% | Number of Related Mortgage Loans | None | |||||||||||||||||
| Owned TTM Occupancy as of 12/31/2017 | 67.3% | Type of Security | Fee Simple | |||||||||||||||||
| Year Built / Latest Renovation | 1975 / 2015-2016 | Mortgage Rate | 5.36000% | |||||||||||||||||
| Appraised Value(1) | $79,000,000 | Original Term to Maturity (Months) | 120 | |||||||||||||||||
| Appraisal Date(1) | 1/1/2018 | Original Amortization Term (Months) | 360 | |||||||||||||||||
| Borrower Sponsors | Driftwood Acquisition & Development L.P., | Original Interest Only Period (Months) | NAP | |||||||||||||||||
| Carlos J. Rodriguez, Sr. and David Buddemeyer | First Payment Date | 4/6/2018 | ||||||||||||||||||
| Property Management | Driftwood Hospitality Management II, LLC | Maturity Date | 3/6/2028 | |||||||||||||||||
| Underwritten Revenues | $19,592,615 | |||||||||||||||||||
| Underwritten Expenses | $13,613,105 | Escrows(2) | ||||||||||||||||||
| Underwritten Net Operating Income (NOI) | $5,979,510 | |||||||||||||||||||
| Underwritten Net Cash Flow (NCF) | $5,195,805 | Upfront | Monthly | |||||||||||||||||
| Cut-off Date LTV Ratio(1) | 60.8% | Taxes | $313,078 | $77,350 | ||||||||||||||||
| Maturity Date LTV Ratio(1) | 50.5% | Insurance | $113,014 | $9,418 | ||||||||||||||||
| DSCR Based on Underwritten NOI / NCF | 1.86x / 1.61x | Replacement Reserves | $0 | $65,309 | ||||||||||||||||
| Debt Yield Based on Underwritten NOI / NCF | 12.5% / 10.8% | Other(1)(3) | $7,000,000 | $0 | ||||||||||||||||
| Sources and Uses | ||||||||||||||||||||
| Sources | $ | % | Uses | $ | % | |||||||||||||||
| Loan Amount | $48,000,000 | 67.9% | Purchase Price | $62,000,000 | 87.7% | |||||||||||||||
| Principal’s New Cash Contribution | 22,658,332 | 32.1 | Reserves | 7,426,092 | 10.5 | |||||||||||||||
| Closing Costs | 1,232,240 | 1.7 | ||||||||||||||||||
| Total Sources | $70,658,332 | 100.0% | Total Uses | $70,658,332 | 100.0% | |||||||||||||||
| ||||||||||||||||||||
| (1) | The Appraised Value represents the “Hypothetical Market Value As Is” appraised value of $79,000,000 as of January 1, 2018, which assumes the completion of a property improvement plan (“PIP”) that was required in connection with the acquisition of the Westin Tysons Corner Property (as defined below). At origination of the Westin Tysons Corner Loan (as defined below), the borrower deposited $7,000,000 for the required PIP. The Cut-off Date LTV Ratio and Maturity Date LTV Ratio for the Westin Tysons Corner Loan are calculated using the Appraised Value. The “as-is” appraised value for the Westin Tysons Corner Property was $69,500,000 as of January 1, 2018. The Cut-off Date LTV Ratio and Maturity Date LTV Ratio calculated using the “as-is” appraised value are 69.1% and 57.5%, respectively. |
| (2) | See “–Escrows” below. |
| (3) | At the origination of the Westin Tysons Corner Loan, the borrower sponsors deposited $7,000,000 for a change-of-ownership PIP required in connection with the acquisition of the Westin Tysons Corner Property. |
| ■ | The Mortgage Loan.The mortgage loan (the “Westin Tysons Corner Loan”) is evidenced by a note in the original principal amount of $48,000,000 and is secured by a first mortgage encumbering the borrower’s fee simple interest in a 407- room hospitality property located in Falls Church, Virginia (the “Westin Tysons Corner Property”). The Westin Tysons Corner Loan was originated by Starwood Mortgage Capital LLC on February 7, 2018 and represents approximately 4.5% of the Initial Pool Balance. The note evidencing the Westin Tysons Corner Loan has an outstanding principal balance as of the Cut-off Date of $48,000,000 and accrues interest at a rate of 5.36000%per annum. The proceeds of the Westin Tysons Corner Loan and $22,658,332 of equity were primarily used to purchase the Westin Tysons Corner Property, fund reserves and pay origination costs. |
The Westin Tysons Corner Loan has an initial term of 120 months and a remaining term of 120 months as of the Cut-off Date. The Westin Tysons Corner Loan requires payments of principal and interest sufficient to amortize the Westin Tysons Corner Loan over a 30-year amortization schedule. The scheduled maturity date of the Westin Tysons Corner Loan is March 6, 2028. At any time after the earlier of February 7, 2021 or the second anniversary of the securitization Closing Date, the Westin Tysons Corner Loan may be defeased with certain “government securities” permitted under the Westin Tysons Corner Loan documents. Additionally, the borrower may prepay the Westin Tysons Corner Loan in whole, but not in part, on any date after the earlier of February 7, 2021 or the second anniversary of the securitization Closing Date provided that the borrower pays the greater of a yield maintenance premium or a prepayment premium equal to 1.0% of the principal amount being prepaid. Voluntary prepayment of the Westin Tysons Corner Loan is permitted on or after November 6, 2027 without payment of any prepayment premium.
The depositor has filed a registration statement (including a prospectus) with the Securities and Exchange Commission (“SEC”) (SEC File No. 333-207132) for the offering to which this communication relates. Before you invest, you should read the prospectus in the registration statement and other documents the depositor has filed with the SEC for more complete information about the depositor, the issuing entity and this offering. You may get these documents for free by visiting EDGAR on the SEC website at www.sec.gov. Alternatively, the depositor or Citigroup Global Markets Inc., Morgan Stanley & Co. LLC, Merrill Lynch, Pierce, Fenner & Smith Incorporated, Drexel Hamilton, LLC, The Williams Capital Group, L.P. or any other underwriter or dealer participating in this offering will arrange to send you the prospectus if you request it by calling toll-free 1-800-831-9146.
66
| LOAN #4: westin tysons corner |
| ■ | The Mortgaged Property. The Westin Tysons Corner Property is a 407-room full service hotel located on approximately 5.3 acres in Falls Church, Virginia. Built in 1975, the Westin Tysons Corner Property underwent an approximately $7,900,000 (approximately $19,325 per room) renovation in 2015 and 2016. The renovation included upgrades to guestrooms, HVAC units, meeting spaces, public areas, food and beverage outlets and back of the house systems. The Westin Tysons Corner Property consists of nine- and 11-story, interior corridor buildings with 10,666 SF of meeting space, a state-of-the-art fitness center, business center, valet parking and complimentary shuttle service for the surrounding area. The Westin Tysons Corner Property also offers several food and beverage options, including The Chop N’ Room, a Starbucks café, the Blu Lounge, Sushi Nami, and in-room dining, offered 24-hours a day. Additionally, the Westin Tysons Corner Property is conveniently located within close proximity to numerous restaurants, shopping and entertainment.Guestrooms at the Westin Tysons Corner Property consist of 265 king bedrooms, 120 double/double bedrooms, 12 one-bedroom suites and 10 queen bedrooms. Each room is equipped with a work desk, flat screen HDTV, mini refrigerator and wireless internet access. In connection with the acquisition of the Westin Tysons Corner Property, the borrower sponsors are completing a change-of-ownership PIP with an estimated cost of approximately $7,000,000 (approximately $17,199 per room). At the origination of the Westin Tysons Corner Loan, the borrower sponsors deposited $7,000,000 into a PIP reserve. The PIP will include, among other things, guestroom renovations to the latest Westin standards, the build-out of additional meeting space, and a renovation of the existing restaurant and bar. Tysons Corner and neighboring McLean, Virginia are home to the headquarters of five Fortune 500 companies: Freddie Mac, Capital One, Hilton Worldwide, Gannett, and Booz Allen Hamilton. The area has experienced significant growth over the past five years spurred by the addition of the I-495 Express Lanes in 2012 and the delivery of the Silver Line Metro in 2014. |
The following tables present certain information relating to historical Occupancy, ADR and RevPAR at the Westin Tysons Corner Property and its competitive set, as provided in a market report:
Historical Statistics(1)
Westin Tysons Corner Property | Competitive Set | Penetration | ||||||||||
12/31/2014 | 12/31/2015 | 12/31/2016 | 12/31/2017 | 12/31/2014 | 12/31/2015 | 12/31/2016 | 12/31/2017 | 12/31/2014 | 12/31/2015 | 12/31/2016 | 12/31/2017 | |
| Occupancy | 62.1% | 63.8% | 67.0% | 67.3% | 71.0% | 71.8% | 74.2% | 73.8% | 87.5% | 88.8% | 90.3% | 91.2% |
| ADR | $144.58 | $146.79 | $146.52 | $153.18 | $165.74 | $169.82 | $172.51 | $177.87 | 87.2% | 86.4% | 84.9% | 86.1% |
| RevPAR | $89.85 | $93.63 | $98.12 | $103.05 | $117.65 | $122.01 | $127.96 | $131.32 | 76.4% | 76.7% | 76.7% | 78.5% |
| (1) | Source: Travel Research Report. |
The following table presents certain information relating to the estimated 2017 demand analysis with respect to the Westin Tysons Corner Property based on market segmentation, as provided in the appraisal for the Westin Tysons Corner Property:
Estimated 2017 Accommodated Room Night Demand(1)
Commercial | Leisure | Meeting and Group |
| 55% | 25% | 20% |
| (1) | Source: Appraisal. |
The depositor has filed a registration statement (including a prospectus) with the Securities and Exchange Commission (“SEC”) (SEC File No. 333-207132) for the offering to which this communication relates. Before you invest, you should read the prospectus in the registration statement and other documents the depositor has filed with the SEC for more complete information about the depositor, the issuing entity and this offering. You may get these documents for free by visiting EDGAR on the SEC website at www.sec.gov. Alternatively, the depositor or Citigroup Global Markets Inc., Morgan Stanley & Co. LLC, Merrill Lynch, Pierce, Fenner & Smith Incorporated, Drexel Hamilton, LLC, The Williams Capital Group, L.P. or any other underwriter or dealer participating in this offering will arrange to send you the prospectus if you request it by calling toll-free 1-800-831-9146.
67
| LOAN #4: westin tysons corner |
| ■ | Operating History and Underwritten Flow. The following table presents certain information relating to the historical operating performance and the Underwritten Net Cash Flow, on an aggregate basis and per room, at the Westin Tysons Corner Property: |
Cash Flow Analysis(1)
2014(2) | 2015(2) | 2016(2) | 2017 | Underwritten |
| Underwritten | ||||||||||||||||||
| Room Revenue | $13,281,897 | $13,841,241 | $14,543,921 | $15,232,997 | $15,308,222 | $37,612 | ||||||||||||||||||
| Food & Beverage Revenue | 3,892,039 | 3,556,677 | 3,614,449 | 3,824,712 | 3,824,712 | 9,397 | ||||||||||||||||||
| Other Revenue(3) | 222,834 | 200,634 | 364,278 | 459,682 | 459,682 | 1,129 | ||||||||||||||||||
| Total Revenue | $17,396,770 | $17,598,552 | $18,522,647 | $19,517,390 | 19,592,615 | $48,139 | ||||||||||||||||||
| Room Expense | $2,847,263 | $2,879,997 | $3,199,588 | $3,348,759 | $3,365,296 | $8,269 | ||||||||||||||||||
| Food & Beverage Expense | 2,624,878 | 2,406,022 | 2,516,212 | 2,474,837 | 2,487,058 | 6,111 | ||||||||||||||||||
| Other Expense | 65,948 | 74,899 | 106,851 | 91,481 | 91,481 | 225 | ||||||||||||||||||
| Total Departmental Expense | $5,538,090 | $5,360,917 | $5,822,652 | $5,915,077 | $5,943,835 | $14,604 | ||||||||||||||||||
| Total Undistributed Expense | 6,108,281 | 6,296,692 | 6,379,095 | 6,907,784 | 6,642,271 | 16,320 | ||||||||||||||||||
| Total Fixed Charges | 986,136 | 937,566 | 997,756 | 1,091,103 | 1,027,000 | 2,523 | ||||||||||||||||||
| Total Operating Expenses | $12,632,506 | $12,595,176 | $13,199,503 | $13,913,963 | $13,613,105 | $33,447 | ||||||||||||||||||
| Net Operating Income | $4,764,263 | $5,003,376 | $5,323,144 | $5,603,428 | $5,979,510 | $14,692 | ||||||||||||||||||
| FF&E | 695,871 | 703,942 | 740,906 | 780,696 | 783,705 | 1,926 | ||||||||||||||||||
| Net Cash Flow | $4,068,393 | $4,299,434 | $4,582,238 | $4,822,732 | $5,195,805 | $12,766 | ||||||||||||||||||
| Occupancy | 62.1% | 63.8% | 67.0% | 67.3% | 67.3% | |||||||||||||||||||
| NOI Debt Yield | 9.9% | 10.4% | 11.1% | 11.7% | 12.5% | |||||||||||||||||||
| NCF DSCR | 1.26x | 1.34x | 1.42x | 1.50x | 1.61x | |||||||||||||||||||
| (1) | Certain items such as interest expense, interest income, depreciation, amortization, debt service payments and any other non-recurring or non-operating items were excluded from the historical presentation and are not considered for the underwritten cash flow. |
| (2) | The Westin Tysons Corner Property previously served as collateral to a mortgage loan, securitized in WBCMT 2006-C28, which financed the prior owner’s acquisition and reflagging of the Westin Tysons Corner Property to the Westin brand. The prior owner failed to complete the required PIP and, in 2014, defaulted under both its franchise agreement and the prior mortgage loan. The Westin Tysons Corner Property was foreclosed upon in January 2015 and Driftwood (as defined below) was appointed receiver for the special servicer. The Westin Tysons Corner Property has since undergone an approximate $7,900,000 (approximately $19,325 per room) PIP renovation, which was completed in 2015 and 2016 to address many of the immediate repairs. As part of the renovation, two rooms that were previously down were brought back into service. |
| (3) | Other Revenue consists of A/V rental income, in-room internet and movie income, parking income, vending income, gift shop income and no show revenue. |
| ■ | Appraisal. According to the appraisal, the Westin Tysons Corner Property had a “Hypothetical Market Value As Is” appraised value of $79,000,000 as of January 1, 2018, which assumes the completion of a PIP, which was agreed to in connection with the acquisition of the Westin Tysons Corner Property. The Westin Tysons Corner Property had an “as-is” appraised value of $69,500,000 as of January 1, 2018 and is expected to have an “as-stabilized” appraised value of $82,500,000 as of January 1, 2021. |
| ■ | Environmental Matters. According to the Phase I environmental report, dated November 15, 2017, there were no recognized environmental conditions or recommendations for further action at the Westin Tysons Corner Property. |
| ■ | Market Overview and Competition. The Westin Tysons Corner Property is located in Falls Church, Virginia, directly off of I-495, at the intersection of some of the Capital Beltway (I-495), Leesburg Pike (Route 7), Chain Bridge Road (Route 123), and Interstate 66. The Westin Tysons Corner Property is equidistant between Dulles International Airport and downtown Washington, D.C. The Metrorail’s Silver Line extension through Tysons Corner to Dulles International Airport started running in July 2014, a major change that has triggered a broad redevelopment plan to transform Tysons Corner into a higher-density urban center. The Westin Tysons Corner Property is located approximately one mile from Capital One’s headquarters. Capital One is in the process of expanding its headquarters to a 24.5 acre campus, which will include a 125,000 SF mixed-use building that will serve as the bank’s training and meeting facility to house its corporate events. Once complete, it will house more than 5,000 employees, making it one of the largest employers in Fairfax County. The Westin Tysons Corner Property is located in Fairfax County, which is Virginia’s largest office market with approximately 29 million SF of office space. The area is home to six of the 15 Fortune 500 companies in the Washington, D.C. region. Furthermore, Tysons Corner and McLean are home to the headquarters of five Fortune 500 companies which provide strong corporate demand at the Westin Tysons Corner Property: Freddie Mac, Capital One, Hilton Worldwide, Gannett and Booz Allen Hamilton. Spurred by the addition of the metro line and the subsequent economic growth, the population within a five mile radius of the Westin Tysons Corner Property has grown by approximately 8.9% from approximately 275,000 in 2010 to approximately 300,000 in 2017. Furthermore, the average household income is approximately $155,000. |
The depositor has filed a registration statement (including a prospectus) with the Securities and Exchange Commission (“SEC”) (SEC File No. 333-207132) for the offering to which this communication relates. Before you invest, you should read the prospectus in the registration statement and other documents the depositor has filed with the SEC for more complete information about the depositor, the issuing entity and this offering. You may get these documents for free by visiting EDGAR on the SEC website at www.sec.gov. Alternatively, the depositor or Citigroup Global Markets Inc., Morgan Stanley & Co. LLC, Merrill Lynch, Pierce, Fenner & Smith Incorporated, Drexel Hamilton, LLC, The Williams Capital Group, L.P. or any other underwriter or dealer participating in this offering will arrange to send you the prospectus if you request it by calling toll-free 1-800-831-9146.
68
| LOAN #4: westin tysons corner |
The appraiser identified nine properties with varying degrees of competitiveness to the Westin Tysons Corner Property. The following table presents certain information related to the competitive properties identified in the appraisal for the Westin Tysons Corner Property:
Westin Tysons Corner Property Competitive Set(1)
Property | Year Opened | Number of Rooms | Commercial Demand | Meeting & Group Demand | Leisure Demand | Appraiser’s Estimated 2017 Occupancy | Appraiser’s Estimated 2017 ADR | Appraiser’s Estimated 2017 RevPAR |
| Westin Tysons Corner Property | 1975 | 407 | 55% | 20% | 25% | 66.7% | $152.72 | $101.86 |
| DoubleTree by Hilton McLean Tysons | 1970 | 316 | 50% | 25% | 25% | 65% – 70% | $120 – $130 | $75 – $85 |
| Tysons Corner Marriott | 1981 | 396 | 55% | 25% | 20% | 75% – 80% | $150 – $160 | $110 – $120 |
| Embassy Suites by Hilton Tysons Corner | 1984 | 234 | 60% | 15% | 25% | 75% – 80% | $145 – $155 | $110 – $120 |
| Sheraton Tysons Hotel | 1986 | 449 | 50% | 30% | 20% | 70% – 75% | $155 – $165 | $110 – $120 |
| Hilton McLean Tysons Corner | 1987 | 458 | 60% | 30% | 10% | 70% – 75% | $205 – $215 | $145 – $155 |
| Ritz-Carlton Tysons Corner | 1991 | 398 | 60% | 30% | 10% | 70% – 75% | $235 – $245 | $170 – $180 |
| Courtyard Tysons Corner Fairfax | 1986 | 229 | 60% | 15% | 25% | 75% – 80% | $145 – $155 | $110 – $120 |
| Hilton Garden Inn Tysons Corner | 2006 | 149 | 60% | 15% | 25% | 75% – 80% | $145 – $155 | $110 – $120 |
Hyatt Regency Tysons Corner Center | 2015 | 300 | 60% | 25% | 15% | 70% – 75% | $215 – $225 | $165 – $175 |
| Total / Wtd. Average | 3,336 | 57% | 25% | 19% | 73.1% | $175.20 | $128.06 |
| (1) | Source: Appraisal. |
| ■ | The Borrower. The borrower is 7801 Leesburg Pike Tysons Corner Owner, LLC, a single-purpose, single-asset Delaware limited liability company. Legal counsel to the borrower delivered a non-consolidation opinion in connection with the origination of the Westin Tysons Corner Loan. The non-recourse carveout guarantors are Driftwood Acquisition & Development L.P., Carlos J. Rodriguez, Sr. and David Buddemeyer. Carlos J. Rodriguez and David Buddemeyer are both principals of Driftwood Hospitality Management, LLC (“Driftwood”). Presently, Driftwood operates 42 hotels with more than 8,000 rooms throughout the United States and Costa Rica, of which it owns 25 hotels, totaling 5,300 rooms. Driftwood’s portfolio includes a number of brands that range from full-service hotels and resorts to mid-size select-service, extended stay and independent boutiques. Driftwood’s hotels include Marriott, Hilton, Hyatt, IHG and Wyndham flagged properties. Driftwood has an ongoing relationship with Marriott, with 12 hotels totaling more than approximately 2,174 rooms that have been flagged with Marriott brands. |
| ■ | Escrows. On the origination date, the borrower funded reserves of $313,078 for real estate tax expenses and $113,014 for insurance premiums with respect to the Westin Tysons Corner Property. Additionally, the borrower deposited $7,000,000 for a PIP reserve which was established in connection with the acquisition of the Westin Tysons Corner Property. |
On each due date, the borrower is required to fund (i) a tax reserve in an amount equal to one-twelfth of the amount the lender estimates will be necessary to pay taxes over the then succeeding 12-month period (initially $77,350), (ii) an insurance reserve in an amount equal to one-twelfth of the amount the lender estimates will be necessary to pay insurance over the then succeeding 12-month period (initially $9,418) and (iii) a reserve for FF&E equal to one-twelfth of 4% of annual gross revenues (initially $65,309).
| ■ | Lockbox and Cash Management. The Westin Tysons Corner Loan is structured with a soft lockbox and the borrower or property manager must cause all rents to be deposited directly into such lockbox account. Prior to the occurrence of a Trigger Event (as defined below), all amounts on deposit in the lockbox account are required to be transferred to an account designated by the borrower. Upon the occurrence of a Trigger Event and for the remainder of the term of the Westin Tysons Corner Loan, (a) credit card companies will be directed to pay all receipts directly into the lockbox account, (b) all funds in the lockbox account will be transferred to an account designated by the lender (the “Cash Management Account”), (c) monthly payments required under the loan documents (including, but not limited to, debt service and reserve payments) will be made from the Cash Management Account and (i) so long as a Trigger Event has occurred and is continuing, all excess cash flow after payment of all sums due and payable under the loan documents and all operating expenses will be retained by the lender as additional collateral for the Westin Tysons Corner Loan or (ii) if no Trigger Event has occurred and is continuing, all excess cash flow will be disbursed to the borrower. |
A “Trigger Event” means a period (a) commencing upon the occurrence of an event of default under the Westin Tysons Corner Loan documents and continuing until the cure or the lender’s waiver of such event of default, (b) commencing upon the occurrence of the debt service coverage ratio being less than 1.15x, and continuing until the debt service coverage ratio is equal to or greater than 1.20x for two consecutive calendar quarters or (c) commencing
The depositor has filed a registration statement (including a prospectus) with the Securities and Exchange Commission (“SEC”) (SEC File No. 333-207132) for the offering to which this communication relates. Before you invest, you should read the prospectus in the registration statement and other documents the depositor has filed with the SEC for more complete information about the depositor, the issuing entity and this offering. You may get these documents for free by visiting EDGAR on the SEC website at www.sec.gov. Alternatively, the depositor or Citigroup Global Markets Inc., Morgan Stanley & Co. LLC, Merrill Lynch, Pierce, Fenner & Smith Incorporated, Drexel Hamilton, LLC, The Williams Capital Group, L.P. or any other underwriter or dealer participating in this offering will arrange to send you the prospectus if you request it by calling toll-free 1-800-831-9146.
69
| LOAN #4: westin tysons corner |
upon the occurrence of a Franchise Agreement Trigger Event (as defined below) and continuing until the borrower has cured all defaults under the franchise agreement, the borrower and the franchisor have reaffirmed the franchise agreement, and/or the borrower has entered into a new franchise agreement with a new franchisor (which new franchisor and franchise agreement will be subject to lender approval).
A “Franchise Agreement Trigger Event” means the occurrence of any of the following: (i) the borrower being in default under the franchise agreement beyond any applicable notice and cure periods; (ii) the borrower or franchisor giving notice that it is terminating the franchise agreement; (iii) any bankruptcy or similar insolvency of the franchisor; (iv) the property failing to be “flagged” pursuant to the franchise agreement; (v) any termination or cancellation of the franchise agreement and/or the franchise agreement expiring or otherwise failing to otherwise be in full force and effect; and (vi) any permit, whether held by the borrower, property manager, or otherwise, applicable to the franchise agreement ceasing to be in full force and effect.
| ■ | Property Management. The Westin Tysons Corner Property is managed by Driftwood Hospitality Management II, LLC, an affiliate of the borrower. Under the Westin Tysons Corner Loan documents, the Westin Tysons Corner Property may be managed by Driftwood Hospitality Management II, LLC or any other management company reasonably approved by the lender and with respect to which a rating agency confirmation has been received. Upon any of (i) the occurrence of an event of default under the Westin Tysons Corner Loan documents, (ii) a default by the property manager under the management agreement beyond any applicable notice and cure period, (iii) the insolvency or the filing of a bankruptcy petition with respect to the property manager or (iv) the engagement by the property manager in gross negligence, fraud, willful misconduct or misappropriation of funds, the lender may require the borrowers to terminate the management agreement and replace the property manager with a new property manager selected by the borrowers, subject to the lender’s approval and, if required by the lender, with respect to which a rating agency confirmation has been received. |
| ■ | Mezzanine or Secured Subordinate Indebtedness. From and after February 7, 2023, mezzanine debt from an acceptable mezzanine lender is permitted, subject to the lender’s approval, under the following conditions, among others: (a) minimum combined debt service coverage ratio of 1.40x, (b) aggregate maximum loan-to-value ratio of 75.0%, (c) the Westin Tysons Corner Property will have satisfied a debt yield of 12.0% for at least two consecutive non-overlapping trailing 12 calendar month periods, (d) delivery of a satisfactory intercreditor agreement, coterminous loan and mezzanine financing and (e) rating agency confirmation. |
| ■ | Release of Collateral. Not permitted. |
| ■ | Terrorism Insurance. The borrower is required to maintain an “all-risk” insurance policy that provides coverage for terrorism in an amount equal to the full replacement cost of the Westin Tysons Corner Property, plus business interruption coverage in an amount equal to 100% of the projected net operating income plus fixed expenses of the Westin Tysons Corner Property for 18 months. The “all-risk” policy containing terrorism insurance is required to contain a deductible that is acceptable to the lender and is no greater than $25,000. See “Risk Factors—Terrorism Insurance May Not Be Available for All Mortgaged Properties” in the Preliminary Prospectus. |
The depositor has filed a registration statement (including a prospectus) with the Securities and Exchange Commission (“SEC”) (SEC File No. 333-207132) for the offering to which this communication relates. Before you invest, you should read the prospectus in the registration statement and other documents the depositor has filed with the SEC for more complete information about the depositor, the issuing entity and this offering. You may get these documents for free by visiting EDGAR on the SEC website at www.sec.gov. Alternatively, the depositor or Citigroup Global Markets Inc., Morgan Stanley & Co. LLC, Merrill Lynch, Pierce, Fenner & Smith Incorporated, Drexel Hamilton, LLC, The Williams Capital Group, L.P. or any other underwriter or dealer participating in this offering will arrange to send you the prospectus if you request it by calling toll-free 1-800-831-9146.
70
(THIS PAGE INTENTIONALLY LEFT BLANK)
The depositor has filed a registration statement (including a prospectus) with the Securities and Exchange Commission (“SEC”) (SEC File No. 333-207132) for the offering to which this communication relates. Before you invest, you should read the prospectus in the registration statement and other documents the depositor has filed with the SEC for more complete information about the depositor, the issuing entity and this offering. You may get these documents for free by visiting EDGAR on the SEC website at www.sec.gov. Alternatively, the depositor or Citigroup Global Markets Inc., Morgan Stanley & Co. LLC, Merrill Lynch, Pierce, Fenner & Smith Incorporated, Drexel Hamilton, LLC, The Williams Capital Group, L.P. or any other underwriter or dealer participating in this offering will arrange to send you the prospectus if you request it by calling toll-free 1-800-831-9146.
71
LOAN #5: extra space self storage portfolio

The depositor has filed a registration statement (including a prospectus) with the Securities and Exchange Commission (“SEC”) (SEC File No. 333-207132) for the offering to which this communication relates. Before you invest, you should read the prospectus in the registration statement and other documents the depositor has filed with the SEC for more complete information about the depositor, the issuing entity and this offering. You may get these documents for free by visiting EDGAR on the SEC website at www.sec.gov. Alternatively, the depositor or Citigroup Global Markets Inc., Morgan Stanley & Co. LLC, Merrill Lynch, Pierce, Fenner & Smith Incorporated, Drexel Hamilton, LLC, The Williams Capital Group, L.P. or any other underwriter or dealer participating in this offering will arrange to send you the prospectus if you request it by calling toll-free 1-800-831-9146.
72
LOAN #5: extra space self storage portfolio
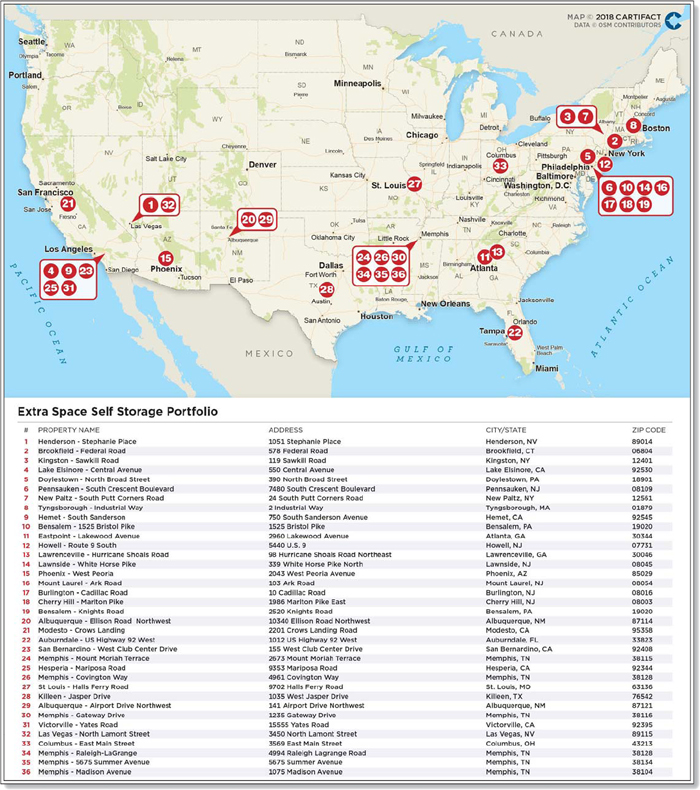
The depositor has filed a registration statement (including a prospectus) with the Securities and Exchange Commission (“SEC”) (SEC File No. 333-207132) for the offering to which this communication relates. Before you invest, you should read the prospectus in the registration statement and other documents the depositor has filed with the SEC for more complete information about the depositor, the issuing entity and this offering. You may get these documents for free by visiting EDGAR on the SEC website at www.sec.gov. Alternatively, the depositor or Citigroup Global Markets Inc., Morgan Stanley & Co. LLC, Merrill Lynch, Pierce, Fenner & Smith Incorporated, Drexel Hamilton, LLC, The Williams Capital Group, L.P. or any other underwriter or dealer participating in this offering will arrange to send you the prospectus if you request it by calling toll-free 1-800-831-9146.
73
LOAN #5: extra space self storage portfolio
| Mortgaged Property Information | Mortgage Loan Information | |||||
| Number of Mortgaged Properties | 36 | Loan Seller | MSMCH | |||
| Location (City/State) | Various | Cut-off Date Balance(4) | $42,400,000 | |||
| Property Type | Self Storage | Cut-off Date Balance per SF(3) | $72.86 | |||
| Size (SF) | 2,668,218 | Percentage of Initial Pool Balance | 4.0% | |||
| Total Occupancy as of 9/30/2017 | 95.1% | Number of Related Mortgage Loans(2) | 2 | |||
| Owned Occupancy as of 9/30/2017 | 95.1% | Type of Security | Fee Simple | |||
| Year Built / Latest Renovation | Various | Mortgage Rate | 4.17500% | |||
| Appraised Value(1) | $299,250,000 | Original Term to Maturity (Months) | 120 | |||
| Appraisal Date(1) | November 1, 2017 | Original Amortization Term (Months) | NAP | |||
Borrower Sponsors (2)
Property Management | Extra Space Storage Inc. and TH Real Estate | Original Interest Only Term (Months) First Payment Date Maturity Date | 120 1/1/2018 12/1/2027 | |||
| Underwritten Revenues | $27,645,157 | |||||
| Underwritten Expenses | $10,672,978 | |||||
| Underwritten Net Operating Income (NOI) | $16,972,179 | Escrows(5) | ||||
| Underwritten Net Cash Flow (NCF) | $16,559,528 | Upfront | Monthly | |||
| Cut-off Date LTV Ratio(1)(3) | 65.0% | Taxes | $0 | $0 | ||
| Maturity Date LTV Ratio(1)(3) | 65.0% | Insurance | $0 | $0 | ||
| DSCR Based on Underwritten NOI / NCF(3) | 2.06x / 2.01x | Replacement Reserves | $0 | $0 | ||
| Debt Yield Based on Underwritten NOI / NCF(3) | 8.7% / 8.5% | Other | $0 | $0 | ||
| Sources and Uses | ||||||
| Sources | $ | % | Uses | $ | % | |
| Loan Combination Amount | $194,400,000 | 65.7% | Purchase Price | $295,000,000 | 99.7% | |
| Principal’s New Cash Contribution | 101,415,237 | 34.3 | Closing Costs | 815,237 | 0.3 | |
| Total Sources | $295,815,237 | 100.0% | Total Uses | $295,815,237 | 100.0% | |
| (1) | The Appraised Value represents the “As Portfolio” bulk appraised value based on individual valuations dated between October 7, 2017 to November 1, 2017, which is inclusive of a $16,600,000 portfolio premium. The Cut-off Date LTV Ratio and Maturity Date LTV Ratio are calculated based upon the Extra Space Self Storage Portfolio Appraised Value of $299,250,000. The Cut-off Date LTV Ratio and Maturity Date LTV Ratio based on the sum of the individual “as-is” appraised values of $282,650,000 are each 68.8%. |
| (2) | The Extra Space Self Storage Portfolio Loan Combination borrower sponsors are also the borrower sponsors of the Extra Space - TIAA Self Storage Portfolio, as to which Bank of America, N.A. is the mortgage loan seller. |
| (3) | Calculated based on the aggregate outstanding principal balance as of the Cut-off Date of the Extra Space Self Storage Portfolio Loan Combination (as defined below). |
| (4) | The Cut-off Date Balance of $42,400,000 represents the non-controlling note A-3 which is part of a loan combination evidenced by threepari passu notes having an aggregate outstanding principal balance as of the Cut-off Date of $194,400,000. The related companion loans, which are evidenced by the controlling note A-1 and the non-controlling note A-2, have an aggregate outstanding principal balance as of the Cut-off Date of $152,000,000 and were contributed to the MSC 2017-HR2 and BANK 2018-BNK10 securitization transactions, respectively. See “—The Mortgage Loan” below. |
| (5) | See “—Escrows” below. |
| ■ | The Mortgage Loan.The mortgage loan (the “Extra Space Self Storage Portfolio Loan”) is part of a loan combination (the “Extra Space Self Storage Portfolio Loan Combination”) evidenced by threepari passunotes that are together secured by a first mortgage encumbering the borrower’s fee interests in a 36 building self storage portfolio located in 15 states (the “Extra Space Self Storage Portfolio Properties”). The Extra Space Self Storage Portfolio Loan, which is evidenced by note A-3 and represents a non-controlling interest in the Extra Space Self Storage Portfolio Loan Combination, had an original principal balance of $42,400,000, and has a Cut-off Date Balance of $42,400,000. The Extra Space Self Storage Portfolio Loan represents approximately 4.0% of the Initial Pool Balance. The related companion loans are evidenced by the controlling note A-1, which had an original principal balance of $92,000,000, has an outstanding principal balance as of the Cut-off Date of $92,000,000 and was contributed to the MSC 2017-HR2 securitization transaction and the non-controlling note A-2, which had an original principal balance of $60,000,000, has an outstanding principal balance as of the Cut-off Date of $60,000,000 and was contributed to the BANK 2018-BNK10 securitization transaction. The Extra Space Self Storage Portfolio Loan Combination was originated by Morgan Stanley Bank, N.A. on November 30, 2017, had an original principal balance of $194,400,000 and has an outstanding principal balance as of the Cut-off Date of $194,400,000. The Extra Space Self Storage Portfolio Loan Combination accrues interest at an interest rate of 4.17500%per annum. The proceeds of the Extra Space Self Storage Portfolio Loan Combination were primarily used to recapitalize the prior debt secured by the Extra Space Self Storage Portfolio Properties and pay origination costs. |
Loan Combination Summary
| Note | Original Balance | Cut-off Date Balance | Note Holder | Controlling Piece | ||||||
| A-1 | $92,000,000 | $92,000,000 | MSC 2017-HR2 | Yes | ||||||
| A-2 | $60,000,000 | $60,000,000 | BANK 2018-BNK10 | No | ||||||
| A-3 | $42,400,000 | $42,400,000 | CGCMT 2018-B2 | No | ||||||
| Total / Wtd. Avg. | $194,400,000 | $194,400,000 | ||||||||
The depositor has filed a registration statement (including a prospectus) with the Securities and Exchange Commission (“SEC”) (SEC File No. 333-207132) for the offering to which this communication relates. Before you invest, you should read the prospectus in the registration statement and other documents the depositor has filed with the SEC for more complete information about the depositor, the issuing entity and this offering. You may get these documents for free by visiting EDGAR on the SEC website at www.sec.gov. Alternatively, the depositor or Citigroup Global Markets Inc., Morgan Stanley & Co. LLC, Merrill Lynch, Pierce, Fenner & Smith Incorporated, Drexel Hamilton, LLC, The Williams Capital Group, L.P. or any other underwriter or dealer participating in this offering will arrange to send you the prospectus if you request it by calling toll-free 1-800-831-9146.
74
LOAN #5: extra space self storage portfolio
The Extra Space Self Storage Portfolio Loan Combination had an initial term of 120 months and has a remaining term of 117 months as of the Cut-off Date. The Extra Space Self Storage Portfolio Loan Combination requires payments of interest only during its term. The scheduled maturity date of the Extra Space Self Storage Portfolio Loan Combination is the due date in December 2027. At any time after the second anniversary of the securitization Closing Date (the “Release Date”), the Extra Space Self Storage Portfolio Loan Combination may be defeased in full or in part with certain direct full faith and credit obligations of the United States of America or other obligations which are “government securities” permitted under the Extra Space Self Storage Portfolio Loan Combination documents. Voluntary prepayment of the Extra Space Self Storage Portfolio Loan Combination without payment of any prepayment premium is permitted on or after the due date in June 2027.
| ■ | The Mortgaged Properties. The Extra Space Self Storage Portfolio Properties are comprised of 36 Extra Space branded self storage properties containing a total of 20,890 units, comprised of approximately 77% non-climate controlled units, approximately 17% climate controlled units and approximately 6% recreational vehicle (“RV”) storage units. Average unit size, excluding RV storage, office, and warehouse square footage, is 112 square feet. The Extra Space Self Storage Portfolio Properties range in size from approximately 27,400 square feet to 292,316 square feet, inclusive of parking square footage. The total portfolio square footage is comprised of approximately 86% storage square footage and approximately 14% parking square footage. While the percentage of parking square feet accounts for less than 15% of total square feet for 32 of the properties in the Extra Space Self Storage Portfolio, four properties including Henderson - Stephanie Place, Lake Elsinore - Central Avenue, Memphis - Covington Way and Killeen - Jasper Drive, have parking square footage that accounts for greater than 15% of the individual property square footage, the largest of which, Henderson – Stephanie Place, accounts for approximately 61% of the individual property’s total square footage. |
The Extra Space Self Storage Portfolio Properties are located across 15 states, with the largest presence in California (six properties, 17.8% of total square feet), New Jersey (six properties, 14.5% of total square feet), Nevada (two properties, 13.1% of total square feet) and Tennessee (six properties, 12.3% of total square feet) with the remaining 16 properties (42.3% of total square feet) located across 11 different states. The largest property accounts for only 6.6% of underwritten net cash flow and only two properties account for more than 5.0% of underwritten net cash flow. The five largest properties by underwritten net cash flow account for 25.0% of the portfolio’s underwritten net cash flow while the ten largest properties account for 44.5% of the portfolio’s underwritten net cash flow. The Extra Space Self Storage Portfolio Properties were built between 1940 and 2013 with a weighted average year built of 1988 and were acquired by Extra Space Storage or its affiliates between 2000 and 2013. According to the Extra Space Self Storage Portfolio Borrower, approximately $8.5 million in capital expenditures has been spent across the portfolio between 2010 and 2016. The weighted average occupancy for the Extra Space Self Storage Portfolio Properties was 95.1% by square feet and 94.7% by unit, as of September 30, 2017.
The depositor has filed a registration statement (including a prospectus) with the Securities and Exchange Commission (“SEC”) (SEC File No. 333-207132) for the offering to which this communication relates. Before you invest, you should read the prospectus in the registration statement and other documents the depositor has filed with the SEC for more complete information about the depositor, the issuing entity and this offering. You may get these documents for free by visiting EDGAR on the SEC website at www.sec.gov. Alternatively, the depositor or Citigroup Global Markets Inc., Morgan Stanley & Co. LLC, Merrill Lynch, Pierce, Fenner & Smith Incorporated, Drexel Hamilton, LLC, The Williams Capital Group, L.P. or any other underwriter or dealer participating in this offering will arrange to send you the prospectus if you request it by calling toll-free 1-800-831-9146.
75
LOAN #5: extra space self storage portfolio
| The following table presents certain information relating to the Extra Space Self Storage Portfolio Properties: |
Portfolio Summary
Property Name | City | State | Year Built | Total GLA(1) | Units | Cut-off Date Allocated Loan Amount(2) | % of ALA | Appraised Value(3) | % of Appraised Value | |||||||||
| Henderson - Stephanie Place | Henderson | NV | 1996 | 292,316 | 1,136 | $13,010,000 | 6.7% | $18,700,000 | 6.6% | |||||||||
| Brookfield - Federal Road | Brookfield | CT | 1988, 2001 | 80,250 | 699 | 9,710,000 | 5.0 | 13,800,000 | 4.9 | |||||||||
| Kingston - Sawkill Road | Kingston | NY | 1986, 2001 | 85,675 | 753 | 9,330,000 | 4.8 | 12,400,000 | 4.4 | |||||||||
| Lake Elsinore - Central Avenue | Lake Elsinore | CA | 2000, 2013 | 105,785 | 654 | 8,310,000 | 4.3 | 12,300,000 | 4.4 | |||||||||
| Doylestown - North Broad Street | Doylestown | PA | 1988 | 71,355 | 557 | 8,130,000 | 4.2 | 11,400,000 | 4.0 | |||||||||
| Pennsauken - South Crescent Boulevard | Pennsauken | NJ | 1990 | 82,810 | 738 | 7,910,000 | 4.1 | 12,300,000 | 4.4 | |||||||||
| New Paltz - South Putt Corners Road | New Paltz | NY | 1989, 2001 | 76,226 | 736 | 7,720,000 | 4.0 | 10,900,000 | 3.9 | |||||||||
| Tyngsborough - Industrial Way | Tyngsborough | MA | 1990 | 79,200 | 575 | 7,640,000 | 3.9 | 10,300,000 | 3.6 | |||||||||
| Hemet - South Sanderson | Hemet | CA | 1985, 2002 | 90,193 | 732 | 7,280,000 | 3.7 | 11,000,000 | 3.9 | |||||||||
| Bensalem - 1525 Bristol Pike | Bensalem | PA | 2000 | 71,070 | 637 | 7,160,000 | 3.7 | 10,800,000 | 3.8 | |||||||||
| Eastpoint - Lakewood Avenue | Atlanta | GA | 1962, 1989, 2005 | 90,200 | 806 | 6,830,000 | 3.5 | 11,150,000 | 3.9 | |||||||||
| Howell - Route 9 South | Howell | NJ | 1987 | 69,765 | 702 | 6,650,000 | 3.4 | 10,000,000 | 3.5 | |||||||||
| Lawrenceville - Hurricane Shoals Road | Lawrenceville | GA | 1995 | 103,830 | 751 | 6,600,000 | 3.4 | 9,150,000 | 3.2 | |||||||||
| Lawnside - White Horse Pike | Lawnside | NJ | 1977 | 64,565 | 665 | 6,400,000 | 3.3 | 10,300,000 | 3.6 | |||||||||
| Phoenix - West Peoria | Phoenix | AZ | 1980, 1998 | 63,214 | 631 | 5,750,000 | 3.0 | 9,300,000 | 3.3 | |||||||||
| Mount Laurel - Ark Road | Mount Laurel | NJ | 1987 | 46,145 | 409 | 5,200,000 | 2.7 | 7,700,000 | 2.7 | |||||||||
| Burlington - Cadillac Road | Burlington | NJ | 1940 | 62,160 | 672 | 5,160,000 | 2.7 | 7,700,000 | 2.7 | |||||||||
| Cherry Hill - Marlton Pike | Cherry Hill | NJ | 1990 | 61,140 | 492 | 5,150,000 | 2.6 | 7,500,000 | 2.7 | |||||||||
| Bensalem - Knights Road | Bensalem | PA | 2004 | 48,546 | 442 | 4,980,000 | 2.6 | 7,600,000 | 2.7 | |||||||||
| Albuquerque - Ellison Road Northwest | Albuquerque | NM | 1993 | 54,860 | 514 | 4,890,000 | 2.5 | 6,900,000 | 2.4 | |||||||||
| Modesto - Crows Landing | Modesto | CA | 2002 | 76,350 | 570 | 4,650,000 | 2.4 | 6,000,000 | 2.1 | |||||||||
| Auburndale - US Highway 92 West | Auburndale | FL | 2000 | 63,675 | 525 | 4,600,000 | 2.4 | 5,700,000 | 2.0 | |||||||||
| San Bernardino - West Club Center Drive | San Bernardino | CA | 1989 | 63,578 | 513 | 4,360,000 | 2.2 | 6,300,000 | 2.2 | |||||||||
| Memphis - Mount Moriah Terrace | Memphis | TN | 1982, 1997 | 84,610 | 676 | 4,200,000 | 2.2 | 5,650,000 | 2.0 | |||||||||
| Hesperia - Mariposa Road | Hesperia | CA | 1999 | 77,600 | 536 | 3,870,000 | 2.0 | 5,600,000 | 2.0 | |||||||||
| Memphis - Covington Way | Memphis | TN | 1984, 1997 | 78,040 | 523 | 3,820,000 | 2.0 | 5,300,000 | 1.9 | |||||||||
| St. Louis - Halls Ferry Road | St. Louis | MO | 1998 | 58,200 | 465 | 3,510,000 | 1.8 | 5,100,000 | 1.8 | |||||||||
| Killeen - Jasper Drive | Killeen | TX | 1974, 1979, 2004 | 94,970 | 717 | 3,470,000 | 1.8 | 6,000,000 | 2.1 | |||||||||
| Albuquerque - Airport Drive Northwest | Albuquerque | NM | 1987 | 53,240 | 400 | 2,970,000 | 1.5 | 4,500,000 | 1.6 | |||||||||
| Memphis - Gateway Drive | Memphis | TN | 1987 | 50,300 | 387 | 2,820,000 | 1.5 | 3,650,000 | 1.3 | |||||||||
| Victorville - Yates Road | Victorville | CA | 1977 | 62,125 | 519 | 2,790,000 | 1.4 | 3,800,000 | 1.3 | |||||||||
| Las Vegas - North Lamont Street | Las Vegas | NV | 1988 | 56,985 | 463 | 2,190,000 | 1.1 | 3,800,000 | 1.3 | |||||||||
| Columbus - East Main Street | Columbus | OH | 1988 | 33,500 | 295 | 2,130,000 | 1.1 | 2,750,000 | 1.0 | |||||||||
| Memphis - Raleigh-LaGrange | Memphis | TN | 1984 | 40,395 | 349 | 1,930,000 | 1.0 | 2,700,000 | 1.0 | |||||||||
| Memphis - 5675 Summer Avenue | Memphis | TN | 1985 | 47,945 | 365 | 1,760,000 | 0.9 | 2,350,000 | 0.8 | |||||||||
| Memphis - Madison Avenue | Memphis | TN | 1982 | 27,400 | 286 | 1,520,000 | 0.8 | 2,250,000 | 0.8 | |||||||||
| Total / Wtd. Avg. | 2,668,218 | 20,890 | $194,400,000 | 100.0% | $282,650,000 | 100.0% |
| (1) | Includes 3,850 SF associated with commercial space across all of the Extra Space Self Storage Portfolio Properties. |
| (2) | Cut-off Date Allocated Loan Amount is based on the Extra Space Self Storage Portfolio Loan Combination. The Cut-off Date Allocated Loan Amounts are allocated based on a schedule in the loan agreement, which was based on net operating income for the Extra Space Self Storage Portfolio Properties. |
| (3) | The individual “as is” appraised values are shown. The appraiser also provided a bulk portfolio value for the Extra Space Self Storage Portfolio Properties of $299,250,000, which includes a portfolio premium of $16,600,000. |
The depositor has filed a registration statement (including a prospectus) with the Securities and Exchange Commission (“SEC”) (SEC File No. 333-207132) for the offering to which this communication relates. Before you invest, you should read the prospectus in the registration statement and other documents the depositor has filed with the SEC for more complete information about the depositor, the issuing entity and this offering. You may get these documents for free by visiting EDGAR on the SEC website at www.sec.gov. Alternatively, the depositor or Citigroup Global Markets Inc., Morgan Stanley & Co. LLC, Merrill Lynch, Pierce, Fenner & Smith Incorporated, Drexel Hamilton, LLC, The Williams Capital Group, L.P. or any other underwriter or dealer participating in this offering will arrange to send you the prospectus if you request it by calling toll-free 1-800-831-9146.
76
LOAN #5: extra space self storage portfolio
The following table presents detailed information with respect to the unit mix and net operating income of the Extra Space Self Storage Portfolio Properties:
Unit Mix and NOI Summary(1)
Property Name | City / State | Date Acquired | Non-Climate Controlled Units | Climate Controlled Units | RV Units | Unit SF % | Parking | 9/30/2017 TTM | % of Total 9/30/2017 TTM NOI | |||||||||
| Henderson - Stephanie Place | Henderson, NV | 7/1/2004 | 666 | 0 | 470 | 39.0% | 61.0% | $1,141,429 | 6.7% | |||||||||
| Brookfield - Federal Road | Brookfield, CT | 7/14/2005 | 491 | 198 | 10 | 98.8% | 1.2% | 851,941 | 5.0 | |||||||||
| Kingston - Sawkill Road | Kingston, NY | 7/14/2005 | 567 | 160 | 26 | 92.1% | 7.9% | 818,310 | 4.8 | |||||||||
| Lake Elsinore - Central Avenue | Lake Elsinore, CA | 10/19/2011 | 477 | 21 | 156 | 59.0% | 41.0% | 728,946 | 4.3 | |||||||||
| Doylestown - North Broad Street | Doylestown, PA | 1/1/2001 | 517 | 0 | 40 | 88.7% | 11.3% | 713,051 | 4.2 | |||||||||
| Pennsauken - South Crescent Boulevard | Pennsauken, NJ | 12/1/2003 | 721 | 0 | 17 | 96.3% | 3.7% | 693,688 | 4.1 | |||||||||
| New Paltz - South Putt Corners Road | New Paltz, NY | 7/14/2005 | 594 | 108 | 34 | 90.2% | 9.8% | 677,043 | 4.0 | |||||||||
| Tyngsborough - Industrial Way | Tyngsborough, MA | 7/14/2005 | 575 | 0 | 0 | 100.0% | 0.0% | 670,119 | 3.9 | |||||||||
| Hemet - South Sanderson | Hemet, CA | 7/14/2005 | 498 | 191 | 43 | 86.4% | 13.6% | 638,388 | 3.7 | |||||||||
| Bensalem - 1525 Bristol Pike | Bensalem, PA | 1/1/2005 | 437 | 185 | 14 | 96.6% | 3.4% | 628,304 | 3.7 | |||||||||
| Eastpoint - Lakewood Avenue | Atlanta, GA | 7/1/2004 | 693 | 83 | 30 | 93.0% | 7.0% | 598,939 | 3.5 | |||||||||
| Howell - Route 9 South | Howell, NJ | 1/1/2002 | 691 | 0 | 10 | 97.1% | 2.9% | 583,122 | 3.4 | |||||||||
| Lawrenceville - Hurricane Shoals Road | Lawrenceville, GA | 11/4/2013 | 438 | 257 | 56 | 87.1% | 12.9% | 579,026 | 3.4 | |||||||||
| Lawnside - White Horse Pike | Lawnside, NJ | 7/1/2004 | 507 | 151 | 7 | 97.5% | 2.5% | 561,739 | 3.3 | |||||||||
| Phoenix - West Peoria | Phoenix, AZ | 7/14/2005 | 408 | 223 | 0 | 100.0% | 0.0% | 504,693 | 3.0 | |||||||||
| Mount Laurel - Ark Road | Mount Laurel, NJ | 7/14/2005 | 287 | 121 | 1 | 99.6% | 0.4% | 455,932 | 2.7 | |||||||||
| Burlington - Cadillac Road | Burlington, NJ | 7/18/2012 | 191 | 476 | 5 | 97.9% | 2.1% | 452,735 | 2.7 | |||||||||
| Cherry Hill - Marlton Pike | Cherry Hill, NJ | 7/1/2004 | 322 | 168 | 2 | 99.5% | 0.5% | 451,476 | 2.6 | |||||||||
| Bensalem - Knights Road | Bensalem, PA | 4/1/2006 | 213 | 219 | 10 | 96.5% | 3.5% | 437,175 | 2.6 | |||||||||
| Albuquerque - Ellison Road Northwest | Albuquerque, NM | 7/14/2005 | 514 | 0 | 0 | 100.0% | 0.0% | 429,337 | 2.5 | |||||||||
| Modesto - Crows Landing | Modesto, CA | 6/1/2007 | 550 | 0 | 20 | 91.6% | 8.4% | 407,564 | 2.4 | |||||||||
| Auburndale - US Highway 92 West | Auburndale, FL | 5/2/2012 | 313 | 212 | 0 | 100.0% | 0.0% | 403,848 | 2.4 | |||||||||
| San Bernardino - West Club Center Drive | San Bernardino, CA | 11/1/2000 | 501 | 0 | 12 | 95.9% | 4.1% | 382,308 | 2.2 | |||||||||
| Memphis - Mount Moriah Terrace | Memphis, TN | 7/14/2005 | 500 | 130 | 46 | 87.9% | 12.1% | 368,422 | 2.2 | |||||||||
| Hesperia - Mariposa Road | Hesperia, CA | 10/19/2011 | 536 | 0 | 0 | 100.0% | 0.0% | 339,722 | 2.0 | |||||||||
| Memphis - Covington Way | Memphis, TN | 7/14/2005 | 244 | 240 | 39 | 83.3% | 16.7% | 335,021 | 2.0 | |||||||||
| St. Louis - Halls Ferry Road | St. Louis, MO | 5/1/2001 | 465 | 0 | 0 | 100.0% | 0.0% | 308,298 | 1.8 | |||||||||
| Killeen - Jasper Drive | Killeen, TX | 11/4/2013 | 291 | 312 | 114 | 72.3% | 27.7% | 304,105 | 1.8 | |||||||||
| Albuquerque - Airport Drive Northwest | Albuquerque, NM | 7/1/2004 | 391 | 0 | 9 | 97.3% | 2.7% | 260,948 | 1.5 | |||||||||
| Memphis - Gateway Drive | Memphis, TN | 7/14/2005 | 387 | 0 | 0 | 100.0% | 0.0% | 246,946 | 1.4 | |||||||||
| Victorville - Yates Road | Victorville, CA | 10/19/2011 | 498 | 0 | 21 | 91.3% | 8.7% | 244,392 | 1.4 | |||||||||
| Las Vegas - North Lamont Street | Las Vegas, NV | 4/1/2001 | 411 | 30 | 22 | 92.4% | 7.6% | 192,375 | 1.1 | |||||||||
| Columbus - East Main Street | Columbus, OH | 7/14/2005 | 295 | 0 | 0 | 100.0% | 0.0% | 186,696 | 1.1 | |||||||||
| Memphis - Raleigh-LaGrange | Memphis, TN | 7/14/2005 | 321 | 12 | 16 | 91.2% | 8.8% | 169,541 | 1.0 | |||||||||
| Memphis - 5675 Summer Avenue | Memphis, TN | 7/14/2005 | 347 | 11 | 5 | 97.4% | 2.6% | 154,416 | 0.9 | |||||||||
| Memphis - Madison Avenue | Memphis, TN | 7/14/2005 | 286 | 0 | 0 | 100.0% | 0.0% | 133,313 | 0.8 | |||||||||
| Total/Wtd. Avg. | 16,143 | 3,508 | 1,235 | 86.3% | 13.7% | $17,053,307 | 100.0% |
| (1) | Based on information provided by the Extra Space Self Storage Portfolio Borrower. |
The following table presents historical occupancy percentages at the Extra Space Self Storage Portfolio Properties:
Historical Occupancy(1)
2013 | 2014 | 2015 | 2016 | As of 9/30/2017(2) |
| 86.5% | 88.7% | 93.0% | 93.6% | 95.1% |
| (1) | Based on information provided by the Extra Space Self Storage Portfolio Borrower and which represents occupancy as of December 31 for the indicated year unless otherwise specified. | |
| (2) | Based on the underwritten rent roll dated September 30, 2017. |
The depositor has filed a registration statement (including a prospectus) with the Securities and Exchange Commission (“SEC”) (SEC File No. 333-207132) for the offering to which this communication relates. Before you invest, you should read the prospectus in the registration statement and other documents the depositor has filed with the SEC for more complete information about the depositor, the issuing entity and this offering. You may get these documents for free by visiting EDGAR on the SEC website at www.sec.gov. Alternatively, the depositor or Citigroup Global Markets Inc., Morgan Stanley & Co. LLC, Merrill Lynch, Pierce, Fenner & Smith Incorporated, Drexel Hamilton, LLC, The Williams Capital Group, L.P. or any other underwriter or dealer participating in this offering will arrange to send you the prospectus if you request it by calling toll-free 1-800-831-9146.
77
LOAN #5: extra space self storage portfolio
| ■ | Operating History and Underwritten Net Cash Flow. The following table presents certain information relating to the historical operating performance and the Underwritten Net Cash Flow at the Extra Space Self Storage Portfolio Properties: |
Cash Flow Analysis(1)
2014 | 2015 | 2016 | TTM 9/30/2017 | Underwritten | Underwritten | |
| Base Rent(2) | $22,697,753 | $24,564,446 | $26,226,349 | $27,627,825 | $27,627,825 | $10.35 |
| Other Income(3) | 1,540,947 | 1,640,794 | 1,714,680 | 1,720,469 | 1,720,469 | 0.64 |
| Concessions and Credit Loss | (1,599,426) | (1,404,249) | (1,549,909) | (1,703,137) | (1,703,137) | (0.64) |
| Effective Gross Income | $22,639,275 | $24,800,992 | $26,391,121 | $27,645,157 | $27,645,157 | $10.36 |
| Total Operating Expenses | $9,853,788 | $10,151,952 | $10,291,797 | $10,591,850 | $10,672,978 | 4.00 |
| Net Operating Income | $12,785,487 | $14,649,039 | $16,099,324 | $17,053,307 | $16,972,179 | $6.36 |
| Capital Expenditures | 0 | 0 | 0 | 0 | 412,651 | 0.15 |
| Net Cash Flow | $12,785,487 | $14,649,039 | $16,099,324 | $17,053,307 | $16,559,528 | $6.21 |
| Occupancy | 88.7% | 93.0% | 93.6% | 95.1% | 95.1%(4) | |
| NOI Debt Yield(5) | 6.6% | 7.5% | 8.3% | 8.8% | 8.7% | |
| NCF DSCR(5) | 1.55x | 1.78x | 1.96x | 2.07x | 2.01x |
| (1) | Certain items such as interest expense, interest income, lease cancellation income, depreciation, amortization, debt service payments and any other non-recurring or non-operating items were not considered for the underwritten net cash flow. |
| (2) | Base Rent is net of vacancy and includes parking income, billboard income and commercial income. Parking income accounts for 4.0% of Underwritten Base Rent. Billboard income and commercial income each account for less than 0.2% of Underwritten Base Rent. |
| (3) | Other Income is comprised of administration fees, late fees, miscellaneous fees and merchandise sales. |
| (4) | The underwritten economic vacancy is 5.8%. As of September 30, 2017, the Extra Space Self Storage Portfolio Properties were 95.1% physically occupied. |
| (5) | Calculated based on the aggregate outstanding principal balance as of the Cut-off Date of the Extra Space Self Storage Portfolio Loan Combination. |
| ■ | Appraisal.As of the appraisal valuation date of November 1, 2017, the Extra Space Self Storage Portfolio Properties had an “As Portfolio” bulk appraised value of $299,250,000, which includes a portfolio premium of $16,600,000. The sum of the individual “as-is” appraised values of the Extra Space Self Storage Portfolio Properties is $282,650,000. |
| ■ | Environmental Matters.According to the Phase I environmental site assessments dated November 3, 2017, there are no recognized environmental conditions or recommendations for further action at the Extra Space Self Storage Portfolio Properties. |
| ■ | Market Overview and Competition. The Extra Space Self Storage Portfolio Properties are geographically diverse, located in 15 different markets across 15 states. The greatest concentration of Extra Space Self Storage Portfolio Properties is located in California (six properties, 17.8% of SF), New Jersey (six properties, 14.5% of SF), Nevada (two properties, 13.1% of SF) and Tennessee (six properties, 12.3% of SF), with the remaining 16 properties (42.3% of SF) located across 11 different states. |
The depositor has filed a registration statement (including a prospectus) with the Securities and Exchange Commission (“SEC”) (SEC File No. 333-207132) for the offering to which this communication relates. Before you invest, you should read the prospectus in the registration statement and other documents the depositor has filed with the SEC for more complete information about the depositor, the issuing entity and this offering. You may get these documents for free by visiting EDGAR on the SEC website at www.sec.gov. Alternatively, the depositor or Citigroup Global Markets Inc., Morgan Stanley & Co. LLC, Merrill Lynch, Pierce, Fenner & Smith Incorporated, Drexel Hamilton, LLC, The Williams Capital Group, L.P. or any other underwriter or dealer participating in this offering will arrange to send you the prospectus if you request it by calling toll-free 1-800-831-9146.
78
LOAN #5: extra space self storage portfolio
The following table presents state-level information with respect to the Extra Space Self Storage Portfolio Properties:
State Summary(1)
State | Property Count | Total SF(2) | Total Units | Climate Controlled Units | 9/30/2017 | Wtd. Avg. | Cut-off Date Allocated Loan Amount(4) | In Place Ann. | % of Ann. Rent(3) | |||||||||
| California | 6 | 475,631 | 3,524 | 212 | 95.5% | $8.92 | $31,260,000 | $4,243,653 | 15.4% | |||||||||
| New Jersey | 6 | 386,585 | 3,678 | 916 | 95.8% | $13.83 | 36,470,000 | 5,347,017 | 19.4 | |||||||||
| Nevada | 2 | 349,301 | 1,599 | 30 | 96.7% | $5.36 | 15,200,000 | 1,873,907 | 6.8 | |||||||||
| Tennessee | 6 | 328,690 | 2,586 | 393 | 93.2% | $8.32 | 16,050,000 | 2,735,589 | 9.9 | |||||||||
| Georgia | 2 | 194,030 | 1,557 | 340 | 95.5% | $10.25 | 13,430,000 | 1,987,912 | 7.2 | |||||||||
| Pennsylvania | 3 | 190,971 | 1,636 | 404 | 95.1% | $14.46 | 20,270,000 | 2,760,958 | 10.0 | |||||||||
| New York | 2 | 161,901 | 1,489 | 268 | 93.9% | $15.07 | 17,050,000 | 2,440,363 | 8.8 | |||||||||
| New Mexico | 2 | 108,100 | 914 | 0 | 96.3% | $10.04 | 7,860,000 | 1,085,628 | 3.9 | |||||||||
| Texas | 1 | 94,970 | 717 | 312 | 90.8% | $6.68 | 3,470,000 | 634,029 | 2.3 | |||||||||
| Connecticut | 1 | 80,250 | 699 | 198 | 97.7% | $15.23 | 9,710,000 | 1,222,484 | 4.4 | |||||||||
| Massachusetts | 1 | 79,200 | 575 | 0 | 94.1% | $12.14 | 7,640,000 | 961,654 | 3.5 | |||||||||
| Florida | 1 | 63,675 | 525 | 212 | 95.8% | $9.46 | 4,600,000 | 602,600 | 2.2 | |||||||||
| Arizona | 1 | 63,214 | 631 | 223 | 94.6% | $12.16 | 5,750,000 | 768,856 | 2.8 | |||||||||
| Missouri | 1 | 58,200 | 465 | 0 | 91.3% | $10.32 | 3,510,000 | 600,697 | 2.2 | |||||||||
| Ohio | 1 | 33,500 | 295 | 0 | 94.9% | $10.82 | 2,130,000 | 362,477 | 1.3 | |||||||||
| Total / Wtd. Avg. | 36 | 2,668,218 | 20,890 | 3,508 | 95.1% | $10.35 | $194,400,000 | $27,627,825 | 100.0% |
| (1) | Based on information provided by the Extra Space Self Storage Portfolio Borrower. |
| (2) | Includes 3,850 SF associated with commercial space across all of the Extra Space Self Storage Portfolio Properties. |
| (3) | Occupancy and rent figures are as of the September 30, 2017 trailing twelve month period. |
| (4) | Cut-off Date Allocated Loan Amount is based on the Extra Space Self Storage Portfolio Loan Combination. The Cut-off Date Allocated Loan Amounts are allocated based on a schedule in the loan agreement, which was based on net operating income for the Extra Space Self Storage Portfolio Properties. |
The following table presents demographic information with respect to the Extra Space Self Storage Portfolio Properties:
Demographic Summary(1)
Market | Location | Count | Market 10x10 Non-Climate Controlled Rent | Market 10x10 Climate Controlled Rent | Market | Population 2016 (Million) | Rentable | Median HH Income | Avg. HH | |||||||||||||||
| Philadelphia | Northeast | 8 | $121.7 | $141.3 | 8.5% | 6.1 | 3.6 | $63,168 | 2.6 | |||||||||||||||
| Greater New York | Northeast | 3 | $267.3 | $303.8 | 12.6% | 20.1 | 2.7 | 69,651 | 2.7 | |||||||||||||||
| San Bernardino-Riverside | West | 5 | $104.7 | $145.4 | 8.7% | 4.5 | 5.1 | 56,571 | 3.2 | |||||||||||||||
| Memphis | Southeast | 6 | $80.4 | $125.6 | 11.6% | 1.4 | 7.0 | 48,624 | 2.6 | |||||||||||||||
| Atlanta | Southeast | 2 | $96.2 | $126.4 | 10.0% | 5.7 | 6.4 | 58,098 | 2.7 | |||||||||||||||
| Las Vegas | Southwest | 2 | $94.1 | $103.8 | 9.6% | 2.1 | 6.2 | 52,771 | 2.7 | |||||||||||||||
| Boston | Northeast | 1 | $181.0 | $152.0 | 10.7% | 4.8 | 3.9 | 76,745 | 2.5 | |||||||||||||||
| Albuquerque | Southwest | 2 | NAV | NAV | NAV | 0.9 | NAV | 49,967 | 2.5 | |||||||||||||||
| Central New Jersey | Northeast | 1 | $136.5 | $157.7 | 7.5% | 0.4 | NAV | 74,942 | 2.6 | |||||||||||||||
| Phoenix | Southwest | 1 | $108.5 | $130.3 | 11.7% | 4.6 | 4.8 | 54,976 | 2.7 | |||||||||||||||
| Central Valley | West | 1 | $119.3 | $142.6 | 6.9% | 2.3 | 7.0 | 60,907 | 2.7 | |||||||||||||||
| Tampa-St Petersburg | Southeast | 1 | $114.8 | $148.9 | 8.3% | 3.0 | 6.2 | 48,529 | 2.4 | |||||||||||||||
| Austin | Southeast | 1 | $104.9 | $149.3 | 10.8% | 2.0 | 7.6 | 65,493 | 2.6 | |||||||||||||||
| St Louis | Midwest | 1 | $93.0 | $134.5 | 10.3% | 2.8 | 5.9 | 56,375 | 2.5 | |||||||||||||||
| Columbus | Midwest | 1 | $120.6 | $90.9 | 10.0% | 2.0 | 5.8 | 56,725 | 2.5 | |||||||||||||||
| Total / Wtd. Avg. | 36 | $133.7 | $159.7 | 9.8% | 62.7 | 4.9 | $62,727 | 2.7 | ||||||||||||||||
| (1) | Based on 2016 demographic and market information as provided by third party research reports and the Extra Space Self Storage Portfolio Borrower. |
| ■ | The Borrower. The borrower is Storage Portfolio II Subsidiary LLC, a Delaware limited liability company and single purpose entity with two independent directors (the “Extra Space Self Storage Portfolio Borrower”). Legal counsel to the borrower delivered a non-consolidation opinion in connection with the origination of the Extra Space Self Storage Portfolio Loan Combination. Extra Space Storage Inc. (“Extra Space Storage”) is the guarantor of certain non-recourse carveouts under the Extra Space Self Storage Portfolio Loan Combination. The borrower sponsors are Extra Space Storage and TH Real Estate. |
The Extra Space Self Storage Portfolio Borrower is 90.0% indirectly owned by Teachers Insurance and Annuity Association of America (“TIAA”) for the benefit of the Separate Real Estate Account (“TIAA Real Estate”) and 9.3% indirectly owned by Extra Space Storage. A subsidiary of Extra Space Storage is the managing member of the joint venture between TIAA Real Estate and Extra Space Storage which owns the borrower.
If a buy/sell is triggered such that TIAA Real Estate becomes the sole indirect owner of the borrower, Teachers REA, LLC has been approved as replacement guarantor provided that it meets certain net worth and liquidity requirements set forth in the loan documents and there has been no material adverse change in its financial condition or status.TH
The depositor has filed a registration statement (including a prospectus) with the Securities and Exchange Commission (“SEC”) (SEC File No. 333-207132) for the offering to which this communication relates. Before you invest, you should read the prospectus in the registration statement and other documents the depositor has filed with the SEC for more complete information about the depositor, the issuing entity and this offering. You may get these documents for free by visiting EDGAR on the SEC website at www.sec.gov. Alternatively, the depositor or Citigroup Global Markets Inc., Morgan Stanley & Co. LLC, Merrill Lynch, Pierce, Fenner & Smith Incorporated, Drexel Hamilton, LLC, The Williams Capital Group, L.P. or any other underwriter or dealer participating in this offering will arrange to send you the prospectus if you request it by calling toll-free 1-800-831-9146.
79
LOAN #5: extra space self storage portfolio
Real Estate is an affiliate of Nuveen, LLC, an investment management arm of TIAA. TH Real Estate is a real estate investment services firm with over 530 real estate professionals located in more than 20 cities throughout the United States, Europe and Asia-Pacific. As of June 30, 2017, TH Real Estate had over $103 billion of assets under management globally. Extra Space Storage is headquartered in Salt Lake City, Utah and owned or operated over 1,400 self-storage locations across 38 states, Washington, D.C. and Puerto Rico as of June 30, 2017.
| ■ | Escrows. The Extra Space Self Storage Portfolio Borrower is required to escrow monthly 1/12th of the annual estimated real estate tax payments. Notwithstanding the foregoing, so long as Extra Space Storage Inc. is the non-recourse carveout guarantor, the Extra Space Self Storage Portfolio Borrower will not be required to make deposits to the real estate tax escrow, provided that (i) no Extra Space Cash Sweep Event Period (as defined below) is continuing and (ii) the Extra Space Self Storage Portfolio Borrower provides the lender paid receipts for taxes upon written request by no later than three business days prior to the date such taxes would be delinquent. The Extra Space Self Storage Portfolio Borrower is required to escrow monthly 1/12th of the annual estimated insurance premiums. Notwithstanding the foregoing, so long as Extra Space Storage Inc. is the non-recourse carveout guarantor, the Extra Space Self Storage Portfolio Borrower will not be required to make deposits to the insurance reserve provided (i) no event of default is continuing and (ii) the Extra Space Self Storage Portfolio Borrower maintains an acceptable blanket insurance policy. |
| ■ | Lockbox and Cash Management. The Extra Space Self Storage Portfolio Loan Combination provides for a springing soft lockbox and springing cash management, in each case upon the occurrence of an Extra Space Cash Sweep Event Period. Upon the first occurrence of an Extra Space Cash Sweep Event Period, the Extra Space Self Storage Portfolio Borrower is required to establish (i) a lockbox account, into which, during an Extra Space Cash Sweep Event Period, all rents (less costs anticipated for debits for credit and chargebacks, fees, and refunded items) are required to be deposited by the Extra Space Self Storage Portfolio Borrower and/or the property manager within five business days after receipt and (ii) a lender-controlled cash management account. During the continuance of an Extra Space Cash Sweep Event Period, all funds in the lockbox account are required to be swept each day to the cash management account. Provided no event of default is continuing, funds in the cash management account are required to be applied on each monthly payment date to disburse to the Extra Space Self Storage Portfolio Borrower amounts for the payment of De Minimis Revenue (as defined below), to pay debt service on the Extra Space Self Storage Portfolio Loan Combination, to fund required reserve deposits as described above under “—Escrows,” to pay operating expenses set forth in the approved annual budget, and extraordinary expenses approved by the lender, and thereafter, to the extent (i) an Extra Space Cash Sweep Event Period is continuing, to deposit any remaining cash flow into an account to be held as additional security for the Extra Space Self Storage Portfolio Loan Combination during the continuance of the Extra Space Cash Sweep Event Period and (ii) no Extra Space Cash Sweep Event Period is continuing, to disburse any remaining cash flow to the Extra Space Self Storage Portfolio Borrower. If an Extra Space Cash Sweep Event Period is no longer continuing, the Extra Space Self Storage Portfolio Borrower and property manager will no longer be obligated to deposit rents into the lockbox account. |
“De Minimis Revenue” means sums for the payment of tenant insurance premiums, sales tax, and packing supply cash receipts. De Minimis Revenue is required to be disbursed to the Extra Space Self Storage Portfolio Borrower within five business days after delivery to the lender of a budget for such expenses.
An “Extra Space Cash Sweep Event Period” will commence upon the earlier of (i) an event of default or (ii) the debt service coverage ratio being less than 1.10x for 12 consecutive months and continue until; (a) in the case of clause (i), the cure of such event of default and (b) in the case of clause (ii), the debt service coverage ratio is equal to or greater than 1.25x for the immediately preceding six consecutive calendar months.
| ■ | Property Management.The Extra Space Self Storage Portfolio Properties are currently managed by Extra Space Management, Inc. If (a) an event of default under the Extra Space Self Storage Portfolio Loan Combination has occurred and is continuing, (b) the property manager (i) is insolvent or a debtor in a bankruptcy proceeding or (ii) has engaged in gross negligence, fraud or willful misconduct, or (c) an event of default by the property manager occurs under the related management agreement (subject to any applicable grace periods), then the lender, at its option, may require the borrower to engage a replacement management agent that is an unaffiliated Qualified Manager (as defined below) chosen by the borrower and terminate the property manager without fee or obligation to the lender. |
| A “Qualified Manager” means either (i) a manager approved by the lender (which may be conditioned on a rating agency confirmation) or (ii) a reputable and experienced professional management organization of self storage facilities for at least five years prior to its engagement at the Extra Space Self Storage Portfolio Properties, which is |
The depositor has filed a registration statement (including a prospectus) with the Securities and Exchange Commission (“SEC”) (SEC File No. 333-207132) for the offering to which this communication relates. Before you invest, you should read the prospectus in the registration statement and other documents the depositor has filed with the SEC for more complete information about the depositor, the issuing entity and this offering. You may get these documents for free by visiting EDGAR on the SEC website at www.sec.gov. Alternatively, the depositor or Citigroup Global Markets Inc., Morgan Stanley & Co. LLC, Merrill Lynch, Pierce, Fenner & Smith Incorporated, Drexel Hamilton, LLC, The Williams Capital Group, L.P. or any other underwriter or dealer participating in this offering will arrange to send you the prospectus if you request it by calling toll-free 1-800-831-9146.
80
LOAN #5: extra space self storage portfolio
| not subject to a bankruptcy, insolvency or similar proceeding, and manages, together with its affiliates, (A) no fewer than 150 self storage facilities, (B) no less than 30 million square feet of self-storage facilities, and (C) at least 500,000 self storage units. If an event of default has occurred and is continuing by Extra Space Management, Inc. as property manager, or a buy/sell is triggered such that either TIAA Real Estate or an entity owned by Extra Space Storage Inc. becomes the sole indirect owner of the borrower, the borrower has the right to replace the property manager without the lender’s consent so long as such replacement manager is a Qualified Manager which executes and delivers a replacement management agreement and an assignment and subordination of management fees acceptable to the lender, and if it is an affiliate of the borrower, a new non-consolidation opinion is delivered. The borrower may not otherwise replace the property manager without the consent of the lender, which may not be unreasonably withheld (and may be conditioned upon receipt of a rating agency confirmation). |
| ■ | Mezzanine or Secured Subordinate Indebtedness. Not permitted. |
| ■ | Release of Collateral. After the Release Date and prior to the payment date in June 2027, provided no event of default has occurred and is continuing, the Extra Space Self Storage Portfolio Borrower may obtain a release of any of the individual properties comprising the Extra Space Self Storage Portfolio Properties upon defeasance of an amount equal to 125% of the allocated loan amount of such individual property; provided that the following conditions, among others, are satisfied: (i) after giving effect to the release, the debt yield with respect to the remaining properties is greater than the debt yield of all of the properties immediately prior to the related release; and (ii) the partial defeasance is permitted under REMIC requirements (and the lender receives an opinion of counsel that the partial defeasance will not cause a REMIC trust formed pursuant to a securitization of any portion of the Extra Space Self Storage Portfolio Loan Combination to fail to maintain its status as a REMIC). |
| ■ | Terrorism Insurance. The Extra Space Self Storage Portfolio Borrower is required to obtain insurance against acts of terrorism or other similar acts or events in form and substance reasonably satisfactory to the lender, including all risk insurance in an amount equal to 100% of full replacement cost and 18 months of business interruption insurance. Notwithstanding the foregoing, for so long as the Terrorism Risk Insurance Act of 2002, as extended and modified by the Terrorism Risk Insurance Program Reauthorization Act of 2015 is in effect (or any extension thereof or other federal government program with substantially similar protection), the Extra Space Self Storage Portfolio Borrower is required to maintain, and the lender is required to accept, terrorism insurance which covers “covered acts” (as defined by such statute or other program), as full compliance as it relates to the risks required to be covered pursuant to the preceding sentence, so long as such statute or other program covers both domestic and foreign acts of terrorism. See “Risk Factors – Terrorism Insurance May Not be Available for All Mortgaged Properties” in the Preliminary Prospectus. |
The depositor has filed a registration statement (including a prospectus) with the Securities and Exchange Commission (“SEC”) (SEC File No. 333-207132) for the offering to which this communication relates. Before you invest, you should read the prospectus in the registration statement and other documents the depositor has filed with the SEC for more complete information about the depositor, the issuing entity and this offering. You may get these documents for free by visiting EDGAR on the SEC website at www.sec.gov. Alternatively, the depositor or Citigroup Global Markets Inc., Morgan Stanley & Co. LLC, Merrill Lynch, Pierce, Fenner & Smith Incorporated, Drexel Hamilton, LLC, The Williams Capital Group, L.P. or any other underwriter or dealer participating in this offering will arrange to send you the prospectus if you request it by calling toll-free 1-800-831-9146.
81
| LOAN #6: RED BUILDING |
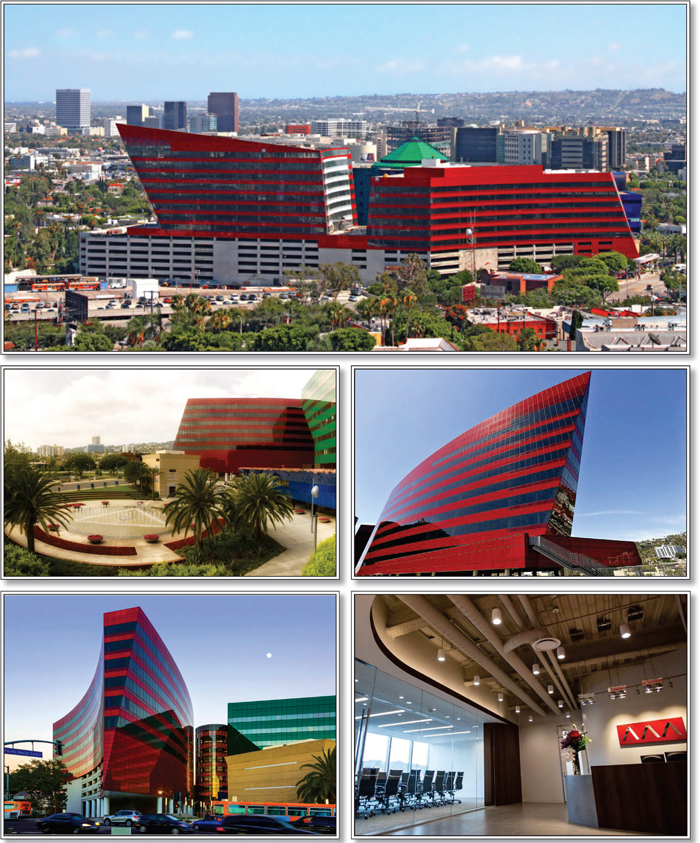
The depositor has filed a registration statement (including a prospectus) with the Securities and Exchange Commission (“SEC”) (SEC File No. 333-207132) for the offering to which this communication relates. Before you invest, you should read the prospectus in the registration statement and other documents the depositor has filed with the SEC for more complete information about the depositor, the issuing entity and this offering. You may get these documents for free by visiting EDGAR on the SEC website at www.sec.gov. Alternatively, the depositor or Citigroup Global Markets Inc., Morgan Stanley & Co. LLC, Merrill Lynch, Pierce, Fenner & Smith Incorporated, Drexel Hamilton, LLC, The Williams Capital Group, L.P. or any other underwriter or dealer participating in this offering will arrange to send you the prospectus if you request it by calling toll-free 1-800-831-9146.
82
| LOAN #6: RED BUILDING |

The depositor has filed a registration statement (including a prospectus) with the Securities and Exchange Commission (“SEC”) (SEC File No. 333-207132) for the offering to which this communication relates. Before you invest, you should read the prospectus in the registration statement and other documents the depositor has filed with the SEC for more complete information about the depositor, the issuing entity and this offering. You may get these documents for free by visiting EDGAR on the SEC website at www.sec.gov. Alternatively, the depositor or Citigroup Global Markets Inc., Morgan Stanley & Co. LLC, Merrill Lynch, Pierce, Fenner & Smith Incorporated, Drexel Hamilton, LLC, The Williams Capital Group, L.P. or any other underwriter or dealer participating in this offering will arrange to send you the prospectus if you request it by calling toll-free 1-800-831-9146.
83
| LOAN #6: RED BUILDING |

The depositor has filed a registration statement (including a prospectus) with the Securities and Exchange Commission (“SEC”) (SEC File No. 333-207132) for the offering to which this communication relates. Before you invest, you should read the prospectus in the registration statement and other documents the depositor has filed with the SEC for more complete information about the depositor, the issuing entity and this offering. You may get these documents for free by visiting EDGAR on the SEC website at www.sec.gov. Alternatively, the depositor or Citigroup Global Markets Inc., Morgan Stanley & Co. LLC, Merrill Lynch, Pierce, Fenner & Smith Incorporated, Drexel Hamilton, LLC, The Williams Capital Group, L.P. or any other underwriter or dealer participating in this offering will arrange to send you the prospectus if you request it by calling toll-free 1-800-831-9146.
84
| LOAN #6: RED BUILDING |
| Mortgaged Property Information | Mortgage Loan Information | ||||||||||||||||
| Number of Mortgaged Properties | 1 | Loan Seller | CREFI | ||||||||||||||
| Location (City/State) | West Hollywood, California | Cut-off Date Balance(2) | $40,000,000 | ||||||||||||||
| Property Type | Office | Cut-off Date Balance per SF(1) | $194.39 | ||||||||||||||
| Size (SF) | 411,547 | Percentage of Initial Pool Balance | 3.8% | ||||||||||||||
| Total Occupancy as of 12/18/2017 | 74.3% | Number of Related Mortgage Loans | None | ||||||||||||||
| Owned Occupancy as of 12/18/2017 | 74.3% | Type of Security | Fee Simple | ||||||||||||||
| Year Built / Latest Renovation | 2013 / NAP | Mortgage Rate | 4.385825% | ||||||||||||||
| Appraised Value | $286,700,000 | Original Term to Maturity (Months) | 120 | ||||||||||||||
| Appraisal Date | 10/27/2017 | Original Amortization Term (Months) | NAP | ||||||||||||||
| Borrower Sponsor | Charles Steven Cohen | Original Interest Only Period (Months) | 120 | ||||||||||||||
| Property Management | Cohen Brothers Realty Corporation of California | First Payment Date | 2/6/2018 | ||||||||||||||
| Maturity Date | 1/6/2028 | ||||||||||||||||
| Underwritten Revenues | $18,925,660 | ||||||||||||||||
| Underwritten Expenses | $6,074,849 | Escrows | |||||||||||||||
| Underwritten Net Operating Income (NOI) | $12,850,810 | Upfront | Monthly | ||||||||||||||
| Underwritten Net Cash Flow (NCF) | $11,790,813 | Taxes | $192,071 | $192,071 | |||||||||||||
| Cut-off Date LTV Ratio(1) | 27.9% | Insurance | $88,901 | $8,082 | |||||||||||||
| Maturity Date LTV Ratio(1) | 27.9% | Replacement Reserve | $0 | $6,859 | |||||||||||||
| DSCR Based on Underwritten NOI / NCF(1) | 3.61x / 3.31x | TI/LC(3) | $0 | $0 | |||||||||||||
| Debt Yield Based on Underwritten NOI / NCF(1) | 16.1% / 14.7% | Other(4) | $4,627,845 | $0 | |||||||||||||
| Sources and Uses | |||||||||||||||||
| Sources | $ | % | Uses | $ | % | ||||||||||||
| Senior A-Note Amount | $80,000,000 | 40.8% | Loan Payoff | $169,954,770 | 86.7% | ||||||||||||
| B-Note Amount | 51,000,000 | 26.0 | Principal Equity Distribution | 18,918,918 | 9.7 | ||||||||||||
| C-Note Amount | 65,000,000 | 33.2 | Upfront Reserves | 4,908,817 | 2.5 | ||||||||||||
| Closing Costs | 2,217,495 | 1.1 | |||||||||||||||
| Total Sources | $196,000,000 | 100.0% | Total Uses | $196,000,000 | 100.0% | ||||||||||||
| (1) | Calculated based on the aggregate outstanding principal balance as of the Cut-off Date of the Red Building A-Notes (as defined below). |
| (2) | The Red Building Loan (as defined below) has a Cut-off Date Balance of $40,000,000 and represents the non-controlling note A-2 of the $196,000,000 Red Building Loan Combination, which is evidenced by twopari passu senior notes, with an aggregate outstanding principal balance as of the Cut-off Date of $80.0 million and three subordinate notes, with an outstanding principal balance as of the Cut-off Date of $116.0 million. See the “Loan Combination Summary” table in “—The Mortgage Loan” below. |
| (3) | Beginning on the monthly payment date in February, 2021, the borrower must deposit $66,114 into the TI/LC reserve until the TI/LC reserve reaches its cap of $3,966,820. |
| (4) | The Upfront Other Reserve is comprised of $3,874,436 for a free rent reserve and $753,409 for an unfunded obligations reserve. See“—Escrows” below. |
| ■ | The Mortgage Loan. The mortgage loan (the“Red Building Loan”) is part of a loan combination (the“Red Building Loan Combination”) evidenced by twopari passu senior notes and three subordinate notes that are together secured by a first mortgage encumbering the borrower’s fee simple interest in an office building totaling 411,547 SF located in West Hollywood, California (the“Red Building Property”). The Red Building Loan, which is evidenced by the non-controlling note A-2, had an original principal balance of $40,000,000, has a Cut-off Date Balance of $40,000,000 and represents approximately 3.8% of the Initial Pool Balance. The Red Building Loan Combination had an original principal balance of $196,000,000, has an outstanding principal balance as of the Cut-off Date of $196,000,000 and is evidenced by: twopari passu senior A notes, with an aggregate outstanding principal balance as of the Cut-off Date of $80,000,000 (the “Red Building A-Notes”), two non-controlling subordinate B notes (the “Red Building B-Notes”), with an aggregate outstanding principal balance as of the Cut-off Date of $51,000,000, and one controlling subordinate C note (the “Red Building C-Note”), with an outstanding principal balance as of the Cut-off Date of $65,000,000. The Red Building A-Notes are comprised of the non-controlling Note A-1 and the Red Building Loan and each accrue interest at an interest rate of 4.385825%per annum. The non-controlling note A-1, which had an original principal balance of $40,000,000 and has an outstanding principal balance as of the Cut-off Date of $40,000,000, was contributed to the Benchmark 2018-B2 securitization transaction. The Red Building B-Notes and the Red Building C-Note are each held by a third party investor. The non-controlling note B-1 has an outstanding principal balance as of the Cut-off Date of $40,800,000 and the non-controlling note B-2 has an outstanding principal balance as of the Cut-off Date of $10,200,000. The Red Building Loan Combination, which accrues interest at an interest rate of 5.146000%per annum, was originated by CREFI on December 18, 2017. The proceeds of the Red Building Loan Combination were primarily used to refinance a prior debt secured by the Red Building Property, return equity to the borrower, pay origination costs and fund reserves. |
The Red Building Loan has an initial term of 120 months and has a remaining term of 118 months as of the Cut-off Date. The Red Building Loan requires monthly payments of interest only for the term of the Red Building Loan. The scheduled maturity date of the Red Building Loan is the due date in January 2028. At any time after the earlier of December 18, 2021 and the second anniversary of the securitization of the last portion of the Red Building Loan Combination, the Red Building Loan may be defeased with certain direct full faith and credit obligations of the United States of America or other obligations which are “government securities” permitted under the Red Building Loan
The depositor has filed a registration statement (including a prospectus) with the Securities and Exchange Commission (“SEC”) (SEC File No. 333-207132) for the offering to which this communication relates. Before you invest, you should read the prospectus in the registration statement and other documents the depositor has filed with the SEC for more complete information about the depositor, the issuing entity and this offering. You may get these documents for free by visiting EDGAR on the SEC website at www.sec.gov. Alternatively, the depositor or Citigroup Global Markets Inc., Morgan Stanley & Co. LLC, Merrill Lynch, Pierce, Fenner & Smith Incorporated, Drexel Hamilton, LLC, The Williams Capital Group, L.P. or any other underwriter or dealer participating in this offering will arrange to send you the prospectus if you request it by calling toll-free 1-800-831-9146.
85
| LOAN #6: RED BUILDING |
documents. Voluntary prepayment of the Red Building Loan is permitted on or after the due date occurring in August 2027 without payment of any prepayment premium.
Loan Combination Summary
| Note | Original Balance | Cut-off Date Balance | Note Holder | Controlling Piece | ||||||
| A-1 | $40,000,000 | $40,000,000 | Benchmark 2018-B2 | No | ||||||
| A-2 | $40,000,000 | $40,000,000 | CGCMT 2018-B2 | No | ||||||
| B-1 | $40,800,000 | $40,800,000 | Athene Annuity and Life Company | No | ||||||
| B-2 | $10,200,000 | $10,200,000 | American Equity Investment Life Insurance Company | No | ||||||
| C | $65,000,000 | $65,000,000 | Senior Real Estate Finance Account (N) LP | Yes | ||||||
| Total / Wtd. Avg. | $196,000,000 | $196,000,000 | ||||||||
Loan Combination Metrics
| % of Total Debt | Cut-off Date LTV | UW NOI Debt Yield | UW NCF DSCR | |
| A-Notes | 40.8% | 27.9% | 16.1% | 3.31x |
| $80,000,000 | ||||
| B-Notes | 26.0% | 45.7% | 9.8% | 1.88x |
| $51,000,000 | ||||
| C-Note | 33.2% | 68.4% | 6.6% | 1.15x |
| $65,000,000 |
| ■ | The Mortgaged Property. The Red Building Property is comprised of 411,547 SF within two towers, the eight-story East Tower, which sits atop seven levels of parking and the six-story West Tower, which sits atop six levels of parking. The Red Building Property is part of the Pacific Design Center, which also includes the Blue Building and the Green Building, neither of which are part of the collateral for the Red Building Loan Combination. The Red Building Property was designed by an internationally-recognized architect, Cesar Pelli, who designed the Pacific Design Center. There are 1,479 parking spaces (3.6 spaces per 1,000 SF of net rentable square footage) at the Red Building Property which are accessible through a driveway that is shared with the adjacent parking garage for the Pacific Design Center. The Pacific Design Center is a multi-use facility that features two restaurants operated by chef Wolfgang Puck; the SilverScreen Theater, a 380-seat, luxury film venue and reception facility; the Blue Conference Center, a 200-seat conference facility; an outpost of the Museum of Contemporary Art; and an on-site fitness center. All of these amenities are available to the Red Building Property, which along with the Blue and Green Buildings, results in a total campus of approximately 1.2 million SF. |
The Red Building Property was 74.3% leased, as of December 18, 2017, to 12 tenants. The tenant mix consists of media and entertainment, fashion, technology and real estate tenants. The top three tenants at the Red Building Property are WeWork, Whalerock Industries (“Whalerock”) and Gaumont Television USA (“Gaumont”). WeWork, the largest tenant, occupies 69,534 SF, which represents 16.9% of the net rentable square footage and is on a lease that expires on January 31, 2030. WeWork provides shared workspace, community and services for entrepreneurs, freelancers, start-ups and small businesses. The company was founded in 2010 and is headquartered in New York City. WeWork manages approximately 10 million SF of office space in 23 U.S. cities and 16 countries including Australia, Canada, India, China, Hong Kong, France, the United Kingdom, Israel, South Korea, Mexico, the Netherlands and Germany. The second largest tenant, Whalerock, occupies 36,163 SF, which represents 8.8% of the net rentable square footage and is on a lease that expires on October 31, 2026. Whalerock is a media and technology company based in Los Angeles. Whalerock partners with public figures and brands to create, build and operate direct-to-consumer multi-media apps which integrate music, video, live streaming, e-commerce and gaming. The third largest tenant, Gaumont, occupies 30,388 SF, which represents 7.4% of the net rentable square footage, under two separate leases. Gaumont, which is the television division of French Gaumont, initially signed a lease at the Red Building Property for 10,495 SF that expires on July 31, 2023. Gaumont later leased an additional 19,893 SF of space under a lease with an expiration date of July 31, 2027. Gaumont produces drama and comedy television programming for the U.S. and international markets.
The depositor has filed a registration statement (including a prospectus) with the Securities and Exchange Commission (“SEC”) (SEC File No. 333-207132) for the offering to which this communication relates. Before you invest, you should read the prospectus in the registration statement and other documents the depositor has filed with the SEC for more complete information about the depositor, the issuing entity and this offering. You may get these documents for free by visiting EDGAR on the SEC website at www.sec.gov. Alternatively, the depositor or Citigroup Global Markets Inc., Morgan Stanley & Co. LLC, Merrill Lynch, Pierce, Fenner & Smith Incorporated, Drexel Hamilton, LLC, The Williams Capital Group, L.P. or any other underwriter or dealer participating in this offering will arrange to send you the prospectus if you request it by calling toll-free 1-800-831-9146.
86
| LOAN #6: RED BUILDING |
The following table presents certain information relating to the major tenants at the Red Building Property:
Ten Largest Owned Tenants Based on Underwritten Base Rent(1)
| Tenant Name | Credit Rating (Fitch/MIS/S&P) | Tenant GLA | % of GLA | UW Base Rent | % of Total UW Base Rent | UW Base Rent $ per SF | Lease Expiration | Renewal / Extension Options | ||||||||||
| WeWork | NR / NR / NR | 69,534 | 16.9 | % | $3,705,306 | 22.7% | $53.29 | 1/31/2030 | 1, 5-year option | |||||||||
| Whalerock Industries | NR / NR / NR | 36,163 | 8.8 | 1,890,421 | 11.6 | $52.28 | 10/31/2026 | 1, 5-year option | ||||||||||
| Gaumont Television USA(2) | NR / NR / NR | 30,388 | 7.4 | 1,713,303 | 10.5 | $56.38 | Various | 1, 5-year option | ||||||||||
| Abrams Artist Agency | NR / NR / NR | 26,668 | 6.5 | 1,523,529 | 9.3 | $57.13 | 1/31/2028 | 1, 5-year option | ||||||||||
| Clique Media(3) | NR / NR / NR | 28,346 | 6.9 | 1,506,533 | 9.2 | $53.15 | 1/31/2026 | 1, 5-year option | ||||||||||
| Critical Content, LLC(4) | NR / NR / NR | 25,883 | 6.3 | 1,487,600 | 9.1 | $57.47 | 11/30/2027 | 1, 5-year option | ||||||||||
| Grindr | NR / NR / NR | 25,780 | 6.3 | 1,476,900 | 9.1 | $57.29 | 4/30/2026 | 1, 5-year option | ||||||||||
| Criteria Corp(5) | NR / NR / NR | 15,549 | 3.8 | 879,210 | 5.4 | $56.54 | 5/31/2026 | 1, 5-year option | ||||||||||
| DBA Media | NR / NR / NR | 13,325 | 3.2 | 763,371 | 4.7 | $57.29 | 11/30/2024 | 3, 10-year options | ||||||||||
| Cohen Brothers Realty Corp | NR / NR / NR | 14,865 | 3.6 | 340,000 | 2.1 | $22.87 | 6/30/2028 | 1, 5-year option | ||||||||||
| Largest Owned Tenants | 286,501 | 69.6 | % | $15,286,172 | 93.7% | $53.35 | ||||||||||||
| Remaining Tenants | 19,299 | 4.7 | 1,028,280 | 6.3 | $53.28 | |||||||||||||
| Vacant | 105,747 | 25.7 | 0 | 0.0 | $0.00 | |||||||||||||
| Total / Wtd. Avg. All Tenants | 411,547 | 100.0 | % | $16,314,451 | 100.0% | $53.35 | ||||||||||||
| (1) | Based on the underwritten rent roll dated December 18, 2017. |
| (2) | A portion of Gaumont Television USA’s space (10,495 SF) expires on July 31, 2023 and the remainder of its space (19,893 SF) expires on July 31, 2027. |
| (3) | Clique Media has an option to terminate its lease on January 31, 2023, with 18 months’ prior notice and payment of any unamortized tenant improvements and leasing commissions and free rent. |
| (4) | Critical Content, LLC has an option to terminate its lease on November 30, 2023, with 12 months’ prior notice and the payment of two months’ of base rent plus any unamortized tenant improvements and leasing commissions and free rent. |
| (5) | Criteria Corp has an option to terminate its lease on July 31, 2022, with 12 months’ prior notice and a total payment of $725,487. |
The following table presents the lease rollover schedule at the Red Building Property, based on initial lease expiration dates:
Lease Expiration Schedule(1)(2)
| Year Ending December 31, | Expiring Owned GLA | % of Owned GLA | Cumulative % of Owned GLA | UW Base Rent | % of Total UW Base Rent | UW Base Rent $ per SF(3) | # of Expiring Tenants | ||||||||||||||
| MTM | 0 | 0.0 | % | 0.0 | % | $0 | 0.0 | % | $0.00 | 0 | |||||||||||
| 2018 | 0 | 0.0 | 0.0 | 0 | 0.0 | $0.00 | 0 | ||||||||||||||
| 2019 | 0 | 0.0 | 0.0 | 0 | 0.0 | $0.00 | 0 | ||||||||||||||
| 2020 | 0 | 0.0 | 0.0 | 0 | 0.0 | $0.00 | 0 | ||||||||||||||
| 2021 | 0 | 0.0 | 0.0 | 0 | 0.0 | $0.00 | 0 | ||||||||||||||
| 2022 | 0 | 0.0 | 0.0 | 0 | 0.0 | $0.00 | 0 | ||||||||||||||
| 2023 | 10,495 | 2.6 | 2.6 | 554,480 | 3.4 | $52.83 | 1 | ||||||||||||||
| 2024 | 13,325 | 3.2 | 5.8 | 763,371 | 4.7 | $57.29 | 1 | ||||||||||||||
| 2025 | 0 | 0.0 | 5.8 | 0 | 0.0 | $0.00 | 0 | ||||||||||||||
| 2026 | 115,858 | 28.2 | 33.9 | 6,282,448 | 38.5 | $54.23 | 5 | ||||||||||||||
| 2027 | 55,055 | 13.4 | 47.3 | 3,145,317 | 19.3 | $57.13 | 2 | ||||||||||||||
| 2028 | 41,533 | 10.1 | 57.4 | 1,863,529 | 11.4 | $44.87 | 2 | ||||||||||||||
| 2029 & Thereafter | 69,534 | 16.9 | 74.3 | 3,705,306 | 22.7 | $53.29 | 1 | ||||||||||||||
| Vacant | 105,747 | 25.7 | 100.0 | % | 0 | 0.0 | $0.00 | 0 | |||||||||||||
| Total / Wtd. Avg. | 411,547 | 100.0 | % | $16,314,451 | 100.0 | % | $53.35 | 12 | |||||||||||||
| (1) | Calculated based on approximate square footage occupied by each owned tenant unless otherwise specified. |
| (2) | Certain tenants may have lease termination options that are exercisable prior to the originally stated expiration date of the subject lease and that are not considered in the Lease Expiration Schedule. |
| (3) | Wtd. Avg. UW Base Rent $ per SF excludes vacant space. |
The depositor has filed a registration statement (including a prospectus) with the Securities and Exchange Commission (“SEC”) (SEC File No. 333-207132) for the offering to which this communication relates. Before you invest, you should read the prospectus in the registration statement and other documents the depositor has filed with the SEC for more complete information about the depositor, the issuing entity and this offering. You may get these documents for free by visiting EDGAR on the SEC website at www.sec.gov. Alternatively, the depositor or Citigroup Global Markets Inc., Morgan Stanley & Co. LLC, Merrill Lynch, Pierce, Fenner & Smith Incorporated, Drexel Hamilton, LLC, The Williams Capital Group, L.P. or any other underwriter or dealer participating in this offering will arrange to send you the prospectus if you request it by calling toll-free 1-800-831-9146.
87
| LOAN #6: RED BUILDING |
The following table presents certain information relating to historical leasing at the Red Building Property:
Historical Leased %(1)
| 2014(2) | 2015 | 2016 | As of 12/18/2017(3) | |||||
| Owned Space | NAV | 6.3% | 34.0% | 74.3% |
| (1) | As provided by the borrower and which represents occupancy as of December 31 for the indicated year unless otherwise specified. |
| (2) | The Red Building Property was built in 2013 and was leased up over the course of 2015-2017, therefore the historical occupancy for 2014 is not available. |
| (3) | Based on the underwritten rent roll dated December 18, 2017. |
| ■ | Operating History and Underwritten Net Cash Flow. The following table presents certain information relating to the historical operating performance and the Underwritten Net Cash Flow at the Red Building Property: |
Cash Flow Analysis(1)
| 2015 | 2016 | TTM 9/30/2017 | Underwritten | Underwritten | |||||||||||
| Base Rent(2) | $541,955 | $4,154,489 | $7,252,385 | $15,999,803 | $38.88 | ||||||||||
| Contractual Rent Steps(3) | 0 | 0 | 0 | 314,649 | 0.76 | ||||||||||
| Gross Up Vacancy | 0 | 0 | 0 | 5,744,058 | 13.96 | ||||||||||
| Economic Vacancy & Credit Loss | 0 | 0 | 0 | (5,744,058 | ) | (13.96 | ) | ||||||||
| Other Income(4) | 23,025 | 102,442 | 116,774 | 271,209 | 0.66 | ||||||||||
| Parking | 0 | 152,871 | 1,956,588 | 2,340,000 | 5.69 | ||||||||||
| Effective Gross Income | $564,980 | $4,409,802 | $9,325,747 | $18,925,660 | $45.99 | ||||||||||
| Real Estate Taxes | $2,549,052 | $2,432,652 | $2,436,545 | $2,195,094 | $5.33 | ||||||||||
| Insurance | 75,102 | 97,493 | 100,547 | 92,365 | 0.22 | ||||||||||
| Management Fee | 16,949 | 132,294 | 279,772 | 567,770 | 1.38 | ||||||||||
| Other Operating Expenses(5) | 1,382,035 | 1,604,226 | 3,015,233 | 3,219,621 | 7.82 | ||||||||||
| Total Operating Expenses | $4,023,138 | $4,266,665 | $5,832,097 | $6,074,849 | $14.76 | ||||||||||
| Net Operating Income | ($3,458,158 | ) | $143,137 | $3,493,650 | $12,850,810 | $31.23 | |||||||||
| TI/LC | 0 | 0 | 0 | 977,688 | 2.38 | ||||||||||
| Capital Expenditures | 0 | 0 | 0 | 82,309 | 0.20 | ||||||||||
| Net Cash Flow | ($3,458,158 | ) | $143,137 | $3,493,650 | $11,790,813 | $28.65 | |||||||||
| Occupancy(6) | 6.3% | 34.0% | 74.3% | 74.2% | |||||||||||
| NOI Debt Yield(7) | 0.0% | 0.2% | 4.4% | 16.1% | |||||||||||
| NCF DSCR(7) | 0.00x | 0.04x | 0.98x | 3.31x | |||||||||||
| (1) | Certain items such as straight line rent, interest expense, interest income, lease cancellation income, depreciation, amortization, debt service payments and any other non-recurring or non-operating items were excluded from the historical presentation and are not considered for the underwritten cash flow. |
| (2) | The Red Building Property was built in 2013 and is currently undergoing lease-up as the sponsorship selectively markets available space to a specific tenant-profile. The increase in underwritten base rent over the TTM 9/30/2017 amount is directly attributable to the signing of new leases at the Red Building Property. |
| (3) | Contractual Rent Steps are underwritten based upon the actual scheduled rent increases through December 1, 2018. |
| (4) | Other Income includes tenant electric reimbursements, loading dock income, tenant services income and miscellaneous income. |
| (5) | Due to the non-stabilized operations at the Red Building Property, historical expenses were not used as a basis for the Underwritten Other Operating Expenses. |
| (6) | TTM 9/30/2017 Occupancy represents physical occupancy as of December 18, 2017. Underwritten Occupancy represents economic occupancy at the Red Building Property. |
| (7) | NOI Debt Yield and NCF DSCR calculations are based on the aggregate outstanding principal balance as of the Cut-off Date of the Red Building A-Notes. |
| ■ | Appraisal.According to the appraisal, the Red Building Property had an “as-is” appraised value of $286,700,000 as of October 27, 2017 and two separate “as-stabilized” appraised values of: $314,400,000 as of April 1, 2019 and $314,300,000 as of April 1, 2018. Under the first stabilization scenario, the appraiser assumed that the Red Building Property’s vacant spaces would be absorbed in 20 months and the Red Building Property would reach a stabilized occupancy of 90.0% by April 1, 2019. The second stabilization scenario assumed that a letter of intent would be signed with a prospective tenant for the 11thand 12th floors of the West Tower, that the prospective tenant’s rent would commence on February 1, 2018, and that the Red Building Property would reach a stabilized 90.0% occupancy at the earlier date of April 1, 2018. |
Appraisal Approach | Value | Discount Rate | Capitalization Rate |
| Direct Capitalization Approach | $289,300,000 | N/A | 4.75% |
| Discounted Cash Flow Approach | $286,700,000 | 6.75% | 5.50%(1) |
| (1) | Represents the terminal capitalization rate. |
| ■ | Environmental Matters. Based on a Phase I environmental report dated October 31, 2017, the environmental consultant did not identify evidence of any recognized environmental conditions or recommendations for further action at the Red Building Property. |
The depositor has filed a registration statement (including a prospectus) with the Securities and Exchange Commission (“SEC”) (SEC File No. 333-207132) for the offering to which this communication relates. Before you invest, you should read the prospectus in the registration statement and other documents the depositor has filed with the SEC for more complete information about the depositor, the issuing entity and this offering. You may get these documents for free by visiting EDGAR on the SEC website at www.sec.gov. Alternatively, the depositor or Citigroup Global Markets Inc., Morgan Stanley & Co. LLC, Merrill Lynch, Pierce, Fenner & Smith Incorporated, Drexel Hamilton, LLC, The Williams Capital Group, L.P. or any other underwriter or dealer participating in this offering will arrange to send you the prospectus if you request it by calling toll-free 1-800-831-9146.
88
| LOAN #6: RED BUILDING |
| ■ | Market Overview and Competition. The Red Building Property is located in the city of West Hollywood within Los Angeles County. West Hollywood is a residential district located between Hollywood on the east and Beverly Hills on the west. The area is known for its shopping, dining and entertainment venues. West Hollywood features a mix of small, family-owned businesses and larger-scale corporate businesses. The largest employer is the Los Angeles County Metropolitan Transportation Authority. Other major employers include the City of West Hollywood and a number of hotels in the area. |
The Red Building Property is located in the West Hollywood office submarket of Los Angeles. According to the appraisal, as of the third quarter of 2017, the submarket is comprised of approximately 7.5 million SF of inventory with a 9.9% vacancy and gross asking rent of $50.12 per SF; gross asking rent for four to five-star properties is $61.17 per SF. The submarket has experienced a net positive absorption from 2015 through the third quarter of 2017 with a decline in submarket vacancy from 12.5% at year-end 2014 to 9.9% as of the third quarter of 2017. For the same period, average asking rents increased from $47.59 per SF to $50.12 per SF which is attributable to the healthy supply/demand conditions that exist within this submarket. The appraiser identified six comparable properties that compete directly with the Red Building Property (see the “Office Lease Comparables” table below), totaling 1,202,409 SF, with an average vacancy of 5.9%, excluding Maple Plaza and 407 North Maple, two properties that have not yet stabilized. Additionally, the appraiser’s market rent conclusion for office spaces that are greater than 10,000 SF is $54.00 per SF, on a modified gross basis, and $57.00 per SF, on a modified gross basis, for office spaces that are less than 10,000 SF. According to the appraisal, the 2016 population within a one-, three- and five-mile radius of the Red Building Property was 38,599, 249,406 and 777,718, respectively. For the same period, the average household income within a one-, three- and five-mile radius was $114,326, $112,805 and $96,749, respectively.
The following table presents certain information relating to lease comparables for the Red Building Property:
Office Lease Comparables(1)
Subject(2) | Beverly Mercedes Place | Maple Plaza | Sunset Doheny West | |
| City | West Hollywood | Beverly Hills | Beverly Hills | West Hollywood |
| Year Built / Renovated | 2013 / NAP | 1989 / NAP | 1986 / NAP | 1962 / 1992 |
| Building SF | 411,547 | 132,221 | 287,187 | 141,983 |
| Total Occupancy | 74.3% | 87.5% | 69.8% | 95.8% |
| Comparable Lease Tenant | - | Listing | Levine Leichtman Capital Partners | Tristar |
| Comparable Lease Rate per SF | - | $64.80 | $65.40 | $52.20 |
407 North Maple | Vine Street Tower | Luckman Plaza | |
| City | Beverly Hills | Los Angeles | West Hollywood |
| Year Built / Renovated | 2003 / 2017 | 2017 / NAP | 1964 / 2010 |
| Building SF | 174,374 | 115,591 | 350,693 |
| Total Occupancy | 55.7% | 98.2% | 95.0% |
| Comparable Lease Tenant | Fandango | WeWork | Mgmt Entertainment |
| Comparable Lease Rate per SF | $63.60 | $59.40 | $72.00 |
| (1) | Source: Appraisal. |
| (2) | Based on the underwritten rent roll dated December 18, 2017. |
| ■ | The Borrower. The borrower is Pacific Red, LLC, a Delaware limited liability company and special purpose entity with two independent directors, is 100% owned by Pacific Vicente Development, LLC. Pacific Vicente Development, LLC is owned by Charles Steven Cohen (60% personally and the sole managing member of Pacific Vicente Development, LLC) and four family trusts, each with a 10% ownership interest (Brook Ashley Cohen Pacific Red Trust, Ross Alexander Cohen Pacific Red Trust, Rex Roman Cohen Pacific Red Trust and Blake S Cohen Pacific Red Trust). Legal counsel to the borrower delivered a non-consolidation opinion in connection with the origination of the Red Building Loan Combination. The sponsor and non-recourse carve-out guarantor for the Red Building Loan Combination is Charles Steven Cohen, the President and CEO of Cohen Brothers Realty Corporation. The ongoing net worth and liquidity covenant during the term of the loan for Mr. Cohen is $500 million and $50 million, respectively. Cohen Brothers Realty Corporation is a private real estate development and management firm that has been in existence for 50+ years. The firm has commercial properties in New York, Houston, South Florida, and Southern California. |
| ■ | Escrows.In connection with the origination of the Red Building Loan Combination, the borrower funded reserves of (i) $192,071 for real estate taxes, (ii) $88,901 for insurance, (iii) $3,874,436 for a cash flow shortfall relating to outstanding free rent obligations and (iv) $753,409 for unfunded obligations related to the leases for WeWork, Gaumont and Grindr. |
The depositor has filed a registration statement (including a prospectus) with the Securities and Exchange Commission (“SEC”) (SEC File No. 333-207132) for the offering to which this communication relates. Before you invest, you should read the prospectus in the registration statement and other documents the depositor has filed with the SEC for more complete information about the depositor, the issuing entity and this offering. You may get these documents for free by visiting EDGAR on the SEC website at www.sec.gov. Alternatively, the depositor or Citigroup Global Markets Inc., Morgan Stanley & Co. LLC, Merrill Lynch, Pierce, Fenner & Smith Incorporated, Drexel Hamilton, LLC, The Williams Capital Group, L.P. or any other underwriter or dealer participating in this offering will arrange to send you the prospectus if you request it by calling toll-free 1-800-831-9146.
89
| LOAN #6: RED BUILDING |
Additionally, on each due date, the borrower is required to fund the following reserves with respect to the Red Building Property: (i) a tax reserve in an amount equal to one-twelfth of the amount that the lender estimates will be necessary to pay taxes over the then succeeding 12-month period (initially $192,071), (ii) an insurance reserve in an amount equal to one-twelfth of the amount that the lender estimates will be necessary to pay insurance premiums over the then succeeding 12-month period, to the extent the Red Building Property is not covered by an approved blanket policy (initially $8,082), (iii) a replacement reserve in the amount of $6,859, and (iv) a springing monthly tenant improvements and leasing commissions reserve (commencing on the monthly payment date in February 2021) in the monthly amount of $66,114, subject to a cap of $3,966,820.
| ■ | Lockbox and Cash Management. The Red Building Loan Combination documents require a hard lockbox with springing cash management.TheRed Building Loan Combinationdocuments required the borrower to deliver tenant direction letters within 30 days of origination of theRed Building Loan Combination, which directed tenants to pay rent directly to a lender-controlled lockbox account and required that all other money received by the borrower with respect to the Red Building Property be promptly deposited into such lockbox account during the term of theRed Building Loan Combination.Prior tothe occurrence of aRed Building Trigger Period (as defined below), funds in the lockbox account will be transferred daily at the direction of the borrower.After the occurrence of and during the continuance of a Red Building Trigger Period, all amounts in the lockbox account are required to be swept to a lender-controlled cash management account on a daily basis and applied to payment of debt service and operating expenses and funding of required reserves, with the remainder deposited into an excess cash flow reserve and held by the lender as additional collateral for the Red Building Loan Combination (provided, however, that to the extent no event of default is then ongoing, funds in the excess cash flow account will be made available to the borrower for: (x) certain tenant improvement and/or leasing commission costs (to the extent there are, as of said date of disbursement, insufficient funds in the leasing reserve for payment of the same), (y) taxes and/or insurance premiums (to the extent there are, as of said date of disbursement, insufficient funds in the tax and/or insurance account (as applicable) for payment of the same) and/or (z) operating expenses which are due and payable that have been expressly approved by the lender or which are set forth in an annual budget which has been expressly approved by the lender (to the extent amounts have not been disbursed for payment of the applicable operating expenses (or anticipated to be disbursed on the next monthly payment date for the same) to the borrower pursuant to the Red Building Loan documents). After the occurrence and during the continuance of an event of default under the Red Building Loan Combination documents, the lender may apply any funds in the cash management account to amounts payable under the Red Building Loan Combination (and/or toward the payment of expenses of the Red Building Property), in such order of priority as the lender may determine. |
A“Red Building Trigger Period” means a period commencing upon the earliest of (i) the occurrence and continuance of an event of default under the Red Building Loan Combination documents, and (ii) the debt service coverage ratio being less than 1.20x, and expiring upon (x) with regard to any Red Building Trigger Period commenced in connection with clause (i) above, the cure (if applicable) of such event of default, and (y) with regard to any Red Building Trigger Period commenced in connection with clause (ii) above, the date that the debt service coverage ratio is equal to or greater than 1.20x for two consecutive calendar quarters. Notwithstanding the foregoing, (A) no Red Building Trigger Period will be deemed to exist solely with respect to clause (ii) above during any period that the Collateral Cure Conditions (defined below) are satisfied and (B) a Red Building Trigger Period will not be deemed to expire in the event that a Red Building Trigger Period then exists for any other reason.
“Collateral Cure Conditions”will be deemed to exist upon satisfaction of the following by the borrower: the borrower has deposited cash into the excess cash flow account or has delivered to the lender a letter of credit which, in either case, will serve as additional collateral for the Red Building Loan Combination, in an amount equal to 20% of the quarterly aggregate debt service payments that are due as of the origination date of the Red Building Loan Combination (i.e. an amount which, assuming the debt service coverage ratio is 1.00x for a given quarter, if added to Underwritable Cash Flow (defined below) for such quarter, would be sufficient to achieve a 1.20x debt service coverage ratio for such quarter) (the “Collateral Deposit Amount”) and thereafter, on each three month anniversary date of the date that borrower made said deposit (or delivered said letter of credit), the borrower must deposit additional cash collateral into the excess cash flow account in the amount of the Collateral Deposit Amount or must increase the amount of the letter of credit by an amount equal to the Collateral Deposit Amount (as applicable) (i.e. for purposes of clarity, over the course of each full year during which the Collateral Cure Conditions are satisfied, four (4) quarterly deposits of the Collateral Deposit Amount shall be required which shall, in the aggregate, equal 20% of the annual aggregate debt service which is due and payable pursuant to the Red Building Loan documents. Provided no event of default is ongoing, the deposited collateral will be disbursed to the borrower at such time as the Red Building Trigger Period that the Collateral Cure Conditions relate to would have been cured had the borrower not satisfied the
The depositor has filed a registration statement (including a prospectus) with the Securities and Exchange Commission (“SEC”) (SEC File No. 333-207132) for the offering to which this communication relates. Before you invest, you should read the prospectus in the registration statement and other documents the depositor has filed with the SEC for more complete information about the depositor, the issuing entity and this offering. You may get these documents for free by visiting EDGAR on the SEC website at www.sec.gov. Alternatively, the depositor or Citigroup Global Markets Inc., Morgan Stanley & Co. LLC, Merrill Lynch, Pierce, Fenner & Smith Incorporated, Drexel Hamilton, LLC, The Williams Capital Group, L.P. or any other underwriter or dealer participating in this offering will arrange to send you the prospectus if you request it by calling toll-free 1-800-831-9146.
90
| LOAN #6: RED BUILDING |
Collateral Cure Conditions (i.e. at such time as the debt service coverage ratio (without taking into account the cash deposit and/or letter of credit) is equal to or greater than 1.20x for two consecutive quarters).
“Underwritable Cash Flow” means an amount calculated by the lender on a monthly basis equal to the sum of the gross rents plus the trailing twelve months operating income, less the trailing twelve months operating expenses, each of which will be subject to the lender’s application of cash flow adjustments.
| ■ | Property Management. The Red Building Property is managed by Cohen Brothers Realty Corporation of California, an affiliate of the borrower. The lender has the right to, or to direct the borrower to, terminate the property management agreement and replace the property manager if (i) the property manager becomes insolvent or a debtor in an involuntary bankruptcy or insolvency proceeding not dismissed within 90 days or any voluntary bankruptcy or insolvency proceeding; (ii) a Red Building Trigger Period exists; (iii) the property manager has engaged in gross negligence, fraud, willful misconduct or misappropriation of funds; or (iv) a default by the property manager under the property management agreement has occurred and is continuing beyond all applicable notice and cure periods. The borrower has the right to replace the property manager, provided no event of default is continuing under the Red Building Loan Combination documents and upon 30 days’ prior notice to the lender, with a property manager approved by the lender in writing (which may be conditioned upon receipt of a rating agency confirmation). |
| ■ | Permitted Mezzanine or Secured Subordinate Indebtedness. The borrower will be permitted to incur mezzanine financing (the “Mezzanine Loan”) secured by the 100% direct or indirect equity ownership interest held in the borrower, provided that certain conditions set forth in the Red Building Loan Combination documents are satisfied, which include (without limitation): (i) no event of default is then ongoing; (ii) the principal balance of the Mezzanine Loan is less than $50,000,000; (iii) after giving effect to the Mezzanine Loan, the debt yield on the entire debt stack will be equal to or greater than 7.5%, the debt service coverage ratio on the entire debt stack will be equal to or greater than 1.45x and the loan to value ratio on the entire debt stack will be equal to or less than 60%; (iv) the holder of the Mezzanine Loan has entered into a mezzanine intercreditor agreement with the lender in form and substance acceptable to lender; (v) the holder of the Mezzanine Loan is a “qualified equityholder” (as such term is defined in the Red Building Loan documents, which includes (without limitation) various types of entities that have total real estate equity assets of at least $750 million); and (vi) a rating agency confirmation is delivered in connection with the consummation of the Mezzanine Loan. |
| ■ | Release of Collateral.Not permitted. |
| ■ | Terrorism Insurance. The borrower is required to maintain an “all-risk” insurance policy that provides coverage for terrorism in an amount equal to 100% of the full replacement cost of theRed BuildingProperty with no deductible in excess of $10,000 (except with respect to earthquake and windstorm coverage), plus a business interruption insurance policy that provides 18 months of business interruption coverage with an additional extended period of indemnity for up to six months after the physical loss has been repaired. Notwithstanding the foregoing, if TRIPRA (or any applicable subsequent statute, extension or reauthorization) is not in effect and any policy excludes terrorism coverage, the borrower will be obligated to obtain, to the extent available, a stand-alone terrorism policy (provided, that, in no event will the borrower be required to pay annual premiums in excess of the TC Cap (defined below) in order to obtain the applicable terrorism coverage). “TC Cap” means an amount equal to two times the annual premium (as of the date of determination) for the other insurance policies required pursuant to the Red Building Loan Combination documents. See “Risk Factors—Terrorism Insurance May Not Be Available for All Mortgaged Properties”in the Preliminary Prospectus. |
The depositor has filed a registration statement (including a prospectus) with the Securities and Exchange Commission (“SEC”) (SEC File No. 333-207132) for the offering to which this communication relates. Before you invest, you should read the prospectus in the registration statement and other documents the depositor has filed with the SEC for more complete information about the depositor, the issuing entity and this offering. You may get these documents for free by visiting EDGAR on the SEC website at www.sec.gov. Alternatively, the depositor or Citigroup Global Markets Inc., Morgan Stanley & Co. LLC, Merrill Lynch, Pierce, Fenner & Smith Incorporated, Drexel Hamilton, LLC, The Williams Capital Group, L.P. or any other underwriter or dealer participating in this offering will arrange to send you the prospectus if you request it by calling toll-free 1-800-831-9146.
91
LOAN #7: town center at levis commons
The depositor has filed a registration statement (including a prospectus) with the Securities and Exchange Commission (“SEC”) (SEC File No. 333-207132) for the offering to which this communication relates. Before you invest, you should read the prospectus in the registration statement and other documents the depositor has filed with the SEC for more complete information about the depositor, the issuing entity and this offering. You may get these documents for free by visiting EDGAR on the SEC website at www.sec.gov. Alternatively, the depositor or Citigroup Global Markets Inc., Morgan Stanley & Co. LLC, Merrill Lynch, Pierce, Fenner & Smith Incorporated, Drexel Hamilton, LLC, The Williams Capital Group, L.P. or any other underwriter or dealer participating in this offering will arrange to send you the prospectus if you request it by calling toll-free 1-800-831-9146.
92
LOAN #7: town center at levis commons
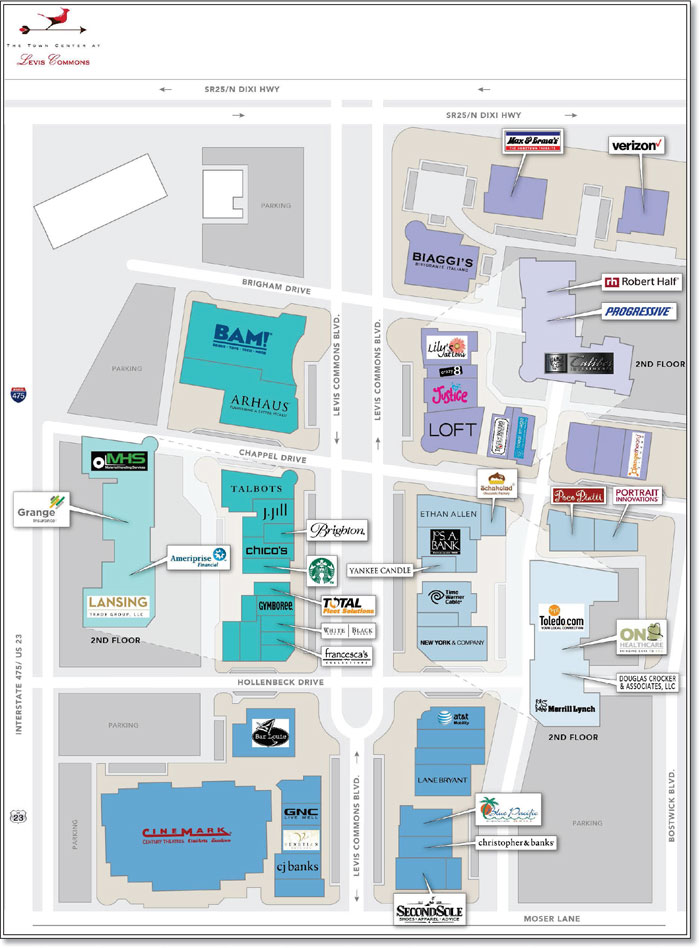
The depositor has filed a registration statement (including a prospectus) with the Securities and Exchange Commission (“SEC”) (SEC File No. 333-207132) for the offering to which this communication relates. Before you invest, you should read the prospectus in the registration statement and other documents the depositor has filed with the SEC for more complete information about the depositor, the issuing entity and this offering. You may get these documents for free by visiting EDGAR on the SEC website at www.sec.gov. Alternatively, the depositor or Citigroup Global Markets Inc., Morgan Stanley & Co. LLC, Merrill Lynch, Pierce, Fenner & Smith Incorporated, Drexel Hamilton, LLC, The Williams Capital Group, L.P. or any other underwriter or dealer participating in this offering will arrange to send you the prospectus if you request it by calling toll-free 1-800-831-9146.
93
LOAN #7: town center at levis commons
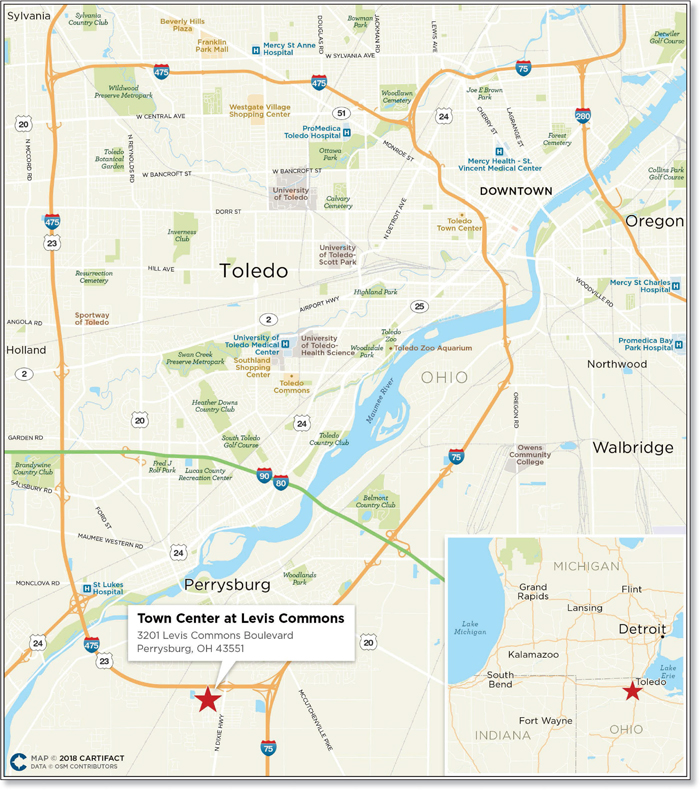
The depositor has filed a registration statement (including a prospectus) with the Securities and Exchange Commission (“SEC”) (SEC File No. 333-207132) for the offering to which this communication relates. Before you invest, you should read the prospectus in the registration statement and other documents the depositor has filed with the SEC for more complete information about the depositor, the issuing entity and this offering. You may get these documents for free by visiting EDGAR on the SEC website at www.sec.gov. Alternatively, the depositor or Citigroup Global Markets Inc., Morgan Stanley & Co. LLC, Merrill Lynch, Pierce, Fenner & Smith Incorporated, Drexel Hamilton, LLC, The Williams Capital Group, L.P. or any other underwriter or dealer participating in this offering will arrange to send you the prospectus if you request it by calling toll-free 1-800-831-9146.
94
LOAN #7: town center at levis commons
| Mortgaged Property Information | Mortgage Loan Information | |||||
| Number of Mortgaged Properties | 1 | Loan Seller | MSMCH | |||
| Location (City/State) | Perrysburg, Ohio | Cut-off Date Balance | $37,000,000 | |||
| Property Type | Retail | Cut-off Date Balance per SF | $119.54 | |||
| Size (SF) | 309,532 | Percentage of Initial Pool Balance | 3.5% | |||
| Total Occupancy as of 1/1/2018(1) | 89.3% | Number of Related Mortgage Loans | None | |||
| Owned Occupancy as of 1/1/2018(1) | 89.3% | Type of Security | Fee Simple | |||
| Year Built / Latest Renovation | 2004 / NAP | Mortgage Rate | 4.79000% | |||
| Appraised Value | $59,500,000 | Original Term to Maturity (Months) | 60 | |||
| Appraisal Date | 12/20/2017 | Original Amortization Term (Months) | NAP | |||
| Borrower Sponsors | Torchlight Investors and Hill | Original Interest Only Period (Months) | 60 | |||
| Partners, Inc. | First Payment Date | 4/1/2018 | ||||
| Property Management | Hill Partners, Inc. | Maturity Date | 3/1/2023 | |||
| Underwritten Revenues(1) | $6,855,459 | |||||
| Underwritten Expenses | $2,926,296 | Escrows(2) | ||||
| Underwritten Net Operating Income (NOI) | $3,929,163 | Upfront | Monthly | |||
| Underwritten Net Cash Flow (NCF) | $3,549,389 | Taxes | $49,820 | $49,820 | ||
| Cut-off Date LTV Ratio | 62.2% | Insurance | $0 | $0 | ||
| Maturity Date LTV Ratio | 62.2% | Replacement Reserve | $0 | $3,869 | ||
| DSCR Based on Underwritten NOI / NCF | 2.19x / 1.98x | TI/LC(3) | $1,000,000 | $38,934 | ||
| Debt Yield Based on Underwritten NOI / NCF | 10.6% / 9.6% | Other(4) | $400,030 | $0 | ||
| Sources and Uses | ||||||||
| Sources | $ | % | Uses | $ | % | |||
| Loan Amount | $37,000,000 | 68.0 | % | Loan Payoff(5) | $51,904,352 | 95.4 | % | |
| Principal’s New Cash Contribution(5) | 17,396,976 | 32.0 | Reserves | 1,449,850 | 2.7 | |||
| Closing Costs | 1,042,774 | 1.9 | ||||||
| Total Sources | $54,396,976 | 100.0 | % | Total Uses | $54,396,976 | 100.0 | % | |
| (1) | Occupancy includes certain tenants representing 6.8% of GLA that are in occupancy and either have an active termination option tied to a sales threshold they are not meeting, are currently dark or are currently delinquent on rent payments. Rent from such tenants was not underwritten. One tenant, Jos A Bank (1.3% of GLA and 2.1% of underwritten rent), which has a sales termination option that is currently exercisable, has been underwritten. |
| (2) | See “—Escrows” below. |
| (3) | The borrower is not required to make the monthly deposit to the TI/LC reserve if it would cause the amount then on deposit (excluding the $1,000,000 upfront deposit) to exceed the TI/LC reserve cap of $1,400,000. |
| (4) | Other Upfront Reserves are comprised of $400,030 for outstanding tenant improvement and leasing commissions. See “—Escrows” below. |
| (5) | Prior to loan closing the Mortgaged Property secured a prior mortgage loan (the “Prior Loan”) in the original principal amount of $58,000,000, which entered maturity default in February 2017 and was purchased by an entity owned by a fund advised by Torchlight Investors (such entity, the “Torchlight Entity”) at a discounted price of $50,000,000 in April 2017. The Loan Payoff of the outstanding principal balance of the Prior Loan of $51,904,352 includes a $17,396,976 credit in the form of forgiveness by the Torchlight Entity of the outstanding principal balance of the Prior Loan that was not repaid by the net proceeds of the Town Center at Levis Commons Loan (as defined below) in exchange for an 85.0% interest in the Town Center at Levis Commons borrower. The Loan Payoff net of this credit is $34,507,376. See “Description of the Mortgage Pool-Default History, Bankruptcy Issues and Other Proceedings” in the Preliminary Prospectus. |
| ■ | The Mortgage Loan. The mortgage loan (the “Town Center at Levis Commons Loan”) is evidenced by a note secured by a first mortgage encumbering the borrower’s fee simple interest in a 309,532 SF lifestyle center located in Perrysburg, Ohio (the “Town Center at Levis Commons Property”). The Town Center at Levis Commons Loan was originated by Morgan Stanley Bank, N.A. on February 15, 2018 and represents approximately 3.5% of the Initial Pool Balance. The note evidencing the Town Center at Levis Commons Loan has an outstanding principal balance as of the Cut-off Date of $37,000,000 and an interest rate of 4.79000%per annum. The proceeds of the Town Center at Levis Commons Loan were primarily used to refinance the Town Center at Levis Commons Property, fund reserves and pay loan origination costs. |
The Town Center at Levis Commons Loan had an initial term of 60 months and has a remaining term of 60 months as of the Cut-off Date. The Town Center at Levis Commons Loan requires payment of interest-only for the entire term. The scheduled maturity date of the Town Center at Levis Commons Loan is the due date in March 2023. At any time after the second anniversary of the securitization Closing Date, the Town Center at Levis Commons Loan may be defeased in full with certain direct, non-callable full faith and credit obligations of the United States of America or other obligations which are “government securities” permitted under the Town Center at Levis Commons Loan documents. Voluntary prepayment of the Town Center at Levis Commons Loan is permitted on and after the due date occurring in December 2022 without payment of any prepayment premium.
| ■ | The Mortgaged Property.The Town Center at Levis Commons Property is a 309,532 SF lifestyle center comprised of 14 two-story buildings located in Perrysburg, Ohio. Built in 2004, the Town Center at Levis Commons Property is situated on 34.6 acres and is comprised of 240,027 SF of retail space (77.5% of GLA and 74.5% of underwritten base rent) and 69,505 SF of second floor office space (22.5% of GLA and 25.5% of underwritten base rent). As of January 1, 2018, the Town Center at Levis Commons Property was 89.3% leased by a mix of 52 national and local retail, restaurant, cinema, fitness and office tenants. Cinemark USA anchors the Town Center at Levis Commons Property as a 12-screen, 54,604 SF movie theatre. Besides Cinemark USA, no single tenant occupies more than 5.3% of GLA. Other notable tenants at the Town Center at Levis Commons Property include Arhaus Furniture, Bank of America, Lane Bryant, Jos A Bank, Verizon Wireless, Orange Theory Fitness, Starbucks, GNC and other major national and |
The depositor has filed a registration statement (including a prospectus) with the Securities and Exchange Commission (“SEC”) (SEC File No. 333-207132) for the offering to which this communication relates. Before you invest, you should read the prospectus in the registration statement and other documents the depositor has filed with the SEC for more complete information about the depositor, the issuing entity and this offering. You may get these documents for free by visiting EDGAR on the SEC website at www.sec.gov. Alternatively, the depositor or Citigroup Global Markets Inc., Morgan Stanley & Co. LLC, Merrill Lynch, Pierce, Fenner & Smith Incorporated, Drexel Hamilton, LLC, The Williams Capital Group, L.P. or any other underwriter or dealer participating in this offering will arrange to send you the prospectus if you request it by calling toll-free 1-800-831-9146.
95
LOAN #7: town center at levis commons
| regional retailers. Forty-three tenants (77.8% of GLA) have been at the Town Center at Levis Commons Property for more than five years while 31 tenants (64.5% of GLA) have been at the Town Center at Levis Commons Property for more than 10 years. Since 2013, year-end occupancy at the Town Center at Levis Commons Property has ranged from 88.3% to 90.0%. The Town Center at Levis Commons Property contains a total of 1,611 parking spaces (5.20 spaces per 1,000 SF of GLA). |
The following table presents sales information relating to certain tenants at the Town Center at Levis Commons Property:
Sales Per SF Summary(1)
Tenant Name | 2015 | 2016 | 2017 | |||
| Cinemark USA(2) | $412,592 | $429,162 | $409,725 | |||
| Arhaus Furniture | $273 | $253 | $312 | |||
| Bar Louie | $459 | $446 | $411 | |||
| Books a Million | $167 | $162 | $154 | |||
| Biaggi’s Ristorante Italiano | $384 | $390 | $385 | |||
| Max & Erma’s | $362 | $344 | $325 | |||
| Ann Taylor Loft | $287 | $271 | $235 | |||
| Other Retail Tenants | $262 | $267 | $246 |
| (1) | Information as provided by the borrower sponsors. |
| (2) | Tenant Sales $ per SF for Cinemark USA is based on 12 screens. |
The following table presents certain information relating to the major tenants (of which certain tenants may have co-tenancy provisions) at the Town Center at Levis Commons Property:
Ten Largest Owned Tenants Based on Underwritten Base Rent(1)
| Tenant Name | Credit Rating (Fitch/MIS/S&P)(2) | Tenant GLA | % of Owned GLA | UW Base Rent(3) | % of Total UW Base Rent | UW Base Rent $ per SF(3) | Lease Expiration | Tenant Sales $ per SF(4) | Occupancy Cost | Renewal / Extension Options | |||||||||||||||||
| Retail Tenants | |||||||||||||||||||||||||||
| Cinemark USA(5)(6) | NR/NR/BB | 54,604 | 17.6 | % | $732,240 | 13.7 | % | $13.41 | 1/1/2025 | $409,725 | 14.9 | % | 4, 5-year options | ||||||||||||||
| Arhaus Furniture | NR/NR/NR | 14,583 | 4.7 | 346,346 | 6.5 | 23.75 | 3/31/2020 | 312 | 7.6 | 1, 5-year option | |||||||||||||||||
| Bar Louie | NR/NR/NR | 7,293 | 2.4 | 257,443 | 4.8 | 35.30 | 3/31/2026 | 411 | 8.6 | NA | |||||||||||||||||
| Books a Million | NR/NR/NR | 16,275 | 5.3 | 252,263 | 4.7 | 15.50 | 2/28/2020 | 154 | 10.0 | 2, 5-year options | |||||||||||||||||
| Biaggi’s Ristorante Italiano | NR/NR/NR | 9,210 | 3.0 | 250,000 | 4.7 | 27.14 | 2/22/2020 | 385 | 7.1 | 3, 5-year options | |||||||||||||||||
| Max & Erma’s | NR/NR/NR | 6,083 | 2.0 | 234,196 | 4.4 | 38.50 | 10/31/2019 | 325 | 11.9 | 4, 5-year options | |||||||||||||||||
| Ann Taylor Loft | NR/NR/NR | 5,732 | 1.9 | 145,020 | 2.7 | 25.30 | 1/31/2020 | 235 | 10.8 | 2, 5-year options | |||||||||||||||||
| Total / Wtd. Avg. | 113,780 | 36.8 | % | $2,217,506 | 41.4 | % | $19.49 | $286 | (7) | 8.8 | %(7) | ||||||||||||||||
| Office Tenants | |||||||||||||||||||||||||||
| Material Handling Services | NR/NR/NR | 11,590 | 3.7 | % | $218,339 | 4.1 | % | $18.84 | 3/31/2023 | NA | |||||||||||||||||
| Total Fleet Solutions | NR/NR/NR | 8,799 | 2.8 | 202,377 | 3.8 | 23.00 | 3/31/2023 | NA | |||||||||||||||||||
| Bank of America | A/A3/A- | 7,200 | 2.3 | 159,768 | 3.0 | 22.19 | 7/31/2022 | 2, 5-year options | |||||||||||||||||||
| Total / Wtd. Avg. | 27,589 | 8.9 | % | $580,484 | 10.8 | % | $21.04 | ||||||||||||||||||||
| Other | 113,995 | 36.8 | $2,556,379 | 47.7 | % | $22.43 | |||||||||||||||||||||
| Vacant(8) | 54,168 | 17.5 | 0 | 0.0 | 0.00 | ||||||||||||||||||||||
| Total / Wtd. Avg. All Owned Tenants | 309,532 | 100.0 | % | $5,354,369 | 100.0 | % | $20.97 | ||||||||||||||||||||
| (1) | Based on the underwritten rent roll dated January 1, 2018. |
| (2) | Certain ratings are those of the parent company whether or not the parent guarantees the lease. |
| (3) | UW Base Rent and UW Base Rent $ per SF include contractual rent steps through December 31, 2018 totaling $49,924. |
| (4) | Tenant Sales $ per SF are as of December 31, 2017. |
| (5) | Cinemark USA has the right to construct an addition to its building not to exceed 17,500 SF. |
| (6) | Tenant Sales $ per SF for Cinemark USA is based on 12 screens. |
| (7) | For purposes of major retail tenants subtotals for Tenant Sales $ per SF and Occupancy Cost, amounts exclude Cinemark USA. |
| (8) | Vacant includes certain tenants representing 6.8% of GLA that are in occupancy and either have an active termination option tied to a sales threshold they are not meeting, are currently dark or are currently delinquent on rent payments. Rent from such tenants was not underwritten. One tenant, Jos A Bank (1.3% of GLA and 2.1% of underwritten rent), which has a sales termination option that is currently exercisable, has been underwritten. |
The depositor has filed a registration statement (including a prospectus) with the Securities and Exchange Commission (“SEC”) (SEC File No. 333-207132) for the offering to which this communication relates. Before you invest, you should read the prospectus in the registration statement and other documents the depositor has filed with the SEC for more complete information about the depositor, the issuing entity and this offering. You may get these documents for free by visiting EDGAR on the SEC website at www.sec.gov. Alternatively, the depositor or Citigroup Global Markets Inc., Morgan Stanley & Co. LLC, Merrill Lynch, Pierce, Fenner & Smith Incorporated, Drexel Hamilton, LLC, The Williams Capital Group, L.P. or any other underwriter or dealer participating in this offering will arrange to send you the prospectus if you request it by calling toll-free 1-800-831-9146.
96
LOAN #7: town center at levis commons
The following table presents certain information relating to the lease rollover schedule at the Town Center at Levis Commons Property, based on initial lease expiration dates:
Lease Expiration Schedule(1)(2)
Year Ending December 31 |
| Expiring Owned GLA |
| % of Owned GLA |
| Cumulative % of Owned GLA |
| UW Base Rent |
| % of Total UW Base Rent |
| UW Base Rent $ per SF(3) |
| # of Expiring Leases |
| MTM | 5,086 | 1.6% | 1.6% | $76,290 | 1.4% | $15.00 | 1 | |||||||
| 2018 | 7,130 | 2.3 | 3.9 | 137,025 | 2.6 | 19.22 | 2 | |||||||
| 2019 | 24,748 | 8.0 | 11.9 | 647,805 | 12.1 | 26.18 | 7 | |||||||
| 2020 | 81,219 | 26.2 | 38.2 | 1,777,565 | 33.2 | 21.89 | 15 | |||||||
| 2021 | 15,266 | 4.9 | 43.1 | 390,647 | 7.3 | 25.59 | 5 | |||||||
| 2022 | 12,562 | 4.1 | 47.2 | 285,704 | 5.3 | 22.74 | 3 | |||||||
| 2023 | 35,662 | 11.5 | 58.7 | 793,496 | 14.8 | 22.25 | 6 | |||||||
| 2024 | 0 | 0.0 | 58.7 | 0 | 0.0 | 0.00 | 0 | |||||||
| 2025 | 57,851 | 18.7 | 77.4 | 818,867 | 15.3 | 14.15 | 3 | |||||||
| 2026 | 7,293 | 2.4 | 79.7 | 257,443 | 4.8 | 35.30 | 1 | |||||||
| 2027 | 6,714 | 2.2 | 81.9 | 169,529 | 3.2 | 25.25 | 2 | |||||||
| 2028 | 0 | 0.0 | 81.9 | 0 | 0.0 | 0.00 | 0 | |||||||
| 2029 & Thereafter | 1,833 | 0.6 | 82.5 | 0 | 0.0 | 0.00 | 1 | |||||||
| Vacant(4) | 54,168 | 17.5 | 100.0% | 0 | 0.0 | 0.00 | 0 | |||||||
| Total / Wtd. Avg. | 309,532 | 100.0% | $5,354,369 | 100.0% | $20.97 | 46 |
| (1) | Calculated based on the approximate square footage occupied by each Owned Tenant. |
| (2) | Certain tenants may have lease termination options that are exercisable prior to the originally stated expiration date of the subject lease and that are not considered in the Lease Expiration Schedule. |
| (3) | Total / Wtd. Avg. annual UW Base Rent $ per SF excludes vacant space. |
| (4) | Vacant includes certain tenants representing 6.8% of GLA that are in occupancy and either have an active termination option tied to a sales threshold they are not meeting, are currently dark or are currently delinquent on rent payments. Rent from such tenants was not underwritten. One tenant, Jos A Bank of GLA (1.3% of GLA and 2.1% of underwritten rent), which has a sales termination option that is currently exercisable, has been underwritten. |
The following table presents certain information relating to historical leasing at the Town Center at Levis Commons Property:
Historical Leased %(1)
2013 | 2014 | 2015 | 2016 | 2017 | As of 1/1/2018(2) |
| 88.5% | 88.3% | 90.0% | 87.0% | 89.1% | 89.3% |
| (1) | As provided by the borrower and which represents occupancy as of December 31 for the indicated year unless otherwise specified. |
| (2) | Occupancy as of January 1, 2018 includes certain tenants representing 6.8% of GLA that are in occupancy and either have an active termination option tied to a sales threshold they are not meeting, are currently dark or are currently delinquent on rent payments. Absent such tenants, occupancy would be 82.5%. Rent from such tenants was not underwritten. One tenant, Jos A Bank (1.3% of GLA and 2.1% of underwritten rent), which has a sales termination option that is currently exercisable, has been underwritten. As of January 1, 2018, office occupancy is 94.0%, overall retail occupancy is 87.7% and in-line occupancy is 80.8%. |
The depositor has filed a registration statement (including a prospectus) with the Securities and Exchange Commission (“SEC”) (SEC File No. 333-207132) for the offering to which this communication relates. Before you invest, you should read the prospectus in the registration statement and other documents the depositor has filed with the SEC for more complete information about the depositor, the issuing entity and this offering. You may get these documents for free by visiting EDGAR on the SEC website at www.sec.gov. Alternatively, the depositor or Citigroup Global Markets Inc., Morgan Stanley & Co. LLC, Merrill Lynch, Pierce, Fenner & Smith Incorporated, Drexel Hamilton, LLC, The Williams Capital Group, L.P. or any other underwriter or dealer participating in this offering will arrange to send you the prospectus if you request it by calling toll-free 1-800-831-9146.
97
LOAN #7: town center at levis commons
| ■ | Operating History and Underwritten Net Cash Flow. The following table presents certain information relating to the historical operating performance and the Underwritten Net Cash Flow at the Town Center at Levis Commons Property: |
Cash Flow Analysis(1)
| 2014 | 2015 | 2016 | 2017 | Underwritten(2) | Underwritten $ per SF | |||||||||
| Gross Potential Rent | $5,668,406 | $5,631,782 | $5,579,752 | $5,540,052 | $6,645,817 | $21.47 | ||||||||
| Total Reimbursement Revenue | 1,489,992 | 1,462,220 | 1,372,382 | 1,393,765 | 1,393,765 | 4.50 | ||||||||
| Other Income | 165,321 | 150,202 | 177,409 | 163,076 | 163,076 | 0.53 | ||||||||
| Vacancy | 0 | 0 | 0 | 0 | (1,347,199) | (4.35) | ||||||||
| Effective Gross Income | $7,323,720 | $7,244,204 | $7,129,542 | $7,096,893 | $6,855,459 | $22.15 | ||||||||
| Real Estate Taxes | $580,596 | $479,054 | $609,685 | $598,153 | $600,598 | $1.94 | ||||||||
| Insurance | 62,600 | 78,854 | 71,399 | 90,218 | 76,901 | 0.25 | ||||||||
| Management Fee | 254,971 | 253,747 | 255,384 | 246,648 | 274,218 | 0.89 | ||||||||
| Other Operating Expenses | 2,310,732 | 2,164,044 | 2,183,725 | 1,974,578 | 1,974,578 | 6.38 | ||||||||
| Total Operating Expenses | $3,208,899 | $2,975,700 | $3,120,192 | $2,909,598 | $2,926,296 | $9.45 | ||||||||
| Net Operating Income | $4,114,821 | $4,268,505 | $4,009,350 | $4,187,296 | $3,929,163 | $12.69 | ||||||||
| TI/LC | 0 | 0 | 0 | 0 | 333,345 | 1.08 | ||||||||
| Capital Expenditures | 0 | 0 | 0 | 0 | 46,430 | 0.15 | ||||||||
| Net Cash Flow | $4,114,821 | $4,268,505 | $4,009,350 | $4,187,296 | $3,549,389 | $11.47 | ||||||||
| Occupancy | 88.3% | 90.0% | 87.0% | 89.3 | %(3) | 80.6 | %(3) | |||||||
| NOI Debt Yield | 11.1% | 11.5% | 10.8% | 11.3 | % | 10.6 | % | |||||||
| NCF DSCR | 2.29x | 2.38x | 2.23x | 2.33 | x | 1.98 | x | |||||||
| (1) | Certain items such as straight line rent, interest expense, interest income, lease cancellation income, depreciation, amortization, debt service payments and any other non-recurring or non-operating items were excluded from the historical presentation and are not considered for the underwritten cash flow. |
| (2) | Underwritten Gross Potential Rent is based on the rent roll as of January 1, 2018 and includes contractual rent increases through December 31, 2018 totaling $49,924. Underwritten Gross Potential Rent excludes certain tenants representing 6.8% of GLA that are in occupancy and either have an active termination options tied to a sales threshold they are not meeting, are currently dark or are currently delinquent on rent payments. Rent from such tenants was not underwritten. One tenant, Jos A Bank (1.3% of GLA and 2.1% of underwritten rent), which has a sales termination option that is currently exercisable, has been underwritten. Certain tenants that were underwritten, representing approximately 4.6% of underwritten rent, are paying reduced rent pursuant to rent reduction agreements negotiated with the borrower. In cases where such tenants have rent steps on or prior to December 1, 2018, the increased rent for such tenants has been underwritten. |
| (3) | 2017 Occupancy represents occupancy as of January 1, 2018. Underwritten Occupancy represents economic occupancy. |
| ■ | Appraisal. According to the appraisal, the Town Center at Levis Commons Property had an “as-is” appraised value of $59,500,000 as of December 20, 2017. |
| ■ | Environmental Matters. According to a Phase I environmental report, dated December 28, 2017, there are no recognized environmental conditions or recommendations for further action at the Town Center at Levis Commons Property. |
| ■ | Market Overview and Competition. The Town Center at Levis Commons Property is located within Levis Commons, a 400-acre mixed use development established in 2004 that includes a variety of commercial, residential, industrial and hotel uses. Multifamily uses in the vicinity of the Town Center at Levis Commons Property include a 300 plus unit apartment complex directly to the south and a 294-unit apartment complex to the southwest that is expected to open in the first quarter of 2018. Hotel properties in the vicinity of the Town Center at Levis Commons Property include a 112 room Holiday Inn Express & Suites that was built in 2015 directly to the south, a Hilton Garden Inn directly to the west and a Home2 Suites by Hilton that is currently under construction, to the north. Two miles west of the Town Center at Levis Commons Property is a new, $35.2 million, 136,000 SF middle school that opened in August of 2017. Additionally, a new Costco has recently opened on Route 25, approximately 1.5 miles from the Town Center at Levis Commons Property. There are multiple other commercial developments that are currently underway or have been recently completed within the immediate area surrounding the Town Center at Levis Commons Property. In the immediate area of the Town Center at Levis Commons Property there is a 27,000 SF retail property that is currently under construction and a 40,000 SF retail building that is planned. |
The Town Center at Levis Commons Property is located at the southwest quadrant of the intersection of Interstate-475 and State Route 25 in Perrysburg, Ohio, approximately 13.0 miles southeast of Toledo, Ohio. Additionally, the Town Center at Levis Commons Property is located less than a quarter mile west of Interstate-75. According to the appraisal, in 2012, the vehicle per day traffic count along Interstate-475 and Interstate-75 was 48,150 and 52,190, respectively. The residential and commercial growth in the area surrounding the Town Center at Levis Commons Property has resulted in a substantial amount of road construction, which has included road closures and detours, most notably between the fall of 2016 and the fall of 2017. The majority of the roadwork impacting the Town Center at Levis Commons Property was completed by the end of October 2017.
The depositor has filed a registration statement (including a prospectus) with the Securities and Exchange Commission (“SEC”) (SEC File No. 333-207132) for the offering to which this communication relates. Before you invest, you should read the prospectus in the registration statement and other documents the depositor has filed with the SEC for more complete information about the depositor, the issuing entity and this offering. You may get these documents for free by visiting EDGAR on the SEC website at www.sec.gov. Alternatively, the depositor or Citigroup Global Markets Inc., Morgan Stanley & Co. LLC, Merrill Lynch, Pierce, Fenner & Smith Incorporated, Drexel Hamilton, LLC, The Williams Capital Group, L.P. or any other underwriter or dealer participating in this offering will arrange to send you the prospectus if you request it by calling toll-free 1-800-831-9146.
98
LOAN #7: town center at levis commons
According to an industry report the Town Center at Levis Commons Property is located in the Perrysburg/Northwood retail submarket of the Toledo retail market. As of January 2018, the Perrysburg/Northwood retail submarket contained approximately 10.1 million SF with a vacancy rate of 4.3% and average asking rents of $11.58 per SF.
According to the appraisal, the estimated 2017 population within a one-, two- and three-mile radius of the Town Center at Levis Commons Property was 2,986, 15,344 and 28,649, respectively. The estimated 2017 average household income within a one-, two- and three-mile radius of the Town Center at Levis Commons Property was $114,077, $110,194 and $101,133, respectively.
The following table presents certain information relating to the primary competition for the Town Center at Levis Commons Property:
Competitive Set(1)(2)
| Town Center at Levis Commons (Subject) | The Shops at Fallen Timbers | Franklin Park Mall | Crossroads Center | Perrysburg Market |
| Distance from Subject | - | 3.8 miles | 11.5 miles | 3.0 miles | 3.0 miles |
| Property Type | Lifestyle Center | Lifestyle Center | Mall | Community Center | Community Center |
| Year Built | 2004 | 2007 | 1971 | 2001 | 2000 |
| Total GLA | 309,532(3) | 640,567 | 1,221,428 | 439,762 | 140,000 |
| Total Occupancy | 89.3%(3) | 89.0% | 93.0% | 95.0% | 100.0% |
| Anchors | Cinemark USA (Rave Cinema), Books A Million and Arhaus Furniture | Dillard’s, JC Penney, Rave Cinema and Barnes & Noble | Dick’s Sporting Goods, Dillard’s, Cinemark 16 & XD, JC Penney and Macy’s | Home Depot, Target and Michaels | Best Buy, Bed Bath & Beyond and Office Max |
| (1) | Source: Appraisal. |
| (2) | According to the appraisal, The Shops at Fallen Timbers and Franklin Park Mall are the primary competitors to the Town Center at Levis Commons Property while Crossroads Center and Perrysburg Market are secondary competitors. |
| (3) | Based on underwritten rent roll as of January 1, 2018. |
The following table presents certain information relating to lease comparables for the Town Center at Levis Commons Property:
Lease Comparables(1)
Property Name | Property Location | Tenant Name | Tenant Type | Lease Date | GLA | Lease Term (yrs) | Initial Rent per SF | Rent Steps | Lease Type |
| Anderson Towne Center | Cincinnati, OH | AMC | Movie Theatre | Feb. 2017 | 48,414 | 15 | $20.21 | 5.0% every 5 years | Net |
| Liberty Towne Center | Liberty Township, OH | Cobb Theaters | Movie Theatre | Oct. 2015 | 77,133 | 15 | $25.50 | 2.0% per annum | Net |
| Whole Foods | Toledo, OH | Whole Foods | Retail | Dec. 2016 | 40,000 | 20 | $15.00 | 10.0% in years 6,11,16 | Net |
| Keystone Business Park | Maumee, OH | Forrester Wehrle Homes | Office | Mar. 2014 | 15,202 | 5 | $15.50 | - | Net |
| Low Rise Office Building | Perrysburg, OH | Res-Care Ohio, Inc. | Office | Nov. 2012 | 6,600 | 5 | $14.00 | - | Net |
| The Shops at Fallen Timbers | Maumee, OH | Tilted Kilt | Retail | Apr. 2014 | 6,460 | 15 | $33.70 | $2.00 per SF in years 5, 10 | Net |
| Starbucks | Holland, OH | Starbucks | Retail | Mar. 2014 | 2,107 | 10 | $33.22 | 10.0% in year 7 | Net |
| Olde 20 Crossings Ph. II | Rossford, OH | Pete’s Piadina Grille | Retail | Oct. 2015 | 1,500 | 10 | $25.00 | 10.0% mid-term | Net |
| The Shops at Fallen Timbers | Maumee, OH | Shirley’s Gourmet Popcorn | Retail | Sept. 2014 | 1,239 | 3 | $13.07 | 3.0% in year 2 | Net |
| (1) | Source: Appraisal. |
| ■ | The Borrower. The borrower is Levis Commons, LLC, a single purpose Delaware limited liability company, with one independent director. Legal counsel to the borrower delivered a non-consolidation opinion in connection with the origination of the Town Center at Levis Commons Loan. The non-recourse carveout guarantors for the Town Center at Levis Commons Loan are Hill Partners, Inc. and DOF V REIT Holdings, LLC. The borrower sponsors for the Town Center at Levis Commons Loan are Torchlight Investors and Hill Partners, Inc. The borrower is 85.0% indirectly owned by DOF V REIT Holdings, LLC and 15.0% indirectly owned by Hill Partners, Inc. |
Hill Partners, Inc. (“HPI”), headquartered in Charlotte, North Carolina, is a 32-year old commercial real estate firm that invests in retail and mixed-use properties. Since 1983, HPI has owned/developed or redeveloped in excess of 4.3
The depositor has filed a registration statement (including a prospectus) with the Securities and Exchange Commission (“SEC”) (SEC File No. 333-207132) for the offering to which this communication relates. Before you invest, you should read the prospectus in the registration statement and other documents the depositor has filed with the SEC for more complete information about the depositor, the issuing entity and this offering. You may get these documents for free by visiting EDGAR on the SEC website at www.sec.gov. Alternatively, the depositor or Citigroup Global Markets Inc., Morgan Stanley & Co. LLC, Merrill Lynch, Pierce, Fenner & Smith Incorporated, Drexel Hamilton, LLC, The Williams Capital Group, L.P. or any other underwriter or dealer participating in this offering will arrange to send you the prospectus if you request it by calling toll-free 1-800-831-9146.
99
LOAN #7: town center at levis commons
million SF. Additionally, HPI has advised/managed and handled the leasing on over 16.0 million SF of retail properties for primarily institutional third-party clients over the same period. HPI has experience with shopping centers and mixed-use properties as it has managed, leased, developed or redeveloped over 20 million SF of such space. HPI was the sole borrower sponsor prior to DOF V REIT Holdings, LLC’s acquisition of 85% of the equity in the borrower in exchange for forgiveness of the Prior Loan.
DOF V REIT Holdings, LLC is owned by Torchlight Debt Opportunity Fund V, LP, which is advised by Torchlight Investors. Torchlight Investors was founded in 1995 and provides investment management services to institutional clients seeking exposure to commercial real estate related debt markets. Since its inception, Torchlight Investors has acquired over $20 billion in commercial real estate debt investments and has grown to a firm with over $3.4 billion of assets under management.
| ■ | Escrows. The Town Center at Levis Commons Loan documents provide for upfront escrows at closing in the amount of approximately (i) $49,820 for real estate taxes; (ii) $1,000,000 for rollover funds; and (iii) $400,030 for outstanding tenant improvements and leasing commissions obligations. |
Additionally, on each due date, the borrower is required to deposit the following monthly escrows with respect to the Town Center at Levis Commons Property: (i) a tax reserve in an amount equal to one-twelfth of the amount the lender reasonably estimates will be necessary to pay taxes during the next ensuing 12 months (initially $49,820); (ii) an insurance reserve in an amount equal to one-twelfth of the insurance premiums that the lender reasonably estimates will be payable for the renewal of the coverage afforded by the insurance policies, provided that the monthly insurance reserve deposit is waived if the borrower is maintaining blanket insurance policies in accordance with the Town Center at Levis Commons Loan documents; (iii) a capital expenditure reserve in an amount equal to $3,869 and (iv) a rollover reserve in an amount equal to $38,934 for tenant improvements and leasing commissions (provided that the borrower is not required to make the monthly deposits to the rollover reserve if it would cause the amount then on deposit (but excluding the $1,000,000 upfront rollover funds deposit described above), to exceed $1,400,000.
| ■ | Lockbox and Cash Management. The Town Center at Levis Commons Loan provides for a springing lockbox with springing cash management, in each case upon the occurrence of a Town Center at Levis Commons Cash Sweep Event Period(as defined below). Upon the first occurrence of a Town Center at Levis Commons Cash Sweep Event Period, the borrower is required to establisha lender-controlledlockbox account, to direct tenants to pay rent directly to the lockbox account, and to deposit any revenues received by the borrower or the property manager with respect to the Town Center at Levis Commons Property despite such direction into such lockbox account within two business days following receipt. Upon the first occurrence of a Town Center at Levis Commons Cash Sweep Event Period, the lender is required to establish, and the borrower is required to cooperate with the cash management bank to establish, a lender controlled cash management account. During the continuance of a Town Center at Levis Commons Cash Sweep Event Period, all available funds on deposit in the lockbox account are required to be swept to such cash management account and applied, provided no event of default is continuing, to make deposits into reserve funds, as described under“—Escrows” above, to pay debt service on the Town Center at Levis Commons Loan, to pay approved operating expenses in accordance with the annual budget (which is required to be approved by the lender during the continuance of a Town Center at Levis Commons Cash Sweep Event Period) and extraordinary expenses approved by the lender, and to deposit the remainder into a cash sweep account to be held as additional collateral for the Town Center at Levis Commons Loan during the continuance of such Town Center at Levis Commons Cash Sweep Event Period. |
A “Town Center at Levis Commons Cash Sweep Event Period” means the period:
| (i) | commencing upon the occurrence of an event of default under the Town Center at Levis Commons Loan and ending when no event of default exists; or |
| (ii) | commencing upon the debt service coverage ratio of the Town Center at Levis Commons Loan falling below 1.40x for six consecutive calendar months based upon the trailing six calendar months operating statements and rent rolls and ending upon the debt service coverage ratio being at least 1.40x for the immediately preceding six consecutive calendar months; or |
| (iii) | commencing nine months prior to the stated expiration date of any Major Tenant’s (as defined below) lease unless such Major Tenant has renewed or extended its lease upon terms and conditions reasonably acceptable to the lender, and ending uponeither (1) such Major Tenant renewing or extending its lease on terms and conditions reasonably acceptable to the lender, and the borrower delivering to the lender a tenant estoppel certificate confirming the tenant is in occupancy, open for business, paying full unabated rent and all |
The depositor has filed a registration statement (including a prospectus) with the Securities and Exchange Commission (“SEC”) (SEC File No. 333-207132) for the offering to which this communication relates. Before you invest, you should read the prospectus in the registration statement and other documents the depositor has filed with the SEC for more complete information about the depositor, the issuing entity and this offering. You may get these documents for free by visiting EDGAR on the SEC website at www.sec.gov. Alternatively, the depositor or Citigroup Global Markets Inc., Morgan Stanley & Co. LLC, Merrill Lynch, Pierce, Fenner & Smith Incorporated, Drexel Hamilton, LLC, The Williams Capital Group, L.P. or any other underwriter or dealer participating in this offering will arrange to send you the prospectus if you request it by calling toll-free 1-800-831-9146.
100
LOAN #7: town center at levis commons
| tenant improvement and leasing commission obligations have been performed (an “Acceptable Estoppel”), or (2) all or substantially all of such Major Tenant’s space having been re-let to a replacement tenant pursuant to a replacement lease, each of which is reasonably acceptable to the lender, and the borrower delivering to the lender an Acceptable Estoppel(a “Replacement Tenant Cure”); or |
| (iv) | commencing upon any Major Tenant making a bankruptcy filing or being the subject of a bankruptcy filing, while in occupancy of at the Town Center at Levis Commons Property, and ending upon either (1) such Major Tenant’s lease having been affirmed in bankruptcy and borrower delivering to the lender anAcceptable Estoppel, or (2) a Replacement Tenant Cure; or |
| (v) | commencing upon (A) any Major Tenant giving a written notice of its intent to vacate or terminate its lease prior to the lease expiration date, (B) any Major Tenant failing to renew or extend its lease by the day after the expiration of such Major Tenant’s respective renewal notice period on terms and conditions reasonably acceptable to the lender, (C) any Major Tenant cancelling or terminating its lease, or (D) any Major Tenant vacating or “going dark” in such Major Tenant’s space, and ending uponeither (1) such Major Tenant being in occupancy of all or substantially all of its space and the borrower delivering to the lender an Acceptable Estoppel, or (2)a Replacement Tenant Cure. |
A “Major Tenant” means Cinemark USA, and any replacement tenant which occupies all or a portion of the Cinemark USA space which was approved by lender.
| ■ | Property Management. The Town Center at Levis Commons Property is managed by Hill Partners, Inc., a North Carolina corporation, and an affiliate of the borrower. Hill Partners, Inc. occupies 1,833 SF of office space at the Town Center at Levis Commons Property, for which it does not pay rent. Upon the occurrence of any one or more of the following events the lender has the right to require the borrower to replace the property manager, in each case with an unaffiliated Qualified Manager (as defined below) chosen by the borrower and reasonably approved by the lender: (i) at any time during the continuation of an event of default under the Town Center at Levis Commons Loan documents; (ii) the debt service coverage ratio of the Town Center at Levis Commons Loan falling below 1.10x, or (iii) if the property manager (A) is insolvent or a debtor in a bankruptcy proceeding, (B) is in default under the applicable management agreement beyond any applicable notice and cure period or (C) has engaged in gross negligence, fraud or willful misconduct. |
A “Qualified Manager” means (i) an entity which is a reputable and experienced management organization having at least five years’ experience in managing properties similar in size, scope, class, use and value as the Town Center at Levis Commons Property and in comparable markets to that in which the Town Center at Levis Commons Property is located which comprise at least 300,000 leasable SF in the aggregate, provided that at the time of appointment such person is not, and its principals are not, the subject of any case, proceeding or other action under any existing or future law of any jurisdiction relating to bankruptcy, insolvency, reorganization or relief of debtors, or (ii) any other reputable and experienced professional management organization approved by the lender (which may be conditioned upon a rating agency confirmation). The borrower may replace the property manager with a Qualified Manager without the consent of the lender, provided that the new manager executes a property management agreement that provides for a management fee not to exceed 3.5%, does not contain any terms that are materially adverse to the lender and is otherwise reasonably approved by the lender, the borrower executes a subordination of management agreement in the form then used by the lender, and if the new manager is an affiliate of the borrower, the borrower delivers a new non-consolidation opinion acceptable to the lender.
| ■ | Mezzanine or Secured Subordinate Indebtedness.Not permitted. |
| ■ | Release of Collateral. Not permitted. |
| ■ | Terrorism Insurance. The borrower is required to maintain an “all-risk” insurance policy (with a deductible that is acceptable to the lender and is no greater than $100,000) that provides coverage for terrorism in an amount equal to 100.0% of the full replacement cost of the Town Center at Levis Commons Property, plus a business interruption insurance policy that provides 12 months of business interruption coverage with an additional six-month extended period of indemnity; provided that if the policies contain an exclusion for loss or damage incurred as a result of an act of terrorism or similar acts of sabotage, the borrower is required to maintain separate insurance against such loss or damage, but in no event more than an amount equal to the full replacement cost plus 12 months of business interruption coverage. For so long as TRIPRA is in effect and continues to cover both domestic and foreign acts of terrorism, the lender is required to accept terrorism insurance coverage which covers against “covered acts” as defined |
The depositor has filed a registration statement (including a prospectus) with the Securities and Exchange Commission (“SEC”) (SEC File No. 333-207132) for the offering to which this communication relates. Before you invest, you should read the prospectus in the registration statement and other documents the depositor has filed with the SEC for more complete information about the depositor, the issuing entity and this offering. You may get these documents for free by visiting EDGAR on the SEC website at www.sec.gov. Alternatively, the depositor or Citigroup Global Markets Inc., Morgan Stanley & Co. LLC, Merrill Lynch, Pierce, Fenner & Smith Incorporated, Drexel Hamilton, LLC, The Williams Capital Group, L.P. or any other underwriter or dealer participating in this offering will arrange to send you the prospectus if you request it by calling toll-free 1-800-831-9146.
101
LOAN #7: town center at levis commons
| by TRIPRA. If TRIPRA or a similar or subsequent statute is not in effect, then, provided that terrorism insurance is commercially available, the borrower is required to carry terrorism insurance, but in such event the borrower is not required to spend on terrorism insurance coverage more than two times the amount of the insurance premiums that are payable at such time in respect of the property and rental loss and/or business income insurance required under the Town Center at Levis Commons Loan documents (without giving effect to the cost of terrorism components of such insurance), and if the cost of terrorism insurance exceeds such amount, the borrower is required to purchase the maximum amount of terrorism insurance available with funds equal to such amount. See“Risk Factors—Terrorism Insurance May Not Be Available for All Mortgaged Properties” in the Preliminary Prospectus. |
The depositor has filed a registration statement (including a prospectus) with the Securities and Exchange Commission (“SEC”) (SEC File No. 333-207132) for the offering to which this communication relates. Before you invest, you should read the prospectus in the registration statement and other documents the depositor has filed with the SEC for more complete information about the depositor, the issuing entity and this offering. You may get these documents for free by visiting EDGAR on the SEC website at www.sec.gov. Alternatively, the depositor or Citigroup Global Markets Inc., Morgan Stanley & Co. LLC, Merrill Lynch, Pierce, Fenner & Smith Incorporated, Drexel Hamilton, LLC, The Williams Capital Group, L.P. or any other underwriter or dealer participating in this offering will arrange to send you the prospectus if you request it by calling toll-free 1-800-831-9146.
102
(THIS PAGE INTENTIONALLY LEFT BLANK)
The depositor has filed a registration statement (including a prospectus) with the Securities and Exchange Commission (“SEC”) (SEC File No. 333-207132) for the offering to which this communication relates. Before you invest, you should read the prospectus in the registration statement and other documents the depositor has filed with the SEC for more complete information about the depositor, the issuing entity and this offering. You may get these documents for free by visiting EDGAR on the SEC website at www.sec.gov. Alternatively, the depositor or Citigroup Global Markets Inc., Morgan Stanley & Co. LLC, Merrill Lynch, Pierce, Fenner & Smith Incorporated, Drexel Hamilton, LLC, The Williams Capital Group, L.P. or any other underwriter or dealer participating in this offering will arrange to send you the prospectus if you request it by calling toll-free 1-800-831-9146.
103
| LOAN #8: OXFORD EXCHANGE |
The depositor has filed a registration statement (including a prospectus) with the Securities and Exchange Commission (“SEC”) (SEC File No. 333-207132) for the offering to which this communication relates. Before you invest, you should read the prospectus in the registration statement and other documents the depositor has filed with the SEC for more complete information about the depositor, the issuing entity and this offering. You may get these documents for free by visiting EDGAR on the SEC website at www.sec.gov. Alternatively, the depositor or Citigroup Global Markets Inc., Morgan Stanley & Co. LLC, Merrill Lynch, Pierce, Fenner & Smith Incorporated, Drexel Hamilton, LLC, The Williams Capital Group, L.P. or any other underwriter or dealer participating in this offering will arrange to send you the prospectus if you request it by calling toll-free 1-800-831-9146.
104
| LOAN #8: OXFORD EXCHANGE |
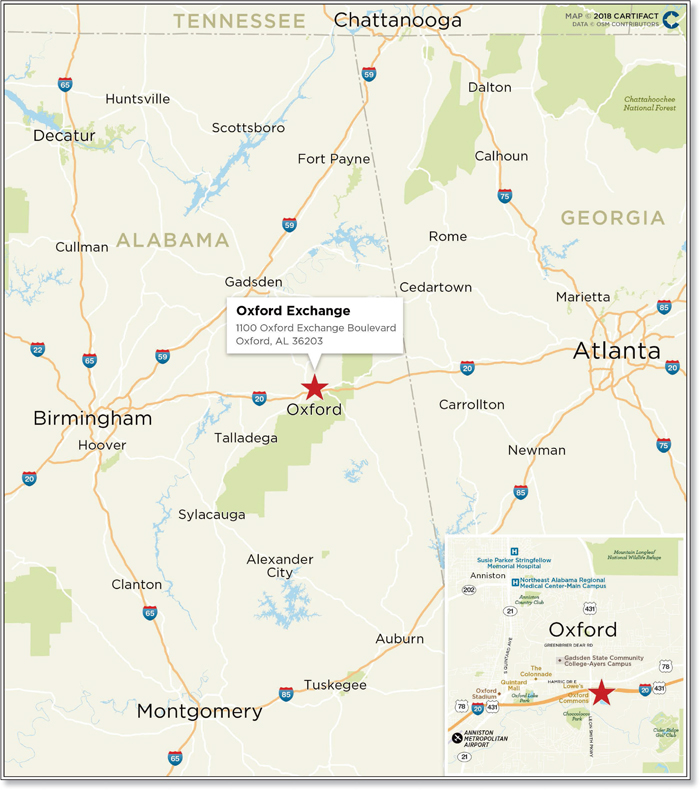
The depositor has filed a registration statement (including a prospectus) with the Securities and Exchange Commission (“SEC”) (SEC File No. 333-207132) for the offering to which this communication relates. Before you invest, you should read the prospectus in the registration statement and other documents the depositor has filed with the SEC for more complete information about the depositor, the issuing entity and this offering. You may get these documents for free by visiting EDGAR on the SEC website at www.sec.gov. Alternatively, the depositor or Citigroup Global Markets Inc., Morgan Stanley & Co. LLC, Merrill Lynch, Pierce, Fenner & Smith Incorporated, Drexel Hamilton, LLC, The Williams Capital Group, L.P. or any other underwriter or dealer participating in this offering will arrange to send you the prospectus if you request it by calling toll-free 1-800-831-9146.
105
| LOAN #8: OXFORD EXCHANGE |
| Mortgaged Property Information | Mortgage Loan Information | ||||||||||||||||||
| Number of Mortgaged Properties | 1 | Loan Seller | SMF V | ||||||||||||||||
| Location (City/State) | Oxford, Alabama | Cut-off Date Balance | $36,900,000 | ||||||||||||||||
| Property Type | Retail | Cut-off Date Balance per SF | $110.52 | ||||||||||||||||
| Size (SF) | 333,866 | Percentage of Initial Pool Balance | 3.5% | ||||||||||||||||
| Total Occupancy as of 12/22/2017 | 99.2% | Number of Related Mortgage Loans | None | ||||||||||||||||
| Owned Occupancy as of 12/22/2017 | 99.2% | Type of Security | Fee Simple | ||||||||||||||||
| Year Built / Latest Renovation | 2006 / NAP | Mortgage Rate | 4.66200% | ||||||||||||||||
| Appraised Value | $54,000,000 | Original Term to Maturity (Months) | 120 | ||||||||||||||||
| Appraisal Date | 12/8/2017 | Original Amortization Term (Months) | 360 | ||||||||||||||||
| Borrower Sponsors | Hardam Singh Azad and Dilip Seth | Original Interest Only Period (Months) | 12 | ||||||||||||||||
| Property Management | Azad Commercial Realty Services, LLC | First Payment Date | 2/6/2018 | ||||||||||||||||
Maturity Date | 1/6/2028 | ||||||||||||||||||
| Underwritten Revenues | $4,748,957 | ||||||||||||||||||
| Underwritten Expenses | $895,859 | Escrows(1) | |||||||||||||||||
| Underwritten Net Operating Income (NOI) | $3,853,098 | Upfront | Monthly | ||||||||||||||||
| Underwritten Net Cash Flow (NCF) | $3,717,943 | Taxes | $52,416 | $26,208 | |||||||||||||||
| Cut-off Date LTV Ratio | 68.3% | Insurance | $10,127 | $4,934 | |||||||||||||||
| Maturity Date LTV Ratio | 57.1% | Replacement Reserve(2) | $0 | $4,175 | |||||||||||||||
| DSCR Based on Underwritten NOI / NCF | 1.69x / 1.63x | TI/LC(3) | $1,500,000 | $13,916 | |||||||||||||||
| Debt Yield Based on Underwritten NOI / NCF | 10.4% / 10.1% | Other | $0 | $0 | |||||||||||||||
| Sources and Uses | |||||||||||||||||||
| Sources | $ | % | Uses | $ | % | ||||||||||||||
| Loan Amount | $36,900,000 | 74.6% | Purchase Price | $47,290,000 | 95.7% | ||||||||||||||
| Principal’s New Cash Contribution | 12,533,763 | 25.4 | Reserves | 1,562,543 | 3.2 | ||||||||||||||
| Closing Costs | 581,220 | 1.2 | |||||||||||||||||
| Total Sources | $49,433,763 | 100.0% | Total Uses | $49,433,763 | 100.0% | ||||||||||||||
| (1) | See“—Escrows” below. |
| (2) | The Replacement Reserve is capped at $350,000. |
| (3) | The TI/LC reserve is capped at $2,500,000. |
| ■ | The Mortgage Loan. The mortgage loan (the “Oxford Exchange Loan”) is evidenced by a note in the original principal amount of $36,900,000 and is secured by a first mortgage encumbering the borrowers’ fee simple interest in an anchored retail property located in Oxford, Alabama (the “Oxford Exchange Property”). The Oxford Exchange Loan was originated by Starwood Mortgage Capital LLC on December 28, 2017 and represents approximately 3.5% of the Initial Pool Balance. The note evidencing the Oxford Exchange Loan has an outstanding principal balance as of the Cut-off Date of $36,900,000 and accrues interest at a rate of 4.66200%per annum. The proceeds of the Oxford Exchange Loan and $12,533,763 of equity were primarily used to purchase the Oxford Exchange Property, fund reserves and pay origination costs. |
The Oxford Exchange Loan had an initial term of 120 months and has a remaining term of 118 months as of the Cut-off Date. The Oxford Exchange Loan requires monthly payments of interest only for the initial 12 months, followed by monthly payments of principal and interest sufficient to amortize the Oxford Exchange Loan over a 30-year amortization schedule. The scheduled maturity date of the Oxford Exchange Loan is January 6, 2028. At any time after the earlier of December 28, 2020 and the second anniversary of the securitization Closing Date, the Oxford Exchange Loan may be defeased with certain “government securities” permitted under the Oxford Exchange Loan documents. Voluntary prepayment of the Oxford Exchange Loan is permitted in whole on or after the payment date in October 2027 without payment of any prepayment premium.
| ■ | The Mortgaged Property.The Oxford Exchange Property is comprised of a 333,866 SF anchored shopping center that is located within Calhoun County, in Oxford, Alabama. The Oxford Exchange Property is located at 1100 Oxford Exchange Boulevard, approximately 55 miles east of the Birminghamcentral business district (the “CBD”)and approximately 85 miles west of the Atlanta CBD. Additionally, theOxford ExchangeProperty is located less than 25 miles east of both the 3.7 million SF Honda manufacturing facility in Lincoln, Alabama,and the approximately 80,000-seat Talladega Superspeedway.The Oxford Exchange Property has access along the I-20 corridor with more than 37,000 vehicles passing the Oxford Exchange Property daily. The Oxford Exchange Property serves a trade area with a radius of approximately 30 miles. A new mega sports complex, Choccolocco Park, recently opened less than one mile from the Oxford Exchange Property. Choccolocco Park projects approximately 500,000 visitors annually from around the country. The park attracts baseball, track and other sporting events multiple times a year. |
The depositor has filed a registration statement (including a prospectus) with the Securities and Exchange Commission (“SEC”) (SEC File No. 333-207132) for the offering to which this communication relates. Before you invest, you should read the prospectus in the registration statement and other documents the depositor has filed with the SEC for more complete information about the depositor, the issuing entity and this offering. You may get these documents for free by visiting EDGAR on the SEC website at www.sec.gov. Alternatively, the depositor or Citigroup Global Markets Inc., Morgan Stanley & Co. LLC, Merrill Lynch, Pierce, Fenner & Smith Incorporated, Drexel Hamilton, LLC, The Williams Capital Group, L.P. or any other underwriter or dealer participating in this offering will arrange to send you the prospectus if you request it by calling toll-free 1-800-831-9146.
106
| LOAN #8: OXFORD EXCHANGE |
As of December 22, 2017, the Oxford Exchange Property was 99.2% occupied by 34 tenants. Over the last three years, the occupancy level at the Oxford Exchange Property has averaged approximately 98.8%. The Oxford Exchange Property is anchored by Hobby Lobby, Dick’s Sporting Goods, Ross Dress for Less and TJ Maxx. Additionally, the Oxford Exchange Property is shadow anchored by Target, Home Depot, Sam’s Club and Kohl’s. Other notable national tenants at the Oxford Exchange Property include Bed Bath & Beyond, PetSmart, Office Max, Old Navy, Dress Barn, Shoe Carnival, Rack Room Shoes, Kirkland’s, Lane Bryant, GNC, AT&T, Gamestop, Sally Beauty Supply and Firehouse Subs.
The following table presents certain information relating to historical leasing at the Oxford Exchange Property:
Historical Leased %(1)
| 2013 | 2014(2) | 2015 | 2016 | As of 12/22/2017(3) | ||||||
| Owned Space | 97.0% | NAV | 98.1% | 99.2% | 99.2% |
| (1) | As provided by the borrowers and which represents occupancy as of December 31 for the indicated year unless otherwise specified. |
| (2) | The previous owner acquired the Oxford Exchange Property in 2014 and historical occupancy for 2014 is not available. |
| (3) | Based on the underwritten rent roll dated December 22, 2017. |
The following table presents certain information relating to the major tenants at the Oxford Exchange Property:
Ten Largest Owned Tenants Based on Underwritten Base Rent(1)
| Tenant Name | Credit Rating | Tenant GLA | % of Owned GLA | UW Base | % of Total UW Base Rent(3) | UW Base | Sales $ per | Occupancy Cost | Lease Expiration | Renewal / Extensions Options | ||||||||||
| Dick’s Sporting Goods | NR / NR / NR | 45,000 | 13.5% | $472,500 | 11.0% | $10.50 | NA | NA | 1/31/2023 | 3, 5-year options | ||||||||||
| Hobby Lobby | NR / NR / NR | 54,990 | 16.5 | 453,668 | 10.5 | $8.25 | NA | NA | 8/31/2021 | 3, 5-year options | ||||||||||
| Ross Dress for Less | NR / A3 / A- | 30,187 | 9.0 | 316,964 | 7.4 | $10.50 | NA | NA | 1/31/2022 | 3, 5-year options | ||||||||||
| Best Buy | BBB- / Baa1 / BBB- | 20,000 | 6.0 | 300,000 | 7.0 | $15.00 | NA | NA | 1/31/2022 | 2, 5-year options | ||||||||||
| TJ Maxx | NR / A2 / A+ | 28,000 | 8.4 | 252,000 | 5.9 | $9.00 | $230 | 4.8% | 7/31/2021 | 3, 5-year options | ||||||||||
| PetSmart | NR / Caa1 / CCC+ | 20,227 | 6.1 | 225,119 | 5.2 | $11.13 | NA | NA | 1/31/2022 | 2, 5-year options | ||||||||||
| Office Max | NR / NR / NR | 15,170 | 4.5 | 219,965 | 5.1 | $14.50 | NA | NA | 3/31/2023 | 2, 5-year options | ||||||||||
| Bed Bath & Beyond | NR / Baa2 / BBB | 20,950 | 6.3 | 209,500 | 4.9 | $10.00 | NA | NA | 1/31/2022 | 3, 5-year options | ||||||||||
| Old Navy | BB+ / Baa2 / BB+ | 14,800 | 4.4 | 194,620 | 4.5 | $13.15 | NA | NA | 8/31/2021 | 1, 5-year option | ||||||||||
| Shoe Carnival | NR / NR / NR | 8,200 | 2.5 | 127,100 | 3.0 | $15.50 | $251 | 7.0% | 6/30/2021 | 1, 5-year option | ||||||||||
| Ten Largest Owned Tenants | 257,524 | 77.1% | $2,771,436 | 64.4% | $10.76 | |||||||||||||||
| Remaining Owned Tenants | 73,801 | 22.1 | 1,528,750 | 35.6 | $20.71 | |||||||||||||||
| Vacant Spaces (Owned Space) | 2,541 | 0.8 | 0 | 0.0 | 0.00 | |||||||||||||||
| Total / Wtd. Avg. All Owned Tenants | 333,866 | 100.0% | $4,300,186 | 100.0% | $12.98 | |||||||||||||||
| (1) | Based on the underwritten rent roll dated December 22, 2017. |
| (2) | Certain ratings are those of the parent company whether or not the parent guarantees the lease. |
| (3) | UW Base Rent, % of Total UW Base Rent and UW Base Rent $ per SF include contractual rent increases through June 1, 2018 ($52,065). |
| (4) | Sales $ per SF represent 2016 sales. |
The following table presents certain information relating to the historical sales and occupancy costs at the Oxford Exchange Property:
Historical Sales per SF and Occupancy Costs(1)
| 2014 | 2015 | 2016 | ||||
| Sales per SF | $204 | $215 | $216 | |||
| Occupancy Cost | 9.9% | 9.6% | 9.5% |
| (1) | Historical Sales per SF and Occupancy Costs are based on actual reported sales provided by the borrower sponsors. |
The depositor has filed a registration statement (including a prospectus) with the Securities and Exchange Commission (“SEC”) (SEC File No. 333-207132) for the offering to which this communication relates. Before you invest, you should read the prospectus in the registration statement and other documents the depositor has filed with the SEC for more complete information about the depositor, the issuing entity and this offering. You may get these documents for free by visiting EDGAR on the SEC website at www.sec.gov. Alternatively, the depositor or Citigroup Global Markets Inc., Morgan Stanley & Co. LLC, Merrill Lynch, Pierce, Fenner & Smith Incorporated, Drexel Hamilton, LLC, The Williams Capital Group, L.P. or any other underwriter or dealer participating in this offering will arrange to send you the prospectus if you request it by calling toll-free 1-800-831-9146.
107
| LOAN #8: OXFORD EXCHANGE |
The following table presents the lease rollover schedule at the Oxford Exchange Property, based on initial lease expiration dates:
Lease Expiration Schedule(1)(2)
| Year Ending December 31, | Expiring Owned GLA | % of Owned GLA | Cumulative % of Owned GLA | UW Base Rent(3) | % of Total UW Base Rent(3) | UW Base Rent $ per SF(3)(4) | # of Expiring Tenants | |||||||||||||||
| MTM | 0 | 0.0 | % | 0.0 | % | $0 | 0.0 | % | $0.00 | 0 | ||||||||||||
| 2018 | 14,867 | 4.5 | 4.5 | % | 285,661 | 6.6 | $19.21 | 5 | ||||||||||||||
| 2019 | 8,833 | 2.6 | 7.1 | % | 181,480 | 4.2 | $20.55 | 3 | ||||||||||||||
| 2020 | 3,600 | 1.1 | 8.2 | % | 96,787 | 2.3 | $26.89 | 2 | ||||||||||||||
| 2021 | 123,673 | 37.0 | 45.2 | % | 1,428,312 | 33.2 | $11.55 | 10 | ||||||||||||||
| 2022 | 108,966 | 32.6 | 77.9 | % | 1,393,830 | 32.4 | $12.79 | 9 | ||||||||||||||
| 2023 | 69,786 | 20.9 | 98.8 | % | 868,585 | 20.2 | $12.45 | 4 | ||||||||||||||
| 2024 | 0 | 0.0 | 98.8 | % | 0 | 0.0 | $0.00 | 0 | ||||||||||||||
| 2025 | 0 | 0.0 | 98.8 | % | 0 | 0.0 | $0.00 | 0 | ||||||||||||||
| 2026 | 1,600 | 0.5 | 99.2 | % | 45,531 | 1.1 | $28.46 | 1 | ||||||||||||||
| 2027 | 0 | 0.0 | 99.2 | % | 0 | 0.0 | $0.00 | 0 | ||||||||||||||
| 2028 | 0 | 0.0 | 99.2 | % | 0 | 0.0 | $0.00 | 0 | ||||||||||||||
| 2029 & Thereafter | 0 | 0.0 | 99.2 | % | 0 | 0.0 | $0.00 | 0 | ||||||||||||||
| Vacant | 2,541 | 0.8 | 100.0 | % | 0 | 0.0 | $0.00 | 0 | ||||||||||||||
| Total / Wtd. Avg. | 333,866 | 100.0 | % | $4,300,186 | 100.0 | % | $12.98 | 34 | ||||||||||||||
| (1) | Calculated based on approximate square footage occupied by each Owned Tenant unless otherwise specified. |
| (2) | Certain tenants may have lease termination options that are exercisable prior to the originally stated expiration date of the subject lease and that are not considered in the Lease Expiration Schedule. |
| (3) | UW Base Rent, % of Total UW Base Rent and UW Base Rent $ per SF include contractual rent increases through June 1, 2018 ($52,065). |
| (4) | Total / Wtd. Avg. UW Base Rent $ per SF excludes vacant space. |
| ■ | Operating History and Underwritten Net Cash Flow. The following table presents certain information relating to the historical operating performance and the Underwritten Net Cash Flow at the Oxford Exchange Property: |
Cash Flow Analysis(1)(2)
| 2015 | 2016 | TTM 10/31/2017 | Underwritten | Underwritten | ||||||
| Base Rent | $3,934,312 | $4,034,903 | $4,408,727 | $4,248,121 | $12.72 | |||||
| Contractual Rent Steps(3) | 0 | 0 | 0 | 52,065 | 0.16 | |||||
| Gross Up Vacancy | 0 | 0 | 0 | 55,902 | 0.17 | |||||
| Reimbursements | 669,908 | 685,011 | 653,529 | 713,005 | 2.14 | |||||
| Other Income(4) | 43,735 | 38,153 | 34,700 | 34,700 | 0.10 | |||||
| Gross Revenue | $4,647,955 | $4,758,067 | $5,096,956 | $5,103,793 | $15.29 | |||||
| Vacancy & Credit Loss | 0 | 0 | 0 | (354,837) | (1.06) | |||||
| Effective Gross Income | $4,647,955 | $4,758,067 | $5,096,956 | $4,748,957 | $14.22 | |||||
| Real Estate Taxes | $264,494 | $264,499 | $270,481 | $264,494 | $0.79 | |||||
| Insurance | 36,201 | 31,684 | 30,689 | 59,207 | 0.18 | |||||
| Management Fee | 92,959 | 95,161 | 148,055 | 142,469 | 0.43 | |||||
| Other Operating Expenses | 415,439 | 401,868 | 429,689 | 429,689 | 1.29 | |||||
| Total Operating Expenses | $809,093 | $793,212 | $878,914 | $895,859 | $2.68 | |||||
| Net Operating Income | $3,838,862 | $3,964,855 | $4,218,042 | $3,853,098 | $11.54 | |||||
| TI/LC | 0 | 0 | 0 | 85,075 | 0.25 | |||||
| Capital Expenditures | 0 | 0 | 0 | 50,080 | 0.15 | |||||
| Net Cash Flow | $3,838,862 | $3,964,855 | $4,218,042 | $3,717,943 | $11.14 | |||||
| Occupancy(5) | 98.1% | 99.2% | 99.2% | 93.0% | ||||||
| NOI Debt Yield | 10.4% | 10.7% | 11.4% | 10.4% | ||||||
| NCF DSCR | 1.68x | 1.73x | 1.84x | 1.63x |
| (1) | Certain items such as straight line rent, interest expense, interest income, lease cancellation income, depreciation, amortization, debt service payments and any other non-recurring or non-operating items were excluded from the historical presentation and are not considered for the underwritten cash flow. |
| (2) | Represents a fiscal year-end of December 31 for the indicated year unless otherwise specified. |
| (3) | Contractual Rent Steps are underwritten based upon the actual scheduled rent increases through June 1, 2018 ($52,065). |
| (4) | Other Income includes storage, ATM income and trash management income. |
| (5) | TTM Occupancy is as of December 22, 2017. Underwritten Occupancy represents economic occupancy. |
The depositor has filed a registration statement (including a prospectus) with the Securities and Exchange Commission (“SEC”) (SEC File No. 333-207132) for the offering to which this communication relates. Before you invest, you should read the prospectus in the registration statement and other documents the depositor has filed with the SEC for more complete information about the depositor, the issuing entity and this offering. You may get these documents for free by visiting EDGAR on the SEC website at www.sec.gov. Alternatively, the depositor or Citigroup Global Markets Inc., Morgan Stanley & Co. LLC, Merrill Lynch, Pierce, Fenner & Smith Incorporated, Drexel Hamilton, LLC, The Williams Capital Group, L.P. or any other underwriter or dealer participating in this offering will arrange to send you the prospectus if you request it by calling toll-free 1-800-831-9146.
108
| LOAN #8: OXFORD EXCHANGE |
| ■ | Appraisal. According to the appraisal, the Oxford Exchange Property had an “as-is” appraised value of $54,000,000 as of December 8, 2017. |
Appraisal Approach(1) | Value | Discount Rate | Capitalization Rate |
| Direct Capitalization Approach | $52,600,000 | N/A | 7.50% |
| Discounted Cash Flow Approach | $54,500,000 | 8.50% | 8.00%(2) |
| (1) | Based on the “as-is” appraised value. |
| (2) | Represents the terminal capitalization rate. |
| ■ | Environmental Matters. Based on a Phase I environmental report dated August 17, 2017, the environmental consultant did not identify evidence of any recognized environmental conditions or recommendations for further action at the Oxford Exchange Property. |
| ■ | Market Overview and Competition. The Oxford Exchange Property is located in Oxford, Alabama within the Calhoun County retail market. The Oxford Exchange Property serves a trade area spanning a radius of approximately 30 miles, as the only significant retail hub between Atlanta and Birmingham. The Oxford Exchange Property is approximately 55 miles east of the Birmingham CBD and approximately 85 miles west of the Atlanta CBD. Demand drivers include Choccolocco Park, McClellan, Jacksonville State University, Honda Manufacturing of Alabama and the Talladega Superspeedway. The new $36 million mega sports complex, Choccolocco Park, recently opened less than one mile from the Oxford Exchange Property. The 370-acre park opened in October 2016 and hosts collegiate and interscholastic team competitions, amateur athletic events, tournaments and camps. Choccolocco Park projects approximately 500,000 visitors annually from around the country. McClellan is a 10,000-acre master-planned community located in Anniston, Alabama, approximately four miles north of the Oxford Exchange Property. The community contains residential, retail, professional and industrial development. Since its opening, McClellan has added more than 900 residents and a work place for more than 3,000 employees. Honda Manufacturing of Alabama (“HMA”) is located approximately 20 miles west of the Oxford Exchange Property. HMA is home to Honda’s largest light truck production facility in the world, and it is the sole manufacturer of the Odyssey minivan, Pilot SUV, Ridgeline pickup truck, Acura MDX and the V-6 engines that power them. The plant has more than 4,500 employees. |
Talladega Superspeedway is located approximately 18 miles southwest of the Oxford Exchange Property. The speedway is a motorsports complex that is one of the most visited sports destinations in the state of Alabama, accommodating 80,000 fans. The facility is used year-round in a variety of ways outside of NASCAR and other races. Over the past 10 years, the economic impact is approximately $3.9 billion from the NASCAR races hosted at the track.
According to the appraisal, as of the second quarter of 2017, the Calhoun County retail market had a total retail inventory of approximately 8.3 million SF with a vacancy rate of 4.1% and average asking rent of $10.01 per SF. According to the appraisal, the 2017 population within a one-, three- and five-mile radius of the Oxford Exchange Property was 923, 16,304 and 33,505, respectively. Additionally, the 2017 median household income within a one-, three- and five-mile radius of the Oxford Exchange Property was $58,909, $53,695 and $45,348, respectively.
The depositor has filed a registration statement (including a prospectus) with the Securities and Exchange Commission (“SEC”) (SEC File No. 333-207132) for the offering to which this communication relates. Before you invest, you should read the prospectus in the registration statement and other documents the depositor has filed with the SEC for more complete information about the depositor, the issuing entity and this offering. You may get these documents for free by visiting EDGAR on the SEC website at www.sec.gov. Alternatively, the depositor or Citigroup Global Markets Inc., Morgan Stanley & Co. LLC, Merrill Lynch, Pierce, Fenner & Smith Incorporated, Drexel Hamilton, LLC, The Williams Capital Group, L.P. or any other underwriter or dealer participating in this offering will arrange to send you the prospectus if you request it by calling toll-free 1-800-831-9146.
109
| LOAN #8: OXFORD EXCHANGE |
The following table presents certain information relating to lease comparables for the Oxford Exchange Property:
Competitive Set(1)
Oxford Exchange | River Trace | Prattville | Eastchase Plaza | Promenade at | ||
| Distance (from Subject) | - | 42.5 miles | 113.0 miles | 108.0 miles | 71.4 miles | |
| Property Type | Retail | Power Center | Power Center | Power Center | Power Center | |
| Year Built | 2006 | 2014 | 2007 | 2003 | 2007 | |
| Total GLA | 333,866 | 137,044 | 168,842 | 324,640 | 248,682 | |
Total Occupancy | 99.2% | 99.0% | 100.0% | 100.0% | 99.0% | |
| Anchors | Hobby Lobby Dick’s Sporting Goods Ross Dress for Less TJ Maxx
| Hobby Lobby Ross Dress for Less Shoe Carnival ULTA Kirkland’s | Ross Dress for Less TJ Maxx PetSmart | Target Kohl’s Ross Dress for Less | JCPenney Ashley Furniture Ross Dress for Less Best Buy |
| (1) | Sources: Appraisal and underwritten rent roll dated December 22, 2017. |
| ■ | The Borrowers. The borrowers are Oxford Exchange, LP, a single-purpose Texas limited partnership, and Ishaan LLC, a single-purpose Delaware limited liability company, as tenants-in-common. Legal counsel for the borrowers delivered a non-consolidation opinion in connection with the origination of the Oxford Exchange Loan. The non-recourse carveout guarantors are Hardam Singh Azad and Dilip Seth. Hardam Singh Azad is based in Houston, Texas and has more than 35 years of real estate experience. He is a licensed real estate broker in Texas and earned the Certified Commercial Investment Member (CCIM) designation in 1998. Mr. Azad founded Azad Commercial Realty Services, LLC in 1995 and handles all real estate brokerage, acquisition, ownership and management business, specifically focusing on retail properties. As of December 2016, the company reported 28 acquisitions over the previous 20 years. The company’s current holdings include 16 multi-tenant shopping centers totaling 1.7 million SF. These properties are located in Texas, Alabama, Louisiana, Tennessee and Oklahoma. Dilip Seth is based in Arizona and began investing in the hospitality segment with four hotels in Arizona and Kansas. Mr. Seth has an ownership interest in six assets, all in Arizona, including one each in Tucson, Chandler, Payson and Phoenix, and two in Tempe. |
| ■ | Escrows. On the origination date of the Oxford Exchange Loan, the borrowers funded a reserve of (i) $52,416 for real estate taxes, (ii) $10,127 for insurance and (iii) $1,500,000 for future tenant improvements and leasing commissions. |
Additionally, on each due date, the borrowers are required to fund the following reserves with respect to the Oxford Exchange Property: (i) a tax reserve in an amount equal to one-twelfth of the amount that the lender estimates will be necessary to pay taxes over the then succeeding 12-month period, (initially $26,208); (ii) an insurance reserve in an amount equal to one-twelfth of the amount that the lender estimates will be necessary to pay insurance premiums over the then succeeding 12-month period (initially $4,934); (iii) a replacement reserve in the amount of $4,175, capped at $350,000 and (iv) a tenant improvements and leasing commissions reserve in the amount of $13,916, capped at $2,500,000.
In the event that the lender receives satisfactory evidence that any Major Tenant (as defined below) has extended the terms of its lease in accordance with the terms of its lease or for at least five years and otherwise on terms and conditions satisfactory to the lender in its reasonable discretion, and provided that no Sweep Event Period (as defined below) is continuing, within 10 days of the lender’s receipt of written request of disbursement, a portion of the funds in the TI/LC reserve will be disbursed to the borrowers in accordance with the following schedule for each Major Tenant, subject to and limited by the balance remaining in TI/LC reserve, after giving effect to the disbursement, being no less than $1,000,000:
Tenant | Release Percentage |
| Hobby Lobby | 15% of then-applicable TI/LC reserve balance |
| Dick’s Sporting Goods | 15% of then-applicable TI/LC reserve balance |
| Ross Dress for Less | 11% of then-applicable TI/LC reserve balance |
| TJ Maxx | 9% of then-applicable TI/LC reserve balance |
The depositor has filed a registration statement (including a prospectus) with the Securities and Exchange Commission (“SEC”) (SEC File No. 333-207132) for the offering to which this communication relates. Before you invest, you should read the prospectus in the registration statement and other documents the depositor has filed with the SEC for more complete information about the depositor, the issuing entity and this offering. You may get these documents for free by visiting EDGAR on the SEC website at www.sec.gov. Alternatively, the depositor or Citigroup Global Markets Inc., Morgan Stanley & Co. LLC, Merrill Lynch, Pierce, Fenner & Smith Incorporated, Drexel Hamilton, LLC, The Williams Capital Group, L.P. or any other underwriter or dealer participating in this offering will arrange to send you the prospectus if you request it by calling toll-free 1-800-831-9146.
110
| LOAN #8: OXFORD EXCHANGE |
| ■ | Lockbox and Cash Management. The Oxford Exchange Loan is structured with a springing lockbox and springing cash management. Upon the occurrence of a Sweep Event Period, the Oxford Exchange Loan documents require certain tenants, pursuant to tenant direction letters, to pay rent directly to the lockbox account and require that all other money received by the borrowers with respect to the Oxford Exchange Property to be deposited within one business day into such lockbox account. During a Sweep Event Period, funds on deposit in the lockbox account are required to be transferred on a daily basis to a lender-controlled cash management account. On each due date during a Sweep Event Period, the Oxford Exchange Loan documents require that all amounts on deposit in the cash management account be used to pay debt service, fund required reserves and pay operating expenses, and all remaining amounts will be deposited (i) in the excess cash flow reserve account and held as additional collateral for the Oxford Exchange Loan or (ii) during a Major Tenant Event Period, into a reserve for tenant improvements and leasing commissions related to the leased space occupied by the Major Tenant. |
A “Sweep Event Period” occurs upon (i) an event of default under the Oxford Exchange Loan until cured (so long as no other Oxford Exchange Trigger Event Period is in effect), (ii) the debt service coverage ratio of the Oxford Exchange Property (based on the trailing 12 calendar months and as determined by the lender) being less than 1.15x, until the debt service coverage ratio of the Oxford Exchange Property (based on the trailing 12 calendar months and as determined by the lender) is equal to or greater than 1.25x for two consecutive calendar quarters (so long as no other Oxford Exchange Trigger Event Period is in effect) or (iii) a Major Tenant Event Period (as defined below), until the same is cured.
A “Major Tenant Event Period” occurs upon Hobby Lobby, Dick’s Sporting Goods, Ross Dress for Less or TJ Maxx, or any tenant that replaces any such tenant at the Oxford Exchange Property (each, a “Major Tenant”) (i) failing to extend the terms of its lease for at least five years and otherwise on terms and conditions satisfactory to the lender, on or before the date that is nine months prior to its lease expiration of Hobby Lobby and Dick’s Sporting Goods and six months prior to its lease expiration date of Ross Dress for Less and TJ Maxx, (ii) defaulting beyond any applicable cure or grace period under its lease, (iii) going dark or otherwise ceasing operations in its leased space at the Oxford Exchange Property, (iv) subletting its leased space or (v) becoming a debtor in any bankruptcy or other insolvency proceeding;provided, however, such Major Tenant Event Period will expire: (a) in connection with (i) above, either (1) a Major Tenant Re-Tenanting Event (as defined below) has occurred or (2) the lender has received evidence that the applicable Major Tenant has extended the term of its lease for a period of no less than five years, and such Major Tenant has provided to the lender a tenant estoppel certificate confirming that all obligations of the borrowers to such Major Tenant with respect to tenant improvements and leasing commissions have been satisfied in full and that such Major Tenant is then paying full, unabated rent; (b) in connection with (ii) above, either (1) a Major Tenant Re-Tenanting Event has occurred or (2) the subject default has been cured, and no other default has occurred under the related lease (in each case, beyond any applicable notice and cure period) for a period of two consecutive calendar quarters following such cure; (c) in connection with (iii) above, either (1) a Major Tenant Re-Tenanting Event has occurred or (2) the applicable Major Tenant has resumed its normal business operations in its leased space and is open during customary hours for a period of two consecutive calendar quarters; (d) in connection with (iv) above, either (1) a Major Tenant Re-Tenanting Event has occurred or (2) there has been a termination of any sublease of the space leased to a Major Tenant and the applicable Major Tenant remains in possession of all of its leased space pursuant to the terms of the related lease; or (e) in connection with (v) above, either (1) a Major Tenant Re-Tenanting Event has occurred or (2) the bankruptcy or insolvency proceeding has terminated in a manner satisfactory to the lender, the related lease has been affirmed and the terms of such lease, as affirmed, are satisfactory to the lender.
A “Major Tenant Re-Tenanting Event” occurs upon lender receiving evidence that all of the space leased to a Major Tenant has been leased to a satisfactory replacement tenant, each pursuant to a satisfactory replacement lease on terms and conditions acceptable to lender and in accordance with the terms of the Oxford Exchange Loan, including, but not limited to, having a term of at least five years, that each such tenant is in occupancy of its premises, open for business and is then paying full, unabated rent pursuant to the terms of its lease, and that all tenant improvement costs and leasing commissions provided in each such replacement lease have been paid, such evidence to include, without limitation, a satisfactory estoppel certificate from each such replacement tenant affirming the foregoing.
The depositor has filed a registration statement (including a prospectus) with the Securities and Exchange Commission (“SEC”) (SEC File No. 333-207132) for the offering to which this communication relates. Before you invest, you should read the prospectus in the registration statement and other documents the depositor has filed with the SEC for more complete information about the depositor, the issuing entity and this offering. You may get these documents for free by visiting EDGAR on the SEC website at www.sec.gov. Alternatively, the depositor or Citigroup Global Markets Inc., Morgan Stanley & Co. LLC, Merrill Lynch, Pierce, Fenner & Smith Incorporated, Drexel Hamilton, LLC, The Williams Capital Group, L.P. or any other underwriter or dealer participating in this offering will arrange to send you the prospectus if you request it by calling toll-free 1-800-831-9146.
111
| LOAN #8: OXFORD EXCHANGE |
| ■ | Property Management. The Oxford Exchange Property is managed by Azad Commercial Realty Services, LLC, an affiliate of the borrowers. Under the Oxford Exchange Loan documents, the Oxford Exchange Property may be managed by Azad Commercial Realty Services, LLC or any other management company reasonably approved by the lender and with respect to which a rating agency confirmation has been received. Upon any of (i) the occurrence of an event of default under the Oxford Exchange Loan documents, (ii) the debt service coverage ratio of the Oxford Exchange Property falling below 1.10x, (iii) a default by the property manager under the management agreement beyond any applicable notice and cure period, (iv) the insolvency or the filing of a bankruptcy petition with respect to the property manager or (v) the engagement by the property manager in gross negligence, fraud, willful misconduct or misappropriation of funds, the lender may require the borrowers to terminate the management agreement and replace the property manager with a new property manager selected by the borrowers, subject to the lender’s approval and, if required by the lender, with respect to which a rating agency confirmation has been received. |
| ■ | Mezzanine or Secured Subordinate Indebtedness. Not permitted. |
| ■ | Release of Collateral. Not permitted. |
| ■ | Terrorism Insurance. The borrowers are required to maintain an “all-risk” insurance policy that provides coverage for terrorism in an amount equal to 100.0% of the full replacement cost of the Oxford Exchange Property, plus a business interruption insurance policy that provides 18 months of business interruption coverage. The required terrorism insurance may be included in a blanket policy, provided that, among other things, any such blanket policy specifically allocates to the Oxford Exchange Property the amount of coverage from time to time required under the Oxford Exchange Loan documents. See “Risk Factors—Terrorism Insurance May Not Be Available for All Mortgaged Properties”in the Preliminary Prospectus. |
The depositor has filed a registration statement (including a prospectus) with the Securities and Exchange Commission (“SEC”) (SEC File No. 333-207132) for the offering to which this communication relates. Before you invest, you should read the prospectus in the registration statement and other documents the depositor has filed with the SEC for more complete information about the depositor, the issuing entity and this offering. You may get these documents for free by visiting EDGAR on the SEC website at www.sec.gov. Alternatively, the depositor or Citigroup Global Markets Inc., Morgan Stanley & Co. LLC, Merrill Lynch, Pierce, Fenner & Smith Incorporated, Drexel Hamilton, LLC, The Williams Capital Group, L.P. or any other underwriter or dealer participating in this offering will arrange to send you the prospectus if you request it by calling toll-free 1-800-831-9146.
112
(THIS PAGE INTENTIONALLY LEFT BLANK)
The depositor has filed a registration statement (including a prospectus) with the Securities and Exchange Commission (“SEC”) (SEC File No. 333-207132) for the offering to which this communication relates. Before you invest, you should read the prospectus in the registration statement and other documents the depositor has filed with the SEC for more complete information about the depositor, the issuing entity and this offering. You may get these documents for free by visiting EDGAR on the SEC website at www.sec.gov. Alternatively, the depositor or Citigroup Global Markets Inc., Morgan Stanley & Co. LLC, Merrill Lynch, Pierce, Fenner & Smith Incorporated, Drexel Hamilton, LLC, The Williams Capital Group, L.P. or any other underwriter or dealer participating in this offering will arrange to send you the prospectus if you request it by calling toll-free 1-800-831-9146.
113
| LOAN #9: 3rd & pine seattle retail & parking |
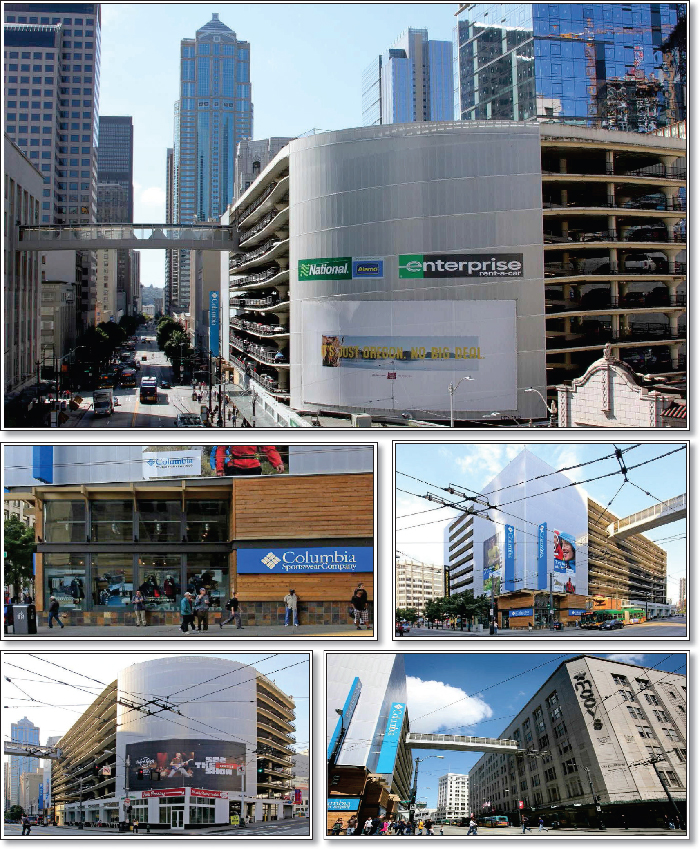
The depositor has filed a registration statement (including a prospectus) with the Securities and Exchange Commission (“SEC”) (SEC File No. 333-207132) for the offering to which this communication relates. Before you invest, you should read the prospectus in the registration statement and other documents the depositor has filed with the SEC for more complete information about the depositor, the issuing entity and this offering. You may get these documents for free by visiting EDGAR on the SEC website at www.sec.gov. Alternatively, the depositor or Citigroup Global Markets Inc., Morgan Stanley & Co. LLC, Merrill Lynch, Pierce, Fenner & Smith Incorporated, Drexel Hamilton, LLC, The Williams Capital Group, L.P. or any other underwriter or dealer participating in this offering will arrange to send you the prospectus if you request it by calling toll-free 1-800-831-9146.
114
| LOAN #9: 3rd & pine seattle retail & parking |
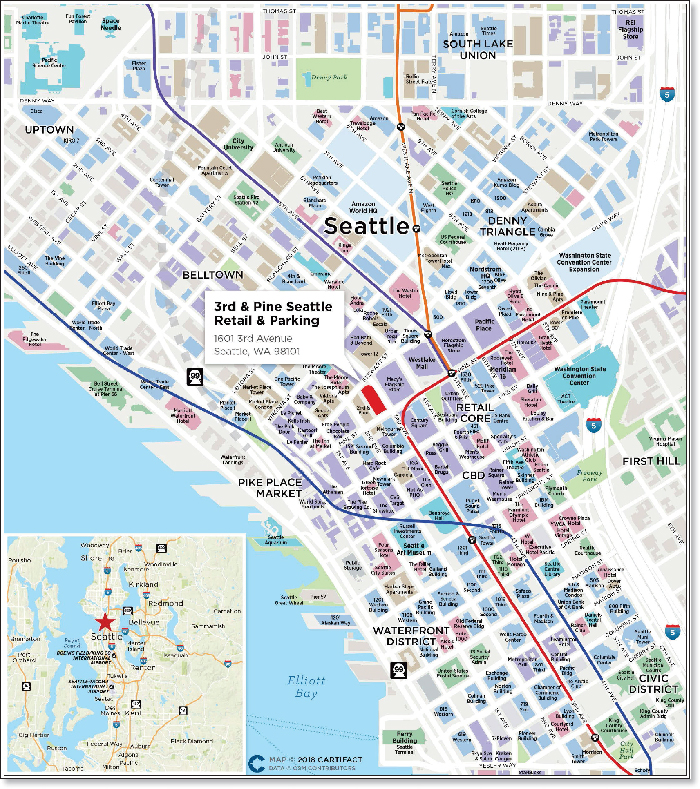
The depositor has filed a registration statement (including a prospectus) with the Securities and Exchange Commission (“SEC”) (SEC File No. 333-207132) for the offering to which this communication relates. Before you invest, you should read the prospectus in the registration statement and other documents the depositor has filed with the SEC for more complete information about the depositor, the issuing entity and this offering. You may get these documents for free by visiting EDGAR on the SEC website at www.sec.gov. Alternatively, the depositor or Citigroup Global Markets Inc., Morgan Stanley & Co. LLC, Merrill Lynch, Pierce, Fenner & Smith Incorporated, Drexel Hamilton, LLC, The Williams Capital Group, L.P. or any other underwriter or dealer participating in this offering will arrange to send you the prospectus if you request it by calling toll-free 1-800-831-9146.
115
| LOAN #9: 3rd & pine seattle retail & parking |
| Mortgaged Property Information | Mortgage Loan Information | ||||||||||||
| Number of Mortgaged Properties | 1 | Loan Seller | CREFI | ||||||||||
| Location (City/State) | Seattle, Washington | Cut-off Date Balance | $35,200,000 | ||||||||||
| Property Type | Mixed Use | Cut-off Date Balance per SF(1) | $100.81 | ||||||||||
| Size (SF)(1) | 349,184 | Percentage of Initial Pool Balance | 3.3% | ||||||||||
| Total Occupancy as of 3/1/2018(1) | 100.0% | Number of Related Mortgage Loans | None | ||||||||||
| Owned Occupancy as of 3/1/2018(1) | 100.0% | Type of Security | Leasehold | ||||||||||
| Year Built / Latest Renovation | 1959 / 2016 | Mortgage Rate | 4.54000% | ||||||||||
| Appraised Value | $59,000,000 | Original Term to Maturity (Months) | 120 | ||||||||||
| Appraisal Date | 1/2/2018 | Original Amortization Term (Months) | NAP | ||||||||||
| Borrower Sponsor | CIM Infra II AIV-2, LP | Original Interest Only Period (Months) | 120 | ||||||||||
| Property Management(2) | LAZ Parking Realty Investors, LLC, | First Payment Date | 4/1/2018 | ||||||||||
| CIM Management, Inc. and | Maturity Date | 3/1/2028 | |||||||||||
| LAZ Parking Northwest, LLC | |||||||||||||
| Underwritten Revenues | $6,032,685 | ||||||||||||
| Underwritten Expenses | $3,074,495 | Escrows | |||||||||||
| Underwritten Net Operating Income (NOI) | $2,958,191 | Upfront | Monthly | ||||||||||
| Underwritten Net Cash Flow (NCF) | $2,880,129 | Taxes | $0 | $0 | |||||||||
| Cut-off Date LTV Ratio | 59.7% | Insurance | $0 | $0 | |||||||||
| Maturity Date LTV Ratio | 59.7% | Replacement Reserve(3) | $40,000 | $3,783 | |||||||||
| DSCR Based on Underwritten NOI / NCF | 1.83x / 1.78x | TI/LC | $0 | $1,671 | |||||||||
| Debt Yield Based on Underwritten NOI / NCF | 8.4% / 8.2% | Other(4) | $1,875 | $0 | |||||||||
| Sources and Uses | |||||||||||||
| Sources | $ | % | Uses | $ | % | ||||||||
| Loan Amount | $35,200,000 | 60.4% | Purchase Price | $57,725,000 | 99.1% | ||||||||
| Principal’s New Cash Contribution | 22,971,746 | 39.4 | Closing Costs | 464,501 | 0.8 | ||||||||
| Other Sources | 59,630 | 0.1 | Upfront Reserves | 41,875 | 0.1 | ||||||||
| Total Sources | $58,231,376 | 100.0% | Total Uses | $58,231,376 | 100.0% | ||||||||
| (1) | The 3rd & Pine Seattle Retail & Parking Property (as defined below) is an 844-stall parking garage with 20,293 SF of ground floor retail space. Inclusive of the SF attributable to the parking spaces, the 3rd & Pine Seattle Retail & Parking Property consists of 349,184 SF. |
| (2) | The retail portion of the 3rd & Pine Seattle Retail & Parking Property is co-managed by LAZ Parking Realty Investors, LLC and CIM Management, Inc. The parking portion of the 3rd & Pine Seattle Retail & Parking Property is managed by LAZ Parking Northwest, LLC. |
| (3) | The 3rd & Pine Seattle Retail & Parking Loan borrowers are required to deposit an amount monthly for replacement reserves equal to (i) for the first seven years of the loan term, $3,783 and (ii) beginning with the 85th monthly payment date and continuing thereafter on each monthly payment date until maturity, $1,833. |
| (4) | The Upfront Other Reserve consists of $1,875 for immediate repairs. |
| ■ | The Mortgage Loan. The mortgage loan (the “3rd & Pine Seattle Retail & Parking Loan”) is secured by a first mortgage encumbering the borrowers’ leasehold interest in an 844-stall parking and ground floor retail building in Seattle, Washington (the “3rd & Pine Seattle Retail & Parking Property”). The 3rd & Pine Seattle Retail & Parking Loan has an outstanding principal balance as of the Cut-off Date of $35,200,000 and represents approximately 3.3% of the Initial Pool Balance. The 3rd & Pine Seattle Retail & Parking Loan accrues interest at an interest rate of 4.54000%per annum. The proceeds of the 3rd & Pine Seattle Retail & Parking Loan were primarily used to acquire the 3rd & Pine Seattle Retail & Parking Property, pay closing costs and fund upfront reserves. The 3rd & Pine Seattle Retail & Parking Loan was originated by CREFI on February 5, 2018. |
The 3rd & Pine Seattle Retail & Parking Loan had an initial term of 120 months and has a remaining term of 120 months as of the Cut-off Date. The 3rd & Pine Seattle Retail & Parking Loan requires interest only payments for the full term and has a scheduled maturity date that is the due date in March 2028. Provided that no event of default has occurred and is continuing under the 3rd & Pine Seattle Retail & Parking Loan documents, at any time after the second anniversary of the securitization closing date, the 3rd & Pine Seattle Retail & Parking Loan may be defeased with certain direct full faith and credit obligations of the United States of America or other obligations which are “government securities” permitted under the 3rd & Pine Seattle Retail & Parking Loan documents. Voluntary prepayment of the 3rd & Pine Seattle Retail & Parking Loan is permitted (in whole, but not in part) without penalty on or after the due date in September 2027.
| ■ | The Mortgaged Property. The 3rd & Pine Seattle Retail & Parking Property is a 349,184 SF, 10-story building consisting of an 844-stall parking garage with 20,293 SF of ground floor retail space located in Seattle, Washington. The 3rd & Pine Seattle Retail & Parking Property was built in 1959 and renovated in 2008, 2015 and 2016. The parking component, which accounts for approximately 80.0% of underwritten effective gross income, currently leases 496 parking spaces on long term leases with the remaining 348 parking spaces currently utilized for monthly and transient parking. The 3rd & Pine Seattle Retail & Parking Property is located in the Seattle central business district (“CBD”) and retail core submarket, with direct access to retail amenities including Pike Place Market, lodging, waterfront amenities, office buildings in the financial district and apartment projects. The adjacent Macy’s building, which is connected to the 3rd & Pine Seattle Retail & Parking Property via a skywalk, has approximately 300,000 SF of recently redeveloped creative office space located on floors five through eight that are part of an office condo unit owned by Starwood Capital (“Starwood”). The 300,000 SF condo unit is leased to Amazon for a 15-year term that is |
The depositor has filed a registration statement (including a prospectus) with the Securities and Exchange Commission (“SEC”) (SEC File No. 333-207132) for the offering to which this communication relates. Before you invest, you should read the prospectus in the registration statement and other documents the depositor has filed with the SEC for more complete information about the depositor, the issuing entity and this offering. You may get these documents for free by visiting EDGAR on the SEC website at www.sec.gov. Alternatively, the depositor or Citigroup Global Markets Inc., Morgan Stanley & Co. LLC, Merrill Lynch, Pierce, Fenner & Smith Incorporated, Drexel Hamilton, LLC, The Williams Capital Group, L.P. or any other underwriter or dealer participating in this offering will arrange to send you the prospectus if you request it by calling toll-free 1-800-831-9146.
116
| LOAN #9: 3rd & pine seattle retail & parking |
anticipated to commence in the fourth quarter of 2018. 250 of the 496 parking spaces on long term leases are leased to Starwood through October 8, 2026 to fulfill the parking and zoning requirements under the Amazon lease.Starwood has commenced paying rent for the lease on the 250 parking spaces; however, the spaces are not anticipated to be used by Amazon until the fourth quarter of 2018 when Amazon takes occupancy of its space. The 250 parking spaces are currently being offered for transient and monthly parking. From calendar year end 2014 through the trailing 12-month period ending September 30, 2017, parking income at the3rd & Pine Seattle Retail & Parking Property has increased by approximately 58.6%.
The remaining parking spaces on long term leases consist of 164 spaces leased to EAN Holdings, LLC (“Enterprise Rental Cars”) through October 2023 and 82 spaces leased to Seattle Hotel Ownership, LLC (“Widewaters Hotel Group”) through December 2026.
The ground floor retail space is currently 100.0% occupied by Columbia Sportswear (18,851 SF) through January 2019 and Enterprise Rental Cars (1,442 SF) through October 2023. Columbia Sportswear was founded in 1938 and sells global active lifestyle apparel, footwear, accessories and equipment. Columbia Sportswear also owns several other brands including Mountain Hardwear, SOREL, and prAna. Inclusive of these brands, Columbia Sportswear products are sold in more than 100 countries. For the years ending 2014, 2015 and 2016, Columbia Sportswear reported annual sales per SF at the 3rd & Pine Seattle Retail & Parking Property of $203, $219 and $236, respectively.
The following table presents certain information relating to the major tenants (of which certain tenants may have co-tenancy provisions) at the 3rd & Pine Seattle Retail & Parking Property:
Retail Tenant(1)
Tenant Name | Credit Rating | Tenant | % of | UW Base Rent | % of Total UW | Retail UW Base | Lease | Tenant Sales $ | Occupancy | |||||||||||||||||
| Columbia Sportswear | NR/NR/NR | 18,851 | 100.0 | % | $885,997 | 100.0 | % | $47.00 | 1/31/2019 | $290.11 | 17.3 | % | ||||||||||||||
| Owned Retail Tenant | 18,851 | 100.0 | % | $885,997 | 100.0 | % | $47.00 | |||||||||||||||||||
| Vacant | 0 | 0.0 | 0 | 0.0 | 0.00 | |||||||||||||||||||||
| Total / Wtd. Avg. | 18,851 | 100.0 | % | $885,997 | 100.0 | % | $47.00 | |||||||||||||||||||
| (1) | Based on the underwritten rent roll dated March 1, 2018. Enterprise Rental Cars occupies 1,442 SF of ground floor retail space, however, this is part of the long-term parking lease that Enterprise Rental Cars entered into and therefore it does not have a specific portion of base rent allocated to this space. See “Long-Term Parking Lease Summary” below for additional information regarding the Enterprise Rental Cars lease. |
| (2) | Columbia Sportswear has two, five-year renewal options with the first renewal option at $54.00 rent per SF and the second at fair market value. |
| (3) | Based on annualized sales from January 2017- June 2017 and adjusted for seasonality based on sales trends from 2013 to 2016. Without adjusting for seasonality, the Columbia Sportswear reported annualized sales per SF for 2017 of $235 and had an Occupancy Cost of 21.3%. |
Long-Term Parking Lease Summary(1)
Lessee Name | Parking | % of | UW Base Rent | % of Total | UW Parking Base | Lease | Renewal | ||||||||||
| Starwood(2) | 250 | 29.6% | $1,041,300 | 21.6% | $347.10 | 10/8/2026 | 6, 5-year options | ||||||||||
| Enterprise Rental Cars | 164 | 19.4 | 464,890 | 9.6 | 236.22 | 10/31/2023 | 2, 5-year options | ||||||||||
| Widewaters Hotel Group | 82 | 9.7 | 379,045 | 7.8 | 385.21 | 12/31/2026 | 2, 5-year options | ||||||||||
| Total Long-Term Parking | 496 | 58.8% | $1,885,235 | 39.0% | 316.74 | ||||||||||||
| Monthly/Transient | 348 | 41.2 | 2,945,083 | 61.0 | 705.24 | ||||||||||||
| Total / Wtd. Avg. | 844 | 100.0% | $4,830,318 | 100.0% | $476.93 | ||||||||||||
| (1) | Based on the underwritten rent roll dated March 1, 2018. |
| (2) | Starwood has commenced paying rent for the lease on the 250 parking spaces; however, the spaces are not anticipated to be used by Amazon until the fourth quarter of 2018 when Amazon takes occupancy of its space. The 250 parking spaces are currently being offered for transient and monthly parking. |
The depositor has filed a registration statement (including a prospectus) with the Securities and Exchange Commission (“SEC”) (SEC File No. 333-207132) for the offering to which this communication relates. Before you invest, you should read the prospectus in the registration statement and other documents the depositor has filed with the SEC for more complete information about the depositor, the issuing entity and this offering. You may get these documents for free by visiting EDGAR on the SEC website at www.sec.gov. Alternatively, the depositor or Citigroup Global Markets Inc., Morgan Stanley & Co. LLC, Merrill Lynch, Pierce, Fenner & Smith Incorporated, Drexel Hamilton, LLC, The Williams Capital Group, L.P. or any other underwriter or dealer participating in this offering will arrange to send you the prospectus if you request it by calling toll-free 1-800-831-9146.
117
| LOAN #9: 3rd & pine seattle retail & parking |
The following table presents certain information relating to historical retail leasing at the 3rd & Pine Seattle Retail & Parking Property:
Historical Leased %
2014(1) | 2015(1) | 2016(1) | As of 3/1/2018(2) | |
| Owned Space | 100.0% | 100.0% | 100.0% | 100.0% |
| (1) | As provided by the borrowers and which represents occupancy as of December 31 for the indicated year for the retail space at the 3rd & Pine Seattle Retail & Parking Property.Enterprise Rental Cars occupies 1,442 SF of ground floor retail space, however, this is part of the long-term parking lease that Enterprise Rental Cars entered into and therefore it does not have a specific portion of base rent allocated to this space. Please see “Long-Term Parking Lease Summary” above for additional information regarding the Enterprise Rental Cars lease. |
| (2) | Based on the underwritten rent roll dated March 1, 2018. |
| ■ | Operating History and Underwritten Net Cash Flow. The following table presents certain information relating to the historical operating performance and the Underwritten Net Cash Flow at the 3rd & Pine Seattle Retail & Parking Property: |
Cash Flow Analysis(1)
2014 | 2015 | 2016 | TTM 9/30/2017 | Underwritten | Underwritten $ per SF(2) | |||
| Base Rent | $791,742 | $815,387 | $885,997 | $885,997 | $885,997 | $2.54 | ||
| Parking(3) | 3,156,341 | 3,653,667 | 4,120,328 | 5,004,563 | 4,830,318 | 13.83 | ||
| Gross Up Vacancy | 0 | 0 | 0 | 0 | 0 | 0.00 | ||
| Reimbursements | 58,624 | 58,624 | 58,624 | 58,624 | 58,624 | 0.17 | ||
| Other Income(4) | 462,949 | 408,870 | 230,890 | 286,589 | 321,029 | 0.92 | ||
| Vacancy & Credit Loss | (0) | (0) | (0) | (0) | (63,282) | (0.18) | ||
| Effective Gross Income | $4,469,657 | $4,936,547 | $5,295,839 | $6,235,773 | $6,032,685 | $17.28 | ||
| Real Estate Taxes | $301,846 | $263,714 | $272,015 | $269,706 | $465,269 | $1.33 | ||
| Insurance | 104,704 | 100,195 | 89,912 | 84,863 | 66,283 | 0.19 | ||
| Management Fee | 111,741 | 123,414 | 132,396 | 155,894 | 150,817 | 0.43 | ||
| Ground Rent | 909,456 | 961,511 | 987,539 | 987,539 | 1,104,886 | 3.16 | ||
| Other Operating Expenses | 1,030,248 | 1,175,307 | 1,236,615 | 1,299,837 | 1,287,240 | 3.69 | ||
| Total Operating Expenses | $2,457,996 | $2,624,141 | $2,718,477 | $2,797,839 | $3,074,495 | $8.80 | ||
| Net Operating Income | $2,011,661 | $2,312,407 | $2,577,363 | $3,437,934 | $2,958,191 | $8.47 | ||
| TI/LC | 0 | 0 | 0 | 0 | 42,585 | 0.12 | ||
| Capital Expenditures | 0 | 0 | 0 | 0 | 35,477 | 0.10 | ||
| Net Cash Flow | $2,011,661 | $2,312,407 | $2,577,363 | $3,437,934 | $2,880,129 | $8.25 | ||
| Occupancy | 100.0% | 100.0% | 100.0% | 100.0%(5) | 95.0% | (6) | ||
| NOI Debt Yield | 5.7% | 6.6% | 7.3% | 9.8% | 8.4% | |||
| NCF DSCR | 1.24x | 1.43x | 1.59x | 2.12x | 1.78x |
| (1) | Certain items such as straight line rent, interest expense, interest income, lease cancellation income, depreciation, amortization, debt service payments and any other non-recurring or non-operating items were excluded from the historical presentation and are not considered for the underwritten cash flow. |
| (2) | Underwritten $ per SF is based on the total 349,184 SF at the mortgaged property. |
| (3) | Parking income is derived from transient ($1,739,915), monthly ($1,205,168) and long-term leased parking ($1,885,235). Underwritten Parking income is below the TTM 9/30/2017 Parking income because it reflects the rental income associated with the Starwood lease where the historical cash flows reflect income generated from using the 250 parking spaces for monthly and transient parking. The operator is currently using the spaces for transient parking until Amazon takes occupancy of its space. |
| (4) | Other Income includes Columbia Sportswear signage rent, Bank of America ATM rent, Total Outdoor Corp. signage rent and Enterprise Rent Cars utility reimbursements. |
| (5) | Based on the underwritten rent roll dated March 1, 2018. |
| (6) | Represents an underwritten economic vacancy of 5.0%. |
| ■ | Appraisal. According to the appraisal, the 3rd & Pine Seattle Retail & Parking Property had an “as-is” appraised value of $59,000,000 as of January 2, 2018. |
Appraisal Approach | Value | Discount | Capitalization |
| Direct Capitalization Approach | $58,200,000 | N/A | 5.25% |
| Discounted Cash Flow Approach | $59,500,000 | 7.25% | 6.00%(1) |
| (1) | Represents the terminal capitalization rate. |
| ■ | Environmental Matters. According to the Phase I environmental report dated August 24, 2017, there was no evidence of any recognized environmental conditions or recommendations for further action at the 3rd & Pine Seattle Retail & Parking Property. |
The depositor has filed a registration statement (including a prospectus) with the Securities and Exchange Commission (“SEC”) (SEC File No. 333-207132) for the offering to which this communication relates. Before you invest, you should read the prospectus in the registration statement and other documents the depositor has filed with the SEC for more complete information about the depositor, the issuing entity and this offering. You may get these documents for free by visiting EDGAR on the SEC website at www.sec.gov. Alternatively, the depositor or Citigroup Global Markets Inc., Morgan Stanley & Co. LLC, Merrill Lynch, Pierce, Fenner & Smith Incorporated, Drexel Hamilton, LLC, The Williams Capital Group, L.P. or any other underwriter or dealer participating in this offering will arrange to send you the prospectus if you request it by calling toll-free 1-800-831-9146.
118
| LOAN #9: 3rd & pine seattle retail & parking |
| ■ | Market Overview and Competition.The 3rd & Pine Seattle Retail & Parking Property is located in Seattle, Washington, within King County and included within the Seattle-Bellevue-Everett Metropolitan Division (“Seattle MD”). The Seattle MD is primarily known for its highly trained and well-educated labor force, as well as its global presence in cloud computing and software development. According to the appraisal, notable employers include Boeing, Microsoft, University of Washington, Amazon and Providence Health & Services. Primary access to the 3rd & Pine Seattle Retail & Parking Property is provided by 1st Avenue, the Alaskan Way Viaduct, South Jackson, South King and South Main Street, while regional access is provided by Interstates 5, 90 and 520. The 3rd & Pine Seattle Retail & Parking Property is also located in close proximity to the Washington State Convention and Trade Center, a flexible center that offers a wide range of meeting sizes and room configurations to accommodate groups from 20 to 3,500 people. The Washington State Trade and Convention Center is in the early stages of expanding the facility by approximately 310,000 SF of exhibit spaces which is anticipated to be open for business by 2021. The City of Seattle is also planning a project known as Waterfront Seattle which encompasses the rebuilding of the Elliot Bay Seawall and a plan to transform and improve a two-mile stretch covering 20 acres of public waterfront space. Waterfront Seattle has commenced and is expected to be fully complete by early 2023. |
The 2017 population within a one-, three- and five-mile radius of the 3rd & Pine Seattle Retail & Parking Property is 57,040, 207,478 and 435,247, respectively. Population growth within a one-mile radius of the 3rd & Pine Seattle Retail & Parking Property has been consistent over the past eight years with annual growth of approximately 2.9%.The 2017 average household income within a one-, three- and five-mile radius of the 3rd & Pine Seattle Retail & Parking Property is $81,991, $101,588, and $107,041, respectively.
According to the appraisal, the 3rd & Pine Seattle Retail & Parking Property is located within the Seattle CBD and retail core submarket. As of the third quarter of 2017, the submarket reported total inventory of approximately 2.9 million SF with a 2.3% vacancy rate. The appraiser concluded to a retail market rent for the Seattle CBD and retail core submarket of $35.12 per SF. The Seattle CBD retail submarket did not receive any delivery of additional space in the past 12 months and no new developments are reported to be under construction.
The following table presents certain information relating to comparable properties to the 3rd & Pine Seattle Retail & Parking Property:
Competitive Parking Rates(1)
| Comparable Property | Location | Hourly Rate | Daily Rate | Early Bird Rate | Weekend Rate | Monthly Rate |
| 3rd & Pine Seattle Retail & Parking (subject) | 1601 3rd Avenue | $8.00 | $30.00 | $18.00 | $7.00 | $338.00 |
| Market Place Tower | 65 Lenora Street | $8.00 | $30.00 | $18.00 | $10.00 | $365.00 |
| Securities Garage | 1913 4th Avenue | $8.00 | $27.00 | $15.00 | $7.00 | $320.00 |
| Westlake Tower | 1601 5th Avenue | $9.00 | $30.00 | $17.00 | $7.00 | $325.00 |
| Pacific Place | 1674 7th Avenue | $6.00 | $28.00 | $15.00 | $12.00 | $285.00 |
| West Edge Garage | 1508 2nd Avenue | $7.00 | $23.00 | $15.00 | $7.00 | $300.00 |
| (1) | Source: Appraisal. |
| ■ | The Borrowers. The borrowers are 1601 Third Avenue (WA), LLC (“Ground Lessee”) and 1601 Third Avenue LeaseCo, LLC (“Operating Lessee”), both Delaware limited liability companies and single purpose entities with two independent directors. 1601 Third Avenue (WA), LLC is 100.0% directly owned by 1601 Third Avenue Venture, LLC and 1601 Third Avenue LeaseCo, LLC is 67.5% owned by CIM Group, L.P. (the managing member) and 32.5% owned by LAZ Parking Realty Investors, LLC (the operating member). Legal counsel to the borrowers delivered a non-consolidation opinion in connection with the origination of the 3rd & Pine Seattle Retail & Parking Loan. CIM Infrastructure Fund II, L.P. is the guarantor of certain nonrecourse carveouts under the 3rd & Pine Seattle Retail & Parking Loan. CIM Infrastructure Fund II, L.P. is required to maintain a minimum net worth of $25,000,000 with liquidity of $2,464,000 during the term of the 3rd & Pine Seattle Retail & Parking Loan. The Ground Lessee leases the parking portion of the 3rd & Pine Seattle Retail & Parking Property to the Operating Lessee pursuant to an operating lease, and the Operating Lessee is the lessor under the various parking tenant leases at the 3rd & Pine Seattle Retail & Parking Property. |
The borrower sponsor is CIM Infra II AIV-2, LP, an affiliate of CIM Group, LLC (“CIM Group”). CIM Group is a transformational urban real estate and infrastructure investment firm founded in 1994 and headquartered in Los Angeles with a principal focus on major metropolitan markets such as San Francisco, Los Angeles, New York City and Seattle. CIM Group is an owner and operator of approximately $25.7 billion of real assets inclusive of its own account and on behalf of its partners and co-investors.
The depositor has filed a registration statement (including a prospectus) with the Securities and Exchange Commission (“SEC”) (SEC File No. 333-207132) for the offering to which this communication relates. Before you invest, you should read the prospectus in the registration statement and other documents the depositor has filed with the SEC for more complete information about the depositor, the issuing entity and this offering. You may get these documents for free by visiting EDGAR on the SEC website at www.sec.gov. Alternatively, the depositor or Citigroup Global Markets Inc., Morgan Stanley & Co. LLC, Merrill Lynch, Pierce, Fenner & Smith Incorporated, Drexel Hamilton, LLC, The Williams Capital Group, L.P. or any other underwriter or dealer participating in this offering will arrange to send you the prospectus if you request it by calling toll-free 1-800-831-9146.
119
| LOAN #9: 3rd & pine seattle retail & parking |
| ■ | Escrows. On the origination date of the 3rd & Pine Seattle Retail & Parking Loan, the borrowers funded reserves of (i) $40,000 for replacement reserves and (ii) $1,875 for immediate repairs. |
On each due date, the borrowers will be required to fund (i) one-twelfth of the amount that the lender estimates will be payable for taxes over the then-succeeding 12-month period, provided that this requirement will be waived so long as the borrowers provide evidence that taxes have been paid and no event of default has occurred and is continuing, (ii) at the option of the lender, one-twelfth of the amount that the lender estimates will be necessary to pay insurance premiums over the then-succeeding 12-month period, provided that this requirement will be waived so long as no event of default has occurred and is continuing and the borrowers have provided the lender with satisfactory evidence that the 3rd & Pine Seattle Retail & Parking Property is insured pursuant to a blanket policy reasonably acceptable to the lender, (iii) an amount equal to (a) $3,783 for each of the first 84 due dates under the 3rd & Pine Seattle Retail & Parking Loan documents and (b) $1,833 for any due date thereafter for replacement reserves and (iv) $1,671 for tenant improvements and leasing commissions.
| ■ | Lockbox and Cash Management.The 3rd & Pine Seattle Retail & Parking Loan is structured with a springing lockbox and springing cash management. Upon the occurrence of a Cash Sweep Period (defined below), the borrowers are required to establish two separate lockbox accounts: one with respect to the retail and outdoor signage portion and one with respect to the parking portion of the 3rd & Pine Seattle Retail & Parking Property. Following the termination of a Cash Sweep Period, the lockbox is closed until the occurrence of a subsequent Cash Sweep Period. During a Cash Sweep Period, all amounts are required to be swept to a lender-controlled cash management account. During an event of default under the 3rd & Pine Seattle Retail & Parking Loan documents, the lender may apply funds in the cash management account in such order as it may determine. |
A “Cash Sweep Period” means the occurrence of (i) an event of default, (ii) the debt service coverage ratio falling below 1.40x or (iii) the occurrence of a Specified Tenant Trigger Event (as defined below). A Cash Sweep Period will end, with respect to clause (i), upon the cure of such event of default, if applicable; with respect to clause (ii), upon the debt service coverage ratio remaining equal to or greater than 1.45x for two consecutive calendar quarters and with respect to clause (iii), upon the cure of the related trigger event pursuant to the 3rd & Pine Seattle Retail & Parking Loan documents.
A “Specified Tenant Trigger Event” means the occurrence of any of the following: (i) a Specified Tenant (as defined below) or Specified Tenant Lease Guarantor (as defined below) being in default under its applicable lease, (ii) if the applicable Specified Tenant or Specified Tenant Lease Guarantor is not credit assessed, such Specified Tenant failing to be in actual, physical possession of the Specified Tenant space, failing to be open for business and/or “going dark”, (iii) a Specified Tenant giving notice that it is terminating its lease for 50% or more of its leased space, (iv) any termination or cancellation of any Specified Tenant’s lease (including, without limitation, rejection in any bankruptcy or similar insolvency proceeding) and/or any Specified Tenant lease failing to otherwise be in full force and effect, (v) any bankruptcy or similar insolvency of Specified Tenant or Specified Tenant Lease Guarantor or (vi) Specified Tenant failing to extend or renew its lease on or prior to the earlier of (a) the date that is six months prior to the expiration of such lease and (b) the date notice of renewal is required under the lease.
A “Specified Tenant” means, as applicable, (i) Columbia Sportswear and (ii) any other lessee(s) of 50.0% or more of the Specified Tenant space after Columbia Sportswear has vacated such portion of the 3rd & Pine Seattle Retail & Parking Property demised as of the origination date of the 3rd & Pine Seattle Retail & Parking Loan to the initial Specified Tenant.
A “Specified Tenant Lease Guarantor” means any guarantor(s) of such Specified Tenant’s lease at the 3rd & Pine Seattle Retail & Parking Property.
| ■ | Property Management. The parking portion of the 3rd & Pine Seattle Retail & Parking Property is managed by LAZ Parking Northwest, LLC (“Parking Manager”) pursuant to a parking management agreement between Parking Manager and 1601 Third Avenue LeaseCo, LLC. The retail space and associated outdoor signage portion of the 3rd & Pine Seattle Retail & Parking Property is co-managed by LAZ Parking Realty Investors, LLC (“LPRI”) and CIM Management, Inc. (“CIM” and together with LPRI, “Retail Managers”) pursuant to the following management agreements: i) a property management agreement by and between 1601 Third Avenue (WA), LLC and CIM, ii) a retail management agreement by and between 1601 Third Avenue (WA), LLC and LPRI and iii) a listing agreement by and between 1601 Third Avenue (WA), LLC and CIM. The borrowers are not permitted to replace the property manager without the lender’s consent (which shall not be unreasonably withheld if the proposed property manager is not an affiliate of the borrowers, and provided that no event of default is then continuing), except that the borrowers may, |
The depositor has filed a registration statement (including a prospectus) with the Securities and Exchange Commission (“SEC”) (SEC File No. 333-207132) for the offering to which this communication relates. Before you invest, you should read the prospectus in the registration statement and other documents the depositor has filed with the SEC for more complete information about the depositor, the issuing entity and this offering. You may get these documents for free by visiting EDGAR on the SEC website at www.sec.gov. Alternatively, the depositor or Citigroup Global Markets Inc., Morgan Stanley & Co. LLC, Merrill Lynch, Pierce, Fenner & Smith Incorporated, Drexel Hamilton, LLC, The Williams Capital Group, L.P. or any other underwriter or dealer participating in this offering will arrange to send you the prospectus if you request it by calling toll-free 1-800-831-9146.
120
| LOAN #9: 3rd & pine seattle retail & parking |
without the lender’s consent, replace the property manager with a manager that is a reputable and experienced management organization possessing experience in managing properties similar in size, scope, use and location as the 3rd & Pine Seattle Retail & Parking Property (a “Qualified Manager”). If (i) an event of default occurs and remains uncured under the 3rd & Pine Seattle Retail & Parking Loan documents, (ii) an event of default occurs and remains uncured under any management agreement, or (iii) the property manager becomes subject to an insolvency or bankruptcy action and, in the case of the events set forth in subsections (ii) and (iii), the property manager is not replaced by the applicable borrowers (x) within 60 days following the applicable borrowers’ knowledge of the same or (y) within 90 days following the applicable borrowers’ knowledge of same if such borrowers have, after 60 days, diligently found a qualified manager and the failure to finalize such replacement is due solely to a delay in servicer approval or confirmation by rating agencies, then, upon the occurrence of one of the events set forth in subsections (i), (ii) or (iii) above, the applicable borrowers are required to, at the request of lender, terminate the applicable management agreement and replace the applicable manager with a Qualified Manager pursuant to a replacement management agreement. The lender’s approval of a Qualified Manager or replacement management agreement may be conditioned on receipt of a rating agency confirmation (unless such Qualified Manager is an affiliate of the borrowers).
| ■ | Mezzanine or Secured Subordinate Indebtedness.Not permitted. |
| ■ | Release of Collateral. Not permitted. |
| ■ | Ground Lease. The 3rd & Pine Seattle Retail & Parking Property is subject to a ground lease with Block 45 LLC, as lessor, that commenced on May 12, 2005 and expires on May 11, 2104 with no renewal options. The borrowers have a right of first opportunity to purchase the 3rd & Pine Retail & Parking Property throughout the term and a fair market value purchase option at any time prior to the 99th year of the ground lease. As of February 2018, the base rent under the ground lease is $987,539 per year and increases every five years by the change in the Consumer Price Index, and the next increase will occur in May 2020. |
| ■ | Terrorism Insurance.The borrowers are required to maintain an “all risk” insurance policy that provides coverage for terrorism in an amount equal to the full replacement cost of the 3rd & Pine Seattle Retail & Parking Property, provided that the borrowers are not required to pay more than two times the annual insurance premiums (excluding the wind, flood and earthquake components of such insurance premiums) for such coverage (the “TC Cap”), and if the cost of such coverage exceeds the TC Cap, the borrowers are required to purchase the maximum coverage available for the TC Cap. The policies can have no deductible in excess of $25,000, except for the policies with respect to windstorm and earthquake coverage, which may provide for a deductible not to exceed 5.0% of the total insurable value of the 3rd & Pine Seattle Retail & Parking Property. The borrowers are required to maintain business interruption insurance covering no less than an amount equal to 100.0% of the projected gross income from the 3rd & Pine Seattle Retail & Parking Property on an actual loss sustained basis for a period beginning on the date of business interruption and continuing until the restoration of the 3rd & Pine Seattle Retail & Parking Property is completed, or the 18-month period following the occurrence of a casualty event, together with a 6-month extended period of indemnity. See “Risk Factors—Terrorism Insurance May Not Be Available for All Mortgaged Properties” in the Preliminary Prospectus. |
The depositor has filed a registration statement (including a prospectus) with the Securities and Exchange Commission (“SEC”) (SEC File No. 333-207132) for the offering to which this communication relates. Before you invest, you should read the prospectus in the registration statement and other documents the depositor has filed with the SEC for more complete information about the depositor, the issuing entity and this offering. You may get these documents for free by visiting EDGAR on the SEC website at www.sec.gov. Alternatively, the depositor or Citigroup Global Markets Inc., Morgan Stanley & Co. LLC, Merrill Lynch, Pierce, Fenner & Smith Incorporated, Drexel Hamilton, LLC, The Williams Capital Group, L.P. or any other underwriter or dealer participating in this offering will arrange to send you the prospectus if you request it by calling toll-free 1-800-831-9146.
121
LOAN #10: axcelis corporate center

The depositor has filed a registration statement (including a prospectus) with the Securities and Exchange Commission (“SEC”) (SEC File No. 333-207132) for the offering to which this communication relates. Before you invest, you should read the prospectus in the registration statement and other documents the depositor has filed with the SEC for more complete information about the depositor, the issuing entity and this offering. You may get these documents for free by visiting EDGAR on the SEC website at www.sec.gov. Alternatively, the depositor or Citigroup Global Markets Inc., Morgan Stanley & Co. LLC, Merrill Lynch, Pierce, Fenner & Smith Incorporated, Drexel Hamilton, LLC, The Williams Capital Group, L.P. or any other underwriter or dealer participating in this offering will arrange to send you the prospectus if you request it by calling toll-free 1-800-831-9146.
122
LOAN #10: axcelis corporate center
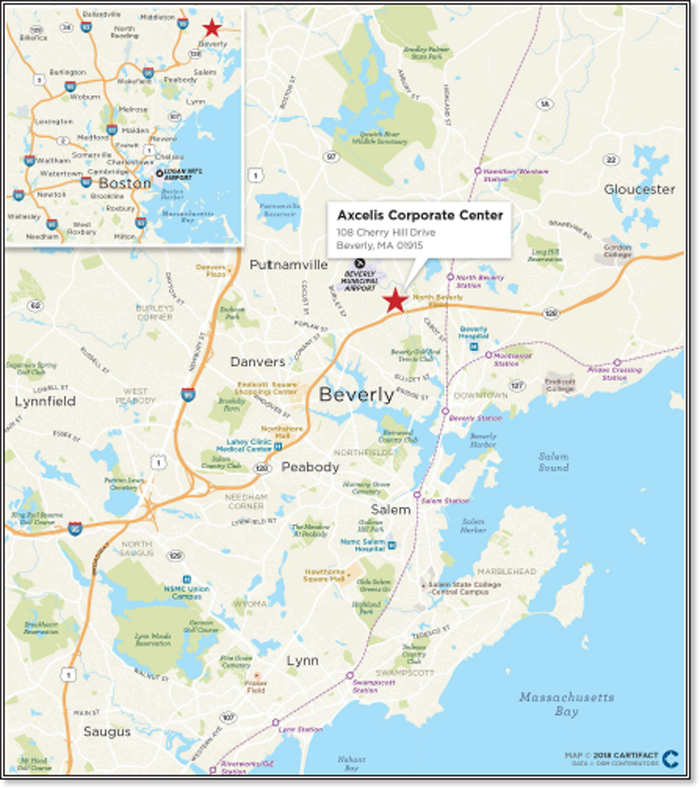
The depositor has filed a registration statement (including a prospectus) with the Securities and Exchange Commission (“SEC”) (SEC File No. 333-207132) for the offering to which this communication relates. Before you invest, you should read the prospectus in the registration statement and other documents the depositor has filed with the SEC for more complete information about the depositor, the issuing entity and this offering. You may get these documents for free by visiting EDGAR on the SEC website at www.sec.gov. Alternatively, the depositor or Citigroup Global Markets Inc., Morgan Stanley & Co. LLC, Merrill Lynch, Pierce, Fenner & Smith Incorporated, Drexel Hamilton, LLC, The Williams Capital Group, L.P. or any other underwriter or dealer participating in this offering will arrange to send you the prospectus if you request it by calling toll-free 1-800-831-9146.
123
LOAN #10: axcelis corporate center
| Mortgaged Property Information | Mortgage Loan Information | ||||
| Number of Mortgaged Properties | 1 | Loan Seller | MSMCH | ||
| Location (City/State) | Beverly, Massachusetts | Cut-off Date Balance(3) | $33,932,928 | ||
| Property Type | Industrial | Cut-off Date Balance per SF(2) | $121.97 | ||
| Size (SF) | 417,313 | Percentage of Initial Pool Balance | 3.2% | ||
| Total Occupancy as of 3/1/2018 | 100.0% | Number of Related Mortgage Loans(1) | 2 | ||
| Owned Occupancy as of 3/1/2018 | 100.0% | Type of Security | Fee Simple | ||
| Year Built / Latest Renovation | 1984 / 2006 | Mortgage Rate | 4.92000% | ||
| Appraised Value | $82,100,000 | Original Term to Maturity (Months) | 120 | ||
| Appraisal Date | 11/16/2017 | Original Amortization Term (Months) | 300 | ||
| Borrower Sponsors(1) | Mitchel Greenberg, | Original Interest Only Period (Months) | NAP | ||
| Peter Holstein, Keith Jaffee and | First Payment Date | 3/1/2018 | |||
| Middleton Partners LLC | Maturity Date | 2/1/2028 | |||
| Property Management | Self Managed | ||||
| Underwritten Revenues | $5,359,310 | ||||
| Underwritten Expenses | $160,780 | Escrows(4) | |||
| Underwritten Net Operating Income (NOI) | $5,198,531 | Upfront | Monthly | ||
| Underwritten Net Cash Flow (NCF) | $4,702,763 | Taxes | $0 | $0 | |
| Cut-off Date LTV Ratio(2) | 62.0% | Insurance | $0 | $0 | |
| Maturity Date LTV Ratio(2) | 46.3% | Replacement Reserve | $0 | $0 | |
| DSCR Based on Underwritten NOI / NCF(2) | 1.46x / 1.33x | TI/LC | $0 | $0 | |
| Debt Yield Based on Underwritten NOI / NCF(2) | 10.2% / 9.2% | Other | $0 | $0 | |
| Sources and Uses | |||||||
| Sources | $ | % | Uses | $ | % | ||
| Loan Combination Amount | $51,000,000 | 100.0% | Loan Payoff | $34,904,054 | 68.4 | % | |
| Principal Equity Distribution | 15,539,138 | 30.5 | |||||
| Closing Costs | 556,808 | 1.1 | |||||
| Total Sources | $51,000,000 | 100.0% | Total Uses | $51,000,000 | 100.0 | % | |
| (1) | The Axcelis Corporate Center Loan Combination borrower sponsors are also the borrower sponsors of the Park Place East and Park Place West Loan. |
| (2) | Calculated based on the aggregate outstanding principal balance as of the Cut-off Date of the Axcelis Corporate Center Loan Combination (as defined below). |
| (3) | The Cut-off Date Balance of $33,932,928 represents the controlling note A-1, which is part of a loan combination evidenced by twopari passu notes having an aggregate outstanding principal balance as of the Cut-off Date of $50,899,391. The related companion loan, which is evidenced by the non-controlling note A-2, has an outstanding principal balance as of the Cut-off Date of $16,966,464, is currently held by Morgan Stanley Bank, N.A. and is expected to be contributed to one or more future commercial mortgage securitization transactions. See “—The Mortgage Loan” below. |
| (4) | See“—Escrows” below. |
| ■ | The Mortgage Loan. The mortgage loan (the“Axcelis Corporate Center Loan”) is part of a loan combination (the“Axcelis Corporate Center Loan Combination”) evidenced by twopari passu notes that are together secured by a first mortgage encumbering the borrower’s fee simple interest in a 417,313 SF industrial flex building located in Beverly, Massachusetts (the“Axcelis Corporate Center Property”). The Axcelis Corporate Center Loan, which is evidenced by the controlling note A-1, had an original principal balance of $34,000,000, has an outstanding principal balance as of the Cut-off Date of $33,932,928 and represents approximately 3.2% of the Initial Pool Balance. The related companion loan is evidenced by the non-controlling note A-2, which had an original principal balance of $17,000,000, has an outstanding principal balance as of the Cut-off Date of $16,966,464, is currently held by Morgan Stanley Bank, N.A., and is expected to be contributed to one or more future commercial mortgage securitization transactions. The Axcelis Corporate Center Loan Combination, which accrues interest at an interest rate of 4.92000%per annum, was originated by Morgan Stanley Bank, N.A. on January 12, 2018, had an original principal balance of $51,000,000 and has an outstanding principal balance as of the Cut-off Date of $50,899,391. The proceeds of the Axcelis Corporate Center Loan Combination were primarily used to refinance a previous loan secured by the Axcelis Corporate Center Property, return equity to the borrower sponsor and pay origination costs. |
Loan Combination Summary
| Note | Original Balance | Cut-off Date Balance | Note Holder | Controlling Piece | |
| A-1 | $34,000,000 | $33,932,928 | CGCMT 2018-B2 | Yes | |
| A-2(1) | $17,000,000 | $16,966,464 | Morgan Stanley Bank, N.A. | No | |
| Total | $51,000,000 | $50,899,392 |
| (1) | Expected to be contributed to one or more future securitization transactions. |
The Axcelis Corporate Center Loan Combination had an initial term of 120 months and has a remaining term of 119 months as of the Cut-off Date. The Axcelis Corporate Center Loan Combination requires monthly payments of $295,769 which payments include interest and principal based on a 25-year amortization schedule. The scheduled maturity date of the Axcelis Corporate Center Loan Combination is the due date in February 2028. At any time after the earlier of (i) the due date in September 2021 and (ii) the second anniversary of the last securitization involving any portion of the Axcelis Corporate Center Loan Combination, the Axcelis Corporate Center Loan Combination may be, provided no event of default has occurred and is continuing under the Axcelis Corporate Center Loan Combination
The depositor has filed a registration statement (including a prospectus) with the Securities and Exchange Commission (“SEC”) (SEC File No. 333-207132) for the offering to which this communication relates. Before you invest, you should read the prospectus in the registration statement and other documents the depositor has filed with the SEC for more complete information about the depositor, the issuing entity and this offering. You may get these documents for free by visiting EDGAR on the SEC website at www.sec.gov. Alternatively, the depositor or Citigroup Global Markets Inc., Morgan Stanley & Co. LLC, Merrill Lynch, Pierce, Fenner & Smith Incorporated, Drexel Hamilton, LLC, The Williams Capital Group, L.P. or any other underwriter or dealer participating in this offering will arrange to send you the prospectus if you request it by calling toll-free 1-800-831-9146.
124
LOAN #10: axcelis corporate center
documents, defeased with certain direct full faith and credit obligations of the United States of America or other obligations which are “government securities” permitted under the Axcelis Corporate Center Loan Combination documents. Voluntary prepayment of the Axcelis Corporate Center Loan Combination in full without payment of any yield maintenance or any other prepayment premium is permitted on or after the due date in November 2027.
| ■ | The Mortgaged Property. The Axcelis Corporate Center Property consists of a 3-story, industrial flex building totaling 417,313 SF on a 36.98 acre site that is 100.0% leased to Axcelis Technologies, Inc (“Axcelis”). The Axcelis Corporate Center Property was built-to-suit for Axcelis in 1984, fully renovated in 2006 and has undergone over $3.3 million in renovations since 2013. The Axcelis Corporate Center Property includes 179,950 SF of manufacturing space, in which 85,838 SF is dedicated to Class 1 to 100,000 clean rooms. There is also a demonstration lab, cafeteria, low-height warehouse storage and 55,465 SF of mezzanine space including offices, assembly areas and equipment/mechanical space. The Axcelis Corporate Center Property has 9 dock-high doors, 3 drive-in doors, a maximum clear ceiling height of 22 feet, and includes 29.0% office space. The Axcelis Corporate Center Property contains 1,096 parking spaces that provide a parking ratio of 2.63 spaces per 1,000 SF. |
The Axcelis Corporate Center Property serves as the headquarters for Axcelis. Axcelis is a provider of equipment and services to the semiconductor manufacturing industry. With 40 years of industry experience, Axcelis has over 3,000 products in use. In addition to manufacturing, Axcelis provides aftermarket service and support including spare parts, equipment upgrades, maintenance services and customer training. The Axcelis Corporate Center Property is used to manufacture all of Axcelis’s products and develop next-generation applications and process capabilities. Axcelis has 30 offices in 12 countries and over 900 employees. Axcelis has a lease expiration of January 30, 2037 with five, five-year renewal options and no termination options. The borrower sponsors acquired the Axcelis Corporate Center Property in a sale/leaseback transaction with Axcelis in 2015. Axcelis owns 23 acres adjacent to the Axcelis Corporate Center Property.
Axcelis has a right of first offer to purchase the Axcelis Corporate Center Property. Such right does not apply to any transfer in a foreclosure sale (or similar proceeding) with respect to a mortgage secured by the Axcelis Corporate Center Property in favor of any lender who has been identified to Axcelis or any party that becomes the holder of such a mortgage as a result of the assignment thereof, or to any conveyance in lieu of foreclosure sale or deed in lieu thereof.
The following table presents certain information relating to the tenant at the Axcelis Corporate Center Property:
Owned Tenants Based on Underwritten Base Rent(1)
Tenant Name | Credit Rating (Fitch/MIS/S&P) | Tenant GLA | % of Owned GLA | UW Base Rent | % of Total UW Base Rent | UW Base Rent $ per SF | Lease Expiration | Renewal / | ||||||||||||
| Axcelis Technologies, Inc | NR / NR / NR | 417,313 | 100.0 | % | $5,480,600 | 100.0 | % | $13.13 | 1/30/2037 | 5, 5-year options | ||||||||||
| Largest Owned Tenant | 417,313 | 100.0 | % | $5,480,600 | 100.0 | % | $13.13 | |||||||||||||
| Vacant Spaces | 0 | 0.0 | 0 | 0.0 | 0.00 | |||||||||||||||
| Total / Wtd. Avg. All Owned Tenants | 417,313 | 100.0 | % | $5,480,600 | 100.0 | % | $13.13 | |||||||||||||
| (1) | Based on the Axcelis lease as of March 1, 2018. |
The depositor has filed a registration statement (including a prospectus) with the Securities and Exchange Commission (“SEC”) (SEC File No. 333-207132) for the offering to which this communication relates. Before you invest, you should read the prospectus in the registration statement and other documents the depositor has filed with the SEC for more complete information about the depositor, the issuing entity and this offering. You may get these documents for free by visiting EDGAR on the SEC website at www.sec.gov. Alternatively, the depositor or Citigroup Global Markets Inc., Morgan Stanley & Co. LLC, Merrill Lynch, Pierce, Fenner & Smith Incorporated, Drexel Hamilton, LLC, The Williams Capital Group, L.P. or any other underwriter or dealer participating in this offering will arrange to send you the prospectus if you request it by calling toll-free 1-800-831-9146.
125
LOAN #10: axcelis corporate center
The following table presents certain information relating to the lease rollover schedule at the Axcelis Corporate Center Property, based on initial lease expiration dates:
Lease Expiration Schedule(1)
Year Ending | Expiring | % of Owned GLA | Cumulative % of | UW Base Rent | % of Total UW | UW Base Rent | # of Expiring | |||||||||||||
| MTM | 0 | 0.0 | % | 0.0 | % | $0 | 0.0 | % | $0.00 | 0 | ||||||||||
| 2018 | 0 | 0.0 | 0.0 | % | 0 | 0.0 | 0.00 | 0 | ||||||||||||
| 2019 | 0 | 0.0 | 0.0 | % | 0 | 0.0 | 0.00 | 0 | ||||||||||||
| 2020 | 0 | 0.0 | 0.0 | % | 0 | 0.0 | 0.00 | 0 | ||||||||||||
| 2021 | 0 | 0.0 | 0.0 | % | 0 | 0.0 | 0.00 | 0 | ||||||||||||
| 2022 | 0 | 0.0 | 0.0 | % | 0 | 0.0 | 0.00 | 0 | ||||||||||||
| 2023 | 0 | 0.0 | 0.0 | % | 0 | 0.0 | 0.00 | 0 | ||||||||||||
| 2024 | 0 | 0.0 | 0.0 | % | 0 | 0.0 | 0.00 | 0 | ||||||||||||
| 2025 | 0 | 0.0 | 0.0 | % | 0 | 0.0 | 0.00 | 0 | ||||||||||||
| 2026 | 0 | 0.0 | 0.0 | % | 0 | 0.0 | 0.00 | 0 | ||||||||||||
| 2027 | 0 | 0.0 | 0.0 | % | 0 | 0.0 | 0.00 | 0 | ||||||||||||
| 2028 & Thereafter | 417,313 | 100.0 | 100.0 | % | 5,480,600 | 100.0 | 13.13 | 1 | ||||||||||||
| Vacant | 0 | 0.0 | 100.0 | % | 0 | 0.0 | 0.00 | 0 | ||||||||||||
| Total / Wtd. Avg. | 417,313 | 100.0 | % | $5,480,600 | 100.0 | % | $13.13 | 1 | ||||||||||||
| (1) | Calculated based on the approximate square footage occupied by each collateral tenant. |
The following table presents certain information relating to historical leasing at the Axcelis Corporate Center Property:
Historical Leased %(1)
2013 | 2014 | 2015 | 2016 | 2017 | As of 3/1/2018(2) | |
| Owned Space | 100.0% | 100.0% | 100.0% | 100.0% | 100.0% | 100.0% |
| (1) | As provided by the borrower and which represents occupancy as of December 31 for the indicated year unless otherwise specified. |
| (2) | Based on the underwritten rent roll dated March 1, 2018. |
| ■ | Underwritten Net Cash Flow. The following table presents certain information relating to the Underwritten Net Cash Flow at the Axcelis Corporate Center Property: |
Cash Flow Analysis(1)(2)
Underwritten | Underwritten | |||
| Gross Potential Rent(3) | $5,480,600 | $13.13 | ||
| Reimbursements | 160,780 | 0.39 | ||
| Other Income | 0 | 0.00 | ||
| Vacancy & Credit Loss | (282,069) | (0.68) | ||
| Effective Gross Income | $5,359,310 | $12.84 | ||
| Real Estate Taxes | $0 | $0.00 | ||
| Insurance | 0 | 0.00 | ||
| Management Fee(4) | 160,780 | 0.39 | ||
| Other Operating Expenses | 0 | 0.00 | ||
| Total Operating Expenses | $160,780 | $0.39 | ||
| Net Operating Income | $5,198,531 | $12.46 | ||
| TI/LC | 412,305 | 0.99 | ||
| Replacement Reserves | 83,463 | 0.20 | ||
| Net Cash Flow | $4,702,763 | $11.27 | ||
| Occupancy | 95.0% | |||
| NOI Debt Yield(5) | 10.2% | |||
| NCF DSCR(5) | 1.33x |
| (1) | Certain items such as interest expense, interest income, amortization expense, depreciation expense and any other non-recurring or non-operating items are not considered for the underwritten cash flow. |
| (2) | Historical financial information was not provided. The Axcelis lease is a triple net lease. |
| (3) | Gross Potential Rent has been underwritten based on the Axcelis lease as of March 1, 2018. The lease provides for 2.0% escalations annually until January 2025, when base rent decreases by 11.0% from $14.90 per SF to $14.04 per SF. The base rent then continues to increase by 2.0% annually through expiration. |
| (4) | The Underwritten Management Fee is based on the appraisal conclusion of market management fee, and assumed to be reimbursed pursuant to the Axcelis lease. The Axcelis Corporate Center Property is currently self-managed by Axcelis. |
| (5) | Calculated based on the aggregate outstanding principal balance as of the Cut-off Date of the Axcelis Corporate Center Loan Combination. |
| ■ | Appraisal. According to the appraisal, the Axcelis Corporate Center Property had an “as-is” appraised value of $82,100,000 as of November 16, 2017. |
The depositor has filed a registration statement (including a prospectus) with the Securities and Exchange Commission (“SEC”) (SEC File No. 333-207132) for the offering to which this communication relates. Before you invest, you should read the prospectus in the registration statement and other documents the depositor has filed with the SEC for more complete information about the depositor, the issuing entity and this offering. You may get these documents for free by visiting EDGAR on the SEC website at www.sec.gov. Alternatively, the depositor or Citigroup Global Markets Inc., Morgan Stanley & Co. LLC, Merrill Lynch, Pierce, Fenner & Smith Incorporated, Drexel Hamilton, LLC, The Williams Capital Group, L.P. or any other underwriter or dealer participating in this offering will arrange to send you the prospectus if you request it by calling toll-free 1-800-831-9146.
126
LOAN #10: axcelis corporate center
| ■ | Environmental Matters. Based on the Phase I environmental report dated November 28, 2017, there were no recognized environmental conditions or recommendations for further action related to the Axcelis Corporate Center Property. However, the Phase I noted a number of environmental concerns, including but not limited to (i) that Axcelis’ manufacturing processes involve the use of various grades of machine oils, laboratory chemicals, adhesives, aqueous cleaners and alcohols, and such tenant is a Resource Conservation and Recovery Act (“RCRA”) small quantity generator of D-, F-, and U-coded hazardous wastes, and waste oils, (ii) a wastewater treatment facility is operated onsite at the Mortgaged Property, with the wastewater permit treatment facility classified as a “significant industrial user” with a categorical status of “metal finishing point source category subpart A”, (iii) since 1985, on-site operations have included the manufacture of equipment used in the semiconductor industry, and the Axcelis Corporate Center Property has been identified as a RCRA hazardous waste generator since 1985, with arsenic-containing waste comprising the majority of hazardous wastes produced and (iv) the presence of above-ground storage tanks used to contain diesel fluid and liquefied oxygen and nitrogen. The borrower has purchased two pollution liability policies for the insured site (one for five years that provides coverage for operational/new conditions, and one for ten years that provides historical conditions coverage), with the borrower as the named insured, from Indian Harbor Insurance Company, rated A+ by S&P. The two policies together share a $10,000,000 limit per pollution condition and in the aggregate, and each policy has a $250,000 self insured retention. The five year policy expires on January 30, 2020, and the ten year policy expires on January 30, 2025. The Mortgage Loan documents require the borrower to obtain and maintain environmental liability insurance providing coverage equal to or superior to the coverage provided pursuant to such policies. |
| ■ | Market Overview and Competition. The Axcelis Corporate Center Property is located in the 128 North flex/high technology submarket of Boston, Massachusetts, according to the appraisal. According to the appraisal, for the third quarter of 2017, the Boston flex/high technology market contained 20,299,558 SF of flex/high technology space, with a vacancy of 4.9% and effective rent of $9.43 per SF. According to the appraisal, for the third quarter of 2017, the 128 North flex/high technology submarket contained 2,321,763 SF of flex/high technology space, with a vacancy of 3.2% and effective rent of $13.74 per SF. |
The Axcelis Corporate Center Property is located in Cherry Hill Corporate Park, a 17-building business park that is 20 miles northeast of Boston. The estimated 2017 population within a one-, three- and five-mile radius of the Axcelis Corporate Center Property is 7,236, 64,723 and 158,685, respectively, according to a third party report. The estimated 2017 average household income within a one-, three- and five-mile radius of the Axcelis Corporate Center Property is $101,419, $101,350 and $96,746, respectively, according to a third party report.
The following table presents certain information relating to recent industrial leasing activity in the Axcelis Corporate Center Property’s market:
Industrial Lease Comparables(1)
Property Name | Property Location | Tenant Name | Percent | Lease | GLA | Lease | Initial | Rent Steps (per Year) | Lease Type | |||||||||
| Axcelis Corporate Center | Beverly, MA | Axcelis Technologies, Inc | 29.0% | Jan. 2015 | 417,313 | 22 | $13.13(2) | 2.00%(3) | Triple Net | |||||||||
| 9 Forge Parkway | Franklin, MA | Tegra CTW | 35.0% | May. 2017 | 81,293 | 10 | $10.00 | 3.00% | Net | |||||||||
| Building 32 | Burlington, MA | Averdo | 30.0% | Jan. 2017 | 60,732 | 5 | $12.00 | $0.25 | Net | |||||||||
| 35 Cherry Hill Drive | Danvers, MA | Medtronic | 50.0% | Nov. 2016 | 77,212 | 5 | $12.36 | 3.00% | Net | |||||||||
| 575 University Avenue | Norwood, MA | Coram CVS | 50.0% | Aug. 2016 | 88,379 | 10 | $10.45 | $0.30 | Net | |||||||||
| 5 Omni Way | Chelmsford, MA | Comcast | 80.0% | Feb. 2016 | 131,430 | 13 | $16.25 | $0.50 | Net | |||||||||
| 23 Frontage Road | Andover, MA | Morpho Detection | 50.0% | Sep. 2014 | 64,200 | 10 | $11.50 | 2.75% | Net |
| (1) | Source: Appraisal. |
| (2) | Axcelis Corporate Center Initial Rent per SF reflects current base rent. |
| (3) | The Axcelis Corporate Center lease provides for 2.0% escalations annually until January 2025, when base rent decreases by 11.0% from $14.90 per SF to $14.04 per SF. The base rent then continues to increase by 2.0% annually through expiration. |
| ■ | The Borrower. The borrower is Beverly Property Owner LLC, a special purpose Delaware limited liability company structured to be bankruptcy remote, with two independent directors in its borrower structure. Legal counsel to the borrower delivered a non-consolidation opinion in connection with the origination of the Axcelis Corporate Center Loan Combination. The borrower sponsors are Mitchel Greenberg, Peter Holstein, Keith Jaffee and Middleton Partners LLC. The non-recourse carveout guarantors for the Axcelis Corporate Center Loan Combination are Mitchel Greenberg, Peter Holstein and Keith Jaffee, jointly and severally (together, the “Axcelis Corporate Center Non-Recourse Carveout Guarantors”). |
The depositor has filed a registration statement (including a prospectus) with the Securities and Exchange Commission (“SEC”) (SEC File No. 333-207132) for the offering to which this communication relates. Before you invest, you should read the prospectus in the registration statement and other documents the depositor has filed with the SEC for more complete information about the depositor, the issuing entity and this offering. You may get these documents for free by visiting EDGAR on the SEC website at www.sec.gov. Alternatively, the depositor or Citigroup Global Markets Inc., Morgan Stanley & Co. LLC, Merrill Lynch, Pierce, Fenner & Smith Incorporated, Drexel Hamilton, LLC, The Williams Capital Group, L.P. or any other underwriter or dealer participating in this offering will arrange to send you the prospectus if you request it by calling toll-free 1-800-831-9146.
127
LOAN #10: axcelis corporate center
The Axcelis Corporate Center Non-Recourse Carveout Guarantors own 50.0% of the borrower through family trusts and affiliated entities. The other 50.0% of the borrower is owned by individual investors. No individual investor has more than a 7.0% interest in the borrower. Middleton Partners LLC is a private real estate investment company, which serves as the platform for the investment activities of Mitchel Greenberg, Keith Jaffee and Peter Holstein.
| ■ | Escrows. The borrower’s obligation to fund reserves for real estate taxes and insurance is waived so long as the borrower provides the lender with evidence that Axcelis is obligated under the terms of its lease to pay all real estate taxes and insurance premiums under its lease and has in fact paid such taxes and insurance premiums prior to the date on which they are due. If the applicable conditions are not satisfied, the borrower will be required to fund: (i) a tax reserve in an amount equal to one-twelfth of the amount that the lender estimates will be necessary to pay taxes over the then succeeding 12-month period and/or (ii) an insurance reserve in an amount equal to one-twelfth of the amount that the lender estimates will be necessary to pay insurance premiums for the renewal of the coverage under the insurance policies, provided that the monthly insurance reserve deposit is waived if the borrower is maintaining blanket insurance policies in accordance with the Axcelis Corporate Center Loan Combination documents. |
Additionally, Axcelis delivered a $5,900,000 letter of credit to the borrower as a security deposit, which may be drawn upon by the lender, to the extent a draw is permitted under the terms of the Axcelis lease, following an event of default under both the lease and the Axcelis Corporate Center Loan Combination. The lender may apply the proceeds of such a draw, solely to the extent of the amount recoverable by the borrower as a result of the tenant’s default, for any purpose. If there is a lease default but no loan default, the lender is required to draw on the letter of credit, to the extent a draw is permitted under the lease, if directed by the borrower, and apply the proceeds for purposes specified in an agreement between the borrower and the lender, which purposes include but are not limited to, to pay principal and interest under the Axcelis Corporate Center Loan Combination, to be deposited into a rollover reserve or to reimburse the borrower for curing an event of default under the lease. The Axcelis lease permits the security deposit to be applied to compensate the landlord in respect of the payment of overdue and unpaid rent or the cost of the damage actually incurred by the landlord due to an event of default under the lease. The landlord is required to return the security deposit to Axcelis if Axcelis becomes rated at least Baa3/BBB- by any two of Moody’s Investors Service, Inc., Standard & Poor’s Financial Services LLC and/or Fitch Ratings, Inc.
| ■ | Lockbox and Cash Management. The Axcelis Corporate Center Loan Combination is structured with a hard lockbox with springing cash management.TheAxcelis Corporate CenterLoan Combination documents require the borrower to direct tenants to pay rent directly to a lender-controlled lockbox account and require that all other money received by the borrower or property manager with respect to theAxcelis Corporate CenterProperty be deposited into such lockbox account within one business day following receipt. If no Axcelis Corporate Center Cash Sweep Event Period (as defined below) is continuing, all funds in the lockbox account are required to be swept into the borrower’s operating account. Upon the first occurrence of an Axcelis Corporate Center Cash Sweep Event Period (as defined below), the lender is required to establish, and the borrower is required to cooperate with the cash management bankto establish, a lender controlled cash management account. During the continuance of an Axcelis Corporate Center Cash Sweep Event Period, all cash flow is required to be swept from the lockbox account into such lender-controlled cash management account and applied in accordance with the Axcelis Corporate Center Loan Combination documents to make deposits into reserve funds, as described under“—Escrows” above, to pay debt service on the Axcelis Corporate Center Loan Combination; in the case of an Axcelis Corporate Center Cash Sweep Event Period under clause (ii), (iii) or (iv) of the definition thereof, to pay approved operating expenses in accordance with the approved annual budget and extraordinary expenses approved by the lender, and to deposit the remainder into a cash sweep account to be held as additional collateral for the Axcelis Corporate Center Loan Combination during the continuance of such Axcelis Corporate Center Cash Sweep Event Period. |
An “Axcelis Corporate Center Cash Sweep Event Period”means the period:
| (i) | commencing upon the occurrence of an event of default under the Axcelis Corporate Center Loan Combination documents and ending upon the acceptance by the lender in its sole discretion of a cure of such event of default; or |
| (ii) | commencing upon the debt service coverage ratio of the Axcelis Corporate Center Loan Combination falling below 1.15x for the immediately preceding six consecutive calendar months based on the trailing six months operating statements and rent rolls and ending upon the debt service coverage ratio being equal to or greater than 1.15x for the immediately preceding six calendar months based on the trailing six months operating statements and rent rolls; or |
The depositor has filed a registration statement (including a prospectus) with the Securities and Exchange Commission (“SEC”) (SEC File No. 333-207132) for the offering to which this communication relates. Before you invest, you should read the prospectus in the registration statement and other documents the depositor has filed with the SEC for more complete information about the depositor, the issuing entity and this offering. You may get these documents for free by visiting EDGAR on the SEC website at www.sec.gov. Alternatively, the depositor or Citigroup Global Markets Inc., Morgan Stanley & Co. LLC, Merrill Lynch, Pierce, Fenner & Smith Incorporated, Drexel Hamilton, LLC, The Williams Capital Group, L.P. or any other underwriter or dealer participating in this offering will arrange to send you the prospectus if you request it by calling toll-free 1-800-831-9146.
128
LOAN #10: axcelis corporate center
| (iii) | commencing upon a Major Underwritten Tenant (as defined below) terminating or cancelling its lease (including, without limitation, any rejection of its lease in a bankruptcy or similar proceeding) or a Major Underwritten Tenant filing for bankruptcy or becoming involved in an insolvency proceeding, and ending upon either (x) such Major Underwritten Tenant’s lease having been affirmed in bankruptcy and such Major Underwritten Tenant being in occupancy of the entirety of its space, open for business and paying full contractual rent, or (y) the entirety of such Major Underwritten Tenant’s space having been re-let to one or more replacement tenant(s) pursuant to replacement lease(s), which replacement tenant(s) and lease(s) are acceptable to the lender, and the borrower delivering a reasonably acceptable tenant estoppel certificate(s) from each such replacement tenant(s) stating that such replacement tenant(s) is/are in occupancy of the entirety of such Major Underwritten Tenant’s space, open for business and either paying full contractual rent or the lender has received sufficient amounts to escrow for the same (an “Axcelis Corporate Center Replacement Tenant Cure”); or |
| (iv) | commencing upon (A) any Major Underwritten Tenant’s lease terminating or failing to be in full force and effect for any reason, (B) any Major Underwritten Tenant going dark, vacating or otherwise failing to occupy its premises, or failing to be open for business during customary hours, (C) any Major Underwritten Tenant giving a termination notice or notice to vacate under its lease for all or any portion of its premises or (D) one year prior to the stated expiration date of any Major Underwritten Tenant’s lease unless it has been renewed or extended in accordance with its terms or on other terms acceptable to the lender and in all events in compliance with the requirements of the Axcelis Corporate Center Loan Combination loan agreement and ending upon either (x) such Major Underwritten Tenant being open for business either pursuant to its lease or pursuant to a replacement lease acceptable to the lender, as evidenced by a reasonably acceptable tenant estoppel certificate stating that such Major Underwritten Tenant is in occupancy of the entirety of such Major Underwritten Tenant’s space, open for business and paying full contractual rent or (y) an Axcelis Corporate Center Replacement Tenant Cure. |
A “Major Underwritten Tenant” means Axcelis or any replacement tenant which occupies all or a portion of the Axcelis space which was approved by the lender.
| ■ | Property Management. The Axcelis Corporate Center Property is self-managed by Axcelis. Upon the occurrence of any one or more of the following events the lender has the right to require the borrower to appoint a property manager (or if a property manager is then appointed, to replace the property manager), in each case with a new property manager that is an unaffiliated Qualified Manager (as defined below) chosen by the borrower and reasonably approved by the lender: (a) an event of default under the Axcelis Corporate Center Loan Combination is continuing, (b) the property manager (I) being insolvent or a debtor in a bankruptcy proceeding or (II) having engaged in gross negligence, fraud or willful misconduct, (c) an event of default by the property manager occurring under the related management agreement (subject to any applicable grace periods) or (d) the debt service coverage ratio of the Axcelis Corporate Center Loan Combination falling below 1.10x. |
A “Qualified Manager” means a manager that is a reputable and experienced professional management organization reasonably approved by the lender (which may be conditioned on a rating agency confirmation). The borrower may not replace the property manager without the consent of the lender, which may not be unreasonably withheld (and may be conditioned upon receipt of a rating agency confirmation).
| ■ | Mezzanine or Secured Subordinate Indebtedness. Not permitted. |
| ■ | Release of Collateral.Not permitted. |
The depositor has filed a registration statement (including a prospectus) with the Securities and Exchange Commission (“SEC”) (SEC File No. 333-207132) for the offering to which this communication relates. Before you invest, you should read the prospectus in the registration statement and other documents the depositor has filed with the SEC for more complete information about the depositor, the issuing entity and this offering. You may get these documents for free by visiting EDGAR on the SEC website at www.sec.gov. Alternatively, the depositor or Citigroup Global Markets Inc., Morgan Stanley & Co. LLC, Merrill Lynch, Pierce, Fenner & Smith Incorporated, Drexel Hamilton, LLC, The Williams Capital Group, L.P. or any other underwriter or dealer participating in this offering will arrange to send you the prospectus if you request it by calling toll-free 1-800-831-9146.
129
LOAN #10: axcelis corporate center
| ■ | Terrorism Insurance. The borrower is required to maintain an “all-risk” insurance policy (with a deductible that is acceptable to the lender and is no greater than $25,000) that provides coverage for terrorism in an amount equal to 100% of the full replacement cost of the Axcelis Corporate Center Property, plus a business interruption insurance policy that provides 18 months of business interruption coverage with an additional 12-month extended period of indemnity; provided that if the policies contain an exclusion for loss or damage incurred as a result of an act of terrorism or similar acts of sabotage, the borrower is required to maintain separate insurance against such loss or damage provided such insurance is commercially available. For so long as TRIPRA is in effect and continues to cover both domestic and foreign acts of terrorism, the lender is required to accept terrorism insurance coverage which covers against “covered acts” as defined by TRIPRA. See“Risk Factors—Terrorism Insurance May Not Be Available for All Mortgaged Properties” in the Preliminary Prospectus. |
The depositor has filed a registration statement (including a prospectus) with the Securities and Exchange Commission (“SEC”) (SEC File No. 333-207132) for the offering to which this communication relates. Before you invest, you should read the prospectus in the registration statement and other documents the depositor has filed with the SEC for more complete information about the depositor, the issuing entity and this offering. You may get these documents for free by visiting EDGAR on the SEC website at www.sec.gov. Alternatively, the depositor or Citigroup Global Markets Inc., Morgan Stanley & Co. LLC, Merrill Lynch, Pierce, Fenner & Smith Incorporated, Drexel Hamilton, LLC, The Williams Capital Group, L.P. or any other underwriter or dealer participating in this offering will arrange to send you the prospectus if you request it by calling toll-free 1-800-831-9146.
130
(THIS PAGE INTENTIONALLY LEFT BLANK)
The depositor has filed a registration statement (including a prospectus) with the Securities and Exchange Commission (“SEC”) (SEC File No. 333-207132) for the offering to which this communication relates. Before you invest, you should read the prospectus in the registration statement and other documents the depositor has filed with the SEC for more complete information about the depositor, the issuing entity and this offering. You may get these documents for free by visiting EDGAR on the SEC website at www.sec.gov. Alternatively, the depositor or Citigroup Global Markets Inc., Morgan Stanley & Co. LLC, Merrill Lynch, Pierce, Fenner & Smith Incorporated, Drexel Hamilton, LLC, The Williams Capital Group, L.P. or any other underwriter or dealer participating in this offering will arrange to send you the prospectus if you request it by calling toll-free 1-800-831-9146.
131
LOAN #11: One newark center
| Mortgaged Property Information | Mortgage Loan Information | ||||
| Number of Mortgaged Properties | 1 | Loan Seller | MSMCH | ||
| Location (City/State) | Newark, New Jersey | Cut-off Date Balance(3) | $32,000,000 | ||
| Property Type | Office | Cut-off Date Balance per SF(2) | $159.31 | ||
| Size (SF) | 417,939 | Percentage of Initial Pool Balance | 3.0% | ||
| Total Occupancy as of 11/1/2017 | 90.0% | Number of Related Mortgage Loans | None | ||
| Owned Occupancy as of 11/1/2017 | 90.0% | Type of Security(4) | Fee Simple | ||
| Year Built / Latest Renovation | 1992 / NAP | Mortgage Rate | 4.25000% | ||
| Appraised Value | $94,000,000 | Original Term to Maturity (Months) | 120 | ||
| Appraisal Date | 10/10/2017 | Original Amortization Term (Months) | 360 | ||
| Borrower Sponsor(1) | Beijing Ideal Group | Original Interest Only Period (Months) | 36 | ||
| Property Management | CBRE, Inc. | First Payment Date | 1/1/2018 | ||
| Maturity Date | 12/1/2027 | ||||
| Underwritten Revenues | $14,737,974 | ||||
| Underwritten Expenses | $7,203,226 | Escrows | |||
| Underwritten Net Operating Income (NOI) | $7,534,747 | Upfront | Monthly | ||
| Underwritten Net Cash Flow (NCF) | $5,985,388 | Taxes | $388,733 | $194,366 | |
| Cut-off Date LTV Ratio(2) | 70.8% | Insurance | $44,763 | $22,319 | |
| Maturity Date LTV Ratio(2) | 61.6% | Replacement Reserve | $0 | $14,247 | |
| DSCR Based on Underwritten NOI / NCF(2) | 1.92x / 1.52x | TI/LC(5) | $2,850,000 | $104,485 | |
| Debt Yield Based on Underwritten NOI / NCF(2) | 11.3% / 9.0% | Other(6) | $1,157,258 | $0 | |
| Sources and Uses | ||||||||
| Sources | $ | % | Uses | $ | % | |||
| Loan Combination Amount | $66,580,000 | 65.8 | % | Purchase Price(7) | $93,900,000 | 92.9 | % | |
| Principal’s New Cash Contribution | 34,532,834 | 34.2 | Reserves | 4,440,755 | 4.4 | |||
| Closing Costs | 2,772,079 | 2.7 | ||||||
| Total Sources | $101,112,834 | 100.0 | % | Total Uses | $101,112,834 | 100.0 | % | |
| (1) | There is no non-recourse carveout guarantor or separate environmental indemnitor with respect to the One Newark Center Loan Combination (as defined below). The owners of the borrower are individuals and entities domiciled in the People’s Republic of China. See“Description of the Mortgage Pool—Non-Recourse Carveout Limitations” in the Preliminary Prospectus. |
| (2) | Calculated based on the aggregate outstanding principal balance as of the Cut-off Date of the One Newark Center Loan Combination. |
| (3) | The Cut-off Date Balance of $32,000,000 represents the non-controlling note A-1 of a loan combination (the “One Newark Center Loan Combination”), evidenced by threepari passu notes having an aggregate outstanding principal balance as of the Cut-off Date of $66,580,000. The related companion loans are evidenced by the controlling note A-2 and the non-controlling note A-3, which have an aggregate outstanding principal balance as of the Cut-off Date of $34,580,000 and have been contributed to the BANK 2018-BNK10 securitization transaction. |
| (4) | The One Newark Center Property consists of a fee on a plane interest comprised of floors six to 22 (417,939 square feet) of a 22 floor office building and a 953 space, 10-story parking garage that is next door to, and attached to, the office building. The land underneath the office building, and floors one through five, are owned by a third party. See “Description of the Mortgage Pool—Condominium Interests” in the Preliminary Prospectus. |
| (5) | The TI/LC reserve has a cap of $3,800,000. |
| (6) | Upfront Other Reserves includes reserves for outstanding TI/LC funds ($579,656), free rent funds ($549,852) and a deferred maintenance reserve ($27,750). |
| (7) | In connection with the purchase of the One Newark Center Property, a prior securitized loan made to the previous owner of the One Newark Center Property was repaid at a discount, resulting in the cancellation of a $9,700,000 “hope note” without repayment. See “Description of the Mortgage Pool—Default History, Bankruptcy Issues and Other Proceedings” in the Preliminary Prospectus. |
The depositor has filed a registration statement (including a prospectus) with the Securities and Exchange Commission (“SEC”) (SEC File No. 333-207132) for the offering to which this communication relates. Before you invest, you should read the prospectus in the registration statement and other documents the depositor has filed with the SEC for more complete information about the depositor, the issuing entity and this offering. You may get these documents for free by visiting EDGAR on the SEC website at www.sec.gov. Alternatively, the depositor or Citigroup Global Markets Inc., Morgan Stanley & Co. LLC, Merrill Lynch, Pierce, Fenner & Smith Incorporated, Drexel Hamilton, LLC, The Williams Capital Group, L.P. or any other underwriter or dealer participating in this offering will arrange to send you the prospectus if you request it by calling toll-free 1-800-831-9146.
132
LOAN #11: One newark center
The following table presents certain information relating to the major tenants at the One Newark Center Property:
Ten Largest Owned Tenants Based on Underwritten Base Rent(1)
| Tenant Name | Credit Rating (Fitch/MIS/S&P)(2) | Tenant GLA | % of Owned GLA | UW Base Rent | % of Total UW Base Rent | UW Base Rent $ per SF | Lease Expiration | Renewal / Extensions Options | |||||||||||||
| K&L Gates, LLP | NR / NR / NR | 52,148 | 12.5 | % | $1,825,180 | 15.1 | % | $35.00 | 1/31/2022 | 2, 5-year options | |||||||||||
| GSA IRS(3) | AAA / Aaa / AA+ | 45,075 | 10.8 | 1,476,986 | 12.2 | 32.77 | 12/29/2019 | NA | |||||||||||||
| GSA HUD(4) | AAA / Aaa / AA+ | 49,698 | 11.9 | 1,391,959 | 11.5 | 33.50 | 4/21/2018 | NA | |||||||||||||
| Level 3 Communications | BB- / B1 / NR- | 33,485 | 8.0 | 1,255,688 | 10.4 | 37.50 | 4/30/2020 | 1, 5-year option | |||||||||||||
| International Fidelity Insurance | NR / NR / NR | 23,709 | 5.7 | 948,360 | 7.8 | 40.00 | 8/31/2020 | 1, 5-year option | |||||||||||||
| Proskauer Rose, LLP | NR / NR / NR | 26,074 | 6.2 | 860,442 | 7.1 | 33.00 | 1/31/2020 | 1, 5-year option | |||||||||||||
| Littler Mendelson, P.C | NR / NR / NR | 24,369 | 5.8 | 816,362 | 6.7 | 33.50 | 1/31/2023 | 1, 5-year option | |||||||||||||
| Sedgwick, LLP(5) | NR / NR / NR | 26,074 | 6.2 | 638,268 | 5.3 | 24.48 | 7/31/2025 | 1, 5-year option | |||||||||||||
| Yang Ming(6) | NR / NR / NR | 19,306 | 4.6 | 627,445 | 5.2 | 32.50 | 4/30/2026 | 1, 5-year option | |||||||||||||
| North Jersey Transportation Plan | NR / NR / NR | 18,662 | 4.5 | 578,522 | 4.8 | 31.00 | 12/31/2027 | 1, 5-year option | |||||||||||||
| Ten Largest Owned Tenants | 318,600 | 76.2 | % | $10,419,211 | 86.0 | % | $33.56 | ||||||||||||||
| Remaining Tenants(7) | 57,353 | 13.7 | 1,699,147 | 14.0 | 32.42 | ||||||||||||||||
| Vacant Spaces | 41,986 | 10.0 | 0 | 0.0 | 0.00 | ||||||||||||||||
| Total / Wtd. Avg. All Owned Tenants(7) | 417,939 | 100.0 | % | $12,118,358 | 100.0 | % | $33.40 | ||||||||||||||
| (1) | Based on the underwritten rent roll dated November 1, 2017. |
| (2) | Certain ratings are those of the parent company or the U.S. federal government, whether or not the parent or the U.S. federal government, as applicable, guarantees the lease. |
| (3) | GSA IRS may terminate its lease at any time on or after April 29, 2019, upon 120 days written notice. |
| (4) | GSA HUD Tenant GLA includes 8,143 SF associated with exterior corridor spaces used by GSA HUD to allow the public to get from one area of the space to another. This space (8,143 SF) was excluded from all UW Base Rent $ per SF calculations. |
| (5) | Sedgewick, LLP is occupying its space under a sublease from Tanenbaum Keale LLP. Each of the sublessor and sublessee has the right to terminate the sublease upon written notice on or before July 31, 2018. The space has been underwritten based on the sublease rent, which is lower than the prime lease rent of $31.00 per SF. |
| (6) | Yang Ming has three months of free rent from June through August 2018, which has been reserved for. |
| (7) | Remaining Tenants and Total / Wtd. Avg. All Owned Tenants UW Base Rent and UW Base Rent $ per SF do not include 8,143 SF of GSA HUD space and 4,947 SF of café space for which there is no rent attributed. |
The following table presents certain information relating to the lease rollover schedule at the One Newark Center Property, based on initial lease expiration dates:
Lease Expiration Schedule(1)(2)
| Year Ending December 31 | Expiring Owned GLA | % of Owned GLA | Cumulative % of Owned GLA | UW Base Rent | % of Total UW Base Rent | UW Base Rent $ per SF(3) | # of Expiring Tenants | ||||||||||||||
| MTM | 0 | 0.0 | % | 0.0 | % | $0 | 0.0 | % | $0.00 | 0 | |||||||||||
| 2018(3) | 49,698 | 11.9 | 11.9 | % | 1,391,959 | 11.5 | $33.50 | 1 | |||||||||||||
| 2019 | 62,152 | 14.9 | 26.8 | % | 2,028,840 | 16.7 | $32.64 | 4 | |||||||||||||
| 2020 | 97,190 | 23.3 | 50.0 | % | 3,522,186 | 29.1 | $36.24 | 4 | |||||||||||||
| 2021 | 0 | 0.0 | 50.0 | % | 0 | 0.0 | $0.00 | 0 | |||||||||||||
| 2022 | 54,555 | 13.1 | 63.1 | % | 1,900,100 | 15.7 | $34.83 | 3 | |||||||||||||
| 2023 | 31,299 | 7.5 | 70.6 | % | 1,049,625 | 8.7 | $33.54 | 2 | |||||||||||||
| 2024 | 0 | 0.0 | 70.6 | % | 0 | 0.0 | $0.00 | 0 | |||||||||||||
| 2025 | 26,074 | 6.2 | 76.8 | % | 638,268 | 5.3 | $24.48 | 1 | |||||||||||||
| 2026 | 31,376 | 7.5 | 84.3 | % | 1,008,857 | 8.3 | $32.15 | 2 | |||||||||||||
| 2027 | 18,662 | 4.5 | 88.8 | % | 578,522 | 4.8 | $31.00 | 1 | |||||||||||||
| 2028 & Thereafter(4) | 4,947 | 1.2 | 90.0 | % | 0 | 0.0 | $0.00 | 1 | |||||||||||||
| Vacant | 41,986 | 10.0 | 100.0 | % | 0 | 0.0 | $0.00 | 0 | |||||||||||||
| Total / Wtd. Avg. | 417,939 | 100.0 | % | $12,118,358 | 100.0 | % | $33.40 | 19 | |||||||||||||
| (1) | Calculated based on the approximate square footage occupied by each owned tenant. |
| (2) | Certain tenants may have lease termination options that are exercisable prior to the originally stated expiration date of the subject lease and that are not considered in the Lease Expiration Schedule. |
| (3) | 2018 Expiring Owned GLA includes 8,143 SF associated with exterior corridor space used by GSA HUD to allow the public to get from one area of the space to another. This space (8,143 SF) was excluded from all UW Base Rent $ per SF calculations. |
| (4) | 2028 & Thereafter has no UW Base Rent because it is comprised of 4,947 SF of café space for which there is no rent attributed. 2028 & Thereafter and Total/Wtd. Avg. UW Base Rent $ per SF exclude the square footage associated with the café space. |
The depositor has filed a registration statement (including a prospectus) with the Securities and Exchange Commission (“SEC”) (SEC File No. 333-207132) for the offering to which this communication relates. Before you invest, you should read the prospectus in the registration statement and other documents the depositor has filed with the SEC for more complete information about the depositor, the issuing entity and this offering. You may get these documents for free by visiting EDGAR on the SEC website at www.sec.gov. Alternatively, the depositor or Citigroup Global Markets Inc., Morgan Stanley & Co. LLC, Merrill Lynch, Pierce, Fenner & Smith Incorporated, Drexel Hamilton, LLC, The Williams Capital Group, L.P. or any other underwriter or dealer participating in this offering will arrange to send you the prospectus if you request it by calling toll-free 1-800-831-9146.
133
LOAN #11: One newark center
The following table presents certain information relating to historical leasing at the One Newark Center Property:
Historical Leased %(1)
| 2013 | 2014 | 2015 | 2016 | As of 11/1/2017(2) | ||||||
| Owned Space | 94.7% | 86.1% | 89.4% | 95.3% | 90.0% |
| (1) | As provided by the borrower and which represents occupancy as of December 31 for the indicated year unless otherwise specified. |
| (2) | Based on the underwritten rent roll dated November 1, 2017. |
| ■ | Operating History and Underwritten Net Cash Flow. The following table presents certain information relating to the historical operating performance and the Underwritten Net Cash Flow at the One Newark Center Property: |
Cash Flow Analysis(1)
2013 | 2014 | 2015 | 2016 | TTM 9/30/2017 | Underwritten | Underwritten | |||||||||||||||
| Gross Potential Rent(2) | $12,808,615 | $11,122,793 | $11,023,808 | $11,531,821 | $11,253,373 | $13,569,825 | $32.47 | ||||||||||||||
| Reimbursements | 1,792,869 | 1,234,851 | 1,364,496 | 1,039,129 | 984,628 | 1,213,173 | 2.90 | ||||||||||||||
| Other Income(3) | 1,255,176 | 1,418,838 | 1,545,354 | 1,613,028 | 1,237,197 | 1,427,000 | 3.41 | ||||||||||||||
| Vacancy & Credit Loss | 0 | 0 | 0 | 0 | 0 | (1,472,025) | (3.52) | ||||||||||||||
| Effective Gross Income | $15,856,660 | $13,776,482 | $13,933,658 | $14,183,978 | $13,475,198 | $14,737,974 | $35.26 | ||||||||||||||
| Real Estate Taxes | $3,248,350 | $2,253,920 | $2,934,736 | $3,037,993 | $2,693,441 | $2,332,397 | $5.58 | ||||||||||||||
| Insurance | 79,747 | 77,274 | 77,406 | 84,426 | 90,165 | 84,606 | 0.20 | ||||||||||||||
| Management Fee | 188,112 | 188,112 | 188,112 | 188,112 | 188,112 | 442,139 | 1.06 | ||||||||||||||
| Other Operating Expenses | 3,876,552 | 4,316,002 | 4,341,718 | 4,211,962 | 4,266,678 | 4,344,084 | 10.39 | ||||||||||||||
| Total Operating Expenses | $7,392,761 | $6,835,308 | $7,541,972 | $7,522,493 | $7,238,396 | $7,203,226 | $17.24 | ||||||||||||||
| Net Operating Income | $8,463,899 | $6,941,174 | $6,391,686 | $6,661,485 | $6,236,802(4) | $7,534,747(4) | $18.03 | ||||||||||||||
| TI/LC | 0 | 0 | 0 | 0 | 0 | 1,378,397 | 3.30 | ||||||||||||||
| Replacement Reserves | 0 | 0 | 0 | 0 | 0 | 170,963 | 0.41 | ||||||||||||||
| Net Cash Flow | $8,463,899 | $6,941,174 | $6,391,686 | $6,661,485 | $6,236,802 | $5,985,388 | $14.32 | ||||||||||||||
| Occupancy(5) | 94.7 | % | 86.1 | % | 89.4 | % | 95.3% | 90.0% | 89.3% | ||||||||||||
| NOI Debt Yield(6) | 12.7 | % | 10.4 | % | 9.6 | % | 10.0% | 9.4% | 11.3% | ||||||||||||
| NCF DSCR(6) | 2.15 | x | 1.77 | x | 1.63 | x | 1.69x | 1.59x | 1.52x | ||||||||||||
| (1) | Certain items such as interest expense, interest income, amortization expense, depreciation expense and any other non-recurring or non-operating items were excluded from the historical presentation and are not considered for the underwritten cash flow. |
| (2) | Gross Potential Rent has been underwritten based on the rent roll dated November 1, 2017 and includes contractual rent steps that have been underwritten through 11/1/2018 and total $169,672. |
| (3) | Other Income is primarily comprised of parking income and has been underwritten based on an estimate in the appraisal. |
| (4) | The increase in Underwritten Net Operating Income from TTM 9/30/2017 Net Operating Income can be attributed to an increase in reimbursements, which were underwritten based on the appraisal, lease expansions, free rent burnoff, and contractual rent increases. |
| (5) | TTM 9/30/2017 occupancy is as of November 1, 2017. Underwritten occupancy represents economic occupancy. |
| (6) | Calculated based on the aggregate outstanding principal balance as of the Cut-off Date of the One Newark Center Loan Combination. |
The depositor has filed a registration statement (including a prospectus) with the Securities and Exchange Commission (“SEC”) (SEC File No. 333-207132) for the offering to which this communication relates. Before you invest, you should read the prospectus in the registration statement and other documents the depositor has filed with the SEC for more complete information about the depositor, the issuing entity and this offering. You may get these documents for free by visiting EDGAR on the SEC website at www.sec.gov. Alternatively, the depositor or Citigroup Global Markets Inc., Morgan Stanley & Co. LLC, Merrill Lynch, Pierce, Fenner & Smith Incorporated, Drexel Hamilton, LLC, The Williams Capital Group, L.P. or any other underwriter or dealer participating in this offering will arrange to send you the prospectus if you request it by calling toll-free 1-800-831-9146.
134
(THIS PAGE INTENTIONALLY LEFT BLANK)
The depositor has filed a registration statement (including a prospectus) with the Securities and Exchange Commission (“SEC”) (SEC File No. 333-207132) for the offering to which this communication relates. Before you invest, you should read the prospectus in the registration statement and other documents the depositor has filed with the SEC for more complete information about the depositor, the issuing entity and this offering. You may get these documents for free by visiting EDGAR on the SEC website at www.sec.gov. Alternatively, the depositor or Citigroup Global Markets Inc., Morgan Stanley & Co. LLC, Merrill Lynch, Pierce, Fenner & Smith Incorporated, Drexel Hamilton, LLC, The Williams Capital Group, L.P. or any other underwriter or dealer participating in this offering will arrange to send you the prospectus if you request it by calling toll-free 1-800-831-9146.
135
LOAN #12:braddock metro center
| Mortgaged Property Information | Mortgage Loan Information | ||||||||||||
| Number of Mortgaged Properties | 1 | Loan Seller | CREFI | ||||||||||
| Location (City/State) | Alexandria, Virginia | Cut-off Date Balance(3) | $30,000,000 | ||||||||||
| Property Type | Office | Cut-off Date Balance per SF(2) | $235.12 | ||||||||||
| Size (SF) | 315,589 | Percentage of Initial Pool Balance | 2.8% | ||||||||||
| Total Occupancy as of 11/1/2017 | 92.4% | Number of Related Mortgage Loans | None | ||||||||||
| Owned Occupancy as of 11/1/2017 | 92.4% | Type of Security | Fee Simple | ||||||||||
| Year Built / Latest Renovation | 1986 / NAP | Mortgage Rate | 4.57000% | ||||||||||
| Appraised Value | $111,140,000 | Original Term to Maturity (Months) | 120 | ||||||||||
| Appraisal Date | 11/3/2017 | Original Amortization Term (Months) | 360 | ||||||||||
| Borrower Sponsor(1) | Kawa Capital Partners LLC | Original Interest Only Period (Months) | 60 | ||||||||||
| Property Management | Cushman & Wakefield U.S., Inc. | First Payment Date | 3/6/2018 | ||||||||||
| Maturity Date | 2/6/2028 | ||||||||||||
| Underwritten Revenues | $10,490,116 | ||||||||||||
| Underwritten Expenses | $3,420,015 | Escrows | |||||||||||
| Underwritten Net Operating Income (NOI) | $7,070,100 | Upfront | Monthly | ||||||||||
| Underwritten Net Cash Flow (NCF) | $6,760,253 | Taxes | $381,274 | $95,318 | |||||||||
| Cut-off Date LTV Ratio(2) | 66.8% | Insurance | $0 | $0 | |||||||||
| Maturity Date LTV Ratio(2) | 61.2% | Replacement Reserve | $0 | $6,049 | |||||||||
| DSCR Based on Underwritten NOI / NCF(2) | 1.55x / 1.49x | TI/LC | $0 | $19,724 | |||||||||
| Debt Yield Based on Underwritten NOI / NCF(2) | 9.5% / 9.1% | Other(4) | $27,805,730 | $0 | |||||||||
| Sources and Uses | |||||||||||||
| Sources | $ | % | Uses | $ | % | ||||||||
| Loan Combination Amount | $74,200,000 | 63.9% | Purchase Price | $87,000,000 | 75.0% | ||||||||
| Principal’s New Cash Contribution | 27,363,225 | 23.6 | Reserves | 28,187,004 | 24.3 | ||||||||
| Other Sources(5) | 14,483,219 | 12.5 | Closing Costs | 859,440 | 0.7 | ||||||||
| Total Sources | $116,046,444 | 100.0% | Total Uses | $116,046,444 | 100.0% | ||||||||
| (1) | The loan sponsor is Kawa Capital Partners LLC, while the two non-recourse carveout guarantors are Kawa Capital Partners LLC and Kawa Investments LLC. |
| (2) | Calculated based on the aggregate outstanding principal balance as of the Cut-off Date of the Braddock Metro Center Loan Combination (as defined below). |
| (3) | The Cut-off Date Balance of $30,000,000 represents the non-controlling note A-2 of a loan combination (“Braddock Metro Center Loan Combination”), which is evidenced by twopari passu notes, having an aggregate outstanding principal balance as of the Cut-off Date of $74,200,000. The related companion loan is evidenced by the controlling note A-1, which has an outstanding principal balance as of the Cut-off Date of $44,200,000 and has been contributed to the Benchmark 2018-B2 securitization transaction. |
| (4) | The Upfront Other Escrows consists of a $27,805,730 GSA (United States Department of Agriculture) (“USDA”) lease reserve which represents USDA gap rent, USDA tenant allowances, USDA improvement costs and USDA leasing commissions. |
| (5) | Other Sources consists of security deposits ($315,106), rents ($239,014), property taxes ($53,722), tenant inducements ($6,992,531) and a shell format cost ($6,930,119) that were credited to the purchaser on the date of the acquisition, net expenses ($45,136) and interest from deposits ($2,137). |
The following table presents certain information relating to the major tenants (of which certain tenants may have co-tenancy provisions) at the Braddock Metro Center Property:
Ten Largest Owned Tenants Based on Underwritten Base Rent(1)
Tenant Name | Credit Rating (Fitch/MIS/S&P)(2) | Tenant GLA | % of | UW Base Rent(3) | % of Total | UW Base Rent $ per SF(3) | Lease | ||||||||||||
| GSA (US Department of Agriculture) | NR / Aaa / AA+ | 131,000 | 41.5 | % | $3,930,000 | 40.1 | % | $30.00 | 5/31/2033 | ||||||||||
| Alexandria City School Board | NR / Aaa / AAA | 84,693 | 26.8 | % | 2,990,607 | 30.5 | 35.31 | 5/31/2029 | |||||||||||
| Close Up Foundation | NR / NR / NR | 13,594 | 4.3 | % | 487,243 | 5.0 | 35.84 | 12/31/2021 | |||||||||||
| Gifts in Kind International / Good360 | NR / NR / NR | 12,968 | 4.1 | % | 486,170 | 5.0 | 37.49 | 12/31/2021 | |||||||||||
| Phase2 Technology, LLC | NR / NR / NR | 11,348 | 3.6 | % | 418,628 | 4.3 | 36.89 | 12/31/2021 | |||||||||||
| Oak Grove Technologies, LLC | NR / NR / NR | 8,292 | 2.6 | % | 293,981 | 3.0 | 35.45 | 12/31/2019 | |||||||||||
| American Chamber of Commerce Executives | NR / NR / NR | 6,236 | 2.0 | % | 211,462 | 2.2 | 33.91 | 11/30/2023 | |||||||||||
| International Parking Institute, Inc. | NR / NR / NR | 4,103 | 1.3 | % | 126,994 | 1.3 | 30.95 | 1/31/2023 | |||||||||||
| World Hope International, Inc.(4) | NR / NR / NR | 3,888 | 1.2 | % | 131,967 | 1.3 | 33.94 | 4/30/2023 | |||||||||||
| National Society of Public Accountants | NR / NR / NR | 3,446 | 1.1 | % | 112,146 | 1.1 | 32.54 | 1 /31/2026 | |||||||||||
| Ten Largest Owned Tenants | 279,568 | 88.6 | % | $9,189,197 | 93.7 | % | $32.87 | ||||||||||||
| Other | 11,944 | 3.8 | 621,348 | 6.3 | 52.02 | ||||||||||||||
| Vacant | 24,077 | 7.6 | 0 | 0.0 | 0.00 | ||||||||||||||
| Total / Wtd. Avg. All Owned Tenants | 315,589 | 100.0 | % | $9,810,545 | 100.0 | % | $33.65 | ||||||||||||
| (1) | Based on the underwritten rent roll dated November 1, 2017. |
| (2) | Certain ratings are those of the parent company or the U.S. federal government whether or not the parent or the U.S. federal government, as applicable, guarantees the lease. |
| (3) | UW Base Rent and UW Base Rent $ per SF includes $509,949, which represents the present value of rent steps for credit tenants and $81,893 for contractual rent steps through September 2018 for other tenants. |
| (4) | World Hope International, Inc. has the right to terminate its lease on or after January 31, 2021 with 12 months’ notice and payment of a termination fee equal to the unamortized portion of any improvement costs, legal fees, rental abatement and leasing commissions amortized at 8% interest. |
The depositor has filed a registration statement (including a prospectus) with the Securities and Exchange Commission (“SEC”) (SEC File No. 333-207132) for the offering to which this communication relates. Before you invest, you should read the prospectus in the registration statement and other documents the depositor has filed with the SEC for more complete information about the depositor, the issuing entity and this offering. You may get these documents for free by visiting EDGAR on the SEC website at www.sec.gov. Alternatively, the depositor or Citigroup Global Markets Inc., Morgan Stanley & Co. LLC, Merrill Lynch, Pierce, Fenner & Smith Incorporated, Drexel Hamilton, LLC, The Williams Capital Group, L.P. or any other underwriter or dealer participating in this offering will arrange to send you the prospectus if you request it by calling toll-free 1-800-831-9146.
136
LOAN #12:braddock metro center
The following table presents certain information relating to the lease rollover schedule at the Braddock Metro Center Property, based on initial lease expiration dates:
Lease Expiration Schedule(1)(2)
Year Ending December 31 | Expiring Owned GLA | % of Owned GLA | Cumulative % of Owned GLA | UW Base Rent | % of Total UW Base Rent | UW Base Rent $ per SF(3) | # of Expiring Tenants | ||||||||||||||
| 2018 & MTM | 0 | 0.0 | % | 0.0 | % | $44,175 | 0.5 | % | $0.00 | 2 | |||||||||||
| 2019 | 11,557 | 3.7 | 3.7 | % | 412,028 | 4.2 | $35.65 | 3 | |||||||||||||
| 2020 | 0 | 0.0 | 3.7 | % | 18,241 | 0.2 | $0.00 | 1 | |||||||||||||
| 2021 | 40,966 | 13.0 | 16.6 | % | 1,568,889 | 16.0 | $38.30 | 6 | |||||||||||||
| 2022 | 1 | 0.0 | 16.6 | % | 79,574 | 0.8 | $79,573.71 | 1 | |||||||||||||
| 2023 | 14,227 | 4.5 | 21.2 | % | 470,423 | 4.8 | $33.07 | 3 | |||||||||||||
| 2024 | 5,622 | 1.8 | 22.9 | % | 184,463 | 1.9 | $32.81 | 1 | |||||||||||||
| 2025 | 0 | 0.0 | 22.9 | % | 0 | 0.0 | $0.00 | 0 | |||||||||||||
| 2026 | 3,446 | 1.1 | 24.0 | % | 112,146 | 1.1 | $32.54 | 1 | |||||||||||||
| 2027 | 0 | 0.0 | 24.0 | % | 0 | 0.0 | $0.00 | 0 | |||||||||||||
| 2028 | 0 | 0.0 | 24.0 | % | 0 | 0.0 | $0.00 | 0 | |||||||||||||
| 2029 & Beyond | 215,693 | 68.3 | 92.4 | % | 6,920,607 | 70.5 | $32.09 | 2 | |||||||||||||
| Vacant | 24,077 | 7.6 | 100.0 | % | NAP | NAP | $0.00 | 0 | |||||||||||||
| Total / Wtd. Avg. | 315,589 | 100.0 | % | $9,810,545 | 100.0 | % | $30.89 | 20 | |||||||||||||
| (1) | Calculated based on the approximate square footage occupied by each collateral tenant. |
| (2) | Certain tenants may have lease termination options that are exercisable prior to the originally stated expiration date of the subject lease and that are not considered in the Lease Expiration Schedule. |
| (3) | Wtd. Avg. UW Base Rent $ per SF excludes vacant space. |
The following table presents certain information relating to historical leasing at the Braddock Metro Center Property:
Historical Leased %(1)
2014 | 2015 | 2016 | As of 11/1/2017(2) | |||||
| Owned Space | 96.9% | 97.8% | 98.3% | 92.4% |
| (1) | As provided by the borrower and which represents occupancy as of December 31 for the indicated year unless otherwise specified. |
| (2) | Based on the underwritten rent roll dated November 1, 2017. |
The depositor has filed a registration statement (including a prospectus) with the Securities and Exchange Commission (“SEC”) (SEC File No. 333-207132) for the offering to which this communication relates. Before you invest, you should read the prospectus in the registration statement and other documents the depositor has filed with the SEC for more complete information about the depositor, the issuing entity and this offering. You may get these documents for free by visiting EDGAR on the SEC website at www.sec.gov. Alternatively, the depositor or Citigroup Global Markets Inc., Morgan Stanley & Co. LLC, Merrill Lynch, Pierce, Fenner & Smith Incorporated, Drexel Hamilton, LLC, The Williams Capital Group, L.P. or any other underwriter or dealer participating in this offering will arrange to send you the prospectus if you request it by calling toll-free 1-800-831-9146.
137
LOAN #12:braddock metro center
| ■ | Operating History and Underwritten Net Cash Flow. The following table presents certain information relating to the historical operating performance and the Underwritten Net Cash Flow at the Braddock Metro Center Property: |
Cash Flow Analysis(1)
2014 | 2015 | 2016 | TTM 10/31/2017 | Underwritten | Underwritten $ per SF | |||||||||||||
| Base Rent | $9,065,314 | $10,029,793 | $10,395,546 | $10,248,302 | $9,218,704 | $29.21 | ||||||||||||
| Contractual Rent Steps(2) | 0 | 0 | 0 | 0 | 591,841 | 1.88 | ||||||||||||
| Gross Up Vacancy | 0 | 0 | 0 | 0 | 794,541 | 2.52 | ||||||||||||
| Reimbursements | 134,411 | 70,650 | 180,131 | 220,780 | 99,938 | 0.32 | ||||||||||||
| Other Income(3) | 30,344 | 36,315 | 36,840 | 27,285 | 27,285 | 0.09 | ||||||||||||
| Vacancy & Credit Loss | (462,741 | ) | (525,989 | ) | (515,479 | ) | (454,134 | ) | (794,541 | ) | (2.52 | ) | ||||||
| EGI Before Other Income | $8,767,328 | 9,610,769 | $10,097,039 | $10,042,233 | $9,937,769 | $31.49 | ||||||||||||
| Parking | 436,611 | 462,062 | 486,192 | 544,918 | 544,918 | 1.73 | ||||||||||||
| Other Income 2 | 3,797 | 199 | 262 | 7,429 | 7,429 | 0.02 | ||||||||||||
| Effective Gross Income | $9,207,736 | $10,073,030 | $10,583,492 | $10,594,580 | $10,490,116 | $33.24 | ||||||||||||
| Real Estate Taxes | $820,245 | $847,088 | $881,300 | $957,038 | $963,786 | 3.05 | ||||||||||||
| Insurance | 37,735 | 41,052 | 49,224 | 52,314 | 160,835 | 0.51 | ||||||||||||
| Management Fee | 304,093 | 307,584 | 270,455 | 276,578 | 314,703 | 1.00 | ||||||||||||
| Other Operating Expenses | 2,118,448 | 2,099,339 | 2,080,813 | 1,913,175 | 1,980,691 | 6.28 | ||||||||||||
| Total Operating Expenses | $3,280,521 | $3,295,063 | $3,281,792 | $3,199,105 | $3,420,015 | $10.84 | ||||||||||||
| Net Operating Income | $5,927,215 | $6,777,967 | $7,301,701 | $7,395,475 | $7,070,100 | $22.40 | ||||||||||||
| TI/LC | 237,262 | 0.75 | ||||||||||||||||
| Replacement Reserves | 0 | 0 | 0 | 0 | 72,585 | 0.23 | ||||||||||||
| Net Cash Flow | $5,927,215 | $6,777,967 | $7,301,701 | $7,395,475 | $6,760,253 | $21.42 | ||||||||||||
| Occupancy | 96.9% | 97.8% | 98.3% | 92.4% | 92.6% | (4) | ||||||||||||
| NOI Debt Yield(5) | 8.0% | 9.1% | 9.8% | 10.0% | 9.5% | |||||||||||||
| NCF DSCR(5) | 1.30x | 1.49x | 1.61x | 1.63x | 1.97x | |||||||||||||
| (1) | Certain items such as interest expense, interest income, lease cancellation income, depreciation, amortization, debt service payments and any other non-recurring or non-operating items are not considered for the underwritten cash flow. |
| (2) | Contractual Rent Steps includes $509,949, which represents the present value of rent steps for credit tenants and $81,893 for contractual rent steps through September 2018 for other tenants. |
| (3) | Other Income includes direct tenant reimbursements for electric and overtime HVAC. |
| (4) | Represents an underwritten economic vacancy of 7.4%. |
| (5) | Calculated based on the aggregate outstanding principal balance as of the Cut-off Date of the Braddock Metro Center Loan Combination. |
The depositor has filed a registration statement (including a prospectus) with the Securities and Exchange Commission (“SEC”) (SEC File No. 333-207132) for the offering to which this communication relates. Before you invest, you should read the prospectus in the registration statement and other documents the depositor has filed with the SEC for more complete information about the depositor, the issuing entity and this offering. You may get these documents for free by visiting EDGAR on the SEC website at www.sec.gov. Alternatively, the depositor or Citigroup Global Markets Inc., Morgan Stanley & Co. LLC, Merrill Lynch, Pierce, Fenner & Smith Incorporated, Drexel Hamilton, LLC, The Williams Capital Group, L.P. or any other underwriter or dealer participating in this offering will arrange to send you the prospectus if you request it by calling toll-free 1-800-831-9146.
138
(THIS PAGE INTENTIONALLY LEFT BLANK)
The depositor has filed a registration statement (including a prospectus) with the Securities and Exchange Commission (“SEC”) (SEC File No. 333-207132) for the offering to which this communication relates. Before you invest, you should read the prospectus in the registration statement and other documents the depositor has filed with the SEC for more complete information about the depositor, the issuing entity and this offering. You may get these documents for free by visiting EDGAR on the SEC website at www.sec.gov. Alternatively, the depositor or Citigroup Global Markets Inc., Morgan Stanley & Co. LLC, Merrill Lynch, Pierce, Fenner & Smith Incorporated, Drexel Hamilton, LLC, The Williams Capital Group, L.P. or any other underwriter or dealer participating in this offering will arrange to send you the prospectus if you request it by calling toll-free 1-800-831-9146.
139
LOAN #13: 2301 RENAISSANCE BOULEVARD
| Mortgaged Property Information | Mortgage Loan Information | ||||||||||||
| Number of Mortgaged Properties | 1 | Loan Seller | SMF V | ||||||||||
| Location (City/State) | King of Prussia, Pennsylvania | Cut-off Date Balance | $29,000,000 | ||||||||||
| Property Type | Office | Cut-off Date Balance per SF | $153.03 | ||||||||||
| Size (SF) | 189,502 | Percentage of Initial Pool Balance | 2.7% | ||||||||||
| Total Occupancy as of 10/1/2017 | 89.1% | Number of Related Mortgage Loans | None | ||||||||||
| Owned Occupancy as of 10/1/2017 | 89.1% | Type of Security | Fee Simple | ||||||||||
| Year Built / Latest Renovation | 2002 / 2017 | Mortgage Rate | 4.66000% | ||||||||||
| Appraised Value(1) | $50,930,000 | Original Term to Maturity (Months) | 120 | ||||||||||
| Appraisal Date | 11/16/2017 | Original Amortization Term (Months) | NAP | ||||||||||
| Borrower Sponsor(2) | Mark I. Solomon | Original Interest Only Period (Months) | 120 | ||||||||||
| Property Management | G&E Real Estate Management Services, Inc. | First Payment Date | 2/6/2018 | ||||||||||
| Maturity Date | 1/6/2028 | ||||||||||||
| Underwritten Revenues | $5,182,739 | ||||||||||||
| Underwritten Expenses | $2,183,114 | Escrows | |||||||||||
| Underwritten Net Operating Income (NOI) | $2,999,625 | Upfront | Monthly | ||||||||||
| Underwritten Net Cash Flow (NCF) | $2,770,199 | Taxes | $375,827 | $54,117 | |||||||||
| Cut-off Date LTV Ratio(1) | 56.9% | Insurance(3) | $51,527 | $0 | |||||||||
| Maturity Date LTV Ratio(1) | 56.9% | Replacement Reserve | $150,000 | $3,112 | |||||||||
| DSCR Based on Underwritten NOI / NCF | 2.19x / 2.02x | TI/LC | $0 | $20,530 | |||||||||
| Debt Yield Based on Underwritten NOI / NCF | 10.3% / 9.6% | Other(4) | $1,969,567 | $0 | |||||||||
| Sources and Uses | |||||||||||||
| Sources | $ | % | Uses | $ | % | ||||||||
| Loan Amount | $29,000,000 | 57.4% | Purchase Price | $47,000,000 | 93.1% | ||||||||
| Principal’s New Cash Contribution | 21,506,091 | 42.6 | Reserves | 2,546,921 | 5.0 | ||||||||
| Closing Costs | 959,170 | 1.9 | |||||||||||
| Total Sources | $50,506,091 | 100.0% | Total Uses | $50,506,091 | 100.0% | ||||||||
| (1) | The appraiser concluded a “Hypothetical Market Value As Is” appraised value of $50,930,000 with an appraisal valuation date of November 16, 2017. The “Hypothetical Market Value As Is” appraised value assumes that all free rent obligations have already been incurred. At origination of the 2301 Renaissance Boulevard loan, the borrower deposited $1,969,567 for free rent. The “as-is” appraised value is $48,400,000 with a valuation date of November 16, 2017. The Cut-off Date LTV Ratio and Maturity Date LTV Ratio based on the “as-is” appraised value are both 59.9%. |
| (2) | Mark I. Solomon is the guarantor of the non-recourse carveouts under the 2301 Renaissance Boulevard loan documents. |
| (3) | The borrower is required to deposit monthly escrows equal to one-twelfth of the amount that the lender estimates will be necessary to pay insurance premiums (unless the 2301 Renaissance Boulevard Property is insured under an acceptable blanket policy in accordance with the related loan documents). |
| (4) | Other Upfront Reserve is comprised of a free rent reserve related to Vertex, Inc., the 2301 Renaissance Boulevard Property’s sole tenant. |
The following table presents certain information relating to the sole tenant at the 2301 Renaissance Boulevard Property:
Owned Tenant Based on Underwritten Base Rent(1)
| Tenant Name | Credit Rating (Fitch/MIS/S&P) | Tenant GLA | % of Owned GLA | UW Base Rent | % of Total UW Base Rent | UW Base Rent $ per SF | Lease Expiration | Renewal / | ||||||||||||
| Vertex, Inc.(2) | NR / NR / NR | 168,820 | 89.1 | % | $3,376,400 | 100.0 | % | $20.00 | 9/30/2028 | NA | ||||||||||
| Largest Owned Tenant | 168,820 | 89.1 | % | $3,376,400 | 100.0 | % | $20.00 | |||||||||||||
| Vacant Spaces (Owned Space) | 20,682 | 10.9 | 0 | 0.0 | 0.00 | |||||||||||||||
| Total / Wtd. Avg. All Owned Tenants | 189,502 | 100.0 | % | $3,376,400 | 100.0 | % | $20.00 | |||||||||||||
| (1) | Based on the underwritten rent roll dated October 1, 2017. |
| (2) | Vertex, Inc. commenced operations in June 2017 and commences paying base rent in September 2018. All free rent through September 2018 was escrowed at origination of the 2301 Renaissance Boulevard loan. |
The depositor has filed a registration statement (including a prospectus) with the Securities and Exchange Commission (“SEC”) (SEC File No. 333-207132) for the offering to which this communication relates. Before you invest, you should read the prospectus in the registration statement and other documents the depositor has filed with the SEC for more complete information about the depositor, the issuing entity and this offering. You may get these documents for free by visiting EDGAR on the SEC website at www.sec.gov. Alternatively, the depositor or Citigroup Global Markets Inc., Morgan Stanley & Co. LLC, Merrill Lynch, Pierce, Fenner & Smith Incorporated, Drexel Hamilton, LLC, The Williams Capital Group, L.P. or any other underwriter or dealer participating in this offering will arrange to send you the prospectus if you request it by calling toll-free 1-800-831-9146.
140
LOAN #13: 2301 RENAISSANCE BOULEVARD
The following table presents certain information relating to the lease rollover schedule at the 2301 Renaissance Boulevard Property, based on initial lease expiration dates:
Lease Expiration Schedule(1)
Year Ending | Expiring | % of Owned GLA | Cumulative % of Owned GLA | UW Base Rent | % of Total UW Base Rent | UW Base Rent $ per SF(2) | # of Expiring Tenants | |||||||||||||
| MTM | 0 | 0.0 | % | 0.0 | % | $0 | 0.0 | % | $0.00 | 0 | ||||||||||
| 2018 | 0 | 0.0 | 0.0 | % | 0 | 0.0 | $0.00 | 0 | ||||||||||||
| 2019 | 0 | 0.0 | 0.0 | % | 0 | 0.0 | $0.00 | 0 | ||||||||||||
| 2020 | 0 | 0.0 | 0.0 | % | 0 | 0.0 | $0.00 | 0 | ||||||||||||
| 2021 | 0 | 0.0 | 0.0 | % | 0 | 0.0 | $0.00 | 0 | ||||||||||||
| 2022 | 0 | 0.0 | 0.0 | % | 0 | 0.0 | $0.00 | 0 | ||||||||||||
| 2023 | 0 | 0.0 | 0.0 | % | 0 | 0.0 | $0.00 | 0 | ||||||||||||
| 2024 | 0 | 0.0 | 0.0 | % | 0 | 0.0 | $0.00 | 0 | ||||||||||||
| 2025 | 0 | 0.0 | 0.0 | % | 0 | 0.0 | $0.00 | 0 | ||||||||||||
| 2026 | 0 | 0.0 | 0.0 | % | 0 | 0.0 | $0.00 | 0 | ||||||||||||
| 2027 | 0 | 0.0 | 0.0 | % | 0 | 0.0 | $0.00 | 0 | ||||||||||||
| 2028 | 168,820 | 89.1 | 89.1 | % | 3,376,400 | 100.0 | $20.00 | 1 | ||||||||||||
| 2029 & Thereafter | 0 | 0.0 | 89.1 | % | 0 | 0.0 | $0.00 | 0 | ||||||||||||
| Vacant | 20,682 | 10.9 | 100.0 | % | 0 | 0.0 | $0.00 | 0 | ||||||||||||
| Total / Wtd. Avg. | 189,502 | 100.0 | % | $3,376,400 | 100.0 | % | $20.00 | 1 | ||||||||||||
| (1) | Calculated based on the approximate square footage occupied by each Owned Tenant. |
| (2) | Wtd. Avg. UW Base Rent $ per SF excludes vacant space. |
The following table presents certain information relating to historical leasing at the 2301 Renaissance Boulevard Property:
Historical Leased %(1)
2014(2) | 2015 | 2016(3) | As of 10/1/2017(4) | |
| Owned Space | NAV | 100.0% | 100.0% | 89.1% |
| (1) | As provided by the borrower and which represents occupancy as of December 31 for the indicated year unless otherwise specified. |
| (2) | Historical Leased % is not available for 2014 because a prior owner of the 2301 Renaissance Boulevard Property did not provide the related information. |
| (3) | The 2301 Renaissance Boulevard Property was originally developed as a build-to-suit for GlaxoSmithKline (“GSK”) which leased 100.0% of the premises from 2002 until December 2016. The prior owner of the 2301 Renaissance Boulevard Property executed a new lease with Vertex, Inc. in October 2016, two months prior to GSK’s lease expiration. |
| (4) | Based on the underwritten rent roll dated October 1, 2017. |
The depositor has filed a registration statement (including a prospectus) with the Securities and Exchange Commission (“SEC”) (SEC File No. 333-207132) for the offering to which this communication relates. Before you invest, you should read the prospectus in the registration statement and other documents the depositor has filed with the SEC for more complete information about the depositor, the issuing entity and this offering. You may get these documents for free by visiting EDGAR on the SEC website at www.sec.gov. Alternatively, the depositor or Citigroup Global Markets Inc., Morgan Stanley & Co. LLC, Merrill Lynch, Pierce, Fenner & Smith Incorporated, Drexel Hamilton, LLC, The Williams Capital Group, L.P. or any other underwriter or dealer participating in this offering will arrange to send you the prospectus if you request it by calling toll-free 1-800-831-9146.
141
LOAN #13: 2301 RENAISSANCE BOULEVARD
| ■ | Operating History and Underwritten Net Cash Flow. The following table presents certain information relating to the historical operating performance and the Underwritten Net Cash Flow at the 2301 Renaissance Boulevard Property: |
Cash Flow Analysis(1)(2)
2015 | 2016 | Underwritten | Underwritten | ||||||||||
| Base Rent | $4,210,875 | $4,309,375 | $3,376,400 | $17.82 | |||||||||
| Gross Up Vacancy | 0 | 0 | 423,981 | 2.24 | |||||||||
| Reimbursements | 1,615,232 | 1,521,271 | 1,806,339 | 9.53 | |||||||||
| Other Income | 145 | 255,468 | 0 | 0.00 | |||||||||
| Vacancy & Credit Loss | 0 | 0 | (423,981 | ) | (2.24 | ) | |||||||
| Effective Gross Income | $5,826,252 | $6,086,114 | $5,182,739 | $27.35 | |||||||||
| Real Estate Taxes | $582,246 | $596,989 | $630,488 | $3.33 | |||||||||
| Insurance | 15,956 | 14,514 | 14,514 | 0.08 | |||||||||
| Management Fee | 219,309 | 220,884 | 155,482 | 0.82 | |||||||||
| Other Operating Expenses | 688,175 | 618,830 | 1,382,630 | 7.30 | |||||||||
| Total Operating Expenses | $1,505,686 | $1,451,217 | $2,183,114 | $11.52 | |||||||||
| Net Operating Income | $4,320,566 | $4,634,897 | $2,999,625 | $15.83 | |||||||||
| TI/LC | 0 | 0 | 192,078 | 1.01 | |||||||||
| Capital Expenditures | 0 | 0 | 37,347 | 0.20 | |||||||||
| Net Cash Flow | $4,320,566 | $4,634,897 | $2,770,199 | $14.62 | |||||||||
| Occupancy | 100.0 | % | 100.0 | %(3) | 92.4 | % | |||||||
| NOI Debt Yield | 14.9 | % | 16.0 | % | 10.3 | % | |||||||
| NCF DSCR | 3.15 | x | 3.38 | x | 2.02 | x | |||||||
| (1) | Certain items such as interest expense, interest income, lease cancellation income, depreciation, amortization, debt service payments and any other non-recurring or non-operating items are not considered for the underwritten cash flow. |
| (2) | Historical cash flows are not available for 2014 because a prior owner of the 2301 Renaissance Boulevard Property did not provide the related information. Historical cash flows are not available for 2017 because the 2301 Renaissance Boulevard Property underwent a renovation. |
| (3) | The 2301 Renaissance Boulevard Property was originally developed as a build-to-suit for GSK which leased 100.0% of the premises from 2002 until December 2016. The prior owner of the 2301 Renaissance Boulevard Property executed a new lease with Vertex, Inc. in October 2016, two months prior to GSK’s lease expiration. |
The depositor has filed a registration statement (including a prospectus) with the Securities and Exchange Commission (“SEC”) (SEC File No. 333-207132) for the offering to which this communication relates. Before you invest, you should read the prospectus in the registration statement and other documents the depositor has filed with the SEC for more complete information about the depositor, the issuing entity and this offering. You may get these documents for free by visiting EDGAR on the SEC website at www.sec.gov. Alternatively, the depositor or Citigroup Global Markets Inc., Morgan Stanley & Co. LLC, Merrill Lynch, Pierce, Fenner & Smith Incorporated, Drexel Hamilton, LLC, The Williams Capital Group, L.P. or any other underwriter or dealer participating in this offering will arrange to send you the prospectus if you request it by calling toll-free 1-800-831-9146.
142
(THIS PAGE INTENTIONALLY LEFT BLANK)
The depositor has filed a registration statement (including a prospectus) with the Securities and Exchange Commission (“SEC”) (SEC File No. 333-207132) for the offering to which this communication relates. Before you invest, you should read the prospectus in the registration statement and other documents the depositor has filed with the SEC for more complete information about the depositor, the issuing entity and this offering. You may get these documents for free by visiting EDGAR on the SEC website at www.sec.gov. Alternatively, the depositor or Citigroup Global Markets Inc., Morgan Stanley & Co. LLC, Merrill Lynch, Pierce, Fenner & Smith Incorporated, Drexel Hamilton, LLC, The Williams Capital Group, L.P. or any other underwriter or dealer participating in this offering will arrange to send you the prospectus if you request it by calling toll-free 1-800-831-9146.
143
LOAN #14: ingram festival shopping center
| Mortgaged Property Information | Mortgage Loan Information | ||||
| Number of Mortgaged Properties | 1 | Loan Seller | SMF V | ||
| Location (City/State) | San Antonio, Texas | Cut-off Date Balance | $27,424,564 | ||
| Property Type | Retail | Cut-off Date Balance per SF | $123.45 | ||
| Size (SF) | 222,154 | Percentage of Initial Pool Balance | 2.6% | ||
| Total Occupancy as of 12/1/2017 | 100.0% | Number of Related Mortgage Loans | None | ||
| Owned Occupancy as of 12/1/2017 | 100.0% | Type of Security | Fee Simple | ||
| Year Built / Latest Renovation | 1995 / NAP | Mortgage Rate | 4.54400% | ||
| Appraised Value | $42,300,000 | Original Term to Maturity (Months) | 120 | ||
| Appraisal Date | 11/6/2017 | Original Amortization Term (Months) | 360 | ||
| Borrower Sponsors(1) | Various | Original Interest Only Period (Months) | NAP | ||
| Property Management | Weitzman Management Corporation | First Payment Date | 2/6/2018 | ||
| Maturity Date | 1/6/2028 | ||||
| Underwritten Revenues | $4,440,849 | ||||
| Underwritten Expenses | $1,530,834 | Escrows | |||
| Underwritten Net Operating Income (NOI) | $2,910,015 | Upfront | Monthly | ||
| Underwritten Net Cash Flow (NCF) | $2,687,861 | Taxes | $240,086 | $80,029 | |
| Cut-off Date LTV Ratio | 64.8% | Insurance | $15,479 | $1,720 | |
| Maturity Date LTV Ratio | 52.6% | Replacement Reserve | $250,000 | $5,924 | |
| DSCR Based on Underwritten NOI / NCF | 1.73x / 1.60x | TI/LC(2) | $500,000 | $0 | |
| Debt Yield Based on Underwritten NOI / NCF | 10.6% / 9.8% | Other(3) | $562,349 | $0 | |
| Sources and Uses | ||||||||||||
| Sources | $ | % | Uses | $ | % | |||||||
| Loan Amount | $27,500,000 | 100.0 | % | Loan Payoff | $24,544,466 | 89.3 | % | |||||
| Reserves | 1,567,914 | 5.7 | ||||||||||
| Return of Equity | 701,605 | 2.6 | ||||||||||
| Closing Costs | 686,014 | 2.5 | ||||||||||
| Total Sources | $27,500,000 | 100.0 | % | Total Uses | $27,500,000 | 100.0 | % | |||||
| (1) | The Survivor’s Trust Under the Warren L. Breslow Trust, The Goldrich Trust No. 1, Hirsch Family Trust A, The KT1 Benjamin Trust, The KT1 Ezra Trust, The KT1 Michael Trust, The KT1 Francesca Trust, The Non-Exempt QTIP Marital Trust under the Goldrich Trust No. 1 and The Survivor’s Trust under the Goldrich Trust No. 1 are both the borrower sponsors and guarantors of the non-recourse carveouts under the Ingram Festival Shopping Center loan documents. |
| (2) | On each monthly payment date when the TI/LC Reserve is below the cap, the borrower is required to deposit $12,589. The TI/LC Reserve is capped at $500,000. |
| (3) | The Upfront Other Reserve is comprised of a Spec’s Wine & Spirits reserve for outstanding tenant improvements and leasing commissions ($547,349) and for a deferred maintenance reserve ($15,000). |
The following table presents certain information relating to the major tenants (of which certain tenants may have co-tenancy provisions) at the Ingram Festival Shopping Center Property:
Ten Largest Owned Tenants Based on Underwritten Base Rent(1)
Tenant Name | Credit Rating (Fitch/MIS/S&P)(2) | Tenant GLA | % of Owned GLA | UW Base Rent(3) | % of Total UW Base Rent(3) | UW Base Rent $ per SF(3) | Sales $ per SF(4) | Occupancy Cost(4) | Lease Expiration | Renewal / Extensions Options | |||||||||||||||||
| Barnes & Noble | NR / NR / NR | 23,682 | 10.7 | % | $348,435 | 10.6 | % | $14.71 | $164 | 9.3 | % | 3/31/2019 | 1, 5-year option | ||||||||||||||
| Marshalls | NR / A2 / A+ | 30,589 | 13.8 | 305,890 | 9.3 | $10.00 | $296 | 5.7 | % | 1/31/2026 | 2, 5-year options | ||||||||||||||||
| Michaels | NR / NR / BB- | 23,100 | 10.4 | 300,300 | 9.1 | $13.00 | $180 | 11.0 | % | 2/28/2026 | 1, 5-year option | ||||||||||||||||
| F21 Red | NR / NR / NR | 22,000 | 9.9 | 291,500 | 8.8 | $13.25 | NA | NA | 1/31/2028 | 2, 5-year options | |||||||||||||||||
| DSW Shoe Warehouse(5) | NR / NR / NR | 18,620 | 8.4 | 253,000 | 7.7 | $13.59 | $135 | 15.2 | % | 1/31/2025 | 2, 5-year options | ||||||||||||||||
| Spec’s Wine & Spirits | NR / NR / NR | 18,383 | 8.3 | 252,766 | 7.7 | $13.75 | NA | NA | 3/31/2028 | 4, 5-year options | |||||||||||||||||
| Ulta Salon | NR / NR / NR | 12,600 | 5.7 | 252,000 | 7.6 | $20.00 | NA | NA | 9/30/2024 | 3, 5-year options | |||||||||||||||||
| Old Navy | BB+ / Baa2 / BB+ | 15,300 | 6.9 | 214,200 | 6.5 | $14.00 | NA | NA | 1/31/2023 | 1, 5-year option | |||||||||||||||||
| Dressbarn (dba Roz & Ali) | NR / NR / NR | 8,500 | 3.8 | 163,632 | 5.0 | $19.25 | $122 | 21.3 | % | 12/31/2022 | 1, 5-year option | ||||||||||||||||
| Dollar Tree | NR / NR / BB+ | 13,000 | 5.9 | 149,500 | 4.5 | $11.50 | NA | NA | 3/31/2021 | 1, 5-year option | |||||||||||||||||
| Ten Largest Owned Tenants | 185,774 | 83.6 | % | $2,531,223 | 76.6 | % | $13.63 | ||||||||||||||||||||
| Remaining Owned Tenants | 36,380 | 16.4 | 771,387 | 23.4 | $21.20 | ||||||||||||||||||||||
| Vacant Spaces (Owned Space) | 0 | 0.0 | 0 | 0.0 | $0.00 | ||||||||||||||||||||||
| Total / Wtd. Avg. All Owned Tenants | 222,154 | 100.0 | % | $3,302,610 | 100.0 | % | $14.87 | ||||||||||||||||||||
| (1) | Based on the underwritten rent roll dated December 1, 2017. |
| (2) | Certain ratings are those of the parent company whether or not the parent guarantees the lease. |
| (3) | UW Base Rent, % of Total UW Base Rent and UW Base Rent $ per SF include contractual rent increases through April 1, 2018 ($62,535). |
| (4) | Sales $ per SF represent 2016 sales. Occupancy Cost represents a percentage of 2016 sales. |
| (5) | DSW Shoe Warehouse has a one time right to terminate its lease effective October 2019, with 90 days’ notice and payment of a termination fee equal to $279,300, if gross sales during the prior 12 month period are not at least $3,750,000. |
The depositor has filed a registration statement (including a prospectus) with the Securities and Exchange Commission (“SEC”) (SEC File No. 333-207132) for the offering to which this communication relates. Before you invest, you should read the prospectus in the registration statement and other documents the depositor has filed with the SEC for more complete information about the depositor, the issuing entity and this offering. You may get these documents for free by visiting EDGAR on the SEC website at www.sec.gov. Alternatively, the depositor or Citigroup Global Markets Inc., Morgan Stanley & Co. LLC, Merrill Lynch, Pierce, Fenner & Smith Incorporated, Drexel Hamilton, LLC, The Williams Capital Group, L.P. or any other underwriter or dealer participating in this offering will arrange to send you the prospectus if you request it by calling toll-free 1-800-831-9146.
144
LOAN #14: ingram festival shopping center
The following table presents certain information relating to the lease rollover schedule at the Ingram Festival Shopping Center Property, based on initial lease expiration dates:
Lease Expiration Schedule(1)(2)
Year Ending December 31 | Expiring Owned GLA | % of Owned GLA | Cumulative % of Owned GLA | UW Base Rent(3) | % of Total UW Base Rent(3) | UW Base Rent $ per SF(3) | # of Expiring Tenants | ||||||||||||||
| MTM | 0 | 0.0 | % | 0.0 | % | $0 | 0.0 | % | $0.00 | 0 | |||||||||||
| 2018 | 0 | 0.0 | 0.0 | % | 0 | 0.0 | $0.00 | 0 | |||||||||||||
| 2019 | 26,504 | 11.9 | 11.9 | % | 413,015 | 12.5 | $15.58 | 3 | |||||||||||||
| 2020 | 4,500 | 2.0 | 14.0 | % | 94,500 | 2.9 | $21.00 | 1 | |||||||||||||
| 2021 | 20,700 | 9.3 | 23.3 | % | 263,075 | 8.0 | $12.71 | 2 | |||||||||||||
| 2022 | 13,683 | 6.2 | 29.4 | % | 260,389 | 7.9 | $19.03 | 3 | |||||||||||||
| 2023 | 31,475 | 14.2 | 43.6 | % | 616,175 | 18.7 | $19.58 | 5 | |||||||||||||
| 2024 | 12,600 | 5.7 | 49.3 | % | 252,000 | 7.6 | $20.00 | 1 | |||||||||||||
| 2025 | 18,620 | 8.4 | 57.7 | % | 253,000 | 7.7 | $13.59 | 1 | |||||||||||||
| 2026 | 53,689 | 24.2 | 81.8 | % | 606,190 | 18.4 | $11.29 | 2 | |||||||||||||
| 2027 | 0 | 0.0 | 81.8 | % | 0 | 0.0 | $0.00 | 0 | |||||||||||||
| 2028 | 40,383 | 18.2 | 100.0 | % | 544,266 | 16.5 | $13.48 | 2 | |||||||||||||
| 2029 & Thereafter | 0 | 0.0 | 100.0 | % | 0 | 0.0 | $0.00 | 0 | |||||||||||||
| Vacant | 0 | 0.0 | 100.0 | % | 0 | 0.0 | $0.00 | 0 | |||||||||||||
| Total / Wtd. Avg. | 222,154 | 100.0 | % | $3,302,610 | 100.0 | % | $14.87 | 20 | |||||||||||||
| (1) | Calculated based on the approximate square footage occupied by each Owned Tenant. |
| (2) | Certain tenants may have lease termination options that are exercisable prior to the originally stated expiration date of the subject lease and that are not considered in the Lease Expiration Schedule. |
| (3) | UW Base Rent, % of Total UW Base Rent and UW Base Rent $ per SF include contractual rent increases through April 1, 2018 ($62,535). |
The following table presents certain information relating to historical leasing at the Ingram Festival Shopping Center Property:
Historical Leased %(1)
| 2014 | 2015 | 2016 | As of 12/1/2017(2) | |||||
| Owned Space | 80.5% | 98.8% | 81.8% | 100.0% |
| (1) | As provided by the borrower and which represents occupancy as of December 31 for the indicated year unless otherwise specified. |
| (2) | Based on the underwritten rent roll dated December 1, 2017. |
| ■ | Operating History and Underwritten Net Cash Flow. The following table presents certain information relating to the historical operating performance and the Underwritten Net Cash Flow at the Ingram Festival Shopping Center Property: |
Cash Flow Analysis(1)
2014 | 2015 | 2016 | TTM 10/31/2017 | Underwritten | Underwritten $ per SF | |||||||||||||
| Base Rent | $2,119,823 | $2,598,417 | $2,616,180 | $2,787,159 | $3,240,075 | $14.58 | ||||||||||||
| Contractual Rent Steps | 0 | 0 | 0 | 0 | 62,535 | 0.28 | ||||||||||||
| Gross Up Vacancy | 0 | 0 | 0 | 0 | 0 | 0.00 | ||||||||||||
| Reimbursements | 596,555 | 748,258 | 838,333 | 1,145,806 | 1,376,894 | 6.20 | ||||||||||||
| Other Income | 131,452 | (115 | ) | 0 | (5,573 | ) | 0 | 0.00 | ||||||||||
| Vacancy & Credit Loss | 0 | 0 | 0 | 0 | (238,655 | ) | (1.07 | ) | ||||||||||
| Effective Gross Income | $2,847,830 | $3,346,560 | $3,454,513 | $3,927,392 | $4,440,849 | $19.99 | ||||||||||||
| Real Estate Taxes | $673,804 | $689,406 | $879,459 | $879,460 | $932,374 | $4.20 | ||||||||||||
| Insurance | 41,378 | 31,306 | 19,794 | 20,638 | 20,639 | 0.09 | ||||||||||||
| Management Fee | 76,760 | 96,391 | 113,681 | 112,611 | 133,225 | 0.60 | ||||||||||||
| Other Operating Expenses | 412,032 | 398,948 | 486,914 | 444,596 | 444,596 | 2.00 | ||||||||||||
| Total Operating Expenses | $1,203,974 | $1,216,051 | $1,499,848 | $1,457,305 | $1,530,834 | $6.89 | ||||||||||||
| Net Operating Income | $1,643,856 | $2,130,509 | $1,954,665 | $2,470,087 | $2,910,015 | $13.10 | ||||||||||||
| TI/LC | 0 | 0 | 0 | 0 | 151,065 | 0.68 | ||||||||||||
| Capital Expenditures | 0 | 0 | 0 | 0 | 71,089 | 0.32 | ||||||||||||
| Net Cash Flow | $1,643,856 | $2,130,509 | $1,954,665 | $2,470,087 | $2,687,861 | $12.10 | ||||||||||||
| Occupancy | 80.5% | 98.8% | 81.8% | 100.0%(2) | 94.9%(3) | |||||||||||||
| NOI Debt Yield | 6.0% | 7.8% | 7.1% | 9.0% | 10.6% | |||||||||||||
| NCF DSCR | 0.98x | 1.27x | 1.16x | 1.47x | 1.60x | |||||||||||||
| (1) | Certain items such as interest expense, interest income, lease cancellation income, depreciation, amortization, debt service payments and any other non-recurring or non-operating items were not considered for the underwritten cash flow. |
| (2) | Represents occupancy as of December 1, 2017. |
| (3) | Represents the underwritten economic vacancy of 5.1%. |
The depositor has filed a registration statement (including a prospectus) with the Securities and Exchange Commission (“SEC”) (SEC File No. 333-207132) for the offering to which this communication relates. Before you invest, you should read the prospectus in the registration statement and other documents the depositor has filed with the SEC for more complete information about the depositor, the issuing entity and this offering. You may get these documents for free by visiting EDGAR on the SEC website at www.sec.gov. Alternatively, the depositor or Citigroup Global Markets Inc., Morgan Stanley & Co. LLC, Merrill Lynch, Pierce, Fenner & Smith Incorporated, Drexel Hamilton, LLC, The Williams Capital Group, L.P. or any other underwriter or dealer participating in this offering will arrange to send you the prospectus if you request it by calling toll-free 1-800-831-9146.
145
LOAN #15: cross point
| Mortgaged Property Information | Mortgage Loan Information | ||||
| Number of Mortgaged Properties | 1 | Loan Seller | SMF V | ||
| Location (City/State) | Lowell, Massachusetts | Cut-off Date Balance(3) | $25,000,000 | ||
| Property Type | Office | Cut-off Date Balance per SF(2) | $113.61 | ||
| Size (SF) | 1,320,254 | Percentage of Initial Pool Balance | 2.4% | ||
| Total Occupancy as of 1/11/2018 | 95.4% | Number of Related Mortgage Loans | None | ||
| Owned Occupancy as of 1/11/2018 | 95.4% | Type of Security | Fee Simple | ||
| Year Built / Latest Renovation | 1979 / 2017 | Mortgage Rate | 4.73400% | ||
| Appraised Value | $250,000,000 | Original Term to Maturity (Months) | 120 | ||
| Appraisal Date | 1/8/2018 | Original Amortization Term (Months) | NAP | ||
| Borrower Sponsors(1) | Samuel T. Byrne and William H. Kremer | Original Interest Only Period (Months) | 120 | ||
| Property Management | ALP CrossPoint Manager LLC | First Payment Date | 3/4/2018 | ||
| Maturity Date | 2/6/2028 | ||||
| Underwritten Revenues | $31,402,846 | ||||
| Underwritten Expenses | $13,741,126 | Escrows | |||
| Underwritten Net Operating Income (NOI) | $17,661,721 | Upfront | Monthly | ||
| Underwritten Net Cash Flow (NCF) | $16,117,023 | Taxes | $240,000 | $240,000 | |
| Cut-off Date LTV Ratio(2) | 60.0% | Insurance(4) | $0 | $0 | |
| Maturity Date LTV Ratio(2) | 60.0% | Replacement Reserve | $0 | $18,704 | |
| DSCR Based on Underwritten NOI / NCF(2) | 2.45x / 2.24x | TI/LC(5) | $0 | $110,021 | |
| Debt Yield Based on Underwritten NOI / NCF(2) | 11.8% / 10.7% | Other(6) | $6,500,000 | $0 | |
| Sources and Uses | ||||||||||||
| Sources | $ | % | Uses | $ | % | |||||||
| Loan Combination Amount | $150,000,000 | 63.7 | % | Purchase Price | $227,200,000 | 96.5 | % | |||||
| Principal’s New Cash Contribution | 85,555,563 | 36.3 | Reserves | 6,740,000 | 2.9 | |||||||
| Closing Costs | 1,615,563 | 0.7 | ||||||||||
| Total Sources | $235,555,563 | 100.0 | % | Total Uses | $235,555,563 | 100.0 | % | |||||
| (1) | The initial non-recourse carveout guarantors of the Cross Point Loan Combination (as defined below) are Samuel T. Byrne and Brian Chaisson (the “Initial Guarantors”) on a joint and several basis. The Cross Point Loan Combination documents provide that one or more of the Initial Guarantors may be replaced as guarantors, provided, among other things, that the replacement guarantor, together with any other replacement or remaining guarantors, has a net worth of not less than $50,000,000, and, if such replacement guarantor is not a natural person, liquid assets of at least $5,000,000. |
| (2) | Calculated based on the aggregate outstanding principal balance as of the Cut-off Date of the Cross Point Loan Combination. |
| (3) | The Cut-off Date Balance of $25,000,000 represents the non-controlling notes A-5 and A-6, which are part of a loan combination (the “Cross Point Loan Combination”) evidenced by 10pari passu notes having an aggregate Cut-off Date Balance of $150,000,000. The related companion loans evidenced by the non-controlling notes A-2, A-3 and A-9, with an aggregate outstanding principal balance as of the Cut-off Date of $50,000,000, were securitized in the UBS 2018-C8 transaction. The related companion loans evidenced by the controlling note A-1 and the non-controlling notes A-4, A-7, A-8 and A-10, with an aggregate outstanding principal balance as of the Cut-off Date of $75,000,000, are currently held by Cantor Commercial Real Estate Lending, L.P., or an affiliate, and are expected to be contributed to future securitization transactions. |
| (4) | The borrower is required to deposit monthly escrows equal to one-twelfth of the amount that the lender estimates will be necessary to pay insurance premiums (unless the Cross Point property is insured under an acceptable blanket policy). |
| (5) | The TI/LC reserve is capped at $3,960,762. |
| (6) | Other Upfront Reserve is comprised of a free rent reserve related to Kronos Incorporated. |
The following table presents certain information relating to the major tenants at the Cross Point Property:
Ten Largest Owned Tenants Based on Underwritten Base Rent(1)
Tenant Name | Credit Rating (Fitch/MIS/S&P)(2) | Tenant GLA | % of GLA | UW Base Rent(3) | % of Total UW Base Rent(3) | UW Base Rent | Lease Expiration | Renewal / Extension Options | |||||||||||||
| Kronos Incorporated | NR / NR / B- | 505,664 | 38.3 | % | $7,837,792 | 37.8 | % | $15.50 | 2/6/2029 | 2, 5-year options | |||||||||||
| Verizon New England | A- / Baa1 / BBB+ | 314,981 | 23.9 | 4,453,589 | 21.5 | $14.14 | Various(4) | 3, 5-year options | |||||||||||||
| Arris Technology, Inc. | NR / NR / NR | 143,594 | 10.9 | 2,145,285 | 10.4 | $14.94 | 4/30/2027 | NA | |||||||||||||
| Vantiv eCommerce, LLC | NR / NR / NR | 63,924 | 4.8 | 1,534,176 | 7.4 | $24.00 | 12/31/2021 | 1, 3-year option | |||||||||||||
| (GSA) – IRS(5) | AAA / Aaa / AA+ | 36,752 | 2.8 | 1,266,958 | 6.1 | $34.47 | 8/14/2026 | NA | |||||||||||||
| PlumChoice, Inc. | NR / NR / NR | 36,752 | 2.8 | 918,800 | 4.4 | $25.00 | 1/31/2021 | NA | |||||||||||||
| GN Netcom, Inc -dba- Jabra | NR / NR / NR | 31,962 | 2.4 | 683,348 | 3.3 | $21.38 | 4/30/2023 | 2, 5-year options | |||||||||||||
| Korde & Associates, PC | NR / NR / NR | 16,397 | 1.2 | 385,330 | 1.9 | $23.50 | 2/28/2024 | 1, 5-year option | |||||||||||||
| Persivia Inc. | NR / NR / NR | 17,876 | 1.4 | 381,653 | 1.8 | $21.35 | 9/30/2018 | 1, 5-year option | |||||||||||||
| Captivate LLC | NR / NR / NR | 15,286 | 1.2 | 371,450 | 1.8 | $24.30 | 2/28/2021 | 1, 5-year option | |||||||||||||
| Ten Largest Owned Tenants | 1,183,188 | 89.6 | % | $19,978,381 | 96.4 | % | $16.89 | ||||||||||||||
| Remaining Tenants(6) | 76,415 | 5.8 | 747,278 | 3.6 | 9.78 | ||||||||||||||||
| Vacant | 60,651 | 4.6 | 0 | 0.0 | 0.00 | ||||||||||||||||
| Total / Wtd. Avg. All Tenants | 1,320,254 | 100.0 | % | $20,725,659 | 100.0 | % | $16.45 | ||||||||||||||
| (1) | Based on the underwritten rent roll dated January 11, 2018. |
| (2) | Certain ratings are those of the parent company or the U.S. federal government whether or not the parent or the U.S. federal government, as applicable, guarantees the lease. |
| (3) | UW Base Rent, % of Total UW Base Rent and UW Base Rent $ per SF includes $288,240, which represents the average rent for Verizon New England through the term of its lease, and $804,117 for contractual rent steps through February 2019 for other tenants. |
| (4) | Verizon New England has 222,601 SF that expires on 12/31/2023 and 92,380 SF that expires on 5/31/2024. Verizon New England has the right to terminate up to 222,601 SF of its space effective on 12/31/2020 and 92,380 SF of its space effective 5/31/2021 by giving notice on or before 12/31/2019, subject to a termination fee of $10.2 million (assuming both rights are exercised). |
| (5) | (GSA) – IRS may terminate its lease at any time effective June 2021 by giving 180 days’ notice. |
| (6) | Approximately 45,237 SF of Remaining Tenants represents amenities that include: a cafeteria, an auditorium, a conference center, a management office and a fitness center. These spaces are represented as occupied square footage with no rent attributed. |
The depositor has filed a registration statement (including a prospectus) with the Securities and Exchange Commission (“SEC”) (SEC File No. 333-207132) for the offering to which this communication relates. Before you invest, you should read the prospectus in the registration statement and other documents the depositor has filed with the SEC for more complete information about the depositor, the issuing entity and this offering. You may get these documents for free by visiting EDGAR on the SEC website at www.sec.gov. Alternatively, the depositor or Citigroup Global Markets Inc., Morgan Stanley & Co. LLC, Merrill Lynch, Pierce, Fenner & Smith Incorporated, Drexel Hamilton, LLC, The Williams Capital Group, L.P. or any other underwriter or dealer participating in this offering will arrange to send you the prospectus if you request it by calling toll-free 1-800-831-9146.
146
LOAN #15: cross point
The following table presents certain information relating to the lease rollover schedule at the Cross Point Property, based on initial lease expiration dates:
Lease Expiration Schedule(1)(2)
Year Ending December 31 | Expiring Owned GLA | % of Owned GLA | Cumulative % of Owned GLA | UW Base Rent(3) | % of Total UW Base Rent(3) | UW Base Rent $ per SF(3)(4) | # of Expiring Tenants | ||||||||||||||
| MTM | 800 | 0.1 | % | 0.1 | % | $57,980 | 0.3 | % | $72.48 | 1 | |||||||||||
| 2018 | 17,876 | 1.4 | 1.4 | % | 381,653 | 1.8 | $21.35 | 1 | |||||||||||||
| 2019 | 0 | 0.0 | 1.4 | % | 0 | 0.0 | $0.00 | 0 | |||||||||||||
| 2020 | 0 | 0.0 | 1.4 | % | 0 | 0.0 | $0.00 | 0 | |||||||||||||
| 2021 | 115,962 | 8.8 | 10.2 | % | 2,824,426 | 13.6 | $24.36 | 3 | |||||||||||||
| 2022 | 0 | 0.0 | 10.2 | % | 0 | 0.0 | $0.00 | 0 | |||||||||||||
| 2023 | 263,535 | 20.0 | 30.2 | % | 4,018,054 | 19.4 | $15.25 | 4 | |||||||||||||
| 2024 | 109,030 | 8.3 | 38.4 | % | 1,757,683 | 8.5 | $16.12 | 3 | |||||||||||||
| 2025 | 0 | 0.0 | 38.4 | % | 0 | 0.0 | $0.00 | 0 | |||||||||||||
| 2026 | 57,905 | 4.4 | 42.8 | % | 1,702,786 | 8.2 | $29.41 | 3 | |||||||||||||
| 2027 | 143,594 | 10.9 | 53.7 | % | 2,145,285 | 10.4 | $14.94 | 1 | |||||||||||||
| 2028 | 0 | 0.0 | 53.7 | % | 0 | 0.0 | $0.00 | 0 | |||||||||||||
| 2029 & Thereafter(5) | 550,901 | 41.7 | 95.4 | % | 7,837,792 | 37.8 | $14.23 | 6 | |||||||||||||
| Vacant | 60,651 | 4.6 | 100.0 | % | 0 | 0.0 | $0.00 | 0 | |||||||||||||
| Total / Wtd. Avg. | 1,320,254 | 100.0 | % | $20,725,659 | 100.0 | % | $16.45 | 22 | |||||||||||||
| (1) | Calculated based on the approximate square footage occupied by each Owned Tenant. |
| (2) | Certain tenants may have lease termination options that are exercisable prior to the originally stated expiration date of the subject lease and that are not considered in the Lease Expiration Schedule. |
| (3) | UW Base Rent, % of Total UW Base Rent and UW Base Rent $ per SF includes $288,240, which represents the average rent for Verizon New England through the term of its lease, and $804,117 for contractual rent steps through February 2019 for other tenants. |
| (4) | Total / Wtd. Avg. UW Base Rent $ per SF excludes vacant space. |
| (5) | Approximately 45,237 SF represents amenities that include: a cafeteria, an auditorium, a conference center, a management office and a fitness center. These spaces are represented as occupied square footage with no rent attributed. |
The following table presents certain information relating to historical leasing at the Cross Point Property:
Historical Leased %(1)
| 2014 | 2015 | 2016 | As of 1/11/2018(2) | |||||
| Owned Space | N/A | N/A | 63.7% | 95.4% |
| (1) | As provided by the borrower and which represents occupancy as of December 31 for the indicated year unless otherwise specified. |
| (2) | Based on the underwritten rent roll dated January 11, 2018. |
The depositor has filed a registration statement (including a prospectus) with the Securities and Exchange Commission (“SEC”) (SEC File No. 333-207132) for the offering to which this communication relates. Before you invest, you should read the prospectus in the registration statement and other documents the depositor has filed with the SEC for more complete information about the depositor, the issuing entity and this offering. You may get these documents for free by visiting EDGAR on the SEC website at www.sec.gov. Alternatively, the depositor or Citigroup Global Markets Inc., Morgan Stanley & Co. LLC, Merrill Lynch, Pierce, Fenner & Smith Incorporated, Drexel Hamilton, LLC, The Williams Capital Group, L.P. or any other underwriter or dealer participating in this offering will arrange to send you the prospectus if you request it by calling toll-free 1-800-831-9146.
147
LOAN #15: cross point
| ■ | Operating History and Underwritten Net Cash Flow. The following table presents certain information relating to the historical operating performance and the Underwritten Net Cash Flow at the Cross Point Property: |
Cash Flow Analysis(1)(2)
2016 | TTM 11/30/2017 | Underwritten | Underwritten $ per SF | |||||||||
| Base Rent | $11,610,171 | $15,907,616 | $19,633,302 | $14.87 | ||||||||
| Contractual Rent Steps(3) | 0 | 0 | 1,092,357 | 0.83 | ||||||||
| Gross Up Vacancy | 0 | 0 | 1,000,309 | 0.76 | ||||||||
| Reimbursements | 5,783,881 | 7,648,558 | 11,478,465 | 8.69 | ||||||||
| Other Income(4) | 671,090 | 812,877 | 854,767 | 0.65 | ||||||||
| Vacancy & Credit Loss | 0 | 0 | (2,656,355 | ) | (2.01 | ) | ||||||
| Effective Gross Income | $18,065,142 | $24,369,051 | $31,402,846 | $23.79 | ||||||||
| Real Estate Taxes | $2,849,610 | $2,786,360 | $2,865,961 | $2.17 | ||||||||
| Insurance | 170,254 | 168,785 | 178,179 | 0.13 | ||||||||
| Management Fee | 537,215 | 618,437 | 942,085 | 0.71 | ||||||||
| Other Operating Expenses | 8,147,575 | 9,482,542 | 9,754,900 | 7.39 | ||||||||
| Total Operating Expenses | $11,704,654 | $13,056,124 | $13,741,126 | $10.41 | ||||||||
| Net Operating Income | $6,360,488 | $11,312,927 | $17,661,721 | $13.38 | ||||||||
| TI/LC | 0 | 0 | 1,320,254 | 1.00 | ||||||||
| Capital Expenditures | 0 | 0 | 224,443 | 0.17 | ||||||||
| Net Cash Flow | $6,360,488 | $11,312,927 | $16,117,023 | $12.21 | ||||||||
| Occupancy | 63.7% | 95.4% | (5) | 92.0% | (6) | |||||||
| NOI Debt Yield(7) | 4.2% | 7.5% | 11.8% | |||||||||
| NCF DSCR(7) | 0.88x | 1.57x | 2.24x | |||||||||
| (1) | Certain items such as interest expense, interest income, lease cancellation income, depreciation, amortization, debt service payments and any other non-recurring or non-operating items are not considered for the underwritten cash flow. |
| (2) | Historical cash flows are not available for 2014 or 2015 because the borrower sponsors acquired the Cross Point property in January 2018. |
| (3) | Contractual Rent Steps of $1,092,357 includes $288,240, which represents the average rent for Verizon New England through the term of its lease, and $804,117 for contractual rent steps through February 2019 for other tenants. |
| (4) | Other Income includes contractual income for antenna leases as well as parking income, among other things. |
| (5) | Based on the underwritten rent roll dated January 11, 2018. |
| (6) | Represents the underwritten economic vacancy of 8.0%. |
| (7) | Calculated based on the aggregate outstanding principal balance as of the Cut-off Date of the Cross Point Loan Combination. |
The depositor has filed a registration statement (including a prospectus) with the Securities and Exchange Commission (“SEC”) (SEC File No. 333-207132) for the offering to which this communication relates. Before you invest, you should read the prospectus in the registration statement and other documents the depositor has filed with the SEC for more complete information about the depositor, the issuing entity and this offering. You may get these documents for free by visiting EDGAR on the SEC website at www.sec.gov. Alternatively, the depositor or Citigroup Global Markets Inc., Morgan Stanley & Co. LLC, Merrill Lynch, Pierce, Fenner & Smith Incorporated, Drexel Hamilton, LLC, The Williams Capital Group, L.P. or any other underwriter or dealer participating in this offering will arrange to send you the prospectus if you request it by calling toll-free 1-800-831-9146.
148