Exhibit 1
| Proxy Solicitation Tier Technologies, Inc. 2009 Annual Meeting February, 2009 |
| TABLE OF CONTENTS Section I Executive Summary Section II Discovery Overview Section III Tier Governance Crisis Section IV EPP Opportunity Section V Tier Shareholders Section VI Discovery Platform |

| Section I Executive Summary |

| Discovery Group is soliciting proxies from Tier Technologies stockholders for the Company’s March 2009 Annual Meeting Discovery seeks proxies in order to: Elect Discovery Nominees Michael Murphy and Daniel Donoghue to the Tier Board Approve Discovery’s stockholder proposals to request that the Tier Board terminate Tier’s Poison Pill and reinstate stockholders’ ability to call special meetings Discovery intends to bring the much needed perspective of a large shareholder to the Tier Board Since January, 2007, Discovery has had extensive conversations, meetings, and correspondence with Tier management and directors Discovery’s Nominees will work constructively with members of the current Board to: Improve corporate governance and eliminate unnecessary corporate takeover defenses Expeditiously reduce excessive corporate overhead Evaluate the best use of excess cash Proactively evaluate all strategic alternatives to unlock the value of Tier’s EPP business Executive Summary Proxy Solicitation and Shareholder Proposals |
| Executive Summary, Continued Proxy Solicitation and Shareholder Proposals |

| Section II Discovery Overview |

| Discovery Overview Discovery Group manages a portfolio of small capitalization public company investments concentrated in 15 to 20 holdings with ownership stakes of up to 20% of outstanding shares. Discovery owns 1.9 million shares of Tier, representing approximately 9.9% of outstanding shares. Discovery’s $16 million investment is a very important position for the partnership. The Partnership’s source of investment funds are university endowments, charitable organizations, pensions, and family offices. The investment strategy is focused on small capitalization stocks that suffer from weak public market valuation, which reflects low institutional investor interest, illiquid trading volume, and a lack of research coverage. The Managing Partners have a long track record of experience with small capitalization public companies. Introduction Published Research Acquisition Advisors Sale Transactions Merger Negotiations Strategic Alternative Analysis Executive Management Fairness Opinions Defensive Advisors Investors |

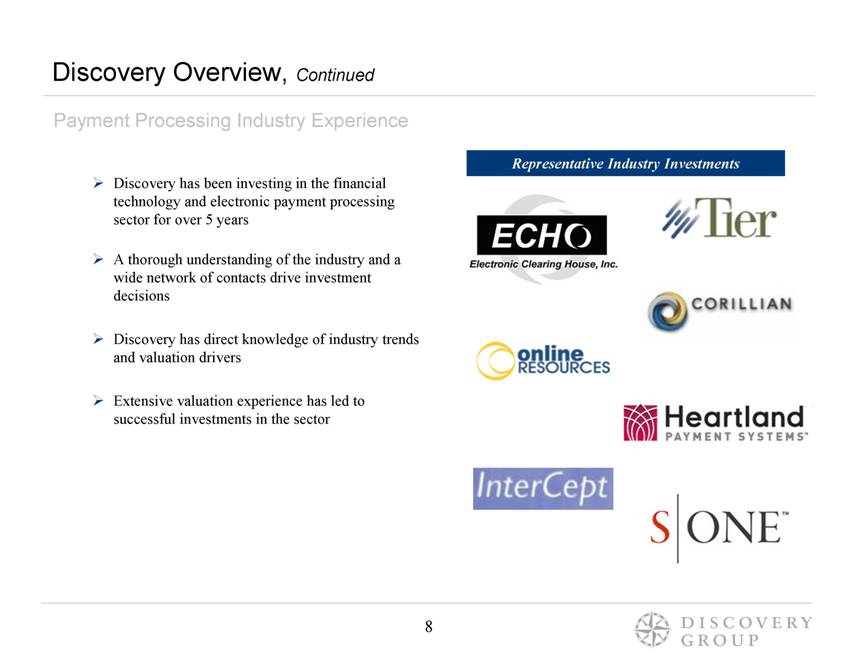
| Discovery Overview, Continued Payment Processing Industry Experience Discovery has been investing in the financial technology and electronic payment processing sector for over 5 years A thorough understanding of the industry and a wide network of contacts drive investment decisions Discovery has direct knowledge of industry trends and valuation drivers Extensive valuation experience has led to successful investments in the sector Representative Industry Investments |
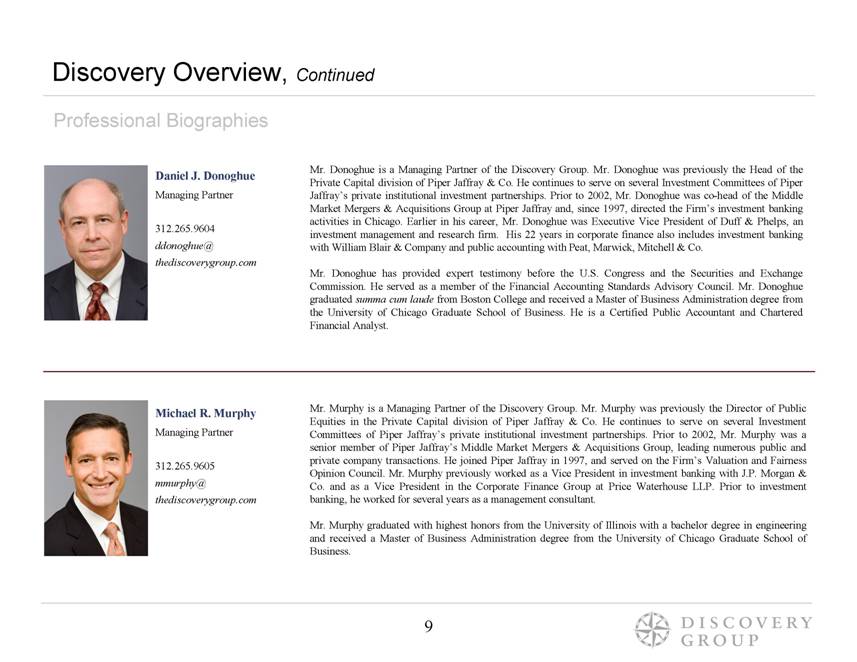
| Discovery Overview, Continued Daniel J. Donoghue Managing Partner 312.265.9604 ddonoghue@thediscoverygroup.com Michael R. Murphy Managing Partner 312.265.9605 mmurphy@thediscoverygroup.com Mr. Donoghue is a Managing Partner of the Discovery Group. Mr. Donoghue was previously the Head of the Private Capital division of Piper Jaffray & Co. He continues to serve on several Investment Committees of Piper Jaffray’s private institutional investment partnerships. Prior to 2002, Mr. Donoghue was co-head of the Middle Market Mergers & Acquisitions Group at Piper Jaffray and, since 1997, directed the Firm’s investment banking activities in Chicago. Earlier in his career, Mr. Donoghue was Executive Vice President of Duff & Phelps, an investment management and research firm. His 22 years in corporate finance also includes investment banking with William Blair & Company and public accounting with Peat, Marwick, Mitchell & Co. Mr. Donoghue has provided expert testimony before the U.S. Congress and the Securities and Exchange Commission. He served as a member of the Financial Accounting Standards Advisory Council. Mr. Donoghue graduated summa cum laude from Boston College and received a Master of Business Administration degree from the University of Chicago Graduate School of Business. He is a Certified Public Accountant and Chartered Financial Analyst. Mr. Murphy is a Managing Partner of the Discovery Group. Mr. Murphy was previously the Director of Public Equities in the Private Capital division of Piper Jaffray & Co. He continues to serve on several Investment Committees of Piper Jaffray’s private institutional investment partnerships. Prior to 2002, Mr. Murphy was a senior member of Piper Jaffray’s Middle Market Mergers & Acquisitions Group, leading numerous public and private company transactions. He joined Piper Jaffray in 1997, and served on the Firm’s Valuation and Fairness Opinion Council. Mr. Murphy previously worked as a Vice President in investment banking with J.P. Morgan & Co. and as a Vice President in the Corporate Finance Group at Price Waterhouse LLP. Prior to investment banking, he worked for several years as a management consultant. Mr. Murphy graduated with highest honors from the University of Illinois with a bachelor degree in engineering and received a Master of Business Administration degree from the University of Chicago Graduate School of Business. Professional Biographies |
| Section III Tier Governance Crisis |

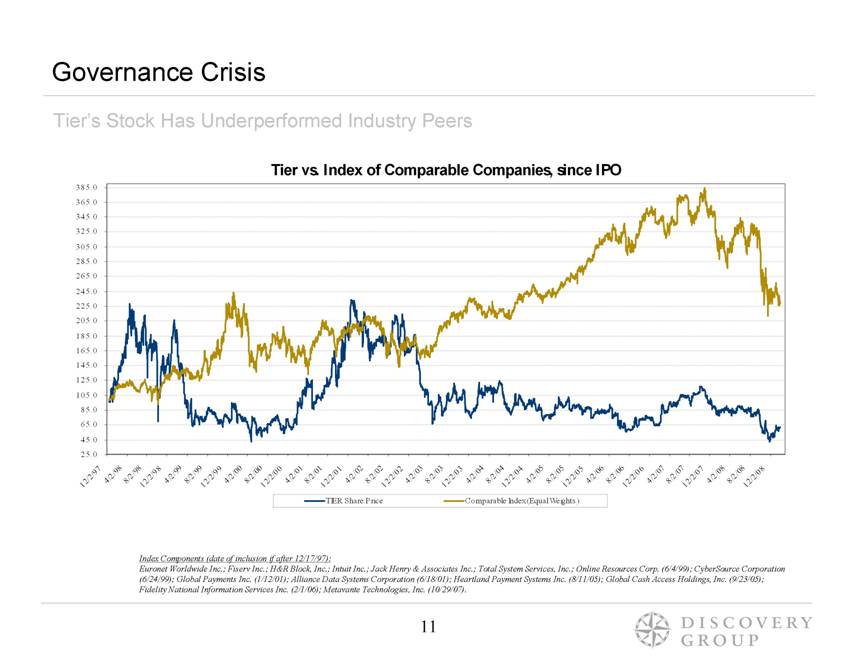
| Governance Crisis Tier’s Stock Has Underperformed Industry Peers Index Components (date of inclusion if after 12/17/97): Euronet Worldwide Inc.; Fiserv Inc.; H&R Block, Inc.; Intuit Inc.; Jack Henry & Associates Inc.; Total System Services, Inc.; Online Resources Corp. (6/4/99); CyberSource Corporation (6/24/99); Global Payments Inc. (1/12/01); Alliance Data Systems Corporation (6/18/01); Heartland Payment Systems Inc. (8/11/05); Global Cash Access Holdings, Inc. (9/23/05); Fidelity National Information Services Inc. (2/1/06); Metavante Technologies, Inc. (10/29/07). Tier vs. Index of Comparable Companies, since IPO 25.0 45.0 65.0 85.0 105.0 125.0 145.0 165.0 185.0 205.0 225.0 245.0 265.0 285.0 305.0 325.0 345.0 365.0 385.0 12/2/97 4/2/98 8/2/98 12/2/98 4/2/99 8/2/99 12/2/99 4/2/00 8/2/00 12/2/00 4/2/01 8/2/01 12/2/01 4/2/02 8/2/02 12/2/02 4/2/03 8/2/03 12/2/03 4/2/04 8/2/04 12/2/04 4/2/05 8/2/05 12/2/05 4/2/06 8/2/06 12/2/06 4/2/07 8/2/07 12/2/07 4/2/08 8/2/08 12/2/08 TIER Share Price Comparable Index (Equal Weights) |
| Governance Crisis, Continued Board Adopted a Poison Pill and Removed Special Meeting Rights In January 2006 the Tier Board took measures to deter possible offers for Tier by depriving shareholders of the ability to directly receive and act on them Adopted a poison pill with a 10% threshold (later amended to 15%) Removed the rights of stockholders with stakes of 10% or more to call a special meeting of shareholders Made changes without consent of shareholders Shareholders have never had the opportunity to vote on either the poison pill or the change in special meeting rights “If we didn’t have a poison pill, we wouldn’t be here today.” – Rossetti, September, 2008 Discovery’s non-binding shareholder proposals provide the opportunity for shareholders to recommend the reinstatement of special meeting rights and the removal of the poison pill |
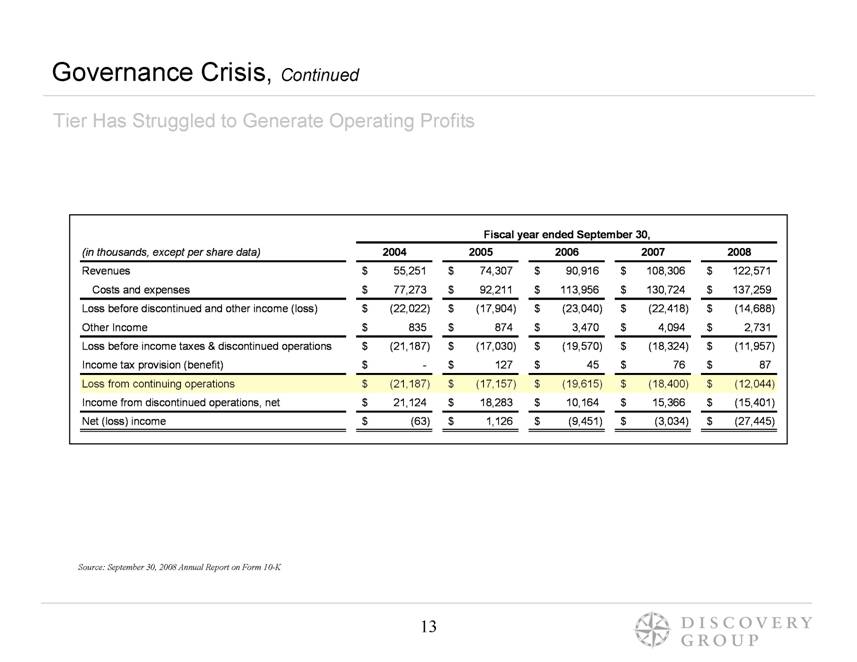
| Governance Crisis, Continued Tier Has Struggled to Generate Operating Profits Source: September 30, 2008 Annual Report on Form 10-K (in thousands, except per share data) 2004 2005 2006 2007 2008 Revenues 55,251 $ 74,307 $ 90,916 $ 108,306 $ 122,571 $ Costs and expenses 77,273 $ 92,211 $ 113,956 $ 130,724 $ 137,259 $ Loss before discontinued and other income (loss) (22,022) $ (17,904) $ (23,040) $ (22,418) $ (14,688) $ Other Income 835 $ 874 $ 3,470 $ 4,094 $ 2,731 $ Loss before income taxes & discontinued operations (21,187) $ (17,030) $ (19,570) $ (18,324) $ (11,957) $ Income tax provision (benefit) - $ 127 $ 45 $ 76 $ 87 $ Loss from continuing operations (21,187) $ (17,157) $ (19,615) $ (18,400) $ (12,044) $ Income from discontinued operations, net 21,124 $ 18,283 $ 10,164 $ 15,366 $ (15,401) $ Net (loss) income (63) $ 1,126 $ (9,451) $ (3,034) $ (27,445) $ Fiscal year ended September 30, |
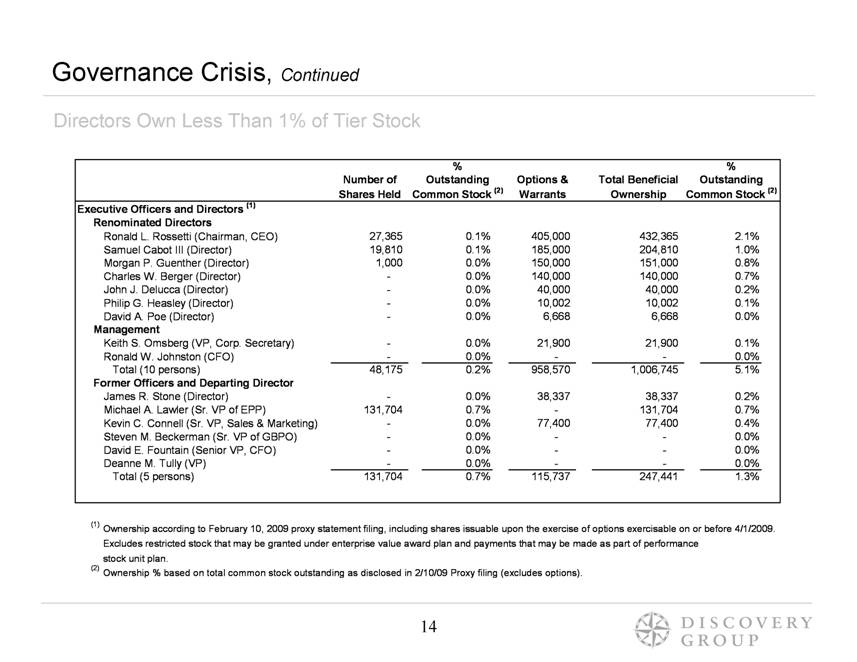
| Governance Crisis, Continued Directors Own Less Than 1% of Tier Stock % % Number of Outstanding Options & Total Beneficial Outstanding Shares Held Common Stock (2) Warrants Ownership Common Stock (2) Executive Officers and Directors (1) Renominated Directors Ronald L. Rossetti (Chairman, CEO) 27,365 0.1% 405,000 432,365 2.1% Samuel Cabot III (Director) 19,810 0.1% 185,000 204,810 1.0% Morgan P. Guenther (Director) 1,000 0.0% 150,000 151,000 0.8% Charles W. Berger (Director) - 0.0% 140,000 140,000 0.7% John J. Delucca (Director) - 0.0% 40,000 40,000 0.2% Philip G. Heasley (Director) - 0.0% 10,002 10,002 0.1% David A. Poe (Director) - 0.0% 6,668 6,668 0.0% Management Keith S. Omsberg (VP, Corp. Secretary) - 0.0% 21,900 21,900 0.1% Ronald W. Johnston (CFO) - 0.0% - - 0.0% Total (10 persons) 48,175 0.2% 958,570 1,006,745 5.1% Former Officers and Departing Director James R. Stone (Director) - 0.0% 38,337 38,337 0.2% Michael A. Lawler (Sr. VP of EPP) 131,704 0.7% - 131,704 0.7% Kevin C. Connell (Sr. VP, Sales & Marketing) - 0.0% 77,400 77,400 0.4% Steven M. Beckerman (Sr. VP of GBPO) - 0.0% - - 0.0% David E. Fountain (Senior VP, CFO) - 0.0% - - 0.0% Deanne M. Tully (VP) - 0.0% - - 0.0% Total (5 persons) 131,704 0.7% 115,737 247,441 1.3% (2) Ownership % based on total common stock outstanding as disclosed in 2/10/09 Proxy filing (excludes options). (1) Ownership according to February 10, 2009 proxy statement filing, including shares issuable upon the exercise of options exercisable on or before 4/1/2009. Excludes restricted stock that may be granted under enterprise value award plan and payments that may be made as part of performance stock unit plan. |
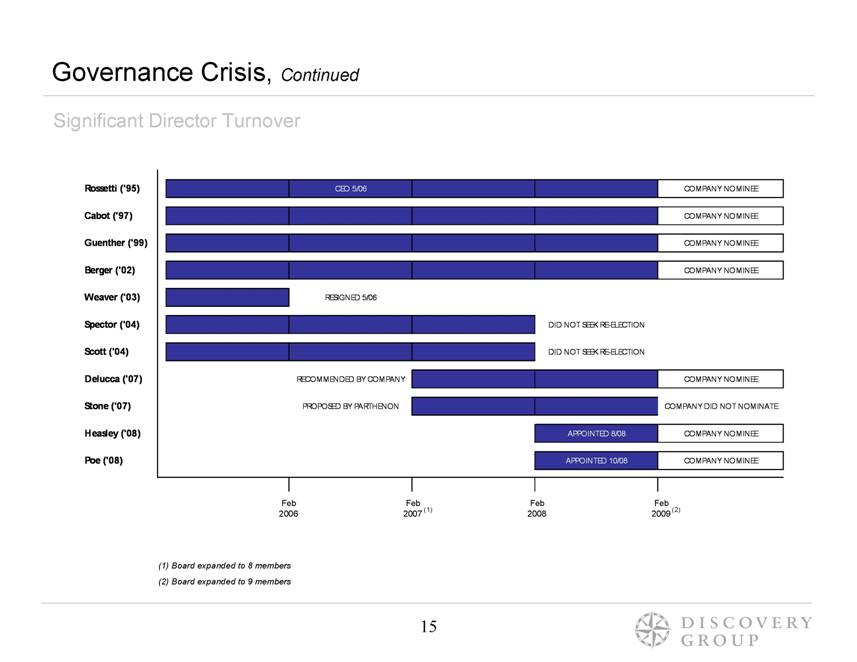
| Governance Crisis, Continued Significant Director Turnover (1) Board expanded to 8 members (2) Board expanded to 9 members Feb Feb Feb Feb 2006 2007 2008 2009 (1) (2) Rossetti (‘95) CEO 5/06 COMPANY NOMINEE Cabot (‘97) COMPANY NOMINEE Guenther (‘99) COMPANY NOMINEE Berger (‘02) COMPANY NOMINEE Weaver (‘03) RESIGNED 5/06 Spector (‘04) DID NOT SEEK RE-ELECTION Scott (‘04) DID NOT SEEK RE-ELECTION Delucca (‘07) RECOMMENDED BY COMPANY COMPANY NOMINEE Stone (‘07) PROPOSED BY PARTHENON COMPANY DID NOT NOMINATE Heasley (‘08) APPOINTED 8/08 COMPANY NOMINEE Poe (‘08) APPOINTED 10/08 COMPANY NOMINEE |
| Governance Crisis, Continued Leadership Turmoil Director Spector and Director Scott did not seek re-election to the Board in February, 2008. Vice President and General Counsel Deanne Tully departed March, 2008. Senior Vice President & CFO David Fountain departed in April, 2008. EPP Senior Vice President Michael Lawler departed in September, 2008. Senior Vice President Steven Beckerman departed September, 2008. Senior Vice President Kevin Connell departed February, 2009. |
| CEO (or interim CEO) since May, 2006. From May 2006 until April 2008 compensation included: $50,000 per month base salary, plus $50,000 per month guaranteed bonus May, 2006 Employment Agreement expired in December, 2007. New Agreement not finalized until April, 2008. Two year contract reduces salary to $400,000 and modifies bonus provisions. Provides Enterprise Value Award Plan: Tier Share Price Units Awarded Value . $ 11.00 180,000 $1,980,000 $ 13.00 185,000 $2,405,000 $ 15.00 185,000 $2,775,000 Total: $7,160,000 In December, 2008, the Compensation Committee adopted the Executive Performance Stock Unit Plan (PSU Plan) and amended Mr. Rossetti’s Enterprise Value Award Plan to include: Tier Share Price Units Awarded Value $ 8.00 150,000 $1,200,000 Governance Crisis, Continued Chairman and CEO Ron Rossetti’s Compensation |

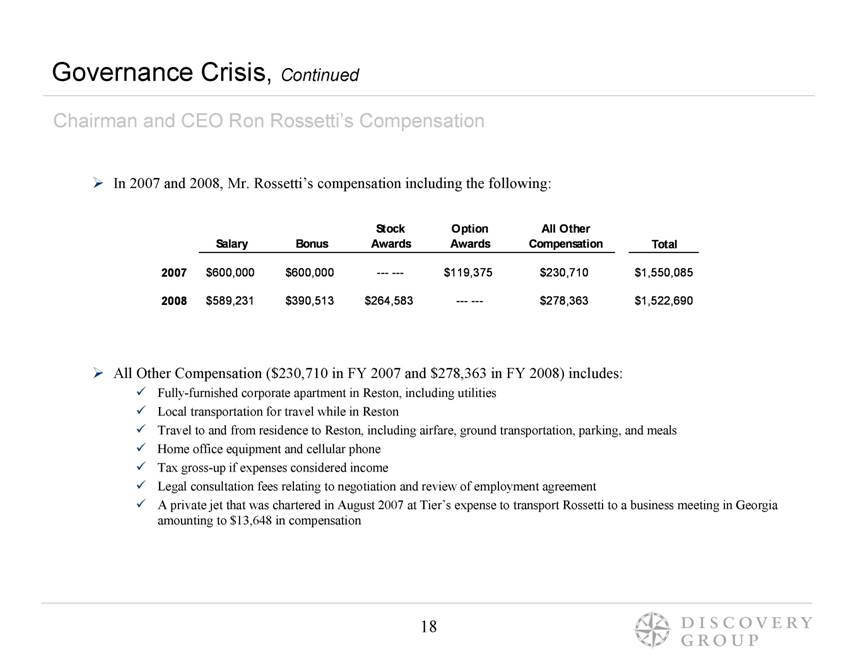
| In 2007 and 2008, Mr. Rossetti’s compensation including the following: All Other Compensation ($230,710 in FY 2007 and $278,363 in FY 2008) includes: Fully-furnished corporate apartment in Reston, including utilities Local transportation for travel while in Reston Travel to and from residence to Reston, including airfare, ground transportation, parking, and meals Home office equipment and cellular phone Tax gross-up if expenses considered income Legal consultation fees relating to negotiation and review of employment agreement A private jet that was chartered in August 2007 at Tier’s expense to transport Rossetti to a business meeting in Georgia amounting to $13,648 in compensation Governance Crisis, Continued Chairman and CEO Ron Rossetti’s Compensation Salary Bonus Stock Awards Option Awards All Other Compensation Total 2007 $600,000 $600,000 --- --- $119,375 $230,710 $1,550,085 2008 $589,231 $390,513 $264,583 --- --- $278,363 $1,522,690 |
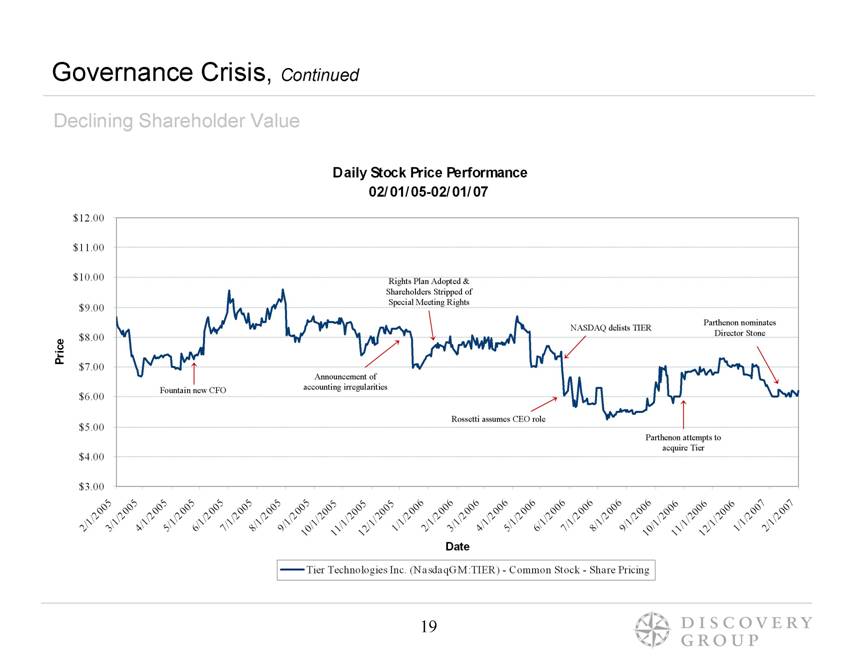
| Governance Crisis, Continued Declining Shareholder Value Fountain new CFO Announcement of accounting irregularities Rights Plan Adopted & Shareholders Stripped of Special Meeting Rights NASDAQ delists TIER Rossetti assumes CEO role Parthenon nominates Director Stone Parthenon attempts to acquire Tier Daily Stock Price Performance 02/01/05-02/01/07 $3.00 $4.00 $5.00 $6.00 $7.00 $8.00 $9.00 $10.00 $11.00 $12.00 2/1/2005 3/1/2005 4/1/2005 5/1/2005 6/1/2005 7/1/2005 8/1/2005 9/1/2005 10/1/2005 11/1/2005 12/1/2005 1/1/2006 2/1/2006 3/1/2006 4/1/2006 5/1/2006 6/1/2006 7/1/2006 8/1/2006 9/1/2006 10/1/2006 11/1/2006 12/1/2006 1/1/2007 2/1/2007 Date Price Tier Technologies Inc. (NasdaqGM:TIER) - Common Stock - Share Pricing |
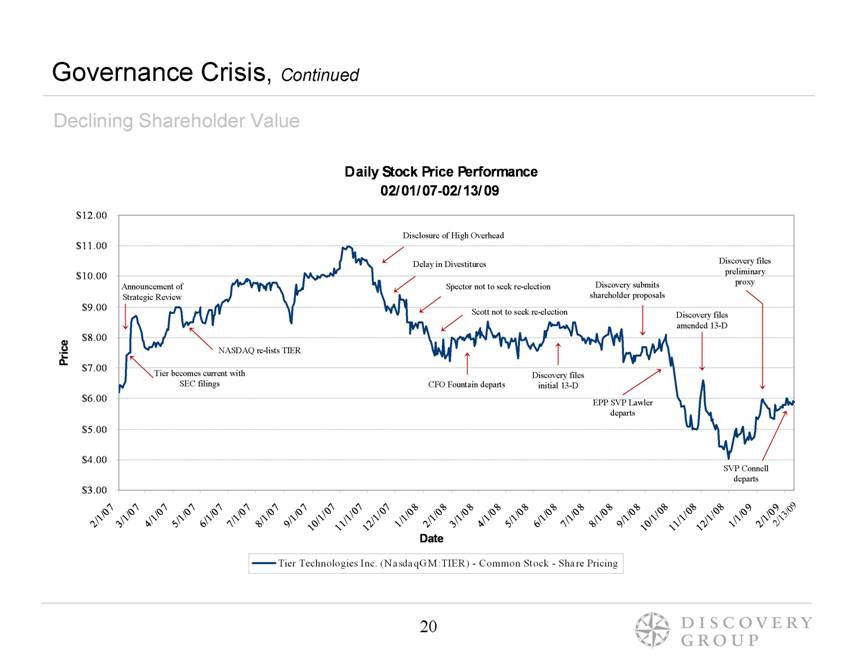
| Governance Crisis, Continued Declining Shareholder Value Tier becomes current with SEC filings NASDAQ re-lists TIER CFO Fountain departs Disclosure of High Overhead Delay in Divestitures Spector not to seek re-election Scott not to seek re-election Discovery files initial 13-D EPP SVP Lawler departs Announcement of Strategic Review Discovery submits shareholder proposals Discovery files amended 13-D Discovery files preliminary proxy SVP Connell departs 2/13/09 Daily Stock Price Performance 02/01/07-02/13/09 $3.00 $4.00 $5.00 $6.00 $7.00 $8.00 $9.00 $10.00 $11.00 $12.00 2/1/07 3/1/07 4/1/07 5/1/07 6/1/07 7/1/07 8/1/07 9/1/07 10/1/07 11/1/07 12/1/07 1/1/08 2/1/08 3/1/08 4/1/08 5/1/08 6/1/08 7/1/08 8/1/08 9/1/08 10/1/08 11/1/08 12/1/08 1/1/09 2/1/09 Date Price Tier Technologies Inc. (NasdaqGM:TIER) - Common Stock - Share Pricing |
| Section IV EPP Opportunity |

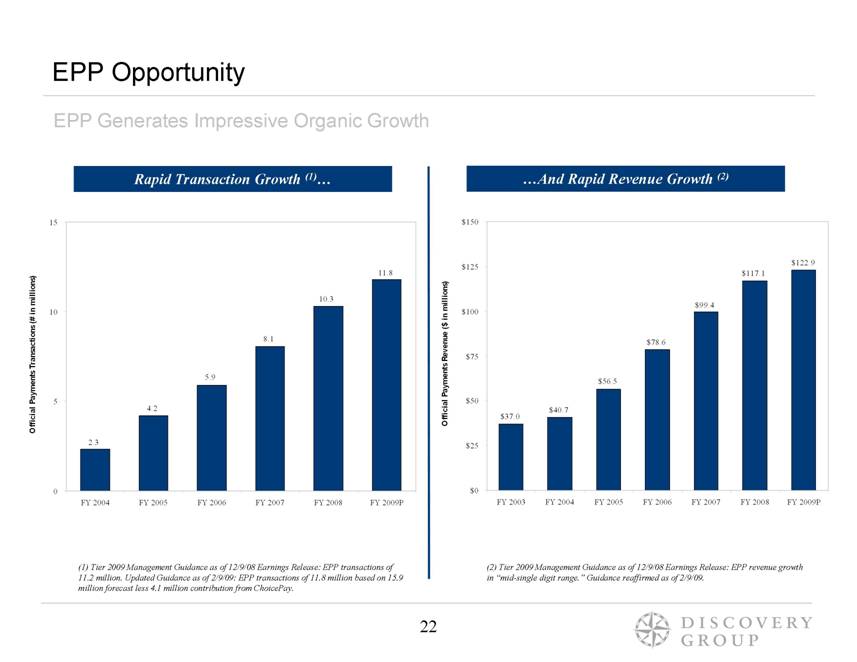
| EPP Generates Impressive Organic Growth Rapid Transaction Growth (1)... ...And Rapid Revenue Growth (2) EPP Opportunity (1) Tier 2009 Management Guidance as of 12/9/08 Earnings Release: EPP transactions of 11.2 million. Updated Guidance as of 2/9/09: EPP transactions of 11.8 million based on 15.9 million forecast less 4.1 million contribution from ChoicePay. (2) Tier 2009 Management Guidance as of 12/9/08 Earnings Release: EPP revenue growth in “mid-single digit range.” Guidance reaffirmed as of 2/9/09. $122.9 $117.1 $99.4 $78.6 $56.5 $37.0 $40.7 $0 $25 $50 $75 $100 $125 $150 FY 2003 FY 2004 FY 2005 FY 2006 FY 2007 FY 2008 FY 2009P Official Payments Revenue ($ in millions) 4.2 2.3 5.9 8.1 10.3 11.8 0 5 10 15 FY 2004 FY 2005 FY 2006 FY 2007 FY 2008 FY 2009P Official Payments Transactions (# in millions) |
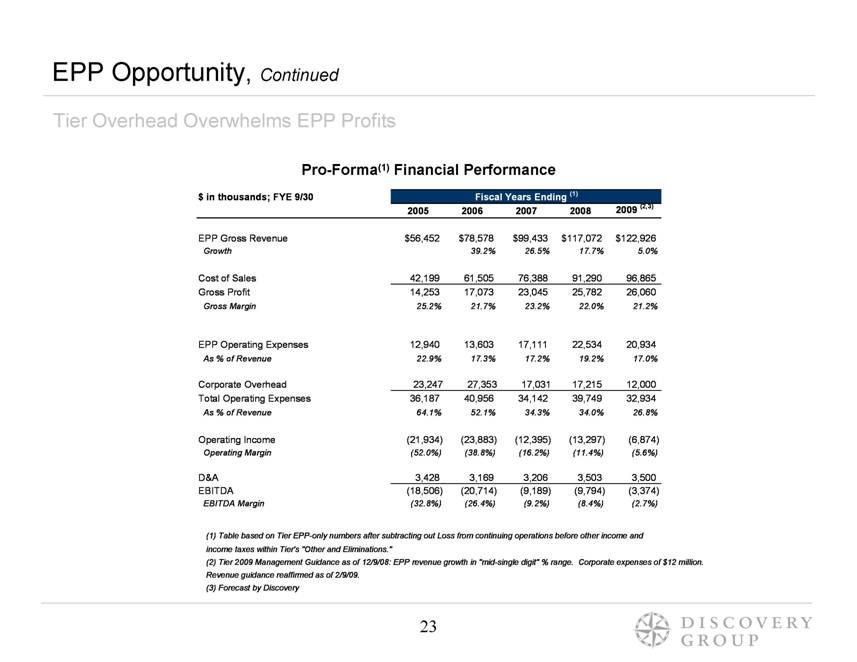
| Tier Overhead Overwhelms EPP Profits EPP Opportunity, Continued Pro-Forma(1) Financial Performance (1) Table based on Tier EPP-only numbers after subtracting out Loss from continuing operations before other income and income taxes within Tier's “Other and Eliminations.” (2) Tier 2009 Management Guidance as of 12/9/08: EPP revenue growth in “mid-single digit” % range. Corporate expenses of $12 million. Revenue guidance reaffirmed as of 2/9/09. (3) Forecast by Discovery $ in thousands; FYE 9/30 2005 2006 2007 2008 2009 (2,3) EPP Gross Revenue $56,452 $78,578 $99,433 $117,072 $122,926 Growth 39.2% 26.5% 17.7% 5.0% Cost of Sales 42,199 61,505 76,388 91,290 96,865 Gross Profit 14,253 17,073 23,045 25,782 26,060 Gross Margin 25.2% 21.7% 23.2% 22.0% 21.2% EPP Operating Expenses 12,940 13,603 17,111 22,534 20,934 As % of Revenue 22.9% 17.3% 17.2% 19.2% 17.0% Corporate Overhead 23,247 27,353 17,031 17,215 12,000 Total Operating Expenses 36,187 40,956 34,142 39,749 32,934 As % of Revenue 64.1% 52.1% 34.3% 34.0% 26.8% Operating Income (21,934) (23,883) (12,395) (13,297) (6,874) Operating Margin (52.0%) (38.8%) (16.2%) (11.4%) (5.6%) D&A 3,428 3,169 3,206 3,503 3,500 EBITDA (18,506) (20,714) (9,189) (9,794) (3,374) EBITDA Margin (32.8%) (26.4%) (9.2%) (8.4%) (2.7%) Fiscal Years Ending (1) |
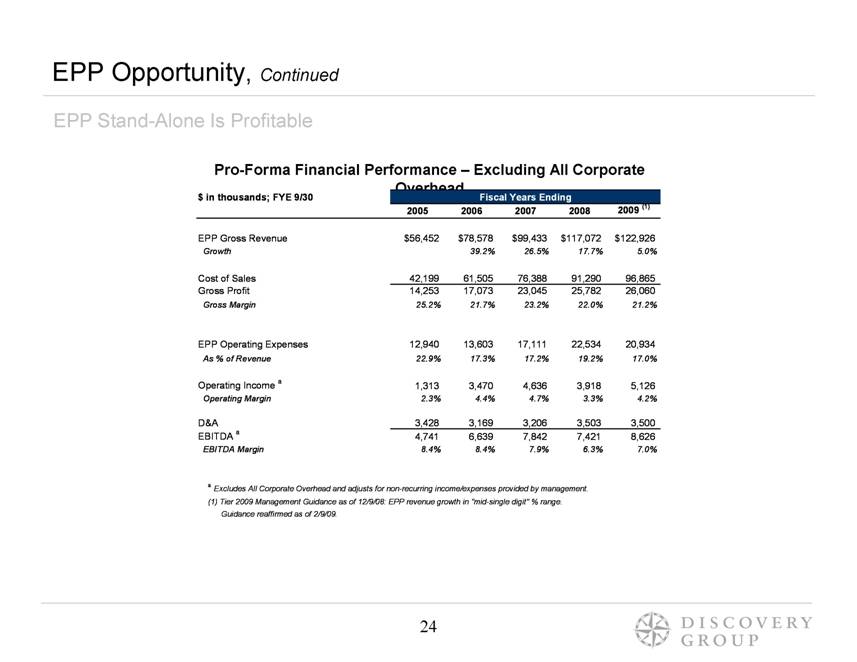
| EPP Stand-Alone Is Profitable EPP Opportunity, Continued Pro-Forma Financial Performance – Excluding All Corporate Overhead a Excludes All Corporate Overhead and adjusts for non-recurring income/expenses provided by management. (1) Tier 2009 Management Guidance as of 12/9/08: EPP revenue growth in “mid-single digit” % range. Guidance reaffirmed as of 2/9/09. $ in thousands; FYE 9/30 2005 2006 2007 2008 2009 (1) EPP Gross Revenue $56,452 $78,578 $99,433 $117,072 $122,926 Growth 39.2% 26.5% 17.7% 5.0% Cost of Sales 42,199 61,505 76,388 91,290 96,865 Gross Profit 14,253 17,073 23,045 25,782 26,060 Gross Margin 25.2% 21.7% 23.2% 22.0% 21.2% EPP Operating Expenses 12,940 13,603 17,111 22,534 20,934 As % of Revenue 22.9% 17.3% 17.2% 19.2% 17.0% Operating Income a 1,313 3,470 4,636 3,918 5,126 Operating Margin 2.3% 4.4% 4.7% 3.3% 4.2% D&A 3,428 3,169 3,206 3,503 3,500 EBITDA a 4,741 6,639 7,842 7,421 8,626 EBITDA Margin 8.4% 8.4% 7.9% 6.3% 7.0% Fiscal Years Ending |
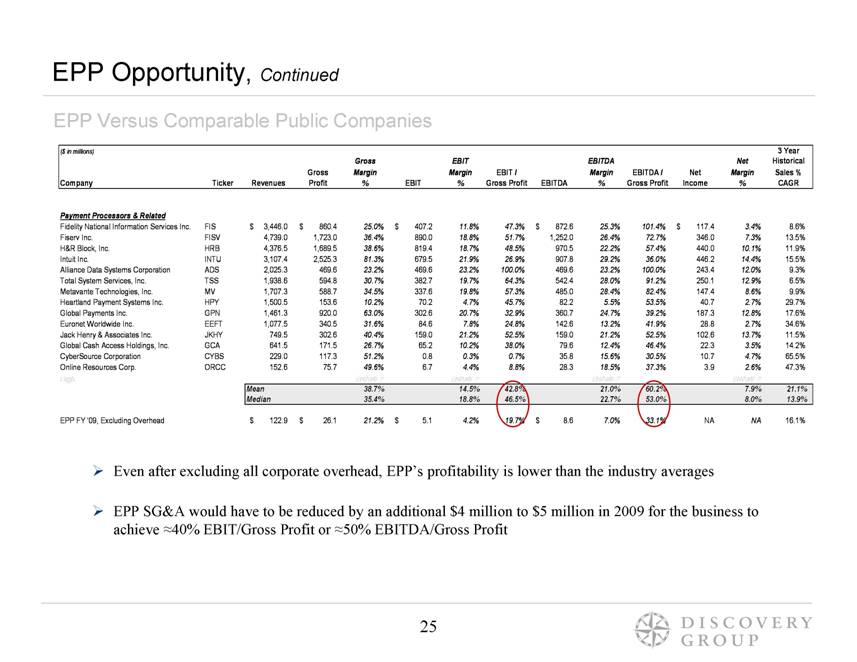
| EPP Versus Comparable Public Companies EPP Opportunity, Continued Even after excluding all corporate overhead, EPP’s profitability is lower than the industry averages EPP SG&A would have to be reduced by an additional $4 million to $5 million in 2009 for the business to achieve =40% EBIT/Gross Profit or =50% EBITDA/Gross Profit ($ in millions) 3 Year Gross EBIT EBITDA Net Historical Gross Margin Margin EBIT / Margin EBITDA / Net Margin Sales % Company Ticker Revenues Profit % EBIT % Gross Profit EBITDA % Gross Profit Income % CAGR Payment Processors & Related Fidelity National Information Services Inc. FIS 3,446.0 $ 860.4 $ 25.0% 407.2 $ 11.8% 47.3% 872.6 $ 25.3% 101.4% 117.4 $ 3.4% 8.6% Fiserv Inc. FISV 4,739.0 1,723.0 36.4% 890.0 18.8% 51.7% 1,252.0 26.4% 72.7% 346.0 7.3% 13.5% H&R Block, Inc. HRB 4,376.5 1,689.5 38.6% 819.4 18.7% 48.5% 970.5 22.2% 57.4% 440.0 10.1% 11.9% Intuit Inc. INTU 3,107.4 2,525.3 81.3% 679.5 21.9% 26.9% 907.8 29.2% 36.0% 446.2 14.4% 15.5% Alliance Data Systems Corporation ADS 2,025.3 469.6 23.2% 469.6 23.2% 100.0% 469.6 23.2% 100.0% 243.4 12.0% 9.3% Total System Services, Inc. TSS 1,938.6 594.8 30.7% 382.7 19.7% 64.3% 542.4 28.0% 91.2% 250.1 12.9% 6.5% Metavante Technologies, Inc. MV 1,707.3 588.7 34.5% 337.6 19.8% 57.3% 485.0 28.4% 82.4% 147.4 8.6% 9.9% Heartland Payment Systems Inc. HPY 1,500.5 153.6 10.2% 70.2 4.7% 45.7% 82.2 5.5% 53.5% 40.7 2.7% 29.7% Global Payments Inc. GPN 1,461.3 920.0 63.0% 302.6 20.7% 32.9% 360.7 24.7% 39.2% 187.3 12.8% 17.6% Euronet Worldwide Inc. EEFT 1,077.5 340.5 31.6% 84.6 7.8% 24.8% 142.6 13.2% 41.9% 28.8 2.7% 34.6% Jack Henry & Associates Inc. JKHY 749.5 302.6 40.4% 159.0 21.2% 52.5% 159.0 21.2% 52.5% 102.6 13.7% 11.5% Global Cash Access Holdings, Inc. GCA 641.5 171.5 26.7% 65.2 10.2% 38.0% 79.6 12.4% 46.4% 22.3 3.5% 14.2% CyberSource Corporation CYBS 229.0 117.3 51.2% 0.8 0.3% 0.7% 35.8 15.6% 30.5% 10.7 4.7% 65.5% Online Resources Corp. ORCC 152.6 75.7 49.6% 6.7 4.4% 8.8% 28.3 18.5% 37.3% 3.9 2.6% 47.3% Mean 38.7% 14.5% 42.8% 21.0% 60.2% 7.9% 21.1% Median 35.4% 18.8% 46.5% 22.7% 53.0% 8.0% 13.9% EPP FY '09, Excluding Overhead 122.9 $ 26.1 $ 21.2% 5.1 $ 4.2% 19.7% 8.6 $ 7.0% 33.1% NA NA 16.1% |
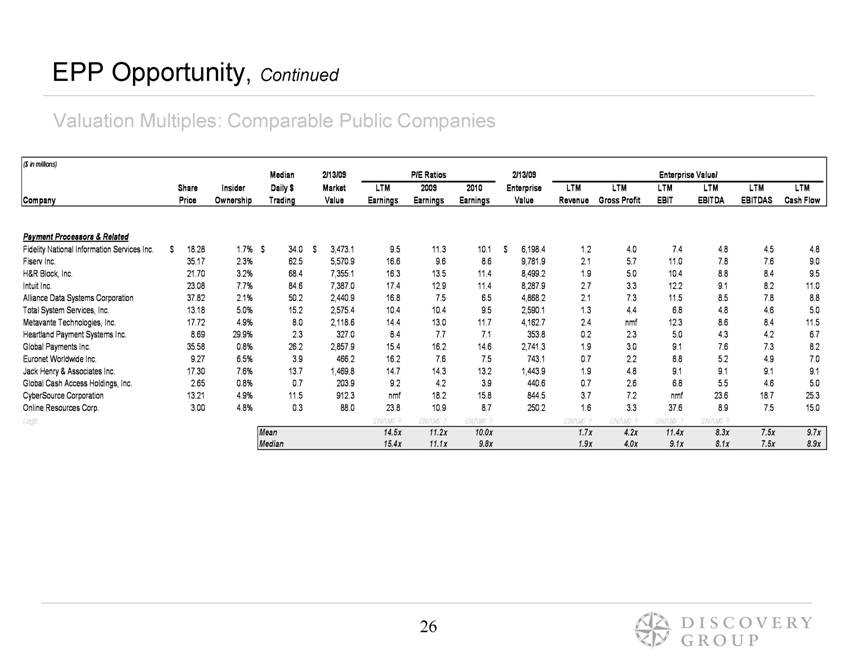
| Valuation Multiples: Comparable Public Companies EPP Opportunity, Continued ($ in millions) Median 2/13/09 P/E Ratios 2/13/09 Enterprise Value/ Share Insider Daily $ Market LTM 2009 2010 Enterprise LTM LTM LTM LTM LTM LTM Company Price Ownership Trading Value Earnings Earnings Earnings Value Revenue Gross Profit EBIT EBITDA EBITDAS Cash Flow Payment Processors & Related Fidelity National Information Services Inc. 18.28 $ 1.7% 34.0 $ 3,473.1 $ 9.5 11.3 10.1 6,198.4 $ 1.2 4.0 7.4 4.8 4.5 4.8 Fiserv Inc. 35.17 2.3% 62.5 5,570.9 16.6 9.6 8.6 9,781.9 2.1 5.7 11.0 7.8 7.6 9.0 H&R Block, Inc. 21.70 3.2% 68.4 7,355.1 16.3 13.5 11.4 8,499.2 1.9 5.0 10.4 8.8 8.4 9.5 Intuit Inc. 23.08 7.7% 84.6 7,387.0 17.4 12.9 11.4 8,287.9 2.7 3.3 12.2 9.1 8.2 11.0 Alliance Data Systems Corporation 37.82 2.1% 50.2 2,440.9 16.8 7.5 6.5 4,868.2 2.1 7.3 11.5 8.5 7.8 8.8 Total System Services, Inc. 13.18 5.0% 15.2 2,575.4 10.4 10.4 9.5 2,590.1 1.3 4.4 6.8 4.8 4.6 5.0 Metavante Technologies, Inc. 17.72 4.9% 8.0 2,118.6 14.4 13.0 11.7 4,162.7 2.4 nmf 12.3 8.6 8.4 11.5 Heartland Payment Systems Inc. 8.69 29.9% 2.3 327.0 8.4 7.7 7.1 353.8 0.2 2.3 5.0 4.3 4.2 6.7 Global Payments Inc. 35.58 0.8% 26.2 2,857.9 15.4 16.2 14.6 2,741.3 1.9 3.0 9.1 7.6 7.3 8.2 Euronet Worldwide Inc. 9.27 6.5% 3.9 466.2 16.2 7.6 7.5 743.1 0.7 2.2 8.8 5.2 4.9 7.0 Jack Henry & Associates Inc. 17.30 7.6% 13.7 1,469.8 14.7 14.3 13.2 1,443.9 1.9 4.8 9.1 9.1 9.1 9.1 Global Cash Access Holdings, Inc. 2.65 0.8% 0.7 203.9 9.2 4.2 3.9 440.6 0.7 2.6 6.8 5.5 4.6 5.0 CyberSource Corporation 13.21 4.9% 11.5 912.3 nmf 18.2 15.8 844.5 3.7 7.2 nmf 23.6 18.7 25.3 Online Resources Corp. 3.00 4.8% 0.3 88.0 23.8 10.9 8.7 250.2 1.6 3.3 37.6 8.9 7.5 15.0 Mean 14.5x 11.2x 10.0x 1.7x 4.2x 11.4x 8.3x 7.5x 9.7x Median 15.4x 11.1x 9.8x 1.9x 4.0x 9.1x 8.1x 7.5x 8.9x |
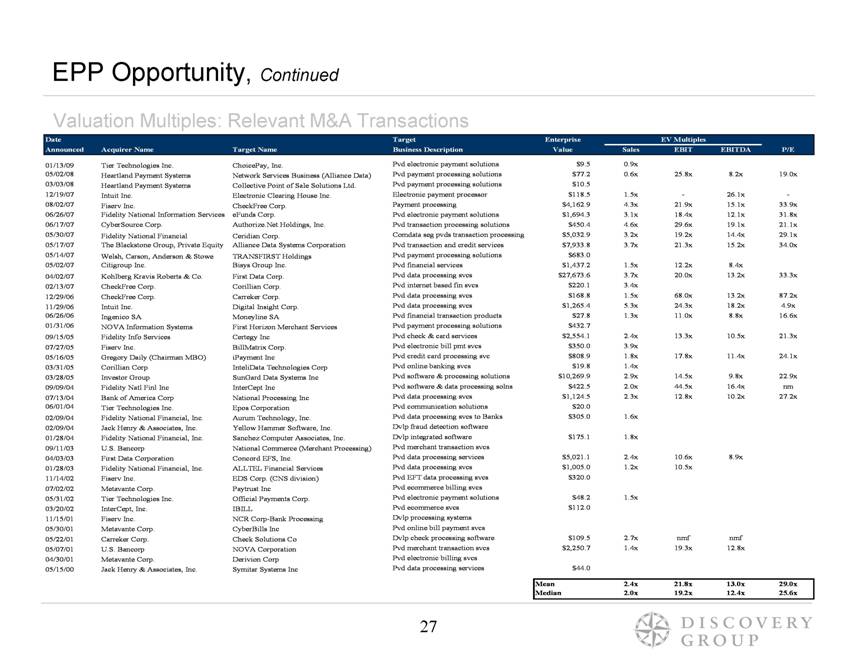
| EPP Opportunity, Continued Valuation Multiples: Relevant M&A Transactions Date Target Enterprise EV Multiples Announced Acquirer Name Target Name Business Description Value Sales EBIT EBITDA P/E 01/13/09 Tier Technologies Inc. ChoicePay, Inc. Pvd electronic payment solutions $9.5 0.9x 05/02/08 Heartland Payment Systems Network Services Business (Alliance Data) Pvd payment processing solutions $77.2 0.6x 25.8x 8.2x 19.0x 03/03/08 Heartland Payment Systems Collective Point of Sale Solutions Ltd. Pvd payment processing solutions $10.5 12/19/07 Intuit Inc. Electronic Clearing House Inc. Electronic payment processor $118.5 1.5x - 26.1x - 08/02/07 Fiserv Inc. CheckFree Corp. Payment processing $4,162.9 4.3x 21.9x 15.1x 33.9x 06/26/07 Fidelity National Information Services Inc. (NYSE:FIS) eFunds Corp. Pvd electronic payment solutions $1,694.3 3.1x 18.4x 12.1x 31.8x 06/17/07 CyberSource Corp. Authorize.Net Holdings, Inc. Pvd transaction processing solutions $450.4 4.6x 29.6x 19.1x 21.1x 05/30/07 Fidelity National Financial Ceridian Corp. Comdata seg pvds transaction processing $5,032.9 3.2x 19.2x 14.4x 29.1x 05/17/07 The Blackstone Group, Private Equity Group Alliance Data Systems Corporation Pvd transaction and credit services $7,933.8 3.7x 21.3x 15.2x 34.0x 05/14/07 Welsh, Carson, Anderson & Stowe TRANSFIRST Holdings Pvd payment processing solutions $683.0 05/02/07 Citigroup Inc. Bisys Group Inc. Pvd financial services $1,437.2 1.5x 12.2x 8.4x 04/02/07 Kohlberg Kravis Roberts & Co. First Data Corp. Pvd data processing svcs $27,673.6 3.7x 20.0x 13.2x 33.3x 02/13/07 CheckFree Corp. Corillian Corp. Pvd internet based fin svcs $220.1 3.4x 12/29/06 CheckFree Corp. Carreker Corp. Pvd data processing svcs $168.8 1.5x 68.0x 13.2x 87.2x 11/29/06 Intuit Inc. Digital Insight Corp. Pvd data processing svcs $1,265.4 5.3x 24.3x 18.2x 4.9x 06/26/06 Ingenico SA Moneyline SA Pvd financial transaction products $27.8 1.3x 11.0x 8.8x 16.6x 01/31/06 NOVA Information Systems First Horizon Merchant Services Pvd payment processing solutions $432.7 09/15/05 Fidelity Info Services Certegy Inc Pvd check & card services $2,554.1 2.4x 13.3x 10.5x 21.3x 07/27/05 Fiserv Inc. BillMatrix Corp. Pvd electronic bill pmt svcs $350.0 3.9x 05/16/05 Gregory Daily (Chairman MBO) iPayment Inc Pvd credit card processing svc $808.9 1.8x 17.8x 11.4x 24.1x 03/31/05 Corillian Corp InteliData Technologies Corp Pvd online banking svcs $19.8 1.4x 03/28/05 Investor Group SunGard Data Systems Inc Pvd software & processing solutions $10,269.9 2.9x 14.5x 9.8x 22.9x 09/09/04 Fidelity Natl Finl Inc InterCept Inc Pvd software & data processing solns $422.5 2.0x 44.5x 16.4x nm 07/13/04 Bank of America Corp National Processing Inc Pvd data processing svcs $1,124.5 2.3x 12.8x 10.2x 27.2x 06/01/04 Tier Technologies Inc. Epos Corporation Pvd communication solutions $20.0 02/09/04 Fidelity National Financial, Inc. Aurum Technology, Inc. Pvd data processing svcs to Banks $305.0 1.6x 02/09/04 Jack Henry & Associates, Inc. Yellow Hammer Software, Inc. Dvlp fraud detection software 01/28/04 Fidelity National Financial, Inc. Sanchez Computer Associates, Inc. Dvlp integrated software $175.1 1.8x 09/11/03 U.S. Bancorp National Commerce (Merchant Processing) Pvd merchant transaction svcs 04/03/03 First Data Corporation Concord EFS, Inc. Pvd data processing services $5,021.1 2.4x 10.6x 8.9x 01/28/03 Fidelity National Financial, Inc. ALLTEL Financial Services Pvd data processing svcs $1,005.0 1.2x 10.5x 11/14/02 Fiserv Inc. EDS Corp. (CNS division) Pvd EFT data processing svcs $320.0 07/02/02 Metavante Corp. Paytrust Inc Pvd ecommerce billing svcs 05/31/02 Tier Technologies Inc. Official Payments Corp. Pvd electronic payment solutions $48.2 1.5x 03/20/02 InterCept, Inc. IBILL Pvd ecommerce svcs $112.0 11/15/01 Fiserv Inc. NCR Corp-Bank Processing Dvlp processing systems 05/30/01 Metavante Corp. CyberBills Inc Pvd online bill payment svcs 05/22/01 Carreker Corp. Check Solutions Co Dvlp check processing software $109.5 2.7x nmf nmf 05/07/01 U.S. Bancorp NOVA Corporation Pvd merchant transaction svcs $2,250.7 1.4x 19.3x 12.8x 04/30/01 Metavante Corp. Derivion Corp Pvd electronic billing svcs 05/15/00 Jack Henry & Associates, Inc. Symitar Systems Inc Pvd data processing services $44.0 Mean 2.4x 21.8x 13.0x 29.0x Median 2.0x 19.2x 12.4x 25.6x |
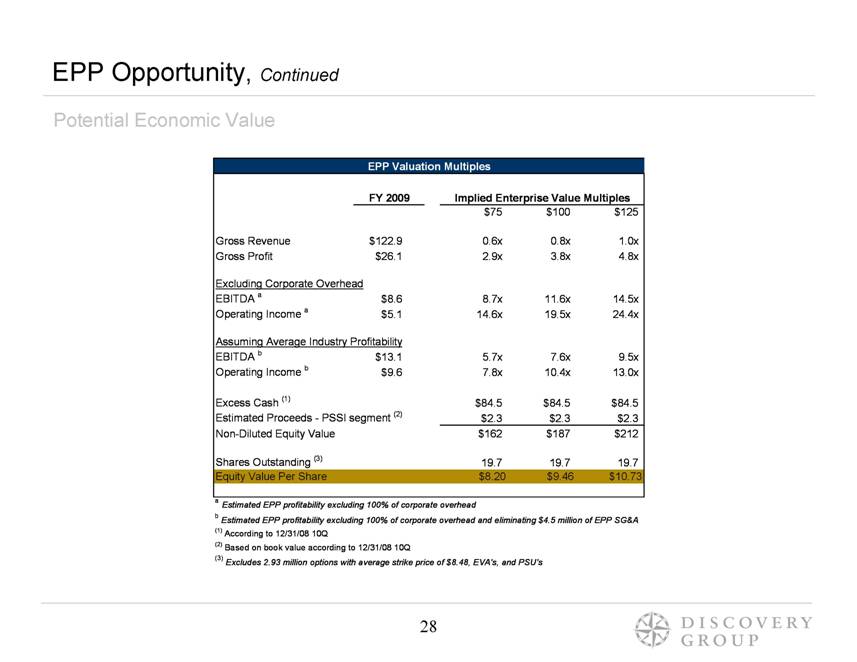
| Potential Economic Value EPP Opportunity, Continued EPP Valuation Multiples FY 2009 Implied Enterprise Value Multiples $75 $100 $125 Gross Revenue $122.9 0.6x 0.8x 1.0x Gross Profit $26.1 2.9x 3.8x 4.8x Excluding Corporate Overhead EBITDA a $8.6 8.7x 11.6x 14.5x Operating Income a $5.1 14.6x 19.5x 24.4x Assuming Average Industry Profitability EBITDA b $13.1 5.7x 7.6x 9.5x Operating Income b $9.6 7.8x 10.4x 13.0x Excess Cash (1) $84.5 $84.5 $84.5 Estimated Proceeds - PSSI segment (2) $2.3 $2.3 $2.3 Non-Diluted Equity Value $162 $187 $212 Shares Outstanding (3) 19.7 19.7 19.7 Equity Value Per Share $8.20 $9.46 $10.73 a Estimated EPP profitability excluding 100% of corporate overhead b Estimated EPP profitability excluding 100% of corporate overhead and eliminating $4.5 million of EPP SG&A (1) According to 12/31/08 10Q (2) Based on book value according to 12/31/08 10Q (3) Excludes 2.93 million options with average strike price of $8.48, EVA's, and PSU's |
| EPP Opportunity, Continued EPP Severely Undervalued as Public Company (1) Discovery estimates that one third of $20 million EPOS acquisition was for EPP portion of EPOS (2) Cash balance of $84.5 million according to 1Q FY2009 10Q, plus estimated proceeds of $2.3 million from PSSI sale $86.8 |

| Section V Tier Shareholders |

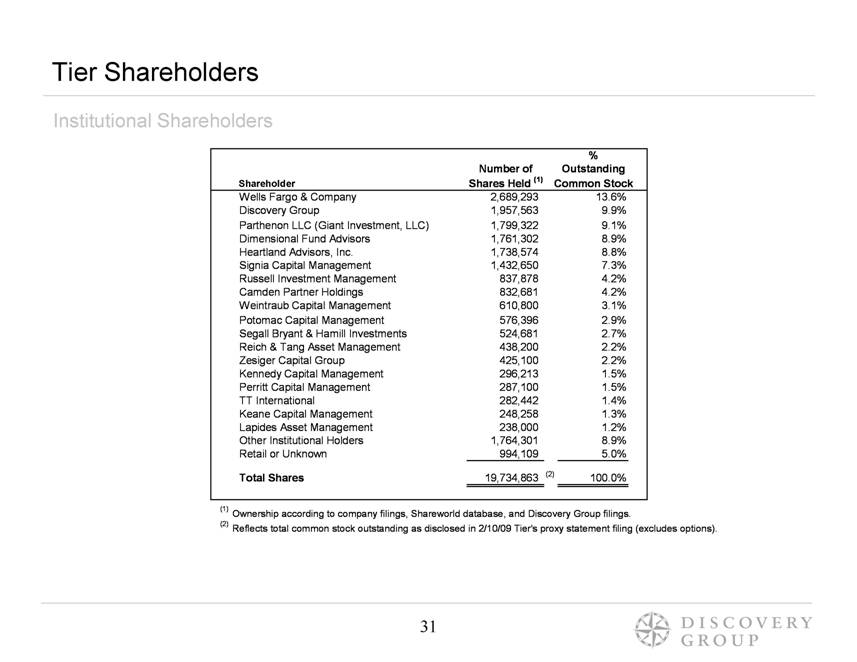
| Tier Shareholders Institutional Shareholders Shareholder % Number of Outstanding Shares Held (1) Common Stock Wells Fargo & Company 2,689,293 13.6% Discovery Group 1,957,563 9.9% Parthenon LLC (Giant Investment, LLC) 1,799,322 9.1% Dimensional Fund Advisors 1,761,302 8.9% Heartland Advisors, Inc. 1,738,574 8.8% Signia Capital Management 1,432,650 7.3% Russell Investment Management 837,878 4.2% Camden Partner Holdings 832,681 4.2% Weintraub Capital Management 610,800 3.1% Potomac Capital Management 576,396 2.9% Segall Bryant & Hamill Investments 524,681 2.7% Reich & Tang Asset Management 438,200 2.2% Zesiger Capital Group 425,100 2.2% Kennedy Capital Management 296,213 1.5% Perritt Capital Management 287,100 1.5% TT International 282,442 1.4% Keane Capital Management 248,258 1.3% Lapides Asset Management 238,000 1.2% Other Institutional Holders 1,764,301 8.9% Retail or Unknown 994,109 5.0% Total Shares 19,734,863 (2) 100.0% (1) Ownership according to company filings, Shareworld database, and Discovery Group filings. (2) Reflects total common stock outstanding as disclosed in 2/10/09 Tier’s proxy statement filing (excludes options). |
| Section VI Discovery Platform |

| Stockholders are best served by a Board that includes directors with a strong alignment of financial interest through stock ownership. Not one current director has the perspective of a large shareholder. All directors together own less than 1% of Tier’s shares. The Discovery Nominees would bring the perspective of a large shareholder, along with other benefits. Extensive research on the industry conducted while investing in Tier and others Experience as a corporate finance advisor to small capitalization public companies As Directors, the Discovery Nominees would have access to additional, inside information that would facilitate the development of proposals that could benefit all shareholders. Previous Board decisions and deliberations Management forecasts and business plans If elected, the Discovery nominees will work cooperatively with other directors to enhance shareholder value. Discovery Platform Bring Perspective of Large Shareholder |
| Discovery will work cooperatively with the Board to bring focus to four key issues as soon as possible: Improve Governance Reduce Overhead Return Excess Cash to Shareholders Explore Strategic Alternatives If elected, the Discovery Nominees will hold two of nine total Board seats. Our nominees must actively engage the remaining directors to gain their support. The Discovery Nominees have investigated opportunities to enhance shareholder value and are prepared to make effective arguments about these issues and opportunities. Parthenon, owner of 9.1% of Tier, has also nominated two candidates for the Tier Board. Parthenon has actively sought change in the past Prior representative (Stone) was brought onto Board, but not re-nominated Parthenon is not soliciting proxies Two of Tier’s re-nominated directors are relatively new, having joined the Tier Board in 2008. The current Tier Board has largely conceded the need for shareholder representation. “the Board’s decision to increase the size of the Board to nine and nominate only seven candidates ensures that two candidates proposed by the shareholders will be added to the Board”, Management Proxy Statement, February, 2008 Discovery Platform, Continued Actively Collaborate With Fellow Directors |
| In January 2006, Tier adopted a Poison Pill without shareholder approval, preventing any person from acquiring 15% or more of outstanding stock without Board consent. Poison Pill does not serve the best interest of shareholders: Reduces accountability Entrenches management Prevents large ownership in a small company Allows Board to block offers Sends signal of disinterest to potential acquirors Tier’s Poison Pill was not presented to shareholders within 12 months and has never been submitted to a vote of shareholders. Results of 2009 14a-8 shareholder proposal will provide feedback from shareholders on whether to remove the Poison Pill. In January 2006, Tier also adopted a by-law amendment that denied stockholders the right to call a special meeting. Elimination of right to call a special meeting limits the voice of significant shareholders. Especially important given Tier’s rapidly changing business, board, management, and overall strategic direction. Results of 2009 14a-8 shareholder proposal will provide feedback from shareholders on whether to reinstate special meeting rights. Discovery Platform, Continued Improve Governance |
| The current Board has sanctioned what Discovery believes is an excess level of corporate overhead, given the company’s revenue and profitability. This overhead must be reduced rapidly and significantly. Existing and forecast corporate overhead (as of 2/9/09, company is no longer providing corporate overhead detail): 2006: $27.2 million 2007: $16.6 million 2008: $16.8 million 2009: $12.0 million (forecast as of 12/08) 2010: $ 9.0 million (forecast “run-rate” by end of fiscal year) A recent independent study of the cost of being public for companies that are much larger than Tier – up to $1 billion in revenue – shows an average cost of only $2.8 million per year for expenses such as Audit, Legal, Board Compensation, D&O Insurance and other public company-related corporate overhead. To reach average industry profitability margins Tier has to eliminate $16 million to $17 million from corporate overhead and EPP SG&A. As a minority of the Board, the Discovery Nominees would propose specific and attainable targets for Tier’s overhead based on a study of industry benchmarks for profitability and a detailed analysis of Tier’s existing overhead to identify areas where reductions are possible. Discovery Platform, Continued Reduce Excess Overhead |
| Tier’s cash balance has grown materially and steadily since the end of fiscal year 2000, when it stood at $19.9 million As of the end of the first quarter of fiscal year 2009, Tier held $84.5 million in cash, including its ill-timed investments in auction rate securities. This is equivalent to approximately $4.28 per share $7.5 million paid for ChoicePay acquisition in the second quarter of fiscal year 2009 A $15 million open market share repurchase plan was recently announced, but no shares purchased as of 2/9/09 Modest amount Difficult, given low trading volume As a minority of the Board, Discovery will seek support of the full board for a return of capital to stockholders by: Developing an analysis of the appropriate level of capital for the Company based on industry benchmarks Highlighting the potential accretion to shareholder value that can be achieved through an efficient allocation of capital Using pertinent public company advisory experience to reallocate capital in the most effective manner, unlike the recent authorized open market program Discovery Platform, Continued Return Excess Cash to Shareholders |
| EPP has significant value that is not currently recognized by the public market As a minority of the Board, Discovery would recommend the formation of a Special Committee, comprised only of independent Directors, that could review Tier’s strategic alternatives and be in a position to proactively engage in discussions with potential acquirors of Tier The nominees’ extensive corporate finance, advisory, investing, and M&A experience would assist the Board in comparing The value that could be achieved in a sale or merger; versus The value likely to result from the status quo of operating Tier as an independent public company Discovery, the Special Committee, the Board, and advisors would have to carefully evaluate the best timing and approach for any potential transaction. Global economic environment IRS contract ARS status ChoicePay integration EPP outlook Discovery Platform, Continued Explore Strategic Alternatives |
