|
| K&L Gates LLP 70 West Madison Street Suite 3100 Chicago, IL 60602-4207
T 312.372.1121 www.klgates.com |
PATRICK J. MALONEY
312.807.4265
pmaloney@bellboyd.com
Direct Fax: 312.827.8037
March 20, 2009
VIA OVERNIGHT MAIL AND EDGAR
United States Securities and Exchange Commission
Office of Mergers and Acquisitions
Division of Corporation Finance
100 F Street, N.E.
Washington, DC 20549-3628
Attention: | Mellissa Campbell Duru, Esq. |
|
| Attorney-Advisor |
|
Re: Tier Technologies, Inc.
Definitive Additional Soliciting Materials filed on February 18, 2009 by Discovery Equity Partners, L.P., Discovery Group I, LLC, Daniel J. Donoghue and Michael R. Murphy
File No. 1-33475
Ladies and Gentlemen:
On behalf of Discovery Equity Partners, L.P., Discovery Group I, LLC, Daniel J. Donoghue and Michael R. Murphy (collectively, “Discovery”), we have set forth below Discovery’s responses to the comments of the Staff (the “Staff”) of the Division of Corporation Finance of the United States Securities and Exchange Commission (the “Commission”) contained in your letter to Patrick J. Maloney of this firm, dated March 12, 2009 (the “Comment Letter”), commenting on the definitive additional soliciting materials of Discovery relating to Tier Technologies, Inc. (“Tier” or the “Company”) that were filed with the Commission on February 18, 2009 (the “Soliciting Materials”). For your convenience we are providing a courtesy copy of the relevant pages of the revised soliciting materials (the “Revised Soliciting Materials”), containing the revisions described in this letter. Discovery plans to file the relevant pages of the Revised Soliciting Materials in response to the Staff’s comments under Regulation 14A after determining that the proposed changes address the Staff comments.
The supplemental information set forth in this letter has been supplied by Discovery for use herein, and all of the responses set forth herein to the Staff’s comments have been reviewed and approved by Discovery. For your convenience, each of the Staff’s consecutively numbered comments is set forth in italics, followed by Discovery’s response.
Capitalized terms used but not defined herein have the meanings ascribed to them in the Soliciting Materials.
Exhibit 1
1. We have reviewed your response to prior comment 1 or out letter dated February 24, 2009. Notwithstanding your response, further clarification may be needed to contextualize the data presented, particularly given the time period upon which your comparisons are based. In this regard, we note that many of the comparable companies you include in your peer group are engaged currently in the electronic processing payments business, Tier, however, was not engaged in this line of business at the time of its initial public offering in 1997 and only became engaged in this line of business upon acquisition of the Official Payment Processing Corporation in 2002. As such, without some form of clarification in the presentation, it does not appear that a meaningful comparison of similar companies is demonstrated for period prior to Tier’s entry into the electronic payment business. Please revise or advise.
Response 1: In response to the Staff’s comment, Discovery has revised page 11 of the Revised Soliciting Materials to narrow the time period used for the comparison of Tier’s stock performance against that of comparable companies to the time period during which Tier has been engaged in electronic processing payments business.
2. We note your response to prior comment 2. Although you are not presenting proposals related to the liquidation of some or all of the assets of the company, it would appear that you have presented valuations in order to support your overall platform. Specifically, in support of your nominees’ election, you disclose that their election to the Board would cause them to “proactively evaluate all strategic alternatives to unlock the value of the Company’s Electronic Payment Processing (“EPP”) business for stockholders.” Given your disclosure in the proxy and soliciting materials to date, the valuation information you present would appear to be material to a shareholder’s overall voting decision. To ensure that such information is presented in a manner that is useful and to ensure compliance with Rule 14a-9, it would appear that further disclosure is needed to facilitate a shareholder’s understating of the basis for you valuations. Please revise you presentation materials to set forth the basis of and any material assumptions relevant to the interpretation of the valuations presented.
Response 2: In response to the Staff’s comment, Discovery has revised Section IV of the Revised Soliciting Materials to provide further disclosure regarding the basis for the valuations presented. Specifically, Discovery has added pages 23, 24, 26, 28, 30, 32, 34, 35 and 37 to the Revised Soliciting Materials. Such pages contain additional disclosure regarding the sources of the data utilized by Discovery, the methods used to arrive at the valuations and material assumptions relevant to interpreting the valuations.
2
If you have any questions regarding these responses or wish to discuss them, please feel free to contact me at (312) 807-4265.
| Very truly yours, |
|
|
| /s/ Patrick J. Maloney |
| Patrick J. Maloney |
Michael R. Murphy
Discovery Equity Partners, L.P.
PJM:adt
3
Governance Crisis
Tier’s Stock Has Underperformed Industry Peers
Tier vs. Index of Comparable Companies, since Official Payments acquisition

Index Components (date of inclusion if after 5/31/02):
Euronet Worldwide Inc.; Fiserv Inc.; H&R Block, Inc.; Intuit Inc.; Jack Henry & Associates Inc.; Total System Services, Inc.; Online Resources Corp.; CyberSource Corporation; Global Payments Inc.; Alliance Data Systems Corporation; Heartland Payment Systems Inc. (8/11/05); Global Cash Access Holdings, Inc. (9/23/05); Fidelity National Information Services Inc. (2/1/06); Metavante Technologies, Inc. (10/29/07).

11
Section IV
EPP Opportunity
EPP Opportunity
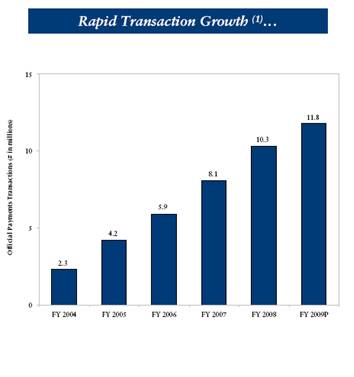
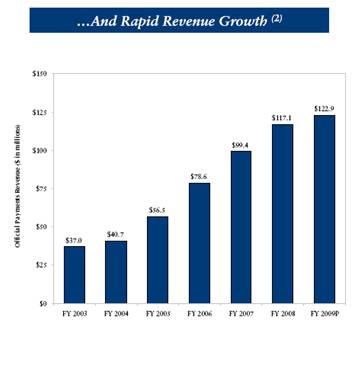
EPP Generates Impressive Organic Growth
|
|
|
| ||
(1) Tier 2009 Management Guidance as of 12/9/08 Earnings Release: EPP transactions of 11.2 million. Updated Guidance as of 2/9/09: EPP transactions of 11.8 million based on 15.9 million forecast less 4.1 million contribution from ChoicePay. |
| (2) Tier 2009 Management Guidance as of 12/9/08 Earnings Release: EPP revenue growth in “mid-single digit range.” Guidance reaffirmed as of 2/9/09. |
22
EPP Opportunity, Continued
Overview
· Discovery Group, in its analysis and valuation of Tier Technologies, among other things:
· Reviewed publicly available information including company filings and company forecasts.
· Constructed and reviewed a comparable group of public companies whose businesses were similar to that of Tier’s.
· Reviewed and analyzed relevant M&A transactions based on transactions whose target companies performed similar business services as Tier.
· Used these various pieces of data and analyses to estimate an accurate economic value for Tier.
· Discovery obtained the data and projections concerning Tier from reports filed by Tier with the Securities and Exchange Commission. Discovery obtained the financial statistics for the comparable companies in this presentation from Capital IQ, a database and data provider that is a division of Standard & Poor’s. Capital IQ states on its website that it” provides financial research and analytical solutions to over 2,400 investment banks, fund managers and corporations.”
· It is Discovery’s understanding that Capital IQ obtains its source data from filings of companies with the Commission and other securities regulatory bodies as well as other sources that it believes to be reliable.
23
EPP Opportunity, Continued
Tier Overhead Overwhelms EPP Profits
· The following two tables present summary financial statement information for Tier Technologies. The tables provide pro-forma financials which 1) exclude Tier’s Discontinued and Wind-down segments and 2) base the amount of Corporate Overhead on Tier’s “Loss from continuing operations before other income and income taxes” in the column entitled “Corporate and Eliminations” in the “Segment Information” footnote of Tier’s financial statements. All figures for 2005 through 2008 are directly from Tier’s 2007 and 2008 Annual Reports on Form 10-K.
· The result is pro-forma annual income statement summaries for Tier’s EPP segment including corporate overhead (Page 25) and excluding corporate overhead (Page 27).
· 2009 numbers displayed in the tables are based on both Tier Fiscal Year 2009 guidance and Discovery forecasts. Tier Fiscal Year 2009 guidance included the following:
· EPP revenue growth in “mid-single digit” percentage range.
· Corporate Overhead of $12 million.
· Potential for positive EBITDA.
· This guidance, combined with our estimates for cost of sales, operating expenses, and depreciation and amortization, yields a 2009 EBITDA of negative $3.374 million. This 2009 EBITDA number, after accounting for Wind-down operations of roughly $3 million, yields an EBITDA that is close to the company’s “hope-for-positive” EBITDA estimate. Discovery’s $3 million estimate for 2009 Wind-down EBITDA was based on Tier’s third quarter and fourth quarter Wind-down Operations EBITDA results of $651 thousand and $854 thousand, respectively, which were obtained directly from Tier’s filings. These EBITDA results were projected over a full year to arrive at an annual Wind-down Operations EBITDA of roughly $3 million.

24
EPP Opportunity, Continued
Tier Overhead Overwhelms EPP Profits
Pro-Forma(1) Financial Performance
|
| Fiscal Years Ending (1) |
| |||||||||||||
$ in thousands; FYE 9/30 |
| 2005 |
| 2006 |
| 2007 |
| 2008 |
| 2009 (2), (3) |
| |||||
|
|
|
|
|
|
|
|
|
|
|
| |||||
EPP Gross Revenue |
| $ | 56,452 |
| $ | 78,578 |
| $ | 99,433 |
| $ | 117,072 |
| $ | 122,926 |
|
Growth |
|
|
| 39.2 | % | 26.5 | % | 17.7 | % | 5.0 | % | |||||
|
|
|
|
|
|
|
|
|
|
|
| |||||
Cost of Sales |
| 42,199 |
| 61,505 |
| 76,388 |
| 91,290 |
| 96,865 |
| |||||
Gross Profit |
| 14,253 |
| 17,073 |
| 23,045 |
| 25,782 |
| 26,060 |
| |||||
Gross Margin |
| 25.2 | % | 21.7 | % | 23.2 | % | 22.0 | % | 21.2 | % | |||||
|
|
|
|
|
|
|
|
|
|
|
| |||||
EPP Operating Expenses |
| 12,940 |
| 13,603 |
| 17,111 |
| 22,534 |
| 20,934 |
| |||||
As % of Revenue |
| 22.9 | % | 17.3 | % | 17.2 | % | 19.2 | % | 17.0 | % | |||||
|
|
|
|
|
|
|
|
|
|
|
| |||||
Corporate Overhead |
| 23,247 |
| 27,353 |
| 17,031 |
| 17,215 |
| 12,000 |
| |||||
Total Operating Expenses |
| 36,187 |
| 40,956 |
| 34,142 |
| 39,749 |
| 32,934 |
| |||||
As % of Revenue |
| 64.1 | % | 52.1 | % | 34.3 | % | 34.0 | % | 26.8 | % | |||||
|
|
|
|
|
|
|
|
|
|
|
| |||||
Operating Income |
| (21,934 | ) | (23,883 | ) | (12,395 | ) | (13,297 | ) | (6,874 | ) | |||||
Operating Margin |
| (52.0 | )% | (38.8 | )% | (16.2 | )% | (11.4 | )% | (5.6 | )% | |||||
|
|
|
|
|
|
|
|
|
|
|
| |||||
D&A |
| 3,428 |
| 3,169 |
| 3,206 |
| 3,503 |
| 3,500 |
| |||||
EBITDA |
| (18,506 | ) | (20,714 | ) | (9,189 | ) | (9,794 | ) | (3,374 | ) | |||||
EBITDA Margin |
| (32.8 | )% | (26.4 | )% | (9.2 | )% | (8.4 | )% | (2.7 | )% | |||||
(1) Table based on Tier EPP-only numbers after subtracting out Loss from continuing operations before other income and income taxes within Tier’s “Corporate and Eliminations.”
(2) Tier 2009 Management Guidance as of 12/9/08: EPP revenue growth in “mid-single digit” % range. Corporate expenses of $12 million. Revenue guidance reaffirmed as of 2/9/09.
(3) Forecast by Discovery
25
EPP Opportunity, Continued
EPP Stand-Alone Is Profitable
· The table displayed on Page 27 is identical to the previous table except that it excludes corporate overhead in each year to illustrate the potential profitability of Tier if the EPP business did not incur Corporate Overhead. Discovery believes such a calculation would be relevant to the valuation of the EPP business by any potential acquirer seeking to add revenues to spread over its own overhead. No assurance can be given that any potential acquirer would apply such a valuation.
26
EPP Opportunity, Continued
EPP Stand-Alone Is Profitable
Pro-Forma Financial Performance – Excluding All Corporate Overhead
|
| Fiscal Years Ending |
| |||||||||||||
$ in thousands; FYE 9/30 |
| 2005 |
| 2006 |
| 2007 |
| 2008 |
| 2009 (1) |
| |||||
|
|
|
|
|
|
|
|
|
|
|
| |||||
EPP Gross Revenue |
| $ | 56,452 |
| $ | 78,578 |
| $ | 99,433 |
| $ | 117,072 |
| $ | 122,926 |
|
Growth |
|
|
| 39.2 | % | 26.5 | % | 17.7 | % | 5.0 | % | |||||
|
|
|
|
|
|
|
|
|
|
|
| |||||
Cost of Sales |
| 42,199 |
| 61,505 |
| 76,388 |
| 91,290 |
| 96,865 |
| |||||
Gross Profit |
| 14,253 |
| 17,073 |
| 23,045 |
| 25,782 |
| 26,060 |
| |||||
Gross Margin |
| 25.2 | % | 21.7 | % | 23.2 | % | 22.0 | % | 21.2 | % | |||||
|
|
|
|
|
|
|
|
|
|
|
| |||||
EPP Operating Expenses |
| 12,940 |
| 13,603 |
| 17,111 |
| 22,534 |
| 20,934 |
| |||||
As % of Revenue |
| 22.9 | % | 17.3 | % | 17.2 | % | 19.2 | % | 17.0 | % | |||||
|
|
|
|
|
|
|
|
|
|
|
| |||||
Operating Income (a) |
| 1,313 |
| 3,470 |
| 4,636 |
| 3,918 |
| 5,126 |
| |||||
Operating Margin |
| 2.3 | % | 4.4 | % | 4.7 | % | 3.3 | % | 4.2 | % | |||||
|
|
|
|
|
|
|
|
|
|
|
| |||||
D&A |
| 3,428 |
| 3,169 |
| 3,206 |
| 3,503 |
| 3,500 |
| |||||
EBITDA (a) |
| 4,741 |
| 6,639 |
| 7,842 |
| 7,421 |
| 8,626 |
| |||||
EBITDA Margin |
| 8.4 | % | 8.4 | % | 7.9 | % | 6.3 | % | 7.0 | % | |||||
(a) Excludes All Corporate Overhead and adjusts for non-recurring income/expenses provided by management.
(1) Tier 2009 Management Guidance as of 12/9/08: EPP revenue growth in “mid-single digit” % range. Guidance reaffirmed as of 2/9/09.
27
EPP Opportunity, Continued
EPP Versus Comparable Public Companies
· After constructing a comparable group of public companies whose businesses were similar to that of Tier’s EPP business, Discovery calculated various profitability and performance ratios for both the comparable companies and for Tier’s EPP business (excluding corporate overhead). After analyzing and comparing these various pieces of financial data, Discovery found that Tier’s profitability, even after excluding for its excessive corporate overhead, was lower than industry averages. For example, Tier’s EBIT/Gross Profit multiple of 19.7% was significantly lower than the comparable group’s mean and median of 42.8% and 46.5%, respectively. Moreover, Tier’s EBITDA/Gross Profit multiple of 33.1% was significantly lower than the comparable group’s mean and median of 60.2% and 53.0%, respectively. Discovery believes that Tier SG&A would have to be reduced by an additional $4 to $5 million in 2009 for the business to achieve roughly 40% EBIT/Gross Profit or 50% EBITDA/Gross Profit.
· Discovery obtained the financial statistics for the comparable companies presented from Capital IQ.

28
EPP Opportunity, Continued
EPP Versus Comparable Public Companies
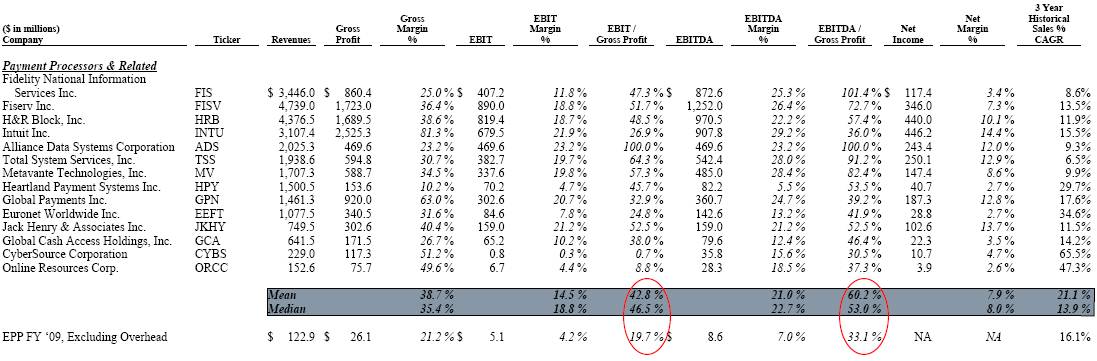
· Even after excluding all corporate overhead, EPP’s profitability is lower than the industry averages
· EPP SG&A would have to be reduced by an additional $4 million to $5 million in 2009 for the business to achieve ≈40% EBIT/Gross Profit or ≈50% EBITDA/Gross Profit
![]()
29
EPP Opportunity, Continued
Valuation Multiples: Comparable Public Companies
· To estimate the value of Tier’s EPP business, Discovery analyzed various Last Twelve Months (LTM) Enterprise Value (EV) multiples for the comparable group of companies selected by Discovery. This group’s LTM EV/EBIT multiples fell in a range between 5.0 and 37.6 with a mean and median of 11.4 and 9.1, respectively. Its LTM EV/EBITDA multiples fell in a range between 4.3 and 23.6 with a mean and median of 8.3 and 8.1, respectively. Its LTM EV/Revenue multiples fell in a range between 0.2 and 3.7 with a mean and median of 1.7 and 1.9, respectively. Its LTM EV/Gross Profit multiples fell in a range between 2.2 and 7.3 with a mean and median of 4.2 and 4.0, respectively.
· Discovery obtained the financial statistics for the comparable companies presented from Capital IQ.

30
EPP Opportunity, Continued
Valuation Multiples: Comparable Public Companies
|
|
|
|
|
|
|
|
|
|
|
|
|
|
|
|
|
|
|
|
|
|
|
|
|
|
|
|
|
| ||||
|
|
|
|
|
| Median |
| 2/13/09 |
| P/E Ratios |
| 2/13/09 |
| Enterprise Value/ |
| ||||||||||||||||||
($ in millions) |
| Share |
| Insider |
| Daily $ |
| Market |
| LTM |
| 2009 |
| 2010 |
| Enterprise |
| LTM |
| LTM |
| LTM |
| LTM |
| LTM |
| LTM |
| ||||
|
|
|
|
|
|
|
|
|
|
|
|
|
|
|
|
|
|
|
|
|
|
|
|
|
|
|
|
|
| ||||
Payment Processors & Related |
|
|
|
|
|
|
|
|
|
|
|
|
|
|
|
|
|
|
|
|
|
|
|
|
|
|
|
|
| ||||
Fidelity National Information Services Inc. |
| $ | 18.28 |
| 1.7 | % | $ | 34.0 |
| $ | 3,473.1 |
| 9.5 |
| 11.3 |
| 10.1 |
| $ | 6,198.4 |
| 1.2 |
| 4.0 |
| 7.4 |
| 4.8 |
| 4.5 |
| 4.8 |
|
Fiserv Inc. |
| 35.17 |
| 2.3 | % | 62.5 |
| 5,570.9 |
| 16.6 |
| 9.6 |
| 8.6 |
| 9,781.9 |
| 2.1 |
| 5.7 |
| 11.0 |
| 7.8 |
| 7.6 |
| 9.0 |
| ||||
H&R Block, Inc. |
| 21.70 |
| 3.2 | % | 68.4 |
| 7,355.1 |
| 16.3 |
| 13.5 |
| 11.4 |
| 8,499.2 |
| 1.9 |
| 5.0 |
| 10.4 |
| 8.8 |
| 8.4 |
| 9.5 |
| ||||
Intuit Inc. |
| 23.08 |
| 7.7 | % | 84.6 |
| 7,387.0 |
| 17.4 |
| 12.9 |
| 11.4 |
| 8,287.9 |
| 2.7 |
| 3.3 |
| 12.2 |
| 9.1 |
| 8.2 |
| 11.0 |
| ||||
Alliance Data Systems Corporation |
| 37.82 |
| 2.1 | % | 50.2 |
| 2,440.9 |
| 16.8 |
| 7.5 |
| 6.5 |
| 4,868.2 |
| 2.1 |
| 7.3 |
| 11.5 |
| 8.5 |
| 7.8 |
| 8.8 |
| ||||
Total System Services, Inc. |
| 13.18 |
| 5.0 | % | 15.2 |
| 2,575.4 |
| 10.4 |
| 10.4 |
| 9.5 |
| 2,590.1 |
| 1.3 |
| 4.4 |
| 6.8 |
| 4.8 |
| 4.6 |
| 5.0 |
| ||||
Metavante Technologies, Inc. |
| 17.72 |
| 4.9 | % | 8.0 |
| 2,118.6 |
| 14.4 |
| 13.0 |
| 11.7 |
| 4,162.7 |
| 2.4 |
| nmf |
| 12.3 |
| 8.6 |
| 8.4 |
| 11.5 |
| ||||
Heartland Payment Systems Inc. |
| 8.69 |
| 29.9 | % | 2.3 |
| 327.0 |
| 8.4 |
| 7.7 |
| 7.1 |
| 353.8 |
| 0.2 |
| 2.3 |
| 5.0 |
| 4.3 |
| 4.2 |
| 6.7 |
| ||||
Global Payments Inc. |
| 35.58 |
| 0.8 | % | 26.2 |
| 2,857.9 |
| 15.4 |
| 16.2 |
| 14.6 |
| 2,741.3 |
| 1.9 |
| 3.0 |
| 9.1 |
| 7.6 |
| 7.3 |
| 8.2 |
| ||||
Euronet Worldwide Inc. |
| 9.27 |
| 6.5 | % | 3.9 |
| 466.2 |
| 16.2 |
| 7.6 |
| 7.5 |
| 743.1 |
| 0.7 |
| 2.2 |
| 8.8 |
| 5.2 |
| 4.9 |
| 7.0 |
| ||||
Jack Henry & Associates Inc. |
| 17.30 |
| 7.6 | % | 13.7 |
| 1,469.8 |
| 14.7 |
| 14.3 |
| 13.2 |
| 1,443.9 |
| 1.9 |
| 4.8 |
| 9.1 |
| 9.1 |
| 9.1 |
| 9.1 |
| ||||
Global Cash Access Holdings, Inc. |
| 2.65 |
| 0.8 | % | 0.7 |
| 203.9 |
| 9.2 |
| 4.2 |
| 3.9 |
| 440.6 |
| 0.7 |
| 2.6 |
| 6.8 |
| 5.5 |
| 4.6 |
| 5.0 |
| ||||
CyberSource Corporation |
| 13.21 |
| 4.9 | % | 11.5 |
| 912.3 |
| nmf |
| 18.2 |
| 15.8 |
| 844.5 |
| 3.7 |
| 7.2 |
| nmf |
| 23.6 |
| 18.7 |
| 25.3 |
| ||||
Online Resources Corp. |
| 3.00 |
| 4.8 | % | 0.3 |
| 88.0 |
| 23.8 |
| 10.9 |
| 8.7 |
| 250.2 |
| 1.6 |
| 3.3 |
| 37.6 |
| 8.9 |
| 7.5 |
| 15.0 |
| ||||
|
|
|
|
|
|
|
|
|
|
|
|
|
|
|
|
|
|
|
|
|
|
|
|
|
|
|
|
|
| ||||
|
|
|
|
|
| Mean |
|
|
| 14.5 | x | 11.2 | x | 10.0 | x |
|
| 1.7 | x | 4.2 | x | 11.4 | x | 8.3 | x | 7.5 | x | 9.7 | x | ||||
|
|
|
|
|
| Median |
|
|
| 15.4 | x | 11.1 | x | 9.8 | x |
|
| 1.9 | x | 4.0 | x | 9.1 | x | 8.1 | x | 7.5 | x | 8.9 | x | ||||

31
EPP Opportunity, Continued
Valuation Multiples: Relevant M&A Transactions
· To estimate the value of Tier’s EPP business, Discovery also compiled and analyzed relevant M&A transactions and their respective implied EV multiples that have occurred over the past 10 years in which the target company performed similar business services as Tier now performs. The target companies’ EV/EBIT multiples fell in a range between 10.5 and 68 with a mean and median of 21.8 and 19.2, respectively. The target companies’ EV/EBITDA multiples fell in a range between 8.2 and 26.1 with a mean and median of 13.0 and 12.4, respectively. The target companies’ EV/Revenue multiples fell in a range between 0.6 and 5.3 with a mean and median of 2.4 and 2.0, respectively. Gross Profit data was not reliably available.
· Discovery obtained the financial statistics for the M&A transactions presented from Capital IQ.

32
EPP Opportunity, Continued
Valuation Multiples: Relevant M&A Transactions
Date |
|
|
|
|
| Target |
| Enterprise |
| EV Multiples |
|
|
| |||||
Announced |
| Acquirer Name |
| Target Name |
| Business Description |
| Value |
| Sales |
| EBIT |
| EBITDA |
| P/E |
| |
01/13/09 |
| Tier Technologies Inc. |
| ChoicePay, Inc. |
| Pvd electronic payment solutions |
| $ | 9.5 |
| 0.9 | x |
|
|
|
|
|
|
05/02/08 |
| Heartland Payment Systems |
| Network Services Business (Alliance Data) |
| Pvd payment processing solutions |
| $ | 77.2 |
| 0.6 | x | 25.8 | x | 8.2 | x | 19.0 | x |
03/03/08 |
| Heartland Payment Systems |
| Collective Point of Sale Solutions Ltd. |
| Pvd payment processing solutions |
| $ | 10.5 |
|
|
|
|
|
|
|
|
|
12/19/07 |
| Intuit Inc. |
| Electronic Clearing House Inc. |
| Electronic payment processor |
| $ | 118.5 |
| 1.5 | x | — |
| 26.1 | x | — |
|
08/02/07 |
| Fiserv Inc. |
| CheckFree Corp. |
| Payment processing |
| $ | 4,162.9 |
| 4.3 | x | 21.9 | x | 15.1 | x | 33.9 | x |
06/26/07 |
| Fidelity National Information Services |
| eFunds Corp. |
| Pvd electronic payment solutions |
| $ | 1,694.3 |
| 3.1 | x | 18.4 | x | 12.1 | x | 31.8 | x |
06/17/07 |
| CyberSource Corp. |
| Authorize.Net Holdings, Inc. |
| Pvd transaction processing solutions |
| $ | 450.4 |
| 4.6 | x | 29.6 | x | 19.1 | x | 21.1 | x |
05/30/07 |
| Fidelity National Financial |
| Ceridian Corp. |
| Comdata seg pvds transaction processing |
| $ | 5,032.9 |
| 3.2 | x | 19.2 | x | 14.4 | x | 29.1 | x |
05/17/07 |
| The Blackstone Group, Private Equity |
| Alliance Data Systems Corporation |
| Pvd transaction and credit services |
| $ | 7,933.8 |
| 3.7 | x | 21.3 | x | 15.2 | x | 34.0 | x |
05/14/07 |
| Welsh, Carson, Anderson & Stowe |
| TRANSFIRST Holdings |
| Pvd payment processing solutions |
| $ | 683.0 |
|
|
|
|
|
|
|
|
|
05/02/07 |
| Citigroup Inc. |
| Bisys Group Inc. |
| Pvd financial services |
| $ | 1,437.2 |
| 1.5 | x | 12.2 | x | 8.4 | x |
|
|
04/02/07 |
| Kohlberg Kravis Roberts & Co. |
| First Data Corp. |
| Pvd data processing svcs |
| $ | 27,673.6 |
| 3.7 | x | 20.0 | x | 13.2 | x | 33.3 | x |
02/13/07 |
| CheckFree Corp. |
| Corillian Corp. |
| Pvd internet based fin svcs |
| $ | 220.1 |
| 3.4 | x |
|
|
|
|
|
|
12/29/06 |
| CheckFree Corp. |
| Carreker Corp. |
| Pvd data processing svcs |
| $ | 168.8 |
| 1.5 | x | 68.0 | x | 13.2 | x | 87.2 | x |
11/29/06 |
| Intuit Inc. |
| Digital Insight Corp. |
| Pvd data processing svcs |
| $ | 1,265.4 |
| 5.3 | x | 24.3 | x | 18.2 | x | 4.9 | x |
06/26/06 |
| Ingenico SA |
| Moneyline SA |
| Pvd financial transaction products |
| $ | 27.8 |
| 1.3 | x | 11.0 | x | 8.8 | x | 16.6 | x |
01/31/06 |
| NOVA Information Systems |
| First Horizon Merchant Services |
| Pvd payment processing solutions |
| $ | 432.7 |
|
|
|
|
|
|
|
|
|
09/15/05 |
| Fidelity Info Services |
| Certegy Inc |
| Pvd check & card services |
| $ | 2,554.1 |
| 2.4 | x | 13.3 | x | 10.5 | x | 21.3 | x |
07/27/05 |
| Fiserv Inc. |
| BillMatrix Corp. |
| Pvd electronic bill pmt svcs |
| $ | 350.0 |
| 3.9 | x |
|
|
|
|
|
|
05/16/05 |
| Gregory Daily (Chairman MBO) |
| iPayment Inc |
| Pvd credit card processing svc |
| $ | 808.9 |
| 1.8 | x | 17.8 | x | 1 1.4 | x | 24.1 | x |
03/31/05 |
| Corillian Corp |
| InteliData Technologies Corp |
| Pvd online banking svcs |
| $ | 19.8 |
| 1.4 | x |
|
|
|
|
|
|
03/28/05 |
| Investor Group |
| SunGard Data Systems Inc |
| Pvd software & processing solutions |
| $ | 10,269.9 |
| 2.9 | x | 14.5 | x | 9.8 | x | 22.9 | x |
09/09/04 |
| Fidelity Natl Finl Inc |
| InterCept Inc |
| Pvd software & data processing solns |
| $ | 422.5 |
| 2.0 | x | 44.5 | x | 16.4 | x | nm |
|
07/13/04 |
| Bank of America Corp |
| National Processing Inc |
| Pvd data processing svcs |
| $ | 1,124.5 |
| 2.3 | x | 12.8 | x | 10.2 | x | 27.2 | x |
06/01/04 |
| Tier Technologies Inc. |
| Epos Corporation |
| Pvd communication solutions |
| $ | 20.0 |
|
|
|
|
|
|
|
|
|
02/09/04 |
| Fidelity National Financial, Inc. |
| Aurum Technology, Inc. |
| Pvd data processing svcs to Banks |
| $ | 305.0 |
| 1.6 | x |
|
|
|
|
|
|
02/09/04 |
| Jack Henry & Associates, Inc. |
| Yellow Hammer Software, Inc. |
| Dvlp fraud detection software |
|
|
|
|
|
|
|
|
|
|
| |
01/28/04 |
| Fidelity National Financial, Inc. |
| Sanchez Computer Associates, Inc. |
| Dvlp integrated software |
| $ | 175.1 |
| 1.8 | x |
|
|
|
|
|
|
09/11/03 |
| U.S. Bancorp |
| National Commerce (Merchant Processing) |
| Pvd merchant transaction svcs |
|
|
|
|
|
|
|
|
|
|
| |
04/03/03 |
| First Data Corporation |
| Concord EFS, Inc. |
| Pvd data processing services |
| $ | 5,021.1 |
| 2.4 | x | 10.6 | x | 8.9 | x |
|
|
01/28/03 |
| Fidelity National Financial, Inc. |
| ALLTEL Financial Services |
| Pvd data processing svcs |
| $ | 1,005.0 |
| 1.2 | x | 10.5 | x |
|
|
|
|
11/14/02 |
| Fiserv Inc. |
| EDS Corp. (CNS division) |
| Pvd EFT data processing svcs |
| $ | 320.0 |
|
|
|
|
|
|
|
|
|
07/02/02 |
| Metavante Corp. |
| Paytrust Inc |
| Pvd ecommerce billing svcs |
|
|
|
|
|
|
|
|
|
|
| |
05/31/02 |
| Tier Technologies Inc. |
| Official Payments Corp. |
| Pvd electronic payment solutions |
| $ | 48.2 |
| 1.5 | x |
|
|
|
|
|
|
03/20/02 |
| InterCept, Inc. |
| IBILL |
| Pvd ecommerce svcs |
| $ | 112.0 |
|
|
|
|
|
|
|
|
|
11/15/01 |
| Fiserv Inc. |
| NCR Corp-Bank Processing |
| Dvlp processing systems |
|
|
|
|
|
|
|
|
|
|
| |
05/30/01 |
| Metavante Corp. |
| CyberBills Inc |
| Pvd online bill payment svcs |
|
|
|
|
|
|
|
|
|
|
| |
05/22/01 |
| Carreker Corp. |
| Check Solutions Co |
| Dvlp check processing software |
| $ | 109.5 |
| 2.7 | x | nmf |
| nmf |
|
|
|
05/07/01 |
| U.S. Bancorp |
| NOVA Corporation |
| Pvd merchant transaction svcs |
| $ | 2,250.7 |
| 1.4 | x | 19.3 | x | 12.8 | x |
|
|
04/30/01 |
| Metavante Corp. |
| Derivion Corp |
| Pvd electronic billing svcs |
|
|
|
|
|
|
|
|
|
|
| |
05/15/00 |
| Jack Henry & Associates, Inc. |
| Symitar Systems Inc |
| Pvd data processing services |
| $ | 44.0 |
|
|
|
|
|
|
|
|
|
|
|
|
|
|
|
|
| Mean |
| 2.4 | x | 21.8 | x | 13.0 | x | 29.0 | x | |
|
|
|
|
|
|
|
| Median |
| 2.0 | x | 19.2 | x | 12.4 | x | 25.6 | x | |
33
EPP Opportunity, Continued
Potential Economic Value
· To obtain a potential economic value for Tier, Discovery used the two methods previously explained to arrive at a range of potential economic values for EPP between $75 million and $125 million with a midpoint of $100 million. Discovery used these three values ($75 million, $100 million, $125 million) and found their respective implied enterprise value multiples. Pro-forma 2009 financial statements detailed on Page 25 were used. Discovery analyzed 2009 numbers after excluding for corporate overhead. This first method yields EV/EBITDA multiples in a range between 8.7 and 14.5, EV/EBIT multiples in a range between 14.6 and 24.4, EV/Revenue multiples in a range between 0.6 and 1.0, and EV/Gross Profit multiples in a range between 2.9 and 4.8. The ranges of the EV/EBITDA, EV/EBIT, EV/Revenue, and EV/Gross Profit multiples fell well within the ranges of Tier’s comparable group discussed on Page 30. The ranges of the EV/EBITDA, EV/EBIT, and EV/Revenue multiples also fell well within the ranges of the target companies in the M&A transactions discussed on Page 32. The EV/Gross Profit multiple was not applicable in this latter comparison because Gross Profit information was not reliably available for the target companies in the M&A transactions discussed on Page 32.
34
EPP Opportunity, Continued
Potential Economic Value
· Next, Discovery analyzed pro-forma 2009 financial statements after excluding for corporate overhead and assuming average industry profitability by eliminating $4.5 million in SG&A.
· This second method yields EV/EBITDA multiples in a range between 5.7 and 9.5, EV/EBIT multiples in a range between 7.8 and 13.0, EV/Revenue multiples in a range between 0.6 and 1.0, and EV/Gross Profit multiples in a range between 2.9 and 4.8. The ranges of the EV/EBITDA, EV/EBIT, EV/Revenue, and EV/Gross Profit multiples fell well within the ranges of Tier’s comparable group discussed on Page 30. The ranges of the EV/EBITDA, EV/EBIT, and EV/Revenue multiples fell within or reasonably close to the ranges of the target companies in the M&A transactions discussed on Page 32. The EV/Gross Profit multiple was not applicable in this latter comparison because Gross Profit information was not reliably available for the target companies in the M&A transactions discussed on Page 32.
· Discovery then added Tier’s excess cash (according to its 12/31/08 10Q) and its estimated proceeds for the remainder of Tier’s for-sale PSSI segment (based on the carrying value of the assets and liabilities remaining in the PSSI segment according to Tier’s 12/31/08 10Q) in order to arrive at a range of values for the non-diluted equity value of Tier Technologies. For example, starting with an enterprise value of $100 million, Discovery added $84.5 in excess cash and $2.3 million in estimated proceeds from the PSSI segment to arrive at a non-diluted equity value of $187 million. Discovery then calculated the implied equity value per share by dividing by shares outstanding. Continuing with the above example, Discovery took the $187 million and divided by shares outstanding of 19.7 million to arrive at an equity value per share of $9.46.
35
EPP Opportunity, Continued
Potential Economic Value
EPP Valuation Multiples
|
| FY 2009 |
| Implied Enterprise Value Multiples |
| ||||||||
|
|
|
| $ | 75 |
| $ | 100 |
| $ | 125 |
| |
Gross Revenue |
| $ | 122.9 |
| 0.6 | x | 0.8 | x | 1.0 | x | |||
Gross Profit |
| $ | 26.1 |
| 2.9 | x | 3.8 | x | 4.8 | x | |||
|
|
|
|
|
|
|
|
|
| ||||
Excluding Corporate Overhead |
|
|
|
|
|
|
|
|
| ||||
EBITDA (a) |
| $ | 8.6 |
| 8.7 | x | 11.6 | x | 14.5 | x | |||
Operating Income (a) |
| $ | 5.1 |
| 14.6 | x | 19.5 | x | 24.4 | x | |||
|
|
|
|
|
|
|
|
|
| ||||
Assuming Average Industry Profitability |
|
|
|
|
|
|
|
|
| ||||
EBITDA (b) |
| $ | 13.1 |
| 5.7 | x | 7.6 | x | 9.5 | x | |||
Operating Income (b) |
| $ | 9.6 |
| 7.8 | x | 10.4 | x | 13.0 | x | |||
|
|
|
|
|
|
|
|
|
| ||||
Excess Cash (1) |
|
|
| $ | 84.5 |
| $ | 84.5 |
| $ | 84.5 |
| |
Estimated Proceeds - PSSI segment (2) |
|
|
| $ | 2.3 |
| $ | 2.3 |
| $ | 2.3 |
| |
Non-Diluted Equity Value |
|
|
| $ | 162 |
| $ | 187 |
| $ | 212 |
| |
|
|
|
|
|
|
|
|
|
| ||||
Shares Outstanding (3) |
|
|
| 19.7 |
| 19.7 |
| 19.7 |
| ||||
Equity Value Per Share |
|
|
| $ | 8.20 |
| $ | 9.46 |
| $ | 10.73 |
| |
(a) Estimated EPP profitability excluding 100% of corporate overhead
(b) Estimated EPP profitability excluding 100% of corporate overhead and eliminating $4.5 million of EPP SG&A
(1) According to 12/31/08 10Q
(2) Based on book value according to 12/31/08 10Q
(3) Excludes 2.93 million options with average strike price of $8.48, EVA’s, and PSU’s

36
EPP Opportunity, Continued
EPP Severely Undervalued as Public Company
· To conclude, Discovery used the potential economic value of $100 million (the midpoint of economic values found on Page 28) in order to illustrate that Tier’s publicly traded price of approximately $6.00 ($118.4 million market capitalization) is significantly lower than the share price ($9.46) and market capitalization ($186.8 million) that an economic value of $100 million would imply. The graphic also shows that Tier spent a combined $54.9 million on its purchases of Official Payments in 2002 and Epos in 2004. Its revenue subsequently doubled and its customer base expanded, yet as recently as February 2009 its EPP enterprise value was only $31.6 million.
37
EPP Opportunity, Continued
EPP Severely Undervalued as Public Company

(1) Discovery estimates that one third of $20 million EPOS acquisition was for EPP portion of EPOS
(2) Cash balance of $84.5 million according to 1Q FY2009 10Q, plus estimated proceeds of $2.3 million from PSSI sale
38