For Release: November 7, 2017
Investor Contact: Phil Morgan, 402.458.3038
Nelnet, Inc. supplemental financial information for the third quarter 2017
(All dollars are in thousands, except per share amounts, unless otherwise noted)
The following information should be read in connection with Nelnet, Inc.'s (the “Company's”) press release for third quarter 2017 earnings, dated November 7, 2017, and the Company's Quarterly Report on Form 10-Q for the quarter ended September 30, 2017.
Forward-looking and cautionary statements
This supplemental financial information contains forward-looking statements and information that are based on management's current expectations as of the date of this document. Statements that are not historical facts, including statements about the Company's plans and expectations for future financial condition, results of operations or economic performance, or that address management's plans and objectives for future operations, and statements that assume or are dependent upon future events, are forward-looking statements. The words “may,” “should,” “could,” “would,” “predict,” “potential,” “continue,” “expect,” “anticipate,” “future,” “intend,” “scheduled,” “plan,” “believe,” “estimate,” “assume,” “forecast,” “will,” and similar expressions, as well as statements in future tense, are intended to identify forward-looking statements.
The forward-looking statements are based on assumptions and analyses made by management in light of management's experience and its perception of historical trends, current conditions, expected future developments, and other factors that management believes are appropriate under the circumstances. These statements are subject to known and unknown risks, uncertainties, assumptions, and other factors that may cause the actual results and performance to be materially different from any future results or performance expressed or implied by such forward-looking statements. These factors include, among others, the risks and uncertainties set forth in the “Risk Factors” section of the Company's Annual Report on Form 10-K for the year ended December 31, 2016 (the "2016 Annual Report"), and include such risks and uncertainties as:
| |
| • | student loan portfolio risks such as interest rate basis and repricing risk resulting from the fact that the interest rate characteristics of the student loan assets do not match the interest rate characteristics of the funding for those assets, the risk of loss of floor income on certain student loans originated under the Federal Family Education Loan Program (the "FFEL Program" or "FFELP"), risks related to the use of derivatives to manage exposure to interest rate fluctuations, uncertainties regarding the expected benefits from purchased securitized and unsecuritized FFELP, private education, and consumer loans and initiatives to purchase additional FFELP, private education, and consumer loans, and risks from changes in levels of student loan prepayment or default rates; |
| |
| • | financing and liquidity risks, including risks of changes in the general interest rate environment and in the securitization and other financing markets for student loans, including adverse changes resulting from slower than expected payments on student loans in FFELP securitization trusts, which may increase the costs or limit the availability of financings necessary to purchase, refinance, or continue to hold student loans; |
| |
| • | risks from changes in the educational credit and services markets resulting from changes in applicable laws, regulations, and government programs and budgets, such as the expected decline over time in FFELP loan interest income and fee-based revenues due to the discontinuation of new FFELP loan originations in 2010 and potential government initiatives or legislative proposals to consolidate existing FFELP loans to the Federal Direct Loan Program or otherwise allow FFELP loans to be refinanced with Federal Direct Loan Program loans; |
| |
| • | risks that the reported agreement to acquire Great Lakes Educational Loan Services, Inc. ("Great Lakes") may not be completed within the currently scheduled time frame or at all, the uncertain nature of the expected benefits from the acquisition and the ability to successfully integrate loan servicing operations and successfully maintain and increase allocated volumes of student loans serviced under existing and any future servicing contracts with the U.S. Department of Education (the "Department"), risks to the Company related to the Department's initiative to procure new contracts for federal student loan servicing, including the risk that the Company's joint venture with Great Lakes, or the Company on a post-Great Lakes acquisition basis, may not be awarded a contract, and risks related to the Company's ability to comply with agreements with third-party customers for the servicing of FFELP, Federal Direct Loan Program, and private education and consumer loans; |
| |
| • | risks related to a breach of or failure in the Company's operational or information systems or infrastructure, or those of third-party vendors, including cybersecurity risks related to the potential disclosure of confidential student loan borrower and other customer information; |
| |
| • | uncertainties inherent in forecasting future cash flows from student loan assets and related asset-backed securitizations; |
| |
| • | the uncertain nature of the expected benefits from the acquisition of Allo Communications LLC on December 31, 2015 and the ability to integrate its communications operations and successfully expand its fiber network in existing service areas and additional communities and manage related construction risks; |
| |
| • | risks and uncertainties related to initiatives to pursue additional strategic investments and acquisitions, including investments and acquisitions that are intended to diversify the Company both within and outside of its historical core education-related businesses; and |
| |
| • | risks and uncertainties associated with litigation matters and with maintaining compliance with the extensive regulatory requirements applicable to the Company's businesses, reputational and other risks, including the risk of increased regulatory costs, resulting from the recent politicization of student loan servicing, and uncertainties inherent in the estimates and assumptions about future events that management is required to make in the preparation of the Company's consolidated financial statements. |
All forward-looking statements contained in this supplement are qualified by these cautionary statements and are made only as of the date of this document. Although the Company may from time to time voluntarily update or revise its prior forward-looking statements to reflect actual results or changes in the Company's expectations, the Company disclaims any commitment to do so except as required by securities laws.
Consolidated Statements of Income
(Dollars in thousands, except share data)
(unaudited)
|
| | | | | | | | | | | | | | | |
| | Three Months Ended | | Nine months ended |
| | September 30,
2017 | | June 30,
2017 | | September 30,
2016 | | September 30,
2017 | | September 30,
2016 |
| Interest income: | | | | | | | | | |
| Loan interest | $ | 191,755 |
| | 189,488 |
| | 193,721 |
| | 562,451 |
| | 567,775 |
|
| Investment interest | 5,129 |
| | 3,589 |
| | 2,460 |
| | 11,335 |
| | 6,674 |
|
| Total interest income | 196,884 |
| | 193,077 |
| | 196,181 |
| | 573,786 |
| | 574,449 |
|
| Interest expense: | | | | | | | | | |
| Interest on bonds and notes payable | 121,650 |
| | 113,236 |
| | 96,386 |
| | 341,787 |
| | 280,847 |
|
| Net interest income | 75,234 |
| | 79,841 |
| | 99,795 |
| | 231,999 |
| | 293,602 |
|
| Less provision for loan losses | 6,000 |
| | 2,000 |
| | 6,000 |
| | 9,000 |
| | 10,500 |
|
| Net interest income after provision for loan losses | 69,234 |
| | 77,841 |
| | 93,795 |
| | 222,999 |
| | 283,102 |
|
| Other income: | | | | | | | | | |
| Loan systems and servicing revenue | 55,950 |
| | 56,899 |
| | 54,350 |
| | 167,079 |
| | 161,082 |
|
| Tuition payment processing, school information, and campus commerce revenue | 35,450 |
| | 34,224 |
| | 33,071 |
| | 113,293 |
| | 102,211 |
|
| Communications revenue | 6,751 |
| | 5,719 |
| | 4,343 |
| | 17,577 |
| | 13,167 |
|
| Enrollment services revenue | — |
| | — |
| | — |
| | — |
| | 4,326 |
|
| Other income | 19,756 |
| | 12,485 |
| | 15,150 |
| | 44,874 |
| | 38,711 |
|
| Gain from debt repurchases | 116 |
| | 442 |
| | 2,160 |
| | 5,537 |
| | 2,260 |
|
| Derivative settlements, net | (573 | ) | | (363 | ) | | (6,261 | ) | | (2,314 | ) | | (18,292 | ) |
| Derivative market value and foreign currency transaction adjustments, net | 7,746 |
| | (27,547 | ) | | 42,262 |
| | (23,254 | ) | | (15,099 | ) |
| Total other income | 125,196 |
| | 81,859 |
| | 145,075 |
| | 322,792 |
| | 288,366 |
|
| Operating expenses: | | | | | | | | | |
| Salaries and benefits | 74,193 |
| | 74,628 |
| | 63,743 |
| | 220,684 |
| | 187,907 |
|
| Depreciation and amortization | 10,051 |
| | 9,038 |
| | 8,994 |
| | 27,687 |
| | 24,817 |
|
| Loan servicing fees | 7,939 |
| | 5,620 |
| | 5,880 |
| | 19,584 |
| | 20,024 |
|
| Cost to provide communications services | 2,632 |
| | 2,203 |
| | 1,784 |
| | 6,789 |
| | 5,169 |
|
| Cost to provide enrollment services | — |
| | — |
| | — |
| | — |
| | 3,623 |
|
| Other expenses | 30,518 |
| | 27,528 |
| | 26,391 |
| | 84,593 |
| | 84,174 |
|
| Total operating expenses | 125,333 |
| | 119,017 |
|
| 106,792 |
| | 359,337 |
| | 325,714 |
|
| Income before income taxes | 69,097 |
| | 40,683 |
|
| 132,078 |
| | 186,454 |
| | 245,754 |
|
| Income tax expense | 25,562 |
| | 16,032 |
| | 47,715 |
| | 70,349 |
| | 87,184 |
|
| Net income | 43,535 |
| | 24,651 |
|
| 84,363 |
| | 116,105 |
| | 158,570 |
|
| Net loss (income) attributable to noncontrolling interests | 2,768 |
| | 4,086 |
| | (69 | ) | | 8,960 |
| | (165 | ) |
| Net income attributable to Nelnet, Inc. | $ | 46,303 |
| | 28,737 |
|
| 84,294 |
| | 125,065 |
| | 158,405 |
|
| Earnings per common share: | | | | | | | | | |
| Net income attributable to Nelnet, Inc. shareholders - basic and diluted | $ | 1.11 |
| | 0.68 |
| | 1.98 |
| | 2.97 |
| | 3.70 |
|
| | | | | | | | | | |
| Weighted average common shares outstanding - basic and diluted | 41,553,316 |
| | 42,326,540 |
| | 42,642,213 |
| | 42,054,532 |
| | 42,788,133 |
|
Condensed Consolidated Balance Sheets
(Dollars in thousands)
(unaudited)
|
| | | | | | | | | |
| | As of | | As of | | As of |
| | September 30, 2017 | | December 31, 2016 | | September 30, 2016 |
| Assets: | | | | | |
| Student loans receivable, net | $ | 22,528,845 |
| | 24,903,724 |
| | 25,615,434 |
|
| Cash, cash equivalents, investments, and other receivables | 530,927 |
| | 323,798 |
| | 324,682 |
|
| Restricted cash | 830,762 |
| | 1,100,663 |
| | 964,379 |
|
| Goodwill and intangible assets, net | 188,054 |
| | 195,125 |
| | 198,276 |
|
| Other assets | 690,122 |
| | 656,798 |
| | 566,840 |
|
| Total assets | $ | 24,768,710 |
| | 27,180,108 |
| | 27,669,611 |
|
| Liabilities: | | | | | |
| Bonds and notes payable | $ | 22,240,279 |
| | 24,668,490 |
| | 25,320,878 |
|
| Other liabilities | 397,991 |
| | 440,693 |
| | 367,637 |
|
| Total liabilities | 22,638,270 |
| | 25,109,183 |
| | 25,688,515 |
|
| Equity: | | | | | |
| Total Nelnet, Inc. shareholders' equity | 2,111,851 |
| | 2,061,655 |
| | 1,972,085 |
|
| Noncontrolling interest | 18,589 |
| | 9,270 |
| | 9,011 |
|
| Total equity | 2,130,440 |
| | 2,070,925 |
| | 1,981,096 |
|
| Total liabilities and equity | $ | 24,768,710 |
| | 27,180,108 |
| | 27,669,611 |
|
Overview
The Company is a diverse company with a focus on delivering education-related products and services and student loan asset management. The largest operating businesses engage in student loan servicing, tuition payment processing and school information systems, and communications. A significant portion of the Company's revenue is net interest income earned on a portfolio of federally insured student loans. The Company also makes investments to further diversify the Company both within and outside of its historical core education-related businesses, including, but not limited to, investments in real estate and start-up ventures.
GAAP Net Income and Non-GAAP Net Income, Excluding Adjustments
The Company prepares its financial statements and presents its financial results in accordance with GAAP. However, it also provides additional non-GAAP financial information related to specific items management believes to be important in the evaluation of its operating results and performance. A reconciliation of the Company's GAAP net income to net income, excluding derivative market value and foreign currency transaction adjustments, and a discussion of why the Company believes providing this additional
information is useful to investors, is provided below.
|
| | | | | | | | | | | | | | | |
| | Three months ended | | Nine months ended |
| | September 30, 2017 | | June 30, 2017 | | September 30, 2016 | | September 30, 2017 | | September 30, 2016 |
| GAAP net income attributable to Nelnet, Inc. | $ | 46,303 |
| | 28,737 |
| | 84,294 |
| | 125,065 |
| | 158,405 |
|
| Realized and unrealized derivative market value adjustments | (21,429 | ) | | 286 |
| | (47,093 | ) | | (22,381 | ) | | 1,556 |
|
| Unrealized foreign currency transaction adjustments | 13,683 |
| | 27,261 |
| | 4,831 |
| | 45,635 |
| | 13,543 |
|
| Net tax effect (a) | 2,943 |
| | (10,468 | ) | | 16,060 |
| | (8,837 | ) | | (5,737 | ) |
| Net income, excluding derivative market value and foreign currency transaction adjustments (b) | $ | 41,500 |
| | 45,816 |
| | 58,092 |
| | 139,482 |
| | 167,767 |
|
| | | | | | | | | | |
| Earnings per share: | | | | | | | | | |
| GAAP net income attributable to Nelnet, Inc. | $ | 1.11 |
| | 0.68 |
| | 1.98 |
| | 2.97 |
| | 3.70 |
|
| Realized and unrealized derivative market value adjustments | (0.51 | ) | | 0.01 |
| | (1.10 | ) | | (0.53 | ) | | 0.03 |
|
| Unrealized foreign currency transaction adjustments | 0.33 |
| | 0.64 |
| | 0.11 |
| | 1.09 |
| | 0.32 |
|
| Net tax effect (a) | 0.07 |
| | (0.25 | ) | | 0.37 |
| | (0.21 | ) | | (0.13 | ) |
| Net income, excluding derivative market value and foreign currency transaction adjustments (b) | $ | 1.00 |
| | 1.08 |
| | 1.36 |
| | 3.32 |
| | 3.92 |
|
| |
| (a) | The tax effects are calculated by multiplying the realized and unrealized derivative market value adjustments and unrealized foreign currency transaction adjustments by the applicable statutory income tax rate. |
| |
| (b) | "Derivative market value and foreign currency transaction adjustments" include (i) both the realized portion of gains and losses (corresponding to variation margin received or paid on derivative instruments that are settled daily at a central clearinghouse under new rules effective January 3, 2017) and the unrealized portion of gains and losses that are caused by changes in fair values of derivatives which do not qualify for "hedge treatment" under GAAP; and (ii) the unrealized foreign currency transaction gains or losses caused by the re-measurement of the Company's Euro-denominated bonds to U.S. dollars. "Derivative market value and foreign currency transaction adjustments" does not include "derivative settlements" that represent the cash paid or received during the current period to settle with derivative instrument counterparties the economic effect of the Company's derivative instruments based on their contractual terms. |
The accounting for derivatives requires that changes in the fair value of derivative instruments be recognized currently in earnings, with no fair value adjustment of the hedged item, unless specific hedge accounting criteria is met. Management has structured all of the Company’s derivative transactions with the intent that each is economically effective; however, the Company’s derivative instruments do not qualify for hedge accounting. As a result, the change in fair value of derivative instruments is reported in current period earnings with no consideration for the corresponding change in fair value of the hedged item. Under GAAP, the cumulative net realized and unrealized gain or loss caused by changes in fair values of derivatives in which the Company plans to hold to maturity will equal zero over the life of the contract. However, the net realized and unrealized gain or loss during any given reporting period fluctuates significantly from period to period. In addition, the Company has incurred unrealized foreign currency transaction adjustments for periodic fluctuations in currency exchange rates between the U.S. dollar and Euro in connection with its student loan asset-backed Euro-denominated bonds with an interest rate based on a spread to the EURIBOR index. The principal and accrued interest on these bonds were remeasured at each reporting period and recorded in the Company's consolidated balance sheet in U.S. dollars based on the foreign currency exchange rate on that date.
The Company believes these point-in-time estimates of asset and liability values related to its derivative instruments and Euro-denominated bonds that are or were subject to interest and currency rate fluctuations are or were subject to volatility mostly due to timing and market factors beyond the control of management, and affect the period-to-period comparability of the results of operations. Accordingly, the Company’s management utilizes operating results excluding these items for comparability purposes when making decisions regarding the Company’s performance and in presentations with credit rating agencies, lenders, and investors. Consequently, the Company reports this non-GAAP information because the Company believes that it provides additional information regarding operational and performance indicators that are closely assessed by management. There is no comprehensive, authoritative guidance for the presentation of such non-GAAP information, which is only meant to supplement GAAP results by providing additional information that management utilizes to assess performance.
On October 25, 2017, the Company completed a remarketing of the Company’s bonds that were prior to that date denominated in Euros, to denominate those bonds in U.S. dollars and reset the interest rate to be based on the 3-month LIBOR index. The Company also terminated a cross-currency interest rate swap associated with those bonds. As a result, foreign currency transaction adjustments will not be incurred with respect to those bonds after October 25, 2017.
The decrease in GAAP net income for the three months ended September 30, 2017, as compared with the same period in 2016, was primarily due to a reduction in net gains related to changes in the fair values of derivative instruments and an increase in losses related to foreign currency transaction adjustments caused by the re-measurement of the Company's Euro-denominated bonds to U.S. dollars.
The decrease in GAAP net income for the nine months ended September 30, 2017, compared with the same period in 2016, was primarily due to an increase in losses related to foreign currency transaction adjustments caused by the re-measurement of the Company's Euro-denominated bonds to U.S. dollars, partially offset by an increase in net gains related to changes in the fair values of derivative instruments.
In addition, net interest income earned on the Company’s student loan portfolio decreased in 2017 compared to 2016 due to the
expected runoff of the portfolio and lower student loan spread.
Operating Results
The Company earns net interest income on its FFELP student loan portfolio in its Asset Generation and Management ("AGM") operating segment. This segment is expected to generate a stable net interest margin and significant amounts of cash as the FFELP portfolio amortizes. As of September 30, 2017, the Company had a $22.5 billion student loan portfolio that management anticipates will amortize over the next approximately 25 years. The Company actively works to maximize the amount and timing of cash flows generated by its FFELP portfolio and seeks to acquire additional FFELP loan portfolios to leverage its servicing scale and expertise to generate incremental earnings and cash flow.
In addition, the Company earns fee-based revenue through the following reportable operating segments:
| |
| • | Loan Systems and Servicing ("LSS") - referred to as Nelnet Diversified Solutions ("NDS") |
| |
| • | Tuition Payment Processing and Campus Commerce ("TPP&CC") - referred to as Nelnet Business Solutions ("NBS") |
| |
| • | Communications - referred to as Allo Communications ("Allo") |
Other business activities and operating segments that are not reportable are combined and included in Corporate and Other Activities ("Corporate"). Corporate and Other Activities also includes income earned on certain investments and interest expense incurred on unsecured debt transactions.
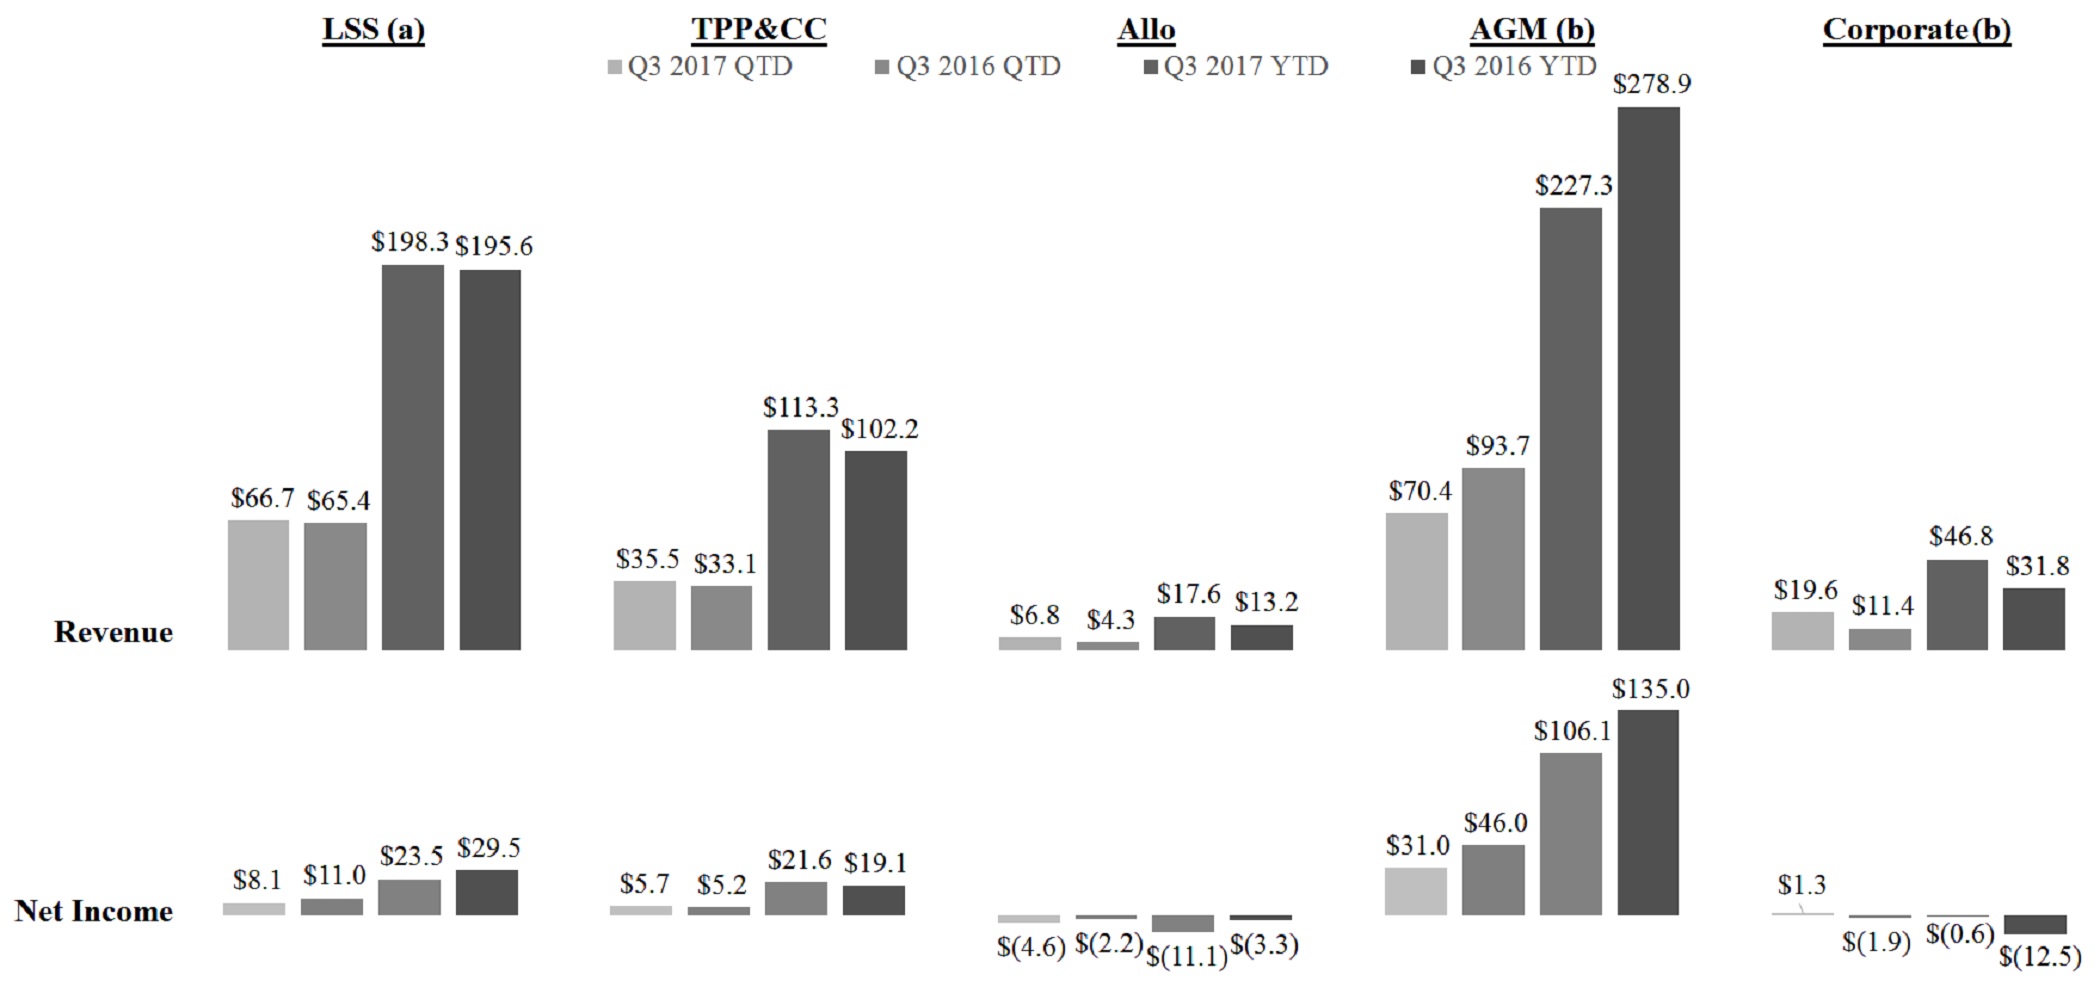
The information below provides the operating results for each reportable operating segment and Corporate and Other Activities for the three and nine months ended September 30, 2017 and 2016 (dollars in millions).
(a) Revenue includes intersegment revenue earned by LSS as a result of servicing loans for AGM.
| |
| (b) | Total revenue includes "net interest income after provision for loan losses" and "total other income" from the Company's segment statements of income, excluding the impact from changes in fair values of derivatives and foreign currency transaction adjustments. Net income excludes changes in fair values of derivatives and foreign currency transaction adjustments, net of tax. For information regarding the exclusion of the impact from changes in fair values of derivatives and foreign currency transaction adjustments, see "GAAP Net Income and Non-GAAP Net Income, Excluding Adjustments" above. |
A summary of the results and financial highlights for each reportable operating segment and a summary of the Company's liquidity and capital resources follows.
Loan Systems and Servicing
| |
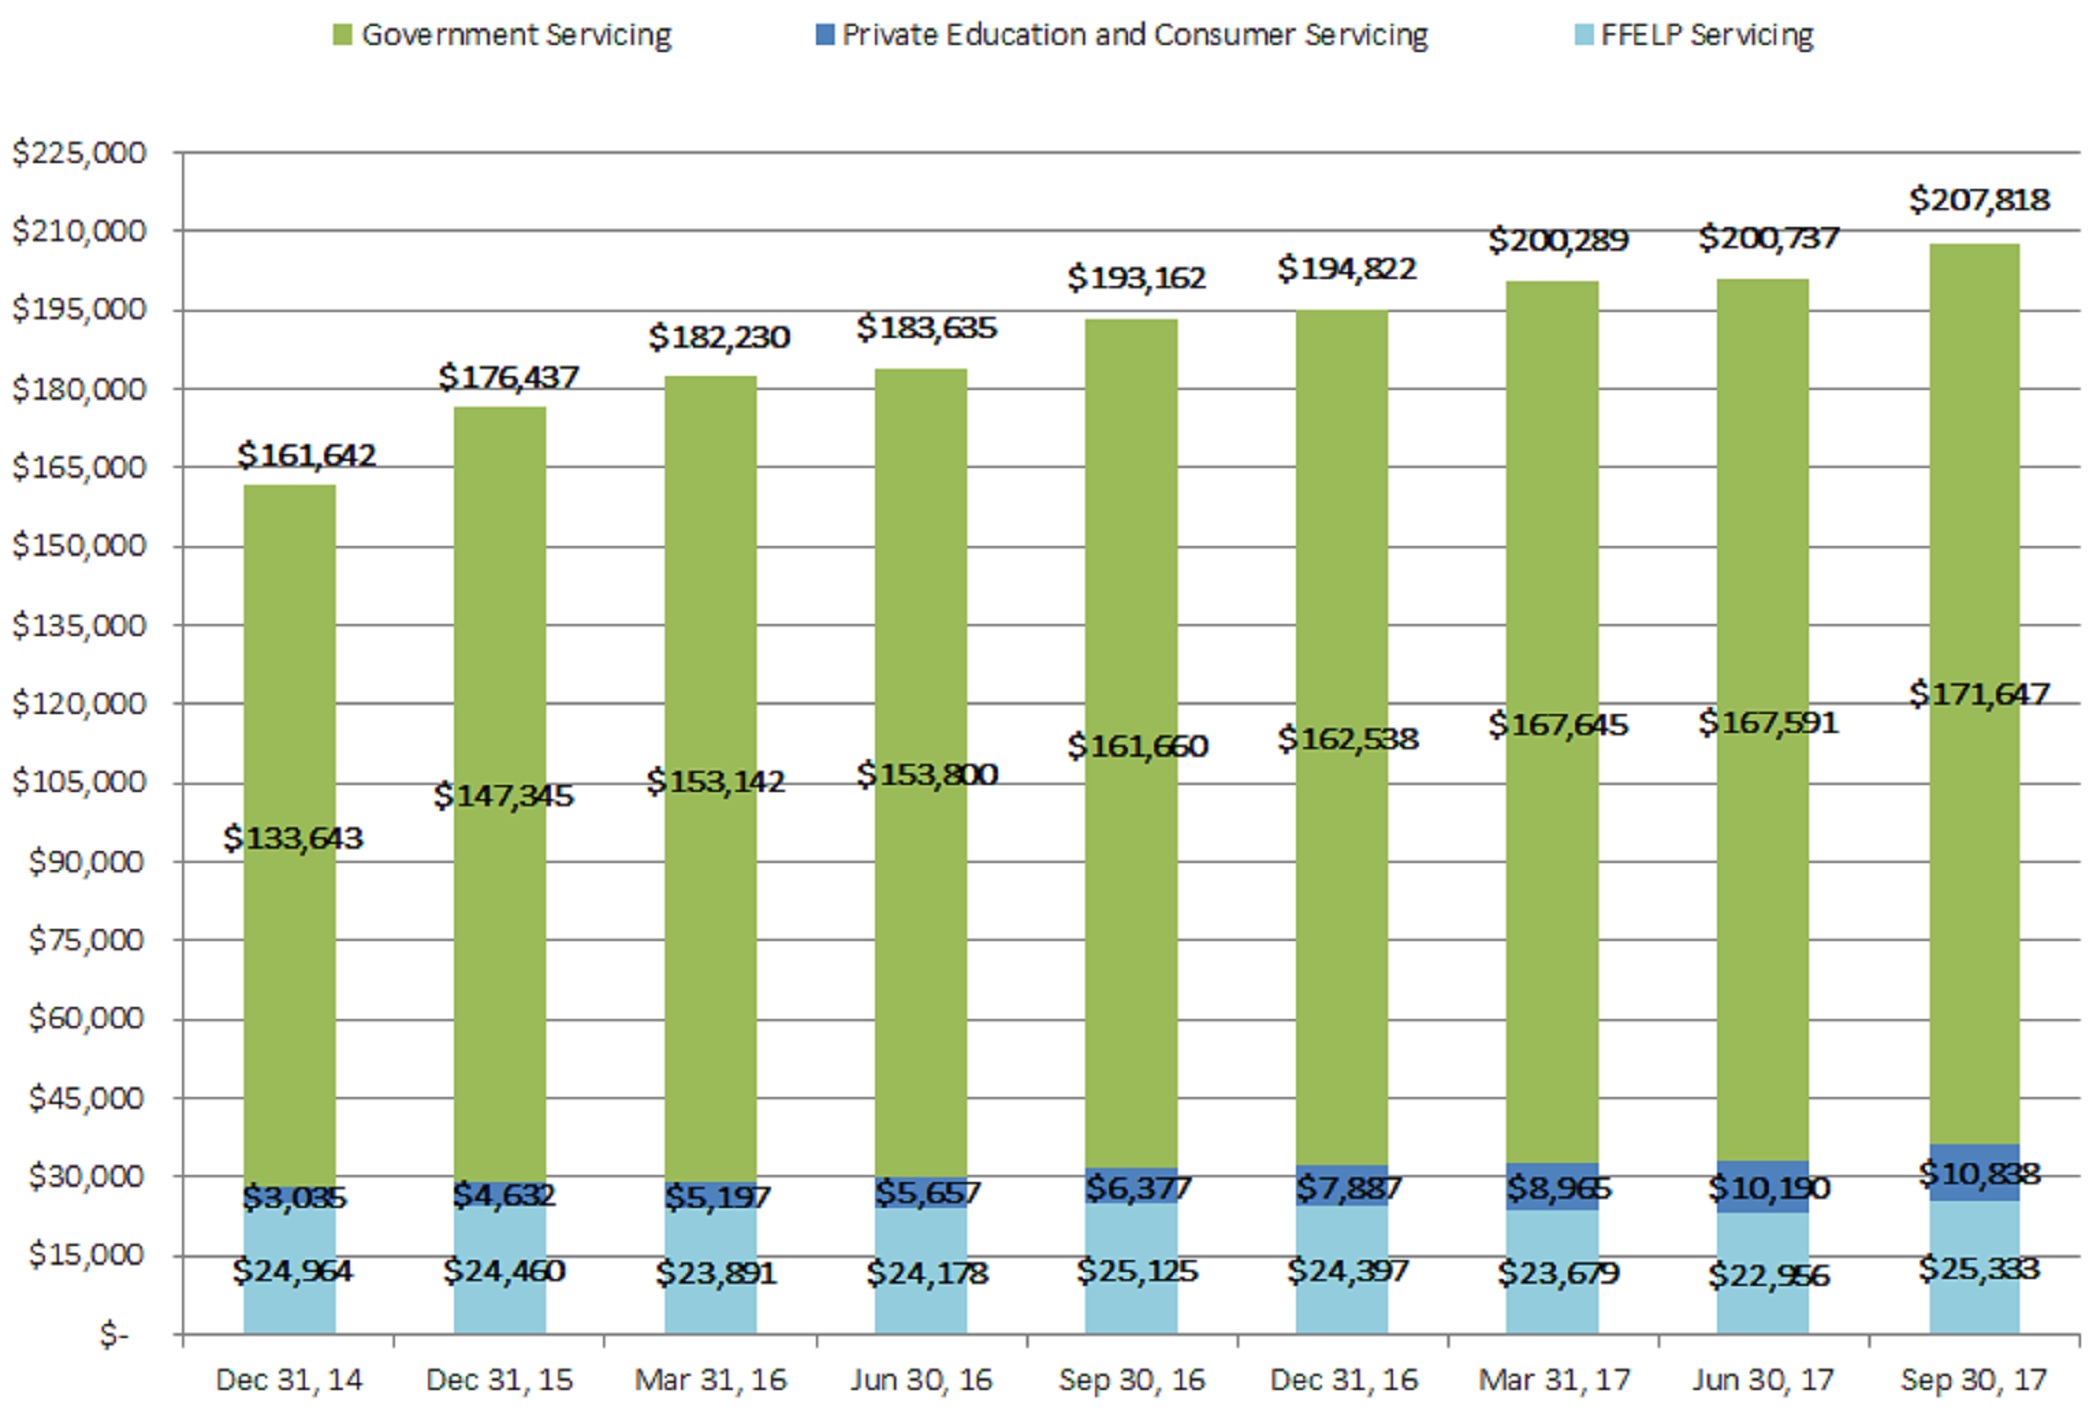
| • | As of September 30, 2017, the Company was servicing $207.8 billion in FFELP, government owned, and private education and consumer loans, as compared with $193.2 billion of loans as of September 30, 2016. |
| |
| • | Revenue increased in the three and nine months ended September 30, 2017 compared to the same periods in 2016 due to growth in private education and consumer loan servicing volume from existing and new clients. In addition, revenue increased for the nine months ended September 30, 2017 compared to the same period in 2016 due to an increase in revenue on the government servicing contract. The increase in revenue for the nine months ended September 30, 2017 compared to the same period in 2016 was partially offset by the loss of guaranty servicing and collection revenue on June 30, 2016. |
| |
| • | Revenue from the government servicing contract decreased to $38.6 million for the three months ended September 30, 2017 compared to $40.2 million for the same period in 2016, and increased to $117.4 million for the nine months ended September 30, 2017, compared to $112.5 million for the same period in 2016. The decrease for the three months ended September 30, 2017 compared to the same period in 2016 was due to a decrease in application volume for the Company's administration of the Total and Permanent Disability Discharge (TPD) program during the third quarter of 2017. The increase for the nine months ended September 30, 2017 compared to the same period in 2016 was due to an increase in TPD and Direct Loan Consolidation program application volume, the transfer of borrowers to the Company from a not-for-profit servicer who exited the loan servicing business in August 2016, and the shift in the portfolio of loans serviced to a greater portion of loans in higher paying repayment statuses. As of September 30, 2017, the Company was servicing $171.6 billion of student loans for 5.9 million borrowers under this contract. |
| |
| • | Revenue from private education and consumer loan servicing increased to $7.6 million for the three months ended September 30, 2017 compared to $4.1 million for the same period in 2016, and increased to $20.5 million for the nine |
months ended September 30, 2017, compared to $10.7 million for the same period in 2016. As of September 30, 2017, the Company was servicing $10.8 billion of private education and consumer loans for approximately 478,000 borrowers, as compared to $6.4 billion of private education and consumer loans for approximately 293,000 borrowers as of September 30, 2016.
| |
| • | The Company's remaining guaranty servicing and collection client exited the FFELP guaranty business at the end of their contract term on June 30, 2016. After this customer's exit from the FFELP guaranty business effective June 30, 2016, the Company has no remaining guaranty servicing and collection revenue. Guaranty servicing and collection revenue earned from this customer in the nine months ended September 30, 2016 was $9.6 million. |
| |
| • | The Company's government servicing contract is currently set to expire on June 19, 2019. In April 2016, the Department announced a new contract procurement process for the Department to acquire a single servicing platform to manage all student loans owned by the Department. |
In May, 2016, Nelnet Servicing, a subsidiary of the Company, and Great Lakes submitted a joint response to the procurement as part of a newly created joint venture to respond to the contract solicitation process and to provide services under a new contract in the event that the Department selects it for a contract award. The joint venture operates as a new legal entity called GreatNet. Nelnet Servicing and Great Lakes each own 50 percent of the ownership interests of GreatNet. In addition to Nelnet Servicing, Great Lakes is currently one of four private sector companies (referred to as Title IV Additional Servicers, or "TIVAS") that has a student loan servicing contract with the Department to provide servicing for loans owned by the Department. On May 19, 2017, the Department announced it had amended the contract procurement process, which required another response by the participants, and on July 7, 2017, GreatNet submitted its response to the Department.
On August, 1, 2017, the Department announced it was canceling the current procurement process for a single servicing platform and that it intends to develop a new contract procurement proposal. The Department indicated that its new approach is expected to require separate contract acquisitions for database housing, system processing, and customer account servicing.
For financial reporting purposes, the operating results of GreatNet are included in the Company's consolidated financial statements. The proportionate share of membership interest (equity) and net loss of GreatNet that is attributable to Great Lakes is reflected as noncontrolling interests. During the first and third quarters of 2017, Nelnet Servicing and Great Lakes each contributed capital to GreatNet and during the first quarter of 2017 GreatNet began to incur certain operating costs.
| |
| • | Before tax operating margin decreased in 2017 compared to 2016 due to operating expenses incurred related to GreatNet and an increase in personnel to support the increase in volume of loans serviced for the government entering repayment status. |
| |
| • | On October 18, 2017, the Company entered into an agreement to purchase 100 percent of the outstanding stock of Great Lakes for a purchase price of $150.0 million in cash. The transaction is scheduled to close on January 1, 2018, subject to customary closing conditions. After the transaction settles, Great Lakes and the Company will maintain their distinct brands, servicing operations, and operational teams, and each will continue to compete for new student loan volume under its respective existing contract with the Department. Over time, shared services teams will integrate and technology systems will be leveraged to support both the Great Lakes and the Company's servicing operations. The operating results of Great Lakes will be included in the Loan Systems and Servicing operating segment. |
Tuition Payment Processing and Campus Commerce
| |
| • | Revenue increased in the three and nine months ended September 30, 2017 compared to the same periods in 2016 due to increases in the number of managed tuition payment plans, campus commerce customer transactions and payments volume, and new school customers. |
| |
| • | Before tax operating margin for the three months ended September 30, 2017 and 2016 was 26.1 percent and 25.4 percent, respectively, and for the nine months ended September 30, 2017 and 2016 was 30.7 percent and 30.2 percent, respectively. This segment is subject to seasonal fluctuations. Based on the timing of when revenue is recognized and when expenses are incurred, revenue and operating margin are higher in the first quarter as compared to the remainder of the year. |
Communications
| |
| • | For the three months ended September 30, 2017 and 2016, Allo recorded net losses of $4.6 million and $2.2 million, respectively, and for the nine months ended September 30, 2017 and 2016 recorded net losses of $11.1 million and $3.3 million, respectively. The Company anticipates this operating segment will be dilutive to consolidated earnings over the next several years as it continues to build its network in Lincoln, Nebraska, due to large upfront capital expenditures and associated depreciation and upfront customer acquisition costs. |
| |
| • | Revenue from Allo for the three months ended September 30, 2017 and 2016 was $6.8 million and $4.3 million, respectively, and for the nine months ended September 30, 2017 and 2016 revenue was $17.6 million and $13.2 million, respectively. The increase in revenue was primarily due to additiional residential households served, which increased to 16,394 as of September 30, 2017 from 8,745 as of September 30, 2016. |
| |
| • | For the three and nine months ended September 30, 2017, Allo's capital expenditures were $29.4 million and $78.4 million, respectively. The Company anticipates total network capital expenditures of approximately $30.0 million in the fourth quarter of 2017 and approximately $100.0 million in 2018; however, such amounts could change based on customer demand for Allo's services. The number of residential households passed, which represents the estimated number of single residence homes, apartments, and condominiums that Allo already serves and those in which Allo has the capacity to connect to its network distribution system without further material extensions to the transmission lines (but have not been connected) increased to 54,815 as of September 30, 2017 as compared to 30,962 as of December 31, 2016. The total households in current markets that Allo plans to expand its network to make services available is 137,500. |
Asset Generation and Management
| |
| • | During the three months ended September 30, 2017 compared to the same period in 2016, the average balance of student loans decreased $3.2 billion, to $23.2 billion, due primarily to the amortization of the student loan portfolio, partially offset by limited portfolio acquisitions from third parties. The Company acquired $37.5 million and $142.4 million of student loans during the three and nine months ended September 30, 2017, respectively. |
| |
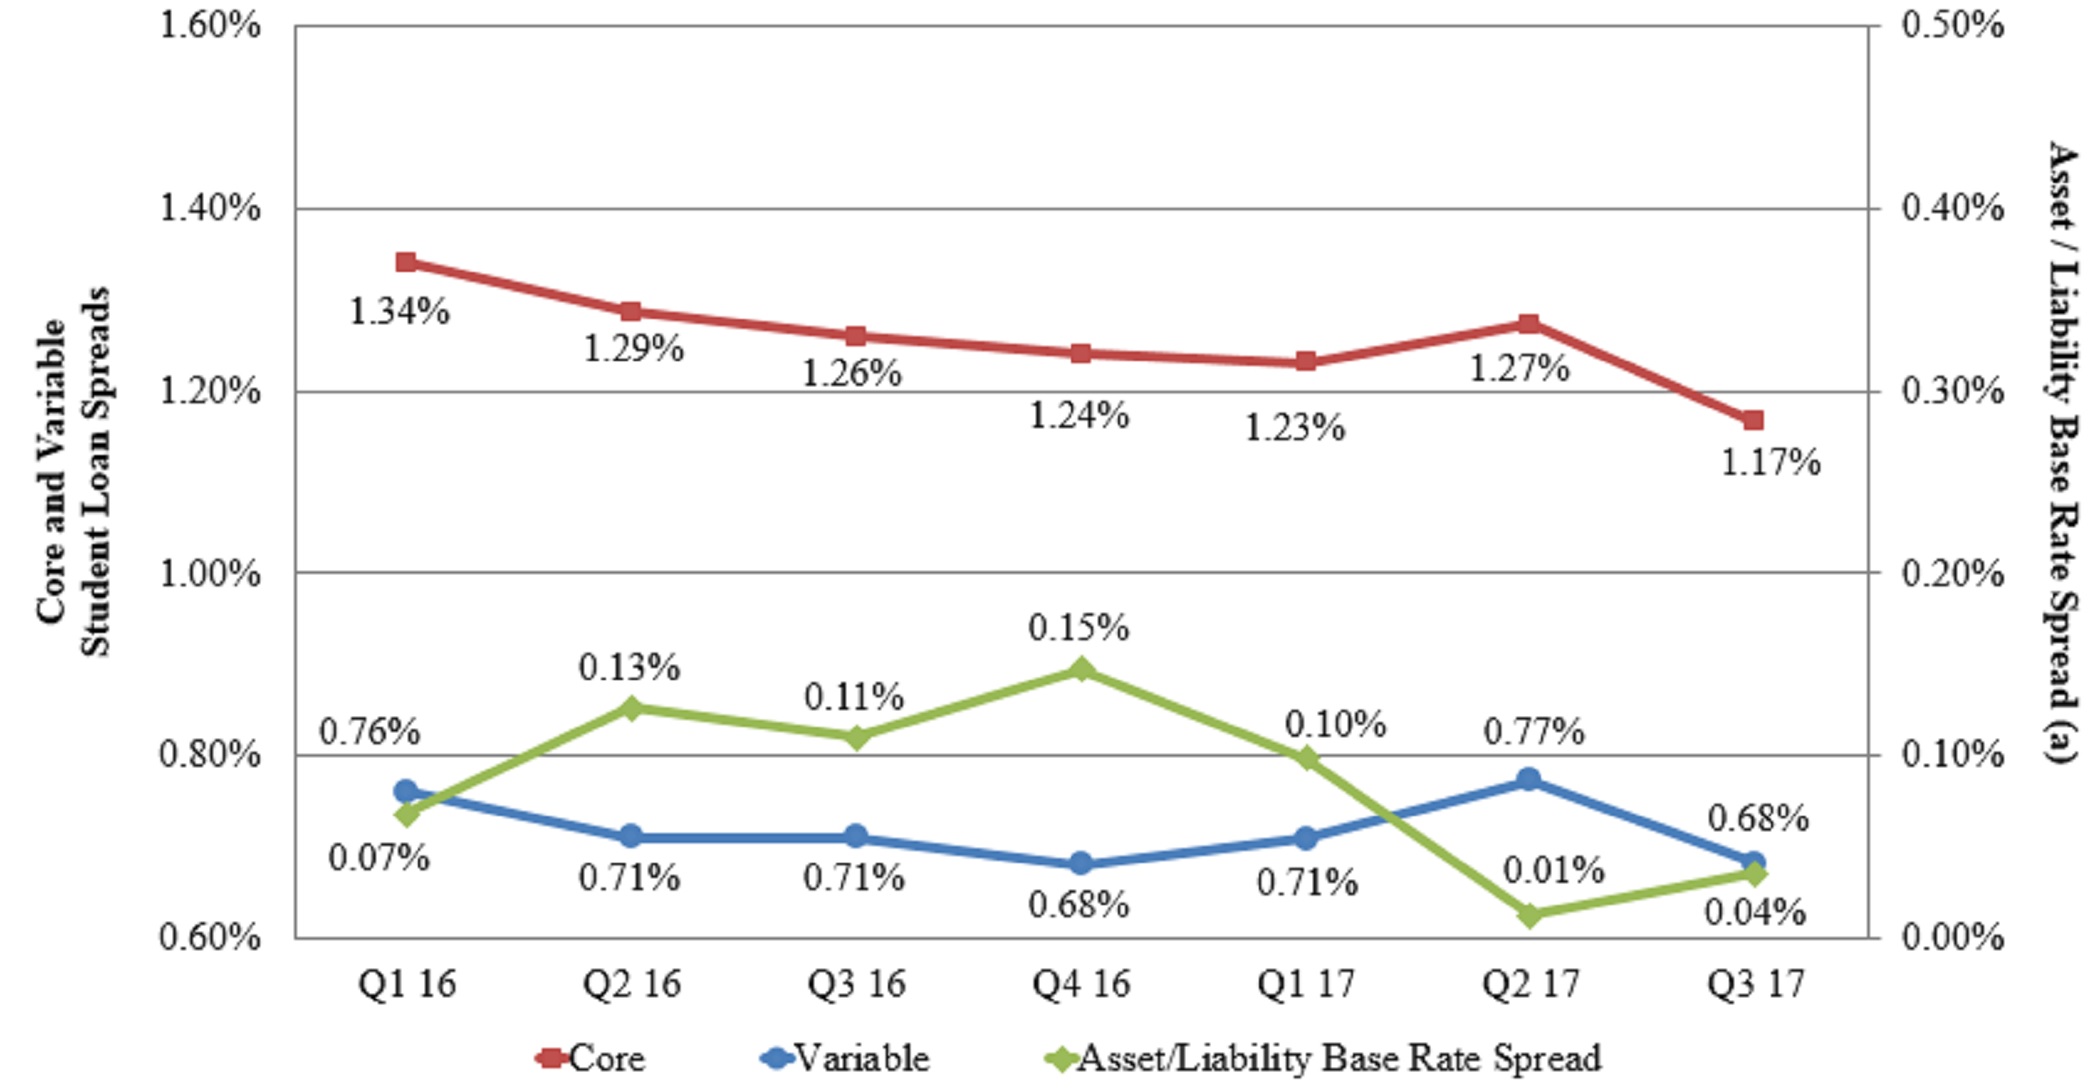
| • | Core student loan spread was 1.17% for the three months ended September 30, 2017, compared to 1.26% for the same period in 2016. The decrease in core student loan spread was primarily due to a decrease in fixed rate floor income and an increase in derivative settlements paid related to the Company's 1:3 basis swaps. |
| |
| • | Due to historically low interest rates, the Company continues to earn significant fixed rate floor income. During the three months ended September 30, 2017 and 2016, and nine months ended September 30, 2017 and 2016, the Company earned $24.6 million, $41.5 million, $84.4 million, and $131.7 million, respectively, of fixed rate floor income. |
| |
| • | Provision for loan losses for federally insured loans was $7.0 million for the three months ended September 30, 2017. During the three months ended September 30, 2017, the Company determined an additional allowance was necessary related to a $1.6 billion (principal balance as of September 30, 2017) portfolio of federally insured loans that were purchased in 2014 and 2015, and recognized $5.0 million (pre-tax) in provision expense related to these loans. |
| |
| • | During the third quarter of 2017, the Company incurred $2.8 million (pre-tax) in expenses related to conversion fees to |
transfer loans from a third-party servicer to the Company's servicing platform, which will decrease servicing costs over the remaining life of this portfolio.
Corporate and Other Activities
| |
| • | Whitetail Rock Capital Management, LLC, the Company's SEC-registered investment advisor subsidiary, recognized investment advisory revenue of $5.9 million, $1.5 million, $11.7 million, and $3.4 million in the three months ended September 30, 2017 and 2016 and nine months ended September 30, 2017 and 2016, respectively. These amounts include performance fees earned from the sale of managed securities or managed securities being called prior to the full contractual maturity. |
Liquidity and Capital Resources
| |
| • | As of September 30, 2017, the Company had cash and cash equivalents of $254.4 million. In addition, the Company had a portfolio of available-for-sale investments, consisting primarily of student loan asset-backed securities, with a fair value of $75.4 million as of September 30, 2017. |
| |
| • | For the nine months ended September 30, 2017, the Company generated $230.3 million in net cash from operating activities. |
| |
| • | Forecasted undiscounted future cash flows from the Company's student loan portfolio financed in asset-backed securitization transactions are estimated to be approximately $1.93 billion as of September 30, 2017. |
| |
| • | As of September 30, 2017, there was $210.0 million outstanding on the Company's $350.0 million unsecured line of credit and $140.0 million was available for future use. The unsecured line of credit has a maturity date of December 12, 2021. |
| |
| • | During the nine months ended September 30, 2017, the Company repurchased a total of 1,363,571 shares of Class A common stock for $63.3 million ($46.44 per share), including a total of 947,794 shares of Class A common stock repurchased for $45.1 million ($47.62 per share) during the three months ended September 30, 2017. Certain of these repurchases were made pursuant to a trading plan adopted by the Company in accordance with Rule 10b5-1 under the Securities Exchange Act of 1934. |
| |
| • | During the first quarter of 2017, the Company initiated a cash tender offer to purchase any and all of its outstanding unsecured Hybrid Securities. The aggregate principal amount of notes tendered to the Company was $29.7 million. The Company paid $25.3 million to redeem these notes, and recognized a $4.4 million (pre-tax) gain. In addition, during the three and nine months ended September 30, 2017, the Company repurchased $14.7 million and $18.8 million of its own asset-backed debt securities and recognized gains of $0.1 million and $1.1 million, respectively. |
| |
| • | During the nine months ended September 30, 2017, the Company paid cash dividends of $17.6 million ($0.42 per share), including $5.8 million ($0.14 per share) during the three months ended September 30, 2017. In addition, the Company's Board of Directors has declared a fourth quarter 2017 cash dividend on the Company's outstanding shares of Class A and Class B common stock of $0.16 per share. The fourth quarter cash dividend will be paid on December 15, 2017 to shareholders of record at the close of business on December 1, 2017. |
| |
| • | The Company intends to use its liquidity position to capitalize on market opportunities, including FFELP and private education and consumer loan acquisitions; strategic acquisitions and investments; expansion of Allo's telecommunications network; and capital management initiatives, including stock repurchases, debt repurchases, and dividend distributions. The timing and size of these opportunities will vary and will have a direct impact on the Company's cash and investment balances. |
Operating Segments
The Company has four reportable operating segments. The Company's reportable operating segments include:
• Loan Systems and Servicing
• Tuition Payment Processing and Campus Commerce
• Communications
• Asset Generation and Management
The Company earns fee-based revenue through its Loan Systems and Servicing, Tuition Payment Processing, and Communications operating segments. In addition, the Company earns interest income on its student loan portfolio in its Asset Generation and Management operating segment. The Company’s operating segments are defined by the products and services they offer and the types of customers they serve, and they reflect the manner in which financial information is currently evaluated by management. See note 1 of the notes to consolidated financial statements included in the 2016 Annual Report for a description of each operating segment, including the primary products and services offered.
The management reporting process measures the performance of the Company’s operating segments based on the management structure of the Company, as well as the methodology used by management to evaluate performance and allocate resources. Executive management (the "chief operating decision maker") evaluates the performance of the Company’s operating segments based on their financial results prepared in conformity with U.S. GAAP.
Corporate and Other Activities
Other business activities and operating segments that are not reportable are combined and included in Corporate and Other Activities. Corporate and Other Activities includes the following items:
| |
| • | Income earned on certain investment activities |
| |
| • | Interest expense incurred on unsecured debt transactions |
| |
| • | Other product and service offerings that are not considered reportable operating segments including, but not limited to, Whitetail Rock Capital Management, LLC, the Company's SEC-registered investment advisor subsidiary |
Corporate and Other Activities also include certain corporate activities and overhead functions related to executive management, human resources, accounting, legal, enterprise risk management, information technology, occupancy, and marketing. These costs are allocated to each operating segment based on estimated use of such activities and services.
Segment Results of Operations
The following tables include the results of each of the Company's operating segments reconciled to the consolidated financial
statements.
|
| | | | | | | | | | | | | | | | | | | | | |
| | Three months ended September 30, 2017 |
| | Loan Systems and Servicing | | Tuition Payment Processing and Campus Commerce | | Communications | | Asset
Generation and
Management | | Corporate and Other Activities | | Eliminations | | Total |
| Total interest income | $ | 147 |
| | 5 |
| | 1 |
| | 194,968 |
| | 3,903 |
| | (2,139 | ) | | 196,884 |
|
| Interest expense | — |
| | — |
| | 1,551 |
| | 121,074 |
| | 1,165 |
| | (2,139 | ) | | 121,650 |
|
| Net interest income | 147 |
| | 5 |
| | (1,550 | ) | | 73,894 |
| | 2,738 |
| | — |
| | 75,234 |
|
| Less provision for loan losses | — |
| | — |
| | — |
| | 6,000 |
| | — |
| | — |
| | 6,000 |
|
| Net interest income (loss) after provision for loan losses | 147 |
| | 5 |
| | (1,550 | ) | | 67,894 |
| | 2,738 |
| | — |
| | 69,234 |
|
| Other income: | |
| | |
| | | | |
| | |
| | |
| | |
|
| Loan systems and servicing revenue | 55,950 |
| | — |
| | — |
| | — |
| | — |
| | — |
| | 55,950 |
|
| Intersegment servicing revenue | 10,563 |
| | — |
| | — |
| | — |
| | — |
| | (10,563 | ) | | — |
|
| Tuition payment processing, school information, and campus commerce revenue | — |
| | 35,450 |
| | — |
| | — |
| | — |
| | — |
| | 35,450 |
|
| Communications revenue | — |
| | — |
| | 6,751 |
| | — |
| | — |
| | — |
| | 6,751 |
|
| Other income | — |
| | — |
| | — |
| | 2,753 |
| | 17,003 |
| | — |
| | 19,756 |
|
| Gain from debt repurchases | — |
| | — |
| | — |
| | 116 |
| | — |
| | — |
| | 116 |
|
| Derivative settlements, net | — |
| | — |
| | — |
| | (382 | ) | | (191 | ) | | — |
| | (573 | ) |
| Derivative market value and foreign currency transaction adjustments, net | — |
| | — |
| | — |
| | 7,702 |
| | 44 |
| | — |
| | 7,746 |
|
| Total other income | 66,513 |
| | 35,450 |
| | 6,751 |
| | 10,189 |
| | 16,856 |
| | (10,563 | ) | | 125,196 |
|
| Operating expenses: | |
| | |
| | | | | | |
| | | | |
|
| Salaries and benefits | 38,435 |
| | 17,432 |
| | 4,099 |
| | 392 |
| | 13,834 |
| | — |
| | 74,193 |
|
| Depreciation and amortization | 549 |
| | 2,316 |
| | 3,145 |
| | — |
| | 4,040 |
| | — |
| | 10,051 |
|
| Loan servicing fees | — |
| | — |
| | — |
| | 7,939 |
| | — |
| | — |
| | 7,939 |
|
| Cost to provide communications services | — |
| | — |
| | 2,632 |
| | — |
| | — |
| | — |
| | 2,632 |
|
| Other expenses | 10,317 |
| | 4,224 |
| | 2,278 |
| | 1,451 |
| | 12,248 |
| | — |
| | 30,518 |
|
| Intersegment expenses, net | 7,774 |
| | 2,219 |
| | 470 |
| | 10,659 |
| | (10,559 | ) | | (10,563 | ) | | — |
|
| Total operating expenses | 57,075 |
| | 26,191 |
| | 12,624 |
| | 20,441 |
| | 19,563 |
| | (10,563 | ) | | 125,333 |
|
| Income (loss) before income taxes | 9,585 |
| | 9,264 |
| | (7,423 | ) | | 57,642 |
| | 31 |
| | — |
| | 69,097 |
|
| Income tax (expense) benefit | (4,937 | ) | | (3,520 | ) | | 2,821 |
| | (21,904 | ) | | 1,978 |
| | — |
| | (25,562 | ) |
| Net income (loss) | 4,648 |
| | 5,744 |
| | (4,602 | ) | | 35,738 |
| | 2,009 |
| | — |
| | 43,535 |
|
| Net loss (income) attributable to noncontrolling interests | 3,408 |
| | — |
| | — |
| | — |
| | (640 | ) | | — |
| | 2,768 |
|
| Net income (loss) attributable to Nelnet, Inc. | $ | 8,056 |
| | 5,744 |
| | (4,602 | ) | | 35,738 |
| | 1,369 |
| | — |
| | 46,303 |
|
|
| | | | | | | | | | | | | | | | | | | | | |
| | Three months ended June 30, 2017 |
| | Loan Systems and Servicing | | Tuition Payment Processing and Campus Commerce | | Communications | | Asset Generation and Management | | Corporate and Other Activities | | Eliminations | | Total |
| Total interest income | $ | 120 |
| | 3 |
| | 1 |
| | 191,367 |
| | 3,362 |
| | (1,776 | ) | | 193,077 |
|
| Interest expense | — |
| | — |
| | 1,104 |
| | 113,073 |
| | 835 |
| | (1,776 | ) | | 113,236 |
|
| Net interest income | 120 |
|
| 3 |
|
| (1,103 | ) |
| 78,294 |
|
| 2,527 |
|
| — |
| | 79,841 |
|
| Less provision for loan losses | — |
| | — |
| | — |
| | 2,000 |
| | — |
| | — |
| | 2,000 |
|
| Net interest income (loss) after provision for loan losses | 120 |
|
| 3 |
|
| (1,103 | ) |
| 76,294 |
|
| 2,527 |
|
| — |
| | 77,841 |
|
| Other income: | | | | | | | | | | | | | |
| Loan systems and servicing revenue | 56,899 |
| | — |
| | — |
| | — |
| | — |
| | — |
| | 56,899 |
|
| Intersegment servicing revenue | 9,952 |
| | — |
| | — |
| | — |
| | — |
| | (9,952 | ) | | — |
|
| Tuition payment processing, school information, and campus commerce revenue | — |
| | 34,224 |
| | — |
| | — |
| | — |
| | — |
| | 34,224 |
|
| Communications revenue | — |
| | — |
| | 5,719 |
| | — |
| | — |
| | — |
| | 5,719 |
|
| Other income | — |
| | — |
| | — |
| | 3,057 |
| | 9,429 |
| | — |
| | 12,485 |
|
| Gain from debt repurchases | — |
| | — |
| | — |
| | 442 |
| | — |
| | — |
| | 442 |
|
| Derivative settlements, net | — |
| | — |
| | — |
| | (165 | ) | | (198 | ) | | — |
| | (363 | ) |
| Derivative market value and foreign currency transaction adjustments, net | — |
| | — |
| | — |
| | (27,412 | ) | | (135 | ) | | — |
| | (27,547 | ) |
| Total other income | 66,851 |
| | 34,224 |
|
| 5,719 |
| | (24,078 | ) | | 9,096 |
| | (9,952 | ) | | 81,859 |
|
| Operating expenses: | |
| | |
| | | | |
| | |
| | |
| | |
|
| Salaries and benefits | 40,506 |
| | 16,901 |
| | 3,411 |
| | 363 |
| | 13,447 |
| | — |
| | 74,628 |
|
| Depreciation and amortization | 546 |
| | 2,346 |
| | 2,600 |
| | — |
| | 3,547 |
| | — |
| | 9,038 |
|
| Loan servicing fees | — |
| | — |
| | — |
| | 5,620 |
| | — |
| | — |
| | 5,620 |
|
| Cost to provide communications services | — |
| | — |
| | 2,203 |
| | — |
| | — |
| | — |
| | 2,203 |
|
| Other expenses | 8,879 |
| | 4,853 |
| | 1,772 |
| | 1,827 |
| | 10,195 |
| | — |
| | 27,528 |
|
| Intersegment expenses, net | 8,324 |
| | 2,136 |
| | 496 |
| | 10,043 |
| | (11,046 | ) | | (9,952 | ) | | — |
|
| Total operating expenses | 58,255 |
| | 26,236 |
|
| 10,482 |
| | 17,853 |
| | 16,143 |
| | (9,952 | ) | | 119,017 |
|
| Income (loss) before income taxes | 8,716 |
| | 7,991 |
|
| (5,866 | ) | | 34,363 |
| | (4,520 | ) | | — |
| | 40,683 |
|
| Income tax (expense) benefit | (4,918 | ) | | (3,037 | ) | | 2,229 |
| | (13,057 | ) | | 2,751 |
| | — |
| | (16,032 | ) |
| Net income (loss) | 3,798 |
| | 4,954 |
|
| (3,637 | ) | | 21,306 |
| | (1,769 | ) | | — |
| | 24,651 |
|
| Net loss (income) attributable to noncontrolling interests | 4,226 |
| | — |
| | — |
| | — |
| | (141 | ) | | — |
| | 4,086 |
|
| Net income (loss) attributable to Nelnet, Inc. | $ | 8,024 |
|
| 4,954 |
|
| (3,637 | ) |
| 21,306 |
|
| (1,910 | ) |
| — |
|
| 28,737 |
|
|
| | | | | | | | | | | | | | | | | | | | | |
| | Three months ended September 30, 2016 |
| | Loan Systems and Servicing | | Tuition Payment Processing and Campus Commerce | | Communications | | Asset
Generation and
Management | | Corporate and Other
Activities | | Eliminations | | Total |
| Total interest income | $ | 37 |
| | 2 |
| | — |
| | 194,701 |
| | 2,370 |
| | (930 | ) | | 196,181 |
|
| Interest expense | — |
| | — |
| | 318 |
| | 95,383 |
| | 1,615 |
| | (930 | ) | | 96,386 |
|
| Net interest income | 37 |
| | 2 |
| | (318 | ) | | 99,318 |
| | 755 |
| | — |
| | 99,795 |
|
| Less provision for loan losses | — |
| | — |
| | — |
| | 6,000 |
| | — |
| | — |
| | 6,000 |
|
| Net interest income (loss) after provision for loan losses | 37 |
| | 2 |
| | (318 | ) | | 93,318 |
| | 755 |
| | — |
| | 93,795 |
|
| Other income: | |
| | |
| | | | |
| | |
| | |
| | |
|
| Loan systems and servicing revenue | 54,350 |
| | — |
| | — |
| | — |
| | — |
| | — |
| | 54,350 |
|
| Intersegment servicing revenue | 11,021 |
| | — |
| | — |
| | — |
| | — |
| | (11,021 | ) | | — |
|
| Tuition payment processing, school information, and campus commerce revenue | — |
| | 33,071 |
| | — |
| | — |
| | — |
| | — |
| | 33,071 |
|
| Communications revenue | — |
| | — |
| | 4,343 |
| | — |
| | — |
| | — |
| | 4,343 |
|
| Enrollment services revenue | — |
| | — |
| | — |
| | — |
| | — |
| | — |
| | — |
|
| Other income | — |
| | — |
| | — |
| | 4,265 |
| | 10,886 |
| | — |
| | 15,150 |
|
| Gain from debt repurchases | — |
| | — |
| | — |
| | 2,160 |
| | — |
| | — |
| | 2,160 |
|
| Derivative settlements, net | — |
| | — |
| | — |
| | (6,028 | ) | | (233 | ) | | — |
| | (6,261 | ) |
| Derivative market value and foreign currency transaction adjustments, net | — |
| | — |
| | — |
| | 42,546 |
| | (284 | ) | | — |
| | 42,262 |
|
| Total other income | 65,371 |
| | 33,071 |
| | 4,343 |
| | 42,943 |
| | 10,369 |
| | (11,021 | ) | | 145,075 |
|
| Operating expenses: | |
| | |
| | | | |
| | |
| | |
| | |
|
| Salaries and benefits | 32,505 |
| | 15,979 |
| | 2,325 |
| | 486 |
| | 12,448 |
| | — |
| | 63,743 |
|
| Depreciation and amortization | 557 |
| | 2,929 |
| | 1,630 |
| | — |
| | 3,878 |
| | — |
| | 8,994 |
|
| Loan servicing fees | — |
| | — |
| | — |
| | 5,880 |
| | — |
| | — |
| | 5,880 |
|
| Cost to provide communication services | — |
| | — |
| | 1,784 |
| | — |
| | — |
| | — |
| | 1,784 |
|
| Cost to provide enrollment services | — |
| | — |
| | — |
| | — |
| | — |
| | — |
| | — |
|
| Other expenses | 8,784 |
| | 4,149 |
| | 1,545 |
| | 1,769 |
| | 10,143 |
| | — |
| | 26,391 |
|
| Intersegment expenses, net | 5,825 |
| | 1,616 |
| | 279 |
| | 11,146 |
| | (7,845 | ) | | (11,021 | ) | | — |
|
| Total operating expenses | 47,671 |
| | 24,673 |
| | 7,563 |
| | 19,281 |
| | 18,624 |
| | (11,021 | ) | | 106,792 |
|
| Income (loss) before income taxes | 17,737 |
| | 8,400 |
| | (3,538 | ) | | 116,980 |
| | (7,500 | ) | | — |
| | 132,078 |
|
| Income tax (expense) benefit | (6,740 | ) | | (3,192 | ) | | 1,344 |
| | (44,571 | ) | | 5,443 |
| | — |
| | (47,715 | ) |
| Net income (loss) | 10,997 |
| | 5,208 |
| | (2,194 | ) | | 72,409 |
| | (2,057 | ) | | — |
| | 84,363 |
|
| Net loss (income) attributable to noncontrolling interests | — |
| | — |
| | — |
| | — |
| | (69 | ) | | — |
| | (69 | ) |
| Net income (loss) attributable to Nelnet, Inc. | $ | 10,997 |
| | 5,208 |
| | (2,194 | ) | | 72,409 |
| | (2,126 | ) | | — |
| | 84,294 |
|
|
| | | | | | | | | | | | | | | | | | | | | |
| | Nine months ended September 30, 2017 |
| | Loan Systems and Servicing | | Tuition Payment Processing and Campus Commerce | | Communications | | Asset
Generation and
Management | | Corporate and Other Activities | | Eliminations | | Total |
| Total interest income | $ | 361 |
| | 10 |
| | 2 |
| | 568,661 |
| | 10,026 |
| | (5,274 | ) | | 573,786 |
|
| Interest expense | — |
| | — |
| | 3,367 |
| | 340,898 |
| | 2,794 |
| | (5,274 | ) | | 341,787 |
|
| Net interest income | 361 |
| | 10 |
| | (3,365 | ) | | 227,763 |
| | 7,232 |
| | — |
| | 231,999 |
|
| Less provision for loan losses | — |
| | — |
| | — |
| | 9,000 |
| | — |
| | — |
| | 9,000 |
|
| Net interest income (loss) after provision for loan losses | 361 |
| | 10 |
| | (3,365 | ) | | 218,763 |
| | 7,232 |
| | — |
| | 222,999 |
|
| Other income: | |
| | |
| | | | |
| | |
| | |
| | |
|
| Loan systems and servicing revenue | 167,079 |
| | — |
| | — |
| | — |
| | — |
| | — |
| | 167,079 |
|
| Intersegment servicing revenue | 30,839 |
| | — |
| | — |
| | — |
| | — |
| | (30,839 | ) | | — |
|
| Tuition payment processing, school information, and campus commerce revenue | — |
| | 113,293 |
| | — |
| | — |
| | — |
| | — |
| | 113,293 |
|
| Communications revenue | — |
| | — |
| | 17,577 |
| | — |
| | — |
| | — |
| | 17,577 |
|
| Other income | — |
| | — |
| | — |
| | 9,152 |
| | 35,722 |
| | — |
| | 44,874 |
|
| Gain from debt repurchases | — |
| | — |
| | — |
| | 1,097 |
| | 4,440 |
| | — |
| | 5,537 |
|
| Derivative settlements, net | — |
| | — |
| | — |
| | (1,721 | ) | | (593 | ) | | — |
| | (2,314 | ) |
| Derivative market value and foreign currency transaction adjustments, net | — |
| | — |
| | — |
| | (23,121 | ) | | (133 | ) | | — |
| | (23,254 | ) |
| Total other income | 197,918 |
| | 113,293 |
| | 17,577 |
| | (14,593 | ) | | 39,436 |
| | (30,839 | ) | | 322,792 |
|
| Operating expenses: | |
| | |
| | | | | | |
| | | | |
|
| Salaries and benefits | 116,932 |
| | 50,986 |
| | 10,489 |
| | 1,156 |
| | 41,121 |
| | — |
| | 220,684 |
|
| Depreciation and amortization | 1,644 |
| | 7,053 |
| | 7,880 |
| | — |
| | 11,109 |
| | — |
| | 27,687 |
|
| Loan servicing fees | — |
| | — |
| | — |
| | 19,584 |
| | — |
| | — |
| | 19,584 |
|
| Cost to provide communications services | — |
| | — |
| | 6,789 |
| | — |
| | — |
| | — |
| | 6,789 |
|
| Other expenses | 28,333 |
| | 14,072 |
| | 5,422 |
| | 4,269 |
| | 32,497 |
| | — |
| | 84,593 |
|
| Intersegment expenses, net | 23,496 |
| | 6,430 |
| | 1,472 |
| | 31,114 |
| | (31,673 | ) | | (30,839 | ) | | — |
|
| Total operating expenses | 170,405 |
| | 78,541 |
| | 32,052 |
| | 56,123 |
| | 53,054 |
| | (30,839 | ) | | 359,337 |
|
| Income (loss) before income taxes | 27,874 |
| | 34,762 |
| | (17,840 | ) | | 148,047 |
| | (6,386 | ) | | — |
| | 186,454 |
|
| Income tax (expense) benefit | (14,410 | ) | | (13,210 | ) | | 6,779 |
| | (56,258 | ) | | 6,749 |
| | — |
| | (70,349 | ) |
| Net income (loss) | 13,464 |
| | 21,552 |
| | (11,061 | ) | | 91,789 |
| | 363 |
| | — |
| | 116,105 |
|
| Net loss (income) attributable to noncontrolling interests | 10,050 |
| | — |
| | — |
| | — |
| | (1,090 | ) | | — |
| | 8,960 |
|
| Net income (loss) attributable to Nelnet, Inc. | $ | 23,514 |
| | 21,552 |
| | (11,061 | ) | | 91,789 |
| | (727 | ) | | — |
| | 125,065 |
|
|
| | | | | | | | | | | | | | | | | | | | | |
| | Nine months ended September 30, 2016 |
| | Loan Systems and Servicing | | Tuition Payment Processing and Campus Commerce | | Communications | | Asset
Generation and
Management | | Corporate and Other Activities | | Eliminations | | Total |
| Total interest income | $ | 80 |
| | 7 |
| | 1 |
| | 570,390 |
| | 6,527 |
| | (2,556 | ) | | 574,449 |
|
| Interest expense | — |
| | — |
| | 671 |
| | 278,029 |
| | 4,702 |
| | (2,556 | ) | | 280,847 |
|
| Net interest income | 80 |
| | 7 |
| | (670 | ) | | 292,361 |
| | 1,825 |
| | — |
| | 293,602 |
|
| Less provision for loan losses | — |
| | — |
| | — |
| | 10,500 |
| | — |
| | — |
| | 10,500 |
|
| Net interest income (loss) after provision for loan losses | 80 |
| | 7 |
| | (670 | ) | | 281,861 |
| | 1,825 |
| | — |
| | 283,102 |
|
| Other income: | |
| | |
| | | | |
| | |
| | |
| | |
|
| Loan systems and servicing revenue | 161,082 |
| | — |
| | — |
| | — |
| | — |
| | — |
| | 161,082 |
|
| Intersegment servicing revenue | 34,436 |
| | — |
| | — |
| | — |
| | — |
| | (34,436 | ) | | — |
|
| Tuition payment processing, school information, and campus commerce revenue | — |
| | 102,211 |
| | — |
| | — |
| | — |
| | — |
| | 102,211 |
|
| Communications revenue | — |
| | — |
| | 13,167 |
| | — |
| | — |
| | — |
| | 13,167 |
|
| Enrollment services revenue | — |
| | — |
| | — |
| | — |
| | 4,326 |
| | — |
| | 4,326 |
|
| Other income | — |
| | — |
| | — |
| | 12,362 |
| | 26,349 |
| | — |
| | 38,711 |
|
| Gain from debt repurchases | — |
| | — |
| | — |
| | 2,260 |
| | — |
| | — |
| | 2,260 |
|
| Derivative settlements, net | — |
| | — |
| | — |
| | (17,596 | ) | | (696 | ) | | — |
| | (18,292 | ) |
| Derivative market value and foreign currency transaction adjustments, net | — |
| | — |
| | — |
| | (8,763 | ) | | (6,336 | ) | | — |
| | (15,099 | ) |
| Total other income | 195,518 |
| | 102,211 |
| | 13,167 |
| | (11,737 | ) | | 23,643 |
| | (34,436 | ) | | 288,366 |
|
| Operating expenses: | |
| | |
| | | | | | |
| | | | |
|
| Salaries and benefits | 96,851 |
| | 45,859 |
| | 4,792 |
| | 1,504 |
| | 38,902 |
| | — |
| | 187,907 |
|
| Depreciation and amortization | 1,440 |
| | 7,711 |
| | 4,137 |
| | — |
| | 11,528 |
| | — |
| | 24,817 |
|
| Loan servicing fees | — |
| | — |
| | — |
| | 20,024 |
| | — |
| | — |
| | 20,024 |
|
| Cost to provide communications services | — |
| | — |
| | 5,169 |
| | — |
| | — |
| | — |
| | 5,169 |
|
| Cost to provide enrollment services | — |
| | — |
| | — |
| | — |
| | 3,623 |
| | — |
| | 3,623 |
|
| Other expenses | 31,635 |
| | 13,122 |
| | 3,110 |
| | 4,766 |
| | 31,540 |
| | — |
| | 84,174 |
|
| Intersegment expenses, net | 18,168 |
| | 4,690 |
| | 610 |
| | 34,791 |
| | (23,823 | ) | | (34,436 | ) | | — |
|
| Total operating expenses | 148,094 |
| | 71,382 |
| | 17,818 |
| | 61,085 |
| | 61,770 |
| | (34,436 | ) | | 325,714 |
|
| Income (loss) before income taxes | 47,504 |
| | 30,836 |
| | (5,321 | ) | | 209,039 |
| | (36,302 | ) | | — |
| | 245,754 |
|
| Income tax (expense) benefit | (18,052 | ) | | (11,718 | ) | | 2,022 |
| | (79,434 | ) | | 19,998 |
| | — |
| | (87,184 | ) |
| Net income (loss) | 29,452 |
| | 19,118 |
| | (3,299 | ) | | 129,605 |
| | (16,304 | ) | | — |
| | 158,570 |
|
| Net loss (income) attributable to noncontrolling interests | — |
| | — |
| | — |
| | — |
| | (165 | ) | | — |
| | (165 | ) |
| Net income (loss) attributable to Nelnet, Inc. | $ | 29,452 |
| | 19,118 |
| | (3,299 | ) | | 129,605 |
| | (16,469 | ) | | — |
| | 158,405 |
|
Net Interest Income, Net of Settlements on Derivatives
The following table summarizes the components of "net interest income" and "derivative settlements, net."
Derivative settlements represent the cash paid or received during the current period to settle with derivative instrument counterparties the economic effect of the Company's derivative instruments based on their contractual terms. Derivative accounting requires that net settlements with respect to derivatives that do not qualify for "hedge treatment" under GAAP be recorded in a separate income statement line item below net interest income. The Company maintains an overall risk management strategy that incorporates the use of derivative instruments to reduce the economic effect of interest rate volatility. As such, management believes derivative settlements for each applicable period should be evaluated with the Company’s net interest income as presented in the table below. Net interest income (net of settlements on derivatives) is a non-GAAP financial measure, and the Company reports this non-GAAP information because the Company believes that it provides additional information regarding operational and performance indicators that are closely assessed by management. There is no comprehensive, authoritative guidance for the presentation of such non-GAAP information, which is only meant to supplement GAAP results by providing additional information that management utilizes to assess performance. See "Derivative Settlements" included in this supplement for the net settlement activity recognized by the Company for each type of derivative for the periods presented in the table below.
|
| | | | | | | | | | | | | | | |
| | Three months ended | | Nine months ended |
| | September 30, 2017 | | June 30, 2017 | | September 30, 2016 | | September 30, 2017 | | September 30, 2016 |
| Variable student loan interest margin | $ | 46,683 |
| | 49,425 |
| | 57,442 |
| | 139,082 |
| | 159,932 |
|
| Settlements on associated derivatives (a) | (4,265 | ) | | (2,279 | ) | | (871 | ) | | (7,598 | ) | | (2,355 | ) |
| Variable student loan interest margin, net of settlements on derivatives | 42,418 |
| | 47,146 |
| | 56,571 |
| | 131,484 |
| | 157,577 |
|
| Fixed rate floor income | 24,586 |
| | 27,664 |
| | 41,509 |
| | 84,382 |
| | 131,720 |
|
| Settlements on associated derivatives (b) | 3,883 |
| | 2,114 |
| | (5,157 | ) | | 5,877 |
| | (15,241 | ) |
| Fixed rate floor income, net of settlements on derivatives | 28,469 |
| | 29,778 |
| | 36,352 |
| | 90,259 |
| | 116,479 |
|
| Investment interest | 5,129 |
| | 3,589 |
| | 2,460 |
| | 11,335 |
| | 6,674 |
|
| Corporate debt interest expense | (1,164 | ) | | (837 | ) | | (1,616 | ) | | (2,800 | ) | | (4,724 | ) |
| Non-portfolio related derivative settlements (c) | (191 | ) | | (198 | ) | | (233 | ) | | (593 | ) | | (696 | ) |
| Net interest income (net of settlements on derivatives) | $ | 74,661 |
| | 79,478 |
| | 93,534 |
| | 229,685 |
| | 275,310 |
|
| |
| (a) | Includes the net settlements paid/received related to the Company’s 1:3 basis swaps and cross-currency interest rate swap. |
| |
| (b) | Includes the net settlements paid/received related to the Company’s floor income interest rate swaps. |
| |
| (c) | Includes the net settlements paid/received related to the Company’s hybrid debt hedges. |
Student Loan Servicing Volumes (dollars in millions)
|
| | | | | | | | | | | | | | | | | | | | | | | | | | | |
| Company owned | | $19,742 | | $18,886 | | $18,433 | | $18,079 | | $17,429 | | $16,962 | | $16,352 | | $15,789 | | $18,403 |
| % of total | | 12.2% | | 10.7% | | 10.1% | | 9.8% | | 9.0% | | 8.7% | | 8.2% | | 7.9% | | 8.9% |
| Number of servicing borrowers: | | | | | | | | | | | | | | |
| Government servicing: | | 5,915,449 |
| | 5,842,163 |
| | 5,786,545 |
| | 5,726,828 |
| | 6,009,433 |
| | 5,972,619 |
| | 5,924,099 |
| | 5,849,283 |
| | 5,906,404 |
|
| FFELP servicing: | | 1,397,295 |
| | 1,335,538 |
| | 1,298,407 |
| | 1,296,198 |
| | 1,357,412 |
| | 1,312,192 |
| | 1,263,785 |
| | 1,218,706 |
| | 1,317,552 |
|
| Private education and consumer loan servicing: | | 202,529 |
| | 245,737 |
| | 250,666 |
| | 267,073 |
| | 292,989 |
| | 355,096 |
| | 389,010 |
| | 454,182 |
| | 478,150 |
|
| Total: | | 7,515,273 |
| | 7,423,438 |
| | 7,335,618 |
| | 7,290,099 |
| | 7,659,834 |
| | 7,639,907 |
| | 7,576,894 |
| | 7,522,171 |
| | 7,702,106 |
|
| | | | | | | | | | | | | | | | | | | |
| Number of remote hosted borrowers: | | 1,611,654 |
| | 1,755,341 |
| | 1,796,783 |
| | 1,842,961 |
| | 2,103,989 |
| | 2,230,019 |
| | 2,305,991 |
| | 2,317,151 |
| | 2,714,588 |
|
Communications Financial and Operating Data
Certain financial and operating data for Allo is summarized in the tables below.
|
| | | | | | | | | | | | | | | |
| | Three months ended | | Nine months ended |
| | September 30, 2017 | | June 30, 2017 | | September 30, 2016 | | September 30, 2017 | | September 30, 2016 |
| Residential revenue | $ | 4,691 |
| | 3,740 |
| | 2,643 |
| | 11,862 |
| | 7,695 |
|
| Business revenue | 2,003 |
| | 1,695 |
| | 1,565 |
| | 5,514 |
| | 4,777 |
|
| Other revenue | 57 |
| | 284 |
| | 135 |
| | 201 |
| | 695 |
|
| Total revenue | $ | 6,751 |
| | 5,719 |
| | 4,343 |
| | 17,577 |
| | 13,167 |
|
| | | | | | | | | | |
| Net loss | $ | (4,602 | ) | | (3,637 | ) | | (2,194 | ) | | (11,061 | ) | | (3,299 | ) |
| EBITDA (a) | (2,728 | ) | | (2,163 | ) | | (1,590 | ) | | (6,595 | ) | | (514 | ) |
| | | | | | | | | | |
| Capital expenditures | 29,417 |
| | 32,344 |
| | 12,610 |
| | 78,430 |
| | 24,647 |
|
| | | | | | | | | | |
| Revenue contribution: | | | | | | | | | |
| Internet | 46.7 | % | | 45.6 | % | | 40.5 | % | | 44.6 | % | | 38.5 | % |
| Television | 30.8 |
| | 30.8 |
| | 32.5 |
| | 30.7 |
| | 32.2 |
|
| Telephone | 20.6 |
| | 23.4 |
| | 27.2 |
| | 22.5 |
| | 27.1 |
|
| Other | 1.9 |
| | 0.2 |
| | (0.2 | ) | | 2.2 |
| | 2.2 |
|
| | 100.0 | % | | 100.0 | % | | 100.0 | % | | 100.0 | % | | 100.0 | % |
|
| | | | | | | | | | | | | | | | | | | | | | | | |
| | | As of September 30, 2017 | | As of June 30, 2017 | | As of
March 31, 2017 | | As of December 31, 2016 | | As of September 30, 2016 | | As of June 30, 2016 | | As of
March 31, 2016 | | As of December 31, 2015 |
| Residential customer information: | | | | | | | | | | | | | | | | |
| Households served | | 16,394 |
| | 12,460 |
| | 10,524 |
| | 9,814 |
| | 8,745 |
| | 8,314 |
| | 7,909 |
| | 7,600 |
|
| Households passed (b) | | 54,815 |
| | 45,880 |
| | 34,925 |
| | 30,962 |
| | 22,977 |
| | 22,977 |
| | 21,274 |
| | 21,274 |
|
| Total households in current markets (c) | | 137,500 |
| | 137,500 |
| | 137,500 |
| | 137,500 |
| | 137,500 |
| | 137,500 |
| | 137,500 |
| | 28,874 |
|
| |
| (a) | Earnings (loss) before interest, income taxes, depreciation, and amortization ("EBITDA") is a supplemental non-GAAP performance measure that is frequently used in capital-intensive industries such as telecommunications. Allo's management uses EBITDA to compare Allo's performance to that of its competitors and to eliminate certain non-cash and non-operating items in order to consistently measure performance from period to period. EBITDA excludes interest and income taxes because these items are associated with a company's particular capitalization and tax structures. EBITDA also excludes depreciation and amortization expense because these non-cash expenses primarily reflect the impact of historical capital investments, as opposed to the cash impacts of capital expenditures made in recent periods, which may be evaluated through cash flow measures. The Company reports EBITDA for Allo because the Company believes that it provides useful additional information for investors regarding a key metric used by management to assess Allo's performance. There are limitations to using EBITDA as a performance measure, including the difficulty associated with comparing companies that use similar performance measures whose calculations may differ from Allo's calculations. In addition, EBITDA should not be considered a substitute for other measures of financial performance, such as net income or any other performance measures derived in accordance with GAAP. A reconciliation of EBITDA from Allo's net loss under GAAP is presented in the table immediately below: |
|
| | | | | | | | | | | | | | | |
| | Three months ended | | Nine months ended |
| | September 30, 2017 | | June 30, 2017 | | September 30, 2016 | | September 30, 2017 | | September 30, 2016 |
| Net loss | $ | (4,602 | ) | | (3,637 | ) | | (2,194 | ) | | (11,061 | ) | | (3,299 | ) |
| Net interest expense | 1,550 |
| | 1,103 |
| | 318 |
| | 3,365 |
| | 670 |
|
| Income tax benefit | (2,821 | ) | | (2,229 | ) | | (1,344 | ) | | (6,779 | ) | | (2,022 | ) |
| Depreciation and amortization | 3,145 |
| | 2,600 |
| | 1,630 |
| | 7,880 |
| | 4,137 |
|
| Earnings (loss) before interest, income taxes, depreciation, and amortization (EBITDA) | $ | (2,728 | ) | | (2,163 | ) | | (1,590 | ) | | (6,595 | ) | | (514 | ) |
| |
| (b) | Represents the number of single residence homes, apartments, and condominiums that Allo already serves and those in which Allo has the capacity to connect to its network distribution system without further material extensions to the transmission lines, but have not been connected. |
| |
| (c) | During the first quarter of 2016, Allo announced plans to expand its network to make services available to substantially all commercial and residential premises in Lincoln, Nebraska, and currently plans to expand to additional communities in Nebraska and surrounding states over the next several years. |
Other Income
The following table summarizes the components of "other income."
|
| | | | | | | | | | | | | | | |
| | Three months ended | | Nine months ended |
| | September 30, 2017 | | June 30, 2017 | | September 30, 2016 | | September 30, 2017 | | September 30, 2016 |
| Investment advisory fees | $ | 5,852 |
| | 2,294 |
| | 1,535 |
| | 11,661 |
| | 3,367 |
|
| Peterson's revenue | 3,402 |
| | 3,043 |
| | 4,128 |
| | 9,282 |
| | 10,655 |
|
| Borrower late fee income | 2,731 |
| | 3,048 |
| | 3,158 |
| | 9,098 |
| | 9,910 |
|
| Realized and unrealized gains on investments classified as available-for-sale and trading, net | 2,468 |
| | 392 |
| | 506 |
| | 3,185 |
| | 1,444 |
|
| Other | 5,303 |
| | 3,708 |
| | 5,823 |
| | 11,648 |
| | 13,335 |
|
| Other income | $ | 19,756 |
| | 12,485 |
| | 15,150 |
| | 44,874 |
| | 38,711 |
|
Derivative Settlements
The following table summarizes the components of "derivative settlements, net" included in the attached consolidated statements of income.
|
| | | | | | | | | | | | | | | |
| | Three months ended | | Nine months ended |
| | September 30,
2017 | | June 30,
2017 | | September 30,
2016 | | September 30,
2017 | | September 30,
2016 |
| 1:3 basis swaps | $ | (2,172 | ) | | (362 | ) | | 523 |
| | (1,836 | ) | | 938 |
|
| Interest rate swaps - floor income hedges | 3,883 |
| | 2,114 |
| | (5,157 | ) | | 5,877 |
| | (15,241 | ) |
| Interest rate swaps - hybrid debt hedges | (191 | ) | | (198 | ) | | (233 | ) | | (593 | ) | | (696 | ) |
| Cross-currency interest rate swap | (2,093 | ) | | (1,917 | ) | | (1,394 | ) | | (5,762 | ) | | (3,293 | ) |
| Total settlements - (expense) income | $ | (573 | ) | | (363 | ) | | (6,261 | ) | | (2,314 | ) | | (18,292 | ) |
Derivative Market Value and Foreign Currency Transaction Adjustments
"Derivative market value and foreign currency transaction adjustments" include (i) the realized and unrealized gains and losses that are caused by changes in fair values of derivatives which do not qualify for "hedge treatment" under GAAP; and (ii) the foreign currency transaction gains or losses caused by the re-measurement of the Company's Euro-denominated bonds to U.S. dollars.
The following table summarizes the components of “derivative market value and foreign currency transaction adjustments” included in the attached consolidated statements of income.
|
| | | | | | | | | | | | | | | |
| | Three months ended | | Nine months ended |
| | September 30,
2017 | | June 30,
2017 | | September 30,
2016 | | September 30,
2017 | | September 30,
2016 |
Change in fair value of derivatives - income (expense) | $ | 21,429 |
| | (286 | ) | | 47,093 |
| | 22,381 |
| | (1,556 | ) |
| Foreign currency transaction adjustment - income (expense) | (13,683 | ) | | (27,261 | ) | | (4,831 | ) | | (45,635 | ) | | (13,543 | ) |
| Derivative market value and foreign currency transaction adjustments - income (expense) | $ | 7,746 |
| | (27,547 | ) | | 42,262 |
| | (23,254 | ) | | (15,099 | ) |
Student Loans Receivable
Student loans receivable consisted of the following:
|
| | | | | | | | | |
| | As of | | As of | | As of |
| | September 30,
2017 | | December 31,
2016 | | September 30,
2016 |
| Federally insured loans: | | | | | |
| Stafford and other | $ | 4,534,588 |
| | 5,186,047 |
| | 5,353,052 |
|
| Consolidation | 17,952,696 |
| | 19,643,937 |
| | 20,189,881 |
|
| Total | 22,487,284 |
| | 24,829,984 |
| | 25,542,933 |
|
| Private education loans | 226,629 |
| | 273,659 |
| | 276,432 |
|
| | 22,713,913 |
| | 25,103,643 |
| | 25,819,365 |
|
| Loan discount, net of unamortized loan premiums and deferred origination costs | (119,572 | ) | | (129,507 | ) | | (131,601 | ) |
| Non-accretable discount | (13,532 | ) | | (18,570 | ) | | (20,760 | ) |
| Allowance for loan losses – federally insured loans | (39,398 | ) | | (37,268 | ) | | (37,028 | ) |
| Allowance for loan losses – private education loans | (12,566 | ) | | (14,574 | ) | | (14,542 | ) |
| | $ | 22,528,845 |
| | 24,903,724 |
| | 25,615,434 |
|
Loan Activity
The following table sets forth the activity of loans:
|
| | | | | | | | | | | | |
| | Three months ended September 30, | | Nine months ended September 30, |
| | 2017 | | 2016 | | 2017 | | 2016 |
| Beginning balance | $ | 23,390,300 |
| | 26,754,560 |
| | 25,103,643 |
| | 28,555,749 |
|
| Loan acquisitions | 37,532 |
| | 52,667 |
| | 142,386 |
| | 238,595 |
|
| Repayments, claims, capitalized interest, and other | (446,588 | ) | | (660,074 | ) | | (1,643,049 | ) | | (1,989,806 | ) |
| Consolidation loans lost to external parties | (267,331 | ) | | (327,766 | ) | | (889,067 | ) | | (940,413 | ) |
| Loans sold | — |
| | (22 | ) | | — |
| | (44,760 | ) |
| Ending balance | $ | 22,713,913 |
| | 25,819,365 |
| | 22,713,913 |
| | 25,819,365 |
|
Student Loan Spread
The following table analyzes the student loan spread on the Company’s portfolio of student loans, which represents the spread between the yield earned on student loan assets and the costs of the liabilities and derivative instruments used to fund the assets.
|
| | | | | | | | | | | | |
| | Three months ended September 30, | | Nine months ended September 30, |
| | 2017 | | 2016 | | 2017 | | 2016 |
| Variable student loan yield, gross | 3.62 | % | | 2.93 | % | | 3.44 | % | | 2.87 | % |
| Consolidation rebate fees | (0.85 | ) | | (0.83 | ) | | (0.84 | ) | | (0.83 | ) |
| Discount accretion, net of premium and deferred origination costs amortization (a) | 0.07 |
| | 0.06 |
| | 0.07 |
| | 0.06 |
|
| Variable student loan yield, net | 2.84 |
| | 2.16 |
| | 2.67 |
| | 2.10 |
|
| Student loan cost of funds - interest expense | (2.09 | ) | | (1.44 | ) | | (1.91 | ) | | (1.36 | ) |
| Student loan cost of funds - derivative settlements (b) (c) | (0.07 | ) | | (0.01 | ) | | (0.04 | ) | | (0.01 | ) |
| Variable student loan spread | 0.68 |
| | 0.71 |
| | 0.72 |
| | 0.73 |
|
| Fixed rate floor income, gross | 0.42 |
| | 0.63 |
| | 0.47 |
| | 0.64 |
|
| Fixed rate floor income - derivative settlements (b) (d) | 0.07 |
| | (0.08 | ) | | 0.03 |
| | (0.07 | ) |
| Fixed rate floor income, net of settlements on derivatives | 0.49 |
| | 0.55 |
| | 0.50 |
| | 0.57 |
|
| Core student loan spread | 1.17 | % | | 1.26 | % | | 1.22 | % | | 1.30 | % |
| | | | | | | | |
| Average balance of student loans | $ | 23,188,577 |
| | 26,368,507 |
| | 23,948,108 |
| | 27,305,128 |
|
| Average balance of debt outstanding | 22,892,789 |
| | 26,235,053 |
| | 23,687,067 |
| | 27,188,069 |
|
| |
| (a) | In the third quarter of 2016, the Company revised its policy to correct for an error in its method of applying the interest method used to amortize premiums and accrete discounts on its student loan portfolio. Under the Company's revised policy, as of September 30, 2016, the constant prepayment rate used by the Company to amortize/accrete student loan premiums/discounts was decreased. During the third quarter of 2016, the Company recorded an adjustment to reflect the net impact on prior periods for the correction of this error that resulted in an $8.2 million reduction to the Company's net loan discount balance and a corresponding increase in interest income. The impact of this adjustment was excluded from the above table. |
| |
| (b) | Derivative settlements represent the cash paid or received during the current period to settle with derivative instrument counterparties the economic effect of the Company's derivative instruments based on their contractual terms. Derivative accounting requires that net settlements with respect to derivatives that do not qualify for "hedge treatment" under GAAP be recorded in a separate income statement line item below net interest income. The Company maintains an overall risk management strategy that incorporates the use of derivative instruments to reduce the economic effect of interest rate volatility. As such, management believes derivative settlements for each applicable period should be evaluated with the Company’s net interest income (student loan spread) as presented in this table. The Company reports this non-GAAP information because it believes that it provides additional information regarding operational and performance indicators that are closely assessed by management. There is no comprehensive, authoritative guidance for the presentation of such non-GAAP information, which is only meant to supplement GAAP results by providing additional information that management utilizes to assess performance. See "Derivative Settlements" included in this supplement for the net settlement activity recognized by the Company for each type of derivative for the periods presented in this table. |
| |
| (c) | Reflects the net settlements paid/received related to the Company’s 1:3 basis swaps and cross-currency interest rate swap. |
| |
| (d) | Derivative settlements include the net settlements paid/received related to the Company’s floor income interest rate swaps. |
A trend analysis of the Company's core and variable student loan spreads is summarized below.
| |
| (a) | The interest earned on a large portion of the Company's FFELP student loan assets is indexed to the one-month LIBOR rate. The Company funds a majority of its assets with three-month LIBOR indexed floating rate securities. The relationship between the indices in which the Company earns interest on its loans and funds such loans has a significant impact on student loan spread. This table (the right axis) shows the difference between the Company's liability base rate and the one-month LIBOR rate by quarter. |
Variable student loan spread decreased during the three months ended September 30, 2017 as compared to the same period in 2016 due to an increase in derivative settlements paid related to the Company's 1:3 basis swaps.
The primary difference between variable student loan spread and core student loan spread is fixed rate floor income. A summary of fixed rate floor income and its contribution to core student loan spread follows:
|
| | | | | | | | | | | | |
| | Three months ended September 30, | | Nine months ended September 30, |
| | 2017 | | 2016 | | 2017 | | 2016 |
| Fixed rate floor income, gross | $ | 24,586 |
| | 41,509 |
| | 84,382 |
| | 131,720 |
|
| Derivative settlements (a) | 3,883 |
| | (5,157 | ) | | 5,877 |
| | (15,241 | ) |
| Fixed rate floor income, net | $ | 28,469 |
| | 36,352 |
| | 90,259 |
| | 116,479 |
|
| Fixed rate floor income contribution to spread, net | 0.49 | % | | 0.55 | % | | 0.50 | % | | 0.57 | % |
| |
| (a) | Includes settlement payments on derivatives used to hedge student loans earning fixed rate floor income. |
Fixed Rate Floor Income
The following table shows the Company’s federally insured student loan assets that were earning fixed rate floor income as of September 30, 2017.
|
| | | | | | | | | | |
| Fixed interest rate range | | Borrower/lender weighted average yield | | Estimated variable conversion rate (a) | | Loan balance |
| 3.5 - 3.99% | | 3.92 | % | | 1.28 | % | | $ | 1,090 |
|
| 4.0 - 4.49% | | 4.20 | % | | 1.56 | % | | 1,408,663 |
|
| 4.5 - 4.99% | | 4.71 | % | | 2.07 | % | | 851,229 |
|
| 5.0 - 5.49% | | 5.22 | % | | 2.58 | % | | 539,482 |
|
| 5.5 - 5.99% | | 5.67 | % | | 3.03 | % | | 379,443 |
|
| 6.0 - 6.49% | | 6.19 | % | | 3.55 | % | | 437,761 |
|
| 6.5 - 6.99% | | 6.70 | % | | 4.06 | % | | 421,737 |
|
| 7.0 - 7.49% | | 7.17 | % | | 4.53 | % | | 150,722 |
|
| 7.5 - 7.99% | | 7.71 | % | | 5.07 | % | | 252,994 |
|
| 8.0 - 8.99% | | 8.18 | % | | 5.54 | % | | 584,749 |
|
| > 9.0% | | 9.05 | % | | 6.41 | % | | 202,455 |
|
| | | | | | | $ | 5,230,325 |
|
| |
| (a) | The estimated variable conversion rate is the estimated short-term interest rate at which loans would convert to a variable rate. As of September 30, 2017, the weighted average estimated variable conversion rate was 3.11% and the short-term interest rate was 125 basis points. |
The following table summarizes the outstanding derivative instruments as of September 30, 2017 used by the Company to economically hedge loans earning fixed rate floor income.
|
| | | | | | | |
| Maturity | | Notional amount | | Weighted average fixed rate paid by the Company (a) |
| | |
| 2018 | | $ | 1,350,000 |
| | 1.07 | % |
| 2019 | | 3,250,000 |
| | 0.97 |
|
| 2020 | | 1,500,000 |
| | 1.01 |
|
| 2025 | | 100,000 |
| | 2.32 |
|
| | | $ | 6,200,000 |
| | 1.02 | % |
| |
| (a) | For all interest rate derivatives, the Company receives discrete three-month LIBOR. |