UNITED STATES SECURITIES AND EXCHANGE COMMISSION
Washington, D.C. 20549
Form N-CSR
CERTIFIED SHAREHOLDER REPORT OF REGISTERED
MANAGEMENT INVESTMENT COMPANIES
MANAGEMENT INVESTMENT COMPANIES
Investment Company Act File Number: 811-21411
Eaton Vance Senior Floating-Rate Trust
(Exact Name of Registrant as Specified in Charter)
Two International Place, Boston, Massachusetts 02110
(Address of Principal Executive Offices)
(Address of Principal Executive Offices)
Maureen A. Gemma
Two International Place, Boston, Massachusetts 02110
(Name and Address of Agent for Services)
Two International Place, Boston, Massachusetts 02110
(Name and Address of Agent for Services)
(617) 482-8260
(Registrant’s Telephone Number)
October 31
Date of Fiscal Year End
October 31, 2011
Date of Reporting Period
Item 1. Reports to Stockholders
| Eaton Vance Senior Floating-Rate Trust (EFR) Annual Report October 31, 2011 |  |

Fund shares are not insured by the FDIC and are not deposits or other obligations of, or guaranteed by, any depository institution. Shares are subject to investment risks, including possible loss of principal invested.
Annual Report October 31, 2011
Eaton Vance
Senior Floating-Rate Trust
Table of Contents
| Management’s Discussion of Fund Performance | 2 | |||
| Performance | 3 | |||
| Fund Profile | 4 | |||
| Endnotes and Additional Disclosures | 5 | |||
| Financial Statements | 6 | |||
| Report of Independent Registered Public Accounting Firm | 38 | |||
| Federal Tax Information | 39 | |||
| Annual Meeting of Shareholders | 40 | |||
| Notice to Shareholders | 41 | |||
| Dividend Reinvestment Plan | 42 | |||
| Management and Organization | 44 | |||
| Important Notices | 46 |
Eaton Vance
Senior Floating-Rate Trust
October 31, 2011
Management’s Discussion of Fund Performance1
Economic and Market Conditions
The S&P/LSTA Leveraged Loan Index (the Index),2 the broad barometer for the floating-rate loan market, posted a total return of 3.16% for the 12 months ending October 31, 2011, reflecting the widespread uncertainty and volatility that affected virtually all global investment markets.
The period began on an upbeat note, with the floating-rate loan market generating strong gains and driven by favorable technical conditions and improving issuer fundamentals. Heavy inflows into prime rate mutual funds, increased refinancing activity and a general improvement in the overall tone of the market bolstered demand and, in turn, lifted prices. Issuer fundamentals also improved as various measures of earnings growth rose. Furthermore, default rates remained low.
The loan market’s strong performance continued in April, although it began to falter in May and June. That is when the new issue supply of floating-rate loans increased and demand dwindled in response to growing uncertainty about the prospects for both the U.S. and global economies. In late summer, the floating-rate loan market performed poorly, coming under significant pressure amid a darkening of macroeconomic headlines. In particular, the downgrade of the U.S. credit rating by Standard & Poor’s, renewed stress in the European sovereign debt saga and several disappointing global economic numbers provided a gloomy economic backdrop. Loans were also challenged by the Federal Reserve’s pledge to keep rates low until at least mid-2013, which tempered individual investors’ demand for the asset class. In October of 2011, the floating-rate loan market rebounded somewhat as worries about higher interest rates resurfaced and investors’ appetite for riskier asset classes improved.
Even though the prospects for global economy dimmed during the period, issuer fundamentals remained solid. As one measure of that, the trailing 12-month default rates by principal amount stood at 0.32% as of October 31, 2011, a low rate when viewed historically.
Fund Performance
The Trust is a closed-end fund and trades on the New York Stock Exchange (NYSE) under the symbol EFR. The Trust’s investment objective is to provide a high level of current income. As a secondary objective, it may also seek preservation of capital to the extent consistent with its primary goal of high current income. Under normal market conditions, the Trust invests at least 80% of its total assets in senior, secured floating-rate loans (senior loans). In managing the Trust, the investment adviser seeks to invest in a portfolio of senior loans that it believes will be less volatile over time than the general loan market. The Trust may also invest in second lien loans and high-yield bonds and, as discussed below, employs leverage to acquire additional income-producing securities, which may increase risk. For the fiscal year ending October 31, 2011, the Trust returned 6.69% for the 12-month period, outperforming its benchmark, the Index. Relative to the Index, the Trust benefited from its general bias toward the higher-quality end of the floating-rate loan market because lower-quality B-rated7 loans, and more notably, CCC-rated securities, underperformed for the 12-month period overall. Although the Trust’s higher-quality positioning acted as a headwind early on when investors favored riskier segments of the floating-rate loan market, the emphasis on higher-quality securities bolstered performance during most of the second half of the period when investors’ appetite for risk waned.
In terms of sector selection, results were favorable overall. The Trust was helped by its underweighted positions in publishing and utilities, sectors that lagged the Index during the 12-month period. The benefits of underweighting these sectors more than offset what was lost by underweighting financial intermediaries, telecommunications, and lodging and casinos, all of which outpaced the benchmark for the year.
The Trust’s comparatively broad diversification8 also aided relative performance. The Index’s larger-cap, more-liquid names, which experienced the greatest selling pressure in the second half of the period, underperformed the floating-rate loan market as a whole for the 12-month period. Against that backdrop, the Trust’s diversification beyond the larger-cap, more-liquid issues was a plus.
Management’s use of leverage and modest high-yield bond exposure benefited the Trust’s relative performance, as floating-rate loans acquired with borrowings were bolstered by favorable conditions in the credit markets during the first half of the period and high-yield bonds typically outpaced the Index for the year.
See Endnotes and Additional Disclosures in this report.
Past performance is no guarantee of future results. Returns are historical and are calculated by determining the percentage change in net asset value (NAV) or market price (as applicable) with all distributions reinvested. Fund performance at market price will differ from its results at NAV due to factors such as changing perceptions about the Fund, market conditions, fluctuations in supply and demand for Fund shares, or changes in Fund distributions. Investment return and principal value will fluctuate so that shares, when sold, may be worth more or less than their original cost. Performance less than one year is cumulative. Performance is for the stated time period only; due to market volatility, current Fund performance may be lower or higher than the quoted return. For performance as of the most recent month end, please refer to www.eatonvance.com.
2
Eaton Vance
Senior Floating-Rate Trust
Senior Floating-Rate Trust
October 31, 2011
Portfolio Managers Scott H. Page, CFA; Craig P. Russ; Peter M. Campo, CFA
Performance2,3
| Since | ||||||||||||||||
| % Average Annual Total Returns | Inception Date | 1 Year | 5 Years | Inception | ||||||||||||
| Fund at NAV | 11/28/2003 | 6.69 | % | 3.78 | % | 4.67 | % | |||||||||
| Fund at Market | — | –0.28 | 3.78 | 4.34 | ||||||||||||
| S&P/LSTA Leveraged Loan Index | 11/28/2003 | 3.16 | % | 4.42 | % | 4.85 | % | |||||||||
% Premium/Discount to NAV | ||||||||||||||||
| –2.41 | % | |||||||||||||||
Distributions4 | ||||||||||||||||
| Total Distributions per share for the period | $ | 1.062 | ||||||||||||||
| Distribution Rate at NAV | 6.68 | % | ||||||||||||||
| Distribution Rate at Market Price | 6.85 | % | ||||||||||||||
% Total Leverage5 | ||||||||||||||||
| Auction Preferred Shares (APS) | 16.42 | % | ||||||||||||||
| Borrowings | 20.63 | |||||||||||||||
See Endnotes and Additional Disclosures in this report.
Past performance is no guarantee of future results. Returns are historical and are calculated by determining the percentage change in net asset value (NAV) or market price (as applicable) with all distributions reinvested. Fund performance at market price will differ from its results at NAV due to factors such as changing perceptions about the Fund, market conditions, fluctuations in supply and demand for Fund shares, or changes in Fund distributions. Investment return and principal value will fluctuate so that shares, when sold, may be worth more or less than their original cost. Performance less than one year is cumulative. Performance is for the stated time period only; due to market volatility, current Fund performance may be lower or higher than the quoted return. For performance as of the most recent month end, please refer to www.eatonvance.com.
3
Eaton Vance
Senior Floating-Rate Trust
Senior Floating-Rate Trust
October 31, 2011
Fund Profile
Top 10 Holdings (% of total investments)6
| Community Health Systems, Inc. | 1.3 | % | ||
| Intelsat Jackson Holdings SA | 1.3 | |||
| Rite Aid Corp. | 1.2 | |||
| SunGard Data Systems, Inc. | 1.1 | |||
| Aramark Corp. | 1.1 | |||
| HCA, Inc. | 1.1 | |||
| UPC Broadband Holding B.V./UPC Financing Partnership | 0.9 | |||
| Nielsen Finance, LLC | 0.9 | |||
| Health Management Associates, Inc. | 0.9 | |||
| Asurion Corp. | 0.8 | |||
| Total | 10.6 | % |
Top 10 Sectors (% of total investments)6
| Health Care | 11.4 | % | ||
| Business Equipment and Services | 9.1 | |||
| Electronics/Electrical | 5.5 | |||
| Leisure Goods/Activities/Movies | 5.2 | |||
| Cable and Satellite Television | 5.0 | |||
| Publishing | 4.5 | |||
| Financial Intermediaries | 4.4 | |||
| Automotive | 4.3 | |||
| Chemicals and Plastics | 4.2 | |||
| Food Service | 3.6 | |||
| Total | 57.2 | % |
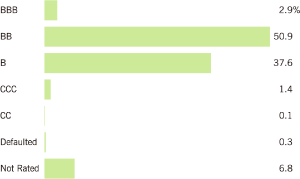
Credit Quality (% of loan holdings)7
See Endnotes and Additional Disclosures in this report.
4
Eaton Vance
Senior Floating-Rate Trust
Senior Floating-Rate Trust
October 31, 2011
Endnotes and Additional Disclosures
| 1 | The views expressed in this report are those of portfolio manager(s) and are current only through the date stated at the top of this page. These views are subject to change at any time based upon market or other conditions, and Eaton Vance and the Fund(s) disclaim any responsibility to update such views. These views may not be relied upon as investment advice and, because investment decisions are based on many factors, may not be relied upon as an indication of trading intent on behalf of any Eaton Vance fund. This commentary may contain statements that are not historical facts, referred to as forward looking statements. The Fund’s actual future results may differ significantly from those stated in any forward looking statement, depending on factors such as changes in securities or financial markets or general economic conditions, the volume of sales and purchases of Fund shares, the continuation of investment advisory, administrative and service contracts, and other risks discussed from time to time in the Fund’s filings with the Securities and Exchange Commission. | |
| 2 | S&P/LSTA Leveraged Loan Index is an unmanaged index of the institutional leveraged loan market. Index returns do not reflect the effect of any applicable sales charges, commissions, expenses, taxes or leverage, as applicable. It is not possible to invest directly in an index. | |
| 3 | Performance results reflect the effects of leverage. Absent an expense waiver by the investment adviser, the returns would be lower. | |
| 4 | The Distribution Rate is based on the Fund’s last regular distribution per share in the period (annualized) divided by the Fund’s NAV or market price at the end of the period. The Fund’s distributions may be comprised of ordinary income, net realized capital gains and return of capital. | |
| 5 | APS leverage represents the liquidation value of the Fund’s APS outstanding as a percentage of Fund net assets applicable to common shares plus APS and borrowings outstanding. Use of leverage creates an opportunity for income, but creates risks including greater price volatility. The cost of leverage rises and falls with changes in short-term interest rates. The Fund is required to maintain prescribed asset coverage for its APS and borrowings, which could be reduced if Fund asset values decline. | |
| 6 | Excludes cash and cash equivalents. | |
| 7 | Ratings are based on Moody’s, S&P or Fitch, as applicable. Credit ratings are based largely on the rating agency’s investment analysis at the time of rating and the rating assigned to any particular security is not necessarily a reflection of the issuer’s current financial condition. The rating assigned to a security by a rating agency does not necessarily reflect its assessment of the volatility of a security’s market value or of the liquidity of an investment in the security. If securities are rated differently by the rating agencies, the higher rating is applied. | |
| 8 | Diversification cannot guarantee a profit or eliminate the risk of a loss. | |
| Fund profile subject to change due to active management. |
5
Eaton Vance
Senior Floating-Rate Trust
October 31, 2011
Portfolio of Investments
| Senior Floating-Rate Interests — 144.9%(1) | ||||||||||||
| Principal | ||||||||||||
| Amount* | ||||||||||||
| Borrower/Tranche Description | (000’s omitted) | Value | ||||||||||
| Aerospace and Defense — 2.8% | ||||||||||||
Booz Allen Hamilton, Inc. | ||||||||||||
| Term Loan, 4.00%, Maturing August 3, 2017 | 473 | $ | 473,437 | |||||||||
DAE Aviation Holdings, Inc. | ||||||||||||
| Term Loan, 5.43%, Maturing July 31, 2014 | 887 | 862,257 | ||||||||||
| Term Loan, 5.43%, Maturing July 31, 2014 | 925 | 899,738 | ||||||||||
Ducommun, Inc. | ||||||||||||
| Term Loan, 5.50%, Maturing June 28, 2017 | 524 | 521,069 | ||||||||||
Dundee Holdco 4, Ltd. | ||||||||||||
| Term Loan, 4.25%, Maturing May 15, 2015 | 391 | 323,097 | ||||||||||
| Term Loan, 4.75%, Maturing May 13, 2016 | 391 | 323,097 | ||||||||||
| Term Loan - Second Lien, 6.71%, Maturing January 13, 2016 | GBP | 500 | 581,524 | |||||||||
IAP Worldwide Services, Inc. | ||||||||||||
| Term Loan, 9.25%, Maturing December 28, 2012 | 1,777 | 1,741,361 | ||||||||||
Sequa Corp. | ||||||||||||
| Term Loan, 3.62%, Maturing December 3, 2014 | 794 | 766,813 | ||||||||||
Term Loan, Maturing December 3, 2014(2) | 250 | 250,208 | ||||||||||
Spirit AeroSystems, Inc. | ||||||||||||
| Term Loan, 3.49%, Maturing September 30, 2016 | 1,549 | 1,546,722 | ||||||||||
TASC, Inc. | ||||||||||||
| Term Loan, 4.50%, Maturing December 18, 2015 | 1,444 | 1,440,203 | ||||||||||
TransDigm, Inc. | ||||||||||||
| Term Loan, 4.00%, Maturing February 14, 2017 | 3,134 | 3,127,999 | ||||||||||
Wesco Aircraft Hardware Corp. | ||||||||||||
| Term Loan, 4.25%, Maturing April 7, 2017 | 396 | 397,091 | ||||||||||
Wyle Services Corp. | ||||||||||||
| Term Loan, 5.75%, Maturing March 27, 2017 | 853 | 835,043 | ||||||||||
| $ | 14,089,659 | |||||||||||
| Air Transport — 0.3% | ||||||||||||
Evergreen International Aviation, Inc. | ||||||||||||
| Term Loan, 11.50%, Maturing July 5, 2015 | 875 | $ | 840,000 | |||||||||
Orbitz Worldwide, Inc. | ||||||||||||
| Term Loan, 3.31%, Maturing July 25, 2014 | 1,063 | 925,400 | ||||||||||
| $ | 1,765,400 | |||||||||||
| Automotive — 6.1% | ||||||||||||
Allison Transmission, Inc. | ||||||||||||
| Term Loan, 2.75%, Maturing August 7, 2014 | 3,693 | $ | 3,583,926 | |||||||||
Autoparts Holdings, Ltd. | ||||||||||||
| Term Loan, 6.50%, Maturing July 28, 2017 | 400 | 400,500 | ||||||||||
Chrysler Group, LLC | ||||||||||||
| Term Loan, 6.00%, Maturing May 24, 2017 | 4,989 | 4,728,470 | ||||||||||
Delphi Corp. | ||||||||||||
| Term Loan, 3.50%, Maturing March 31, 2017 | 1,924 | 1,924,319 | ||||||||||
Federal-Mogul Corp. | ||||||||||||
| Term Loan, 2.18%, Maturing December 29, 2014 | 2,432 | 2,305,821 | ||||||||||
| Term Loan, 2.18%, Maturing December 28, 2015 | 3,056 | 2,897,605 | ||||||||||
Goodyear Tire & Rubber Co. | ||||||||||||
| Term Loan - Second Lien, 1.93%, Maturing April 30, 2014 | 5,400 | 5,285,250 | ||||||||||
HHI Holdings, LLC | ||||||||||||
| Term Loan, 7.00%, Maturing March 21, 2017 | 522 | 515,845 | ||||||||||
Metaldyne, LLC | ||||||||||||
| Term Loan, 5.25%, Maturing May 18, 2017 | 2,193 | 2,173,316 | ||||||||||
SRAM, LLC | ||||||||||||
| Term Loan, 4.76%, Maturing June 7, 2018 | 1,294 | 1,287,867 | ||||||||||
| Term Loan - Second Lien, 8.50%, Maturing December 7, 2018 | 500 | 502,500 | ||||||||||
Tomkins, LLC | ||||||||||||
| Term Loan, 4.25%, Maturing September 21, 2016 | 1,938 | 1,937,334 | ||||||||||
TriMas Corp. | ||||||||||||
| Term Loan, 4.25%, Maturing June 21, 2017 | 1,047 | 1,027,737 | ||||||||||
Veyance Technologies, Inc. | ||||||||||||
| Term Loan, 2.75%, Maturing July 31, 2014 | 236 | 214,049 | ||||||||||
| Term Loan, 2.75%, Maturing July 31, 2014 | 1,647 | 1,494,449 | ||||||||||
| Term Loan - Second Lien, 6.00%, Maturing July 31, 2015 | 775 | 654,875 | ||||||||||
| $ | 30,933,863 | |||||||||||
| Building and Development — 2.3% | ||||||||||||
Armstrong World Industries, Inc. | ||||||||||||
| Term Loan, 4.00%, Maturing March 9, 2018 | 647 | $ | 641,495 | |||||||||
Beacon Sales Acquisition, Inc. | ||||||||||||
| Term Loan, 2.33%, Maturing September 30, 2013 | 1,069 | 1,030,807 | ||||||||||
Forestar Real Estate Group, Inc. | ||||||||||||
Revolving Loan, 0.49%, Maturing August 6, 2013(3) | 244 | 229,723 | ||||||||||
| Term Loan, 6.50%, Maturing August 6, 2015 | 2,240 | 2,150,514 | ||||||||||
Goodman Global Holdings, Inc. | ||||||||||||
| Term Loan, 5.75%, Maturing October 28, 2016 | 1,676 | 1,678,192 | ||||||||||
NCI Building Systems, Inc. | ||||||||||||
| Term Loan, 8.00%, Maturing April 18, 2014 | 246 | 239,993 | ||||||||||
November 2005 Land Investors, LLC | ||||||||||||
Term Loan, 0.00%, Maturing March 29, 2013(4)(5) | 305 | 45,726 | ||||||||||
Panolam Industries International | ||||||||||||
| Term Loan, 8.25%, Maturing December 31, 2013 | 1,472 | 1,343,158 | ||||||||||
See Notes to Financial Statements.
6
Eaton Vance
Senior Floating-Rate Trust
October 31, 2011
Portfolio of Investments — continued
| Principal | ||||||||||||
| Amount* | ||||||||||||
| Borrower/Tranche Description | (000’s omitted) | Value | ||||||||||
| Building and Development (continued) | ||||||||||||
RE/MAX International, Inc. | ||||||||||||
| Term Loan, 5.50%, Maturing April 15, 2016 | 1,745 | $ | 1,736,108 | |||||||||
Realogy Corp. | ||||||||||||
| Term Loan, 3.19%, Maturing October 10, 2013 | 138 | 129,200 | ||||||||||
| Term Loan, 3.27%, Maturing October 10, 2013 | 662 | 619,966 | ||||||||||
South Edge, LLC | ||||||||||||
Term Loan, 0.00%, Maturing October 31, 2009(6) | 1,588 | 1,504,156 | ||||||||||
| $ | 11,349,038 | |||||||||||
| Business Equipment and Services — 14.2% | ||||||||||||
Acosta, Inc. | ||||||||||||
| Term Loan, 4.75%, Maturing March 1, 2018 | 1,269 | $ | 1,255,939 | |||||||||
Advantage Sales & Marketing, Inc. | ||||||||||||
| Term Loan, 5.25%, Maturing December 18, 2017 | 1,836 | 1,808,583 | ||||||||||
Affinion Group, Inc. | ||||||||||||
| Term Loan, 5.00%, Maturing October 10, 2016 | 4,612 | 4,260,340 | ||||||||||
Allied Security Holdings, LLC | ||||||||||||
| Term Loan, 5.00%, Maturing February 3, 2017 | 572 | 569,264 | ||||||||||
Altegrity, Inc. | ||||||||||||
| Term Loan, 7.75%, Maturing February 20, 2015 | 767 | 757,256 | ||||||||||
| Term Loan, 2.99%, Maturing February 21, 2015 | 784 | 724,834 | ||||||||||
Audatex North America, Inc. | ||||||||||||
| Term Loan, 3.31%, Maturing May 16, 2014 | EUR | 721 | 983,136 | |||||||||
BAR/BRI Review Courses, Inc. | ||||||||||||
| Term Loan, 6.00%, Maturing June 16, 2017 | 725 | 710,500 | ||||||||||
Brand Energy and Infrastructure Services, Inc. | ||||||||||||
| Term Loan, 2.63%, Maturing February 7, 2014 | 2,667 | 2,160,369 | ||||||||||
| Term Loan, 3.63%, Maturing February 7, 2014 | 732 | 607,349 | ||||||||||
Brickman Group Holdings, Inc. | ||||||||||||
| Term Loan, 7.25%, Maturing October 14, 2016 | 1,166 | 1,166,188 | ||||||||||
Brock Holdings III, Inc. | ||||||||||||
| Term Loan, 6.00%, Maturing March 16, 2017 | 1,144 | 1,092,759 | ||||||||||
ClientLogic Corp. | ||||||||||||
| Term Loan, 7.14%, Maturing January 30, 2017 | 1,567 | 1,427,657 | ||||||||||
Crawford & Company | ||||||||||||
| Term Loan, 5.00%, Maturing October 30, 2013 | 1,131 | 1,122,553 | ||||||||||
DynCorp International, LLC | ||||||||||||
| Term Loan, 6.25%, Maturing July 5, 2016 | 738 | 729,959 | ||||||||||
Endurance International Group, Inc. (The) | ||||||||||||
| Term Loan, 8.00%, Maturing October 3, 2016 | 825 | 812,625 | ||||||||||
Fidelity National Information Services, Inc. | ||||||||||||
| Term Loan, 5.25%, Maturing July 18, 2016 | 1,503 | 1,516,609 | ||||||||||
Go Daddy Group, Inc. (The) | ||||||||||||
Term Loan, Maturing September 29, 2017(2) | 1,450 | 1,450,906 | ||||||||||
IMS Health, Inc. | ||||||||||||
| Term Loan, 4.50%, Maturing August 25, 2017 | 1,281 | 1,280,516 | ||||||||||
KAR Auction Services, Inc. | ||||||||||||
| Term Loan, 5.00%, Maturing May 19, 2017 | 2,843 | 2,842,875 | ||||||||||
Kronos, Inc. | ||||||||||||
| Term Loan, 2.12%, Maturing June 11, 2014 | 1,001 | 958,097 | ||||||||||
| Term Loan, 6.12%, Maturing June 11, 2015 | 1,000 | 937,500 | ||||||||||
Language Line, LLC | ||||||||||||
| Term Loan, 6.25%, Maturing June 20, 2016 | 2,117 | 2,101,569 | ||||||||||
Meritas, LLC | ||||||||||||
| Term Loan, 7.50%, Maturing July 28, 2017 | 804 | 792,309 | ||||||||||
Mitchell International, Inc. | ||||||||||||
| Term Loan - Second Lien, 5.63%, Maturing March 30, 2015 | 1,000 | 940,000 | ||||||||||
MSCI, Inc. | ||||||||||||
| Term Loan, 3.75%, Maturing March 14, 2017 | 2,901 | 2,933,762 | ||||||||||
N.E.W. Holdings I, LLC | ||||||||||||
| Term Loan, 6.00%, Maturing March 23, 2016 | 1,598 | 1,562,887 | ||||||||||
National CineMedia, LLC | ||||||||||||
| Term Loan, 1.84%, Maturing February 13, 2015 | 2,086 | 2,027,098 | ||||||||||
Protection One Alarm Monitoring, Inc. | ||||||||||||
| Term Loan, 6.00%, Maturing June 4, 2016 | 1,517 | 1,505,737 | ||||||||||
Quantum Corp. | ||||||||||||
| Term Loan, 3.83%, Maturing July 14, 2014 | 73 | 71,286 | ||||||||||
Quintiles Transnational Corp. | ||||||||||||
| Term Loan, 5.00%, Maturing June 8, 2018 | 4,314 | 4,276,438 | ||||||||||
Sabre, Inc. | ||||||||||||
| Term Loan, 2.30%, Maturing September 30, 2014 | 5,937 | 5,223,455 | ||||||||||
Sensus USA, Inc. | ||||||||||||
| Term Loan, 4.75%, Maturing May 9, 2017 | 672 | 661,551 | ||||||||||
| Term Loan - Second Lien, 8.50%, Maturing May 9, 2018 | 1,000 | 970,000 | ||||||||||
Softlayer Technologies, Inc. | ||||||||||||
| Term Loan, 7.25%, Maturing November 5, 2016 | 645 | 622,546 | ||||||||||
SunGard Data Systems, Inc. | ||||||||||||
| Term Loan, 1.99%, Maturing February 28, 2014 | 2,166 | 2,139,634 | ||||||||||
| Term Loan, 3.90%, Maturing February 26, 2016 | 6,642 | 6,583,661 | ||||||||||
SymphonyIRI Group, Inc. | ||||||||||||
| Term Loan, 5.00%, Maturing December 1, 2017 | 823 | 813,680 | ||||||||||
TransUnion, LLC | ||||||||||||
| Term Loan, 4.75%, Maturing February 12, 2018 | 1,891 | 1,878,684 | ||||||||||
Travelport, LLC | ||||||||||||
| Term Loan, 4.87%, Maturing August 21, 2015 | 553 | 482,679 | ||||||||||
| Term Loan, 4.87%, Maturing August 21, 2015 | 2,856 | 2,494,052 | ||||||||||
| Term Loan, 6.05%, Maturing August 21, 2015 | EUR | 741 | 879,446 | |||||||||
See Notes to Financial Statements.
7
Eaton Vance
Senior Floating-Rate Trust
October 31, 2011
Portfolio of Investments — continued
| Principal | ||||||||||||
| Amount* | ||||||||||||
| Borrower/Tranche Description | (000’s omitted) | Value | ||||||||||
| Business Equipment and Services (continued) | ||||||||||||
U.S. Security Holdings, Inc. | ||||||||||||
Term Loan, 1.50%, Maturing July 28, 2017(3) | 118 | $ | 116,402 | |||||||||
| Term Loan, 6.00%, Maturing July 28, 2017 | 607 | 597,723 | ||||||||||
West Corp. | ||||||||||||
| Term Loan, 4.61%, Maturing July 15, 2016 | 1,943 | 1,930,363 | ||||||||||
| Term Loan, 4.63%, Maturing July 15, 2016 | 683 | 678,791 | ||||||||||
| $ | 71,459,567 | |||||||||||
| Cable and Satellite Television — 7.9% | ||||||||||||
Atlantic Broadband Finance, LLC | ||||||||||||
| Term Loan, 4.00%, Maturing March 8, 2016 | 1,279 | $ | 1,260,294 | |||||||||
BBHI Acquisition, LLC | ||||||||||||
| Term Loan, 4.50%, Maturing December 14, 2017 | 1,241 | 1,234,422 | ||||||||||
Bragg Communications, Inc. | ||||||||||||
| Term Loan, 2.82%, Maturing August 31, 2014 | 2,064 | 2,002,080 | ||||||||||
Cequel Communications, LLC | ||||||||||||
| Term Loan, 2.24%, Maturing November 5, 2013 | 2,135 | 2,108,024 | ||||||||||
Charter Communications Operating, LLC | ||||||||||||
| Term Loan, 3.62%, Maturing September 6, 2016 | 990 | 984,975 | ||||||||||
Crown Media Holdings, Inc. | ||||||||||||
| Term Loan, 5.75%, Maturing July 14, 2018 | 524 | 518,451 | ||||||||||
CSC Holdings, Inc. | ||||||||||||
| Term Loan, 1.99%, Maturing March 29, 2016 | 2,864 | 2,842,159 | ||||||||||
Insight Midwest Holdings, LLC | ||||||||||||
| Term Loan, 1.99%, Maturing April 7, 2014 | 3,157 | 3,132,079 | ||||||||||
Lavena Holdings 4 GmbH | ||||||||||||
| Term Loan, 4.20%, Maturing March 6, 2015 | EUR | 369 | 435,423 | |||||||||
| Term Loan, 4.45%, Maturing March 4, 2016 | EUR | 369 | 435,423 | |||||||||
Term Loan, 8.83%, Maturing March 6, 2017(7) | EUR | 391 | 315,945 | |||||||||
| Term Loan - Second Lien, 5.58%, Maturing September 2, 2016 | EUR | 520 | 507,217 | |||||||||
MCC Iowa, LLC | ||||||||||||
| Term Loan, 1.95%, Maturing January 30, 2015 | 5,615 | 5,334,645 | ||||||||||
Mediacom, LLC | ||||||||||||
| Term Loan, 4.50%, Maturing October 23, 2017 | 815 | 793,506 | ||||||||||
Mediacom Broadband, LLC | ||||||||||||
| Term Loan, 4.50%, Maturing October 23, 2017 | 1,457 | 1,432,893 | ||||||||||
Mediacom Illinois, LLC | ||||||||||||
| Term Loan, 1.95%, Maturing January 30, 2015 | 3,617 | 3,422,616 | ||||||||||
| Term Loan, 5.50%, Maturing March 31, 2017 | 980 | 970,507 | ||||||||||
NDS Finance, Ltd. | ||||||||||||
| Term Loan, 4.00%, Maturing March 12, 2018 | 1,343 | 1,321,422 | ||||||||||
P7S1 Broadcasting Holding II B.V. | ||||||||||||
| Term Loan, 4.03%, Maturing July 1, 2016 | EUR | 1,781 | 2,327,527 | |||||||||
UPC Broadband Holding B.V. | ||||||||||||
| Term Loan, 5.11%, Maturing December 31, 2016 | EUR | 2,353 | 3,132,388 | |||||||||
| Term Loan, 5.36%, Maturing December 31, 2017 | EUR | 1,619 | 2,167,389 | |||||||||
UPC Financing Partnership | ||||||||||||
| Term Loan, 3.87%, Maturing December 30, 2016 | 409 | 397,602 | ||||||||||
| Term Loan, 3.74%, Maturing December 29, 2017 | 1,264 | 1,223,076 | ||||||||||
Term Loan, Maturing December 31, 2017(2) | 375 | 372,188 | ||||||||||
YPSO Holding SA | ||||||||||||
Term Loan, 4.87%, Maturing June 6, 2016(7) | EUR | 204 | 240,182 | |||||||||
Term Loan, 4.87%, Maturing June 6, 2016(7) | EUR | 243 | 286,533 | |||||||||
Term Loan, 4.87%, Maturing June 6, 2016(7) | EUR | 497 | 585,539 | |||||||||
| $ | 39,784,505 | |||||||||||
| Chemicals and Plastics — 6.4% | ||||||||||||
Arizona Chemical, Inc. | ||||||||||||
| Term Loan, 4.75%, Maturing November 21, 2016 | 325 | $ | 325,929 | |||||||||
Ashland, Inc. | ||||||||||||
| Term Loan, 3.75%, Maturing August 23, 2018 | 1,950 | 1,961,374 | ||||||||||
General Chemical Corp. | ||||||||||||
| Term Loan, 5.00%, Maturing October 6, 2015 | 555 | 551,180 | ||||||||||
Houghton International, Inc. | ||||||||||||
| Term Loan, 6.75%, Maturing January 29, 2016 | 817 | 819,381 | ||||||||||
Huntsman International, LLC | ||||||||||||
| Term Loan, 1.83%, Maturing April 21, 2014 | 573 | 563,440 | ||||||||||
| Term Loan, 2.52%, Maturing June 30, 2016 | 855 | 830,006 | ||||||||||
| Term Loan, 2.80%, Maturing April 19, 2017 | 1,563 | 1,513,975 | ||||||||||
Ineos Holdings, Ltd. | ||||||||||||
| Term Loan, 9.00%, Maturing June 16, 2015 | EUR | 1,250 | 1,653,521 | |||||||||
INEOS US Finance, LLC | ||||||||||||
| Term Loan, 7.50%, Maturing December 16, 2013 | 1,723 | 1,772,387 | ||||||||||
| Term Loan, 8.00%, Maturing December 16, 2014 | 1,665 | 1,713,166 | ||||||||||
MacDermid, Inc. | ||||||||||||
| Term Loan, 2.25%, Maturing April 11, 2014 | 461 | 449,194 | ||||||||||
Momentive Performance Materials, Inc. (Nautilus) | ||||||||||||
| Term Loan, 3.75%, Maturing May 5, 2015 | 3,143 | 2,975,434 | ||||||||||
Momentive Specialty Chemicals, Inc. | ||||||||||||
| Term Loan, 4.00%, Maturing May 5, 2015 | 479 | 452,419 | ||||||||||
| Term Loan, 4.00%, Maturing May 5, 2015 | 1,691 | 1,617,747 | ||||||||||
| Term Loan, 4.13%, Maturing May 5, 2015 | 760 | 727,366 | ||||||||||
Nalco Co. | ||||||||||||
| Term Loan, 4.50%, Maturing October 5, 2017 | 1,386 | 1,387,516 | ||||||||||
Norit NV | ||||||||||||
| Term Loan, 6.75%, Maturing July 7, 2017 | 1,250 | 1,218,750 | ||||||||||
See Notes to Financial Statements.
8
Eaton Vance
Senior Floating-Rate Trust
October 31, 2011
Portfolio of Investments — continued
| Principal | ||||||||||||
| Amount* | ||||||||||||
| Borrower/Tranche Description | (000’s omitted) | Value | ||||||||||
| Chemicals and Plastics (continued) | ||||||||||||
OM Group, Inc. | ||||||||||||
| Term Loan, 5.75%, Maturing August 2, 2017 | 525 | $ | 526,312 | |||||||||
Omnova Solutions, Inc. | ||||||||||||
| Term Loan, 5.75%, Maturing May 31, 2017 | 993 | 983,816 | ||||||||||
Rockwood Specialties Group, Inc. | ||||||||||||
| Term Loan, 3.50%, Maturing February 9, 2018 | 2,114 | 2,125,475 | ||||||||||
Schoeller Arca Systems Holding | ||||||||||||
| Term Loan, 6.04%, Maturing November 16, 2015 | EUR | 145 | 145,982 | |||||||||
| Term Loan, 6.04%, Maturing November 16, 2015 | EUR | 412 | 416,223 | |||||||||
| Term Loan, 6.04%, Maturing November 16, 2015 | EUR | 443 | 447,896 | |||||||||
Solutia, Inc. | ||||||||||||
| Term Loan, 3.50%, Maturing August 1, 2017 | 2,077 | 2,083,623 | ||||||||||
Styron S.A.R.L. | ||||||||||||
| Term Loan, 6.00%, Maturing August 2, 2017 | 2,878 | 2,646,191 | ||||||||||
Univar, Inc. | ||||||||||||
| Term Loan, 5.00%, Maturing June 30, 2017 | 2,563 | 2,511,924 | ||||||||||
| $ | 32,420,227 | |||||||||||
| Clothing / Textiles — 0.2% | ||||||||||||
Phillips-Van Heusen Corp. | ||||||||||||
| Term Loan, 3.50%, Maturing May 6, 2016 | 547 | $ | 547,905 | |||||||||
Warnaco, Inc. | ||||||||||||
| Term Loan, 3.75%, Maturing June 15, 2018 | 499 | 496,256 | ||||||||||
| $ | 1,044,161 | |||||||||||
| Conglomerates — 3.6% | ||||||||||||
Education Management, LLC | ||||||||||||
| Term Loan, 2.13%, Maturing June 3, 2013 | 3,988 | $ | 3,793,580 | |||||||||
Financiere SPIE S.A.S. | ||||||||||||
| Term Loan, 6.12%, Maturing June 29, 2018 | EUR | 2,000 | 2,615,193 | |||||||||
Jason, Inc. | ||||||||||||
| Term Loan, 8.25%, Maturing September 21, 2014 | 173 | 172,755 | ||||||||||
| Term Loan, 8.25%, Maturing September 22, 2014 | 69 | 68,772 | ||||||||||
| Term Loan, 8.50%, Maturing September 22, 2014 | 225 | 223,875 | ||||||||||
Rexnord Corp. | ||||||||||||
| Term Loan, 2.50%, Maturing July 19, 2013 | 768 | 753,628 | ||||||||||
| Term Loan, 2.87%, Maturing July 19, 2013 | 3,785 | 3,751,719 | ||||||||||
RGIS Holdings, LLC | ||||||||||||
| Term Loan, 2.87%, Maturing April 30, 2014 | 122 | 115,510 | ||||||||||
| Term Loan, 2.87%, Maturing April 30, 2014 | 2,438 | 2,310,204 | ||||||||||
Spectrum Brands, Inc. | ||||||||||||
| Term Loan, 5.00%, Maturing June 17, 2016 | 2,279 | 2,275,752 | ||||||||||
Walter Energy, Inc. | ||||||||||||
| Term Loan, 4.00%, Maturing April 2, 2018 | 2,239 | 2,238,415 | ||||||||||
| $ | 18,319,403 | |||||||||||
| Containers and Glass Products — 2.4% | ||||||||||||
Berry Plastics Corp. | ||||||||||||
| Term Loan, 2.24%, Maturing April 3, 2015 | 1,949 | $ | 1,859,884 | |||||||||
BWAY Corp. | ||||||||||||
| Term Loan, 4.50%, Maturing February 23, 2018 | 70 | 69,933 | ||||||||||
| Term Loan, 4.50%, Maturing February 23, 2018 | 794 | 787,682 | ||||||||||
Graphic Packaging International, Inc. | ||||||||||||
| Term Loan, 2.39%, Maturing May 16, 2014 | 808 | 801,913 | ||||||||||
| Term Loan, 3.14%, Maturing May 16, 2014 | 367 | 368,274 | ||||||||||
Hilex Poly Co. | ||||||||||||
| Term Loan, 11.25%, Maturing November 16, 2015 | 925 | 906,500 | ||||||||||
Pelican Products, Inc. | ||||||||||||
| Term Loan, 5.00%, Maturing March 7, 2017 | 769 | 761,496 | ||||||||||
Reynolds Group Holdings, Inc. | ||||||||||||
| Term Loan, 6.50%, Maturing February 9, 2018 | 2,811 | 2,809,118 | ||||||||||
| Term Loan, 6.50%, Maturing August 9, 2018 | 2,825 | 2,818,231 | ||||||||||
Sealed Air Corp. | ||||||||||||
| Term Loan, 4.75%, Maturing October 3, 2018 | 648 | 655,804 | ||||||||||
| $ | 11,838,835 | |||||||||||
| Cosmetics / Toiletries — 0.7% | ||||||||||||
Bausch & Lomb, Inc. | ||||||||||||
| Term Loan, 3.50%, Maturing April 24, 2015 | 290 | $ | 288,808 | |||||||||
| Term Loan, 3.59%, Maturing April 24, 2015 | 1,191 | 1,184,984 | ||||||||||
KIK Custom Products, Inc. | ||||||||||||
| Term Loan - Second Lien, 5.26%, Maturing November 28, 2014 | 975 | 627,250 | ||||||||||
Prestige Brands, Inc. | ||||||||||||
| Term Loan, 4.77%, Maturing March 24, 2016 | 1,311 | 1,316,398 | ||||||||||
| $ | 3,417,440 | |||||||||||
| Drugs — 1.5% | ||||||||||||
Aptalis Pharma, Inc. | ||||||||||||
| Term Loan, 5.50%, Maturing February 10, 2017 | 1,489 | $ | 1,441,296 | |||||||||
Capsugel Healthcare, Ltd. | ||||||||||||
| Term Loan, 5.25%, Maturing August 1, 2018 | 1,275 | 1,279,781 | ||||||||||
Endo Pharmaceuticals Holdings, Inc. | ||||||||||||
| Term Loan, 4.00%, Maturing June 18, 2018 | 1,227 | 1,231,462 | ||||||||||
Graceway Pharmaceuticals, LLC | ||||||||||||
Term Loan, 0.00%, Maturing May 3, 2012(4) | 550 | 325,440 | ||||||||||
See Notes to Financial Statements.
9
Eaton Vance
Senior Floating-Rate Trust
October 31, 2011
Portfolio of Investments — continued
| Principal | ||||||||||||
| Amount* | ||||||||||||
| Borrower/Tranche Description | (000’s omitted) | Value | ||||||||||
| Drugs (continued) | ||||||||||||
Term Loan, 12.00%, Maturing November 3, 2013(7) | 323 | $ | 2,219 | |||||||||
Term Loan - Second Lien, 0.00%, Maturing May 3, 2013(4) | 1,500 | 30,938 | ||||||||||
Warner Chilcott Corp. | ||||||||||||
| Term Loan, 4.25%, Maturing March 15, 2018 | 802 | 797,009 | ||||||||||
| Term Loan, 4.25%, Maturing March 15, 2018 | 1,603 | 1,594,019 | ||||||||||
WC Luxco S.A.R.L. | ||||||||||||
| Term Loan, 4.25%, Maturing March 15, 2018 | 1,102 | 1,095,888 | ||||||||||
| $ | 7,798,052 | |||||||||||
| Ecological Services and Equipment — 0.2% | ||||||||||||
Cory Environmental Holdings | ||||||||||||
Term Loan - Second Lien, 5.04%, Maturing September 30, 2014(7) | GBP | 513 | $ | 232,136 | ||||||||
Environmental Systems Products Holdings, Inc. | ||||||||||||
Term Loan - Second Lien, 13.50%, Maturing September 12, 2014(5) | 618 | 552,438 | ||||||||||
| $ | 784,574 | |||||||||||
| Electronics / Electrical — 8.6% | ||||||||||||
Aeroflex, Inc. | ||||||||||||
| Term Loan, 4.25%, Maturing May 9, 2018 | 1,173 | $ | 1,155,713 | |||||||||
Aspect Software, Inc. | ||||||||||||
| Term Loan, 6.25%, Maturing May 6, 2016 | 1,551 | 1,559,132 | ||||||||||
Attachmate Corp. | ||||||||||||
| Term Loan, 6.50%, Maturing April 27, 2017 | 950 | 929,813 | ||||||||||
Cinedigm Digital Funding I, LLC | ||||||||||||
| Term Loan, 5.25%, Maturing April 29, 2016 | 572 | 549,022 | ||||||||||
CommScope, Inc. | ||||||||||||
| Term Loan, 5.00%, Maturing January 14, 2018 | 2,114 | 2,106,446 | ||||||||||
Dealer Computer Services, Inc. | ||||||||||||
| Term Loan, 3.75%, Maturing April 20, 2018 | 2,394 | 2,390,409 | ||||||||||
DG FastChannel, Inc. | ||||||||||||
| Term Loan, 5.75%, Maturing July 26, 2018 | 1,621 | 1,604,728 | ||||||||||
Eagle Parent, Inc. | ||||||||||||
| Term Loan, 5.00%, Maturing May 16, 2018 | 2,594 | 2,543,251 | ||||||||||
Edwards (Cayman Island II), Ltd. | ||||||||||||
| Term Loan, 5.50%, Maturing May 31, 2016 | 500 | 469,584 | ||||||||||
| Term Loan, 5.50%, Maturing May 31, 2016 | 1,241 | 1,165,154 | ||||||||||
FCI International S.A.S. | ||||||||||||
| Term Loan, 3.62%, Maturing November 1, 2013 | 123 | 120,808 | ||||||||||
| Term Loan, 3.62%, Maturing November 1, 2013 | 123 | 120,808 | ||||||||||
| Term Loan, 3.62%, Maturing November 1, 2013 | 128 | 125,486 | ||||||||||
| Term Loan, 3.62%, Maturing November 1, 2013 | 128 | 125,486 | ||||||||||
Freescale Semiconductor, Inc. | ||||||||||||
| Term Loan, 4.49%, Maturing December 1, 2016 | 3,498 | 3,375,785 | ||||||||||
Infor Enterprise Solutions Holdings | ||||||||||||
| Term Loan, 5.75%, Maturing March 3, 2014 | 500 | 400,000 | ||||||||||
| Term Loan, 6.00%, Maturing July 28, 2015 | 1,470 | 1,392,022 | ||||||||||
| Term Loan, 6.00%, Maturing July 28, 2015 | 2,818 | 2,710,307 | ||||||||||
| Term Loan - Second Lien, 6.50%, Maturing March 3, 2014 | 183 | 151,250 | ||||||||||
| Term Loan - Second Lien, 6.50%, Maturing March 3, 2014 | 317 | 258,083 | ||||||||||
Microsemi Corp. | ||||||||||||
| Term Loan, 5.75%, Maturing February 2, 2018 | 1,575 | 1,586,813 | ||||||||||
NXP B.V. | ||||||||||||
| Term Loan, 4.50%, Maturing March 3, 2017 | 2,687 | 2,592,473 | ||||||||||
Open Solutions, Inc. | ||||||||||||
| Term Loan, 2.55%, Maturing January 23, 2014 | 2,006 | 1,731,064 | ||||||||||
SafeNet, Inc. | ||||||||||||
| Term Loan, 2.75%, Maturing April 12, 2014 | 1,936 | 1,859,777 | ||||||||||
Sensata Technologies Finance Co., LLC | ||||||||||||
| Term Loan, 4.00%, Maturing May 11, 2018 | 3,516 | 3,505,199 | ||||||||||
Serena Software, Inc. | ||||||||||||
| Term Loan, 4.34%, Maturing March 10, 2016 | 474 | 450,300 | ||||||||||
Shield Finance Co. S.A.R.L. | ||||||||||||
| Term Loan, 7.75%, Maturing June 15, 2016 | 842 | 831,660 | ||||||||||
SkillSoft Corp. | ||||||||||||
| Term Loan, 6.50%, Maturing May 19, 2017 | 250 | 250,000 | ||||||||||
| Term Loan, 6.50%, Maturing May 26, 2017 | 978 | 978,386 | ||||||||||
Spansion, LLC | ||||||||||||
| Term Loan, 4.75%, Maturing February 9, 2015 | 554 | 551,976 | ||||||||||
Sunquest Information Systems, Inc. | ||||||||||||
| Term Loan, 6.25%, Maturing December 16, 2016 | 748 | 740,644 | ||||||||||
VeriFone, Inc. | ||||||||||||
| Term Loan, 3.00%, Maturing October 31, 2013 | 1,968 | 1,967,875 | ||||||||||
Vertafore, Inc. | ||||||||||||
| Term Loan, 5.25%, Maturing July 29, 2016 | 993 | 976,373 | ||||||||||
Web.com Group, Inc. | ||||||||||||
Term Loan, Maturing October 27, 2017(2) | 2,150 | 1,930,969 | ||||||||||
| $ | 43,206,796 | |||||||||||
| Equipment Leasing — 0.6% | ||||||||||||
BakerCorp. International, Inc. | ||||||||||||
| Term Loan, 5.00%, Maturing June 1, 2018 | 848 | $ | 836,747 | |||||||||
Delos Aircraft, Inc. | ||||||||||||
| Term Loan, 7.00%, Maturing March 17, 2016 | 1,425 | 1,436,874 | ||||||||||
See Notes to Financial Statements.
10
Eaton Vance
Senior Floating-Rate Trust
October 31, 2011
Portfolio of Investments — continued
| Principal | ||||||||||||
| Amount* | ||||||||||||
| Borrower/Tranche Description | (000’s omitted) | Value | ||||||||||
| Equipment Leasing (continued) | ||||||||||||
International Lease Finance Corp. | ||||||||||||
| Term Loan, 6.75%, Maturing March 17, 2015 | 850 | $ | 858,235 | |||||||||
| $ | 3,131,856 | |||||||||||
| Farming / Agriculture — 0.3% | ||||||||||||
WM. Bolthouse Farms, Inc. | ||||||||||||
| Term Loan, 5.50%, Maturing February 11, 2016 | 1,568 | $ | 1,556,466 | |||||||||
| $ | 1,556,466 | |||||||||||
| Financial Intermediaries — 5.9% | ||||||||||||
AmWINS Group, Inc. | ||||||||||||
| Term Loan, 4.62%, Maturing June 8, 2013 | 948 | $ | 924,416 | |||||||||
| Term Loan - Second Lien, 5.86%, Maturing June 8, 2014 | 500 | 475,000 | ||||||||||
CB Richard Ellis Services, Inc. | ||||||||||||
| Term Loan, 3.50%, Maturing March 5, 2018 | 693 | 676,968 | ||||||||||
| Term Loan, 3.74%, Maturing September 4, 2019 | 654 | 639,358 | ||||||||||
Citco III, Ltd. | ||||||||||||
| Term Loan, 6.25%, Maturing June 29, 2018 | 1,646 | 1,600,613 | ||||||||||
Fifth Third Processing Solutions, LLC | ||||||||||||
| Term Loan, 4.50%, Maturing November 3, 2016 | 1,241 | 1,237,570 | ||||||||||
First Data Corp. | ||||||||||||
| Term Loan, 2.99%, Maturing September 24, 2014 | 257 | 238,409 | ||||||||||
| Term Loan, 2.99%, Maturing September 24, 2014 | 1,239 | 1,148,055 | ||||||||||
| Term Loan, 2.99%, Maturing September 24, 2014 | 2,988 | 2,769,485 | ||||||||||
| Term Loan, 4.24%, Maturing March 23, 2018 | 1,636 | 1,421,772 | ||||||||||
Grosvenor Capital Management Holdings, LLP | ||||||||||||
| Term Loan, 4.25%, Maturing December 5, 2016 | 1,352 | 1,301,148 | ||||||||||
HarbourVest Partners, LLC | ||||||||||||
| Term Loan, 6.25%, Maturing December 14, 2016 | 1,125 | 1,124,763 | ||||||||||
iPayment, Inc. | ||||||||||||
| Term Loan, 5.75%, Maturing May 8, 2017 | 937 | 946,673 | ||||||||||
LPL Holdings, Inc. | ||||||||||||
| Term Loan, 2.02%, Maturing June 28, 2013 | 915 | 907,913 | ||||||||||
| Term Loan, 4.25%, Maturing June 25, 2015 | 2,881 | 2,864,457 | ||||||||||
| Term Loan, 5.25%, Maturing June 28, 2017 | 2,080 | 2,077,504 | ||||||||||
Mercury Payment Systems Canada, LLC | ||||||||||||
| Term Loan, 6.50%, Maturing July 3, 2017 | 648 | 649,185 | ||||||||||
Mondrian Investment Partners, Ltd. | ||||||||||||
| Term Loan, 5.50%, Maturing July 12, 2018 | 1,270 | 1,269,545 | ||||||||||
Nuveen Investments, Inc. | ||||||||||||
| Term Loan, 3.39%, Maturing November 13, 2014 | 1,651 | 1,599,296 | ||||||||||
| Term Loan, 5.89%, Maturing May 12, 2017 | 2,429 | 2,341,527 | ||||||||||
RJO Holdings Corp. | ||||||||||||
Term Loan, 6.25%, Maturing December 10, 2015(5) | 7 | 5,773 | ||||||||||
Term Loan, 6.25%, Maturing December 10, 2015(5) | 224 | 169,505 | ||||||||||
RPI Finance Trust | ||||||||||||
| Term Loan, 4.00%, Maturing May 9, 2018 | 3,491 | 3,474,886 | ||||||||||
| $ | 29,863,821 | |||||||||||
| Food Products — 4.3% | ||||||||||||
American Seafoods Group, LLC | ||||||||||||
| Term Loan, 4.25%, Maturing March 8, 2018 | 642 | $ | 630,691 | |||||||||
Del Monte Foods Co. | ||||||||||||
| Term Loan, 4.50%, Maturing March 8, 2018 | 4,416 | 4,316,457 | ||||||||||
Dole Food Company, Inc. | ||||||||||||
| Term Loan, 5.05%, Maturing July 6, 2018 | 969 | 972,455 | ||||||||||
JBS USA Holdings, Inc. | ||||||||||||
| Term Loan, 4.25%, Maturing May 25, 2018 | 998 | 982,538 | ||||||||||
Michael Foods Group, Inc. | ||||||||||||
| Term Loan, 4.25%, Maturing February 23, 2018 | 696 | 690,883 | ||||||||||
NBTY, Inc. | ||||||||||||
| Term Loan, 4.25%, Maturing October 2, 2017 | 2,084 | 2,082,514 | ||||||||||
Pierre Foods, Inc. | ||||||||||||
| Term Loan, 7.00%, Maturing September 30, 2016 | 1,238 | 1,228,735 | ||||||||||
Pinnacle Foods Holdings Corp. | ||||||||||||
| Term Loan, 2.77%, Maturing April 2, 2014 | 6,554 | 6,483,016 | ||||||||||
Provimi Holding | ||||||||||||
| Term Loan, 2.12%, Maturing June 28, 2015 | 205 | 203,564 | ||||||||||
| Term Loan, 2.12%, Maturing June 28, 2015 | 252 | 250,511 | ||||||||||
| Term Loan, 3.24%, Maturing June 28, 2015 | EUR | 29 | 39,241 | |||||||||
| Term Loan, 3.24%, Maturing June 28, 2015 | EUR | 265 | 364,321 | |||||||||
| Term Loan, 3.24%, Maturing June 28, 2015 | EUR | 394 | 540,863 | |||||||||
| Term Loan, 3.24%, Maturing June 28, 2015 | EUR | 431 | 591,905 | |||||||||
| Term Loan - Second Lien, 4.96%, Maturing December 28, 2016 | 148 | 146,848 | ||||||||||
| Term Loan - Second Lien, 5.62%, Maturing December 28, 2016 | EUR | 24 | 33,147 | |||||||||
| Term Loan - Second Lien, 5.62%, Maturing December 28, 2016 | EUR | 331 | 453,978 | |||||||||
Solvest, Ltd. | ||||||||||||
| Term Loan, 5.03%, Maturing July 6, 2018 | 1,799 | 1,805,988 | ||||||||||
| $ | 21,817,655 | |||||||||||
See Notes to Financial Statements.
11
Eaton Vance
Senior Floating-Rate Trust
October 31, 2011
Portfolio of Investments — continued
| Principal | ||||||||||||
| Amount* | ||||||||||||
| Borrower/Tranche Description | (000’s omitted) | Value | ||||||||||
| Food Service — 5.7% | ||||||||||||
Aramark Corp. | ||||||||||||
| Term Loan, 2.11%, Maturing January 27, 2014 | 169 | $ | 166,970 | |||||||||
| Term Loan, 2.24%, Maturing January 27, 2014 | 2,094 | 2,069,957 | ||||||||||
| Term Loan, 2.95%, Maturing January 27, 2014 | GBP | 953 | 1,454,949 | |||||||||
| Term Loan, 3.49%, Maturing July 26, 2016 | 304 | 301,524 | ||||||||||
| Term Loan, 3.62%, Maturing July 26, 2016 | 4,621 | 4,584,867 | ||||||||||
Buffets, Inc. | ||||||||||||
Term Loan, 14.00%, Maturing April 21, 2015(7) | 1,235 | 586,806 | ||||||||||
Term Loan, 9.62%, Maturing April 22, 2015(7) | 125 | 56,144 | ||||||||||
Burger King Corp. | ||||||||||||
| Term Loan, 4.50%, Maturing October 19, 2016 | 4,789 | 4,776,840 | ||||||||||
Denny’s, Inc. | ||||||||||||
| Term Loan, 5.25%, Maturing September 30, 2016 | 630 | 632,362 | ||||||||||
DineEquity, Inc. | ||||||||||||
| Term Loan, 4.32%, Maturing October 19, 2017 | 1,583 | 1,584,728 | ||||||||||
Dunkin’ Brands, Inc. | ||||||||||||
| Term Loan, 4.00%, Maturing November 23, 2017 | 3,102 | 3,102,472 | ||||||||||
NPC International, Inc. | ||||||||||||
| Term Loan, 2.01%, Maturing May 3, 2013 | 268 | 266,958 | ||||||||||
OSI Restaurant Partners, LLC | ||||||||||||
| Term Loan, 2.80%, Maturing June 14, 2013 | 447 | 428,290 | ||||||||||
| Term Loan, 2.56%, Maturing June 14, 2014 | 4,970 | 4,758,669 | ||||||||||
Sagittarius Restaurants, LLC | ||||||||||||
| Term Loan, 7.51%, Maturing May 18, 2015 | 450 | 447,750 | ||||||||||
Selecta | ||||||||||||
| Term Loan - Second Lien, 5.77%, Maturing December 28, 2015 | EUR | 741 | 685,484 | |||||||||
U.S. Foodservice, Inc. | ||||||||||||
| Term Loan, 2.75%, Maturing July 3, 2014 | 1,987 | 1,849,431 | ||||||||||
Wendy’s/Arby’s Restaurants, LLC | ||||||||||||
| Term Loan, 5.00%, Maturing May 24, 2017 | 821 | 820,177 | ||||||||||
| $ | 28,574,378 | |||||||||||
| Food / Drug Retailers — 5.1% | ||||||||||||
Alliance Boots Holdings, Ltd. | ||||||||||||
| Term Loan, 3.63%, Maturing July 9, 2015 | GBP | 1,775 | $ | 2,617,676 | ||||||||
| Term Loan, 4.15%, Maturing July 9, 2015 | EUR | 1,000 | 1,301,172 | |||||||||
General Nutrition Centers, Inc. | ||||||||||||
| Term Loan, 4.25%, Maturing March 2, 2018 | 4,725 | 4,719,094 | ||||||||||
Pantry, Inc. (The) | ||||||||||||
| Term Loan, 2.00%, Maturing May 15, 2014 | 217 | 208,435 | ||||||||||
| Term Loan, 2.00%, Maturing May 15, 2014 | 752 | 723,851 | ||||||||||
Rite Aid Corp. | ||||||||||||
| Term Loan, 2.00%, Maturing June 4, 2014 | 7,966 | 7,653,939 | ||||||||||
| Term Loan, 4.50%, Maturing March 2, 2018 | 2,114 | 2,008,222 | ||||||||||
Roundy’s Supermarkets, Inc. | ||||||||||||
| Term Loan, 7.00%, Maturing November 3, 2013 | 3,262 | 3,194,487 | ||||||||||
Supervalu, Inc. | ||||||||||||
| Term Loan, 4.50%, Maturing April 28, 2018 | 3,234 | 3,108,442 | ||||||||||
| $ | 25,535,318 | |||||||||||
| Health Care — 18.0% | ||||||||||||
1-800-Contacts, Inc. | ||||||||||||
| Term Loan, 7.70%, Maturing March 4, 2015 | 902 | $ | 897,367 | |||||||||
Alere, Inc. | ||||||||||||
| Term Loan, 4.50%, Maturing June 30, 2017 | 2,375 | 2,339,375 | ||||||||||
Alliance Healthcare Services | ||||||||||||
| Term Loan, 7.25%, Maturing June 1, 2016 | 1,137 | 1,034,658 | ||||||||||
Ardent Medical Services, Inc. | ||||||||||||
| Term Loan, 6.50%, Maturing September 15, 2015 | 1,133 | 1,110,803 | ||||||||||
| Term Loan, 6.50%, Maturing September 18, 2015 | 675 | 660,656 | ||||||||||
Aveta Holdings, LLC | ||||||||||||
| Term Loan, 8.50%, Maturing April 14, 2015 | 510 | 505,731 | ||||||||||
| Term Loan, 8.50%, Maturing April 14, 2015 | 510 | 505,731 | ||||||||||
Biomet, Inc. | ||||||||||||
| Term Loan, 3.32%, Maturing March 25, 2015 | 3,696 | 3,650,973 | ||||||||||
Carestream Health, Inc. | ||||||||||||
| Term Loan, 5.00%, Maturing February 25, 2017 | 1,517 | 1,365,887 | ||||||||||
Carl Zeiss Vision Holding GmbH | ||||||||||||
Term Loan, 4.00%, Maturing September 30, 2019(7) | 135 | 113,556 | ||||||||||
Catalent Pharma Solutions | ||||||||||||
| Term Loan, 2.50%, Maturing April 10, 2014 | 2,139 | 2,046,403 | ||||||||||
CDRL MS, Inc. | ||||||||||||
| Term Loan, 6.75%, Maturing September 29, 2016 | 878 | 872,230 | ||||||||||
Community Health Systems, Inc. | ||||||||||||
| Term Loan, 2.57%, Maturing July 25, 2014 | 351 | 341,832 | ||||||||||
| Term Loan, 2.57%, Maturing July 25, 2014 | 6,838 | 6,651,159 | ||||||||||
| Term Loan, 3.82%, Maturing January 25, 2017 | 3,432 | 3,335,598 | ||||||||||
ConMed Corp. | ||||||||||||
| Term Loan, 1.75%, Maturing April 12, 2013 | 439 | 430,601 | ||||||||||
ConvaTec, Inc. | ||||||||||||
| Term Loan, 5.75%, Maturing December 22, 2016 | 995 | 972,600 | ||||||||||
CRC Health Corp. | ||||||||||||
| Term Loan, 4.87%, Maturing November 16, 2015 | 1,940 | 1,842,715 | ||||||||||
See Notes to Financial Statements.
12
Eaton Vance
Senior Floating-Rate Trust
October 31, 2011
Portfolio of Investments — continued
| Principal | ||||||||||||
| Amount* | ||||||||||||
| Borrower/Tranche Description | (000’s omitted) | Value | ||||||||||
| Health Care (continued) | ||||||||||||
Dako EQT Project Delphi | ||||||||||||
| Term Loan - Second Lien, 4.12%, Maturing December 12, 2016 | 500 | $ | 428,125 | |||||||||
DaVita, Inc. | ||||||||||||
| Term Loan, 4.50%, Maturing October 20, 2016 | 2,978 | 2,976,571 | ||||||||||
DJO Finance, LLC | ||||||||||||
| Term Loan, 3.25%, Maturing May 20, 2014 | 635 | 614,010 | ||||||||||
Drumm Investors, LLC | ||||||||||||
| Term Loan, 5.00%, Maturing May 4, 2018 | 1,497 | 1,368,911 | ||||||||||
Emdeon Business Services, LLC | ||||||||||||
| Term Loan, 4.25%, Maturing November 18, 2013 | 2,452 | 2,463,769 | ||||||||||
Emergency Medical Services Corp. | ||||||||||||
| Term Loan, 5.25%, Maturing May 25, 2018 | 1,997 | 1,959,541 | ||||||||||
Fresenius US Finance I, Inc. | ||||||||||||
| Term Loan, 3.50%, Maturing September 10, 2014 | 308 | 308,009 | ||||||||||
| Term Loan, 3.50%, Maturing September 10, 2014 | 686 | 685,838 | ||||||||||
Grifols, Inc. | ||||||||||||
| Term Loan, 6.00%, Maturing June 1, 2017 | 2,145 | 2,154,008 | ||||||||||
Hanger Orthopedic Group, Inc. | ||||||||||||
| Term Loan, 4.00%, Maturing December 1, 2016 | 670 | 654,026 | ||||||||||
HCA, Inc. | ||||||||||||
| Term Loan, 3.62%, Maturing March 31, 2017 | 6,168 | 6,000,791 | ||||||||||
| Term Loan, 3.62%, Maturing May 1, 2018 | 2,572 | 2,487,739 | ||||||||||
Health Management Associates, Inc. | ||||||||||||
| Term Loan, 2.12%, Maturing February 28, 2014 | 6,981 | 6,858,844 | ||||||||||
Iasis Healthcare, LLC | ||||||||||||
| Term Loan, 5.00%, Maturing May 3, 2018 | 1,667 | 1,633,293 | ||||||||||
Immucor, Inc. | ||||||||||||
| Term Loan, 7.25%, Maturing August 17, 2018 | 700 | 705,250 | ||||||||||
inVentiv Health, Inc. | ||||||||||||
| Term Loan, 6.50%, Maturing August 4, 2016 | 1,884 | 1,841,246 | ||||||||||
| Term Loan, 6.75%, Maturing May 15, 2018 | 1,172 | 1,163,272 | ||||||||||
Kindred Healthcare, Inc. | ||||||||||||
| Term Loan, 5.25%, Maturing June 1, 2018 | 1,820 | 1,702,109 | ||||||||||
Kinetic Concepts, Inc. | ||||||||||||
Term Loan, Maturing November 2, 2018(2) | 4,025 | 4,041,036 | ||||||||||
Lifepoint Hospitals, Inc. | ||||||||||||
| Term Loan, 3.08%, Maturing April 15, 2015 | 2,022 | 1,997,000 | ||||||||||
MedAssets, Inc. | ||||||||||||
| Term Loan, 5.25%, Maturing November 16, 2016 | 845 | 840,473 | ||||||||||
Medpace, Inc. | ||||||||||||
| Term Loan, 6.50%, Maturing June 16, 2017 | 873 | 833,536 | ||||||||||
MultiPlan, Inc. | ||||||||||||
| Term Loan, 4.75%, Maturing August 26, 2017 | 3,520 | 3,415,896 | ||||||||||
Physiotherapy Associates, Inc. | ||||||||||||
| Term Loan, 7.50%, Maturing June 27, 2013 | 643 | 639,713 | ||||||||||
Prime Healthcare Services, Inc. | ||||||||||||
| Term Loan, 7.25%, Maturing April 22, 2015 | 2,290 | 2,181,344 | ||||||||||
RadNet Management, Inc. | ||||||||||||
| Term Loan, 5.75%, Maturing April 1, 2016 | 1,084 | 1,040,160 | ||||||||||
Renal Advantage Holdings, Inc. | ||||||||||||
| Term Loan, 5.75%, Maturing December 16, 2016 | 720 | 720,462 | ||||||||||
Select Medical Corp. | ||||||||||||
| Term Loan, 5.50%, Maturing May 25, 2018 | 3,017 | 2,806,217 | ||||||||||
Sunrise Medical Holdings, Inc. | ||||||||||||
| Term Loan, 7.25%, Maturing May 13, 2014 | EUR | 237 | 303,862 | |||||||||
TriZetto Group, Inc. (The) | ||||||||||||
| Term Loan, 4.75%, Maturing May 2, 2018 | 1,471 | 1,450,162 | ||||||||||
Universal Health Services, Inc. | ||||||||||||
| Term Loan, 4.00%, Maturing November 15, 2016 | 2,103 | 2,093,205 | ||||||||||
Vanguard Health Holding Co., II, LLC | ||||||||||||
| Term Loan, 5.00%, Maturing January 29, 2016 | 1,576 | 1,566,956 | ||||||||||
VWR Funding, Inc. | ||||||||||||
| Term Loan, 2.75%, Maturing June 30, 2014 | 2,222 | 2,145,202 | ||||||||||
| $ | 90,758,451 | |||||||||||
| Home Furnishings — 0.8% | ||||||||||||
Hunter Fan Co. | ||||||||||||
| Term Loan, 2.75%, Maturing April 16, 2014 | 326 | $ | 299,763 | |||||||||
National Bedding Co., LLC | ||||||||||||
| Term Loan, 3.88%, Maturing November 28, 2013 | 1,437 | 1,424,163 | ||||||||||
| Term Loan - Second Lien, 5.31%, Maturing February 28, 2014 | 2,050 | 1,988,500 | ||||||||||
Yankee Candle Company, Inc. (The) | ||||||||||||
| Term Loan, 2.25%, Maturing February 6, 2014 | 520 | 510,354 | ||||||||||
| $ | 4,222,780 | |||||||||||
| Industrial Equipment — 2.2% | ||||||||||||
Butterfly Wendel US, Inc. | ||||||||||||
| Term Loan, 3.44%, Maturing June 23, 2014 | 277 | $ | 259,110 | |||||||||
| Term Loan, 4.19%, Maturing June 22, 2015 | 277 | 259,027 | ||||||||||
Excelitas Technologies Corp. | ||||||||||||
| Term Loan, 4.75%, Maturing November 23, 2016 | 990 | 990,000 | ||||||||||
Generac CCMP Acquisition Corp. | ||||||||||||
| Term Loan, 2.78%, Maturing November 11, 2013 | 1,211 | 1,176,107 | ||||||||||
Husky Injection Molding Systems, Ltd. | ||||||||||||
| Term Loan, 6.50%, Maturing June 30, 2018 | 1,498 | 1,498,125 | ||||||||||
See Notes to Financial Statements.
13
Eaton Vance
Senior Floating-Rate Trust
October 31, 2011
Portfolio of Investments — continued
| Principal | ||||||||||||
| Amount* | ||||||||||||
| Borrower/Tranche Description | (000’s omitted) | Value | ||||||||||
| Industrial Equipment (continued) | ||||||||||||
KION Group GmbH | ||||||||||||
Term Loan, 3.75%, Maturing December 23, 2014(7) | 1,028 | $ | 856,354 | |||||||||
Term Loan, 4.00%, Maturing December 23, 2015(7) | 1,028 | 856,354 | ||||||||||
Manitowoc Company, Inc. (The) | ||||||||||||
| Term Loan, 4.25%, Maturing November 13, 2017 | 673 | 663,213 | ||||||||||
Polypore, Inc. | ||||||||||||
| Term Loan, 2.25%, Maturing July 3, 2014 | 3,784 | 3,722,657 | ||||||||||
Terex Corp. | ||||||||||||
| Term Loan, 5.50%, Maturing April 28, 2017 | 700 | 701,094 | ||||||||||
| $ | 10,982,041 | |||||||||||
| Insurance — 4.1% | ||||||||||||
Alliant Holdings I, Inc. | ||||||||||||
| Term Loan, 3.37%, Maturing August 21, 2014 | 2,384 | $ | 2,371,638 | |||||||||
Applied Systems, Inc. | ||||||||||||
| Term Loan, 5.50%, Maturing December 8, 2016 | 1,390 | 1,361,710 | ||||||||||
Asurion Corp. | ||||||||||||
| Term Loan, 5.50%, Maturing May 24, 2018 | 5,583 | 5,527,575 | ||||||||||
| Term Loan - Second Lien, 9.00%, Maturing May 24, 2019 | 1,100 | 1,084,875 | ||||||||||
C.G. JCF Corp. | ||||||||||||
| Term Loan, 3.25%, Maturing August 1, 2014 | 518 | 503,513 | ||||||||||
CCC Information Services Group, Inc. | ||||||||||||
| Term Loan, 5.50%, Maturing November 11, 2015 | 1,418 | 1,419,647 | ||||||||||
CNO Financial Group, Inc. | ||||||||||||
| Term Loan, 6.25%, Maturing September 30, 2016 | 1,041 | 1,049,194 | ||||||||||
HUB International Holdings, Inc. | ||||||||||||
| Term Loan, 2.87%, Maturing June 13, 2014 | 487 | 476,702 | ||||||||||
| Term Loan, 2.87%, Maturing June 13, 2014 | 2,166 | 2,121,173 | ||||||||||
| Term Loan, 6.75%, Maturing June 13, 2014 | 564 | 564,909 | ||||||||||
Towergate Finance, PLC | ||||||||||||
| Term Loan, 6.50%, Maturing August 4, 2017 | GBP | 1,000 | 1,489,989 | |||||||||
U.S.I. Holdings Corp. | ||||||||||||
| Term Loan, 2.75%, Maturing May 5, 2014 | 2,975 | 2,832,282 | ||||||||||
| $ | 20,803,207 | |||||||||||
| Leisure Goods / Activities / Movies — 8.0% | ||||||||||||
Alpha D2, Ltd. | ||||||||||||
| Term Loan, 2.53%, Maturing December 31, 2013 | 864 | $ | 828,371 | |||||||||
| Term Loan, 2.53%, Maturing December 31, 2013 | 1,582 | 1,515,981 | ||||||||||
| Term Loan - Second Lien, 3.90%, Maturing June 30, 2014 | 2,000 | 1,865,714 | ||||||||||
AMC Entertainment, Inc. | ||||||||||||
| Term Loan, 3.49%, Maturing December 16, 2016 | 3,708 | 3,667,896 | ||||||||||
AMC Networks, Inc. | ||||||||||||
| Term Loan, 4.00%, Maturing December 31, 2018 | 1,347 | 1,335,404 | ||||||||||
Bombardier Recreational Products | ||||||||||||
| Term Loan, 2.90%, Maturing June 28, 2013 | 2,810 | 2,733,096 | ||||||||||
Bright Horizons Family Solutions, Inc. | ||||||||||||
| Term Loan, 4.25%, Maturing May 28, 2015 | 913 | 890,586 | ||||||||||
Carmike Cinemas, Inc. | ||||||||||||
| Term Loan, 5.50%, Maturing January 27, 2016 | 722 | 718,842 | ||||||||||
Cedar Fair, L.P. | ||||||||||||
| Term Loan, 4.00%, Maturing December 15, 2017 | 1,930 | 1,934,402 | ||||||||||
Cinemark USA, Inc. | ||||||||||||
| Term Loan, 3.52%, Maturing April 29, 2016 | 3,434 | 3,419,350 | ||||||||||
Clubcorp Operations, Inc. | ||||||||||||
| Term Loan, 6.00%, Maturing November 9, 2016 | 1,645 | 1,641,012 | ||||||||||
Dave & Buster’s, Inc. | ||||||||||||
| Term Loan, 5.50%, Maturing May 12, 2016 | 985 | 976,381 | ||||||||||
Deluxe Entertainment Services Group, Inc. | ||||||||||||
| Term Loan, 6.25%, Maturing May 11, 2013 | 59 | 58,169 | ||||||||||
| Term Loan, 6.25%, Maturing May 11, 2013 | 839 | 826,004 | ||||||||||
Fender Musical Instruments Corp. | ||||||||||||
| Term Loan, 2.50%, Maturing June 9, 2014 | 286 | 266,728 | ||||||||||
| Term Loan, 2.50%, Maturing June 9, 2014 | 563 | 525,294 | ||||||||||
Live Nation Entertainment, Inc. | ||||||||||||
| Term Loan, 4.50%, Maturing November 7, 2016 | 2,266 | 2,262,668 | ||||||||||
Regal Cinemas Corp. | ||||||||||||
| Term Loan, 3.37%, Maturing August 23, 2017 | 4,367 | 4,319,509 | ||||||||||
Revolution Studios Distribution Co., LLC | ||||||||||||
| Term Loan, 4.03%, Maturing December 21, 2014 | 927 | 681,511 | ||||||||||
Term Loan - Second Lien, 7.25%, Maturing June 21, 2015(5) | 800 | 247,520 | ||||||||||
SeaWorld Parks & Entertainment, Inc. | ||||||||||||
| Term Loan, 4.00%, Maturing August 17, 2017 | 1,745 | 1,736,751 | ||||||||||
Six Flags Theme Parks, Inc. | ||||||||||||
| Term Loan, 5.25%, Maturing June 30, 2016 | 3,141 | 3,150,399 | ||||||||||
Town Sports International, Inc. | ||||||||||||
| Term Loan, 7.00%, Maturing May 4, 2018 | 1,010 | 1,002,053 | ||||||||||
Zuffa, LLC | ||||||||||||
| Term Loan, 2.25%, Maturing June 19, 2015 | 3,902 | 3,745,906 | ||||||||||
| $ | 40,349,547 | |||||||||||
| Lodging and Casinos — 3.3% | ||||||||||||
Ameristar Casinos, Inc. | ||||||||||||
| Term Loan, 4.00%, Maturing April 13, 2018 | 1,045 | 1,045,186 | ||||||||||
See Notes to Financial Statements.
14
Eaton Vance
Senior Floating-Rate Trust
October 31, 2011
Portfolio of Investments — continued
| Principal | ||||||||||||
| Amount* | ||||||||||||
| Borrower/Tranche Description | (000’s omitted) | Value | ||||||||||
| Lodging and Casinos (continued) | ||||||||||||
Caesars Entertainment Operating Co. | ||||||||||||
| Term Loan, 3.36%, Maturing January 28, 2015 | 1,223 | $ | 1,080,388 | |||||||||
| Term Loan, 3.42%, Maturing January 28, 2015 | 748 | 662,087 | ||||||||||
| Term Loan, 3.42%, Maturing January 28, 2015 | 1,500 | 1,328,840 | ||||||||||
| Term Loan, 9.50%, Maturing October 31, 2016 | 2,948 | 2,989,870 | ||||||||||
Gala Group, Ltd. | ||||||||||||
| Term Loan, 5.71%, Maturing May 30, 2018 | GBP | 1,625 | 2,219,823 | |||||||||
Isle of Capri Casinos, Inc. | ||||||||||||
| Term Loan, 4.75%, Maturing November 1, 2013 | 920 | 923,826 | ||||||||||
Las Vegas Sands, LLC | ||||||||||||
| Term Loan, 2.84%, Maturing November 23, 2016 | 549 | 531,528 | ||||||||||
| Term Loan, 2.84%, Maturing November 23, 2016 | 2,175 | 2,105,776 | ||||||||||
LodgeNet Entertainment Corp. | ||||||||||||
| Term Loan, 6.50%, Maturing April 4, 2014 | 1,444 | 1,263,613 | ||||||||||
Penn National Gaming, Inc. | ||||||||||||
| Term Loan, 3.75%, Maturing July 16, 2018 | 1,147 | 1,151,965 | ||||||||||
Tropicana Entertainment, Inc. | ||||||||||||
| Term Loan, 15.00%, Maturing March 8, 2013 | 182 | 199,850 | ||||||||||
VML US Finance, LLC | ||||||||||||
| Term Loan, 4.75%, Maturing May 27, 2013 | 967 | 963,113 | ||||||||||
| $ | 16,465,865 | |||||||||||
| Nonferrous Metals / Minerals — 1.6% | ||||||||||||
Fairmount Minerals, Ltd. | ||||||||||||
| Term Loan, 5.25%, Maturing March 15, 2017 | 2,790 | $ | 2,783,025 | |||||||||
Noranda Aluminum Acquisition | ||||||||||||
| Term Loan, 2.00%, Maturing May 16, 2014 | 499 | 483,737 | ||||||||||
Novelis, Inc. | ||||||||||||
| Term Loan, 3.75%, Maturing March 10, 2017 | 2,035 | 2,027,312 | ||||||||||
Oxbow Carbon and Mineral Holdings | ||||||||||||
| Term Loan, 3.86%, Maturing May 8, 2016 | 2,658 | 2,567,872 | ||||||||||
| $ | 7,861,946 | |||||||||||
| Oil and Gas — 3.0% | ||||||||||||
Big West Oil, LLC | ||||||||||||
| Term Loan, 7.00%, Maturing March 31, 2016 | 369 | $ | 373,470 | |||||||||
Buffalo Gulf Coast Terminals, LLC | ||||||||||||
Term Loan, Maturing October 31, 2017(2) | 550 | 556,875 | ||||||||||
CITGO Petroleum Corp. | ||||||||||||
| Term Loan, 8.00%, Maturing June 24, 2015 | 210 | 210,754 | ||||||||||
| Term Loan, 9.00%, Maturing June 23, 2017 | 2,543 | 2,596,212 | ||||||||||
Crestwood Holdings, LLC | ||||||||||||
| Term Loan, 10.50%, Maturing September 30, 2016 | 447 | 454,582 | ||||||||||
Frac Tech International, LLC | ||||||||||||
| Term Loan, 6.25%, Maturing May 6, 2016 | 2,095 | 2,086,814 | ||||||||||
Gibson Energy | ||||||||||||
| Term Loan, 5.75%, Maturing June 14, 2018 | 2,070 | 2,074,987 | ||||||||||
MEG Energy Corp. | ||||||||||||
| Term Loan, 4.00%, Maturing March 16, 2018 | 1,225 | 1,224,873 | ||||||||||
Obsidian Natural Gas Trust | ||||||||||||
| Term Loan, 7.00%, Maturing November 2, 2015 | 3,707 | 3,725,669 | ||||||||||
Sheridan Production Partners I, LLC | ||||||||||||
| Term Loan, 6.50%, Maturing April 20, 2017 | 106 | 106,707 | ||||||||||
| Term Loan, 6.50%, Maturing April 20, 2017 | 174 | 174,699 | ||||||||||
| Term Loan, 6.50%, Maturing April 20, 2017 | 1,316 | 1,318,399 | ||||||||||
| $ | 14,904,041 | |||||||||||
| Publishing — 6.3% | ||||||||||||
Ascend Learning | ||||||||||||
| Term Loan, 7.01%, Maturing December 6, 2016 | 1,092 | $ | 1,063,548 | |||||||||
Aster Zweite Beteiligungs GmbH | ||||||||||||
| Term Loan, 4.80%, Maturing December 31, 2014 | 1,699 | 1,514,250 | ||||||||||
| Term Loan, 4.80%, Maturing December 30, 2016 | 1,509 | 1,344,949 | ||||||||||
| Term Loan, 4.80%, Maturing December 30, 2016 | 1,775 | 1,581,525 | ||||||||||
Cengage Learning Acquisitions, Inc. | ||||||||||||
| Term Loan, 2.50%, Maturing July 3, 2014 | 992 | 856,125 | ||||||||||
GateHouse Media Operating, Inc. | ||||||||||||
| Term Loan, 2.25%, Maturing August 28, 2014 | 862 | 212,553 | ||||||||||
| Term Loan, 2.25%, Maturing August 28, 2014 | 2,054 | 506,735 | ||||||||||
| Term Loan, 2.50%, Maturing August 28, 2014 | 667 | 164,583 | ||||||||||
Getty Images, Inc. | ||||||||||||
| Term Loan, 5.25%, Maturing November 7, 2016 | 3,432 | 3,446,714 | ||||||||||
Instant Web, Inc. | ||||||||||||
| Term Loan, 3.62%, Maturing August 7, 2014 | 166 | 157,950 | ||||||||||
| Term Loan, 3.62%, Maturing August 7, 2014 | 1,595 | 1,515,231 | ||||||||||
Interactive Data Corp. | ||||||||||||
| Term Loan, 4.50%, Maturing February 12, 2018 | 2,256 | 2,242,891 | ||||||||||
Lamar Media Corp. | ||||||||||||
| Term Loan, 4.00%, Maturing December 30, 2016 | 631 | 632,053 | ||||||||||
Laureate Education, Inc. | ||||||||||||
| Term Loan, 5.25%, Maturing August 15, 2018 | 4,840 | 4,543,625 | ||||||||||
MediaNews Group, Inc. | ||||||||||||
| Term Loan, 8.50%, Maturing March 19, 2014 | 112 | 107,765 | ||||||||||
Merrill Communications, LLC | ||||||||||||
| Term Loan, 7.50%, Maturing December 24, 2012 | 1,225 | 1,182,423 | ||||||||||
Nelson Education, Ltd. | ||||||||||||
| Term Loan, 2.87%, Maturing July 3, 2014 | 462 | 372,076 | ||||||||||
See Notes to Financial Statements.
15
Eaton Vance
Senior Floating-Rate Trust
October 31, 2011
Portfolio of Investments — continued
| Principal | ||||||||||||
| Amount* | ||||||||||||
| Borrower/Tranche Description | (000’s omitted) | Value | ||||||||||
| Publishing (continued) | ||||||||||||
Nielsen Finance, LLC | ||||||||||||
| Term Loan, 2.24%, Maturing August 9, 2013 | 5,264 | $ | 5,244,480 | |||||||||
| Term Loan, 3.99%, Maturing May 2, 2016 | 1,963 | 1,957,700 | ||||||||||
SGS International, Inc. | ||||||||||||
| Term Loan, 3.75%, Maturing September 30, 2013 | 457 | 452,454 | ||||||||||
Source Interlink Companies, Inc. | ||||||||||||
| Term Loan, 10.75%, Maturing June 18, 2013 | 895 | 861,776 | ||||||||||
Term Loan, 15.00%, Maturing March 18, 2014(7) | 644 | 595,998 | ||||||||||
Springer Science+Business Media S.A. | ||||||||||||
| Term Loan, 4.25%, Maturing June 17, 2016 | 1,000 | 964,375 | ||||||||||
| $ | 31,521,779 | |||||||||||
| Radio and Television — 4.0% | ||||||||||||
Block Communications, Inc. | ||||||||||||
| Term Loan, 2.25%, Maturing December 21, 2012 | 801 | $ | 801,125 | |||||||||
Clear Channel Communication | ||||||||||||
| Term Loan, 3.90%, Maturing January 28, 2016 | 1,500 | 1,188,984 | ||||||||||
Cumulus Media, Inc. | ||||||||||||
| Term Loan, 5.75%, Maturing September 17, 2018 | 4,675 | 4,628,250 | ||||||||||
Foxco Acquisition Sub, LLC | ||||||||||||
| Term Loan, 4.75%, Maturing July 14, 2015 | 549 | 535,260 | ||||||||||
Gray Television, Inc. | ||||||||||||
| Term Loan, 3.74%, Maturing December 31, 2014 | 633 | 621,058 | ||||||||||
HIT Entertainment, Inc. | ||||||||||||
| Term Loan, 5.51%, Maturing June 1, 2012 | 739 | 733,039 | ||||||||||
Hubbard Radio, LLC | ||||||||||||
| Term Loan, 5.25%, Maturing April 28, 2017 | 998 | 990,019 | ||||||||||
Miramax Film NY, LLC | ||||||||||||
| Term Loan, 7.75%, Maturing May 20, 2016 | 838 | 838,462 | ||||||||||
Mission Broadcasting, Inc. | ||||||||||||
| Term Loan, 5.00%, Maturing September 30, 2016 | 520 | 517,319 | ||||||||||
Nexstar Broadcasting, Inc. | ||||||||||||
| Term Loan, 5.00%, Maturing September 30, 2016 | 813 | 809,154 | ||||||||||
Raycom TV Broadcasting, LLC | ||||||||||||
| Term Loan, 4.50%, Maturing May 31, 2017 | 873 | 829,172 | ||||||||||
Univision Communications, Inc. | ||||||||||||
| Term Loan, 2.25%, Maturing September 29, 2014 | 3,336 | 3,220,628 | ||||||||||
| Term Loan, 4.50%, Maturing March 31, 2017 | 3,336 | 3,032,717 | ||||||||||
Weather Channel | ||||||||||||
| Term Loan, 4.25%, Maturing February 13, 2017 | 1,134 | 1,139,263 | ||||||||||
| $ | 19,884,450 | |||||||||||
| Retailers (Except Food and Drug) — 4.6% | ||||||||||||
Amscan Holdings, Inc. | ||||||||||||
| Term Loan, 6.75%, Maturing December 4, 2017 | 3,010 | $ | 2,969,308 | |||||||||
BJ’s Wholesale Club, Inc. | ||||||||||||
| Term Loan, 7.00%, Maturing September 27, 2018 | 1,925 | 1,925,803 | ||||||||||
FTD, Inc. | ||||||||||||
| Term Loan, 4.75%, Maturing June 6, 2018 | 1,272 | 1,247,966 | ||||||||||
Harbor Freight Tools USA, Inc. | ||||||||||||
| Term Loan, 6.50%, Maturing December 22, 2017 | 1,773 | 1,765,899 | ||||||||||
J. Crew Operating Corp. | ||||||||||||
| Term Loan, 4.75%, Maturing March 7, 2018 | 1,592 | 1,497,674 | ||||||||||
Jo-Ann Stores, Inc. | ||||||||||||
| Term Loan, 4.75%, Maturing March 16, 2018 | 1,997 | 1,927,581 | ||||||||||
Michaels Stores, Inc. | ||||||||||||
| Term Loan, 2.66%, Maturing October 31, 2013 | 926 | 909,894 | ||||||||||
Neiman Marcus Group, Inc. | ||||||||||||
| Term Loan, 4.75%, Maturing May 16, 2018 | 3,050 | 2,968,031 | ||||||||||
PETCO Animal Supplies, Inc. | ||||||||||||
| Term Loan, 4.50%, Maturing November 24, 2017 | 1,238 | 1,229,766 | ||||||||||
Pilot Travel Centers, LLC | ||||||||||||
| Term Loan, 4.25%, Maturing March 30, 2018 | 1,777 | 1,780,513 | ||||||||||
Savers, Inc. | ||||||||||||
| Term Loan, 4.25%, Maturing March 3, 2017 | 1,194 | 1,188,776 | ||||||||||
Service Master Co. | ||||||||||||
| Term Loan, 2.75%, Maturing July 24, 2014 | 134 | 128,955 | ||||||||||
| Term Loan, 2.76%, Maturing July 24, 2014 | 1,350 | 1,294,925 | ||||||||||
Visant Holding Corp. | ||||||||||||
| Term Loan, 5.25%, Maturing December 22, 2016 | 1,390 | 1,321,762 | ||||||||||
Vivarte | ||||||||||||
| Term Loan, 3.23%, Maturing March 9, 2015 | EUR | 29 | 33,225 | |||||||||
| Term Loan, 3.23%, Maturing March 9, 2015 | EUR | 62 | 72,644 | |||||||||
| Term Loan, 3.23%, Maturing March 9, 2015 | EUR | 347 | 403,763 | |||||||||
| Term Loan, 3.85%, Maturing March 8, 2016 | EUR | 441 | 512,447 | |||||||||
| Term Loan, 3.85%, Maturing May 29, 2016 | EUR | 18 | 21,399 | |||||||||
| Term Loan, 3.85%, Maturing May 29, 2016 | EUR | 71 | 82,780 | |||||||||
| $ | 23,283,111 | |||||||||||
| Steel — 0.5% | ||||||||||||
JMC Steel Group, Inc. | ||||||||||||
| Term Loan, 4.75%, Maturing April 3, 2017 | 697 | $ | 693,018 | |||||||||
Niagara Corp. | ||||||||||||
Term Loan, 10.50%, Maturing June 29, 2014(5)(7) | 1,361 | 1,333,306 | ||||||||||
SunCoke Energy, Inc. | ||||||||||||
| Term Loan, 4.01%, Maturing July 26, 2018 | 499 | 498,750 | ||||||||||
| $ | 2,525,074 | |||||||||||
See Notes to Financial Statements.
16
Eaton Vance
Senior Floating-Rate Trust
October 31, 2011
Portfolio of Investments — continued
| Principal | ||||||||||||
| Amount* | ||||||||||||
| Borrower/Tranche Description | (000’s omitted) | Value | ||||||||||
| Surface Transport — 1.1% | ||||||||||||
Hertz Corp. | ||||||||||||
| Term Loan, 3.75%, Maturing March 9, 2018 | 3,507 | $ | 3,486,082 | |||||||||
Swift Transportation Co., Inc. | ||||||||||||
| Term Loan, 6.00%, Maturing December 21, 2016 | 2,096 | 2,103,030 | ||||||||||
| $ | 5,589,112 | |||||||||||
| Telecommunications — 4.7% | ||||||||||||
Alaska Communications Systems Holdings, Inc. | ||||||||||||
| Term Loan, 5.50%, Maturing October 21, 2016 | 1,811 | $ | 1,781,879 | |||||||||
Cellular South, Inc. | ||||||||||||
| Term Loan, 4.50%, Maturing July 27, 2017 | 848 | 845,755 | ||||||||||
Intelsat Jackson Holdings SA | ||||||||||||
| Term Loan, 5.25%, Maturing April 2, 2018 | 10,298 | 10,269,291 | ||||||||||
Macquarie UK Broadcast, Ltd. | ||||||||||||
| Term Loan, 2.96%, Maturing December 1, 2014 | GBP | 755 | 1,032,592 | |||||||||
MetroPCS Wireless | ||||||||||||
| Term Loan, 4.00%, Maturing March 16, 2018 | 3,980 | 3,926,918 | ||||||||||
NTelos, Inc. | ||||||||||||
| Term Loan, 4.00%, Maturing August 7, 2015 | 912 | 904,563 | ||||||||||
SBA Finance | ||||||||||||
| Term Loan, 3.75%, Maturing June 29, 2018 | 948 | 942,295 | ||||||||||
Syniverse Technologies, Inc. | ||||||||||||
| Term Loan, 5.25%, Maturing December 21, 2017 | 995 | 998,097 | ||||||||||
Telesat Canada, Inc. | ||||||||||||
| Term Loan, 3.25%, Maturing October 31, 2014 | 156 | 154,034 | ||||||||||
| Term Loan, 3.25%, Maturing October 31, 2014 | 1,818 | 1,793,200 | ||||||||||
TowerCo Finance, LLC | ||||||||||||
| Term Loan, 5.25%, Maturing February 2, 2017 | 672 | 671,625 | ||||||||||
Windstream Corp. | ||||||||||||
| Term Loan, 3.12%, Maturing December 17, 2015 | 323 | 321,276 | ||||||||||
| $ | 23,641,525 | |||||||||||
| Utilities — 3.5% | ||||||||||||
AES Corp. | ||||||||||||
| Term Loan, 4.25%, Maturing June 1, 2018 | 2,587 | $ | 2,587,323 | |||||||||
BRSP, LLC | ||||||||||||
| Term Loan, 7.50%, Maturing June 4, 2014 | 962 | 966,568 | ||||||||||
Calpine Corp. | ||||||||||||
| Term Loan, 4.50%, Maturing April 2, 2018 | 948 | 940,518 | ||||||||||
| Term Loan, 4.50%, Maturing April 2, 2018 | 2,786 | 2,762,495 | ||||||||||
Dynegy Holdings, Inc. | ||||||||||||
| Term Loan, 9.25%, Maturing August 4, 2016 | 525 | 518,519 | ||||||||||
| Term Loan, 9.25%, Maturing August 4, 2016 | 950 | 952,375 | ||||||||||
EquiPower Resources Holdings, LLC | ||||||||||||
| Term Loan, 5.75%, Maturing January 26, 2018 | 530 | 530,011 | ||||||||||
NRG Energy, Inc. | ||||||||||||
| Term Loan, 4.00%, Maturing July 2, 2018 | 4,414 | 4,423,132 | ||||||||||
TXU Texas Competitive Electric Holdings Co., LLC | ||||||||||||
| Term Loan, 4.76%, Maturing October 10, 2017 | 5,832 | 3,989,056 | ||||||||||
| $ | 17,669,997 | |||||||||||
| Total Senior Floating-Rate Interests | ||||||||||||
| (identified cost $744,100,499) | $ | 729,153,940 | ||||||||||
| Corporate Bonds & Notes — 8.6% | ||||||||||||
| Principal | ||||||||||||
| Amount* | ||||||||||||
| Security | (000’s omitted) | Value | ||||||||||
| Automotive — 0.0%(8) | ||||||||||||
American Axle & Manufacturing Holdings, Inc., Sr. Notes | ||||||||||||
9.25%, 1/15/17(9) | 104 | $ | 113,880 | |||||||||
| $ | 113,880 | |||||||||||
| Broadcast Radio and Television — 0.1% | ||||||||||||
XM Satellite Radio Holdings, Inc. | ||||||||||||
13.00%, 8/1/14(9) | 485 | $ | 554,112 | |||||||||
| $ | 554,112 | |||||||||||
| Building and Development — 0.7% | ||||||||||||
AMO Escrow Corp., Sr. Notes | ||||||||||||
11.50%, 12/15/17(9) | 1,802 | $ | 1,630,810 | |||||||||
Grohe Holding GmbH, Variable Rate | ||||||||||||
4.447%, 1/15/14(10) | EUR | 1,575 | 2,081,258 | |||||||||
| $ | 3,712,068 | |||||||||||
| Business Equipment and Services — 0.3% | ||||||||||||
Brocade Communications Systems, Inc., Sr. Notes | ||||||||||||
| 6.625%, 1/15/18 | 30 | $ | 31,275 | |||||||||
| 6.875%, 1/15/20 | 30 | 31,575 | ||||||||||
RSC Equipment Rental, Inc., Sr. Notes | ||||||||||||
10.00%, 7/15/17(9) | 750 | 840,000 | ||||||||||
SunGard Data Systems, Inc., Sr. Notes | ||||||||||||
| 10.625%, 5/15/15 | 500 | 541,250 | ||||||||||
See Notes to Financial Statements.
17
Eaton Vance
Senior Floating-Rate Trust
October 31, 2011
Portfolio of Investments — continued
| Principal | ||||||||||||
| Amount* | ||||||||||||
| Security | (000’s omitted) | Value | ||||||||||
| Business Equipment and Services (continued) | ||||||||||||
Ticketmaster Entertainment, Inc. | ||||||||||||
| 10.75%, 8/1/16 | 40 | $ | 42,000 | |||||||||
| $ | 1,486,100 | |||||||||||
| Chemicals and Plastics — 0.2% | ||||||||||||
Styrolution Group GmbH, Sr. Notes | ||||||||||||
7.625%, 5/15/16(9) | EUR | 1,075 | $ | 1,182,545 | ||||||||
| $ | 1,182,545 | |||||||||||
| Conglomerates — 0.1% | ||||||||||||
Education Management, LLC, Sr. Notes | ||||||||||||
| 8.75%, 6/1/14 | 390 | $ | 388,050 | |||||||||
RBS Global & Rexnord Corp. | ||||||||||||
| 11.75%, 8/1/16 | 155 | 164,300 | ||||||||||
| $ | 552,350 | |||||||||||
| Containers and Glass Products — 0.4% | ||||||||||||
Berry Plastics Corp., Sr. Notes, Variable Rate | ||||||||||||
| 5.153%, 2/15/15 | 2,000 | $ | 1,985,000 | |||||||||
| $ | 1,985,000 | |||||||||||
| Cosmetics / Toiletries — 0.3% | ||||||||||||
Revlon Consumer Products Corp. | ||||||||||||
| 9.75%, 11/15/15 | 1,415 | $ | 1,524,662 | |||||||||
| $ | 1,524,662 | |||||||||||
| Ecological Services and Equipment — 0.1% | ||||||||||||
Environmental Systems Product Holdings, Inc., Jr. Notes | ||||||||||||
18.00%, 3/31/15(5) | 373 | $ | 314,905 | |||||||||
| $ | 314,905 | |||||||||||
| Electronics / Electrical — 0.1% | ||||||||||||
NXP BV/NXP Funding, LLC, Variable Rate | ||||||||||||
| 3.153%, 10/15/13 | 674 | $ | 663,047 | |||||||||
| $ | 663,047 | |||||||||||
| Equipment Leasing — 0.3% | ||||||||||||
International Lease Finance Corp., Sr. Notes | ||||||||||||
| 5.65%, 6/1/14 | 1,000 | $ | 965,000 | |||||||||
6.75%, 9/1/16(9) | 350 | 361,812 | ||||||||||
7.125%, 9/1/18(9) | 350 | 363,125 | ||||||||||
| $ | 1,689,937 | |||||||||||
| Financial Intermediaries — 1.1% | ||||||||||||
First Data Corp., Sr. Notes | ||||||||||||
7.375%, 6/15/19(9) | 1,000 | $ | 995,000 | |||||||||
Ford Motor Credit Co., LLC, Sr. Notes | ||||||||||||
| 12.00%, 5/15/15 | 2,250 | 2,843,350 | ||||||||||
| 8.00%, 12/15/16 | 175 | 202,755 | ||||||||||
UPCB Finance II, Ltd., Sr. Notes | ||||||||||||
6.375%, 7/1/20(9) | EUR | 1,000 | 1,300,678 | |||||||||
| $ | 5,341,783 | |||||||||||
| Food Service — 0.1% | ||||||||||||
NPC International, Inc., Sr. Sub. Notes | ||||||||||||
| 9.50%, 5/1/14 | 245 | $ | 250,513 | |||||||||
| $ | 250,513 | |||||||||||
| Forest Products — 0.0%(8) | ||||||||||||
Verso Paper Holdings, LLC/Verso Paper, Inc. | ||||||||||||
| 11.375%, 8/1/16 | 140 | $ | 104,300 | |||||||||
| $ | 104,300 | |||||||||||
| Health Care — 0.0%(8) | ||||||||||||
Accellent, Inc., Sr. Notes | ||||||||||||
| 8.375%, 2/1/17 | 135 | $ | 138,375 | |||||||||
| $ | 138,375 | |||||||||||
| Industrial Equipment — 0.2% | ||||||||||||
Terex Corp., Sr. Notes | ||||||||||||
| 10.875%, 6/1/16 | 1,000 | $ | 1,115,000 | |||||||||
| $ | 1,115,000 | |||||||||||
| Insurance — 0.0%(8) | ||||||||||||
Alliant Holdings I, Inc. | ||||||||||||
11.00%, 5/1/15(9) | 40 | $ | 41,450 | |||||||||
| $ | 41,450 | |||||||||||
| Leisure Goods / Activities / Movies — 0.1% | ||||||||||||
AMC Entertainment, Inc., Sr. Notes | ||||||||||||
| 8.75%, 6/1/19 | 110 | 116,875 | ||||||||||
See Notes to Financial Statements.
18
Eaton Vance
Senior Floating-Rate Trust
October 31, 2011
Portfolio of Investments — continued
| Principal | ||||||||||||
| Amount* | ||||||||||||
| Security | (000’s omitted) | Value | ||||||||||
| Leisure Goods / Activities / Movies (continued) | ||||||||||||
Royal Caribbean Cruises, Sr. Notes | ||||||||||||
| 7.00%, 6/15/13 | 95 | $ | 99,987 | |||||||||
| 6.875%, 12/1/13 | 35 | 36,663 | ||||||||||
| 7.25%, 6/15/16 | 25 | 26,625 | ||||||||||
| 7.25%, 3/15/18 | 50 | 52,250 | ||||||||||
| $ | 332,400 | |||||||||||
| Lodging and Casinos — 0.8% | ||||||||||||
Buffalo Thunder Development Authority | ||||||||||||
9.375%, 12/15/49(4)(9) | 480 | $ | 170,400 | |||||||||
CCM Merger, Inc. | ||||||||||||
8.00%, 8/1/13(9) | 50 | 47,750 | ||||||||||
Harrah’s Operating Co., Inc., Sr. Notes | ||||||||||||
| 11.25%, 6/1/17 | 1,500 | 1,612,500 | ||||||||||
Inn of the Mountain Gods Resort & Casino, Sr. Notes | ||||||||||||
1.25%, 11/30/20(7)(9) | 314 | 179,217 | ||||||||||
8.75%, 11/30/20(9) | 137 | 134,260 | ||||||||||
Mohegan Tribal Gaming Authority, Sr. Sub. Notes | ||||||||||||
| 8.00%, 4/1/12 | 140 | 94,850 | ||||||||||
| 7.125%, 8/15/14 | 215 | 115,025 | ||||||||||
| 6.875%, 2/15/15 | 230 | 116,725 | ||||||||||
Peninsula Gaming, LLC | ||||||||||||
| 10.75%, 8/15/17 | 1,000 | 1,035,000 | ||||||||||
Tunica-Biloxi Gaming Authority, Sr. Notes | ||||||||||||
9.00%, 11/15/15(9) | 310 | 310,000 | ||||||||||
Waterford Gaming, LLC, Sr. Notes | ||||||||||||
8.625%, 9/15/14(5)(9) | 210 | 120,814 | ||||||||||
| $ | 3,936,541 | |||||||||||
| Nonferrous Metals / Minerals — 0.3% | ||||||||||||
CII Carbon, LLC | ||||||||||||
11.125%, 11/15/15(9) | 185 | $ | 195,762 | |||||||||
Cloud Peak Energy Resources, LLC/Cloud Peak Energy Finance Corp. | ||||||||||||
8.25%, 12/15/17(9) | 1,000 | 1,075,000 | ||||||||||
| 8.50%, 12/15/19 | 335 | 360,125 | ||||||||||
| $ | 1,630,887 | |||||||||||
| Oil and Gas — 0.1% | ||||||||||||
Petroleum Development Corp., Sr. Notes | ||||||||||||
| 12.00%, 2/15/18 | 115 | $ | 125,350 | |||||||||
Petroplus Finance, Ltd. | ||||||||||||
7.00%, 5/1/17(9) | 145 | 110,925 | ||||||||||
Quicksilver Resources, Inc., Sr. Notes | ||||||||||||
| 11.75%, 1/1/16 | 125 | 141,875 | ||||||||||
SESI, LLC, Sr. Notes | ||||||||||||
| 6.875%, 6/1/14 | 60 | 60,300 | ||||||||||
| $ | 438,450 | |||||||||||
| Publishing — 0.2% | ||||||||||||
Laureate Education, Inc. | ||||||||||||
10.00%, 8/15/15(9) | 1,000 | $ | 1,010,000 | |||||||||
| $ | 1,010,000 | |||||||||||
| Radio and Television — 0.2% | ||||||||||||
Entravision Communications Corp., Sr. Notes | ||||||||||||
8.75%, 8/1/17(9) | 1,000 | $ | 997,500 | |||||||||
| $ | 997,500 | |||||||||||
| Rail Industries — 0.2% | ||||||||||||
American Railcar Industry, Sr. Notes | ||||||||||||
| 7.50%, 3/1/14 | 175 | $ | 176,750 | |||||||||
Kansas City Southern Mexico, Sr. Notes | ||||||||||||
| 8.00%, 2/1/18 | 500 | 560,000 | ||||||||||
| $ | 736,750 | |||||||||||
| Retailers (Except Food and Drug) — 0.4% | ||||||||||||
Amscan Holdings, Inc., Sr. Sub. Notes | ||||||||||||
| 8.75%, 5/1/14 | 400 | $ | 404,000 | |||||||||
Sally Holdings, LLC, Sr. Notes | ||||||||||||
| 9.25%, 11/15/14 | 665 | 685,781 | ||||||||||
| 10.50%, 11/15/16 | 20 | 21,175 | ||||||||||
Toys ‘‘R” Us | ||||||||||||
| 10.75%, 7/15/17 | 1,000 | 1,115,000 | ||||||||||
| $ | 2,225,956 | |||||||||||
| Steel — 0.0%(8) | ||||||||||||
RathGibson, Inc., Sr. Notes | ||||||||||||
11.25%, 2/15/14(4)(5) | 445 | $ | 45 | |||||||||
| $ | 45 | |||||||||||
| Surface Transport — 0.0%(8) | ||||||||||||
CEVA Group PLC, Sr. Notes | ||||||||||||
11.50%, 4/1/18(9) | 165 | $ | 149,738 | |||||||||
| $ | 149,738 | |||||||||||
See Notes to Financial Statements.
19
Eaton Vance
Senior Floating-Rate Trust
October 31, 2011
Portfolio of Investments — continued
| Principal | ||||||||||||
| Amount* | ||||||||||||
| Security | (000’s omitted) | Value | ||||||||||
| Telecommunications — 0.5% | ||||||||||||
Avaya, Inc., Sr. Notes | ||||||||||||
| 9.75%, 11/1/15 | 840 | $ | 747,600 | |||||||||
EH Holding Corp., Sr. Notes | ||||||||||||
6.50%, 6/15/19(9) | 1,000 | 1,027,500 | ||||||||||
Intelsat Bermuda, Ltd. | ||||||||||||
| 11.25%, 6/15/16 | 210 | 222,075 | ||||||||||
Telesat Canada/Telesat, LLC, Sr. Notes | ||||||||||||
| 11.00%, 11/1/15 | 405 | 442,462 | ||||||||||
| $ | 2,439,637 | |||||||||||
| Utilities — 1.8% | ||||||||||||
Calpine Corp., Sr. Notes | ||||||||||||
7.50%, 2/15/21(9) | 4,725 | $ | 4,984,875 | |||||||||
7.875%, 1/15/23(9) | 3,350 | 3,551,000 | ||||||||||
Dynegy Holdings, LLC | ||||||||||||
| 7.625%, 10/15/26 | 390 | 235,950 | ||||||||||
Reliant Energy, Inc., Sr. Notes | ||||||||||||
| 7.625%, 6/15/14 | 20 | 20,500 | ||||||||||
| $ | 8,792,325 | |||||||||||
| Total Corporate Bonds & Notes | ||||||||||||
| (identified cost $43,380,012) | $ | 43,460,256 | ||||||||||
| Asset-Backed Securities — 1.3% | ||||||||||||
| Principal | ||||||||||||
| Amount | ||||||||||||
| Security | (000’s omitted) | Value | ||||||||||
Alzette European CLO SA, Series 2004-1A, Class E2, 6.874%, 12/15/20(11) | $ | 400 | $ | 317,527 | ||||||||
Avalon Capital Ltd. 3, Series 1A, Class D, 2.258%, 2/24/19(9)(11) | 589 | 404,061 | ||||||||||
Babson Ltd., Series 2005-1A, Class C1, 2.353%, 4/15/19(9)(11) | 753 | 472,998 | ||||||||||
Carlyle High Yield Partners, Series 2004-6A, Class C, 2.728%, 8/11/16(9)(11) | 1,000 | 835,228 | ||||||||||
Centurion CDO 8 Ltd., Series 2005-8A, Class D, 5.836%, 3/8/17(11) | 985 | 696,908 | ||||||||||
Centurion CDO 9 Ltd., Series 2005-9A, Class D1, 5.153%, 7/17/19(11) | 750 | 491,281 | ||||||||||
Comstock Funding Ltd., Series 2006-1A, Class D, 4.569%, 5/30/20(9)(11) | 692 | 435,588 | ||||||||||
Dryden Leveraged Loan, Series 2004-6A, Class C1, 2.978%, 7/30/16(9)(11) | 1,500 | 1,500,000 | ||||||||||
First CLO Ltd., Series 2004-1A1, Class C, 2.722%, 7/27/16(9)(11) | 1,000 | 840,129 | ||||||||||
Schiller Park CLO Ltd., Series 2007-1A, Class D, 2.668%, 4/25/21(9)(11) | 1,000 | 631,911 | ||||||||||
| Total Asset-Backed Securities | ||||||||||||
| (identified cost $8,484,344) | $ | 6,625,631 | ||||||||||
| Common Stocks — 2.0% | ||||||||||||
| Security | Shares | Value | ||||||||||
| Air Transport — 0.0%(8) | ||||||||||||
Delta Air Lines, Inc.(12) | 3,971 | $ | 33,833 | |||||||||
| $ | 33,833 | |||||||||||
| Automotive — 0.6% | ||||||||||||
Dayco Products, LLC(12)(13) | 18,702 | $ | 764,444 | |||||||||
Hayes Lemmerz International, Inc.(5)(12)(13) | 44,747 | 2,349,218 | ||||||||||
| �� | $ | 3,113,662 | ||||||||||
| Building and Development — 0.1% | ||||||||||||
Panolam Holdings Co.(5)(12)(14) | 253 | $ | 216,072 | |||||||||
United Subcontractors, Inc.(5)(12)(13) | 508 | 29,710 | ||||||||||
| $ | 245,782 | |||||||||||
| Diversified Manufacturing — 0.0%(8) | ||||||||||||
MEGA Brands, Inc.(12) | 16,150 | $ | 133,023 | |||||||||
| $ | 133,023 | |||||||||||
| Ecological Services and Equipment — 0.1% | ||||||||||||
Environmental Systems Products Holdings, Inc.(5)(12)(14) | 6,211 | $ | 262,787 | |||||||||
| $ | 262,787 | |||||||||||
| Financial Intermediaries — 0.0%(8) | ||||||||||||
RTS Investor Corp.(5)(12)(13) | 78 | $ | 20,501 | |||||||||
| $ | 20,501 | |||||||||||
| Food Service — 0.0% | ||||||||||||
Buffets, Inc.(5)(12)(13) | 23,029 | $ | 0 | |||||||||
| $ | 0 | |||||||||||
| Leisure Goods / Activities / Movies — 0.2% | ||||||||||||
Metro-Goldwyn-Mayer Holdings, Inc.(12)(13) | 50,438 | $ | 911,036 | |||||||||
| $ | 911,036 | |||||||||||
See Notes to Financial Statements.
20
Eaton Vance
Senior Floating-Rate Trust
October 31, 2011
Portfolio of Investments — continued
| Security | Shares | Value | ||||||||||
| Lodging and Casinos — 0.1% | ||||||||||||
Greektown Superholdings, Inc.(12) | 71 | $ | 4,793 | |||||||||
Tropicana Entertainment, Inc.(12)(13) | 35,670 | 490,462 | ||||||||||
| $ | 495,255 | |||||||||||
| Nonferrous Metals / Minerals — 0.0%(8) | ||||||||||||
Euramax International, Inc.(12)(13) | 701 | $ | 198,966 | |||||||||
| $ | 198,966 | |||||||||||
| Oil and Gas — 0.0%(8) | ||||||||||||
SemGroup Corp.(12) | 1,397 | $ | 39,088 | |||||||||
| $ | 39,088 | |||||||||||
| Publishing — 0.7% | ||||||||||||
Ion Media Networks, Inc.(5)(12)(13) | 3,990 | $ | 3,192,000 | |||||||||
MediaNews Group, Inc.(5)(12)(13) | 10,718 | 212,108 | ||||||||||
Source Interlink Companies, Inc.(5)(12)(13) | 2,290 | 14,244 | ||||||||||
SuperMedia, Inc.(12) | 9,554 | 16,528 | ||||||||||
| $ | 3,434,880 | |||||||||||
| Steel — 0.2% | ||||||||||||
KNIA Holdings, Inc.(5)(12)(13) | 23,138 | $ | 512,044 | |||||||||
RathGibson Acquisition Co., LLC(5)(12)(14) | 19,800 | 611,820 | ||||||||||
| $ | 1,123,864 | |||||||||||
| Total Common Stocks | ||||||||||||
| (identified cost $4,502,446) | $ | 10,012,677 | ||||||||||
| Preferred Stocks — 0.0%(8) | ||||||||||||
| Security | Shares | Value | ||||||||||
| Ecological Services and Equipment — 0.0%(8) | ||||||||||||
Environmental Systems Products Holdings, Inc., Series A(5)(12)(14) | 1,422 | $ | 87,538 | |||||||||
| Total Preferred Stocks | ||||||||||||
| (identified cost $24,885) | $ | 87,538 | ||||||||||
| Warrants — 0.0%(8) | ||||||||||||
| Security | Shares | Value | ||||||||||
| Oil and Gas — 0.0%(8) | ||||||||||||
SemGroup Corp., Expires 11/30/14(12) | 1,470 | $ | 10,952 | |||||||||
| $ | 10,952 | |||||||||||
| Publishing — 0.0% | ||||||||||||
Reader’s Digest Association, Inc. (The), Expires 2/19/14(5)(12)(13) | 1,450 | $ | 0 | |||||||||
| $ | 0 | |||||||||||
| Retailers (Except Food and Drug) — 0.0% | ||||||||||||
Oriental Trading Co., Inc., Expires 2/11/16(5)(12)(13) | 6,134 | $ | 0 | |||||||||
Oriental Trading Co., Inc., Expires 2/11/16(5)(12)(13) | 6,730 | 0 | ||||||||||
| $ | 0 | |||||||||||
| Total Warrants | ||||||||||||
| (identified cost $15) | $ | 10,952 | ||||||||||
| Short-Term Investments — 2.2% | ||||||||||||
| Interest/ | ||||||||||||
| Principal | ||||||||||||
| Amount | ||||||||||||
| Description | (000’s omitted) | Value | ||||||||||
Eaton Vance Cash Reserves Fund, LLC, 0.12%(15) | $ | 8,817 | $ | 8,817,147 | ||||||||
| State Street Bank and Trust Euro Time Deposit, 0.01%, 11/1/11 | 2,383 | 2,383,102 | ||||||||||
| Total Short-Term Investments | ||||||||||||
| (identified cost $11,200,249) | $ | 11,200,249 | ||||||||||
| Total Investments — 159.0% | ||||||||||||
| (identified cost $811,692,450) | $ | 800,551,243 | ||||||||||
| Less Unfunded Loan Commitments — (0.1)% | $ | (362,561 | ) | |||||||||
| Net Investments — 158.9% | ||||||||||||
| (identified cost $811,329,889) | $ | 800,188,682 | ||||||||||
| Other Assets, Less Liabilities — (32.8)% | $ | (165,497,076 | ) | |||||||||
| Auction Preferred Shares Plus Cumulative Unpaid Dividends — (26.1)% | $ | (131,309,060 | ) | |||||||||
| Net Assets Applicable to Common Shares — 100.0% | $ | 503,382,546 | ||||||||||
The percentage shown for each investment category in the Portfolio of Investments is based on net assets applicable to common shares.
| EUR | - Euro | |
| GBP | - British Pound Sterling |
| * | In U.S. dollars unless otherwise indicated. | |
| (1) | Senior floating-rate interests (Senior Loans) often require prepayments from excess cash flows or permit the borrowers to repay at their election. The degree to which borrowers repay, whether as a contractual |
See Notes to Financial Statements.
21
Eaton Vance
Senior Floating-Rate Trust
October 31, 2011
Portfolio of Investments — continued
| requirement or at their election, cannot be predicted with accuracy. As a result, the actual remaining maturity may be substantially less than the stated maturities shown. However, Senior Loans will have an expected average life of approximately two to four years. The stated interest rate represents the weighted average interest rate of all contracts within the senior loan facility and includes commitment fees on unfunded loan commitments, if any. Senior Loans typically have rates of interest which are redetermined either daily, monthly, quarterly or semi-annually by reference to a base lending rate, plus a premium. These base lending rates are primarily the London Interbank Offered Rate (“LIBOR”) and secondarily, the prime rate offered by one or more major United States banks (the “Prime Rate”) and the certificate of deposit (“CD”) rate or other base lending rates used by commercial lenders. | ||
| (2) | This Senior Loan will settle after October 31, 2011, at which time the interest rate will be determined. | |
| (3) | Unfunded or partially unfunded loan commitments. See Note 1G for description. | |
| (4) | Currently the issuer is in default with respect to interest payments. For a variable rate security, interest rate has been adjusted to reflect non-accrual status. | |
| (5) | Security valued at fair value using methods determined in good faith by or at the direction of the Trustees. | |
| (6) | Defaulted matured security. For a variable rate security, interest rate has been adjusted to reflect non-accrual status. | |
| (7) | Represents a payment-in-kind security which may pay all or a portion of interest/dividends in additional par/shares. | |
| (8) | Amount is less than 0.05%. | |
| (9) | Security exempt from registration pursuant to Rule 144A under the Securities Act of 1933. These securities may be sold in certain transactions (normally to qualified institutional buyers) and remain exempt from registration. At October 31, 2011, the aggregate value of these securities is $26,568,068 or 5.3% of the Trust’s net assets applicable to common shares. | |
| (10) | Security exempt from registration under Regulation S of the Securities Act of 1933, which exempts from registration securities offered and sold outside the United States. Security may not be offered or sold in the United States except pursuant to an exemption from, or in a transaction not subject to, the registration requirements of the Securities Act of 1933. | |
| (11) | Variable rate security. The stated interest rate represents the rate in effect at October 31, 2011. | |
| (12) | Non-income producing security. | |
| (13) | Security was acquired in connection with a restructuring of a Senior Loan and may be subject to restrictions on resale. | |
| (14) | Restricted security (see Note 8). | |
| (15) | Affiliated investment company available to Eaton Vance portfolios and funds which invests in high quality, U.S. dollar denominated money market instruments. The rate shown is the annualized seven-day yield as of October 31, 2011. |
See Notes to Financial Statements.
22
Eaton Vance
Senior Floating-Rate Trust
October 31, 2011
Statement of Assets and Liabilities
| Assets | October 31, 2011 | |||||
| Unaffiliated investments, at value (identified cost, $802,512,742) | $ | 791,371,535 | ||||
| Affiliated investment, at value (identified cost, $8,817,147) | 8,817,147 | |||||
| Restricted cash* | 780,000 | |||||
| Foreign currency, at value (identified cost, $4,822,919) | 4,871,744 | |||||
| Interest and dividends receivable | 3,923,680 | |||||
| Interest receivable from affiliated investment | 847 | |||||
| Receivable for investments sold | 7,970,364 | |||||
| Receivable for open forward foreign currency exchange contracts | 879,001 | |||||
| Prepaid expenses | 26,878 | |||||
| Other assets | 10,281 | |||||
Total assets | $ | 818,651,477 | ||||
| Liabilities | ||||||
| Notes payable | $ | 165,000,000 | ||||
| Payable for investments purchased | 17,480,750 | |||||
| Payable for open forward foreign currency exchange contracts | 603,302 | |||||
| Payable to affiliates: | ||||||
| Investment adviser fee | 466,975 | |||||
| Trustees’ fees | 2,169 | |||||
| Accrued expenses | 406,675 | |||||
Total liabilities | $ | 183,959,871 | ||||
Auction preferred shares (5,252 shares outstanding) at liquidation value plus cumulative unpaid dividends | $ | 131,309,060 | ||||
Net assets applicable to common shares | $ | 503,382,546 | ||||
| Sources of Net Assets | ||||||
| Common shares, $0.01 par value, unlimited number of shares authorized, 33,767,691 shares issued and outstanding | $ | 337,677 | ||||
| Additional paid-in capital | 637,482,422 | |||||
| Accumulated net realized loss | (124,308,145 | ) | ||||
| Accumulated undistributed net investment income | 633,849 | |||||
| Net unrealized depreciation | (10,763,257 | ) | ||||
Net assets applicable to common shares | $ | 503,382,546 | ||||
| Net Asset Value Per Common Share | ||||||
($503,382,546 ¸ 33,767,691 common shares issued and outstanding) | $ | 14.91 | ||||
| * | Represents restricted cash on deposit at the custodian as collateral for open financial contracts. |
See Notes to Financial Statements.
23
Eaton Vance
Senior Floating-Rate Trust
October 31, 2011
Statement of Operations
| Year Ended | ||||||
| Investment Income | October 31, 2011 | |||||
| Interest and other income | $ | 43,082,995 | ||||
| Interest allocated from affiliated investment | 27,038 | |||||
| Expenses allocated from affiliated investment | (2,133 | ) | ||||
Total investment income | $ | 43,107,900 | ||||
| Expenses | ||||||
| Investment adviser fee | $ | 5,991,921 | ||||
| Trustees’ fees and expenses | 26,040 | |||||
| Custodian fee | 385,914 | |||||
| Transfer and dividend disbursing agent fees | 18,744 | |||||
| Legal and accounting services | 155,233 | |||||
| Printing and postage | 122,420 | |||||
| Interest expense and fees | 2,255,344 | |||||
| Preferred shares service fee | 199,914 | |||||
| Miscellaneous | 150,096 | |||||
Total expenses | $ | 9,305,626 | ||||
| Deduct — | ||||||
| Reduction of investment adviser fee | $ | 428,699 | ||||
| Reduction of custodian fee | 65 | |||||
Total expense reductions | $ | 428,764 | ||||
Net expenses | $ | 8,876,862 | ||||
Net investment income | $ | 34,231,038 | ||||
| Realized and Unrealized Gain (Loss) | ||||||
| Net realized gain (loss) — | ||||||
| Investment transactions | $ | (599,760 | ) | |||
| Investment transactions allocated from affiliated investment | 684 | |||||
| Foreign currency and forward foreign currency exchange contract transactions | (1,600,975 | ) | ||||
Net realized loss | $ | (2,200,051 | ) | |||
| Change in unrealized appreciation (depreciation) — | ||||||
| Investments | $ | 521,081 | ||||
| Foreign currency and forward foreign currency exchange contracts | 947,082 | |||||
Net change in unrealized appreciation (depreciation) | $ | 1,468,163 | ||||
Net realized and unrealized loss | $ | (731,888 | ) | |||
Distributions to preferred shareholders | ||||||
| From net investment income | $ | (291,157 | ) | |||
Net increase in net assets from operations | $ | 33,207,993 | ||||
See Notes to Financial Statements.
24
Eaton Vance
Senior Floating-Rate Trust
October 31, 2011
Statements of Changes in Net Assets
| Year Ended October 31, | ||||||||||
| Increase (Decrease) in Net Assets | 2011 | 2010 | ||||||||
| From operations — | ||||||||||
| Net investment income | $ | 34,231,038 | $ | 34,509,000 | ||||||
| Net realized loss from investment, foreign currency and forward foreign currency exchange contract transactions | (2,200,051 | ) | (15,778,618 | ) | ||||||
| Net change in unrealized appreciation (depreciation) from investments, foreign currency and forward foreign currency exchange contracts | 1,468,163 | 62,203,911 | ||||||||
| Distributions to preferred shareholders — | ||||||||||
| From net investment income | (291,157 | ) | (384,607 | ) | ||||||
Net increase in net assets from operations | $ | 33,207,993 | $ | 80,549,686 | ||||||
| Distributions to common shareholders — | ||||||||||
| From net investment income | $ | (35,840,010 | ) | $ | (37,305,680 | ) | ||||
Total distributions to common shareholders | $ | (35,840,010 | ) | $ | (37,305,680 | ) | ||||
| Capital share transactions — | ||||||||||
| Reinvestment of distributions to common shareholders | $ | 817,192 | $ | 1,253,537 | ||||||
Net increase in net assets from capital share transactions | $ | 817,192 | $ | 1,253,537 | ||||||
Net increase (decrease) in net assets | $ | (1,814,825 | ) | $ | 44,497,543 | |||||
| Net Assets Applicable to Common Shares | ||||||||||
| At beginning of year | $ | 505,197,371 | $ | 460,699,828 | ||||||
At end of year | $ | 503,382,546 | $ | 505,197,371 | ||||||
| Accumulated undistributed net investment income included in net assets applicable to common shares | ||||||||||
At end of year | $ | 633,849 | $ | 3,963,096 | ||||||
See Notes to Financial Statements.
25
Eaton Vance
Senior Floating-Rate Trust
October 31, 2011
Statement of Cash Flows
| Year Ended | ||||||
| Cash Flows From Operating Activities | October 31, 2011 | |||||
| Net increase in net assets from operations | $ | 33,207,993 | ||||
| Distributions to preferred shareholders | 291,157 | |||||
| Net increase in net assets from operations excluding distributions to preferred shareholders | $ | 33,499,150 | ||||
| Adjustments to reconcile net increase in net assets from operations to net cash provided by operating activities: | ||||||
| Investments purchased | (387,910,995 | ) | ||||
| Investments sold and principal repayments | 382,317,564 | |||||
| Decrease in short-term investments, net | 4,610,341 | |||||
| Net amortization/accretion of premium (discount) | (5,225,261 | ) | ||||
| Increase in restricted cash | (780,000 | ) | ||||
| Amortization of structuring fee on notes payable | 91,849 | |||||
| Decrease in interest and dividends receivable | 96,057 | |||||
| Decrease in interest receivable from affiliated investment | 2,013 | |||||
| Increase in receivable for investments sold | (1,795,401 | ) | ||||
| Increase in receivable for open forward foreign currency exchange contracts | (865,503 | ) | ||||
| Decrease in receivable from the transfer agent | 95,902 | |||||
| Increase in prepaid expenses | (21,274 | ) | ||||
| Increase in other assets | (1,678 | ) | ||||
| Increase in payable for investments purchased | 883,324 | |||||
| Increase in payable for open forward foreign currency exchange contracts | 73,974 | |||||
| Increase in payable to affiliate for investment adviser fee | 35,900 | |||||
| Decrease in payable to affiliate for Trustees’ fees | (146 | ) | ||||
| Decrease in accrued expenses | (9,730 | ) | ||||
| Decrease in unfunded loan commitments | (1,221,389 | ) | ||||
| Net change in unrealized (appreciation) depreciation from investments | (521,081 | ) | ||||
| Net realized loss from investments | 599,760 | |||||
Net cash provided by operating activities | $ | 23,953,376 | ||||
| Cash Flows From Financing Activities | ||||||
| Distributions paid to common shareholders, net of reinvestments | $ | (35,022,818 | ) | |||
| Cash distributions to preferred shareholders | (298,248 | ) | ||||
| Increase in notes payable | 15,000,000 | |||||
Net cash used in financing activities | $ | (20,321,066 | ) | |||
Net increase in cash* | $ | 3,632,310 | ||||
Cash at beginning of year(1) | $ | 1,239,434 | ||||
Cash at end of year(1) | $ | 4,871,744 | ||||
| Supplemental disclosure of cash flow information: | ||||||
| Reinvestment of dividends and distributions | $ | 817,192 | ||||
| Cash paid for interest and fees on borrowings | $ | 2,241,279 | ||||
| (1) | Balance includes foreign currency, at value. | |
| * | Includes net change in unrealized appreciation (depreciation) on foreign currency of $46,998. |
See Notes to Financial Statements.
26
Eaton Vance
Senior Floating-Rate Trust
October 31, 2011
Financial Highlights
Selected data for a common share outstanding during the periods stated
| Year Ended October 31, | ||||||||||||||||||||||
| 2011 | 2010 | 2009 | 2008 | 2007 | ||||||||||||||||||
| Net asset value — Beginning of year (Common shares) | $ | 14.980 | $ | 13.700 | $ | 10.190 | $ | 17.800 | $ | 18.690 | ||||||||||||
| Income (Loss) From Operations | ||||||||||||||||||||||
Net investment income(1) | $ | 1.014 | $ | 1.025 | $ | 0.978 | $ | 1.665 | $ | 2.177 | ||||||||||||
| Net realized and unrealized gain (loss) | (0.013 | ) | 1.374 | 3.423 | (7.647 | ) | (0.861 | ) | ||||||||||||||
| Distributions to preferred shareholders | ||||||||||||||||||||||
From net investment income(1) | (0.009 | ) | (0.011 | ) | (0.028 | ) | (0.367 | ) | (0.634 | ) | ||||||||||||
Total income (loss) from operations | $ | 0.992 | $ | 2.388 | $ | 4.373 | $ | (6.349 | ) | $ | 0.682 | |||||||||||
| Less Distributions to Common Shareholders | ||||||||||||||||||||||
| From net investment income | $ | (1.062 | ) | $ | (1.108 | ) | $ | (0.863 | ) | $ | (1.142 | ) | $ | (1.542 | ) | |||||||
| Tax return of capital | — | — | — | (0.119 | ) | (0.030 | ) | |||||||||||||||
Total distributions to common shareholders | $ | (1.062 | ) | $ | (1.108 | ) | $ | (0.863 | ) | $ | (1.261 | ) | $ | (1.572 | ) | |||||||
Net asset value — End of year (Common shares) | $ | 14.910 | $ | 14.980 | $ | 13.700 | $ | 10.190 | $ | 17.800 | ||||||||||||
Market value — End of year (Common shares) | $ | 14.550 | $ | 15.640 | $ | 12.980 | $ | 9.480 | $ | 16.200 | ||||||||||||
Total Investment Return on Net Asset Value(2) | 6.69 | % | 17.93 | % | 46.90 | % | (37.33 | )% | 3.93 | % | ||||||||||||
Total Investment Return on Market Value(2) | (0.28 | )% | 29.96 | % | 49.61 | % | (35.90 | )% | (3.13 | )% | ||||||||||||
See Notes to Financial Statements.
27
Eaton Vance
Senior Floating-Rate Trust
October 31, 2011
Financial Highlights — continued
Selected data for a common share outstanding during the periods stated
| Year Ended October 31, | ||||||||||||||||||||||
| Ratios/Supplemental Data | 2011 | 2010 | 2009 | 2008 | 2007 | |||||||||||||||||
| Net assets applicable to common shares, end of year (000’s omitted) | $ | 503,383 | $ | 505,197 | $ | 460,700 | $ | 342,457 | $ | 598,214 | ||||||||||||
Ratios (as a percentage of average daily net assets applicable to common shares):(3) | ||||||||||||||||||||||
Expenses excluding interest and fees(4) | 1.29 | % | 1.22 | % | 1.21 | % | 1.18 | % | 1.18 | % | ||||||||||||
Interest and fee expense(5) | 0.44 | % | 0.49 | % | 1.15 | % | 0.99 | % | — | |||||||||||||
| Total expenses | 1.73 | % | 1.71 | % | 2.36 | % | 2.17 | % | 1.18 | % | ||||||||||||
| Net investment income | 6.69 | % | 7.11 | % | 9.21 | % | 10.66 | % | 11.79 | % | ||||||||||||
| Portfolio Turnover | 49 | % | 36 | % | 42 | % | 21 | % | 58 | % | ||||||||||||
| The ratios reported above are based on net assets applicable solely to common shares. The ratios based on net assets, including amounts related to preferred shares and borrowings, are as follows: | ||||||||||||||||||||||
Ratios (as a percentage of average daily net assets applicable to common shares plus preferred shares and borrowings):(3) | ||||||||||||||||||||||
Expenses excluding interest and fees(4) | 0.83 | % | 0.77 | % | 0.74 | % | 0.68 | % | 0.72 | % | ||||||||||||
Interest and fee expense(5) | 0.28 | % | 0.31 | % | 0.70 | % | 0.57 | % | — | |||||||||||||
| Total expenses | 1.11 | % | 1.08 | % | 1.44 | % | 1.25 | % | 0.72 | % | ||||||||||||
| Net investment income | 4.28 | % | 4.50 | % | 5.63 | % | 6.12 | % | 7.21 | % | ||||||||||||
| Senior Securities: | ||||||||||||||||||||||
| Total notes payable outstanding (in 000’s) | $ | 165,000 | $ | 150,000 | $ | 150,000 | $ | 154,200 | $ | — | ||||||||||||
Asset coverage per $1,000 of notes payable(6) | $ | 4,847 | $ | 5,243 | $ | 4,947 | $ | 4,074 | $ | — | ||||||||||||
| Total preferred shares outstanding | 5,252 | 5,252 | 5,252 | 5,252 | 15,760 | |||||||||||||||||
| Asset coverage per preferred share | $ | 67,473 | (7) | $ | 69,900 | (7) | $ | 65,945 | (7) | $ | 55,060 | (7) | $ | 63,001 | (8) | |||||||
Involuntary liquidation preference per preferred share(9) | $ | 25,000 | $ | 25,000 | $ | 25,000 | $ | 25,000 | $ | 25,000 | ||||||||||||
Approximate market value per preferred share(9) | $ | 25,000 | $ | 25,000 | $ | 25,000 | $ | 25,000 | $ | 25,000 | ||||||||||||
| (1) | Computed using average shares outstanding. | |
| (2) | Returns are historical and are calculated by determining the percentage change in net asset value or market value with all distributions reinvested. | |
| (3) | Ratios do not reflect the effect of dividend payments to preferred shareholders. | |
| (4) | Excludes the effect of custody fee credits, if any, of less than 0.005%. | |
| (5) | Interest and fee expense relates to the notes payable incurred to partially redeem the Trust’s APS (see Note 10). | |
| (6) | Calculated by subtracting the Trust’s total liabilities (not including the notes payable and preferred shares) from the Trust’s total assets, and dividing the result by the notes payable balance in thousands. | |
| (7) | Calculated by subtracting the Trust’s total liabilities (not including the notes payable and preferred shares) from the Trust’s total assets, dividing the result by the sum of the value of the notes payable and liquidation value of preferred shares, and multiplying the result by the liquidation value of one preferred share. Such amount equates to 270%, 280%, 264% and 220% at October 31, 2011, 2010, 2009 and 2008, respectively. | |
| (8) | Calculated by subtracting the Trust’s total liabilities (not including the preferred shares) from the Trust’s total assets, and dividing the result by the number of preferred shares outstanding. | |
| (9) | Plus accumulated and unpaid dividends. |
See Notes to Financial Statements.
28
Eaton Vance
Senior Floating-Rate Trust
October 31, 2011
Notes to Financial Statements
1 Significant Accounting Policies
Eaton Vance Senior Floating-Rate Trust (the Trust) is a Massachusetts business trust registered under the Investment Company Act of 1940, as amended (the 1940 Act), as a diversified, closed-end management investment company. The Trust’s primary investment objective is to provide a high level of current income. The Trust may, as a secondary objective, also seek preservation of capital to the extent consistent with its primary objective.
The following is a summary of significant accounting policies of the Trust. The policies are in conformity with accounting principles generally accepted in the United States of America.
A Investment Valuation — Interests in senior floating-rate loans (Senior Loans) for which reliable market quotations are readily available are valued generally at the average mean of bid and ask quotations obtained from a third party pricing service. Other Senior Loans are valued at fair value by the investment adviser under procedures approved by the Trustees. In fair valuing a Senior Loan, the investment adviser utilizes one or more of the valuation techniques described in (i) through (iii) below to assess the likelihood that the borrower will make a full repayment of the loan underlying such Senior Loan relative to yields on other Senior Loans issued by companies of comparable credit quality. If the investment adviser believes that there is a reasonable likelihood of full repayment, the investment adviser will determine fair value using a matrix pricing approach that considers the yield on the Senior Loan. If the investment adviser believes there is not a reasonable likelihood of full repayment, the investment adviser will determine fair value using analyses that include, but are not limited to: (i) a comparison of the value of the borrower’s outstanding equity and debt to that of comparable public companies; (ii) a discounted cash flow analysis; or (iii) when the investment adviser believes it is likely that a borrower will be liquidated or sold, an analysis of the terms of such liquidation or sale. In certain cases, the investment adviser will use a combination of analytical methods to determine fair value, such as when only a portion of a borrower’s assets are likely to be sold. In conducting its assessment and analyses for purposes of determining fair value of a Senior Loan, the investment adviser will use its discretion and judgment in considering and appraising relevant factors. Fair value determinations are made by the portfolio managers of the Trust based on information available to such managers. The portfolio managers of other funds managed by the investment adviser that invest in Senior Loans may not possess the same information about a Senior Loan borrower as the portfolio managers of the Trust. At times, the fair value of a Senior Loan determined by the portfolio managers of other funds managed by the investment adviser that invest in Senior Loans may vary from the fair value of the same Senior Loan determined by the portfolio managers of the Trust. The fair value of each Senior Loan is periodically reviewed and approved by the investment adviser’s Valuation Committee and by the Trustees based upon procedures approved by the Trustees. Junior Loans (i.e., subordinated loans and second lien loans) are valued in the same manner as Senior Loans.
Debt obligations (including short-term obligations with a remaining maturity of more than sixty days) are generally valued on the basis of valuations provided by third party pricing services, as derived from such services’ pricing models. Inputs to the models may include, but are not limited to, reported trades, executable bid and asked prices, broker/dealer quotations, prices or yields of securities with similar characteristics, benchmark curves or information pertaining to the issuer, as well as industry and economic events. The pricing services may use a matrix approach, which considers information regarding securities with similar characteristics to determine the valuation for a security. Short-term debt obligations purchased with a remaining maturity of sixty days or less are generally valued at amortized cost, which approximates market value.
Equity securities (including common shares of closed-end investment companies) listed on a U.S. securities exchange generally are valued at the last sale or closing price on the day of valuation or, if no sales took place on such date, at the mean between the closing bid and asked prices therefore on the exchange where such securities are principally traded. Equity securities listed on the NASDAQ Global or Global Select Market generally are valued at the NASDAQ official closing price. Unlisted or listed securities for which closing sales prices or closing quotations are not available are valued at the mean between the latest available bid and asked prices or, in the case of preferred equity securities that are not listed or traded in the over-the-counter market, by a third party pricing service that will use various techniques that consider factors including, but not limited to, prices or yields of securities with similar characteristics, benchmark yields, broker/dealer quotes, quotes of underlying common stock, issuer spreads, as well as industry and economic events. Forward foreign currency exchange contracts are generally valued at the mean of the average bid and average asked prices that are reported by currency dealers to a third party pricing service at the valuation time. Such third party pricing service valuations are supplied for specific settlement periods and the Trust’s forward foreign currency exchange contracts are valued at an interpolated rate between the closest preceding and subsequent settlement period reported by the third party pricing service. Foreign securities and currencies are valued in U.S. dollars, based on foreign currency exchange rate quotations supplied by a third party pricing service. The pricing service uses a proprietary model to determine the exchange rate. Inputs to the model include reported trades and implied bid/ask spreads. Investments for which valuations or market quotations are not readily available or are deemed unreliable are valued at fair value using methods determined in good faith by or at the direction of the Trustees of the Trust in a manner that fairly reflects the security’s value, or the amount that the Trust might reasonably expect to receive for the security upon its current sale in the ordinary course. Each such determination is based on a consideration of relevant factors, which are likely to vary from one pricing context to another. These factors may include, but are not limited to, the type of security, the existence of any contractual restrictions on the security’s disposition, the price and extent of public trading in similar securities of the issuer or of comparable companies or entities, quotations or relevant information obtained from broker/dealers or other market participants, information obtained from the issuer, analysts, and/or the appropriate stock exchange (for exchange-traded securities), an analysis of the company’s or entity’s financial condition, and an evaluation of the forces that influence the issuer and the market(s) in which the security is purchased and sold.
The Trust may invest in Eaton Vance Cash Reserves Fund, LLC (Cash Reserves Fund), an affiliated investment company managed by Eaton Vance Management (EVM). Cash Reserves Fund generally values its investment securities utilizing the amortized cost valuation technique in accordance with Rule 2a-7 under the 1940 Act. This technique involves initially valuing a portfolio security at its cost and thereafter assuming a constant amortization to maturity of any discount or premium. If amortized cost is determined not to approximate fair value, Cash Reserves Fund may value its investment securities in the same manner as debt obligations described above.
29
Eaton Vance
Senior Floating-Rate Trust
October 31, 2011
Notes to Financial Statements — continued
B Investment Transactions — Investment transactions for financial statement purposes are accounted for on a trade date basis. Realized gains and losses on investments sold are determined on the basis of identified cost.
C Income — Interest income is recorded on the basis of interest accrued, adjusted for amortization of premium or accretion of discount. Fees associated with loan amendments are recognized immediately. Dividend income is recorded on the ex-dividend date for dividends received in cash and/or securities.
D Federal Taxes — The Trust’s policy is to comply with the provisions of the Internal Revenue Code applicable to regulated investment companies and to distribute to shareholders each year substantially all of its net investment income, and all or substantially all of its net realized capital gains. Accordingly, no provision for federal income or excise tax is necessary.
At October 31, 2011, the Trust, for federal income tax purposes, had a capital loss carryforward of $123,862,786 which will reduce its taxable income arising from future net realized gains on investment transactions, if any, to the extent permitted by the Internal Revenue Code, and thus will reduce the amount of distributions to shareholders, which would otherwise be necessary to relieve the Trust of any liability for federal income or excise tax. Such capital loss carryforward will expire on October 31, 2012 ($5,860,075), October 31, 2013 ($4,807,956), October 31, 2014 ($1,142,602), October 31, 2015 ($2,782,217), October 31, 2016 ($63,478,422), October 31, 2017 ($33,311,438), October 31, 2018 ($11,668,372) and October 31, 2019 ($811,704).
As of October 31, 2011, the Trust had no uncertain tax positions that would require financial statement recognition, de-recognition, or disclosure. Each of the Trust’s federal tax returns filed in the 3-year period ended October 31, 2011 remains subject to examination by the Internal Revenue Service.
E Expense Reduction — State Street Bank and Trust Company (SSBT) serves as custodian of the Trust. Pursuant to the custodian agreement, SSBT receives a fee reduced by credits, which are determined based on the average daily cash balance the Trust maintains with SSBT. All credit balances, if any, used to reduce the Trust’s custodian fees are reported as a reduction of expenses in the Statement of Operations.
F Foreign Currency Translation — Investment valuations, other assets, and liabilities initially expressed in foreign currencies are translated each business day into U.S. dollars based upon current exchange rates. Purchases and sales of foreign investment securities and income and expenses denominated in foreign currencies are translated into U.S. dollars based upon currency exchange rates in effect on the respective dates of such transactions. Recognized gains or losses on investment transactions attributable to changes in foreign currency exchange rates are recorded for financial statement purposes as net realized gains and losses on investments. That portion of unrealized gains and losses on investments that results from fluctuations in foreign currency exchange rates is not separately disclosed.
G Unfunded Loan Commitments — The Trust may enter into certain credit agreements all or a portion of which may be unfunded. The Trust is obligated to fund these commitments at the borrower’s discretion. These commitments are disclosed in the accompanying Portfolio of Investments. At October 31, 2011, the Trust had sufficient cash and/or securities to cover these commitments.
H Use of Estimates — The preparation of the financial statements in conformity with accounting principles generally accepted in the United States of America requires management to make estimates and assumptions that affect the reported amounts of assets and liabilities at the date of the financial statements and the reported amounts of income and expense during the reporting period. Actual results could differ from those estimates.
I Indemnifications — Under the Trust’s organizational documents, its officers and Trustees may be indemnified against certain liabilities and expenses arising out of the performance of their duties to the Trust. Under Massachusetts law, if certain conditions prevail, shareholders of a Massachusetts business trust (such as the Trust) could be deemed to have personal liability for the obligations of the Trust. However, the Trust’s Declaration of Trust contains an express disclaimer of liability on the part of Fund shareholders and the By-laws provide that the Trust shall assume the defense on behalf of any Fund shareholders. Moreover, the By-laws also provide for indemnification out of Fund property of any shareholder held personally liable solely by reason of being or having been a shareholder for all loss or expense arising from such liability. Additionally, in the normal course of business, the Trust enters into agreements with service providers that may contain indemnification clauses. The Trust’s maximum exposure under these arrangements is unknown as this would involve future claims that may be made against the Trust that have not yet occurred.
J Forward Foreign Currency Exchange Contracts — The Trust may enter into forward foreign currency exchange contracts for the purchase or sale of a specific foreign currency at a fixed price on a future date. The forward foreign currency exchange contracts are adjusted by the daily exchange rate of the underlying currency and any gains or losses are recorded as unrealized until such time as the contracts have been closed or offset by another contract with the same broker for the same settlement date and currency. Risks may arise upon entering these contracts from the potential inability of counterparties to meet the terms of their contracts and from movements in the value of a foreign currency relative to the U.S. dollar.
K Statement of Cash Flows — The cash amount shown in the Statement of Cash Flows of the Trust is the amount included in the Trust’s Statement of Assets and Liabilities and represents the cash on hand at its custodian and does not include any short-term investments.
2 Auction Preferred Shares
The Trust issued Auction Preferred Shares (APS) on January 26, 2004 in a public offering. The underwriting discount and other offering costs incurred in connection with the offering were recorded as a reduction of the paid-in capital of the common shares. Dividends on the APS, which accrue daily, are
30
Eaton Vance
Senior Floating-Rate Trust
October 31, 2011
Notes to Financial Statements — continued
cumulative at rates which are reset weekly for Series A and Series B, and approximately monthly for Series C and Series D by an auction, unless a special dividend period has been set. Series of APS are identical in all respects except for the reset dates of the dividend rates. If the APS auctions do not successfully clear, the dividend payment rate over the next period for the APS holders is set at a specified maximum applicable rate until such time as the APS auctions are successful. Auctions have not cleared since February 13, 2008 and the rate since that date has been the maximum applicable rate (see Note 3). The maximum applicable rate on the APS is 150% of the “AA” Financial Composite Commercial Paper Rate at the date of the auction.
The number of APS issued and outstanding as of October 31, 2011 is as follows:
| APS Issued and | ||||||
| Outstanding | ||||||
| Series A | 1,313 | |||||
| Series B | 1,313 | |||||
| Series C | 1,313 | |||||
| Series D | 1,313 | |||||
The APS are redeemable at the option of the Trust at a redemption price equal to $25,000 per share, plus accumulated and unpaid dividends, on any dividend payment date. The APS are also subject to mandatory redemption at a redemption price equal to $25,000 per share, plus accumulated and unpaid dividends, if the Trust is in default for an extended period on its asset maintenance requirements with respect to the APS. If the dividends on the APS remain unpaid in an amount equal to two full years’ dividends, the holders of the APS as a class have the right to elect a majority of the Board of Trustees. In general, the holders of the APS and the common shares have equal voting rights of one vote per share, except that the holders of the APS, as a separate class, have the right to elect at least two members of the Board of Trustees. The APS have a liquidation preference of $25,000 per share, plus accumulated and unpaid dividends. The Trust is required to maintain certain asset coverage with respect to the APS as defined in the Trust’s By-Laws and the 1940 Act. The Trust pays an annual fee up to 0.15% of the liquidation value of the APS to broker/dealers as a service fee if the auctions are unsuccessful; otherwise, the annual fee is 0.25%.
3 Distributions to Shareholders
The Trust intends to make monthly distributions of net investment income to common shareholders, after payment of any dividends on any outstanding APS. In addition, at least annually, the Trust intends to distribute all or substantially all of its net realized capital gains (reduced by available capital loss carryforwards from prior years, if any). Distributions to common shareholders are recorded on the ex-dividend date. Distributions to preferred shareholders are recorded daily and are payable at the end of each dividend period. The dividend rates for the APS at October 31, 2011, and the amount of dividends accrued (including capital gains, if any) to APS shareholders, average APS dividend rates, and dividend rate ranges for the year then ended were as follows:
| APS Dividend | Dividends | Average APS | Dividend | |||||||||||||||
| Rates at | Accrued to APS | Dividend | Rate | |||||||||||||||
| October 31, 2011 | Shareholders | Rates | Ranges (%) | |||||||||||||||
| Series A | 0.21 | % | $ | 72,793 | 0.22 | % | 0.09–0.33 | |||||||||||
| Series B | 0.21 | 72,793 | 0.22 | 0.09–0.33 | ||||||||||||||
| Series C | 0.09 | 71,676 | 0.22 | 0.09–0.30 | ||||||||||||||
| Series D | 0.21 | 73,895 | 0.23 | 0.12–0.32 | ||||||||||||||
Beginning February 13, 2008 and consistent with the patterns in the broader market for auction-rate securities, the Trust’s APS auctions were unsuccessful in clearing due to an imbalance of sell orders over bids to buy the APS. As a result, the dividend rates of the APS were reset to the maximum applicable rate. The table above reflects such maximum dividend rate for each series as of October 31, 2011.
The Trust distinguishes between distributions on a tax basis and a financial reporting basis. Accounting principles generally accepted in the United States of America require that only distributions in excess of tax basis earnings and profits be reported in the financial statements as a return of capital. Permanent differences between book and tax accounting relating to distributions are reclassified to paid-in capital. For tax purposes, distributions from short-term capital gains are considered to be from ordinary income.
31
Eaton Vance
Senior Floating-Rate Trust
October 31, 2011
Notes to Financial Statements — continued
The tax character of distributions declared for the years ended October 31, 2011 and October 31, 2010 was as follows:
| Year Ended October 31, | ||||||||||
| 2011 | 2010 | |||||||||
Distributions declared from: | ||||||||||
| Ordinary income | $ | 36,131,167 | $ | 37,690,287 | ||||||
During the year ended October 31, 2011, accumulated undistributed net investment income was decreased by $1,429,118, accumulated net realized loss was decreased by $1,425,616 and paid-in capital was increased by $3,502 due to differences between book and tax accounting, primarily for premium amortization, defaulted bond interest, mixed straddles and foreign currency gain (loss). These reclassifications had no effect on the net assets or net asset value per share of the Trust.
As of October 31, 2011, the components of distributable earnings (accumulated losses) and unrealized appreciation (depreciation) on a tax basis were as follows:
| Undistributed ordinary income | $ | 725,553 | ||||
| Capital loss carryforward | $ | (123,862,786 | ) | |||
| Net unrealized depreciation | $ | (11,300,320 | ) | |||
The differences between components of distributable earnings (accumulated losses) on a tax basis and the amounts reflected in the Statement of Assets and Liabilities are primarily due to wash sales, defaulted bond interest, investments in partnerships and premium amortization.
4 Investment Adviser Fee and Other Transactions with Affiliates
The investment adviser fee is earned by EVM as compensation for management and investment advisory services rendered to the Trust. The fee is computed at an annual rate of 0.75% of the Trust’s average daily gross assets and is payable monthly. Gross assets as referred to herein represent net assets plus obligations attributable to investment leverage. The Trust invests its cash in Cash Reserves Fund. EVM does not currently receive a fee for advisory services provided to Cash Reserves Fund. For the year ended October 31, 2011, the Trust’s investment adviser fee totaled to $5,991,921. EVM also serves as administrator of the Trust, but receives no compensation.
In addition, EVM has contractually agreed to reimburse the Trust for fees and other expenses at an annual rate of 0.20% of the Trust’s average daily gross assets during the first five full years of the Trust’s operations, 0.15% of the Trust’s average daily gross assets in year six, 0.10% in year seven and 0.05% in year eight. The Trust concluded its first seven full years of operations on November 28, 2010. Pursuant to this agreement, EVM waived $428,699 of its investment adviser fee for the year ended October 31, 2011.
Except for Trustees of the Trust who are not members of EVM’s organization, officers and Trustees receive remuneration for their services to the Trust out of the investment adviser fee. Trustees of the Trust who are not affiliated with EVM may elect to defer receipt of all or a percentage of their annual fees in accordance with the terms of the Trustees Deferred Compensation Plan. For the year ended October 31, 2011, no significant amounts have been deferred. Certain officers and Trustees of the Trust are officers of EVM.
5 Purchases and Sales of Investments
Purchases and sales of investments, other than short-term obligations and including maturities, paydowns and principal repayments on Senior Loans, aggregated $387,910,995 and $382,317,564, respectively, for the year ended October 31, 2011.
6 Common Shares of Beneficial Interest
The Trust may issue common shares pursuant to its dividend reinvestment plan. Common shares issued pursuant to the Trust’s dividend reinvestment plan for the year ended October 31, 2011 and October 31, 2010 were 51,827 and 85,909, respectively.
32
Eaton Vance
Senior Floating-Rate Trust
October 31, 2011
Notes to Financial Statements — continued
7 Federal Income Tax Basis of Investments
The cost and unrealized appreciation (depreciation) of investments of the Trust at October 31, 2011, as determined on a federal income tax basis, were as follows:
Aggregate cost | $ | 811,866,952 | ||||
| Gross unrealized appreciation | $ | 14,879,674 | ||||
| Gross unrealized depreciation | (26,557,944 | ) | ||||
Net unrealized depreciation | $ | (11,678,270 | ) | |||
8 Restricted Securities
At October 31, 2011, the Trust owned the following securities (representing 0.2% of net assets applicable to common shares) which were restricted as to public resale and not registered under the Securities Act of 1933 (excluding Rule 144A securities). The Trust has various registration rights (exercisable under a variety of circumstances) with respect to these securities. The value of these securities is determined based on valuations provided by brokers when available, or if not available, they are valued at fair value using methods determined in good faith by or at the direction of the Trustees.
| Date of | ||||||||||||||||||
| Description | Acquisition | Shares | Cost | Value | ||||||||||||||
Common Stocks | ||||||||||||||||||
| Environmental Systems Products Holdings, Inc. | 10/25/07 | 6,211 | $ | 0 | (1) | $ | 262,787 | |||||||||||
| Panolam Holdings Co. | 12/30/09 | 253 | 139,024 | 216,072 | ||||||||||||||
| RathGibson Acquisition Co., LLC | 6/14/10 | 19,800 | 105,079 | 611,820 | ||||||||||||||
Total Common Stocks | $ | 244,103 | $ | 1,090,679 | ||||||||||||||
Preferred Stocks | ||||||||||||||||||
| Environmental Systems Products Holdings, Inc., Series A | 10/25/07 | 1,422 | $ | 24,885 | $ | 87,538 | ||||||||||||
Total Restricted Securities | $ | 268,988 | $ | 1,178,217 | ||||||||||||||
| (1) | Less than $0.50. |
9 Financial Instruments
The Trust may trade in financial instruments with off-balance sheet risk in the normal course of its investing activities. These financial instruments may include forward foreign currency exchange contracts and may involve, to a varying degree, elements of risk in excess of the amounts recognized for financial statement purposes. The notional or contractual amounts of these instruments represent the investment the Trust has in particular classes of financial instruments and do not necessarily represent the amounts potentially subject to risk. The measurement of the risks associated with these instruments is meaningful only when all related and offsetting transactions are considered.
33
Eaton Vance
Senior Floating-Rate Trust
October 31, 2011
Notes to Financial Statements — continued
A summary of obligations under these financial instruments at October 31, 2011 is as follows:
| Forward Foreign Currency Exchange Contracts | ||||||||||||
Sales | ||||||||||||
| Net Unrealized | ||||||||||||
| Appreciation | ||||||||||||
| Settlement Date | Deliver | In Exchange For | Counterparty | (Depreciation) | ||||||||
| 11/30/11 | British Pound Sterling 2,803,559 | United States Dollar 4,576,739 | JPMorgan Chase Bank | $ | 70,152 | |||||||
| 11/30/11 | Euro 10,081,327 | United States Dollar 14,583,950 | Citibank NA | 638,370 | ||||||||
| 12/30/11 | British Pound Sterling 7,148,136 | United States Dollar 11,132,114 | Goldman Sachs, Inc. | (354,257 | ) | |||||||
| 12/30/11 | Euro 8,328,903 | United States Dollar 11,284,498 | HSBC Bank USA | (235,031 | ) | |||||||
| 1/31/12 | Euro 4,387,143 | United States Dollar 6,229,393 | Deutsche Bank | 162,327 | ||||||||
| $ | 281,561 | |||||||||||
Purchases | ||||||||||||
| Net Unrealized | ||||||||||||
| Appreciation | ||||||||||||
| Settlement Date | In Exchange For | Deliver | Counterparty | (Depreciation) | ||||||||
| 11/30/11 | British Pound Sterling 233,374 | United States Dollar 366,986 | Deutsche Bank | $ | 8,152 | |||||||
| 12/30/11 | British Pound Sterling 2,784,046 | United States Dollar 4,487,710 | JPMorgan Chase Bank | (14,014 | ) | |||||||
| $ | (5,862 | ) | ||||||||||
At October 31, 2011, the Trust had sufficient cash and/or securities to cover commitments under these contracts.
The Trust is subject to foreign exchange risk in the normal course of pursuing its investment objective. Because the Trust holds foreign currency denominated investments, the value of these investments and related receivables and payables may change due to future changes in foreign currency exchange rates. To hedge against this risk, the Trust enters into forward foreign currency exchange contracts. The Trust also enters into such contracts to hedge the currency risk of investments it anticipates purchasing.
The Trust enters into forward foreign currency exchange contracts that may contain provisions whereby the counterparty may terminate the contract under certain conditions, including but not limited to a decline in the Trust’s net assets below a certain level over a certain period of time, which would trigger a payment by the Trust for those derivatives in a liability position. At October 31, 2011 the fair value of derivatives with credit-related contingent features in a net liability position was $603,302. The aggregate fair value of assets pledged as collateral by the Trust for such liability was $780,000 at October 31, 2011.
The non-exchange traded derivatives in which the Trust invests, including forward foreign currency exchange contracts, are subject to the risk that the counterparty to the contract fails to perform its obligations under the contract. At October 31, 2011, the maximum amount of loss the Trust would incur due to counterparty risk was $879,001, representing the fair value of such derivatives in an asset position, with the highest amount from any one counterparty being $638,370. To mitigate this risk, the Trust has entered into master netting agreements with substantially all its derivative counterparties, which allows it and a counterparty to aggregate amounts owed by each of them for derivative transactions under the agreement into a single net amount payable by either the Trust or the counterparty. At October 31, 2011, the maximum amount of loss the Trust would incur due to counterparty risk would be reduced by approximately $14,000 due to master netting agreements. Counterparties may be required to pledge collateral in
34
Eaton Vance
Senior Floating-Rate Trust
October 31, 2011
Notes to Financial Statements — continued
the form of cash, U.S. Government securities or highly-rated bonds for the benefit of the Trust if the net amount due from the counterparty with respect to a derivative contract exceeds a certain threshold. The amount of collateral posted by the counterparties with respect to such contracts would also reduce the amount of any loss incurred.
The fair value of open derivative instruments (not considered to be hedging instruments for accounting disclosure purposes) and whose primary underlying risk exposure is foreign exchange risk at October 31, 2011 was as follows:
| Fair Value | ||||||||||
| Derivative | Asset Derivative(1) | Liability Derivative(2) | ||||||||
| Forward foreign currency exchange contracts | $ | 879,001 | $ | (603,302 | ) | |||||
| (1) | Statement of Assets and Liabilities location: Receivable for open forward foreign currency exchange contracts; Net unrealized depreciation. | |
| (2) | Statement of Assets and Liabilities location: Payable for open forward foreign currency exchange contracts; Net unrealized depreciation. |
The effect of derivative instruments (not considered to be hedging instruments for accounting disclosure purposes) on the Statement of Operations and whose primary underlying risk exposure is foreign exchange risk for the year ended October 31, 2011 was as follows:
| Realized Gain (Loss) | Change in Unrealized | |||||||||
| on Derivatives Recognized | Appreciation (Depreciation) on | |||||||||
| Derivative | in Income(1) | Derivatives Recognized in Income(2) | ||||||||
| Forward foreign currency exchange contracts | $ | (1,444,245 | ) | $ | 791,529 | |||||
| (1) | Statement of Operations location: Net realized gain (loss) – Foreign currency and forward foreign currency exchange contract transactions. | |
| (2) | Statement of Operations location: Change in unrealized appreciation (depreciation) – Foreign currency and forward foreign currency exchange contracts. |
The average notional amount of forward foreign currency exchange contracts outstanding during the year ended October 31, 2011, which is indicative of the volume of this derivative type, was approximately $56,323,000.
10 Credit Agreement
The Trust has entered into a Credit Agreement (the Agreement) with a bank to borrow up to a limit of $185 million ($150 million prior to March 29, 2011) pursuant to a 364-day revolving line of credit. Borrowings under the Agreement are secured by the assets of the Trust. Interest is charged at a rate above the London Interbank Offered Rate (LIBOR) and is payable monthly. Under the terms of the Agreement, the Trust pays a commitment fee of 0.15% on the borrowing limit. Included in interest expense is approximately $92,000 of amortization of previously paid up-front fees related to the period from November 1, 2010 through March 29, 2011. In connection with the renewal of the Agreement on March 30, 2011, the Trust was not required to pay up-front fees. The Trust is required to maintain certain net asset levels during the term of the Agreement. At October 31, 2011, the Trust had borrowings outstanding under the Agreement of $165,000,000 at an interest rate of 1.19%. The carrying amount of the borrowings at October 31, 2011 approximated its fair value. For the year ended October 31, 2011, the average borrowings under the Agreement and the average interest rate were $156,013,699 and 1.22%, respectively.
11 Risks Associated with Foreign Investments
Investing in securities issued by companies whose principal business activities are outside the United States may involve significant risks not present in domestic investments. For example, there is generally less publicly available information about foreign companies, particularly those not subject to the disclosure and reporting requirements of the U.S. securities laws. Certain foreign issuers are generally not bound by uniform accounting, auditing, and financial reporting requirements and standards of practice comparable to those applicable to domestic issuers. Investments in foreign securities also involve the risk of possible adverse changes in investment or exchange control regulations, expropriation or confiscatory taxation, limitation on the removal of funds or other assets of the Trust, political or financial instability or diplomatic and other developments which could affect such investments. Foreign securities markets, while growing in volume and sophistication, are generally not as developed as those in the United States, and securities of some foreign issuers (particularly those located in developing countries) may be less liquid and more volatile than securities of comparable U.S. companies. In general, there is less overall governmental supervision and regulation of foreign securities markets, broker/dealers and issuers than in the United States.
12 Credit Risk
The Trust invests primarily in below investment grade floating-rate loans and floating-rate debt obligations, which are considered speculative because of the credit risk of their issuers. Changes in economic conditions or other circumstances are more likely to reduce the capacity of issuers of these securities
35
Eaton Vance
Senior Floating-Rate Trust
October 31, 2011
Notes to Financial Statements — continued
to make principal and interest payments. Such companies are more likely to default on their payments of interest and principal owed than issuers of investment grade bonds. An economic downturn generally leads to a higher non-payment rate, and a loan or other debt obligation may lose significant value before a default occurs. Lower rated investments also may be subject to greater price volatility than higher rated investments. Moreover, the specific collateral used to secure a loan may decline in value or become illiquid, which would adversely affect the loan’s value.
13 Fair Value Measurements
Under generally accepted accounting principles for fair value measurements, a three-tier hierarchy to prioritize the assumptions, referred to as inputs, is used in valuation techniques to measure fair value. The three-tier hierarchy of inputs is summarized in the three broad levels listed below.
| • | Level 1 – quoted prices in active markets for identical investments |
| • | Level 2 – other significant observable inputs (including quoted prices for similar investments, interest rates, prepayment speeds, credit risk, etc.) |
| • | Level 3 – significant unobservable inputs (including a fund’s own assumptions in determining the fair value of investments) |
In cases where the inputs used to measure fair value fall in different levels of the fair value hierarchy, the level disclosed is determined based on the lowest level input that is significant to the fair value measurement in its entirety. The inputs or methodology used for valuing securities are not necessarily an indication of the risk associated with investing in those securities.
At October 31, 2011, the hierarchy of inputs used in valuing the Trust’s investments and open derivative instruments, which are carried at value, were as follows:
| Asset Description | Level 1 | Level 2 | Level 3 | Total | ||||||||||||||
| Senior Floating-Rate Interests (Less Unfunded Loan Commitments) | $ | — | $ | 726,437,111 | $ | 2,354,268 | $ | 728,791,379 | ||||||||||
| Corporate Bonds & Notes | — | 43,024,492 | 435,763 | 43,460,256 | ||||||||||||||
| Asset-Backed Securities | — | 6,625,631 | — | 6,625,631 | ||||||||||||||
| Common Stocks | 222,472 | 2,369,702 | 7,420,504 | 10,012,677 | ||||||||||||||
| Preferred Stocks | — | — | 87,538 | 87,538 | ||||||||||||||
| Warrants | — | 10,952 | 0 | 10,952 | ||||||||||||||
| Short-Term Investments | — | 11,200,249 | — | 11,200,249 | ||||||||||||||
Total Investments | $ | 222,472 | $ | 789,668,137 | $ | 10,298,073 | $ | 800,188,682 | ||||||||||
| Forward Foreign Currency Exchange Contracts | $ | — | $ | 879,001 | $ | — | $ | 879,001 | ||||||||||
Total | $ | 222,472 | $ | 790,547,138 | $ | 10,298,073 | $ | 801,067,683 | ||||||||||
Liability Description | ||||||||||||||||||
| Forward Foreign Currency Exchange Contracts | $ | — | $ | (603,302 | ) | $ | — | $ | (603,302 | ) | ||||||||
Total | $ | — | $ | (603,302 | ) | $ | — | $ | (603,302 | ) | ||||||||
36
Eaton Vance
Senior Floating-Rate Trust
October 31, 2011
Notes to Financial Statements — continued
The following is a reconciliation of Level 3 assets for which significant unobservable inputs were used to determine fair value:
| Investments | Investments | |||||||||||||||||||||||||
| in Senior | in Corporate | Investments in | Investments | Investments in | ||||||||||||||||||||||
| Floating-Rate | Bonds & | Common | in Preferred | Warrants and | ||||||||||||||||||||||
| Interests | Notes | Stocks | Stocks | Miscellaneous | Total | |||||||||||||||||||||
Balance as of October 31, 2010 | $ | 1,958,716 | $ | 528,020 | $ | 1,650,143 | $ | 328,797 | $ | 0 | $ | 4,465,676 | ||||||||||||||
| Realized gains (losses) | (811,655 | ) | (320,637 | ) | (45,539 | ) | 117,398 | — | (1,060,433 | ) | ||||||||||||||||
| Change in net unrealized appreciation (depreciation)* | 578,605 | 771,768 | 4,078,904 | (216,357 | ) | — | 5,212,920 | |||||||||||||||||||
Cost of purchases(1) | 212,208 | 23,565 | 1,828 | — | — | 237,601 | ||||||||||||||||||||
Proceeds from sales(1) | (195,810 | ) | (601,013 | ) | (221,452 | ) | (142,300 | ) | — | (1,160,575 | ) | |||||||||||||||
| Accrued discount (premium) | 8,042 | 29,521 | — | — | — | 37,563 | ||||||||||||||||||||
| Transfers to Level 3** | 604,162 | 4,539 | 1,956,620 | — | — | 2,565,321 | ||||||||||||||||||||
| Transfers from Level 3** | — | — | — | — | — | — | ||||||||||||||||||||
Balance as of October 31, 2011 | $ | 2,354,268 | $ | 435,763 | $ | 7,420,504 | $ | 87,538 | $ | 0 | $ | 10,298,073 | ||||||||||||||
Change in net unrealized appreciation (depreciation) on investments still held as of October 31, 2011* | $ | (106,186 | ) | $ | (9,731 | ) | $ | 3,946,948 | $ | (76,803 | ) | $ | 0 | $ | 3,754,228 | |||||||||||
| * | Amount is included in the related amount on investments in the Statement of Operations. |
| ** | Transfers are reflected at the value of the securities at the beginning of the period. Transfers from Level 2 to Level 3 were due to a reduction in the availability of significant observable inputs in determining the fair value of these investments. |
| (1) | Cost of purchases may include securities received in corporate actions; proceeds from sales may include securities delivered in corporate actions. |
At October 31, 2011, the value of investments transferred between Level 1 and Level 2, if any, during the year then ended was not significant.
37
Eaton Vance
Senior Floating-Rate Trust
October 31, 2011
Report of Independent Registered Public Accounting Firm
To the Trustees and Shareholders of Eaton Vance Senior Floating-Rate Trust:
We have audited the accompanying statement of assets and liabilities of Eaton Vance Senior Floating-Rate Trust (the “Trust”), including the portfolio of investments, as of October 31, 2011, and the related statements of operations and cash flows for the year then ended, the statements of changes in net assets for each of the two years in the period then ended, and the financial highlights for each of the five years in the period then ended. These financial statements and financial highlights are the responsibility of the Trust’s management. Our responsibility is to express an opinion on these financial statements and financial highlights based on our audits.
We conducted our audits in accordance with the standards of the Public Company Accounting Oversight Board (United States). Those standards require that we plan and perform the audit to obtain reasonable assurance about whether the financial statements and financial highlights are free of material misstatement. The Trust is not required to have, nor were we engaged to perform, an audit of its internal control over financial reporting. Our audits included consideration of internal control over financial reporting as a basis for designing audit procedures that are appropriate in the circumstances, but not for the purpose of expressing an opinion on the effectiveness of the Trust’s internal control over financial reporting. Accordingly, we express no such opinion. An audit also includes examining, on a test basis, evidence supporting the amounts and disclosures in the financial statements, assessing the accounting principles used and significant estimates made by management, as well as evaluating the overall financial statement presentation. Our procedures included confirmation of securities and senior loans owned as of October 31, 2011, by correspondence with the custodian, brokers, and selling or agent banks; where replies were not received from brokers and selling or agent banks, we performed other auditing procedures. We believe that our audits provide a reasonable basis for our opinion.
In our opinion, such financial statements and financial highlights referred to above present fairly, in all material respects, the financial position of Eaton Vance Senior Floating-Rate Trust as of October 31, 2011, the results of its operations and its cash flows for the year then ended, the changes in its net assets for each of the two years in the period then ended and the financial highlights for each of the five years in the period then ended, in conformity with accounting principles generally accepted in the United States of America.
DELOITTE & TOUCHE LLP
Boston, Massachusetts
December 20, 2011
38
Eaton Vance
Senior Floating-Rate Trust
October 31, 2011
Federal Tax Information (Unaudited)
The Form 1099-DIV you receive in January 2012 will show the tax status of all distributions paid to your account in calendar year 2011. Shareholders are advised to consult their own tax adviser with respect to the tax consequences of their investment in the Trust.
39
Eaton Vance
Senior Floating-Rate Trust
October 31, 2011
Annual Meeting of Shareholders of Eaton Vance Senior Floating-Rate Trust (Unaudited)
The Trust held its Annual Meeting of Shareholders on August 26, 2011. The following action was taken by the shareholders:
Item 1: The election of Thomas E. Faust Jr., William H. Park and Ralph F. Verni as Class II Trustees of the Trust for a three-year term expiring in 2014. Mr. Verni was elected solely by APS shareholders.
| Nominee for Trustee | Number of Shares | |||||||||
| Elected by APS Shareholders | For | Withheld | ||||||||
| Ralph F. Verni (APS) | 3,635 | 115 | ||||||||
| Nominee for Trustee | Number of Shares | |||||||||
| Elected by All Shareholders | For | Withheld | ||||||||
| Thomas E. Faust Jr. | 30,970,030 | 844,898 | ||||||||
| William H. Park | 30,990,322 | 824,606 | ||||||||
40
Eaton Vance
Senior Floating-Rate Trust
October 31, 2011
Notice to Shareholders
Effective May 20, 2011, the Trust’s investment policies were changed to expand the “Authorized Foreign Currencies” in which the Trust may invest to include Australian dollars. The Trust may invest up to 15% of net assets in senior loans denominated in Authorized Foreign Currencies, which include euros, British pounds, Swiss francs, Canadian dollars and Australian dollars. The Trust currently seeks to hedge against currency fluctuations related to Authorized Foreign Currency senior loan holdings through the use of currency exchange contracts.
41
Eaton Vance
Senior Floating-Rate Trust
October 31, 2011
Dividend Reinvestment Plan
The Trust offers a dividend reinvestment plan (Plan) pursuant to which shareholders may elect to have distributions automatically reinvested in common shares (Shares) of the Trust. You may elect to participate in the Plan by completing the Dividend Reinvestment Plan Application Form. If you do not participate, you will receive all distributions in cash paid by check mailed directly to you by American Stock Transfer & Trust Company (AST) as dividend paying agent. On the distribution payment date, if the NAV per Share is equal to or less than the market price per Share plus estimated brokerage commissions, then new Shares will be issued. The number of Shares shall be determined by the greater of the NAV per Share or 95% of the market price. Otherwise, Shares generally will be purchased on the open market by AST, the Plan agent (Agent). Distributions subject to income tax (if any) are taxable whether or not Shares are reinvested.
If your Shares are in the name of a brokerage firm, bank, or other nominee, you can ask the firm or nominee to participate in the Plan on your behalf. If the nominee does not offer the Plan, you will need to request that the Trust’s transfer agent re-register your Shares in your name or you will not be able to participate.
The Agent’s service fee for handling distributions will be paid by the Trust. Plan participants will be charged their pro rata share of brokerage commissions on all open-market purchases.
Plan participants may withdraw from the Plan at any time by writing to the Agent at the address noted on the following page. If you withdraw, you will receive Shares in your name for all Shares credited to your account under the Plan. If a participant elects by written notice to the Agent to sell part or all of his or her Shares and remit the proceeds, the Agent is authorized to deduct a $5.00 fee plus brokerage commissions from the proceeds.
If you wish to participate in the Plan and your Shares are held in your own name, you may complete the form on the following page and deliver it to the Agent. Any inquiries regarding the Plan can be directed to the Agent at 1-866-439-6787.
42
Eaton Vance
Senior Floating-Rate Trust
October 31, 2011
Application for Participation in Dividend Reinvestment Plan
This form is for shareholders who hold their common shares in their own names. If your common shares are held in the name of a brokerage firm, bank, or other nominee, you should contact your nominee to see if it will participate in the Plan on your behalf. If you wish to participate in the Plan, but your brokerage firm, bank, or nominee is unable to participate on your behalf, you should request that your common shares be re-registered in your own name which will enable your participation in the Plan.
The following authorization and appointment is given with the understanding that I may terminate it at any time by terminating my participation in the Plan as provided in the terms and conditions of the Plan.
Please print exact name on account:
Shareholder signature Date
Shareholder signature Date
Please sign exactly as your common shares are registered. All persons whose names appear on the share certificate must sign.
YOU SHOULD NOT RETURN THIS FORM IF YOU WISH TO RECEIVE YOUR DISTRIBUTIONS IN CASH. THIS IS NOT A PROXY.
This authorization form, when signed, should be mailed to the following address:
Eaton Vance Senior Floating-Rate Trust
c/o American Stock Transfer & Trust Company
P.O. Box 922
Wall Street Station
New York, NY 10269-0560
Number of Employees
The Trust is organized as a Massachusetts business trust and is registered under the Investment Company Act of 1940, as amended, as a closed-end management investment company and has no employees.
Number of Shareholders
As of October 31, 2011, Trust records indicate that there are 53 registered shareholders and approximately 22,337 shareholders owning the Trust shares in street name, such as through brokers, banks, and financial intermediaries.
If you are a street name shareholder and wish to receive Trust reports directly, which contain important information about the Trust, please write or call:
Eaton Vance Distributors, Inc.
Two International Place
Boston, MA 02110
1-800-262-1122
New York Stock Exchange symbol
The New York Stock Exchange symbol is EFR.
43
Eaton Vance
Senior Floating-Rate Trust
October 31, 2011
Management and Organization
Trust Management. The Trustees of Eaton Vance Senior Floating-Rate Trust (the Trust) are responsible for the overall management and supervision of the Trust’s affairs. The Trustees and officers of the Trust are listed below. Except as indicated, each individual has held the office shown or other offices in the same company for the last five years. The “Noninterested Trustees” consist of those Trustees who are not “interested persons” of the Trust, as that term is defined under the 1940 Act. The business address of each Trustee and officer is Two International Place, Boston, Massachusetts 02110. As used below, “EVC” refers to Eaton Vance Corp., “EV” refers to Eaton Vance, Inc., “EVM” refers to Eaton Vance Management, “BMR” refers to Boston Management and Research and “EVD” refers to Eaton Vance Distributors, Inc. EVC and EV are the corporate parent and trustee, respectively, of EVM and BMR. EVD is a wholly-owned subsidiary of EVC. Each officer affiliated with Eaton Vance may hold a position with other Eaton Vance affiliates that is comparable to his or her position with EVM listed below. Each Trustee oversees 179 portfolios in the Eaton Vance Complex (including all master and feeder funds in a master feeder structure). Each officer serves as an officer of certain other Eaton Vance funds. Each Trustee serves for a three year term. Each officer serves until his or her successor is elected.
| Position(s) | Term of | |||||
| with the | Office; | Principal Occupation(s) and Directorships | ||||
| Name and Year of Birth | Trust | Length of Service | During Past Five Years and Other Relevant Experience | |||
| Interested Trustee | ||||||
| Thomas E. Faust Jr. 1958 | Class II Trustee | Until 2014. 3 years. Trustee since 2007. | Chairman, Chief Executive Officer and President of EVC, Director and President of EV, Chief Executive Officer and President of EVM and BMR, and Director of EVD. Trustee and/or officer of 179 registered investment companies and 1 private investment company managed by EVM or BMR. Mr. Faust is an interested person because of his positions with EVM, BMR, EVD, EVC and EV, which are affiliates of the Trust. Directorships in the Last Five Years.(1) Director of EVC. | |||
| Noninterested Trustees | ||||||
| Scott E. Eston 1956 | Class I Trustee | Until 2013. 2 years. Trustee since 2011. | Private investor. Formerly held various positions at Grantham, Mayo, Van Otterloo and Co., L.L.C. (investment management firm) (1997-2009), including Chief Operating Officer (2002-2009), Chief Financial Officer (1997-2009) and Chairman of the Executive Committee (2002-2008); President and Principal Executive Officer, GMO Trust (open-end registered investment company) (2006-2009). Former Partner, Coopers and Lybrand L.L.P. (now PricewaterhouseCoopers) (public accounting firm) (1987-1997). Directorships in the Last Five Years. None. | |||
| Benjamin C. Esty(A) 1963 | Class I Trustee | Until 2013. 3 years. Trustee since 2005. | Roy and Elizabeth Simmons Professor of Business Administration and Finance Unit Head, Harvard University Graduate School of Business Administration. Directorships in the Last Five Years.(1) None. | |||
| Allen R. Freedman 1940 | Class I Trustee | Until 2013. 3 years. Trustee since 2007. | Private Investor. Former Chairman (2002-2004) and a Director (1983-2004) of Systems & Computer Technology Corp. (provider of software to higher education). Formerly, a Director of Loring Ward International (fund distributor) (2005-2007). Former Chairman and a Director of Indus International, Inc. (provider of enterprise management software to the power generating industry) (2005-2007). Former Chief Executive Officer of Assurant, Inc. (insurance provider) (1979-2000). Directorships in the Last Five Years.(1) Director of Stonemor Partners, L.P. (owner and operator of cemeteries). Formerly, Director of Assurant, Inc. (insurance provider) (1979-2011). | |||
| William H. Park 1947 | Class II Trustee | Until 2014. 3 years. Trustee since 2003. | Consultant and private investor. Formerly, Chief Financial Officer, Aveon Group L.P. (investment management firm) (2010-2011). Formerly, Vice Chairman, Commercial Industrial Finance Corp. (specialty finance company) (2006-2010). Formerly, President and Chief Executive Officer, Prizm Capital Management, LLC (investment management firm) (2002-2005). Formerly, Executive Vice President and Chief Financial Officer, United Asset Management Corporation (investment management firm) (1982-2001). Formerly, Senior Manager, Price Waterhouse (now PricewaterhouseCoopers) (an independent registered public accounting firm) (1972-1981). Directorships in the Last Five Years.(1) None. | |||
| Ronald A. Pearlman 1940 | Class III Trustee | Until 2012. 3 years. Trustee since 2003. | Professor of Law, Georgetown University Law Center. Formerly, Deputy Assistant Secretary (Tax Policy) and Assistant Secretary (Tax Policy), U.S. Department of the Treasury (1983-1985). Formerly, Chief of Staff, Joint Committee on Taxation, U.S. Congress (1988-1990). Directorships in the Last Five Years.(1) None. | |||
44
Eaton Vance
Senior Floating-Rate Trust
October 31, 2011
Management and Organization — continued
| Position(s) | Term of | |||||
| with the | Office; | Principal Occupation(s) and Directorships | ||||
| Name and Year of Birth | Trust | Length of Service | During Past Five Years and Other Relevant Experience | |||
| Noninterested Trustees (continued) | ||||||
| Helen Frame Peters 1948 | Class III Trustee | Until 2012. 3 years. Trustee since 2008. | Professor of Finance, Carroll School of Management, Boston College. Formerly, Dean, Carroll School of Management, Boston College (2000-2002). Formerly, Chief Investment Officer, Fixed Income, Scudder Kemper Investments (investment management firm) (1998-1999). Formerly, Chief Investment Officer, Equity and Fixed Income, Colonial Management Associates (investment management firm) (1991-1998). Directorships in the Last Five Years.(1) Formerly, Director of BJ’s Wholesale Club, Inc. (wholesale club retailer) (2004-2011). Formerly, Trustee of SPDR Index Shares Funds and SPDR Series Trust (exchange traded funds) (2000-2009). Formerly, Director of Federal Home Loan Bank of Boston (a bank for banks) (2007-2009). | |||
| Lynn A. Stout 1957 | Class I Trustee | Until 2013. 3 years. Trustee since 2003. | Paul Hastings Professor of Corporate and Securities Law (since 2006) and Professor of Law (2001-2006), University of California at Los Angeles School of Law. Directorships in the Last Five Years.(1) None. | |||
| Harriett Tee Taggart 1948 | Class III Trustee | Until 2012. 1 year. Trustee since 2011. | Managing Director, Taggart Associates (a professional practice firm). Formerly, Partner and Senior Vice President, Wellington Management Company, LLP (investment management firm) (1983-2006). Directorships in the Last Five Years. Director of Albemarle Corporation (chemicals manufacturer) (since 2007) and The Hanover Group (specialty property and casualty insurance company) (since 2009). Formerly, Director of Lubrizol Corporation (specialty chemicals) (2007-2011). | |||
| Ralph F. Verni(A) 1943 | Chairman of the Board and Class II Trustee | Until 2014. 3 years. Trustee since 2005. Chairman of the Board since 2007. | Consultant and private investor. Formerly, Chief Investment Officer (1982-1992), Chief Financial Officer (1988-1990) and Director (1982-1992), New England Life. Formerly, Chairperson, New England Mutual Funds (1982-1992). Formerly, President and Chief Executive Officer, State Street Management & Research (1992-2000). Formerly, Chairperson, State Street Research Mutual Funds (1992-2000). Formerly, Director, W.P. Carey, LLC (1998-2004) and First Pioneer Farm Credit Corp. (2002-2006). Directorships in the Last Five Years.(1) None. | |||
| Principal Officers who are not Trustees | ||||||
| Position(s) | ||||||
| with the | Length of | Principal Occupation(s) | ||||
| Name and Year of Birth | Trust | Service | During Past Five Years | |||
| Scott H. Page 1959 | President | Since 2008 | Vice President of EVM and BMR. | |||
| Payson F. Swaffield 1956 | Vice President | Since 2011 | Chief Income Investment Officer of EVC. Vice President of EVM and BMR. | |||
| Barbara E. Campbell 1957 | Treasurer | Since 2003 | Vice President of EVM and BMR. | |||
| Maureen A. Gemma 1960 | Vice President, Secretary and Chief Legal Officer | Vice President since 2011, Secretary since 2007 and Chief Legal Officer since 2008 | Vice President of EVM and BMR. | |||
| Paul M. O’Neil 1953 | Chief Compliance Officer | Since 2004 | Vice President of EVM and BMR. | |||
| (1) | During their respective tenures, the Trustees (except Mr. Eston and Ms. Taggart) also served as trustees of one or more of the following Eaton Vance funds (which operated in the years noted): Eaton Vance Credit Opportunities Fund (launched in 2005 and terminated in 2010); Eaton Vance Insured Florida Plus Municipal Bond Fund (launched in 2002 and terminated in 2009); and Eaton Vance National Municipal Income Trust (launched in 1998 and terminated in 2009). | |
| (A) | APS Trustee |
45
Eaton Vance
Senior Floating-Rate Trust
October 31, 2011
IMPORTANT NOTICES
Privacy. The Eaton Vance organization is committed to ensuring your financial privacy. Each of the financial institutions identified below has in effect the following policy (“Privacy Policy”) with respect to nonpublic personal information about its customers:
| • | Only such information received from you, through application forms or otherwise, and information about your Eaton Vance fund transactions will be collected. This may include information such as name, address, social security number, tax status, account balances and transactions. |
| • | None of such information about you (or former customers) will be disclosed to anyone, except as permitted by law (which includes disclosure to employees necessary to service your account). In the normal course of servicing a customer’s account, Eaton Vance may share information with unaffiliated third parties that perform various required services such as transfer agents, custodians and broker/dealers. |
| • | Policies and procedures (including physical, electronic and procedural safeguards) are in place that are designed to protect the confidentiality of such information. |
| • | We reserve the right to change our Privacy Policy at any time upon proper notification to you. Customers may want to review our Privacy Policy periodically for changes by accessing the link on our homepage: www.eatonvance.com. |
Our pledge of privacy applies to the following entities within the Eaton Vance organization: the Eaton Vance Family of Funds, Eaton Vance Management, Eaton Vance Investment Counsel, Eaton Vance Distributors, Inc., Eaton Vance Trust Company, Eaton Vance Management’s Real Estate Investment Group and Boston Management and Research. In addition, our Privacy Policy applies only to those Eaton Vance customers who are individuals and who have a direct relationship with us. If a customer’s account (i.e. fund shares) is held in the name of a third-party financial advisor/broker-dealer, it is likely that only such advisor’s privacy policies apply to the customer. This notice supersedes all previously issued privacy disclosures. For more information about Eaton Vance’s Privacy Policy, please call 1-800-262-1122.
Delivery of Shareholder Documents. The Securities and Exchange Commission (SEC) permits funds to deliver only one copy of shareholder documents, including prospectuses, proxy statements and shareholder reports, to fund investors with multiple accounts at the same residential or post office box address. This practice is often called “householding” and it helps eliminate duplicate mailings to shareholders. Eaton Vance, or your financial advisor, may household the mailing of your documents indefinitely unless you instruct Eaton Vance, or your financial advisor, otherwise. If you would prefer that your Eaton Vance documents not be householded, please contact Eaton Vance at 1-800-262-1122, or contact your financial advisor. Your instructions that householding not apply to delivery of your Eaton Vance documents will be effective within 30 days of receipt by Eaton Vance or your financial advisor.
Portfolio Holdings. Each Eaton Vance Fund and its underlying Portfolio(s) (if applicable) will file a schedule of portfolio holdings on Form N-Q with the SEC for the first and third quarters of each fiscal year. The Form N-Q will be available on the Eaton Vance website at www.eatonvance.com, by calling Eaton Vance at 1-800-262-1122 or in the EDGAR database on the SEC’s website at www.sec.gov. Form N-Q may also be reviewed and copied at the SEC’s public reference room in Washington, D.C. (call 1-800-732-0330 for information on the operation of the public reference room).
Proxy Voting. From time to time, funds are required to vote proxies related to the securities held by the funds. The Eaton Vance Funds or their underlying Portfolios (if applicable) vote proxies according to a set of policies and procedures approved by the Funds’ and Portfolios’ Boards. You may obtain a description of these policies and procedures and information on how the Funds or Portfolios voted proxies relating to portfolio securities during the most recent 12-month period ended June 30, without charge, upon request, by calling 1-800-262-1122 and by accessing the SEC’s website at www.sec.gov.
Additional Notice to Shareholders. The Fund may redeem or purchase its outstanding auction preferred shares (APS) in order to maintain compliance with regulatory requirements, borrowing or rating agency requirements of for other purposes as it deems appropriate or necessary. The Fund also may purchase shares of its common stock in the open market when they trade at a discount to net asset value or at other times if the Fund determines such purchases are advisable. There can be no assurance that the Fund will take such action or that such purchases would reduce the discount.
Closed-End Fund Information. The Eaton Vance closed-end funds make certain quarterly fund performance data and information about portfolio characteristics (such as top holdings and asset allocation) available on the Eaton Vance website after the end of each calendar quarter-end. Certain month end fund performance data for the funds, including total returns, are posted to the website shortly after the end of each calendar month. Portfolio holdings for the most recent calendar quarter-end are also posted to the website approximately 30 days following the end of the quarter. This information is available at www.eatonvance.com on the fund information pages under “Individual Investors – Closed-End Funds”.
46
This Page Intentionally Left Blank
This Page Intentionally Left Blank
Investment Adviser and Administrator
Eaton Vance Management
Eaton Vance Management
Two International Place
Boston, MA 02110
Custodian
State Street Bank and Trust Company
State Street Bank and Trust Company
200 Clarendon Street
Boston, MA 02116
Transfer Agent
American Stock Transfer & Trust Company
American Stock Transfer & Trust Company
59 Maiden Lane
Plaza Level
New York, NY 10038
Independent Registered Public Accounting Firm
Deloitte & Touche LLP
Deloitte & Touche LLP
200 Berkeley Street
Boston, MA 02116-5022
Fund Offices
Two International Place
Two International Place
Boston, MA 02110
| 2025-12/11 | CE-FLRTSRC |
Item 2. Code of Ethics
The registrant has adopted a code of ethics applicable to its Principal Executive Officer, Principal Financial Officer and Principal Accounting Officer. The registrant undertakes to provide a copy of such code of ethics to any person upon request, without charge, by calling
1-800-262-1122.
1-800-262-1122.
Item 3. Audit Committee Financial Expert
The registrant’s Board has designated William H. Park, an independent trustee, as its audit committee financial expert. Mr. Park is a certified public accountant who is a consultant and private investor. Previously, he served as the Chief Financial Officer of Aveon Group, L.P. (an investment management firm), as the Vice Chairman of Commercial Industrial Finance Corp. (specialty finance company), as President and Chief Executive Officer of Prizm Capital Management, LLC (investment management firm), as Executive Vice President and Chief Financial Officer of United Asset Management Corporation (an institutional investment management firm) and as a Senior Manager at Price Waterhouse (now PricewaterhouseCoopers) (an independent registered public accounting firm).
Item 4. Principal Accountant Fees and Services
(a)-(d)
The following table presents the aggregate fees billed to the registrant for the registrant’s fiscal years ended October 31, 2010 and October 31, 2011 by the registrant’s principal accountant, Deloitte & Touche LLP (“D&T”), for professional services rendered for the audit of the registrant’s annual financial statements and fees billed for other services rendered by D&T during such periods.
| Fiscal Years Ended | 10/31/10 | 10/31/11 | ||||||
| Audit Fees | $ | 76,490 | $ | 77,250 | ||||
Audit-Related Fees(1) | $ | 5,330 | $ | 5,330 | ||||
Tax Fees(2) | $ | 14,540 | $ | 14,690 | ||||
All Other Fees(3) | $ | 1,400 | $ | 1,200 | ||||
| Total | $ | 97,760 | $ | 98,470 | ||||
| (1) | Audit-related fees consist of the aggregate fees billed for assurance and related services that are reasonably related to the performance of the audit of the registrant’s financial statements and are not reported under the category of audit fees and specifically include fees for the performance of certain agreed-upon procedures relating to the registrant’s auction preferred shares. | |
| (2) | Tax fees consist of the aggregate fees billed for professional services rendered by the principal accountant relating to tax compliance, tax advice, and tax planning and specifically include fees for tax return preparation and other related tax compliance/planning matters | |
| (3) | All other fees consist of the aggregate fees billed for products and services provided by the registrant’s principal accountant other than audit, audit-related, and tax services. |
(e)(1) The registrant’s audit committee has adopted policies and procedures relating to the pre-approval of services provided by the registrant’s principal accountant (the “Pre-Approval Policies”). The Pre-Approval Policies establish a framework intended to assist the audit committee in the proper discharge of its pre-approval responsibilities. As a general matter, the Pre-Approval Policies (i) specify certain types of audit, audit-related, tax, and other services determined to be pre-approved by the audit committee; and (ii) delineate specific procedures governing the mechanics of the pre-approval process, including the approval and monitoring of audit and non-audit service fees. Unless a service is specifically pre-approved under the Pre-Approval Policies, it must be separately pre-approved by the Audit Committee.
The Pre-Approval Policies and the types of audit and non-audit services pre-approved therein must be reviewed and ratified by the registrant’s audit committee at least annually. The registrant’s audit committee maintains full responsibility for the appointment, compensation, and oversight of the work of the registrant’s principal accountant.
(e)(2) No services described in paragraphs (b)-(d) above were approved by the registrant’s audit committee pursuant to the “de minimis exception” set forth in Rule 2-01 (c)(7)(i)(C) of Regulation S-X.
(f) Not applicable.
(g) The following table presents (i) the aggregate non-audit fees (i.e., fees for audit-related, tax, and other services) billed to the registrant by D&T for the registrant’s fiscal years ended October 31, 2010 and October 31, 2011; and (ii) the aggregate non-audit fees (i.e., fees for audit-related, tax, and other services) billed to the Eaton Vance organization by D&T for the same time periods.
| Fiscal Years Ended | 10/31/10 | 10/31/11 | ||||||
Registrant | $ | 21,270 | $ | 21,220 | ||||
Eaton Vance(1) | $ | 278,901 | $ | 226,431 | ||||
| (1) | Certain subsidiaries of Eaton Vance Corp. provide ongoing services to the registrant. |
(h) The registrant’s audit committee has considered whether the provision by the registrant’s principal accountant of non-audit services to the registrant’s investment adviser and any entity controlling, controlled by, or under common control with the adviser that provides ongoing services to the registrant that were not pre-approved pursuant to Rule 2-01(c)(7)(ii) of Regulation S-X is compatible with maintaining the principal accountant’s independence.
Item 5. Audit Committee of Listed Registrants
The registrant has a separately-designated standing audit committee established in accordance with Section 3(a)(58)(A) of the Securities and Exchange Act of 1934, as amended. William H. Park (Chair), Scott E. Eston, Helen Frame Peters, Lynn A. Stout and Ralph F. Verni are the members of the registrant’s audit committee.
Item 6. Schedule of Investments
Please see schedule of investments contained in the Report to Stockholders included under Item 1 of this Form N-CSR.
Item 7. Disclosure of Proxy Voting Policies and Procedures for Closed-End Management Investment Companies
The Board of Trustees of the Trust has adopted a proxy voting policy and procedure (the “Fund Policy”), pursuant to which the Trustees have delegated proxy voting responsibility to the Fund’s investment adviser and adopted the investment adviser’s proxy voting policies and procedures (the “Policies”) which are described below. The Trustees will review the Fund’s proxy voting records from time to time and will annually consider approving the Policies for the upcoming year. In the event that a conflict of interest arises between the Fund’s shareholders and the investment adviser, the administrator, or any of their affiliates or any affiliate of the Fund, the investment adviser will generally refrain from voting the proxies related to the companies giving rise to such conflict until it consults with the Board’s Special Committee except as contemplated under the Fund Policy. The Board’s Special Committee will instruct the investment adviser on the appropriate course of action.
The Policies are designed to promote accountability of a company’s management to its shareholders and to align the interests of management with those shareholders. An independent proxy voting service (“Agent”), currently Institutional Shareholder Services, Inc., has been retained to assist in the voting of
proxies through the provision of vote analysis, implementation and recordkeeping and disclosure services. The investment adviser will generally vote proxies through the Agent. The Agent is required to vote all proxies and/or refer them back to the investment adviser pursuant to the Policies. It is generally the policy of the investment adviser to vote in accordance with the recommendation of the Agent. The Agent shall refer to the investment adviser proxies relating to mergers and restructurings, and the disposition of assets, termination, liquidation and mergers contained in mutual fund proxies. The investment adviser will normally vote against anti-takeover measures and other proposals designed to limit the ability of shareholders to act on possible transactions, except in the case of closed-end management investment companies. The investment adviser generally supports management on social and environmental proposals. The investment adviser may abstain from voting from time to time where it determines that the costs associated with voting a proxy outweighs the benefits derived from exercising the right to vote or the economic effect on shareholders interests or the value of the portfolio holding is indeterminable or insignificant.
In addition, the investment adviser will monitor situations that may result in a conflict of interest between the Fund’s shareholders and the investment adviser, the administrator, or any of their affiliates or any affiliate of the Fund by maintaining a list of significant existing and prospective corporate clients. The investment adviser’s personnel responsible for reviewing and voting proxies on behalf of the Fund will report any proxy received or expected to be received from a company included on that list to the personnel of the investment adviser identified in the Policies. If such personnel expect to instruct the Agent to vote such proxies in a manner inconsistent with the guidelines of the Policies or the recommendation of the Agent, the personnel will consult with members of senior management of the investment adviser to determine if a material conflict of interests exists. If it is determined that a material conflict does exist, the investment adviser will seek instruction on how to vote from the Special Committee.
Information on how the Fund voted proxies relating to portfolio securities during the most recent 12 month period ended June 30 is available (1) without charge, upon request, by calling 1-800-262-1122, and (2) on the Securities and Exchange Commission’s website at http://www.sec.gov.
Item 8. Portfolio Managers of Closed-End Management Investment Companies
Scott H. Page, Craig P. Russ, Peter M. Campo and other Eaton Vance Management (“EVM”) investment professionals comprise the investment team responsible for the overall and day-to-day management of the Trust’s investments as well as allocations of the Trust’s assets between common and preferred stocks. Messrs. Page, Russ and Campo are the portfolio managers responsible for the day-to-day management of the Trust’s investments.
Mr. Page has been an Eaton Vance portfolio manager since 1996 and is a Vice President of EVM and Boston Management and Research, an Eaton Vance subsidiary (“BMR”). He is head of Eaton Vance’s Bank Loan Investment Group. Mr. Russ has been an Eaton Vance portfolio manager since 2001 and is a Vice President of EVM and BMR. Mr. Campo joined Eaton Vance in 2003 and is a Vice President of EVM and BMR. This information is provided as of the date of filing of this report.
The following table shows, as of the Trust’s most recent fiscal year end, the number of accounts each portfolio manager managed in each of the listed categories and the total assets (in millions of dollars) in the accounts managed within each category. The table also shows the number of accounts with respect to which the advisory fee is based on the performance of the account, if any, and the total assets (in millions of dollars) in those accounts.
| Number | Number of Accounts | Total Assets of | |||||||||||||||
| of All | Total Assets of | Paying a | Accounts Paying a | ||||||||||||||
| Accounts | All Accounts | Performance Fee | Performance Fee | ||||||||||||||
| Scott H. Page | |||||||||||||||||
| Registered Investment Companies | 12 | $ | 18,042.5 | 0 | $ | 0 | |||||||||||
| Other Pooled Investment Vehicles | 6 | $ | 6,359.5 | 1 | $ | 489.5 | |||||||||||
| Other Accounts | 2 | $ | 1,307.1 | 0 | $ | 0 | |||||||||||
| Craig P. Russ | |||||||||||||||||
| Registered Investment Companies | 8 | $ | 15,743.2 | 0 | $ | 0 | |||||||||||
| Other Pooled Investment Vehicles | 1 | $ | 3,659.2 | 0 | $ | 0 | |||||||||||
| Other Accounts | 2 | $ | 1,307.1 | 0 | $ | 0 | |||||||||||
| Peter M. Campo | |||||||||||||||||
| Registered Investment Companies | 1 | $ | 799.7 | 0 | $ | 0 | |||||||||||
| Other Pooled Investment Vehicles | 0 | $ | 0 | 0 | $ | 0 | |||||||||||
| Other Accounts | 0 | $ | 0 | 0 | $ | 0 | |||||||||||
The following table shows the dollar range of Trust shares beneficially owned by each portfolio manager as of the Trust’s most recent fiscal year end.
| Portfolio Manager | Dollar Range of Equity Securities Owned in the Trust | |
| Scott H. Page | $100,001 — $500,000 | |
| Craig P. Russ | None | |
| Peter M. Campo | None |
Potential for Conflicts of Interest. It is possible that conflicts of interest may arise in connection with a portfolio manager’s management of the Trust’s investments on the one hand and investments of other accounts for which a portfolio manager is responsible on the other. For example, a portfolio manager may have conflicts of interest in allocating management time, resources and investment opportunities among the Trust and other accounts he or she advises. In addition, due to differences in the investment strategies or restrictions between the Trust and the other accounts, a portfolio manager may take action with respect to another account that differs from the action taken with respect to the Trust. In some cases, another account managed by a portfolio manager may compensate the investment adviser based on the performance of the securities held by that account. The existence of such a performance based fee may create additional conflicts of interest for a portfolio manager in the allocation of management time, resources and investment opportunities. Whenever conflicts of interest arise, a portfolio manager will endeavor to exercise his or her discretion in a manner that he or she believes is equitable to all interested persons. EVM has adopted several policies and procedures designed to address these potential conflicts including a code of ethics and policies which govern the investment adviser’s trading practices, including among other things the aggregation and allocation of trades among clients, brokerage allocation, cross trades and best execution.
Compensation Structure for EVM
Compensation of EVM’s portfolio managers and other investment professionals has three primary components: (1) a base salary, (2) an annual cash bonus, and (3) annual stock-based compensation
consisting of options to purchase shares of EVC’s nonvoting common stock and/or restricted shares of EVC’s nonvoting common stock. EVM’s investment professionals also receive certain retirement, insurance and other benefits that are broadly available to EVM’s employees. Compensation of EVM’s investment professionals is reviewed primarily on an annual basis. Cash bonuses, stock-based compensation awards, and adjustments in base salary are typically paid or put into effect at or shortly after the October 31st fiscal year end of EVC.
Method to Determine Compensation. EVM compensates its portfolio managers based primarily on the scale and complexity of their portfolio responsibilities and the total return performance of managed funds and accounts versus the benchmark(s) stated in the prospectus, as well as an appropriate peer group (as described below). In addition to rankings within peer groups of funds on the basis of absolute performance, consideration may also be given to relative risk-adjusted performance. Risk-adjusted performance measures include, but are not limited to, the Sharpe Ratio. Performance is normally based on periods ending on the September 30th preceding fiscal year end. Fund performance is normally evaluated primarily versus peer groups of funds as determined by Lipper Inc. and/or Morningstar, Inc. When a fund’s peer group as determined by Lipper or Morningstar is deemed by EVM’s management not to provide a fair comparison, performance may instead be evaluated primarily against a custom peer group. In evaluating the performance of a fund and its manager, primary emphasis is normally placed on three-year performance, with secondary consideration of performance over longer and shorter periods. For funds that are tax-managed or otherwise have an objective of after-tax returns, performance is measured net of taxes. For other funds, performance is evaluated on a pre-tax basis. For funds with an investment objective other than total return (such as current income), consideration will also be given to the fund’s success in achieving its objective. For managers responsible for multiple funds and accounts, investment performance is evaluated on an aggregate basis, based on averages or weighted averages among managed funds and accounts. Funds and accounts that have performance-based advisory fees are not accorded disproportionate weightings in measuring aggregate portfolio manager performance.
The compensation of portfolio managers with other job responsibilities (such as heading an investment group or providing analytical support to other portfolios) will include consideration of the scope of such responsibilities and the managers’ performance in meeting them.
EVM seeks to compensate portfolio managers commensurate with their responsibilities and performance, and competitive with other firms within the investment management industry. EVM participates in investment-industry compensation surveys and utilizes survey data as a factor in determining salary, bonus and stock-based compensation levels for portfolio managers and other investment professionals. Salaries, bonuses and stock-based compensation are also influenced by the operating performance of EVM and its parent company. The overall annual cash bonus pool is based on a substantially fixed percentage of pre-bonus operating income. While the salaries of EVM’s portfolio managers are comparatively fixed, cash bonuses and stock-based compensation may fluctuate significantly from year to year, based on changes in manager performance and other factors as described herein. For a high performing portfolio manager, cash bonuses and stock-based compensation may represent a substantial portion of total compensation.
Item 9. Purchases of Equity Securities by Closed-End Management Investment Company and Affiliated Purchasers
No such purchases this period.
Item 10. Submission of Matters to a Vote of Security Holders
No Material Changes.
Item 11. Controls and Procedures
(a) It is the conclusion of the registrant’s principal executive officer and principal financial officer that the effectiveness of the registrant’s current disclosure controls and procedures (such disclosure controls and procedures having been evaluated within 90 days of the date of this filing) provide reasonable assurance that the information required to be disclosed by the registrant has been recorded, processed, summarized and reported within the time period specified in the Commission’s rules and forms and that the information required to be disclosed by the registrant has been accumulated and communicated to the registrant’s principal executive officer and principal financial officer in order to allow timely decisions regarding required disclosure.
(b) There have been no changes in the registrant’s internal controls over financial reporting during the second fiscal quarter of the period covered by this report that has materially affected, or is reasonably likely to materially affect, the registrant’s internal control over financial reporting.
Item 12. Exhibits
| (a)(1) | Registrant’s Code of Ethics — Not applicable (please see Item 2). | |
| (a)(2)(i) | Treasurer’s Section 302 certification. | |
| (a)(2)(ii) | President’s Section 302 certification. | |
| (b) | Combined Section 906 certification. |
Signatures
Pursuant to the requirements of the Securities Exchange Act of 1934 and the Investment Company Act of 1940, the registrant has duly caused this report to be signed on its behalf by the undersigned, thereunto duly authorized.
Eaton Vance Senior Floating-Rate Trust
| By: | /s/ Scott H. Page President |
Date: December 19, 2011
Pursuant to the requirements of the Securities Exchange Act of 1934 and the Investment Company Act of 1940, this report has been signed below by the following persons on behalf of the registrant and in the capacities and on the dates indicated.
| By: | /s/ Barbara E. Campbell Treasurer |
Date: December 19, 2011
| By: | /s/ Scott H. Page President |
Date: December 19, 2011