UNITED STATES
SECURITIES AND EXCHANGE COMMISSION
Washington, D.C. 20549
FORM N-CSR
CERTIFIED SHAREHOLDER REPORT OF REGISTERED
MANAGEMENT INVESTMENT COMPANIES
Investment Company Act file number | 811- 21411 | |||||||
| ||||||||
Eaton Vance Senior Floating-Rate Trust | ||||||||
(Exact name of registrant as specified in charter) | ||||||||
| ||||||||
The Eaton Vance Building, 255 State Street, Boston, Massachusetts |
| 02109 | ||||||
(Address of principal executive offices) |
| (Zip code) | ||||||
| ||||||||
Alan R. Dynner The Eaton Vance Building, 255 State Street, Boston, Massachusetts 02109 | ||||||||
(Name and address of agent for service) | ||||||||
| ||||||||
Registrant’s telephone number, including area code: | (617) 482-8260 |
| ||||||
| ||||||||
Date of fiscal year end: | October 31 |
| ||||||
| ||||||||
Date of reporting period: | October 31, 2005 |
| ||||||
Item 1. Reports to Stockholders

Annual Report October 31, 2005
EATON VANCE
SENIOR
FLOATING-RATE
TRUST


IMPORTANT NOTICES REGARDING PRIVACY,
DELIVERY OF SHAREHOLDER DOCUMENTS,
PORTFOLIO HOLDINGS AND PROXY VOTING
Privacy. The Eaton Vance organization is committed to ensuring your financial privacy. Each of the financial institutions identified below has in effect the following policy ("Privacy Policy") with respect to nonpublic personal information about its customers:
• Only such information received from you, through application forms or otherwise, and information about your Eaton Vance fund transactions will be collected. This may include information such as name, address, social security number, tax status, account balances and transactions.
• None of such information about you (or former customers) will be disclosed to anyone, except as permitted by law (which includes disclosure to employees necessary to service your account). In the normal course of servicing a customer's account, Eaton Vance may share information with unaffiliated third parties that perform various required services such as transfer agents, custodians and broker/dealers.
• Policies and procedures (including physical, electronic and procedural safeguards) are in place that are designed to protect the confidentiality of such information.
• We reserve the right to change our Privacy Policy at any time upon proper notification to you. Customers may want to review our Policy periodically for changes by accessing the link on our homepage: www.eatonvance.com.
Our pledge of privacy applies to the following entities within the Eaton Vance organization: the Eaton Vance Family of Funds, Eaton Vance Management, Eaton Vance Investment Counsel, Boston Management and Research, and Eaton Vance Distributors, Inc.
In addition, our Privacy Policy only applies to those Eaton Vance customers who are individuals and who have a direct relationship with us. If a customer's account (i.e. fund shares) is held in the name of a third-party financial adviser/broker-dealer, it is likely that only such adviser's privacy policies apply to the customer. This notice supersedes all previously issued privacy disclosures.
For more information about Eaton Vance's Privacy Policy, please call 1-800-262-1122.
Delivery of Shareholder Documents. The Securities and Exchange Commission (the "SEC") permits funds to deliver only one copy of shareholder documents, including prospectuses, proxy statements and shareholder reports, to fund investors with multiple accounts at the same residential or post office box address. This practice is often called "householding" and it helps eliminate duplicate mailings to shareholders.
Eaton Vance, or your financial adviser, may household the mailing of your documents indefinitely unless you instruct Eaton Vance, or your financial adviser, otherwise.
If you would prefer that your Eaton Vance documents not be householded, please contact Eaton Vance at 1-800-262-1122, or contact your financial adviser.
Your instructions that householding not apply to delivery of your Eaton Vance documents will be effective within 30 days of receipt by Eaton Vance or your financial adviser.
Portfolio Holdings. Each Eaton Vance Fund and Portfolio (if applicable) will file a schedule of its portfolio holdings on Form N-Q with the SEC for the first and third quarters of each fiscal year. The Form N-Q will be available on the Eaton Vance website www.eatonvance.com, by calling Eaton Vance at 1-800-262-1122 or in the EDGAR database on the SEC's website at www.sec.gov. Form N-Q may also be reviewed and copied at the SEC's public reference room in Washington, D.C. (call 1-800-732-0330 for information on the operation of the public reference room).
Proxy Voting. From time to time, funds are required to vote proxies related to the securities held by the funds. The Eaton Vance Funds or their underlying Portfolios (if applicable) vote proxies according to a set of policies and procedures approved by the Funds' and Portfolios' Boards. You may obtain a description of these policies and procedures and information on how the Funds or Portfolios voted proxies relating to Portfolio securities during the most recent 12 month period ended June 30, without charge, upon request, by calling 1-800-262-1122. This description is also available on the SEC's website at www.sec.gov.
Eaton Vance Senior Floating-Rate Trust as of October 31, 2005
MANAGEMENT’S DISCUSSION OF PERFORMANCE
The Trust
Performance for the Past Year
• Based on its October 2005 monthly dividend of $0.115 and a closing share price of $17.21, Eaton Vance Senior Floating-Rate Trust, a closed-end fund traded on the New York Stock Exchange (the “Trust”) had a market yield of 8.02%.(1)
• Based on share price (traded on the New York Stock Exchange), the Trust had a total return of -7.77% for the year ended October 31, 2005. That return was the result of a decrease in share price from $19.94 on October 31, 2004 to $17.21 on October 31, 2005 and the reinvestment of $1.230 in regular monthly dividends.(2)
• Based on net asset value (NAV), the Trust had a total return of 5.57% for the year ended October 31, 2005. That return was the result of a decrease in net asset value per share from $18.97 on October 31, 2004 to $18.74 on October 31, 2005, and the reinvestment of all distributions.(2)
• For performance comparison, the S&P/LSTA Leveraged Loan Index – an unmanaged index of U.S. dollar-denominated leveraged loans – had a total return of 5.03% for the year ended October 31,2005.(3)
The Trust’s Investments
• The Trust’s loan investments included 376 borrowers at October 31, 2005, with an average loan size of just 0.22% of total assets and no industry constituting more than 8.0% of the Trust. Building and development (including manufacturers of building products and companies that manage/own apartments, shopping malls and commercial office buildings, among others), health care, cable/satellite television, leisure goods/activities/movies and chemicals/plastics were the largest industry weightings.
• The loan market performed well, as short-term interest rates rose throughout the fiscal year. The London Inter-Bank Offered Rate (LIBOR) – the primary benchmark over which loan interest rates are typically set – kept pace with the Federal Reserve’s rate hikes over the period. Yield spreads narrowed to just below their historical range. The loan market outperformed the high-yield bond market during the fiscal year.
• In the wake of Hurricanes Katrina and Rita, management identified approximately 10 companies that were directly impacted by the storms. While these loans suffered very little price impact, management nonetheless selectively reduced exposure to the hardest-hit companies, generally at prices above par. The hurricanes had little initial overall impact on the Trust.
• While the Trust slightly outperformed its benchmark Index on a net asset value basis, it did have some laggard performers. The Trust’s investments in the auto and auto parts areas weakened during the period, reflecting the ailing auto industry. However, these positions were below a market weighting and did not have a significantly negative impact on performance.
• At October 31, 2005, the Trust had leverage in the amount of approximately 39% of the Trust’s total assets. The Trust employs leverage though the issuance of Auction Preferred Shares (“APS”).(3) Use of financial leverage creates an opportunity for increased income but, at the same time, creates special risks (including the likelihood of greater volatility of net asset value and market price of common shares). The cost of the Trust’s APS rises and falls with changes in short-term interest rates. Such increases/decreases in cost of the Trust’s APS may be offset by increased/decreased income from the Trust’s senior loan investments.
• The decline in the Trust’s share price during the fiscal year was consistent with the market price decline of other closed-end income funds. The fundamentals and technical factors of the floating-rate loan asset class remained strong.
The views expressed in this report are those of the portfolio managers and are current only through the end of the period of the report as stated on the cover. These views are subject to change at any time based upon market or other conditions, and Eaton Vance disclaims any responsibility to update such views. These views may not be relied on as investment advice and, because investment decisions for an Eaton Vance fund are based on many factors, may not be relied on as an indication of trading intent on behalf of any Eaton Vance fund.
Past performance is no guarantee of future results. Returns are historical and are calculated by determining the percentage change in net asset value or share price (as applicable) with all distributions reinvested. Investment return and principal value will fluctuate so that shares, when sold, may be worth more or less than their original cost. Performance is for the stated time period only; due to market volatility, the Trust’s current performance may be lower or higher than the quoted return. For performance as of the most recent month end, please refer to www.eatonvance.com.
(1) The Trust’s market yield is calculated by dividing the most recent dividend per share by the share market price at the end of the period and annualizing the result.
(2) Performance results reflect the effect of leverage resulting from the Trust’s Auction Preferred Shares. In the event of a rise in long-term interest rates, the value of the Trust’s investment portfolio could decline, which would reduce the asset coverage for its Auction Preferred Shares.
(3) It is not possible to invest directly in an Index. The Index’s total return reflects changes in value of the loans comprising the Index and accrual of interest and does not reflect the commissions or expenses that would have been incurred if an investor individually purchased or sold the loans represented in the Index. Unlike the Trust, the Index’s return does not reflect the effect of leverage, such as the issuance of Auction Preferred Shares.
Shares of the Trust are not insured by the FDIC and are not deposits or other obligations of, or guaranteed by, any depository institution. Shares are subject to investment risks, including possible loss of principal invested.
2
Eaton Vance Senior Floating-Rate Trust as of October 31, 2005
PERFORMANCE
Performance(1)
Average Annual Total Return (by share price, NYSE) |
|
|
|
One Year |
| -7.77 | % |
Life of Fund (11/28/03) |
| 0.49 |
|
|
|
|
|
Average Annual Total Return (at net asset value) |
|
|
|
One Year |
| 5.57 | % |
Life of Fund (11/28/03) |
| 5.02 |
|
(1) Performance results reflect the effect of leverage resulting from the Trust’s issuance of Auction Preferred Shares. In the event of a rise in long-term interest rates, the value of the Trust’s investment portfolio could decline, which would reduce the asset coverage for its Auction Preferred Shares.
Past performance is no guarantee of future results. Returns are historical and are calculated by determining the percentage change in net asset value or share price (as applicable) with all distributions reinvested. Investment return and principal value will fluctuate so that shares, when sold, may be worth more or less than their original cost. Performance is for the stated time period only; due to market volatility, the Fund’s current performance may be lower or higher than the quoted return. For performance as of the most recent month end, please refer to www.eatonvance.com.
Diversification by Industries(2)
By total investments
Building & Development |
| 7.4 | % |
Healthcare |
| 6.4 |
|
Cable & Satellite Television |
| 5.8 |
|
Leisure Goods/Activities/Movies |
| 5.5 |
|
Chemicals & Plastics |
| 5.2 |
|
Automotive |
| 4.7 |
|
Telecommunications |
| 4.7 |
|
Publishing |
| 4.2 |
|
Radio & Television |
| 3.9 |
|
Business Equip. & Services |
| 3.8 |
|
Containers & Glass Products |
| 3.7 |
|
Lodging & Casinos |
| 3.6 |
|
Oil & Gas |
| 2.9 |
|
Food Products |
| 2.9 |
|
Retailers (Except Food & Drug) |
| 2.8 |
|
Utilities |
| 2.7 |
|
Conglomerates |
| 2.3 |
|
Financial Intermediaries |
| 2.2 |
|
Food Service |
| 2.1 |
|
Electronics/Electrical |
| 2.1 |
|
Forest Products |
| 1.8 |
|
Ecological Services & Equip. |
| 1.6 |
|
Aerospace & Defense |
| 1.5 |
|
Nonferrous Metals/Minerals |
| 1.5 |
|
Beverage & Tobacco |
| 1.2 |
|
Home Furnishings |
| 1.0 |
|
Food/Drug Retailers |
| 1.0 |
|
Equipment Leasing |
| 0.9 |
|
Industrial Equipment |
| 0.9 |
|
Insurance |
| 0.6 |
|
Cosmetics/Toiletries |
| 0.6 |
|
Drugs |
| 0.5 |
|
Clothing/Textiles |
| 0.4 |
|
Surface Transport |
| 0.4 |
|
Rail Industries |
| 0.4 |
|
Air Transport |
| 0.4 |
|
Real Estate |
| 0.3 |
|
Farming/Agriculture |
| 0.2 |
|
Broker, Dealers and Inv. Houses |
| 0.0 |
|
Steel |
| 0.0 |
|
(2) Reflects the Trust’s investments as of October 31, 2005. Industries are shown as a percentage of the Trust’s total loan and corporate bond and note investments. Portfolio information may not be representative of current or future investments andare subject to change due to active management.
Diversification by Sectors (3)
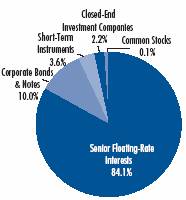
(3) Diversification by Sectors reflects the Trust’s total investments as of October 31, 2005. Sectors are shown as a percentage of the Trust’s total investments. Trust statistics may not be representative of the Trust’s current or future investments and are subject to change due to active management.
3
Eaton Vance Senior Floating-Rate Trust as of October 31, 2005
PORTFOLIO OF INVESTMENTS
| Senior, Floating Rate Interests — 135.9%(1) | |||||||||||
| Principal Amount | Borrower/Tranche Description | Value | |||||||||
| Aerospace and Defense — 2.2% | |||||||||||
| Alliant Techsystems, Inc. | |||||||||||
| $ | 612,750 | Term Loan, 5.23%, Maturing March 31, 2009 | $ | 616,389 | |||||||
| Delta Air Lines, Inc. | |||||||||||
| 1,725,000 | Term Loan, 12.89%, Maturing March 16, 2008 | 1,762,376 | |||||||||
| Hexcel Corp. | |||||||||||
| 435,778 | Term Loan, 5.81%, Maturing March 1, 2012 | 440,408 | |||||||||
| K&F Industries, Inc. | |||||||||||
| 1,653,949 | Term Loan, 6.38%, Maturing November 18, 2012 | 1,673,590 | |||||||||
| Mid-Western Aircraft Systems, Inc. | |||||||||||
| 1,925,175 | Term Loan, 6.41%, Maturing December 31, 2011 | 1,952,368 | |||||||||
| Standard Aero Holdings, Inc. | |||||||||||
| 1,550,687 | Term Loan, 6.25%, Maturing August 24, 2012 | 1,570,556 | |||||||||
| Transdigm, Inc. | |||||||||||
| 1,974,950 | Term Loan, 6.19%, Maturing July 22, 2010 | 2,006,219 | |||||||||
| Vought Aircraft Industries, Inc. | |||||||||||
| 2,169,576 | Term Loan, 6.59%, Maturing December 22, 2011 | 2,194,255 | |||||||||
| Wam Aquisition, S.A. | |||||||||||
| 695,118 | Term Loan, 6.77%, Maturing April 8, 2013 | 697,514 | |||||||||
| 695,118 | Term Loan, 7.27%, Maturing April 8, 2014 | 700,015 | |||||||||
| Wyle Laboratories, Inc. | |||||||||||
| 278,600 | Term Loan, 6.46%, Maturing January 28, 2011 | 282,605 | |||||||||
| $ | 13,896,295 | ||||||||||
| Air Transport — 0.3% | |||||||||||
| United Airlines, Inc. | |||||||||||
| $ | 1,978,812 | DIP Loan, 7.96%, Maturing December 31, 2006 | $ | 2,002,930 | |||||||
| $ | 2,002,930 | ||||||||||
| Automotive — 6.8% | |||||||||||
| Accuride Corp. | |||||||||||
| $ | 2,355,126 | Term Loan, 6.18%, Maturing January 31, 2012 | $ | 2,373,378 | |||||||
| AE Europe Group, LLC | |||||||||||
| 1,000,000 | Term Loan, 9.00%, Maturing October 11, 2011 | 1,008,125 | |||||||||
| Affina Group, Inc. | |||||||||||
| 1,532,685 | Term Loan, 6.40%, Maturing November 30, 2011 | 1,535,798 | |||||||||
| Axletech International Holding, Inc. | |||||||||||
| 1,750,000 | Term Loan, 12.25%, Maturing April 21, 2013 | 1,767,500 | |||||||||
| Collins & Aikman Products Co. | |||||||||||
| 1,030,155 | Term Loan, 10.25%, Maturing August 31, 2011 | 990,972 | |||||||||
| CSA Acquisition Corp. | |||||||||||
| 418,504 | Term Loan, 6.06%, Maturing December 23, 2011 | 421,120 | |||||||||
| 673,246 | Term Loan, 6.06%, Maturing December 23, 2011 | 677,454 | |||||||||
| Principal Amount | Borrower/Tranche Description | Value | |||||||||
| Automotive (continued) | |||||||||||
| Dayco Products, LLC | |||||||||||
| $ | 2,850,666 | Term Loan, 7.04%, Maturing June 23, 2011 | $ | 2,884,517 | |||||||
| Exide Technologies, Inc. | |||||||||||
| 635,437 | Term Loan, 9.37%, Maturing May 5, 2010 | 640,202 | |||||||||
| 635,437 | Term Loan, 9.37%, Maturing May 5, 2010 | 639,408 | |||||||||
| Federal-Mogul Corp. | |||||||||||
| 7,434,538 | Revolving Loan, 5.83%, Maturing December 9, 2006(2) | 6,963,687 | |||||||||
| 2,559,019 | Term Loan, 6.33%, Maturing December 9, 2006 | 2,410,542 | |||||||||
| Goodyear Tire & Rubber Co. | |||||||||||
| 880,000 | Term Loan, 3.50%, Maturing April 30, 2010 | 887,858 | |||||||||
| 2,950,000 | Term Loan, 7.06%, Maturing April 30, 2010 | 2,979,193 | |||||||||
| 1,000,000 | Term Loan, 7.81%, Maturing March 1, 2011 | 994,250 | |||||||||
| HLI Operating Co., Inc. | |||||||||||
| 1,934,697 | Term Loan, 7.15%, Maturing June 3, 2009 | 1,932,107 | |||||||||
| 675,000 | Term Loan, 9.26%, Maturing June 3, 2010 | 666,000 | |||||||||
| Key Automotive Group | |||||||||||
| 1,369,654 | Term Loan, 6.86%, Maturing June 29, 2010 | 1,369,654 | |||||||||
| R.J. Tower Corp. | |||||||||||
| 1,725,000 | DIP Revolving Loan, 7.25%, Maturing February 2, 2007 | 1,757,703 | |||||||||
| Tenneco Automotive, Inc. | |||||||||||
| 1,994,254 | Term Loan, 6.08%, Maturing December 12, 2009 | 2,027,596 | |||||||||
| 1,656,896 | Term Loan, 6.11%, Maturing December 12, 2010 | 1,684,597 | |||||||||
| TI Automotive, Ltd. | |||||||||||
| 1,197,280 | Term Loan, 6.91%, Maturing June 30, 2011 | 1,177,825 | |||||||||
| TRW Automotive, Inc. | |||||||||||
| 4,563,383 | Term Loan, 5.25%, Maturing June 30, 2012 | 4,612,344 | |||||||||
| $ | 42,401,830 | ||||||||||
| Beverage and Tobacco — 2.0% | |||||||||||
| Alliance One International, Inc. | |||||||||||
| $ | 776,100 | Term Loan, 6.73%, Maturing May 13, 2010 | $ | 776,100 | |||||||
| Constellation Brands, Inc. | |||||||||||
| 4,516,628 | Term Loan, 5.66%, Maturing November 30, 2011 | 4,571,112 | |||||||||
| Culligan International Co. | |||||||||||
| 1,163,250 | Term Loan, 6.47%, Maturing September 30, 2011 | 1,178,276 | |||||||||
| National Dairy Holdings, L.P. | |||||||||||
| 796,000 | Term Loan, 6.08%, Maturing March 15, 2012 | 802,467 | |||||||||
| National Distribution Company | |||||||||||
| 785,000 | Term Loan, 10.56%, Maturing June 22, 2010 | 786,962 | |||||||||
| Southern Wine & Spirits of America, Inc. | |||||||||||
| 3,780,427 | Term Loan, 5.53%, Maturing May 31, 2012 | 3,819,808 | |||||||||
| Sunny Delight Beverages Co. | |||||||||||
| 395,294 | Term Loan, 8.25%, Maturing August 20, 2010 | 398,753 | |||||||||
| $ | 12,333,478 | ||||||||||
See notes to financial statements
4
Eaton Vance Senior Floating-Rate Trust as of October 31, 2005
PORTFOLIO OF INVESTMENTS CONT'D
| Principal Amount | Borrower/Tranche Description | Value | |||||||||
| Building and Development — 11.4% | |||||||||||
| Biomed Realty, L.P. | |||||||||||
| $ | 3,055,000 | Term Loan, 6.11%, Maturing May 31, 2010 | $ | 3,058,819 | |||||||
| DMB/CHII, LLC | |||||||||||
| 156,820 | Term Loan, 6.44%, Maturing March 3, 2007 | 157,212 | |||||||||
| Formica Corp. | |||||||||||
| 1,027,281 | Term Loan, 9.03%, Maturing June 10, 2010 | 1,032,417 | |||||||||
| 711,251 | Term Loan, 9.03%, Maturing June 10, 2010 | 714,808 | |||||||||
| 363,737 | Term Loan, 9.03%, Maturing June 10, 2010 | 365,556 | |||||||||
| 293,509 | Term Loan, 9.03%, Maturing June 10, 2010 | 294,977 | |||||||||
| FT-FIN Acquisition, LLC | |||||||||||
| 1,238,862 | Term Loan, 8.56%, Maturing November 17, 2007 | 1,241,959 | |||||||||
| General Growth Properties, Inc. | |||||||||||
| 8,649,208 | Term Loan, 6.09%, Maturing November 12, 2008 | 8,754,798 | |||||||||
| Hovstone Holdings, LLC | |||||||||||
| 1,230,000 | Term Loan, 6.29%, Maturing February 28, 2009 | 1,233,075 | |||||||||
| Kyle Acquisition Group, LLC | |||||||||||
| 519,288 | Term Loan, 6.06%, Maturing July 20, 2008 | 525,779 | |||||||||
| 1,480,712 | Term Loan, 6.06%, Maturing July 20, 2010 | 1,499,221 | |||||||||
| Landsource Communities, LLC | |||||||||||
| 6,011,000 | Term Loan, 6.50%, Maturing March 31, 2010 | 6,065,478 | |||||||||
| Lion Gables Realty Limited | |||||||||||
| 1,734,132 | Term Loan, 5.63%, Maturing September 30, 2006 | 1,743,453 | |||||||||
| LNR Property Corp. | |||||||||||
| 4,772,669 | Term Loan, 6.73%, Maturing February 3, 2008 | 4,811,447 | |||||||||
| 1,399,850 | Term Loan, 6.89%, Maturing February 3, 2008 | 1,408,599 | |||||||||
| LNR Property Holdings | |||||||||||
| 935,000 | Term Loan, 8.23%, Maturing March 8, 2008 | 939,091 | |||||||||
| Longyear Holdings, Inc. | |||||||||||
| 399,000 | Term Loan, 6.53%, Maturing July 28, 2012 | 399,499 | |||||||||
| 99,750 | Term Loan, 6.53%, Maturing July 28, 2012 | 99,875 | |||||||||
| MAAX Corp. | |||||||||||
| 713,489 | Term Loan, 6.75%, Maturing June 4, 2011 | 709,922 | |||||||||
| Mueller Group, Inc. | |||||||||||
| 2,550,000 | Term Loan, 6.40%, Maturing October 3, 2012 | 2,587,113 | |||||||||
| NCI Building Systems, Inc. | |||||||||||
| 743,050 | Term Loan, 4.94%, Maturing June 18, 2010 | 746,998 | |||||||||
| Newkirk Master, L.P. | |||||||||||
| 4,952,747 | Term Loan, 5.99%, Maturing August 11, 2008 | 5,027,038 | |||||||||
| Newkirk Tender Holdings, LLC | |||||||||||
| 1,806,929 | Term Loan, 8.59%, Maturing May 25, 2006 | 1,811,446 | |||||||||
| 777,778 | Term Loan, 10.09%, Maturing May 25, 2006 | 779,722 | |||||||||
| Nortek, Inc. | |||||||||||
| 2,767,025 | Term Loan, 5.92%, Maturing August 27, 2011 | 2,799,538 | |||||||||
| Panolam Industries Holdings, Inc. | |||||||||||
| 650,000 | Term Loan, 6.77%, Maturing September 30, 2012 | 659,750 | |||||||||
| Principal Amount | Borrower/Tranche Description | Value | |||||||||
| Building and Development (continued) | |||||||||||
| Ply Gem Industries, Inc. | |||||||||||
| $ | 1,296,123 | Term Loan, 6.16%, Maturing February 12, 2011 | $ | 1,305,034 | |||||||
| 190,458 | Term Loan, 6.16%, Maturing February 12, 2011 | 191,768 | |||||||||
| 699,129 | Term Loan, 6.64%, Maturing February 12, 2011 | 703,936 | |||||||||
| South Edge, LLC | |||||||||||
| 612,500 | Term Loan, 5.31%, Maturing October 31, 2007 | 615,307 | |||||||||
| 787,500 | Term Loan, 5.56%, Maturing October 31, 2009 | 796,031 | |||||||||
| St. Marys Cement, Inc. | |||||||||||
| 5,885,126 | Term Loan, 6.02%, Maturing December 4, 2010 | 5,988,115 | |||||||||
| Stile Acquisition Corp. | |||||||||||
| 1,898,833 | Term Loan, 6.20%, Maturing April 6, 2013 | 1,893,977 | |||||||||
| Stile U.S. Acquisition Corp. | |||||||||||
| 1,902,067 | Term Loan, 6.20%, Maturing April 6, 2013 | 1,897,204 | |||||||||
| Sugarloaf Mills, L.P. | |||||||||||
| 1,500,000 | Term Loan, 5.79%, Maturing April 7, 2007 | 1,507,500 | |||||||||
| TE / Tousa Senior, LLC | |||||||||||
| 1,575,000 | Term Loan, 6.56%, Maturing August 1, 2008 | 1,600,594 | |||||||||
| The Woodlands Community Property Co. | |||||||||||
| 1,022,000 | Term Loan, 6.11%, Maturing November 30, 2007 | 1,028,387 | |||||||||
| 1,319,000 | Term Loan, 8.11%, Maturing November 30, 2007 | 1,338,785 | |||||||||
| Tousa/Kolter, LLC | |||||||||||
| 2,070,000 | Term Loan, 6.11%, Maturing January 7, 2008(2) | 2,080,350 | |||||||||
| Trustreet Properties, Inc. | |||||||||||
| 865,000 | Term Loan, 5.86%, Maturing April 8, 2010 | 873,109 | |||||||||
| $ | 71,287,687 | ||||||||||
| Business Equipment and Services — 5.8% | |||||||||||
| Acco Brands Corp. | |||||||||||
| $ | 655,000 | Term Loan, 5.73%, Maturing August 17, 2012 | $ | 663,269 | |||||||
| Affinion Group, Inc. | |||||||||||
| 2,300,000 | Term Loan, 6.91%, Maturing October 17, 2012 | 2,286,103 | |||||||||
| Allied Security Holdings, LLC | |||||||||||
| 1,680,947 | Term Loan, 7.78%, Maturing June 30, 2010 | 1,704,060 | |||||||||
| Baker & Taylor, Inc. | |||||||||||
| 2,200,000 | Term Loan, 10.48%, Maturing May 6, 2011 | 2,227,500 | |||||||||
| Buhrmann US, Inc. | |||||||||||
| 3,139,275 | Term Loan, 6.30%, Maturing December 31, 2010 | 3,200,098 | |||||||||
| DynCorp International, LLC | |||||||||||
| 1,223,850 | Term Loan, 6.75%, Maturing February 11, 2011 | 1,228,950 | |||||||||
| Global Imaging Systems, Inc. | |||||||||||
| 485,122 | Term Loan, 5.38%, Maturing May 10, 2010 | 488,761 | |||||||||
| Info USA, Inc. | |||||||||||
| 795,455 | Term Loan, 6.53%, Maturing March 25, 2009 | 797,443 | |||||||||
| 842,177 | Term Loan, 6.78%, Maturing June 4, 2010 | 844,282 | |||||||||
See notes to financial statements
5
Eaton Vance Senior Floating-Rate Trust as of October 31, 2005
PORTFOLIO OF INVESTMENTS CONT'D
| Principal Amount | Borrower/Tranche Description | Value | |||||||||
| Business Equipment and Services (continued) | |||||||||||
| Iron Mountain, Inc. | |||||||||||
| $ | 2,309,748 | Term Loan, 5.63%, Maturing April 2, 2011 | $ | 2,333,928 | |||||||
| Language Line, Inc. | |||||||||||
| 2,524,970 | Term Loan, 8.45%, Maturing June 11, 2011 | 2,548,010 | |||||||||
| Mitchell International, Inc. | |||||||||||
| 373,966 | Term Loan, 6.15%, Maturing August 11, 2011 | 377,589 | |||||||||
| N.E.W. Holdings I, LLC | |||||||||||
| 983,886 | Term Loan, 7.35%, Maturing July 1, 2011 | 998,030 | |||||||||
| Protection One, Inc. | |||||||||||
| 923,579 | Term Loan, 6.91%, Maturing April 18, 2011 | 934,836 | |||||||||
| Sungard Data Systems, Inc. | |||||||||||
| 13,067,250 | Term Loan, 6.28%, Maturing February 11, 2013 | 13,197,178 | |||||||||
| Transaction Network Services, Inc. | |||||||||||
| 816,033 | Term Loan, 5.85%, Maturing May 4, 2012 | 824,193 | |||||||||
| US Investigations Services, Inc. | |||||||||||
| 700,000 | Term Loan, 6.57%, Maturing October 14, 2012 | 707,875 | |||||||||
| Western Inventory Services | |||||||||||
| 525,000 | Term Loan, 10.77%, Maturing October 14, 2011 | 530,250 | |||||||||
| Williams Scotsman, Inc. | |||||||||||
| 750,000 | Term Loan, 6.66%, Maturing June 28, 2010 | 759,844 | |||||||||
| $ | 36,652,199 | ||||||||||
| Cable and Satellite Television — 8.1% | |||||||||||
| Adelphia Communications Corp. | |||||||||||
| $ | 3,382,074 | DIP Loan, 6.31%, Maturing March 31, 2006 | $ | 3,398,985 | |||||||
| Atlantic Broadband Finance, LLC | |||||||||||
| 4,294,434 | Term Loan, 6.52%, Maturing September 1, 2011 | 4,369,587 | |||||||||
| Bragg Communications, Inc. | |||||||||||
| 1,039,500 | Term Loan, 5.86%, Maturing August 31, 2011 | 1,054,443 | |||||||||
| Bresnan Communications, LLC | |||||||||||
| 2,000,000 | Term Loan, 7.57%, Maturing March 31, 2010 | 2,028,750 | |||||||||
| Canadian Cable Acquisition Co., Inc. | |||||||||||
| 1,485,000 | Term Loan, 7.02%, Maturing July 30, 2011 | 1,500,315 | |||||||||
| Cebridge Connections, Inc. | |||||||||||
| 1,487,350 | Term Loan, 7.04%, Maturing February 23, 2009 | 1,496,646 | |||||||||
| 1,576,000 | Term Loan, 9.95%, Maturing February 23, 2010 | 1,585,850 | |||||||||
| Charter Communications Operating, LLC | |||||||||||
| 12,180,482 | Term Loan, 7.50%, Maturing April 27, 2011 | 12,226,670 | |||||||||
| Insight Midwest Holdings, LLC | |||||||||||
| 7,108,313 | Term Loan, 6.06%, Maturing December 31, 2009 | 7,217,163 | |||||||||
| MCC Iowa, LLC | |||||||||||
| 5,925,225 | Term Loan, 6.03%, Maturing February 3, 2014 | 6,017,807 | |||||||||
| Mediacom Illinois, LLC | |||||||||||
| 2,798,850 | Term Loan, 6.28%, Maturing March 31, 2013 | 2,845,644 | |||||||||
| Principal Amount | Borrower/Tranche Description | Value | |||||||||
| Cable and Satellite Television (continued) | |||||||||||
| NTL, Inc. | |||||||||||
| $ | 2,300,000 | Term Loan, 7.14%, Maturing April 13, 2012 | $ | 2,311,691 | |||||||
| UGS Corp. | |||||||||||
| 2,508,303 | Term Loan, 6.08%, Maturing March 31, 2012 | 2,548,280 | |||||||||
| UPC Broadband Holdings B.V. | |||||||||||
| 2,390,000 | Term Loan, 6.55%, Maturing September 30, 2012 | 2,413,279 | |||||||||
| $ | 51,015,110 | ||||||||||
| Chemicals and Plastics — 7.5% | |||||||||||
| Basell Af S.A.R.L. | |||||||||||
| $ | 312,500 | Term Loan, 6.58%, Maturing August 1, 2013 | $ | 317,871 | |||||||
| 62,500 | Term Loan, 6.58%, Maturing August 1, 2013 | 63,548 | |||||||||
| 312,500 | Term Loan, 7.24%, Maturing August 1, 2014 | 318,262 | |||||||||
| 62,500 | Term Loan, 7.24%, Maturing August 1, 2014 | 63,626 | |||||||||
| Brenntag AG | |||||||||||
| 2,975,000 | Term Loan, 6.81%, Maturing February 27, 2012 | 2,989,503 | |||||||||
| Celanese Holdings, LLC | |||||||||||
| 3,600,930 | Term Loan, 6.31%, Maturing April 6, 2011 | 3,657,645 | |||||||||
| Gentek, Inc. | |||||||||||
| 564,492 | Term Loan, 6.61%, Maturing February 25, 2011 | 569,008 | |||||||||
| 800,000 | Term Loan, 9.90%, Maturing February 25, 2012 | 790,000 | |||||||||
| Hercules, Inc. | |||||||||||
| 871,725 | Term Loan, 5.86%, Maturing October 8, 2010 | 882,839 | |||||||||
| Hexion Specialty Chemicals, Inc. | |||||||||||
| 170,000 | Term Loan, 5.88%, Maturing May 31, 2012 | 172,337 | |||||||||
| 705,931 | Term Loan, 6.38%, Maturing May 31, 2012 | 715,637 | |||||||||
| 974,857 | Term Loan, 6.56%, Maturing May 31, 2012 | 988,261 | |||||||||
| Huntsman, LLC | |||||||||||
| 4,739,101 | Term Loan, 5.72%, Maturing August 16, 2012 | 4,769,991 | |||||||||
| Innophos, Inc. | |||||||||||
| 938,985 | Term Loan, 6.21%, Maturing August 13, 2010 | 950,527 | |||||||||
| Invista B.V. | |||||||||||
| 3,601,940 | Term Loan, 6.31%, Maturing April 29, 2011 | 3,662,723 | |||||||||
| 1,562,761 | Term Loan, 6.31%, Maturing April 29, 2011 | 1,589,133 | |||||||||
| ISP Chemco, Inc. | |||||||||||
| 1,477,500 | Term Loan, 5.83%, Maturing March 27, 2011 | 1,495,969 | |||||||||
| Kraton Polymer, LLC | |||||||||||
| 3,291,660 | Term Loan, 6.42%, Maturing December 23, 2010 | 3,345,150 | |||||||||
| Mosaic Co. | |||||||||||
| 1,432,800 | Term Loan, 5.23%, Maturing February 21, 2012 | 1,450,038 | |||||||||
| Nalco Co. | |||||||||||
| 6,594,684 | Term Loan, 5.81%, Maturing November 4, 2010 | 6,701,392 | |||||||||
| PQ Corp. | |||||||||||
| 1,270,495 | Term Loan, 6.06%, Maturing February 11, 2012 | 1,280,818 | |||||||||
See notes to financial statements
6
Eaton Vance Senior Floating-Rate Trust as of October 31, 2005
PORTFOLIO OF INVESTMENTS CONT'D
| Principal Amount | Borrower/Tranche Description | Value | |||||||||
| Chemicals and Plastics (continued) | |||||||||||
| Professional Paint, Inc. | |||||||||||
| $ | 926,250 | Term Loan, 7.18%, Maturing September 30, 2011 | $ | 933,197 | |||||||
| Rockwood Specialties Group, Inc. | |||||||||||
| 4,427,750 | Term Loan, 6.47%, Maturing December 10, 2012 | 4,503,854 | |||||||||
| Solo Cup Co. | |||||||||||
| 2,670,141 | Term Loan, 6.44%, Maturing February 27, 2011 | 2,682,157 | |||||||||
| Wellman, Inc. | |||||||||||
| 2,250,000 | Term Loan, 7.71%, Maturing February 10, 2009 | 2,293,126 | |||||||||
| $ | 47,186,612 | ||||||||||
| Clothing / Textiles — 0.3% | |||||||||||
| Propex Fabrics, Inc. | |||||||||||
| $ | 336,875 | Term Loan, 6.28%, Maturing December 31, 2011 | $ | 337,717 | |||||||
| St. John Knits International, Inc. | |||||||||||
| 700,762 | Term Loan, 6.56%, Maturing March 23, 2012 | 711,273 | |||||||||
| The William Carter Co. | |||||||||||
| 867,188 | Term Loan, 5.72%, Maturing July 14, 2012 | 878,841 | |||||||||
| $ | 1,927,831 | ||||||||||
| Conglomerates — 3.7% | |||||||||||
| Amsted Industries, Inc. | |||||||||||
| $ | 3,448,368 | Term Loan, 6.62%, Maturing October 15, 2010 | $ | 3,497,221 | |||||||
| Blount, Inc. | |||||||||||
| 627,161 | Term Loan, 6.57%, Maturing August 9, 2010 | 636,373 | |||||||||
| Euramax International, Inc. | |||||||||||
| 713,213 | Term Loan, 6.38%, Maturing June 28, 2012 | 708,118 | |||||||||
| 501,316 | Term Loan, 11.09%, Maturing June 28, 2013 | 493,796 | |||||||||
| 248,684 | Term Loan, 11.09%, Maturing June 28, 2013 | 244,954 | |||||||||
| Goodman Global Holdings, Inc. | |||||||||||
| 1,195,963 | Term Loan, 6.38%, Maturing December 23, 2011 | 1,214,649 | |||||||||
| Jarden Corp. | |||||||||||
| 1,655,850 | Term Loan, 5.69%, Maturing January 24, 2012 | 1,664,336 | |||||||||
| 2,938,749 | Term Loan, 6.02%, Maturing January 24, 2012 | 2,964,725 | |||||||||
| Johnson Diversey, Inc. | |||||||||||
| 3,284,624 | Term Loan, 5.46%, Maturing November 3, 2009 | 3,322,604 | |||||||||
| Penn Engineering & Manufacturing Corp. | |||||||||||
| 466,492 | Term Loan, 6.52%, Maturing May 25, 2011 | 472,323 | |||||||||
| Polymer Group, Inc. | |||||||||||
| 485,204 | Term Loan, 7.25%, Maturing April 27, 2010 | 492,886 | |||||||||
| 1,750,000 | Term Loan, 10.25%, Maturing April 27, 2011 | 1,789,375 | |||||||||
| PP Acquisition Corp. | |||||||||||
| 2,484,409 | Term Loan, 6.34%, Maturing November 12, 2011 | 2,489,999 | |||||||||
| Rexnord Corp. | |||||||||||
| 2,915,120 | Term Loan, 6.15%, Maturing December 31, 2011 | 2,952,774 | |||||||||
| $ | 22,944,133 | ||||||||||
| Principal Amount | Borrower/Tranche Description | Value | |||||||||
| Containers and Glass Products — 5.8% | |||||||||||
| Berry Plastics Corp. | |||||||||||
| $ | 2,125,392 | Term Loan, 5.86%, Maturing December 2, 2011 | $ | 2,151,959 | |||||||
| BWAY Corp. | |||||||||||
| 603,260 | Term Loan, 6.31%, Maturing June 30, 2011 | 612,309 | |||||||||
| Consolidated Container Holding, LLC | |||||||||||
| 1,185,000 | Term Loan, 7.50%, Maturing December 15, 2008 | 1,200,553 | |||||||||
| Crown America, Inc. | |||||||||||
| 500,000 | Revolving Loan, 2.75%, Maturing February 15, 2010(2) | 482,500 | |||||||||
| Dr. Pepper/Seven Up Bottling Group, Inc. | |||||||||||
| 5,926,371 | Term Loan, 6.16%, Maturing December 19, 2010 | 6,017,489 | |||||||||
| Graham Packaging Holdings Co. | |||||||||||
| 4,367,000 | Term Loan, 6.56%, Maturing October 7, 2011 | 4,427,046 | |||||||||
| 2,000,000 | Term Loan, 8.25%, Maturing April 7, 2012 | 2,040,000 | |||||||||
| Graphic Packaging International, Inc. | |||||||||||
| 5,666,972 | Term Loan, 6.52%, Maturing August 8, 2010 | 5,726,475 | |||||||||
| IPG (US), Inc. | |||||||||||
| 2,168,613 | Term Loan, 6.12%, Maturing July 28, 2011 | 2,200,237 | |||||||||
| Owens-Illinois, Inc. | |||||||||||
| 1,216,832 | Term Loan, 5.67%, Maturing April 1, 2007 | 1,226,211 | |||||||||
| 788,429 | Term Loan, 5.78%, Maturing April 1, 2008 | 795,984 | |||||||||
| 1,178,229 | Term Loan, 5.87%, Maturing April 1, 2008 | 1,189,274 | |||||||||
| Smurfit-Stone Container Corp. | |||||||||||
| 589,195 | Term Loan, 3.33%, Maturing November 1, 2010 | 596,744 | |||||||||
| 4,673,416 | Term Loan, 5.72%, Maturing November 1, 2011 | 4,733,296 | |||||||||
| 1,485,461 | Term Loan, 5.88%, Maturing November 1, 2011 | 1,504,494 | |||||||||
| U.S. Can Corp. | |||||||||||
| 1,477,500 | Term Loan, 7.65%, Maturing January 15, 2010 | 1,484,887 | |||||||||
| $ | 36,389,458 | ||||||||||
| Cosmetics / Toiletries — 0.8% | |||||||||||
| American Safety Razor Co. | |||||||||||
| $ | 960,175 | Term Loan, 6.61%, Maturing February 28, 2012 | $ | 975,178 | |||||||
| Church & Dwight Co., Inc. | |||||||||||
| 1,551,446 | Term Loan, 5.82%, Maturing May 30, 2011 | 1,569,547 | |||||||||
| Prestige Brands, Inc. | |||||||||||
| 1,773,000 | Term Loan, 6.32%, Maturing April 7, 2011 | 1,797,379 | |||||||||
| Revlon Consumer Products Corp. | |||||||||||
| 945,000 | Term Loan, 9.86%, Maturing July 9, 2010 | 976,303 | |||||||||
| $ | 5,318,407 | ||||||||||
| Drugs — 0.7% | |||||||||||
| Warner Chilcott Corp. | |||||||||||
| $ | 2,902,156 | Term Loan, 6.61%, Maturing January 18, 2012 | $ | 2,916,408 | |||||||
| 1,169,427 | Term Loan, 6.77%, Maturing January 18, 2012 | 1,175,170 | |||||||||
See notes to financial statements
7
Eaton Vance Senior Floating-Rate Trust as of October 31, 2005
PORTFOLIO OF INVESTMENTS CONT'D
| Principal Amount | Borrower/Tranche Description | Value | |||||||||
| Drugs (continued) | |||||||||||
| $ | 540,242 | Term Loan, 6.77%, Maturing January 18, 2012 | $ | 542,895 | |||||||
| $ | 4,634,473 | ||||||||||
| Ecological Services and Equipment — 2.3% | |||||||||||
| Alderwoods Group, Inc. | |||||||||||
| $ | 235,518 | Term Loan, 5.84%, Maturing September 29, 2009 | $ | 238,977 | |||||||
| Allied Waste Industries, Inc. | |||||||||||
| 1,310,943 | Term Loan, 4.02%, Maturing January 15, 2012 | 1,319,592 | |||||||||
| 3,469,280 | Term Loan, 6.04%, Maturing January 15, 2012 | 3,492,344 | |||||||||
| Envirocare of Utah, LLC | |||||||||||
| 1,532,841 | Term Loan, 6.95%, Maturing April 15, 2010 | 1,562,859 | |||||||||
| Environmental Systems, Inc. | |||||||||||
| 1,215,378 | Term Loan, 7.49%, Maturing December 12, 2008 | 1,238,546 | |||||||||
| 2,500,000 | Term Loan, 13.98%, Maturing December 12, 2010 | 2,550,000 | |||||||||
| IESI Corp. | |||||||||||
| 970,588 | Term Loan, 6.09%, Maturing January 20, 2012 | 983,327 | |||||||||
| Sensus Metering Systems, Inc. | |||||||||||
| 380,544 | Term Loan, 6.44%, Maturing December 17, 2010 | 385,062 | |||||||||
| 2,439,130 | Term Loan, 6.45%, Maturing December 17, 2010 | 2,468,095 | |||||||||
| $ | 14,238,802 | ||||||||||
| Electronics / Electrical — 3.1% | |||||||||||
| AMI Semiconductor, Inc. | |||||||||||
| $ | 2,081,799 | Term Loan, 5.58%, Maturing April 1, 2012 | $ | 2,093,942 | |||||||
| Aspect Software, Inc. | |||||||||||
| 650,000 | Term Loan, 6.56%, Maturing September 22, 2010 | 654,469 | |||||||||
| Communications & Power, Inc. | |||||||||||
| 1,022,222 | Term Loan, 6.03%, Maturing July 23, 2010 | 1,037,556 | |||||||||
| Enersys Capital, Inc. | |||||||||||
| 1,086,250 | Term Loan, 5.86%, Maturing March 17, 2011 | 1,096,434 | |||||||||
| Fairchild Semiconductor Corp. | |||||||||||
| 1,958,938 | Term Loan, 5.60%, Maturing December 31, 2010 | 1,973,630 | |||||||||
| Invensys International Holdings Limited | |||||||||||
| 1,773,096 | Term Loan, 7.79%, Maturing September 4, 2009 | 1,790,827 | |||||||||
| Rayovac Corp. | |||||||||||
| 3,721,300 | Term Loan, 6.00%, Maturing February 7, 2012 | 3,753,087 | |||||||||
| Security Co., Inc. | |||||||||||
| 987,505 | Term Loan, 7.31%, Maturing June 28, 2010 | 994,912 | |||||||||
| 1,000,000 | Term Loan, 11.25%, Maturing June 30, 2011 | 1,015,000 | |||||||||
| SSA Global Technologies, Inc. | |||||||||||
| 500,000 | Term Loan, 5.97%, Maturing September 22, 2011 | 503,125 | |||||||||
| Telcordia Technologies, Inc. | |||||||||||
| 1,970,100 | Term Loan, 6.36%, Maturing September 15, 2012 | 1,954,093 | |||||||||
| United Online, Inc. | |||||||||||
| 242,083 | Term Loan, 7.03%, Maturing December 13, 2008 | 243,294 | |||||||||
| Principal Amount | Borrower/Tranche Description | Value | |||||||||
| Electronics / Electrical (continued) | |||||||||||
| Vertafore, Inc. | |||||||||||
| $ | 1,379,135 | Term Loan, 6.57%, Maturing December 22, 2010 | $ | 1,394,650 | |||||||
| 500,000 | Term Loan, 9.51%, Maturing December 22, 2011 | 511,250 | |||||||||
| Viasystems, Inc. | |||||||||||
| 493,141 | Term Loan, 8.38%, Maturing September 30, 2009 | 499,921 | |||||||||
| $ | 19,516,190 | ||||||||||
| Equipment Leasing — 1.5% | |||||||||||
| Ashtead Group, PLC | |||||||||||
| $ | 1,000,000 | Term Loan, 6.06%, Maturing November 12, 2009 | $ | 1,010,833 | |||||||
| Maxim Crane Works, L.P. | |||||||||||
| 1,416,642 | Term Loan, 9.63%, Maturing January 28, 2012 | 1,452,059 | |||||||||
| United Rentals, Inc. | |||||||||||
| 1,121,250 | Term Loan, 2.87%, Maturing February 14, 2011 | 1,132,322 | |||||||||
| 5,522,156 | Term Loan, 6.32%, Maturing February 14, 2011 | 5,576,688 | |||||||||
| $ | 9,171,902 | ||||||||||
| Farming / Agriculture — 0.2% | |||||||||||
| Central Garden & Pet Co. | |||||||||||
| $ | 1,525,838 | Term Loan, 5.78%, Maturing May 15, 2009 | $ | 1,547,772 | |||||||
| $ | 1,547,772 | ||||||||||
| Financial Intermediaries — 2.1% | |||||||||||
| AIMCO Properties, L.P. | |||||||||||
| $ | 1,300,000 | Term Loan, 5.72%, Maturing November 2, 2009 | $ | 1,312,187 | |||||||
| 2,000,000 | Term Loan, 5.89%, Maturing November 2, 2009 | 2,026,876 | |||||||||
| Coinstar, Inc. | |||||||||||
| 577,601 | Term Loan, 6.10%, Maturing July 7, 2011 | 588,431 | |||||||||
| Fidelity National Information Solutions, Inc. | |||||||||||
| 6,455,488 | Term Loan, 5.69%, Maturing March 9, 2013 | 6,485,170 | |||||||||
| The Macerich Partnership, L.P. | |||||||||||
| 1,323,708 | Term Loan, 5.66%, Maturing April 25, 2006 | 1,326,190 | |||||||||
| 1,210,000 | Term Loan, 5.63%, Maturing April 25, 2010 | 1,219,075 | |||||||||
| $ | 12,957,929 | ||||||||||
| Food Products — 4.3% | |||||||||||
| Acosta Sales Co., Inc. | |||||||||||
| $ | 940,000 | Term Loan, 5.98%, Maturing August 13, 2010 | $ | 951,750 | |||||||
| Chiquita Brands, LLC | |||||||||||
| 1,187,025 | Term Loan, 6.57%, Maturing June 28, 2012 | 1,205,202 | |||||||||
| Del Monte Corp. | |||||||||||
| 875,600 | Term Loan, 5.73%, Maturing February 8, 2012 | 889,281 | |||||||||
| Dole Food Company, Inc. | |||||||||||
| 1,649,424 | Term Loan, 5.59%, Maturing April 18, 2012 | 1,665,093 | |||||||||
See notes to financial statements
8
Eaton Vance Senior Floating-Rate Trust as of October 31, 2005
PORTFOLIO OF INVESTMENTS CONT'D
| Principal Amount | Borrower/Tranche Description | Value | |||||||||
| Food Products (continued) | |||||||||||
| Herbalife International, Inc. | |||||||||||
| $ | 277,200 | Term Loan, 5.93%, Maturing December 21, 2010 | $ | 281,098 | |||||||
| Interstate Brands Corp. | |||||||||||
| 1,047,089 | Term Loan, 8.18%, Maturing July 19, 2007 | 1,057,298 | |||||||||
| Merisant Co. | |||||||||||
| 3,284,106 | Term Loan, 7.49%, Maturing January 11, 2010 | 3,243,055 | |||||||||
| Michael Foods, Inc. | |||||||||||
| 4,016,107 | Term Loan, 5.19%, Maturing November 21, 2010 | 4,083,878 | |||||||||
| 6,000,000 | Term Loan, 6.59%, Maturing November 20, 2011 | 6,086,250 | |||||||||
| Pinnacle Foods Holdings Corp. | |||||||||||
| 5,372,036 | Term Loan, 7.31%, Maturing November 25, 2010 | 5,445,901 | |||||||||
| Reddy Ice Group, Inc. | |||||||||||
| 1,970,000 | Term Loan, 5.87%, Maturing August 9, 2012 | 1,990,931 | |||||||||
| $ | 26,899,737 | ||||||||||
| Food Service — 3.4% | |||||||||||
| AFC Enterprises, Inc. | |||||||||||
| $ | 1,576,050 | Term Loan, 6.31%, Maturing May 11, 2011 | $ | 1,595,751 | |||||||
| Buffets, Inc. | |||||||||||
| 418,182 | Term Loan, 6.78%, Maturing June 28, 2009 | 422,364 | |||||||||
| 1,992,267 | Term Loan, 7.16%, Maturing June 28, 2009 | 2,012,190 | |||||||||
| Burger King Corp. | |||||||||||
| 1,416,450 | Term Loan, 5.83%, Maturing June 30, 2012 | 1,432,891 | |||||||||
| Carrols Corp. | |||||||||||
| 2,456,503 | Term Loan, 6.56%, Maturing December 31, 2010 | 2,493,351 | |||||||||
| CKE Restaurants, Inc. | |||||||||||
| 393,044 | Term Loan, 6.00%, Maturing May 1, 2010 | 395,991 | |||||||||
| Denny's, Inc. | |||||||||||
| 962,731 | Term Loan, 7.30%, Maturing September 21, 2009 | 977,474 | |||||||||
| Domino's, Inc. | |||||||||||
| 6,376,462 | Term Loan, 5.81%, Maturing June 25, 2010 | 6,486,724 | |||||||||
| Gate Gourmet Borrower, LLC | |||||||||||
| 1,425,791 | Term Loan, 11.39%, Maturing December 31, 2008 | 1,427,573 | |||||||||
| Jack in the Box, Inc. | |||||||||||
| 2,949,546 | Term Loan, 5.57%, Maturing January 8, 2011 | 2,978,121 | |||||||||
| Weight Watchers International, Inc. | |||||||||||
| 915,750 | Term Loan, 5.67%, Maturing March 31, 2010 | 926,434 | |||||||||
| $ | 21,148,864 | ||||||||||
| Food / Drug Retailers — 1.5% | |||||||||||
| Cumberland Farms, Inc. | |||||||||||
| $ | 859,427 | Term Loan, 6.30%, Maturing September 8, 2008 | $ | 864,262 | |||||||
| General Nutrition Centers, Inc. | |||||||||||
| 1,013,184 | Term Loan, 6.80%, Maturing December 5, 2008 | 1,027,960 | |||||||||
| Principal Amount | Borrower/Tranche Description | Value | |||||||||
| Food / Drug Retailers (continued) | |||||||||||
| $ | 1,000,000 | Revolving Loan, 0.00%, Maturing December 15, 2009(2) | $ | 980,625 | |||||||
| Giant Eagle, Inc. | |||||||||||
| 1,837,850 | Term Loan, 5.75%, Maturing August 6, 2009 | 1,868,864 | |||||||||
| The Jean Coutu Group (PJC), Inc. | |||||||||||
| 2,648,250 | Term Loan, 6.50%, Maturing July 30, 2011 | 2,681,147 | |||||||||
| The Pantry, Inc. | |||||||||||
| 2,049,424 | Term Loan, 6.34%, Maturing March 12, 2011 | 2,082,727 | |||||||||
| $ | 9,505,585 | ||||||||||
| Forest Products — 2.2% | |||||||||||
| Appleton Papers, Inc. | |||||||||||
| $ | 1,862,158 | Term Loan, 6.03%, Maturing June 11, 2010 | $ | 1,884,854 | |||||||
| Boise Cascade Holdings, LLC | |||||||||||
| 2,788,378 | Term Loan, 5.79%, Maturing October 29, 2011 | 2,830,396 | |||||||||
| Buckeye Technologies, Inc. | |||||||||||
| 3,119,072 | Term Loan, 5.89%, Maturing March 15, 2010 | 3,136,616 | |||||||||
| Escanaba Timber, LLC | |||||||||||
| 590,000 | Term Loan, 6.75%, Maturing May 2, 2008 | 590,737 | |||||||||
| Koch Cellulose, LLC | |||||||||||
| 197,887 | Term Loan, 5.36%, Maturing May 7, 2011 | 200,401 | |||||||||
| 642,778 | Term Loan, 5.77%, Maturing May 7, 2011 | 650,679 | |||||||||
| NewPage Corp. | |||||||||||
| 2,643,375 | Term Loan, 6.79%, Maturing May 2, 2011 | 2,669,809 | |||||||||
| RLC Industries Co. | |||||||||||
| 1,112,786 | Term Loan, 5.52%, Maturing February 24, 2010 | 1,119,741 | |||||||||
| Xerium Technologies, Inc. | |||||||||||
| 897,750 | Term Loan, 6.02%, Maturing May 18, 2012 | 910,375 | |||||||||
| $ | 13,993,608 | ||||||||||
| Healthcare — 9.0% | |||||||||||
| Alliance Imaging, Inc. | |||||||||||
| $ | 1,119,752 | Term Loan, 6.41%, Maturing December 29, 2011 | $ | 1,132,350 | |||||||
| AMN Healthcare, Inc. | |||||||||||
| 1,351,228 | Term Loan, 7.02%, Maturing October 2, 2008 | 1,353,762 | |||||||||
| AMR HoldCo, Inc. | |||||||||||
| 1,766,125 | Term Loan, 6.28%, Maturing February 10, 2012 | 1,781,579 | |||||||||
| Carl Zeiss Topco GMBH | |||||||||||
| 368,333 | Term Loan, 6.95%, Maturing March 22, 2013 | 370,635 | |||||||||
| 736,667 | Term Loan, 7.45%, Maturing March 21, 2014 | 742,192 | |||||||||
| 375,000 | Term Loan, 9.70%, Maturing September 22, 2014 | 381,562 | |||||||||
| Colgate Medical, Ltd. | |||||||||||
| 959,091 | Term Loan, 6.01%, Maturing December 30, 2008 | 968,682 | |||||||||
| Community Health Systems, Inc. | |||||||||||
| 7,169,056 | Term Loan, 5.61%, Maturing August 19, 2011 | 7,268,376 | |||||||||
See notes to financial statements
9
Eaton Vance Senior Floating-Rate Trust as of October 31, 2005
PORTFOLIO OF INVESTMENTS CONT'D
| Principal Amount | Borrower/Tranche Description | Value | |||||||||
| Healthcare (continued) | |||||||||||
| Concentra Operating Corpratio | |||||||||||
| $ | 2,400,000 | Term Loan, 6.05%, Maturing September 30, 2011 | $ | 2,430,751 | |||||||
| Conmed Corp. | |||||||||||
| 1,193,830 | Term Loan, 6.28%, Maturing December 31, 2007 | 1,209,747 | |||||||||
| Davita Inc. | |||||||||||
| 7,250,000 | Term Loan, 6.38%, Maturing October 5, 2012 | 7,365,797 | |||||||||
| Encore Medical IHC, Inc. | |||||||||||
| 1,464,792 | Term Loan, 6.62%, Maturing October 4, 2010 | 1,481,271 | |||||||||
| Envision Worldwide, Inc. | |||||||||||
| 1,285,556 | Term Loan, 9.01%, Maturing September 30, 2010 | 1,291,983 | |||||||||
| FHC Health Systems, Inc. | |||||||||||
| 928,571 | Term Loan, 9.87%, Maturing December 18, 2009 | 951,786 | |||||||||
| 650,000 | Term Loan, 11.87%, Maturing December 18, 2009 | 663,000 | |||||||||
| 500,000 | Term Loan, 12.87%, Maturing February 7, 2011 | 507,500 | |||||||||
| Genoa Healthcare Group, LLC | |||||||||||
| 384,000 | Term Loan, 7.23%, Maturing August 12, 2012 | 389,520 | |||||||||
| Healthcare Partners, LLC | |||||||||||
| 399,750 | Term Loan, 5.82%, Maturing March 2, 2011 | 403,373 | |||||||||
| Healthsouth Corp. | |||||||||||
| 922,688 | Term Loan, 6.53%, Maturing June 14, 2007 | 928,166 | |||||||||
| 260,000 | Term Loan, 3.55%, Maturing March 21, 2010 | 261,544 | |||||||||
| Kinetic Concepts, Inc. | |||||||||||
| 2,078,049 | Term Loan, 5.78%, Maturing August 11, 2010 | 2,103,158 | |||||||||
| Knowledge Learning Corp. | |||||||||||
| 3,769,727 | Term Loan, 6.59%, Maturing January 7, 2012 | 3,790,147 | |||||||||
| Leiner Health Products, Inc. | |||||||||||
| 982,563 | Term Loan, 7.70%, Maturing May 27, 2011 | 981,948 | |||||||||
| Lifecare Holdings, Inc. | |||||||||||
| 875,000 | Term Loan, 6.13%, Maturing August 11, 2012 | 827,422 | |||||||||
| Lifepoint Hospitals, Inc. | |||||||||||
| 4,076,483 | Term Loan, 5.44%, Maturing April 15, 2012 | 4,106,694 | |||||||||
| Magellan Health Services, Inc. | |||||||||||
| 1,111,111 | Term Loan, 3.76%, Maturing August 15, 2008 | 1,123,611 | |||||||||
| 1,513,889 | Term Loan, 5.87%, Maturing August 15, 2008 | 1,530,920 | |||||||||
| National Mentor, Inc. | |||||||||||
| 1,296,132 | Term Loan, 6.25%, Maturing September 30, 2011 | 1,312,333 | |||||||||
| Renal Advantage, Inc. | |||||||||||
| 350,000 | Term Loan, 6.44%, Maturing October 5, 2012 | 354,047 | |||||||||
| Select Medical Holding Corp. | |||||||||||
| 1,437,775 | Term Loan, 5.57%, Maturing February 24, 2012 | 1,440,372 | |||||||||
| Sunrise Medical Holdings, Inc. | |||||||||||
| 968,577 | Term Loan, 7.12%, Maturing May 13, 2010 | 969,788 | |||||||||
| Talecris Biotherapeutics, Inc. | |||||||||||
| 1,004,950 | Term Loan, 7.08%, Maturing March 31, 2010 | 1,007,462 | |||||||||
| Team Health, Inc. | |||||||||||
| 1,719,751 | Term Loan, 6.77%, Maturing March 23, 2011 | 1,724,051 | |||||||||
| Principal Amount | Borrower/Tranche Description | Value | |||||||||
| Healthcare (continued) | |||||||||||
| Vanguard Health Holding Co., LLC | |||||||||||
| $ | 2,220,738 | Term Loan, 6.21%, Maturing September 23, 2011 | $ | 2,252,661 | |||||||
| VWR International, Inc. | |||||||||||
| 1,189,933 | Term Loan, 6.69%, Maturing April 7, 2011 | 1,208,526 | |||||||||
| $ | 56,616,716 | ||||||||||
| Home Furnishings — 1.6% | |||||||||||
| Knoll, Inc. | |||||||||||
| $ | 1,890,000 | Term Loan, 5.88%, Maturing October 3, 2012 | $ | 1,918,350 | |||||||
| National Bedding Company, LLC | |||||||||||
| 550,000 | Term Loan, 8.99%, Maturing August 31, 2012 | 544,500 | |||||||||
| Sealy Mattress Co. | |||||||||||
| 2,283,186 | Term Loan, 5.73%, Maturing April 6, 2012 | 2,306,732 | |||||||||
| Simmons Co. | |||||||||||
| 5,309,654 | Term Loan, 5.96%, Maturing December 19, 2011 | 5,373,811 | |||||||||
| $ | 10,143,393 | ||||||||||
| Industrial Equipment — 1.2% | |||||||||||
| Alliance Laundry Holdings, LLC | |||||||||||
| $ | 963,050 | Term Loan, 6.14%, Maturing January 27, 2012 | $ | 977,195 | |||||||
| Douglas Dynamics Holdings, Inc. | |||||||||||
| 992,500 | Term Loan, 6.02%, Maturing December 16, 2010 | 1,004,906 | |||||||||
| Flowserve Corp. | |||||||||||
| 2,150,000 | Term Loan, 5.81%, Maturing August 10, 2012 | 2,181,579 | |||||||||
| Gleason Corp. | |||||||||||
| 462,480 | Term Loan, 6.74%, Maturing July 27, 2011 | 468,261 | |||||||||
| 1,250,000 | Term Loan, 9.42%, Maturing January 31, 2012 | 1,271,875 | |||||||||
| Itron, Inc. | |||||||||||
| 540,541 | Term Loan, 5.85%, Maturing December 17, 2010 | 544,933 | |||||||||
| Terex Corp. | |||||||||||
| 798,481 | Term Loan, 6.41%, Maturing June 30, 2009 | 809,960 | |||||||||
| $ | 7,258,709 | ||||||||||
| Insurance — 1.0% | |||||||||||
| Alliant Resources Group, Inc. | |||||||||||
| $ | 1,382,500 | Term Loan, 7.58%, Maturing August 31, 2011 | $ | 1,392,869 | |||||||
| CCC Information Services Group, Inc. | |||||||||||
| 1,003,342 | Term Loan, 6.83%, Maturing August 20, 2010 | 1,005,850 | |||||||||
| Conseco, Inc. | |||||||||||
| 2,529,913 | Term Loan, 5.97%, Maturing June 22, 2010 | 2,563,118 | |||||||||
| U.S.I. Holdings Corp. | |||||||||||
| 1,245,588 | Term Loan, 6.74%, Maturing August 11, 2008 | 1,251,037 | |||||||||
| $ | 6,212,874 | ||||||||||
See notes to financial statements
10
Eaton Vance Senior Floating-Rate Trust as of October 31, 2005
PORTFOLIO OF INVESTMENTS CONT'D
| Principal Amount | Borrower/Tranche Description | Value | |||||||||
| Leisure Goods / Activities / Movies — 8.4% | |||||||||||
| 24 Hour Fitness Worldwide, Inc. | |||||||||||
| $ | 1,675,000 | Term Loan, 6.78%, Maturing June 8, 2012 | $ | 1,703,266 | |||||||
| Alliance Atlantis Communications, Inc. | |||||||||||
| 621,875 | Term Loan, 5.83%, Maturing December 20, 2011 | 627,511 | |||||||||
| AMF Bowling Worldwide, Inc. | |||||||||||
| 1,770,463 | Term Loan, 6.76%, Maturing August 27, 2009 | 1,786,509 | |||||||||
| Cinemark, Inc. | |||||||||||
| 1,970,000 | Term Loan, 5.18%, Maturing March 31, 2011 | 1,995,610 | |||||||||
| Fender Musical Instruments Co. | |||||||||||
| 705,000 | Term Loan, 8.72%, Maturing March 30, 2012 | 712,050 | |||||||||
| Loews Cineplex Entertainment Corp. | |||||||||||
| 5,052,353 | Term Loan, 6.17%, Maturing July 30, 2011 | 5,085,512 | |||||||||
| Mega Blocks, Inc. | |||||||||||
| 1,645,875 | Term Loan, 5.88%, Maturing July 26, 2012 | 1,667,992 | |||||||||
| Metro-Goldwyn-Mayer Holdings, Inc. | |||||||||||
| 10,065,000 | Term Loan, 6.27%, Maturing April 8, 2012 | 10,162,510 | |||||||||
| Regal Cinemas Corp. | |||||||||||
| 7,467,035 | Term Loan, 6.02%, Maturing November 10, 2010 | 7,553,959 | |||||||||
| Riddell Bell Holdings, Inc. | |||||||||||
| 495,000 | Term Loan, 6.16%, Maturing September 30, 2011 | 503,044 | |||||||||
| Six Flags Theme Parks, Inc. | |||||||||||
| 7,823,591 | Term Loan, 6.71%, Maturing June 30, 2009 | 7,919,985 | |||||||||
| Universal City Development Partners, Ltd. | |||||||||||
| 1,846,050 | Term Loan, 6.01%, Maturing June 9, 2011 | 1,871,817 | |||||||||
| WMG Acquisition Corp. | |||||||||||
| 875,000 | Revolving Loan, 2.25%, Maturing February 28, 2010(2) | 852,305 | |||||||||
| 9,957,552 | Term Loan, 5.85%, Maturing February 28, 2011 | 10,070,610 | |||||||||
| Yankees Holdings & YankeeNets, LLC | |||||||||||
| 400,714 | Term Loan, 6.36%, Maturing June 25, 2007 | 404,721 | |||||||||
| $ | 52,917,401 | ||||||||||
| Lodging and Casinos — 5.0% | |||||||||||
| Alliance Gaming Corp. | |||||||||||
| $ | 4,949,372 | Term Loan, 6.77%, Maturing September 5, 2009 | $ | 4,949,372 | |||||||
| Ameristar Casinos, Inc. | |||||||||||
| 503,824 | Term Loan, 6.06%, Maturing December 31, 2006 | 506,973 | |||||||||
| CCM Merger, Inc. | |||||||||||
| 982,538 | Term Loan, 5.93%, Maturing April 25, 2012 | 992,056 | |||||||||
| CNL Resort Hotel, L.P. | |||||||||||
| 1,560,000 | Term Loan, 6.52%, Maturing August 18, 2006 | 1,563,900 | |||||||||
| Globalcash Access, LLC | |||||||||||
| 841,380 | Term Loan, 6.33%, Maturing March 10, 2010 | 854,264 | |||||||||
| Green Valley Ranch Gaming, LLC | |||||||||||
| 1,240,626 | Term Loan, 6.02%, Maturing December 24, 2010 | 1,258,460 | |||||||||
| Principal Amount | Borrower/Tranche Description | Value | |||||||||
| Lodging and Casinos (continued) | |||||||||||
| Isle of Capri Casinos, Inc. | |||||||||||
| $ | 2,257,938 | Term Loan, 5.84%, Maturing February 4, 2012 | $ | 2,284,398 | |||||||
| Marina District Finance Co., Inc. | |||||||||||
| 2,754,188 | Term Loan, 5.91%, Maturing October 14, 2011 | 2,777,138 | |||||||||
| Penn National Gaming, Inc. | |||||||||||
| 6,570,000 | Term Loan, 6.08%, Maturing October 3, 2012 | 6,660,337 | |||||||||
| Pinnacle Entertainment, Inc. | |||||||||||
| 486,425 | Term Loan, 7.04%, Maturing August 27, 2010 | 492,505 | |||||||||
| 1,375,000 | Term Loan, 7.09%, Maturing August 27, 2010 | 1,390,469 | |||||||||
| Resorts International Holdings, LLC | |||||||||||
| 1,072,367 | Term Loan, 6.53%, Maturing April 26, 2012 | 1,074,244 | |||||||||
| 1,400,000 | Term Loan, 10.27%, Maturing April 26, 2013 | 1,388,188 | |||||||||
| Venetian Casino Resort, LLC | |||||||||||
| 3,433,304 | Term Loan, 5.77%, Maturing June 15, 2011 | 3,465,759 | |||||||||
| 707,898 | Term Loan, 5.77%, Maturing June 15, 2011 | 714,590 | |||||||||
| Wynn Las Vegas, LLC | |||||||||||
| 1,225,000 | Term Loan, 6.20%, Maturing December 14, 2011 | 1,239,547 | |||||||||
| $ | 31,612,200 | ||||||||||
| Nonferrous Metals / Minerals — 2.3% | |||||||||||
| Carmeuse Lime, Inc. | |||||||||||
| $ | 614,250 | Term Loan, 6.00%, Maturing May 2, 2011 | $ | 618,857 | |||||||
| Compass Minerals Group, Inc. | |||||||||||
| 75,365 | Term Loan, 6.47%, Maturing November 28, 2009 | 75,679 | |||||||||
| Foundation Coal Corp. | |||||||||||
| 1,378,457 | Term Loan, 5.85%, Maturing July 30, 2011 | 1,403,059 | |||||||||
| ICG, LLC | |||||||||||
| 1,831,502 | Term Loan, 6.69%, Maturing November 5, 2010 | 1,843,712 | |||||||||
| International Mill Service, Inc. | |||||||||||
| 2,000,000 | Term Loan, 10.09%, Maturing October 26, 2011 | 2,030,000 | |||||||||
| Magnequench International, Inc. | |||||||||||
| 2,275,000 | Term Loan, 7.36%, Maturing August 31, 2009 | 2,280,687 | |||||||||
| Murray Energy Corp. | |||||||||||
| 925,350 | Term Loan, 6.86%, Maturing January 28, 2010 | 931,712 | |||||||||
| Novelis, Inc. | |||||||||||
| 1,340,754 | Term Loan, 5.46%, Maturing January 6, 2012 | 1,356,780 | |||||||||
| 2,329,295 | Term Loan, 5.46%, Maturing January 6, 2012 | 2,357,137 | |||||||||
| Trout Coal Holdings, LLC | |||||||||||
| 1,400,000 | Term Loan, 10.00%, Maturing March 23, 2012 | 1,412,250 | |||||||||
| $ | 14,309,873 | ||||||||||
| Oil & Gas — 0.2% | |||||||||||
| Dresser Rand Group, Inc. | |||||||||||
| $ | 1,099,385 | Term Loan, 6.08%, Maturing October 29, 2011 | $ | 1,117,937 | |||||||
| $ | 1,117,937 | ||||||||||
See notes to financial statements
11
Eaton Vance Senior Floating-Rate Trust as of October 31, 2005
PORTFOLIO OF INVESTMENTS CONT'D
| Principal Amount | Borrower/Tranche Description | Value | |||||||||
| Oil and Gas — 4.1% | |||||||||||
| Coffeyville Resources, LLC | |||||||||||
| $ | 850,000 | Term Loan, 10.81%, Maturing June 24, 2013 | $ | 878,687 | |||||||
| Dresser, Inc. | |||||||||||
| 1,132,534 | Term Loan, 6.59%, Maturing March 31, 2007 | 1,143,860 | |||||||||
| El Paso Corp. | |||||||||||
| 1,973,625 | Term Loan, 5.27%, Maturing November 23, 2009 | 1,988,291 | |||||||||
| 3,236,745 | Term Loan, 6.81%, Maturing November 23, 2009 | 3,264,843 | |||||||||
| Epco Holdings, Inc. | |||||||||||
| 1,905,000 | Term Loan, 6.42%, Maturing August 18, 2010 | 1,932,215 | |||||||||
| Kerr-McGee Corp. | |||||||||||
| 1,648,500 | Term Loan, 6.26%, Maturing May 24, 2007 | 1,653,210 | |||||||||
| 4,274,288 | Term Loan, 6.51%, Maturing May 24, 2011 | 4,294,056 | |||||||||
| Key Energy Services, Inc. | |||||||||||
| 1,195,000 | Term Loan, 7.02%, Maturing June 30, 2012(2) | 1,213,672 | |||||||||
| LB Pacific, L.P. | |||||||||||
| 1,014,900 | Term Loan, 6.80%, Maturing March 3, 2012 | 1,033,929 | |||||||||
| Lyondell-Citgo Refining, L.P. | |||||||||||
| 2,653,912 | Term Loan, 5.51%, Maturing May 21, 2007 | 2,693,721 | |||||||||
| Universal Compression, Inc. | |||||||||||
| 1,029,825 | Term Loan, 5.59%, Maturing February 15, 2012 | 1,042,698 | |||||||||
| Williams Production RMT Co. | |||||||||||
| 4,666,875 | Term Loan, 6.20%, Maturing May 30, 2008 | 4,729,588 | |||||||||
| $ | 25,868,770 | ||||||||||
| Publishing — 6.3% | |||||||||||
| American Media Operations, Inc. | |||||||||||
| $ | 550,665 | Term Loan, 6.81%, Maturing April 1, 2007 | $ | 557,318 | |||||||
| 3,725,461 | Term Loan, 6.81%, Maturing April 1, 2008 | 3,770,476 | |||||||||
| CBD Media, LLC | |||||||||||
| 2,134,007 | Term Loan, 6.44%, Maturing December 31, 2009 | 2,166,017 | |||||||||
| Dex Media East, LLC | |||||||||||
| 5,483,739 | Term Loan, 5.78%, Maturing May 8, 2009 | 5,515,869 | |||||||||
| Dex Media West, LLC | |||||||||||
| 4,234,823 | Term Loan, 5.75%, Maturing March 9, 2010 | 4,260,114 | |||||||||
| Freedom Communications | |||||||||||
| 1,155,767 | Term Loan, 5.38%, Maturing May 18, 2012 | 1,166,458 | |||||||||
| Herald Media, Inc. | |||||||||||
| 279,852 | Term Loan, 6.78%, Maturing July 22, 2011 | 281,776 | |||||||||
| 625,000 | Term Loan, 9.78%, Maturing January 22, 2012 | 633,203 | |||||||||
| Liberty Group Operating, Inc. | |||||||||||
| 1,331,372 | Term Loan, 6.19%, Maturing February 28, 2012 | 1,344,963 | |||||||||
| Merrill Communications, LLC | |||||||||||
| 1,313,687 | Term Loan, 6.58%, Maturing July 30, 2009 | 1,331,340 | |||||||||
| Morris Publishing Group, LLC | |||||||||||
| 423,500 | Term Loan, 5.56%, Maturing September 30, 2010 | 428,132 | |||||||||
| 655,050 | Term Loan, 5.81%, Maturing March 31, 2011 | 658,325 | |||||||||
| Principal Amount | Borrower/Tranche Description | Value | |||||||||
| Publishing (continued) | |||||||||||
| Nebraska Book Co., Inc. | |||||||||||
| $ | 1,438,100 | Term Loan, 6.70%, Maturing March 4, 2011 | $ | 1,450,683 | |||||||
| R.H. Donnelley Corp. | |||||||||||
| 174,444 | Term Loan, 5.81%, Maturing December 31, 2009 | 175,652 | |||||||||
| 5,307,950 | Term Loan, 5.70%, Maturing June 30, 2011 | 5,349,803 | |||||||||
| Source Media, Inc. | |||||||||||
| 1,342,118 | Term Loan, 6.27%, Maturing November 8, 2011 | 1,361,411 | |||||||||
| 250,000 | Term Loan, 9.29%, Maturing August 30, 2012 | 254,297 | |||||||||
| SP Newsprint Co. | |||||||||||
| 3,866,667 | Term Loan, 4.03%, Maturing January 9, 2010 | 3,929,500 | |||||||||
| 1,575,000 | Term Loan, 6.53%, Maturing January 9, 2010 | 1,600,594 | |||||||||
| Sun Media Corp. | |||||||||||
| 1,275,458 | Term Loan, 6.24%, Maturing February 7, 2009 | 1,289,807 | |||||||||
| Xsys US, Inc. | |||||||||||
| 1,122,229 | Term Loan, 6.77%, Maturing December 31, 2012 | 1,132,049 | |||||||||
| 1,146,271 | Term Loan, 7.27%, Maturing December 31, 2013 | 1,163,465 | |||||||||
| $ | 39,821,252 | ||||||||||
| Radio and Television — 5.3% | |||||||||||
| Adams Outdoor Advertising, L.P. | |||||||||||
| $ | 1,416,251 | Term Loan, 6.20%, Maturing November 18, 2012 | $ | 1,437,495 | |||||||
| ALM Media Holdings, Inc. | |||||||||||
| 1,124,350 | Term Loan, 6.52%, Maturing March 5, 2010 | 1,126,224 | |||||||||
| DirecTV Holdings, LLC | |||||||||||
| 3,896,667 | Term Loan, 5.43%, Maturing April 13, 2013 | 3,935,633 | |||||||||
| Entravision Communications Corp. | |||||||||||
| 1,325,000 | Term Loan, 5.55%, Maturing September 29, 2013 | 1,336,594 | |||||||||
| Gray Television, Inc. | |||||||||||
| 1,147,125 | Term Loan, 5.35%, Maturing December 31, 2012 | 1,153,220 | |||||||||
| HIT Entertainment, Inc. | |||||||||||
| 525,000 | Term Loan, 6.11%, Maturing March 20, 2012 | 528,937 | |||||||||
| NEP Supershooters, L.P. | |||||||||||
| 1,916,927 | Term Loan, 12.02%, Maturing August 3, 2011 | 1,907,343 | |||||||||
| Nexstar Broadcasting, Inc. | |||||||||||
| 1,831,593 | Term Loan, 5.77%, Maturing October 1, 2012 | 1,844,566 | |||||||||
| 1,864,470 | Term Loan, 5.77%, Maturing October 1, 2012 | 1,877,676 | |||||||||
| PanAmSat Corp. | |||||||||||
| 5,090,617 | Term Loan, 6.11%, Maturing August 20, 2011 | 5,162,206 | |||||||||
| Patriot Media and Communications CNJ, LLC | |||||||||||
| 500,000 | Term Loan, 9.00%, Maturing October 6, 2013 | 510,469 | |||||||||
| Rainbow National Services, LLC | |||||||||||
| 2,772,954 | Term Loan, 6.63%, Maturing March 31, 2012 | 2,801,551 | |||||||||
| Raycom TV Broadcasting, Inc. | |||||||||||
| 2,275,000 | Term Loan, 6.06%, Maturing February 24, 2012 | 2,292,062 | |||||||||
| Spanish Broadcasting System, Inc. | |||||||||||
| 1,200,000 | Term Loan, 7.51%, Maturing June 10, 2013 | 1,218,000 | |||||||||
See notes to financial statements
12
Eaton Vance Senior Floating-Rate Trust as of October 31, 2005
PORTFOLIO OF INVESTMENTS CONT'D
| Principal Amount | Borrower/Tranche Description | Value | |||||||||
| Radio and Television (continued) | |||||||||||
| Susquehanna Media Co. | |||||||||||
| $ | 5,223,750 | Term Loan, 5.98%, Maturing March 31, 2012 | $ | 5,254,769 | |||||||
| Young Broadcasting, Inc. | |||||||||||
| 733,163 | Term Loan, 5.77%, Maturing November 3, 2012 | 739,425 | |||||||||
| $ | 33,126,170 | ||||||||||
| Rail Industries — 0.6% | |||||||||||
| Kansas City Southern Industries, Inc. | |||||||||||
| $ | 684,825 | Term Loan, 5.34%, Maturing March 30, 2008 | $ | 691,888 | |||||||
| Railamerica, Inc. | |||||||||||
| 219,389 | Term Loan, 5.88%, Maturing September 29, 2011 | 223,228 | |||||||||
| 2,605,909 | Term Loan, 5.90%, Maturing September 29, 2011 | 2,651,513 | |||||||||
| $ | 3,566,629 | ||||||||||
| Retailers (Except Food and Drug) — 4.6% | |||||||||||
| Advance Stores Company, Inc. | |||||||||||
| $ | 1,511,413 | Term Loan, 5.52%, Maturing September 30, 2010 | $ | 1,533,139 | |||||||
| 896,191 | Term Loan, 5.66%, Maturing September 30, 2010 | 909,074 | |||||||||
| Alimentation Couche-Tard, Inc. | |||||||||||
| 1,203,061 | Term Loan, 5.69%, Maturing December 17, 2010 | 1,218,099 | |||||||||
| American Achievement Corp. | |||||||||||
| 626,695 | Term Loan, 6.52%, Maturing March 25, 2011 | 629,829 | |||||||||
| Amscan Holdings, Inc. | |||||||||||
| 989,975 | Term Loan, 6.72%, Maturing April 30, 2012 | 996,162 | |||||||||
| Coinmach Laundry Corp. | |||||||||||
| 2,151,547 | Term Loan, 6.97%, Maturing July 25, 2009 | 2,182,475 | |||||||||
| FTD, Inc. | |||||||||||
| 2,407,091 | Term Loan, 6.19%, Maturing February 28, 2011 | 2,441,693 | |||||||||
| Harbor Freight Tools USA, Inc. | |||||||||||
| 2,086,316 | Term Loan, 6.30%, Maturing July 15, 2010 | 2,113,438 | |||||||||
| Home Interiors & Gifts, Inc. | |||||||||||
| 1,090,861 | Term Loan, 9.09%, Maturing March 31, 2011 | 1,002,228 | |||||||||
| Josten's Corp. | |||||||||||
| 3,942,500 | Term Loan, 5.94%, Maturing October 4, 2010 | 4,008,415 | |||||||||
| Mapco Express, Inc. | |||||||||||
| 607,478 | Term Loan, 8.50%, Maturing April 28, 2011 | 615,451 | |||||||||
| Movie Gallery, Inc. | |||||||||||
| 1,062,337 | Term Loan, 7.83%, Maturing April 27, 2011 | 1,041,201 | |||||||||
| Neiman Marcus Group, Inc. | |||||||||||
| 975,000 | Term Loan, 6.48%, Maturing April 5, 2013 | 981,337 | |||||||||
| Oriental Trading Co., Inc. | |||||||||||
| 900,163 | Term Loan, 6.31%, Maturing August 4, 2010 | 905,226 | |||||||||
| Petro Stopping Center, L.P. | |||||||||||
| 531,250 | Term Loan, 5.94%, Maturing February 9, 2007 | 537,891 | |||||||||
| Principal Amount | Borrower/Tranche Description | Value | |||||||||
| Retailers (Except Food and Drug) (continued) | |||||||||||
| Rent-A-Center, Inc. | |||||||||||
| $ | 1,984,925 | Term Loan, 5.46%, Maturing June 30, 2010 | $ | 2,009,488 | |||||||
| Savers, Inc. | |||||||||||
| 1,074,943 | Term Loan, 7.65%, Maturing August 4, 2009 | 1,084,349 | |||||||||
| 1,000,000 | Term Loan, 12.22%, Maturing August 4, 2010 | 1,012,500 | |||||||||
| Stewert Enterprises, Inc. | |||||||||||
| 424,963 | Term Loan, 5.60%, Maturing November 19, 2011 | 430,541 | |||||||||
| Travelcenters of America, Inc. | |||||||||||
| 3,090,000 | Term Loan, 5.71%, Maturing November 30, 2008 | 3,126,694 | |||||||||
| $ | 28,779,230 | ||||||||||
| Surface Transport — 0.5% | |||||||||||
| Horizon Lines, LLC | |||||||||||
| $ | 938,125 | Term Loan, 6.27%, Maturing July 7, 2011 | $ | 952,783 | |||||||
| Sirva Worldwide, Inc. | |||||||||||
| 2,482,353 | Term Loan, 7.53%, Maturing December 1, 2010 | 2,386,782 | |||||||||
| $ | 3,339,565 | ||||||||||
| Telecommunications — 5.6% | |||||||||||
| AAT Communications Corp. | |||||||||||
| $ | 1,230,000 | Term Loan, 6.61%, Maturing July 29, 2013 | $ | 1,249,219 | |||||||
| Alaska Communications Systems Holdings, Inc. | |||||||||||
| 990,000 | Term Loan, 6.02%, Maturing February 1, 2011 | 1,004,355 | |||||||||
| Centennial Cellular Operating Co., LLC | |||||||||||
| 4,777,250 | Term Loan, 6.34%, Maturing February 9, 2011 | 4,815,210 | |||||||||
| Cincinnati Bell, Inc. | |||||||||||
| 650,000 | Term Loan, 5.38%, Maturing August 31, 2012 | 654,469 | |||||||||
| Consolidated Communications, Inc. | |||||||||||
| 2,563,752 | Term Loan, 6.17%, Maturing July 27, 2015 | 2,599,004 | |||||||||
| D&E Communications, Inc. | |||||||||||
| 982,342 | Term Loan, 5.86%, Maturing December 31, 2011 | 990,937 | |||||||||
| Fairpoint Communications, Inc. | |||||||||||
| 2,230,000 | Term Loan, 5.81%, Maturing February 8, 2012 | 2,255,366 | |||||||||
| Hawaiian Telcom Communications, Inc. | |||||||||||
| 750,000 | Term Loan, 6.28%, Maturing October 31, 2012 | 759,258 | |||||||||
| Intelsat, Ltd. | |||||||||||
| 1,000,000 | Term Loan, 5.81%, Maturing July 28, 2011 | 1,010,417 | |||||||||
| Iowa Telecommunications Services | |||||||||||
| 2,616,000 | Term Loan, 5.71%, Maturing November 23, 2011 | 2,645,838 | |||||||||
| IPC Acquisition Corp. | |||||||||||
| 470,000 | Term Loan, 6.83%, Maturing August 5, 2011 | 472,742 | |||||||||
| Madison River Capital, LLC | |||||||||||
| 535,000 | Term Loan, 6.59%, Maturing July 31, 2012 | 542,914 | |||||||||
| NTelos, Inc. | |||||||||||
| 1,210,850 | Term Loan, 6.53%, Maturing February 18, 2011 | 1,221,445 | |||||||||
See notes to financial statements
13
Eaton Vance Senior Floating-Rate Trust as of October 31, 2005
PORTFOLIO OF INVESTMENTS CONT'D
| Principal Amount | Borrower/Tranche Description | Value | |||||||||
| Telecommunications (continued) | |||||||||||
| Qwest Corp. | |||||||||||
| $ | 4,000,000 | Term Loan, 8.53%, Maturing June 4, 2007 | $ | 4,130,832 | |||||||
| SBA Senior Finance, Inc. | |||||||||||
| 3,746,941 | Term Loan, 7.89%, Maturing October 31, 2008 | 3,761,772 | |||||||||
| Stratos Global Corp. | |||||||||||
| 1,063,000 | Term Loan, 6.27%, Maturing December 3, 2011 | 1,066,655 | |||||||||
| Triton PCS, Inc. | |||||||||||
| 1,523,488 | Term Loan, 7.34%, Maturing November 18, 2009 | 1,538,960 | |||||||||
| Valor Telecom Enterprise, LLC | |||||||||||
| 2,373,167 | Term Loan, 5.80%, Maturing February 14, 2012 | 2,405,373 | |||||||||
| Westcom Corp. | |||||||||||
| 833,984 | Term Loan, 6.99%, Maturing December 17, 2010 | 839,718 | |||||||||
| 1,000,000 | Term Loan, 11.24%, Maturing May 17, 2011 | 1,019,375 | |||||||||
| $ | 34,983,859 | ||||||||||
| Utilities — 4.2% | |||||||||||
| Allegheny Energy Supply Co., LLC | |||||||||||
| $ | 3,254,342 | Term Loan, 5.79%, Maturing March 8, 2011 | $ | 3,293,394 | |||||||
| Cellnet Technology, Inc. | |||||||||||
| 583,538 | Term Loan, 7.17%, Maturing April 26, 2012 | 587,914 | |||||||||
| Cogentrix Delaware Holdings, Inc. | |||||||||||
| 1,452,458 | Term Loan, 5.78%, Maturing April 14, 2012 | 1,472,278 | |||||||||
| Covanta Energy Corp. | |||||||||||
| 1,050,407 | Term Loan, 3.86%, Maturing June 24, 2012 | 1,065,506 | |||||||||
| 847,470 | Term Loan, 6.96%, Maturing June 24, 2012 | 859,652 | |||||||||
| 725,000 | Term Loan, 9.52%, Maturing June 24, 2013 | 725,906 | |||||||||
| Energy Transfer Company, L.P. | |||||||||||
| 1,610,000 | Term Loan, 6.81%, Maturing June 16, 2008 | 1,625,496 | |||||||||
| KGen, LLC | |||||||||||
| 895,500 | Term Loan, 6.65%, Maturing August 5, 2011 | 894,381 | |||||||||
| La Paloma Generating Co., LLC | |||||||||||
| 52,459 | Term Loan, 5.75%, Maturing August 16, 2012 | 52,944 | |||||||||
| 320,000 | Term Loan, 5.77%, Maturing August 16, 2012 | 322,960 | |||||||||
| 25,486 | Term Loan, 5.77%, Maturing August 16, 2012 | 25,722 | |||||||||
| NRG Energy, Inc. | |||||||||||
| 2,023,982 | Term Loan, 3.92%, Maturing December 24, 2011 | 2,038,318 | |||||||||
| 2,554,941 | Term Loan, 5.90%, Maturing December 24, 2011 | 2,573,038 | |||||||||
| Petrohawk Energy Corp. | |||||||||||
| 1,315,000 | Term Loan, 8.50%, Maturing July 28, 2010 | 1,323,219 | |||||||||
| Pike Electric, Inc. | |||||||||||
| 297,736 | Term Loan, 6.19%, Maturing July 1, 2012 | 301,458 | |||||||||
| 691,755 | Term Loan, 6.25%, Maturing July 1, 2012 | 700,402 | |||||||||
| Plains Resources, Inc. | |||||||||||
| 1,662,858 | Term Loan, 5.85%, Maturing July 23, 2010 | 1,688,841 | |||||||||
| Principal Amount | Borrower/Tranche Description | Value | |||||||||
| Utilities (continued) | |||||||||||
| Reliant Energy, Inc. | |||||||||||
| $ | 1,496,561 | Term Loan, 6.11%, Maturing December 22, 2010 | $ | 1,503,108 | |||||||
| Texas Genco, LLC | |||||||||||
| 1,454,858 | Term Loan, 5.88%, Maturing December 14, 2011 | 1,462,132 | |||||||||
| 3,513,436 | Term Loan, 5.88%, Maturing December 14, 2011 | 3,531,003 | |||||||||
| $ | 26,047,672 | ||||||||||
| Total Senior, Floating Rate Interests (identified cost $845,822,789) | $ | 852,693,082 | |||||||||
| Corporate Bonds & Notes — 16.0% | |||||||||||
| Principal Amount (000's omitted) | Security | Value | |||||||||
| Aerospace and Defense — 0.2% | |||||||||||
| Argo Tech Corp., Sr. Notes | |||||||||||
| $ | 840 | 9.25%, 6/1/11 | $ | 869,400 | |||||||
| BE Aerospace, Sr. Sub. Notes, Series B | |||||||||||
| 60 | 8.00%, 3/1/08 | 60,150 | |||||||||
| Sequa Corp. | |||||||||||
| 500 | 8.875%, 4/1/08 | 515,000 | |||||||||
| Standard Aero Holdings, Inc., Sr. Sub. Notes | |||||||||||
| 30 | 8.25%, 9/1/14 | 28,650 | |||||||||
| $ | 1,473,200 | ||||||||||
| Air Transport — 0.3% | |||||||||||
| American Airlines | |||||||||||
| $ | 750 | 7.80%, 10/1/06 | $ | 715,364 | |||||||
| AMR Corp. | |||||||||||
| 175 | 9.00%, 8/1/12 | 121,625 | |||||||||
| Continental Airlines | |||||||||||
| 668 | 7.033%, 6/15/11 | 603,476 | |||||||||
| Delta Airlines Notes | |||||||||||
| 1,000 | 7.90%, 12/15/09(3) | 182,500 | |||||||||
| $ | 1,622,965 | ||||||||||
| Automotive — 0.9% | |||||||||||
| Altra Industrial Motion, Inc. | |||||||||||
| $ | 60 | 9.50%, 12/1/11(4) | $ | 58,500 | |||||||
| Commercial Vehicle Group, Inc., Sr. Notes | |||||||||||
| 100 | 8.00%, 7/1/13(4) | 98,500 | |||||||||
| Dana Credit Corp. | |||||||||||
| 100 | 8.375%, 8/15/07(4) | 97,500 | |||||||||
See notes to financial statements
14
Eaton Vance Senior Floating-Rate Trust as of October 31, 2005
PORTFOLIO OF INVESTMENTS CONT'D
| Principal Amount (000's omitted) | Security | Value | |||||||||
| Automotive (continued) | |||||||||||
| Ford Motor Credit Co. | |||||||||||
| $ | 1,055 | 7.875%, 6/15/10 | $ | 1,016,479 | |||||||
| Ford Motor Credit Co., Variable Rate | |||||||||||
| 690 | 7.26%, 11/2/07 | 686,061 | |||||||||
| General Motors Acceptance Corp. | |||||||||||
| 45 | 6.125%, 9/15/06 | 44,878 | |||||||||
| 40 | 7.00%, 2/1/12 | 38,851 | |||||||||
| 1,000 | 8.00%, 11/1/31 | 1,035,209 | |||||||||
| Keystone Automotive Operations, Inc., Sr. Sub. Notes | |||||||||||
| 1,320 | 9.75%, 11/1/13 | 1,290,300 | |||||||||
| Metaldyne Corp., Sr. Notes | |||||||||||
| 575 | 11.00%, 11/1/13(4) | 520,375 | |||||||||
| Tenneco Automotive, Inc., Series B | |||||||||||
| 255 | 10.25%, 7/15/13 | 276,675 | |||||||||
| Tenneco Automotive, Inc., Sr. Sub Notes | |||||||||||
| 255 | 8.625%, 11/15/14 | 244,800 | |||||||||
| Visteon Corp., Sr. Notes | |||||||||||
| 180 | 8.25%, 8/1/10 | 167,175 | |||||||||
| $ | 5,575,303 | ||||||||||
| Brokers / Dealers / Investment Houses — 0.0% | |||||||||||
| E*Trade Financial Corp., Sr. Notes | |||||||||||
| $ | 75 | 8.00%, 6/15/11 | $ | 76,500 | |||||||
| Residential Capital Corp. | |||||||||||
| 155 | 6.875%, 6/30/15(4) | 163,478 | |||||||||
| $ | 239,978 | ||||||||||
| Building and Development — 0.6% | |||||||||||
| Coleman Cable, Inc., Sr. Notes | |||||||||||
| $ | 105 | 9.875%, 10/1/12 | $ | 95,025 | |||||||
| General Cable Corp., Sr. Notes | |||||||||||
| 80 | 9.50%, 11/15/10 | 84,800 | |||||||||
| Interface, Inc. | |||||||||||
| 500 | 10.375%, 2/1/10 | 541,250 | |||||||||
| Interline Brands, Inc., Sr. Sub. Notes | |||||||||||
| 487 | 11.50%, 5/15/11 | 543,005 | |||||||||
| MAAX Corp., Sr. Sub. Notes | |||||||||||
| 115 | 9.75%, 6/15/12 | 91,425 | |||||||||
| Mueller Group, Inc., Sr. Sub. Notes | |||||||||||
| 635 | 10.00%, 5/1/12 | 669,925 | |||||||||
| Mueller Holdings, Inc., Disc. Notes | |||||||||||
| 295 | 14.75%, 4/15/14 | 216,825 | |||||||||
| Nortek, Inc., Sr. Sub Notes | |||||||||||
| 465 | 8.50%, 9/1/14 | 446,400 | |||||||||
| Principal Amount (000's omitted) | Security | Value | |||||||||
| Building and Development (continued) | |||||||||||
| NTK Holdings, Inc., Sr. Disc. Notes | |||||||||||
| $ | 225 | 10.75%, 3/1/14 | $ | 136,125 | |||||||
| Panolam Industries International, Sr. Sub. Notes | |||||||||||
| 200 | 10.75%, 10/1/13(4) | 195,000 | |||||||||
| Ply Gem Industries, Inc., Sr. Sub. Notes | |||||||||||
| 500 | 9.00%, 2/15/12(4) | 407,500 | |||||||||
| RMCC Acquisition Co., Sr. Sub. Notes | |||||||||||
| 400 | 9.50%, 11/1/12(4) | 408,000 | |||||||||
| Stanley-Martin Co. | |||||||||||
| 80 | 9.75%, 8/15/15(4) | 74,000 | |||||||||
| $ | 3,909,280 | ||||||||||
| Business Equipment and Services — 0.4% | |||||||||||
| Hydrochem Industrial Services, Inc., Sr. Sub Notes | |||||||||||
| $ | 185 | 9.25%, 2/15/13(4) | $ | 170,200 | |||||||
| Knowledge Learning Center, Sr. Sub. Notes | |||||||||||
| 160 | 7.75%, 2/1/15(4) | 149,600 | |||||||||
| Norcross Safety Products LLC/Norcross Capital Corp., Sr. Sub. Notes, Series B | |||||||||||
| 40 | 9.875%, 8/15/11 | 42,800 | |||||||||
| NSP Holdings LLC/NSP Holdings Capital Corp., Sr. Notes | |||||||||||
| 272 | 11.75%, 1/1/12 | 272,152 | |||||||||
| Safety Products Holdings, Sr. Notes (PIK) | |||||||||||
| 90 | 11.75%, 1/1/12(4) | 90,075 | |||||||||
| Sungard Data Systems, Inc., Sr. Notes | |||||||||||
| 400 | 9.125%, 8/15/13(4) | 408,000 | |||||||||
| Sungard Data Systems, Inc., Sr. Notes, Variable Rate | |||||||||||
| 100 | 8.525%, 8/15/13(4) | 103,000 | |||||||||
| Sungard Data Systems, Inc., Sr. Sub. Notes | |||||||||||
| 340 | 10.25%, 8/15/15(4) | 338,725 | |||||||||
| United Rentals North America, Inc. | |||||||||||
| 75 | 6.50%, 2/15/12 | 72,281 | |||||||||
| United Rentals North America, Inc., Sr. Sub. Notes | |||||||||||
| 700 | 7.00%, 2/15/14 | 647,500 | |||||||||
| $ | 2,294,333 | ||||||||||
| Cable and Satellite Television — 1.3% | |||||||||||
| CCO Holdings LLC / Capital Corp., Sr. Notes | |||||||||||
| $ | 730 | 8.75%, 11/15/13(4) | $ | 706,275 | |||||||
| Charter Communications Holdings II, LLC, Sr. Notes | |||||||||||
| 230 | 10.25%, 9/15/10 | 231,725 | |||||||||
| CSC Holdings, Inc., Sr. Notes | |||||||||||
| 290 | 6.75%, 4/15/12(4) | 281,300 | |||||||||
| CSC Holdings, Inc., Sr. Notes, Series B | |||||||||||
| 100 | 7.625%, 4/1/11 | 100,750 | |||||||||
See notes to financial statements
15
Eaton Vance Senior Floating-Rate Trust as of October 31, 2005
PORTFOLIO OF INVESTMENTS CONT'D
| Principal Amount (000's omitted) | Security | Value | |||||||||
| Cable and Satellite Television (continued) | |||||||||||
| CSC Holdings, Inc., Sr. Sub. Notes | |||||||||||
| $ | 475 | 10.50%, 5/15/16 | $ | 511,812 | |||||||
| Insight Communications, Sr. Disc. Notes | |||||||||||
| 400 | 12.25%, 2/15/11 | 413,000 | |||||||||
| Kabel Deutschland GMBH | |||||||||||
| 485 | 10.625%, 7/1/14(4) | 524,406 | |||||||||
| Ono Finance PLC, Sr. Notes | |||||||||||
| 85 | 14.00%, 2/15/11 | 92,969 | |||||||||
| Paxson Communications Corp., Variable Rate | |||||||||||
| 4,000 | 6.90%, 1/15/10(4) | 4,010,000 | |||||||||
| UGS Corp. | |||||||||||
| 1,060 | 10.00%, 6/1/12 | 1,163,350 | |||||||||
| $ | 8,035,587 | ||||||||||
| Chemicals and Plastics — 0.9% | |||||||||||
| Avecia Group PLC | |||||||||||
| $ | 11 | 11.00%, 7/1/09 | $ | 11,385 | |||||||
| BCP Crystal Holdings Corp., Sr. Sub Notes | |||||||||||
| 312 | 9.625%, 6/15/14 | 344,760 | |||||||||
| Borden U.S. Finance/Nova Scotia Finance, Sr. Notes | |||||||||||
| 175 | 9.00%, 7/15/14(4) | 173,031 | |||||||||
| Crystal US Holdings/US Holdings 3, LLC, Sr. Disc. Notes, Series B | |||||||||||
| 312 | 10.50%, 10/1/14 | 217,620 | |||||||||
| Huntsman LLC | |||||||||||
| 272 | 11.625%, 10/15/10 | 309,400 | |||||||||
| Innophos, Inc., Sr. Sub. Notes | |||||||||||
| 35 | 8.875%, 8/15/14(4) | 35,175 | |||||||||
| Lyondell Chemical Co., Sr. Notes | |||||||||||
| 938 | 10.50%, 6/1/13 | 1,068,147 | |||||||||
| Nalco Co., Sr. Sub. Notes | |||||||||||
| 605 | 8.875%, 11/15/13 | 620,881 | |||||||||
| Nova Chemicals Corp., Sr. Notes, Variable Rate | |||||||||||
| 295 | 7.561%, 11/15/13(4) | 299,425 | |||||||||
| OM Group, Inc. | |||||||||||
| 1,765 | 9.25%, 12/15/11 | 1,707,637 | |||||||||
| Polyone Corp., Sr. Notes | |||||||||||
| 275 | 10.625%, 5/15/10 | 270,875 | |||||||||
| PQ Corp. | |||||||||||
| 80 | 7.50%, 2/15/13(4) | 74,000 | |||||||||
| Rhodia SA, Sr. Notes | |||||||||||
| 110 | 10.25%, 6/1/10 | 117,700 | |||||||||
| Solo Cup Co., Sr. Sub. Notes | |||||||||||
| 175 | 8.50%, 2/15/14 | 144,375 | |||||||||
| $ | 5,394,411 | ||||||||||
| Principal Amount (000's omitted) | Security | Value | |||||||||
| Clothing / Textiles — 0.4% | |||||||||||
| Collins & Aikman Floor Cover | |||||||||||
| $ | 300 | 9.75%, 2/15/10 | $ | 282,000 | |||||||
| Levi Strauss & Co., Sr. Notes | |||||||||||
| 665 | 12.25%, 12/15/12 | 733,162 | |||||||||
| 230 | 9.75%, 1/15/15 | 233,450 | |||||||||
| Levi Strauss & Co., Sr. Notes, Variable Rate | |||||||||||
| 185 | 8.804%, 4/1/12 | 184,537 | |||||||||
| Oxford Industries, Inc., Sr. Notes | |||||||||||
| 570 | 8.875%, 6/1/11 | 587,100 | |||||||||
| Perry Ellis International, Inc., Sr. Sub. Notes | |||||||||||
| 145 | 8.875%, 9/15/13 | 146,812 | |||||||||
| Phillips Van-Heusen, Sr. Notes | |||||||||||
| 155 | 7.25%, 2/15/11 | 157,325 | |||||||||
| Quiksilver, Inc., Sr. Notes | |||||||||||
| 140 | 6.875%, 4/15/15(4) | 130,550 | |||||||||
| $ | 2,454,936 | ||||||||||
| Conglomerates — 0.1% | |||||||||||
| Amsted Industries, Inc., Sr. Notes | |||||||||||
| $ | 615 | 10.25%, 10/15/11(4) | $ | 661,125 | |||||||
| Goodman Global Holdings, Sr. Notes, Variable Rate | |||||||||||
| 40 | 6.41%, 6/15/12(4) | 39,400 | |||||||||
| Polypore, Inc., Sr. Sub Notes | |||||||||||
| 30 | 8.75%, 5/15/12 | 26,550 | |||||||||
| $ | 727,075 | ||||||||||
| Containers and Glass Products — 0.2% | |||||||||||
| Intertape Polymer US, Inc., Sr. Sub. Notes | |||||||||||
| $ | 315 | 8.50%, 8/1/14 | $ | 304,011 | |||||||
| Pliant Corp. (PIK) | |||||||||||
| 851 | 11.625%, 6/15/09(4) | 886,222 | |||||||||
| $ | 1,190,233 | ||||||||||
| Cosmetics / Toiletries — 0.1% | |||||||||||
| Aearo Co. I, Sr. Sub. Notes | |||||||||||
| $ | 155 | 8.25%, 4/15/12 | $ | 155,000 | |||||||
| Samsonite Corp., Sr. Sub. Notes | |||||||||||
| 225 | 8.875%, 6/1/11(5) | 232,875 | |||||||||
| WH Holdings Ltd./WH Capital Corp., Sr. Notes | |||||||||||
| 105 | 9.50%, 4/1/11 | 114,450 | |||||||||
| $ | 502,325 | ||||||||||
See notes to financial statements
16
Eaton Vance Senior Floating-Rate Trust as of October 31, 2005
PORTFOLIO OF INVESTMENTS CONT'D
| Principal Amount (000's omitted) | Security | Value | |||||||||
| Ecological Services and Equipment — 0.3% | |||||||||||
| Aleris International, Inc. | |||||||||||
| $ | 140 | 10.375%, 10/15/10 | $ | 153,650 | |||||||
| 163 | 9.00%, 11/15/14 | 167,075 | |||||||||
| Allied Waste North America, Series B | |||||||||||
| 370 | 8.875%, 4/1/08 | 387,575 | |||||||||
| Allied Waste North America, Sr. Notes, Series B | |||||||||||
| 565 | 8.50%, 12/1/08 | 590,425 | |||||||||
| Waste Services, Inc., Sr. Sub Notes | |||||||||||
| 390 | 9.50%, 4/15/14 | 388,050 | |||||||||
| $ | 1,686,775 | ||||||||||
| Electronics / Electrical — 0.3% | |||||||||||
| Advanced Micro Devices, Inc., Senior Notes | |||||||||||
| $ | 580 | 7.75%, 11/1/12 | $ | 582,900 | |||||||
| Amkor Technologies, Inc., Sr. Notes | |||||||||||
| 130 | 7.125%, 3/15/11 | 113,100 | |||||||||
| 750 | 7.75%, 5/15/13 | 643,125 | |||||||||
| CPI Holdco, Inc., Sr. Notes, Variable Rate | |||||||||||
| 95 | 9.672%, 2/1/15 | 93,600 | |||||||||
| Stratus Technologies, Inc., Sr. Notes | |||||||||||
| 175 | 10.375%, 12/1/08 | 177,625 | |||||||||
| $ | 1,610,350 | ||||||||||
| Equipment Leasing — 0.1% | |||||||||||
| Greenbrier Companies, Inc. (The) | |||||||||||
| $ | 370 | 8.375%, 5/15/15 | $ | 382,025 | |||||||
| $ | 382,025 | ||||||||||
| Financial Intermediaries — 1.6% | |||||||||||
| Alzette, Variable Rate | |||||||||||
| $ | 750 | 8.691%, 12/15/20(4) | $ | 770,400 | |||||||
| Avalon Capital Ltd. 3, Series 1A, Class D, Variable Rate | |||||||||||
| 760 | 5.78%, 2/24/19(4) | 762,508 | |||||||||
| Babson Ltd., Series 2005-1A, Class C1, Variable Rate | |||||||||||
| 1,000 | 6.10%, 4/15/19(4) | 1,000,000 | |||||||||
| Bryant Park CDO Ltd., Series 2005-1A, Class C, Variable Rate | |||||||||||
| 1,000 | 6.20%, 1/15/19(4) | 1,000,000 | |||||||||
| Carlyle High Yield Partners, Series 2004-6A, Class C, Variable Rate | |||||||||||
| 1,000 | 6.782%, 8/11/16(4) | 1,000,000 | |||||||||
| Centurion CDO 8 Ltd., Series 2005 8A, Class D, Variable Rate | |||||||||||
| 1,000 | 8.297%, 3/8/17 | 1,000,000 | |||||||||
| Centurion CDO 9 Ltd., Series 2005-9A | |||||||||||
| 750 | 0.00%, 7/17/19 | 750,000 | |||||||||
| Principal Amount (000's omitted) | Security | Value | |||||||||
| Financial Intermediaries (continued) | |||||||||||
| Dryden Leveraged Loan, Series 2004-6A, Class C1, Variable Rate | |||||||||||
| $ | 1,500 | 4.055%, 7/30/16(4) | $ | 1,509,375 | |||||||
| First CLO, Ltd., Sr. Sub. Notes, Variable Rate | |||||||||||
| 1,000 | 5.48%, 7/27/16(4) | 1,000,000 | |||||||||
| Stanfield Vantage Ltd., Series 2005-1A, Class D, Variable Rate | |||||||||||
| 1,000 | 5.337%, 3/21/17(4) | 1,006,400 | |||||||||
| $ | 9,798,683 | ||||||||||
| Food Products — 0.4% | |||||||||||
| American Seafood Group, LLC | |||||||||||
| $ | 30 | 10.125%, 4/15/10 | $ | 31,800 | |||||||
| ASG Consolidated, LLC/ASG Finance, Inc., Sr. Disc. Notes | |||||||||||
| 400 | 11.50%, 11/1/11 | 310,000 | |||||||||
| Pierre Foods, Inc., Sr. Sub. Notes | |||||||||||
| 320 | 9.875%, 7/15/12 | 324,800 | |||||||||
| Pinnacle Foods Holdings Corp., Sr. Sub. Notes | |||||||||||
| 2,185 | 8.25%, 12/1/13 | 2,032,050 | |||||||||
| United Agricultural Products, Sr. Notes | |||||||||||
| 86 | 8.25%, 12/15/11 | 90,730 | |||||||||
| $ | 2,789,380 | ||||||||||
| Food / Drug Retailers — 0.0% | |||||||||||
| Rite Aid Corp. | |||||||||||
| $ | 130 | 7.125%, 1/15/07 | $ | 130,650 | |||||||
| 190 | 8.125%, 5/1/10 | 190,950 | |||||||||
| $ | 321,600 | ||||||||||
| Forest Products — 0.6% | |||||||||||
| Caraustar Industries, Inc. | |||||||||||
| $ | 40 | 7.375%, 6/1/09 | $ | 38,600 | |||||||
| Caraustar Industries, Inc., Sr. Sub. Notes | |||||||||||
| 920 | 9.875%, 4/1/11 | 906,200 | |||||||||
| Domtar, Inc. | |||||||||||
| 290 | 7.125%, 8/1/15 | 246,500 | |||||||||
| Georgia-Pacific Corp. | |||||||||||
| 65 | 9.50%, 12/1/11 | 75,725 | |||||||||
| JSG Funding PLC, Sr. Notes | |||||||||||
| 180 | 9.625%, 10/1/12 | 173,700 | |||||||||
| Newark Group, Inc., Sr. Sub. Notes | |||||||||||
| 470 | 9.75%, 3/15/14 | 406,550 | |||||||||
| NewPage Corp. | |||||||||||
| 525 | 10.00%, 5/1/12 | 480,375 | |||||||||
| Norske Skog Canada Ltd., Sr. Notes, Series D | |||||||||||
| 60 | 8.625%, 6/15/11 | 58,200 | |||||||||
See notes to financial statements
17
Eaton Vance Senior Floating-Rate Trust as of October 31, 2005
PORTFOLIO OF INVESTMENTS CONT'D
| Principal Amount (000's omitted) | Security | Value | |||||||||
| Forest Products (continued) | |||||||||||
| Stone Container Corp., Sr. Notes | |||||||||||
| $ | 700 | 9.25%, 2/1/08 | $ | 715,750 | |||||||
| Stone Container Finance Canada | |||||||||||
| 750 | 7.375%, 7/15/14 | 669,375 | |||||||||
| $ | 3,770,975 | ||||||||||
| Healthcare — 1.2% | |||||||||||
| AMR HoldCo, Inc., Sr. Sub. Notes | |||||||||||
| $ | 250 | 10.00%, 2/15/15(4) | $ | 273,750 | |||||||
| Healthsouth Corp., Sr. Notes | |||||||||||
| 280 | 7.375%, 10/1/06 | 280,700 | |||||||||
| Inverness Medical Innovations, Inc., Sr. Sub. Notes | |||||||||||
| 1,565 | 8.75%, 2/15/12 | 1,604,125 | |||||||||
| Medical Device Manufacturing, Inc., Series B | |||||||||||
| 235 | 10.00%, 7/15/12 | 276,125 | |||||||||
| National Mentor, Inc., Sr. Sub. Notes | |||||||||||
| 225 | 9.625%, 12/1/12(4) | 232,875 | |||||||||
| Quintiles Transnational Corp., Sr. Sub. Notes | |||||||||||
| 2,000 | 10.00%, 10/1/13 | 2,217,500 | |||||||||
| Res-Care, Inc., Sr. Notes | |||||||||||
| 195 | 7.75%, 10/15/13(4) | 196,950 | |||||||||
| Service Corp. International, Sr. Notes | |||||||||||
| 400 | 7.00%, 6/15/17(4) | 399,000 | |||||||||
| Tenet Healthcare Corp., Sr. Notes | |||||||||||
| 500 | 9.25%, 2/1/15(4) | 476,250 | |||||||||
| US Oncology, Inc. | |||||||||||
| 220 | 9.00%, 8/15/12 | 233,200 | |||||||||
| 425 | 10.75%, 8/15/14 | 470,687 | |||||||||
| Vanguard Health Holding Co. II LLC, Sr. Sub. Notes | |||||||||||
| 475 | 9.00%, 10/1/14 | 497,562 | |||||||||
| Ventas Realty LP/ Ventas Capital Corp. | |||||||||||
| 140 | 7.125%, 6/1/15 | 145,250 | |||||||||
| VWR International, Inc., Sr. Sub. Notes | |||||||||||
| 385 | 8.00%, 4/15/14 | 375,375 | |||||||||
| $ | 7,679,349 | ||||||||||
| Home Furnishings — 0.0% | |||||||||||
| Fedders North America, Inc. | |||||||||||
| $ | 240 | 9.875%, 3/1/14 | $ | 178,200 | |||||||
| $ | 178,200 | ||||||||||
| Industrial Equipment — 0.3% | |||||||||||
| Case New Holland, Inc., Sr. Notes | |||||||||||
| $ | 40 | 9.25%, 8/1/11 | $ | 42,300 | |||||||
| Principal Amount (000's omitted) | Security | Value | |||||||||
| Industrial Equipment (continued) | |||||||||||
| Chart Industries, Inc., Sr. Sub. Notes | |||||||||||
| $ | 195 | 9.125%, 10/15/15(4) | $ | 194,025 | |||||||
| Milacron Escrow Corp. | |||||||||||
| 355 | 11.50%, 5/15/11 | 307,075 | |||||||||
| Thermadyne Holdings Corp., Sr. Sub. Notes | |||||||||||
| 1,345 | 9.25%, 2/1/14 | 1,210,500 | |||||||||
| $ | 1,753,900 | ||||||||||
| Leisure Goods / Activities / Movies — 0.4% | |||||||||||
| AMC Entertainment, Inc., Sr. Sub. Notes | |||||||||||
| $ | 210 | 9.875%, 2/1/12 | $ | 201,600 | |||||||
| Loews Cineplex Entertainment Corp. | |||||||||||
| 600 | 9.00%, 8/1/14 | 580,500 | |||||||||
| Marquee Holdings, Inc., Sr. Disc. Notes | |||||||||||
| 590 | 12.00%, 8/15/14(4) | 358,425 | |||||||||
| Six Flags Theme Parks, Inc., Sr. Notes | |||||||||||
| 535 | 8.875%, 2/1/10 | 533,662 | |||||||||
| Universal City Development Partners, Sr. Notes | |||||||||||
| 245 | 11.75%, 4/1/10 | 275,931 | |||||||||
| Universal City Florida Holding, Sr. Notes | |||||||||||
| 55 | 8.375%, 5/1/10 | 56,650 | |||||||||
| Universal City Florida, Sr. Notes, Variable Rate | |||||||||||
| 340 | 8.443%, 5/1/10 | 349,775 | |||||||||
| $ | 2,356,543 | ||||||||||
| Lodging and Casinos — 0.8% | |||||||||||
| CCM Merger, Inc. | |||||||||||
| $ | 235 | 8.00%, 8/1/13(4) | $ | 233,825 | |||||||
| Chukchansi EDA, Sr. Notes | |||||||||||
| 120 | 8.00%, 11/15/13(4) | 120,000 | |||||||||
| Chukchansi EDA, Sr. Notes, Variable Rate | |||||||||||
| 280 | 8.06%, 11/15/12(4) | 280,000 | |||||||||
| Felcor Lodging L.P., Sr. Notes, Variable Rate | |||||||||||
| 140 | 7.78%, 6/1/11 | 144,725 | |||||||||
| Host Marriot L.P., Series O | |||||||||||
| 30 | 6.375%, 3/15/15 | 29,250 | |||||||||
| Inn of the Mountain Gods, Sr. Notes | |||||||||||
| 525 | 12.00%, 11/15/10 | 564,375 | |||||||||
| Kerzner International, Sr. Sub Note | |||||||||||
| 1,080 | 6.75%, 10/1/15(4) | 1,031,400 | |||||||||
| Majestic Star Casino LLC | |||||||||||
| 465 | 9.50%, 10/15/10 | 457,444 | |||||||||
| Meristar Hospitality Operations/Finance | |||||||||||
| 280 | 10.50%, 6/15/09 | 297,150 | |||||||||
See notes to financial statements
18
Eaton Vance Senior Floating-Rate Trust as of October 31, 2005
PORTFOLIO OF INVESTMENTS CONT'D
| Principal Amount (000's omitted) | Security | Value | |||||||||
| Lodging and Casinos (continued) | |||||||||||
| Mohegan Tribal Gaming Authority, Sr. Sub. Notes | |||||||||||
| $ | 95 | 8.00%, 4/1/12 | $ | 99,394 | |||||||
| OED Corp./Diamond Jo LLC | |||||||||||
| 355 | 8.75%, 4/15/12 | 346,125 | |||||||||
| San Pasqual Casino | |||||||||||
| 305 | 8.00%, 9/15/13(4) | 305,000 | |||||||||
| Seneca Gaming Corp., Sr. Notes | |||||||||||
| 130 | 7.25%, 5/1/12 | 133,412 | |||||||||
| 70 | 7.25%, 5/1/12(4) | 71,837 | |||||||||
| Station Casinos, Sr. Sub. Notes | |||||||||||
| 215 | 6.875%, 3/1/16 | 217,687 | |||||||||
| Trump Entertainment Resorts, Inc. | |||||||||||
| 840 | 8.50%, 6/1/15 | 817,950 | |||||||||
| Wynn Las Vegas, LLC/Corp. | |||||||||||
| 105 | 6.625%, 12/1/14 | 100,537 | |||||||||
| $ | 5,250,111 | ||||||||||
| Nonferrous Metals / Minerals — 0.1% | |||||||||||
| Alpha Natural Resources, Sr. Notes | |||||||||||
| $ | 135 | 10.25%, 6/1/12 | $ | 149,175 | |||||||
| Novelis, Inc., Sr. Notes | |||||||||||
| 245 | 7.50%, 2/15/15(4) | 224,787 | |||||||||
| $ | 373,962 | ||||||||||
| Oil and Gas — 0.4% | |||||||||||
| Aventine Renewable Energy Holdings, Inc., Variable Rate | |||||||||||
| $ | 100 | 9.41%, 12/15/11(4) | $ | 104,500 | |||||||
| Clayton Williams Energy, Inc., Sr. Notes | |||||||||||
| 95 | 7.75%, 8/1/13(4) | 92,150 | |||||||||
| Coastal Corp., Sr. Debs. | |||||||||||
| 225 | 9.625%, 5/15/12 | 248,625 | |||||||||
| El Paso Corp. | |||||||||||
| 140 | 6.95%, 12/15/07 | 141,575 | |||||||||
| El Paso Corp., Sr. Notes | |||||||||||
| 155 | 7.625%, 8/16/07 | 158,100 | |||||||||
| El Paso Production Holding Co. | |||||||||||
| 50 | 7.75%, 6/1/13 | 51,750 | |||||||||
| Giant Industries | |||||||||||
| 225 | 8.00%, 5/15/14 | 234,000 | |||||||||
| Hanover Compressor Co., Sr. Sub. Notes | |||||||||||
| 680 | 0.00%, 3/31/07 | 603,500 | |||||||||
| Hanover Equipment Trust, Series B | |||||||||||
| 135 | 8.75%, 9/1/11 | 143,775 | |||||||||
| Ocean Rig Norway AS, Sr. Notes | |||||||||||
| 100 | 8.375%, 7/1/13(4) | 107,875 | |||||||||
| Principal Amount (000's omitted) | Security | Value | |||||||||
| Oil and Gas (continued) | |||||||||||
| Parker Drilling Co., Sr. Notes | |||||||||||
| $ | 100 | 9.625%, 10/1/13 | $ | 113,500 | |||||||
| Petrobras International Finance Co. | |||||||||||
| 50 | 7.75%, 9/15/14 | 53,250 | |||||||||
| Transmontaigne, Inc., Sr. Sub. Notes | |||||||||||
| 175 | 9.125%, 6/1/10 | 174,125 | |||||||||
| United Refining Co., Sr. Notes | |||||||||||
| 410 | 10.50%, 8/15/12 | 434,600 | |||||||||
| Williams Cos., Inc. (The) | |||||||||||
| 80 | 8.75%, 3/15/32 | 92,700 | |||||||||
| $ | 2,754,025 | ||||||||||
| Publishing — 0.3% | |||||||||||
| American Media Operations, Inc., Series B | |||||||||||
| $ | 745 | 10.25%, 5/1/09 | $ | 709,612 | |||||||
| CBD Media, Inc., Sr. Sub. Notes | |||||||||||
| 125 | 8.625%, 6/1/11 | 127,500 | |||||||||
| Dex Media West LLC, Sr. Sub. Notes | |||||||||||
| 87 | 9.875%, 8/15/13 | 96,352 | |||||||||
| Houghton Mifflin Co., Sr. Sub. Notes | |||||||||||
| 1,245 | 9.875%, 2/1/13 | 1,291,688 | |||||||||
| $ | 2,225,152 | ||||||||||
| Radio and Television — 1.0% | |||||||||||
| Advanstar Communications, Inc. | |||||||||||
| $ | 1,000 | 10.75%, 8/15/10 | $ | 1,112,500 | |||||||
| CanWest Media, Inc. | |||||||||||
| 464 | 8.00%, 9/15/12 | 488,133 | |||||||||
| Emmis Communications Corp., Sr. Notes, Variable Rate | |||||||||||
| 3,000 | 9.745%, 6/15/12 | 3,022,500 | |||||||||
| LBI Media, Inc. | |||||||||||
| 165 | 10.125%, 7/15/12 | 176,138 | |||||||||
| Nexstar Finance Holdings LLC, Inc., Sr. Disc. Notes | |||||||||||
| 110 | 11.375%, 4/1/13 | 79,750 | |||||||||
| Nextmedia Operating, Inc. | |||||||||||
| 100 | 10.75%, 7/1/11 | 109,125 | |||||||||
| Paxson Communications Corp. | |||||||||||
| 105 | 10.75%, 7/15/08 | 103,163 | |||||||||
| Rainbow National Services, LLC, Sr. Notes | |||||||||||
| 180 | 8.75%, 9/1/12(4) | 189,900 | |||||||||
| Rainbow National Services, LLC, Sr. Sub. Debs. | |||||||||||
| 645 | 10.375%, 9/1/14(4) | 712,725 | |||||||||
| Sirius Satellite Radio, Sr. Notes | |||||||||||
| 480 | 9.625%, 8/1/13(4) | 456,600 | |||||||||
| $ | 6,450,534 | ||||||||||
See notes to financial statements
19
Eaton Vance Senior Floating-Rate Trust as of October 31, 2005
PORTFOLIO OF INVESTMENTS CONT'D
| Principal Amount (000's omitted) | Security | Value | |||||||||
| Rail Industries — 0.0% | |||||||||||
| TFM SA de C.V., Sr. Notes | |||||||||||
| $ | 85 | 12.50%, 6/15/12 | $ | 98,600 | |||||||
| $ | 98,600 | ||||||||||
| Retailers (Except Food and Drug) — 0.5% | |||||||||||
| Affinity Group, Inc., Sr. Sub. Notes | |||||||||||
| $ | 1,190 | 9.00%, 2/15/12 | $ | 1,184,050 | |||||||
| GSC Holdings Corp. | |||||||||||
| 815 | 8.00%, 10/1/12(4) | 796,663 | |||||||||
| GSC Holdings Corp., Variable Rate | |||||||||||
| 485 | 7.895%, 10/1/11(4) | 487,425 | |||||||||
| Neiman Marcus Group, Inc., Sr. Notes | |||||||||||
| 80 | 9.00%, 10/15/15(4) | 79,000 | |||||||||
| Neiman Marcus Group, Inc., Sr. Sub. Notes | |||||||||||
| 485 | 10.375%, 10/15/15(4) | 470,450 | |||||||||
| $ | 3,017,588 | ||||||||||
| Steel — 0.0% | |||||||||||
| Ispat Inland ULC, Sr. Notes | |||||||||||
| $ | 199 | 9.75%, 4/1/14 | $ | 225,865 | |||||||
| $ | 225,865 | ||||||||||
| Surface Transport — 0.1% | |||||||||||
| Horizon Lines, LLC | |||||||||||
| $ | 217 | 9.00%, 11/1/12 | $ | 231,376 | |||||||
| OMI Corp., Sr. Notes | |||||||||||
| 30 | 7.625%, 12/1/13 | 30,900 | |||||||||
| Quality Distribution LLC/ QD Capital Corp., Variable Rate | |||||||||||
| 130 | 8.65%, 1/15/12(4) | 125,613 | |||||||||
| $ | 387,889 | ||||||||||
| Telecommunications — 2.0% | |||||||||||
| AirGate PCS, Inc., Variable Rate | |||||||||||
| $ | 105 | 7.90%, 10/15/11 | $ | 108,150 | |||||||
| Alamosa Delaware, Inc., Sr. Disc. Notes | |||||||||||
| 180 | 12.00%, 7/31/09 | 198,000 | |||||||||
| Alamosa Delaware, Inc., Sr. Notes | |||||||||||
| 515 | 11.00%, 7/31/10 | 572,938 | |||||||||
| Centennial Cellular Operating Co., Sr. Notes | |||||||||||
| 485 | 10.125%, 6/15/13 | 544,413 | |||||||||
| Digicel Ltd., Sr. Notes | |||||||||||
| 100 | 9.25%, 9/1/12(4) | 103,500 | |||||||||
| Inmarsat Finance PLC | |||||||||||
| 269 | 7.625%, 6/30/12 | 273,371 | |||||||||
| Principal Amount (000's omitted) | Security | Value | |||||||||
| Telecommunications (continued) | |||||||||||
| Intelsat Bermuda Ltd., Sr. Notes, Variable Rate | |||||||||||
| $ | 435 | 8.695%, 1/15/12(4) | $ | 442,613 | |||||||
| Intelsat Ltd., Sr. Notes | |||||||||||
| 1,085 | 5.25%, 11/1/08 | 998,200 | |||||||||
| IWO Holdings, Inc. | |||||||||||
| 200 | 10.75%, 1/15/15 | 144,000 | |||||||||
| LCI International, Inc., Sr. Notes | |||||||||||
| 905 | 7.25%, 6/15/07 | 898,213 | |||||||||
| New Skies Satellites NV, Sr. Notes | |||||||||||
| 350 | 9.125%, 11/1/12 | 357,000 | |||||||||
| New Skies Satellites NV, Sr. Notes, Variable Rate | |||||||||||
| 195 | 9.573%, 11/1/11 | 200,850 | |||||||||
| Qwest Capital Funding, Inc. | |||||||||||
| 375 | 7.75%, 8/15/06 | 382,500 | |||||||||
| 180 | 6.375%, 7/15/08 | 175,950 | |||||||||
| Qwest Communications International, Inc. | |||||||||||
| 95 | 7.25%, 2/15/11 | 92,863 | |||||||||
| Qwest Communications International, Inc., Sr. Notes | |||||||||||
| 690 | 7.50%, 2/15/14(4) | 664,125 | |||||||||
| Qwest Corp., Sr. Notes | |||||||||||
| 140 | 7.625%, 6/15/15(4) | 144,200 | |||||||||
| Qwest Corp., Sr. Notes, Variable Rate | |||||||||||
| 925 | 7.12%, 6/15/13(4) | 980,500 | |||||||||
| Qwest Services Corp. | |||||||||||
| 525 | 13.50%, 12/15/10 | 602,438 | |||||||||
| Rogers Wireless, Inc. | |||||||||||
| 305 | 7.50%, 3/15/15 | 328,638 | |||||||||
| Rogers Wireless, Inc., Sr. Sub. Notes | |||||||||||
| 170 | 8.00%, 12/15/12 | 180,625 | |||||||||
| Rogers Wireless, Inc., Variable Rate | |||||||||||
| 1,453 | 6.995%, 12/15/10 | 1,511,120 | |||||||||
| Rural Cellular Corp., Variable Rate | |||||||||||
| 2,000 | 8.37%, 3/15/10 | 2,055,000 | |||||||||
| SBA Telecommunications, Sr. Disc. Notes | |||||||||||
| 121 | 9.75%, 12/15/11 | 109,808 | |||||||||
| UbiquiTel Operating Co., Sr. Notes | |||||||||||
| 395 | 9.875%, 3/1/11 | 433,513 | |||||||||
| $ | 12,502,528 | ||||||||||
| Utilities — 0.2% | |||||||||||
| Calpine Corp., Sr. Notes | |||||||||||
| $ | 500 | 8.75%, 7/15/07 | $ | 305,000 | |||||||
| Dynegy Holdings, Inc. Debs. | |||||||||||
| 330 | 7.625%, 10/15/26 | 292,050 | |||||||||
See notes to financial statements
20
Eaton Vance Senior Floating-Rate Trust as of October 31, 2005
PORTFOLIO OF INVESTMENTS CONT'D
| Principal Amount (000's omitted) | Security | Value | |||||||||
| Utilities (continued) | |||||||||||
| Dynegy Holdings, Inc., Sr. Notes | |||||||||||
| $ | 115 | 10.125%, 7/15/13(4) | $ | 127,075 | |||||||
| Mission Energy Holding Co. | |||||||||||
| 215 | 13.50%, 7/15/08 | 249,938 | |||||||||
| NRG Energy, Inc. | |||||||||||
| 302 | 8.00%, 12/15/13 | 330,690 | |||||||||
| $ | 1,304,753 | ||||||||||
| Total Corporate Bonds & Notes (identified cost $101,404,493) | $ | 100,338,413 | |||||||||
| Convertible Bonds — 0.0% | |||||||||||
| Shares/Rights | Security | Value | |||||||||
| 220,000 | Nortel Networks Ltd. | $ | 206,525 | ||||||||
| Total Convertible Bonds (identified cost, $213,366) | $ | 206,525 | |||||||||
| Common Stocks and Warrants — 0.1% | |||||||||||
| Shares/Rights | Security | Value | |||||||||
| 105,000 | Amkor Technologies, Inc. | $ | 101,588 | ||||||||
| 310,000 | L-3 Communications Corp.(4) | 313,100 | |||||||||
| Total Common Stocks and Warrants (identified cost, $415,482) | $ | 414,688 | |||||||||
| Common Stocks — 0.1% | |||||||||||
| Shares | Security | Value | |||||||||
| 98 | Crown Castle International Corp.(5) | $ | 2,402 | ||||||||
| 33,486 | Trump Entertainment Resorts, Inc.(5) | 574,789 | |||||||||
| Total Common Stocks (identified cost, $415,932) | $ | 577,191 | |||||||||
| Preferred Stocks — 0.0% | |||||||||||
| Shares | Security | Value | |||||||||
| 934 | Crown Castle International Corp., (PIK), 6.25% | $ | 48,101 | ||||||||
| Total Preferred Stocks (identified cost, $44,588) | $ | 48,101 | |||||||||
| Warrants — 0.0% | |||||||||||
| Shares/Rights | Security | Value | |||||||||
| 190 | Mueller Holdings, Inc., Exp. 4/15/14(4)(5) | $ | 76,998 | ||||||||
| Total Warrants (identified cost, $0) | $ | 76,998 | |||||||||
| Closed-End Investment Companies — 3.5% | |||||||||||
| Shares | Security | Value | |||||||||
| 87,500 | Citigroup Investments Corporate Loan Fund, Inc. | $ | 1,101,625 | ||||||||
| 125,000 | First Trust/Four Corners Senior Floating Rate Income Fund II | 2,143,750 | |||||||||
| 20,000 | Floating Rate Income Strategies Fund II, Inc. | 346,400 | |||||||||
| 25,000 | Floating Rate Income Strategies Fund, Inc. | 428,500 | |||||||||
| 895,800 | ING Prime Rate Trust | 6,010,818 | |||||||||
| 130,000 | Pioneer Floating Rate Trust | 2,278,900 | |||||||||
| 1,197,000 | Van Kampen Senior Income Trust | 9,408,420 | |||||||||
| Total Closed-End Investment Companies (identified cost, $23,835,934) | $ | 21,718,413 | |||||||||
| Miscellaneous — 0.0% | |||||||||||
| Shares | Security | Value | |||||||||
| 535,000 | Trump Atlantic City(5)(6) | $ | 20,598 | ||||||||
| Total Miscellaneous (identified cost, $0) | $ | 20,598 | |||||||||
| Commercial Paper — 5.4% | |||||||||||
| Principal Amount | Maturity Date | Borrower | Rate | Amount | |||||||||||||||
| $ | 20,634,000 | 11/01/05 | General Electric Capital Corp. | 4.02 | % | $ | 20,634,000 | ||||||||||||
| 8,733,000 | 11/01/05 | MetLife Funding, Inc. | 3.86 | % | 8,733,000 | ||||||||||||||
| 1,500,000 | 11/01/05 | Old Line Funding, LLC | 3.86 | % | 1,500,000 | ||||||||||||||
| 3,205,000 | 11/01/05 | Prudential Financial, Inc. | 4.02 | % | 3,205,000 | ||||||||||||||
| Total Commercial Paper (at amortized cost) | $ | 34,072,000 | |||||
See notes to financial statements
21
Eaton Vance Senior Floating-Rate Trust as of October 31, 2005
PORTFOLIO OF INVESTMENTS CONT'D
| Short-Term Investments — 0.3% | |||||||||||||||||||
| Principal Amount | Maturity Date | Borrower | Rate | Amount | |||||||||||||||
| $ | 2,000,000 | 11/01/05 | Investors Bank and Trust Company Time Deposit | 4.03 | % | $ | 2,000,000 | ||||||||||||
| Total Short-Term Investments (at amortized cost) | $ | 2,000,000 | |||||||||||||||||
| Gross Investments — 161.3% (identified cost $1,008,224,584) | $ | 1,012,166,009 | |||||||||||||||||
| Less Unfunded Loan Commitments — (0.6)% | $ | (3,756,385 | ) | ||||||||||||||||
| Net Investments — 160.7% (identified cost $1,004,468,199) | $ | 1,008,409,624 | |||||||||||||||||
| Other Assets, Less Liabilities — 2.2% | $ | 13,676,316 | |||||||||||||||||
| Auction Preferred Shares Plus Cumulative Unpaid Dividends — (62.9)% | $ | (394,500,282 | ) | ||||||||||||||||
| Net Assets Applicable to Common Shares — 100.0% | $ | 627,585,658 | |||||||||||||||||
PIK - Payment In Kind.
(1) Senior floating-rate interests often require prepayments from excess cash flows or permit the borrower to repay at its election. The degree to which borrowers repay, whether as a contractual requirement or at their election, cannot be predicted with accuracy. As a result, the actual remaining maturity may be substantially less than the stated maturities shown. However, it is anticipated that the senior floating-rate interests will have an expected average life of approximately two to three years. The stated interest rate represents the weighted average interest rate of all contracts within the senior loan facility. Senior Loans typically have rates of interest which are redetermined either daily, monthly, quarterly or semi-annually by reference to a base lending rate, plus a premium. These base lending rates are primarily the London - -Interbank Offered Rate ("LIBOR"), and secondarily the prime rate offered by one or more major United States banks (the "Prime Rate") and the certificate of deposit ("CD") rate or other base lending rates used by commercial lenders.
(2) Unfunded loan commitments. See Note 1E for description.
(3) Security is in default and making only partial interest payments.
(4) Security exempt from registration under Rule 144A of the Securities Act of 1933. These securities may be sold in transactions exempt from registration, normally to qualified
institutional buyers. At October 31, 2005, the aggregate value of the securities is $30,025,181 or 4.8% of the net assets.
(5) Non-income producing security.
(6) Security valued at fair value using methods determined in good faith by or at the direction of the Trustees.
See notes to financial statements
22
Eaton Vance Senior Floating-Rate Trust as of October 31, 2005
FINANCIAL STATEMENTS
Statement of Assets and Liabilities
As of October 31, 2005
| Assets | |||||||
| Investments, at value (identified cost, $1,004,468,199) | $ | 1,008,409,624 | |||||
| Cash | 6,181,538 | ||||||
| Receivable for investments sold | 3,512,102 | ||||||
| Dividends and interest receivable | 7,290,357 | ||||||
| Prepaid expenses | 77,801 | ||||||
| Total assets | $ | 1,025,471,422 | |||||
| Liabilities | |||||||
| Payable for investments purchased | $ | 1,351,426 | |||||
| Payable to agency bank | 1,077,255 | ||||||
| Payable to affiliate for investment advisory fees | 478,212 | ||||||
| Payable to affiliate | 114,409 | ||||||
| Payable for open swap contracts | 48,933 | ||||||
| Payable to affiliate for Trustees' fees | 1,979 | ||||||
| Accrued expenses | 313,268 | ||||||
| Total liabilities | $ | 3,385,482 | |||||
| Auction preferred shares (15,760 shares outstanding) at liquidation value plus cumulative unpaid dividends | 394,500,282 | ||||||
| Net assets applicable to common shares | $ | 627,585,658 | |||||
| Sources of Net Assets | |||||||
| Common Shares, $0.01 par value, unlimited number of shares authorized, 33,488,490 shares issued and outstanding | $ | 334,885 | |||||
| Additional paid-in capital | 634,454,573 | ||||||
| Accumulated net realized loss (computed on the basis of identified cost) | (11,752,652 | ) | |||||
| Accumulated undistributed net investment income | 801,658 | ||||||
| Net unrealized appreciation (computed on the basis of identified cost) | 3,747,194 | ||||||
| Net assets applicable to common shares | $ | 627,585,658 | |||||
| Net Asset Value Per Common Share | |||||||
| ($627,585,658 ÷ 33,488,490 common shares issued and outstanding) | $ | 18.74 | |||||
Statement of Operations
For the Year Ended
October 31, 2005
| Investment Income | |||||||
| Interest | $ | 57,986,444 | |||||
| Dividends | 1,156,012 | ||||||
| Total investment income | $ | 59,142,456 | |||||
| Expenses | |||||||
| Investment adviser fee | $ | 7,705,041 | |||||
| Trustees' fees and expenses | 21,109 | ||||||
| Preferred shares remarketing agent fee | 985,000 | ||||||
| Custodian fee | 309,595 | ||||||
| Printing and postage | 124,801 | ||||||
| Legal and accounting services | 113,798 | ||||||
| Transfer and dividend disbursing agent fees | 70,356 | ||||||
| Registration fees | 21,930 | ||||||
| Miscellaneous | 69,015 | ||||||
| Total expenses | $ | 9,420,645 | |||||
| Deduct — Reduction of custodian fee | $ | 8,610 | |||||
| Reduction of Investment Adviser fee | 2,052,751 | ||||||
| Total expense reductions | $ | 2,061,361 | |||||
| Net expenses | $ | 7,359,284 | |||||
| Net investment income | $ | 51,783,172 | |||||
| Realized and Unrealized Gain (Loss) | |||||||
| Net realized gain (loss) — Investment transactions (identified cost basis) | $ | (3,743,015 | ) | ||||
| Swap contracts | 229,869 | ||||||
| Net realized loss | $ | (3,513,146 | ) | ||||
| Change in unrealized appreciation (depreciation) — | |||||||
| Investments (identified cost basis) | $ | (2,808,253 | ) | ||||
| Swap contracts | (66,582 | ) | |||||
| Net change in unrealized appreciation (depreciation) | $ | (2,874,835 | ) | ||||
| Net realized and unrealized loss | $ | (6,387,981 | ) | ||||
| Distributions to preferred shareholders from income | $ | (11,840,232 | ) | ||||
| Net increase in net assets from operations | $ | 33,554,959 | |||||
See notes to financial statements
23
Eaton Vance Senior Floating-Rate Trust as of October 31, 2005
FINANCIAL STATEMENTS CONT'D
Statements of Changes in Net Assets
| Increase (Decrease) in Net Assets | Year Ended October 31, 2005 | Period Ended October 31, 2004(1) | |||||||||
| From operations — Net investment income | $ | 51,783,172 | $ | 31,944,766 | |||||||
| Net realized loss from Investment transactions and swaps contracts | (3,513,146 | ) | (3,804,412 | ) | |||||||
| Net change in unrealized appreciation (depreciation) from investments and swaps contracts | (2,874,835 | ) | 6,622,029 | ||||||||
| Distributions to preferred shareholders from net investment income | (11,840,232 | ) | (4,366,536 | ) | |||||||
| Net increase in net assets from operations | $ | 33,554,959 | $ | 30,395,847 | |||||||
| Distributions to common shareholders — From net investment income | $ | (41,162,227 | ) | $ | (29,992,379 | ) | |||||
| Total distributions to common shareholders | $ | (41,162,227 | ) | $ | (29,992,379 | ) | |||||
| Capital share transactions — Proceeds from sale of common shares | $ | — | $ | 635,075,000 | (2) | ||||||
| Reinvestment of distributions to common shareholders | 1,608,927 | 2,824,407 | |||||||||
| Offering costs and preferred shares underwriting discounts | — | (4,818,876 | ) | ||||||||
| Net increase in net assets from capital share transactions | $ | 1,608,927 | $ | 633,080,531 | |||||||
| Net increase (decrease) in net assets | $ | (5,998,341 | ) | $ | 633,483,999 | ||||||
| Net Assets Applicable to Common Shares | |||||||||||
| At beginning of year | $ | 633,583,999 | $ | 100,000 | |||||||
| At end of year | $ | 627,585,658 | $ | 633,583,999 | |||||||
| Accumulated undistributed (overdistributed) net investment income included in net assets applicable to common shares | |||||||||||
| At end of year | $ | 801,658 | $ | 539,293 | |||||||
(1) For the period from the start of business, November 28, 2003, to October 31, 2004.
(2) Proceeds from sales of shares net of sales load paid of $29,925,000.
See notes to financial statements
24
Eaton Vance Senior Floating-Rate Trust as of October 31, 2005
FINANCIAL STATEMENTS CONT'D
Financial Highlights
Selected data for a common share outstanding during the periods stated
| Year Ended October 31, | |||||||||||
| 2005(1) | 2004(1)(2) | ||||||||||
| Net asset value — Beginning of year (Common shares) | $ | 18.970 | $ | 19.100 | (3) | ||||||
| Income (loss) from operations | |||||||||||
| Net investment income | $ | 1.547 | $ | 0.968 | |||||||
| Net realized and unrealized gain (loss) | (0.193 | ) | 0.080 | ||||||||
| Distribution to preferred shareholders from net investment income | (0.354 | ) | (0.132 | ) | |||||||
| Total income from operations | $ | 1.000 | $ | 0.916 | |||||||
| Less distributions to common shareholders | |||||||||||
| From net investment income | $ | (1.230 | ) | $ | (0.900 | ) | |||||
| Total distributions to common shareholders | $ | (1.230 | ) | $ | (0.900 | ) | |||||
| Preferred and Common shares offering costs charged to paid-in capital | $ | — | $ | (0.027 | ) | ||||||
| Preferred Shares underwriting discounts | $ | — | $ | (0.119 | ) | ||||||
| Net asset value — End of period (Common shares) | $ | 18.740 | $ | 18.970 | |||||||
| Market value — End of period (Common shares) | $ | 17.210 | $ | 19.940 | |||||||
| Total Investment Return on Net Asset Value(5) | 5.57 | % | 4.13 | %(4) | |||||||
| Total Investment Return on Market Value(5) | (7.77 | )% | 9.45 | %(4) | |||||||
See notes to financial statements
25
Eaton Vance Senior Floating-Rate Trust as of October 31, 2005
FINANCIAL STATEMENTS CONT'D
Financial Highlights
Selected data for a common share outstanding during the periods stated
| Year Ended October 31, | |||||||||||
| 2005(1) | 2004(1)(2) | ||||||||||
| Ratios/Supplemental Data† †† | |||||||||||
| Net assets applicable to common shares, end of year (000's omitted) | $ | 627,586 | $ | 633,584 | |||||||
| Ratios (As a percentage of average net assets applicable to common shares): | |||||||||||
| Net expenses(6) | 1.16 | % | 1.08 | %(7) | |||||||
| Net expenses after custodian fee reduction(6) | 1.16 | % | 1.08 | %(7) | |||||||
| Net investment income(6) | 8.18 | % | 5.51 | %(7) | |||||||
| Portfolio Turnover | 64 | % | 95 | % | |||||||
† The operating expenses of the Trust reflect a reduction of the investment advisor fee and/or a reimbursement of expenses by the Advisor. Had such actions not been taken, the ratios and net investment income per share would have been as follows:
| Ratios (As a percentage of average net assets applicable to common shares): | |||||||||||
| Expenses(6) | 1.49 | % | 1.38 | %(7) | |||||||
| Expenses after custodian fee reduction(6) | 1.49 | % | 1.38 | %(7) | |||||||
| Net investment income(6) | 7.85 | % | 5.21 | %(7) | |||||||
| Net investment income per share | $ | 1.486 | $ | 0.914 | |||||||
†† The ratios reported are based on net assets applicable solely to common shares. The ratios based on net assets, including amounts related to preferred shares, are as follows:
Ratios (As a percentage of average total net assets):
| Net expenses | 0.72 | % | 0.71 | %(7) | |||||||
| Net expenses after custodian fee reduction | 0.72 | % | 0.71 | %(7) | |||||||
| Net investment income | 5.04 | % | 3.63 | %(7) | |||||||
† The operating expenses of the Trust reflect a reduction of the investment advisor fee and/or a reimbursement of expenses by the Advisor. Had such actions not been taken, the ratios would have been as follows:
| Ratios (As a percentage of average total net assets): | |||||||||||
| Expenses | 0.92 | % | 0.91 | %(7) | |||||||
| Expenses after custodian fee reduction | 0.92 | % | 0.91 | %(7) | |||||||
| Net investment income | 4.84 | % | 3.43 | %(7) | |||||||
| Senior Securities: | |||||||||||
| Total preferred shares outstanding | 15,760 | 15,760 | |||||||||
| Asset coverage per preferred share(8) | $ | 64,853 | $ | 65,223 | |||||||
| Involuntary liquidation preference per preferred share(9) | $ | 25,000 | $ | 25,000 | |||||||
| Approximate market value per preferred share(9) | $ | 25,000 | $ | 25,000 | |||||||
(1) Computed using average common shares outstanding.
(2) For the period from the start of business, November 28, 2003, to October 31, 2004.
(3) Net asset value at beginning of period reflects the deduction of the sales load of $0.90 per share paid by the shareholder from the $20.00 offering price.
(4) Total investment return on net asset value is calculated assuming a purchase at the offering price of $20.00 less the sales load of $0.90 per share paid by the shareholder on the first day and a sale at the net asset value on the last day of the period reported. Total investment return on market value is calculated assuming a purchase at the offering price of $20.00 less the sales load of $0.90 per share paid by the shareholder on the first day and a sale at the current market price on the last day of the period reported.
(5) Total investment return on net asset value and total investment return on market value are not computed on an annualized basis.
(6) Ratios do not reflect the effect of dividend payments to preferred shareholders. Ratios to average net assets applicable to common shares reflect the Fund's leveraged capital structure.
(7) Annualized.
(8) Calculated by subtracting the Fund's total liabilities (not including the preferred shares) from the Fund's total assets, and dividing this by the number of preferred shares outstanding.
(9) Plus accumulated and unpaid dividends.
See notes to financial statements
26
Eaton Vance Senior Floating-Rate Trust as of October 31, 2005
NOTES TO FINANCIAL STATEMENTS
1 Significant Accounting Policies
Eaton Vance Senior Floating-Rate Trust (the Trust) is registered under the Investment Company Act of 1940, as amended, as a closed-end management investment company. The Trust, which was organized as a Massachusetts business trust on August 5, 2003, seeks to provide a high level of current income. The Trust may, as a secondary objective, also seek preservation of capital to the extent consistent with its primary goal of high current income. The Trust pursues its objectives by investing primarily in senior, secured floating rate loans (Senior Loans). The following is a summary of significant accounting policies of the Trust. The policies are in conformity with accounting principles generally accepted in the United States of America.
A Investment Valuation — The Trust's investments are primarily in interests in senior floating rate loans (Senior Loans). Certain Senior Loans are deemed to be liquid because reliable market quotations are readily available for them. Liquid Senior Loans are valued on the basis of prices furnished by a pricing service. Other Senior Loans are valued at fair value by the Trust's investment adviser, Eaton Vance Management (EVM), under procedures approved by the Trustees. In connection with determining the fair value of a Senior Loan, the investment adviser makes an assessment of the likelihood that the borrower will make a full repayment of the Senior Loan. The primary factors considered by the investment adviser when making this assessment are (i) the creditworthiness of the borrower, (ii) the value of the collateral backing the Senior Loan, and (iii) the priority of the Senior Loan versus other creditors of the borrower. If, based on its assessment, the investment adviser believes there is a reasonable likelihood that the borrower will make a full repayment of the Senior Loan, the investment adviser will determine the fair value of the Senior Loan using a matrix pricing approach that considers the yield on the Senior Loan relative to yields on other loan interests issued by companies of comparable credit quality. If, based on its assessment, the investment adviser believes there is not a reasonable likelihood that the borrower will make a full repayment of the Senior Loan, the investment adviser will determine the fair value of the Senior Loan using analyses that include, but are not limited to (i) a comparison of the value of the borrower's outstanding equity and debt to that of comparable public companies; (ii) a discounted cash flow analysis; or (iii) when the investment ad viser believes it is likely that a borrower will be liquidated or sold, an analysis of the terms of such liquidation or sale. In certain cases, the investment adviser will use a combination of analytical methods to determine fair value, such as when only a portion of a borrower's assets are likely to be sold. In conducting its assessment and analyses for purposes of determining fair value of a Senior Loan, the investment adviser will use its discretion and judgment in considering and appraising such factors, data and information and the relative weight to be given thereto as it deems relevant, including without limitation, some or all of the following: (i) the fundamental characteristics of and fundamental analytical data relating to the Senior Loan, including the cost, size, current interest rate, maturity and base lending rate of the Senior Loan, the terms and conditions of the Senior Loan and any related agreements, and the position o f the Senior Loan in the Borrower's debt structure; (ii) the nature, adequacy and value of the collateral securing the Senior Loan, including the Trust's rights, remedies and interests with respect to the collateral; (iii) the creditworthiness of the Borrower, based on an evaluation of, among other things, its financial condition, financial statements and information about the Borrower's business, cash flows, capital structure and future prospects; (iv) information relating to the market for the Senior Loan, including price quotations for and trading in the Senior Loan and interests in similar Senior Loans and the market environment and investor attitudes towards the Senior Loan and interests in similar Senior Loans; (v) the experience, reputation, stability and financial condition of the agent and any intermediate participants in the Senior Loan; and (vi) general economic and market conditions affecting the fair value of the Senior Loan.
Non-loan portfolio holdings (other than short-term obligations maturing in sixty days or less), including listed securities and securities for which price quotations are available and forward contracts, will normally be valued on the basis of market valuations furnished by dealers or pricing services. Financial futures contracts listed on commodity exchanges and exchange-traded options are valued at closing settlement prices. Over-the-counter options are valued at the mean between the bid and asked prices provided by dealers. Marketable securities listed on the NASDAQ National Market System are valued at the NASDAQ official closing price. The value of interest rate swaps will be based upon a dealer quotation. Short-term obligations and money market securities maturing in sixty days or less are valued at amortized cost which approximates value. Investments for which reliable market quotations are unavailable are valued at fair va lue using methods determined in good faith by or at the direction of the Trustees of the Trust. Occasionally, events affecting the value of foreign securities may occur between the time trading is completed abroad and the close of the Exchange which will not be reflected in the computation of the Trust's net asset value (unless the Trust deems that such
27
Eaton Vance Senior Floating-Rate Trust as of October 31, 2005
NOTES TO FINANCIAL STATEMENTS CONT'D
event would materially affect its net asset value in which case an adjustment would be made and reflected in such computation). The Trust may rely on an independent fair valuation service in making any such adjustment.
B Income — Interest income from Senior Loans is recorded on the accrual basis at the then-current interest rate, while all other interest income is determined on the basis of interest accrued, adjusted for amortization of premium or accretion of discount. Dividend income is recorded on the ex-dividend date for dividends received in cash and/or securities.
C Federal Taxes — The Trust's policy is to comply with the provisions of the Internal Revenue Code applicable to regulated investment companies and to distribute to shareholders each year all of its taxable income, including any net realized gain on investments. Accordingly, no provision for federal income or excise tax is necessary. At October 31, 2005, the Trust, for federal income tax purposes, had a capital loss carryover of $10,668,031 which will reduce the Trust's taxable income arising from future net realized gains on investments, if any, to the extent permitted by the Internal Revenue Code, and thus will reduce the amount of the distributions to shareholders which would otherwise be necessary to relieve the Trust of any liability for federal income or excise tax. Such capital loss carryover will expire on October 31, 2012 ($5,860,075) and October 31, 2013 ($4,807,956).
D Investment Transactions — Investment transactions are recorded on a trade date basis. Realized gains and losses from such transactions are determined using the specific identification method. Securities purchased or sold on a when-issued or delayed delivery basis may be settled a month or more after the transaction date. The securities so purchased are subject to market fluctuations during this period. To the extent that when-issued or delayed delivery purchases are outstanding, the Trust instructs the custodian to segregate assets in a separate account, with a current value at least equal to the amount of its purchase commitments.
E Unfunded Loan Commitments — The Trust may enter into certain credit agreements all or a portion of which may be unfunded. The Trust is obligated to fund these commitments at the borrower's discretion. These commitments are disclosed in the accompanying Portfolio of Investments.
F Offering Costs — Costs incurred by the Trust in connection with the offering of the common shares and preferred shares were recorded as a reduction of capital paid in excess of par applicable to common shares.
G Expense Reduction — Investors Bank & Trust Company (IBT) serves as custodian of the Trust. Pursuant to the custodian agreement, IBT receives a fee reduced by credits which are determined based on the average daily cash balance the Trust maintains with IBT. All credit balances used to reduce the Trust's custodian fees are reported as a reduction of expenses on the Statement of Operations.
H Written Options — Upon the writing of a call or a put option, an amount equal to the premium received by the Trust is included in the Statement of Assets and Liabilities as a liability. The amount of the liability is subsequently marked-to-market to reflect the current value of the option written in accordance with the Trust's policies on investment valuations discussed above. Premiums received from writing options which expire are treated as realized gains. Premiums received from writing options which are exercised or are closed are added to or offset against the proceeds or amount paid on the transaction to determine the realized gain or loss. If a put option is exercised, the premium reduces the cost basis of the securities purchased by the Trust. The Trust, as write r of an option, may have no control over whether the underlying securities may be sold (call) or purchased (put) and, as a result, bears the market risk of an unfavorable change in the price of the securities underlying the written option.
I Purchased Options — Upon the purchase of a call or put option, the premium paid by the Trust is included in the Statement of Assets and Liabilities as an investment. The amount of the investment is subsequently marked-to-market to reflect the current market value of the option purchased, in accordance with the Trust's policies on investment valuations discussed above. If an option which the Trust has purchased expires on the stipulated expiration date, the Trust will realize a loss in the amount of the cost of the option. If the Trust enters into a closing sale transaction, the Trust will realize a gain or loss, depending on whether the sales proceeds from the closing sale transaction are greater or less than the cost of the option. If the Trust exercises a put option, it will realize a gain or loss from the sale of the underlying security, and the proceeds from such sale will be decreased by the premium originally paid. If the Trust exercises a call option, the cost of the security which the Trust purchases upon exercise will be increased by the premium originally paid.
J Financial Futures Contracts — Upon entering into a financial futures contract, the Trust is required to
28
Eaton Vance Senior Floating-Rate Trust as of October 31, 2005
NOTES TO FINANCIAL STATEMENTS CONT'D
deposit an amount (initial margin) either in cash or securities equal to a certain percentage of the purchase price indicated in the financial futures contract. Subsequent payments are made or received by the Trust (margin maintenance) each day, dependent on the daily fluctuations in the value of the underlying securities, and are recorded for book purposes as unrealized gains or losses by the Trust.
If the Trust enters into a closing transaction, the Trust will realize, for book purposes, a gain or loss equal to the difference between the value of the financial futures contract to sell and the financial futures contract to buy. The Trust's investment in financial futures contracts is designed only to hedge against anticipated future changes in interest rates. Should interest rates move unexpectedly, the Trust may not achieve the anticipated benefits of the financial futures contracts and may realize a loss.
K Reverse Repurchase Agreements — The Trust may enter into reverse repurchase agreements. Under such an agreement, the Trust temporarily transfers possession, but not ownership, of a security to a counterparty, in return for cash. At the same time, the Trust agrees to repurchase the security at an agreed-upon price and time in the future. The Trust may enter into reverse repurchase agreements for temporary purposes, such as Trust withdrawals, or for use as hedging instruments where the underlying security is denominated in a foreign currency. As a form of leverage, reverse repurchase agreements may increase the risk of fluctuation in the market value of the Trust's assets or in its yield. Liabilities to counterparties under reverse repurchase agreements are recognized in the Statement of Assets and Liabilities at the same time at which cash is received by the Trust. The securities underlying such agreements continue to be treated as owned by the Trust and remain in the Portfolio of Investments. Interest charged on amounts borrowed by the Trust under reverse repurchase agreements is accrued daily.
L Total Return Swaps — The Trust may enter into swap agreements to hedge against fluctuations in securities prices, interest rates or market conditions; to change the duration of the overall portfolio; to mitigate default risk; or for other risk management purposes. Pursuant to these agreements, the Trust makes monthly payments at a rate equal to a predetermined spread to the one-month LIBOR. In exchange, the Trust receives payments based on the rate of return of a benchmark industry index. During the term of the outstanding swap agreement, changes in the underlying value of the swap are recorded as unrealized gains and losses. Payments received or made at the end of the measurement period are recorded as realized gains and losses. The value of the swap is determined by changes in the relationship between the rate of interest and the benchmark industry index. The Trust is exposed to credit loss in the event of non-performance by the swap counterparty. However, the Trust does not anticipate non-performance by the counterparty. Risk may also arise from the unanticipated movements in value of interest rates or the index.
M Credit Default Swaps — The Trust may enter into credit default swap contracts for risk management purposes, including diversification. When the Trust is the buyer of a credit default swap contract, the Trust is entitled to receive the par (or other agreed-upon) value of a referenced debt obligation from the counterparty to the contract in the event of a default by a third party, such as a U.S. or foreign corporate issuer, on the debt obligation. In return, the Trust would pay the counterparty a periodic stream of payments over the term of the contract provided that no event of default has occurred. If no default occurs, the Trust would have spent the stream of payments and received no benefit from the contract. When the Trust is the seller of a credit default swap contr act, it receives the stream of payments, but is obligated to pay upon default of the referenced debt obligation. As the seller, the Trust would effectively add leverage to its portfolio because, in addition to its total net assets, the Trust would be subject to investment exposure on the notional amount of the swap. The Trust will segregate assets in the form of cash and cash equivalents in an amount equal to the aggregate market value of the credit default swaps of which it is the seller, marked to market on a daily basis. These transactions involve certain risks, including the risk that the seller may be unable to fulfill the transaction.
N Use of Estimates — The preparation of the financial statements in conformity with accounting principles generally accepted in the United States of America requires management to make estimates and assumptions that affect the reported amounts of assets and liabilities at the date of the financial statements and the reported amounts of income and expense during the reporting period. Actual results could differ from those estimates.
O Indemnifications — Under the Trust's organizational documents, its officers and Trustees may be indemnified against certain liabilities and expenses arising out of the performance of their duties to the Trust, and shareholders are indemnified against personal liability for obligations of the Trust. Additionally, in the normal course of business, the Trust enters into agreements with service providers that may contain indemnification clauses. The Trust's maximum exposure under these arrangements is
29
Eaton Vance Senior Floating-Rate Trust as of October 31, 2005
NOTES TO FINANCIAL STATEMENTS CONT'D
unknown as this would involve future claims that may be made against the Trust that have not yet occurred.
2 Auction Preferred Shares
The Trust issued 3,940 shares of Auction Preferred Shares (APS) Series A, 3,940 shares of Auction Preferred Shares (APS) Series B, 3,940 shares of Auction Preferred Shares (APS) Series C, and 3,940 shares of Auction Preferred Shares (APS) Series D on January 26, 2004 in a public offering. The underwriting discount and other offering costs were recorded as a reduction of the capital of the common shares. Dividends on the APS, which accrue daily, are cumulative at a rate which was established at the offering of the APS and have been reset every 28 days thereafter by an auction. Dividend rates ranged from 2.194% to 3.840% for Series A shares, 2.00% to 3.84% for Series B shares, 2.05% to 3.75% for Series C shares, and 2.11% to 3.80% for Series D shares.
The APS are redeemable at the option of the Trust, at a redemption price equal to $25,000 per share, plus accumulated and unpaid dividends on any dividend payment date. The APS are also subject to mandatory redemption at a redemption price equal to $25,000 per share, plus accumulated and unpaid dividends, if the Trust is in default for an extended period on its asset maintenance requirements with respect to the APS. If the dividends on the APS shall remain unpaid in an amount equal to two full years' dividends, the holders of the APS as a class have the right to elect a majority of the Board of Trustees. In general, the holders of the APS and the common shares have equal voting rights of one vote per share, except that the holders of the APS, as a separate class, have the right to elect at least two members of the Board of Trustees. The APS have a liquidation preference of $25,000 per share, plus accumulated and unpaid dividends . The Trust is required to maintain certain asset coverage with respect to the APS as defined in the Trust's By-Laws and the Investment Company Act of 1940. The Trust pays an annual fee equivalent to 0.25% of the APS liquidation value for the remarketing efforts associated with the preferred auctions.
3 Distribution to Shareholders
The Trust intends to make monthly distributions of net investment income, after payment of any dividends on any outstanding APS. In addition, at least annually, the Trust intends to distribute net capital gain, if any. Distributions are recorded on the ex-dividend date. Distributions to preferred shareholders are recorded daily and are payable at the end of each dividend period. Each dividend payment period for the APS is generally twenty-eight days. The applicable dividend rate for the APS on October 31, 2005 was 3.62%, 3.65%, 3.75%, and 3.80%, for Series A, Series B, Series C, and Series D Shares, respectively. For the year ended October 31, 2005, the Trust paid dividends to APS shareholders amounting to $2,942,510, $2,937,664, $2,918,197 and $3,041,861 for Series A, Series B, Series C, and Series D Shares, respectively, representing an average APS dividen d rate for such period of 3.239%, 3.213%, 2.956%, and 3.108%, respectively.
The Trust distinguishes between distributions on a tax basis and a financial reporting basis. Accounting principals generally accepted in the United States of America require that only distributions in excess of tax basis earnings and profits be reported in the financial statements as a return of capital. Permanent differences between book and tax accounting relating to distributions are reclassified to paid in capital. These differences relate primarily to the method for amortizing premiums.
The tax character of distributions paid for the period ended October 31, 2004, and year ended October 31, 2005 was as follows:
| Year Ended October 31, 2005 | Period Ended October 31, 2004(1) | ||||||||||
| Distributions declared from: | |||||||||||
| Ordinary income: | $ | 53,002,459 | $ | 34,358,915 | |||||||
During the year ended October 31, 2005, accumulated undistributed net investment income was increased by $1,481,652, and accumulated net realized loss was increased by $1,481,652 due to differences between book and tax accounting. This change had no effect on net assets or the net asset value per share.
As of October 31, 2005, the components of distributable earnings (accumulated losses) on a tax basis were as follows:
| Undistributed income | $ | 801,658 | |||||
| Unrealized gain | $ | 2,662,573 | |||||
| Capital loss carryforwards | $ | (10,668,031 | ) | ||||
(1) For the period from the start of business, November 28, 2003, to October 31, 2004.
4 Investment Adviser Fee and Other Transactions with Affiliates
The investment adviser fee, computed at an annual rate of 0.75% of the average daily gross assets of the Trust, was earned by Eaton Vance Management (EVM), as compensation
30
Eaton Vance Senior Floating-Rate Trust as of October 31, 2005
NOTES TO FINANCIAL STATEMENTS CONT'D
for management and investment advisory services rendered to the Trust. For the year ended October 31, 2005, the fee was equivalent to 0.75% (annualized) of the Trust's average daily gross assets for such period and amounted to $7,705,041.
In addition, the Adviser has contractually agreed to reimburse the Trust for fees and other expenses in the amount of 0.20% of the average daily gross assets of the Trust for the first five full years of the Trust's operations, 0.15% of average weekly gross assets in year 6, 0.10% in year 7 and 0.05% in year 8. For the year ended October 31, 2005 the Investment Adviser waived $2,052,751 of its advisory fee.
Certain officers and Trustees of the Trust are officers of the above organization.
5 Purchases and Sales of Investments
Purchases and sales of investments, other than short-term obligations and including paydowns, aggregated $638,152,766, and $620,070,223 respectively, for the year ended October 31, 2005.
6 Common Shares of Beneficial Interest
The Agreement and Declaration of Trust permits the Trustees to issue an unlimited number of full and fractional $0.01 par value common shares of beneficial interest. Transactions in common shares were as follows:
| Year Ended October 31, 2005 | Period Ended October 31, 2004(1) | ||||||||||
| Sales | — | 33,255,000 | |||||||||
| Issued to shareholders electing to receive payments of distributions in Fund shares | 84,520 | 148,970 | |||||||||
| Net increase | 84,520 | 33,403,970 | |||||||||
(1) For the period from the start of business, November 28, 2003, to October 31, 2004.
7 Federal Income Tax Basis of Unrealized Appreciation (Depreciation)
The cost and unrealized appreciation (depreciation) in value of investments owned by the Trust at October 31, 2005, as computed on a federal income tax basis, were as follows:
| Aggregate Cost | $ | 1,005,552,820 | |||||
| Gross unrealized appreciation | $ | 8,664,406 | |||||
| Gross unrealized depreciation | (5,807,602 | ) | |||||
| Net unrealized appreciation | $ | 2,856,804 | |||||
8 Financial Instruments
The Trust may trade in financial instruments with off-balance sheet risk in the normal course of its investing activities to assist in managing exposure to various market risks. These financial instruments include written options, financial futures and swap contracts and may involve, to a varying degree, elements of risk in excess of the amounts recognized for financial statement purposes. The notional or contractual amounts of these instruments represent the investment the Trust has in particular classes of financial instruments and does not necessarily represent the amounts potentially subject to risk. The measurement of the risks associated with these instruments is meaningful only when all related and offsetting transactions are considered. A summary of obligations under these financial instruments at October 31, 2005 is as follows:
Credit Default Swaps
| Notional Amount | Expiration Date | Description | Net Unrealized Appreciation (Depreciation) | ||||||||||||
| $ | 2,400,000 | 9/20/2008 | Agreement with Credit Suisse/ First Boston dated 1/9/2004 whereby the Trust will receive 2.45% per year times the notional amount. The Trust makes a payment only upon a default event on underlying loan assets (47 in total, each representing 2.128% of the notional value of th e swap). | $ | (41,633 | ) | |||||||||
| $ | 5,200,000 | 9/20/2008 | Agreement with Credit Suisse/ First Boston dated 1/27/2004 whereby the Trust will receive 2.45% per year times the notional amount. The Trust makes a payment only upon a default event on underlying loan assets (47 in total, each representing 2.128% of the notional value of t he swap). | $ | (138,734 | ) | |||||||||
| $ | 2,000,000 | 3/20/2010 | Agreement with Lehman Brothers dated 3/15/2005 whereby the Trust will receive 2.20% per year times the notional amount. The Trust makes a payment of the notional amount only upon a default event on the reference entity, a Revolving Credit Agreement issued by Inergy, L.P. | $ | (13,864 | ) | |||||||||
At October 31, 2005, The Trust had sufficient cash and/or securities segregated to cover potential obligations arising from open swap contracts.
31
Eaton Vance Senior Floating-Rate Trust as of October 31, 2005
REPORT OF INDEPENDENT REGISTERED PUBLIC ACCOUNTING FIRM
To the Trustees and Shareholders
of Eaton Vance Senior Floating-Rate Trust:
We have audited the accompanying statement of assets and liabilities of Eaton Vance Senior Floating-Rate Trust (the Trust), including the portfolio of investments as of October 31, 2005, the related statement of operations for the year then ended, the statement of changes in net assets, and the financial highlights for the year then ended and for the period from the start of business November 28, 2003 to October 31, 2004. These financial statements and financial highlights are the responsibility of the Trust's management. Our responsibility is to express an opinion on these financial statements and financial highlights based on our audits.
We conducted our audits in accordance with standards of the Public Company Accounting Oversight Board (United States). Those standards require that we plan and perform the audits to obtain reasonable assurance about whether the financial statements and financial highlights are free of material misstatement. The Trust is not required to have, nor were we engaged to perform, an audit of its internal control over financial reporting. Our audit includes consideration of internal control over financial reporting as a basis for designing audit procedures that are appropriate in the circumstances, but not for the purpose of expressing an opinion on the effectiveness of the Trust's internal control over financial reporting. Accordingly, we express no such opinion. An audit also includes examining, on a test basis, evidence supporting the amounts and disclosures in the financial statements, assessing the accounting principles used and si gnificant estimates made by management, as well as evaluating the overall financial statement presentation. Our procedures included confirmation of securities and Senior Loans owned as of October 31, 2005 by correspondence with the custodian, brokers, and selling or agent banks; where replies were not received from brokers and selling or agent banks; we performed other auditing procedures. We believe that our audits provide a reasonable basis for our opinion.
In our opinion, the financial statements and financial highlights referred to above present fairly, in all material respects, the financial position of the Eaton Vance Senior Floating-Rate Trust at October 31, 2005, the results of its operations for the year then ended, the changes in its net assets, and the financial highlights for the year then ended and for the period from the start of business November 28, 2003 to October 31, 2004, in conformity with accounting principles generally accepted in the United States of America.
DELOITTE & TOUCHE LLP
Boston, Massachusetts
December 19, 2005
32
Eaton Vance Senior Floating-Rate Trust as of October 31, 2005
FEDERAL TAX INFORMATION (Unaudited)
The Form 1099-DIV you receive in January 2006 will show the tax status of all distributions paid to your account in calendar 2005. Shareholders are advised to consult their own tax adviser with respect to the tax consequences of their investment in the Fund.
33
Eaton Vance Senior Floating Rate Trust as of October 31, 2005
OTHER MATTERS (Unaudited)
Annual Meeting of Shareholders (Unaudited)
The Trust held its Annual Meeting of Shareholders on August 19, 2005. The following action was taken by the shareholders:
Item 1: The election of James B. Hawkes, William H. Park and Ralph F. Verni as Class II Trustees of the Trust for a three-year term expiring in 2008.
| Nominee for Trustees | Number of Shares | ||||||||||
| Elected by All Shareholders | For | Withheld | |||||||||
| James B. Hawkes | 28,662,537 | 431,175 | |||||||||
| William H. Park | 28,651,739 | 441,973 | |||||||||
| Ralph F. Verni | 28,668,277 | 425,435 | |||||||||
34
Eaton Vance Senior Floating-Rate Trust
DIVIDEND REINVESTMENT PLAN
The Trust offers a dividend reinvestment plan (the Plan) pursuant to which shareholders may elect to have dividends and capital gains distributions reinvested in common shares (the Shares) of the Trust. You may elect to participate in the Plan by completing the Dividend Reinvestment Plan Application Form. If you do not participate, you will receive all distributions in cash paid by check mailed directly to you by PFPC Inc. as dividend paying agent. On the distribution payment date, if the net asset value per Share is equal to or less than the market price per Share plus estimated brokerage commissions then new Shares will be issued. The number of Shares shall be determined by the greater of the net asset value per Share or 95% of the market price. Otherwise, Shares generally will be purchased on the open market by the Plan Agent. Distributions subject to income tax (if any) are taxable whether or not shares are reinvested.
If your shares are in the name of a brokerage firm, bank, or other nominee, you can ask the firm or nominee to participate in the Plan on your behalf. If the nominee does not offer the Plan, you will need to request that your shares be re-registered in your name with the Trust's transfer agent, PFPC, Inc. or you will not be able to participate.
The Plan Agent's service fee for handling distributions will be paid by the Trust. Each participant will be charged their pro rata share of brokerage commissions on all open-market purchases.
Plan participants may withdraw from the Plan at any time by writing to the Plan Agent at the address noted on the following page. If you withdraw, you will receive shares in your name for all Shares credited to your account under the Plan. If a participant elects by written notice to the Plan Agent to have the Plan Agent sell part or all of his or her Shares and remit the proceeds, the Plan Agent is authorized to deduct a $5.00 fee plus brokerage commissions from the proceeds.
If you wish to participate in the Plan and your shares are held in your own name, you may complete the form on the following page and deliver it to the Plan Agent.
Any inquires regarding the Plan can be directed to the Plan Agent, PFPC, Inc., at 1-800-331-1710.
35
Eaton Vance Senior Floating-Rate Trust
APPLICATION FOR PARTICIPATION IN DIVIDEND REINVESTMENT PLAN
This form is for shareholders who hold their common shares in their own names. If your common shares are held in the name of a brokerage firm, bank, or other nominee, you should contact your nominee to see if it will participate in the Plan on your behalf. If you wish to participate in the Plan, but your brokerage firm, bank, or nominee is unable to participate on your behalf, you should request that your common shares be re-registered in your own name which will enable your participation in the Plan.
The following authorization and appointment is given with the understanding that I may terminate it at any time by terminating my participation in the Plan as provided in the terms and conditions of the Plan.
Please print exact name on account:
Shareholder signature Date
Shareholder signature Date
Please sign exactly as your common shares are registered. All persons whose names appear on the share certificate must sign.
YOU SHOULD NOT RETURN THIS FORM IF YOU WISH TO RECEIVE YOUR DIVIDENDS AND DISTRIBUTIONS IN CASH. THIS IS NOT A PROXY.
This authorization form, when signed, should be mailed to the following address:
Eaton Vance Senior Floating-Rate Trust
c/o PFPC, Inc.
P.O. Box 43027
Providence, RI 02940-3027
800-331-1710
Number of Employees
The Trust is organized as a Massachusetts business trust and is registered under the Investment Company Act of 1940, as amended, as a diversified closed-end management investment company and has no employees.
Number of Shareholders
As of October 31, 2005, our records indicate that there are 20 registered shareholders and approximately 23,993, shareholders owning the Trust shares in street name, such as through brokers, banks, and financial intermediaries.
If you are a street name shareholder and wish to receive our reports directly, which contain important information about the Trust, please write or call:
Eaton Vance Distributors, Inc.
The Eaton Vance Building
255 State Street
Boston, MA 02109
1-800-225-6265
New York Stock Exchange symbol
The New York Stock Exchange symbol is EFR.
36
Eaton Vance Senior Floating-Rate Trust
BOARD OF TRUSTEES' ANNUAL APPROVAL OF THE INVESTMENT ADVISORY AGREEMENT
The investment advisory agreement between Eaton Vance Senior Floating-Rate Trust (the Trust) and the investment adviser, Eaton Vance Management ("Eaton Vance"), provides that the advisory agreement will continue in effect from year to year so long as its continuance is approved at least annually (i) by a vote of a majority of the noninterested Trustees of the Trust cast in person at a meeting called for the purpose of voting on such approval and (ii) by the Trustees of the Trust or by vote of a majority of the outstanding interests of the Trust.
In considering the annual approval of the investment advisory agreement between the Trust and the investment adviser, the Special Committee of the Board of Trustees considered information that had been provided throughout the year at regular Board meetings, as well as information furnished for a series of meetings held in February and March in preparation for a Board meeting held on March 21, 2005 to specifically consider the renewal of the investment advisory agreement. Such information included, among other things, the following:
• An independent report comparing the advisory fees of the Trust with those of comparable funds;
• An independent report comparing the expense ratio of the Trust to those of comparable funds;
• Information regarding Trust investment performance (including on a risk-adjusted basis) in comparison to relevant peer groups of funds and appropriate indices;
• The economic outlook and the general investment outlook in relevant investment markets;
• Eaton Vance's results and financial condition and the overall organization of the investment adviser;
• The procedures and processes used to determine the fair value of Trust assets, including, in particular, the valuation of senior loan portfolios and actions taken to monitor and test the effectiveness of such procedures and processes;
• Eaton Vance's management of the relationship with the custodian, subcustodians and fund accountants;
• The resources devoted to compliance efforts undertaken by Eaton Vance on behalf of the funds it manages and the record of compliance with the investment policies and restrictions and with policies on personal securities transactions;
• The quality, nature, cost and character of the administrative and other non-investment management services provided by Eaton Vance and its affiliates; and
• The terms of the advisory agreement and the reasonableness and appropriateness of the particular fee paid by the Trust for the services described therein.
The Special Committee also considered the investment adviser's portfolio management capabilities, including information relating to the education, experience, and number of investment professionals and other personnel who provide services under the investment advisory agreement. Specifically, the Special Committee considered the investment adviser's experience in managing senior loan portfolios. The Special Committee noted the experience of the 26 bank loan investment professionals and other personnel who would provide services under the investment advisory agreement, including four portfolio managers and 15 analysts. Many of these portfolio managers and analysts have previous experience working for commercial banks and other lending institutions. The Special Committee also took into account the time and attention to be devoted by senior management to the Trust and the other funds in the complex. The Special Committee evaluated the level of skill required to manage the Trust and concluded that the human resources available at the investment adviser were appropriate to fulfill its duties on behalf of the Trust.
In its review of comparative information with respect to the Trust's investment performance (including on a risk-adjusted basis), the Special Committee noted the Trust's limited operating history and concluded that it was appropriate to allow time to fully evaluate the Trust's performance record. With respect to its review of investment advisory fees, the Special Committee concluded that the fees paid by the Trust are within the range of those paid by comparable funds within the mutual fund industry. In reviewing the information regarding the expense ratio of the Trust, the Special Committee concluded that the Trust's expense ratio is within a range that is competitive with comparable funds.
In addition to the factors mentioned above, the Special Committee reviewed the level of the investment adviser's profits in providing investment management and administration services for the Trust and for all Eaton Vance funds as a group. The Special Committee noted in particular that the Trust benefits from a contractual waiver of advisory fees and other expenses effective during the first five years of the Trust's operations. In addition, the Special Committee considered the fiduciary duty assumed by the investment adviser in connection with the services rendered to the Trust and the business reputation of the investment adviser and its financial resources.
37
Eaton Vance Senior Floating-Rate Trust
BOARD OF TRUSTEES' ANNUAL APPROVAL OF THE INVESTMENT ADVISORY AGREEMENT CONT'D
The Trustees concluded that in light of the services rendered, the profits realized by the investment adviser are not unreasonable. The Special Committee also considered the fact that the Trust is not continuously offered and concluded that, in light of the level of the investment adviser's profits with respect to the Trust, the implementation of breakpoints is not appropriate.
The Special Committee did not consider any single factor as controlling in determining whether or not to renew the investment advisory agreement. Nor are the items described herein all the matters considered by the Special Committee. In assessing the information provided by Eaton Vance and its affiliates, the Special Committee also took into consideration the benefits to shareholders of investing in a fund that is a part of a large family of funds which provides a large variety of shareholder services.
Based on its consideration of the foregoing factors and conclusions, and such other factors and conclusions as it deemed relevant, and assisted by independent counsel, the Special Committee concluded that the renewal of the investment advisory agreement, including the fee structure, is in the interests of shareholders.
38
Eaton Vance Senior Floating-Rate Trust
MANAGEMENT AND ORGANIZATION
Trust Management. The Trustees of Eaton Vance Senior Floating-Rate Trust (the Trust) are responsible for the overall management and supervision of the Trust's affairs. The Trustees and officers of the Trust are listed below. Except as indicated, each individual has held the office shown or other offices in the same company for the last five years. Trustees and officers of the Trust hold indefinite terms of office. The "noninterested Trustees" consist of those Trustees who are not "interested persons" of the Trust, as that term is defined under the 1940 Act. The business address of each Trustee and officer is The Eaton Vance Building, 255 State Street, Boston, Massachusetts 02109. As used below, "EVC" refers to Eaton Vance Corp., "EV" refers to Eaton Vance, Inc., "EVM" refers to Eaton Vance Management, "BMR" refers to Boston Management and Research, and "EVD" refers to Eaton Vance Distributors, Inc. EVC and EV are the corporate parent and trustee, respectively, of EVM and BMR. EVD is the Trust's principal underwriter and a wholly-owned subsidiary of EVM.
| Name and Date of Birth | Position(s) with the Trust | Term of Office and Length of Service | Principal Occupation(s) During Past Five Years | Number of Portfolios in Fund Complex Overseen By Trustee(1) | Other Directorships Held | ||||||||||||||||||
| Interested Trustee | |||||||||||||||||||||||
| James B. Hawkes 11/9/41 | Trustee and Vice President | Until 2008. 3 years. Trustee since 2003 | Chairman, President and Chief Executive Officer of BMR, EVC, EVM and EV; Director of EV; Vice President and Director of EVD. Trustee and/or officer of 161 registered investment companies in the Eaton Vance Fund Complex. Mr. Hawkes is an interested person because of his positions with BMR, EVM, EVC and EV, which are affiliates of the Trust. | 161 | Director of EVC | ||||||||||||||||||
| Noninterested Trustee(s) | |||||||||||||||||||||||
| Benjamin C. Esty 1/2/63 | Trustee | Until 2007. 3 years. Trustee since 2005 | Professor, Harvard University Graduate School of Business Administration (since 2003). Formerly, Associate Professor, Harvard University Grauduate School of Business Administration (2000-2003). | 152 | None | ||||||||||||||||||
| Samuel L. Hayes, III 2/23/35 | Chairman of the Board and Trustee | Until 2007. 3 years. Trustee since 2003; Chairman since 2005 | Jacob H. Schiff Professor of Investment Banking Emeritus, Harvard University Graduate School of Business Administration. | 161 | Director of Tiffany & Co. (specialty retailer) and Telect, Inc. (telecommunication services company) | ||||||||||||||||||
| William H. Park 9/19/47 | Trustee | Until 2008. 3 years. Trustee since 2003 | President and Chief Executive Officer, Prizm Capital Management, LLC (investment management firm) (since 2002). Executive Vice President and Chief Financial Officer, United Asset Management Corporation (a holding company owning institutional investment management firms) (1982-2001). | 161 | None | ||||||||||||||||||
| Ronald A. Pearlman 7/10/40 | Trustee | Until 2006. 3 years. Trustee since 2003 | Professor of Law, Georgetown University Law Center (since 1999). Tax Partner, Covington & Burling, Washington, DC (1991-2000). | 161 | None | ||||||||||||||||||
| Norton H. Reamer 9/21/35 | Trustee | Until 2006. 3 years. Trustee since 2003 | President and Chief Executive Officer of Asset Management Finance Corp. (a specialty finance company serving the investment management industry) (since October 2003). President, Unicorn Corporation (an investment and financial advisory services company) (since September 2000). Formerly, Chairman, Hellman, Jordan Management Co., Inc. (an investment management company) (2000-2003). Formerly, Advisory Director of Berkshire Capital Corporation (investment banking firm) (2002-2003). Formerly, Chairman of the Board, United Asset Management Corporation (a holding company owning institutional investment management firms) and Chairman, President and Director, UAM Funds (mutual funds) (1980-2000). | 161 | None | ||||||||||||||||||
39
Eaton Vance Senior Floating-Rate Trust
MANAGEMENT AND ORGANIZATION CONT'D
| Name and Date of Birth | Position(s) with the Trust | Term of Office and Length of Service | Principal Occupation(s) During Past Five Years | Number of Portfolios in Fund Complex Overseen By Trustee(1) | Other Directorships Held | ||||||||||||||||||
| Noninterested Trustee(s) (continued) | |||||||||||||||||||||||
| Lynn A. Stout 9/14/57 | Trustee | Until 2007. 3 years. Trustee since 2003 | Professor of Law, University of California at Los Angeles School of Law (since July 2001). Formerly, Professor of Law, Georgetown University Law Center. | 161 | None | ||||||||||||||||||
| Ralph F. Verni 1/26/43 | Trustee | Until 2008. 3 years. Trustee since 2005 | Consultant and private investor (since 2000). Formerly, President and Chief Executive Officer, Redwood Investment Systems, Inc. (software developer) (2000). Formerly, President and Chief Executive Officer, State Street Research & Management (investment adviser), SSRM Holdings (parent of State Street Research & Management), and SSR Realty (institutional realty manager) (1992-2000). | 152 | Director of W.P. Carey & Company LLC (manager of real estate investment trust) | ||||||||||||||||||
| Principal Officers who are not Trustees | |||||||||||||||||||||||
| Name and Date of Birth | Position(s) with the Trust | Term of Office and Length of Service | Principal Occupation(s) During Past Five Years | ||||||||||||
| Thomas E. Faust Jr. 5/31/58 | President | Since 2003 | Executive Vice President of EVM, BMR, EVC and EV; Chief Investment Officer of EVM and BMR and Director of EVC. Chief Executive Officer of Belair Capital Fund LLC, Belcrest Capital Fund LLC, Belmar Capital Fund LLC, Belport Capital Fund LLC and Belrose Capital Fund LLC (private investment companies sponsored by EVM). Officer of 65 registered investment companies managed by EVM or BMR. | ||||||||||||
| Scott H. Page 11/30/59 | Vice President | Since 2003 | Vice President EVM and BMR. Officer of 14 registered investment companies managed by EVM or BMR. | ||||||||||||
| Craig Russ 10/30/63 | Vice President | Since 2003 | Vice President EVM and BMR. Officer of 1 registered investment companies managed by EVM or BMR. | ||||||||||||
| Payson F. Swaffield 8/13/56 | Vice President | Since 2003 | Vice President of EVM and BMR. Officer of 14 registered investment companies managed by EVM or BMR. | ||||||||||||
| Michael W. Weilheimer 2/11/61 | Vice President | Since 2003 | Vice President of EVM and BMR. Officer of 9 registered investment companies managed by EVM or BMR. | ||||||||||||
| Barbara E. Campbell 6/19/57 | Treasurer | Since 2003 | Vice President of EVM and BMR. Officer of 161 registered investment companies managed by EVM or BMR. | ||||||||||||
| Alan R. Dynner 10/10/40 | Secretary | Since 2003 | Vice President, Secretary and Chief Legal Officer of BMR, EVM, EVD, EV and EVC. Officer of 161 registered investment companies managed by EVM or BMR. | ||||||||||||
| Paul M. O'Neil 7/11/53 | Chief Compliance Officer | Since 2004 | Vice President of EVM and BMR. Officer of 161 registered investment companies managed by EVM or BMR. | ||||||||||||
(1) Includes both master and feeder funds in a master-feeder structure.
The SAI for the Trust includes additional information about the Trustees and officers of the Trust and can be obtained without charge by calling 1-800-225-6265.
In accordance with Section 303A.12 (a) of the New York Stock Exchange Listed Company Manual, the Fund's Annual CEO Certification certifying as to compliance with NYSE's Corporate Governance Listing Standards was submitted to the Exchange on September 13, 2005. The Fund has also filed its CEO and CFO certifications required by Section 302 of the Sarbanes-Oxley Act with the SEC as an exhibit to its most recent Form N-CSR.
40
This Page Intentionally Left Blank
Investment Adviser of Eaton Vance Senior Floating-Rate Trust
Eaton Vance Management
The Eaton Vance Building
255 State Street
Boston, MA 02109
Administrator of Eaton Vance Senior Floating-Rate Trust
Eaton Vance Management
The Eaton Vance Building
255 State Street
Boston, MA 02109
Custodian
Investors Bank & Trust Company
200 Clarendon Street
Boston, MA 02116
Transfer Agent
PFPC Inc.
Attn: Eaton Vance Funds
P.O. Box 43027
Providence, RI 02940-3027
(800) 331-1710
Independent Registered Public Accounting Firm
Deloitte & Touche LLP
200 Berkeley Street
Boston, MA 02116-5022
Eaton Vance Senior Floating-Rate Trust
The Eaton Vance Building
255 State Street
Boston, MA 02109
2025-12/05 CE-FLRTSRC
Item 2. Code of Ethics
The registrant has adopted a code of ethics applicable to its Principal Executive Officer, Principal Financial Officer and Principal Accounting Officer. The registrant undertakes to provide a copy of such code of ethics to any person upon request, without charge, by calling 1-800-262-1122.
Item 3. Audit Committee Financial Expert
The registrant’s Board has designated William H. Park, Samuel L. Hayes, III and Norton H. Reamer, each an independent trustee, as its audit committee financial experts. Mr. Park is a certified public accountant who is the President and Chief Executive Officer of Prizm Capital Management, LLC (investment management firm). Previously, he served as Executive Vice President and Chief Financial Officer of United Asset Management Corporation (“UAM”) (a holding company owning institutional investment management firms). Mr. Hayes is the Jacob H. Schiff Professor of Investment Banking Emeritus of the Harvard University Graduate School of Business Administration. Mr. Reamer is the President, Chief Executive Officer and a Director of Asset Management Finance Corp. (a specialty finance company serving the investment management industry) and is President of Unicorn Corporation (an investment and financial advisory services company). Formerly, Mr. Reamer was Chairman of Hellman, Jordan Management Co., Inc. (an investment management company) and Advisory Director of Berkshire Capital Corporation (an investment banking firm), Chairman of the Board of UAM and Chairman, President and Director of the UAM Funds (mutual funds).
Item 4. Principal Accountant Fees and Services
(a)-(d)
The following table presents aggregate fees billed to the registrant for the fiscal years ended October 31, 2004 and October 31, 2005 by the registrant’s principal accountant for professional services rendered for the audit of the registrant’s annual financial statements and fees billed for other services rendered by the principal accountant during those periods.
Fiscal Years Ended |
| 10/31/2004 |
| 10/31/2005 |
| ||
|
|
|
|
|
| ||
Audit Fees |
| $ | 63,040 |
| $ | 65,120 |
|
|
|
|
|
|
| ||
Audit-Related Fees(1) |
| $ | 4,950 |
| $ | 5,000 |
|
|
|
|
|
|
| ||
Tax Fees(2) |
| $ | 6,100 |
| $ | 6,405 |
|
|
|
|
|
|
| ||
All Other Fees(3) |
| $ | 0 |
| $ | 0 |
|
|
|
|
|
|
| ||
Total |
| $ | 74,090 |
| $ | 76,525 |
|
(1) Audit-related fees consist of the aggregate fees billed for assurance and related services that are reasonably related to the performance of the audit of the registrant’s financial statements and are not reported under the category of audit fees and specifically include fees for the performance of certain agreed-upon procedures relating to the registrant’s auction preferred shares.
(2) Tax fees consist of the aggregate fees billed for professional services rendered by the principal accountant relating to tax compliance, tax advice, and tax planning and specifically include fees for tax return preparation and other related tax compliance/planning matters
(3) All other fees consist of the aggregate fees billed for products and services provided by the registrant’s principal accountant other than audit, audit-related, and tax services.
(e)(1) The registrant’s audit committee has adopted policies and procedures relating to the pre-approval of services provided by the registrant’s principal accountant (the “Pre-Approval Policies”). The Pre-Approval Policies establish a framework intended to assist the audit committee in the proper discharge of its pre-approval responsibilities. As a general matter, the Pre-Approval Policies (i) specify certain types of audit, audit-related, tax, and other services determined to be pre-approved by the audit committee; and (ii) delineate specific procedures governing the mechanics of the pre-approval process, including the approval and monitoring of audit and non-audit service fees. Unless a service is specifically pre-approved under the Pre-Approval Policies, it must be separately pre-approved by the Audit Committee.
The Pre-Approval Policies and the types of audit and non-audit services pre-approved therein must be reviewed and ratified by the registrant’s audit committee at least annually. The registrant’s audit committee maintains full responsibility for the appointment, compensation, and oversight of the work of the registrant’s principal accountant.
(e)(2) No services described in paragraphs (b)-(d) above were approved by the registrant’s audit committee pursuant to the “de minimis exception” set forth in Rule 2-01 (c)(7)(i)(C) of Regulation S-X.
(f) Not applicable.
(g) The following table presents (i) the aggregate non-audit fees (i.e., fees for audit-related, tax, and other services) billed to the registrant by the registrant’s principal accountant for the registrant’s fiscal years ended October 31, 2004 and October 31, 2005; and (ii) the aggregate non-audit fees (i.e., fees for audit-related, tax, and other services) billed to the Eaton Vance organization by the registrant’s principal accountant for the same time periods, respectively.
Fiscal Years Ended |
| 10/31/2004 |
| 10/31/2005 |
| ||
|
|
|
|
|
| ||
Registrant |
| $ | 11,050 |
| $ | 11,405 |
|
|
|
|
|
|
| ||
Eaton Vance(1) |
| $ | 344,230 |
| $ | 170,983 |
|
(1) Eaton Vance Management, a subsidiary of Eaton Vance Corp., acts as the registrant’s investment adviser and administrator.
(h) The registrant’s audit committee has considered whether the provision by the registrant’s principal accountant of non-audit services to the registrant’s investment adviser and any entity controlling, controlled by, or under common control with the adviser that provides ongoing services to the registrant that were not pre-approved pursuant to Rule 2-01(c)(7)(ii) of Regulation S-X is compatible with maintaining the principal accountant’s independence.
Item 5. Audit Committee of Listed registrants
Not required in this filing.
Item 6. Schedule of Investments
Please see schedule of investments contained in the Report to Stockholders included under Item 1 of this Form N-CSR.
Item 7. Disclosure of Proxy Voting Policies and Procedures for Closed-End Management Investment Companies
Not required in this filing.
Item 8. Purchases of Equity Securities by Closed-End Management Investment Company and Affiliated Purchasers.
Not required in this filing.
Item 9. Submission of Matters to a Vote of Security Holders.
Effective February 7, 2005, the Governance Committee of the Board of Trustees revised the procedures by which a Fund’s shareholders may recommend nominees to the registrant’s Board of Trustees to add the following (highlighted):
The Governance Committee shall, when identifying candidates for the position of Independent Trustee, consider any such candidate recommended by a shareholder of a Fund if such recommendation contains (i)sufficient background information concerning the candidate, including evidence the candidate is willing to serve as an Independent Trustee if selected for the position; and (ii) is received in a sufficiently timely manner (and in any event no later than the date specified for receipt of shareholder proposals in any applicable proxy statement with respect to a Fund). Shareholders shall be directed to address any such recommendations in writing to the attention of the Governance Committee, c/o the Secretary of the Fund. The Secretary shall retain copies of any shareholder recommendations which meet the foregoing requirements for a period of not more than 12 months following receipt. The Secretary shall have no obligation to acknowledge receipt of any shareholder recommendations
Item 10. Controls and Procedures
(a) It is the conclusion of the registrant’s principal executive officer and principal financial officer that the effectiveness of the registrant’s current disclosure controls and procedures (such disclosure controls and procedures having been evaluated within 90 days of the date of this filing) provide reasonable assurance that the information required to be disclosed by the registrant has been recorded, processed, summarized and reported within the time period specified in the Commission’s rules and forms and that the information required to be disclosed by the registrant has been accumulated and communicated to the registrant’s principal executive officer and principal financial officer in order to allow timely decisions regarding required disclosure.
(b) There have been no changes in the registrant’s internal controls over financial reporting during the second fiscal quarter of the period covered by this report that has materially affected, or is reasonably likely to materially affect, the registrant’s internal control over financial reporting.
Item 11. Exhibits
(a)(1) | Registrant’s Code of Ethics – Not applicable (please see Item 2). |
(a)(2)(i) | Treasurer’s Section 302 certification. |
(a)(2)(ii) | President’s Section 302 certification. |
(b) | Combined Section 906 certification. |
Signatures
Pursuant to the requirements of the Securities Exchange Act of 1934 and the Investment Company Act of 1940, the registrant has duly caused this report to be signed on its behalf by the undersigned, thereunto duly authorized.
Eaton Vance Senior Floating-Rate Trust |
| ||
|
| ||
By: | /s/Thomas E. Faust Jr. |
| |
| Thomas E. Faust Jr. | ||
| President | ||
|
| ||
Date: | December 16, 2005 | ||
Pursuant to the requirements of the Securities Exchange Act of 1934 and the Investment Company Act of 1940, this report has been signed below by the following persons on behalf of the registrant and in the capacities and on the dates indicated.
By: | /s/Barbara E. Campbell |
| |
| Barbara E. Campbell | ||
| Treasurer | ||
|
| ||
|
| ||
Date: | December 16, 2005 | ||
|
| ||
|
| ||
By: | /s/Thomas E. Faust Jr. |
| |
| Thomas E. Faust Jr. | ||
| President | ||
|
| ||
|
| ||
Date: | December 16, 2005 | ||