UNITED STATES
SECURITIES AND EXCHANGE COMMISSION
Washington, D.C. 20549
Form N-CSR
CERTIFIED SHAREHOLDER REPORT OF REGISTERED
MANAGEMENT INVESTMENT COMPANIES
Investment Company Act File Number: 811-21411
Eaton Vance Senior Floating-Rate Trust
(Exact Name of Registrant as Specified in Charter)
Two International Place, Boston, Massachusetts 02110
(Address of Principal Executive Offices)
Deidre E. Walsh
Two International Place, Boston, Massachusetts 02110
(Name and Address of Agent for Services)
(617) 482-8260
(Registrant’s Telephone Number)
October 31
Date of Fiscal Year End
October 31, 2022
Date of Reporting Period
Item 1. Reports to Stockholders


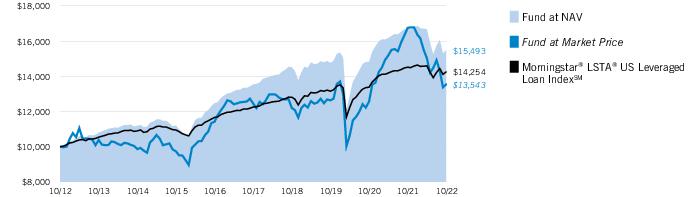
| % Average Annual Total Returns1,2 | Inception Date | One Year | Five Years | Ten Years |
| Fund at NAV | 11/28/2003 | (7.26)% | 2.74% | 4.47% |
| Fund at Market Price | — | (19.10) | 1.69 | 3.08 |
| Morningstar® LSTA® US Leveraged Loan IndexSM | — | (1.78)% | 3.07% | 3.61% |
| % Premium/Discount to NAV3 | |
| (9.11)% |
| Distributions 4 | |
| Total Distributions per share for the period | $0.975 |
| Distribution Rate at NAV | 7.91% |
| Distribution Rate at Market Price | 8.70 |
| % Total Leverage5 | |
| Auction Preferred Shares (APS) | 13.38% |
| Borrowings | 23.44 |
| Top 10 Issuers (% of total investments)1 | |
| Virgin Media SFA Finance Limited | 1.0% |
| Ultimate Software Group Inc (The) | 1.0 |
| Finastra USA, Inc. | 0.9 |
| Uber Technologies, Inc. | 0.9 |
| Clarios Global LP | 0.8 |
| Magenta Buyer, LLC | 0.8 |
| Asurion LLC | 0.8 |
| Citgo Petroleum Corporation | 0.8 |
| RealPage, Inc. | 0.8 |
| Les Schwab Tire Centers | 0.8 |
| Total | 8.6% |
| Top 10 Sectors (% of total investments)1 | |
| Software | 16.6% |
| Health Care Providers & Services | 5.0 |
| Machinery | 5.0 |
| Commercial Services & Supplies | 3.5 |
| IT Services | 3.4 |
| Chemicals | 3.3 |
| Capital Markets | 3.1 |
| Specialty Retail | 3.0 |
| Diversified Telecommunication Services | 2.6 |
| Hotels, Restaurants & Leisure | 2.5 |
| Total | 48.0% |
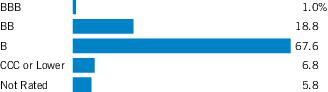
| Credit Quality (% of bonds, loans and asset-backed securities)2 |
| 1 | Excludes cash and cash equivalents. |
| 2 | Credit ratings are categorized using S&P Global Ratings (“S&P”). Ratings, which are subject to change, apply to the creditworthiness of the issuers of the underlying securities and not to the Fund or its shares. Credit ratings measure the quality of a bond based on the issuer’s creditworthiness, with ratings ranging from AAA, being the highest, to D, being the lowest based on S&P’s measures. Ratings of BBB or higher by S&P are considered to be investment-grade quality. Credit ratings are based largely on the ratings agency’s analysis at the time of rating. The rating assigned to any particular security is not necessarily a reflection of the issuer’s current financial condition and does not necessarily reflect its assessment of the volatility of a security’s market value or of the liquidity of an investment in the security. Holdings designated as “Not Rated” (if any) are not rated by S&P. |
| † | The views expressed in this report are those of the portfolio manager(s) and are current only through the date stated at the top of this page. These views are subject to change at any time based upon market or other conditions, and Eaton Vance and the Fund(s) disclaim any responsibility to update such views. These views may not be relied upon as investment advice and, because investment decisions are based on many factors, may not be relied upon as an indication of trading intent on behalf of any Eaton Vance fund. This commentary may contain statements that are not historical facts, referred to as “forward-looking statements.” The Fund’s actual future results may differ significantly from those stated in any forward-looking statement, depending on factors such as changes in securities or financial markets or general economic conditions, the volume of sales and purchases of Fund shares, the continuation of investment advisory, administrative and service contracts, and other risks discussed from time to time in the Fund’s filings with the Securities and Exchange Commission. |
| ‡ | The information contained herein is provided for informational purposes only and does not constitute a solicitation of an offer to buy or sell Fund shares. Common shares of the Fund are available for purchase and sale only at current market prices in secondary market trading. |
| 1 | Morningstar® LSTA® US Leveraged Loan IndexSM is an unmanaged index of the institutional leveraged loan market. Morningstar® LSTA® Leveraged Loan indices are a product of Morningstar, Inc. (“Morningstar”) and have been licensed for use. Morningstar® is a registered trademark of Morningstar licensed for certain use. Loan Syndications and Trading Association® and LSTA® are trademarks of the LSTA licensed for certain use by Morningstar, and further sublicensed by Morningstar for certain use. Neither Morningstar nor LSTA guarantees the accuracy and/or completeness of the Morningstar® LSTA® US Leveraged Loan IndexSM or any data included therein, and shall have no liability for any errors, omissions, or interruptions therein. Unless otherwise stated, index returns do not reflect the effect of any applicable sales charges, commissions, expenses, taxes or leverage, as applicable. It is not possible to invest directly in an index. Prior to August 29, 2022, the index name was S&P/LSTA Leveraged Loan Index. |
| 2 | Performance results reflect the effects of leverage. The Fund’s performance for certain periods reflects the effects of expense reductions. Absent these reductions, performance would have been lower. Included in the average annual total return at NAV for the five and ten year periods is the impact of the tender and repurchase of a portion of the Fund’s APS at 92% and 95% of the Fund’s APS per share liquidation preference. Had these transactions not occurred, the total return at NAV would be lower for the Fund. |
| 3 | The shares of the Fund often trade at a discount or premium to their net asset value. The discount or premium may vary over time and may be higher or lower than what is quoted in this report. For up-to-date premium/discount information, please refer to https://funds.eatonvance.com/closed-end-fund-prices.php. |
| 4 | The Distribution Rate is based on the Fund’s last regular distribution per share in the period (annualized) divided by the Fund’s NAV or market price at the end of the period. The Fund’s distributions may be comprised of amounts characterized for federal income tax purposes as qualified and non-qualified ordinary dividends, capital gains and nondividend distributions, also known as return of capital. For additional information about nondividend distributions, please refer to Eaton Vance Closed-End Fund Distribution Notices (19a) posted on our website, eatonvance.com. The Fund will determine the federal income tax character of distributions paid to a shareholder after the end of the calendar year. This is reported on the IRS form 1099-DIV and provided to the shareholder shortly after each year-end. For information about the tax character of distributions made in prior calendar years, please refer to Performance-Tax Character of Distributions on the Fund’s webpage available at eatonvance. com. The Fund’s distributions are determined by the investment adviser based on its current assessment of the Fund’s long-term return potential. Fund distributions may be affected by numerous factors including changes in Fund performance, the cost of financing for leverage, portfolio holdings, realized and projected returns, and other factors. As portfolio and market conditions change, the rate of distributions paid by the Fund could change. |
| 5 | Leverage represents the liquidation value of the Fund’s APS and borrowings outstanding as a percentage of Fund net assets applicable to common shares plus APS and borrowings outstanding. Use of leverage creates an opportunity for income, but creates risks including greater price volatility. The cost of leverage rises and falls with changes in short-term interest rates. The Fund may be required to maintain prescribed asset coverage for its leverage and may be required to reduce its leverage at an inopportune time. |
| Fund profile subject to change due to active management. | |
| Additional Information | |
| S&P 500® Index is an unmanaged index of large-cap stocks commonly used as a measure of U.S. stock market performance. S&P Dow Jones Indices are a product of S&P Dow Jones Indices LLC (“S&P DJI”) and have been licensed for use. S&P® and S&P 500® are registered trademarks of S&P DJI; Dow Jones® is a registered trademark of Dow Jones Trademark Holdings LLC (“Dow Jones”); S&P DJI, Dow Jones and their respective affiliates do not sponsor, endorse, sell or promote the Fund, will not have any liability with respect thereto and do not have any liability for any errors, omissions, or interruptions of the S&P Dow Jones Indices. |
| Asset-Backed Securities — 7.2% |
| Security | Principal Amount (000's omitted) | Value | |
| AIG CLO, Ltd., Series 2019-1A, Class ER, 10.629%, (3 mo. SOFR + 6.70%), 4/18/35(1)(2) | $ | 1,000 | $ 790,166 |
| Ares XXXIIR CLO, Ltd., Series 2014-32RA, Class D, 8.755%, (3 mo. USD LIBOR + 5.85%), 5/15/30(1)(2) | 2,000 | 1,620,472 | |
| Ares XXXIV CLO, Ltd., Series 2015-2A, Class ER, 10.929%, (3 mo. USD LIBOR + 6.85%), 4/17/33(1)(2) | 1,150 | 918,416 | |
| Benefit Street Partners CLO XIX, Ltd., Series 2019-19A, Class E, 11.099%, (3 mo. USD LIBOR + 7.02%), 1/15/33(1)(2) | 750 | 654,840 | |
| Benefit Street Partners CLO XVIII, Ltd., Series 2019-18A, Class ER, 10.829%, (3 mo. USD LIBOR + 6.75%), 10/15/34(1)(2) | 1,000 | 856,736 | |
| Benefit Street Partners CLO XXII, Ltd., Series 2020-22A, Class ER, 10.893%, (3 mo. SOFR + 6.93%), 4/20/35(1)(2) | 1,000 | 827,510 | |
| BlueMountain CLO XXVI, Ltd., Series 2019-26A, Class ER, 11.373%, (3 mo. USD LIBOR + 7.13%), 10/20/34(1)(2) | 1,500 | 1,250,547 | |
| Canyon Capital CLO, Ltd.: | |||
| Series 2019-2A, Class ER, 10.829%, (3 mo. USD LIBOR + 6.75%), 10/15/34(1)(2) | 400 | 329,772 | |
| Series 2022-1A, Class E, 10.329%, (3 mo. SOFR + 6.40%), 4/15/35(1)(2) | 1,250 | 1,038,375 | |
| Carlyle Global Market Strategies CLO, Ltd.: | |||
| Series 2012-3A, Class DR2, 10.511%, (3 mo. USD LIBOR + 6.50%), 1/14/32(1)(2) | 1,200 | 958,889 | |
| Series 2015-5A, Class DR, 10.943%, (3 mo. USD LIBOR + 6.70%), 1/20/32(1)(2) | 500 | 409,215 | |
| Cedar Funding X CLO, Ltd., Series 2019-10A, Class ER, 10.743%, (3 mo. USD LIBOR + 6.50%), 10/20/32(1)(2) | 1,000 | 853,524 | |
| Galaxy XV CLO, Ltd., Series 2013-15A, Class ER, 10.724%, (3 mo. USD LIBOR + 6.65%), 10/15/30(1)(2) | 1,000 | 809,377 | |
| Galaxy XXI CLO, Ltd., Series 2015-21A, Class ER, 9.493%, (3 mo. USD LIBOR + 5.25%), 4/20/31(1)(2) | 1,000 | 797,622 | |
| Galaxy XXV CLO, Ltd., Series 2018-25A, Class E, 10.308%, (3 mo. USD LIBOR + 5.95%), 10/25/31(1)(2) | 250 | 201,877 | |
| Golub Capital Partners CLO 23M, Ltd., Series 2015-23A, Class ER, 9.993%, (3 mo. USD LIBOR + 5.75%), 1/20/31(1)(2) | 1,200 | 971,027 | |
| Golub Capital Partners CLO 50B-R, Ltd., Series 2020-50A, Class ER, 11.063%, (3 mo. SOFR + 7.10%), 4/20/35(1)(2) | 1,000 | 822,232 | |
| Security | Principal Amount (000's omitted) | Value | |
| Madison Park Funding XXXVI, Ltd., Series 2019-36A, Class ER, 10.914%, (3 mo. SOFR + 7.05%), 4/15/35(1)(2) | $ | 1,000 | $ 863,802 |
| Neuberger Berman Loan Advisers CLO 48, Ltd., Series 2022-48A, Class E, 10.56%, (3 mo. SOFR + 6.50%), 4/25/36(1)(2) | 1,000 | 854,950 | |
| Palmer Square CLO, Ltd.: | |||
| Series 2013-2A, Class DRR, 9.929%, (3 mo. USD LIBOR + 5.85%), 10/17/31(1)(2) | 900 | 761,004 | |
| Series 2014-1A, Class DR2, 9.779%, (3 mo. USD LIBOR + 5.70%), 1/17/31(1)(2) | 1,500 | 1,267,711 | |
| Series 2015-1A, Class DR4, 9.484%, (3 mo. USD LIBOR + 6.50%), 5/21/34(1)(2) | 500 | 425,048 | |
| Series 2019-1A, Class DR, 9.405%, (3 mo. USD LIBOR + 6.50%), 11/14/34(1)(2) | 1,000 | 853,044 | |
| RAD CLO 5, Ltd., Series 2019-5A, Class E, 11.025%, (3 mo. USD LIBOR + 6.70%), 7/24/32(1)(2) | 1,000 | 837,900 | |
| RAD CLO 7, Ltd., Series 2020-7A, Class E, 10.579%, (3 mo. USD LIBOR + 6.50%), 4/17/33(1)(2) | 1,150 | 1,010,989 | |
| Regatta XIV Funding, Ltd., Series 2018-3A, Class E, 10.308%, (3 mo. USD LIBOR + 5.95%), 10/25/31(1)(2) | 700 | 562,901 | |
| Regatta XVI Funding, Ltd., Series 2019-2A, Class E, 11.079%, (3 mo. USD LIBOR + 7.00%), 1/15/33(1)(2) | 750 | 604,106 | |
| Vibrant CLO X, Ltd., Series 2018-10A, Class D, 10.433%, (3 mo. USD LIBOR + 6.19%), 10/20/31(1)(2) | 775 | 565,004 | |
| Vibrant CLO XI, Ltd., Series 2019-11A, Class D, 11.013%, (3 mo. USD LIBOR + 6.77%), 7/20/32(1)(2) | 1,000 | 815,670 | |
| Voya CLO, Ltd., Series 2013-1A, Class DR, 10.559%, (3 mo. USD LIBOR + 6.48%), 10/15/30(1)(2) | 2,000 | 1,400,544 | |
| Wellfleet CLO, Ltd., Series 2020-1A, Class D, 11.319%, (3 mo. USD LIBOR + 7.24%), 4/15/33(1)(2) | 1,150 | 988,446 | |
| Total Asset-Backed Securities (identified cost $31,198,600) | $ 25,921,716 | ||
| Closed-End Funds — 1.8% |
| Security | Shares | Value | |
| BlackRock Floating Rate Income Strategies Fund, Inc. | 99,936 | $ 1,137,272 | |
| Invesco Senior Income Trust | 361,124 | 1,357,826 | |
| Nuveen Credit Strategies Income Fund | 365,228 | 1,840,749 | |
| Nuveen Floating Rate Income Fund | 148,079 | 1,177,228 | |
| Nuveen Floating Rate Income Opportunity Fund | 103,281 | 815,920 | |
| Total Closed-End Funds (identified cost $8,822,714) | $ 6,328,995 | ||
| Common Stocks — 0.9% |
| Security | Shares | Value | |
| Aerospace and Defense — 0.1% | |||
| IAP Global Services, LLC(3)(4)(5) | 55 | $ 235,982 | |
| $ 235,982 | |||
| Electronics/Electrical — 0.0%(6) | |||
| Riverbed Technology, Inc.(4)(5) | 327 | $ 164 | |
| Skillsoft Corp.(4)(5) | 53,012 | 94,892 | |
| $ 95,056 | |||
| Investment Companies — 0.1% | |||
| Aegletes B.V.(4)(5) | 14,087 | $ 521,219 | |
| $ 521,219 | |||
| Oil and Gas — 0.3% | |||
| Nine Point Energy Holdings, Inc.(3)(4)(5)(7) | 758 | $ 0 | |
| QuarterNorth Energy, Inc.(5) | 8,668 | 1,061,830 | |
| $ 1,061,830 | |||
| Radio and Television — 0.2% | |||
| Clear Channel Outdoor Holdings, Inc.(4)(5) | 86,335 | $ 123,459 | |
| Cumulus Media, Inc., Class A(4)(5) | 38,163 | 281,261 | |
| iHeartMedia, Inc., Class A(4)(5) | 36,714 | 303,992 | |
| $ 708,712 | |||
| Retailers (Except Food and Drug) — 0.1% | |||
| Phillips Pet Holding Corp.(3)(4)(5) | 556 | $ 170,439 | |
| $ 170,439 | |||
| Telecommunications — 0.1% | |||
| GEE Acquisition Holdings Corp.(3)(4)(5) | 45,136 | $ 406,224 | |
| $ 406,224 | |||
| Total Common Stocks (identified cost $3,863,224) | $ 3,199,462 | ||
| Convertible Preferred Stocks — 0.0%(6) |
| Security | Shares | Value | |
| Electronics/Electrical — 0.0%(6) | |||
| Riverbed Technology, Inc., Series A, 6.50%, (1.50% cash, 5.00% PIK)(4)(5) | 107 | $ 107 | |
| $ 107 | |||
| Security | Shares | Value | |
| Oil and Gas — 0.0% | |||
| Nine Point Energy Holdings, Inc., Series A, 12.00%, (PIK)(3)(4)(5)(7) | 14 | $ 0 | |
| $ 0 | |||
| Total Convertible Preferred Stocks (identified cost $17,197) | $ 107 | ||
| Corporate Bonds — 7.5% |
| Security | Principal Amount (000's omitted) | Value | |
| Aerospace and Defense — 0.2% | |||
| TransDigm, Inc., 4.875%, 5/1/29 | $ | 625 | $ 532,812 |
| $ 532,812 | |||
| Automotive — 0.3% | |||
| Clarios Global, L.P./Clarios US Finance Co., 8.50%, 5/15/27(1) | $ | 1,000 | $ 981,695 |
| $ 981,695 | |||
| Building and Development — 0.3% | |||
| SRM Escrow Issuer, LLC, 6.00%, 11/1/28(1) | $ | 625 | $ 526,762 |
| Standard Industries, Inc., 4.75%, 1/15/28(1) | 625 | 549,200 | |
| $ 1,075,962 | |||
| Business Equipment and Services — 0.7% | |||
| GEMS MENASA Cayman, Ltd./GEMS Education Delaware, LLC, 7.125%, 7/31/26(1) | $ | 1,000 | $ 947,470 |
| Prime Security Services Borrower, LLC/Prime Finance, Inc.: | |||
| 5.25%, 4/15/24(1) | 700 | 697,907 | |
| 5.75%, 4/15/26(1) | 700 | 682,619 | |
| $ 2,327,996 | |||
| Chemicals and Plastics — 0.3% | |||
| NOVA Chemicals Corp., 4.875%, 6/1/24(1) | $ | 1,000 | $ 974,755 |
| $ 974,755 | |||
| Conglomerates — 0.2% | |||
| Spectrum Brands, Inc., 5.50%, 7/15/30(1) | $ | 1,000 | $ 804,342 |
| $ 804,342 | |||
| Security | Principal Amount (000's omitted) | Value | |
| Consumer Products — 0.1% | |||
| Central Garden & Pet Co., 4.125%, 10/15/30 | $ | 625 | $ 517,488 |
| $ 517,488 | |||
| Cosmetics/Toiletries — 0.2% | |||
| Edgewell Personal Care Co., 5.50%, 6/1/28(1) | $ | 625 | $ 589,034 |
| $ 589,034 | |||
| Distribution & Wholesale — 0.4% | |||
| BCPE Empire Holdings, Inc., 7.625%, 5/1/27(1) | $ | 625 | $ 572,386 |
| Performance Food Group, Inc., 5.50%, 10/15/27(1) | 1,000 | 947,855 | |
| $ 1,520,241 | |||
| Diversified Financial Services — 0.2% | |||
| VistaJet Malta Finance PLC/XO Management Holding, Inc., 6.375%, 2/1/30(1) | $ | 625 | $ 520,385 |
| $ 520,385 | |||
| Engineering & Construction — 0.1% | |||
| TopBuild Corp., 3.625%, 3/15/29(1) | $ | 625 | $ 497,528 |
| $ 497,528 | |||
| Entertainment — 0.3% | |||
| Caesars Entertainment, Inc., 8.125%, 7/1/27(1) | $ | 1,000 | $ 974,255 |
| $ 974,255 | |||
| Financial Intermediaries — 0.2% | |||
| Ford Motor Credit Co., LLC, 3.815%, 11/2/27 | $ | 1,000 | $ 861,282 |
| $ 861,282 | |||
| Food Service — 0.2% | |||
| Albertsons Cos., Inc./Safeway, Inc./New Albertsons L.P./Albertsons, LLC, 3.50%, 3/15/29(1) | $ | 625 | $ 518,919 |
| $ 518,919 | |||
| Health Care — 0.7% | |||
| Centene Corp., 3.375%, 2/15/30 | $ | 1,000 | $ 832,250 |
| LifePoint Health, Inc., 5.375%, 1/15/29(1) | 625 | 400,187 | |
| Tenet Healthcare Corp., 6.875%, 11/15/31 | 1,000 | 850,150 | |
| US Acute Care Solutions, LLC, 6.375%, 3/1/26(1) | 625 | 568,191 | |
| $ 2,650,778 | |||
| Home Furnishings — 0.1% | |||
| Tempur Sealy International, Inc., 4.00%, 4/15/29(1) | $ | 625 | $ 504,107 |
| $ 504,107 | |||
| Security | Principal Amount (000's omitted) | Value | |
| Insurance — 0.3% | |||
| Alliant Holdings Intermediate, LLC/Alliant Holdings Co-Issuer, 6.75%, 10/15/27(1) | $ | 625 | $ 571,184 |
| AmWINS Group, Inc., 4.875%, 6/30/29(1) | 600 | 514,270 | |
| $ 1,085,454 | |||
| Leisure Goods/Activities/Movies — 0.1% | |||
| Viking Cruises, Ltd., 5.875%, 9/15/27(1) | $ | 625 | $ 495,407 |
| $ 495,407 | |||
| Media — 0.5% | |||
| Audacy Capital Corp., 6.50%, 5/1/27(1) | $ | 625 | $ 185,300 |
| Diamond Sports Group, LLC/Diamond Sports Finance Co.: | |||
| 5.375%, 8/15/26(1) | 0 (8) | 23 | |
| 5.375%, 8/15/26(1) | 2,864 | 576,279 | |
| iHeartCommunications, Inc.: | |||
| 6.375%, 5/1/26 | 208 | 198,337 | |
| 8.375%, 5/1/27 | 376 | 338,706 | |
| Sirius XM Radio, Inc., 4.00%, 7/15/28(1) | 625 | 538,305 | |
| $ 1,836,950 | |||
| Nonferrous Metals/Minerals — 0.1% | |||
| New Gold, Inc., 7.50%, 7/15/27(1) | $ | 500 | $ 427,131 |
| $ 427,131 | |||
| Oil and Gas — 0.6% | |||
| Centennial Resource Production, LLC, 5.375%, 1/15/26(1) | $ | 625 | $ 578,962 |
| Neptune Energy Bondco PLC, 6.625%, 5/15/25(1) | 1,000 | 973,407 | |
| Tap Rock Resources, LLC, 7.00%, 10/1/26(1) | 500 | 467,628 | |
| $ 2,019,997 | |||
| Pipelines — 0.2% | |||
| EQM Midstream Partners, L.P., 4.75%, 1/15/31(1) | $ | 625 | $ 523,809 |
| $ 523,809 | |||
| Real Estate Investment Trusts (REITs) — 0.1% | |||
| HAT Holdings I, LLC/HAT Holdings II, LLC, 3.375%, 6/15/26(1) | $ | 625 | $ 509,538 |
| $ 509,538 | |||
| Retail — 0.1% | |||
| Fertitta Entertainment, LLC/Fertitta Entertainment Finance Co., Inc., 6.75%, 1/15/30(1) | $ | 625 | $ 491,978 |
| $ 491,978 | |||
| Security | Principal Amount (000's omitted) | Value | |
| Retailers (Except Food and Drug) — 0.3% | |||
| Dave & Buster's, Inc., 7.625%, 11/1/25(1) | $ | 500 | $ 499,352 |
| PetSmart, Inc./PetSmart Finance Corp., 7.75%, 2/15/29(1) | 500 | 470,555 | |
| $ 969,907 | |||
| Technology — 0.1% | |||
| Minerva Merger Sub, Inc., 6.50%, 2/15/30(1) | $ | 625 | $ 488,606 |
| $ 488,606 | |||
| Telecommunications — 0.3% | |||
| Connect Finco S.a.r.l./Connect US Finco, LLC, 6.75%, 10/1/26(1) | $ | 1,000 | $ 941,650 |
| $ 941,650 | |||
| Utilities — 0.2% | |||
| NRG Energy, Inc., 3.625%, 2/15/31(1) | $ | 1,000 | $ 797,130 |
| $ 797,130 | |||
| Wireless Telecommunication Services — 0.1% | |||
| Digicel International Finance, Ltd./Digicel International Holdings, Ltd., 8.75%, 5/25/24(1) | $ | 550 | $ 470,605 |
| $ 470,605 | |||
| Total Corporate Bonds (identified cost $31,115,687) | $ 26,909,741 | ||
| Senior Floating-Rate Loans — 136.2%(9) |
| Borrower/Description | Principal Amount* (000's omitted) | Value | |
| Aerospace and Defense — 2.4% | |||
| Aernnova Aerospace S.A.U.: | |||
| Term Loan, 3.00%, (3 mo. EURIBOR + 3.00%), 2/22/27 | EUR | 102 | $ 86,304 |
| Term Loan, 3.00%, (6 mo. EURIBOR + 3.00%), 2/26/27 | EUR | 398 | 336,585 |
| AI Convoy (Luxembourg) S.a.r.l.: | |||
| Term Loan, 3.50%, (6 mo. EURIBOR + 3.50%), 1/18/27 | EUR | 400 | 367,629 |
| Term Loan, 8.173%, (USD LIBOR + 3.50%), 1/18/27(10) | 1,727 | 1,692,515 | |
| Dynasty Acquisition Co., Inc.: | |||
| Term Loan, 7.254%, (1 mo. USD LIBOR + 3.50%), 4/6/26 | 1,853 | 1,745,310 | |
| Term Loan, 7.254%, (1 mo. USD LIBOR + 3.50%), 4/6/26 | 996 | 938,663 | |
| Borrower/Description | Principal Amount* (000's omitted) | Value | |
| Aerospace and Defense (continued) | |||
| IAP Worldwide Services, Inc., Term Loan - Second Lien, 10.174%, (3 mo. USD LIBOR + 6.50%), 7/18/23(3) | 394 | $ 305,936 | |
| Spirit Aerosystems, Inc., Term Loan, 7.504%, (1 mo. USD LIBOR + 3.75%), 1/15/25 | 517 | 512,914 | |
| WP CPP Holdings, LLC, Term Loan, 8.168%, (USD LIBOR + 3.75%), 4/30/25(10) | 2,992 | 2,573,303 | |
| $ 8,559,159 | |||
| Airlines — 1.8% | |||
| American Airlines, Inc., Term Loan, 8.993%, (3 mo. USD LIBOR + 4.75%), 4/20/28 | 3,025 | $ 2,999,073 | |
| Mileage Plus Holdings, LLC, Term Loan, 8.777%, (3 mo. USD LIBOR + 5.25%), 6/21/27 | 713 | 728,977 | |
| United Airlines, Inc., Term Loan, 8.108%, (3 mo. USD LIBOR + 3.75%), 4/21/28 | 2,962 | 2,899,638 | |
| $ 6,627,688 | |||
| Auto Components — 3.7% | |||
| Adient US, LLC, Term Loan, 7.004%, (1 mo. USD LIBOR + 3.25%), 4/10/28 | 1,928 | $ 1,867,847 | |
| Chassix, Inc., Term Loan, 8.272%, (USD LIBOR + 5.50%), 11/15/23(10) | 1,286 | 1,179,254 | |
| Clarios Global, L.P.: | |||
| Term Loan, 4.383%, (1 mo. EURIBOR + 3.25%), 4/30/26 | EUR | 947 | 873,954 |
| Term Loan, 7.004%, (1 mo. USD LIBOR + 3.25%), 4/30/26 | 3,004 | 2,930,293 | |
| DexKo Global, Inc.: | |||
| Term Loan, 4.00%, (EURIBOR + 4.00%), 10/4/28(10) | EUR | 461 | 402,099 |
| Term Loan, 4.00%, (3 mo. EURIBOR + 4.00%), 10/4/28 | EUR | 240 | 209,103 |
| Term Loan, 5.133%, (1 mo. EURIBOR + 4.00%), 10/4/28 | EUR | 74 | 64,699 |
| Term Loan, 7.476%, (USD LIBOR + 3.75%), 10/4/28(10) | 697 | 632,727 | |
| Garrett LX I S.a.r.l., Term Loan, 7.67%, (3 mo. USD LIBOR + 3.25%), 4/30/28 | 718 | 699,806 | |
| LTI Holdings, Inc., Term Loan, 8.254%, (1 mo. USD LIBOR + 4.50%), 7/24/26 | 545 | 512,448 | |
| Tenneco, Inc., Term Loan, 6.206%, (1 mo. USD LIBOR + 3.00%), 10/1/25 | 2,969 | 2,960,244 | |
| Truck Hero, Inc., Term Loan, 7.254%, (1 mo. USD LIBOR + 3.50%), 1/31/28 | 833 | 718,912 | |
| Wheel Pros, LLC, Term Loan, 8.825%, (3 mo. USD LIBOR + 4.50%), 5/11/28 | 191 | 139,383 | |
| $ 13,190,769 | |||
| Borrower/Description | Principal Amount* (000's omitted) | Value | |
| Automobiles — 0.6% | |||
| MajorDrive Holdings IV, LLC: | |||
| Term Loan, 7.125%, (3 mo. USD LIBOR + 4.00%), 6/1/28 | 617 | $ 570,127 | |
| Term Loan, 8.597%, (SOFR + 5.65%), 6/1/29 | 1,468 | 1,408,920 | |
| $ 1,979,047 | |||
| Beverages — 1.0% | |||
| Arterra Wines Canada, Inc., Term Loan, 7.142%, (3 mo. USD LIBOR + 3.50%), 11/24/27 | 983 | $ 899,602 | |
| City Brewing Company, LLC, Term Loan, 6.814%, (1 mo. USD LIBOR + 3.50%), 4/5/28 | 692 | 478,520 | |
| Triton Water Holdings, Inc., Term Loan, 7.174%, (3 mo. USD LIBOR + 3.50%), 3/31/28 | 2,419 | 2,166,098 | |
| $ 3,544,220 | |||
| Biotechnology — 0.2% | |||
| Alkermes, Inc., Term Loan, 5.98%, (1 mo. USD LIBOR + 2.50%), 3/12/26 | 341 | $ 328,416 | |
| Alltech, Inc., Term Loan, 7.754%, (1 mo. USD LIBOR + 4.00%), 10/13/28 | 397 | 381,616 | |
| $ 710,032 | |||
| Building Products — 2.1% | |||
| ACProducts, Inc., Term Loan, 7.325%, (USD LIBOR + 4.25%), 5/17/28(10) | 1,926 | $ 1,350,104 | |
| Cornerstone Building Brands, Inc., Term Loan, 6.589%, (1 mo. USD LIBOR + 3.25%), 4/12/28 | 2,815 | 2,373,998 | |
| LHS Borrower, LLC, Term Loan, 8.579%, (SOFR + 4.75%), 2/16/29 | 1,642 | 1,303,824 | |
| MI Windows and Doors, LLC, Term Loan, 7.329%, (SOFR + 3.50%), 12/18/27 | 1,524 | 1,487,089 | |
| Standard Industries, Inc., Term Loan, 6.675%, (6 mo. USD LIBOR + 2.50%), 9/22/28 | 933 | 915,974 | |
| $ 7,430,989 | |||
| Capital Markets — 4.8% | |||
| Advisor Group, Inc., Term Loan, 8.254%, (1 mo. USD LIBOR + 4.50%), 7/31/26 | 2,185 | $ 2,104,591 | |
| AllSpring Buyer, LLC, Term Loan, 6.688%, (3 mo. USD LIBOR + 3.00%), 11/1/28 | 1,346 | 1,330,915 | |
| Aretec Group, Inc., Term Loan, 8.079%, (SOFR + 4.25%), 10/1/25 | 3,256 | 3,168,565 | |
| Edelman Financial Center, LLC, Term Loan, 7.254%, (1 mo. USD LIBOR + 3.50%), 4/7/28 | 2,471 | 2,309,436 | |
| EIG Management Company, LLC, Term Loan, 7.504%, (1 mo. USD LIBOR + 3.75%), 2/22/25 | 239 | 232,185 | |
| Borrower/Description | Principal Amount* (000's omitted) | Value | |
| Capital Markets (continued) | |||
| Focus Financial Partners, LLC, Term Loan, 6.254%, (1 mo. USD LIBOR + 2.50%), 6/30/28 | 2,964 | $ 2,903,690 | |
| Guggenheim Partners, LLC, Term Loan, 6.504%, (1 mo. USD LIBOR + 2.75%), 7/21/23 | 974 | 969,100 | |
| Hudson River Trading, LLC, Term Loan, 6.164%, (SOFR + 3.00%), 3/20/28 | 1,742 | 1,604,774 | |
| Mariner Wealth Advisors, LLC, Term Loan, 7.065%, (SOFR + 3.25%), 8/18/28 | 1,660 | 1,599,684 | |
| Victory Capital Holdings, Inc., Term Loan, 5.962%, (SOFR + 2.25%), 7/1/26 | 852 | 835,329 | |
| $ 17,058,269 | |||
| Chemicals — 5.0% | |||
| Aruba Investments, Inc.: | |||
| Term Loan, 4.979%, (1 mo. EURIBOR + 4.00%), 11/24/27 | EUR | 493 | $ 447,776 |
| Term Loan, 7.576%, (1 mo. USD LIBOR + 4.00%), 11/24/27 | 714 | 673,097 | |
| Charter NEX US, Inc., Term Loan, 7.504%, (1 mo. USD LIBOR + 3.75%), 12/1/27 | 442 | 429,567 | |
| Chemours Company (The), Term Loan, 2.00%, (3 mo. EURIBOR + 2.00%), 4/3/25 | EUR | 554 | 520,351 |
| CPC Acquisition Corp., Term Loan, 7.424%, (3 mo. USD LIBOR + 3.75%), 12/29/27 | 763 | 610,700 | |
| Flint Group GmbH: | |||
| Term Loan, 8.574%, (3 mo. USD LIBOR + 5.00%), 7.824% cash, 0.75% PIK, 9/21/23 | 96 | 72,528 | |
| Term Loan, 8.574%, (3 mo. USD LIBOR + 5.00%), 7.824% cash, 0.75% PIK, 9/21/23 | 580 | 438,733 | |
| Gemini HDPE, LLC, Term Loan, 7.358%, (3 mo. USD LIBOR + 3.00%), 12/31/27 | 695 | 669,878 | |
| Groupe Solmax, Inc., Term Loan, 8.392%, (3 mo. USD LIBOR + 4.75%), 5/29/28 | 1,481 | 1,296,094 | |
| INEOS Enterprises Holdings II Limited, Term Loan, 3.25%, (3 mo. EURIBOR + 3.25%), 8/31/26 | EUR | 175 | 158,532 |
| INEOS Enterprises Holdings US Finco, LLC, Term Loan, 6.57%, (3 mo. USD LIBOR + 3.50%), 8/28/26 | 199 | 181,358 | |
| INEOS Finance PLC: | |||
| Term Loan, 3.133%, (1 mo. EURIBOR + 2.00%), 4/1/24 | EUR | 4 | 3,697 |
| Term Loan, 3.883%, (1 mo. EURIBOR + 2.75%), 11/8/28 | EUR | 625 | 560,523 |
| INEOS Styrolution US Holding, LLC, Term Loan, 6.504%, (1 mo. USD LIBOR + 2.75%), 1/29/26 | 1,975 | 1,864,317 | |
| INEOS US Finance, LLC, Term Loan, 6.254%, (1 mo. USD LIBOR + 2.50%), 11/8/28 | 522 | 487,550 | |
| Kraton Corporation, Term Loan, 6.718%, (SOFR + 3.25%), 3/15/29 | 398 | 385,562 | |
| Borrower/Description | Principal Amount* (000's omitted) | Value | |
| Chemicals (continued) | |||
| Kraton Polymers Holdings B.V., Term Loan, 3.25%, (3 mo. EURIBOR + 3.25%), 3/15/29 | EUR | 300 | $ 273,498 |
| Lonza Group AG, Term Loan, 7.674%, (3 mo. USD LIBOR + 4.00%), 7/3/28 | 2,445 | 2,161,113 | |
| LSF11 Skyscraper Holdco S.a.r.l., Term Loan, 7.174%, (3 mo. USD LIBOR + 3.50%), 9/29/27 | 616 | 594,134 | |
| Momentive Performance Materials, Inc., Term Loan, 7.01%, (1 mo. USD LIBOR + 3.25%), 5/15/24 | 411 | 407,204 | |
| Olympus Water US Holding Corporation: | |||
| Term Loan, 7.438%, (3 mo. USD LIBOR + 3.75%), 11/9/28 | 1,489 | 1,359,547 | |
| Term Loan, 8.153%, (SOFR + 4.50%), 11/9/28 | 323 | 297,667 | |
| Orion Engineered Carbons GmbH, Term Loan, 5.924%, (3 mo. USD LIBOR + 2.25%), 9/24/28 | 322 | 312,031 | |
| Rohm Holding GmbH, Term Loan, 8.121%, (3 mo. USD LIBOR + 4.75%), 7/31/26 | 1,451 | 1,106,133 | |
| Starfruit Finco B.V., Term Loan, 3.00%, (EURIBOR + 3.00%), 10/1/25(10) | EUR | 401 | 369,775 |
| W.R. Grace & Co.-Conn., Term Loan, 7.438%, (3 mo. USD LIBOR + 3.75%), 9/22/28 | 2,432 | 2,343,695 | |
| $ 18,025,060 | |||
| Commercial Services & Supplies — 5.4% | |||
| Allied Universal Holdco, LLC, Term Loan, 7.504%, (1 mo. USD LIBOR + 3.75%), 5/12/28 | 3,889 | $ 3,537,991 | |
| Belfor Holdings, Inc., Term Loan, 7.754%, (1 mo. USD LIBOR + 4.00%), 4/6/26 | 484 | 479,315 | |
| EnergySolutions, LLC, Term Loan, 7.424%, (3 mo. USD LIBOR + 3.75%), 5/9/25 | 1,642 | 1,527,009 | |
| Garda World Security Corporation, Term Loan, 7.24%, (3 mo. USD LIBOR + 4.25%), 10/30/26 | 2,408 | 2,302,108 | |
| GFL Environmental, Inc., Term Loan, 7.415%, (3 mo. USD LIBOR + 3.00%), 5/30/25 | 49 | 48,950 | |
| LABL, Inc., Term Loan, 8.754%, (1 mo. USD LIBOR + 5.00%), 10/29/28 | 620 | 574,254 | |
| Monitronics International, Inc., Term Loan, 11.915%, (3 mo. USD LIBOR + 6.50%), 3/29/24 | 1,387 | 917,696 | |
| PECF USS Intermediate Holding III Corporation, Term Loan, 8.004%, (1 mo. USD LIBOR + 4.25%), 12/15/28 | 1,514 | 1,176,660 | |
| Phoenix Services International, LLC: | |||
| DIP Loan, 5.559%, (SOFR + 2.00%), 3/28/23 | 81 | 81,105 | |
| Term Loan, 0.00%, 3/1/25(11) | 814 | 182,105 | |
| Prime Security Services Borrower, LLC, Term Loan, 6.505%, (3 mo. USD LIBOR + 2.75%), 9/23/26 | 2,009 | 1,982,157 | |
| SITEL Worldwide Corporation, Term Loan, 7.51%, (1 mo. USD LIBOR + 3.75%), 8/28/28 | 2,302 | 2,270,101 | |
| Borrower/Description | Principal Amount* (000's omitted) | Value | |
| Commercial Services & Supplies (continued) | |||
| Tempo Acquisition, LLC, Term Loan, 6.729%, (SOFR + 3.00%), 8/31/28 | 1,549 | $ 1,531,605 | |
| TruGreen Limited Partnership, Term Loan, 7.754%, (1 mo. USD LIBOR + 4.00%), 11/2/27 | 2,046 | 1,900,309 | |
| Werner FinCo, L.P., Term Loan, 7.674%, (3 mo. USD LIBOR + 4.00%), 7/24/24 | 1,046 | 951,600 | |
| $ 19,462,965 | |||
| Communications Equipment — 0.2% | |||
| Digi International, Inc., Term Loan, 8.754%, (1 mo. USD LIBOR + 5.00%), 11/1/28 | 339 | $ 333,773 | |
| Tiger Acquisition, LLC, Term Loan, 7.004%, (1 mo. USD LIBOR + 3.25%), 6/1/28 | 543 | 508,557 | |
| $ 842,330 | |||
| Construction Materials — 0.9% | |||
| Oscar AcquisitionCo, LLC, Term Loan, 8.153%, (SOFR + 4.50%), 4/29/29 | 800 | $ 726,800 | |
| Quikrete Holdings, Inc., Term Loan, 6.754%, (1 mo. USD LIBOR + 3.00%), 6/11/28 | 2,488 | 2,429,718 | |
| $ 3,156,518 | |||
| Containers & Packaging — 2.0% | |||
| Berlin Packaging, LLC, Term Loan, 6.911%, (USD LIBOR + 3.75%), 3/11/28(10) | 1,040 | $ 997,270 | |
| BWAY Holding Company, Term Loan, 6.378%, (1 mo. USD LIBOR + 3.25%), 4/3/24 | 2,356 | 2,241,379 | |
| Clydesdale Acquisition Holdings, Inc., Term Loan, 8.004%, (SOFR + 4.18%), 4/13/29 | 1,496 | 1,443,631 | |
| Pregis TopCo Corporation, Term Loan, 7.843%, (1 mo. USD LIBOR + 4.00%), 7/31/26 | 584 | 557,972 | |
| Pretium PKG Holdings, Inc.: | |||
| Term Loan, 7.60%, (USD LIBOR + 4.00%), 10/2/28(10) | 521 | 458,101 | |
| Term Loan - Second Lien, 10.205%, (USD LIBOR + 6.75%), 10/1/29(10) | 300 | 253,500 | |
| Proampac PG Borrower, LLC, Term Loan, 7.842%, (3 mo. USD LIBOR + 3.75%), 11/3/25 | 592 | 565,195 | |
| Trident TPI Holdings, Inc., Term Loan, 6.924%, (3 mo. USD LIBOR + 3.25%), 10/17/24 | 524 | 517,260 | |
| $ 7,034,308 | |||
| Distributors — 1.4% | |||
| Autokiniton US Holdings, Inc., Term Loan, 7.80%, (1 mo. USD LIBOR + 4.50%), 4/6/28 | 3,164 | $ 2,966,771 | |
| Borrower/Description | Principal Amount* (000's omitted) | Value | |
| Distributors (continued) | |||
| Phillips Feed Service, Inc., Term Loan, 10.48%, (1 mo. USD LIBOR + 7.00%), 11/13/24(3) | 102 | $ 81,701 | |
| White Cap Buyer, LLC, Term Loan, 7.479%, (SOFR + 3.75%), 10/19/27 | 2,132 | 2,024,008 | |
| $ 5,072,480 | |||
| Diversified Consumer Services — 1.2% | |||
| Ascend Learning, LLC, Term Loan, 7.132%, (1 mo. USD LIBOR + 3.50%), 12/11/28 | 546 | $ 502,674 | |
| Corporation Service Company, Term Loan, 8/31/29(12) | 325 | 319,109 | |
| KUEHG Corp.: | |||
| Term Loan, 7.504%, (1 mo. USD LIBOR + 3.75%), 2/21/25 | 2,864 | 2,750,268 | |
| Term Loan - Second Lien, 12.004%, (1 mo. USD LIBOR + 8.25%), 8/22/25 | 400 | 389,600 | |
| Sotheby's, Term Loan, 8.579%, (3 mo. USD LIBOR + 4.50%), 1/15/27 | 408 | 400,322 | |
| $ 4,361,973 | |||
| Diversified Financial Services — 0.5% | |||
| Concorde Midco Ltd., Term Loan, 5.16%, (3 mo. EURIBOR + 4.00%), 3/1/28 | EUR | 525 | $ 471,704 |
| Sandy BidCo B.V., Term Loan, 4.00%, (6 mo. EURIBOR + 4.00%), 8/17/29 | EUR | 925 | 872,995 |
| Zephyr Bidco Limited, Term Loan, 6.934%, (SONIA + 4.75%), 7/23/25 | GBP | 700 | 628,160 |
| $ 1,972,859 | |||
| Diversified Telecommunication Services — 4.0% | |||
| Altice France S.A.: | |||
| Term Loan, 6.905%, (3 mo. USD LIBOR + 4.00%), 8/14/26 | 1,603 | $ 1,473,536 | |
| Term Loan, 7.767%, (3 mo. USD LIBOR + 3.69%), 1/31/26 | 2,198 | 1,984,745 | |
| GEE Holdings 2, LLC: | |||
| Term Loan, 11.604%, (3 mo. USD LIBOR + 8.00%), 3/24/25 | 398 | 399,826 | |
| Term Loan - Second Lien, 11.85%, (3 mo. USD LIBOR + 1.50%), 5.10% cash, 6.75% PIK, 3/23/26 | 850 | 651,484 | |
| Numericable Group S.A., Term Loan, 4.605%, (3 mo. EURIBOR + 3.00%), 7/31/25 | EUR | 425 | 388,209 |
| UPC Broadband Holding B.V.: | |||
| Term Loan, 2.863%, (6 mo. EURIBOR + 2.50%), 4/30/29 | EUR | 725 | 670,805 |
| Term Loan, 5.662%, (1 mo. USD LIBOR + 2.25%), 4/30/28 | 825 | 806,094 | |
| UPC Financing Partnership, Term Loan, 6.337%, (1 mo. USD LIBOR + 2.93%), 1/31/29 | 1,397 | 1,369,319 | |
| Borrower/Description | Principal Amount* (000's omitted) | Value | |
| Diversified Telecommunication Services (continued) | |||
| Virgin Media Bristol, LLC, Term Loan, 6.662%, (1 mo. USD LIBOR + 3.25%), 1/31/29 | 5,675 | $ 5,596,083 | |
| Zayo Group Holdings, Inc., Term Loan, 4.383%, (1 mo. EURIBOR + 3.25%), 3/9/27 | EUR | 1,404 | 1,128,219 |
| $ 14,468,320 | |||
| Electrical Equipment — 0.7% | |||
| AZZ, Inc., Term Loan, 8.079%, (SOFR + 4.25%), 5/13/29 | 334 | $ 331,877 | |
| GrafTech Finance, Inc., Term Loan, 6.754%, (1 mo. USD LIBOR + 3.00%), 2/12/25 | 1,313 | 1,252,065 | |
| II-VI Incorporated, Term Loan, 5.878%, (1 mo. USD LIBOR + 2.75%), 7/2/29 | 850 | 827,475 | |
| $ 2,411,417 | |||
| Electronic Equipment, Instruments & Components — 1.7% | |||
| Chamberlain Group, Inc., Term Loan, 7.254%, (1 mo. USD LIBOR + 3.50%), 11/3/28 | 1,315 | $ 1,199,721 | |
| Creation Technologies, Inc., Term Loan, 9.248%, (3 mo. USD LIBOR + 5.50%), 10/5/28 | 846 | 701,972 | |
| DG Investment Intermediate Holdings 2, Inc., Term Loan, 7.504%, (1 mo. USD LIBOR + 3.75%), 3/31/28 | 988 | 937,848 | |
| Mirion Technologies, Inc., Term Loan, 5.627%, (6 mo. USD LIBOR + 2.75%), 10/20/28 | 596 | 581,729 | |
| Robertshaw US Holding Corp., Term Loan, 7.313%, (1 mo. USD LIBOR + 3.50%), 2/28/25 | 931 | 761,195 | |
| Verifone Systems, Inc., Term Loan, 6.997%, (3 mo. USD LIBOR + 4.00%), 8/20/25 | 1,105 | 987,433 | |
| Verisure Holding AB: | |||
| Term Loan, 3.473%, (6 mo. EURIBOR + 3.25%), 3/27/28 | EUR | 775 | 719,461 |
| Term Loan, 3.753%, (6 mo. EURIBOR + 3.25%), 7/20/26 | EUR | 300 | 280,021 |
| $ 6,169,380 | |||
| Energy Equipment & Services — 0.0%(6) | |||
| Ameriforge Group, Inc., Term Loan, 15.03%, (1 mo. USD LIBOR + 13.00%), 12/29/23(13) | 52 | $ 25,784 | |
| $ 25,784 | |||
| Engineering & Construction — 1.5% | |||
| Aegion Corporation, Term Loan, 8.504%, (1 mo. USD LIBOR + 4.75%), 5/17/28 | 520 | $ 481,851 | |
| Amentum Government Services Holdings, LLC, Term Loan, 7.393%, (SOFR + 4.00%), 2/15/29 | 648 | 630,545 | |
| American Residential Services, LLC, Term Loan, 7.174%, (3 mo. USD LIBOR + 3.50%), 10/15/27 | 565 | 550,814 | |
| Borrower/Description | Principal Amount* (000's omitted) | Value | |
| Engineering & Construction (continued) | |||
| Northstar Group Services, Inc., Term Loan, 9.254%, (1 mo. USD LIBOR + 5.50%), 11/12/26 | 1,414 | $ 1,395,975 | |
| USIC Holdings, Inc., Term Loan, 7.254%, (1 mo. USD LIBOR + 3.50%), 5/12/28 | 2,277 | 2,169,910 | |
| $ 5,229,095 | |||
| Entertainment — 2.2% | |||
| Alchemy Copyrights, LLC, Term Loan, 6.128%, (1 mo. USD LIBOR + 3.00%), 3/10/28 | 490 | $ 487,572 | |
| AMC Entertainment Holdings, Inc., Term Loan, 6.314%, (1 mo. USD LIBOR + 3.00%), 4/22/26 | 1,713 | 1,224,705 | |
| City Football Group Limited, Term Loan, 6.484%, (3 mo. USD LIBOR + 3.50%), 7/21/28 | 1,985 | 1,855,975 | |
| Crown Finance US, Inc.: | |||
| DIP Loan, 0.00%, 9/7/23(13) | 107 | 107,801 | |
| DIP Loan, 13.612%, (SOFR + 10.00%), 9/7/23 | 1,277 | 1,282,945 | |
| Term Loan, 0.00%, 9/30/26(11) | 1,365 | 405,867 | |
| Renaissance Holding Corp.: | |||
| Term Loan, 7.608%, (SOFR + 4.50%), 3/30/29 | 150 | 145,136 | |
| Term Loan - Second Lien, 10.754%, (1 mo. USD LIBOR + 7.00%), 5/29/26 | 175 | 167,271 | |
| UFC Holdings, LLC, Term Loan, 7.11%, (3 mo. USD LIBOR + 2.75%), 4/29/26 | 1,776 | 1,740,512 | |
| Vue International Bidco PLC: | |||
| Term Loan, 4.75%, (6 mo. EURIBOR + 4.75%), 7/3/26 | EUR | 615 | 414,978 |
| Term Loan, 8.00%, (3 mo. EURIBOR + 8.00%), 6/30/27 | EUR | 69 | 64,164 |
| $ 7,896,926 | |||
| Food Products — 1.0% | |||
| 8th Avenue Food & Provisions, Inc., Term Loan, 8.382%, (1 mo. USD LIBOR + 4.75%), 10/1/25 | 495 | $ 434,363 | |
| Badger Buyer Corp., Term Loan, 7.254%, (1 mo. USD LIBOR + 3.50%), 9/30/24 | 333 | 293,016 | |
| CHG PPC Parent, LLC, Term Loan, 6.632%, (1 mo. USD LIBOR + 3.00%), 12/8/28 | 398 | 386,060 | |
| Del Monte Foods, Inc., Term Loan, 7.827%, (SOFR + 4.35%), 5/16/29 | 400 | 389,250 | |
| Monogram Food Solutions, LLC, Term Loan, 7.813%, (1 mo. USD LIBOR + 4.00%), 8/28/28 | 447 | 435,459 | |
| Shearer's Foods, Inc., Term Loan, 7.254%, (1 mo. USD LIBOR + 3.50%), 9/23/27 | 392 | 365,948 | |
| Sovos Brands Intermediate, Inc., Term Loan, 7.915%, (3 mo. USD LIBOR + 3.50%), 6/8/28 | 560 | 537,985 | |
| United Petfood Group B.V., Term Loan, 4.558%, (3 mo. EURIBOR + 3.00%), 4/23/28 | EUR | 700 | 631,245 |
| $ 3,473,326 | |||
| Borrower/Description | Principal Amount* (000's omitted) | Value | |
| Gas Utilities — 0.8% | |||
| CQP Holdco, L.P., Term Loan, 7.424%, (3 mo. USD LIBOR + 3.75%), 6/5/28 | 2,918 | $ 2,886,341 | |
| $ 2,886,341 | |||
| Health Care Equipment & Supplies — 1.6% | |||
| Bayou Intermediate II, LLC, Term Loan, 7.302%, (3 mo. USD LIBOR + 4.50%), 8/2/28 | 794 | $ 762,240 | |
| CryoLife, Inc., Term Loan, 7.174%, (3 mo. USD LIBOR + 3.50%), 6/1/27 | 476 | 446,484 | |
| Gloves Buyer, Inc., Term Loan, 7.754%, (1 mo. USD LIBOR + 4.00%), 12/29/27 | 1,631 | 1,483,930 | |
| Journey Personal Care Corp., Term Loan, 7.924%, (3 mo. USD LIBOR + 4.25%), 3/1/28 | 1,160 | 747,241 | |
| Medline Borrower, L.P., Term Loan, 7.004%, (1 mo. USD LIBOR + 3.25%), 10/23/28 | 2,488 | 2,289,883 | |
| $ 5,729,778 | |||
| Health Care Providers & Services — 7.8% | |||
| AEA International Holdings (Lux) S.a.r.l., Term Loan, 7.438%, (3 mo. USD LIBOR + 3.75%), 9/7/28 | 868 | $ 855,411 | |
| Biogroup-LCD, Term Loan, 3.027%, (3 mo. EURIBOR + 2.75%), 2/9/28 | EUR | 225 | 201,047 |
| BW NHHC Holdco, Inc., Term Loan, 7.961%, (3 mo. USD LIBOR + 5.00%), 5/15/25 | 2,146 | 1,356,190 | |
| Cano Health, LLC, Term Loan, 7.829%, (SOFR + 4.00%), 11/23/27 | 2,474 | 2,122,769 | |
| CCRR Parent, Inc., Term Loan, 7.51%, (1 mo. USD LIBOR + 3.75%), 3/6/28 | 567 | 550,452 | |
| Cerba Healthcare S.A.S.: | |||
| Term Loan, 4.383%, (1 mo. EURIBOR + 3.25%), 6/30/28 | EUR | 450 | 405,430 |
| Term Loan, 5.133%, (1 mo. EURIBOR + 4.00%), 2/15/29 | EUR | 500 | 467,874 |
| CHG Healthcare Services, Inc., Term Loan, 7.004%, (3 mo. USD LIBOR + 3.25%), 9/29/28 | 916 | 890,996 | |
| Covis Finco S.a.r.l., Term Loan, 10.203%, (SOFR + 6.50%), 2/18/27 | 829 | 559,406 | |
| Electron BidCo, Inc., Term Loan, 6.754%, (1 mo. USD LIBOR + 3.00%), 11/1/28 | 672 | 651,756 | |
| Envision Healthcare Corporation: | |||
| Term Loan, 11.603%, (SOFR + 7.88%), 3/31/27 | 316 | 293,158 | |
| Term Loan - Second Lien, 6.825%, (SOFR + 4.25%), 3/31/27 | 2,238 | 981,026 | |
| IVC Acquisition, Ltd., Term Loan, 4.00%, (3 mo. EURIBOR + 4.00%), 2/13/26 | EUR | 1,325 | 1,224,726 |
| Borrower/Description | Principal Amount* (000's omitted) | Value | |
| Health Care Providers & Services (continued) | |||
| LSCS Holdings, Inc., Term Loan, 8.174%, (3 mo. USD LIBOR + 4.50%), 12/16/28 | 620 | $ 593,949 | |
| MDVIP, Inc., Term Loan, 7.072%, (1 mo. USD LIBOR + 3.50%), 10/16/28 | 249 | 240,821 | |
| Medical Solutions Holdings, Inc.: | |||
| Term Loan, 3.50%, 11/1/28(13) | 173 | 166,678 | |
| Term Loan, 6.377%, (3 mo. USD LIBOR + 3.50%), 11/1/28 | 1,072 | 1,036,002 | |
| National Mentor Holdings, Inc.: | |||
| Term Loan, 7.43%, (3 mo. USD LIBOR + 3.75%), 3/2/28 | 60 | 43,447 | |
| Term Loan, 7.466%, (USD LIBOR + 3.75%), 3/2/28(10) | 2,085 | 1,505,586 | |
| Option Care Health, Inc., Term Loan, 6.504%, (1 mo. USD LIBOR + 2.75%), 10/27/28 | 347 | 341,513 | |
| Pacific Dental Services, LLC, Term Loan, 6.98%, (1 mo. USD LIBOR + 3.50%), 5/5/28 | 543 | 526,379 | |
| Pearl Intermediate Parent, LLC, Term Loan - Second Lien, 10.004%, (1 mo. USD LIBOR + 6.25%), 2/13/26 | 150 | 137,250 | |
| Pediatric Associates Holding Company, LLC: | |||
| Term Loan, 5.122%, (1 mo. USD LIBOR + 3.25%), 12/29/28(13) | 62 | 60,318 | |
| Term Loan, 7.004%, (1 mo. USD LIBOR + 3.25%), 12/29/28 | 410 | 397,098 | |
| PetVet Care Centers, LLC, Term Loan, 7.254%, (1 mo. USD LIBOR + 3.50%), 2/14/25 | 296 | 277,886 | |
| Phoenix Guarantor, Inc.: | |||
| Term Loan, 7.004%, (1 mo. USD LIBOR + 3.25%), 3/5/26 | 2,962 | 2,849,005 | |
| Term Loan, 7.254%, (1 mo. USD LIBOR + 3.50%), 3/5/26 | 1,432 | 1,377,241 | |
| Radiology Partners, Inc., Term Loan, 7.825%, (1 mo. USD LIBOR + 4.25%), 7/9/25 | 1,213 | 985,619 | |
| Radnet Management, Inc., Term Loan, 6.754%, (1 mo. USD LIBOR + 3.00%), 4/21/28 | 2,469 | 2,402,788 | |
| Sound Inpatient Physicians, Term Loan, 6.504%, (1 mo. USD LIBOR + 2.75%), 6/27/25 | 431 | 342,115 | |
| Surgery Center Holdings, Inc., Term Loan, 7.07%, (1 mo. USD LIBOR + 3.75%), 8/31/26 | 2,444 | 2,340,306 | |
| Synlab Bondco PLC, Term Loan, 2.778%, (6 mo. EURIBOR + 2.50%), 7/1/27 | EUR | 300 | 283,628 |
| U.S. Anesthesia Partners, Inc., Term Loan, 7.378%, (1 mo. USD LIBOR + 4.25%), 10/1/28 | 916 | 868,164 | |
| WP CityMD Bidco, LLC, Term Loan, 6.924%, (3 mo. USD LIBOR + 3.25%), 12/22/28 | 572 | 557,536 | |
| $ 27,893,570 | |||
| Borrower/Description | Principal Amount* (000's omitted) | Value | |
| Health Care Technology — 3.1% | |||
| Bracket Intermediate Holding Corp., Term Loan, 7.998%, (3 mo. USD LIBOR + 4.25%), 9/5/25 | 840 | $ 806,610 | |
| Certara, L.P., Term Loan, 7.254%, (1 mo. USD LIBOR + 3.50%), 8/15/26 | 950 | 928,683 | |
| eResearchTechnology, Inc., Term Loan, 8.254%, (1 mo. USD LIBOR + 4.50%), 2/4/27 | 320 | 298,882 | |
| Imprivata, Inc.: | |||
| Term Loan, 7.504%, (1 mo. USD LIBOR + 3.75%), 12/1/27 | 2,150 | 2,109,909 | |
| Term Loan, 7.979%, (SOFR + 4.25%), 12/1/27 | 200 | 197,089 | |
| MedAssets Software Intermediate Holdings, Inc.: | |||
| Term Loan, 7.754%, (1 mo. USD LIBOR + 4.00%), 12/18/28 | 945 | 897,988 | |
| Term Loan - Second Lien, 10.504%, (1 mo. USD LIBOR + 6.75%), 12/17/29 | 600 | 516,500 | |
| Navicure, Inc., Term Loan, 7.754%, (1 mo. USD LIBOR + 4.00%), 10/22/26 | 1,402 | 1,367,412 | |
| PointClickCare Technologies, Inc., Term Loan, 5.938%, (6 mo. USD LIBOR + 3.00%), 12/29/27 | 616 | 603,569 | |
| Project Ruby Ultimate Parent Corp., Term Loan, 7.004%, (1 mo. USD LIBOR + 3.25%), 3/10/28 | 1,108 | 1,045,966 | |
| Symplr Software, Inc., Term Loan, 8.694%, (SOFR + 4.50%), 12/22/27 | 962 | 900,611 | |
| Verscend Holding Corp., Term Loan, 7.754%, (1 mo. USD LIBOR + 4.00%), 8/27/25 | 1,453 | 1,435,743 | |
| $ 11,108,962 | |||
| Hotels, Restaurants & Leisure — 3.9% | |||
| Carnival Corporation: | |||
| Term Loan, 5.877%, (6 mo. USD LIBOR + 3.00%), 6/30/25 | 1,271 | $ 1,196,623 | |
| Term Loan, 6.127%, (6 mo. USD LIBOR + 3.25%), 10/18/28 | 3,280 | 3,013,718 | |
| ClubCorp Holdings, Inc., Term Loan, 6.424%, (3 mo. USD LIBOR + 2.75%), 9/18/24 | 1,481 | 1,333,393 | |
| Dave & Buster's, Inc., Term Loan, 8.875%, (SOFR + 5.00%), 6/29/29 | 673 | 660,548 | |
| Great Canadian Gaming Corporation, Term Loan, 7.602%, (3 mo. USD LIBOR + 4.00%), 11/1/26 | 1,521 | 1,482,017 | |
| IRB Holding Corp., Term Loan, 6.208%, (SOFR + 3.00%), 12/15/27 | 2,457 | 2,387,650 | |
| Oravel Stays Singapore Pte, Ltd., Term Loan, 11.86%, (3 mo. USD LIBOR + 8.25%), 6/23/26 | 593 | 518,438 | |
| Playa Resorts Holding B.V., Term Loan, 6.50%, (1 mo. USD LIBOR + 2.75%), 4/29/24 | 1,102 | 1,076,530 | |
| SeaWorld Parks & Entertainment, Inc., Term Loan, 6.813%, (1 mo. USD LIBOR + 3.00%), 8/25/28 | 743 | 725,515 | |
| Borrower/Description | Principal Amount* (000's omitted) | Value | |
| Hotels, Restaurants & Leisure (continued) | |||
| SMG US Midco 2, Inc., Term Loan, 6.915%, (USD LIBOR + 2.50%), 1/23/25(10) | 215 | $ 204,368 | |
| Travel Leaders Group, LLC, Term Loan, 7.754%, (1 mo. USD LIBOR + 4.00%), 1/25/24 | 1,595 | 1,416,143 | |
| $ 14,014,943 | |||
| Household Durables — 0.8% | |||
| Libbey Glass, Inc., Term Loan, 11.941%, (3 mo. USD LIBOR + 8.00%), 11/13/25 | 660 | $ 676,234 | |
| Serta Simmons Bedding, LLC: | |||
| Term Loan, 10.793%, (1 mo. USD LIBOR + 7.50%), 8/10/23 | 1,050 | 1,021,621 | |
| Term Loan - Second Lien, 10.793%, (1 mo. USD LIBOR + 7.50%), 8/10/23 | 2,426 | 1,226,686 | |
| $ 2,924,541 | |||
| Household Products — 0.4% | |||
| Kronos Acquisition Holdings, Inc.: | |||
| Term Loan, 6.82%, (3 mo. USD LIBOR + 3.75%), 12/22/26 | 1,277 | $ 1,210,793 | |
| Term Loan, 8.94%, (SOFR + 6.00%), 12/22/26 | 347 | 333,480 | |
| $ 1,544,273 | |||
| Industrial Conglomerates — 0.6% | |||
| SPX Flow, Inc., Term Loan, 8.329%, (SOFR + 4.50%), 4/5/29 | 2,200 | $ 2,090,000 | |
| $ 2,090,000 | |||
| Insurance — 3.4% | |||
| Alliant Holdings Intermediate, LLC, Term Loan, 7.004%, (1 mo. USD LIBOR + 3.25%), 5/9/25 | 2,241 | $ 2,179,727 | |
| AssuredPartners, Inc.: | |||
| Term Loan, 7.254%, (1 mo. USD LIBOR + 3.50%), 2/12/27 | 1,382 | 1,321,513 | |
| Term Loan, 7.254%, (1 mo. USD LIBOR + 3.50%), 2/12/27 | 1,383 | 1,321,670 | |
| Financiere CEP S.A.S., Term Loan, 4.225%, (6 mo. EURIBOR + 4.00%), 6/18/27 | EUR | 500 | 464,477 |
| NFP Corp., Term Loan, 7.004%, (1 mo. USD LIBOR + 3.25%), 2/15/27 | 2,172 | 2,065,717 | |
| Ryan Specialty Group, LLC, Term Loan, 6.829%, (SOFR + 3.00%), 9/1/27 | 2,962 | 2,929,816 | |
| USI, Inc., Term Loan, 6.924%, (3 mo. USD LIBOR + 3.25%), 12/2/26 | 1,975 | 1,938,665 | |
| $ 12,221,585 | |||
| Borrower/Description | Principal Amount* (000's omitted) | Value | |
| Interactive Media & Services — 2.4% | |||
| Arches Buyer, Inc., Term Loan, 7.004%, (1 mo. USD LIBOR + 3.25%), 12/6/27 | 2,000 | $ 1,775,208 | |
| Buzz Finco, LLC, Term Loan, 6.504%, (1 mo. USD LIBOR + 2.75%), 1/29/27 | 536 | 522,843 | |
| Camelot U.S. Acquisition, LLC, Term Loan, 6.754%, (1 mo. USD LIBOR + 3.00%), 10/30/26 | 3,191 | 3,143,935 | |
| Foundational Education Group, Inc., Term Loan, 7.565%, (SOFR + 3.75%), 8/31/28 | 1,464 | 1,432,829 | |
| Getty Images, Inc., Term Loan, 7.625%, (3 mo. USD LIBOR + 4.50%), 2/19/26 | 1,078 | 1,073,543 | |
| Match Group, Inc., Term Loan, 4.692%, (3 mo. USD LIBOR + 1.75%), 2/13/27 | 700 | 687,167 | |
| $ 8,635,525 | |||
| Internet & Direct Marketing Retail — 1.0% | |||
| Adevinta ASA: | |||
| Term Loan, 3.25%, (3 mo. EURIBOR + 3.25%), 6/26/28 | EUR | 1,035 | $ 988,637 |
| Term Loan, 6.674%, (3 mo. USD LIBOR + 3.00%), 6/26/28 | 296 | 290,001 | |
| CNT Holdings I Corp., Term Loan, 7.239%, (SOFR + 3.50%), 11/8/27 | 1,531 | 1,493,998 | |
| Hoya Midco, LLC, Term Loan, 6.979%, (SOFR + 3.25%), 2/3/29 | 940 | 930,368 | |
| $ 3,703,004 | |||
| IT Services — 5.2% | |||
| Asurion, LLC: | |||
| Term Loan, 7.004%, (1 mo. USD LIBOR + 3.25%), 12/23/26 | 1,159 | $ 1,036,531 | |
| Term Loan, 7.004%, (1 mo. USD LIBOR + 3.25%), 7/31/27 | 1,481 | 1,308,395 | |
| Term Loan, 7.653%, (SOFR + 4.00%), 8/19/28 | 1,109 | 1,001,643 | |
| Term Loan - Second Lien, 9.004%, (1 mo. USD LIBOR + 5.25%), 1/31/28 | 1,830 | 1,298,156 | |
| Endure Digital, Inc., Term Loan, 6.698%, (1 mo. USD LIBOR + 3.50%), 2/10/28 | 4,037 | 3,458,830 | |
| EP Purchaser, LLC, Term Loan, 7.174%, (3 mo. USD LIBOR + 3.50%), 11/6/28 | 348 | 344,224 | |
| Gainwell Acquisition Corp., Term Loan, 7.674%, (3 mo. USD LIBOR + 4.00%), 10/1/27 | 3,854 | 3,677,369 | |
| Indy US Bidco, LLC: | |||
| Term Loan, 4.883%, (1 mo. EURIBOR + 3.75%), 3/6/28 | EUR | 592 | 527,045 |
| Term Loan, 7.504%, (1 mo. USD LIBOR + 3.75%), 3/5/28 | 739 | 657,521 | |
| NAB Holdings, LLC, Term Loan, 6.703%, (SOFR + 3.00%), 11/23/28 | 918 | 882,870 | |
| Borrower/Description | Principal Amount* (000's omitted) | Value | |
| IT Services (continued) | |||
| Rackspace Technology Global, Inc., Term Loan, 5.617%, (3 mo. USD LIBOR + 2.75%), 2/15/28 | 2,970 | $ 1,904,621 | |
| Sedgwick Claims Management Services, Inc., Term Loan, 7.004%, (1 mo. USD LIBOR + 3.25%), 12/31/25 | 1,135 | 1,098,124 | |
| Skopima Merger Sub, Inc., Term Loan, 7.754%, (1 mo. USD LIBOR + 4.00%), 5/12/28 | 1,510 | 1,411,616 | |
| $ 18,606,945 | |||
| Leisure Products — 0.5% | |||
| Amer Sports Oyj, Term Loan, 5.131%, (6 mo. EURIBOR + 4.50%), 3/30/26 | EUR | 1,650 | $ 1,443,092 |
| Fender Musical Instruments Corporation, Term Loan, 7.368%, (SOFR + 4.00%), 12/1/28 | 272 | 229,515 | |
| $ 1,672,607 | |||
| Life Sciences Tools & Services — 1.3% | |||
| Cambrex Corporation, Term Loan, 7.329%, (SOFR + 3.50%), 12/4/26 | 289 | $ 278,987 | |
| Curia Global, Inc., Term Loan, 8.163%, (USD LIBOR + 3.75%), 8/30/26(10) | 1,845 | 1,696,936 | |
| LGC Group Holdings, Ltd., Term Loan, 3.883%, (1 mo. EURIBOR + 2.75%), 4/21/27 | EUR | 475 | 424,824 |
| Loire Finco Luxembourg S.a.r.l., Term Loan, 6.754%, (1 mo. USD LIBOR + 3.00%), 4/21/27 | 318 | 296,311 | |
| Packaging Coordinators Midco, Inc., Term Loan, 7.424%, (3 mo. USD LIBOR + 3.75%), 11/30/27 | 1,361 | 1,319,380 | |
| Sotera Health Holdings, LLC, Term Loan, 7.165%, (1 mo. USD LIBOR + 2.75%), 12/11/26 | 625 | 568,750 | |
| $ 4,585,188 | |||
| Machinery — 7.7% | |||
| AI Aqua Merger Sub, Inc., Term Loan, 6.858%, (SOFR + 3.75%), 7/31/28 | 2,195 | $ 2,046,371 | |
| Albion Financing 3 S.a.r.l., Term Loan, 9.575%, (3 mo. USD LIBOR + 5.25%), 8/17/26 | 1,340 | 1,269,531 | |
| Alliance Laundry Systems, LLC, Term Loan, 7.409%, (3 mo. USD LIBOR + 3.50%), 10/8/27 | 2,105 | 2,037,499 | |
| American Trailer World Corp., Term Loan, 7.579%, (SOFR + 3.75%), 3/3/28 | 1,261 | 1,148,812 | |
| Apex Tool Group, LLC, Term Loan, 8.624%, (SOFR + 5.25%), 2/8/29 | 2,088 | 1,814,302 | |
| Conair Holdings, LLC, Term Loan, 7.424%, (3 mo. USD LIBOR + 3.75%), 5/17/28 | 2,178 | 1,844,041 | |
| CPM Holdings, Inc., Term Loan, 6.628%, (1 mo. USD LIBOR + 3.50%), 11/17/25 | 1,974 | 1,922,771 | |
| Borrower/Description | Principal Amount* (000's omitted) | Value | |
| Machinery (continued) | |||
| Delachaux Group S.A., Term Loan, 8.915%, (3 mo. USD LIBOR + 4.50%), 4/16/26 | 421 | $ 380,779 | |
| Engineered Machinery Holdings, Inc., Term Loan, 7.424%, (3 mo. USD LIBOR + 3.75%), 5/19/28 | 2,698 | 2,615,682 | |
| Filtration Group Corporation: | |||
| Term Loan, 3.50%, (3 mo. EURIBOR + 3.50%), 3/29/25 | EUR | 359 | 337,030 |
| Term Loan, 7.254%, (1 mo. USD LIBOR + 3.50%), 10/21/28 | 644 | 622,241 | |
| Gates Global, LLC, Term Loan, 6.254%, (1 mo. USD LIBOR + 2.50%), 3/31/27 | 2,543 | 2,480,145 | |
| Granite Holdings US Acquisition Co., Term Loan, 7.688%, (3 mo. USD LIBOR + 4.00%), 9/30/26 | 1,304 | 1,275,620 | |
| Icebox Holdco III, Inc.: | |||
| Term Loan, 7.424%, (3 mo. USD LIBOR + 3.75%), 12/22/28 | 598 | 554,377 | |
| Term Loan, 7.58%, (3 mo. USD LIBOR + 3.75%), 12/22/28 | 124 | 115,275 | |
| Illuminate Buyer, LLC, Term Loan, 7.254%, (1 mo. USD LIBOR + 3.50%), 6/30/27 | 869 | 813,148 | |
| Madison IAQ, LLC, Term Loan, 6.815%, (3 mo. USD LIBOR + 3.25%), 6/21/28 | 2,469 | 2,246,562 | |
| Penn Engineering & Manufacturing Corp., Term Loan, 6.424%, (3 mo. USD LIBOR + 2.75%), 6/27/24 | 165 | 160,852 | |
| Titan Acquisition Limited, Term Loan, 5.877%, (6 mo. USD LIBOR + 3.00%), 3/28/25 | 1,979 | 1,812,479 | |
| TK Elevator Topco GmbH, Term Loan, 4.256%, (1 mo. EURIBOR + 3.63%), 7/29/27 | EUR | 500 | 455,212 |
| Vertical US Newco, Inc., Term Loan, 6.871%, (6 mo. USD LIBOR + 3.50%), 7/30/27 | 1,201 | 1,142,929 | |
| Zephyr German BidCo GmbH, Term Loan, 3.40%, (3 mo. EURIBOR + 3.40%), 3/10/28 | EUR | 600 | 547,985 |
| $ 27,643,643 | |||
| Media — 3.1% | |||
| CMG Media Corporation, Term Loan, 7.254%, (1 mo. USD LIBOR + 3.50%), 12/17/26 | 2,222 | $ 2,083,337 | |
| Diamond Sports Group, LLC, Term Loan, 11.208%, (SOFR + 8.10%), 5/26/26 | 479 | 461,949 | |
| Gray Television, Inc.: | |||
| Term Loan, 5.625%, (1 mo. USD LIBOR + 2.50%), 2/7/24 | 156 | 156,198 | |
| Term Loan, 5.628%, (1 mo. USD LIBOR + 2.50%), 1/2/26 | 595 | 586,201 | |
| Term Loan, 6.128%, (1 mo. USD LIBOR + 3.00%), 12/1/28 | 819 | 808,748 | |
| Hubbard Radio, LLC, Term Loan, 8.01%, (1 mo. USD LIBOR + 4.25%), 3/28/25 | 567 | 468,406 | |
| Borrower/Description | Principal Amount* (000's omitted) | Value | |
| Media (continued) | |||
| Magnite, Inc., Term Loan, 8.642%, (USD LIBOR + 5.00%), 4/28/28(10) | 716 | $ 676,561 | |
| MJH Healthcare Holdings, LLC, Term Loan, 7.329%, (SOFR + 3.50%), 1/28/29 | 249 | 236,313 | |
| Nexstar Broadcasting, Inc., Term Loan, 6.254%, (1 mo. USD LIBOR + 2.50%), 9/18/26 | 280 | 278,077 | |
| Recorded Books, Inc., Term Loan, 7.578%, (SOFR + 4.00%), 8/29/25 | 2,280 | 2,221,101 | |
| Sinclair Television Group, Inc.: | |||
| Term Loan, 6.26%, (1 mo. USD LIBOR + 2.50%), 9/30/26 | 582 | 551,300 | |
| Term Loan, 6.76%, (1 mo. USD LIBOR + 3.00%), 4/1/28 | 388 | 361,473 | |
| Univision Communications, Inc., Term Loan, 7.004%, (1 mo. USD LIBOR + 3.25%), 3/15/26 | 2,173 | 2,111,205 | |
| $ 11,000,869 | |||
| Metals/Mining — 0.3% | |||
| Dynacast International, LLC, Term Loan, 11.98%, (3 mo. USD LIBOR + 9.00%), 10/22/25 | 332 | $ 282,267 | |
| WireCo WorldGroup, Inc., Term Loan, 7.188%, (3 mo. USD LIBOR + 4.25%), 11/13/28 | 411 | 402,506 | |
| Zekelman Industries, Inc., Term Loan, 5.604%, (3 mo. USD LIBOR + 2.00%), 1/24/27 | 554 | 539,144 | |
| $ 1,223,917 | |||
| Oil, Gas & Consumable Fuels — 3.9% | |||
| Centurion Pipeline Company, LLC: | |||
| Term Loan, 7.004%, (1 mo. USD LIBOR + 3.25%), 9/29/25 | 242 | $ 239,456 | |
| Term Loan, 7.754%, (1 mo. USD LIBOR + 4.00%), 9/28/25 | 222 | 219,479 | |
| CITGO Petroleum Corporation, Term Loan, 10.004%, (1 mo. USD LIBOR + 6.25%), 3/28/24 | 4,506 | 4,517,591 | |
| Delek US Holdings, Inc., Term Loan, 9.254%, (1 mo. USD LIBOR + 5.50%), 3/31/25 | 561 | 556,070 | |
| Freeport LNG Investments, LLLP, Term Loan, 7.743%, (3 mo. USD LIBOR + 3.50%), 12/21/28 | 591 | 554,666 | |
| Matador Bidco S.a.r.l., Term Loan, 8.254%, (1 mo. USD LIBOR + 4.50%), 10/15/26 | 3,709 | 3,639,751 | |
| Oryx Midstream Services Permian Basin, LLC, Term Loan, 6.211%, (3 mo. USD LIBOR + 3.25%), 10/5/28 | 695 | 685,907 | |
| Oxbow Carbon, LLC, Term Loan, 7.878%, (3 mo. USD LIBOR + 4.25%), 10/17/25 | 675 | 673,031 | |
| Borrower/Description | Principal Amount* (000's omitted) | Value | |
| Oil, Gas & Consumable Fuels (continued) | |||
| QuarterNorth Energy Holding, Inc., Term Loan - Second Lien, 11.754%, (1 mo. USD LIBOR + 8.00%), 8/27/26 | 755 | $ 753,418 | |
| UGI Energy Services, LLC, Term Loan, 7.254%, (1 mo. USD LIBOR + 3.50%), 8/13/26 | 1,974 | 1,967,439 | |
| $ 13,806,808 | |||
| Personal Products — 0.5% | |||
| HLF Financing S.a.r.l., Term Loan, 6.254%, (1 mo. USD LIBOR + 2.50%), 8/18/25 | 635 | $ 613,173 | |
| Sunshine Luxembourg VII S.a.r.l., Term Loan, 7.424%, (3 mo. USD LIBOR + 3.75%), 10/1/26 | 1,133 | 1,079,652 | |
| $ 1,692,825 | |||
| Pharmaceuticals — 2.5% | |||
| Akorn, Inc., Term Loan, 11.243%, (3 mo. USD LIBOR + 7.50%), 10/1/25 | 296 | $ 281,517 | |
| Amneal Pharmaceuticals, LLC, Term Loan, 7.251%, (USD LIBOR + 3.50%), 5/4/25(10) | 1,646 | 1,411,874 | |
| Bausch Health Companies, Inc., Term Loan, 8.624%, (SOFR + 5.25%), 2/1/27 | 1,694 | 1,273,233 | |
| Jazz Financing Lux S.a.r.l., Term Loan, 7.254%, (1 mo. USD LIBOR + 3.50%), 5/5/28 | 2,227 | 2,204,720 | |
| Mallinckrodt International Finance S.A.: | |||
| Term Loan, 8.733%, (3 mo. USD LIBOR + 5.25%), 9/30/27 | 1,882 | 1,532,625 | |
| Term Loan, 8.983%, (3 mo. USD LIBOR + 5.50%), 9/30/27 | 2,697 | 2,202,847 | |
| PharmaZell GmbH, Term Loan, 5.193%, (1 mo. EURIBOR + 4.00%), 5/12/27 | EUR | 125 | 117,972 |
| $ 9,024,788 | |||
| Professional Services — 3.2% | |||
| AlixPartners, LLP, Term Loan, 3.25%, (3 mo. EURIBOR + 3.25%), 2/4/28 | EUR | 493 | $ 461,161 |
| APFS Staffing Holdings, Inc., Term Loan, 8.044%, (SOFR + 4.00%), 12/29/28(10) | 249 | 241,287 | |
| Blitz 20-487 GmbH, Term Loan, 4.805%, (3 mo. EURIBOR + 3.20%), 4/28/28 | EUR | 750 | 697,643 |
| Brown Group Holding, LLC: | |||
| Term Loan, 6.254%, (1 mo. USD LIBOR + 2.50%), 6/7/28 | 2,171 | 2,113,277 | |
| Term Loan, 7.419%, (SOFR + 3.75%), 7/2/29 | 225 | 222,862 | |
| CoreLogic, Inc., Term Loan, 7.313%, (1 mo. USD LIBOR + 3.50%), 6/2/28 | 2,859 | 2,106,449 | |
| Deerfield Dakota Holding, LLC, Term Loan, 7.479%, (SOFR + 3.75%), 4/9/27 | 2,104 | 1,994,995 | |
| Borrower/Description | Principal Amount* (000's omitted) | Value | |
| Professional Services (continued) | |||
| Employbridge, LLC, Term Loan, 8.424%, (3 mo. USD LIBOR + 4.75%), 7/19/28 | 1,485 | $ 1,273,918 | |
| Techem Verwaltungsgesellschaft 675 mbH, Term Loan, 2.638%, (6 mo. EURIBOR + 2.38%), 7/15/25 | EUR | 739 | 691,703 |
| Trans Union, LLC, Term Loan, 6.004%, (1 mo. USD LIBOR + 2.25%), 12/1/28 | 1,511 | 1,489,661 | |
| Vaco Holdings, LLC, Term Loan, 8.708%, (SOFR + 5.00%), 1/21/29(10) | 248 | 242,542 | |
| $ 11,535,498 | |||
| Road & Rail — 3.3% | |||
| Grab Holdings, Inc., Term Loan, 8.26%, (1 mo. USD LIBOR + 4.50%), 1/29/26 | 2,290 | $ 2,164,525 | |
| Kenan Advantage Group, Inc., Term Loan, 7.504%, (1 mo. USD LIBOR + 3.75%), 3/24/26 | 2,383 | 2,278,078 | |
| PODS, LLC, Term Loan, 6.754%, (1 mo. USD LIBOR + 3.00%), 3/31/28 | 2,469 | 2,387,327 | |
| Uber Technologies, Inc.: | |||
| Term Loan, 6.57%, (3 mo. USD LIBOR + 3.50%), 4/4/25 | 4,914 | 4,885,397 | |
| Term Loan, 6.57%, (3 mo. USD LIBOR + 3.50%), 2/25/27 | 5 | 4,928 | |
| $ 11,720,255 | |||
| Semiconductors & Semiconductor Equipment — 0.9% | |||
| Altar Bidco, Inc.: | |||
| Term Loan, 5.368%, (SOFR + 3.10%), 2/1/29(10) | 1,072 | $ 1,005,963 | |
| Term Loan - Second Lien, 7.355%, (SOFR + 5.60%), 2/1/30 | 450 | 388,500 | |
| Bright Bidco B.V., Term Loan, 12.094%, (SOFR + 8.00%), 10/31/27 | 410 | 367,286 | |
| MKS Instruments, Inc., Term Loan, 3.913%, (1 mo. EURIBOR + 3.00%), 8/17/29 | EUR | 350 | 336,376 |
| Ultra Clean Holdings, Inc., Term Loan, 7.504%, (1 mo. USD LIBOR + 3.75%), 8/27/25 | 1,108 | 1,097,135 | |
| $ 3,195,260 | |||
| Software — 25.5% | |||
| Applied Systems, Inc., Term Loan - Second Lien, 9.174%, (3 mo. USD LIBOR + 5.50%), 9/19/25 | 2,390 | $ 2,361,938 | |
| AppLovin Corporation: | |||
| Term Loan, 6.674%, (3 mo. USD LIBOR + 3.00%), 10/25/28 | 1,269 | 1,225,413 | |
| Term Loan, 7.004%, (1 mo. USD LIBOR + 3.25%), 8/15/25 | 2,122 | 2,079,656 | |
| Borrower/Description | Principal Amount* (000's omitted) | Value | |
| Software (continued) | |||
| Aptean, Inc., Term Loan, 7.32%, (3 mo. USD LIBOR + 4.25%), 4/23/26 | 2,078 | $ 1,995,319 | |
| AQA Acquisition Holding, Inc., Term Loan, 7.32%, (3 mo. USD LIBOR + 4.25%), 3/3/28 | 889 | 854,311 | |
| Astra Acquisition Corp.: | |||
| Term Loan, 9.004%, (1 mo. USD LIBOR + 5.25%), 10/25/28 | 920 | 802,119 | |
| Term Loan - Second Lien, 12.629%, (1 mo. USD LIBOR + 8.88%), 10/25/29 | 1,425 | 1,303,562 | |
| Banff Merger Sub, Inc.: | |||
| Term Loan, 4.00%, (3 mo. EURIBOR + 4.00%), 10/2/25 | EUR | 266 | 247,423 |
| Term Loan, 7.504%, (1 mo. USD LIBOR + 3.75%), 10/2/25 | 3,426 | 3,301,117 | |
| Term Loan - Second Lien, 9.254%, (1 mo. USD LIBOR + 5.50%), 2/27/26 | 750 | 690,938 | |
| CDK Global, Inc., Term Loan, 8.112%, (SOFR + 4.50%), 7/6/29 | 2,050 | 2,011,278 | |
| CentralSquare Technologies, LLC, Term Loan, 7.424%, (3 mo. USD LIBOR + 3.75%), 8/29/25 | 794 | 691,628 | |
| Ceridian HCM Holding, Inc., Term Loan, 6.254%, (1 mo. USD LIBOR + 2.50%), 4/30/25 | 882 | 855,558 | |
| Cloudera, Inc.: | |||
| Term Loan, 7.504%, (1 mo. USD LIBOR + 3.75%), 10/8/28 | 2,332 | 2,180,771 | |
| Term Loan - Second Lien, 9.754%, (1 mo. USD LIBOR + 6.00%), 10/8/29 | 650 | 539,500 | |
| ConnectWise, LLC, Term Loan, 7.174%, (3 mo. USD LIBOR + 3.50%), 9/29/28 | 1,985 | 1,881,780 | |
| Constant Contact, Inc., Term Loan, 7.909%, (3 mo. USD LIBOR + 4.00%), 2/10/28 | 1,857 | 1,616,106 | |
| Cornerstone OnDemand, Inc., Term Loan, 7.504%, (1 mo. USD LIBOR + 3.75%), 10/16/28 | 1,144 | 961,170 | |
| Delta TopCo, Inc.: | |||
| Term Loan, 5.836%, (3 mo. USD LIBOR + 3.75%), 12/1/27 | 1,419 | 1,299,717 | |
| Term Loan - Second Lien, 10.332%, (3 mo. USD LIBOR + 7.25%), 12/1/28 | 2,025 | 1,746,562 | |
| E2open, LLC, Term Loan, 6.644%, (3 mo. USD LIBOR + 3.50%), 2/4/28 | 864 | 844,090 | |
| ECI Macola Max Holding, LLC, Term Loan, 7.424%, (3 mo. USD LIBOR + 3.75%), 11/9/27 | 1,278 | 1,239,238 | |
| Epicor Software Corporation: | |||
| Term Loan, 7.004%, (1 mo. USD LIBOR + 3.25%), 7/30/27 | 2,250 | 2,141,624 | |
| Term Loan - Second Lien, 11.504%, (1 mo. USD LIBOR + 7.75%), 7/31/28 | 850 | 837,250 | |
| Finastra USA, Inc.: | |||
| Term Loan, 6.871%, (3 mo. USD LIBOR + 3.50%), 6/13/24 | 4,644 | 4,218,052 | |
| Borrower/Description | Principal Amount* (000's omitted) | Value | |
| Software (continued) | |||
| Finastra USA, Inc.: (continued) | |||
| Term Loan - Second Lien, 10.621%, (1 week USD LIBOR + 7.25%), 6/13/25 | 1,000 | $ 747,500 | |
| GoTo Group, Inc., Term Loan, 8.322%, (1 mo. USD LIBOR + 4.75%), 8/31/27 | 1,842 | 1,188,211 | |
| Greeneden U.S. Holdings II, LLC, Term Loan, 7.754%, (1 mo. USD LIBOR + 4.00%), 12/1/27 | 2,316 | 2,264,164 | |
| Hyland Software, Inc., Term Loan - Second Lien, 10.004%, (1 mo. USD LIBOR + 6.25%), 7/7/25 | 3,630 | 3,489,337 | |
| Imperva, Inc., Term Loan, 6.921%, (3 mo. USD LIBOR + 4.00%), 1/12/26 | 2,316 | 1,873,261 | |
| Ivanti Software, Inc., Term Loan, 7.332%, (3 mo. USD LIBOR + 4.25%), 12/1/27 | 1,319 | 995,518 | |
| MA FinanceCo., LLC, Term Loan, 7.418%, (3 mo. USD LIBOR + 4.25%), 6/5/25 | 1,529 | 1,521,395 | |
| Magenta Buyer, LLC: | |||
| Term Loan, 9.17%, (3 mo. USD LIBOR + 4.75%), 7/27/28 | 4,232 | 3,712,479 | |
| Term Loan - Second Lien, 12.67%, (3 mo. USD LIBOR + 8.25%), 7/27/29 | 1,150 | 992,833 | |
| Marcel LUX IV S.a.r.l., Term Loan, 7.125%, (SOFR + 4.00%), 12/31/27 | 100 | 98,729 | |
| McAfee, LLC, Term Loan, 6.87%, (SOFR + 3.75%), 3/1/29 | 2,444 | 2,234,110 | |
| Mediaocean, LLC, Term Loan, 7.254%, (1 mo. USD LIBOR + 3.50%), 12/15/28 | 547 | 515,783 | |
| MH Sub I, LLC, Term Loan, 7.504%, (1 mo. USD LIBOR + 3.75%), 9/13/24 | 322 | 310,323 | |
| Mitnick Corporate Purchaser, Inc., Term Loan, 8.944%, (SOFR + 4.75%), 5/2/29 | 400 | 382,100 | |
| Panther Commercial Holdings, L.P., Term Loan, 8.665%, (3 mo. USD LIBOR + 4.25%), 1/7/28 | 889 | 805,435 | |
| Polaris Newco, LLC, Term Loan, 7.674%, (3 mo. USD LIBOR + 4.00%), 6/2/28 | 2,648 | 2,428,665 | |
| Proofpoint, Inc., Term Loan, 6.32%, (3 mo. USD LIBOR + 3.25%), 8/31/28 | 2,978 | 2,838,394 | |
| RealPage, Inc., Term Loan, 6.754%, (1 mo. USD LIBOR + 3.00%), 4/24/28 | 4,604 | 4,336,497 | |
| Redstone Holdco 2 L.P., Term Loan, 9.108%, (3 mo. USD LIBOR + 4.75%), 4/27/28 | 2,228 | 1,618,032 | |
| Sabre GLBL, Inc.: | |||
| Term Loan, 7.254%, (1 mo. USD LIBOR + 3.50%), 12/17/27 | 1,517 | 1,361,558 | |
| Term Loan, 7.254%, (1 mo. USD LIBOR + 3.50%), 12/17/27 | 952 | 854,145 | |
| Term Loan, 8.079%, (SOFR + 4.25%), 6/30/28 | 908 | 809,060 | |
| Seattle Spinco, Inc., Term Loan, 6.504%, (1 mo. USD LIBOR + 2.75%), 6/21/24 | 1,715 | 1,701,160 | |
| Borrower/Description | Principal Amount* (000's omitted) | Value | |
| Software (continued) | |||
| Sophia, L.P., Term Loan, 7.174%, (3 mo. USD LIBOR + 3.50%), 10/7/27 | 4,170 | $ 4,029,400 | |
| Sovos Compliance, LLC, Term Loan, 8.254%, (1 mo. USD LIBOR + 4.50%), 8/11/28 | 571 | 554,453 | |
| Sportradar Capital S.a.r.l., Term Loan, 4.948%, (1 mo. EURIBOR + 3.50%), 11/22/27 | EUR | 262 | 248,474 |
| SurveyMonkey, Inc., Term Loan, 7.51%, (1 mo. USD LIBOR + 3.75%), 10/10/25 | 884 | 857,916 | |
| Turing Midco, LLC, Term Loan, 6.504%, (1 mo. USD LIBOR + 2.75%), 3/23/28 | 240 | 236,699 | |
| Ultimate Software Group, Inc. (The): | |||
| Term Loan, 6.998%, (3 mo. USD LIBOR + 3.25%), 5/4/26 | 4,201 | 4,063,860 | |
| Term Loan, 7.504%, (1 mo. USD LIBOR + 3.75%), 5/4/26 | 1,550 | 1,509,875 | |
| Veritas US, Inc.: | |||
| Term Loan, 5.943%, (3 mo. EURIBOR + 4.75%), 9/1/25 | EUR | 318 | 238,412 |
| Term Loan, 8.674%, (3 mo. USD LIBOR + 5.00%), 9/1/25 | 2,173 | 1,739,967 | |
| Vision Solutions, Inc., Term Loan, 8.358%, (3 mo. USD LIBOR + 4.00%), 4/24/28 | 2,376 | 2,025,540 | |
| VS Buyer, LLC, Term Loan, 6.754%, (1 mo. USD LIBOR + 3.00%), 2/28/27 | 1,097 | 1,069,453 | |
| $ 91,578,858 | |||
| Specialty Retail — 4.6% | |||
| Belron Finance US, LLC, Term Loan, 5.375%, (3 mo. USD LIBOR + 2.50%), 4/13/28 | 911 | $ 898,170 | |
| Boels Topholding B.V., Term Loan, 3.25%, (3 mo. EURIBOR + 3.25%), 2/6/27 | EUR | 575 | 539,405 |
| Great Outdoors Group, LLC, Term Loan, 7.504%, (1 mo. USD LIBOR + 3.75%), 3/6/28 | 2,653 | 2,505,934 | |
| Harbor Freight Tools USA, Inc., Term Loan, 6.504%, (1 mo. USD LIBOR + 2.75%), 10/19/27 | 2,715 | 2,552,066 | |
| L1R HB Finance Limited: | |||
| Term Loan, 4.25%, (6 mo. EURIBOR + 4.25%), 9/2/24 | EUR | 400 | 297,368 |
| Term Loan, 7.217%, (SONIA + 5.25%), 9/2/24 | GBP | 400 | 346,223 |
| Les Schwab Tire Centers, Term Loan, 6.58%, (3 mo. USD LIBOR + 3.25%), 11/2/27 | 4,432 | 4,316,027 | |
| LIDS Holdings, Inc., Term Loan, 8.99%, (SOFR + 5.50%), 12/14/26 | 408 | 344,724 | |
| Mattress Firm, Inc., Term Loan, 8.433%, (3 mo. USD LIBOR + 4.25%), 9/25/28 | 1,913 | 1,643,592 | |
| PetSmart, Inc., Term Loan, 7.50%, (1 mo. USD LIBOR + 3.75%), 2/11/28 | 3,012 | 2,905,833 | |
| $ 16,349,342 | |||
| Borrower/Description | Principal Amount* (000's omitted) | Value | |
| Trading Companies & Distributors — 2.8% | |||
| DXP Enterprises, Inc., Term Loan, 8.504%, (1 mo. USD LIBOR + 4.75%), 12/16/27 | 614 | $ 587,006 | |
| Electro Rent Corporation, Term Loan, 9.278%, (3 mo. USD LIBOR + 5.00%), 1/31/24 | 1,567 | 1,479,306 | |
| Hillman Group, Inc. (The): | |||
| Term Loan, 3.034%, (1 mo. USD LIBOR + 2.75%), 7/14/28(13) | 76 | 72,695 | |
| Term Loan, 6.326%, (1 mo. USD LIBOR + 2.75%), 7/14/28 | 314 | 300,707 | |
| Park River Holdings, Inc., Term Loan, 6.993%, (3 mo. USD LIBOR + 3.25%), 12/28/27 | 665 | 566,564 | |
| Patagonia Bidco Limited: | |||
| Term Loan, 6.94%, (SONIA + 5.25%), 3/5/29 | GBP | 1,121 | 1,067,163 |
| Term Loan, 6.94%, (SONIA + 5.25%), 3/5/29 | GBP | 204 | 194,030 |
| Spin Holdco, Inc., Term Loan, 7.144%, (3 mo. USD LIBOR + 4.00%), 3/4/28 | 4,176 | 3,696,994 | |
| SRS Distribution, Inc.: | |||
| Term Loan, 7.254%, (1 mo. USD LIBOR + 3.50%), 6/2/28 | 1,086 | 1,011,796 | |
| Term Loan, 7.329%, (SOFR + 3.50%), 6/2/28 | 323 | 300,386 | |
| TricorBraun Holdings, Inc., Term Loan, 7.004%, (1 mo. USD LIBOR + 3.25%), 3/3/28 | 741 | 704,310 | |
| $ 9,980,957 | |||
| Transportation Infrastructure — 0.4% | |||
| KKR Apple Bidco, LLC, Term Loan, 6.504%, (1 mo. USD LIBOR + 2.75%), 9/23/28 | 1,638 | $ 1,591,737 | |
| $ 1,591,737 | |||
| Wireless Telecommunication Services — 0.4% | |||
| CCI Buyer, Inc., Term Loan, 7.553%, (SOFR + 4.00%), 12/17/27 | 372 | $ 357,822 | |
| Digicel International Finance Limited, Term Loan, 7.004%, (1 mo. USD LIBOR + 3.25%), 5/28/24 | 1,425 | 1,226,702 | |
| $ 1,584,524 | |||
| Total Senior Floating-Rate Loans (identified cost $531,003,289) | $ 488,249,457 | ||
| Warrants — 0.0% |
| Security | Shares | Value | |
| Leisure Goods/Activities/Movies — 0.0% | |||
| Cineworld Group PLC, Exp. 11/23/25(4)(5) | 139,907 | $ 0 | |
| $ 0 | |||
| Security | Shares | Value | |
| Retailers (Except Food and Drug) — 0.0% | |||
| David’s Bridal, LLC, Exp. 11/26/22(3)(4)(5) | 4,339 | $ 0 | |
| $ 0 | |||
| Total Warrants (identified cost $0) | $ 0 | ||
| Short-Term Investments — 0.4% |
| Security | Shares | Value | |
| Morgan Stanley Institutional Liquidity Funds - Government Portfolio, Institutional Class, 2.88%(14) | 1,352,933 | $ 1,352,933 | |
| Total Short-Term Investments (identified cost $1,352,933) | $ 1,352,933 | ||
| Total Investments — 154.0% (identified cost $607,373,644) | $ 551,962,411 | ||
| Less Unfunded Loan Commitments — (0.1)% | $ (458,376) | ||
| Net Investments — 153.9% (identified cost $606,915,268) | $ 551,504,035 | ||
| Other Assets, Less Liabilities — (32.7)% | $ (117,201,838) | ||
| Auction Preferred Shares Plus Cumulative Unpaid Dividends — (21.2)% | $ (75,897,558) | ||
| Net Assets Applicable to Common Shares — 100.0% | $ 358,404,639 | ||
| The percentage shown for each investment category in the Portfolio of Investments is based on net assets applicable to common shares. | |
| * | In U.S. dollars unless otherwise indicated. |
| (1) | Security exempt from registration under Rule 144A of the Securities Act of 1933, as amended. These securities may be sold in certain transactions in reliance on an exemption from registration (normally to qualified institutional buyers). At October 31, 2022, the aggregate value of these securities is $48,700,432 or 13.6% of the Trust's net assets applicable to common shares. |
| (2) | Variable rate security. The stated interest rate represents the rate in effect at October 31, 2022. |
| (3) | For fair value measurement disclosure purposes, security is categorized as Level 3 (see Note 11). |
| (4) | Non-income producing security. |
| (5) | Security was acquired in connection with a restructuring of a Senior Loan and may be subject to restrictions on resale. |
| (6) | Amount is less than 0.05%. |
| (7) | Restricted security (see Note 7). |
| (8) | Principal amount is less than $500. |
| (9) | Senior floating-rate loans (Senior Loans) often require prepayments from excess cash flows or permit the borrowers to repay at their election. The degree to which borrowers repay, whether as a contractual requirement or at their election, cannot be predicted with accuracy. As a result, the actual remaining maturity may be substantially less than the stated maturities shown. However, Senior Loans will typically have an expected average life of approximately two to four years. Senior Loans typically have rates of interest which are redetermined periodically by reference to a base lending rate, plus a spread. These base lending rates are primarily the London Interbank Offered Rate (“LIBOR”) or the Secured Overnight Financing Rate (“SOFR”) and secondarily, the prime rate offered by one or more major United States banks (the “Prime Rate”). Base lending rates may be subject to a floor, or minimum rate. Rates for SOFR are generally 1 or 3-month tenors and may also be subject to a credit spread adjustment. Senior Loans are generally subject to contractual restrictions that must be satisfied before they can be bought or sold. |
| (10) | The stated interest rate represents the weighted average interest rate at October 31, 2022 of contracts within the senior loan facility. Interest rates on contracts are primarily redetermined either weekly, monthly or quarterly by reference to the indicated base lending rate and spread and the reset period. |
| (11) | Issuer is in default with respect to interest and/or principal payments. |
| (12) | This Senior Loan will settle after October 31, 2022, at which time the interest rate will be determined. |
| (13) | Unfunded or partially unfunded loan commitments. The stated interest rate reflects the weighted average of the reference rate and spread for the funded portion, if any, and the commitment fees on the portion of the loan that is unfunded. At October 31, 2022, the total value of unfunded loan commitments is $374,017 (See Note 1F). |
| (14) | May be deemed to be an affiliated investment company. The rate shown is the annualized seven-day yield as of October 31, 2022. |
| Forward Foreign Currency Exchange Contracts (OTC) | |||||||
| Currency Purchased | Currency Sold | Counterparty | Settlement Date | Unrealized Appreciation | Unrealized (Depreciation) | ||
| USD | 8,454,660 | EUR | 8,613,275 | Standard Chartered Bank | 11/2/22 | $ — | $ (57,406) |
| USD | 8,530,881 | EUR | 8,613,274 | Standard Chartered Bank | 12/2/22 | 692 | — |
| USD | 1,321,734 | EUR | 1,354,357 | Bank of America, N.A. | 12/30/22 | — | (23,425) |
| USD | 1,322,035 | EUR | 1,354,357 | State Street Bank and Trust Company | 12/30/22 | — | (23,124) |
| USD | 1,660,389 | EUR | 1,701,204 | State Street Bank and Trust Company | 12/30/22 | — | (29,261) |
| USD | 1,314,885 | EUR | 1,354,357 | State Street Bank and Trust Company | 12/30/22 | — | (30,274) |
| USD | 1,983,304 | EUR | 2,031,536 | State Street Bank and Trust Company | 12/30/22 | — | (34,434) |
| USD | 1,196,222 | EUR | 1,189,788 | Bank of America, N.A. | 1/31/23 | 11,613 | — |
| USD | 748,853 | EUR | 743,617 | Bank of America, N.A. | 1/31/23 | 8,473 | — |
| USD | 748,156 | EUR | 743,617 | Bank of America, N.A. | 1/31/23 | 7,777 | — |
| USD | 749,711 | EUR | 743,618 | Standard Chartered Bank | 1/31/23 | 9,330 | — |
| USD | 1,298,791 | EUR | 1,290,139 | State Street Bank and Trust Company | 1/31/23 | 14,269 | — |
| USD | 1,197,920 | EUR | 1,189,788 | State Street Bank and Trust Company | 1/31/23 | 13,312 | — |
| USD | 1,197,157 | EUR | 1,189,788 | State Street Bank and Trust Company | 1/31/23 | 12,548 | — |
| USD | 1,196,104 | EUR | 1,189,788 | State Street Bank and Trust Company | 1/31/23 | 11,496 | — |
| USD | 748,123 | EUR | 743,617 | State Street Bank and Trust Company | 1/31/23 | 7,744 | — |
| USD | 1,383,071 | GBP | 1,190,466 | State Street Bank and Trust Company | 1/31/23 | 13,667 | — |
| USD | 1,049,458 | GBP | 904,453 | State Street Bank and Trust Company | 1/31/23 | 9,058 | — |
| $119,979 | $(197,924) | ||||||
| Abbreviations: | |
| DIP | – Debtor In Possession |
| EURIBOR | – Euro Interbank Offered Rate |
| LIBOR | – London Interbank Offered Rate |
| OTC | – Over-the-counter |
| PIK | – Payment In Kind |
| SOFR | – Secured Overnight Financing Rate |
| SONIA | – Sterling Overnight Interbank Average |
| Currency Abbreviations: | |
| EUR | – Euro |
| GBP | – British Pound Sterling |
| USD | – United States Dollar |
| October 31, 2022 | |
| Assets | |
| Unaffiliated investments, at value (identified cost $605,562,335) | $ 550,151,102 |
| Affiliated investment, at value (identified cost $1,352,933) | 1,352,933 |
| Cash | 4,991,831 |
| Deposits for derivatives collateral — forward foreign currency exchange contracts | 400,000 |
| Foreign currency, at value (identified cost $2,565,164) | 2,564,267 |
| Interest receivable | 3,067,548 |
| Dividends receivable from affiliated investment | 8,020 |
| Receivable for investments sold | 6,655,426 |
| Receivable for open forward foreign currency exchange contracts | 119,979 |
| Prepaid upfront fees on notes payable | 41,257 |
| Prepaid expenses | 8,479 |
| Total assets | $569,360,842 |
| Liabilities | |
| Notes payable | $ 133,000,000 |
| Cash collateral due to broker | 120,000 |
| Payable for investments purchased | 637,676 |
| Payable for open forward foreign currency exchange contracts | 197,924 |
| Payable to affiliate: | |
| Investment adviser fee | 361,221 |
| Trustees' fees | 3,681 |
| Accrued expenses | 738,143 |
| Total liabilities | $135,058,645 |
| Auction preferred shares (3,032 shares outstanding) at liquidation value plus cumulative unpaid dividends | $ 75,897,558 |
| Net assets applicable to common shares | $358,404,639 |
| Sources of Net Assets | |
| Common shares, $0.01 par value, unlimited number of shares authorized | $ 291,748 |
| Additional paid-in capital | 453,333,842 |
| Accumulated loss | (95,220,951) |
| Net assets applicable to common shares | $358,404,639 |
| Common Shares Issued and Outstanding | 29,174,848 |
| Net Asset Value Per Common Share | |
| Net assets ÷ common shares issued and outstanding | $ 12.28 |
| Year Ended | |
| October 31, 2022 | |
| Investment Income | |
| Dividend income | $ 676,904 |
| Dividend income from affiliated investments | 36,783 |
| Interest and other income | 34,490,763 |
| Total investment income | $ 35,204,450 |
| Expenses | |
| Investment adviser fee | $ 4,556,131 |
| Trustees’ fees and expenses | 37,806 |
| Custodian fee | 174,092 |
| Transfer and dividend disbursing agent fees | 18,405 |
| Legal and accounting services | 220,437 |
| Printing and postage | 134,194 |
| Interest expense and fees | 3,182,386 |
| Preferred shares service fee | 75,467 |
| Miscellaneous | 126,811 |
| Total expenses | $ 8,525,729 |
| Deduct: | |
| Waiver and/or reimbursement of expenses by affiliate | $ 3,138 |
| Total expense reductions | $ 3,138 |
| Net expenses | $ 8,522,591 |
| Net investment income | $ 26,681,859 |
| Realized and Unrealized Gain (Loss) | |
| Net realized gain (loss): | |
| Investment transactions | $ (5,128,934) |
| Investment transactions - affiliated investment | (486) |
| Foreign currency transactions | (590,938) |
| Forward foreign currency exchange contracts | 6,224,251 |
| Net realized gain | $ 503,893 |
| Change in unrealized appreciation (depreciation): | |
| Investments | $ (56,156,807) |
| Foreign currency | (66,759) |
| Forward foreign currency exchange contracts | (438,321) |
| Net change in unrealized appreciation (depreciation) | $(56,661,887) |
| Net realized and unrealized loss | $(56,157,994) |
| Distributions to preferred shareholders | $ (1,307,960) |
| Net decrease in net assets from operations | $(30,784,095) |
| Year Ended October 31, | ||
| 2022 | 2021 | |
| Increase (Decrease) in Net Assets | ||
| From operations: | ||
| Net investment income | $ 26,681,859 | $ 24,985,695 |
| Net realized gain (loss) | 503,893 | (7,200,996) |
| Net change in unrealized appreciation (depreciation) | (56,661,887) | 39,790,813 |
| Distributions to preferred shareholders | (1,307,960) | (99,970) |
| Net increase (decrease) in net assets from operations | $ (30,784,095) | $ 57,475,542 |
| Distributions to common shareholders | $ (25,476,811) | $ (27,741,383) |
| Tax return of capital to common shareholders | $ (2,906,292) | $ (1,879,642) |
| Capital share transactions: | ||
| Proceeds from shelf offering, net of offering costs (see Note 6) | $ 13,626,005 | $ 1,152,788 |
| Reinvestment of distributions to common shareholders | 356,912 | 201,513 |
| Cost of shares repurchased in tender offer (see Note 6) | — | (122,960,986) |
| Net increase (decrease) in net assets from capital share transactions | $ 13,982,917 | $(121,606,685) |
| Net decrease in net assets | $ (45,184,281) | $ (93,752,168) |
| Net Assets Applicable to Common Shares | ||
| At beginning of year | $ 403,588,920 | $ 497,341,088 |
| At end of year | $358,404,639 | $ 403,588,920 |
| Year Ended | |
| October 31, 2022 | |
| Cash Flows From Operating Activities | |
| Net decrease in net assets from operations | $ (30,784,095) |
| Distributions to preferred shareholders | 1,307,960 |
| Net decrease in net assets from operations excluding distributions to preferred shareholders | $ (29,476,135) |
| Adjustments to reconcile net decrease in net assets from operations to net cash used in operating activities: | |
| Investments purchased | (119,634,295) |
| Investments sold and principal repayments | 76,620,144 |
| Decrease in short-term investments, net | 9,114,674 |
| Net amortization/accretion of premium (discount) | (1,604,370) |
| Amortization of prepaid upfront fees on notes payable | 119,138 |
| Increase in interest and dividends receivable | (1,399,982) |
| Increase in dividends receivable from affiliated investment | (7,563) |
| Decrease in receivable for open forward foreign currency exchange contracts | 240,979 |
| Decrease in receivable from the transfer agent | 68,883 |
| Decrease in prepaid expenses | 1,932 |
| Increase in cash collateral due to brokers | 120,000 |
| Increase in payable for open forward foreign currency exchange contracts | 197,342 |
| Decrease in payable to affiliate for investment adviser fee | (605) |
| Increase in payable to affiliate for Trustees' fees | 328 |
| Increase in accrued expenses | 294,007 |
| Decrease in unfunded loan commitments | (1,170,482) |
| Net change in unrealized (appreciation) depreciation from investments | 56,156,807 |
| Net realized loss from investments | 5,129,420 |
| Net cash used in operating activities | $ (5,229,778) |
| Cash Flows From Financing Activities | |
| Cash distributions paid to common shareholders | $ (28,026,191) |
| Cash distributions paid to preferred shareholders | (1,212,363) |
| Proceeds from shelf offering, net of offering costs | 14,094,787 |
| Proceeds from notes payable | 54,000,000 |
| Repayments of notes payable | (41,000,000) |
| Payment of prepaid upfront fees on notes payable | (100,000) |
| Net cash used in financing activities | $ (2,243,767) |
| Net decrease in cash and restricted cash* | $ (7,473,545) |
| Cash at beginning of year (including foreign currency) | $ 15,429,643 |
| Cash and restricted cash at end of year (including foreign currency) | $ 7,956,098 |
| Supplemental disclosure of cash flow information: | |
| Noncash financing activities not included herein consist of: | |
| Reinvestment of dividends and distributions | $ 356,912 |
| Cash paid for interest and fees on borrowings | 2,482,489 |
| * | Includes net change in unrealized appreciation (depreciation) on foreign currency of $21,749. |
| October 31, 2022 | |
| Cash | $ 4,991,831 |
| Deposits for derivatives collateral — forward foreign currency exchange contracts | 400,000 |
| Foreign currency | 2,564,267 |
| Total cash and restricted cash as shown on the Statement of Cash Flows | $7,956,098 |
| Year Ended October 31, | |||||
| 2022 | 2021 | 2020 | 2019 | 2018 | |
| Net asset value — Beginning of year (Common shares) | $ 14.300 | $ 13.500 | $ 14.510 | $ 15.370 | $ 15.210 |
| Income (Loss) From Operations | |||||
| Net investment income(1) | $ 0.917 | $ 0.721 | $ 0.816 | $ 0.987 | $ 0.885 |
| Net realized and unrealized gain (loss) | (1.934) | 0.907 | (0.874) | (0.796) | 0.153 |
| Distributions to preferred shareholders: From net investment income(1) | (0.045) | (0.003) | (0.028) | (0.072) | (0.066) |
| Discount on redemption and repurchase of auction preferred shares(1) | — | — | — | — | 0.044 |
| Total income (loss) from operations | $ (1.062) | $ 1.625 | $ (0.086) | $ 0.119 | $ 1.016 |
| Less Distributions to Common Shareholders | |||||
| From net investment income | $ (0.875) | $ (0.806) | $ (0.924) | $ (0.979) | $ (0.856) |
| Tax return of capital | (0.100) | (0.056) | — | — | — |
| Total distributions to common shareholders | $ (0.975) | $ (0.862) | $ (0.924) | $ (0.979) | $ (0.856) |
| Premium from common shares sold through shelf offering (see Note 6)(1) | $ 0.017 | $ 0.001 | $ — | $ — | $ — |
| Discount on tender offer (see Note 6)(1) | $ — | $ 0.036 | $ — | $ — | $ — |
| Net asset value — End of year (Common shares) | $12.280 | $14.300 | $13.500 | $14.510 | $15.370 |
| Market value — End of year (Common shares) | $11.170 | $14.900 | $11.900 | $12.910 | $13.430 |
| Total Investment Return on Net Asset Value(2) | (7.26)% | 12.69% | 0.42% | 1.69% | 7.25% (3) |
| Total Investment Return on Market Value(2) | (19.10)% | 33.21% | (0.52)% | 3.55% | (2.04)% |
| Year Ended October 31, | |||||
| 2022 | 2021 | 2020 | 2019 | 2018 | |
| Ratios/Supplemental Data | |||||
| Net assets applicable to common shares, end of year (000’s omitted) | $358,405 | $403,589 | $497,341 | $534,714 | $566,490 |
| Ratios (as a percentage of average daily net assets applicable to common shares):(4)† | |||||
| Expenses excluding interest and fees | 1.37% | 1.33% | 1.32% | 1.28% | 1.31% |
| Interest and fee expense(5) | 0.81% | 0.46% | 0.78% | 1.40% | 1.06% |
| Total expenses | 2.18% (6) | 1.79% | 2.10% | 2.68% | 2.37% |
| Net investment income | 6.83% | 5.05% | 6.03% | 6.64% | 5.78% |
| Portfolio Turnover | 12% | 66% | 30% | 28% | 32% |
| Senior Securities: | |||||
| Total notes payable outstanding (in 000’s) | $133,000 | $120,000 | $223,000 | $218,000 | $222,000 |
| Asset coverage per $1,000 of notes payable(7) | $ 4,265 | $ 4,995 | $ 3,570 | $ 3,801 | $ 3,893 |
| Total preferred shares outstanding | 3,032 | 3,032 | 3,032 | 3,032 | 3,032 |
| Asset coverage per preferred share(8) | $ 67,924 | $ 76,531 | $ 66,612 | $ 70,501 | $ 72,558 |
| Involuntary liquidation preference per preferred share(9) | $ 25,000 | $ 25,000 | $ 25,000 | $ 25,000 | $ 25,000 |
| Approximate market value per preferred share(9) | $ 25,000 | $ 25,000 | $ 25,000 | $ 25,000 | $ 25,000 |
| (1) | Computed using average shares outstanding. |
| (2) | Returns are historical and are calculated by determining the percentage change in net asset value or market value with all distributions reinvested. Distributions are assumed to be reinvested at prices obtained under the Trust’s dividend reinvestment plan. |
| (3) | The total return based on net asset value reflects the impact of the tender and repurchase by the Trust of a portion of its APS at 92% of the per share liquidation preference. Absent this transaction, the total return based on net asset value would have been 6.94%. |
| (4) | Ratios do not reflect the effect of dividend payments to preferred shareholders. |
| (5) | Interest and fee expense relates to the notes payable incurred to partially redeem the Trust’s APS (see Note 9). |
| (6) | Includes a reduction by the investment adviser of a portion of its adviser fee due to the Trust's investment in the Liquidity Fund (equal to less than 0.005% of average daily net assets for the year ended October 31, 2022). |
| (7) | Calculated by subtracting the Trust’s total liabilities (not including the notes payable and preferred shares) from the Trust’s total assets, and dividing the result by the notes payable balance in thousands. |
| (8) | Calculated by subtracting the Trust's total liabilities (not including the notes payable and preferred shares) from the Trust's total assets, dividing the result by the sum of the values of the notes payable and liquidation value of the preferred shares, and multiplying the result by the liquidation value of one preferred share. Such amount equates to 272%, 306%, 266%, 282% and 290% at October 31, 2022, 2021, 2020, 2019 and 2018, respectively. |
| (9) | Plus accumulated and unpaid dividends. |
| † | Ratios based on net assets applicable to common shares plus preferred shares and borrowings are presented below. Ratios do not reflect the effect of dividend payments to preferred shareholders. |
| Year Ended October 31, | |||||
| 2022 | 2021 | 2020 | 2019 | 2018 | |
| Expenses excluding interest and fees | 0.88% | 0.87% | 0.84% | 0.82% | 0.85% |
| Interest and fee expense | 0.52% | 0.31% | 0.50% | 0.91% | 0.69% |
| Total expenses | 1.40% | 1.18% | 1.34% | 1.73% | 1.54% |
| Net investment income | 4.39% | 3.34% | 3.86% | 4.29% | 3.76% |
| APS Issued and Outstanding | |
| Series A | 739 |
| Series B | 763 |
| Series C | 738 |
| Series D | 792 |
| APS Dividend Rates at October 31, 2022 | Dividends Accrued to APS Shareholders | Average APS Dividend Rates | Dividend Rate Ranges (%) | |
| Series A | 5.34% | $331,847 | 1.80% | 0.08-5.39 |
| Series B | 5.34 | 342,626 | 1.80 | 0.08-5.39 |
| Series C | 5.21 | 300,240 | 1.63 | 0.08-5.21 |
| Series D | 5.39 | 333,247 | 1.68 | 0.08-5.39 |
| Year Ended October 31, | ||
| 2022 | 2021 | |
| Ordinary income | $26,784,771 | $27,841,353 |
| Tax return of capital | $ 2,906,292 | $ 1,879,642 |
| Deferred capital losses | $ (44,119,587) |
| Net unrealized depreciation | (51,101,364) |
| Accumulated loss | $(95,220,951) |
| Aggregate cost | $ 602,444,156 |
| Gross unrealized appreciation | $ 1,833,277 |
| Gross unrealized depreciation | (52,773,398) |
| Net unrealized depreciation | $ (50,940,121) |
| Description | Date(s) of Acquisition | Shares | Cost | Value |
| Common Stocks | ||||
| Nine Point Energy Holdings, Inc. | 7/15/14 | 758 | $ 34,721 | $ 0 |
| Total Common Stocks | $34,721 | $0 | ||
| Convertible Preferred Stocks | ||||
| Nine Point Energy Holdings, Inc., Series A, 12.00%, (PIK) | 5/26/17 | 14 | $ 14,000 | $ 0 |
| Total Convertible Preferred Stocks | $14,000 | $0 | ||
| Total Restricted Securities | $48,721 | $0 |
| Fair Value | ||
| Derivative | Asset Derivative(1) | Liability Derivative(2) |
| Forward foreign currency exchange contracts | $119,979 | $(197,924) |
| (1) | Statement of Assets and Liabilities location: Receivable for open forward foreign currency exchange contracts. |
| (2) | Statement of Assets and Liabilities location: Payable for open forward foreign currency exchange contracts. |
| Counterparty | Derivative Assets Subject to Master Netting Agreement | Derivatives Available for Offset | Non-cash Collateral Received(a) | Cash Collateral Received(a) | Net Amount of Derivative Assets(b) |
| Bank of America, N.A. | $ 27,863 | $ (23,425) | $ — | $ (4,438) | $ — |
| Standard Chartered Bank | 10,022 | (10,022) | — | — | — |
| State Street Bank and Trust Company | 82,094 | (82,094) | — | — | — |
| $119,979 | $(115,541) | $ — | $(4,438) | $ — |
| Counterparty | Derivative Liabilities Subject to Master Netting Agreement | Derivatives Available for Offset | Non-cash Collateral Pledged(a) | Cash Collateral Pledged(a) | Net Amount of Derivative Liabilities(c) |
| Bank of America, N.A. | $ (23,425) | $ 23,425 | $ — | $ — | $ — |
| Standard Chartered Bank | (57,406) | 10,022 | — | — | (47,384) |
| State Street Bank and Trust Company | (117,093) | 82,094 | — | 34,999 | — |
| $(197,924) | $115,541 | $ — | $34,999 | $(47,384) |
| (a) | In some instances, the total collateral received and/or pledged may be more than the amount shown due to overcollateralization. |
| (b) | Net amount represents the net amount due from the counterparty in the event of default. |
| (c) | Net amount represents the net amount payable to the counterparty in the event of default. |
| Derivative | Realized Gain (Loss) on Derivatives Recognized in Income(1) | Change in Unrealized Appreciation (Depreciation) on Derivatives Recognized in Income(2) |
| Forward foreign currency exchange contracts | $6,224,251 | $(438,321) |
| (1) | Statement of Operations location: Net realized gain (loss) - Forward foreign currency exchange contracts. |
| (2) | Statement of Operations location: Change in unrealized appreciation (depreciation) - Forward foreign currency exchange contracts. |
| Name | Value, beginning of period | Purchases | Sales proceeds | Net realized gain (loss) | Change in unrealized appreciation (depreciation) | Value, end of period | Dividend income | Units/Shares, end of period |
| Short-Term Investments | ||||||||
| Cash Reserves Fund | $10,468,093 | $98,905,088 | $(109,372,695) | $ (486) | $ — | $ — | $ 5,492 | — |
| Liquidity Fund | — | 76,963,114 | (75,610,181) | — | — | 1,352,933 | 31,291 | 1,352,933 |
| Total | $(486) | $ — | $1,352,933 | $36,783 | ||||
| • | Level 1 – quoted prices in active markets for identical investments |
| • | Level 2 – other significant observable inputs (including quoted prices for similar investments, interest rates, prepayment speeds, credit risk, etc.) |
| • | Level 3 – significant unobservable inputs (including a fund's own assumptions in determining the fair value of investments) |
| Asset Description | Level 1 | Level 2 | Level 3* | Total |
| Asset-Backed Securities | $ — | $ 25,921,716 | $ — | $ 25,921,716 |
| Closed-End Funds | 6,328,995 | — | — | 6,328,995 |
| Common Stocks | 803,604 | 1,583,213 | 812,645 | 3,199,462 |
| Convertible Preferred Stocks | — | 107 | 0 | 107 |
| Corporate Bonds | — | 26,909,741 | — | 26,909,741 |
| Senior Floating-Rate Loans (Less Unfunded Loan Commitments) | — | 487,403,444 | 387,637 | 487,791,081 |
| Warrants | — | 0 | 0 | 0 |
| Asset Description (continued) | Level 1 | Level 2 | Level 3* | Total |
| Short-Term Investments | $ 1,352,933 | $ — | $ — | $ 1,352,933 |
| Total Investments | $8,485,532 | $ 541,818,221 | $1,200,282 | $ 551,504,035 |
| Forward Foreign Currency Exchange Contracts | $ — | $ 119,979 | $ — | $ 119,979 |
| Total | $8,485,532 | $ 541,938,200 | $1,200,282 | $ 551,624,014 |
| Liability Description | ||||
| Forward Foreign Currency Exchange Contracts | $ — | $ (197,924) | $ — | $ (197,924) |
| Total | $ — | $ (197,924) | $ — | $ (197,924) |
| * | None of the unobservable inputs for Level 3 assets, individually or collectively, had a material impact on the Trust. |
Boston, Massachusetts
December 16, 2022
| Number of Shares | ||||
| Nominees for Trustee | For | Withheld | ||
| Cynthia E. Frost | 21,671,783 | 645,478 | ||
| Valerie A. Mosley | 21,577,876 | 739,385 | ||
| Scott E. Wennerholm | 21,704,506 | 612,755 | ||
| Nancy A. Wiser | 21,584,880 | 732,381 | ||
| Please print exact name on account | |
| Shareholder signature | Date |
| Shareholder signature | Date |
| Please sign exactly as your common shares are registered. All persons whose names appear on the share certificate must sign. | |
c/o American Stock Transfer & Trust Company, LLC
P.O. Box 922
Wall Street Station
New York, NY 10269-0560
| Name and Year of Birth | Trust Position(s) | Length of Service | Principal Occupation(s) and Other Directorships During Past Five Years and Other Relevant Experience |
| Interested Trustee | |||
| Thomas E. Faust Jr. 1958 | Class II Trustee | Until 2023. 3 years. Since 2007. | Chairman of Morgan Stanley Investment Management, Inc. (MSIM), member of the Board of Managers and President of EV (since 2021), Chief Executive Officer of EVM and BMR. Formerly, Chairman, Chief Executive Officer (2007-2021) and President (2006-2021) of EVC and Director of EVD (2007-2022). Mr. Faust is an interested person because of his positions with MSIM, BMR, EVM, and EV, which are affiliates of the Fund. Other Directorships. Formerly, Director of EVC (2007-2021) and Hexavest Inc. (investment management firm) (2012-2021). |
| Noninterested Trustees | |||
| Mark R. Fetting 1954 | Class II Trustee | Until 2023. 3 years. Since 2016. | Private investor. Formerly held various positions at Legg Mason, Inc. (investment management firm) (2000-2012), including President, Chief Executive Officer, Director and Chairman (2008-2012), Senior Executive Vice President (2004-2008) and Executive Vice President (2001-2004). Formerly, President of Legg Mason family of funds (2001-2008). Formerly, Division President and Senior Officer of Prudential Financial Group, Inc. and related companies (investment management firm) (1991-2000). Other Directorships. None. |
| Cynthia E. Frost 1961 | Class I Trustee | Until 2025. 3 years. Since 2014. | Private investor. Formerly, Chief Investment Officer of Brown University (university endowment) (2000-2012). Formerly, Portfolio Strategist for Duke Management Company (university endowment manager) (1995-2000). Formerly, Managing Director, Cambridge Associates (investment consulting company) (1989-1995). Formerly, Consultant, Bain and Company (management consulting firm) (1987-1989). Formerly, Senior Equity Analyst, BA Investment Management Company (1983-1985). Other Directorships. None. |
| George J. Gorman 1952 | Chairperson of the Board and Class II Trustee(1) | Until 2023. 3 years. Chairperson of the Board since 2021 and Trustee since 2014. | Principal at George J. Gorman LLC (consulting firm). Formerly, Senior Partner at Ernst & Young LLP (a registered public accounting firm) (1974-2009). Other Directorships. None. |
| Name and Year of Birth | Trust Position(s) | Length of Service | Principal Occupation(s) and Other Directorships During Past Five Years and Other Relevant Experience |
| Noninterested Trustees (continued) | |||
| Valerie A. Mosley 1960 | Class I Trustee | Until 2025. 3 years. Since 2014. | Chairwoman and Chief Executive Officer of Valmo Ventures (a consulting and investment firm). Founder of Upward Wealth, Inc., dba BrightUp, a fintech platform. Formerly, Partner and Senior Vice President, Portfolio Manager and Investment Strategist at Wellington Management Company, LLP (investment management firm) (1992-2012). Formerly, Chief Investment Officer, PG Corbin Asset Management (1990-1992). Formerly worked in institutional corporate bond sales at Kidder Peabody (1986-1990). Other Directorships. Director of DraftKings, Inc. (digital sports entertainment and gaming company) (since September 2020). Director of Envestnet, Inc. (provider of intelligent systems for wealth management and financial wellness) (since 2018). Formerly, Director of Dynex Capital, Inc. (mortgage REIT) (2013-2020) and Director of Groupon, Inc. (e-commerce provider) (2020-2022). |
| Keith Quinton 1958 | Class III Trustee | Until 2024. 3 years Since 2018. | Private investor, researcher and lecturer. Formerly, Independent Investment Committee Member at New Hampshire Retirement System (2017-2021). Formerly, Portfolio Manager and Senior Quantitative Analyst at Fidelity Investments (investment management firm) (2001-2014). Other Directorships. Formerly, Director (2016-2021) and Chairman (2019-2021) of New Hampshire Municipal Bond Bank. |
| Marcus L. Smith 1966 | Class III Trustee | Until 2024. 3 years. Since 2018. | Private investor and independent corporate director. Formerly, Chief Investment Officer, Canada (2012-2017), Chief Investment Officer, Asia (2010-2012), Director of Asian Research (2004-2010) and portfolio manager (2001-2017) at MFS Investment Management (investment management firm). Other Directorships. Director of First Industrial Realty Trust, Inc. (an industrial REIT) (since 2021). Director of MSCI Inc. (global provider of investment decision support tools) (since 2017). Formerly, Director of DCT Industrial Trust Inc. (logistics real estate company) (2017-2018). |
| Susan J. Sutherland 1957 | Class III Trustee | Until 2024. 3 years. Since 2015. | Private investor. Director of Ascot Group Limited and certain of its subsidiaries (insurance and reinsurance) (since 2017). Formerly, Director of Hagerty Holding Corp. (insurance) (2015-2018) and Montpelier Re Holdings Ltd. (insurance and reinsurance) (2013-2015). Formerly, Associate, Counsel and Partner at Skadden, Arps, Slate, Meagher & Flom LLP (law firm) (1982-2013). Other Directorships. Director of Kairos Acquisition Corp. (insurance/InsurTech acquisition company) (since 2021). |
| Scott E. Wennerholm 1959 | Class I Trustee | Until 2025. 3 years. Since 2016. | Private investor. Formerly, Trustee at Wheelock College (postsecondary institution) (2012-2018). Formerly, Consultant at GF Parish Group (executive recruiting firm) (2016-2017). Formerly, Chief Operating Officer and Executive Vice President at BNY Mellon Asset Management (investment management firm) (2005-2011). Formerly, Chief Operating Officer and Chief Financial Officer at Natixis Global Asset Management (investment management firm) (1997-2004). Formerly, Vice President at Fidelity Investments Institutional Services (investment management firm) (1994-1997). Other Directorships. None. |
| Nancy A. Wiser(2) 1967 | Class I Trustee | Until 2025. 3 years Since 2022. | Formerly, Executive Vice President and the Global Head of Operations at Wells Fargo Asset Management (2011-2021). Other Directorships. None. |
| Name and Year of Birth | Trust Position(s) | Length of Service | Principal Occupation(s) During Past Five Years |
| Principal Officers who are not Trustees | |||
| Edward J. Perkin 1972 | President | Since 2014 | Vice President and Chief Equity Investment Officer of EVM and BMR. Also Vice President of Calvert Research and Management (“CRM”). |
| Deidre E. Walsh 1971 | Vice President and Chief Legal Officer | Since 2009 | Vice President of EVM and BMR. Also Vice President of CRM. |
| James F. Kirchner 1967 | Treasurer | Since 2007 | Vice President of EVM and BMR. Also Vice President of CRM. |
| Name and Year of Birth | Trust Position(s) | Length of Service | Principal Occupation(s) During Past Five Years |
| Principal Officers who are not Trustees (continued) | |||
| Nicholas Di Lorenzo 1987 | Secretary | Since 2022 | Formerly, associate (2012-2021) and counsel (2022) at Dechert LLP. |
| Richard F. Froio 1968 | Chief Compliance Officer | Since 2017 | Vice President of EVM and BMR since 2017. Formerly, Deputy Chief Compliance Officer (Adviser/Funds) and Chief Compliance Officer (Distribution) at PIMCO (2012-2017) and Managing Director at BlackRock/Barclays Global Investors (2009-2012). |
| Privacy Notice | April 2021 |
| FACTS | WHAT DOES EATON VANCE DO WITH YOUR PERSONAL INFORMATION? |
| Why? | Financial companies choose how they share your personal information. Federal law gives consumers the right to limit some but not all sharing. Federal law also requires us to tell you how we collect, share, and protect your personal information. Please read this notice carefully to understand what we do. |
| What? | The types of personal information we collect and share depend on the product or service you have with us. This information can include:■ Social Security number and income ■ investment experience and risk tolerance ■ checking account number and wire transfer instructions |
| How? | All financial companies need to share customers’ personal information to run their everyday business. In the section below, we list the reasons financial companies can share their customers’ personal information; the reasons Eaton Vance chooses to share; and whether you can limit this sharing. |
| Reasons we can share your personal information | Does Eaton Vance share? | Can you limit this sharing? |
| For our everyday business purposes — such as to process your transactions, maintain your account(s), respond to court orders and legal investigations, or report to credit bureaus | Yes | No |
| For our marketing purposes — to offer our products and services to you | Yes | No |
| For joint marketing with other financial companies | No | We don’t share |
| For our investment management affiliates’ everyday business purposes — information about your transactions, experiences, and creditworthiness | Yes | Yes |
| For our affiliates’ everyday business purposes — information about your transactions and experiences | Yes | No |
| For our affiliates’ everyday business purposes — information about your creditworthiness | No | We don’t share |
| For our investment management affiliates to market to you | Yes | Yes |
| For our affiliates to market to you | No | We don’t share |
| For nonaffiliates to market to you | No | We don’t share |
| To limit our sharing | Call toll-free 1-800-262-1122 or email: EVPrivacy@eatonvance.comPlease note:If you are a new customer, we can begin sharing your information 30 days from the date we sent this notice. When you are no longer our customer, we continue to share your information as described in this notice. However, you can contact us at any time to limit our sharing. |
| Questions? | Call toll-free 1-800-262-1122 or email: EVPrivacy@eatonvance.com |
| Privacy Notice — continued | April 2021 |
| Who we are | |
| Who is providing this notice? | Eaton Vance Management, Eaton Vance Distributors, Inc., Eaton Vance Trust Company, Eaton Vance Management (International) Limited, Eaton Vance Advisers International Ltd., Eaton Vance Global Advisors Limited, Eaton Vance Management’s Real Estate Investment Group, Boston Management and Research, Calvert Research and Management, Eaton Vance and Calvert Fund Families and our investment advisory affiliates (“Eaton Vance”) (see Investment Management Affiliates definition below) |
| What we do | |
| How does Eaton Vance protect my personal information? | To protect your personal information from unauthorized access and use, we use security measures that comply with federal law. These measures include computer safeguards and secured files and buildings. We have policies governing the proper handling of customer information by personnel and requiring third parties that provide support to adhere to appropriate security standards with respect to such information. |
| How does Eaton Vance collect my personal information? | We collect your personal information, for example, when you■ open an account or make deposits or withdrawals from your account ■ buy securities from us or make a wire transfer ■ give us your contact informationWe also collect your personal information from others, such as credit bureaus, affiliates, or other companies. |
| Why can’t I limit all sharing? | Federal law gives you the right to limit only■ sharing for affiliates’ everyday business purposes — information about your creditworthiness ■ affiliates from using your information to market to you ■ sharing for nonaffiliates to market to youState laws and individual companies may give you additional rights to limit sharing. See below for more on your rights under state law. |
| Definitions | |
| Investment Management Affiliates | Eaton Vance Investment Management Affiliates include registered investment advisers, registered broker- dealers, and registered and unregistered funds. Investment Management Affiliates does not include entities associated with Morgan Stanley Wealth Management, such as Morgan Stanley Smith Barney LLC and Morgan Stanley & Co. |
| Affiliates | Companies related by common ownership or control. They can be financial and nonfinancial companies.■ Our affiliates include companies with a Morgan Stanley name and financial companies such as Morgan Stanley Smith Barney LLC and Morgan Stanley & Co. |
| Nonaffiliates | Companies not related by common ownership or control. They can be financial and nonfinancial companies.■ Eaton Vance does not share with nonaffiliates so they can market to you. |
| Joint marketing | A formal agreement between nonaffiliated financial companies that together market financial products or services to you.■ Eaton Vance doesn’t jointly market. |
| Other important information | |
| Vermont: Except as permitted by law, we will not share personal information we collect about Vermont residents with Nonaffiliates unless you provide us with your written consent to share such information.California: Except as permitted by law, we will not share personal information we collect about California residents with Nonaffiliates and we will limit sharing such personal information with our Affiliates to comply with California privacy laws that apply to us. | |
Two International Place
Boston, MA 02110
State Street Financial Center, One Lincoln Street
Boston, MA 02111
6201 15th Avenue
Brooklyn, NY 11219
200 Berkeley Street
Boston, MA 02116-5022
Boston, MA 02110
Item 2. Code of Ethics
The registrant (sometimes referred to as the “Fund”) has adopted a code of ethics applicable to its Principal Executive Officer, Principal Financial Officer and Principal Accounting Officer. The registrant undertakes to provide a copy of such code of ethics to any person upon request, without charge, by calling 1-800-262-1122. The registrant has not amended the code of ethics as described in Form N-CSR during the period covered by this report. The registrant has not granted any waiver, including an implicit waiver, from a provision of the code of ethics as described in Form N-CSR during the period covered by this report.
Item 3. Audit Committee Financial Expert
The registrant’s Board of Trustees (the “Board”) has designated George J. Gorman and Scott E. Wennerholm, each an independent trustee, as audit committee financial experts. Mr. Gorman is a certified public accountant who is the Principal at George J. Gorman LLC (a consulting firm). Previously, Mr. Gorman served in various capacities at Ernst & Young LLP (a registered public accounting firm), including as Senior Partner. Mr. Gorman also has experience serving as an independent trustee and audit committee financial expert of other mutual fund complexes. Mr. Wennerholm is a private investor. Previously, Mr. Wennerholm served as a Trustee at Wheelock College (postsecondary institution), as a Consultant at GF Parish Group (executive recruiting firm), Chief Operating Officer and Executive Vice President at BNY Mellon Asset Management (investment management firm), Chief Operating Officer and Chief Financial Officer at Natixis Global Asset Management (investment management firm), and Vice President at Fidelity Investments Institutional Services (investment management firm).
Item 4. Principal Accountant Fees and Services
(a)-(d)
The following table presents the aggregate fees billed to the registrant for the registrant’s fiscal years ended October 31, 2021 and October 31, 2022 by the registrant’s principal accountant, Deloitte & Touche LLP (“D&T”), for professional services rendered for the audit of the registrant’s annual financial statements and fees billed for other services rendered by D&T during such periods.
Fiscal Years Ended | 10/31/21 | 10/31/22 | ||||||
Audit Fees | $ | 96,894 | $ | 93,650 | ||||
Audit-Related Fees(1) | $ | 0 | $ | 0 | ||||
Tax Fees(2) | $ | 13,991 | $ | 350 | ||||
All Other Fees(3) | $ | 0 | $ | 0 | ||||
|
|
|
| |||||
Total | $ | 110,885 | $ | 94,000 | ||||
|
|
|
| |||||
| (1) | Audit-related fees consist of the aggregate fees billed for assurance and related services that are reasonably related to the performance of the audit of the registrant’s financial statements and are not reported under the category of audit fees and specifically include fees for the performance of certain agreed-upon procedures relating to the registrant’s auction preferred shares. |
| (2) | Tax fees consist of the aggregate fees billed for professional services rendered by the principal accountant relating to tax compliance, tax advice, and tax planning and specifically include fees for tax return preparation and other related tax compliance/planning matters. |
| (3) | All other fees consist of the aggregate fees billed for products and services provided by the registrant’s principal accountant other than audit, audit-related, and tax services. |
(e)(1) The registrant’s audit committee has adopted policies and procedures relating to the pre-approval of services provided by the registrant’s principal accountant (the “Pre-Approval Policies”). The Pre-Approval Policies establish a framework intended to assist the audit committee in the proper discharge of its pre-approval responsibilities. As a general matter, the Pre-Approval Policies (i) specify certain types of audit, audit-related, tax, and other services determined to be pre-approved by the audit committee; and (ii) delineate specific procedures governing the mechanics of the pre-approval process, including the approval and monitoring of audit and non-audit service fees. Unless a service is specifically pre-approved under the Pre-Approval Policies, it must be separately pre-approved by the Audit Committee.
The Pre-Approval Policies and the types of audit and non-audit services pre-approved therein must be reviewed and ratified by the registrant’s audit committee at least annually. The registrant’s audit committee maintains full responsibility for the appointment, compensation, and oversight of the work of the registrant’s principal accountant.
(e)(2) No services described in paragraphs (b)-(d) above were approved by the registrant’s audit committee pursuant to the “de minimis exception” set forth in Rule 2-01 (c)(7)(i)(C) of Regulation S-X.
(f) Not applicable.
(g) The following table presents (i) the aggregate non-audit fees (i.e., fees for audit-related, tax, and other services) billed to the registrant by D&T for the registrant’s fiscal years ended October 31, 2021 and October 31, 2022; and (ii) the aggregate non-audit fees (i.e., fees for audit-related, tax, and other services) billed to the Eaton Vance organization by D&T for the same time periods.
Fiscal Years Ended | 10/31/21 | 10/31/22 | ||||||
Registrant | $ | 13,991 | $ | 350 | ||||
Eaton Vance(1) | $ | 51,800 | $ | 52,836 | ||||
| (1) | Certain subsidiaries of Morgan Stanley provide ongoing services to the registrant. |
(h) The registrant’s audit committee has considered whether the provision by the registrant’s principal accountant of non-audit services to the registrant’s investment adviser and any entity controlling, controlled by, or under common control with the adviser that provides ongoing services to the registrant that were not pre-approved pursuant to Rule 2-01(c)(7)(ii) of Regulation S-X is compatible with maintaining the principal accountant’s independence.
Item 5. Audit Committee of Listed Registrants
The registrant has a separately-designated standing audit committee established in accordance with Section 3(a)(58)(A) of the Securities and Exchange Act of 1934, as amended. George J. Gorman, Keith Quinton, Scott E. Wennerholm (Chair), and Nancy A. Wiser are the members of the registrant’s audit committee.
Item 6. Schedule of Investments
Please see schedule of investments contained in the Report to Stockholders included under Item 1 of this Form N-CSR.
Item 7. Disclosure of Proxy Voting Policies and Procedures for Closed-End Management Investment Companies
The Board of the Fund has adopted a proxy voting policy and procedure (the “Fund Policy”), pursuant to which the trustees have delegated proxy voting responsibility to the Fund’s investment adviser and adopted the investment adviser’s proxy voting policies and procedures (the “Policies”) which are described below. The trustees will review the Policies annually. In the event that a conflict of interest arises between the Fund’s shareholders and the investment adviser, the administrator, or any of their affiliates or any affiliate of the Fund, the investment adviser will generally refrain from voting the proxies related to the companies giving rise to such conflict until it consults with the Board, or any committee, sub-committee or group of independent trustees identified by the Board, which will instruct the investment adviser on the appropriate course of action. If the Board Members are unable to meet and the failure to vote a proxy would have a material adverse impact on the Fund, the investment adviser may vote such proxy, provided that it discloses the existence of the material conflict to the Chairperson of the Fund’s Board as soon as practicable and to the Board at its next meeting.
The Policies are designed to promote accountability of a company’s management to its shareholders and to align the interests of management with those shareholders. An independent proxy voting service (“Agent”), currently Institutional Shareholder Services, Inc., has been retained to assist in the voting of proxies through the provision of vote analysis, implementation and recordkeeping and disclosure services. The investment adviser will generally vote proxies through the Agent. The Agent is required to vote all proxies in accordance with customized proxy voting guidelines (the “Guidelines”) and/or refer them back to the investment adviser pursuant to the Policies.
The Agent is required to establish and maintain adequate internal controls and policies in connection with the provision of proxy voting services, including methods to reasonably ensure that its analysis and recommendations are not influenced by a conflict of interest. The Guidelines include voting guidelines for matters relating to, among other things, the election of directors, approval of independent auditors, executive compensation, corporate structure and anti-takeover defenses. The investment adviser may cause the Fund to abstain from voting from time to time where it determines that the costs associated with voting a proxy outweigh the benefits derived from exercising the right to vote or it is unable to access or access timely ballots or other proxy information, among other stated reasons. The Agent will refer Fund proxies to the investment adviser for instructions under circumstances where, among others: (1) the application of the Guidelines is unclear; (2) a particular proxy question is not covered by the Guidelines; or (3) the Guidelines require input from the investment adviser. When a proxy voting issue has been referred to the investment adviser, the analyst (or portfolio manager if applicable) covering the company subject to the proxy proposal determines the final vote (or decision not to vote) and the investment adviser’s Proxy Administrator (described below) instructs the Agent to vote accordingly for securities held by the Fund. Where more than one analyst covers a particular company and the recommendations of such analysts voting a proposal conflict, the investment adviser’s Global Proxy Group (described below) will review such recommendations and any other available information related to the proposal and determine the manner in which it should be voted, which may result in different recommendations for the Fund that may differ from other clients of the investment adviser.
The investment adviser has appointed a Proxy Administrator to assist in the coordination of the voting of client proxies (including the Fund’s) in accordance with the Guidelines and the Policies. The investment adviser and its affiliates have also established a Global Proxy Group. The Global Proxy Group develops the investment adviser’s positions on all major corporate issues, creates the Guidelines and oversees the proxy voting process. The Proxy Administrator maintains a record of all proxy questions that have been referred by the Agent, all applicable recommendations, analysis and research received and any resolution of the matter. Before instructing the Agent to vote contrary to the Guidelines or the recommendation of the Agent, the Proxy Administrator will provide the Global Proxy Group with the Agent’s recommendation for the proposal along with any other relevant materials, including the basis for the analyst’s recommendation. The Proxy Administrator will then instruct the Agent to vote the proxy in the manner determined by the Global Proxy Group. A similar process will be followed if the Agent has a conflict of interest with respect to a proxy. The investment adviser will report to the Fund’s Board any votes cast contrary to the Guidelines or Agent recommendations, as applicable, no less than annually.
The investment adviser’s Global Proxy Group is responsible for monitoring and resolving possible material conflicts with respect to proxy voting. Because the Guidelines are predetermined and designed to be in the best interests of shareholders, application of the Guidelines to vote client proxies should, in most cases, adequately address any possible conflict of interest. The investment adviser will monitor situations that may result in a conflict of interest between any of its clients and the investment adviser or any of its affiliates by maintaining a list of significant existing and prospective corporate clients. The Proxy Administrator will compare such list with the names of companies of which he or she has been referred a proxy statement (the “Proxy Companies”). If a company on the list is also a Proxy Company, the Proxy Administrator will report that fact to the Global Proxy Group. If the Proxy Administrator intends to instruct the Agent to vote in a manner inconsistent with the Guidelines, the Global Proxy Group will first determine, in consultation with legal counsel if necessary, whether a material conflict exists. If it is determined that a material conflict exists, the investment adviser will seek instruction on how the proxy should be voted from the Fund’s Board, or any committee or subcommittee identified by the Board. If a matter is referred to the Global Proxy Group, the decision made and basis for the decision will be documented by the Proxy Administrator and/or Global Proxy Group.
Information on how the Fund voted proxies relating to portfolio securities during the most recent 12 month period ended June 30 is available (1) without charge, upon request, by calling 1-800-262-1122, and (2) on the Securities and Exchange Commission’s website at http://www.sec.gov.
Item 8. Portfolio Managers of Closed-End Management Investment Companies
Eaton Vance Management (“EVM” or “Eaton Vance”) is the investment adviser of the Trust. Sarah A. Choi, Catherine C. McDermott, Daniel P. McElaney and Andrew N. Sveen comprise the investment team responsible for the overall and day-to-day management of the Trust’s investments.
Messrs. McElaney and Sveen and Ms. McDermott are Vice Presidents of EVM and have been portfolio managers of the Trust since March 2019. Ms. Choi is a Vice President of EVM and has been a portfolio manager of the Trust since July 2022. Messrs. McElaney and Sveen and Ms. McDermott have been employed by EVM for more than five years and manage other Eaton Vance funds. Ms. Choi has been employed by EVM since October 2019 and manages other Eaton Vance funds. Prior to joining EVM, Ms. Choi worked as a Senior Credit Analyst at Apex Credit Partners from 2014 to 2019. This information is provided as of the date of filing this report.
The following table shows, as of the Trust’s most recent fiscal year end, the number of accounts each portfolio manager managed in each of the listed categories and the total assets (in millions of dollars) in the accounts managed within each category. The table also shows the number of accounts with respect to which the advisory fee is based on the performance of the account, if any, and the total assets (in millions of dollars) in those accounts.
| Number of All Accounts | Total Assets of All Accounts | Number of Accounts Paying a Performance Fee | Total Assets of Accounts Paying a Performance Fee | |||||||||||||
Sarah A. Choi | ||||||||||||||||
Registered Investment Companies | 3 | $ | 1,328.4 | 0 | $ | 0 | ||||||||||
Other Pooled Investment Vehicles | 0 | $ | 0 | 0 | $ | 0 | ||||||||||
Other Accounts | 0 | $ | 0 | 0 | $ | 0 | ||||||||||
Catherine C. McDermott | ||||||||||||||||
Registered Investment Companies | 7 | $ | 3,802.1 | 0 | $ | 0 | ||||||||||
Other Pooled Investment Vehicles | 0 | $ | 0 | 0 | $ | 0 | ||||||||||
Other Accounts | 0 | $ | 0 | 0 | $ | 0 | ||||||||||
Daniel P. McElaney | ||||||||||||||||
Registered Investment Companies | 4 | $ | 1,328.5 | 0 | $ | 0 | ||||||||||
Other Pooled Investment Vehicles | 0 | $ | 0 | 0 | $ | 0 | ||||||||||
Other Accounts | 0 | $ | 0 | 0 | $ | 0 | ||||||||||
Andrew N. Sveen | ||||||||||||||||
Registered Investment Companies | 12 | $ | 36,179.8 | 0 | $ | 0 | ||||||||||
Other Pooled Investment Vehicles | 0 | $ | 0 | 0 | $ | 0 | ||||||||||
Other Accounts | 0 | $ | 0 | 0 | $ | 0 | ||||||||||
The following table shows the dollar range of Trust shares beneficially owned by each portfolio manager as of the Trust’s most recent fiscal year end.
Portfolio Manager | Dollar Range of Equity Securities Beneficially Owned in the Trust | |
Sarah A. Choi | None | |
Catherine C. McDermott | None | |
Daniel P. McElaney | None | |
Andrew N. Sveen | $100,001 - $500,000 |
Potential for Conflicts of Interest. It is possible that conflicts of interest may arise in connection with a portfolio manager’s management of the Fund’s investments on the one hand and the investments of other accounts for which a portfolio manager is responsible on the other. For example, a portfolio manager may have conflicts of interest in allocating management time, resources and investment opportunities among the Fund and other accounts he or she advises. In addition, due to differences in the investment strategies or restrictions between the Fund and the other accounts, the portfolio manager may take action with respect to another account that differs from the action taken with respect to the Fund. In some cases, another account managed by a portfolio manager may compensate the investment adviser based on the performance of the securities held by that account. The existence of such a performance based fee may create additional conflicts of interest for the portfolio manager in the allocation of management time, resources and investment opportunities. Whenever conflicts of interest arise, the portfolio manager will endeavor to exercise his or her discretion in a manner that he or she believes is equitable to all interested persons. EVM has adopted several policies and procedures designed to address these potential conflicts including a code of ethics and policies that govern the investment adviser’s trading practices, including among other things the aggregation and allocation of trades among clients, brokerage allocations, cross trades and best execution.
Compensation Structure for EVM
The compensation structure of Eaton Vance and its affiliates that are investment advisers (for purposes of this section “Eaton Vance”) is based on a total reward system of base salary and incentive compensation, which is paid either in the form of cash bonus, or for employees meeting the specified deferred compensation eligibility threshold, partially as a cash bonus and partially as mandatory deferred compensation. Deferred compensation granted to Eaton Vance employees are generally granted as a mix of deferred cash awards under the Investment Management Alignment Plan (IMAP) and equity-based awards in the form of stock units. The portion of incentive compensation granted in the form of a deferred compensation award and the terms of such awards are determined annually by the Compensation, Management Development and Succession Committee of the Board of Directors of Eaton Vance’s parent company, Morgan Stanley.
Base salary compensation. Generally, portfolio managers and research analysts receive base salary compensation based on the level of their position with the Adviser.
Incentive compensation. In addition to base compensation, portfolio managers and research analysts may receive discretionary year-end compensation. Incentive compensation may include:
| • | Cash bonus |
| • | Deferred compensation: |
| • | A mandatory program that defers a portion of incentive compensation into restricted stock units or other awards based on Morgan Stanley common stock or other plans that are subject to vesting and other conditions |
| • | IMAP is a cash-based deferred compensation plan designed to increase the alignment of participants’ interests with the interests of clients. For eligible employees, a portion of their deferred compensation is mandatorily deferred into IMAP on an annual basis. Awards granted under IMAP are notionally invested in referenced funds available pursuant to the plan, which are funds advised by MSIM and its affiliates including Eaton Vance. Portfolio managers are required to notionally invest a minimum of 40% of their account balance in the designated funds that they manage and are included in the IMAP notional investment fund menu. |
| • | Deferred compensation awards are typically subject to vesting over a multi-year period and are subject to cancellation through the payment date for competition, cause (i.e., any act or omission that constitutes a breach of obligation to the Funds, including failure to comply with internal compliance, |
ethics or risk management standards, and failure or refusal to perform duties satisfactorily, including supervisory and management duties), disclosure of proprietary information, and solicitation of employees or clients. Awards are also subject to clawback through the payment date if an employee’s act or omission (including with respect to direct supervisory responsibilities) causes a restatement of the firm’s consolidated financial results, constitutes a violation of the firm’s global risk management principles, policies and standards, or causes a loss of revenue associated with a position on which the employee was paid and the employee operated outside of internal control policies. |
Eaton Vance compensates employees based on principles of pay-for-performance, market competitiveness and risk management. Eligibility for, and the amount of any, discretionary compensation is subject to a multi-dimensional process. Specifically, consideration is given to one or more of the following factors, which can vary by portfolio management team and circumstances:
| • | Revenue and profitability of the business and/or each fund/account managed by the portfolio manager |
| • | Revenue and profitability of the firm |
| • | Return on equity and risk factors of both the business units and Morgan Stanley |
| • | Assets managed by the portfolio manager |
| • | External market conditions |
| • | New business development and business sustainability |
| • | Contribution to client objectives |
| • | Team, product and/or Eaton Vance performance |
| • | The pre-tax investment performance of the funds/accounts managed by the portfolio manager(1) (which may, in certain cases, be measured against the applicable benchmark(s) and/or peer group(s) over one, three and five-year periods),(2) provided that for funds that are tax-managed or otherwise have an objective of after-tax returns, performance net of taxes will be considered |
| • | Individual contribution and performance |
Further, the firm’s Global Incentive Compensation Discretion Policy requires compensation managers to consider only legitimate, business related factors when exercising discretion in determining variable incentive compensation, including adherence to Morgan Stanley’s core values, conduct, disciplinary actions in the current performance year, risk management and risk outcomes.
| (1) | Generally, this is total return performance, provided that consideration may also be given to relative risk-adjusted performance. |
| (2) | When a fund’s peer group as determined by Lipper or Morningstar is deemed by the relevant Eaton Vance Chief Investment Officer, or in the case of the sub-advised Funds, the Director of Product Development and Sub-Advised Funds, not to provide a fair comparison, performance may instead be evaluated primarily against a custom peer group or market. |
Item 9. Purchases of Equity Securities by Closed-End Management Investment Company and Affiliated Purchasers
No such purchases this period.
Item 10. Submission of Matters to a Vote of Security Holders
No material changes.
Item 11. Controls and Procedures
(a) It is the conclusion of the registrant’s principal executive officer and principal financial officer that the effectiveness of the registrant’s current disclosure controls and procedures (such disclosure controls and procedures having been evaluated within 90 days of the date of this filing) provide reasonable assurance that the information required to be disclosed by the registrant has been recorded, processed, summarized and reported within the time period specified in the Commission’s rules and forms and that the information required to be disclosed by the registrant has been accumulated and communicated to the registrant’s principal executive officer and principal financial officer in order to allow timely decisions regarding required disclosure.
(b) There have been no changes in the registrant’s internal controls over financial reporting during the period covered by this report that has materially affected, or is reasonably likely to materially affect, the registrant’s internal control over financial reporting.
Item 12. Disclosure of Securities Lending Activities for Closed-End Management Investment Companies
No activity to report for the registrant’s most recent fiscal year end.
Item 13. Exhibits
| (a)(1) | Registrant’s Code of Ethics – Not applicable (please see Item 2). | |
| (a)(2)(i) | Treasurer’s Section 302 certification. | |
| (a)(2)(ii) | President’s Section 302 certification. | |
| (b) | Combined Section 906 certification. | |
Signatures
Pursuant to the requirements of the Securities Exchange Act of 1934 and the Investment Company Act of 1940, the registrant has duly caused this report to be signed on its behalf by the undersigned, thereunto duly authorized.
Eaton Vance Senior Floating-Rate Trust
| By: | /s/ Eric A. Stein | |
| Eric A. Stein | ||
| President |
Date: December 22, 2022
Pursuant to the requirements of the Securities Exchange Act of 1934 and the Investment Company Act of 1940, this report has been signed below by the following persons on behalf of the registrant and in the capacities and on the dates indicated.
| By: | /s/ James F. Kirchner | |
| James F. Kirchner | ||
| Treasurer | ||
| Date: December 22, 2022 | ||
| By: | /s/ Eric A. Stein | |
| Eric A. Stein | ||
| President | ||
Date: December 22, 2022