Item 1. | Reports to Stockholders |

% Average Annual Total Returns 1,2 | Inception Date | Six Months | One Year | Five Years | Ten Years |
| Fund at NAV | 11/28/2003 | 7.64% | 14.25% | 5.35% | 5.65% |
| Fund at Market Price | — | 18.82 | 26.58 | 8.06 | 6.21 |
| Morningstar® LSTA® US Leveraged Loan Index SM | — | 6.05% | 11.97% | 5.26% | 4.59% |
% Premium/Discount to NAV 3 | |
| As of period end | 0.54% |
Distributions 4 | |
| Total Distributions per share for the period | $0.723 |
| Distribution Rate at NAV | 11.16 % |
| Distribution Rate at Market Price | 11.10 |
% Total Leverage 5 | |
| Auction Preferred Shares (APS) | 13.16% |
| Borrowings | 20.84 |
| Top 10 Issuers (% of total investments) 1 | |
| Asurion, LLC | 1.1% |
| Les Schwab Tire Centers | 0.8 |
| Cloud Software Group, Inc. | 0.8 |
| UKG Inc. | 0.8 |
| Focus Financial Partners, LLC | 0.8 |
| Virgin Media Bristol LLC | 0.7 |
| Sophia, L.P. | 0.7 |
| Banff Merger Sub Inc. | 0.7 |
| Aretec Group, Inc. | 0.7 |
| Endure Digital Inc. | 0.7 |
| Total | 7.8% |
| Top 10 Sectors (% of total investments) 1 | |
| Software | 12.8% |
| Health Care Providers & Services | 5.6 |
| Machinery | 5.5 |
| Chemicals | 5.1 |
| Hotels, Restaurants & Leisure | 4.3 |
| IT Services | 4.3 |
| Capital Markets | 4.2 |
| Professional Services | 3.9 |
| Commercial Services & Supplies | 3.4 |
| Specialty Retail | 3.3 |
| Total | 52.4% |
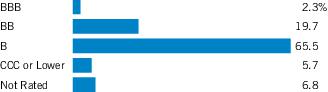
| Credit Quality (% of bonds, loans and asset-backed securities) 2 |
| 1 | Excludes cash and cash equivalents. |
| 2 | Credit ratings are categorized using S&P Global Ratings (“S&P”). Ratings, which are subject to change, apply to the creditworthiness of the issuers of the underlying securities and not to the Fund or its shares. Credit ratings measure the quality of a bond based on the issuer’s creditworthiness, with ratings ranging from AAA, being the highest, to D, being the lowest based on S&P’s measures. Ratings of BBB or higher by S&P are considered to be investment-grade quality. Credit ratings are based largely on the ratings agency’s analysis at the time of rating. The rating assigned to any particular security is not necessarily a reflection of the issuer’s current financial condition and does not necessarily reflect its assessment of the volatility of a security’s market value or of the liquidity of an investment in the security. Holdings designated as “Not Rated” (if any) are not rated by S&P. |
| 1 | Morningstar® LSTA® US Leveraged Loan Index SM is an unmanaged index of the institutional leveraged loan market. Morningstar® LSTA® Leveraged Loan indices are a product of Morningstar, Inc. (“Morningstar”) and have been licensed for use. Morningstar® is a registered trademark of Morningstar licensed for certain use. Loan Syndications and Trading Association® and LSTA® are trademarks of the LSTA licensed for certain use by Morningstar, and further sublicensed by Morningstar for certain use. Neither Morningstar nor LSTA guarantees the accuracy and/or completeness of the Morningstar® LSTA® US Leveraged Loan IndexSM or any data included therein, and shall have no liability for any errors, omissions, or interruptions therein. Unless otherwise stated, index returns do not reflect the effect of any applicable sales charges, commissions, expenses, taxes or leverage, as applicable. It is not possible to invest directly in an index. |
| 2 | Performance results reflect the effects of leverage. The Fund’s performance for certain periods reflects the effects of expense reductions. Absent these reductions, performance would have been lower. Included in the average annual total return at NAV for the ten year period is the impact of the tender and repurchase of a portion of the Fund’s APS at 95% of the Fund’s APS per share liquidation preference. Had these transactions not occurred, the total return at NAV would be lower for the Fund. |
| 3 | The shares of the Fund often trade at a discount or premium to their net asset value. The discount or premium may vary over time and may be higher or lower than what is quoted in this report. For up-to-date premium/discount information, please refer to https://funds.eatonvance.com/closed-end-fund-prices.php. |
| 4 | The Distribution Rate is based on the Fund’s last regular distribution per share in the period (annualized) divided by the Fund’s NAV or market price at the end of the period. The Fund’s distributions may be comprised of amounts characterized for federal income tax purposes as qualified and non-qualified ordinary dividends, capital gains and nondividend distributions, also known as return of capital. For additional information about nondividend distributions, please refer to Eaton Vance Closed-End Fund Distribution Notices (19a) posted on our website, eatonvance.com. The Fund will determine the federal income tax character of distributions paid to a shareholder after the end of the calendar year. This is reported on the IRS form 1099-DIV and provided to the shareholder shortly after each year-end. For information about the tax character of distributions made in prior calendar years, please refer to Performance-Tax Character of Distributions on the Fund’s webpage available at eatonvance.com. The Fund’s distributions are determined by the investment adviser based on its current assessment of the Fund’s long-term return potential. Fund distributions may be affected by numerous factors including changes in Fund performance, the cost of financing for leverage, portfolio holdings, realized and projected returns, and other factors. As portfolio and market conditions change, the rate of distributions paid by the Fund could change. |
| 5 | Leverage represents the liquidation value of the Fund’s APS and borrowings outstanding as a percentage of Fund net assets applicable to common shares plus APS and borrowings outstanding. Use of leverage creates an opportunity for income, but creates risks including greater price volatility. The cost of leverage rises and falls with |
| changes in short-term interest rates. The Fund may be required to maintain prescribed asset coverage for its leverage and may be required to reduce its leverage at an inopportune time. |
| Fund profile subject to change due to active management. | |
| Important Notice to Shareholders | |
| On January 26, 2023, the Fund's Board of Trustees voted to exempt, on a going forward basis, all prior and, until further notice, new acquisitions of Fund shares that otherwise might be deemed "Control Share Acquisitions" under the Fund's By-Laws from the Control Share Provisions of the Fund's By-Laws. |
| Asset-Backed Securities — 7.6% |
| Security | Principal Amount (000's omitted) | Value | |
| ARES XXXIIR CLO Ltd., Series 2014-32RA, Class D, 11.419%, (3 mo. SOFR + 6.112%), 5/15/30 (1)(2) | $ | 2,000 | $ 1,912,860 |
| ARES XXXIV CLO Ltd., Series 2015-2A, Class ER, 12.429%, (3 mo. SOFR + 7.112%), 4/17/33 (1)(2) | 1,150 | 1,137,459 | |
| Benefit Street Partners CLO XIX Ltd., Series 2019-19A, Class E, 12.61%, (3 mo. SOFR + 7.282%), 1/15/33 (1)(2) | 750 | 758,359 | |
| Benefit Street Partners CLO XVIII Ltd., Series 2019-18A, Class ER, 12.34%, (3 mo. SOFR + 7.012%), 10/15/34 (1)(2) | 1,000 | 1,010,566 | |
| Benefit Street Partners CLO XXII Ltd., Series 2020-22A, Class ER, 12.255%, (3 mo. SOFR + 6.93%), 4/20/35 (1)(2) | 1,000 | 1,003,100 | |
| BlueMountain CLO XXVI Ltd., Series 2019-26A, Class ER, 12.716%, (3 mo. SOFR + 7.392%), 10/20/34 (1)(2) | 1,500 | 1,473,017 | |
| Canyon Capital CLO Ltd.: | |||
| Series 2019-2A, Class ER, 12.34%, (3 mo. SOFR + 7.012%), 10/15/34 (1)(2) | 400 | 391,538 | |
| Series 2022-1A, Class E, 11.728%, (3 mo. SOFR + 6.40%), 4/15/35 (1)(2) | 1,250 | 1,220,471 | |
| Carlyle Global Market Strategies CLO Ltd.: | |||
| Series 2012-3A, Class DR2, 12.09%, (3 mo. SOFR + 6.762%), 1/14/32 (1)(2) | 1,200 | 1,183,860 | |
| Series 2015-5A, Class DR, 12.286%, (3 mo. SOFR + 6.962%), 1/20/32 (1)(2) | 500 | 490,014 | |
| Cedar Funding X CLO Ltd., Series 2019-10A, Class ER, 12.086%, (3 mo. SOFR + 6.762%), 10/20/32 (1)(2) | 1,000 | 997,461 | |
| Clover CLO Ltd., Series 2019-1A, Class ER, 12.027%, (3 mo. SOFR + 6.70%), 4/18/35 (1)(2) | 1,000 | 979,501 | |
| Galaxy XV CLO Ltd., Series 2013-15A, Class ER, 12.235%, (3 mo. SOFR + 6.907%), 10/15/30 (1)(2) | 1,000 | 996,512 | |
| Galaxy XXI CLO Ltd., Series 2015-21A, Class ER, 10.836%, (3 mo. SOFR + 5.512%), 4/20/31 (1)(2) | 1,000 | 990,423 | |
| Golub Capital Partners CLO 23M Ltd., Series 2015-23A, Class ER, 11.336%, (3 mo. SOFR + 6.012%), 1/20/31 (1)(2) | 1,200 | 1,205,570 | |
| Golub Capital Partners CLO 50B-R Ltd., Series 2020-50A, Class ER, 12.425%, (3 mo. SOFR + 7.10%), 4/20/35 (1)(2) | 1,000 | 1,002,918 | |
| Madison Park Funding XXXVI Ltd., Series 2019-36A, Class ER, 12.379%, (3 mo. SOFR + 7.05%), 4/15/35 (1)(2) | 1,000 | 1,003,404 | |
| Neuberger Berman Loan Advisers CLO Ltd., Series 2022-48A, Class E, 11.824%, (3 mo. SOFR + 6.50%), 4/25/36 (1)(2) | 1,000 | 1,002,757 | |
| Palmer Square CLO Ltd.: | |||
| Series 2013-2A, Class DRR, 11.429%, (3 mo. SOFR + 6.112%), 10/17/31 (1)(2) | 900 | 902,391 | |
| Security | Principal Amount (000's omitted) | Value | |
| Palmer Square CLO Ltd.: | |||
| Series 2014-1A, Class DR2, 11.279%, (3 mo. SOFR + 5.962%), 1/17/31 (1)(2) | $ | 1,500 | $ 1,503,665 |
| Series 2015-1A, Class DR4, 12.076%, (3 mo. SOFR + 6.762%), 5/21/34 (1)(2) | 500 | 501,303 | |
| Series 2019-1A, Class DR, 12.068%, (3 mo. SOFR + 6.762%), 11/14/34 (1)(2) | 1,000 | 1,004,898 | |
| RAD CLO 5 Ltd., Series 2019-5A, Class E, 12.285%, (3 mo. SOFR + 6.962%), 7/24/32 (1)(2) | 1,000 | 993,503 | |
| Regatta XIV Funding Ltd., Series 2018-3A, Class E, 11.535%, (3 mo. SOFR + 6.212%), 10/25/31 (1)(2) | 700 | 690,460 | |
| Regatta XVI Funding Ltd., Series 2019-2A, Class E, 12.59%, (3 mo. SOFR + 7.262%), 1/15/33 (1)(2) | 750 | 755,267 | |
| Vibrant CLO XI Ltd., Series 2019-11A, Class D, 12.356%, (3 mo. SOFR + 7.032%), 7/20/32 (1)(2) | 1,000 | 972,907 | |
| Voya CLO Ltd., Series 2013-1A, Class DR, 12.07%, (3 mo. SOFR + 6.742%), 10/15/30 (1)(2) | 2,000 | 1,795,460 | |
| Wellfleet CLO Ltd., Series 2020-1A, Class D, 12.83%, (3 mo. SOFR + 7.502%), 4/15/33 (1)(2) | 1,150 | 1,128,350 | |
| Total Asset-Backed Securities (identified cost $29,206,146) | $ 29,007,994 | ||
| Closed-End Funds — 1.9% |
| Security | Shares | Value | |
| BlackRock Floating Rate Income Strategies Fund, Inc. | 99,936 | $ 1,299,168 | |
| Invesco Senior Income Trust | 361,124 | 1,549,222 | |
| Nuveen Credit Strategies Income Fund | 365,228 | 2,016,059 | |
| Nuveen Floating Rate Income Fund | 249,983 | 2,149,854 | |
| Total Closed-End Funds (identified cost $8,822,712) | $ 7,014,303 | ||
| Common Stocks — 0.8% |
| Security | Shares | Value | |
| Aerospace and Defense — 0.0% | |||
| IAP Worldwide Services LLC (3)(4)(5) | 55 | $ 0 | |
| $ 0 | |||
| Chemicals — 0.0% | |||
| Flint Campfire Topco Ltd., Class A (3)(4)(5) | 196,320 | $ 0 | |
| $ 0 | |||
| Commercial Services & Supplies — 0.1% | |||
| Monitronics International, Inc. (4)(5) | 18,441 | $ 387,261 | |
| Security | Shares | Value | |
| Commercial Services & Supplies (continued) | |||
| Phoenix Services International LLC (4)(5) | 16,081 | $ 82,415 | |
| Phoenix Services International LLC (4)(5) | 1,467 | 7,519 | |
| $ 477,195 | |||
| Electronics/Electrical — 0.0% (6) | |||
| Skillsoft Corp. (4)(5) | 2,650 | $ 19,053 | |
| $ 19,053 | |||
| Entertainment — 0.1% | |||
| New Cineworld Ltd. (4)(5) | 14,009 | $ 268,798 | |
| $ 268,798 | |||
| Health Care — 0.1% | |||
| Envision Parent, Inc. (4)(5) | 44,965 | $ 317,565 | |
| $ 317,565 | |||
| Household Durables — 0.1% | |||
| Serta Simmons Bedding, Inc. (4)(5) | 74,131 | $ 525,092 | |
| Serta SSB Equipment Co. (3)(4)(5) | 74,131 | 0 | |
| $ 525,092 | |||
| Investment Companies — 0.0% (6) | |||
| Aegletes BV (4)(5) | 14,087 | $ 29,301 | |
| $ 29,301 | |||
| Pharmaceuticals — 0.4% | |||
| Covis Midco 1 SARL, Class A (4)(5) | 501 | $ 255 | |
| Covis Midco 1 SARL, Class B (4)(5) | 501 | 255 | |
| Covis Midco 1 SARL, Class C (4)(5) | 501 | 255 | |
| Covis Midco 1 SARL, Class D (4)(5) | 501 | 256 | |
| Covis Midco 1 SARL, Class E (4)(5) | 501 | 256 | |
| Mallinckrodt International Finance SA (4)(5) | 27,357 | 1,443,082 | |
| $ 1,444,359 | |||
| Retail — 0.0% | |||
| Jubilee Enterprise PCL, Class A1 (3)(4)(5) | 458 | $ 0 | |
| Jubilee Enterprise PCL, Class A2 (3)(4)(5) | 366,665 | 0 | |
| $ 0 | |||
| Retailers (Except Food and Drug) — 0.0% (6) | |||
| Phillips Feed Service, Inc. (3)(4)(5) | 556 | $ 796 | |
| $ 796 | |||
| Security | Shares | Value | |
| Telecommunications — 0.0% | |||
| GEE Acquisition Holdings Corp. (3)(4)(5) | 45,136 | $ 0 | |
| $ 0 | |||
| Total Common Stocks (identified cost $5,435,344) | $ 3,082,159 | ||
| Corporate Bonds — 6.2% |
| Security | Principal Amount (000's omitted) | Value | |
| Aerospace and Defense — 0.2% | |||
| Bombardier, Inc., 6.00%, 2/15/28 (1) | $ | 200 | $ 195,256 |
| TransDigm, Inc., 4.875%, 5/1/29 | 625 | 575,556 | |
| $ 770,812 | |||
| Automotive — 0.3% | |||
| Clarios Global LP/Clarios U.S. Finance Co., 8.50%, 5/15/27 (1) | $ | 1,000 | $ 1,003,193 |
| $ 1,003,193 | |||
| Building and Development — 0.3% | |||
| Smyrna Ready Mix Concrete LLC, 6.00%, 11/1/28 (1) | $ | 625 | $ 605,184 |
| Standard Industries, Inc., 4.75%, 1/15/28 (1) | 625 | 590,042 | |
| $ 1,195,226 | |||
| Business Equipment and Services — 0.4% | |||
| GEMS MENASA Cayman Ltd./GEMS Education Delaware LLC, 7.125%, 7/31/26 (1) | $ | 1,000 | $ 994,608 |
| Prime Security Services Borrower LLC/Prime Finance, Inc., 5.75%, 4/15/26 (1) | 700 | 691,822 | |
| $ 1,686,430 | |||
| Cable and Satellite Television — 0.1% | |||
| CCO Holdings LLC/CCO Holdings Capital Corp., 4.50%, 8/15/30 (1) | $ | 625 | $ 508,370 |
| $ 508,370 | |||
| Chemicals — 0.1% | |||
| Olympus Water U.S. Holding Corp., 9.75%, 11/15/28 (1) | $ | 209 | $ 222,035 |
| $ 222,035 | |||
| Security | Principal Amount (000's omitted) | Value | |
| Commercial Services — 0.1% | |||
| Mavis Tire Express Services Topco Corp., 6.50%, 5/15/29 (1) | $ | 489 | $ 453,499 |
| $ 453,499 | |||
| Cosmetics/Toiletries — 0.2% | |||
| Edgewell Personal Care Co., 5.50%, 6/1/28 (1) | $ | 625 | $ 603,744 |
| $ 603,744 | |||
| Distribution & Wholesale — 0.4% | |||
| BCPE Empire Holdings, Inc., 7.625%, 5/1/27 (1) | $ | 602 | $ 586,478 |
| Performance Food Group, Inc., 5.50%, 10/15/27 (1) | 1,000 | 968,905 | |
| $ 1,555,383 | |||
| Diversified Financial Services — 0.1% | |||
| VistaJet Malta Finance PLC/Vista Management Holding, Inc., 6.375%, 2/1/30 (1) | $ | 625 | $ 484,521 |
| $ 484,521 | |||
| Ecological Services and Equipment — 0.1% | |||
| GFL Environmental, Inc., 4.375%, 8/15/29 (1) | $ | 366 | $ 330,707 |
| $ 330,707 | |||
| Engineering & Construction — 0.2% | |||
| TopBuild Corp., 3.625%, 3/15/29 (1) | $ | 625 | $ 561,668 |
| $ 561,668 | |||
| Entertainment — 0.3% | |||
| Caesars Entertainment, Inc., 8.125%, 7/1/27 (1) | $ | 1,000 | $ 1,014,213 |
| $ 1,014,213 | |||
| Food Service — 0.1% | |||
| Albertsons Cos., Inc./Safeway, Inc./New Albertsons LP/Albertsons LLC, 3.50%, 3/15/29 (1) | $ | 625 | $ 552,095 |
| $ 552,095 | |||
| Health Care — 0.6% | |||
| LifePoint Health, Inc., 5.375%, 1/15/29 (1) | $ | 625 | $ 500,343 |
| Medline Borrower LP, 5.25%, 10/1/29 (1) | 241 | 224,572 | |
| Tenet Healthcare Corp., 6.875%, 11/15/31 | 1,000 | 1,031,582 | |
| U.S. Acute Care Solutions LLC, 6.375%, 3/1/26 (1) | 625 | 633,447 | |
| $ 2,389,944 | |||
| Security | Principal Amount (000's omitted) | Value | |
| Home Furnishings — 0.2% | |||
| Tempur Sealy International, Inc., 4.00%, 4/15/29 (1) | $ | 625 | $ 556,302 |
| $ 556,302 | |||
| Insurance — 0.3% | |||
| Alliant Holdings Intermediate LLC/Alliant Holdings Co-Issuer, 6.75%, 10/15/27 (1) | $ | 625 | $ 613,402 |
| AmWINS Group, Inc., 4.875%, 6/30/29 (1) | 600 | 545,983 | |
| $ 1,159,385 | |||
| Leisure Goods/Activities/Movies — 0.3% | |||
| NCL Corp. Ltd., 5.875%, 2/15/27 (1) | $ | 550 | $ 537,677 |
| Viking Cruises Ltd., 5.875%, 9/15/27 (1) | 625 | 606,469 | |
| $ 1,144,146 | |||
| Media — 0.0% (6) | |||
| Diamond Sports Group LLC/Diamond Sports Finance Co., 5.375%, 8/15/26 (1)(7) | $ | 0 (8) | $ 6 |
| iHeartCommunications, Inc., 6.375%, 5/1/26 | 208 | 175,659 | |
| $ 175,665 | |||
| Nonferrous Metals/Minerals — 0.1% | |||
| New Gold, Inc., 7.50%, 7/15/27 (1) | $ | 474 | $ 471,532 |
| $ 471,532 | |||
| Oil and Gas — 0.3% | |||
| Civitas Resources, Inc., 8.375%, 7/1/28 (1) | $ | 250 | $ 261,108 |
| Permian Resources Operating LLC, 5.375%, 1/15/26 (1) | 625 | 618,143 | |
| Vital Energy, Inc., 9.75%, 10/15/30 | 350 | 381,646 | |
| $ 1,260,897 | |||
| Pipelines — 0.1% | |||
| Venture Global LNG, Inc., 8.375%, 6/1/31 (1) | $ | 447 | $ 459,012 |
| $ 459,012 | |||
| Real Estate Investment Trusts (REITs) — 0.2% | |||
| HAT Holdings I LLC/HAT Holdings II LLC, 3.375%, 6/15/26 (1) | $ | 625 | $ 581,580 |
| $ 581,580 | |||
| Retail — 0.0% (6) | |||
| Evergreen AcqCo 1 LP/TVI, Inc., 9.75%, 4/26/28 (1) | $ | 49 | $ 51,954 |
| $ 51,954 | |||
| Security | Principal Amount (000's omitted) | Value | |
| Retailers (Except Food and Drug) — 0.2% | |||
| Dave & Buster's, Inc., 7.625%, 11/1/25 (1) | $ | 500 | $ 503,702 |
| PetSmart, Inc./PetSmart Finance Corp., 7.75%, 2/15/29 (1) | 355 | 337,791 | |
| $ 841,493 | |||
| Surface Transport — 0.1% | |||
| Hertz Corp., 4.625%, 12/1/26 (1) | $ | 252 | $ 195,450 |
| $ 195,450 | |||
| Technology — 0.2% | |||
| athenahealth Group, Inc., 6.50%, 2/15/30 (1) | $ | 625 | $ 563,236 |
| $ 563,236 | |||
| Telecommunications — 0.3% | |||
| Connect Finco SARL/Connect U.S. Finco LLC, 6.75%, 10/1/26 (1) | $ | 1,000 | $ 969,363 |
| $ 969,363 | |||
| Utilities — 0.3% | |||
| Calpine Corp., 5.00%, 2/1/31 (1) | $ | 505 | $ 458,153 |
| NRG Energy, Inc., 3.625%, 2/15/31 (1) | 1,000 | 847,562 | |
| $ 1,305,715 | |||
| Wireless Telecommunication Services — 0.1% | |||
| Digicel Intermediate Holdings Ltd./Digicel International Finance Ltd./DIFL U.S., 10.50%, (9.00% cash, 1.50% PIK), 5/25/27 (9) | $ | 550 | $ 534,072 |
| $ 534,072 | |||
| Total Corporate Bonds (identified cost $23,747,955) | $ 23,601,642 | ||
| Senior Floating-Rate Loans — 135.3% (10) |
| Borrower/Description | Principal Amount * (000's omitted) | Value | |
| Aerospace and Defense — 1.1% | |||
| Aernnova Aerospace SAU: | |||
| Term Loan, 6.902%, (6 mo. EURIBOR + 3.00%), 2/26/27 | EUR | 102 | $ 108,444 |
| Term Loan, 6.952%, (3 mo. EURIBOR + 3.00%), 2/26/27 | EUR | 398 | 422,933 |
| Dynasty Acquisition Co., Inc.: | |||
| Term Loan, 8.816%, (SOFR + 3.50%), 8/24/28 | 2,515 | 2,529,647 | |
| Term Loan, 8.816%, (SOFR + 3.50%), 8/24/28 | 970 | 975,367 | |
| Borrower/Description | Principal Amount * (000's omitted) | Value | |
| Aerospace and Defense (continued) | |||
| IAP Worldwide Services, Inc., Term Loan - Second Lien, 12.152%, (3 mo. USD LIBOR + 6.50%), 7/18/23 (3) | 391 | $ 310,307 | |
| $ 4,346,698 | |||
| Airlines — 0.8% | |||
| American Airlines, Inc., Term Loan, 10.336%, (SOFR + 4.75%), 4/20/28 | 2,420 | $ 2,520,236 | |
| Mileage Plus Holdings LLC, Term Loan, 10.733%, (SOFR + 5.25%), 6/21/27 | 488 | 500,873 | |
| $ 3,021,109 | |||
| Apparel & Luxury Goods — 0.9% | |||
| Gloves Buyer, Inc.: | |||
| Term Loan, 9.43%, (SOFR + 4.00%), 12/29/27 | 1,606 | $ 1,609,869 | |
| Term Loan, 10.43%, (SOFR + 5.00%), 12/29/27 | 620 | 621,863 | |
| Hanesbrands, Inc., Term Loan, 9.066%, (SOFR + 3.75%), 3/8/30 | 347 | 347,366 | |
| Touchdown Acquirer, Inc.: | |||
| Term Loan, 0.00%, 2/21/31 (11) | 175 | 175,984 | |
| Term Loan, 9.314%, (SOFR + 4.00%), 2/21/31 | 775 | 779,360 | |
| $ 3,534,442 | |||
| Auto Components — 3.6% | |||
| Adient U.S. LLC, Term Loan, 8.066%, (SOFR + 2.75%), 1/31/31 | 1,562 | $ 1,570,842 | |
| Autokiniton U.S. Holdings, Inc., Term Loan, 9.43%, (SOFR + 4.00%), 4/6/28 | 3,116 | 3,134,773 | |
| Clarios Global LP: | |||
| Term Loan, 7.098%, (1 mo. EURIBOR + 3.25%), 4/30/26 | EUR | 630 | 673,808 |
| Term Loan, 8.316%, (SOFR + 3.00%), 5/6/30 | 2,070 | 2,078,609 | |
| DexKo Global, Inc.: | |||
| Term Loan, 7.902%, (3 mo. EURIBOR + 4.00%), 10/4/28 | EUR | 240 | 253,186 |
| Term Loan, 7.902%, (3 mo. EURIBOR + 4.00%), 10/4/28 | EUR | 535 | 565,210 |
| Term Loan, 9.321%, (SOFR + 3.75%), 10/4/28 | 686 | 682,025 | |
| Garrett LX I SARL, Term Loan, 8.841%, (SOFR + 3.25%), 4/30/28 | 707 | 708,863 | |
| Garrett Motion, Inc., Term Loan, 9.83%, (SOFR + 4.50%), 4/30/28 | 543 | 545,571 | |
| LSF12 Badger Bidco LLC, Term Loan, 11.316%, (SOFR + 6.00%), 8/30/30 | 299 | 301,120 | |
| LTI Holdings, Inc., Term Loan, 10.18%, (SOFR + 4.75%), 7/24/26 | 537 | 531,695 | |
| Borrower/Description | Principal Amount * (000's omitted) | Value | |
| Auto Components (continued) | |||
| RealTruck Group, Inc.: | |||
| Term Loan, 8.93%, (SOFR + 3.50%), 1/31/28 | 1,805 | $ 1,794,233 | |
| Term Loan, 10.43%, (SOFR + 5.00%), 1/31/28 | 675 | 673,031 | |
| $ 13,512,966 | |||
| Automobiles — 0.5% | |||
| MajorDrive Holdings IV LLC: | |||
| Term Loan, 9.571%, (SOFR + 4.00%), 6/1/28 | 608 | $ 611,231 | |
| Term Loan, 10.959%, (SOFR + 5.50%), 6/1/29 | 1,446 | 1,457,245 | |
| $ 2,068,476 | |||
| Beverages — 1.3% | |||
| Arterra Wines Canada, Inc., Term Loan, 9.071%, (SOFR + 3.50%), 11/24/27 | 968 | $ 891,234 | |
| City Brewing Co. LLC: | |||
| Term Loan, 9.09%, (SOFR + 3.50%), 4/5/28 | 572 | 526,165 | |
| Term Loan, 11.574%, (SOFR + 6.25%), 4/5/28 | 185 | 184,937 | |
| Term Loan - Second Lien, 10.59%, (SOFR + 5.00%), 9.09% cash, 1.50% PIK, 4/5/28 | 1,072 | 782,501 | |
| Triton Water Holdings, Inc., Term Loan, 8.814%, (SOFR + 3.25%), 3/31/28 | 2,383 | 2,375,186 | |
| $ 4,760,023 | |||
| Biotechnology — 0.2% | |||
| Alkermes, Inc., Term Loan, 7.93%, (SOFR + 2.50%), 3/12/26 | 336 | $ 337,695 | |
| Alltech, Inc., Term Loan, 9.43%, (SOFR + 4.00%), 10/13/28 | 391 | 389,045 | |
| $ 726,740 | |||
| Building Products — 2.4% | |||
| Cornerstone Building Brands, Inc., Term Loan, 8.671%, (SOFR + 3.25%), 4/12/28 | 2,772 | $ 2,722,143 | |
| LHS Borrower LLC, Term Loan, 10.166%, (SOFR + 4.75%), 2/16/29 | 998 | 965,211 | |
| MI Windows and Doors LLC, Term Loan, 8.816%, (SOFR + 3.50%), 3/28/31 | 2,275 | 2,288,082 | |
| Oscar AcquisitionCo LLC, Term Loan, 9.902%, (SOFR + 4.50%), 4/29/29 | 2,288 | 2,300,076 | |
| Standard Industries, Inc., Term Loan, 7.68%, (SOFR + 2.25%), 9/22/28 | 911 | 914,456 | |
| $ 9,189,968 | |||
| Capital Markets — 6.4% | |||
| Advisor Group, Inc.: | |||
| Term Loan, 9.816%, (SOFR + 4.50%), 8/17/28 | 2,163 | $ 2,177,316 | |
| Borrower/Description | Principal Amount * (000's omitted) | Value | |
| Capital Markets (continued) | |||
| Advisor Group, Inc.: | |||
| Term Loan, 8/17/28 (12) | 750 | $ 754,553 | |
| AllSpring Buyer LLC, Term Loan, 8.677%, (SOFR + 3.25%), 11/1/28 | 1,326 | 1,323,556 | |
| Aretec Group, Inc., Term Loan, 9.916%, (SOFR + 4.50%), 8/9/30 | 3,926 | 3,949,699 | |
| Citco Funding LLC, Term Loan, 8.422%, (SOFR + 3.25%), 4/27/28 | 771 | 774,820 | |
| Edelman Financial Center LLC, Term Loan, 8.93%, (SOFR + 3.50%), 4/7/28 | 2,434 | 2,437,618 | |
| EIG Management Co. LLC, Term Loan, 9.166%, (SOFR + 3.75%), 2/22/25 | 235 | 234,853 | |
| FinCo I LLC, Term Loan, 8.33%, (SOFR + 3.00%), 6/27/29 | 1,216 | 1,220,751 | |
| Focus Financial Partners LLC: | |||
| Term Loan, 7.816%, (SOFR + 2.50%), 6/30/28 | 2,919 | 2,919,073 | |
| Term Loan, 8.066%, (SOFR + 2.75%), 6/30/28 | 1,416 | 1,417,364 | |
| Franklin Square Holdings LP, Term Loan, 7.568%, (SOFR + 2.25%), 4/25/31 | 1,025 | 1,025,641 | |
| HighTower Holdings LLC, Term Loan, 9.586%, (SOFR + 4.00%), 4/21/28 | 2,248 | 2,262,332 | |
| Kestra Advisor Services Holdings A, Inc., Term Loan, 9.316%, (SOFR + 4.00%), 3/22/31 | 1,400 | 1,408,532 | |
| Mariner Wealth Advisors LLC, Term Loan, 8.68%, (SOFR + 3.25%), 8/18/28 | 1,635 | 1,637,381 | |
| Press Ganey Holdings, Inc., Term Loan, 4/24/31 (12) | 650 | 648,781 | |
| $ 24,192,270 | |||
| Chemicals — 7.8% | |||
| Aruba Investments Holdings LLC: | |||
| Term Loan, 7.848%, (1 mo. EURIBOR + 4.00%), 11/24/27 | EUR | 485 | $ 494,139 |
| Term Loan, 9.416%, (SOFR + 4.00%), 11/24/27 | 1,444 | 1,407,751 | |
| Axalta Coating Systems U.S. Holdings, Inc., Term Loan, 7.33%, (SOFR + 2.00%), 12/20/29 | 1,747 | 1,753,902 | |
| Charter NEX U.S., Inc., Term Loan, 8.816%, (SOFR + 3.50%), 12/1/27 | 1,180 | 1,185,369 | |
| CPC Acquisition Corp., Term Loan, 9.321%, (SOFR + 3.75%), 12/29/27 | 674 | 571,847 | |
| Flint Group Midco Ltd., Term Loan, 10.588%, (SOFR + 5.262), 9.838% cash, 0.75% PIK, 12/31/26 | 346 | 331,362 | |
| Flint Group Topco Ltd.: | |||
| Term Loan, 12.588%, (SOFR + 7.262), 5.688% cash, 6.90% PIK, 12/31/27 | 179 | 148,043 | |
| Term Loan - Second Lien, 12.588%, (SOFR + 7.262), 5.688% cash, 6.90% PIK, 12/31/27 | 235 | 36,589 | |
| Borrower/Description | Principal Amount * (000's omitted) | Value | |
| Chemicals (continued) | |||
| Gemini HDPE LLC, Term Loan, 8.591%, (SOFR + 3.00%), 12/31/27 | 647 | $ 648,106 | |
| Groupe Solmax, Inc., Term Loan, 10.252%, (SOFR + 4.75%), 5/29/28 (13) | 1,459 | 1,439,604 | |
| INEOS Enterprises Holdings II Ltd., Term Loan, 7.952%, (3 mo. EURIBOR + 4.00%), 7/7/30 | EUR | 175 | 187,460 |
| INEOS Enterprises Holdings U.S. Finco LLC, Term Loan, 9.193%, (SOFR + 3.75%), 7/8/30 | 1,047 | 1,051,303 | |
| INEOS Finance PLC: | |||
| Term Loan, 6.598%, (1 mo. EURIBOR + 2.75%), 11/8/28 | EUR | 625 | 664,332 |
| Term Loan, 7.848%, (1 mo. EURIBOR + 4.00%), 11/8/27 | EUR | 4 | 4,058 |
| INEOS Quattro Holdings U.K. Ltd.: | |||
| Term Loan, 7.848%, (1 mo. EURIBOR + 4.00%), 3/14/30 | EUR | 275 | 291,384 |
| Term Loan, 9.666%, (SOFR + 4.25%), 4/2/29 | 1,955 | 1,952,556 | |
| INEOS U.S. Finance LLC: | |||
| Term Loan, 7.916%, (SOFR + 2.50%), 11/8/28 | 515 | 514,259 | |
| Term Loan, 8.916%, (SOFR + 3.50%), 2/18/30 | 1,318 | 1,322,174 | |
| Term Loan, 9.066%, (SOFR + 3.75%), 2/7/31 | 550 | 552,406 | |
| Term Loan, 9.166%, (SOFR + 3.75%), 11/8/27 | 598 | 600,252 | |
| Kraton Corp., Term Loan, 8.841%, (SOFR + 3.25%), 3/15/29 | 1,133 | 1,089,730 | |
| Kraton Polymers Holdings BV, Term Loan, 7.188%, (3 mo. EURIBOR + 3.25%), 3/15/29 | EUR | 300 | 310,255 |
| Lonza Group AG, Term Loan, 9.334%, (SOFR + 3.93%), 7/3/28 | 2,408 | 2,314,076 | |
| Momentive Performance Materials, Inc., Term Loan, 9.817%, (SOFR + 4.50%), 3/29/28 | 1,784 | 1,776,674 | |
| Olympus Water U.S. Holding Corp.: | |||
| Term Loan, 9.321%, (SOFR + 3.75%), 11/9/28 | 1,466 | 1,471,106 | |
| Term Loan, 9.576%, (SOFR + 4.25%), 11/9/28 | 766 | 769,893 | |
| Orion Engineered Carbons GmbH, Term Loan, 7.559%, (SOFR + 2.15%), 9/24/28 | 317 | 316,083 | |
| Rohm Holding GmbH, Term Loan, 10.581%, (SOFR + 5.00%), 7/31/26 | 1,428 | 1,349,681 | |
| SCUR-Alpha 1503 GmbH, Term Loan, 10.83%, (SOFR + 5.50%), 3/29/30 | 470 | 436,173 | |
| Starfruit Finco BV, Term Loan, 9.423%, (SOFR + 4.00%), 4/3/28 | 596 | 597,826 | |
| Tronox Finance LLC: | |||
| Term Loan, 8.816%, (SOFR + 3.50%), 8/16/28 | 474 | 475,392 | |
| Term Loan, 4/4/29 (12) | 1,000 | 1,002,812 | |
| W.R. Grace & Co.-Conn., Term Loan, 9.321%, (SOFR + 3.75%), 9/22/28 | 2,395 | 2,401,930 | |
| $ 29,468,527 | |||
| Borrower/Description | Principal Amount * (000's omitted) | Value | |
| Commercial Services & Supplies — 4.8% | |||
| Albion Financing 3 SARL: | |||
| Term Loan, 10.575%, (SOFR + 5.25%), 8/17/26 | 1,320 | $ 1,328,698 | |
| Term Loan, 10.824%, (SOFR + 5.50%), 8/17/26 | 272 | 273,952 | |
| Allied Universal Holdco LLC, Term Loan, 9.166%, (SOFR + 3.75%), 5/12/28 | 3,831 | 3,835,320 | |
| Belfor Holdings, Inc., Term Loan, 9.066%, (SOFR + 3.75%), 11/1/30 | 587 | 589,577 | |
| EnergySolutions LLC, Term Loan, 9.316%, (SOFR + 4.00%), 9/20/30 | 1,550 | 1,558,144 | |
| Foundever Worldwide Corp., Term Loan, 9.18%, (SOFR + 3.75%), 8/28/28 | 2,267 | 1,763,710 | |
| Garda World Security Corp., Term Loan, 9.583%, (SOFR + 4.25%), 2/1/29 | 2,402 | 2,416,098 | |
| GFL Environmental, Inc., Term Loan, 7.826%, (SOFR + 2.50%), 5/31/27 | 28 | 27,775 | |
| Heritage-Crystal Clean, Inc., Term Loan, 9.816%, (SOFR + 4.50%), 10/17/30 | 698 | 700,977 | |
| LABL, Inc., Term Loan, 10.416%, (SOFR + 5.00%), 10/29/28 | 611 | 599,355 | |
| Monitronics International, Inc., Term Loan, 13.091%, (SOFR + 7.50%), 6/30/28 | 1,011 | 1,010,045 | |
| Phoenix Services International LLC, Term Loan, 11.418%, (SOFR + 6.10%), 6/30/28 | 196 | 183,554 | |
| Tempo Acquisition LLC, Term Loan, 8.066%, (SOFR + 2.75%), 8/31/28 | 1,525 | 1,531,444 | |
| TMF Group Holding BV, Term Loan, 9.306%, (SOFR + 4.00%), 5/3/28 | 374 | 375,933 | |
| TruGreen LP, Term Loan, 9.416%, (SOFR + 4.00%), 11/2/27 | 2,015 | 1,940,809 | |
| $ 18,135,391 | |||
| Construction Materials — 0.7% | |||
| Quikrete Holdings, Inc., Term Loan, 7.569%, (SOFR + 2.25%), 3/19/29 | 2,450 | $ 2,453,572 | |
| U.S. Silica Co., Term Loan, 9.316%, (SOFR + 4.00%), 3/25/30 | 324 | 324,789 | |
| $ 2,778,361 | |||
| Consumer Staples Distribution & Retail — 0.5% | |||
| Cardenas Markets, Inc., Term Loan, 12.159%, (SOFR + 6.75%), 8/1/29 | 396 | $ 398,667 | |
| Peer Holding III BV: | |||
| Term Loan, 7.652%, (3 mo. EURIBOR + 3.75%), 9/29/28 | EUR | 525 | 563,222 |
| Term Loan, 8.559%, (SOFR + 3.25%), 10/28/30 | 1,100 | 1,105,271 | |
| $ 2,067,160 | |||
| Borrower/Description | Principal Amount * (000's omitted) | Value | |
| Containers & Packaging — 1.5% | |||
| Berlin Packaging LLC, Term Loan, 9.197%, (SOFR + 3.75%), 3/11/28 (13) | 1,766 | $ 1,769,447 | |
| Clydesdale Acquisition Holdings, Inc., Term Loan, 9.091%, (SOFR + 3.68%), 4/13/29 | 2,461 | 2,474,153 | |
| Pretium Packaging LLC, Term Loan - Second Lien, 11.309%, (SOFR + 6.00%), 9.906% cash, 1.403% PIK, 10/2/28 | 35 | 31,084 | |
| Pretium PKG Holdings, Inc., Term Loan - Second Lien, 12.334%, (SOFR + 6.75%), 10/1/29 | 300 | 184,875 | |
| Proampac PG Borrower LLC, Term Loan, 9.326%, (SOFR + 4.00%), 9/15/28 (13) | 1,122 | 1,127,565 | |
| $ 5,587,124 | |||
| Distributors — 0.7% | |||
| CD&R Hydra Buyer, Inc., Term Loan, 9.42%, (SOFR + 4.00%), 3/25/31 | 875 | $ 883,067 | |
| Parts Europe SA, Term Loan, 7.647%, (3 mo. EURIBOR + 3.75%), 2/3/31 | EUR | 1,475 | 1,580,357 |
| Phillips Feed Service, Inc., Term Loan, 12.416%, (SOFR + 7.00%), 11/13/24 (3) | 101 | 70,394 | |
| $ 2,533,818 | |||
| Diversified Consumer Services — 1.8% | |||
| Ascend Learning LLC, Term Loan, 8.916%, (SOFR + 3.50%), 12/11/28 | 538 | $ 536,491 | |
| Belron Finance U.S. LLC, Term Loan, 7.578%, (SOFR + 2.00%), 4/13/28 | 897 | 899,867 | |
| KUEHG Corp., Term Loan, 9.823%, (SOFR + 4.50%), 6/12/30 | 2,289 | 2,298,121 | |
| Sotheby's, Term Loan, 10.09%, (SOFR + 4.50%), 1/15/27 | 1,524 | 1,491,569 | |
| Spring Education Group, Inc., Term Loan, 9.809%, (SOFR + 4.50%), 10/4/30 | 349 | 351,002 | |
| Wand NewCo 3, Inc., Term Loan, 9.066%, (SOFR + 3.75%), 1/30/31 | 1,250 | 1,259,375 | |
| $ 6,836,425 | |||
| Diversified Financial Services — 0.4% | |||
| Concorde Midco Ltd., Term Loan, 7.851%, (6 mo. EURIBOR + 4.00%), 3/1/28 | EUR | 525 | $ 561,448 |
| Sandy BidCo BV, Term Loan, 7.437%, (1 mo. EURIBOR + 3.60%), 8/17/29 | EUR | 925 | 988,943 |
| $ 1,550,391 | |||
| Diversified Telecommunication Services — 1.9% | |||
| Altice France SA, Term Loan, 10.829%, (SOFR + 5.50%), 8/15/28 | 1,180 | $ 885,719 | |
| Borrower/Description | Principal Amount * (000's omitted) | Value | |
| Diversified Telecommunication Services (continued) | |||
| GEE Holdings 2 LLC: | |||
| Term Loan, 13.413%, (SOFR + 8.00%), 3/24/25 | 398 | $ 362,483 | |
| Term Loan - Second Lien, 13.662%, (SOFR + 8.25%), 5.412% cash, 8.25% PIK, 3/23/26 | 936 | 561,493 | |
| Virgin Media Bristol LLC, Term Loan, 8.686%, (SOFR + 3.25%), 1/31/29 | 4,200 | 4,143,418 | |
| Zayo Group Holdings, Inc., Term Loan, 7.098%, (1 mo. EURIBOR + 3.25%), 3/9/27 | EUR | 1,383 | 1,280,024 |
| $ 7,233,137 | |||
| Electrical Equipment — 1.1% | |||
| AZZ, Inc., Term Loan, 8.566%, (SOFR + 3.25%), 5/13/29 | 1,212 | $ 1,219,407 | |
| WEC U.S. Holdings Ltd., Term Loan, 8.066%, (SOFR + 2.75%), 1/27/31 | 3,100 | 3,105,716 | |
| $ 4,325,123 | |||
| Electronic Equipment, Instruments & Components — 2.8% | |||
| Chamberlain Group, Inc.: | |||
| Term Loan, 8.666%, (SOFR + 3.25%), 11/3/28 | 1,295 | $ 1,294,956 | |
| Term Loan, 9.066%, (SOFR + 3.75%), 11/3/28 | 1,175 | 1,178,525 | |
| Creation Technologies, Inc., Term Loan, 11.068%, (SOFR + 5.50%), 10/5/28 | 1,325 | 1,255,876 | |
| Ingram Micro, Inc., Term Loan, 8.571%, (SOFR + 3.00%), 6/30/28 | 2,236 | 2,243,341 | |
| Mirion Technologies, Inc., Term Loan, 8.314%, (SOFR + 2.75%), 10/20/28 | 502 | 503,590 | |
| MX Holdings U.S., Inc., Term Loan, 8.18%, (SOFR + 2.75%), 7/31/28 | 249 | 249,786 | |
| Robertshaw U.S. Holding Corp.: | |||
| DIP Loan, 6.309%, (SOFR + 1.00%), 9/27/24 | 312 | 304,562 | |
| Term Loan, 0.00%, 2/28/27 (7) | 0 (8) | 177 | |
| Term Loan, 0.00%, 2/28/27 (7) | 999 | 973,617 | |
| Term Loan - Second Lien, 0.00%, 2/28/27 (7) | 919 | 505,620 | |
| Verifone Systems, Inc., Term Loan, 9.585%, (SOFR + 4.00%), 8/20/25 | 1,088 | 987,847 | |
| Verisure Holding AB: | |||
| Term Loan, 6.891%, (3 mo. EURIBOR + 3.00%), 8/6/26 | EUR | 300 | 320,375 |
| Term Loan, 6.902%, (3 mo. EURIBOR + 3.00%), 3/27/28 | EUR | 775 | 825,999 |
| $ 10,644,271 | |||
| Energy Equipment & Services — 0.4% | |||
| Ameriforge Group, Inc., Term Loan, 12.085%, (SOFR + 8.00%), 12/29/23 (3)(11) | 55 | $ 44,195 | |
| Borrower/Description | Principal Amount * (000's omitted) | Value | |
| Energy Equipment & Services (continued) | |||
| GIP Pilot Acquisition Partners LP, Term Loan, 8.308%, (SOFR + 3.00%), 10/4/30 | 474 | $ 476,774 | |
| PG Investment Co. 59 SARL, Term Loan, 8.813%, (SOFR + 3.50%), 3/26/31 | 1,075 | 1,080,152 | |
| $ 1,601,121 | |||
| Engineering & Construction — 1.2% | |||
| Aegion Corp., Term Loan, 9.566%, (SOFR + 4.25%), 5/17/28 | 1,253 | $ 1,261,659 | |
| American Residential Services LLC, Term Loan, 9.071%, (SOFR + 3.50%), 10/15/27 | 556 | 557,355 | |
| Artera Services LLC, Term Loan, 9.809%, (SOFR + 4.50%), 2/15/31 | 425 | 429,144 | |
| Northstar Group Services, Inc., Term Loan, 10.93%, (SOFR + 5.50%), 11/12/26 | 1,348 | 1,352,887 | |
| Platea BC Bidco AB: | |||
| Term Loan, 4/2/31 (12) | EUR | 708 | 759,241 |
| Term Loan, 4/2/31 (12) | EUR | 142 | 151,848 |
| $ 4,512,134 | |||
| Entertainment — 1.7% | |||
| City Football Group Ltd., Term Loan, 8.439%, (SOFR + 3.00%), 7/21/28 | 1,955 | $ 1,954,185 | |
| Crown Finance U.S., Inc., Term Loan, 13.93%, (SOFR + 8.50%), 6.93% cash, 7.00% PIK, 7/31/28 | 316 | 321,909 | |
| EP Purchaser LLC, Term Loan, 9.071%, (SOFR + 3.50%), 11/6/28 | 343 | 341,464 | |
| Renaissance Holding Corp., Term Loan, 9.566%, (SOFR + 4.25%), 4/5/30 | 1,915 | 1,920,175 | |
| UFC Holdings LLC, Term Loan, 8.336%, (SOFR + 2.75%), 4/29/26 | 1,715 | 1,720,124 | |
| Vue Entertainment International Ltd., Term Loan, 12.428%, (6 mo. EURIBOR + 8.50%), 4.028% cash, 8.40% PIK, 12/31/27 | EUR | 252 | 158,127 |
| Vue International Bidco PLC, Term Loan, 11.844%, (6 mo. EURIBOR + 8.00%), 6/30/27 | EUR | 69 | 73,506 |
| $ 6,489,490 | |||
| Equity Real Estate Investment Trusts (REITs) — 0.3% | |||
| Iron Mountain, Inc., Term Loan, 7.566%, (SOFR + 2.25%), 1/31/31 | 1,047 | $ 1,046,503 | |
| $ 1,046,503 | |||
| Financial Services — 1.4% | |||
| GTCR W Merger Sub LLC, Term Loan, 8.309%, (SOFR + 3.00%), 1/31/31 | 2,975 | $ 2,990,339 | |
| Borrower/Description | Principal Amount * (000's omitted) | Value | |
| Financial Services (continued) | |||
| NCR Atleos LLC, Term Loan, 10.18%, (SOFR + 4.75%), 3/27/29 (13) | 1,320 | $ 1,331,296 | |
| Nuvei Technologies Corp., Term Loan, 8.416%, (SOFR + 3.00%), 12/19/30 | 848 | 850,313 | |
| $ 5,171,948 | |||
| Food Products — 1.2% | |||
| 8th Avenue Food & Provisions, Inc., Term Loan, 10.18%, (SOFR + 4.75%), 10/1/25 | 488 | $ 471,656 | |
| Badger Buyer Corp., Term Loan, 8.93%, (SOFR + 3.50%), 9/30/24 | 327 | 317,160 | |
| CHG PPC Parent LLC, Term Loan, 8.43%, (SOFR + 3.00%), 12/8/28 | 392 | 392,928 | |
| Del Monte Foods, Inc., Term Loan, 9.668%, (SOFR + 4.25%), 5/16/29 | 889 | 760,073 | |
| Nomad Foods U.S. LLC, Term Loan, 11/13/29 (12) | 2,000 | 2,006,718 | |
| United Petfood Group BV, Term Loan, 6.583%, (6 mo. EURIBOR + 2.75%), 4/24/28 | EUR | 700 | 744,472 |
| $ 4,693,007 | |||
| Gas Utilities — 0.7% | |||
| CQP Holdco LP, Term Loan, 8.302%, (SOFR + 3.00%), 12/31/30 | 2,613 | $ 2,623,438 | |
| $ 2,623,438 | |||
| Health Care Equipment & Supplies — 1.6% | |||
| Bayou Intermediate II LLC, Term Loan, 10.091%, (SOFR + 4.50%), 8/2/28 | 1,526 | $ 1,520,566 | |
| Journey Personal Care Corp., Term Loan, 9.68%, (SOFR + 4.25%), 3/1/28 | 2,482 | 2,470,783 | |
| Medline Borrower LP, Term Loan, 8.068%, (SOFR + 2.75%), 10/23/28 | 2,232 | 2,240,145 | |
| $ 6,231,494 | |||
| Health Care Providers & Services — 7.8% | |||
| AEA International Holdings (Lux) SARL, Term Loan, 8.809%, (SOFR + 3.50%), 9/7/28 (13) | 1,596 | $ 1,603,904 | |
| Biogroup-LCD, Term Loan, 7.395%, (3 mo. EURIBOR + 3.50%), 2/9/28 | EUR | 225 | 227,067 |
| BW NHHC Holdco, Inc., Term Loan - Second Lien, 13.302%, (SOFR + 8.00%), 1/15/26 | 2,181 | 1,886,919 | |
| Cano Health LLC: | |||
| DIP Loan, 16.322%, (SOFR + 11.00%), 10/7/24 | 181 | 186,479 | |
| DIP Loan, 16.322%, (SOFR + 11.00%), 10/7/24 | 278 | 285,843 | |
| Term Loan, 0.00%, 11/23/27 (7) | 2,443 | 659,495 | |
| CCRR Parent, Inc., Term Loan, 9.18%, (SOFR + 3.75%), 3/6/28 | 2,538 | 2,355,322 | |
| Borrower/Description | Principal Amount * (000's omitted) | Value | |
| Health Care Providers & Services (continued) | |||
| Cerba Healthcare SAS: | |||
| Term Loan, 7.548%, (1 mo. EURIBOR + 3.70%), 6/30/28 | EUR | 450 | $ 414,507 |
| Term Loan, 7.848%, (1 mo. EURIBOR + 4.00%), 2/16/29 | EUR | 500 | 463,765 |
| CHG Healthcare Services, Inc.: | |||
| Term Loan, 8.68%, (SOFR + 3.25%), 9/29/28 | 1,642 | 1,648,427 | |
| Term Loan, 9.091%, (SOFR + 3.75%), 9/29/28 (13) | 399 | 401,294 | |
| CNT Holdings I Corp., Term Loan, 8.83%, (SOFR + 3.50%), 11/8/27 | 1,508 | 1,514,601 | |
| Covis Finco SARL, Term Loan, 0.00%, 2/18/27 (7) | 617 | 257,577 | |
| Electron BidCo, Inc., Term Loan, 8.43%, (SOFR + 3.00%), 11/1/28 | 662 | 663,360 | |
| Ensemble RCM LLC, Term Loan, 8.33%, (SOFR + 3.00%), 8/1/29 | 330 | 331,300 | |
| IVC Acquisition Ltd.: | |||
| Term Loan, 9.071%, (6 mo. EURIBOR + 5.00%), 12/12/28 | EUR | 1,325 | 1,405,866 |
| Term Loan, 10.809%, (SOFR + 5.50%), 12/12/28 | 1,047 | 1,051,629 | |
| LSCS Holdings, Inc., Term Loan, 9.931%, (SOFR + 4.61%), 12/16/28 | 611 | 604,319 | |
| Medical Solutions Holdings, Inc., Term Loan, 8.666%, (SOFR + 3.25%), 11/1/28 | 2,460 | 2,187,151 | |
| National Mentor Holdings, Inc.: | |||
| Term Loan, 9.159%, (SOFR + 3.75%), 3/2/28 | 46 | 42,360 | |
| Term Loan, 9.165%, (SOFR + 3.75%), 3/2/28 (13) | 1,572 | 1,437,218 | |
| Option Care Health, Inc., Term Loan, 8.18%, (SOFR + 2.75%), 10/27/28 | 342 | 343,322 | |
| Pacific Dental Services LLC, Term Loan, 8.571%, (SOFR + 3.25%), 3/15/31 | 875 | 878,145 | |
| Phoenix Guarantor, Inc., Term Loan, 8.566%, (SOFR + 3.25%), 2/21/31 | 1,640 | 1,629,750 | |
| R1 RCM, Inc., Term Loan, 8.327%, (SOFR + 3.00%), 6/21/29 | 224 | 225,609 | |
| Radnet Management, Inc., Term Loan, 7.823%, (SOFR + 2.50%), 4/18/31 | 725 | 725,906 | |
| Sound Inpatient Physicians, Term Loan, 8.591%, (SOFR + 3.00%), 6/27/25 | 424 | 247,053 | |
| Surgery Center Holdings, Inc., Term Loan, 8.815%, (SOFR + 3.50%), 12/19/30 | 2,203 | 2,218,911 | |
| Synlab Bondco PLC: | |||
| Term Loan, 6.361%, (6 mo. EURIBOR + 2.50%), 7/1/27 | EUR | 300 | 318,639 |
| Term Loan, 12/23/30 (12) | EUR | 525 | 562,385 |
| TTF Holdings LLC, Term Loan, 3/31/28 (12) | 2,000 | 2,005,834 | |
| U.S. Anesthesia Partners, Inc., Term Loan, 9.692%, (SOFR + 4.25%), 10/1/28 | 902 | 874,819 | |
| $ 29,658,776 | |||
| Borrower/Description | Principal Amount * (000's omitted) | Value | |
| Health Care Technology — 3.4% | |||
| athenahealth Group, Inc., Term Loan, 8.566%, (SOFR + 3.25%), 2/15/29 | 1,767 | $ 1,763,337 | |
| Certara LP, Term Loan, 9.105%, (SOFR + 3.50%), 8/15/26 | 936 | 938,844 | |
| eResearchTechnology, Inc., Term Loan, 9.93%, (SOFR + 4.50%), 2/4/27 | 315 | 316,555 | |
| Imprivata, Inc., Term Loan, 9.091%, (SOFR + 3.50%), 12/1/27 | 2,314 | 2,328,082 | |
| MedAssets Software Intermediate Holdings, Inc.: | |||
| Term Loan, 9.424%, (SOFR + 4.00%), 12/18/28 | 931 | 788,441 | |
| Term Loan - Second Lien, 12.18%, (SOFR + 6.75%), 12/17/29 | 600 | 416,250 | |
| PointClickCare Technologies, Inc., Term Loan, 8.324%, (SOFR + 3.00%), 12/29/27 | 606 | 610,797 | |
| Project Ruby Ultimate Parent Corp., Term Loan, 8.68%, (SOFR + 3.25%), 3/10/28 | 1,091 | 1,091,543 | |
| Symplr Software, Inc., Term Loan, 9.93%, (SOFR + 4.50%), 12/22/27 | 1,691 | 1,610,237 | |
| Verscend Holding Corp., Term Loan, 11.50%, (USD Prime + 3.00%), 8/27/25 | 1,431 | 1,432,498 | |
| Waystar Technologies, Inc., Term Loan, 9.316%, (SOFR + 4.00%), 10/22/29 | 1,734 | 1,745,972 | |
| $ 13,042,556 | |||
| Hotels, Restaurants & Leisure — 5.9% | |||
| Caesars Entertainment, Inc., Term Loan, 8.066%, (SOFR + 2.75%), 2/6/31 | 2,325 | $ 2,331,538 | |
| Carnival Corp., Term Loan, 8.067%, (SOFR + 2.75%), 10/18/28 | 2,512 | 2,523,169 | |
| ClubCorp Holdings, Inc., Term Loan, 10.564%, (SOFR + 5.00%), 9/18/26 | 1,407 | 1,411,365 | |
| Fertitta Entertainment LLC, Term Loan, 9.069%, (SOFR + 3.75%), 1/27/29 | 1,980 | 1,987,099 | |
| Flutter Financing BV, Term Loan, 7.559%, (SOFR + 2.25%), 11/25/30 | 3,142 | 3,151,944 | |
| Great Canadian Gaming Corp., Term Loan, 9.59%, (SOFR + 4.00%), 11/1/26 | 1,498 | 1,505,617 | |
| IRB Holding Corp., Term Loan, 8.166%, (SOFR + 2.75%), 12/15/27 | 2,432 | 2,437,920 | |
| Ontario Gaming GTA LP, Term Loan, 9.559%, (SOFR + 4.25%), 8/1/30 | 998 | 1,004,108 | |
| Oravel Stays Singapore Pte. Ltd., Term Loan, 13.84%, (SOFR + 8.25%), 6/23/26 | 379 | 379,114 | |
| Playa Resorts Holding BV, Term Loan, 8.565%, (SOFR + 3.25%), 1/5/29 | 2,024 | 2,035,236 | |
| Scientific Games Holdings LP, Term Loan, 8.556%, (SOFR + 3.25%), 4/4/29 | 1,975 | 1,977,406 | |
| Borrower/Description | Principal Amount * (000's omitted) | Value | |
| Hotels, Restaurants & Leisure (continued) | |||
| SeaWorld Parks & Entertainment, Inc., Term Loan, 7.816%, (SOFR + 2.50%), 8/25/28 | 731 | $ 732,024 | |
| Wyndham Hotels & Resorts, Inc., Term Loan, 7.666%, (SOFR + 2.25%), 5/24/30 | 794 | 797,425 | |
| $ 22,273,965 | |||
| Household Durables — 1.7% | |||
| ACProducts, Inc., Term Loan, 9.814%, (SOFR + 4.25%), 5/17/28 | 2,721 | $ 2,366,461 | |
| Libbey Glass, Inc., Term Loan, 11.975%, (SOFR + 6.50%), 11/22/27 | 660 | 636,554 | |
| Serta Simmons Bedding LLC: | |||
| Term Loan, 12.924%, (SOFR + 7.50%), 6/29/28 | 1,432 | 1,261,971 | |
| Term Loan, 6/29/28 (12) | 156 | 152,788 | |
| Solis IV BV, Term Loan, 8.824%, (SOFR + 3.50%), 2/26/29 | 1,972 | 1,962,897 | |
| $ 6,380,671 | |||
| Household Products — 0.7% | |||
| Kronos Acquisition Holdings, Inc.: | |||
| Term Loan, 9.314%, (SOFR + 3.75%), 12/22/26 | 1,753 | $ 1,756,140 | |
| Term Loan, 11.493%, (SOFR + 6.00%), 12/22/26 | 783 | 787,101 | |
| $ 2,543,241 | |||
| Industrial Conglomerates — 0.6% | |||
| Kohler Energy Co. LLC, Term Loan, 1/30/31 (12) | 2,325 | $ 2,332,993 | |
| $ 2,332,993 | |||
| Insurance — 1.3% | |||
| Alliant Holdings Intermediate LLC, Term Loan, 8.819%, (SOFR + 3.50%), 11/6/30 | 884 | $ 888,147 | |
| AmWINS Group, Inc., Term Loan, 8.18%, (SOFR + 2.75%), 2/19/28 | 642 | 644,132 | |
| Financiere CEP SAS, Term Loan, 7.885%, (6 mo. EURIBOR + 4.00%), 6/18/27 | EUR | 500 | 535,128 |
| Ryan Specialty Group LLC, Term Loan, 8.066%, (SOFR + 2.75%), 9/1/27 | 2,917 | 2,925,992 | |
| $ 4,993,399 | |||
| Interactive Media & Services — 1.5% | |||
| Adevinta ASA: | |||
| Term Loan, 6.348%, (1 mo. EURIBOR + 2.50%), 6/26/28 | EUR | 684 | $ 731,192 |
| Term Loan, 8.332%, (SOFR + 2.75%), 6/26/28 | 123 | 123,547 | |
| Arches Buyer, Inc., Term Loan, 8.666%, (SOFR + 3.25%), 12/6/27 | 1,974 | 1,910,627 | |
| Borrower/Description | Principal Amount * (000's omitted) | Value | |
| Interactive Media & Services (continued) | |||
| Buzz Finco LLC, Term Loan, 8.166%, (SOFR + 2.75%), 1/29/27 | 528 | $ 529,815 | |
| Foundational Education Group, Inc., Term Loan, 9.341%, (SOFR + 3.75%), 8/31/28 | 1,442 | 1,432,801 | |
| Getty Images, Inc., Term Loan, 9.909%, (SOFR + 4.50%), 2/19/26 | 991 | 993,728 | |
| $ 5,721,710 | |||
| IT Services — 6.2% | |||
| Asurion LLC: | |||
| Term Loan, 8.68%, (SOFR + 3.25%), 12/23/26 | 1,142 | $ 1,118,014 | |
| Term Loan, 8.68%, (SOFR + 3.25%), 7/31/27 | 1,459 | 1,420,357 | |
| Term Loan, 9.416%, (SOFR + 4.00%), 8/19/28 | 1,092 | 1,063,943 | |
| Term Loan - Second Lien, 10.68%, (SOFR + 5.25%), 1/31/28 | 1,830 | 1,673,469 | |
| Term Loan - Second Lien, 10.68%, (SOFR + 5.25%), 1/20/29 | 1,400 | 1,266,016 | |
| Endure Digital, Inc., Term Loan, 8.939%, (SOFR + 3.50%), 2/10/28 | 3,975 | 3,860,339 | |
| Gainwell Acquisition Corp., Term Loan, 9.409%, (SOFR + 4.00%), 10/1/27 | 2,795 | 2,674,047 | |
| Go Daddy Operating Co. LLC, Term Loan, 7.316%, (SOFR + 2.00%), 11/9/29 | 2,155 | 2,157,215 | |
| Indy U.S. Bidco LLC, Term Loan, 7.598%, (1 mo. EURIBOR + 3.75%), 3/6/28 | EUR | 583 | 617,176 |
| NAB Holdings LLC, Term Loan, 8.209%, (SOFR + 2.75%), 11/23/28 | 3,133 | 3,134,603 | |
| Rackspace Technology Global, Inc.: | |||
| Term Loan, 11.552%, (SOFR + 6.25%), 5/15/28 | 1,740 | 1,757,621 | |
| Term Loan - Second Lien, 8.186%, (SOFR + 2.75%), 5/15/28 | 3,710 | 1,780,889 | |
| Sedgwick Claims Management Services, Inc., Term Loan, 9.066%, (SOFR + 3.75%), 2/24/28 | 1,121 | 1,126,590 | |
| $ 23,650,279 | |||
| Leisure Products — 0.3% | |||
| Fender Musical Instruments Corp., Term Loan, 9.418%, (SOFR + 4.00%), 12/1/28 | 269 | $ 266,541 | |
| Recess Holdings, Inc., Term Loan, 9.843%, (SOFR + 4.50%), 2/20/30 | 800 | 803,000 | |
| $ 1,069,541 | |||
| Life Sciences Tools & Services — 1.8% | |||
| Cambrex Corp., Term Loan, 8.916%, (SOFR + 3.50%), 12/4/26 | 289 | $ 279,191 | |
| Catalent Pharma Solutions, Inc., Term Loan, 8.315%, (SOFR + 3.00%), 2/22/28 | 275 | 276,547 | |
| Borrower/Description | Principal Amount * (000's omitted) | Value | |
| Life Sciences Tools & Services (continued) | |||
| Curia Global, Inc., Term Loan, 9.18%, (SOFR + 3.75%), 8/30/26 (13) | 1,817 | $ 1,730,873 | |
| IQVIA, Inc., Term Loan, 7.309%, (SOFR + 2.00%), 1/2/31 | 1,347 | 1,354,200 | |
| LGC Group Holdings Ltd., Term Loan, 7.098%, (1 mo. EURIBOR + 3.25%), 4/21/27 | EUR | 475 | 501,893 |
| Loire Finco Luxembourg SARL, Term Loan, 8.916%, (SOFR + 3.50%), 4/21/27 | 313 | 307,800 | |
| Packaging Coordinators Midco, Inc., Term Loan, 9.071%, (SOFR + 3.50%), 11/30/27 | 1,341 | 1,346,651 | |
| Sotera Health Holdings LLC: | |||
| Term Loan, 8.18%, (SOFR + 2.75%), 12/11/26 | 625 | 624,805 | |
| Term Loan, 12/11/26 (12) | 500 | 502,500 | |
| $ 6,924,460 | |||
| Machinery — 8.5% | |||
| AI Aqua Merger Sub, Inc., Term Loan, 9.324%, (SOFR + 4.00%), 7/31/28 | 2,162 | $ 2,170,619 | |
| Alliance Laundry Systems LLC, Term Loan, 8.90%, (SOFR + 3.50%), 10/8/27 (13) | 1,864 | 1,872,471 | |
| American Trailer World Corp., Term Loan, 9.166%, (SOFR + 3.75%), 3/3/28 | 1,261 | 1,238,577 | |
| Apex Tool Group LLC: | |||
| Term Loan, 15.315%, (SOFR + 10.00%), 2/8/30 | 1,155 | 1,120,206 | |
| Term Loan - Second Lien, 12.566%, (SOFR + 7.25%), 8.566% cash, 4.00% PIK, 2/8/29 | 495 | 489,987 | |
| Barnes Group, Inc., Term Loan, 7.816%, (SOFR + 2.50%), 9/3/30 | 522 | 524,116 | |
| Clark Equipment Co., Term Loan, 7.902%, (SOFR + 2.50%), 4/20/29 | 869 | 872,671 | |
| Conair Holdings LLC, Term Loan, 9.18%, (SOFR + 3.75%), 5/17/28 | 2,145 | 2,131,403 | |
| CPM Holdings, Inc., Term Loan, 9.827%, (SOFR + 4.50%), 9/28/28 | 1,904 | 1,910,956 | |
| EMRLD Borrower LP, Term Loan, 7.816%, (SOFR + 2.50%), 5/31/30 | 733 | 734,952 | |
| Engineered Machinery Holdings, Inc., Term Loan, 9.321%, (SOFR + 3.75%), 5/19/28 | 3,425 | 3,430,540 | |
| Filtration Group Corp., Term Loan, 8.93%, (SOFR + 3.50%), 10/21/28 | 634 | 635,862 | |
| Gates Global LLC, Term Loan, 7.916%, (SOFR + 2.50%), 3/31/27 | 2,316 | 2,325,088 | |
| Icebox Holdco III, Inc., Term Loan, 9.321%, (SOFR + 3.75%), 12/22/28 | 711 | 710,609 | |
| Madison IAQ LLC, Term Loan, 8.68%, (SOFR + 3.25%), 6/21/28 | 2,431 | 2,434,456 | |
| Pro Mach Group, Inc., Term Loan, 9.066%, (SOFR + 3.75%), 8/31/28 | 1,489 | 1,496,477 | |
| Borrower/Description | Principal Amount * (000's omitted) | Value | |
| Machinery (continued) | |||
| Roper Industrial Products Investment Co. LLC, Term Loan, 9.302%, (SOFR + 4.00%), 11/22/29 | 1,312 | $ 1,322,646 | |
| SPX Flow, Inc., Term Loan, 9.916%, (SOFR + 4.50%), 4/5/29 | 1,917 | 1,930,049 | |
| Titan Acquisition Ltd., Term Loan, 10.317%, (SOFR + 5.00%), 2/1/29 | 850 | 855,312 | |
| TK Elevator Midco GmbH, Term Loan, 7.926%, (3 mo. EURIBOR + 4.00%), 4/30/30 | EUR | 900 | 964,923 |
| TK Elevator Topco GmbH, Term Loan, 7.491%, (6 mo. EURIBOR + 3.63%), 7/30/27 | EUR | 500 | 534,082 |
| TK Elevator U.S. Newco, Inc., Term Loan, 8.791%, (SOFR + 3.50%), 4/30/30 | 2,006 | 2,014,945 | |
| Zephyr German BidCo GmbH, Term Loan, 7.446%, (6 mo. EURIBOR + 3.60%), 3/10/28 | EUR | 600 | 633,561 |
| $ 32,354,508 | |||
| Media — 1.6% | |||
| Aragorn Parent Corp., Term Loan, 9.569%, (SOFR + 4.25%), 12/15/28 | 1,307 | $ 1,316,328 | |
| Gray Television, Inc.: | |||
| Term Loan, 7.942%, (SOFR + 2.50%), 1/2/26 | 575 | 568,947 | |
| Term Loan, 8.442%, (SOFR + 3.00%), 12/1/28 | 800 | 754,485 | |
| Hubbard Radio LLC, Term Loan, 9.816%, (SOFR + 4.50%), 3/28/25 | 460 | 380,998 | |
| MJH Healthcare Holdings LLC, Term Loan, 8.916%, (SOFR + 3.50%), 1/28/29 | 245 | 245,306 | |
| Sinclair Television Group, Inc., Term Loan, 8.091%, (SOFR + 2.50%), 9/30/26 | 573 | 534,975 | |
| Univision Communications, Inc., Term Loan, 8.68%, (SOFR + 3.25%), 3/15/26 | 2,140 | 2,143,345 | |
| $ 5,944,384 | |||
| Metals/Mining — 1.0% | |||
| Arsenal AIC Parent LLC, Term Loan, 9.066%, (SOFR + 3.75%), 8/18/30 | 1,496 | $ 1,509,347 | |
| Dynacast International LLC, Term Loan, 14.443%, (SOFR + 9.00%), 10/22/25 | 327 | 243,631 | |
| PMHC II, Inc., Term Loan, 9.706%, (SOFR + 4.25%), 4/23/29 | 1,808 | 1,785,063 | |
| WireCo WorldGroup, Inc., Term Loan, 9.075%, (SOFR + 3.75%), 11/13/28 | 370 | 372,327 | |
| $ 3,910,368 | |||
| Oil, Gas & Consumable Fuels — 2.2% | |||
| Freeport LNG Investments LLP, Term Loan, 9.086%, (SOFR + 3.50%), 12/21/28 | 582 | $ 579,541 | |
| Borrower/Description | Principal Amount * (000's omitted) | Value | |
| Oil, Gas & Consumable Fuels (continued) | |||
| ITT Holdings LLC, Term Loan, 8.421%, (SOFR + 3.00%), 10/11/30 | 821 | $ 822,585 | |
| Matador Bidco SARL, Term Loan, 9.916%, (SOFR + 4.50%), 10/15/26 | 3,306 | 3,317,091 | |
| Oryx Midstream Services Permian Basin LLC, Term Loan, 8.436%, (SOFR + 3.00%), 10/5/28 | 875 | 879,251 | |
| Oxbow Carbon LLC, Term Loan, 9.413%, (SOFR + 4.00%), 5/10/30 (13) | 521 | 523,668 | |
| UGI Energy Services LLC, Term Loan, 8.666%, (SOFR + 3.25%), 2/22/30 | 2,364 | 2,380,924 | |
| $ 8,503,060 | |||
| Passenger Airlines — 0.1% | |||
| WestJet Loyalty LP, Term Loan, 9.048%, (SOFR + 3.75%), 2/14/31 | 500 | $ 501,161 | |
| $ 501,161 | |||
| Personal Products — 0.3% | |||
| Olaplex, Inc., Term Loan, 8.918%, (SOFR + 3.50%), 2/23/29 | 1,287 | $ 1,191,351 | |
| $ 1,191,351 | |||
| Pharmaceuticals — 1.8% | |||
| Bausch Health Cos., Inc., Term Loan, 10.668%, (SOFR + 5.25%), 2/1/27 | 1,565 | $ 1,319,057 | |
| Ceva Sante Animale, Term Loan, 9.564%, (SOFR + 4.25%), 11/1/30 | 400 | 403,125 | |
| Jazz Financing Lux SARL, Term Loan, 8.43%, (SOFR + 3.00%), 5/5/28 | 2,189 | 2,204,517 | |
| Mallinckrodt International Finance SA: | |||
| Term Loan, 12.819%, (SOFR + 7.50%), 11/14/28 | 375 | 420,369 | |
| Term Loan - Second Lien, 14.819%, (SOFR + 9.50%), 11/14/28 | 2,127 | 2,327,361 | |
| PharmaZell GmbH, Term Loan, 7.902%, (3 mo. EURIBOR + 4.00%), 5/12/27 | EUR | 125 | 132,455 |
| $ 6,806,884 | |||
| Professional Services — 5.9% | |||
| AlixPartners LLP: | |||
| Term Loan, 6.902%, (3 mo. EURIBOR + 3.00%), 2/4/28 | EUR | 485 | $ 518,725 |
| Term Loan, 7.93%, (SOFR + 2.50%), 2/4/28 | 546 | 547,868 | |
| APFS Staffing Holdings, Inc., Term Loan, 9.316%, (SOFR + 4.00%), 12/29/28 | 241 | 240,199 | |
| Apleona Holding GmbH, Term Loan, 6.564%, (3 mo. EURIBOR + 2.70%), 4/28/28 | EUR | 750 | 792,540 |
| Borrower/Description | Principal Amount * (000's omitted) | Value | |
| Professional Services (continued) | |||
| Camelot U.S. Acquisition LLC, Term Loan, 8.066%, (SOFR + 2.75%), 1/31/31 | 2,807 | $ 2,814,658 | |
| CoreLogic, Inc., Term Loan, 8.93%, (SOFR + 3.50%), 6/2/28 | 1,815 | 1,757,827 | |
| Corporation Service Co., Term Loan, 8.066%, (SOFR + 2.75%), 11/2/29 | 253 | 253,918 | |
| Crisis Prevention Institute, Inc., Term Loan, 10.043%, (SOFR + 4.75%), 4/9/31 | 325 | 326,828 | |
| Deerfield Dakota Holding LLC, Term Loan, 9.059%, (SOFR + 3.75%), 4/9/27 | 2,072 | 2,071,518 | |
| EAB Global, Inc., Term Loan, 8.93%, (SOFR + 3.50%), 8/16/28 | 1,489 | 1,493,762 | |
| Employbridge Holding Co., Term Loan, 10.314%, (SOFR + 4.75%), 7/19/28 | 1,955 | 1,590,296 | |
| Fleet Midco I Ltd., Term Loan, 8.566%, (SOFR + 3.25%), 2/21/31 | 750 | 753,750 | |
| Genuine Financial Holdings LLC, Term Loan, 9.316%, (SOFR + 4.00%), 9/27/30 | 398 | 397,440 | |
| Neptune Bidco U.S., Inc., Term Loan, 10.406%, (SOFR + 5.00%), 4/11/29 | 1,832 | 1,724,854 | |
| Rockwood Service Corp., Term Loan, 9.68%, (SOFR + 4.25%), 1/23/27 | 1,050 | 1,057,663 | |
| Techem Verwaltungsgesellschaft 675 mbH, Term Loan, 7.605%, (3 mo. EURIBOR + 3.75%), 7/15/29 | EUR | 2,339 | 2,499,999 |
| Teneo Holdings LLC, Term Loan, 10.066%, (SOFR + 4.75%), 3/13/31 | 1,075 | 1,084,630 | |
| Vaco Holdings LLC, Term Loan, 10.434%, (SOFR + 5.00%), 1/21/29 | 1,237 | 1,230,191 | |
| Wood Mackenzie Ltd., Term Loan, 8.814%, (SOFR + 3.50%), 2/7/31 | 1,225 | 1,231,966 | |
| $ 22,388,632 | |||
| Real Estate Management & Development — 0.8% | |||
| Greystar Real Estate Partners LLC, Term Loan, 8.576%, (SOFR + 3.25%), 8/21/30 | 2,097 | $ 2,104,867 | |
| Homeserve USA Holding Corp., Term Loan, 8.319%, (SOFR + 3.00%), 10/21/30 | 925 | 929,047 | |
| $ 3,033,914 | |||
| Road & Rail — 1.6% | |||
| First Student Bidco, Inc.: | |||
| Term Loan, 8.564%, (SOFR + 3.00%), 7/21/28 | 383 | $ 383,822 | |
| Term Loan, 8.564%, (SOFR + 3.00%), 7/21/28 | 1,260 | 1,261,949 | |
| Hertz Corp.: | |||
| Term Loan, 9.065%, (SOFR + 3.75%), 6/30/28 | 748 | 690,457 | |
| Term Loan, 6/30/28 (12) | 1,259 | 1,163,873 | |
| Term Loan, 6/30/28 (12) | 241 | 223,614 | |
| Borrower/Description | Principal Amount * (000's omitted) | Value | |
| Road & Rail (continued) | |||
| Kenan Advantage Group, Inc., Term Loan, 9.066%, (SOFR + 3.75%), 1/25/29 | 2,352 | $ 2,355,191 | |
| $ 6,078,906 | |||
| Semiconductors & Semiconductor Equipment — 0.6% | |||
| Altar Bidco, Inc.: | |||
| Term Loan, 7.947%, (SOFR + 3.10%), 2/1/29 | 1,797 | $ 1,798,370 | |
| Term Loan - Second Lien, 10.914%, (SOFR + 5.60%), 2/1/30 | 450 | 446,250 | |
| Bright Bidco BV, Term Loan, 14.33%, (SOFR + 9.00%), 6.33% cash, 8.00% PIK, 10/31/27 | 462 | 139,701 | |
| $ 2,384,321 | |||
| Software — 19.4% | |||
| Applied Systems, Inc., Term Loan, 8.809%, (SOFR + 3.50%), 2/24/31 | 645 | $ 650,569 | |
| AppLovin Corp., Term Loan, 7.816%, (SOFR + 2.50%), 8/16/30 | 1,798 | 1,800,530 | |
| Astra Acquisition Corp.: | |||
| Term Loan, 10.578%, (SOFR + 5.25%), 10/25/28 | 735 | 375,061 | |
| Term Loan, 12.078%, (SOFR + 6.75%), 2/25/28 | 167 | 164,402 | |
| Term Loan, 2/25/28 (12) | 354 | 347,140 | |
| Term Loan - Second Lien, 14.439%, (SOFR + 8.88%), 10/25/29 | 1,425 | 403,652 | |
| Banff Merger Sub, Inc.: | |||
| Term Loan, 8.348%, (1 mo. EURIBOR + 4.50%), 12/29/28 | EUR | 263 | 282,806 |
| Term Loan, 9.566%, (SOFR + 4.25%), 12/29/28 | 3,677 | 3,704,344 | |
| Central Parent, Inc., Term Loan, 9.309%, (SOFR + 4.00%), 7/6/29 | 2,035 | 2,044,700 | |
| Cloud Software Group, Inc., Term Loan, 9.909%, (SOFR + 4.50%), 3/30/29 (13) | 4,474 | 4,478,323 | |
| Cloudera, Inc.: | |||
| Term Loan, 9.166%, (SOFR + 3.75%), 10/8/28 | 2,944 | 2,932,778 | |
| Term Loan - Second Lien, 11.416%, (SOFR + 6.00%), 10/8/29 | 650 | 627,250 | |
| Cornerstone OnDemand, Inc., Term Loan, 9.18%, (SOFR + 3.75%), 10/16/28 | 1,127 | 1,081,216 | |
| Delta TopCo, Inc.: | |||
| Term Loan, 9.121%, (SOFR + 3.75%), 12/1/27 | 1,398 | 1,401,451 | |
| Term Loan - Second Lien, 12.621%, (SOFR + 7.25%), 12/1/28 | 2,025 | 2,038,922 | |
| E2open LLC, Term Loan, 8.93%, (SOFR + 3.50%), 2/4/28 | 851 | 855,348 | |
| ECI Macola Max Holding LLC, Term Loan, 9.052%, (SOFR + 3.75%), 5/31/30 | 1,409 | 1,416,524 | |
| Epicor Software Corp.: | |||
| Term Loan, 8.68%, (SOFR + 3.25%), 7/30/27 | 2,216 | 2,227,881 | |
| Borrower/Description | Principal Amount * (000's omitted) | Value | |
| Software (continued) | |||
| Epicor Software Corp.: | |||
| Term Loan, 9.066%, (SOFR + 3.75%), 7/30/27 | 823 | $ 828,595 | |
| Fiserv Investment Solutions, Inc., Term Loan, 9.319%, (SOFR + 4.00%), 2/18/27 | 1,486 | 1,428,583 | |
| GoTo Group, Inc.: | |||
| Term Loan, 10.173%, (SOFR + 4.75%), 4/30/28 | 976 | 933,191 | |
| Term Loan - Second Lien, 10.173%, (SOFR + 4.75%), 4/30/28 | 818 | 623,377 | |
| iSolved, Inc., Term Loan, 8.819%, (SOFR + 3.50%), 10/15/30 | 499 | 500,309 | |
| Ivanti Software, Inc., Term Loan, 9.814%, (SOFR + 4.25%), 12/1/27 | 1,299 | 1,207,780 | |
| Magenta Buyer LLC, Term Loan, 10.591%, (SOFR + 5.00%), 7/27/28 | 2,013 | 1,023,079 | |
| Marcel LUX IV SARL, Term Loan, 9.81%, (SOFR + 4.50%), 11/11/30 | 1,272 | 1,278,966 | |
| Maverick Bidco, Inc., Term Loan, 9.23%, (SOFR + 3.75%), 5/18/28 | 240 | 239,901 | |
| McAfee LLC, Term Loan, 9.177%, (SOFR + 3.75%), 3/1/29 | 2,407 | 2,415,507 | |
| Mosel Bidco SE, Term Loan, 10.059%, (SOFR + 4.75%), 9/16/30 | 250 | 251,406 | |
| OceanKey (U.S.) II Corp., Term Loan, 8.916%, (SOFR + 3.50%), 12/15/28 | 539 | 536,080 | |
| Open Text Corp., Term Loan, 8.166%, (SOFR + 2.75%), 1/31/30 | 1,904 | 1,912,397 | |
| Polaris Newco LLC, Term Loan, 9.591%, (SOFR + 4.00%), 6/2/28 | 2,608 | 2,593,454 | |
| Proofpoint, Inc., Term Loan, 8.68%, (SOFR + 3.25%), 8/31/28 | 2,933 | 2,946,796 | |
| Quartz Acquireco LLC, Term Loan, 8.809%, (SOFR + 3.50%), 6/28/30 | 1,496 | 1,505,913 | |
| Quest Software U.S. Holdings, Inc., Term Loan, 9.73%, (SOFR + 4.25%), 2/1/29 | 1,757 | 1,243,159 | |
| RealPage, Inc., Term Loan, 8.43%, (SOFR + 3.00%), 4/24/28 | 3,287 | 3,173,340 | |
| Redstone Holdco 2 LP, Term Loan, 10.18%, (SOFR + 4.75%), 4/27/28 | 1,376 | 1,084,705 | |
| Sabre GLBL, Inc.: | |||
| Term Loan, 8.93%, (SOFR + 3.50%), 12/17/27 | 1,472 | 1,290,339 | |
| Term Loan, 8.93%, (SOFR + 3.50%), 12/17/27 | 940 | 823,629 | |
| Term Loan, 9.666%, (SOFR + 4.25%), 6/30/28 | 881 | 776,270 | |
| Skillsoft Corp., Term Loan, 10.68%, (SOFR + 5.25%), 7/14/28 | 1,484 | 1,195,835 | |
| SolarWinds Holdings, Inc., Term Loan, 8.566%, (SOFR + 3.25%), 2/5/27 | 1,763 | 1,767,818 | |
| Sophia LP, Term Loan, 8.916%, (SOFR + 3.50%), 10/9/29 | 4,093 | 4,111,592 | |
| Borrower/Description | Principal Amount * (000's omitted) | Value | |
| Software (continued) | |||
| UKG, Inc., Term Loan, 8.814%, (SOFR + 3.50%), 2/10/31 | 4,384 | $ 4,409,780 | |
| Veritas U.S., Inc.: | |||
| Term Loan, 8.652%, (3 mo. EURIBOR + 4.75%), 9/1/25 | EUR | 314 | 304,185 |
| Term Loan, 10.43%, (SOFR + 5.00%), 9/1/25 | 2,740 | 2,523,889 | |
| Vision Solutions, Inc., Term Loan, 9.841%, (SOFR + 4.25%), 4/24/28 | 3,829 | 3,820,774 | |
| $ 73,583,546 | |||
| Specialty Retail — 4.8% | |||
| Boels Topholding BV, Term Loan, 7.139%, (EURIBOR + 3.25%), 2/6/27 (13) | EUR | 496 | $ 530,227 |
| Great Outdoors Group LLC, Term Loan, 9.18%, (SOFR + 3.75%), 3/6/28 | 2,613 | 2,616,675 | |
| Harbor Freight Tools USA, Inc., Term Loan, 8.18%, (SOFR + 2.75%), 10/19/27 | 3,184 | 3,190,122 | |
| Hoya Midco LLC, Term Loan, 8.58%, (SOFR + 3.25%), 2/3/29 | 926 | 928,491 | |
| Les Schwab Tire Centers, Term Loan, 8.317%, (SOFR + 3.00%), 4/23/31 | 4,815 | 4,823,735 | |
| LIDS Holdings, Inc., Term Loan, 10.98%, (SOFR + 5.50%), 12/14/26 | 287 | 286,719 | |
| Mattress Firm, Inc., Term Loan, 9.814%, (SOFR + 4.25%), 9/25/28 | 3,062 | 3,073,736 | |
| PetSmart, Inc., Term Loan, 9.166%, (SOFR + 3.75%), 2/11/28 | 2,966 | 2,926,266 | |
| $ 18,375,971 | |||
| Trading Companies & Distributors — 3.7% | |||
| Beacon Roofing Supply, Inc., Term Loan, 7.316%, (SOFR + 2.00%), 5/19/28 | 549 | $ 550,716 | |
| Core & Main LP, Term Loan, 7.568%, (SOFR + 2.25%), 2/9/31 | 374 | 375,933 | |
| DXP Enterprises, Inc., Term Loan, 10.164%, (SOFR + 4.75%), 10/11/30 | 697 | 701,071 | |
| Foundation Building Materials Holding Co. LLC, Term Loan, 9.33%, (SOFR + 4.00%), 1/29/31 (13) | 1,275 | 1,286,156 | |
| Patagonia Bidco Ltd., Term Loan, 10.473%, (SONIA + 5.25%), 11/1/28 | GBP | 1,325 | 1,462,593 |
| Spin Holdco, Inc., Term Loan, 9.585%, (SOFR + 4.00%), 3/4/28 | 4,123 | 3,659,234 | |
| SRS Distribution, Inc.: | |||
| Term Loan, 8.666%, (SOFR + 3.25%), 6/2/28 | 318 | 320,110 | |
| Term Loan, 8.93%, (SOFR + 3.50%), 6/2/28 | 2,303 | 2,321,922 | |
| Borrower/Description | Principal Amount * (000's omitted) | Value | |
| Trading Companies & Distributors (continued) | |||
| White Cap Buyer LLC, Term Loan, 9.066%, (SOFR + 3.75%), 10/19/27 | 2,099 | $ 2,108,781 | |
| Windsor Holdings III LLC, Term Loan, 9.319%, (SOFR + 4.00%), 8/1/30 | 1,145 | 1,155,896 | |
| $ 13,942,412 | |||
| Transportation Infrastructure — 1.1% | |||
| Brown Group Holding LLC: | |||
| Term Loan, 8.166%, (SOFR + 2.75%), 6/7/28 | 2,136 | $ 2,139,280 | |
| Term Loan, 8.329%, (SOFR + 3.00%), 7/2/29 (13) | 222 | 222,720 | |
| KKR Apple Bidco LLC, Term Loan, 8.18%, (SOFR + 2.75%), 9/22/28 | 1,613 | 1,616,781 | |
| $ 3,978,781 | |||
| Wireless Telecommunication Services — 1.0% | |||
| CCI Buyer, Inc., Term Loan, 9.302%, (SOFR + 4.00%), 12/17/27 | 1,590 | $ 1,590,675 | |
| Digicel International Finance Ltd., Term Loan, 12.075%, (SOFR + 6.75%), 5/25/27 | 1,496 | 1,430,864 | |
| SBA Senior Finance II LLC, Term Loan, 7.32%, (SOFR + 2.00%), 1/25/31 | 750 | 753,375 | |
| $ 3,774,914 | |||
| Total Senior Floating-Rate Loans (identified cost $524,110,413) | $ 514,226,259 | ||
| Short-Term Investments — 2.9% |
| Security | Shares | Value | |
| Morgan Stanley Institutional Liquidity Funds - Government Portfolio, Institutional Class, 5.22% (14) | 10,949,282 | $ 10,949,282 | |
| Total Short-Term Investments (identified cost $10,949,282) | $ 10,949,282 | ||
| Total Investments — 154.7% (identified cost $602,271,852) | $ 587,881,639 | ||
| Less Unfunded Loan Commitments — (0.0)% (6) | $ (180,061) | ||
| Net Investments — 154.7% (identified cost $602,091,791) | $ 587,701,578 | ||
| Other Assets, Less Liabilities — (34.7)% | $(131,697,004) | ||
| Auction Preferred Shares Plus Cumulative Unpaid Dividends — (20.0)% | $ (75,916,998) | ||
| Net Assets Applicable to Common Shares — 100.0% | $ 380,087,576 | ||
| The percentage shown for each investment category in the Portfolio of Investments is based on net assets applicable to common shares. | |
| * | In U.S. dollars unless otherwise indicated. |
| (1) | Security exempt from registration under Rule 144A of the Securities Act of 1933, as amended. These securities may be sold in certain transactions in reliance on an exemption from registration (normally to qualified institutional buyers). At April 30, 2024, the aggregate value of these securities is $49,911,121 or 13.1% of the Trust's net assets applicable to common shares. |
| (2) | Variable rate security. The stated interest rate represents the rate in effect at April 30, 2024. |
| (3) | For fair value measurement disclosure purposes, security is categorized as Level 3 (see Note 10). |
| (4) | Non-income producing security. |
| (5) | Security was acquired in connection with a restructuring of a Senior Loan and may be subject to restrictions on resale. |
| (6) | Amount is less than 0.05% or (0.05)%, as applicable. |
| (7) | Issuer is in default with respect to interest and/or principal payments or has declared bankruptcy. For a variable rate security, interest rate has been adjusted to reflect non-accrual status. |
| (8) | Principal amount is less than $500. |
| (9) | Represents a payment-in-kind security which may pay interest in additional principal at the issuer’s discretion. |
| (10) | Senior floating-rate loans (Senior Loans) often require prepayments from excess cash flows or permit the borrowers to repay at their election. The degree to which borrowers repay, whether as a contractual requirement or at their election, cannot be predicted with accuracy. As a result, the actual remaining maturity may be substantially less than the stated maturities shown. However, Senior Loans will typically have an expected average life of approximately two to four years. Senior Loans typically have rates of interest which are redetermined periodically by reference to a base lending rate, plus a spread. These base lending rates are primarily the Secured Overnight Financing Rate (“SOFR”) and secondarily, the prime rate offered by one or more major United States banks (the “Prime Rate”). Base lending rates may be subject to a floor, or minimum rate. Rates for SOFR are generally 1 or 3-month tenors and may also be subject to a credit spread adjustment. Senior Loans are generally subject to contractual restrictions that must be satisfied before they can be bought or sold. |
| (11) | Unfunded or partially unfunded loan commitments. The stated interest rate reflects the weighted average of the reference rate and spread for the funded portion, if any, and the commitment fees on the portion of the loan that is unfunded. At April 30, 2024, the total value of unfunded loan commitments is $179,958. See Note 1F for description. |
| (12) | This Senior Loan will settle after April 30, 2024, at which time the interest rate will be determined. |
| (13) | The stated interest rate represents the weighted average interest rate at April 30, 2024 of contracts within the senior loan facility. Interest rates on contracts are primarily redetermined either monthly or quarterly by reference to the indicated base lending rate and spread and the reset period. |
| (14) | May be deemed to be an affiliated investment company. The rate shown is the annualized seven-day yield as of April 30, 2024. |
Forward Foreign Currency Exchange Contracts (OTC) | |||||||
| Currency Purchased | Currency Sold | Counterparty | Settlement Date | Unrealized Appreciation | Unrealized (Depreciation) | ||
| USD | 9,313,394 | EUR | 8,613,275 | Standard Chartered Bank | 5/3/24 | $121,303 | $ — |
| USD | 1,127,796 | EUR | 1,035,000 | Bank of America, N.A. | 5/31/24 | 22,013 | — |
| USD | 1,128,832 | EUR | 1,036,178 | Bank of America, N.A. | 5/31/24 | 21,790 | — |
| USD | 1,034,872 | EUR | 950,000 | Bank of America, N.A. | 5/31/24 | 19,902 | — |
| USD | 958,864 | EUR | 880,000 | Bank of America, N.A. | 5/31/24 | 18,681 | — |
| USD | 1,144,212 | EUR | 1,050,000 | State Street Bank and Trust Company | 5/31/24 | 22,403 | — |
| USD | 1,129,692 | EUR | 1,037,000 | State Street Bank and Trust Company | 5/31/24 | 21,773 | — |
| USD | 1,128,448 | EUR | 1,036,000 | State Street Bank and Trust Company | 5/31/24 | 21,597 | — |
| USD | 1,339,042 | GBP | 1,055,000 | HSBC Bank USA, N.A. | 5/31/24 | 20,573 | — |
Forward Foreign Currency Exchange Contracts (OTC) (continued) | |||||||
| Currency Purchased | Currency Sold | Counterparty | Settlement Date | Unrealized Appreciation | Unrealized (Depreciation) | ||
| USD | 1,338,109 | GBP | 1,053,944 | State Street Bank and Trust Company | 5/31/24 | $ 20,959 | $ — |
| USD | 9,221,392 | EUR | 8,613,275 | Standard Chartered Bank | 6/4/24 | 17,549 | — |
| USD | 6,225,999 | EUR | 5,734,660 | State Street Bank and Trust Company | 6/28/24 | 91,601 | — |
| $420,144 | $— | ||||||
| Abbreviations: | |
| DIP | – Debtor In Possession |
| EURIBOR | – Euro Interbank Offered Rate |
| LIBOR | – London Interbank Offered Rate |
| OTC | – Over-the-counter |
| PCL | – Public Company Limited |
| PIK | – Payment In Kind |
| SOFR | – Secured Overnight Financing Rate |
| SONIA | – Sterling Overnight Interbank Average |
| Currency Abbreviations: | |
| EUR | – Euro |
| GBP | – British Pound Sterling |
| USD | – United States Dollar |
| April 30, 2024 | |
| Assets | |
| Unaffiliated investments, at value (identified cost $591,142,509) | $576,752,296 |
| Affiliated investments, at value (identified cost $10,949,282) | 10,949,282 |
| Cash | 4,326,905 |
| Foreign currency, at value (identified cost $2,375,062) | 2,363,391 |
| Interest receivable | 3,169,024 |
| Dividends receivable from affiliated investments | 47,223 |
| Receivable for investments sold | 3,798,574 |
| Receivable for open forward foreign currency exchange contracts | 420,144 |
| Prepaid upfront fees on notes payable | 79,910 |
| Trustees' deferred compensation plan | 160,618 |
| Prepaid expenses | 8,479 |
| Total assets | $602,075,846 |
| Liabilities | |
| Notes payable | $120,000,000 |
| Payable for investments purchased | 24,497,528 |
| Payable to affiliates: | |
| Investment adviser fee | 353,462 |
| Trustees' fees | 3,045 |
| Trustees' deferred compensation plan | 160,618 |
| Accrued expenses | 1,056,619 |
| Total liabilities | $146,071,272 |
| Auction preferred shares (3,032 shares outstanding) at liquidation value plus cumulative unpaid dividends | $75,916,998 |
| Net assets applicable to common shares | $380,087,576 |
| Sources of Net Assets | |
| Common shares, $0.01 par value, unlimited number of shares authorized | $292,010 |
| Additional paid-in capital | 453,627,069 |
| Accumulated loss | (73,831,503) |
| Net assets applicable to common shares | $380,087,576 |
| Common Shares Issued and Outstanding | 29,200,987 |
| Net Asset Value Per Common Share | |
| Net assets ÷ common shares issued and outstanding | $13.02 |
| Six Months Ended | |
| April 30, 2024 | |
| Investment Income | |
| Dividend income | $412,570 |
| Dividend income from affiliated investments | 211,197 |
| Interest income | 27,694,691 |
| Other income | 648,032 |
| Total investment income | $28,966,490 |
| Expenses | |
| Investment adviser fee | $2,133,886 |
| Trustees’ fees and expenses | 18,296 |
| Custodian fee | 93,136 |
| Transfer and dividend disbursing agent fees | 6,003 |
| Legal and accounting services | 62,065 |
| Printing and postage | 92,606 |
| Interest expense and fees | 3,909,890 |
| Preferred shares service fee | 37,630 |
| Miscellaneous | 53,048 |
| Total expenses | $6,406,560 |
| Deduct: | |
| Waiver and/or reimbursement of expenses by affiliates | $6,085 |
| Total expense reductions | $6,085 |
| Net expenses | $6,400,475 |
| Net investment income | $22,566,015 |
| Realized and Unrealized Gain (Loss) | |
| Net realized gain (loss): | |
| Investment transactions | $(6,853,269) |
| Foreign currency transactions | 59,006 |
| Forward foreign currency exchange contracts | (33,357) |
| Net realized loss | $(6,827,620) |
| Change in unrealized appreciation (depreciation): | |
| Investments | $15,903,070 |
| Foreign currency | 2,566 |
| Forward foreign currency exchange contracts | 1,924 |
| Net change in unrealized appreciation (depreciation) | $15,907,560 |
| Net realized and unrealized gain | $9,079,940 |
| Distributions to preferred shareholders | $(3,283,374) |
| Net increase in net assets from operations | $28,362,581 |
| Six Months Ended April 30, 2024 (Unaudited) | Year Ended October 31, 2023 | |
| Increase (Decrease) in Net Assets | ||
| From operations: | ||
| Net investment income | $22,566,015 | $42,239,681 |
| Net realized loss | (6,827,620) | (13,003,715) |
| Net change in unrealized appreciation (depreciation) | 15,907,560 | 25,663,868 |
| Distributions to preferred shareholders | (3,283,374) | (5,930,706) |
| Net increase in net assets from operations | $28,362,581 | $48,969,128 |
| Distributions to common shareholders | $(21,096,597) | $(34,893,118) |
| Capital share transactions: | ||
| Reinvestment of distributions to common shareholders | $340,943 | $— |
| Net increase in net assets from capital share transactions | $340,943 | $— |
| Net increase in net assets | $7,606,927 | $14,076,010 |
| Net Assets Applicable to Common Shares | ||
| At beginning of period | $372,480,649 | $358,404,639 |
| At end of period | $380,087,576 | $372,480,649 |
| Six Months Ended | |
| April 30, 2024 | |
| Cash Flows From Operating Activities | |
| Net increase in net assets from operations | $28,362,581 |
| Distributions to preferred shareholders | 3,283,374 |
| Net increase in net assets from operations excluding distributions to preferred shareholders | $31,645,955 |
| Adjustments to reconcile net increase in net assets from operations to net cash provided by operating activities: | |
| Investments purchased | (79,543,479) |
| Investments sold and principal repayments | 73,866,516 |
| Decrease in short-term investments, net | 825,375 |
| Net amortization/accretion of premium (discount) | (1,041,708) |
| Amortization of prepaid upfront fees on notes payable | 52,773 |
| Decrease in interest receivable | 35,888 |
| Decrease in dividends receivable from affiliated investments | 28,249 |
| Increase in Trustees’ deferred compensation plan | (19,808) |
| Decrease in cash collateral due to broker | (280,000) |
| Decrease in payable to affiliate for investment adviser fee | (2,565) |
| Decrease in payable to affiliate for Trustees' fees | (40) |
| Increase in payable to affiliate for Trustees' deferred compensation plan | 19,808 |
| Decrease in accrued expenses | (941,283) |
| Increase in unfunded loan commitments | 175,000 |
| Net change in unrealized (appreciation) depreciation from investments | (15,903,070) |
| Net change in unrealized (appreciation) depreciation from forward foreign currency exchange contracts | (1,924) |
| Net realized loss from investments | 6,853,269 |
| Net cash provided by operating activities | $15,768,956 |
| Cash Flows From Financing Activities | |
| Cash distributions paid to common shareholders | $(20,755,654) |
| Cash distributions paid to preferred shareholders | (3,279,423) |
| Proceeds from notes payable | 10,000,000 |
| Payment of prepaid upfront fees on notes payable | (92,500) |
| Net cash used in financing activities | $(14,127,577) |
| Net increase in cash and restricted cash* | $1,641,379 |
| Cash and restricted cash at beginning of period (including foreign currency) | $5,048,917 |
| Cash and restricted cash at end of period (including foreign currency) | $6,690,296 |
| Supplemental disclosure of cash flow information: | |
| Noncash financing activities not included herein consist of: | |
| Reinvestment of dividends and distributions | $340,943 |
| Cash paid for interest and fees on borrowings | 4,714,415 |
| * | Includes net change in unrealized (appreciation) depreciation on foreign currency of $4,702. |
| Six Months Ended April 30, 2024 (Unaudited) | Year Ended October 31, | |||||
| 2023 | 2022 | 2021 | 2020 | 2019 | ||
| Net asset value — Beginning of period (Common shares) | $12.770 | $12.280 | $14.300 | $13.500 | $14.510 | $15.370 |
| Income (Loss) From Operations | ||||||
| Net investment income (1) | $0.773 | $1.448 | $0.917 | $0.721 | $0.816 | $0.987 |
| Net realized and unrealized gain (loss) | 0.313 | 0.441 | (1.934) | 0.907 | (0.874) | (0.796) |
| Distributions to preferred shareholders: From net investment income (1) | (0.113) | (0.203) | (0.045) | (0.003) | (0.028) | (0.072) |
| Total income (loss) from operations | $0.973 | $1.686 | $(1.062) | $1.625 | $(0.086) | $0.119 |
| Less Distributions to Common Shareholders | ||||||
| From net investment income | $(0.723) | $(1.196) | $(0.875) | $(0.806) | $(0.924) | $(0.979) |
| Tax return of capital | — | — | (0.100) | (0.056) | — | — |
| Total distributions to common shareholders | $(0.723) | $(1.196) | $(0.975) | $(0.862) | $(0.924) | $(0.979) |
Premium from common shares sold through shelf offering (see Note 6) (1) | $— | $— | $0.017 | $0.001 | $— | $— |
Discount on tender offer (see Note 6) (1) | $— | $— | $— | $0.036 | $— | $— |
| Net asset value — End of period (Common shares) | $13.020 | $12.770 | $12.280 | $14.300 | $13.500 | $14.510 |
| Market value — End of period (Common shares) | $13.080 | $11.640 | $11.170 | $14.900 | $11.900 | $12.910 |
Total Investment Return on Net Asset Value (2) | 7.64% (3) | 15.09% | (7.26)% | 12.69% | 0.42% | 1.69% |
Total Investment Return on Market Value (2) | 18.82% (3) | 15.34% | (19.10)% | 33.21% | (0.52)% | 3.55% |
| Six Months Ended April 30, 2024 (Unaudited) | Year Ended October 31, | |||||
| 2023 | 2022 | 2021 | 2020 | 2019 | ||
| Ratios/Supplemental Data | ||||||
| Net assets applicable to common shares, end of period (000’s omitted) | $380,088 | $372,481 | $358,405 | $403,589 | $497,341 | $534,714 |
| Ratios (as a percentage of average daily net assets applicable to common shares): (4)† | ||||||
| Expenses excluding interest and fees | 1.32% (5) | 1.34% | 1.37% | 1.33% | 1.32% | 1.28% |
| Interest and fee expense (6) | 2.07% (5) | 1.95% | 0.81% | 0.46% | 0.78% | 1.40% |
| Total expenses | 3.39% (5)(7) | 3.29% (7) | 2.18% (7) | 1.79% | 2.10% | 2.68% |
| Net investment income | 11.94% (5) | 11.37% | 6.83% | 5.05% | 6.03% | 6.64% |
| Portfolio Turnover | 13% (3) | 24% | 12% | 66% | 30% | 28% |
| Senior Securities: | ||||||
| Total notes payable outstanding (in 000’s) | $120,000 | $110,000 | $133,000 | $120,000 | $223,000 | $218,000 |
| Asset coverage per $1,000 of notes payable (8) | $4,800 | $5,076 | $4,265 | $4,995 | $3,570 | $3,801 |
| Total preferred shares outstanding | 3,032 | 3,032 | 3,032 | 3,032 | 3,032 | 3,032 |
| Asset coverage per preferred share (9) | $73,545 | $75,134 | $67,924 | $76,531 | $66,612 | $70,501 |
| Involuntary liquidation preference per preferred share (10) | $25,000 | $25,000 | $25,000 | $25,000 | $25,000 | $25,000 |
| Approximate market value per preferred share (10) | $25,000 | $25,000 | $25,000 | $25,000 | $25,000 | $25,000 |
| (1) | Computed using average shares outstanding. |
| (2) | Returns are historical and are calculated by determining the percentage change in net asset value or market value with all distributions reinvested. Distributions are assumed to be reinvested at prices obtained under the Trust’s dividend reinvestment plan. |
| (3) | Not annualized. |
| (4) | Ratios do not reflect the effect of dividend payments to preferred shareholders. |
| (5) | Annualized. |
| (6) | Interest and fee expense relates to the notes payable incurred to partially redeem the Trust’s APS (see Note 8). |
| (7) | Includes a reduction by the investment adviser of a portion of its adviser fee due to the Trust’s investment in the Liquidity Fund (equal to less than 0.005% of average daily net assets for the six months ended April 30, 2024 and the years ended October 31, 2023 and 2022). |
| (8) | Calculated by subtracting the Trust’s total liabilities (not including the notes payable and preferred shares) from the Trust’s total assets, and dividing the result by the notes payable balance in thousands. |
| (9) | Calculated by subtracting the Trust’s total liabilities (not including the notes payable and preferred shares) from the Trust’s total assets, dividing the result by the sum of the values of the notes payable and liquidation value of the preferred shares, and multiplying the result by the liquidation value of one preferred share. Such amount equates to 294%, 301%, 272%, 306%, 266% and 282% at April 30, 2024 and October 31, 2023, 2022, 2021, 2020 and 2019, respectively. |
| (10) | Plus accumulated and unpaid dividends. |
| † | Ratios based on net assets applicable to common shares plus preferred shares and borrowings are presented below. Ratios do not reflect the effect of dividend payments to preferred shareholders. Ratios for periods less than one year are annualized. |
| Six Months Ended April 30, 2024 (Unaudited) | Year Ended October 31, | |||||
| 2023 | 2022 | 2021 | 2020 | 2019 | ||
| Expenses excluding interest and fees | 0.88% | 0.89% | 0.88% | 0.87% | 0.84% | 0.82% |
| Interest and fee expense | 1.37% | 1.28% | 0.52% | 0.31% | 0.50% | 0.91% |
| Total expenses | 2.25% | 2.17% | 1.40% | 1.18% | 1.34% | 1.73% |
| Net investment income | 7.93% | 7.47% | 4.39% | 3.34% | 3.86% | 4.29% |
| APS Issued and Outstanding | |
| Series A | 739 |
| Series B | 763 |
| Series C | 738 |
| Series D | 792 |
| APS Dividend Rates at April 30, 2024 | Dividends Accrued to APS Shareholders | Average APS Dividend Rates | Dividend Rate Ranges (%) | |
| Series A | 8.58% | $800,794 | 8.57% | 8.49-8.74 |
| Series B | 8.58 | 826,799 | 8.57 | 8.49-8.74 |
| Series C | 8.58 | 796,584 | 8.54 | 8.49-8.62 |
| Series D | 8.57 | 859,197 | 8.58 | 8.55-8.65 |
| Aggregate cost | $602,420,230 |
| Gross unrealized appreciation | $5,881,574 |
| Gross unrealized depreciation | (20,180,082) |
| Net unrealized depreciation | $(14,298,508) |
| Fair Value | ||
| Derivative | Asset Derivative (1) | Liability Derivative |
| Forward foreign currency exchange contracts | $420,144 | $ — |
| (1) | Statement of Assets and Liabilities location: Receivable for open forward foreign currency exchange contracts. |
| Counterparty | Derivative Assets Subject to Master Netting Agreement | Derivatives Available for Offset | Non-cash Collateral Received (a) | Cash Collateral Received (a) | Net Amount of Derivative Assets (b) |
| Bank of America, N.A. | $82,386 | $ — | $ — | $ — | $82,386 |
| HSBC Bank USA, N.A. | 20,573 | — | — | — | 20,573 |
| Standard Chartered Bank | 138,852 | — | — | — | 138,852 |
| State Street Bank and Trust Company | 178,333 | — | — | — | 178,333 |
| $420,144 | $— | $— | $— | $420,144 |
| (a) | In some instances, the total collateral received and/or pledged may be more than the amount shown due to overcollateralization. |
| (b) | Net amount represents the net amount due from the counterparty in the event of default. |
| Derivative | Realized Gain (Loss) on Derivatives Recognized in Income (1) | Change in Unrealized Appreciation (Depreciation) on Derivatives Recognized in Income (2) |
| Forward foreign currency exchange contracts | $(33,357) | $1,924 |
| (1) | Statement of Operations location: Net realized gain (loss): Forward foreign currency exchange contracts. |
| (2) | Statement of Operations location: Change in unrealized appreciation (depreciation): Forward foreign currency exchange contracts. |
| Name | Value, beginning of period | Purchases | Sales proceeds | Net realized gain (loss) | Change in unrealized appreciation (depreciation) | Value, end of period | Dividend income | Shares, end of period |
Short-Term Investments | ||||||||
| Liquidity Fund | $11,774,657 | $90,745,432 | $(91,570,807) | $ — | $ — | $10,949,282 | $211,197 | 10,949,282 |
| • | Level 1 – quoted prices in active markets for identical investments |
| • | Level 2 – other significant observable inputs (including quoted prices for similar investments, interest rates, prepayment speeds, credit risk, etc.) |
| • | Level 3 – significant unobservable inputs (including a fund's own assumptions in determining the fair value of investments) |
Asset Description | Level 1 | Level 2 | Level 3* | Total |
| Asset-Backed Securities | $ — | $ 29,007,994 | $ — | $ 29,007,994 |
| Closed-End Funds | 7,014,303 | — | — | 7,014,303 |
| Common Stocks | 19,053 | 3,062,310 | 796 | 3,082,159 |
| Corporate Bonds | — | 23,601,642 | — | 23,601,642 |
| Senior Floating-Rate Loans (Less Unfunded Loan Commitments) | — | 513,621,302 | 424,896 | 514,046,198 |
| Short-Term Investments | 10,949,282 | — | — | 10,949,282 |
| Total Investments | $17,982,638 | $569,293,248 | $425,692 | $587,701,578 |
| Forward Foreign Currency Exchange Contracts | $ — | $ 420,144 | $ — | $ 420,144 |
| Total | $17,982,638 | $569,713,392 | $425,692 | $588,121,722 |
| * | None of the unobservable inputs for Level 3 assets, individually or collectively, had a material impact on the Trust. |
| Officers | |
| Kenneth A. Topping President | Nicholas S. Di Lorenzo Secretary |
| Deidre E. Walsh Vice President and Chief Legal Officer | Laura T. Donovan Chief Compliance Officer |
| James F. Kirchner Treasurer | |
| Trustees |
| George J. Gorman Chairperson | |
| Alan C. Bowser | |
| Mark R. Fetting | |
| Cynthia E. Frost | |
| Valerie A. Mosley | |
| Anchal Pachnanda* |
| Keith Quinton | |
| Marcus L. Smith | |
| Susan J. Sutherland | |
| Scott E. Wennerholm | |
| Nancy A. Wiser |
| * | Interested Trustee |
| U.S. Customer Privacy Notice | March 2024 |
| FACTS | WHAT DOES EATON VANCE DO WITH YOUR PERSONAL INFORMATION? |
Why? | Financial companies choose how they share your personal information. Federal law gives consumers the right to limit some but not all sharing. Federal law also requires us to tell you how we collect, share, and protect your personal information. Please read this notice carefully to understand what we do. |
What? | The types of personal information we collect and share depend on the product or service you have with us. This information can include:■ Social Security number and income ■ investment experience and risk tolerance ■ checking account information and wire transfer instructions |
How? | All financial companies need to share customers’ personal information to run their everyday business. In the section below, we list the reasons financial companies can share their customers’ personal information; the reasons Eaton Vance chooses to share; and whether you can limit this sharing. |
| Reasons we can share your personal information | Does Eaton Vance share? | Can you limit this sharing? |
For our everyday business purposes — such as to process your transactions, maintain your account(s), respond to court orders and legal investigations, or report to credit bureaus | Yes | No |
For our marketing purposes — to offer our products and services to you | Yes | No |
| For joint marketing with other financial companies | No | We don’t share |
For our affiliates’ everyday business purposes — information about your transactions and experiences | Yes | No* |
For our affiliates’ everyday business purposes — information about your creditworthiness | Yes | Yes* |
| For our affiliates to market to you | Yes | Yes* |
| For nonaffiliates to market to you | No | We don’t share |
To limit our sharing | Call toll-free 1-800-262-1122 or email: EVPrivacy@eatonvance.com Please note: new no longer |
Questions? | Call toll-free 1-800-262-1122 or email: EVPrivacy@eatonvance.com |
| U.S. Customer Privacy Notice — continued | March 2024 |
| Who we are | |
| Who is providing this notice? | Eaton Vance Management and our investment management affiliates (“Eaton Vance”) (see Affiliates definition below.) |
| What we do | |
| How does Eaton Vance protect my personal information? | To protect your personal information from unauthorized access and use, we use security measures that comply with federal law. These measures include computer safeguards and secured files and buildings. We have policies governing the proper handling of customer information by personnel and requiring third parties that provide support to adhere to appropriate security standards with respect to such information. |
| How does Eaton Vance collect my personal information? | We collect your personal information, for example, when you■ open an account or make deposits or withdrawals from your account ■ buy securities from us or make a wire transfer ■ give us your contact informationWe also collect your personal information from others, such as credit bureaus, affiliates, or other companies. |
| Why can’t I limit all sharing? | Federal law gives you the right to limit only■ sharing for affiliates’ everyday business purposes — information about your creditworthiness ■ affiliates from using your information to market to you ■ sharing for nonaffiliates to market to youState laws and individual companies may give you additional rights to limit sharing. (See below for more on your rights under state law.) |
| What happens when I limit sharing for an account I hold jointly with someone else? | Your choices will apply to everyone on your account. |
| Definitions | |
| Affiliates | Companies related by common ownership or control. They can be financial and nonfinancial companies.■ Our affiliates include registered investment advisers such as Eaton Vance Management, Eaton Vance Advisers International Ltd., Boston Management and Research, Calvert Research and Management, Parametric Portfolio Associates LLC, Atlanta Capital Management Company LLC, Morgan Stanley Investment Management Inc., Morgan Stanley Investment Management Co.; registered broker-dealers such as Morgan Stanley Distributors Inc. and Eaton Vance Distributors, Inc. (together, the “Investment Management Affiliates”); and companies with a Morgan Stanley name and financial companies such as Morgan Stanley Smith Barney LLC and Morgan Stanley & Co. (the “Morgan Stanley Affiliates”). |
| Nonaffiliates | Companies not related by common ownership or control. They can be financial and nonfinancial companies.■ Eaton Vance does not share with nonaffiliates so they can market to you. |
| Joint marketing | A formal agreement between nonaffiliated financial companies that together market financial products or services to you.■ Eaton Vance does not jointly market. |
| U.S. Customer Privacy Notice — continued | March 2024 |
| Other important information | |
*PLEASE NOTE: Eaton Vance does not share your creditworthiness information or your transactions and experiences information with the Morgan Stanley Affiliates, nor does Eaton Vance enable the Morgan Stanley Affiliates to market to you. Your opt outs will prevent Eaton Vance from sharing your creditworthiness information with the Investment Management Affiliates and will prevent the Investment Management Affiliates from marketing their products to you. Vermont: Except as permitted by law, we will not share personal information we collect about Vermont residents with Nonaffiliates unless you provide us with your written consent to share such information. California: Except as permitted by law, we will not share personal information we collect about California residents with Nonaffiliates and we will limit sharing such personal information with our Affiliates to comply with California privacy laws that apply to us. |
Boston, MA 02109
Boston, MA 02114-2016
Newark, NJ 07101
Boston, MA 02109
| Item 2. | Code of Ethics |
Not required in this filing.
| Item 3. | Audit Committee Financial Expert |
Not required in this filing.
| Item 4. | Principal Accountant Fees and Services |
Not required in this filing.
| Item 5. | Audit Committee of Listed Registrants |
Not required in this filing.
| Item 6. | Schedule of Investments |
Please see schedule of investments contained in the Report to Stockholders included under Item 1 of this Form N-CSR.
| Item 7. | Disclosure of Proxy Voting Policies and Procedures for Closed-End Management Investment Companies |
Not required in this filing.
| Item 8. | Portfolio Managers of Closed-End Management Investment Companies |
Not required in this filing.
| Item 9. | Purchases of Equity Securities by Closed-End Management Investment Company and Affiliated Purchasers |
No such purchases this period.
| Item 10. | Submission of Matters to a Vote of Security Holders |
No material changes.
| Item 11. | Controls and Procedures |
(a) It is the conclusion of the registrant’s principal executive officer and principal financial officer that the effectiveness of the registrant’s current disclosure controls and procedures (such disclosure controls and procedures having been evaluated within 90 days of the date of this filing) provide reasonable assurance that the information required to be disclosed by the registrant has been recorded, processed, summarized and reported within the time period specified in the Commission’s rules and forms and that the information required to be disclosed by the registrant has been accumulated and communicated to the registrant’s principal executive officer and principal financial officer in order to allow timely decisions regarding required disclosure.
(b) There have been no changes in the registrant’s internal controls over financial reporting during the period covered by this report that has materially affected, or is reasonably likely to materially affect, the registrant’s internal control over financial reporting.
| Item 12. | Disclosure of Securities Lending Activities for Closed-End Management Investment Companies |
No activity to report for the Registrant’s most recent fiscal year end.
| Item 13. | Exhibits |
| (a)(1) | Registrant’s Code of Ethics – Not applicable (please see Item 2). | |
| (a)(2)(i) | Principal Financial Officer’s Section 302 certification. | |
| (a)(2)(ii) | Principal Executive Officer’s Section 302 certification. | |
| (b) | Combined Section 906 certification. | |
Signatures
Pursuant to the requirements of the Securities Exchange Act of 1934 and the Investment Company Act of 1940, the registrant has duly caused this report to be signed on its behalf by the undersigned, thereunto duly authorized.
Eaton Vance Senior Floating-Rate Trust
| By: | /s/ Kenneth A. Topping | |
| Kenneth A. Topping | ||
| Principal Executive Officer | ||
| Date: | June 25, 2024 | |
Pursuant to the requirements of the Securities Exchange Act of 1934 and the Investment Company Act of 1940, this report has been signed below by the following persons on behalf of the registrant and in the capacities and on the dates indicated.
| By: | /s/ James F. Kirchner | |
| James F. Kirchner | ||
| Principal Financial Officer | ||
| Date: | June 25, 2024 | |
| By: | /s/ Kenneth A. Topping | |
| Kenneth A. Topping | ||
| Principal Executive Officer | ||
| Date: | June 25, 2024 | |