Exhibit 99.1
LOCM Company Overview
MARCH 2015
Forward looking statements
Certain matters being discussed by Local Corporation’s management today include forward looking statements which are made pursuant to the Safe Harbor provisions of section 21-E of the Securities Exchange Act of 1934. Investors are cautioned that statements which are not strictly historical statements, including statements concerning future expected financial performance, management objectives and plans for future operations, our relationships with strategic or other partners, the release of new products or services or enhancements to existing products or services, our expectations regarding potential acquisitions and the future performance of past acquisitions including our ability to realize expected synergies, trends in the market for our current or planned products or services, and market acceptance of our products or services, constitute forward looking statements.
The forward looking statements include, but are not limited to, any statements containing the words “expect”, “anticipate”, “estimates”, “believes”, “should”, “could”, “may”, “possibly”, and similar expressions and the negatives thereof. These forward looking statements involve a number of risks and uncertainties that could cause actual results to differ materially from the forward looking statements. Those risks and uncertainties are detailed in the company s filings from time to time with the Securities and Exchange Commission. The information contained in the forward looking statements is provided as of the date of such oral statements and the company disclaims any obligation to update such statements.
Adjusted EBITDA is defined as net income (loss) excluding: provision for income taxes; interest and other income (expense), net; depreciation; amortization; stock-based compensation charges; gain or loss on derivatives’ revaluation; net income (loss) from discontinued operations; LEC receivables reserve; finance-related charges; accrued lease liability/asset; severance charges; and an expense related to a settlement accrual.
Adjusted EBITDA, as defined above, is not a measurement under GAAP. Adjusted EBITDA is reconciled to net loss and loss per share, which we believe are the most comparable GAAP measures, at the end of this presentation. Management believes that Adjusted EBITDA provides useful information to investors about the company’s performance because it eliminates the effects of period-to-period changes in income from interest on the company’s cash and marketable securities, expense from the company’s financing transactions and the costs associated with income tax expense, capital investments, stock-based compensation expense, warrant revaluation charges, and non-recurring charges which are not directly attributable to the underlying performance of the company’s business operations. Management uses Adjusted EBITDA in evaluating the overall performance of the company’s business operations.
A limitation of non-GAAP Adjusted EBITDA is that it excludes items that often have a material effect on the company’s net income and earnings per common share calculated in accordance with GAAP. Therefore, management compensates for this limitation by using Adjusted EBITDA in conjunction with GAAP net loss and loss per share measures. The company believes that Adjusted EBITDA provides investors with an additional tool for evaluating the company’s core performance, which management uses in its own evaluation of overall performance, and as a base-line for assessing the future earnings potential of the company. While the GAAP results are more complete, the company prefers to allow investors to have this supplemental metric since, with reconciliation to GAAP (as noted above), it may provide greater insight into the company’s financial results. The non-GAAP measures should be viewed as a supplement to, and not as a substitute for, or superior to, GAAP net income or earnings per share.
LOCM—Roth Presentation– March 2015
2
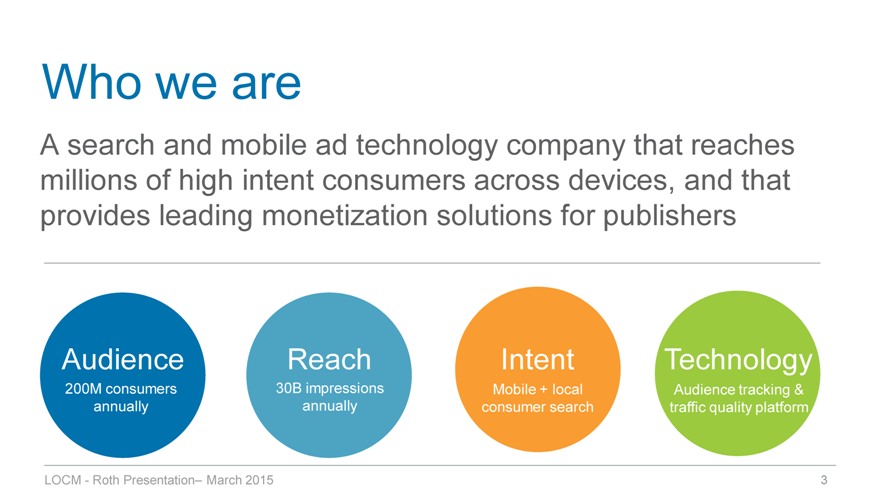
Who we are
A search and mobile ad technology company that reaches millions of high intent consumers across devices, and that provides leading monetization solutions for publishers
Audience
200M consumers annually
Reach
30B impressions annually
Intent
Mobile + local consumer search
Technology
Audience tracking & traffic quality platform
LOCM—Roth Presentation– March 2015
3
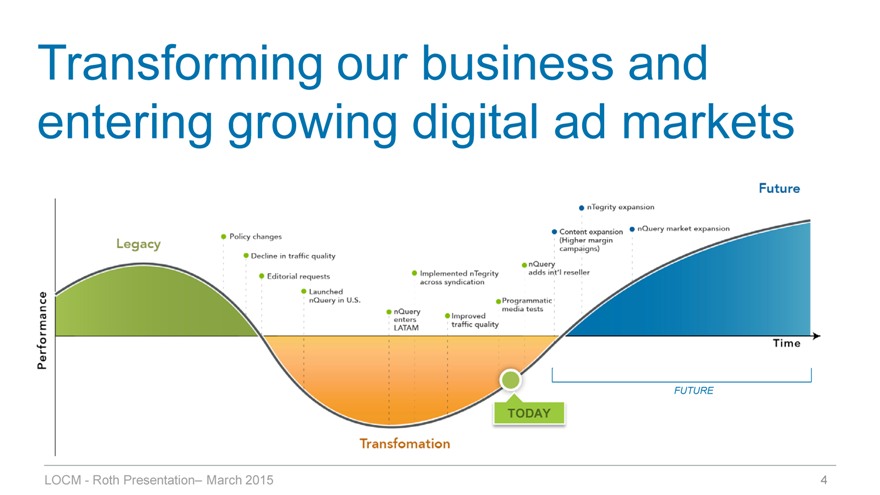
Transforming our business and entering growing digital ad markets
LOCM—Roth Presentation– March 2015
4
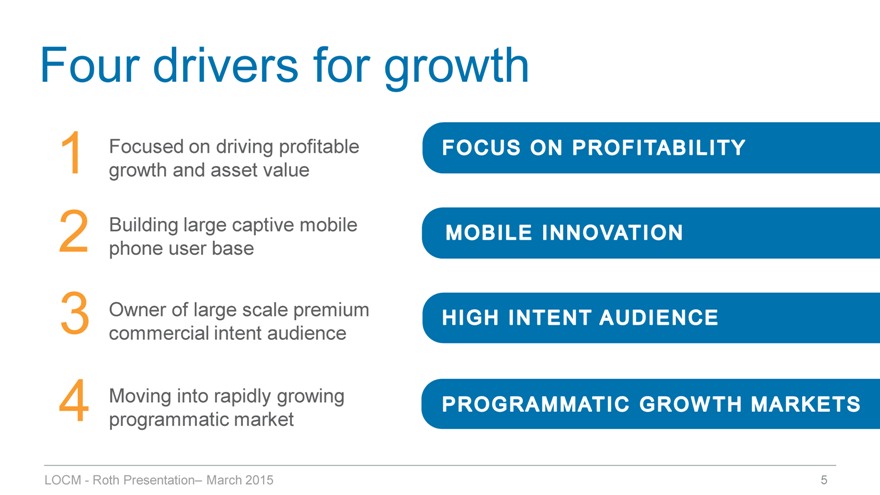
Four drivers for growth
1 Focused on driving profitable growth and asset value
2 Building large captive mobile phone user base
3 Owner of large scale premium commercial intent audience
4 Moving into rapidly growing programmatic market
FOCUS ON PROFITABILITY
MOBILE INNOVATION
HIGH INTENT AUDIENCE
PROGRAMMATIC GROWTH MARKETS
LOCM—Roth Presentation– March 2015
5
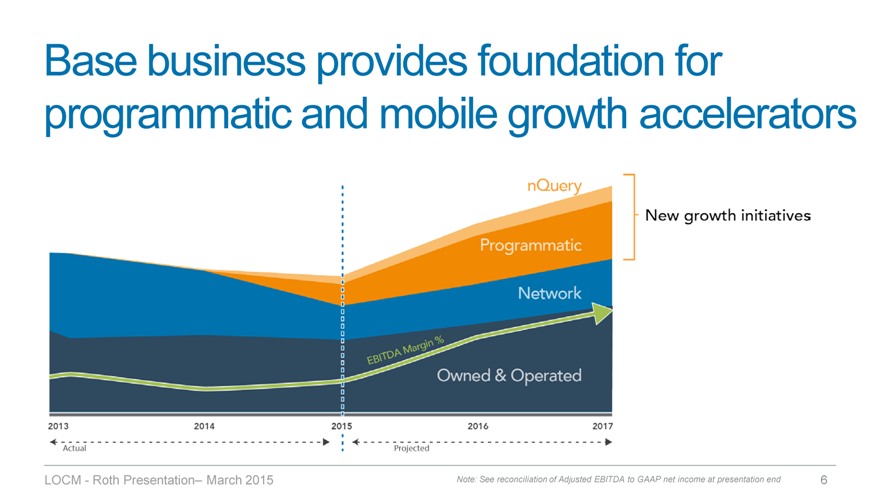
Base business provides foundation for programmatic and mobile growth accelerators
LOCM—Roth Presentation– March 2015
Note: See reconciliation of Adjusted EBITDA to GAAP net income at presentation end
6
Mobile Innovation
More search is being done on mobile devices than desktop – GLOBALLY
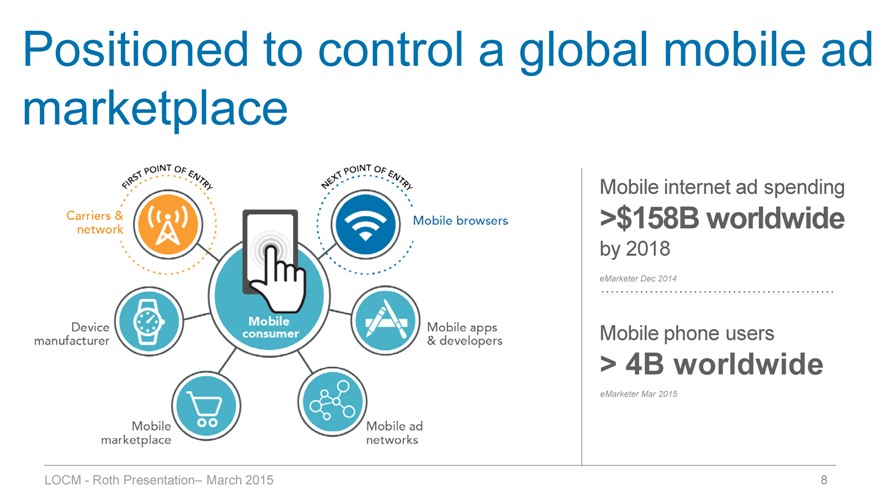
Positioned to control a global mobile ad marketplace
Mobile internet ad spending
>$158B worldwide
by 2018
eMarketer Dec 2014
Mobile phone users
> 4B worldwide
eMarketer Mar 2015
LOCM—Roth Presentation– March 2015
8
White labeled hosted search
Drive subscriber and search volume in portal & default search
Growing mobile search demand
20M unique visitors per month
Market expansion
18 countries (LATAM + US)
EMEA & APAC expected by
2H 2015
Platform expansion
Enhancing paid content
Enter into default search via browser – expected 2H2015
LOCM—Roth Presentation– March 2015
Innovation Milestone:
Concept to global launch in < 9 months
9
High-Intent Audience
The most valuable consumer for an advertiser is one actively searching for goods and services
We own a high-intent search audience
Publisher Partner Network
LOCM—Roth Presentation– March 2015
11
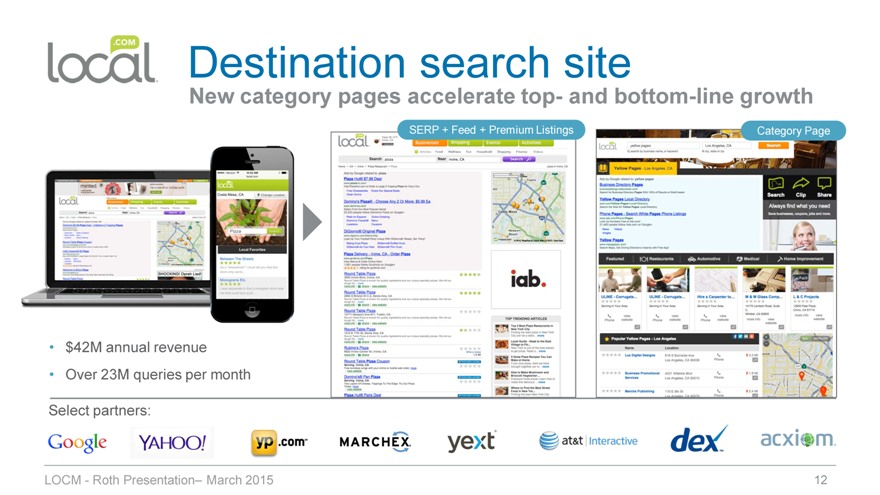
Destination search site
New category pages accelerate top- and bottom-line growth
SERP + Feed + Premium Listings
Category Page
$42M annual revenue Over 23M queries per month
Select partners:
LOCM—Roth Presentation– March 2015
12
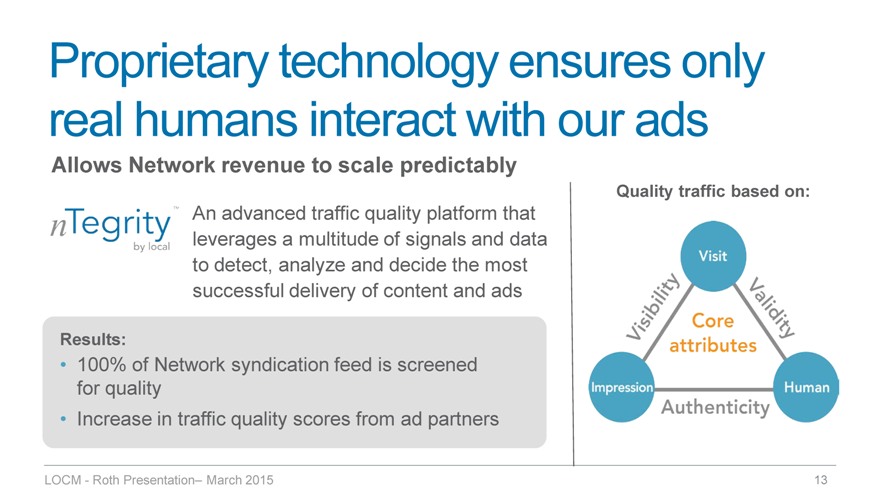
Proprietary technology ensures only real humans interact with our ads
Allows Network revenue to scale predictably
An advanced traffic quality platform that leverages a multitude of signals and data to detect, analyze and decide the most successful delivery of content and ads
Results:
100% of Network syndication feed is screened for quality
Increase in traffic quality scores from ad partners
Quality traffic based on:
LOCM—Roth Presentation– March 2015
13
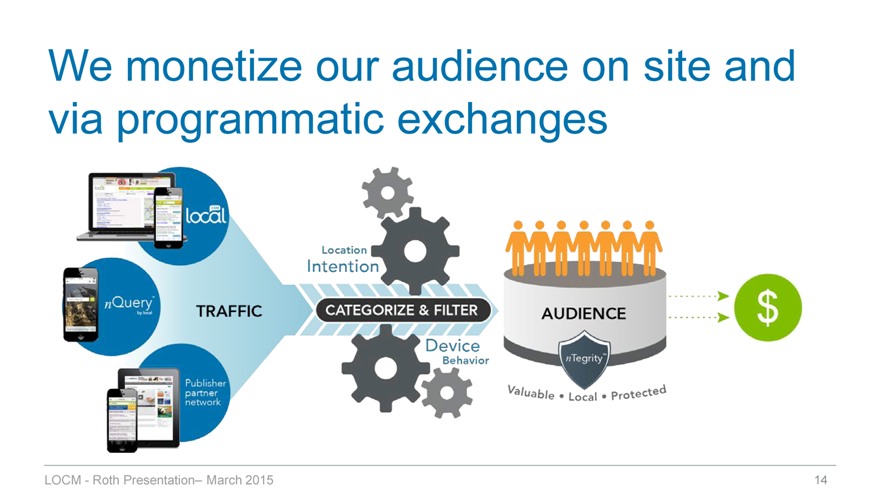
We monetize our audience on site and via programmatic exchanges
LOCM—Roth Presentation– March 2015
Programmatic Growth Markets
Programmatic and REAL-TIME BIDDING rapidly expanding and projected to become the digital media supply and demand equation
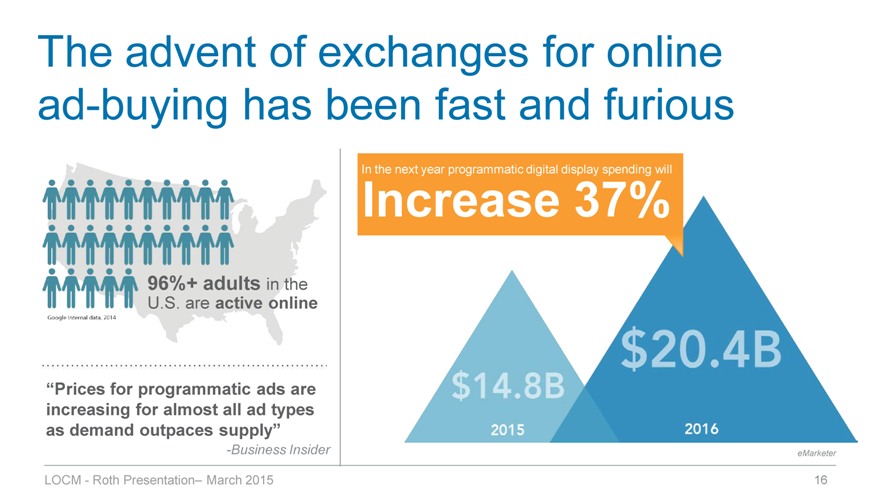
The advent of exchanges for online ad-buying has been fast and furious
96%+ adults in the
U.S. are active online
“Prices for programmatic ads are increasing for almost all ad types as demand outpaces supply”
-Business Insider
In the next year programmatic digital display spending will
Increase 37%
eMarketer
LOCM—Roth Presentation– March 2015
16
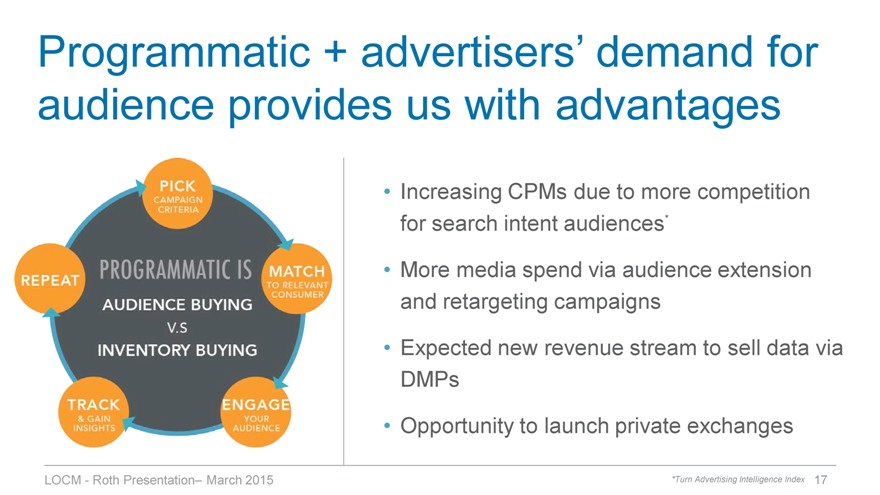
Programmatic + advertisers’ demand for audience provides us with advantages
Increasing CPMs due to more competition for search intent audiences*
More media spend via audience extension and retargeting campaigns
Expected new revenue stream to sell data via DMPs
Opportunity to launch private exchanges
LOCM—Roth Presentation– March 2015
*Turn Advertising Intelligence Index 17
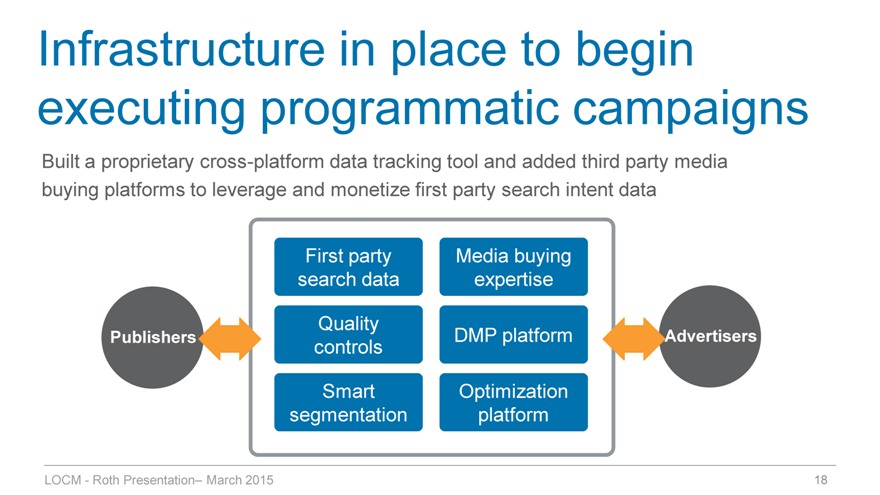
Infrastructure in place to begin executing programmatic campaigns
Built a proprietary cross-platform data tracking tool and added third party media buying platforms to leverage and monetize first party search intent data
Publishers
First party search data
Quality controls
Smart segmentation
Media buying expertise
DMP platform
Optimization platform
Advertisers
LOCM—Roth Presentation– March 2015
18
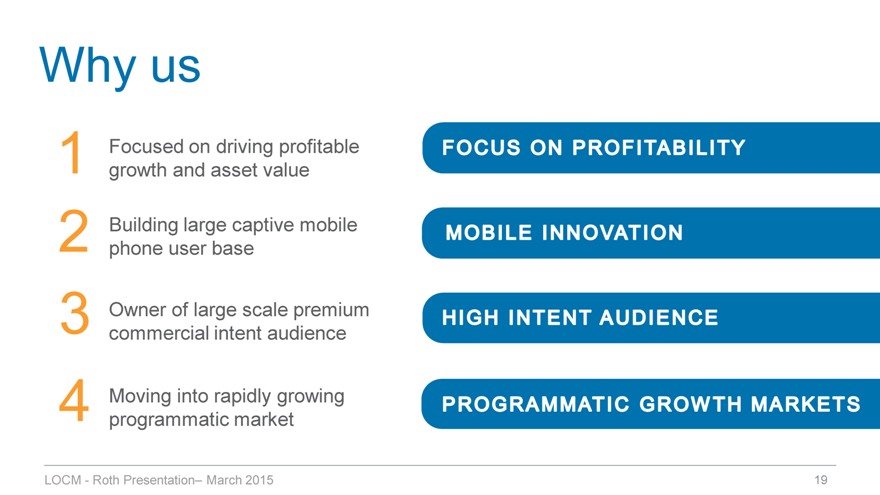
Why us
1 Focused on driving profitable growth and asset value
2 Building large captive mobile phone user base
3 Owner of large scale premium commercial intent audience
4 Moving into rapidly growing programmatic market
FOCUS ON PROFITABILITY
MOBILE INNOVATION
HIGH INTENT AUDIENCE
PROGRAMMATIC GROWTH MARKETS
LOCM—Roth Presentation– March 2015
19
Thank you
Fred Thiel
Chairman & CEO fred@local.com
Ken Cragun CFO kcragun@local.com
Local Corporation | 7555 Irvine Center Drive | Irvine CA 92618 | 949.784.0800 | www.localcorporation.com
LOCM—Roth Presentation– March 2015
20
Use of non-GAP measures
This document includes the non-GAAP financial measure of “Adjusted EBITDA” which we define as net income (loss) excluding: provision for income taxes; interest and other income (expense), net; depreciation; amortization; stock based compensation charges; gain or loss on derivatives’ revaluation, net income (loss) from discontinued operations; gain on sale of Rovion; impairment charges; LEC receivables reserve; finance related charges; accrued lease liability/asset; and severance charges. Adjusted EBITDA, as defined above, is not a measurement under GAAP. Adjusted EBITDA is reconciled to net income (loss) which we believe is the most comparable GAAP measure. A reconciliation of net income (loss) to Adjusted EBITDA is set forth within this presentation.
Management believes that Adjusted EBITDA provides useful information to investors about the company’s performance because it eliminates the effects of period-to-period changes in income from interest on the company’s cash and marketable securities, expense from the company’s financing transactions and the costs associated with income tax expense, capital investments, stock-based compensation expense, LEC receivables reserve, warrant revaluation charges; finance related charges; accrued lease liability; and severance charges which are not directly attributable to the underlying performance of the company’s business operations. Management uses Adjusted EBITDA in evaluating the overall performance of the company’s business operations.
A limitation of non-GAAP Adjusted EBITDA is that it excludes items that often have a material effect on the company’s net income and earnings per common share calculated in accordance with GAAP. Therefore, management compensates for this limitation by using Adjusted EBITDA in conjunction with net income (loss) and net income (loss) per share measures. The company believes that Adjusted EBITDA provides investors with an additional tool for evaluating the company’s core performance, which management uses in its own evaluation of overall performance, and as a base-line for assessing the future earnings potential of the company. While the GAAP results are more complete, the company prefers to allow investors to have this supplemental metric since, with reconciliation to GAAP; it may provide greater insight into the company’s financial results. The non-GAAP measures should be viewed as a supplement to, and not as a substitute for, or superior to, GAAP net income (loss) or earnings (loss) per share.
LOCM—Roth Presentation– March 2015
21
Appendix
LOCM—Roth Presentation– March 2015
22
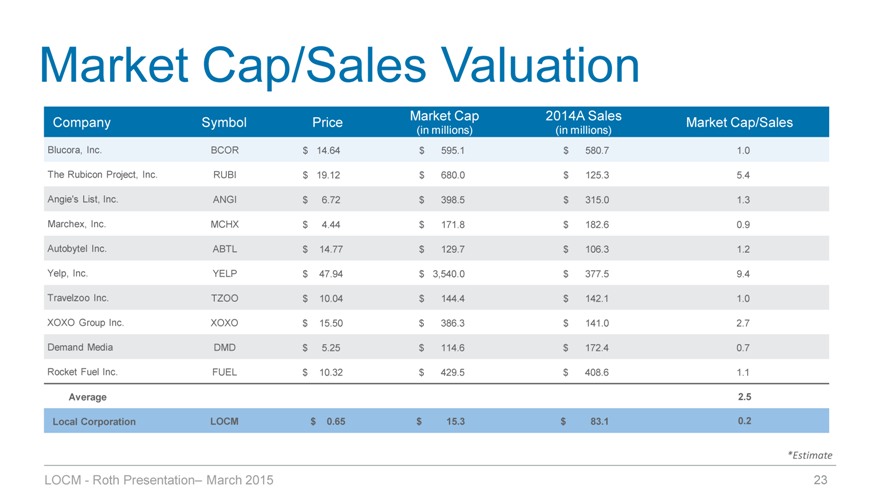
Market Cap/Sales Valuation
Company
Blucora, Inc.
The Rubicon Project, Inc.
Angie’s List, Inc.
Marchex, Inc. Autobytel Inc. Yelp, Inc. Travelzoo Inc. XOXO Group Inc. Demand Media Rocket Fuel Inc.
Average
Local Corporation
Symbol
BCOR RUBI ANGI MCHX ABTL YELP TZOO XOXO DMD FUEL
LOCM
Price
$ 14.64 $ 19.12 $ 6.72 $ 4.44 $ 14.77 $ 47.94 $ 10.04 $ 15.50 $ 5.25 $ 10.32
$ 0.65
Market Cap
(in millions) $ 595.1
$ 680.0 $ 398.5 $ 171.8 $ 129.7 $ 3,540.0 $ 144.4 $ 386.3 $ 114.6 $ 429.5
$ 15.3
2014A Sales
(in millions) $ 580.7
$ 125.3 $ 315.0 $ 182.6 $ 106.3 $ 377.5 $ 142.1 $ 141.0 $ 172.4 $ 408.6
$ 83.1
Market Cap/Sales
1.0
5.4
1.3
0.9
1.2
9.4
1.0
2.7
0.7
1.1
2.5
0.2
*Estimate
LOCM—Roth Presentation– March 2015
23
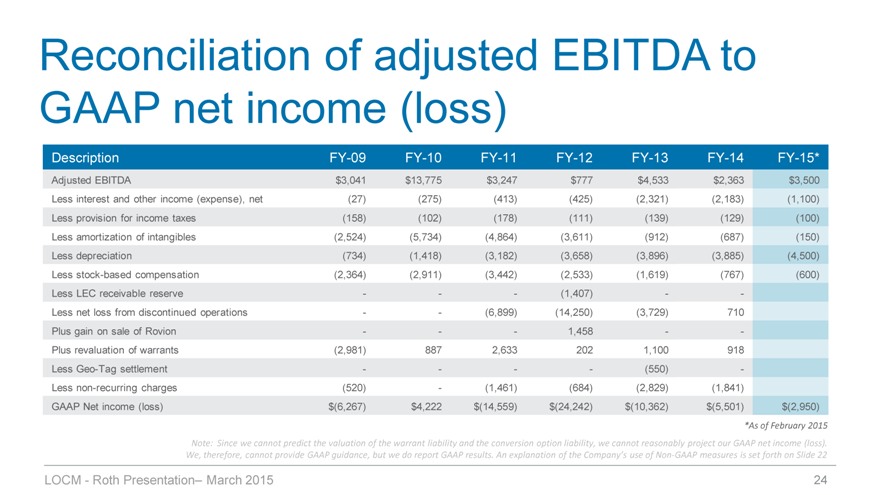
Reconciliation of adjusted EBITDA to GAAP net income (loss)
Description
Adjusted EBITDA
Less interest and other income (expense), net Less provision for income taxes Less amortization of intangibles Less depreciation Less stock-based compensation Less LEC receivable reserve Less net loss from discontinued operations Plus gain on sale of Rovion Plus revaluation of warrants Less Geo-Tag settlement Less non-recurring charges GAAP Net income (loss)
FY-09
$3,041 (27) (158) (2,524) (734) (2,364) —-(2,981) -(520) $(6,267)
FY-10
$13,775 (275) (102) (5,734) (1,418) (2,911) —-887 —$4,222
FY-11
$3,247 (413) (178) (4,864) (3,182) (3,442) -(6,899) -2,633 -(1,461) $(14,559)
FY-12
$777 (425) (111) (3,611) (3,658) (2,533) (1,407) (14,250) 1,458 202 -(684) $(24,242)
FY-13
$4,533 (2,321) (139) (912) (3,896) (1,619) -(3,729) -1,100 (550) (2,829) $(10,362)
FY-14
$2,363 (2,183) (129) (687) (3,885) (767) -710 -918 -(1,841) $(5,501)
FY-15*
$3,500 (1,100) (100) (150) (4,500) (600)
$(2,950)
*As of February 2015
Note: Since we cannot predict the valuation of the warrant liability and the conversion option liability, we cannot reasonably project our GAAP net income (loss).
We, therefore, cannot provide GAAP guidance, but we do report GAAP results. An explanation of the Company’s use of Non-GAAP measures is set forth on Slide 22
LOCM—Roth Presentation– March 2015
24
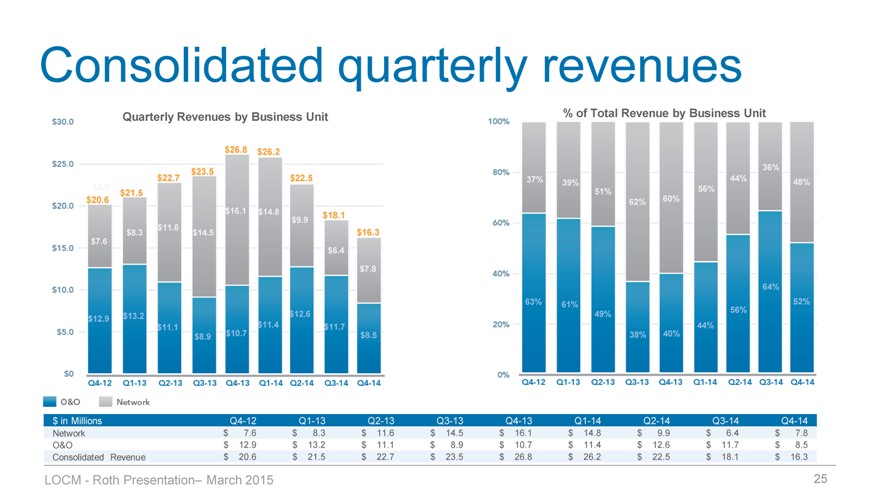
Consolidated quarterly revenues
Quarterly Revenues by Business Unit
$26.8
$26.2
$23.5
$22.7
$22.5
$5.0
$21.5
$20.6
$16.1
$14.8
$18.1
$9.9
$11.6
$8.3
$14.5
$16.3
$7.6
$6.4
$7.8
$12.9
$13.2
$12.6
$11.1
$11.4
$11.7
$8.9$10.7
$8.5
$ in Millions
Network O&O
Consolidated Revenue
Q4-12 $ 7.6 $ 12.9 $ 20.6
Q1-13 $ 8.3 $ 13.2 $ 21.5
Q2-13 $ 11.6 $ 11.1 $ 22.7
Q3-13 $ 14.5 $ 8.9 $ 23.5
Q4-13 $ 16.1 $ 10.7 $ 26.8
Q1-14 $ 14.8 $ 11.4 $ 26.2
Q2-14 $ 9.9 $ 12.6 $ 22.5
Q3-14 $ 6.4 $ 11.7 $ 18.1
Q4-14 $ 7.8 $ 8.5 $ 16.3
LOCM—Roth Presentation– March 2015
25