UNITED STATES
SECURITIES AND EXCHANGE COMMISSION
Washington, D.C. 20549
FORM N-CSR
CERTIFIED SHAREHOLDER REPORT OF REGISTERED MANAGEMENT
INVESTMENT COMPANIES
Investment Company Act file number: 811-21413
| Name of Fund: | | BlackRock Floating Rate Income Strategies Fund, Inc. (FRA) |
| Fund Address: | | 100 Bellevue Parkway, Wilmington, DE 19809 |
Name and address of agent for service: John M. Perlowski, Chief Executive Officer, BlackRock Floating
Rate Income Strategies Fund, Inc., 50 Hudson Yards, New York, NY 10001
Registrant’s telephone number, including area code: (800) 882-0052, Option 4
Date of fiscal year end: 12/31/2022
Date of reporting period: 12/31/2022
Item 1 – Report to Stockholders
(a) The Report to Shareholders is attached herewith.
| | |
 | | DECEMBER 31, 2022 |
BlackRock Debt Strategies Fund, Inc. (DSU)
BlackRock Floating Rate Income Strategies Fund, Inc. (FRA)
BlackRock Income Trust, Inc. (BKT)
BlackRock Limited Duration Income Trust (BLW)
|
| |
| Not FDIC Insured • May Lose Value • No Bank Guarantee |
| |
|
Supplemental Information (unaudited)
Section 19(a) Notices
BlackRock Debt Strategies Fund, Inc.’s (DSU), BlackRock Floating Rate Income Strategies Fund, Inc.’s (FRA), BlackRock Income Trust, Inc.’s (BKT) and BlackRock Limited Duration Income Trust’s (BLW) (collectively, the “Funds” or individually, a “Fund”) amounts and sources of distributions reported are estimates and are being provided to you pursuant to regulatory requirements and are not being provided for tax reporting purposes. The actual amounts and sources for tax reporting purposes will depend upon each Fund’s investment experience during its fiscal year and may be subject to changes based on tax regulations. Each Fund will provide a Form 1099-DIV each calendar year that will tell you how to report these distributions for U.S. federal income tax purposes.
December 31, 2022
| | | | | | | | | | | | | | | | | | | | | | | | | | | | | | | | | | | | | | | | | | | | | | | | | | |
| | | | | |
| | | | | Total Cumulative Distributions
for the Fiscal Period | | | | | | % Breakdown of the Total Cumulative
Distributions for the Fiscal Period | | | | |
| | | | | | | | | | | | | |
| | | Fund Name | |
| Net
Income |
| |
| Net Realized
Capital Gains
Short-Term |
| |
| Net Realized
Capital Gains
Long-Term |
| |
| Return of
Capital |
(a) | |
| Total Per
Common Share |
| |
|
|
| |
| Net
Income |
| |
| Net Realized
Capital Gains Short-Term |
| |
| Net Realized
Capital Gains Long-Term |
| |
| Return of
Capital |
| |
| Total Per
Common Share |
| |
|
|
|
| | | | | | | | | | | | | |
| | DSU | | $ | 0.684464 | | | $ | — | | | $ | — | | | $ | 0.011036 | | | $ | 0.695500 | | | | | | | | 98 | % | | | — | % | | | — | % | | | 2 | % | | | 100 | % | | | | |
| | FRA | | | 0.774800 | | | | — | | | | — | | | | — | | | | 0.774800 | | | | | | | | 100 | | | | — | | | | — | | | | — | | | | 100 | | | | | |
| | BKT | | | 0.589077 | | | | — | | | | — | | | | 0.441123 | | | | 1.030200 | | | | | | | | 57 | | | | — | | | | — | | | | 43 | | | | 100 | | | | | |
| | BLW | | | 0.945571 | | | | — | | | | — | | | | 0.133529 | | | | 1.079100 | | | | | | | | 88 | | | | — | | | | — | | | | 12 | | | | 100 | | | | | |
| | (a) | Each Fund estimates that it has distributed more than its net income and net realized capital gains; therefore, a portion of the distribution may be a return of capital. A return of capital may occur, for example, when some or all of the shareholder’s investment in a Fund is returned to the shareholder. A return of capital does not necessarily reflect a Fund’s investment performance and should not be confused with “yield” or “income.” When distributions exceed total return performance, the difference will reduce a Fund’s net asset value per share. | |
Section 19(a) notices for the Funds, as applicable, are available on the BlackRock website at blackrock.com.
Section 19(b) Disclosure
BlackRock Debt Strategies Fund, Inc.’s (DSU), BlackRock Floating Rate Income Strategies Fund, Inc.’s (FRA) and BlackRock Limited Duration Income Trust’s (BLW) (collectively, the “Funds” or individually, a “Fund”), acting pursuant to a U.S. Securities and Exchange Commission (“SEC”) exemptive order and with the approval of each Fund’s Board of Directors (the “Board”), each has adopted a managed distribution plan, consistent with its investment objectives and policies, to support a level distribution of income, capital gains and/or return of capital (the “Plan”). In accordance with the Plans, the Funds currently distribute the following fixed amounts per share on a monthly basis:
| | | | |
| | |
| Exchange Symbol | | Amount Per
Common Share | |
| |
DSU | | $ | 0.0705 | |
FRA | | | 0.0804 | |
BLW | | | 0.0981 | |
The fixed amounts distributed per share are subject to change at the discretion of each Fund’s Board. Under its Plan, each Fund will distribute all available net income to its shareholders as required by the Internal Revenue Code of 1986, as amended (the “Code”). If sufficient income (inclusive of net income and short-term capital gains) is not earned on a monthly basis, the Funds will distribute long-term capital gains and/or return of capital to shareholders in order to maintain a level distribution. Each monthly distribution to shareholders is expected to be at the fixed amount established by the Board; however, each Fund may make additional distributions from time to time, including additional capital gain distributions at the end of the taxable year, if required to meet requirements imposed by the Code and/or the Investment Company Act of 1940, as amended (the “1940 Act”).
Shareholders should not draw any conclusions about each Fund’s investment performance from the amount of these distributions or from the terms of the Plan. Each Fund’s total return performance is presented in its financial highlights table.
The Board may amend, suspend or terminate a Fund’s Plan at any time without prior notice to the Fund’s shareholders if it deems such actions to be in the best interests of the Fund or its shareholders. The suspension or termination of the Plan could have the effect of creating a trading discount (if the Fund’s stock is trading at or above net asset value) or widening an existing trading discount. The Funds are subject to risks that could have an adverse impact on their ability to maintain level distributions. Examples of potential risks include, but are not limited to, economic downturns impacting the markets, changes in interest rates, decreased market volatility, companies suspending or decreasing corporate dividend distributions and changes in the Code. Please refer to DSU’s and BLW’s prospectus for a more complete description of each Fund’s risks.
Managed Distribution Plan
BKT, with the approval of BKT’s Board of Directors (the “Board”), adopted a managed distribution plan, consistent with its investment objectives and policies, to support a level distribution of income, capital gains and/or return of capital (the “Plan”). In accordance with the Plan, BKT currently distributes a fixed amount of $0.0882 per share on a monthly basis.
The fixed amount distributed per share is subject to change at the discretion of the Board. BKT is currently not relying on any exemptive relief from Section 19(b) of the Investment Company Act of 1940, as amended (the “1940 Act”). Under its Plan, BKT will distribute all available investment income to its shareholders as required by the Internal Revenue Code of 1986, as amended (the “Code”). If sufficient income (inclusive of net investment income and short-term capital gains) is not earned on a monthly basis, BKT will distribute long-term capital gains and/or return of capital to shareholders in order to maintain a level distribution. Each monthly distribution to shareholders is
| | |
| 2 | | 2 0 2 2 BLACK ROCK ANNUAL REPORT TO SHAREHOLDERS |
Supplemental Information (unaudited) (continued)
expected to be at the fixed amount established by the Board; however, BKT may make additional distributions from time to time, including additional capital gain distributions at the end of the taxable year, if required to meet requirements imposed by the Code and/or the 1940 Act.
Shareholders should not draw any conclusions about BKT’s investment performance from the amount of these distributions or from the terms of the Plan. BKT’s total return performance is presented in its financial highlights table.
The Board may amend, suspend or terminate the Plan at any time without prior notice to BKT’s shareholders if it deems such actions to be in the best interests of BKT or its shareholders. The suspension or termination of the Plan could have the effect of creating a trading discount (if BKT’s stock is trading at or above net asset value) or widening an existing trading discount. BKT is subject to risks that could have an adverse impact on its ability to maintain level distributions. Examples of potential risks include, but are not limited to, economic downturns impacting the markets, changes in interest rates, decreased market volatility, companies suspending or decreasing corporate dividend distributions and changes in the Code. Please refer to BKT’s prospectus for a more complete description of BKT’s risks.
| | |
SUPPLEMENTAL INFORMATION | | 3 |
The Markets in Review
Dear Shareholder,
Significant economic headwinds emerged during the 12-month reporting period ended December 31, 2022, as investors navigated changing economic conditions and volatile markets. The U.S. economy shrank in the first half of 2022 before returning to modest growth in the third quarter, marking a shift to a more challenging post-reopening economic environment. Changes in consumer spending patterns and a tight labor market led to elevated inflation, which reached a 40-year high before beginning to moderate. Moreover, while the foremost effect of Russia’s invasion of Ukraine has been a severe humanitarian crisis, the ongoing war continued to present challenges for both investors and policymakers.
Equity prices fell as interest rates rose, particularly during the first half of the reporting period. Both large- and small-capitalization U.S. stocks fell, although equities began to recover in the second half of the year as inflation eased and economic growth resumed. Emerging market stocks and international equities from developed markets declined overall, pressured by rising interest rates and a strengthening U.S. dollar.
The 10-year U.S. Treasury yield rose notably during the reporting period, driving its price down, as investors reacted to fluctuating inflation data and attempted to anticipate its impact on future interest rate changes. The corporate bond market also faced inflationary headwinds, and heightened uncertainty led to higher corporate bond spreads (the difference in yield between U.S. Treasuries and similarly-dated corporate bonds).
The U.S. Federal Reserve (the “Fed”), acknowledging that inflation has been more persistent than expected, raised interest rates seven times. Furthermore, the Fed wound down its bond-buying programs and is accelerating the reduction of its balance sheet. While the Fed suggested that additional rate hikes were likely, it also gave indications that the pace of increases would slow if inflation continued to subside.
The pandemic’s restructuring of the economy brought an ongoing mismatch between supply and demand, contributing to the current inflationary regime. While growth slowed in 2022, we believe that taming inflation requires a more dramatic economic decline to bring demand back to a level more in line with the economy’s capacity. The Fed has been raising interest rates at the fastest pace in decades, and seems set to overtighten in its effort to get inflation back to target. With this in mind, we believe the possibility of a U.S. recession in the near-term is high, but this prospect has not yet been fully priced in by markets. Investors should expect a period of higher volatility as markets adjust to the new economic reality and policymakers attempt to adapt to rapidly changing conditions.
In this environment, while we favor an overweight to equities in the long-term, the market’s concerns over excessive rate hikes from central banks moderate our outlook. Rising input costs and a deteriorating economic backdrop are likely to challenge corporate earnings, so we are underweight equities overall in the near term. However, we see better opportunities in credit, where valuations are attractive and higher yields provide income opportunities. We believe that global investment-grade corporates, global inflation-linked bonds, and U.S. mortgage-backed securities offer strong opportunities for a six- to twelve-month horizon.
Overall, our view is that investors need to think globally, position themselves to be prepared for a decarbonizing economy, and be nimble as market conditions change. We encourage you to talk with your financial advisor and visit blackrock.com for further insight about investing in today’s markets.
Sincerely,

Rob Kapito
President, BlackRock Advisors, LLC

Rob Kapito
President, BlackRock Advisors, LLC
| | | | |
| Total Returns as of December 31, 2022 |
| | | |
| | | 6-Month | | 12-Month |
| | |
U.S. large cap equities
(S&P 500® Index) | | 2.31% | | (18.11)% |
| | |
U.S. small cap equities
(Russell 2000® Index) | | 3.91 | | (20.44) |
| | |
International equities
(MSCI Europe, Australasia, Far East Index) | | 6.36 | | (14.45) |
| | |
Emerging market equities
(MSCI Emerging Markets Index) | | (2.99) | | (20.09) |
| | |
3-month Treasury bills
(ICE BofA 3-Month U.S. Treasury Bill Index) | | 1.32 | | 1.47 |
| | |
U.S. Treasury securities
(ICE BofA 10-Year U.S. Treasury Index) | | (5.58) | | (16.28) |
| | |
U.S. investment grade bonds
(Bloomberg U.S. Aggregate Bond Index) | | (2.97) | | (13.01) |
| | |
Tax-exempt municipal bonds
(Bloomberg Municipal Bond Index) | | 0.50 | | (8.53) |
| | |
U.S. high yield bonds
(Bloomberg U.S. Corporate High Yield 2% Issuer Capped Index) | | 3.50 | | (11.18) |
|
| Past performance is not an indication of future results. Index performance is shown for illustrative purposes only. You cannot invest directly in an index. |
| | |
| 4 | | THIS PAGE IS NOT PART OF YOUR FUND REPORT |
Table of Contents
The Benefits and Risks of Leveraging
The Funds may utilize leverage to seek to enhance the distribution rate on, and net asset value (“NAV”) of, their common shares (“Common Shares”). However, there is no guarantee that these objectives can be achieved in all interest rate environments.
In general, the concept of leveraging is based on the premise that the financing cost of leverage, which is based on short-term interest rates, is normally lower than the income earned by a Fund on its longer-term portfolio investments purchased with the proceeds from leverage. To the extent that the total assets of each Fund (including the assets obtained from leverage) are invested in higher-yielding portfolio investments, each Fund’s shareholders benefit from the incremental net income. The interest earned on securities purchased with the proceeds from leverage (after paying the leverage costs) is paid to shareholders in the form of dividends, and the value of these portfolio holdings (less the leverage liability) is reflected in the per share NAV.
To illustrate these concepts, assume a Fund’s capitalization is $100 million and it utilizes leverage for an additional $30 million, creating a total value of $130 million available for investment in longer-term income securities. If prevailing short-term interest rates are 3% and longer-term interest rates are 6%, the yield curve has a strongly positive slope. In this case, a Fund’s financing costs on the $30 million of proceeds obtained from leverage are based on the lower short-term interest rates. At the same time, the securities purchased by a Fund with the proceeds from leverage earn income based on longer-term interest rates. In this case, a Fund’s financing cost of leverage is significantly lower than the income earned on a Fund’s longer-term investments acquired from such leverage proceeds, and therefore the holders of Common Shares (“Common Shareholders”) are the beneficiaries of the incremental net income.
However, in order to benefit shareholders, the return on assets purchased with leverage proceeds must exceed the ongoing costs associated with the leverage. If interest and other costs of leverage exceed a Fund’s return on assets purchased with leverage proceeds, income to shareholders is lower than if a Fund had not used leverage. Furthermore, the value of the Funds’ portfolio investments generally varies inversely with the direction of long-term interest rates, although other factors can influence the value of portfolio investments. In contrast, the amount of each Fund’s obligations under its respective leverage arrangement generally does not fluctuate in relation to interest rates. As a result, changes in interest rates can influence the Funds’ NAVs positively or negatively. Changes in the future direction of interest rates are very difficult to predict accurately, and there is no assurance that a Fund’s intended leveraging strategy will be successful.
The use of leverage also generally causes greater changes in each Fund’s NAV, market price and dividend rates than comparable portfolios without leverage. In a declining market, leverage is likely to cause a greater decline in the NAV and market price of a Fund’s shares than if the Fund were not leveraged. In addition, each Fund may be required to sell portfolio securities at inopportune times or at distressed values in order to comply with regulatory requirements applicable to the use of leverage or as required by the terms of leverage instruments, which may cause the Fund to incur losses. The use of leverage may limit a Fund’s ability to invest in certain types of securities or use certain types of hedging strategies. Each Fund incurs expenses in connection with the use of leverage, all of which are borne by shareholders and may reduce income to the shareholders. Moreover, to the extent the calculation of each Fund’s investment advisory fees includes assets purchased with the proceeds of leverage, the investment advisory fees payable to the Funds’ investment adviser will be higher than if the Funds did not use leverage.
Each Fund may utilize leverage through a credit facility or reverse repurchase agreements as described in the Notes to Financial Statements, if applicable.
Under the Investment Company Act of 1940, as amended (the “1940 Act”), each Fund is permitted to borrow money (including through the use of TOB Trusts) or issue debt securities up to 33 1/3% of its total managed assets. A Fund may voluntarily elect to limit its leverage to less than the maximum amount permitted under the 1940 Act. In addition, a Fund may also be subject to certain asset coverage, leverage or portfolio composition requirements imposed by its credit facility, which may be more stringent than those imposed by the 1940 Act.
Derivative Financial Instruments
The Funds may invest in various derivative financial instruments. These instruments are used to obtain exposure to a security, commodity, index, market, and/or other assets without owning or taking physical custody of securities, commodities and/or other referenced assets or to manage market, equity, credit, interest rate, foreign currency exchange rate, commodity and/or other risks. Derivative financial instruments may give rise to a form of economic leverage and involve risks, including the imperfect correlation between the value of a derivative financial instrument and the underlying asset, possible default of the counterparty to the transaction or illiquidity of the instrument. Pursuant to Rule 18f-4 under the 1940 Act, among other things, the Funds must either use derivative financial instruments with embedded leverage in a limited manner or comply with an outer limit on fund leverage risk based on value-at-risk. The Funds’ successful use of a derivative financial instrument depends on the investment adviser’s ability to predict pertinent market movements accurately, which cannot be assured. The use of these instruments may result in losses greater than if they had not been used, may limit the amount of appreciation a Fund can realize on an investment and/or may result in lower distributions paid to shareholders. The Funds’ investments in these instruments, if any, are discussed in detail in the Notes to Financial Statements.
| | |
| 6 | | 2 0 2 2 BLACK ROCK ANNUAL REPORT TO SHAREHOLDERS |
| | |
| Fund Summary as of December 31, 2022 | | BlackRock Debt Strategies Fund, Inc. (DSU) |
Investment Objective
BlackRock Debt Strategies Fund, Inc.’s (DSU) (the “Fund”) primary investment objective is to seek to provide current income by investing primarily in a diversified portfolio of U.S. companies’ debt instruments, including corporate loans, which are rated in the lower rating categories of the established rating services (BBB or lower by S&P Global Ratings or Baa or lower by Moody’s Investors Service, Inc. (“Moody’s”)) or unrated debt instruments, which are in the judgment of the investment adviser of equivalent quality. Corporate loans include senior and subordinated corporate loans, both secured and unsecured. The Fund may invest directly in debt instruments or synthetically through the use of derivatives. The Fund’s secondary investment objective is to provide capital appreciation.
No assurance can be given that the Fund’s investment objective will be achieved.
Fund Information
| | |
| | |
Symbol on New York Stock Exchange | | DSU |
Initial Offering Date | | March 27, 1998 |
Current Distribution Rate on Closing Market Price as of December 31, 2022 ($9.20)(a) | | 9.20% |
Current Monthly Distribution per Common Share(b) | | $0.0705 |
Current Annualized Distribution per Common Share(b) | | $0.8460 |
Leverage as of December 31, 2022(c) | | 25% |
| | (a) | Current distribution rate on closing market price is calculated by dividing the current annualized distribution per share by the closing market price. The current distribution rate may consist of income, net realized gains and/or a return of capital. Past performance is not an indication of future results. | |
| | (b) | The distribution rate is not constant and is subject to change. A portion of the distribution may be deemed a return of capital or net realized gain. | |
| | (c) | Represents bank borrowings outstanding as a percentage of total managed assets, which is the total assets of the Fund (including any assets attributable to borrowings), minus the sum of liabilities (other than borrowings representing financial leverage). Does not reflect derivatives or other instruments that may give rise to economic leverage. For a discussion of leveraging techniques utilized by the Fund, please see The Benefits and Risks of Leveraging and Derivative Financial Instruments. | |
Market Price and Net Asset Value Per Share Summary
| | | | | | | | | | | | | | | | | | | | |
| | | 12/31/22 | | | 12/31/21 | | | Change | | | High | | | Low | |
| | | | | |
Closing Market Price | | $ | 9.20 | | | $ | 11.70 | | | | (21.37 | )% | | $ | 11.75 | | | $ | 8.80 | |
Net Asset Value | | | 10.44 | | | | 11.56 | | | | (9.69 | ) | | | 11.62 | | | | 10.17 | |
GROWTH OF $10,000 INVESTMENT
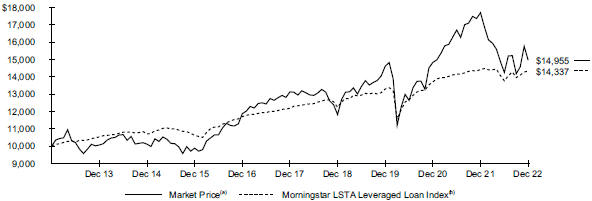
| | (a) | Represents the Fund’s closing market price on the NYSE and reflects the reinvestment of dividends and/or distributions at actual reinvestment prices. | |
| | (b) | Morningstar LSTA Leveraged Loan Index (formerly S&P® /LSTA Leveraged Loan Index), an unmanaged market value-weighted index designed to measure the performance of the U.S. leveraged loan market based upon market weightings, spreads and interest payments. | |
| | |
| Fund Summary as of December 31, 2022 (continued) | | BlackRock Debt Strategies Fund, Inc. (DSU) |
Performance
Returns for the period ended December 31, 2022 were as follows:
| | | | | | | | | | | | |
| | | Average Annual Total Returns | |
| | | | |
| | | |
| | | 1 Year | | | 5 Years | | | 10 Years | |
| | | |
Fund at NAV(a)(b) | | | (2.97 | )% | | | 3.67 | % | | | 5.46 | % |
Fund at Market Price(a)(b) | | | (15.51 | ) | | | 2.64 | | | | 4.11 | |
Reference Benchmark(c) | | | (5.93 | ) | | | 2.83 | | | | 3.87 | |
Bloomberg U.S. Corporate High Yield 2% Issuer Capped Index(d) | | | (11.18 | ) | | | 2.30 | | | | 4.03 | |
Morningstar LSTA Leveraged Loan Index | | | (0.60 | ) | | | 3.31 | | | | 3.67 | |
| | (a) | All returns reflect reinvestment of dividends and/or distributions at actual reinvestment prices. Performance results reflect the Fund’s use of leverage. | |
| | (b) | The Fund moved from a premium to NAV to a discount during the period, which accounts for the difference between performance based on market price and performance based on NAV. | |
| | (c) | The Reference Benchmark is comprised of the Bloomberg U.S. Corporate High Yield 2% Issuer Capped Index (50%) and the Morningstar LSTA Leveraged Loan Index (formerly S&P® /LSTA Leveraged Loan Index) (50%). The Reference Benchmark’s index content and weightings may have varied over past periods. | |
| | (d) | An unmanaged index comprised of issuers that meet the following criteria: at least $150 million par value outstanding; maximum credit rating of Ba1; at least one year to maturity; and no issuer represents more than 2% of the index. | |
Performance results may include adjustments made for financial reporting purposes in accordance with U.S. generally accepted accounting principles. Past performance is not an indication of future results.
The Fund is presenting the performance of one or more indices for informational purposes only. The Fund is actively managed and does not seek to track or replicate the performance of any index. The index performance shown is not intended to be indicative of the Fund’s investment strategies, portfolio components or past or future performance.
More information about the Fund’s historical performance can be found in the “Closed End Funds” section of blackrock.com.
The following discussion relates to the Fund’s absolute performance based on NAV:
What factors influenced performance?
Floating rate loan interest lost ground in 2022 amid a broader downturn in the bond market, but outpaced most major fixed-income categories. At a time of high inflation and rising interest rates, loans’ floating-rate feature fueled elevated investor demand. On the other hand, high yield bonds and investment-grade corporates both posted sizable losses as the “risk-off” environment led to underperformance for the market’s credit sectors.
Floating rate loan interest was the largest contributor to the Fund’s absolute returns in 2022. Foreign-exchange positioning, which the Fund achieved through the use of derivatives, also contributed to results. From a sector perspective, property and casualty insurance, airlines and automotive were the three top contributors.
An allocation to high yield bonds detracted from performance. A position in investment-grade corporates, while limited, also hurt performance. At the sector level, healthcare, wireline telecommunications, and cable and satellite were the leading detractors. CCC and B rated bonds were the most notable detractors from a ratings perspective, reflecting their larger portfolio weightings and higher beta (sensitivity to market movements).
The Fund’s practice of maintaining a specified level of monthly distributions to shareholders did not have a material impact on the Fund’s investment strategy. The distribution policy resulted in return of capital for the period. Refer to the financial highlights and income tax information sections in this report for further information about the distributions.
Describe recent portfolio activity.
The Fund reduced its positions in floating rate loan interest and high yield bonds, and it modestly increased its allocation to investment-grade corporates. It also reduced leverage given rising borrowing costs and an uncertain outlook for growth. It reduced its weighting in B and CCC rated issues in an effort to reduce risk, but it maintained overweights in both areas. It kept its weighting in BB rated debt largely unchanged.
The Fund further decreased its allocations to the technology and healthcare sectors. However, the investment adviser believed bottom-up security selection was the most important driver of performance. The Fund continued to use liquid, index-based derivatives in the loan and high-yield markets to manage its positioning.
Describe portfolio positioning at period end.
Although the investment adviser reduced the Fund’s weightings in the technology and healthcare sectors, they still represent fairly large allocations in the portfolio given their respective sizes in the floating rate loan interest and high yield markets. Leverage was lower at the end of 2022 compared to its level of a year earlier.
The views expressed reflect the opinions of BlackRock as of the date of this report and are subject to change based on changes in market, economic or other conditions. These views are not intended to be a forecast of future events and are no guarantee of future results.
| | |
| 8 | | 2 0 2 2 BLACK ROCK ANNUAL REPORT TO SHAREHOLDERS |
| | |
| Fund Summary as of December 31, 2022 (continued) | | BlackRock Debt Strategies Fund, Inc. (DSU) |
Overview of the Fund’s Total Investments
| | | | |
PORTFOLIO COMPOSITION | |
| |
| |
| Asset Type | | 12/31/22 | |
| |
| |
Floating Rate Loan Interests | | | 82.9% | |
Corporate Bonds | | | 16.4 | |
Other* | | | 0.7 | |
| |
| | | | |
CREDIT QUALITY ALLOCATION | |
| |
| |
| Credit Rating(a)(b) | | 12/31/22 | |
| |
| |
A | | | 0.1% | |
BBB/Baa | | | 6.6 | |
BB/Ba | | | 28.4 | |
B | | | 57.2 | |
CCC/Caa | | | 6.3 | |
C | | | —(c) | |
N/R | | | 1.4 | |
| |
| (a) | For financial reporting purposes, credit quality ratings shown above reflect the highest rating assigned by either S&P Global Ratings or Moody’s Investors Service, Inc. if ratings differ. These rating agencies are independent, nationally recognized statistical rating organizations and are widely used. Investment grade ratings are credit ratings of BBB/Baa or higher. Below investment grade ratings are credit ratings of BB/Ba or lower. Investments designated N/R are not rated by either rating agency. Unrated investments do not necessarily indicate low credit quality. Credit quality ratings are subject to change. |
| (b) | Excludes short-term securities. |
| (c) | Rounds to less than 0.1%. |
| * | Includes one or more investment categories that individually represents less than 1.0% of the Fund’s total investments. Please refer to the Schedule of Investments for details. |
| | |
| Fund Summary as of December 31, 2022 | | BlackRock Floating Rate Income Strategies Fund, Inc. (FRA) |
Investment Objective
BlackRock Floating Rate Income Strategies Fund, Inc.’s (FRA) (the “Fund”) investment objective is to provide shareholders with high current income and such preservation of capital as is consistent with investment in a diversified, leveraged portfolio consisting primarily of floating rate debt securities and instruments. The Fund seeks to achieve its investment objective by investing, under normal market conditions, at least 80% of its managed assets in floating rate debt securities, including floating or variable rate debt securities that pay interest at rates that adjust whenever a specified interest rate changes and/or which reset on predetermined dates (such as the last day of a month or calendar quarter). The Fund invests a substantial portion of its investments in floating rate debt securities consisting of secured or unsecured senior floating rate loans that are rated below investment grade at the time of investment or, if unrated, are considered by the investment adviser to be of comparable quality. The Fund may invest directly in floating rate debt securities or synthetically through the use of derivatives.
No assurance can be given that the Fund’s investment objective will be achieved.
Fund Information
| | |
| | |
Symbol on New York Stock Exchange | | FRA |
Initial Offering Date | | October 31, 2003 |
Current Distribution Rate on Closing Market Price as of December 31, 2022 ($11.26)(a) | | 8.57% |
Current Monthly Distribution per Common Share(b) | | $0.0804 |
Current Annualized Distribution per Common Share(b) | | $0.9648 |
Leverage as of December 31, 2022(c) | | 25% |
| | (a) | Current distribution rate on closing market price is calculated by dividing the current annualized distribution per share by the closing market price. Past performance is not an indication of future results. | |
| | (b) | The distribution rate is not constant and is subject to change. | |
| | (c) | Represents bank borrowings outstanding as a percentage of total managed assets, which is the total assets of the Fund (including any assets attributable to borrowings), minus the sum of liabilities (other than borrowings representing financial leverage). Does not reflect derivatives or other instruments that may give rise to economic leverage. For a discussion of leveraging techniques utilized by the Fund, please see The Benefits and Risks of Leveraging and Derivative Financial Instruments. | |
Market Price and Net Asset Value Per Share Summary
| | | | | | | | | | | | | | | | | | | | |
| | | 12/31/22 | | | 12/31/21 | | | Change | | | High | | | Low | |
| | | | | |
Closing Market Price | | $ | 11.26 | | | $ | 13.43 | | | | (16.16 | )% | | $ | 13.90 | | | $ | 11.01 | |
Net Asset Value | | | 12.81 | | | | 13.85 | | | | (7.51 | ) | | | 13.97 | | | | 12.39 | |
GROWTH OF $10,000 INVESTMENT
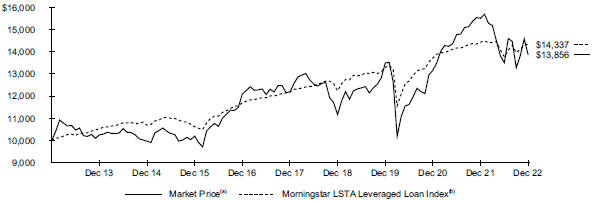
| | (a) | Represents the Fund’s closing market price on the NYSE and reflects the reinvestment of dividends and/or distributions at actual reinvestment prices. | |
| | (b) | Morningstar LSTA Leveraged Loan Index (formerly S&P® /LSTA Leveraged Loan Index), an unmanaged market value-weighted index designed to measure the performance of the U.S. leveraged loan market based upon market weightings, spreads and interest payments. | |
| | |
| 10 | | 2 0 2 2 BLACK ROCK ANNUAL REPORT TO SHAREHOLDERS |
| | |
| Fund Summary as of December 31, 2022 (continued) | | BlackRock Floating Rate Income Strategies Fund, Inc. (FRA) |
Performance
Returns for the period ended December 31, 2022 were as follows:
| | | | | | | | | | | | |
| | | Average Annual Total Returns | |
| | | |
| | | 1 Year | | | 5 Years | | | 10 Years | |
| | | |
Fund at NAV(a)(b) | | | (1.34 | )% | | | 3.72 | % | | | 4.70 | % |
Fund at Market Price(a)(b) | | | (10.57 | ) | | | 2.61 | | | | 3.32 | |
| | | | |
Morningstar LSTA Leveraged Loan Index | | | (0.60 | ) | | | 3.31 | | | | 3.67 | |
| | (a) | All returns reflect reinvestment of dividends and/or distributions at actual reinvestment prices. Performance results reflect the Fund’s use of leverage. | |
| | (b) | The Fund’s discount to NAV widened during the period, which accounts for the difference between performance based on market price and performance based on NAV. | |
Performance results may include adjustments made for financial reporting purposes in accordance with U.S. generally accepted accounting principles. Past performance is not an indication of future results.
The Fund is presenting the performance of one or more indices for informational purposes only. The Fund is actively managed and does not seek to track or replicate the performance of any index. The index performance shown is not intended to be indicative of the Fund’s investment strategies, portfolio components or past or future performance.
More information about the Fund’s historical performance can be found in the “Closed End Funds” section of blackrock.com.
The following discussion relates to the Fund’s absolute performance based on NAV:
What factors influenced performance?
Floating rate loan interest lost ground in 2022 amid a broader downturn in the bond market, but outpaced most major fixed-income categories. At a time of high inflation and rising interest rates, loans’ floating-rate feature fueled elevated investor demand.
The Fund’s holdings in the property and casualty, airline and chemical sectors were the leading contributors to performance. Conversely, positions in the healthcare, wireline telecommunications, leisure and consumer products sectors detracted.
In terms of rating class, holdings in the BB and BBB rated categories produced the best results. Lower-rated CCC and C securities detracted, which was consistent with the broader “risk-off” sentiment in the market.
The Fund’s practice of maintaining a specified level of monthly distributions to shareholders did not have a material impact on the Fund’s investment strategy. The distribution policy did not result in return of capital for the period. Refer to the financial highlights and income tax information sections in this report for further information about the distributions.
Describe recent portfolio activity.
The investment adviser marginally decreased the Fund’s allocation to loans, and it sought to reduce leverage in response to rising borrowing costs and uncertainty about the economy. It reduced the Fund’s weightings in B and CCC rated issues in an effort to reduce risk, but it maintained overweights in both areas. It kept the weighting in BB rated debt largely unchanged.
The investment adviser tactically managed the Fund’s sector-level positioning by further reducing its allocations to technology and healthcare. However, the investment adviser believed bottom-up security selection was the most important driver of performance. The Fund continued to use liquid, index-based derivatives in the loan and high-yield markets to manage its positioning.
Describe portfolio positioning at period end.
The Fund remained predominately invested in floating rate loan interest, with a weighting of over 95% of assets held in the category. The rest of the portfolio was allocated to high yield bonds and cash.
B rated loans were the Fund’s largest allocation by credit rating. Within the category, the investment adviser remained highly selective with respect to B3 rated issues given the higher risk of downgrades at a time of slowing economic growth. In the CCC space, it focused on avoiding the lowest-quality segments of the market.
Although the investment adviser reduced the Fund’s positions in the technology and healthcare sectors, they still represent fairly large allocations in the portfolio given their respective weightings in the index. In general, the Fund’s sector composition is a byproduct of individual security selection.
The investment adviser had a bias toward larger loan tranches of $1 billion and above, and it maintained a preference for loan/bond capital structures over the loan-only segment.
The views expressed reflect the opinions of BlackRock as of the date of this report and are subject to change based on changes in market, economic or other conditions. These views are not intended to be a forecast of future events and are no guarantee of future results.
| | |
| Fund Summary as of December 31, 2022 (continued) | | BlackRock Floating Rate Income Strategies Fund, Inc. (FRA) |
Overview of the Fund’s Total Investments
PORTFOLIO COMPOSITION
| | | | |
| | |
| Asset Type | | 12/31/22 | |
| |
Floating Rate Loan Interests | | | 97.9 | % |
Corporate Bonds | | | 1.7 | |
Other* | | | 0.4 | |
CREDIT QUALITY ALLOCATION
| | | | |
| | |
| Credit Rating(a)(b) | | 12/31/22 | |
| |
BBB/Baa | | | 5.2 | % |
BB/Ba | | | 26.4 | |
B | | | 61.3 | |
CCC/Caa | | | 5.2 | |
C | | | — | (c) |
N/R | | | 1.9 | |
| (a) | For financial reporting purposes, credit quality ratings shown above reflect the highest rating assigned by either S&P Global Ratings or Moody’s Investors Service, Inc. if ratings differ. These rating agencies are independent, nationally recognized statistical rating organizations and are widely used. Investment grade ratings are credit ratings of BBB/Baa or higher. Below investment grade ratings are credit ratings of BB/Ba or lower. Investments designated N/R are not rated by either rating agency. Unrated investments do not necessarily indicate low credit quality. Credit quality ratings are subject to change. |
| (b) | Excludes short-term securities. |
| (c) | Rounds to less than 0.1%. |
| * | Includes one or more investment categories that individually represents less than 1.0% of the Fund’s total investments. Please refer to the Schedule of Investments for details. |
| | |
| 12 | | 2 0 2 2 BLACK ROCK ANNUAL REPORT TO SHAREHOLDERS |
| | |
| Fund Summary as of December 31, 2022 | | BlackRock Income Trust, Inc. (BKT) |
Investment Objective
BlackRock Income Trust, Inc.’s (BKT) (the “Fund”) investment objective is to manage a portfolio of high-quality securities to achieve both preservation of capital and high monthly income. The Fund seeks to achieve its investment objective by investing at least 65% of its assets in mortgage-backed securities. The Fund invests at least 80% of its assets in securities that are (i) issued or guaranteed by the U.S. government or one of its agencies or instrumentalities or (ii) rated at the time of investment either AAA by S&P Global Ratings or Aaa by Moody’s Investors Service, Inc. The Fund may invest directly in such securities or synthetically through the use of derivatives.
No assurance can be given that the Fund’s investment objective will be achieved.
Fund Information
| | |
| | |
Symbol on New York Stock Exchange | | BKT |
Initial Offering Date | | July 22,1988 |
Current Distribution Rate on Closing Market Price as of December 31, 2022 ($12.34)(a) | | 8.58% |
Current Monthly Distribution per Common Share(b) | | $0.0882 |
Current Annualized Distribution per Common Share(b) | | $1.0584 |
Leverage as of December 31, 2022(c) | | 29% |
| | (a) | Current distribution rate on closing market price is calculated by dividing the current annualized distribution per share by the closing market price. The current distribution rate may consist of income, net realized gains and/or a return of capital. Past performance is not an indication of future results. | |
| | (b) | The distribution rate is not constant and is subject to change. A portion of the distribution may be deemed a return of capital or net realized gain. | |
| | (c) | Represents reverse repurchase agreements as a percentage of total managed assets, which is the total assets of the Fund (including any assets attributable to any borrowings) minus the sum of its liabilities (other than borrowings representing financial leverage). Does not reflect derivatives or other instruments that may give rise to economic leverage. For a discussion of leveraging techniques utilized by the Fund, please see The Benefits and Risks of Leveraging and Derivative Financial Instruments. | |
Market Price and Net Asset Value Per Share Summary(a)
| | | | | | | | | | | | | | | | | | | | |
| | | 12/31/22 | | | 12/31/21 | | | Change | | | High | | | Low | |
| | | | | |
Closing Market Price | | $ | 12.34 | | | $ | 16.95 | | | | (27.20 | )% | | $ | 16.95 | | | $ | 11.63 | |
Net Asset Value | | | 13.10 | | | | 16.94 | | | | (22.67 | ) | | | 16.94 | | | | 12.62 | |
| | (a) | Market price and net asset value per share reflect a 1-for-3 reverse stock split effective after the close of trading on October 17, 2022 for the common shareholders of record on October 17, 2022. See Note 11 of the Notes to Financial Statements for details. | |
GROWTH OF $10,000 INVESTMENT
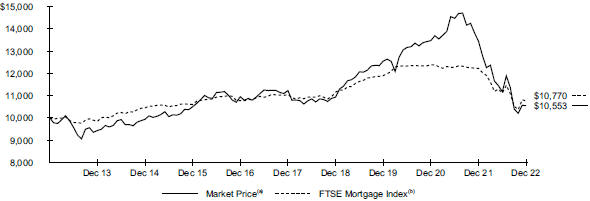
| | (a) | Represents the Fund’s closing market price on the NYSE and reflects the reinvestment of dividends and/or distributions at actual reinvestment prices. | |
| | (b) | An unmanaged index that includes all outstanding government sponsored fixed rate mortgage-backed securities, weighted in proportion to their current market capitalization. | |
| | |
| Fund Summary as of December 31, 2022 (continued) | | BlackRock Income Trust, Inc. (BKT) |
Performance
Returns for the period ended December 31, 2022 were as follows:
| | | | | | | | | | | | |
| | | Average Annual Total Returns | |
| | | |
| | | 1 Year | | | 5 Years | | | 10 Years | |
| | | |
Fund at NAV(a)(b) | | | (16.67 | )% | | | (1.30 | )% | | | 0.69 | % |
Fund at Market Price(a)(b) | | | (21.50 | ) | | | (1.24 | ) | | | 0.54 | |
| | | | |
FTSE Mortgage Index | | | (11.92 | ) | | | (0.51 | ) | | | 0.74 | |
| | (a) | All returns reflect reinvestment of dividends and/or distributions at actual reinvestment prices. Performance results reflect the Fund’s use of leverage. | |
| | (b) | The Fund moved from a premium to NAV to a discount during the period, which accounts for the difference between performance based on market price and performance based on NAV. | |
Performance results may include adjustments made for financial reporting purposes in accordance with U.S. generally accepted accounting principles. Past performance is not an indication of future results.
The Fund is presenting the performance of one or more indices for informational purposes only. The Fund is actively managed and does not seek to track or replicate the performance of any index. The index performance shown is not intended to be indicative of the Fund’s investment strategies, portfolio components or past or future performance.
More information about the Fund’s historical performance can be found in the “Closed End Funds” section of blackrock.com.
The following discussion relates to the Fund’s absolute performance based on NAV:
What factors influenced performance?
The Fund’s allocation to agency collateralized mortgage obligations (“CMOs”) as well as agency MBS derivatives (including interest-only and inverse interest-only positions) detracted from performance during the one-year period, as valuations on these sectors weakened in-line with the adverse macro environment and increased volatility. Duration exposure also detracted from fund performance given the notable move higher in government bond yields throughout 2022. These losses were partially offset by the Fund’s positioning on the MBS coupon stack, where its focus on middle coupon MBS (3.0s to 4.5s) outperformed the Benchmark’s concentration in lower coupons. The Fund’s positioning in MBS pass-throughs also benefited from its focus on specified pools, which outperformed the generic seasoned collateral of the Benchmark.
The Fund’s practice of maintaining a specified level of monthly distributions to shareholders did not have a material impact on the Fund’s investment strategy. The distribution policy resulted in return of capital for the period. Refer to the financial highlights and income tax information sections in this report for further information about the distributions.
Describe recent portfolio activity.
During the period, the Fund added to its Agency CMO and Agency mortgage derivative allocations to take advantage of widened valuations. The Fund also added exposure to Agency MBS specified pools in the middle to higher end of the MBS coupon stack. The Fund reduced its position in Agency CMBS, given tight valuations relative to the yield available in Agency MBS.
Describe portfolio positioning at period end.
The Fund continued to hold a substantial allocation to well-structured Agency CMOs as well as agency MBS interest-only derivatives, both of which served as a source of high-quality income. Security selection within the Agency CMO and MBS derivatives holdings were focused on seasoned collateral, which demonstrated more favorable prepayment performance across both higher and lower mortgage rate regimes relative to generic collateral. The investment adviser believed that the Fund’s allocation to MBS interest-only derivatives is expected to continue benefiting from the increase in mortgage rates and corresponding decrease in borrower refinancing.
The Fund also held a substantial allocation to agency MBS pass-throughs, with a focus on specified pool collateral types that offered a combination of extension and call protection. Within the MBS coupon stack, the Fund held an overweight in middle coupon MBS (3.0s to 4.5s), given that tthe investment adviser believed they provided an appealing yield spread to Treasuries while retaining a safe enough cushion from prepayment risk at current mortgage rate levels. The Fund was overweight duration relative to the Reference Benchmark and modestly short convexity (i.e., the rate at which duration changes in response to interest rate movements).
The Fund held only marginal positions in other securitized assets such as non-agency residential MBS and CMBS, preferring to focus on prepayment and structural opportunities in higher quality agency-backed assets rather than seek credit exposure.
The views expressed reflect the opinions of BlackRock as of the date of this report and are subject to change based on changes in market, economic or other conditions. These views are not intended to be a forecast of future events and are no guarantee of future results.
| | |
| 14 | | 2 0 2 2 BLACK ROCK ANNUAL REPORT TO SHAREHOLDERS |
| | |
| Fund Summary as of December 31, 2022 (continued) | | BlackRock Income Trust, Inc. (BKT) |
Overview of the Fund’s Total Investments
PORTFOLIO COMPOSITION
| | | | |
| | |
| Asset Type(a) | | 12/31/22 | |
| |
U.S. Government Sponsored Agency Securities | | | 94.1 | % |
Non-Agency Mortgage-Backed Securities | | | 5.9 | |
Asset-Backed Securities | | | — | (b) |
CREDIT QUALITY ALLOCATION
| | | | | | | | |
| | | |
| Credit Rating(a)(c) | | | | | 12/31/22 | |
| | |
AAA/Aaa(d) | | | | | | | 94.2 | % |
AA/Aa | | | | | | | 5.8 | |
CCC/Caa | | | | | | | — | (b) |
N/R | | | | | | | — | (b) |
| (a) | Excludes short-term securities. |
| (b) | Rounds to less than 0.1%. |
| (c) | For financial reporting purposes, credit quality ratings shown above reflect the highest rating assigned by either S&P Global Ratings or Moody’s Investors Service, Inc. if ratings differ. These rating agencies are independent, nationally recognized statistical rating organizations and are widely used. Investment grade ratings are credit ratings of BBB/Baa or higher. Below investment grade ratings are credit ratings of BB/Ba or lower. Investments designated N/R are not rated by either rating agency. Unrated investments do not necessarily indicate low credit quality. Credit quality ratings are subject to change. |
| (d) | Includes U.S. Government Sponsored Agency Securities which are deemed AAA/Aaa by the investment adviser. |
| | |
| Fund Summary as of December 31, 2022 | | BlackRock Limited Duration Income Trust (BLW) |
Investment Objective
BlackRock Limited Duration Income Trust’s (BLW) (the “Fund”) investment objective is to provide current income and capital appreciation. The Fund seeks to achieve its investment objective by investing primarily in three distinct asset classes:
| | • | | intermediate duration, investment grade corporate bonds, mortgage-related securities, asset-backed securities and U.S. Government and agency securities; |
| | • | | senior, secured floating rate loans made to corporate and other business entities; and |
| | • | | U.S. dollar-denominated securities of U.S. and non-U.S. issuers rated below investment grade at the time of investment or unrated and deemed by the investment adviser to be of comparable quality and, to a limited extent, non-U.S. dollar denominated securities of non-U.S. issuers rated below investment grade or unrated and deemed by the investment adviser to be of comparable quality. |
The Fund’s portfolio normally has an average portfolio duration of less than five years (including the effect of anticipated leverage), although it may be longer from time to time depending on market conditions. The Fund may invest directly in such securities or synthetically through the use of derivatives.
No assurance can be given that the Fund’s investment objective will be achieved.
Fund Information
| | |
| | |
Symbol on New York Stock Exchange | | BLW |
Initial Offering Date | | July 30, 2003 |
Current Distribution Rate on Closing Market Price as of December 31, 2022 ($13.07)(a) | | 9.01% |
Current Monthly Distribution per Common Share(b) | | $0.0981 |
Current Annualized Distribution per Common Share(b) | | $1.1772 |
Leverage as of December 31, 2022(c) | | 36% |
| | (a) | Current distribution rate on closing market price is calculated by dividing the current annualized distribution per share by the closing market price. The current distribution rate may consist of income, net realized gains and/or a return of capital. Past performance is not an indication of future results. | |
| | (b) | The distribution rate is not constant and is subject to change. A portion of the distribution may be deemed a return of capital or net realized gain. | |
| | (c) | Represents reverse repurchase agreements as a percentage of total managed assets, which is the total assets of the Fund (including any assets attributable to any borrowings) minus the sum of its liabilities (other than borrowings representing financial leverage). Does not reflect derivatives or other instruments that may give rise to economic leverage. For a discussion of leveraging techniques utilized by the Fund, please see The Benefits and Risks of Leveraging and Derivative Financial Instruments. | |
Market Price and Net Asset Value Per Share Summary
| | | | | | | | | | | | | | | | | | | | |
| | | 12/31/22 | | | 12/31/21 | | | Change | | | High | | | Low | |
| | | | | |
Closing Market Price | | $ | 13.07 | | | $ | 16.85 | | | | (22.43 | )% | | $ | 16.85 | | | $ | 11.76 | |
Net Asset Value | | | 13.51 | | | | 16.44 | | | | (17.82 | ) | | | 16.44 | | | | 13.08 | |
GROWTH OF $10,000 INVESTMENT
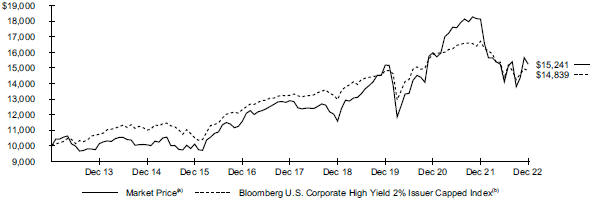
| | (a) | Represents the Fund’s closing market price on the NYSE and reflects the reinvestment of dividends and/or distributions at actual reinvestment prices. | |
| | (b) | An unmanaged index comprised of issuers that meet the following criteria: at least $150 million par value outstanding; maximum credit rating of Ba1; at least one year to maturity; and no issuer represents more than 2% of the index. | |
| | |
| 16 | | 2 0 2 2 BLACK ROCK ANNUAL REPORT TO SHAREHOLDERS |
| | |
| Fund Summary as of December 31, 2022 (continued) | | BlackRock Limited Duration Income Trust (BLW) |
Performance
Returns for the period ended December 31, 2022 were as follows:
| | | | | | | | | | | | |
| | | Average Annual Total Returns | |
| | | |
| | | 1 Year | | | 5 Years | | | 10 Years | |
| | | |
Fund at NAV(a)(b) | | | (10.96 | )% | | | 2.74 | % | | | 5.00 | % |
Fund at Market Price(a)(b) | | | (15.96 | ) | | | 3.39 | | | | 4.30 | |
| | | | |
Reference Benchmark(c) | | | (5.59 | ) | | | 2.31 | | | | 3.04 | |
Bloomberg U.S. Corporate High Yield 2% Issuer Capped Index | | | (11.18 | ) | | | 2.30 | | | | 4.03 | |
Morningstar LSTA Leveraged Loan Index(d) | | | (0.60 | ) | | | 3.31 | | | | 3.67 | |
BATS S Benchmark(e) | | | (5.02 | ) | | | 1.12 | | | | 1.29 | |
| | (a) | All returns reflect reinvestment of dividends and/or distributions at actual reinvestment prices. Performance results reflect the Fund’s use of leverage. | |
| | (b) | The Fund moved from a premium to NAV to a discount during the period, which accounts for the difference between performance based on market price and performance based on NAV. | |
| | (c) | The Reference Benchmark is comprised of the Bloomberg U.S. Corporate High Yield 2% Issuer Capped Index (33.33%), the Morningstar LSTA Leveraged Loan Index (formerly S&P® /LSTA Leveraged Loan Index) (33.33%), and the BATS S Benchmark (33.34%). The Reference Benchmark’s index content and weightings may have varied over past periods. | |
| | (d) | Morningstar LSTA Leveraged Loan Index (formerly S&P/LSTA Leveraged Loan Index), an unmanaged market value-weighted index designed to measure the performance of the U.S. leveraged loan market based upon market weightings, spreads and interest payments. | |
| | (e) | A composite index comprised of Bloomberg ABS 1-3 Year AAA Rated ex Home Equity Index, Bloomberg Corporate 1-5 year Index, Bloomberg CMBS Investment Grade 1-3.5 Yr. Index, Bloomberg MBS 15 Yr Index and Bloomberg Credit Ex-Corporate 1-5 Yr Index. | |
Performance results may include adjustments made for financial reporting purposes in accordance with U.S. generally accepted accounting principles. Past performance is not an indication of future results.
The Fund is presenting the performance of one or more indices for informational purposes only. The Fund is actively managed and does not seek to track or replicate the performance of any index. The index performance shown is not intended to be indicative of the Fund’s investment strategies, portfolio components or past or future performance.
More information about the Fund’s historical performance can be found in the “Closed End Funds” section of blackrock.com.
The following discussion relates to the Fund’s absolute performance based on NAV:
What factors influenced performance?
Exposure to a range of credit-oriented sectors including high yield corporate bonds, investment grade corporate bonds, non-U.S. corporate bonds, and emerging market bonds weighed most heavily on the Fund’s performance. Exposure to U.S. Treasuries and securitized assets including agency mortgage-backed securities (“MBS”) and commercial mortgage-backed securities (“CMBS”) also detracted.
The Fund’s use of U.S. interest rate derivatives and exposure to floating rate bank loans contributed to performance.
The Fund held derivatives during the period, including Treasury futures, currency forwards, currency options, interest rate swaps and credit default swaps. Derivative securities were employed primarily to adjust duration (sensitivity to interest rate changes) and yield curve exposure, as well as to hedge credit and currency risk. Currency forwards were used to provide the portfolio with active currency exposure. The Fund’s use of derivatives contributed to performance during the period.
The Fund’s practice of maintaining a specified level of monthly distributions to shareholders did not have a material impact on the Fund’s investment strategy. The distribution policy resulted in return of capital for the period. Refer to the financial highlights and income tax information sections in this report for further information about the distributions.
Describe recent portfolio activity.
Over the period, the Fund reduced exposure to riskier assets such as high yield corporate and emerging market bonds in anticipation of a potential economic slowdown. The increased focus on quality was also reflected in increased allocations to investment grade corporate bonds and agency MBS. As interest rate volatility declined late in the period MBS became more attractive.
Describe portfolio positioning at period end.
At period end, the Fund maintained diversified exposure to non-government spread sectors including high yield and investment grade corporate bonds, bank loans, CMBS, asset-backed securities, agency and non-agency residential MBS, emerging market debt and foreign sovereign debt.
The views expressed reflect the opinions of BlackRock as of the date of this report and are subject to change based on changes in market, economic or other conditions. These views are not intended to be a forecast of future events and are no guarantee of future results.
| | |
| Fund Summary as of December 31, 2022 (continued) | | BlackRock Limited Duration Income Trust (BLW) |
Overview of the Fund’s Total Investments
PORTFOLIO COMPOSITION
| | | | |
| | |
| Asset Type | | 12/31/22 | |
| |
Corporate Bonds | | | 45.4 | % |
Floating Rate Loan Interests | | | 34.8 | |
U.S. Government Sponsored Agency Securities | | | 6.3 | |
Preferred Securities | | | 4.3 | |
Asset-Backed Securities | | | 4.1 | |
Non-Agency Mortgage-Backed Securities | | | 2.1 | |
U.S. Treasury Obligations | | | 1.6 | |
Other* | | | 1.4 | |
CREDIT QUALITY ALLOCATION
| | | | |
| | |
| Credit Rating(a)(b) | | 12/31/22 | |
| |
AAA/Aaa(c) | | | 9.8 | % |
AA/Aa | | | 0.3 | |
A | | | 2.3 | |
BBB/Baa | | | 15.7 | |
BB/Ba | | | 28.3 | |
B | | | 34.8 | |
CCC/Caa | | | 5.6 | |
CC | | | 0.4 | |
C | | | — | (d) |
N/R(e) | | | 2.8 | |
| (a) | For financial reporting purposes, credit quality ratings shown above reflect the highest rating assigned by either S&P Global Ratings or Moody’s Investors Service, Inc. if ratings differ. These rating agencies are independent, nationally recognized statistical rating organizations and are widely used. Investment grade ratings are credit ratings of BBB/Baa or higher. Below investment grade ratings are credit ratings of BB/Ba or lower. Investments designated N/R are not rated by either rating agency. Unrated investments do not necessarily indicate low credit quality. Credit quality ratings are subject to change. |
| (b) | Excludes short-term securities. |
| (c) | The investment adviser evaluates the credit quality of not-rated investments based upon certain factors including, but not limited to, credit ratings for similar investments and financial analysis of sectors, individual investments and/or issuer. Using this approach, the investment adviser has deemed U.S. Government Sponsored Agency Securities and U.S. Treasury Obligations as AAA/Aaa. |
| (d) | Rounds to less than 0.1%. |
| (e) | The investment adviser evaluates the credit quality of unrated investments based upon certain factors including, but not limited to, credit ratings for similar investments and financial analysis of sectors and individual investments. Using this approach, the investment adviser has deemed certain of these unrated securities as investment grade quality. As of December 31, 2022, the market value of unrated securities deemed by the investment adviser to be investment grade represents less than 1.0% of the Fund’s total investments. |
| * | Includes one or more investment categories that individually represents less than 1.0% of the Fund’s total investments. Please refer to the Schedule of Investments for details. |
| | |
| 18 | | 2 0 2 2 BLACK ROCK ANNUAL REPORT TO SHAREHOLDERS |
| | |
Schedule of Investments December 31, 2022 | | BlackRock Debt Strategies Fund, Inc. (DSU) (Percentages shown are based on Net Assets) |
| | | | | | | | | | | | |
| Security | | | | | Par (000) | | | Value | |
| | | |
Asset-Backed Securities | | | | | | | | | | | | |
Unique Pub Finance Co. PLC(a) | | | | | | | | | | | | |
Series A4, 5.66%, 06/30/27 | | | GBP | | | | 35 | | | $ | 42,173 | |
Series N, 6.46%, 03/30/32 | | | | | | | 100 | | | | 120,901 | |
| | | | | | | | | | | | |
| | |
Total Asset-Backed Securities — 0.1%
(Cost: $194,352) | | | | | | | | 163,074 | |
| | | | | | | | | | | | |
| | | |
| | | | | | Shares | | | | |
| | | |
Common Stocks | | | | | | | | | | | | |
| | |
Construction & Engineering — 0.0% | | | | | | | | | |
McDermott International Ltd.(b) | | | | | | | 141,483 | | | | 45,275 | |
| | | | | | | | | | | | |
| | |
| Diversified Financial Services — 0.0% | | | | | | | |
Kcad Holdings I Ltd.(c) | | | | | | | 1,075,282,733 | | | | 10,753 | |
| | | | | | | | | | | | |
| | | |
| Electrical Equipment — 0.0% | | | | | | | | | |
SunPower Corp.(b) | | | | | | | 1,707 | | | | 30,777 | |
| | | | | | | | | | | | |
| | | |
Metals & Mining — 0.0% | | | | | | | | | | | | |
Ameriforge Group, Inc. | | | | | | | 1,664 | | | | 832 | |
Project Investor Holdings LLC, (Acquired 02/12/19,
Cost: $255,714)(c)(d) | | | | | | | 14,566 | | | | 1,603 | |
| | | | | | | | | | | | |
| | | |
| | | | | | | | | | | 2,435 | |
| | |
Oil, Gas & Consumable Fuels — 0.0% | | | | | | | | | |
Chesapeake Energy Corp. | | | | | | | 1,585 | | | | 149,577 | |
| | | | | | | | | | | | |
| |
Semiconductors & Semiconductor Equipment —0.0% | | | | | |
Maxeon Solar Technologies Ltd.(b) | | | | | | | 213 | | | | 3,421 | |
| | | | | | | | | | | | |
| | | |
Specialty Retail — 0.1% | | | | | | | | | | | | |
NMG Parent LLC | | | | | | | 1,477 | | | | 223,396 | |
| | | | | | | | | | | | |
| | | |
Total Common Stocks — 0.1%
(Cost: $13,881,852) | | | | | | | | | | | 465,634 | |
| | | | | | | | | | | | |
| | | |
| | | | | | Par (000) | | | | |
| | | |
Corporate Bonds | | | | | | | | | | | | |
| | | |
Aerospace & Defense — 0.9% | | | | | | | | | | | | |
Boeing Co., 5.15%, 05/01/30 | | | USD | | | | 545 | | | | 531,723 | |
Bombardier, Inc.(e) | | | | | | | | | | | | |
7.50%, 03/15/25 | | | | | | | 12 | | | | 11,884 | |
7.13%, 06/15/26 | | | | | | | 421 | | | | 408,460 | |
7.88%, 04/15/27 | | | | | | | 83 | | | | 80,508 | |
6.00%, 02/15/28 | | | | | | | 351 | | | | 324,577 | |
F-Brasile SpA/F-Brasile U.S. LLC, Series XR, 7.38%, 08/15/26(e) | | | | | | | 200 | | | | 163,500 | |
Rolls-Royce PLC,
5.75%, 10/15/27(e) | | | | | | | 400 | | | | 381,000 | |
Spirit AeroSystems, Inc. | | | | | | | | | | | | |
7.50%, 04/15/25(e) | | | | | | | 10 | | | | 9,882 | |
9.38%, 11/30/29 | | | | | | | 150 | | | | 157,905 | |
TransDigm, Inc. | | | | | | | | | | | | |
8.00%, 12/15/25(e) | | | | | | | 508 | | | | 515,513 | |
6.25%, 03/15/26(e) | | | | | | | 1,334 | | | | 1,273,872 | |
6.38%, 06/15/26 | | | | | | | 15 | | | | 14,594 | |
7.50%, 03/15/27 | | | | | | | 33 | | | | 32,650 | |
4.63%, 01/15/29 | | | | | | | 151 | | | | 132,770 | |
| | | | | | | | | | | | |
| Security | | | | | Par (000) | | | Value | |
| | | |
Aerospace & Defense (continued) | | | | | | | | | | | | |
TransDigm, Inc. (continued) | | | | | | | | | | | | |
4.88%, 05/01/29 | | | USD | | | | 96 | | | $ | 83,736 | |
Triumph Group, Inc., 8.88%, 06/01/24(e) | | | | | | | 223 | | | | 226,903 | |
| | | | | | | | |
| | | | | | | | | | | 4,349,477 | |
| | | |
| Airlines — 0.7% | | | | | | | | | |
Air Canada, 3.88%, 08/15/26(e) | | | | | | | 116 | | | | 102,745 | |
Allegiant Travel Co.(e) | | | | | | | | | | | | |
8.50%, 02/05/24 | | | | | | | 1,065 | | | | 1,062,338 | |
7.25%, 08/15/27 | | | | | | | 37 | | | | 35,193 | |
American Airlines, Inc., 11.75%, 07/15/25(e) | | | | | | | 394 | | | | 422,604 | |
American Airlines, Inc./AAdvantage Loyalty IP Ltd.(e) | | | | | | | | | | | | |
5.50%, 04/20/26 | | | | | | | 57 | | | | 54,407 | |
5.75%, 04/20/29 | | | | | | | 289 | | | | 264,264 | |
Delta Air Lines, Inc./SkyMiles IP Ltd., 4.75%, 10/20/28(e) | | | | | | | 98 | | | | 92,006 | |
Deutsche Lufthansa AG, 3.75%, 02/11/28(a) | | | EUR | | | | 100 | | | | 95,002 | |
Hawaiian Brand Intellectual Property
Ltd./HawaiianMiles Loyalty Ltd., 5.75%, 01/20/26(e) | | | USD | | | | 101 | | | | 91,405 | |
Mileage Plus Holdings LLC/Mileage Plus Intellectual Property Assets Ltd., 6.50%, 06/20/27(e) | | | | | | | 335 | | | | 333,328 | |
Spirit Loyalty Cayman Ltd./Spirit IP Cayman Ltd., 8.00%, 09/20/25(e) | | | | | | | 70 | | | | 70,685 | |
United Airlines Pass-Through Trust | | | | | | | | | | | | |
Series 2020-1, Class A, 5.88%, 10/15/27 | | | | | | | 177 | | | | 174,558 | |
Series 2020-1, Class B, 4.88%, 01/15/26 | | | | | | | 15 | | | | 14,499 | |
United Airlines, Inc.(e) | | | | | | | | | | | | |
4.38%, 04/15/26 | | | | | | | 284 | | | | 263,247 | |
4.63%, 04/15/29 | | | | | | | 194 | | | | 168,915 | |
| | | | | | | | |
| | | | | | | | | | | 3,245,196 | |
| | | |
Auto Components — 0.4% | | | | | | | | | | | | |
Clarios Global LP, 6.75%, 05/15/25(e) | | | | | | | 721 | | | | 722,667 | |
Clarios Global LP/Clarios U.S. Finance Co.(e) | | | | | | | | | | | | |
6.25%, 05/15/26 | | | | | | | 271 | | | | 264,903 | |
8.50%, 05/15/27 | | | | | | | 912 | | | | 890,565 | |
Dealer Tire LLC/DT Issuer LLC,
8.00%, 02/01/28(e) | | | | | | | 12 | | | | 10,558 | |
Goodyear Tire & Rubber Co. | | | | | | | | | | | | |
9.50%, 05/31/25 | | | | | | | 65 | | | | 66,788 | |
5.00%, 07/15/29 | | | | | | | 26 | | | | 21,688 | |
5.63%, 04/30/33 | | | | | | | 30 | | | | 24,489 | |
NM Holdings Co. LLC(b)(c)(f) | | | | | | | | | | | | |
12.00%, 07/01/49 | | | | | | | 5,150 | | | | — | |
Series B, 9.50%, 07/01/05 | | | | | | | 5,125 | | | | 1 | |
Titan International, Inc., 7.00%, 04/30/28 | | | | | | | 18 | | | | 16,994 | |
| | | | | | | | |
| | | | | | | | | | | 2,018,653 | |
| | | |
Automobiles — 0.4% | | | | | | | | | | | | |
Asbury Automotive Group, Inc. | | | | | | | | | | | | |
4.50%, 03/01/28 | | | | | | | 35 | | | | 30,814 | |
4.75%, 03/01/30 | | | | | | | 73 | | | | 61,054 | |
5.00%, 02/15/32(e) | | | | | | | 51 | | | | 41,958 | |
Constellation Automotive Financing PLC,
4.88%, 07/15/27(a) | | | GBP | | | | 100 | | | | 78,788 | |
Ford Motor Co. | | | | | | | | | | | | |
4.35%, 12/08/26 | | | USD | | | | 9 | | | | 8,535 | |
3.25%, 02/12/32 | | | | | | | 199 | | | | 149,238 | |
6.10%, 08/19/32 | | | | | | | 57 | | | | 52,631 | |
| | |
SCHEDULE OF INVESTMENTS | | 19 |
| | |
Schedule of Investments (continued) December 31, 2022 | | BlackRock Debt Strategies Fund, Inc. (DSU) (Percentages shown are based on Net Assets) |
| | | | | | | | | | | | |
| Security | | | | | Par (000) | | | Value | |
| | | |
Automobiles (continued) | | | | | | | | | | | | |
Ford Motor Credit Co. LLC | | | | | | | | | | | | |
3.81%, 01/09/24 | | | USD | | | | 200 | | | $ | 194,506 | |
4.69%, 06/09/25 | | | | | | | 200 | | | | 190,293 | |
5.13%, 06/16/25 | | | | | | | 200 | | | | 192,268 | |
4.00%, 11/13/30 | | | | | | | 200 | | | | 164,168 | |
General Motors Co., 5.40%, 10/15/29 | | | | | | | 218 | | | | 208,037 | |
Group 1 Automotive, Inc., 4.00%, 08/15/28(e) | | | | | | | 15 | | | | 12,696 | |
Ken Garff Automotive LLC, 4.88%, 09/15/28(e) | | | | | | | 39 | | | | 32,625 | |
LCM Investments Holdings II LLC,
4.88%, 05/01/29(e) | | | | | | | 90 | | | | 72,071 | |
Lithia Motors, Inc., 3.88%, 06/01/29(e) | | | | | | | 42 | | | | 34,529 | |
MajorDrive Holdings IV LLC,
6.38%, 06/01/29(e) | | | | | | | 59 | | | | 44,025 | |
Penske Automotive Group, Inc. | | | | | | | | | | | | |
3.50%, 09/01/25 | | | | | | | 59 | | | | 54,756 | |
3.75%, 06/15/29 | | | | | | | 22 | | | | 17,856 | |
Wabash National Corp., 4.50%, 10/15/28(e) | | | | | | | 70 | | | | 59,611 | |
| | | | | | | | |
| | | | | | | | | | | 1,700,459 | |
| | | |
| Banks — 0.1% | | | | | | | | | |
Banco Espirito Santo SA(b)(f) | | | | | | | | | | | | |
4.75%, 01/15/22 | | | EUR | | | | 200 | | | | 25,691 | |
4.00%, 01/21/22 | | | | | | | 100 | | | | 12,845 | |
2.63%, 05/08/49(a) | | | | | | | 100 | | | | 12,845 | |
Northern Trust Corp., 6.13%, 11/02/32 | | | USD | | | | 74 | | | | 78,029 | |
Wells Fargo & Co., Series BB, (5 year CMT + 3.45%), 3.90%(g)(h) | | | | | | | 115 | | | | 100,656 | |
| | | | | | | | |
| | | | | | | | | | | 230,066 | |
| | | |
| Beverages — 0.4% | | | | | | | | | |
ARD Finance SA, (6.50% Cash or 7.25% PIK),
6.50%, 06/30/27(e)(i) | | | | | | | 441 | | | | 306,730 | |
Ardagh Metal Packaging Finance USA LLC/Ardagh Metal Packaging Finance PLC(e) | | | | | | | | | | | | |
6.00%, 06/15/27 | | | | | | | 200 | | | | 195,789 | |
3.25%, 09/01/28 | | | | | | | 200 | | | | 169,889 | |
4.00%, 09/01/29 | | | | | | | 485 | | | | 384,376 | |
Ball Corp. | | | | | | | | | | | | |
2.88%, 08/15/30 | | | | | | | 12 | | | | 9,578 | |
3.13%, 09/15/31 | | | | | | | 157 | | | | 126,091 | |
Silgan Holdings, Inc., 4.13%, 02/01/28 | | | | | | | 8 | | | | 7,401 | |
Trivium Packaging Finance BV,
8.50%, 08/15/27(e) | | | | | | | 814 | | | | 746,865 | |
| | | | | | | | |
| | | | | | | | | | | 1,946,719 | |
| | | |
| Building Materials — 0.2% | | | | | | | | | |
Camelot Return Merger Sub, Inc.,
8.75%, 08/01/28(e) | | | | | | | 67 | | | | 61,481 | |
Masonite International Corp.(e) | | | | | | | | | | | | |
Class C, 5.38%, 02/01/28 | | | | | | | 45 | | | | 41,607 | |
Class C, 3.50%, 02/15/30 | | | | | | | 69 | | | | 55,816 | |
New Enterprise Stone & Lime Co., Inc.(e) | | | | | | | | | | | | |
5.25%, 07/15/28 | | | | | | | 26 | | | | 23,087 | |
9.75%, 07/15/28 | | | | | | | 38 | | | | 35,110 | |
Smyrna Ready Mix Concrete LLC,
6.00%, 11/01/28(e) | | | | | | | 267 | | | | 238,885 | |
Standard Industries, Inc. | | | | | | | | | | | | |
2.25%, 11/21/26(a) | | | EUR | | | | 100 | | | | 90,989 | |
5.00%, 02/15/27(e) | | | USD | | | | 45 | | | | 41,523 | |
4.75%, 01/15/28(e) | | | | | | | 12 | | | | 10,799 | |
4.38%, 07/15/30(e) | | | | | | | 174 | | | | 141,797 | |
| | | | | | | | | | | | |
| Security | | | | | Par (000) | | | Value | |
| | | |
| Building Materials (continued) | | | | | | | | | |
Standard Industries, Inc. (continued) | | | | | | | | | | | | |
3.38%, 01/15/31(e) | | | USD | | | | 99 | | | $ | 74,498 | |
Summit Materials LLC/Summit Materials Finance Corp., 5.25%, 01/15/29(e) | | | | | | | 168 | | | | 156,412 | |
| | | | | | | | |
| | | | | | | | | | | 972,004 | |
| | | |
| Building Products(e) — 0.3% | | | | | | | | | |
Advanced Drainage Systems, Inc. | | | | | | | | | | | | |
5.00%, 09/30/27 | | | | | | | 5 | | | | 4,663 | |
6.38%, 06/15/30 | | | | | | | 193 | | | | 187,530 | |
Beacon Roofing Supply, Inc.,
4.13%, 05/15/29 | | | | | | | 39 | | | | 32,409 | |
Foundation Building Materials, Inc.,
6.00%, 03/01/29 | | | | | | | 32 | | | | 23,959 | |
GYP Holdings III Corp., 4.63%, 05/01/29 | | | | | | | 76 | | | | 62,052 | |
LBM Acquisition LLC, 6.25%, 01/15/29 | | | | | | | 12 | | | | 7,636 | |
Specialty Building Products Holdings LLC/SBP Finance Corp., 6.38%, 09/30/26 | | | | | | | 27 | | | | 21,739 | |
SRS Distribution, Inc. | | | | | | | | | | | | |
4.63%, 07/01/28 | | | | | | | 259 | | | | 229,596 | |
6.13%, 07/01/29 | | | | | | | 164 | | | | 132,597 | |
6.00%, 12/01/29 | | | | | | | 168 | | | | 133,703 | |
White Cap Buyer LLC, 6.88%, 10/15/28 | | | | | | | 616 | | | | 532,845 | |
White Cap Parent LLC, (8.25% PIK),
8.25%, 03/15/26(i) | | | | | | | 75 | | | | 64,837 | |
| | | | | | | | |
| | | | | | | | | | | 1,433,566 | |
| | | |
| Capital Markets — 0.4% | | | | | | | | | |
AG TTMT Escrow Issuer LLC,
8.63%, 09/30/27(e) | | | | | | | 150 | | | | 150,750 | |
Aretec Escrow Issuer, Inc., 7.50%, 04/01/29(e) | | | | | | | 36 | | | | 29,708 | |
Blackstone Private Credit Fund | | | | | | | | | | | | |
7.05%, 09/29/25(e) | | | | | | | 25 | | | | 24,802 | |
3.25%, 03/15/27 | | | | | | | 24 | | | | 20,207 | |
Charles Schwab Corp., Series H, (10 year CMT + 3.08%), 4.00%(g)(h) | | | | | | | 265 | | | | 211,324 | |
Compass Group Diversified Holdings LLC, 5.25%, 04/15/29(e) | | | | | | | 65 | | | | 55,627 | |
GLP Capital LP/GLP Financing II, Inc.,
3.25%, 01/15/32 | | | | | | | 160 | | | | 127,902 | |
Icahn Enterprises LP/Icahn Enterprises Finance Corp. | | | | | | | | | | | | |
4.75%, 09/15/24 | | | | | | | 101 | | | | 96,834 | |
6.25%, 05/15/26 | | | | | | | 9 | | | | 8,648 | |
5.25%, 05/15/27 | | | | | | | 196 | | | | 179,458 | |
4.38%, 02/01/29 | | | | | | | 182 | | | | 153,908 | |
NFP Corp.(e) | | | | | | | | | | | | |
4.88%, 08/15/28 | | | | | | | 200 | | | | 170,259 | |
6.88%, 08/15/28 | | | | | | | 699 | | | | 576,171 | |
7.50%, 10/01/30 | | | | | | | 34 | | | | 31,973 | |
Owl Rock Capital Corp. | | | | | | | | | | | | |
4.25%, 01/15/26 | | | | | | | 6 | | | | 5,508 | |
3.40%, 07/15/26 | | | | | | | 21 | | | | 18,336 | |
Owl Rock Core Income Corp. | | | | | | | | | | | | |
5.50%, 03/21/25 | | | | | | | 55 | | | | 53,317 | |
3.13%, 09/23/26 | | | | | | | 12 | | | | 10,212 | |
7.75%, 09/16/27(e) | | | | | | | 98 | | | | 97,683 | |
| | | | | | | | |
| | | | | | | | | | | 2,022,627 | |
| | | |
| Chemicals — 0.6% | | | | | | | | | |
Ashland LLC, 3.38%, 09/01/31(e) | | | | | | | 89 | | | | 71,135 | |
Avient Corp., 7.13%, 08/01/30(e) | | | | | | | 53 | | | | 51,809 | |
| | |
| 20 | | 2 0 2 2 BLACK ROCK ANNUAL REPORT TO SHAREHOLDERS |
| | |
Schedule of Investments (continued) December 31, 2022 | | BlackRock Debt Strategies Fund, Inc. (DSU) (Percentages shown are based on Net Assets) |
| | | | | | | | | | | | |
| Security | | | | | Par (000) | | | Value | |
| | | |
Chemicals (continued) | | | | | | | | | | | | |
Axalta Coating Systems LLC, 3.38%, 02/15/29(e) | | | USD | | | | 300 | | | $ | 247,549 | |
Celanese U.S. Holdings LLC, 6.17%, 07/15/27 | | | | | | | 85 | | | | 83,838 | |
Chemours Co., 5.75%, 11/15/28(e) | | | | | | | 38 | | | | 34,133 | |
Diamond BC BV, 4.63%, 10/01/29(e) | | | | | | | 230 | | | | 184,575 | |
Element Solutions, Inc., 3.88%, 09/01/28(e) | | | | | | | 559 | | | | 475,150 | |
HB Fuller Co., 4.25%, 10/15/28 | | | | | | | 35 | | | | 30,975 | |
Herens Holdco SARL, 4.75%, 05/15/28(e) | | | | | | | 200 | | | | 149,482 | |
Herens Midco SARL, 5.25%, 05/15/29(a) | | | EUR | | | | 100 | | | | 73,931 | |
Illuminate Buyer LLC/Illuminate Holdings IV, Inc., 9.00%, 07/01/28(e) | | | USD | | | | 188 | | | | 157,399 | |
Ingevity Corp., 3.88%, 11/01/28(e) | | | | | | | 23 | | | | 19,777 | |
Kobe U.S. Midco 2, Inc., (9.25% Cash or 10.00% PIK), 9.25%, 11/01/26(e)(i) | | | | | | | 82 | | | | 57,400 | |
LSF11 A5 HoldCo LLC, 6.63%, 10/15/29(e) | | | | | | | 36 | | | | 29,740 | |
Minerals Technologies, Inc., 5.00%, 07/01/28(e) | | | | | | | 55 | | | | 48,983 | |
Scotts Miracle-Gro Co. | | | | | | | | | | | | |
4.00%, 04/01/31 | | | | | | | 57 | | | | 43,545 | |
4.38%, 02/01/32 | | | | | | | 8 | | | | 6,030 | |
SK Invictus Intermediate II Sarl, 5.00%, 10/30/29(e) | | | | | | | 176 | | | | 144,320 | |
WESCO Distribution, Inc.(e) | | | | | | | | | | | | |
7.13%, 06/15/25 | | | | | | | 49 | | | | 49,613 | |
7.25%, 06/15/28 | | | | | | | 153 | | | | 154,985 | |
WR Grace Holdings LLC(e) | | | | | | | | | | | | |
4.88%, 06/15/27 | | | | | | | 55 | | | | 48,737 | |
5.63%, 08/15/29 | | | | | | | 786 | | | | 634,514 | |
| | | | | | | | |
| | | | | | | | | | | 2,797,620 | |
| | | |
| Commercial Services & Supplies — 0.2% | | | | | | | | | |
ADT Security Corp.(e) | | | | | | | | | | | | |
4.13%, 08/01/29 | | | | | | | 9 | | | | 7,654 | |
4.88%, 07/15/32 | | | | | | | 14 | | | | 11,898 | |
AMN Healthcare, Inc., 4.00%, 04/15/29(e) | | | | | | | 28 | | | | 23,961 | |
APX Group, Inc.(e) | | | | | | | | | | | | |
6.75%, 02/15/27 | | | | | | | 64 | | | | 61,603 | |
5.75%, 07/15/29 | | | | | | | 86 | | | | 71,224 | |
Avis Budget Car Rental LLC/Avis Budget Finance, Inc., 5.38%, 03/01/29(e) | | | | | | | 13 | | | | 11,121 | |
Fortress Transportation & Infrastructure Investors LLC(e) | | | | | | | | | | | | |
6.50%, 10/01/25 | | | | | | | 18 | | | | 16,924 | |
9.75%, 08/01/27 | | | | | | | 17 | | | | 17,042 | |
5.50%, 05/01/28 | | | | | | | 95 | | | | 81,045 | |
Herc Holdings, Inc., 5.50%, 07/15/27(e) | | | | | | | 121 | | | | 112,863 | |
Hertz Corp.(e) | | | | | | | | | | | | |
4.63%, 12/01/26 | | | | | | | 40 | | | | 33,500 | |
5.00%, 12/01/29 | | | | | | | 33 | | | | 25,034 | |
Metis Merger Sub LLC, 6.50%, 05/15/29(e) | | | | | | | 39 | | | | 32,740 | |
NESCO Holdings II, Inc., 5.50%, 04/15/29(e) | | | | | | | 74 | | | | 64,750 | |
Prime Security Services Borrower LLC/Prime Finance, Inc., 6.25%, 01/15/28(e) | | | | | | | 209 | | | | 190,223 | |
Sotheby’s/Bidfair Holdings, Inc., 5.88%, 06/01/29(e) | | | | | | | 202 | | | | 169,619 | |
United Rentals North America, Inc., 5.25%, 01/15/30 | | | | | | | 2 | | | | 1,879 | |
Williams Scotsman International, Inc.(e) | | | | | | | | | | | | |
6.13%, 06/15/25 | | | | | | | 82 | | | | 81,180 | |
4.63%, 08/15/28 | | | | | | | 74 | | | | 66,785 | |
| | | | | | | | |
| | | | | | | | | | | 1,081,045 | |
| | | | | | | | | | | | |
| Security | | | | | Par (000) | | | Value | |
| | | |
| Communications Equipment(e) — 0.1% | | | | | | | | | |
Ciena Corp., 4.00%, 01/31/30 | | | USD | | | | 34 | | | $ | 29,924 | |
CommScope Technologies LLC, 6.00%, 06/15/25 | | | | | | | 196 | | | | 178,360 | |
CommScope, Inc. | | | | | | | | | | | | |
6.00%, 03/01/26 | | | | | | | 8 | | | | 7,383 | |
8.25%, 03/01/27 | | | | | | | 35 | | | | 27,125 | |
7.13%, 07/01/28 | | | | | | | 58 | | | | 41,462 | |
4.75%, 09/01/29 | | | | | | | 152 | | | | 122,542 | |
Viasat, Inc. | | | | | | | | | | | | |
5.63%, 09/15/25 | | | | | | | 77 | | | | 71,440 | |
5.63%, 04/15/27 | | | | | | | 21 | | | | 19,075 | |
6.50%, 07/15/28 | | | | | | | 48 | | | | 36,011 | |
Viavi Solutions, Inc., 3.75%, 10/01/29 | | | | | | | 110 | | | | 92,450 | |
| | | | | | | | |
| | | | | | | | | | | 625,772 | |
| | | |
| Construction Materials(e) — 0.0% | | | | | | | | | |
American Builders & Contractors Supply Co., Inc. | | | | | | | | | | | | |
4.00%, 01/15/28 | | | | | | | 103 | | | | 91,896 | |
3.88%, 11/15/29 | | | | | | | 18 | | | | 14,714 | |
BCPE Empire Holdings, Inc., 7.63%, 05/01/27 | | | | | | | 41 | | | | 36,768 | |
H&E Equipment Services, Inc., 3.88%, 12/15/28 | | | | | | | 20 | | | | 17,036 | |
Resideo Funding, Inc., 4.00%, 09/01/29 | | | | | | | 18 | | | | 14,554 | |
| | | | | | | | |
| | | | | | | | | | | 174,968 | |
| | | |
| Consumer Discretionary(e) — 0.5% | | | | | | | | | |
APi Group DE, Inc. | | | | | | | | | | | | |
4.13%, 07/15/29 | | | | | | | 67 | | | | 55,531 | |
4.75%, 10/15/29 | | | | | | | 32 | | | | 27,739 | |
Carnival Corp. | | | | | | | | | | | | |
10.50%, 02/01/26 | | | | | | | 214 | | | | 215,019 | |
7.63%, 03/01/26 | | | | | | | 29 | | | | 22,985 | |
5.75%, 03/01/27 | | | | | | | 280 | | | | 199,931 | |
9.88%, 08/01/27 | | | | | | | 99 | | | | 93,555 | |
4.00%, 08/01/28 | | | | | | | 138 | | | | 112,527 | |
6.00%, 05/01/29 | | | | | | | 120 | | | | 79,966 | |
Carnival Holdings Bermuda Ltd., 10.38%, 05/01/28 | | | | | | | 418 | | | | 429,123 | |
CoreLogic, Inc., 4.50%, 05/01/28 | | | | | | | 138 | | | | 105,874 | |
Legends Hospitality Holding Co. LLC/Legends Hospitality Co.-Issuer, Inc., 5.00%, 02/01/26 | | | | | | | 52 | | | | 46,280 | |
Life Time, Inc. | | | | | | | | | | | | |
5.75%, 01/15/26 | | | | | | | 80 | | | | 74,440 | |
8.00%, 04/15/26 | | | | | | | 69 | | | | 62,100 | |
Lindblad Expeditions LLC, 6.75%, 02/15/27 | | | | | | | 283 | | | | 256,729 | |
NCL Corp. Ltd. | | | | | | | | | | | | |
5.88%, 03/15/26 | | | | | | | 91 | | | | 71,478 | |
7.75%, 02/15/29 | | | | | | | 22 | | | | 16,556 | |
NCL Finance Ltd., 6.13%, 03/15/28 | | | | | | | 46 | | | | 33,958 | |
Neptune Bidco U.S., Inc., 9.29%, 04/15/29 | | | | | | | 68 | | | | 64,090 | |
Royal Caribbean Cruises Ltd. | | | | | | | | | | | | |
11.50%, 06/01/25 | | | | | | | 57 | | | | 61,132 | |
4.25%, 07/01/26 | | | | | | | 24 | | | | 19,400 | |
5.50%, 08/31/26 | | | | | | | 28 | | | | 23,555 | |
5.38%, 07/15/27 | | | | | | | 43 | | | | 34,817 | |
11.63%, 08/15/27 | | | | | | | 56 | | | | 56,237 | |
5.50%, 04/01/28 | | | | | | | 46 | | | | 36,710 | |
8.25%, 01/15/29 | | | | | | | 62 | | | | 62,155 | |
9.25%, 01/15/29 | | | | | | | 112 | | | | 115,091 | |
Viking Ocean Cruises Ship VII Ltd., 5.63%, 02/15/29 | | | | | | | 18 | | | | 14,490 | |
| | | | | | | | |
| | | | | | | | | | | 2,391,468 | |
| | |
SCHEDULE OF INVESTMENTS | | 21 |
| | |
Schedule of Investments (continued) December 31, 2022 | | BlackRock Debt Strategies Fund, Inc. (DSU) (Percentages shown are based on Net Assets) |
| | | | | | | | | | | | |
| Security | | | | | Par (000) | | | Value | |
| | | |
| Consumer Finance — 0.7% | | | | | | | | | |
American Express Co., (5 year CMT + 2.85%), | | | | | | | | | | | | |
3.55%(g)(h) | | | USD | | | | 235 | | | $ | 193,052 | |
Block, Inc., 3.50%, 06/01/31 | | | | | | | 525 | | | | 418,911 | |
Discover Financial Services, 6.70%, 11/29/32 | | | | | | | 30 | | | | 30,494 | |
Global Payments, Inc. | | | | | | | | | | | | |
4.95%, 08/15/27 | | | | | | | 35 | | | | 33,950 | |
3.20%, 08/15/29 | | | | | | | 181 | | | | 153,859 | |
2.90%, 05/15/30 | | | | | | | 239 | | | | 195,829 | |
5.40%, 08/15/32 | | | | | | | 28 | | | | 26,666 | |
HealthEquity, Inc., 4.50%, 10/01/29(e) | | | | | | | 223 | | | | 194,880 | |
MPH Acquisition Holdings LLC, 5.50%, 09/01/28(e) | | | | | | | 66 | | | | 51,487 | |
Navient Corp. | | | | | | | | | | | | |
7.25%, 09/25/23 | | | | | | | 3 | | | | 2,997 | |
6.13%, 03/25/24 | | | | | | | 93 | | | | 91,105 | |
5.88%, 10/25/24 | | | | | | | 77 | | | | 74,501 | |
5.50%, 03/15/29 | | | | | | | 66 | | | | 53,856 | |
OneMain Finance Corp. | | | | | | | | | | | | |
6.88%, 03/15/25 | | | | | | | 151 | | | | 145,062 | |
3.50%, 01/15/27 | | | | | | | 156 | | | | 129,163 | |
6.63%, 01/15/28 | | | | | | | 8 | | | | 7,367 | |
5.38%, 11/15/29 | | | | | | | 32 | | | | 26,173 | |
4.00%, 09/15/30 | | | | | | | 76 | | | | 56,707 | |
Sabre Global, Inc.(e) | | | | | | | | | | | | |
9.25%, 04/15/25 | | | | | | | 78 | | | | 77,698 | |
7.38%, 09/01/25 | | | | | | | 81 | | | | 77,844 | |
11.25%, 12/15/27 | | | | | | | 29 | | | | 29,862 | |
Shift4 Payments LLC/Shift4 Payments Finance Sub, Inc., 4.63%, 11/01/26(e) | | | | | | | 210 | | | | 198,406 | |
SLM Corp., 3.13%, 11/02/26 | | | | | | | 56 | | | | 47,625 | |
Verscend Escrow Corp., 9.75%, 08/15/26(e) | | | | | | | 851 | | | | 833,733 | |
| | | | | | | | |
| | | | | | | | | | | 3,151,227 | |
| | | |
| Containers & Packaging(e) — 0.1% | | | | | | | | | |
Clydesdale Acquisition Holdings, Inc. | | | | | | | | | | | | |
6.63%, 04/15/29 | | | | | | | 302 | | | | 287,127 | |
8.75%, 04/15/30 | | | | | | | 178 | | | | 152,363 | |
LABL, Inc., 5.88%, 11/01/28 | | | | | | | 84 | | | | 73,187 | |
Sealed Air Corp., 4.00%, 12/01/27 | | | | | | | 61 | | | | 55,335 | |
| | | | | | | | |
| | | | | | | | | | | 568,012 | |
| | | |
| Diversified Consumer Services — 0.5% | | | | | | | | | |
Allied Universal Holdco LLC/Allied Universal Finance Corp.(e) | | | | | | | | | | | | |
6.63%, 07/15/26 | | | | | | | 529 | | | | 484,035 | |
9.75%, 07/15/27 | | | | | | | 101 | | | | 87,870 | |
6.00%, 06/01/29 | | | | | | | 600 | | | | 435,456 | |
Allied Universal Holdco LLC/Allied Universal Finance Corp./Atlas Luxco 4 SARL, 4.63%, 06/01/28(e) | | | | | | | 400 | | | | 327,335 | |
Brink’s Co., 5.50%, 07/15/25(e) | | | | | | | 15 | | | | 14,727 | |
Clarivate Science Holdings Corp.(e) | | | | | | | | | | | | |
3.88%, 07/01/28 | | | | | | | 365 | | | | 316,234 | |
4.88%, 07/01/29 | | | | | | | 175 | | | | 148,811 | |
Garda World Security Corp., 4.63%, 02/15/27(e) | | | | | | | 11 | | | | 9,713 | |
Rekeep SpA, 7.25%, 02/01/26(a) | | | EUR | | | | 100 | | | | 88,979 | |
Service Corp. International, 4.00%, 05/15/31 | | | USD | | | | 192 | | | | 161,707 | |
Sotheby’s, 7.38%, 10/15/27(e) | | | | | | | 400 | | | | 375,052 | |
| | | | | | | | |
| | | | | | | | | | | 2,449,919 | |
| | | | | | | | | | | | |
| Security | | | | | Par (000) | | | Value | |
| | | |
Diversified Financial Services — 0.3% | | | | | | | | | | | | |
Acuris Finance U.S., Inc./Acuris Finance SARL, 5.00%, 05/01/28(e) | | | USD | | | | 200 | | | $ | 159,500 | |
Bank of America Corp., (1 day SOFR + 1.99%),
6.20%, 11/10/28(h) | | | | | | | 130 | | | | 134,221 | |
Blackstone Holdings Finance Co. LLC, 5.90%, 11/03/27 | | | | | | | 203 | | | | 204,520 | |
Citigroup, Inc.(g)(h) | | | | | | | | | | | | |
Series W, (5 year CMT + 3.60%), 4.00% | | | | | | | 50 | | | | 43,556 | |
Series Y, (5 year CMT + 3.00%), 4.15% | | | | | | | 10 | | | | 8,164 | |
Credit Suisse Group AG, (1 year EURIBOR ICE Swap Rate + 4.95%), 7.75%, 03/01/29(a)(h) | | | EUR | | | | 100 | | | | 106,291 | |
Garfunkelux Holdco 3 SA, 7.75%, 11/01/25(a) | | | GBP | | | | 100 | | | | 93,932 | |
Global Aircraft Leasing Co. Ltd., (6.50% Cash or 7.25% PIK), 6.50%, 09/15/24(e)(i) | | | USD | | | | 26 | | | | 21,758 | |
HSBC Holdings PLC, (1 day SOFR + 3.35%),
7.39%, 11/03/28(h) | | | | | | | 200 | | | | 210,190 | |
Intrum AB, 4.88%, 08/15/25(a) | | | EUR | | | | 100 | | | | 97,047 | |
Jefferies Finance LLC/JFIN Co.-Issuer Corp.,
5.00%, 08/15/28(e) | | | USD | | | | 200 | | | | 163,146 | |
JPMorgan Chase & Co., (1 day SOFR + 2.58%),
5.72%, 09/14/33(h) | | | | | | | 62 | | | | 60,515 | |
Ladder Capital Finance Holdings LLLP/Ladder Capital Finance Corp., 4.75%, 06/15/29(e) | | | | | | | 22 | | | | 17,762 | |
Spectrum Brands, Inc.(e) | | | | | | | | | | | | |
5.00%, 10/01/29 | | | | | | | 8 | | | | 6,924 | |
5.50%, 07/15/30 | | | | | | | 50 | | | | 44,127 | |
UBS Group AG, (5 year CMT +
3.31%), 4.38%(e)(g)(h) | | | | | | | 345 | | | | 262,117 | |
VistaJet Malta Finance PLC/XO Management Holding, Inc., 6.38%, 02/01/30(e) | | | | | | | 52 | | | | 41,695 | |
| | | | | | | | |
| | | | | | | | | | | 1,675,465 | |
| |
| Diversified Telecommunication Services — 0.7% | | | | |
Consolidated Communications, Inc., 6.50%, 10/01/28(e) | | | | | | | 157 | | | | 121,998 | |
Level 3 Financing, Inc.(e) | | | | | | | | | | | | |
3.40%, 03/01/27 | | | | | | | 144 | | | | 121,678 | |
4.63%, 09/15/27 | | | | | | | 64 | | | | 53,280 | |
4.25%, 07/01/28 | | | | | | | 195 | | | | 153,601 | |
3.63%, 01/15/29 | | | | | | | 66 | | | | 48,328 | |
3.75%, 07/15/29 | | | | | | | 116 | | | | 83,447 | |
3.88%, 11/15/29 | | | | | | | 12 | | | | 9,470 | |
Lumen Technologies, Inc.(e) | | | | | | | | | | | | |
4.00%, 02/15/27 | | | | | | | 327 | | | | 277,117 | |
4.50%, 01/15/29 | | | | | | | 236 | | | | 162,890 | |
5.38%, 06/15/29 | | | | | | | 9 | | | | 6,479 | |
Sprint Capital Corp. | | | | | | | | | | | | |
6.88%, 11/15/28 | | | | | | | 351 | | | | 364,317 | |
8.75%, 03/15/32 | | | | | | | 556 | | | | 661,696 | |
Telecom Italia Capital SA | | | | | | | | | | | | |
6.38%, 11/15/33 | | | | | | | 58 | | | | 47,449 | |
6.00%, 09/30/34 | | | | | | | 134 | | | | 101,264 | |
7.20%, 07/18/36 | | | | | | | 14 | | | | 11,367 | |
7.72%, 06/04/38 | | | | | | | 23 | | | | 19,090 | |
Telecom Italia SpA, 2.88%, 01/28/26(a) | | | EUR | | | | 100 | | | | 97,143 | |
Uniti Group LP/Uniti Group Finance, Inc./CSL Capital LLC, 4.75%, 04/15/28(e) | | | USD | | | | 23 | | | | 18,400 | |
| | |
| 22 | | 2 0 2 2 BLACK ROCK ANNUAL REPORT TO SHAREHOLDERS |
| | |
Schedule of Investments (continued) December 31, 2022 | | BlackRock Debt Strategies Fund, Inc. (DSU) (Percentages shown are based on Net Assets) |
| | | | | | | | | | | | |
| Security | | | | | Par (000) | | | Value | |
|
Diversified Telecommunication Services (continued) | |
Zayo Group Holdings, Inc.(e) | | | | | | | | | | | | |
4.00%, 03/01/27 | | | USD | | | | 829 | | | $ | 612,274 | |
6.13%, 03/01/28 | | | | | | | 746 | | | | 423,041 | |
| | | | | | | | |
| | | | | | | | | | | 3,394,329 | |
| | | |
| Electric Utilities — 0.1% | | | | | | | | | |
Edison International, Series A, (5 year CMT + 4.70%), 5.38%(g)(h) | | | | | | | 100 | | | | 81,839 | |
FirstEnergy Corp. | | | | | | | | | | | | |
2.65%, 03/01/30 | | | | | | | 26 | | | | 21,199 | |
Series B, 2.25%, 09/01/30 | | | | | | | 6 | | | | 4,762 | |
Series C, 3.40%, 03/01/50 | | | | | | | 191 | | | | 126,022 | |
FirstEnergy Transmission LLC(e) | | | | | | | | | | | | |
5.45%, 07/15/44 | | | | | | | 139 | | | | 129,301 | |
4.55%, 04/01/49 | | | | | | | 51 | | | | 41,267 | |
Pike Corp., 5.50%, 09/01/28(e) | | | | | | | 130 | | | | 113,651 | |
Texas Competitive Electric Holdings, 1.00%, 11/10/21(b)(c)(f) | | | | | | | 2,375 | | | | — | |
| | | | | | | | |
| | | | | | | | | | | 518,041 | |
| | | |
| Electrical Equipment(e) — 0.1% | | | | | | | | | |
Gates Global LLC/Gates Corp., 6.25%, 01/15/26 | | | | | | | 322 | | | | 310,730 | |
GrafTech Finance, Inc., 4.63%, 12/15/28 | | | | | | | 66 | | | | 54,201 | |
| | | | | | | | |
| | | | | | | | | | | 364,931 | |
|
| Electronic Equipment, Instruments & Components — 0.3% | |
BWX Technologies, Inc.(e) | | | | | | | | | | | | |
4.13%, 06/30/28 | | | | | | | 86 | | | | 77,293 | |
4.13%, 04/15/29 | | | | | | | 107 | | | | 93,646 | |
CDW LLC/CDW Finance Corp. | | | | | | | | | | | | |
3.28%, 12/01/28 | | | | | | | 42 | | | | 35,959 | |
3.25%, 02/15/29 | | | | | | | 32 | | | | 27,254 | |
Imola Merger Corp., 4.75%, 05/15/29(e) | | | | | | | 186 | | | | 161,376 | |
Vertiv Group Corp., 4.13%, 11/15/28(e) | | | | | | | 1,027 | | | | 872,950 | |
| | | | | | | | |
| | | | | | | | | | | 1,268,478 | |
| | | |
| Energy Equipment & Services — 0.2% | | | | | | | | | |
Archrock Partners LP/Archrock Partners Finance Corp.(e) | | | | | | | | | | | | |
6.88%, 04/01/27 | | | | | | | 115 | | | | 109,786 | |
6.25%, 04/01/28 | | | | | | | 174 | | | | 159,212 | |
USA Compression Partners LP/USA Compression Finance Corp. | | | | | | | | | | | | |
6.88%, 04/01/26 | | | | | | | 70 | | | | 67,150 | |
6.88%, 09/01/27 | | | | | | | 229 | | | | 214,115 | |
Vallourec SA, 8.50%, 06/30/26(a) | | | EUR | | | | 8 | | | | 8,396 | |
Weatherford International Ltd.(e) | | | | | | | | | | | | |
11.00%, 12/01/24 | | | USD | | | | 3 | | | | 3,060 | |
6.50%, 09/15/28 | | | | | | | 68 | | | | 66,661 | |
8.63%, 04/30/30 | | | | | | | 101 | | | | 96,991 | |
| | | | | | | | |
| | | | | | | | | | | 725,371 | |
|
| Environmental, Maintenance & Security Service — 0.2% | |
Covanta Holding Corp. | | | | | | | | | | | | |
4.88%, 12/01/29(e) | | | | | | | 43 | | | | 35,229 | |
5.00%, 09/01/30 | | | | | | | 21 | | | | 16,958 | |
GFL Environmental, Inc.(e) | | | | | | | | | | | | |
3.75%, 08/01/25 | | | | | | | 45 | | | | 42,525 | |
5.13%, 12/15/26 | | | | | | | 113 | | | | 108,063 | |
4.00%, 08/01/28 | | | | | | | 150 | | | | 128,250 | |
3.50%, 09/01/28 | | | | | | | 65 | | | | 57,145 | |
4.75%, 06/15/29 | | | | | | | 111 | | | | 97,153 | |
4.38%, 08/15/29 | | | | | | | 145 | | | | 122,880 | |
| | | | | | | | | | | | |
| Security | | | | | Par (000) | | | Value | |
|
| Environmental, Maintenance & Security Service (continued) | |
Stericycle, Inc., 3.88%, 01/15/29(e) | | | USD | | | | 49 | | | $ | 42,752 | |
Tervita Corp., 11.00%, 12/01/25(e) | | | | | | | 25 | | | | 26,877 | |
Waste Pro USA, Inc., 5.50%, 02/15/26(e) | | | | | | | 187 | | | | 165,140 | |
| | | | | | | | |
| | | | | | | | | | | 842,972 | |
| |
| Equity Real Estate Investment Trusts (REITs) — 0.3% | | | | |
American Tower Corp. | | | | | | | | | | | | |
2.90%, 01/15/30 | | | | | | | 90 | | | | 76,218 | |
2.70%, 04/15/31 | | | | | | | 29 | | | | 23,605 | |
4.05%, 03/15/32 | | | | | | | 58 | | | | 51,724 | |
Brookfield Property REIT, Inc./BPR Cumulus LLC/BPR Nimbus LLC/GGSI Sellco LLC, 4.50%, 04/01/27(e) | | | | | | | 57 | | | | 47,641 | |
Digital Realty Trust LP, 5.55%, 01/15/28 | | | | | | | 40 | | | | 40,264 | |
Equinix, Inc., 3.90%, 04/15/32 | | | | | | | 177 | | | | 157,254 | |
Global Net Lease, Inc./Global Net Lease Operating Partnership LP, 3.75%, 12/15/27(e) | | | | | | | 46 | | | | 38,038 | |
HAT Holdings I LLC/HAT Holdings II LLC, 3.38%, 06/15/26(e) | | | | | | | 59 | | | | 51,259 | |
Iron Mountain, Inc.(e) | | | | | | | | | | | | |
5.00%, 07/15/28 | | | | | | | 10 | | | | 8,982 | |
5.25%, 07/15/30 | | | | | | | 43 | | | | 37,367 | |
5.63%, 07/15/32 | | | | | | | 66 | | | | 57,197 | |
MPT Operating Partnership LP/MPT Finance Corp. | | | | | | | | | | | | |
4.63%, 08/01/29 | | | | | | | 323 | | | | 246,315 | |
3.50%, 03/15/31 | | | | | | | 342 | | | | 234,435 | |
RHP Hotel Properties LP/RHP Finance Corp. | | | | | | | | | | | | |
4.75%, 10/15/27 | | | | | | | 156 | | | | 141,182 | |
4.50%, 02/15/29(e) | | | | | | | 77 | | | | 66,420 | |
RLJ Lodging Trust LP(e) | | | | | | | | | | | | |
3.75%, 07/01/26 | | | | | | | 40 | | | | 35,624 | |
4.00%, 09/15/29 | | | | | | | 31 | | | | 25,131 | |
VICI Properties LP/VICI Note Co., Inc., 3.88%, 02/15/29(e) | | | | | | | 16 | | | | 14,023 | |
| | | | | | | | |
| | | | | | | | | | | 1,352,679 | |
| | | |
| Food & Staples Retailing — 0.3% | | | | | | | | | |
Albertsons Cos., Inc./Safeway, Inc./New Albertsons LP/Albertsons LLC(e) | | | | | | | | | | | | |
3.25%, 03/15/26 | | | | | | | 146 | | | | 133,160 | |
4.63%, 01/15/27 | | | | | | | 11 | | | | 10,218 | |
4.88%, 02/15/30 | | | | | | | 122 | | | | 108,880 | |
Darling Ingredients, Inc., 6.00%, 06/15/30(e) | | | | | | | 135 | | | | 131,963 | |
Kraft Heinz Foods Co., 5.50%, 06/01/50 | | | | | | | 151 | | | | 144,310 | |
Lamb Weston Holdings, Inc.(e) | | | | | | | | | | | | |
4.88%, 05/15/28 | | | | | | | 25 | | | | 23,688 | |
4.13%, 01/31/30 | | | | | | | 94 | | | | 83,021 | |
4.38%, 01/31/32 | | | | | | | 142 | | | | 124,065 | |
Ocado Group PLC, 3.88%, 10/08/26(a) | | | GBP | | | | 100 | | | | 93,089 | |
Performance Food Group, Inc., 4.25%, 08/01/29(e) | | | USD | | | | 168 | | | | 145,592 | |
Post Holdings, Inc.(e) | | | | | | | | | | | | |
5.50%, 12/15/29 | | | | | | | 11 | | | | 9,954 | |
4.63%, 04/15/30 | | | | | | | 36 | | | | 31,059 | |
4.50%, 09/15/31 | | | | | | | 21 | | | | 17,654 | |
U.S. Foods, Inc.(e) | | | | | | | | | | | | |
6.25%, 04/15/25 | | | | | | | 51 | | | | 50,466 | |
4.75%, 02/15/29 | | | | | | | 121 | | | | 107,438 | |
| | |
SCHEDULE OF INVESTMENTS | | 23 |
| | |
Schedule of Investments (continued) December 31, 2022 | | BlackRock Debt Strategies Fund, Inc. (DSU) (Percentages shown are based on Net Assets) |
| | | | | | | | | | | | |
| Security | | | | | Par (000) | | | Value | |
| | | |
Food & Staples Retailing (continued) | | | | | | | | | | | | |
U.S. Foods, Inc.(e) (continued) | | | | | | | | | | | | |
4.63%, 06/01/30 | | | USD | | | | 13 | | | $ | 11,448 | |
United Natural Foods, Inc., 6.75%, 10/15/28(e) | | | | | | | 26 | | | | 24,981 | |
| | | | | | | | | | | | |
| | | | | | | | | | | 1,250,986 | |
| | | |
| Food Products — 0.3% | | | | | | | | | |
Aramark International Finance SARL,
3.13%, 04/01/25(a) | | | EUR | | | | 100 | | | | 102,228 | |
Aramark Services, Inc.(e) | | | | | | | | | | | | |
6.38%, 05/01/25 | | | USD | | | | 110 | | | | 108,648 | |
5.00%, 02/01/28 | | | | | | | 233 | | | | 217,374 | |
Chobani LLC/Chobani Finance Corp., Inc.(e) | | | | | | | | | | | | |
7.50%, 04/15/25 | | | | | | | 370 | | | | 360,287 | |
4.63%, 11/15/28 | | | | | | | 272 | | | | 236,806 | |
JBS USA LUX SA/JBS USA Food Co./JBS USA Finance, Inc., 3.75%, 12/01/31(e) | | | | | | | 89 | | | | 72,704 | |
Pilgrim’s Pride Corp., 3.50%, 03/01/32(e) | | | | | | | 57 | | | | 44,603 | |
Simmons Foods, Inc./Simmons Prepared Foods, Inc./Simmons Pet Food, Inc./Simmons Feed, 4.63%, 03/01/29(e) | | | | | | | 74 | | | | 60,240 | |
| | | | | | | | |
| | | | | | | | | | | 1,202,890 | |
| | | |
| Gas Utilities — 0.0% | | | | | | | | | |
Suburban Propane Partners LP/Suburban Energy Finance Corp., 5.00%, 06/01/31(e) | | | | | | | 29 | | | | 24,649 | |
| | | | | | | | |
|
| Health Care Equipment & Supplies(e) — 0.1% | |
Avantor Funding, Inc. | | | | | | | | | | | | |
4.63%, 07/15/28 | | | | | | | 191 | | | | 173,550 | |
3.88%, 11/01/29 | | | | | | | 55 | | | | 46,186 | |
Embecta Corp., 6.75%, 02/15/30 | | | | | | | 24 | | | | 21,660 | |
Garden Spinco Corp., 8.63%, 07/20/30 | | | | | | | 64 | | | | 67,840 | |
| | | | | | | | |
| | | | | | | | | | | 309,236 | |
|
| Health Care Providers & Services — 0.7% | |
Acadia Healthcare Co., Inc.(e) | | | | | | | | | | | | |
5.50%, 07/01/28 | | | | | | | 37 | | | | 35,094 | |
5.00%, 04/15/29 | | | | | | | 26 | | | | 23,912 | |
AdaptHealth LLC(e) | | | | | | | | | | | | |
6.13%, 08/01/28 | | | | | | | 24 | | | | 22,001 | |
5.13%, 03/01/30 | | | | | | | 9 | | | | 7,662 | |
AHP Health Partners, Inc., 5.75%, 07/15/29(e) | | | | | | | 105 | | | | 82,031 | |
Cano Health LLC, 6.25%, 10/01/28(e) | | | | | | | 34 | | | | 20,570 | |
Centene Corp. | | | | | | | | | | | | |
2.45%, 07/15/28 | | | | | | | 140 | | | | 118,167 | |
3.00%, 10/15/30 | | | | | | | 430 | | | | 352,492 | |
2.50%, 03/01/31 | | | | | | | 381 | | | | 298,122 | |
2.63%, 08/01/31 | | | | | | | 86 | | | | 67,579 | |
CHS/Community Health Systems, Inc.(e) | | | | | | | | | | | | |
5.63%, 03/15/27 | | | | | | | 65 | | | | 55,735 | |
6.00%, 01/15/29 | | | | | | | 145 | | | | 121,290 | |
5.25%, 05/15/30 | | | | | | | 112 | | | | 84,452 | |
4.75%, 02/15/31 | | | | | | | 24 | | | | 17,424 | |
Encompass Health Corp. | | | | | | | | | | | | |
4.50%, 02/01/28 | | | | | | | 5 | | | | 4,542 | |
4.75%, 02/01/30 | | | | | | | 166 | | | | 145,772 | |
4.63%, 04/01/31 | | | | | | | 66 | | | | 56,728 | |
Legacy LifePoint Health LLC(e) | | | | | | | | | | | | |
6.75%, 04/15/25 | | | | | | | 116 | | | | 109,166 | |
4.38%, 02/15/27 | | | | | | | 35 | | | | 29,604 | |
| | | | | | | | | | | | |
| Security | | | | | Par (000) | | | Value | |
|
Health Care Providers & Services (continued) | |
Medline Borrower LP(e) | | | | | | | | | | | | |
3.88%, 04/01/29 | | | USD | | | | 93 | | | $ | 74,954 | |
5.25%, 10/01/29 | | | | | | | 733 | | | | 582,200 | |
Molina Healthcare, Inc.(e) | | | | | | | | | | | | |
4.38%, 06/15/28 | | | | | | | 12 | | | | 10,951 | |
3.88%, 11/15/30 | | | | | | | 174 | | | | 147,454 | |
3.88%, 05/15/32 | | | | | | | 77 | | | | 63,944 | |
Surgery Center Holdings, Inc.(e) | | | | | | | | | | | | |
6.75%, 07/01/25 | | | | | | | 73 | | | | 71,960 | |
10.00%, 04/15/27 | | | | | | | 150 | | | | 152,625 | |
Teleflex, Inc. | | | | | | | | | | | | |
4.63%, 11/15/27 | | | | | | | 6 | | | | 5,719 | |
4.25%, 06/01/28(e) | | | | | | | 31 | | | | 28,299 | |
Tenet Healthcare Corp.(e) | | | | | | | | | | | | |
4.88%, 01/01/26 | | | | | | | 214 | | | | 202,368 | |
6.25%, 02/01/27 | | | | | | | 55 | | | | 52,828 | |
5.13%, 11/01/27 | | | | | | | 343 | | | | 319,072 | |
4.63%, 06/15/28 | | | | | | | 26 | | | | 23,263 | |
6.13%, 10/01/28 | | | | | | | 55 | | | | 49,243 | |
4.25%, 06/01/29 | | | | | | | 14 | | | | 12,128 | |
6.13%, 06/15/30 | | | | | | | 112 | | | | 106,714 | |
| | | | | | | | |
| | | | | | | | | | | 3,556,065 | |
| | | |
| Health Care Technology(e) — 0.1% | | | | | | | | | |
AthenaHealth Group, Inc., 6.50%, 02/15/30 | | | | | | | 527 | | | | 388,363 | |
Catalent Pharma Solutions, Inc. | | | | | | | | | | | | |
5.00%, 07/15/27 | | | | | | | 41 | | | | 38,151 | |
3.13%, 02/15/29 | | | | | | | 52 | | | | 41,404 | |
3.50%, 04/01/30 | | | | | | | 118 | | | | 93,172 | |
Charles River Laboratories International, Inc. | | | | | | | | | | | | |
4.25%, 05/01/28 | | | | | | | 46 | | | | 42,365 | |
3.75%, 03/15/29 | | | | | | | 11 | | | | 9,728 | |
4.00%, 03/15/31 | | | | | | | 21 | | | | 18,165 | |
Syneos Health, Inc., 3.63%, 01/15/29 | | | | | | | 51 | | | | 40,613 | |
| | | | | | | | |
| | | | | | | | | | | 671,961 | |
| | | |
| Hotels, Restaurants & Leisure — 0.9% | | | | | | | | | |
Boyd Gaming Corp. | | | | | | | | | | | | |
4.75%, 12/01/27 | | | | | | | 58 | | | | 54,020 | |
4.75%, 06/15/31(e) | | | | | | | 160 | | | | 139,200 | |
Boyne USA, Inc., 4.75%, 05/15/29(e) | | | | | | | 109 | | | | 96,470 | |
Burger King (Restaurant Brands Int)/New Red Finance, Inc.(e) | | | | | | | | | | | | |
3.88%, 01/15/28 | | | | | | | 25 | | | | 22,364 | |
4.38%, 01/15/28 | | | | | | | 121 | | | | 108,344 | |
4.00%, 10/15/30 | | | | | | | 46 | | | | 37,251 | |
Caesars Entertainment, Inc.(e) | | | | | | | | | | | | |
6.25%, 07/01/25 | | | | | | | 381 | | | | 370,208 | |
8.13%, 07/01/27 | | | | | | | 524 | | | | 514,856 | |
4.63%, 10/15/29 | | | | | | | 534 | | | | 434,575 | |
Caesars Resort Collection LLC/CRC Finco, Inc., 5.75%, 07/01/25(e) | | | | | | | 151 | | | | 147,815 | |
CCM Merger, Inc., 6.38%, 05/01/26(e) | | | | | | | 53 | | | | 49,943 | |
CDI Escrow Issuer, Inc., 5.75%, 04/01/30(e) | | | | | | | 219 | | | | 196,318 | |
Cedar Fair LP/Canada’s Wonderland Co./Magnum Management Corp./Millennium Op | | | | | | | | | | | | |
5.50%, 05/01/25(e) | | | | | | | 318 | | | | 314,539 | |
6.50%, 10/01/28 | | | | | | | 19 | | | | 18,382 | |
| | |
| 24 | | 2 0 2 2 BLACK ROCK ANNUAL REPORT TO SHAREHOLDERS |
| | |
Schedule of Investments (continued) December 31, 2022 | | BlackRock Debt Strategies Fund, Inc. (DSU) (Percentages shown are based on Net Assets) |
| | | | | | | | | | | | |
Security | | | | | Par (000) | | | Value | |
| | | |
Hotels, Restaurants & Leisure (continued) | | | | | | | | | | | | |
Churchill Downs, Inc.(e) | | | | | | | | | | | | |
5.50%, 04/01/27 | | | USD | | | | 77 | | | $ | 72,962 | |
4.75%, 01/15/28 | | | | | | | 152 | | | | 136,020 | |
Fertitta Entertainment LLC/Fertitta Entertainment Finance Co., Inc.(e) | | | | | | | | | | | | |
4.63%, 01/15/29 | | | | | | | 195 | | | | 165,016 | |
6.75%, 01/15/30 | | | | | | | 570 | | | | 459,762 | |
Hilton Domestic Operating Co., Inc. | | | | | | | | | | | | |
5.75%, 05/01/28(e) | | | | | | | 19 | | | | 18,430 | |
3.75%, 05/01/29(e) | | | | | | | 46 | | | | 39,790 | |
4.88%, 01/15/30 | | | | | | | 193 | | | | 174,899 | |
4.00%, 05/01/31(e) | | | | | | | 76 | | | | 63,584 | |
3.63%, 02/15/32(e) | | | | | | | 40 | | | | 32,032 | |
MGM Resorts International, 5.75%, 06/15/25 | | | | | | | 73 | | | | 70,947 | |
Midwest Gaming Borrower LLC/Midwest Gaming Finance Corp., 4.88%, 05/01/29(e) | | | | | | | 71 | | | | 60,411 | |
Premier Entertainment Sub LLC/Premier Entertainment Finance Corp.(e) | | | | | | | | | | | | |
5.63%, 09/01/29 | | | | | | | 34 | | | | 25,072 | |
5.88%, 09/01/31 | | | | | | | 37 | | | | 26,174 | |
Raptor Acquisition Corp./Raptor Co.-Issuer LLC, 4.88%, 11/01/26(e) | | | | | | | 57 | | | | 50,639 | |
Scientific Games International, Inc., 8.63%, 07/01/25(e) | | | | | | | 65 | | | | 66,313 | |
Six Flags Theme Parks, Inc., 7.00%, 07/01/25(e) | | | | | | | 96 | | | | 96,654 | |
Station Casinos LLC(e) | | | | | | | | | | | | |
4.50%, 02/15/28 | | | | | | | 69 | | | | 59,987 | |
4.63%, 12/01/31 | | | | | | | 89 | | | | 71,393 | |
Vail Resorts, Inc., 6.25%, 05/15/25(e) | | | | | | | 89 | | | | 89,000 | |
Wyndham Hotels & Resorts, Inc., 4.38%, 08/15/28(e) | | | | | | | 44 | | | | 39,477 | |
Wynn Resorts Finance LLC/Wynn Resorts Capital Corp., 5.13%, 10/01/29(e) | | | | | | | 238 | | | | 203,997 | |
Yum! Brands, Inc. | | | | | | | | | | | | |
4.75%, 01/15/30(e) | | | | | | | 17 | | | | 15,597 | |
5.38%, 04/01/32 | | | | | | | 12 | | | | 11,115 | |
5.35%, 11/01/43 | | | | | | | 14 | | | | 11,515 | |
| | | | | | | | |
| | | | | | | | | | | 4,565,071 | |
| | | |
| Household Durables — 0.2% | | | | | | | | | |
Ashton Woods USA LLC/Ashton Woods Finance Co.(e) | | | | | | | | | | | | |
4.63%, 08/01/29 | | | | | | | 32 | | | | 25,623 | |
4.63%, 04/01/30 | | | | | | | 46 | | | | 36,920 | |
Brookfield Residential Properties, Inc./Brookfield Residential U.S. LLC(e) | | | | | | | | | | | | |
5.00%, 06/15/29 | | | | | | | 67 | | | | 52,352 | |
4.88%, 02/15/30 | | | | | | | 223 | | | | 173,866 | |
CD&R Smokey Buyer, Inc., 6.75%, 07/15/25(e) | | | | | | | 104 | | | | 89,245 | |
K Hovnanian Enterprises, Inc.,
10.00%, 11/15/25(e) | | | | | | | 20 | | | | 20,650 | |
KB Home, 7.25%, 07/15/30 | | | | | | | 21 | | | | 20,406 | |
Mattamy Group Corp., 4.63%, 03/01/30(e) | | | | | | | 72 | | | | 58,353 | |
NCR Corp.(e) | | | | | | | | | | | | |
5.75%, 09/01/27 | | | | | | | 20 | | | | 19,139 | |
5.00%, 10/01/28 | | | | | | | 57 | | | | 48,594 | |
5.13%, 04/15/29 | | | | | | | 30 | | | | 25,090 | |
6.13%, 09/01/29 | | | | | | | 78 | | | | 72,934 | |
SWF Escrow Issuer Corp., 6.50%, 10/01/29(e) | | | | | | | 105 | | | | 60,842 | |
| | | | | | | | | | | | |
| Security | | | | | Par (000) | | | Value | |
| | | |
Household Durables (continued) | | | | | | | | | | | | |
Taylor Morrison Communities, Inc.,
5.13%, 08/01/30(e) | | | USD | | | | 20 | | | $ | 17,325 | |
Tempur Sealy International, Inc.(e) | | | | | | | | | | | | |
4.00%, 04/15/29 | | | | | | | 67 | | | | 56,291 | |
3.88%, 10/15/31 | | | | | | | 57 | | | | 44,746 | |
Tri Pointe Homes, Inc., 5.70%, 06/15/28 | | | | | | | 18 | | | | 16,305 | |
| | | | | | | | |
| | | | | | | | | | | 838,681 | |
| | | |
| Household Products — 0.0% | | | | | | | | | |
Central Garden & Pet Co. | | | | | | | | | | | | |
5.13%, 02/01/28 | | | | | | | 15 | | | | 13,954 | |
4.13%, 10/15/30 | | | | | | | 63 | | | | 51,749 | |
4.13%, 04/30/31(e) | | | | | | | 55 | | | | 45,530 | |
| | | | | | | | |
| | | | | | | | | | | 111,233 | |
|
| Independent Power and Renewable Electricity Producers — 0.1% | |
Calpine Corp.(e) | | | | | | | | | | | | |
5.25%, 06/01/26 | | | | | | | 28 | | | | 26,671 | |
5.13%, 03/15/28 | | | | | | | 380 | | | | 339,071 | |
4.63%, 02/01/29 | | | | | | | 22 | | | | 18,877 | |
5.00%, 02/01/31 | | | | | | | 14 | | | | 11,745 | |
Clearway Energy Operating LLC(e) | | | | | | | | | | | | |
4.75%, 03/15/28 | | | | | | | 47 | | | | 43,378 | |
3.75%, 01/15/32 | | | | | | | 82 | | | | 65,914 | |
NRG Energy, Inc. | | | | | | | | | | | | |
5.75%, 01/15/28 | | | | | | | 22 | | | | 20,651 | |
5.25%, 06/15/29(e) | | | | | | | 13 | | | | 11,475 | |
3.63%, 02/15/31(e) | | | | | | | 107 | | | | 81,341 | |
3.88%, 02/15/32(e) | | | | | | | 20 | | | | 15,021 | |
TerraForm Power Operating LLC,
4.75%, 01/15/30(e) | | | | | | | 74 | | | | 64,380 | |
| | | | | | | | |
| | | | | | | | | | | 698,524 | |
| | | |
| Insurance — 0.5% | | | | | | | | | |
Acrisure LLC/Acrisure Finance, Inc.,
6.00%, 08/01/29(e) | | | | | | | 71 | | | | 58,023 | |
Alliant Holdings Intermediate LLC/Alliant Holdings Co-Issuer(e) | | | | | | | | | | | | |
4.25%, 10/15/27 | | | | | | | 388 | | | | 347,504 | |
6.75%, 10/15/27 | | | | | | | 1,083 | | | | 973,465 | |
5.88%, 11/01/29 | | | | | | | 551 | | | | 453,142 | |
AmWINS Group, Inc., 4.88%, 06/30/29(e) | | | | | | | 89 | | | | 75,485 | |
GTCR AP Finance, Inc., 8.00%, 05/15/27(e) | | | | | | | 4 | | | | 3,832 | |
HUB International Ltd.(e) | | | | | | | | | | | | |
7.00%, 05/01/26 | | | | | | | 434 | | | | 424,882 | |
5.63%, 12/01/29 | | | | | | | 16 | | | | 13,974 | |
Jones Deslauriers Insurance Management, Inc., 10.50%, 12/15/30 | | | | | | | 87 | | | | 85,682 | |
Ryan Specialty Group LLC, 4.38%, 02/01/30(e) | | | | | | | 43 | | | | 37,234 | |
| | | | | | | | |
| | | | | | | | | | | 2,473,223 | |
| | | |
| Interactive Media & Services — 0.1% | | | | | | | | | |
Arches Buyer, Inc., 4.25%, 06/01/28(e) | | | | | | | 36 | | | | 28,156 | |
iliad SA(a) | | | | | | | | | | | | |
2.38%, 06/17/26 | | | EUR | | | | 100 | | | | 96,250 | |
5.38%, 06/14/27 | | | | | | | 100 | | | | 106,189 | |
Northwest Fiber LLC/Northwest Fiber Finance Sub, Inc.(e) | | | | | | | | | | | | |
4.75%, 04/30/27 | | | USD | | | | 152 | | | | 133,739 | |
6.00%, 02/15/28 | | | | | | | 71 | | | | 54,974 | |
10.75%, 06/01/28 | | | | | | | 30 | | | | 27,896 | |
| | | | | | | | |
| | | | | | | | | | | 447,204 | |
| | |
SCHEDULE OF INVESTMENTS | | 25 |
| | |
Schedule of Investments (continued) December 31, 2022 | | BlackRock Debt Strategies Fund, Inc. (DSU) (Percentages shown are based on Net Assets) |
| | | | | | | | | | | | |
| Security | | | | | Par (000) | | | Value | |
| | | |
Internet Software & Services(e) — 0.4% | | | | | | | | | | | | |
ANGI Group LLC, 3.88%, 08/15/28 | | | USD | | | | 106 | | | $ | 78,661 | |
Gen Digital, Inc., 7.13%, 09/30/30 | | | | | | | 74 | | | | 72,705 | |
Go Daddy Operating Co. LLC/GD Finance Co., Inc., 3.50%, 03/01/29 | | | | | | | 71 | | | | 59,441 | |
Match Group Holdings II LLC | | | | | | | | | | | | |
4.63%, 06/01/28 | | | | | | | 81 | | | | 72,208 | |
4.13%, 08/01/30 | | | | | | | 65 | | | | 53,064 | |
3.63%, 10/01/31 | | | | | | | 66 | | | | 50,613 | |
Uber Technologies, Inc. | | | | | | | | | | | | |
7.50%, 05/15/25 | | | | | | | 242 | | | | 241,824 | |
8.00%, 11/01/26 | | | | | | | 208 | | | | 208,716 | |
7.50%, 09/15/27 | | | | | | | 282 | | | | 282,197 | |
6.25%, 01/15/28 | | | | | | | 341 | | | | 327,360 | |
4.50%, 08/15/29 | | | | | | | 660 | | | | 575,028 | |
| | | | | | | | |
| | | | | | | | | | | 2,021,817 | |
| | | |
| IT Services — 0.6% | | | | | | | | | |
Ahead DB Holdings LLC, 6.63%, 05/01/28(e) | | | | | | | 50 | | | | 40,187 | |
Booz Allen Hamilton, Inc.(e) | | | | | | | | | | | | |
3.88%, 09/01/28 | | | | | | | 75 | | | | 66,447 | |
4.00%, 07/01/29 | | | | | | | 138 | | | | 121,460 | |
CA Magnum Holdings, 5.38%, 10/31/26(e) | | | | | | | 201 | | | | 181,931 | |
Camelot Finance SA, 4.50%, 11/01/26(e) | | | | | | | 120 | | | | 112,470 | |
Condor Merger Sub, Inc., 7.38%, 02/15/30(e) | | | | | | | 279 | | | | 224,324 | |
Dun & Bradstreet Corp., 5.00%, 12/15/29(e) | | | | | | | 262 | | | | 224,210 | |
Fair Isaac Corp., 4.00%, 06/15/28(e) | | | | | | | 63 | | | | 57,173 | |
Fiserv, Inc., 2.25%, 06/01/27 | | | | | | | 1,385 | | | | 1,236,091 | |
Gartner, Inc.(e) | | | | | | | | | | | | |
4.50%, 07/01/28 | | | | | | | 78 | | | | 72,722 | |
3.63%, 06/15/29 | | | | | | | 42 | | | | 36,906 | |
3.75%, 10/01/30 | | | | | | | 25 | | | | 21,549 | |
KBR, Inc., 4.75%, 09/30/28(e) | | | | | | | 66 | | | | 58,299 | |
Tempo Acquisition LLC/Tempo Acquisition Finance Corp., 5.75%, 06/01/25(e) | | | | | | | 163 | | | | 163,280 | |
Twilio, Inc., 3.88%, 03/15/31 | | | | | | | 140 | | | | 111,070 | |
ZoomInfo Technologies LLC/ZoomInfo Finance Corp., 3.88%, 02/01/29(e) | | | | | | | 337 | | | | 283,209 | |
| | | | | | | | |
| | | | | | | | | | | 3,011,328 | |
| | | |
| Leisure Products — 0.0% | | | | | | | | | |
Mattel, Inc. | | | | | | | | | | | | |
3.75%, 04/01/29(e) | | | | | | | 32 | | | | 28,106 | |
6.20%, 10/01/40 | | | | | | | 60 | | | | 51,790 | |
5.45%, 11/01/41 | | | | | | | 119 | | | | 96,865 | |
| | | | | | | | |
| | | | | | | | | | | 176,761 | |
| | | |
| Machinery — 0.5% | | | | | | | | | |
ATS Corp., 4.13%, 12/15/28(e) | | | | | | | 35 | | | | 30,197 | |
Chart Industries, Inc. | | | | | | | | | | | | |
7.50%, 01/01/30(e) | | | | | | | 195 | | | | 196,032 | |
9.50%, 01/01/31 | | | | | | | 30 | | | | 30,768 | |
Husky III Holding Ltd., (13.00% Cash or 13.75% PIK), 13.00%, 02/15/25(e)(i) | | | | | | | 445 | | | | 393,825 | |
Madison IAQ LLC, 5.88%, 06/30/29(e) | | | | | | | 1,139 | | | | 780,669 | |
Mueller Water Products, Inc.,
4.00%, 06/15/29(e) | | | | | | | 34 | | | | 29,877 | |
OT Merger Corp., 7.88%, 10/15/29(e) | | | | | | | 37 | | | | 19,610 | |
Terex Corp., 5.00%, 05/15/29(e) | | | | | | | 102 | | | | 91,672 | |
Titan Acquisition Ltd./Titan Co.-Borrower LLC, 7.75%, 04/15/26(e) | | | | | | | 171 | | | | 154,001 | |
TK Elevator Holdco GmbH,
7.63%, 07/15/28(e) | | | | | | | 200 | | | | 163,303 | |
| | | | | | | | | | | | |
| Security | | | | | Par (000) | | | Value | |
| | | |
Machinery (continued) | | | | | | | | | | | | |
TK Elevator Midco GmbH, 4.38%, 07/15/27(a) | | | EUR | | | | 100 | | | $ | 94,703 | |
TK Elevator U.S. Newco, Inc.,
5.25%, 07/15/27(e) | | | USD | | | | 600 | | | | 532,524 | |
| | | | | | | | |
| | | | | | | | | | | 2,517,181 | |
| | | |
| Marine — 0.0% | | | | | | | | | |
Huntington Ingalls Industries, Inc., 4.20%, 05/01/30 | | | | | | | 57 | | | | 51,735 | |
| | | | | | | | |
| | | |
| Media — 2.6% | | | | | | | | | |
Adelphia Communications Corp.,
10.50%, 12/31/49(b)(c)(f) | | | | | | | 400 | | | | — | |
Altice Financing SA(e) | | | | | | | | | | | | |
5.00%, 01/15/28 | | | | | | | 204 | | | | 164,220 | |
5.75%, 08/15/29 | | | | | | | 651 | | | | 512,052 | |
Altice France Holding SA, 10.50%, 05/15/27(e) | | | | | | | 342 | | | | 260,775 | |
AMC Networks, Inc., 4.25%, 02/15/29 | | | | | | | 39 | | | | 24,301 | |
Cable One, Inc. | | | | | | | | | | | | |
0.00%, 03/15/26(j)(k) | | | | | | | 28 | | | | 21,994 | |
1.13%, 03/15/28(j) | | | | | | | 66 | | | | 49,038 | |
4.00%, 11/15/30(e) | | | | | | | 111 | | | | 87,103 | |
CCO Holdings LLC/CCO Holdings Capital Corp. | | | | | | | | | | | | |
5.13%, 05/01/27(e) | | | | | | | 38 | | | | 35,419 | |
5.00%, 02/01/28(e) | | | | | | | 33 | | | | 29,964 | |
5.38%, 06/01/29(e) | | | | | | | 117 | | | | 105,800 | |
6.38%, 09/01/29(e) | | | | | | | 417 | | | | 391,872 | |
4.75%, 03/01/30(e) | | | | | | | 61 | | | | 52,607 | |
4.50%, 08/15/30(e) | | | | | | | 109 | | | | 90,051 | |
4.25%, 02/01/31(e) | | | | | | | 257 | | | | 206,143 | |
4.75%, 02/01/32(e) | | | | | | | 207 | | | | 167,815 | |
4.50%, 05/01/32 | | | | | | | 291 | | | | 231,636 | |
4.50%, 06/01/33(e) | | | | | | | 128 | | | | 98,205 | |
4.25%, 01/15/34(e) | | | | | | | 289 | | | | 213,295 | |
Charter Communications Operating LLC/Charter Communications Operating Capital,
4.40%, 04/01/33 | | | | | | | 242 | | | | 207,069 | |
Clear Channel International BV,
6.63%, 08/01/25(e) | | | | | | | 200 | | | | 190,841 | |
Clear Channel Outdoor Holdings, Inc.(e) | | | | | | | | | | | | |
5.13%, 08/15/27 | | | | | | | 574 | | | | 497,371 | |
7.75%, 04/15/28 | | | | | | | 337 | | | | 246,013 | |
7.50%, 06/01/29 | | | | | | | 379 | | | | 278,288 | |
CMG Media Corp., 8.88%, 12/15/27(e) | | | | | | | 90 | | | | 67,743 | |
Connect Finco SARL/Connect U.S. Finco LLC, 6.75%, 10/01/26(e) | | | | | | | 538 | | | | 498,597 | |
CSC Holdings LLC | | | | | | | | | | | | |
5.25%, 06/01/24 | | | | | | | 357 | | | | 332,372 | |
4.13%, 12/01/30(e) | | | | | | | 223 | | | | 157,400 | |
3.38%, 02/15/31(e) | | | | | | | 205 | | | | 133,688 | |
Directv Financing LLC/Directv Financing Co.- Obligor, Inc., 5.88%, 08/15/27(e) | | | | | | | 155 | | | | 138,672 | |
DISH DBS Corp. | | | | | | | | | | | | |
5.25%, 12/01/26(e) | | | | | | | 423 | | | | 356,308 | |
5.75%, 12/01/28(e) | | | | | | | 233 | | | | 185,963 | |
5.13%, 06/01/29 | | | | | | | 107 | | | | 69,027 | |
DISH Network Corp., 11.75%, 11/15/27(e) | | | | | | | 150 | | | | 154,485 | |
Frontier Communications Holdings LLC(e) | | | | | | | | | | | | |
5.88%, 10/15/27 | | | | | | | 93 | | | | 86,357 | |
5.00%, 05/01/28 | | | | | | | 228 | | | | 198,821 | |
6.75%, 05/01/29 | | | | | | | 146 | | | | 120,780 | |
6.00%, 01/15/30 | | | | | | | 63 | | | | 49,491 | |
8.75%, 05/15/30 | | | | | | | 187 | | | | 190,132 | |
GCI LLC, 4.75%, 10/15/28(e) | | | | | | | 35 | | | | 29,403 | |
| | |
| 26 | | 2 0 2 2 BLACK ROCK ANNUAL REPORT TO SHAREHOLDERS |
| | |
Schedule of Investments (continued) December 31, 2022 | | BlackRock Debt Strategies Fund, Inc. (DSU) (Percentages shown are based on Net Assets) |
| | | | | | | | | | | | |
| Security | | | | | Par (000) | | | Value | |
| | | |
Media (continued) | | | | | | | | | | | | |
Iliad Holding SASU(e) | | | | | | | | | | | | |
6.50%, 10/15/26 | | | USD | | | | 420 | | | $ | 389,531 | |
7.00%, 10/15/28 | | | | | | | 200 | | | | 180,758 | |
Lamar Media Corp. | | | | | | | | | | | | |
3.75%, 02/15/28 | | | | | | | 13 | | | | 11,636 | |
4.00%, 02/15/30 | | | | | | | 57 | | | | 49,818 | |
LCPR Senior Secured Financing DAC(e) | | | | | | | | | | | | |
6.75%, 10/15/27 | | | | | | | 180 | | | | 168,300 | |
5.13%, 07/15/29 | | | | | | | 200 | | | | 165,682 | |
Liberty Broadband Corp.,
2.75%, 09/30/50(e)(j) | | | | | | | 481 | | | | 468,471 | |
Ligado Networks LLC, (15.50% PIK), 15.50%, 11/01/23(e)(i) | | | | | | | 78 | | | | 22,905 | |
Lions Gate Capital Holdings LLC,
5.50%, 04/15/29(e) | | | | | | | 244 | | | | 141,470 | |
Live Nation Entertainment, Inc.(e) | | | | | | | | | | | | |
4.88%, 11/01/24 | | | | | | | 9 | | | | 8,714 | |
6.50%, 05/15/27 | | | | | | | 531 | | | | 519,610 | |
4.75%, 10/15/27 | | | | | | | 78 | | | | 69,445 | |
3.75%, 01/15/28 | | | | | | | 64 | | | | 54,533 | |
Odeon Finco PLC, 12.75%, 11/01/27 | | | | | | | 519 | | | | 451,530 | |
Outfront Media Capital LLC/Outfront Media Capital Corp.(e) | | | | | | | | | | | | |
5.00%, 08/15/27 | | | | | | | 256 | | | | 230,463 | |
4.25%, 01/15/29 | | | | | | | 57 | | | | 47,295 | |
4.63%, 03/15/30 | | | | | | | 25 | | | | 20,683 | |
Radiate Holdco LLC/Radiate Finance, Inc.(e) | | | | | | | | | | | | |
4.50%, 09/15/26 | | | | | | | 764 | | | | 561,311 | |
6.50%, 09/15/28 | | | | | | | 349 | | | | 146,236 | |
Sinclair Television Group, Inc.,
4.13%, 12/01/30(e) | | | | | | | 229 | | | | 171,678 | |
Sirius XM Radio, Inc.(e) | | | | | | | | | | | | |
3.13%, 09/01/26 | | | | | | | 212 | | | | 188,243 | |
5.00%, 08/01/27 | | | | | | | 133 | | | | 122,940 | |
4.00%, 07/15/28 | | | | | | | 99 | | | | 86,160 | |
4.13%, 07/01/30 | | | | | | | 28 | | | | 23,106 | |
3.88%, 09/01/31 | | | | | | | 98 | | | | 76,457 | |
Stagwell Global LLC, 5.63%, 08/15/29(e) | | | | | | | 32 | | | | 26,387 | |
Univision Communications, Inc.(e) | | | | | | | | | | | | |
5.13%, 02/15/25 | | | | | | | 107 | | | | 101,906 | |
6.63%, 06/01/27 | | | | | | | 39 | | | | 37,628 | |
7.38%, 06/30/30 | | | | | | | 68 | | | | 64,988 | |
UPC Broadband Finco BV,
4.88%, 07/15/31(e) | | | | | | | 200 | | | | 166,359 | |
Videotron Ltd., 3.63%, 06/15/29(e) | | | | | | | 85 | | | | 71,612 | |
Virgin Media Secured Finance PLC,
4.50%, 08/15/30(e) | | | | | | | 200 | | | | 167,085 | |
Virgin Media Vendor Financing Notes IV DAC, 5.00%, 07/15/28(e) | | | | | | | 242 | | | | 211,534 | |
Warnermedia Holdings, Inc.,
4.28%, 03/15/32(e) | | | | | | | 242 | | | | 199,351 | |
WMG Acquisition Corp., 3.88%, 07/15/30(e) | | | | | | | 7 | | | | 6,029 | |
Ziggo Bond Co. BV, 5.13%, 02/28/30(e) | | | | | | | 200 | | | | 161,500 | |
| | | | | | | | |
| | | | | | | | | | | 12,522,465 | |
| | | |
| Metals & Mining — 0.6% | | | | | | | | | |
Arconic Corp.(e) | | | | | | | | | | | | |
6.00%, 05/15/25 | | | | | | | 13 | | | | 12,780 | |
6.13%, 02/15/28 | | | | | | | 203 | | | | 190,468 | |
ATI, Inc. | | | | | | | | | | | | |
5.88%, 12/01/27 | | | | | | | 6 | | | | 5,738 | |
4.88%, 10/01/29 | | | | | | | 32 | | | | 28,279 | |
5.13%, 10/01/31 | | | | | | | 88 | | | | 77,493 | |
| | | | | | | | | | | | |
| Security | | | | | Par (000) | | | Value | |
| | | |
Metals & Mining (continued) | | | | | | | | | | | | |
Big River Steel LLC/BRS Finance Corp.,
6.63%, 01/31/29(e) | | | USD | | | | 441 | | | $ | 420,152 | |
Carpenter Technology Corp. | | | | | | | | | | | | |
6.38%, 07/15/28 | | | | | | | 14 | | | | 13,314 | |
7.63%, 03/15/30 | | | | | | | 72 | | | | 72,172 | |
Commercial Metals Co. | | | | | | | | | | | | |
4.13%, 01/15/30 | | | | | | | 23 | | | | 20,352 | |
4.38%, 03/15/32 | | | | | | | 24 | | | | 20,878 | |
Constellium SE | | | | | | | | | | | | |
4.25%, 02/15/26(a) | | | EUR | | | | 100 | | | | 102,603 | |
3.75%, 04/15/29(e) | | | USD | | | | 500 | | | | 406,219 | |
ERO Copper Corp., 6.50%, 02/15/30(e) | | | | | | | 64 | | | | 51,560 | |
Kaiser Aluminum Corp.(e) | | | | | | | | | | | | |
4.63%, 03/01/28 | | | | | | | 169 | | | | 147,474 | |
4.50%, 06/01/31 | | | | | | | 192 | | | | 154,320 | |
New Gold, Inc., 7.50%, 07/15/27(e) | | | | | | | 170 | | | | 149,184 | |
Novelis Corp.(e) | | | | | | | | | | | | |
3.25%, 11/15/26 | | | | | | | 203 | | | | 181,991 | |
4.75%, 01/30/30 | | | | | | | 381 | | | | 337,781 | |
3.88%, 08/15/31 | | | | | | | 168 | | | | 137,154 | |
Novelis Sheet Ingot GmbH, 3.38%, 04/15/29(a) | | | EUR | | | | 100 | | | | 90,922 | |
Roller Bearing Co. of America, Inc.,
4.38%, 10/15/29(e) | | | USD | | | | 39 | | | | 33,723 | |
| | | | | | | | |
| | | | | | | | | | | 2,654,557 | |
| |
Mortgage Real Estate Investment Trusts (REITs) — 0.0% | | | | | |
Starwood Property Trust, Inc.,
5.50%, 11/01/23(e) | | | | | | | 9 | | | | 8,922 | |
| | | | | | | | |
| | | |
| Multiline Retail — 0.0% | | | | | | | | | |
NMG Holding Co., Inc./Neiman Marcus Group LLC,
7.13%, 04/01/26(e) | | | | | | | 96 | | | | 89,978 | |
| | | | | | | | |
| | | |
| Multi-Utilities — 0.0% | | | | | | | | | |
Edison International, 6.95%, 11/15/29 | | | | | | | 35 | | | | 36,550 | |
TransAlta Corp., 7.75%, 11/15/29 | | | | | | | 35 | | | | 35,745 | |
| | | | | | | | |
| | | | | | | | | | | 72,295 | |
| | | |
| Offshore Drilling & Other Services(e) — 0.1% | | | | | | | | | |
Entegris Escrow Corp., 4.75%, 04/15/29 | | | | | | | 539 | | | | 491,534 | |
Entegris, Inc. | | | | | | | | | | | | |
4.38%, 04/15/28 | | | | | | | 143 | | | | 126,446 | |
3.63%, 05/01/29 | | | | | | | 49 | | | | 39,898 | |
| | | | | | | | |
| | | | | | | | | | | 657,878 | |
| | | |
| Oil, Gas & Consumable Fuels — 2.8% | | | | | | | | | |
Aethon United BR LP/Aethon United Finance Corp., 8.25%, 02/15/26(e) | | | | | | | 217 | | | | 215,252 | |
Antero Midstream Partners LP/Antero Midstream Finance Corp.(e) | | | | | | | | | | | | |
5.75%, 03/01/27 | | | | | | | 89 | | | | 84,137 | |
5.75%, 01/15/28 | | | | | | | 15 | | | | 13,914 | |
5.38%, 06/15/29 | | | | | | | 66 | | | | 60,340 | |
Antero Resources Corp., 7.63%, 02/01/29(e) | | | | | | | 23 | | | | 23,127 | |
Apache Corp. | | | | | | | | | | | | |
4.25%, 01/15/30 | | | | | | | 68 | | | | 60,174 | |
5.10%, 09/01/40 | | | | | | | 76 | | | | 62,982 | |
5.35%, 07/01/49 | | | | | | | 41 | | | | 33,124 | |
Arcosa, Inc., 4.38%, 04/15/29(e) | | | | | | | 117 | | | | 101,460 | |
Ascent Resources Utica Holdings LLC/ARU Finance Corp.(e) | | | | | | | | | | | | |
9.00%, 11/01/27 | | | | | | | 308 | | | | 378,840 | |
5.88%, 06/30/29 | | | | | | | 154 | | | | 137,311 | |
| | |
SCHEDULE OF INVESTMENTS | | 27 |
| | |
Schedule of Investments (continued) December 31, 2022 | | BlackRock Debt Strategies Fund, Inc. (DSU) (Percentages shown are based on Net Assets) |
| | | | | | | | | | | | |
| Security | | | | | Par (000) | | | Value | |
| | | |
Oil, Gas & Consumable Fuels (continued) | | | | | | | | | | | | |
Buckeye Partners LP | | | | | | | | | | | | |
5.85%, 11/15/43 | | | USD | | | | 16 | | | $ | 11,921 | |
5.60%, 10/15/44 | | | | | | | 1 | | | | 730 | |
Callon Petroleum Co. | | | | | | | | | | | | |
6.38%, 07/01/26 | | | | | | | 38 | | | | 35,418 | |
8.00%, 08/01/28(e) | | | | | | | 250 | | | | 238,321 | |
7.50%, 06/15/30(e) | | | | | | | 297 | | | | 271,755 | |
Cellnex Telecom SA, Series CLNX,
0.75%, 11/20/31(a) | | | EUR | | | | 100 | | | | 77,168 | |
Cheniere Energy Partners LP | | | | | | | | | | | | |
4.50%, 10/01/29 | | | USD | | | | 262 | | | | 235,596 | |
4.00%, 03/01/31 | | | | | | | 272 | | | | 231,570 | |
3.25%, 01/31/32 | | | | | | | 299 | | | | 237,617 | |
Cheniere Energy, Inc., 4.63%, 10/15/28 | | | | | | | 24 | | | | 21,693 | |
Chesapeake Energy Corp.(e) | | | | | | | | | | | | |
5.88%, 02/01/29 | | | | | | | 5 | | | | 4,737 | |
6.75%, 04/15/29 | | | | | | | 150 | | | | 146,040 | |
CITGO Petroleum Corp.(e) | | | | | | | | | | | | |
7.00%, 06/15/25 | | | | | | | 90 | | | | 87,782 | |
6.38%, 06/15/26 | | | | | | | 74 | | | | 71,327 | |
Civitas Resources, Inc., 5.00%, 10/15/26(e) | | | | | | | 28 | | | | 25,599 | |
CNX Midstream Partners LP,
4.75%, 04/15/30(e) | | | | | | | 32 | | | | 26,261 | |
CNX Resources Corp.(e) | | | | | | | | | | | | |
6.00%, 01/15/29 | | | | | | | 33 | | | | 30,365 | |
7.38%, 01/15/31 | | | | | | | 67 | | | | 64,219 | |
Colgate Energy Partners III LLC(e) | | | | | | | | | | | | |
7.75%, 02/15/26 | | | | | | | 113 | | | | 109,614 | |
5.88%, 07/01/29 | | | | | | | 129 | | | | 110,793 | |
Comstock Resources, Inc.(e) | | | | | | | | | | | | |
6.75%, 03/01/29 | | | | | | | 237 | | | | 213,892 | |
5.88%, 01/15/30 | | | | | | | 220 | | | | 189,134 | |
CQP Holdco LP/BIP-V Chinook Holdco LLC, 5.50%, 06/15/31(e) | | | | | | | 250 | | | | 218,378 | |
Crescent Energy Finance LLC,
7.25%, 05/01/26(e) | | | | | | | 222 | | | | 209,199 | |
Crestwood Midstream Partners LP/Crestwood Midstream Finance Corp.(e) | | | | | | | | | | | | |
5.63%, 05/01/27 | | | | | | | 16 | | | | 14,880 | |
6.00%, 02/01/29 | | | | | | | 43 | | | | 39,453 | |
8.00%, 04/01/29 | | | | | | | 27 | | | | 26,867 | |
CrownRock LP/CrownRock Finance, Inc.(e) | | | | | | | | | | | | |
5.63%, 10/15/25 | | | | | | | 413 | | | | 398,545 | |
5.00%, 05/01/29 | | | | | | | 16 | | | | 14,376 | |
DCP Midstream Operating LP | | | | | | | | | | | | |
5.63%, 07/15/27 | | | | | | | 15 | | | | 14,879 | |
6.45%, 11/03/36(e) | | | | | | | 179 | | | | 175,406 | |
6.75%, 09/15/37(e) | | | | | | | 6 | | | | 6,048 | |
Diamondback Energy, Inc., 6.25%, 03/15/33 | | | | | | | 252 | | | | 255,771 | |
DT Midstream, Inc.(e) | | | | | | | | | | | | |
4.13%, 06/15/29 | | | | | | | 124 | | | | 106,530 | |
4.38%, 06/15/31 | | | | | | | 152 | | | | 127,513 | |
Dycom Industries, Inc., 4.50%, 04/15/29(e) | | | | | | | 37 | | | | 32,205 | |
Earthstone Energy Holdings LLC,
8.00%, 04/15/27(e) | | | | | | | 113 | | | | 108,101 | |
Enerflex Ltd., 9.00%, 10/15/27 | | | | | | | 83 | | | | 82,771 | |
Energy Transfer LP | | | | | | | | | | | | |
5.55%, 02/15/28 | | | | | | | 55 | | | | 54,556 | |
3.75%, 05/15/30 | | | | | | | 291 | | | | 256,571 | |
5.75%, 02/15/33 | | | | | | | 65 | | | | 63,593 | |
Series H, (5 year CMT + 5.69%), 6.50%(g)(h) | | | | | | | 222 | | | | 190,920 | |
| | | | | | | | | | | | |
| Security | | | | | Par (000) | | | Value | |
| | | |
Oil, Gas & Consumable Fuels (continued) | | | | | | | | | | | | |
EnLink Midstream LLC | | | | | | | | | | | | |
5.63%, 01/15/28(e) | | | USD | | | | 103 | | | $ | 98,107 | |
5.38%, 06/01/29 | | | | | | | 118 | | | | 109,183 | |
6.50%, 09/01/30(e) | | | | | | | 75 | | | | 74,227 | |
EnLink Midstream Partners LP | | | | | | | | | | | | |
4.85%, 07/15/26 | | | | | | | 39 | | | | 36,661 | |
5.60%, 04/01/44 | | | | | | | 82 | | | | 67,631 | |
5.45%, 06/01/47 | | | | | | | 18 | | | | 14,459 | |
EQM Midstream Partners LP | | | | | | | | | | | | |
6.00%, 07/01/25(e) | | | | | | | 44 | | | | 42,460 | |
4.13%, 12/01/26 | | | | | | | 17 | | | | 15,121 | |
6.50%, 07/01/27(e) | | | | | | | 117 | | | | 111,823 | |
4.50%, 01/15/29(e) | | | | | | | 8 | | | | 6,719 | |
7.50%, 06/01/30(e) | | | | | | | 27 | | | | 26,015 | |
4.75%, 01/15/31(e) | | | | | | | 152 | | | | 124,260 | |
Genesis Energy LP/Genesis Energy Finance Corp. | | | | | | | | | | | | |
6.50%, 10/01/25 | | | | | | | 30 | | | | 28,671 | |
7.75%, 02/01/28 | | | | | | | 10 | | | | 9,205 | |
Gulfport Energy Corp., 8.00%, 05/17/26(e) | | | | | | | 11 | | | | 11,213 | |
Harvest Midstream I LP, 7.50%, 09/01/28(e) | | | | | | | 20 | | | | 19,089 | |
Hess Midstream Operations LP,
4.25%, 02/15/30(e) | | | | | | | 77 | | | | 65,829 | |
Hilcorp Energy I LP/Hilcorp Finance Co.(e) | | | | | | | | | | | | |
6.25%, 11/01/28 | | | | | | | 31 | | | | 28,055 | |
5.75%, 02/01/29 | | | | | | | 63 | | | | 56,074 | |
6.00%, 04/15/30 | | | | | | | 5 | | | | 4,446 | |
6.00%, 02/01/31 | | | | | | | 5 | | | | 4,313 | |
6.25%, 04/15/32 | | | | | | | 2 | | | | 1,726 | |
ITT Holdings LLC, 6.50%, 08/01/29(e) | | | | | | | 109 | | | | 91,793 | |
Kinder Morgan, Inc., 4.80%, 02/01/33 | | | | | | | 166 | | | | 153,901 | |
Kinetik Holdings LP, 5.88%, 06/15/30(e) | | | | | | | 177 | | | | 165,988 | |
Magnolia Oil & Gas Operating LLC/Magnolia Oil & Gas Finance Corp., 6.00%, 08/01/26(e) | | | | | | | 10 | | | | 9,600 | |
MasTec, Inc., 4.50%, 08/15/28(e) | | | | | | | 56 | | | | 50,159 | |
Matador Resources Co., 5.88%, 09/15/26 | | | | | | | 23 | | | | 22,114 | |
Murphy Oil Corp. | | | | | | | | | | | | |
5.75%, 08/15/25 | | | | | | | 8 | | | | 7,861 | |
5.88%, 12/01/27 | | | | | | | 20 | | | | 19,246 | |
Murphy Oil USA, Inc., 4.75%, 09/15/29 | | | | | | | 109 | | | | 99,738 | |
Nabors Industries Ltd.(e) | | | | | | | | | | | | |
7.25%, 01/15/26 | | | | | | | 66 | | | | 62,198 | |
7.50%, 01/15/28 | | | | | | | 78 | | | | 71,362 | |
Nabors Industries, Inc. | | | | | | | | | | | | |
5.75%, 02/01/25 | | | | | | | 205 | | | | 195,490 | |
7.38%, 05/15/27(e) | | | | | | | 104 | | | | 100,744 | |
New Fortress Energy, Inc.(e) | | | | | | | | | | | | |
6.75%, 09/15/25 | | | | | | | 390 | | | | 368,862 | |
6.50%, 09/30/26 | | | | | | | 321 | | | | 298,113 | |
NGL Energy Operating LLC/NGL Energy Finance Corp., 7.50%, 02/01/26(e) | | | | | | | 80 | | | | 71,231 | |
NGPL PipeCo LLC, 7.77%, 12/15/37(e) | | | | | | | 186 | | | | 193,536 | |
Northern Oil & Gas, Inc., 8.13%, 03/01/28(e) | | | | | | | 309 | | | | 296,700 | |
NuStar Logistics LP | | | | | | | | | | | | |
5.75%, 10/01/25 | | | | | | | 41 | | | | 39,415 | |
6.00%, 06/01/26 | | | | | | | 124 | | | | 119,400 | |
6.38%, 10/01/30 | | | | | | | 2 | | | | 1,849 | |
Occidental Petroleum Corp. | | | | | | | | | | | | |
6.95%, 07/01/24 | | | | | | | 9 | | | | 9,171 | |
5.88%, 09/01/25 | | | | | | | 38 | | | | 37,862 | |
| | |
| 28 | | 2 0 2 2 BLACK ROCK ANNUAL REPORT TO SHAREHOLDERS |
| | |
Schedule of Investments (continued) December 31, 2022 | | BlackRock Debt Strategies Fund, Inc. (DSU) (Percentages shown are based on Net Assets) |
| | | | | | | | | | | | |
| Security | | | | | Par (000) | | | Value | |
| | | |
Oil, Gas & Consumable Fuels (continued) | | | | | | | | | | | | |
Occidental Petroleum Corp. (continued) | | | | | | | | | | | | |
8.88%, 07/15/30 | | | USD | | | | 23 | | | $ | 25,967 | |
6.63%, 09/01/30 | | | | | | | 764 | | | | 789,502 | |
7.50%, 05/01/31 | | | | | | | 29 | | | | 30,986 | |
6.45%, 09/15/36 | | | | | | | 111 | | | | 113,220 | |
6.20%, 03/15/40 | | | | | | | 296 | | | | 289,664 | |
6.60%, 03/15/46 | | | | | | | 18 | | | | 18,522 | |
ONEOK, Inc., 4.35%, 03/15/29 | | | | | | | 90 | | | | 83,177 | |
PDC Energy, Inc., 6.13%, 09/15/24 | | | | | | | 68 | | | | 67,612 | |
Permian Resources Operating LLC(e) | | | | | | | | | | | | |
5.38%, 01/15/26 | | | | | | | 80 | | | | 72,823 | |
6.88%, 04/01/27 | | | | | | | 36 | | | | 33,921 | |
Plains All American Pipeline LP/PAA Finance Corp., 3.80%, 09/15/30 | | | | | | | 142 | | | | 123,410 | |
Precision Drilling Corp., 6.88%, 01/15/29(e) | | | | | | | 4 | | | | 3,724 | |
Range Resources Corp. | | | | | | | | | | | | |
4.88%, 05/15/25 | | | | | | | 39 | | | | 37,046 | |
4.75%, 02/15/30(e) | | | | | | | 5 | | | | 4,406 | |
Rockcliff Energy II LLC, 5.50%, 10/15/29(e) | | | | | | | 149 | | | | 136,328 | |
Rockies Express Pipeline LLC,
4.95%, 07/15/29(e) | | | | | | | 14 | | | | 12,563 | |
Sabine Pass Liquefaction LLC,
5.90%, 09/15/37 | | | | | | | 45 | | | | 45,031 | |
SM Energy Co. | | | | | | | | | | | | |
5.63%, 06/01/25 | | | | | | | 22 | | | | 21,120 | |
6.75%, 09/15/26 | | | | | | | 46 | | | | 44,659 | |
6.63%, 01/15/27 | | | | | | | 7 | | | | 6,743 | |
6.50%, 07/15/28 | | | | | | | 23 | | | | 22,052 | |
Southwestern Energy Co. | | | | | | | | | | | | |
5.38%, 02/01/29 | | | | | | | 92 | | | | 85,290 | |
4.75%, 02/01/32 | | | | | | | 52 | | | | 44,439 | |
Sunoco LP/Sunoco Finance Corp.,
5.88%, 03/15/28 | | | | | | | 151 | | | | 143,003 | |
Tallgrass Energy Partners LP/Tallgrass Energy Finance Corp.(e) | | | | | | | | | | | | |
6.00%, 03/01/27 | | | | | | | 14 | | | | 13,071 | |
5.50%, 01/15/28 | | | | | | | 11 | | | | 9,755 | |
6.00%, 12/31/30 | | | | | | | 10 | | | | 8,647 | |
6.00%, 09/01/31 | | | | | | | 41 | | | | 35,251 | |
Tap Rock Resources LLC, 7.00%, 10/01/26(e) | | | | | | | 245 | | | | 227,874 | |
Targa Resources Partners LP/Targa Resources Partners Finance Corp., 6.88%, 01/15/29 | | | | | | | 169 | | | | 170,345 | |
Transocean, Inc., 11.50%, 01/30/27(e) | | | | | | | 167 | | | | 167,417 | |
Venture Global Calcasieu Pass LLC(e) | | | | | | | | | | | | |
3.88%, 08/15/29 | | | | | | | 347 | | | | 303,625 | |
4.13%, 08/15/31 | | | | | | | 247 | | | | 210,443 | |
3.88%, 11/01/33 | | | | | | | 581 | | | | 474,619 | |
Vermilion Energy, Inc., 6.88%, 05/01/30(e) | | | | | | | 51 | | | | 46,542 | |
Western Midstream Operating LP | | | | | | | | | | | | |
4.75%, 08/15/28 | | | | | | | 95 | | | | 86,763 | |
5.45%, 04/01/44 | | | | | | | 217 | | | | 180,266 | |
5.30%, 03/01/48 | | | | | | | 39 | | | | 32,067 | |
5.50%, 08/15/48 | | | | | | | 17 | | | | 14,110 | |
5.50%, 02/01/50 | | | | | | | 156 | | | | 128,513 | |
| | | | | | | | |
| | | | | | | | | | | 13,814,911 | |
| | | | | | | | | | | | |
| Security | | | | | Par
(000) | | | Value | |
| | | |
Personal Products — 0.0% | | | | | | | | | | | | |
Coty, Inc./HFC Prestige Products, Inc./HFC | | | | | | | | | | | | |
Prestige International U.S. LLC,
4.75%, 01/15/29(e) | | | USD | | | | 5 | | | $ | 4,525 | |
| | | | | | | | |
| | | |
| Pharmaceuticals — 0.3% | | | | | | | | | |
Cheplapharm Arzneimittel GmbH,
4.38%, 01/15/28(a) | | | EUR | | | | 100 | | | | 93,777 | |
Elanco Animal Health, Inc., 6.40%, 08/28/28 | | | USD | | | | 50 | | | | 47,575 | |
Gruenenthal GmbH, 4.13%, 05/15/28(a) | | | EUR | | | | 100 | | | | 96,073 | |
Jazz Securities DAC, 4.38%, 01/15/29(e) | | | USD | | | | 200 | | | | 178,230 | |
Option Care Health, Inc., 4.38%, 10/31/29(e) | | | | | | | 79 | | | | 69,102 | |
Organon & Co./Organon Foreign Debt Co.-Issuer BV(e) | | | | | | | | | | | | |
4.13%, 04/30/28 | | | | | | | 200 | | | | 177,080 | |
5.13%, 04/30/31 | | | | | | | 200 | | | | 173,176 | |
PRA Health Sciences, Inc., 2.88%, 07/15/26(e) | | | | | | | 200 | | | | 181,011 | |
Prestige Brands, Inc., 3.75%, 04/01/31(e) | | | | | | | 70 | | | | 57,727 | |
Teva Pharmaceutical Finance Netherlands II BV, 3.75%, 05/09/27 | | | EUR | | | | 100 | | | | 92,279 | |
Teva Pharmaceutical Finance Netherlands III BV, 3.15%, 10/01/26 | | | USD | | | | 35 | | | | 30,367 | |
| | | | | | | | |
| | | | | | | | | | | 1,196,397 | |
| | | |
| Real Estate — 0.0% | | | | | | | | | |
VICI Properties LP/VICI Note Co., Inc.,
4.50%, 01/15/28(e) | | | | | | | 30 | | | | 27,529 | |
| | | | | | | | |
|
| Real Estate Management & Development — 0.2% | |
Cushman & Wakefield U.S. Borrower LLC, 6.75%, 05/15/28(e) | | | | | | | 101 | | | | 96,390 | |
DIC Asset AG, 2.25%, 09/22/26(a) | | | EUR | | | | 100 | | | | 61,016 | |
Howard Hughes Corp.(e) | | | | | | | | | | | | |
5.38%, 08/01/28 | | | USD | | | | 2 | | | | 1,802 | |
4.13%, 02/01/29 | | | | | | | 51 | | | | 42,713 | |
4.38%, 02/01/31 | | | | | | | 63 | | | | 50,971 | |
Realogy Group LLC/Realogy Co.-Issuer Corp.(e) | | | | | | | | | | | | |
5.75%, 01/15/29 | | | | | | | 531 | | | | 401,643 | |
5.25%, 04/15/30 | | | | | | | 43 | | | | 31,369 | |
Starwood Property Trust, Inc.,
4.38%, 01/15/27(e) | | | | | | | 25 | | | | 21,877 | |
VICI Properties LP, 5.13%, 05/15/32 | | | | | | | 272 | | | | 251,858 | |
| | | | | | | | |
| | | | | | | | | | | 959,639 | |
| | | |
| Road & Rail — 0.1% | | | | | | | | | |
Seaspan Corp., 5.50%, 08/01/29(e) | | | | | | | 101 | | | | 76,538 | |
United Rentals North America, Inc.,
6.00%, 12/15/29 | | | | | | | 505 | | | | 501,844 | |
| | | | | | | | |
| | | | | | | | | | | 578,382 | |
| |
| Semiconductors & Semiconductor Equipment — 0.2% | | | | |
Broadcom Corp./Broadcom Cayman Finance Ltd., 3.88%, 01/15/27 | | | | | | | 200 | | | | 189,178 | |
Broadcom, Inc. | | | | | | | | | | | | |
4.11%, 09/15/28 | | | | | | | 47 | | | | 43,710 | |
4.15%, 11/15/30 | | | | | | | 27 | | | | 24,196 | |
2.45%, 02/15/31(e) | | | | | | | 55 | | | | 43,319 | |
4.30%, 11/15/32 | | | | | | | 117 | | | | 103,117 | |
2.60%, 02/15/33(e) | | | | | | | 70 | | | | 52,542 | |
3.42%, 04/15/33(e) | | | | | | | 77 | | | | 61,732 | |
3.47%, 04/15/34(e) | | | | | | | 3 | | | | 2,393 | |
| | |
SCHEDULE OF INVESTMENTS | | 29 |
| | |
Schedule of Investments (continued) December 31, 2022 | | BlackRock Debt Strategies Fund, Inc. (DSU) (Percentages shown are based on Net Assets) |
| | | | | | | | | | | | |
| Security | | | | | Par (000) | | | Value | |
|
Semiconductors & Semiconductor Equipment (continued) | |
Marvell Technology, Inc., 2.95%, 04/15/31 | | | USD | | | | 104 | | | $ | 83,651 | |
Sensata Technologies BV, 4.00%, 04/15/29(e) | | | | | | | 36 | | | | 31,050 | |
Sensata Technologies, Inc.(e) | | | | | | | | | | | | |
4.38%, 02/15/30 | | | | | | | 231 | | | | 201,087 | |
3.75%, 02/15/31 | | | | | | | 49 | | | | 40,309 | |
Synaptics, Inc., 4.00%, 06/15/29(e) | | | | | | | 121 | | | | 101,948 | |
| | | | | | | | |
| | | | | | | | | | | 978,232 | |
| | | |
| Software — 0.7% | | | | | | | | | |
Black Knight InfoServ LLC, 3.63%, 09/01/28(e) | | | | | | | 122 | | | | 105,835 | |
Boxer Parent Co., Inc.(e) | | | | | | | | | | | | |
7.13%, 10/02/25 | | | | | | | 148 | | | | 143,932 | |
9.13%, 03/01/26 | | | | | | | 318 | | | | 300,006 | |
Central Parent, Inc./CDK Global, Inc.,
7.25%, 06/15/29(e) | | | | | | | 224 | | | | 219,099 | |
Cloud Software Group Holdings, Inc.,
6.50%, 03/31/29(e) | | | | | | | 783 | | | | 659,506 | |
Elastic NV, 4.13%, 07/15/29(e) | | | | | | | 120 | | | | 96,924 | |
Iron Mountain Information Management Services, Inc., 5.00%, 07/15/32(e) | | | | | | | 73 | | | | 60,641 | |
MicroStrategy, Inc., 6.13%, 06/15/28(e) | | | | | | | 144 | | | | 102,967 | |
MSCI, Inc.(e) | | | | | | | | | | | | |
3.63%, 09/01/30 | | | | | | | 64 | | | | 53,200 | |
3.88%, 02/15/31 | | | | | | | 11 | | | | 9,146 | |
3.63%, 11/01/31 | | | | | | | 41 | | | | 33,906 | |
3.25%, 08/15/33 | | | | | | | 58 | | | | 44,791 | |
Open Text Corp., 6.90%, 12/01/27 | | | | | | | 270 | | | | 270,000 | |
Oracle Corp. | | | | | | | | | | | | |
6.15%, 11/09/29 | | | | | | | 175 | | | | 181,644 | |
2.95%, 04/01/30 | | | | | | | 29 | | | | 24,726 | |
6.25%, 11/09/32 | | | | | | | 545 | | | | 570,408 | |
PTC, Inc., 4.00%, 02/15/28(e) | | | | | | | 80 | | | | 72,003 | |
SS&C Technologies, Inc., 5.50%, 09/30/27(e) | | | | | | | 398 | | | | 372,686 | |
Veritas U.S., Inc./Veritas Bermuda Ltd., 7.50%, 09/01/25(e) | | | | | | | 188 | | | | 129,479 | |
| | | | | | | | |
| | | | | | | | | | | 3,450,899 | |
| | | |
| Specialty Retail(e) — 0.1% | | | | | | | | | |
Arko Corp., 5.13%, 11/15/29 | | | | | | | 58 | | | | 45,541 | |
PetSmart, Inc./PetSmart Finance Corp.,
7.75%, 02/15/29 | | | | | | | 253 | | | | 237,616 | |
Staples, Inc., 7.50%, 04/15/26 | | | | | | | 82 | | | | 70,576 | |
| | | | | | | | |
| | | | | | | | | | | 353,733 | |
| |
| Technology Hardware, Storage & Peripherals — 0.0% | | | | |
Coherent Corp., 5.00%, 12/15/29(e) | | | | | | | 189 | | | | 162,999 | |
| | | | | | | | |
| | | |
| Textiles, Apparel & Luxury Goods(e) — 0.0% | | | | | | | | | |
Crocs, Inc. | | | | | | | | | | | | |
4.25%, 03/15/29 | | | | | | | 11 | | | | 9,318 | |
4.13%, 08/15/31 | | | | | | | 49 | | | | 39,933 | |
Kontoor Brands, Inc., 4.13%, 11/15/29 | | | | | | | 32 | | | | 26,115 | |
Levi Strauss & Co., 3.50%, 03/01/31 | | | | | | | 78 | | | | 61,908 | |
| | | | | | | | |
| | | | | | | | | | | 137,274 | |
| | | |
| Thrifts & Mortgage Finance — 0.1% | | | | | | | | | |
Enact Holdings, Inc., 6.50%, 08/15/25(e) | | | | | | | 129 | | | | 126,595 | |
Home Point Capital, Inc., 5.00%, 02/01/26(e) | | | | | | | 58 | | | | 40,106 | |
MGIC Investment Corp., 5.25%, 08/15/28 | | | | | | | 47 | | | | 43,338 | |
| | | | | | | | | | | | |
| Security | | | | | Par (000) | | | Value | |
|
Thrifts & Mortgage Finance (continued) | |
Nationstar Mortgage Holdings, Inc.(e) | | | | | | | | | | | | |
6.00%, 01/15/27 | | | USD | | | | 54 | | | $ | 48,330 | |
5.13%, 12/15/30 | | | | | | | 34 | | | | 26,260 | |
5.75%, 11/15/31 | | | | | | | 37 | | | | 28,768 | |
Rocket Mortgage LLC/Rocket Mortgage Co.- Issuer, Inc., 2.88%, 10/15/26(e) | | | | | | | 98 | | | | 84,002 | |
| | | | | | | | |
| | | | | | | | | | | 397,399 | |
| | | |
| Transportation — 0.0% | | | | | | | | | |
XPO Escrow Sub LLC, 7.50%, 11/15/27 | | | | | | | 34 | | | | 34,405 | |
| | | | | | | | |
| | | |
| Utilities(e) — 0.0% | | | | | | | | | |
Consensus Cloud Solutions, Inc. | | | | | | | | | | | | |
6.00%, 10/15/26 | | | | | | | 23 | | | | 21,511 | |
6.50%, 10/15/28 | | | | | | | 20 | | | | 18,395 | |
Pattern Energy Operations LP/Pattern Energy Operations, Inc., 4.50%, 08/15/28 | | | | | | | 42 | | | | 37,659 | |
Vistra Operations Co. LLC | | | | | | | | | | | | |
5.50%, 09/01/26 | | | | | | | 5 | | | | 4,817 | |
5.00%, 07/31/27 | | | | | | | 5 | | | | 4,640 | |
4.38%, 05/01/29 | | | | | | | 45 | | | | 38,773 | |
| | | | | | | | |
| | | | | | | | | | | 125,795 | |
|
| Wireless Telecommunication Services — 0.3% | |
Altice France SA/France(e) | | | | | | | | | | | | |
8.13%, 02/01/27 | | | | | | | 334 | | | | 304,234 | |
5.50%, 01/15/28 | | | | | | | 229 | | | | 179,334 | |
SBA Communications Corp. | | | | | | | | | | | | |
3.13%, 02/01/29 | | | | | | | 109 | | | | 90,632 | |
3.88%, 02/15/27 | | | | | | | 410 | | | | 370,441 | |
T-Mobile USA, Inc. | | | | | | | | | | | | |
3.38%, 04/15/29 | | | | | | | 67 | | | | 59,012 | |
3.50%, 04/15/31 | | | | | | | 26 | | | | 22,459 | |
VICI Properties LP/VICI Note Co., Inc.(e) | | | | | | | | | | | | |
5.63%, 05/01/24 | | | | | | | 18 | | | | 17,825 | |
3.50%, 02/15/25 | | | | | | | 34 | | | | 32,056 | |
4.63%, 06/15/25 | | | | | | | 161 | | | | 154,359 | |
4.50%, 09/01/26 | | | | | | | 3 | | | | 2,823 | |
4.25%, 12/01/26 | | | | | | | 34 | | | | 31,719 | |
4.63%, 12/01/29 | | | | | | | 133 | | | | 121,030 | |
4.13%, 08/15/30 | | | | | | | 124 | | | | 108,520 | |
Vmed O2 U.K. Financing I PLC,
4.75%, 07/15/31(e) | | | | | | | 200 | | | | 162,470 | |
| | | | | | | | |
| | | | | | | | | | | 1,656,914 | |
| | | | | | | | |
| | | |
Total Corporate Bonds — 21.6%
(Cost: $126,743,895) | | | | | | | | | | | 105,114,737 | |
| | | | | | | | |
| | | |
Floating Rate Loan Interests | | | | | | | | | | | | |
| | | |
Aerospace & Defense(h) — 3.3% | | | | | | | | | | | | |
Atlas CC Acquisition Corp. | | | | | | | | | | | | |
Term Loan B, (3 mo. LIBOR + 4.25%, 0.75% Floor), 8.98%, 05/25/28 | | | | | | | 2,456 | | | | 2,057,406 | |
Term Loan C, (3 mo. LIBOR + 4.25%, 0.75% Floor), 8.98%, 05/25/28 | | | | | | | 499 | | | | 418,456 | |
Bleriot U.S. Bidco, Inc., 2021 Term Loan B, (3 mo. LIBOR + 4.00%), 8.73%, 10/31/26 | | | | | | | 808 | | | | 798,401 | |
| | |
| 30 | | 2 0 2 2 BLACK ROCK ANNUAL REPORT TO SHAREHOLDERS |
| | |
Schedule of Investments (continued) December 31, 2022 | | BlackRock Debt Strategies Fund, Inc. (DSU) (Percentages shown are based on Net Assets) |
| | | | | | | | | | | | |
| Security | | | | | Par
(000) | | | Value | |
|
Aerospace & Defense (continued) | |
Cobham Ultra U.S. Co-Borrower LLC, USD Term Loan B, (6 mo. LIBOR + 3.75%, 0.50% Floor), 7.06%, 08/03/29 | | | USD | | | | 325 | | | $ | 315,429 | |
Dynasty Acquisition Co., Inc. | | | | | | | | | | | | |
2020 CAD Term Loan B2, (1 mo. LIBOR + 3.50%), 7.92%, 04/06/26 | | | | | | | 1,172 | | | | 1,114,524 | |
2020 Term Loan B1, (1 mo. LIBOR + 3.50%), 7.92%, 04/06/26 | | | | | | | 2,179 | | | | 2,073,268 | |
Nordam Group, Inc., Term Loan B, (1 mo. LIBOR + 5.50%), 9.94%, 04/09/26 | | | | | | | 762 | | | | 590,783 | |
Peraton Corp. | | | | | | | | | | | | |
2nd Lien Term Loan B1, (1 mo. LIBOR + 7.75%, 0.75% Floor), 12.09%, 02/01/29 | | | | | | | 1,474 | | | | 1,398,219 | |
Term Loan B, (1 mo. LIBOR + 3.75%, 0.75% Floor), 8.13%, 02/01/28 | | | | | | | 5,048 | | | | 4,920,761 | |
TransDigm, Inc., 2020 Term Loan F, (3 mo. LIBOR + 2.25%), 6.98%, 12/09/25 | | | | | | | 2,369 | | | | 2,337,439 | |
| | | | | | | | |
| | | | | | | | | | | 16,024,686 | |
| | | |
| Air Freight & Logistics(h) — 0.3% | | | | | | | | | |
AIT Worldwide Logistics Holdings, Inc., 2021 Term Loan, (3 mo. LIBOR + 4.75%, 0.75% Floor), 8.49%, 04/06/28 | | | | | | | 510 | | | | 466,238 | |
Kestrel Bidco, Inc., Term Loan B, (1 mo. LIBOR + 3.00%, 1.00% Floor), 7.35%, 12/11/26 | | | | | | | 364 | | | | 330,277 | |
PECF USS Intermediate Holding III Corp., Term Loan B, (1 mo. LIBOR + 4.25%, 0.50% Floor), 8.63%, 12/15/28 | | | | | | | 688 | | | | 571,766 | |
| | | | | | | | |
| | | | | | | | | | | 1,368,281 | |
| | | |
| Airlines(h) — 2.1% | | | | | | | | | |
AAdvantage Loyalty IP Ltd., 2021 Term Loan, (3 mo. LIBOR + 4.75%, 0.75% Floor), 8.99%, 04/20/28 | | | | | | | 1,434 | | | | 1,425,900 | |
Air Canada, 2021 Term Loan B, (3 mo. LIBOR + 3.50%, 0.75% Floor),
8.13%, 08/11/28 | | | | | | | 1,793 | | | | 1,768,733 | |
American Airlines, Inc. | | | | | | | | | | | | |
2017 1st Lien Term Loan, (1 mo. LIBOR + 1.75%), 6.14%, 01/29/27 | | | | | | | 147 | | | | 139,355 | |
2018 Term Loan B, (1 mo. LIBOR + 1.75%), 6.14%, 06/27/25 | | | | | | | 860 | | | | 824,742 | |
Mileage Plus Holdings LLC, 2020 Term Loan B, (3 mo. LIBOR + 5.25%, 1.00% Floor), 10.00%, 06/21/27 | | | | | | | 2,712 | | | | 2,785,752 | |
United Airlines, Inc., 2021 Term Loan B, (3 mo. LIBOR + 3.75%, 0.75% Floor), 8.11%, 04/21/28 | | | | | | | 3,262 | | | | 3,214,798 | |
| | | | | | | | |
| | | | | | | | | | | 10,159,280 | |
| | | |
| Auto Components(h) — 2.2% | | | | | | | | | |
Adient U.S. LLC, 2021 Term Loan B, (1 mo. LIBOR + 3.25%), 7.63%, 04/10/28 | | | | | | | 717 | | | | 708,339 | |
Clarios Global LP, 2021 USD Term Loan B, (1 mo. LIBOR + 3.25%), 7.63%, 04/30/26 | | | | | | | 3,217 | | | | 3,145,632 | |
USI, Inc. | | | | | | | | | | | | |
2019 Incremental Term Loan B, (3 mo. LIBOR + 3.25%), 7.98%, 12/02/26 | | | | | | | 245 | | | | 243,271 | |
| | | | | | | | | | | | |
| Security | | | | | Par
(000) | | | Value | |
| | | |
Auto Components (continued) | | | | | | | | | | | | |
USI, Inc. (continued) | | | | | | | | | | | | |
2022 Incremental Term Loan, (1 mo. SOFR CME + 3.75%, 0.50% Floor),
8.33%, 11/22/29 | | | USD | | | | 4,303 | | | $ | 4,256,779 | |
Wand NewCo 3, Inc., 2020 Term Loan, (1 mo. LIBOR + 3.00%), 7.38%, 02/05/26 | | | | | | | 2,278 | | | | 2,155,610 | |
| | | | | | | | |
| | | | | | | | | | | 10,509,631 | |
| | | |
| Banks(h) — 0.7% | | | | | | | | | |
DirecTV Financing LLC, Term Loan, (1 mo. LIBOR + 5.00%, 0.75% Floor),
9.38%, 08/02/27 | | | | | | | 2,058 | | | | 1,999,138 | |
LABL, Inc., 2021 USD 1st Lien Term Loan, (1 mo. LIBOR + 5.00%, 0.50% Floor),
9.38%, 10/29/28 | | | | | | | 1,405 | | | | 1,329,695 | |
| | | | | | | | |
| | | | | | | | | | | 3,328,833 | |
| | | |
| Beverages(h) — 0.7% | | | | | | | | | |
Naked Juice LLC | | | | | | | | | | | | |
2nd Lien Term Loan, (3 mo. SOFRTE + 6.00%, 0.50% Floor), 10.68%, 01/24/30 | | | | | | | 1,565 | | | | 1,230,776 | |
Term Loan, (3 mo. SOFRTE + 3.25%, 0.50% Floor), 7.93%, 01/24/29 | | | | | | | 2,602 | | | | 2,321,231 | |
| | | | | | | | |
| | | | | | | | | | | 3,552,007 | |
| | | |
| Building Materials — 0.1% | | | | | | | | | |
Cornerstone Building Brands, Inc., 2021 Term Loan B, (1 mo. LIBOR + 3.25%, 0.50% Floor), 7.57%, 04/12/28(h) | | | | | | | 313 | | | | 279,651 | |
| | | | | | | | |
| | | |
| Building Products(h) — 1.7% | | | | | | | | | |
CP Atlas Buyer, Inc., 2021 Term Loan B, (1 mo. LIBOR + 3.50%, 0.50% Floor),
7.88%, 11/23/27 | | | | | | | 1,274 | | | | 1,112,492 | |
CPG International LLC, 2022 Term Loan B, (1 mo. SOFR CME + 2.50%, 0.50% Floor), 6.92%, 04/28/29 | | | | | | | 705 | | | | 684,075 | |
Jeld-Wen, Inc., 2021 Term Loan B, (1 mo. LIBOR + 2.25%), 6.63%, 07/28/28 | | | | | | | 720 | | | | 669,670 | |
LSF10 XL Bidco SCA, 2021 EUR Term Loan B4, (3 mo. EURIBOR + 3.93%),
6.13%, 04/12/28 | | | EUR | | | | 853 | | | | 733,573 | |
New AMI I LLC, 2022 Term Loan B, (1 mo. SOFRTE + 6.00%, 0.50% Floor),
10.32%, 03/08/29 | | | USD | | | | 735 | | | | 626,769 | |
Standard Industries, Inc., 2021 Term Loan B, (3 mo. LIBOR + 2.25%, 0.50% Floor), 6.43%, 09/22/28 | | | | | | | 1,415 | | | | 1,396,220 | |
Wilsonart LLC, 2021 Term Loan E, (3 mo. LIBOR + 3.25%, 1.00% Floor),
7.98%, 12/31/26 | | | | | | | 3,023 | | | | 2,870,168 | |
| | | | | | | | |
| | | | | | | | | | | 8,092,967 | |
| | | |
| Capital Markets(h) — 3.0% | | | | | | | | | |
Ascensus Holdings, Inc. | | | | | | | | | | | | |
2021 2nd Lien Term Loan, (3 mo. LIBOR + 6.50%, 0.50% Floor), 10.25%, 08/02/29 | | | | | | | 2,373 | | | | 2,060,200 | |
Term Loan, (3 mo. LIBOR + 3.50%, 0.50% Floor), 8.25%, 08/02/28 | | | | | | | 3,099 | | | | 2,953,439 | |
Deerfield Dakota Holding LLC | | | | | | | | | | | | |
2020 USD Term Loan B, (1 mo. SOFR CME + 3.75%, 1.00% Floor),
8.07%, 04/09/27 | | | | | | | 5,636 | | | | 5,253,767 | |
2021 USD 2nd Lien Term Loan, (1 mo. LIBOR + 6.75%, 0.75% Floor),
11.13%, 04/07/28 | | | | | | | 1,594 | | | | 1,510,315 | |
Eagle Broadband Investments LLC, Term Loan, (3 mo. LIBOR + 3.00%, 0.75% Floor), 7.75%, 11/12/27 | | | | | | | 1,332 | | | | 1,273,388 | |
| | |
SCHEDULE OF INVESTMENTS | | 31 |
| | |
Schedule of Investments (continued) December 31, 2022 | | BlackRock Debt Strategies Fund, Inc. (DSU) (Percentages shown are based on Net Assets) |
| | | | | | | | | | | | |
| Security | | | | | Par
(000) | | | Value | |
|
Capital Markets (continued) | |
FinCo I LLC, 2020 Term Loan B, (1 mo. LIBOR + 2.50%), 6.88%, 06/27/25 | | | USD | | | | — | (l) | | $ | 184 | |
Focus Financial Partners LLC, 2021 Term Loan B4, (1 mo. SOFR CME + 2.50%, 0.50% Floor), 6.82%, 06/30/28 | | | | | | | 1,293 | | | | 1,265,814 | |
Greenhill & Co., Inc., Term Loan B, (1 mo. LIBOR + 3.25%), 7.63%, 04/12/24 | | | | | | | 520 | | | | 505,449 | |
| | | | | | | | |
| | | | | | | | | | | 14,822,556 | |
| | | |
| Chemicals — 4.0% | | | | | | | | | |
Ascend Performance Materials Operations LLC, 2021 Term Loan B, (3 mo. LIBOR + 4.75%, 0.75% Floor),
8.83%, 08/27/26(h) | | | | | | | 2,899 | | | | 2,718,467 | |
Axalta Coating Systems U.S. Holdings, Inc., 2022 USD Term Loan B, (3 mo. SOFR CME + 3.00%, 0.50% Floor),
7.51%, 12/20/29 | | | | | | | 1,068 | | | | 1,068,000 | |
CPC Acquisition Corp., Term Loan, (3 mo. LIBOR + 3.75%, 0.75% Floor),
8.48%, 12/29/27(h) | | | | | | | 644 | | | | 462,703 | |
Discovery Purchaser Corp., Term Loan, (3 mo. SOFR CME + 4.375%, 0.50% Floor), 7.97%, 10/04/29(h) | | | | | | | 1,143 | | | | 1,039,273 | |
Element Solutions, Inc., 2019 Term Loan B1, (1 mo. LIBOR + 2.00%),
6.32%, 01/31/26(h) | | | | | | | 1,746 | | | | 1,740,826 | |
Illuminate Buyer LLC, 2021 Term Loan, (1 mo. LIBOR + 3.50%), 7.88%, 06/30/27(h) | | | | | | | 1,226 | | | | 1,172,334 | |
Lonza Group AG, USD Term Loan B, (3 mo. LIBOR + 4.00%, 0.75% Floor), 8.73%, 07/03/28(h) | | | | | | | 944 | | | | 862,490 | |
Messer Industries GmbH, 2018 USD Term Loan, (3 mo. LIBOR + 2.50%),
7.23%, 03/02/26(h) | | | | | | | 2,489 | | | | 2,464,106 | |
Momentive Performance Materials, Inc., Term Loan B, (1 mo. LIBOR + 3.25%), 7.64%, 05/15/24(h) | | | | | | | 1,323 | | | | 1,317,056 | |
OQ Chemicals Corp., 2017 USD Term Loan B2, (3 mo. LIBOR + 3.25%), 7.00%, 10/14/24(h) | | | | | | | 1,515 | | | | 1,427,379 | |
PQ Corp., 2021 Term Loan B, (3 mo. LIBOR + 2.50%, 0.50% Floor),
6.91%, 06/09/28(h) | | | | | | | 1,523 | | | | 1,496,800 | |
Pregis TopCo Corp., 2021 Incremental Term Loan, (1 mo. LIBOR + 3.75%, 0.50% Floor), 8.13%, 07/31/26(h) | | | | | | | 617 | | | | 596,712 | |
SCIH Salt Holdings, Inc., 2021 Incremental Term Loan B, (3 mo. LIBOR + 4.00%, 0.75% Floor), 8.41%, 03/16/27(h) | | | | | | | 931 | | | | 902,558 | |
Sparta U.S. HoldCo LLC, 2021 Term Loan, (1 mo. LIBOR + 3.25%, 0.75% Floor), 7.39%, 08/02/28(h) | | | | | | | 1,433 | | | | 1,390,643 | |
Starfruit Finco BV, 2018 USD Term Loan B, (3 mo. LIBOR + 2.75%),
7.16%, 10/01/25(h) | | | | | | | 328 | | | | 322,518 | |
W.R. Grace Holdings LLC, 2021 Term Loan B, (3 mo. LIBOR + 3.75%, 0.50% Floor), 8.50%, 09/22/28(h) | | | | | | | 470 | | | | 460,553 | |
| | | | | | | | |
| | | | | | | | | | | 19,442,418 | |
|
| Commercial Services & Supplies(h) — 3.3% | |
Allied Universal Holdco LLC, 2021 USD | | | | | | | | | | | | |
Incremental Term Loan B, (1 mo. LIBOR + 3.75%, 0.50% Floor),
8.17%, 05/12/28 | | | | | | | 2,304 | | | | 2,184,569 | |
| | | | | | | | | | | | |
| Security | | | | | Par
(000) | | | Value | |
|
Commercial Services & Supplies (continued) | |
Amentum Government Services Holdings LLC, 2022 Term Loan, (3 mo. SOFR CME + 4.00%),
8.64%, 02/15/29 | | | USD | | | | 686 | | | $ | 666,490 | |
Asurion LLC | | | | | | | | | | | | |
2018 Term Loan B7, (1 mo. LIBOR + 3.00%), 7.38%, 11/03/24 | | | | | | | 907 | | | | 878,689 | |
2020 Term Loan B8, (1 mo. LIBOR + 3.25%), 7.63%, 12/23/26 | | | | | | | 668 | | | | 594,368 | |
2021 2nd Lien Term Loan B3, (1 mo. LIBOR + 5.25%), 9.63%, 01/31/28 | | | | | | | 985 | | | | 764,490 | |
2021 Second Lien Term Loan B4, (1 mo. LIBOR + 5.25%), 9.63%, 01/20/29 | | | | | | | 1,402 | | | | 1,083,550 | |
Clean Harbors, Inc., 2021 Incremental Term Loan B, (1 mo. LIBOR + 2.00%),
6.38%, 10/08/28 | | | | | | | 612 | | | | 608,082 | |
Covanta Holding Corp. | | | | | | | | | | | | |
2021 Term Loan B, (1 mo. SOFR CME + 2.50%, 0.50% Floor), 6.82%, 11/30/28 | | | | | | | 992 | | | | 983,522 | |
2021 Term Loan C, (1 mo. SOFR CME + 2.50%, 0.50% Floor), 6.82%, 11/30/28 | | | | | | | 75 | | | | 74,229 | |
Creative Artists Agency LLC, 2020 Incremental Term Loan B1, (1 mo. LIBOR + 4.25%, 1.00% Floor), 8.63%, 11/27/26 | | | | | | | 1,693 | | | | 1,678,100 | |
EnergySolutions LLC, 2018 Term Loan B, (3 mo. LIBOR + 3.75%, 1.00% Floor),
8.48%, 05/09/25 | | | | | | | 432 | | | | 399,801 | |
Packers Holdings LLC, 2021 Term Loan, (3 mo. LIBOR + 3.25%, 0.75% Floor),
7.54%, 03/09/28 | | | | | | | 1,124 | | | | 980,924 | |
Prime Security Services Borrower LLC, 2021 Term Loan, (3 mo. LIBOR + 2.75%, 0.75% Floor), 6.50%, 09/23/26 | | | | | | | 1,479 | | | | 1,464,587 | |
Verscend Holding Corp., 2021 Term Loan B, (1 mo. LIBOR + 4.00%), 8.38%, 08/27/25 | | | | | | | 3,230 | | | | 3,203,034 | |
Viad Corp., Initial Term Loan, (1 mo. LIBOR + 5.00%, 0.50% Floor), 9.38%, 07/30/28 | | | | | | | 687 | | | | 646,062 | |
| | | | | | | | |
| | | | | | | | | | | 16,210,497 | |
|
| Communications Equipment — 0.4% | |
ViaSat, Inc., Term Loan, (1 mo. SOFR CME + 4.50%, 0.50% Floor), 8.94%, 03/02/29(h) | | | | | | | 1,788 | | | | 1,735,952 | |
| | | | | | | | |
|
| Construction & Engineering(h) — 1.5% | |
Arc Falcon I, Inc., 2021 2nd Lien Term Loan, (1 mo. LIBOR + 7.00%, 0.50% Floor), 11.38%, 09/30/29(c) | | | | | | | 815 | | | | 702,937 | |
Brand Energy & Infrastructure Services, Inc., 2017 Term Loan, (3 mo. LIBOR + 4.25%, 1.00% Floor), 8.49%, 06/21/24 | | | | | | | 2,161 | | | | 1,928,521 | |
Pike Corp., 2021 Incremental Term Loan B, (1 mo. LIBOR + 3.00%), 7.39%, 01/21/28 | | | | | | | 925 | | | | 910,849 | |
SRS Distribution, Inc., 2021 Term Loan B, (1 mo. LIBOR + 3.50%, 0.50% Floor),
7.88%, 06/02/28 | | | | | | | 2,409 | | | | 2,298,879 | |
USIC Holdings, Inc., 2021 Term Loan, (1 mo. LIBOR + 3.50%, 0.75% Floor),
7.88%, 05/12/28 | | | | | | | 1,546 | | | | 1,472,398 | |
| | | | | | | | |
| | | | | | | | | | | 7,313,584 | |
| | |
| 32 | | 2 0 2 2 BLACK ROCK ANNUAL REPORT TO SHAREHOLDERS |
| | |
Schedule of Investments (continued) December 31, 2022 | | BlackRock Debt Strategies Fund, Inc. (DSU) (Percentages shown are based on Net Assets) |
| | | | | | | | | | | | |
| Security | | | | | Par
(000) | | | Value | |
|
Construction Materials(h) — 1.5% | |
Core & Main LP, 2021 Term Loan B, (3 mo. LIBOR + 2.50%), 6.88%, 07/27/28 | | | USD | | | | 3,559 | | | $ | 3,507,075 | |
Filtration Group Corp., 2018 1st Lien Term Loan, (1 mo. LIBOR + 3.00%),
7.38%, 03/29/25 | | | | | | | 2,099 | | | | 2,073,933 | |
Oscar AcquisitionCo. LLC, Term Loan B, (3 mo. SOFR CME + 4.50%, 0.50% Floor), 9.18%, 04/29/29 | | | | | | | 959 | | | | 905,280 | |
Tamko Building Products LLC, Term Loan B, (3 mo. LIBOR + 3.00%), 7.57%, 06/01/26 | | | | | | | 762 | | | | 734,612 | |
| | | | | | | | |
| | | | | | | | | | | 7,220,900 | |
| | | |
| Containers & Packaging(h) — 1.5% | | | | | | | | | |
Charter Next Generation, Inc., 2021 Term Loan, (1 mo. LIBOR + 3.75%, 0.75% Floor), 8.13%, 12/01/27 | | | | | | | 2,985 | | | | 2,894,392 | |
Mauser Packaging Solutions Holding Co., | | | | | | | | | | | | |
2017 Term Loan B, (1 mo. LIBOR + 3.25%), 7.37%, 04/03/24 | | | | | | | 2,028 | | | | 1,977,062 | |
Pregis TopCo Corp., 1st Lien Term Loan, (1 mo. LIBOR + 3.75%), 8.13%, 07/31/26 | | | | | | | 540 | | | | 524,212 | |
Tosca Services LLC, 2021 Term Loan, (1 mo. LIBOR + 3.50%, 0.75% Floor),
7.94%, 08/18/27 | | | | | | | 1,028 | | | | 822,696 | |
Trident TPI Holdings, Inc. | | | | | | | | | | | | |
2021 Delayed Draw Term Loan, (1 mo. LIBOR + 4.00%, 0.50% Floor),
8.60%, 09/15/28 | | | | | | | 126 | | | | 120,754 | |
2021 Incremental Term Loan, (3 mo. LIBOR + 4.00%, 0.50% Floor),
8.73%, 09/15/28 | | | | | | | 884 | | | | 847,610 | |
| | | | | | | | |
| | | | | | | | | | | 7,186,726 | |
| | | |
| Distributors — 1.3% | | | | | | | | | |
American Builders & Contractors Supply Co., Inc., 2019 Term Loan, (1 mo. LIBOR + 2.00%), 6.38%, 01/15/27(h) | | | | | | | 1,056 | | | | 1,045,886 | |
Dealer Tire Financial LLC, Term Loan B2, (1 mo. SOFR CME + 4.50%, 0.50% Floor), 8.82%, 12/14/27 | | | | | | | 2,660 | | | | 2,621,221 | |
TMK Hawk Parent Corp.(h) | | | | | | | | | | | | |
2020 Super Priority First Out Term Loan A, (3 mo. LIBOR + 9.50%, 1.00% Floor), 14.26%, 05/30/24(c) | | | | | | | 1,009 | | | | 922,906 | |
2020 Super Priority Second Out Term Loan B, (3 mo. LIBOR + 3.50%, 1.00% Floor), 8.26%, 08/28/24 | | | | | | | 3,213 | | | | 1,638,622 | |
| | | | | | | | |
| | | | | | | | | | | 6,228,635 | |
|
| Diversified Consumer Services — 1.9% | |
2U, Inc., Term Loan, (3 mo. LIBOR + 5.75%, 0.75% Floor), 10.16%, 12/30/24(h) | | | | | | | 1,258 | | | | 1,200,462 | |
Ascend Learning LLC(h) | | | | | | | | | | | | |
2021 2nd Lien Term Loan, (1 mo. LIBOR + 5.75%, 0.50% Floor), 10.13%, 12/10/29 | | | | | | | 681 | | | | 581,404 | |
2021 Term Loan, (1 mo. LIBOR + 3.50%, 0.50% Floor), 7.88%, 12/11/28 | | | | | | | 1,688 | | | | 1,593,003 | |
Bright Horizons Family Solutions LLC, 2021 Term Loan B, (1 mo. LIBOR + 2.25%, 0.50% Floor), 6.69%, 11/24/28(h) | | | | | | | 812 | | | | 795,564 | |
Genuine Financial Holdings LLC, 2018 1st Lien Term Loan, (1 mo. LIBOR + 3.75%), 8.33%, 07/11/25(h) | | | | | | | 1,111 | | | | 1,067,313 | |
| | | | | | | | | | | | |
| Security | | | | | Par
(000) | | | Value | |
|
Diversified Consumer Services (continued) | |
OLA Netherlands BV, Term Loan, (1 mo. SOFR CME + 6.25%, 0.75% Floor),
10.67%, 12/15/26 | | | USD | | | | 750 | | | $ | 705,216 | |
PAI Holdco, Inc., 2020 Term Loan B, (3 mo. LIBOR + 3.75%, 0.75% Floor),
8.16%, 10/28/27(h) | | | | | | | 872 | | | | 764,193 | |
Serta Simmons Bedding LLC(h) | | | | | | | | | | | | |
2020 Super Priority First Out Term Loan, (3 mo. LIBOR + 7.50%), 12.27%, 08/10/23 | | | | | | | 413 | | | | 405,606 | |
2020 Super Priority Second Out Term Loan, (3 mo. LIBOR + 7.50%, 1.00% Floor), 12.27%, 08/10/23 | | | | | | | 845 | | | | 384,650 | |
Sotheby’s, 2021 Term Loan B, (3 mo. LIBOR + 4.50%, 0.50% Floor), 8.58%, 01/15/27(h) | | | | | | | 1,658 | | | | 1,613,731 | |
Voyage Australia Pty. Ltd., USD Term Loan B, (3 mo. LIBOR + 3.50%, 0.50% Floor), 7.74%, 07/20/28(c)(h) | | | | | | | 288 | | | | 272,909 | |
| | | | | | | | |
| | | | | | | | | | | 9,384,051 | |
|
| Diversified Financial Services(h) — 5.1% | |
Acuris Finance U.S., Inc., 2021 USD Term Loan B, (3 mo. SOFR CME + 4.00%, 0.50% Floor), 8.73%, 02/16/28 | | | | | | | 380 | | | | 373,036 | |
Advisor Group, Inc., 2021 Term Loan, (1 mo. LIBOR + 4.50%), 8.88%, 07/31/26 | | | | | | | 914 | | | | 892,343 | |
AlixPartners LLP, 2021 USD Term Loan B, (1 mo. LIBOR + 2.75%, 0.50% Floor), 7.13%, 02/04/28 | | | | | | | 1,524 | | | | 1,509,134 | |
Castlelake Aviation Ltd., Term Loan B, (3 mo. LIBOR + 2.75%, 0.50% Floor),
7.52%, 10/22/26 | | | | | | | 1,361 | | | | 1,346,837 | |
Cogeco Financing 2 LP, 2021 Incremental Term Loan B, (1 mo. LIBOR + 2.50%, 0.50% Floor), 6.88%, 09/01/28 | | | | | | | 1,384 | | | | 1,341,769 | |
Delta TopCo, Inc. | | | | | | | | | | | | |
2020 2nd Lien Term Loan, (3 mo. LIBOR + 7.25%, 0.75% Floor), 11.65%, 12/01/28 | | | | | | | 330 | | | | 256,987 | |
2020 Term Loan B, (3 mo. LIBOR + 3.75%, 0.75% Floor), 8.15%, 12/01/27 | | | | | | | 501 | | | | 461,588 | |
EG America LLC, 2018 USD Term Loan, (3 mo. LIBOR + 4.00%), 8.73%, 02/07/25 | | | | | | | 1,137 | | | | 1,071,075 | |
Gainwell Acquisition Corp., Term Loan B, (3 mo. LIBOR + 4.00%, 0.75% Floor),
8.73%, 10/01/27 | | | | | | | 2,822 | | | | 2,641,914 | |
Kingpin Intermediate Holdings LLC, 2018 Term Loan B, (1 mo. LIBOR + 3.50%, 1.00% Floor), 7.89%, 07/03/24(c) | | | | | | | 1,314 | | | | 1,311,076 | |
KKR Apple Bidco LLC | | | | | | | | | | | | |
2021 2nd Lien Term Loan, (1 mo. LIBOR + 5.75%, 0.50% Floor), 10.13%, 09/21/29 | | | | | | | 218 | | | | 209,592 | |
2021 Term Loan, (1 mo. LIBOR + 2.75%, 0.50% Floor), 7.13%, 09/23/28 | | | | | | | 529 | | | | 520,646 | |
LBM Acquisition LLC, Term Loan B, (6 mo. LIBOR + 3.75%, 0.75% Floor),
7.12%, 12/17/27 | | | | | | | 437 | | | | 377,764 | |
Radiate Holdco LLC, 2021 Term Loan B, (1 mo. LIBOR + 3.25%, 0.75% Floor),
7.63%, 09/25/26 | | | | | | | 2,224 | | | | 1,798,785 | |
RVR Dealership Holdings LLC, Term Loan B, (1 mo. SOFRTE + 3.75%, 0.75% Floor), 8.17%, 02/08/28 | | | | | | | 640 | | | | 587,511 | |
| | |
SCHEDULE OF INVESTMENTS | | 33 |
| | |
Schedule of Investments (continued) December 31, 2022 | | BlackRock Debt Strategies Fund, Inc. (DSU) (Percentages shown are based on Net Assets) |
| | | | | | | | | | | | |
| Security | | | | | Par
(000) | | | Value | |
|
Diversified Financial Services (continued) | |
Setanta Aircraft Leasing Designated Activity Co., Term Loan B, (3 mo. LIBOR + 2.00%), 6.73%, 11/05/28 | | | USD | | | | 1,175 | | | $ | 1,167,362 | |
SMG U.S. Midco 2, Inc., 2020 Term Loan, (3 mo. LIBOR + 2.50%), 6.91%, 01/23/25 | | | | | | | 1,699 | | | | 1,651,264 | |
SSH Group Holdings, Inc., 2018 1st Lien Term Loan, (3 mo. LIBOR + 4.00%),
8.73%, 07/30/25 | | | | | | | 916 | | | | 892,092 | |
Veritas U.S., Inc., 2021 USD Term Loan B, (3 mo. LIBOR + 5.00%, 1.00% Floor),
9.73%, 09/01/25 | | | | | | | 3,329 | | | | 2,333,932 | |
VS Buyer LLC, Term Loan B, (1 mo. LIBOR + 3.00%), 7.38%, 02/28/27 | | | | | | | 1,458 | | | | 1,412,915 | |
White Cap Buyer LLC, Term Loan B, (1 mo. SOFR CME + 3.75%), 8.07%, 10/19/27 | | | | | | | 1,089 | | | | 1,051,165 | |
Ziggo Financing Partnership, USD Term Loan I, (1 mo. LIBOR + 2.50%),
6.82%, 04/30/28 | | | | | | | 1,876 | | | | 1,826,173 | |
| | | | | | | | |
| | | | | | | | | | | 25,034,960 | |
|
| Diversified Telecommunication Services(h) — 1.4% | |
Cablevision Lightpath LLC, Term Loan B, (1 mo. LIBOR + 3.25%, 0.50% Floor),
7.57%, 11/30/27 | | | | | | | 332 | | | | 316,783 | |
Consolidated Communications, Inc., 2021 Term Loan B, (1 mo. LIBOR + 3.50%, 0.75% Floor), 7.88%, 10/02/27 | | | | | | | 713 | | | | 626,918 | |
Frontier Communications Holdings LLC, 2021 1st Lien Term Loan, (3 mo. LIBOR + 3.75%, 0.75% Floor), 8.50%, 05/01/28 | | | | | | | 1,753 | | | | 1,668,397 | |
Iridium Satellite LLC, 2021 Term Loan B2, (1 mo. LIBOR + 2.50%, 0.75% Floor),
6.92%, 11/04/26 | | | | | | | 1,583 | | | | 1,566,859 | |
Level 3 Financing, Inc., 2019 Term Loan B, (1 mo. LIBOR + 1.75%), 6.13%, 03/01/27 | | | | | | | 1,299 | | | | 1,242,269 | |
Virgin Media SFA Finance Ltd., GBP Term Loan L, (1 mo. SONIA + 3.25%),
6.21%, 01/15/27 | | | GBP | | | | 1,400 | | | | 1,561,359 | |
| | | | | | | | |
| | | | | | | | | | | 6,982,585 | |
|
| Electric Utilities(h) — 0.8% | |
ExGen Renewables IV LLC, 2020 Term Loan, (3 mo. LIBOR + 2.50%, 1.00% Floor), 7.24%, 12/15/27 | | | USD | | | | 1,110 | | | | 1,097,718 | |
Triton Water Holdings, Inc., Term Loan, (3 mo. LIBOR + 3.50%, 0.50% Floor),
8.23%, 03/31/28 | | | | | | | 2,798 | | | | 2,592,215 | |
| | | | | | | | |
| | | | | | | | | | | 3,689,933 | |
|
| Electrical Equipment(h) — 0.7% | |
Arcline FM Holdings LLC, 2021 1st Lien Term Loan, (6 mo. LIBOR + 4.75%, 0.75% Floor), 9.48%, 06/23/28 | | | | | | | 1,337 | | | | 1,267,989 | |
AZZ, Inc., Term Loan B, (1 mo. SOFR CME + 4.25%, 0.50% Floor), 8.67%, 05/13/29 | | | | | | | 228 | | | | 238,072 | |
Gates Global LLC, 2021 Term Loan B3, (1 mo. LIBOR + 2.50%, 0.75% Floor), 6.88%, 03/31/27 | | | | | | | 2,135 | | | | 2,086,540 | |
| | | | | | | | |
| | | | | | | | | | | 3,592,601 | |
| | | | | | | | | | | | |
| Security | | | | | Par
(000) | | | Value | |
|
Electronic Equipment, Instruments & Components — 0.3% | |
Coherent Corp., 2022 Term Loan B, (3 mo. LIBOR + 2.75%, 0.50% Floor),
7.13%, 07/02/29(h) | | | USD | | | | 1,488 | | | $ | 1,469,105 | |
| | | | | | | | |
| | | |
| Entertainment — 0.2% | | | | | | | | | |
Delta 2 Lux SARL, Term Loan B, (3 mo. SOFR CME + 3.25%, 0.50% Floor),
7.57%, 01/15/30(h) | | | | | | | 1,104 | | | | 1,102,620 | |
| | | | | | | | |
|
| Environmental, Maintenance & Security Service(h) — 0.5% | |
Asplundh Tree Expert LLC, 2021 Term Loan B, (1 mo. LIBOR + 1.75%), 6.13%, 09/07/27 | | | | | | | 1,735 | | | | 1,732,165 | |
TruGreen LP, 2020 Term Loan, (1 mo. LIBOR + 4.00%, 0.75% Floor), 8.38%, 11/02/27 | | | | | | | 1,068 | | | | 945,438 | |
| | | | | | | | |
| | | | | | | | | | | 2,677,603 | |
|
| Equity Real Estate Investment Trusts (REITs) — 0.1% | |
RHP Hotel Properties LP, 2017 Term Loan B, (1 mo. LIBOR + 2.00%), 6.39%, 05/11/24(h) | | | | | | | 270 | | | | 267,870 | |
| | | | | | | | |
|
| Food & Staples Retailing(h) — 0.5% | |
Nomad Foods U.S. LLC, 2022 Term Loan B, (3 mo. SOFR CME + 3.75%, 0.50% Floor), 8.23%, 11/12/29 | | | | | | | 911 | | | | 907,489 | |
U.S. Foods, Inc. | | | | | | | | | | | | |
2019 Term Loan B, (1 mo. LIBOR + 2.00%), 6.38%, 09/13/26 | | | | | | | 631 | | | | 623,634 | |
2021 Term Loan B, (1 mo. LIBOR + 2.75%), 7.13%, 11/22/28 | | | | | | | 854 | | | | 848,582 | |
| | | | | | | | |
| | | | | | | | | | | 2,379,705 | |
| | | |
| Food Products(h) — 2.3% | | | | | | | | | |
8th Avenue Food & Provisions, Inc. | | | | | | | | | | | | |
2018 1st Lien Term Loan, (1 mo. LIBOR + 3.75%), 8.13%, 10/01/25 | | | | | | | 1,178 | | | | 976,116 | |
2021 Incremental Term Loan, (1 mo. LIBOR + 4.75%, 0.75% Floor), 9.13%, 10/01/25 | | | | | | | 1,335 | | | | 1,104,517 | |
Chobani LLC, 2020 Term Loan B, (1 mo. LIBOR + 3.50%, 1.00% Floor),
7.88%, 10/25/27 | | | | | | | 2,438 | | | | 2,385,747 | |
Froneri International Ltd., 2020 USD Term Loan, (1 mo. LIBOR + 2.25%),
6.63%, 01/29/27 | | | | | | | 3,255 | | | | 3,162,419 | |
Reynolds Group Holdings, Inc., 2020 Term Loan B2, (1 mo. LIBOR + 3.25%),
7.63%, 02/05/26 | | | | | | | 1,669 | | | | 1,646,510 | |
Sovos Brands Intermediate, Inc., 2021 Term Loan, (3 mo. LIBOR + 3.50%, 0.75% Floor), 7.91%, 06/08/28 | | | | | | | 1,345 | | | | 1,306,733 | |
UTZ Quality Foods LLC, 2021 Term Loan B, (1 mo. SOFR CME + 3.00%),
7.44%, 01/20/28 | | | | | | | 603 | | | | 596,217 | |
| | | | | | | | |
| | | | | | | | | | | 11,178,259 | |
| | | |
| Gas Utilities — 0.6% | | | | | | | | | |
Freeport LNG Investments LLLP, Term Loan B, (3 mo. LIBOR + 3.50%, 0.50% Floor), 7.74%, 12/21/28(h) | | | | | | | 3,018 | | | | 2,863,161 | |
| | | | | | | | |
|
| Health Care Equipment & Supplies(h) — 1.4% | |
Electron BidCo, Inc., 2021 Term Loan, (1 mo. LIBOR + 3.00%, 0.50% Floor),
7.38%, 11/01/28 | | | | | | | 1,919 | | | | 1,865,682 | |
| | |
| 34 | | 2 0 2 2 BLACK ROCK ANNUAL REPORT TO SHAREHOLDERS |
| | |
Schedule of Investments (continued) December 31, 2022 | | BlackRock Debt Strategies Fund, Inc. (DSU) (Percentages shown are based on Net Assets) |
| | | | | | | | | | | | |
| Security | | | | | Par
(000) | | | Value | |
|
Health Care Equipment & Supplies (continued) | |
Insulet Corp., Term Loan B, (3 mo. SOFR CME + 3.25%), 7.69%, 05/04/28 | | | USD | | | | 675 | | | $ | 664,186 | |
Medline Borrower LP, USD Term Loan B, (1 mo. LIBOR + 3.25%, 0.50% Floor), 7.63%, 10/23/28 | | | | | | | 3,752 | | | | 3,560,971 | |
Venga Finance SARL, 2021 USD Term Loan B, (3 mo. LIBOR + 4.75%, 0.75% Floor), 9.48%, 12/04/28 | | | | | | | 568 | | | | 519,303 | |
| | | | | | | | |
| | | | | | | | | | | 6,610,142 | |
|
| Health Care Providers & Services(h) — 2.5% | |
CHG Healthcare Services, Inc., 2021 Term Loan, (1 mo. LIBOR + 3.25%, 0.50% Floor), 7.63%, 09/29/28 | | | | | | | 899 | | | | 877,660 | |
Envision Healthcare Corp. | | | | | | | | | | | | |
2022 First Out Term Loan, (3 mo. SOFR CME + 7.88%, 1.00% Floor),
12.61%, 03/31/27 | | | | | | | 210 | | | | 185,931 | |
2022 Second Out Term Loan, (3 mo. SOFR CME + 4.25%, 1.00% Floor), 8.83%, 03/31/27 | | | | | | | 1,397 | | | | 475,001 | |
EyeCare Partners LLC | | | | | | | | | | | | |
2020 Term Loan, (3 mo. LIBOR + 3.75%), 8.48%, 02/18/27 | | | | | | | 1,935 | | | | 1,541,484 | |
2021 2nd Lien Term Loan, (3 mo. LIBOR + 6.75%, 0.50% Floor),
11.48%, 11/15/29 | | | | | | | 508 | | | | 412,889 | |
2021 Incremental Term Loan, (3 mo. LIBOR + 3.75%, 0.50% Floor),
8.48%, 11/15/28 | | | | | | | 468 | | | | 392,029 | |
Femur Buyer, Inc., 1st Lien Term Loan, (3 mo. LIBOR + 4.50%), 9.23%, 03/05/26 | | | | | | | 927 | | | | 791,727 | |
Ingenovis Health, Inc., Term Loan B, (1 mo. LIBOR + 3.75%, 0.75% Floor),
8.14%, 03/06/28 | | | | | | | 1,398 | | | | 1,327,575 | |
Orbcomm, Inc., Term Loan B, (3 mo. LIBOR + 4.25%, 0.75% Floor), 8.81%, 09/01/28 | | | | | | | 763 | | | | 650,078 | |
PetVet Care Centers LLC, 2021 Term Loan B3, (1 mo. LIBOR + 3.50%, 0.75% Floor), 7.88%, 02/14/25 | | | | | | | 46 | | | | 43,149 | |
Sotera Health Holdings LLC, 2021 Term Loan, (3 mo. LIBOR + 2.75%, 0.50% Floor), 7.16%, 12/11/26 | | | | | | | 2,247 | | | | 2,067,240 | |
Surgery Center Holdings, Inc., 2021 Term Loan, (3 mo. LIBOR + 3.75%, 0.75% Floor), 8.05%, 08/31/26 | | | | | | | 509 | | | | 502,262 | |
Vizient, Inc., 2022 Term Loan B, (1 mo. SOFR CME + 2.25%, 0.50% Floor), 6.67%, 04/28/29 | | | | | | | 292 | | | | 291,872 | |
WCG Purchaser Corp., 2019 Term Loan, (1 mo. LIBOR + 4.00%, 1.00% Floor), 8.38%, 01/08/27 | | | | | | | 1,404 | | | | 1,270,281 | |
WP CityMD Bidco LLC, 2021 1st Lien Term Loan B, (1 mo. LIBOR + 3.25%, 0.50% Floor), 7.63%, 12/22/28 | | | | | | | 1,600 | | | | 1,595,869 | |
| | | | | | | | |
| | | | | | | | | | | 12,425,047 | |
| | | | | | | | | | | | |
| Security | | | | | Par
(000) | | | Value | |
|
Health Care Services(h) — 0.3% | |
Azalea Topco, Inc., Term Loan, (1 mo. LIBOR + 3.50%), 7.88%, 07/24/26 | | | USD | | | | 845 | | | $ | 771,788 | |
Medical Solutions Holdings, Inc., 2021 2nd Lien Term Loan, (1 mo. LIBOR + 7.00%, 0.50% Floor), 11.38%, 11/01/29 | | | | | | | 536 | | | | 493,120 | |
| | | | | | | | |
| | | | | | | | | | | 1,264,908 | |
|
| Health Care Technology(h) — 2.2% | |
AthenaHealth Group, Inc. | | | | | | | | | | | | |
2022 Delayed Draw Term loan, (3 mo. SOFR CME + 3.50%), 7.82%, 02/15/29 | | | | | | | 321 | | | | 96,283 | |
2022 Term Loan B, (1 mo. SOFR CME + 3.50%, 0.50% Floor), 7.82%, 02/15/29 | | | | | | | 2,618 | | | | 2,260,916 | |
GoodRx, Inc., 1st Lien Term Loan, (1 mo. LIBOR + 2.75%), 7.13%, 10/10/25 | | | | | | | 621 | | | | 603,167 | |
Polaris Newco LLC, USD Term Loan B, (3 mo. LIBOR + 4.00%, 0.50% Floor),
8.73%, 06/02/28 | | | | | | | 3,255 | | | | 2,963,442 | |
Press Ganey Holdings, Inc., 2021 Term Loan B, (1 mo. LIBOR + 3.75%, 0.75% Floor), 8.13%, 07/24/26 | | | | | | | 2,310 | | | | 2,117,806 | |
Verscend Holding Corp., 2021 2nd Lien Term Loan, (1 mo. LIBOR + 7.00%, 0.50% Floor), 11.38%, 04/02/29(c) | | | | | | | 2,740 | | | | 2,698,900 | |
| | | | | | | | |
| | | | | | | | | | | 10,740,514 | |
|
| Hotels, Restaurants & Leisure — 5.8% | |
Aimbridge Acquisition Co., Inc., 2019 Term Loan B, (1 mo. LIBOR + 3.75%),
8.13%, 02/02/26(h) | | | | | | | 240 | | | | 216,394 | |
Aristocrat Technologies, Inc., 2022 Term Loan B, (3 mo. SOFR CME + 2.25%, 0.50% Floor), 6.93%, 05/24/29(h) | | | | | | | 87 | | | | 87,308 | |
Bally’s Corp., 2021 Term Loan B, (3 mo. LIBOR + 3.25%, 0.50% Floor),
7.54%, 10/02/28(h) | | | | | | | 789 | | | | 727,712 | |
Burger King (Restaurant Brands Int), Term Loan B4, (3 mo. LIBOR + 1.75%),
6.14%, 11/19/26(h) | | | | | | | 2,708 | | | | 2,657,324 | |
Caesars Resort Collection LLC(h) | | | | | | | | | | | | |
2017 1st Lien Term Loan B, (1 mo. LIBOR + 2.75%), 7.13%, 12/23/24 | | | | | | | 1,195 | | | | 1,191,581 | |
2020 Term Loan B1, (1 mo. LIBOR + 3.50%), 7.88%, 07/21/25 | | | | | | | 604 | | | | 601,965 | |
Carnival Corp., USD Term Loan B, (1 mo. LIBOR + 3.00%, 0.75% Floor),
7.38%, 06/30/25(h) | | | | | | | 1,238 | | | | 1,183,945 | |
Churchill Downs, Inc., 2021 Incremental Term Loan B1, (1 mo. LIBOR + 2.00%),
6.39%, 03/17/28(h) | | | | | | | 684 | | | | 676,414 | |
ECL Entertainment LLC, Term Loan, (1 mo. LIBOR + 7.50%, 0.75% Floor),
11.88%, 05/01/28(h) | | | | | | | 808 | | | | 805,010 | |
Equinox Holdings, Inc., 2017 1st Lien Term Loan, (3 mo. LIBOR + 3.00%, 1.00% Floor), 7.73%, 03/08/24(h) | | | | | | | 3,337 | | | | 2,498,841 | |
Fertitta Entertainment LLC, 2022 Term Loan B, (1 mo. SOFRTE + 4.00%, 0.50% Floor), 8.32%, 01/27/29(h) | | | | | | | 3,262 | | | | 3,095,314 | |
| | |
SCHEDULE OF INVESTMENTS | | 35 |
| | |
Schedule of Investments (continued) December 31, 2022 | | BlackRock Debt Strategies Fund, Inc. (DSU) (Percentages shown are based on Net Assets) |
| | | | | | | | | | | | |
| Security | | | | | Par
(000) | | | Value | |
|
Hotels, Restaurants & Leisure (continued) | |
Flutter Financing B.V., 2022 USD Term Loan B, (3 mo. SOFR CME + 3.25%, 0.50% Floor), 8.09%, 07/22/28(h) | | | USD | | | | 1,013 | | | $ | 1,007,693 | |
Four Seasons Hotels Ltd., 2022 Term Loan B, (1 mo. SOFR CME + 3.25%, 0.50% Floor), 7.67%, 11/30/29(h) | | | | | | | 2,379 | | | | 2,378,015 | |
IRB Holding Corp., 2020 Term Loan B, (1 mo. LIBOR + 2.75%, 1.00% Floor), 7.13%, 02/05/25(h) | | | | | | | 1,371 | | | | 1,356,695 | |
Penn National Gaming, Inc., 2022 Term Loan B, (1 mo. SOFR CME + 2.75%, 0.50% Floor), 7.17%, 05/03/29(h) | | | | | | | 1,281 | | | | 1,266,530 | |
Playa Resorts Holding B.V., 2022 Term Loan B, (3 mo. SOFR CME + 4.25%, 0.50% Floor), 8.58%, 01/05/29 | | | | | | | 411 | | | | 399,956 | |
Playtika Holding Corp., 2021 Term Loan, (1 mo. LIBOR + 2.75%), 7.13%, 03/13/28(h) | | | | | | | 1,509 | | | | 1,437,455 | |
Scientific Games International, Inc., 2022 USD Term Loan, (1 mo. SOFR CME + 3.00%, 0.50% Floor), 7.42%, 04/14/29(h) | | | | | | | 707 | | | | 696,076 | |
Stars Group Holdings BV, 2018 USD Incremental Term Loan, (3 mo. LIBOR + 2.25%), 6.98%, 07/21/26(h) | | | | | | | 1,045 | | | | 1,028,821 | |
Station Casinos LLC, 2020 Term Loan B, (1 mo. LIBOR + 2.25%, 0.25% Floor), 6.64%, 02/08/27(h) | | | | | | | 1,958 | | | | 1,908,196 | |
Travelport Finance Luxembourg SARL(h) | | | | | | | | | | | | |
2020 Super Priority Term Loan, (3 mo. LIBOR + 1.50%, 1.00% Floor, 8.75% PIK), 6.23%, 02/28/25(i) | | | | | | | 31 | | | | 30,569 | |
2021 Consented Term Loan, (3 mo. LIBOR + 6.75%), 11.48%, 05/29/26 | | | | | | | 1,228 | | | | 828,890 | |
Whatabrands LLC, 2021 Term Loan B, (1 mo. LIBOR + 3.25%, 0.50% Floor), 7.63%, 08/03/28(h) | | | | | | | 1,986 | | | | 1,916,849 | |
Wyndham Hotels & Resorts, Inc., Term Loan B, (1 mo. LIBOR + 1.75%),
6.13%, 05/30/25(h) | | | | | | | 173 | | | | 172,244 | |
| | | | | | | | |
| | | | | | | | | | | 28,169,797 | |
|
| Household Durables(h) — 1.1% | |
ACProducts Holdings, Inc., 2021 Term Loan B, (6 mo. LIBOR + 4.25%, 0.50% Floor), 8.98%, 05/17/28 | | | | | | | 1,426 | | | | 1,061,622 | |
Hunter Douglas, Inc., USD Term Loan B1, (3 mo. SOFR CME + 3.50%),
7.86%, 02/26/29 | | | | | | | 2,088 | | | | 1,828,735 | |
Snap One Holdings Corp., Term Loan B, (1 mo. LIBOR + 4.50%, 0.50% Floor), 8.88%, 12/08/28(c) | | | | | | | 515 | | | | 469,717 | |
Sunset Debt Merger Sub, Inc., 2021 Term Loan B, (3 mo. LIBOR + 4.00%, 0.75% Floor), 8.75%, 10/06/28 | | | | | | | 723 | | | | 589,317 | |
Weber-Stephen Products LLC, Term Loan B, (1 mo. LIBOR + 3.25%, 0.75% Floor), 7.63%, 10/30/27 | | | | | | | 1,701 | | | | 1,428,829 | |
| | | | | | | | |
| | | | | | | | | | | 5,378,220 | |
| | | | | | | | | | | | |
| Security | | | | | Par
(000) | | | Value | |
|
| Household Products — 0.1% | |
Spectrum Brands, Inc., 2021 Term Loan, (1 mo. LIBOR + 2.00%, 0.50% Floor),
6.60%, 03/03/28(h) | | | USD | | | | 472 | | | $ | 462,168 | |
| | | | | | | | |
|
| Independent Power and Renewable Electricity Producers(h) — 0.7% | |
Calpine Construction Finance Co. LP, 2017 Term Loan B, (1 mo. LIBOR + 2.00%), 6.38%, 01/15/25 | | | | | | | 655 | | | | 652,897 | |
Calpine Corp. | | | | | | | | | | | | |
2019 Term Loan B10, (1 mo. LIBOR + 2.00%), 6.38%, 08/12/26 | | | | | | | 1,040 | | | | 1,025,264 | |
Term Loan B9, (1 mo. LIBOR + 2.00%), 6.39%, 04/05/26 | | | | | | | 1,883 | | | | 1,857,195 | |
| | | | | | | | |
| | | |
| | | | | | | | | | | 3,535,356 | |
|
| Industrial Conglomerates — 1.6% | |
AVSC Holding Corp. | | | | | | | | | | | | |
2020 Term Loan B1, (3 mo. LIBOR + 3.25%, 1.00% Floor), 7.68%, 03/03/25(h) | | | | | | | 866 | | | | 792,427 | |
2020 Term Loan B3, (3 mo. LIBOR + 15.00%), 15.00%, 10/15/26 | | | | | | | 793 | | | | 840,274 | |
Diamond BC BV, 2021 Term Loan B, (3 mo. LIBOR + 2.75%, 0.50% Floor),
7.16%, 09/29/28(h) | | | | | | | 1,519 | | | | 1,466,257 | |
Stitch Aquisition Corp., Term Loan B, (3 mo. LIBOR + 6.75%, 0.75% Floor),
11.48%, 07/28/28(h) | | | | | | | 956 | | | | 809,332 | |
Vertical U.S. Newco, Inc., Term Loan B, (6 mo. LIBOR + 3.50%, 0.50% Floor),
6.87%, 07/30/27(h) | | | | | | | 1,674 | | | | 1,611,109 | |
Vertiv Group Corp., 2021 Term Loan B, (1 mo. LIBOR + 2.75%), 6.89%, 03/02/27(h) | | | | | | | 2,143 | | | | 2,057,864 | |
| | | | | | | | |
| | | |
| | | | | | | | | | | 7,577,263 | |
| | | |
| Insurance(h) — 4.2% | | | | | | | | | |
Alliant Holdings Intermediate LLC | | | | | | | | | | | | |
2018 Term Loan B, (1 mo. LIBOR + 3.25%), 7.63%, 05/09/25 | | | | | | | 2,390 | | | | 2,356,151 | |
2021 Term Loan B4, (1 mo. LIBOR + 3.50%, 0.50% Floor), 7.85%, 11/06/27 | | | | | | | 3,283 | | | | 3,204,027 | |
Term Loan B, (1 mo. LIBOR + 3.25%), 7.63%, 05/09/25 | | | | | | | 1,166 | | | | 1,149,362 | |
AmWINS Group, Inc., 2021 Term Loan B, (1 mo. LIBOR + 2.25%, 0.75% Floor),
6.63%, 02/19/28 | | | | | | | 2,954 | | | | 2,898,089 | |
AssuredPartners, Inc. | | | | | | | | | | | | |
2020 Term Loan B, (1 mo. LIBOR + 3.50%), 7.88%, 02/12/27 | | | | | | | 1,281 | | | | 1,241,954 | |
2021 Term Loan B, (1 mo. LIBOR + 3.50%, 0.50% Floor), 7.88%, 02/12/27 | | | | | | | 764 | | | | 738,577 | |
Hub International Ltd. | | | | | | | | | | | | |
2018 Term Loan B, (3 mo. LIBOR + 3.00%), 7.33%, 04/25/25 | | | | | | | 2,339 | | | | 2,310,566 | |
2021 Term Loan B, (3 mo. LIBOR + 3.25%, 0.75% Floor), 7.53%, 04/25/25 | | | | | | | 2,971 | | | | 2,940,920 | |
2022 Term Loan B, (3 mo. SOFR CME + 4.00%, 0.75% Floor), 8.22%, 11/10/29 | | | | | | | 468 | | | | 462,412 | |
NFP Corp., 2020 Term Loan, (1 mo. LIBOR + 3.25%), 7.63%, 02/15/27 | | | | | | | 163 | | | | 155,546 | |
| | |
| 36 | | 2 0 2 2 BLACK ROCK ANNUAL REPORT TO SHAREHOLDERS |
| | |
Schedule of Investments (continued) December 31, 2022 | | BlackRock Debt Strategies Fund, Inc. (DSU) (Percentages shown are based on Net Assets) |
| | | | | | | | | | | | |
| Security | | | | | Par
(000) | | | Value | |
|
Insurance (continued) | |
Ryan Specialty Group LLC, Term Loan, (1 mo. SOFR CME + 3.00%, 0.75% Floor), 7.42%, 09/01/27 | | | USD | | | | 1,171 | | | $ | 1,161,205 | |
Sedgwick Claims Management Services, Inc. | | | | | | | | | | | | |
2019 Term Loan B, (1 mo. LIBOR + 3.75%), 8.13%, 09/03/26 | | | | | | | 1,346 | | | | 1,319,648 | |
2020 Term Loan B3, (1 mo. LIBOR + 4.25%, 1.00% Floor), 8.63%, 09/03/26 | | | | | | | 719 | | | | 708,342 | |
| | | | | | | | |
| | | | | | | | | | | 20,646,799 | |
|
| Interactive Media & Services(h) — 1.5% | |
Adevinta ASA, USD Term Loan B, (3 mo. LIBOR + 2.75%, 0.75% Floor),
7.48%, 06/26/28 | | | | | | | 1,529 | | | | 1,509,081 | |
Camelot U.S. Acquisition LLC, 2020 Incremental Term Loan B, (1 mo. LIBOR + 3.00%, 1.00% Floor), 7.38%, 10/30/26 | | | | | | | 2,044 | | | | 2,010,187 | |
Go Daddy Operating Co. LLC, 2021 Term Loan B4, (1 mo. LIBOR + 2.00%),
6.38%, 08/10/27 | | | | | | | 1,687 | | | | 1,668,837 | |
Grab Holdings, Inc., Term Loan B, (1 mo. LIBOR + 4.50%, 1.00% Floor),
8.89%, 01/29/26 | | | | | | | 1,972 | | | | 1,942,689 | |
| | | | | | | | |
| | | | | | | | | | | 7,130,794 | |
|
| Internet & Direct Marketing Retail(h) — 0.6% | |
CNT Holdings I Corp., 2020 Term Loan, (3 mo. SOFR CME + 3.50%, 0.75% Floor), 7.24%, 11/08/27 | | | | | | | 1,612 | | | | 1,557,414 | |
Go Daddy Operating Co. LLC, 2022 Term Loan B5, (1 mo. SOFR CME + 3.25%), 7.57%, 10/21/29 | | | | | | | 1,275 | | | | 1,271,634 | |
PUG LLC, 2021 Incremental Term Loan B, (1 mo. LIBOR + 4.25%, 0.50% Floor), 8.63%, 02/12/27(c) | | | | | | | 323 | | | | 266,403 | |
| | | | | | | | |
| | | | | | | | | | | 3,095,451 | |
|
| Internet Software & Services — 0.3% | |
Uber Technologies, Inc., 2021 Term Loan B, (3 mo. LIBOR + 3.50%),
8.23%, 02/25/27(h) | | | | | | | 1,534 | | | | 1,530,159 | |
| | | | | | | | |
|
| IT Services — 5.7% | |
Aruba Investments Holdings LLC(h) | | | | | | | | | | | | |
2020 2nd Lien Term Loan, (1 mo. LIBOR + 7.75%, 0.75% Floor),
12.14%, 11/24/28 | | | | | | | 1,275 | | | | 1,153,875 | |
2020 USD Term Loan, (1 mo. LIBOR + 3.75%, 0.75% Floor), 8.14%, 11/24/27 | | | | | | | 678 | | | | 657,066 | |
Boxer Parent Co., Inc., 2021 USD Term Loan, (1 mo. LIBOR + 3.75%),
8.13%, 10/02/25(h) | | | | | | | 1,767 | | | | 1,688,794 | |
Camelot Finance SA, Term Loan B, (1 mo. LIBOR + 3.00%), 7.38%, 10/30/26(h) | | | | | | | 1,882 | | | | 1,849,788 | |
CCC Intelligent Solutions, Inc., Term Loan, (1 mo. LIBOR + 2.25%, 0.50% Floor), 6.63%, 09/21/28(h) | | | | | | | 1,477 | | | | 1,462,309 | |
CoreLogic, Inc. | | | | | | | | | | | | |
2nd Lien Term Loan, (1 mo. LIBOR + 6.50%, 0.50% Floor), 10.94%, 06/04/29 | | | | | | | 1,248 | | | | 874,224 | |
Term Loan, (1 mo. LIBOR + 3.50%, 0.50% Floor), 7.94%, 06/02/28(h) | | | | | | | 2,952 | | | | 2,453,959 | |
Fleetcor Technologies Operating Co. LLC, | | | | | | | | | | | | |
2021 Term Loan B4, (1 mo. LIBOR + 1.75%), 6.13%, 04/28/28(h) | | | | | | | 1,941 | | | | 1,918,189 | |
Genesys Cloud Services Holdings II LLC, 2020 USD Term Loan B4, (1 mo. LIBOR + 4.00%, 0.75% Floor), 8.38%, 12/01/27(h) | | | | | | | 4,293 | | | | 4,112,881 | |
| | | | | | | | | | | | |
| Security | | | | | Par
(000) | | | Value | |
|
IT Services (continued) | |
PUG LLC, USD Term Loan, (1 mo. LIBOR + 3.50%), 7.88%, 02/12/27(h) | | | USD | | | | 2,225 | | | $ | 1,832,028 | |
Sophia LP, 2020 2nd Lien Term Loan, (3 mo. LIBOR + 8.00%, 1.00% Floor),
12.73%, 10/09/28(h) | | | | | | | 3,730 | | | | 3,702,025 | |
TierPoint LLC, 2021 Term Loan, (1 mo. LIBOR + 3.75%, 0.75% Floor),
8.13%, 05/05/26(h) | | | | | | | 851 | | | | 793,023 | |
Trans Union LLC(h) | | | | | | | | | | | | |
2019 Term Loan B5, (1 mo. LIBOR + 1.75%), 6.13%, 11/16/26 | | | | | | | 1,636 | | | | 1,611,216 | |
2021 Term Loan B6, (1 mo. LIBOR + 2.25%, 0.50% Floor), 6.63%, 12/01/28 | | | | | | | 2,104 | | | | 2,080,847 | |
Virtusa Corp., First Lien Term Loan B, (1 mo. LIBOR + 3.75%, 0.75% Floor),
8.13%, 02/11/28(h) | | | | | | | 598 | | | | 575,953 | |
WEX, Inc., 2021 Term Loan, (1 mo. LIBOR + 2.25%), 6.63%, 03/31/28(h) | | | | | | | 859 | | | | 852,385 | |
ZoomInfo LLC, 2021 Term Loan B, (1 mo. SOFR CME + 3.00%), 7.48%, 02/02/26(h) | | | | | | | 192 | | | | 191,099 | |
| | | | | | | | |
| | | | | | | | | | | 27,809,661 | |
|
| Leisure Products(h) — 0.3% | |
Fender Musical Instruments Corp., 2021 Term Loan B, (3 mo. SOFRTE + 4.00%, 0.50% Floor), 8.42%, 12/01/28(c) | | | | | | | 853 | | | | 684,983 | |
MND Holdings III Corp., 2018 1st Lien Term Loan, (1 mo. LIBOR + 3.50%, 1.00% Floor), 8.23%, 06/19/24 | | | | | | | 765 | | | | 729,282 | |
Peloton Interactive, Inc., Term Loan, (2 mo. SOFR CME + 6.50%, 0.50% Floor), 11.76%, 05/25/27 | | | | | | | 298 | | | | 291,802 | |
| | | | | | | | |
| | | | | | | | | | | 1,706,067 | |
|
| Life Sciences Tools & Services(h) — 2.3% | |
Avantor Funding, Inc., 2021 Term Loan B5, (1 mo. LIBOR + 2.25%, 0.50% Floor),
6.63%, 11/08/27 | | | | | | | 1,835 | | | | 1,824,210 | |
eResearchTechnology, Inc., 2020 1st Lien Term Loan, (1 mo. LIBOR + 4.50%, 1.00% Floor), 8.88%, 02/04/27 | | | | | | | 2,847 | | | | 2,504,414 | |
ICON Luxembourg SARL, LUX Term Loan, (3 mo. LIBOR + 2.25%, 0.50% Floor),
7.00%, 07/03/28 | | | | | | | 2,222 | | | | 2,212,933 | |
Maravai Intermediate Holdings LLC, 2022 Term Loan B, (3 mo. SOFRTE + 3.00%, 0.50% Floor), 6.96%, 10/19/27 | | | | | | | 1,294 | | | | 1,267,937 | |
Parexel International Corp., 2021 1st Lien Term Loan, (1 mo. LIBOR + 3.25%, 0.50% Floor), 7.63%, 11/15/28 | | | | | | | 2,982 | | | | 2,866,746 | |
PRA Health Sciences, Inc., US Term Loan, (3 mo. LIBOR + 2.25%, 0.50% Floor),
7.00%, 07/03/28 | | | | | | | 553 | | | | 551,355 | |
| | | | | | | | |
| | | | | | | | | | | 11,227,595 | |
| | | |
| Machinery(h) — 2.9% | | | | | | | | | |
Albion Acquisitions Ltd., USD Term Loan, (3 mo. LIBOR + 5.25%, 0.50% Floor),
9.57%, 08/17/26 | | | | | | | 1,607 | | | | 1,515,519 | |
Clark Equipment Co., 2022 Term Loan B, (3 mo. SOFR CME + 2.50%, 0.50% Floor), 7.18%, 04/20/29 | | | | | | | 263 | | | | 258,986 | |
| | |
SCHEDULE OF INVESTMENTS | | 37 |
| | |
Schedule of Investments (continued) December 31, 2022 | | BlackRock Debt Strategies Fund, Inc. (DSU) (Percentages shown are based on Net Assets) |
| | | | | | | | | | | | |
| Security | | | | | Par
(000) | | | Value | |
|
Machinery (continued) | |
Columbus McKinnon Corp., 2021 Term Loan B, (3 mo. LIBOR + 2.75%, 0.50% Floor), 7.50%, 05/14/28 | | | USD | | | | 343 | | | $ | 338,020 | |
Filtration Group Corp., 2021 Incremental Term Loan, (1 mo. LIBOR + 3.50%, 0.50% Floor), 7.88%, 10/21/28 | | | | | | | 1,026 | | | | 1,005,492 | |
Fluidra SA, 2022 USD Term Loan B, (1 mo. SOFR CME + 2.00%),
6.42%, 01/29/29 | | | | | | | 269 | | | | 255,210 | |
Ingersoll-Rand Services Co., 2020 USD Spinco Term Loan, (1 mo. SOFR CME + 1.75%), 6.17%, 03/01/27 | | | | | | | 2,476 | | | | 2,453,240 | |
Madison IAQ LLC, Term Loan, (3 mo. LIBOR + 3.25%, 0.50% Floor),
7.99%, 06/21/28 | | | | | | | 3,262 | | | | 3,027,179 | |
SPX Flow, Inc., 2022 Term Loan, (1 mo. SOFR CME + 4.50%, 0.50% Floor), 8.92%, 04/05/29 | | | | | | | 1,201 | | | | 1,112,120 | |
Titan Acquisition Ltd., 2018 Term Loan B, (6 mo. LIBOR +
3.00%), 8.15%, 03/28/25 | | | | | | | 4,206 | | | | 3,919,705 | |
Zurn LLC, 2021 Term Loan B, (1 mo. LIBOR + 2.00%, 0.50% Floor),
6.38%, 10/04/28 | | | | | | | 111 | | | | 110,464 | |
| | | | | | | | |
| | | | | | | | | | | 13,995,935 | |
| | | |
| Media(h) — 10.2% | | | | | | | | | |
Altice Financing SA | | | | | | | | | | | | |
2017 USD Term Loan B, (3 mo. LIBOR + 2.75%), 6.83%, 07/15/25 | | | | | | | 646 | | | | 624,398 | |
USD 2017 1st Lien Term Loan, (3 mo. LIBOR + 2.75%), 6.83%, 01/31/26 | | | | | | | 1,723 | | | | 1,653,778 | |
Altice France SA/France, 2018 Term Loan B13, (3 mo. LIBOR + 4.00%),
8.65%, 08/14/26 | | | | | | | 2,773 | | | | 2,573,553 | |
AMC Entertainment Holdings, Inc., 2019 Term Loan B, (1 mo. LIBOR + 3.00%), 7.27%, 04/22/26 | | | | | | | 1,313 | | | | 706,996 | |
Cable One, Inc., 2021 Term Loan B4, (1 mo. LIBOR + 2.00%), 6.38%, 05/03/28 | | | | | | | 430 | | | | 419,253 | |
Charter Communications Operating LLC, Class A, 2019 Term Loan B1, (1 mo. LIBOR + 1.75%), 6.14%, 04/30/25 | | | | | | | 2,567 | | | | 2,550,145 | |
City Football Group Ltd., Term Loan, (1 mo. LIBOR + 3.00%, 0.50% Floor), 7.36%, 07/21/28 | | | | | | | 1,473 | | | | 1,373,132 | |
Clear Channel Outdoor Holdings, Inc., Term Loan B, (3 mo. LIBOR + 3.50%), 7.91%, 08/21/26 | | | | | | | 3,364 | | | | 3,057,309 | |
CMG Media Corp., 2021 Term Loan, (3 mo. LIBOR + 3.50%), 8.23%, 12/17/26 | | | | | | | — | (l) | | | 192 | |
Connect Finco SARL, 2021 Term Loan B, (1 mo. LIBOR + 3.50%, 1.00% Floor), 7.89%, 12/11/26 | | | | | | | 7,205 | | | | 7,111,922 | |
CSC Holdings LLC | | | | | | | | | | | | |
2017 Term Loan B1, (1 mo. LIBOR + 2.25%), 6.57%, 07/17/25 | | | | | | | 576 | | | | 542,734 | |
2019 Term Loan B5, (1 mo. LIBOR + 2.50%), 6.82%, 04/15/27 | | | | | | | 1,836 | | | | 1,633,892 | |
E.W. Scripps Co., 2020 Term Loan B3, (1 mo. LIBOR + 2.75%, 0.75% Floor), 7.13%, 01/07/28 | | | | | | | 471 | | | | 456,930 | |
Learfield Communications LLC, 2016 1st Lien Term Loan, (1 mo. LIBOR + 3.25%, 1.00% Floor), 7.64%, 12/01/23 | | | | | | | 749 | | | | 558,046 | |
Lions Gate Capital Holdings LLC, 2018 Term Loan B, (1 mo. LIBOR + 2.25%), 6.63%, 03/24/25 | | | | | | | 1,514 | | | | 1,442,265 | |
| | | | | | | | | | | | |
| Security | | | | | Par
(000) | | | Value | |
|
Media (continued) | |
Live Nation Entertainment, Inc., Term Loan B4, (1 mo. LIBOR + 1.75%),
6.13%, 10/17/26 | | | USD | | | | 2,250 | | | $ | 2,194,100 | |
MH Sub I LLC | | | | | | | | | | | | |
2017 1st Lien Term Loan, (1 mo. LIBOR + 3.75%), 8.13%, 09/13/24 | | | | | | | 3,440 | | | | 3,337,013 | |
2020 Incremental Term Loan, (1 mo. LIBOR + 3.75%, 1.00% Floor), 8.13%, 09/13/24 | | | | | | | 1,677 | | | | 1,627,604 | |
2021 2nd Lien Term Loan, (3 mo. SOFR CME + 6.25%), 10.65%, 02/23/29 | | | | | | | 1,724 | | | | 1,536,757 | |
Nexstar Broadcasting, Inc., 2019 Term Loan B4, (1 mo. LIBOR + 2.50%),
6.88%, 09/18/26 | | | | | | | 912 | | | | 903,386 | |
Sinclair Television Group, Inc., 2022 Term Loan B4, (1 mo. SOFR CME + 3.75%), 8.17%, 04/21/29 | | | | | | | 1,573 | | | | 1,491,687 | |
UFC Holdings LLC, 2021 Term Loan B, (3 mo. LIBOR + 2.75%, 0.75% Floor),
7.11%, 04/29/26 | | | | | | | 769 | | | | 740,378 | |
UPC Financing Partnership, 2021 USD Term Loan AX, (1 mo. LIBOR + 2.93%),
7.24%, 01/31/29 | | | | | | | 672 | | | | 655,096 | |
Virgin Media Bristol LLC | | | | | | | | | | | | |
2020 USD Term Loan Q, (1 mo. LIBOR + 3.25%), 7.57%, 01/31/29 | | | | | | | 1,212 | | | | 1,198,971 | |
USD Term Loan N, (1 mo. LIBOR + 2.50%), 6.82%, 01/31/28 | | | | | | | 2,578 | | | | 2,531,284 | |
Voyage Digital Ltd., USD Term Loan B, (3 mo. SOFRTE + 4.50%, 0.50% Floor),
8.78%, 05/11/29(c) | | | | | | | 881 | | | | 865,165 | |
William Morris Endeavor Entertainment LLC, 2018 1st Lien Term Loan, (1 mo. LIBOR + 2.75%), 7.14%, 05/18/25 | | | | | | | 2,584 | | | | 2,522,957 | |
WMG Acquisition Corp., 2021 Term Loan G, (1 mo. LIBOR + 2.13%), 6.51%, 01/20/28 | | | | | | | 1,854 | | | | 1,830,090 | |
Zayo Group Holdings, Inc., USD Term Loan, (1 mo. LIBOR + 3.00%), 7.38%, 03/09/27 | | | | | | | 4,386 | | | | 3,540,183 | |
| | | | | | | | |
| | | | | | | | | | | 49,679,216 | |
|
| Oil, Gas & Consumable Fuels(h) — 1.4% | |
Ascent Resources Utica Holdings LLC, 2020 Fixed 2nd Lien Term Loan, (3 mo. LIBOR + 9.00%, 1.00% Floor), 12.94%, 11/01/25 | | | | | | | 555 | | | | 585,415 | |
Edgewater Generation LLC, Term Loan, (1 mo. LIBOR + 3.75%), 8.13%, 12/13/25 | | | | | | | 1,061 | | | | 1,003,347 | |
Lealand Finance Co. BV | | | | | | | | | | | | |
2020 Make Whole Term Loan, (1 mo. LIBOR + 3.00%), 7.38%, 06/28/24 | | | | | | | 46 | | | | 28,764 | |
2020 Take Back Term Loan, (1 mo. LIBOR + 1.00%), 5.38%, 06/30/25 | | | | | | | 343 | | | | 179,375 | |
M6 ETX Holdings II Midco LLC, Term Loan B, (3 mo. SOFR CME + 4.50%, 0.50% Floor), 9.16%, 09/19/29 | | | | | | | 229 | | | | 229,209 | |
Medallion Midland Acquisition LLC, 2021 Term Loan, (3 mo. SOFR CME + 3.75%, 0.75% Floor), 8.59%, 10/18/28 | | | | | | | 1,672 | | | | 1,654,036 | |
Murphy USA, Inc., Term Loan B, (1 mo. LIBOR + 1.75%, 0.50% Floor),
5.93%, 01/31/28 | | | | | | | 565 | | | | 566,097 | |
Oryx Midstream Services Permian Basin LLC, Term Loan B, (3 mo. LIBOR + 3.25%, 0.50% Floor), 7.92%, 10/05/28 | | | | | | | 2,688 | | | | 2,651,763 | |
| | | | | | | | |
| | | | | | | | | | | 6,898,006 | |
| | |
| 38 | | 2 0 2 2 BLACK ROCK ANNUAL REPORT TO SHAREHOLDERS |
| | |
Schedule of Investments (continued) December 31, 2022 | | BlackRock Debt Strategies Fund, Inc. (DSU) (Percentages shown are based on Net Assets) |
| | | | | | | | | | | | |
| Security | | | | | Par
(000) | | | Value | |
|
Personal Products(h) — 1.1% | |
Kronos Acquisition Holdings, Inc., 2021 1st Lien Term Loan, (3 mo. SOFRTE + 6.00%, 1.00% Floor), 10.51%, 12/22/26 | | | USD | | | | 355 | | | $ | 342,082 | |
Prestige Brands, Inc., 2021 Term Loan B5, (1 mo. LIBOR + 2.00%, 0.50% Floor),
6.38%, 07/03/28 | | | | | | | 178 | | | | 176,610 | |
Sunshine Luxembourg VII SARL, 2021 Term Loan B3, (3 mo. LIBOR + 3.75%, 0.75% Floor), 8.48%, 10/01/26 | | | | | | | 5,305 | | | | 5,071,807 | |
| | | | | | | | |
| | | | | | | | | | | 5,590,499 | |
| | | |
| Pharmaceuticals(h) — 2.0% | | | | | | | | | |
Amneal Pharmaceuticals LLC, 2018 Term Loan B, (3 mo. LIBOR + 3.50%),
8.09%, 05/04/25 | | | | | | | 1,065 | | | | 951,250 | |
Bausch Health Cos., Inc., 2022 Term Loan B, (1 mo. SOFR CME + 5.25%, 0.50% Floor), 9.67%, 02/01/27 | | | | | | | 979 | | | | 740,861 | |
Catalent Pharma Solutions, Inc., 2021 Term Loan B3, (1 mo. LIBOR + 2.00%, 0.50% Floor), 6.38%, 02/22/28 | | | | | | | 1,851 | | | | 1,818,636 | |
Elanco Animal Health, Inc., Term Loan B, (1 mo. LIBOR + 1.75%), 5.87%, 08/01/27 | | | | | | | 1,280 | | | | 1,226,719 | |
Jazz Financing Lux SARL, USD Term Loan, (1 mo. LIBOR + 3.50%, 0.50% Floor), 7.88%, 05/05/28 | | | | | | | 1,915 | | | | 1,895,380 | |
Option Care Health, Inc., 2021 Term Loan B, (1 mo. LIBOR + 2.75%, 0.50% Floor), 7.13%, 10/27/28 | | | | | | | 608 | | | | 602,520 | |
Organon & Co., USD Term Loan, (3 mo. LIBOR + 3.00%, 0.50% Floor),
7.75%, 06/02/28 | | | | | | | 1,360 | | | | 1,344,648 | |
Precision Medicine Group LLC, 2021 Term Loan, (3 mo. LIBOR + 3.00%, 0.75% Floor), 7.73%, 11/18/27(c) | | | | | | | 1,281 | | | | 1,188,758 | |
| | | | | | | | |
| | | | | | | | | | | 9,768,772 | |
| | | |
| Professional Services(h) — 1.2% | | | | | | | | | |
Dun & Bradstreet Corp. | | | | | | | | | | | | |
2022 Incremental Term Loan B2, (1 mo. SOFR CME + 3.25%), 7.57%, 01/18/29 | | | | | | | 620 | | | | 609,072 | |
Term Loan, (1 mo. LIBOR + 3.25%), 7.64%, 02/06/26 | | | | | | | 2,021 | | | | 1,998,829 | |
Element Materials Technology Group | | | | | | | | | | | | |
U.S. Holdings, Inc. | | | | | | | | | | | | |
2022 USD Delayed Draw Term Loan, (3 mo. SOFR CME + 4.25%, 0.50% Floor), 8.93%, 07/06/29 | | | | | | | 529 | | | | 515,863 | |
2022 USD Term Loan, (3 mo. SOFR CME + 4.25%, 0.50% Floor), 8.93%, 07/06/29 | | | | | | | 1,147 | | | | 1,117,702 | |
Galaxy U.S. Opco, Inc., Term Loan, (1 mo. SOFR CME + 4.75%, 0.50% Floor),
9.07%, 04/29/29 | | | | | | | 1,749 | | | | 1,578,473 | |
| | | | | | | | |
| | | | | | | | | | | 5,819,939 | |
| | | | | | | | | | | | |
| Security | | | | | Par
(000) | | | Value | |
|
Real Estate Management & Development(h) — 0.8% | |
Chariot Buyer LLC, Term Loan B, (1 mo. LIBOR + 3.25%, 0.50% Floor),
7.63%, 11/03/28 | | | USD | | | | 2,150 | | | $ | 2,023,048 | |
Cushman & Wakefield U.S. Borrower LLC, | | | | | | | | | | | | |
2020 Term Loan B, (1 mo. LIBOR + 2.75%), 7.13%, 08/21/25 | | | | | | | 2,038 | | | | 1,987,235 | |
| | | | | | | | |
| | | |
| | | | | | | | | | | 4,010,283 | |
| | | |
| Road & Rail(h) — 0.4% | | | | | | | | | |
Avis Budget Car Rental LLC, 2020 Term Loan B, (1 mo. LIBOR + 1.75%),
6.14%, 08/06/27 | | | | | | | 569 | | | | 549,645 | |
SIRVA Worldwide, Inc., 2018 1st Lien Term Loan, (1 mo. LIBOR + 5.50%),
9.58%, 08/04/25 | | | | | | | 1,327 | | | | 1,182,801 | |
| | | | | | | | |
| | | |
| | | | | | | | | | | 1,732,446 | |
|
| Semiconductors & Semiconductor Equipment(h) — 0.3% | |
MKS Instruments, Inc., 2022 USD Term Loan B, 08/17/29(m) | | | | | | | 993 | | | | 978,866 | |
ON Semiconductor Corp., 2019 Term Loan B, (1 mo. LIBOR + 2.00%), 6.42%, 09/19/26 | | | | | | | — | (l) | | | 21 | |
Synaptics, Inc., Term Loan B, (6 mo. LIBOR + 2.25%, 0.50% Floor), 7.40%, 12/02/28 | | | | | | | 548 | | | | 535,731 | |
| | | | | | | | |
| | | |
| | | | | | | | | | | 1,514,618 | |
| | | |
| Software — 10.6% | | | | | | | | | |
Applied Systems, Inc. | | | | | | | | | | | | |
2021 2nd Lien Term Loan, (3 mo. SOFR CME + 6.75%, 0.75% Floor),
11.33%, 09/19/25(h) | | | | | | | 630 | | | | 622,913 | |
2022 Extended 1st Lien Term Loan, 09/18/26(m) | | | | | | | 431 | | | | 428,306 | |
Barracuda Networks, Inc., 2022 Term Loan, (3 mo. SOFR CME + 4.50%, 0.50% Floor), 8.59%, 08/15/29(h) | | | | | | | 661 | | | | 636,305 | |
Central Parent, Inc., 2022 USD Term Loan B, (3 mo. SOFR CME + 4.50%, 0.50% Floor), 9.08%, 07/06/29(h) | | | | | | | 634 | | | | 627,514 | |
Cloudera, Inc.(h) | | | | | | | | | | | | |
2021 Second Lien Term Loan, (1 mo. LIBOR + 6.00%, 0.50% Floor),
10.38%, 10/08/29 | | | | | | | 676 | | | | 562,209 | |
2021 Term Loan, (1 mo. LIBOR + 3.75%, 0.50% Floor), 8.13%, 10/08/28 | | | | | | | 1,234 | | | | 1,157,551 | |
Cornerstone OnDemand, Inc., 2021 Term Loan, (1 mo. LIBOR + 3.75%, 0.50% Floor), 8.13%, 10/16/28(h) | | | | | | | 1,050 | | | | 934,558 | |
Digicel International Finance Ltd., 2017 Term Loan B, (1 mo. LIBOR + 3.25%),
7.63%, 05/28/24(h) | | | | | | | 497 | | | | 416,225 | |
E2open LLC, 2020 Term Loan B, (1 mo. LIBOR + 3.50%, 0.50% Floor),
7.68%, 02/04/28(h) | | | | | | | 250 | | | | 244,994 | |
Epicor Software Corp., 2020 2nd Lien Term Loan, (1 mo. LIBOR + 7.75%, 1.00% Floor), 12.13%, 07/31/28(h) | | | | | | | 1,886 | | | | 1,854,881 | |
Helios Software Holdings, Inc., 2021 USD Term Loan B, (3 mo. SOFR CME + 3.75%), 8.48%, 03/11/28(h) | | | | | | | 1,192 | | | | 1,166,835 | |
Informatica LLC, 2021 USD Term Loan B, (1 mo. LIBOR + 2.75%), 7.19%, 10/27/28(h) | | | | | | | 3,343 | | | | 3,273,025 | |
Instructure Holdings, Inc., 2021 Term Loan B, (3 mo. LIBOR + 2.75%, 0.50% Floor), 6.12%, 10/30/28(c)(h) | | | | | | | 639 | | | | 626,387 | |
| | |
SCHEDULE OF INVESTMENTS | | 39 |
| | |
Schedule of Investments (continued) December 31, 2022 | | BlackRock Debt Strategies Fund, Inc. (DSU) (Percentages shown are based on Net Assets) |
| | | | | | | | | | | | |
| Security | | | | | Par
(000) | | | Value | |
|
Software (continued) | |
IPS Corp.(h) | | | | | | | | | | | | |
2021 2nd Lien Term Loan B, (1 mo. LIBOR + 3.50%, 0.50% Floor),
11.38%, 10/01/29(c) | | | USD | | | | 919 | | | $ | 771,960 | |
2021 Delayed Draw Term Loan,
3.50%, 10/02/28 | | | | | | | 94 | | | | 83,205 | |
2021 Term Loan, (1 mo. LIBOR + 3.50%, 0.50% Floor), 7.88%, 10/02/28 | | | | | | | 523 | | | | 465,147 | |
Magenta Buyer LLC(h) | | | | | | | | | | | | |
2021 USD 1st Lien Term Loan, (3 mo. LIBOR + 4.75%, 0.75% Floor),
9.17%, 07/27/28 | | | | | | | 2,094 | | | | 1,782,771 | |
2021 USD 2nd Lien Term Loan, (3 mo. LIBOR + 8.25%, 0.75% Floor),
12.67%, 07/27/29 | | | | | | | 1,907 | | | | 1,493,734 | |
McAfee Corp., 2022 USD Term Loan B, (1 mo. SOFR CME + 3.75%),
7.97%, 03/01/29(h) | | | | | | | 3,035 | | | | 2,817,432 | |
Planview Parent, Inc.(h) | | | | | | | | | | | | |
2nd Lien Term Loan, (3 mo. LIBOR + 7.25%, 0.75% Floor), 11.98%, 12/18/28 | | | | | | | 824 | | | | 729,240 | |
Term Loan, (3 mo. LIBOR + 4.00%, 0.75% Floor), 8.73%, 12/17/27 | | | | | | | 901 | | | | 834,615 | |
Proofpoint, Inc.(h) | | | | | | | | | | | | |
1st Lien Term Loan, (3 mo. LIBOR + 3.25%, 0.50% Floor), 7.98%, 08/31/28 | | | | | | | 2,469 | | | | 2,368,777 | |
2nd Lien Term Loan, (3 mo. LIBOR + 6.25%, 0.50% Floor), 10.98%, 08/31/29 | | | | | | | 1,281 | | | | 1,225,494 | |
RealPage, Inc.(h) | | | | | | | | | | | | |
1st Lien Term Loan, (1 mo. LIBOR + 3.00%, 0.50% Floor), 7.38%, 04/24/28 | | | | | | | 5,429 | | | | 5,151,907 | |
2nd Lien Term Loan, (1 mo. LIBOR + 6.50%, 0.75% Floor), 10.88%, 04/23/29 | | | | | | | 2,629 | | | | 2,517,348 | |
Renaissance Holding Corp., 2018 1st Lien Term Loan, (1 mo. LIBOR + 3.25%), 7.63%, 05/30/25(h) | | | | | | | 578 | | | | 549,736 | |
Severin Acquisition LLC, 2018 Term Loan B, (3 mo. SOFR CME + 3.00%),
7.09%, 08/01/25(h) | | | | | | | 2,406 | | | | 2,385,509 | |
Sophia LP, 2021 Term Loan B, (3 mo. LIBOR + 3.50%, 0.50% Floor),
8.23%, 10/07/27(h) | | | | | | | 1,964 | | | | 1,891,061 | |
SS&C Technologies, Inc.(h) | | | | | | | | | | | | |
2018 Term Loan B3, (1 mo. LIBOR + 1.75%), 6.13%, 04/16/25 | | | | | | | 388 | | | | 381,081 | |
2018 Term Loan B4, (1 mo. LIBOR + 1.75%), 6.13%, 04/16/25 | | | | | | | 315 | | | | 309,601 | |
2018 Term Loan B5, (1 mo. LIBOR + 1.75%), 6.13%, 04/16/25 | | | | | | | 1,639 | | | | 1,608,606 | |
Tempo Acquisition LLC, 2022 Term Loan B, (1 mo. SOFR CME + 3.00%),
7.32%, 08/31/28(h) | | | | | | | 4,209 | | | | 4,192,295 | |
TIBCO Software, Inc., 2022 USD Term Loan, (3 mo. SOFR CME + 4.50%, 0.50% Floor), 9.18%, 03/30/29(h) | | | | | | | 3,298 | | | | 2,939,342 | |
Ultimate Software Group, Inc.(h) | | | | | | | | | | | | |
2021 2nd Lien Term Loan, (1 mo. LIBOR + 5.25%, 0.50% Floor),
9.00%, 05/03/27 | | | | | | | 1,216 | | | | 1,113,447 | |
2021 Term Loan, (3 mo. LIBOR + 3.25%, 0.50% Floor), 7.00%, 05/04/26 | | | | | | | 1,101 | | | | 1,046,097 | |
Term Loan B, (1 mo. LIBOR + 3.75%), 8.13%, 05/04/26 | | | | | | | 2,255 | | | | 2,170,615 | |
| | | | | | | | |
| | | | | | | | | | | 51,380,723 | |
| | | | | | | | | | | | |
| Security | | | | | Par
(000) | | | Value | |
| | | |
Specialty Retail(h) — 3.7% | | | | | | | | | | | | |
Belron Finance U.S. LLC | | | | | | | | | | | | |
2018 Term Loan B, (3 mo. LIBOR + 2.25%), 6.94%, 11/13/25 | | | USD | | | | 1,967 | | | $ | 1,954,746 | |
2019 USD Term Loan B3, (3 mo. LIBOR + 2.25%), 6.69%, 10/30/26 | | | | | | | 1,128 | | | | 1,121,059 | |
2021 USD Term Loan B, (3 mo. LIBOR + 2.50%, 0.50% Floor), 7.06%, 04/13/28 | | | | | | | 1,711 | | | | 1,691,055 | |
EG Group Ltd., 2021 Term Loan, (3 mo. LIBOR + 4.25%, 0.50% Floor),
8.98%, 03/31/26 | | | | | | | 500 | | | | 466,380 | |
Fanatics Commerce Intermediate Holdco LLC, Term Loan B, (1 mo. LIBOR + 3.25%, 0.50% Floor), 7.63%, 11/24/28(c) | | | | | | | 596 | | | | 584,060 | |
Mavis Tire Express Services Corp., 2021 Term Loan B, (1 mo. SOFR CME + 4.00%, 0.75% Floor), 8.50%, 05/04/28 | | | | | | | 2,644 | | | | 2,517,211 | |
MED ParentCo LP, 1st Lien Term Loan, (1 mo. LIBOR + 4.25%), 8.63%, 08/31/26 | | | | | | | 1,838 | | | | 1,561,204 | |
Midas Intermediate Holdco II LLC, (1 mo. SOFR CME + 8.35%, 0.75% Floor), 12.67%, 06/30/27 | | | | | | | 2,741 | | | | 2,366,414 | |
PetSmart, Inc., 2021 Term Loan B, (1 mo. LIBOR + 3.75%, 0.75% Floor),
8.13%, 02/11/28 | | | | | | | 3,255 | | | | 3,178,613 | |
Restoration Hardware, Inc., 2022 Incremental Term Loan, (1 mo. SOFR CME + 3.25%, 0.50% Floor), 7.67%, 10/20/28 | | | | | | | 751 | | | | 700,650 | |
Reverb Buyer, Inc., 2021 1st Lien Term Loan, (1 mo. LIBOR + 3.50%, 0.50% Floor), 7.88%, 11/01/28 | | | | | | | 812 | | | | 754,015 | |
Woof Holdings, Inc. | | | | | | | | | | | | |
1st Lien Term Loan, (1 mo. LIBOR + 3.75%, 0.75% Floor), 8.10%, 12/21/27 | | | | | | | 482 | | | | 452,657 | |
2nd Lien Term Loan, (1 mo. LIBOR + 7.25%, 0.75% Floor), 11.60%, 12/21/28 | | | | | | | 495 | | | | 445,500 | |
| | | | | | | | |
| | | | | | | | | | | 17,793,564 | |
|
| Technology Hardware, Storage & Peripherals — 0.1% | |
Electronics for Imaging, Inc., Term Loan, (1 mo. LIBOR + 5.00%), 9.38%, 07/23/26(h) | | | | | | | 688 | | | | 456,195 | |
| | | | | | | | |
|
| Textiles, Apparel & Luxury Goods — 0.2% | |
Crocs, Inc., Term Loan B, (3 mo. SOFRTE + 3.50%, 0.50% Floor), 7.80%, 02/20/29(h) | | | | | | | 1,179 | | | | 1,154,227 | |
| | | | | | | | |
|
| Trading Companies & Distributors(h) — 0.5% | |
Beacon Roofing Supply, Inc., 2021 Term Loan B, (1 mo. LIBOR + 2.25%),
6.63%, 05/19/28 | | | | | | | 1,214 | | | | 1,202,384 | |
ION Trading Finance Ltd., 2021 USD Term Loan, (3 mo. LIBOR + 4.75%),
9.48%, 04/03/28 | | | | | | | 595 | | | | 562,641 | |
SRS Distribution, Inc., 2022 Incremental Term Loan, (1 mo. SOFR CME + 3.50%),
7.92%, 06/02/28 | | | | | | | 864 | | | | 823,915 | |
| | | | | | | | |
| | | | | | | | | | | 2,588,940 | |
| | |
| 40 | | 2 0 2 2 BLACK ROCK ANNUAL REPORT TO SHAREHOLDERS |
| | |
Schedule of Investments (continued) December 31, 2022 | | BlackRock Debt Strategies Fund, Inc. (DSU) (Percentages shown are based on Net Assets) |
| | | | | | | | | | | | |
| Security | | | | | Par (000) | | | Value | |
|
Wireless Telecommunication Services(h) — 0.9% | |
GOGO Intermediate Holdings LLC, Term Loan B, (3 mo. LIBOR + 3.75%, 0.75% Floor), 8.16%, 04/30/28 | | | USD | | | | 963 | | | $ | 953,909 | |
SBA Senior Finance II LLC, 2018 Term Loan B, (1 mo. LIBOR + 1.75%), 6.14%, 04/11/25 | | | | | | | 3,301 | | | | 3,286,011 | |
| | | | | | | | |
| | | |
| | | | | | | | | | | 4,239,920 | |
| | | | | | | | |
| |
Total Floating Rate Loan Interests — 108.9%
(Cost: $558,203,105) | | | | 530,032,281 | |
| | | | | | | | |
| | | |
| | | | | | Shares | | | | |
| | | |
Investment Companies | | | | | | | | | | | | |
| | | |
Fixed Income Funds — 0.1% | | | | | | | | | | | | |
Invesco Senior Loan ETF | | | | | | | 16,200 | | | | 332,586 | |
| | | | | | | | |
| |
Total Investment Companies — 0.1%
(Cost: $349,754) | | | | 332,586 | |
| | | | | | | | |
| | | |
| | | | | | Benefical Interest (000) | | | | |
| | | |
Other Interests | | | | | | | | | | | | |
| | | |
IT Services(c)(n) — 0.0% | | | | | | | | | | | | |
Millennium Corp. Claim | | | USD | | | | 1,084 | | | | — | |
Millennium Lender Claim Trust | | | | | | | 1,156 | | | | — | |
| | | | | | | | |
| |
Total Other Interests — 0.0%
(Cost:$ — ) | | | | — | |
| | | | | | | | |
| | | |
| | | | | | Par (000) | | | | |
| | | |
Preferred Securities | | | | | | | | | | | | |
| | | |
Capital Trusts — 0.4% | | | | | | | | | | | | |
| | |
Aerospace & Defense — 0.0% | | | | | | | | | |
Air France-KLM, 6.50%, 12/31/99 | | | EUR | | | | 100 | | | | 105,258 | |
| | | | | | | | |
| | | |
| Automobiles — 0.0% | | | | | | | | | |
General Motors Financial Co., Inc., Series C, 5.70%(g)(h) | | | USD | | | | 50 | | | | 42,319 | |
| | | | | | | | |
| | | |
| Banks — 0.0% | | | | | | | | | |
PNC Financial Services Group, Inc., Series V, 6.20%(g)(h) | | | | | | | 92 | | | | 89,907 | |
| | | | | | | | |
| |
| Diversified Financial Services(g)(h) — 0.3% | | | | |
Barclays PLC, 4.38% | | | | | | | 200 | | | | 152,500 | |
HSBC Holdings PLC, 6.00% | | | | | | | 600 | | | | 550,686 | |
JPMorgan Chase & Co. | | | | | | | | | | | | |
Series FF, 5.00% | | | | | | | 765 | | | | 699,922 | |
Series HH, 4.60% | | | | | | | 166 | | | | 146,287 | |
| | | | | | | | |
| | | | | | | | | | | 1,549,395 | |
| |
| Diversified Telecommunication Services — 0.0% | | | | |
Telefonica Europe BV, 7.13%(a)(g)(h) | | | EUR | | | | 100 | | | | 109,186 | |
| | | | | | | | |
| | | |
| Electric Utilities — 0.0% | | | | | | | | | |
Edison International, Series B, 5.00%(g)(h) | | | USD | | | | 55 | | | | 45,977 | |
| | | | | | | | |
| | | | | | | | | | | | |
| Security | | | | | Par (000) | | | Value | |
|
Independent Power and Renewable Electricity Producers — 0.0% | |
Vistra Corp., 7.00%(e)(g)(h) | | | USD | | | | 77 | | | $ | 70,065 | |
| | | | | | | | |
| | | |
Utilities — 0.1% | | | | | | | | | | | | |
Electricite de France SA, 3.38%(a)(g)(h) | | | EUR | | | | 200 | | | | 154,248 | |
| | | | | | | | |
| | | |
| | | | | | | | | | | 2,166,355 | |
| | | | | | | | |
| | | |
| | | | | | Shares | | | | |
| | | |
Preferred Stocks — 0.1% | | | | | | | | | | | | |
| | | |
Capital Markets — 0.1% | | | | | | | | | | | | |
Goldman Sachs Group, Inc., Series J, 5.50%(g)(h) . | | | | | | | 13,550 | | | | 334,008 | |
| | | | | | | | |
| | | |
| Insurance — 0.0% | | | | | | | | | |
Alliant Holdings, Inc.(c) | | | | | | | 83 | | | | 75,612 | |
| | | | | | | | |
| | | |
| | | | | | | | | | | 409,620 | |
| | | | | | | | |
| |
Total Preferred Securities — 0.5%
(Cost: $2,865,053) | | | | 2,575,975 | |
| | | | | | | | |
| | | |
Warrants | | | | | | | | | | | | |
| |
Consumer Discretionary — 0.0% | | | | | |
Service King (Carnelian Point), (Expires 06/30/27, Strike Price USD 10.00)(b) | | | | | | | 3,030 | | | | — | |
| | | | | | | | |
| |
Oil, Gas & Consumable Fuels — 0.0% | | | | | |
California Resources Corp., (Issued/Exercisable 11/03/20, 1 Share for 1 Warrant, Expires 10/27/24, Strike Price USD 36.00)(b) | | | | | | | 1,152 | | | | 14,515 | |
| | | | | | | | |
| |
Transportation Infrastructure — 0.0% | | | | | |
Turbo Cayman Ltd.(b)(c) | | | | | | | 1 | | | | — | |
| | | | | | | | |
| | | |
Total Warrants — 0.0%
(Cost: $ — ) | | | | | | | | | | | 14,515 | |
| | | | | | | | |
| |
Total Long-Term Investments — 131.3%
(Cost: $702,238,011) | | | | 638,698,802 | |
| | | | | | | | |
| | | |
Short-Term Securities | | | | | | | | | | | | |
| | | |
Money Market Funds — 0.1% | | | | | | | | | | | | |
BlackRock Liquidity Funds, T-Fund, Institutional Class, 4.03%(o)(p) | | | | | | | 482,274 | | | | 482,274 | |
| | | | | | | | |
| |
Total Short-Term Securities — 0.1%
(Cost: $482,274) | | | | 482,274 | |
| | | | | | | | |
| | | |
Total Investments — 131.4%
(Cost: $702,720,285) | | | | | | | | | | | 639,181,076 | |
| |
Liabilities in Excess of Other Assets — (31.4)% | | | | (152,615,923 | ) |
| | | | | | | | |
| | | |
Net Assets — 100.0% | | | | | | | | | | $ | 486,565,153 | |
| | | | | | | | |
| (a) | This security may be resold to qualified foreign investors and foreign institutional buyers under Regulation S of the Securities Act of 1933. |
| (b) | Non-income producing security. |
| (c) | Security is valued using significant unobservable inputs and is classified as Level 3 in the fair value hierarchy. |
| (d) | Restricted security as to resale, excluding 144A securities. The Fund held restricted securities with a current value of $1,603, representing less than 0.05% of its net assets as of period end, and an original cost of $255,714. |
| (e) | Security exempt from registration pursuant to Rule 144A under the Securities Act of 1933, as amended. These securities may be resold in transactions exempt from registration to qualified institutional investors. |
| (f) | Issuer filed for bankruptcy and/or is in default. |
| (g) | Perpetual security with no stated maturity date. |
| | |
SCHEDULE OF INVESTMENTS | | 41 |
| | |
Schedule of Investments (continued) December 31, 2022 | | BlackRock Debt Strategies Fund, Inc. (DSU) |
| (h) | Variable rate security. Interest rate resets periodically. The rate shown is the effective interest rate as of period end. Security description also includes the reference rate and spread if published and available. |
| (i) | Payment-in-kind security which may pay interest/dividends in additional par/shares and/or in cash. Rates shown are the current rate and possible payment rates. |
| (j) | Convertible security. |
| (l) | Rounds to less than 1,000. |
| (m) | Represents an unsettled loan commitment at period end. Certain details associated with this purchase are not known prior to the settlement date, including coupon rate. |
| (n) | Other interests represent beneficial interests in liquidation trusts and other reorganization or private entities. |
| (o) | Affiliate of the Fund. |
| (p) | Annualized 7-day yield as of period end. |
For Fund compliance purposes, the Fund’s industry classifications refer to one or more of the industry sub-classifications used by one or more widely recognized market indexes or rating group indexes, and/or as defined by the investment adviser. These definitions may not apply for purposes of this report, which may combine such industry sub-classifications for reporting ease.
Affiliates
Investments in issuers considered to be affiliate(s) of the Fund during the year ended December 31, 2022 for purposes of Section 2(a)(3) of the Investment Company Act of 1940, as amended, were as follows:
| | | | | | | | | | | | | | | | | | | | | | | | | | | | | | | | | | | | |
| | | | | | | | | | |
| Affiliated Issuer | | Value at 12/31/21 | | | Purchases at Cost | | | Proceeds from Sales | | | Net Realized Gain (Loss) | | | Change in Unrealized Appreciation (Depreciation) | | | Value at 12/31/22 | | | Shares Held at 12/31/22 | | | Income | | | Capital Gain Distributions from Underlying Funds | |
| | | | | | | | | |
BlackRock Liquidity Funds, T-Fund, Institutional Class | | $ | 435,992 | | | $ | 46,282 | (a) | | $ | — | | | $ | — | | | $ | — | | | $ | 482,274 | | | | 482,274 | | | $ | 49,288 | | | $ | — | |
| | | | | | | | | | | | | | | | | | | | | | | | | | | | | | | | | | | | |
| | (a) | Represents net amount purchased (sold). | |
Derivative Financial Instruments Outstanding as of Period End
Forward Foreign Currency Exchange Contracts
| | | | | | | | | | | | | | | | | | | | |
| | | | | |
| Currency Purchased | | | Currency Sold | | | Counterparty | | Settlement Date | | | Unrealized Appreciation (Depreciation) | |
| | | | | | |
| USD | | | 287,887 | | | GBP | | | 236,000 | | | Morgan Stanley & Co. International PLC | | | 03/15/23 | | | $ | 2,078 | |
| USD | | | 1,686,364 | | | GBP | | | 1,379,000 | | | Westpac Banking Corp. | | | 03/15/23 | | | | 16,322 | |
| | | | | | | | | | | | | | | | | | | | |
| | | | | | |
| | | | | | | | | | | | | | | | | | | 18,400 | |
| | | | | | | | | | | | | | | | | | | | |
| USD | | | 822,277 | | | EUR | | | 768,000 | | | Bank of America N.A. | | | 03/15/23 | | | | (3,771 | ) |
| USD | | | 1,987,038 | | | EUR | | | 1,859,000 | | | Bank of America N.A. | | | 03/15/23 | | | | (12,471 | ) |
| | | | | | | | | | | | | | | | | | | | |
| | | | | | |
| | | | | | | | | | | | | | | | | | | (16,242 | ) |
| | | | | | | | | | | | | | | | | | | | |
| | | | | | |
| | | | | | | | | | | | | | | | | | $ | 2,158 | |
| | | | | | | | | | | | | | | | | | | | |
Centrally Cleared Credit Default Swaps — Sell Protection
| | | | | | | | | | | | | | | | | | | | | | | | | | | | | | | | | | | | | | | | | | | | |
| | | | | | | | | |
Reference Obligation/Index | |
| Financing
Rate Received by the Fund |
| |
| Payment
Frequency |
| |
| Termination
Date |
| |
| Credit
Rating |
(a) | |
| Notional
Amount (000)(b) |
| | | Value | | |
| Upfront
Premium Paid (Received) |
| |
| Unrealized
Appreciation (Depreciation) |
|
| | | | | | | | | | | |
CDX.NA.HY.38.V2 | | | 5.00 | % | | | Quarterly | | | | 06/20/27 | | | | B | | | | USD | | | | 3,906 | | | $ | 88,308 | | | | | | | $ | 27,708 | | | | | | | $ | 60,600 | |
| | | | | | | | | | | | | | | | | | | | | | | | | | | | | | | | | | | | | | | | | | | | |
| | (a) | Using the rating of the issuer or the underlying securities of the index, as applicable, provided by S&P Global Ratings. | |
| | (b) | The maximum potential amount the Fund may pay should a negative credit event take place as defined under the terms of the agreement. | |
| | |
| 42 | | 2 0 2 2 BLACK ROCK ANNUAL REPORT TO SHAREHOLDERS |
| | |
Schedule of Investments (continued) December 31, 2022 | | BlackRock Debt Strategies Fund, Inc. (DSU) |
OTC Credit Default Swaps — Sell Protection
| | | | | | | | | | | | | | | | | | | | | | | | | | | | | | | | | | | | | | | | | | |
| | | | | | | | | | | |
| | | Reference Obligation/Index | |
| Financing
Rate Received by the Fund |
| |
| Payment
Frequency |
| | Counterparty | |
| Termination
Date |
| |
| Credit
Rating |
(a) | | | Notional Amount (000)(b) | | | | Value | | |
| Upfront
Premium Paid (Received) |
| |
| Unrealized
Appreciation (Depreciation) |
| | |
| | | | | | | | | | | | |
| | CenturyLink, Inc. | | | 1.00 | % | | | Quarterly | | | Barclays Bank PLC | | | 12/20/23 | | | | N/R | | | | USD | | | | 170 | | | $ | (1,898 | ) | | $ | (2,662 | ) | | $ | 764 | | | |
| | Jaguar Land Rover Automotive PLC | | | 5.00 | | | | Quarterly | | | Bank of America N.A. | | | 12/20/26 | | | | B+ | | | | EUR | | | | 10 | | | | (1,513 | ) | | | (351 | ) | | | (1,162 | ) | | |
| | Jaguar Land Rover Automotive PLC | | | 5.00 | | | | Quarterly | | | Barclays Bank PLC | | | 12/20/26 | | | | B+ | | | | EUR | | | | 5 | | | | (768 | ) | | | 179 | | | | (947 | ) | | |
| | Jaguar Land Rover Automotive PLC | | | 5.00 | | | | Quarterly | | | Credit Suisse International | | | 12/20/26 | | | | B+ | | | | EUR | | | | 5 | | | | (747 | ) | | | 183 | | | | (930 | ) | | |
| | Jaguar Land Rover Automotive PLC | | | 5.00 | | | | Quarterly | | | Credit Suisse International Morgan Stanley & Co. | | | 12/20/26 | | | | B+ | | | | EUR | | | | 10 | | | | (1,513 | ) | | | 347 | | | | (1,860 | ) | | |
| | Jaguar Land Rover Automotive PLC | | | 5.00 | | | | Quarterly | | | International PLC | | | 12/20/26 | | | | B+ | | | | EUR | | | | 10 | | | | (1,513 | ) | | | 411 | | | | (1,924 | ) | | |
| | CMA CGM SA | | | 5.00 | | | | Quarterly | | | Credit Suisse International | | | 06/20/27 | | | | BB+ | | | | EUR | | | | 20 | | | | 762 | | | | 829 | | | | (67 | ) | | |
| | Adler Real Estate AG | | | 5.00 | | | | Quarterly | | | Bank of America N.A. | | | 12/20/27 | | | | CCC- | | | | EUR | | | | 15 | | | | (3,864 | ) | | | (3,529 | ) | | | (335 | ) | | |
| | | | | | | | | | | | | | | | | | | | | | | | | | | | | | | | | | | | | | | | | | |
| | | | | | | | | | | | |
| | | | | | | | | | | | | | | | | | | | | | | | | | | | | | $ | (11,054 | ) | | $ | (4,593 | ) | | $ | (6,461 | ) | | |
| | | | | | | | | | | | | | | | | | | | | | | | | | | | | | | | | | | | | | | | | | |
| | (a) | Using the rating of the issuer or the underlying securities of the index, as applicable, provided by S&P Global Ratings. | |
| | (b) | The maximum potential amount the Fund may pay should a negative credit event take place as defined under the terms of the agreement. | |
Balances Reported in the Statements of Assets and Liabilities for Centrally Cleared Swaps and OTC Swaps
| | | | | | | | | | | | | | | | |
| | | | | |
| Description | | Swap Premiums Paid | | | Swap Premiums Received | | | Unrealized Appreciation | | | Unrealized Depreciation | |
| | | | |
Centrally Cleared Swaps(a) | | $ | 27,708 | | | $ | — | | | $ | 60,600 | | | $ | — | |
OTC Swaps | | | 1,949 | | | | (6,542 | ) | | | 764 | | | | (7,225 | ) |
| | (a) | Includes cumulative appreciation (depreciation) on centrally cleared swaps, as reported in the Schedule of Investments. Only current day’s variation margin is reported within the Statements of Assets and Liabilities and is net of any previously paid (received) swap premium amounts. | |
Derivative Financial Instruments Categorized by Risk Exposure
As of period end, the fair values of derivative financial instruments located in the Statements of Assets and Liabilities were as follows:
| | | | | | | | | | | | | | | | | | | | | | | | | | | | |
| | | | | | | | |
| | | Commodity Contracts | | | Credit Contracts | | | Equity Contracts | | | Foreign Currency Exchange Contracts | | | Interest Rate Contracts | | | Other Contracts | | | Total | |
| | | | | | | |
Assets — Derivative Financial Instruments | | | | | | | | | | | | | | | | | | | | | | | | | | | | |
Forward foreign currency exchange contracts | | | | | | | | | | | | | | | | | | | | | | | | | | | | |
Unrealized appreciation on forward foreign currency exchange contracts | | $ | — | | | $ | — | | | $ | — | | | $ | 18,400 | | | $ | — | | | $ | — | | | $ | 18,400 | |
Swaps — centrally cleared | | | | | | | | | | | | | | | | | | | | | | | | | | | | |
Unrealized appreciation on centrally cleared swaps(a) | | | — | | | | 60,600 | | | | — | | | | — | | | | — | | | | — | | | | 60,600 | |
Swaps — OTC | | | | | | | | | | | | | | | | | | | | | | | | | | | | |
Unrealized appreciation on OTC swaps; Swap premiums paid | | | — | | | | 2,713 | | | | — | | | | — | | | | — | | | | — | | | | 2,713 | |
| | | | | | | | | | | | | | | | | | | | | | | | | | | | |
| | | | | | | |
| | $ | — | | | $ | 63,313 | | | $ | — | | | $ | 18,400 | | | $ | — | | | $ | — | | | $ | 81,713 | |
| | | | | | | | | | | | | | | | | | | | | | | | | | | | |
| | | | | | | |
Liabilities — Derivative Financial Instruments | | | | | | | | | | | | | | | | | | | | | | | | | | | | |
Forward foreign currency exchange contracts | | | | | | | | | | | | | | | | | | | | | | | | | | | | |
Unrealized depreciation on forward foreign currency exchange contracts | | $ | — | | | $ | — | | | $ | — | | | $ | 16,242 | | | $ | — | | | $ | — | | | $ | 16,242 | |
Swaps — OTC | | | | | | | | | | | | | | | | | | | | | | | | | | | | |
Unrealized depreciation on OTC swaps; Swap premiums received | | | — | | | | 13,767 | | | | — | | | | — | | | | — | | | | — | | | | 13,767 | |
| | | | | | | | | | | | | | | | | | | | | | | | | | | | |
| | | | | | | |
| | $ | — | | | $ | 13,767 | | | $ | — | | | $ | 16,242 | | | $ | — | | | $ | — | | | $ | 30,009 | |
| | | | | | | | | | | | | | | | | | | | | | | | | | | | |
| | (a) | Net cumulative unrealized appreciation (depreciation) on futures contracts and centrally cleared swaps, if any, are reported in the Schedule of Investments. In the Statements of Assets and Liabilities, only current day’s variation margin is reported in receivables or payables and the net cumulative unrealized appreciation (depreciation) is included in accumulated earnings (loss). | |
| | |
SCHEDULE OF INVESTMENTS | | 43 |
| | |
Schedule of Investments (continued) December 31, 2022 | | BlackRock Debt Strategies Fund, Inc. (DSU) |
For the period ended December 31, 2022, the effect of derivative financial instruments in the Statements of Operations was as follows:
| | | | | | | | | | | | | | | | | | | | | | | | | | | | |
| | | | | | | | |
| | | Commodity Contracts | | | Credit Contracts | | | Equity Contracts | | | Foreign Currency Exchange Contracts | | | Interest Rate
Contracts | | | Other Contracts | | | Total | |
| | | | | | | |
Net Realized Gain (Loss) from: | | | | | | | | | | | | | | | | | | | | | | | | | | | | |
Futures contracts | | $ | — | | | $ | — | | | $ | — | | | $ | — | | | $ | (374 | ) | | $ | — | | | $ | (374 | ) |
Forward foreign currency exchange contracts | | | — | | | | — | | | | — | | | | 600,851 | | | | — | | | | — | | | | 600,851 | |
Options purchased(a) | | | — | | | | (1,296 | ) | | | — | | | | — | | | | (486 | ) | | | — | | | | (1,782 | ) |
Swaps | | | — | | | | 14,460 | | | | — | | | | — | | | | — | | | | — | | | | 14,460 | |
| | | | | | | | | | | | | | | | | | | | | | | | | | | | |
| | | | | | | |
| | $ | — | | | $ | 13,164 | | | $ | — | | | $ | 600,851 | | | $ | (860 | ) | | $ | — | | | $ | 613,155 | |
| | | | | | | | | | | | | | | | | | | | | | | | | | | | |
| | | | | | | |
Net Change in Unrealized Appreciation (Depreciation) on: | | | | | | | | | | | | | | | | | | | | | | | | | | | | |
Forward foreign currency exchange contracts | | $ | — | | | $ | — | | | $ | — | | | $ | 90,227 | | | $ | — | | | $ | — | | | $ | 90,227 | |
Swaps | | | — | | | | (57,967 | ) | | | — | | | | — | | | | — | | | | — | | | | (57,967 | ) |
| | | | | | | | | | | | | | | | | | | | | | | | | | | | |
| | | | | | | |
| | $ | — | | | $ | (57,967 | ) | | $ | — | | | $ | 90,227 | | | $ | — | | | $ | — | | | $ | 32,260 | |
| | | | | | | | | | | | | | | | | | | | | | | | | | | | |
| | (a) | Options purchased are included in net realized gain (loss) from investments — unaffiliated. | |
Average Quarterly Balances of Outstanding Derivative Financial Instruments
| | | | |
| | |
Forward foreign currency exchange contracts: | | | | |
Average amounts purchased — in USD | | $ | 5,778,718 | |
Options: | | | | |
Average value of option contracts purchased | | $ | — | (a) |
Average notional value of swaption contracts purchased | | $ | — | (a) |
Credit default swaps: | | | | |
Average notional value — sell protection | | $ | 6,039,048 | |
| | (a) | Derivative not held at any quarter-end. The risk exposure table serves as an indicator of activity during the period. | |
For more information about the Fund’s investment risks regarding derivative financial instruments, refer to the Notes to Financial Statements.
Derivative Financial Instruments — Offsetting as of Period End
The Fund’s derivative assets and liabilities (by type) were as follows:
| | | | | | | | |
| | | |
| | | Assets | | | Liabilities | |
| | |
Derivative Financial Instruments | | | | | | | | |
Forward foreign currency exchange contracts | | $ | 18,400 | | | $ | 16,242 | |
Swaps — centrally cleared | | | 14 | | | | — | |
Swaps — OTC(a) | | | 2,713 | | | | 13,767 | |
| | | | | | | | |
| | |
Total derivative assets and liabilities in the Statements of Assets and Liabilities | | | 21,127 | | | | 30,009 | |
| | | | | | | | |
| | |
Derivatives not subject to a Master Netting Agreement or similar agreement (“MNA”) | | | (14 | ) | | | — | |
| | | | | | | | |
| | |
Total derivative assets and liabilities subject to an MNA | | $ | 21,113 | | | $ | 30,009 | |
| | | | | | | | |
| | (a) | Includes unrealized appreciation (depreciation) on OTC swaps and swap premiums (paid/received) in the Statements of Assets and Liabilities. | |
The following table presents the Fund’s derivative assets and liabilities by counterparty net of amounts available for offset under an MNA and net of the related collateral received (and pledged) by the Fund:
| | | | | | | | | | | | | | | | | | | | |
| | | | | | |
| Counterparty | |
| Derivative
Assets Subject to an MNA by Counterparty |
| |
| Derivatives
Available for Offset |
(a) | |
| Non-Cash
Collateral Received |
| |
| Cash
Collateral Received |
| |
| Net Amount
of DerivativeAssets |
(b)(c) |
| | | | | |
Barclays Bank PLC | | $ | 943 | | | $ | (943 | ) | | $ | — | | | $ | — | | | $ | — | |
Credit Suisse International | | | 1,359 | | | | (1,359 | ) | | | — | | | | — | | | | — | |
Morgan Stanley & Co. International PLC | | | 2,489 | | | | (1,924 | ) | | | — | | | | — | | | | 565 | |
Westpac Banking Corp. | | | 16,322 | | | | — | | | | — | | | | — | | | | 16,322 | |
| | | | | | | | | | | | | | | | | | | | |
| | | | | |
| | $ | 21,113 | | | $ | (4,226 | ) | | $ | — | | | $ | — | | | $ | 16,887 | |
| | | | | | | | | | | | | | | | | | | | |
| | |
| 44 | | 2 0 2 2 BLACK ROCK ANNUAL REPORT TO SHAREHOLDERS |
| | |
Schedule of Investments (continued) December 31, 2022 | | BlackRock Debt Strategies Fund, Inc. (DSU) |
| | | | | | | | | | | | | | | | | | | | |
| | | | | | |
| Counterparty | |
| Derivative
Liabilities Subject to an MNA by Counterparty |
| |
| Derivatives
Available for Offse |
t(a) | |
| Non-Cash
Collateral Pledged |
| |
| Cash
Collateral Pledged |
(d) | |
| Net Amount
of Derivative Liabilities |
(b)(e) |
| | | | | |
Bank of America N.A | | $ | 21,619 | | | $ | — | | | $ | — | | | $ | — | | | $ | 21,619 | |
Barclays Bank PLC | | | 3,609 | | | | (943 | ) | | | — | | | | (2,666 | ) | | | — | |
Credit Suisse International | | | 2,857 | | | | (1,359 | ) | | | — | | | | — | | | | 1,498 | |
Morgan Stanley & Co. International PLC | | | 1,924 | | | | (1,924 | ) | | | — | | | | — | | | | — | |
| | | | | | | | | | | | | | | | | | | | |
| | | | | |
| | $ | 30,009 | | | $ | (4,226 | ) | | $ | — | | | $ | (2,666 | ) | | $ | 23,117 | |
| | | | | | | | | | | | | | | | | | | | |
| | (a) | The amount of derivatives available for offset is limited to the amount of derivative asset and/or liabilities that are subject to an MNA. | |
| | (b) | Net amount may also include forward foreign currency exchange contracts that are not required to be collateralized. | |
| | (c) | Net amount represents the net amount receivable from the counterparty in the event of default. | |
| | (d) | Excess of collateral received/pledged, if any, from the individual counterparty is not shown for financial reporting purposes. | |
| | (e) | Net amount represents the net amount payable due to counterparty in the event of default. | |
Fair Value Hierarchy as of Period End
Various inputs are used in determining the fair value of financial instruments. For a description of the input levels and information about the Fund’s policy regarding valuation of financial instruments, refer to the Notes to Financial Statements.
The following table summarizes the Fund’s financial instruments categorized in the fair value hierarchy. The breakdown of the Fund’s financial instruments into major categories is disclosed in the Schedule of Investments above.
| | | | | | | | | | | | | | | | |
| | | | | |
| | | Level 1 | | | Level 2 | | | Level 3 | | | Total | |
| | | | |
Assets | | | | | | | | | | | | | | | | |
Investments | | | | | | | | | | | | | | | | |
Long-Term Investments | | | | | | | | | | | | | | | | |
Asset-Backed Securities | | $ | — | | | $ | 163,074 | | | $ | — | | | $ | 163,074 | |
Common Stocks | | | | | | | | | | | | | | | | |
Construction & Engineering | | | 45,275 | | | | — | | | | — | | | | 45,275 | |
Diversified Financial Services | | | — | | | | — | | | | 10,753 | | | | 10,753 | |
Electrical Equipment | | | 30,777 | | | | — | | | | — | | | | 30,777 | |
Metals & Mining | | | — | | | | 832 | | | | 1,603 | | | | 2,435 | |
Oil, Gas & Consumable Fuels | | | 149,577 | | | | — | | | | — | | | | 149,577 | |
Semiconductors & Semiconductor Equipment | | | 3,421 | | | | — | | | | — | | | | 3,421 | |
Specialty Retail | | | — | | | | 223,396 | | | | — | | | | 223,396 | |
Corporate Bonds | | | | | | | | | | | | | | | | |
Aerospace & Defense | | | — | | | | 4,349,477 | | | | — | | | | 4,349,477 | |
Airlines | | | — | | | | 3,245,196 | | | | — | | | | 3,245,196 | |
Auto Components | | | — | | | | 2,018,652 | | | | 1 | | | | 2,018,653 | |
Automobiles | | | — | | | | 1,700,459 | | | | — | | | | 1,700,459 | |
Banks | | | — | | | | 230,066 | | | | — | | | | 230,066 | |
Beverages | | | — | | | | 1,946,719 | | | | — | | | | 1,946,719 | |
Building Materials | | | — | | | | 972,004 | | | | — | | | | 972,004 | |
Building Products | | | — | | | | 1,433,566 | | | | — | | | | 1,433,566 | |
Capital Markets | | | — | | | | 2,022,627 | | | | — | | | | 2,022,627 | |
Chemicals | | | — | | | | 2,797,620 | | | | — | | | | 2,797,620 | |
Commercial Services & Supplies | | | — | | | | 1,081,045 | | | | — | | | | 1,081,045 | |
Communications Equipment | | | — | | | | 625,772 | | | | — | | | | 625,772 | |
Construction Materials | | | — | | | | 174,968 | | | | — | | | | 174,968 | |
Consumer Discretionary | | | — | | | | 2,391,468 | | | | — | | | | 2,391,468 | |
Consumer Finance | | | — | | | | 3,151,227 | | | | — | | | | 3,151,227 | |
Containers & Packaging | | | — | | | | 568,012 | | | | — | | | | 568,012 | |
Diversified Consumer Services | | | — | | | | 2,449,919 | | | | — | | | | 2,449,919 | |
Diversified Financial Services | | | — | | | | 1,675,465 | | | | — | | | | 1,675,465 | |
Diversified Telecommunication Services | | | — | | | | 3,394,329 | | | | — | | | | 3,394,329 | |
Electric Utilities | | | — | | | | 518,041 | | | | — | | | | 518,041 | |
Electrical Equipment | | | — | | | | 364,931 | | | | — | | | | 364,931 | |
Electronic Equipment, Instruments & Components | | | — | | | | 1,268,478 | | | | — | | | | 1,268,478 | |
Energy Equipment & Services | | | — | | | | 725,371 | | | | — | | | | 725,371 | |
Environmental, Maintenance & Security Service | | | — | | | | 842,972 | | | | — | | | | 842,972 | |
Equity Real Estate Investment Trusts (REITs) | | | — | | | | 1,352,679 | | | | — | | | | 1,352,679 | |
Food & Staples Retailing | | | — | | | | 1,250,986 | | | | — | | | | 1,250,986 | |
| | |
SCHEDULE OF INVESTMENTS | | 45 |
| | |
Schedule of Investments (continued) December 31, 2022 | | BlackRock Debt Strategies Fund, Inc. (DSU) |
Fair Value Hierarchy as of Period End (continued)
| | | | | | | | | | | | | | | | |
| |
| | | | |
| | | Level 1 | | | Level 2 | | | Level 3 | | | Total | |
| |
| | | | |
Corporate Bonds (continued) | | | | | | | | | | | | | | | | |
Food Products | | $ | — | | | $ | 1,202,890 | | | $ | — | | | $ | 1,202,890 | |
Gas Utilities | | | — | | | | 24,649 | | | | — | | | | 24,649 | |
Health Care Equipment & Supplies | | | — | | | | 309,236 | | | | — | | | | 309,236 | |
Health Care Providers & Services | | | — | | | | 3,556,065 | | | | — | | | | 3,556,065 | |
Health Care Technology | | | — | | | | 671,961 | | | | — | | | | 671,961 | |
Hotels, Restaurants & Leisure | | | — | | | | 4,565,071 | | | | — | | | | 4,565,071 | |
Household Durables | | | — | | | | 838,681 | | | | — | | | | 838,681 | |
Household Products | | | — | | | | 111,233 | | | | — | | | | 111,233 | |
Independent Power and Renewable Electricity Producers | | | — | | | | 698,524 | | | | — | | | | 698,524 | |
Insurance | | | — | | | | 2,473,223 | | | | — | | | | 2,473,223 | |
Interactive Media & Services | | | — | | | | 447,204 | | | | — | | | | 447,204 | |
Internet Software & Services | | | — | | | | 2,021,817 | | | | — | | | | 2,021,817 | |
IT Services | | | — | | | | 3,011,328 | | | | — | | | | 3,011,328 | |
Leisure Products | | | — | | | | 176,761 | | | | — | | | | 176,761 | |
Machinery | | | — | | | | 2,517,181 | | | | — | | | | 2,517,181 | |
Marine | | | — | | | | 51,735 | | | | — | | | | 51,735 | |
Media | | | — | | | | 12,522,465 | | | | — | | | | 12,522,465 | |
Metals & Mining | | | — | | | | 2,654,557 | | | | — | | | | 2,654,557 | |
Mortgage Real Estate Investment Trusts (REITs) | | | — | | | | 8,922 | | | | — | | | | 8,922 | |
Multiline Retail | | | — | | | | 89,978 | | | | — | | | | 89,978 | |
Multi-Utilities | | | — | | | | 72,295 | | | | — | | | | 72,295 | |
Offshore Drilling & Other Services | | | — | | | | 657,878 | | | | — | | | | 657,878 | |
Oil, Gas & Consumable Fuels | | | 77,168 | | | | 13,737,743 | | | | — | | | | 13,814,911 | |
Personal Products | | | — | | | | 4,525 | | | | — | | | | 4,525 | |
Pharmaceuticals | | | — | | | | 1,196,397 | | | | — | | | | 1,196,397 | |
Real Estate | | | — | | | | 27,529 | | | | — | | | | 27,529 | |
Real Estate Management & Development | | | — | | | | 959,639 | | | | — | | | | 959,639 | |
Road & Rail | | | — | | | | 578,382 | | | | — | | | | 578,382 | |
Semiconductors & Semiconductor Equipment | | | — | | | | 978,232 | | | | — | | | | 978,232 | |
Software | | | — | | | | 3,450,899 | | | | — | | | | 3,450,899 | |
Specialty Retail | | | — | | | | 353,733 | | | | — | �� | | | 353,733 | |
Technology Hardware, Storage & Peripherals | | | — | | | | 162,999 | | | | — | | | | 162,999 | |
Textiles, Apparel & Luxury Goods | | | — | | | | 137,274 | | | | — | | | | 137,274 | |
Thrifts & Mortgage Finance | | | — | | | | 397,399 | | | | — | | | | 397,399 | |
Transportation | | | — | | | | 34,405 | | | | — | | | | 34,405 | |
Utilities | | | — | | | | 125,795 | | | | — | | | | 125,795 | |
Wireless Telecommunication Services | | | — | | | | 1,656,914 | | | | — | | | | 1,656,914 | |
Floating Rate Loan Interests | | | — | | | | 518,666,120 | | | | 11,366,161 | | | | 530,032,281 | |
Investment Companies | | | 332,586 | | | | — | | | | — | | | | 332,586 | |
Other Interests | | | — | | | | — | | | | — | | | | — | |
Preferred Securities | | | | | | | | | | | | | | | | |
Capital Trusts | | | | | | | | | | | | | | | | |
Aerospace & Defense | | | 105,258 | | | | — | | | | — | | | | 105,258 | |
Automobiles | | | — | | | | 42,319 | | | | — | | | | 42,319 | |
Banks | | | — | | | | 89,907 | | | | — | | | | 89,907 | |
Diversified Financial Services | | | — | | | | 1,549,395 | | | | — | | | | 1,549,395 | |
Diversified Telecommunication Services | | | — | | | | 109,186 | | | | — | | | | 109,186 | |
Electric Utilities | | | — | | | | 45,977 | | | | — | | | | 45,977 | |
Independent Power and Renewable Electricity Producers | | | — | | | | 70,065 | | | | — | | | | 70,065 | |
Utilities | | | — | | | | 154,248 | | | | — | | | | 154,248 | |
Preferred Stocks | | | 334,008 | | | | — | | | | 75,612 | | | | 409,620 | |
Warrants | | | 14,515 | | | | — | | | | — | | | | 14,515 | |
Short-Term Securities | | | | | | | | | | | | | | | | |
Money Market Funds | | | 482,274 | | | | — | | | | — | | | | 482,274 | |
Liabilities | | | | | | | | | | | | | | | | |
Unfunded Floating Rate Loan Interests(a) | | | — | | | | (42,384 | ) | | | — | | | | (42,384 | ) |
| | | | | | | | | | | | | | | | |
| | | | |
| | $ | 1,574,859 | | | $ | 626,109,703 | | | $ | 11,454,130 | | | $ | 639,138,692 | |
| | | | | | | | | | | | | | | | |
Derivative Financial Instruments(b) | | | | | | | | | | | | | | | | |
Assets | | | | | | | | | | | | | | | | |
Credit Contracts | | $ | — | | | $ | 61,364 | | | $ | — | | | $ | 61,364 | |
Foreign Currency Exchange Contracts | | | — | | | | 18,400 | | | | — | | | | 18,400 | |
| | |
| 46 | | 2 0 2 2 BLACK ROCK ANNUAL REPORT TO SHAREHOLDERS |
| | |
Schedule of Investments (continued) December 31, 2022 | | BlackRock Debt Strategies Fund, Inc. (DSU) |
Fair Value Hierarchy as of Period End (continued)
| | | | | | | | | | | | | | | | |
| |
| | | | |
| | | Level 1 | | | Level 2 | | | Level 3 | | | Total | |
| |
| | | | |
Liabilities | | | | | | | | | | | | | | | | |
Credit Contracts | | | $— | | | | $(7,225) | | | | $— | | | | $(7,225) | |
Foreign Currency Exchange Contracts | | | — | | | | (16,242) | | | | — | | | | (16,242) | |
| | | | | | | | | | | | | | | | |
| | | | |
| | $ | — | | | $ | 56,297 | | | $ | — | | | $ | 56,297 | |
| | | | | | | | | | | | | | | | |
| | (a) | Unfunded floating rate loan interests are valued at the unrealized appreciation (depreciation) on the commitment. | |
| | (b) | Derivative financial instruments are swaps and forward foreign currency exchange contracts. Swaps and forward foreign currency exchange contracts are valued at the unrealized appreciation (depreciation) on the instrument. | |
The Fund may hold assets and/or liabilities in which the fair value approximates the carrying amount for financial statement purposes. As of period end, bank borrowings payable of $164,000,000 are categorized as Level 2 within the fair value hierarchy.
A reconciliation of Level 3 financial instruments is presented when the Fund had a significant amount of Level 3 investments and derivative financial instruments at the beginning and/or end of the year in relation to net assets. The following table is a reconciliation of Level 3 investments for which significant unobservable inputs were used in determining fair value:
| | | | | | | | | | | | | | | | | | | | | | | | | | | | |
| |
| | | | | | | |
| | | Common Stocks | | | Corporate Bonds | | | Floating Rate Loan Interests | | | Other Interests | | | Preferred Stocks | | | Unfunded Floating Rate Loan Interests | | | Total | |
| |
| | | | | | | |
Assets/Liabilities | | | | | | | | | | | | | | | | | | | | | | | | | | | | |
Opening balance, as of December 31, 2021 | | $ | 11,700 | | | $ | 1 | | | $ | 26,559,403 | | | | — | (a) | | $ | 86,236 | | | $ | (259 | ) | | $ | 26,657,081 | |
Transfers into Level 3(b) | | | — | | | | — | | | | 7,499,870 | | | | — | | | | — | | | | — | | | | 7,499,870 | |
Transfers out of Level 3(c) | | | — | | | | — | | | | (12,270,852 | ) | | | — | | | | — | | | | 259 | | | | (12,270,593 | ) |
Accrued discounts/premiums | | | — | | | | — | | | | 23,129 | | | | — | | | | — | | | | — | | | | 23,129 | |
Net realized gain (loss) | | | — | | | | — | | | | 61,645 | | | | — | | | | — | | | | — | | | | 61,645 | |
Net change in unrealized appreciation (depreciation)(d)(e) | | | 656 | | | | — | | | | (840,677 | ) | | | — | | | | (10,624 | ) | | | — | | | | (850,645 | ) |
Purchases | | | — | | | | — | | | | 1,052,992 | | | | — | | | | — | | | | — | | | | 1,052,992 | |
Sales | | | — | | | | — | | | | (10,719,349 | ) | | | — | | | | — | | | | — | | | | (10,719,349 | ) |
| | | | | | | | | | | | | | | | | | | | | | | | | | | | |
| | | | | | | |
Closing balance, as of December 31, 2022 | | $ | 12,356 | | | $ | 1 | | | $ | 11,366,161 | | | | — | (a) | | $ | 75,612 | | | $ | — | | | $ | 11,454,130 | |
| | | | | | | | | | | | | | | | | | | | | | | | | | | | |
| | | | | | | |
Net change in unrealized appreciation (depreciation) on investments still held at December 31, 2022(e) | | $ | 656 | | | $ | — | | | $ | (724,235 | ) | | | — | | | $ | (10,624 | ) | | $ | — | | | $ | (734,203 | ) |
| | | | | | | | | | | | | | | | | | | | | | | | | | | | |
| | (a) | Rounds to less than $1. | |
| | (b) | As of December 31, 2021, the Fund used observable inputs in determining the value of certain investments. As of December 31, 2022, the Fund used significant unobservable inputs in determining the value of the same investments. As a result, investments at beginning of period value were transferred from Level 2 to Level 3 in the disclosure hierarchy. | |
| | (c) | As of December 31, 2021, the Fund used significant unobservable inputs in determining the value of certain investments. As of December 31, 2022, the Fund used observable inputs in determining the value of the same investments. As a result, investments at beginning of period value were transferred from Level 3 to Level 2 in the disclosure hierarchy. | |
| | (d) | Included in the related net change in unrealized appreciation (depreciation) in the Statements of Operations. | |
| | (e) | Any difference between net change in unrealized appreciation (depreciation) and net change in unrealized appreciation (depreciation) on investments still held at December 31, 2022 is generally due to investments no longer held or categorized as Level 3 at period end. | |
The Fund’s financial instruments that are categorized as Level 3 were valued utilizing third-party pricing information without adjustment. Such valuations are based on unobservable inputs. A significant change in third-party information could result in a significantly lower or higher value of such Level 3 financial instruments.
See notes to financial statements.
| | |
SCHEDULE OF INVESTMENTS | | 47 |
| | |
Schedule of Investments December 31, 2022 | | BlackRock Floating Rate Income Strategies Fund, Inc. (FRA) (Percentages shown are based on Net Assets) |
| | | | | | | | | | | | |
| Security | | | | | Shares | | | Value | |
| | | |
Common Stocks | | | | | | | | | | | | |
|
Construction & Engineering — 0.0% | |
McDermott International Ltd.(a) | | | | | | | 123,933 | | | $ | 39,659 | |
| | | | | | | | |
|
Diversified Financial Services — 0.0% | |
Kcad Holdings I Ltd.(b) | | | | | | | 309,827,230 | | | | 3,098 | |
| | | | | | | | |
| | | |
Electrical Equipment — 0.0% | | | | | | | | | | | | |
SunPower Corp.(a) | | | | | | | 1,860 | | | | 33,536 | |
| | | | | | | | |
| | | |
Metals & Mining — 0.0% | | | | | | | | | | | | |
Project Investor Holdings LLC, (Acquired 02/12/19,
Cost: $214,007)(b)(c) | | | | | | | 6,099 | | | | 1,342 | |
| | | | | | | | |
|
Semiconductors & Semiconductor Equipment — 0.0% | |
Maxeon Solar Technologies Ltd.(a) | | | | | | | 232 | | | | 3,726 | |
| | | | | | | | |
| | | |
Software — 0.0% | | | | | | | | | | | | |
Avaya Holdings Corp.(a) | | | | | | | 66 | | | | 13 | |
| | | | | | | | |
| | | |
Specialty Retail — 0.1% | | | | | | | | | | | | |
NMG Parent LLC | | | | | | | 3,613 | | | | 548,437 | |
| | | | | | | | |
| | | |
Total Common Stocks — 0.1%
(Cost: $5,727,052) | | | | | | | | | | | 629,811 | |
| | | | | | | | |
| | | |
| | | | | | Par (000) | | | | |
| | | |
Corporate Bonds | | | | | | | | | | | | |
| | | |
Airlines — 0.3% | | | | | | | | | | | | |
Allegiant Travel Co.,
8.50%, 02/05/24(a)(d) | | | USD | | | | 1,195 | | | | 1,192,012 | |
| | | | | | | | |
| | | |
Auto Components — 0.1% | | | | | | | | | | | | |
Clarios Global LP, 6.75%, 05/15/25(a)(d) | | | | | | | 446 | | | | 447,031 | |
| | | | | | | | |
| | | |
Building Materials — 0.0% | | | | | | | | | | | | |
Summit Materials LLC/Summit Materials Finance Corp.,
5.25%, 01/15/29(a)(d) | | | | | | | 118 | | | | 109,861 | |
| | | | | | | | |
| | | |
Building Products — 0.0% | | | | | | | | | | | | |
White Cap Buyer LLC,
6.88%, 10/15/28(a)(d) | | | | | | | 250 | | | | 216,252 | |
| | | | | | | | |
| | | |
Capital Markets — 0.0% | | | | | | | | | | | | |
AG TTMT Escrow Issuer LLC,
8.63%, 09/30/27(a)(d) | | | | | | | 119 | | | | 119,595 | |
| | | | | | | | |
| | | |
Chemicals(a)(d) — 0.1% | | | | | | | | | | | | |
Illuminate Buyer LLC/Illuminate Holdings IV, Inc., 9.00%, 07/01/28 | | | | | | | 51 | | | | 42,698 | |
WR Grace Holdings LLC,
5.63%, 08/15/29 | | | | | | | 388 | | | | 313,221 | |
| | | | | | | | |
| | | | | | | | | | | 355,919 | |
| | | |
Construction Materials — 0.2% | | | | | | | | | | | | |
Wesco Aircraft Holdings, Inc.,
9.00%, 11/15/26(a)(d) | | | | | | | 1,028 | | | | 688,760 | |
| | | | | | | | |
|
Diversified Telecommunication Services — 0.0% | |
Zayo Group Holdings, Inc.,
6.13%, 03/01/28(a)(d) | | | | | | | 251 | | | | 142,337 | |
| | | | | | | | |
| | | |
Electric Utilities(a) — 0.0% | | | | | | | | | | | | |
Pike Corp., 5.50%, 09/01/28(d) | | | | | | | 144 | | | | 125,891 | |
Texas Competitive Electric Holdings, 1.00%, 11/10/21(b)(e) | | | | | | | 1,710 | | | | — | |
| | | | | | | | |
| | | | | | | | | | | 125,891 | |
|
Electronic Equipment, Instruments & Components — 0.2% | |
Vertiv Group Corp.,
4.13%, 11/15/28(a)(d) | | | | | | | 901 | | | | 765,850 | |
| | | | | | | | |
| | | | | | | | | | | | |
| Security | | | | | Par (000) | | | Value | |
| | | |
Health Care Providers & Services — 0.1% | | | | | | | | | | | | |
Medline Borrower LP, 5.25%, 10/01/29(a)(d) | | | USD | | | | 384 | | | $ | 305,000 | |
| | | | | | | | |
| | | |
Hotels, Restaurants & Leisure(a)(d) — 0.2% | | | | | | | | | | | | |
Caesars Entertainment, Inc., 4.63%, 10/15/29 | | | | | | | 390 | | | | 317,386 | |
Fertitta Entertainment LLC/Fertitta Entertainment Finance Co., Inc.,
6.75%, 01/15/30 | | | | | | | 641 | | | | 517,030 | |
| | | | | | | | |
| | | | | | | | | | | 834,416 | |
| | | |
Insurance — 0.1% | | | | | | | | | | | | |
Alliant Holdings Intermediate LLC/Alliant Holdings Co-Issuer, 6.75%, 10/15/27(a)(d) | | | | | | | 357 | | | | 320,893 | |
| | | | | | | | |
| | | |
Internet Software & Services(a)(d) — 0.2% | | | | | | | | | | | | |
Expedia Group, Inc., 6.25%, 05/01/25 | | | | | | | 337 | | | | 339,857 | |
Uber Technologies, Inc., 4.50%, 08/15/29 | | | | | | | 381 | | | | 331,948 | |
| | | | | | | | |
| | | | | | | | | | | 671,805 | |
| | | |
Machinery — 0.2% | | | | | | | | | | | | |
Madison IAQ LLC, 5.88%, 06/30/29(a)(d) | | | | | | | 1,203 | | | | 824,535 | |
| | | | | | | | |
| | | |
Media — 0.3% | | | | | | | | | | | | |
Liberty Broadband Corp., 2.75%, 09/30/50(a)(d) | | | | | | | 513 | | | | 499,637 | |
Ligado Networks LLC, (15.50% PIK),
15.50%, 11/01/23(a)(d)(f) | | | | | | | 244 | | | | 71,765 | |
Odeon Finco PLC, 12.75%, 11/01/27 | | | | | | | 607 | | | | 528,090 | |
Radiate Holdco LLC/Radiate Finance, Inc., 4.50%, 09/15/26(a)(d) | | | | | | | 573 | | | | 420,983 | |
| | | | | | | | |
| | | | | | | | | | | 1,520,475 | |
| | | |
Oil, Gas & Consumable Fuels — 0.1% | | | | | | | | | | | | |
Occidental Petroleum Corp.,
6.63%, 09/01/30(a) | | | | | | | 619 | | | | 639,662 | |
| | | | | | | | |
|
Real Estate Management & Development — 0.1% | |
Realogy Group LLC/Realogy Co.-Issuer Corp., 5.75%, 01/15/29(a)(d) | | | | | | | 510 | | | | 385,759 | |
| | | | | | | | |
|
Wireless Telecommunication Services — 0.0% | |
VICI Properties LP/VICI Note Co., Inc.,
4.63%, 06/15/25(a)(d) | | | | | | | 138 | | | | 132,308 | |
| | | | | | | | |
| | | |
Total Corporate Bonds — 2.2%
(Cost: $11,243,440) | | | | | | | | | | | 9,798,361 | |
| | | | | | | | |
| | | |
Floating Rate Loan Interests(g) | | | | | | | | | | | | |
| | | |
Aerospace & Defense — 3.1% | | | | | | | | | | | | |
Atlas CC Acquisition Corp. | | | | | | | | | | | | |
Term Loan B, (3 mo. LIBOR + 4.25%, 0.75% Floor), 8.98%, 05/25/28 | | | | | | | 2,847 | | | | 2,384,935 | |
Term Loan C, (3 mo. LIBOR + 4.25%, 0.75% Floor), 8.98%, 05/25/28 | | | | | | | 579 | | | | 485,071 | |
Bleriot U.S. Bidco, Inc., 2021 Term Loan B, (3 mo. LIBOR + 4.00%), 8.73%, 10/31/26 | | | | | | | 707 | | | | 699,130 | |
Cobham Ultra U.S. Co-Borrower LLC, USD Term Loan B, (6 mo. LIBOR + 3.75%, 0.50% Floor), 7.06%, 08/03/29 | | | | | | | 373 | | | | 361,873 | |
Nordam Group, Inc., Term Loan B, (1 mo. LIBOR + 5.50%), 9.94%, 04/09/26 | | | | | | | 762 | | | | 590,782 | |
Peraton Corp. | | | | | | | | | | | | |
2nd Lien Term Loan B1, (1 mo. LIBOR + 7.75%, 0.75% Floor), 12.09%, 02/01/29 | | | | | | | 1,700 | | | | 1,611,844 | |
| | |
| 48 | | 2 0 2 2 BLACK ROCK ANNUAL REPORT TO SHAREHOLDERS |
| | |
Schedule of Investments (continued) December 31, 2022 | | BlackRock Floating Rate Income Strategies Fund, Inc. (FRA) (Percentages shown are based on Net Assets) |
| | | | | | | | | | | | |
| Security | | | | | Par (000) | | | Value | |
| | | |
Aerospace & Defense (continued) | | | | | | | | | | | | |
Peraton Corp. (continued) | | | | | | | | | | | | |
Term Loan B, (1 mo. LIBOR + 3.75%, 0.75% Floor), 8.13%, 02/01/28 | | | USD | | | | 5,700 | | | $ | 5,556,431 | |
TransDigm, Inc., 2020 Term Loan F, (3 mo. LIBOR + 2.25%), 6.98%, 12/09/25 | | | | | | | 2,520 | | | | 2,486,457 | |
| | | | | | | | |
| | | | | | | | | | | 14,176,523 | |
| | | |
Air Freight & Logistics — 0.3% | | | | | | | | | | | | |
AIT Worldwide Logistics Holdings, Inc., 2021 Term Loan, (3 mo. LIBOR + 4.75%, 0.75% Floor), 8.49%, 04/06/28 | | | | | | | 579 | | | | 529,488 | |
Kestrel Bidco, Inc., Term Loan B, (1 mo. LIBOR + 3.00%, 1.00% Floor),
7.35%, 12/11/26 | | | | | | | 414 | | | | 375,369 | |
PECF USS Intermediate Holding III Corp., Term Loan B, (1 mo. LIBOR + 4.25%, 0.50% Floor), 8.63%, 12/15/28 | | | | | | | 806 | | | | 669,836 | |
| | | | | | | | |
| | | | | | | | | | | 1,574,693 | |
| | | |
Airlines — 2.6% | | | | | | | | | | | | |
AAdvantage Loyalty IP Ltd., 2021 Term Loan, (3 mo. LIBOR + 4.75%, 0.75% Floor), 8.99%, 04/20/28 | | | | | | | 1,636 | | | | 1,626,782 | |
Air Canada, 2021 Term Loan B, (3 mo. LIBOR + 3.50%, 0.75% Floor),
8.13%, 08/11/28 | | | | | | | 2,037 | | | | 2,009,250 | |
American Airlines, Inc. | | | | | | | | | | | | |
2017 1st Lien Term Loan, (1 mo. LIBOR + 1.75%), 6.14%, 01/29/27 | | | | | | | 275 | | | | 261,226 | |
2018 Term Loan B, (1 mo. LIBOR + 1.75%), 6.14%, 06/27/25 | | | | | | | 1,253 | | | | 1,201,601 | |
Mileage Plus Holdings LLC, 2020 Term Loan B, (3 mo. LIBOR + 5.25%, 1.00% Floor), 10.00%, 06/21/27 | | | | | | | 3,109 | | | | 3,194,013 | |
United Airlines, Inc., 2021 Term Loan B, (3 mo. LIBOR + 3.75%, 0.75% Floor),
8.11%, 04/21/28 | | | | | | | 3,688 | | | | 3,635,046 | |
| | | | | | | | |
| | | | | | | | | | | 11,927,918 | |
| | | |
Auto Components — 2.4% | | | | | | | | | | | | |
Adient U.S. LLC, 2021 Term Loan B, (1 mo. LIBOR + 3.25%), 7.63%, 04/10/28 | | | | | | | 813 | | | | 802,719 | |
Clarios Global LP, 2021 USD Term Loan B, (1 mo. LIBOR + 3.25%), 7.63%, 04/30/26 | | | | | | | 3,646 | | | | 3,565,477 | |
USI, Inc. | | | | | | | | | | | | |
2019 Incremental Term Loan B, (3 mo. LIBOR + 3.25%), 7.98%, 12/02/26 | | | | | | | 213 | | | | 211,540 | |
2022 Incremental Term Loan, (1 mo. SOFR CME + 3.75%, 0.50% Floor),
8.33%, 11/22/29 | | | | | | | 3,731 | | | | 3,690,755 | |
Wand NewCo 3, Inc., 2020 Term Loan, (1 mo. LIBOR + 3.00%), 7.38%, 02/05/26 | | | | | | | 2,572 | | | | 2,433,729 | |
| | | | | | | | |
| | | | | | | | | | | 10,704,220 | |
| | | |
Banks — 0.8% | | | | | | | | | | | | |
DirecTV Financing LLC, Term Loan, (1 mo. LIBOR + 5.00%, 0.75% Floor),
9.38%, 08/02/27 | | | | | | | 2,373 | | | | 2,305,038 | |
LABL, Inc., 2021 USD 1st Lien Term Loan, (1 mo. LIBOR + 5.00%, 0.50% Floor),
9.38%, 10/29/28 | | | | | | | 1,605 | | | | 1,518,982 | |
| | | | | | | | |
| | | | | | | | | | | 3,824,020 | |
| | | | | | | | | | | | |
| Security | | | | | Par (000) | | | Value | |
| | | |
Beverages — 0.9% | | | | | | | | | | | | |
Naked Juice LLC | | | | | | | | | | | | |
2nd Lien Term Loan, (3 mo. SOFRTE + 6.00%, 0.50% Floor), 10.68%, 01/24/30 | | | USD | | | | 1,804 | | | $ | 1,418,900 | |
Term Loan, (3 mo. SOFRTE + 3.25%, 0.50% Floor), 7.93%, 01/24/29 | | | | | | | 3,007 | | | | 2,682,425 | |
| | | | | | | | |
| | | | | | | | | | | 4,101,325 | |
| | | |
Building Materials — 0.1% | | | | | | | | | | | | |
Cornerstone Building Brands, Inc., 2021 Term Loan B, (1 mo. LIBOR + 3.25%, 0.50% Floor), 7.57%, 04/12/28 | | | | | | | 266 | | | | 237,835 | |
| | | | | | | | |
| | | |
Building Products — 2.0% | | | | | | | | | | | | |
CP Atlas Buyer, Inc., 2021 Term Loan B, (1 mo. LIBOR + 3.50%, 0.50% Floor),
7.88%, 11/23/27 | | | | | | | 1,466 | | | | 1,280,021 | |
CPG International LLC, 2022 Term Loan B, (1 mo. SOFR CME + 2.50%, 0.50% Floor), 6.92%, 04/28/29 | | | | | | | 798 | | | | 774,060 | |
Jeld-Wen, Inc., 2021 Term Loan B, (1 mo. LIBOR + 2.25%), 6.63%, 07/28/28 | | | | | | | 819 | | | | 762,029 | |
LSF10 XL Bidco SCA, 2021 EUR Term Loan B4, (3 mo. EURIBOR + 3.93%),
6.13%, 04/12/28 | | | EUR | | | | 853 | | | | 733,573 | |
New AMI I LLC, 2022 Term Loan B, (1 mo. SOFRTE + 6.00%, 0.50% Floor),
10.32%, 03/08/29 | | | USD | | | | 846 | | | | 721,363 | |
Standard Industries, Inc., 2021 Term Loan B, (3 mo. LIBOR + 2.25%, 0.50% Floor),
6.43%, 09/22/28 | | | | | | | 1,611 | | | | 1,589,639 | |
Wilsonart LLC, 2021 Term Loan E, (3 mo. LIBOR + 3.25%, 1.00% Floor),
7.98%, 12/31/26 | | | | | | | 3,172 | | | | 3,011,687 | |
| | | | | | | | |
| | | | | | | | | | | 8,872,372 | |
| | | |
Capital Markets — 3.9% | | | | | | | | | | | | |
Ascensus Holdings, Inc. | | | | | | | | | | | | |
2021 2nd Lien Term Loan, (3 mo. LIBOR + 6.50%, 0.50% Floor), 10.25%, 08/02/29 | | | | | | | 2,698 | | | | 2,343,173 | |
Term Loan, (3 mo. LIBOR + 3.50%, 0.50% Floor), 8.25%, 08/02/28 | | | | | | | 3,545 | | | | 3,378,238 | |
Deerfield Dakota Holding LLC | | | | | | | | | | | | |
2020 USD Term Loan B, (1 mo. SOFR CME + 3.75%, 1.00% Floor), 8.07%, 04/09/27 | | | | | | | 6,179 | | | | 5,759,578 | |
2021 USD 2nd Lien Term Loan, (1 mo. LIBOR + 6.75%, 0.75% Floor),
11.13%, 04/07/28 | | | | | | | 1,806 | | | | 1,711,185 | |
Eagle Broadband Investments LLC, Term Loan, (3 mo. LIBOR + 3.00%, 0.75% Floor), 7.75%, 11/12/27 | | | | | | | 1,515 | | | | 1,448,316 | |
FinCo I LLC, 2020 Term Loan B, (1 mo. LIBOR + 2.50%), 6.88%, 06/27/25 | | | | | | | 614 | | | | 612,021 | |
Focus Financial Partners LLC, 2021 Term Loan B4, (1 mo. SOFR CME + 2.50%, 0.50% Floor), 6.82%, 06/30/28 | | | | | | | 1,470 | | | | 1,438,958 | |
Greenhill & Co., Inc., Term Loan B, (1 mo. LIBOR + 3.25%), 7.63%, 04/12/24 | | | | | | | 1,170 | | | | 1,136,132 | |
| | | | | | | | |
| | | | | | | | | | | 17,827,601 | |
| | | |
Chemicals — 4.6% | | | | | | | | | | | | |
Ascend Performance Materials Operations LLC, 2021 Term Loan B, (6 mo. SOFR CME + 4.75%, 0.75% Floor), 8.83%, 08/27/26 | | | | | | | 2,514 | | | | 2,355,542 | |
Axalta Coating Systems U.S. Holdings, Inc., 2022 USD Term Loan B, (3 mo. SOFR CME + 3.00%, 0.50% Floor), 7.51%, 12/20/29 | | | | | | | 1,252 | | | | 1,252,000 | |
CPC Acquisition Corp., Term Loan, (3 mo. LIBOR + 3.75%, 0.75% Floor),
8.48%, 12/29/27 | | | | | | | 728 | | | | 523,455 | |
| | |
SCHEDULE OF INVESTMENTS | | 49 |
| | |
Schedule of Investments (continued) December 31, 2022 | | BlackRock Floating Rate Income Strategies Fund, Inc. (FRA) (Percentages shown are based on Net Assets) |
| | | | | | | | | | | | |
| Security | | | | | Par (000) | | | Value | |
| | | |
Chemicals (continued) | | | | | | | | | | | | |
Discovery Purchaser Corp., Term Loan, (3 mo. SOFR CME + 4.375%, 0.50% Floor), 7.97%, 10/04/29 | | | USD | | | | 1,328 | | | $ | 1,207,484 | |
Element Solutions, Inc., 2019 Term Loan B1, (1 mo. LIBOR + 2.00%), 6.32%, 01/31/26 | | | | | | | 1,985 | | | | 1,976,634 | |
Illuminate Buyer LLC, 2021 Term Loan, (1 mo. LIBOR + 3.50%), 7.88%, 06/30/27 | | | | | | | 1,392 | | | | 1,330,459 | |
Lonza Group AG, USD Term Loan B, (3 mo. LIBOR + 4.00%, 0.75% Floor),
8.73%, 07/03/28 | | | | | | | 1,074 | | | | 981,343 | |
Messer Industries GmbH, 2018 USD Term Loan, (3 mo. LIBOR + 2.50%),
7.23%, 03/02/26 | | | | | | | 2,162 | | | | 2,140,150 | |
Momentive Performance Materials, Inc., Term Loan B, (1 mo. LIBOR + 3.25%), 7.64%, 05/15/24 | | | | | | | 1,498 | | | | 1,491,717 | |
OQ Chemicals Corp., 2017 USD Term Loan B2, (3 mo. LIBOR + 3.25%),
7.00%, 10/14/24 | | | | | | | 1,719 | | | | 1,619,193 | |
PQ Corp., 2021 Term Loan B, (3 mo. LIBOR + 2.50%, 0.50% Floor), 6.91%, 06/09/28 | | | | | | | 1,730 | | | | 1,700,118 | |
Pregis TopCo Corp., 2021 Incremental Term Loan, (1 mo. LIBOR + 3.75%, 0.50% Floor), 8.13%, 07/31/26 | | | | | | | 701 | | | | 676,377 | |
SCIH Salt Holdings, Inc., 2021 Incremental Term Loan B, (3 mo. LIBOR + 4.00%, 0.75% Floor), 8.41%, 03/16/27 | | | | | | | 1,054 | | | | 1,021,852 | |
Sparta U.S. HoldCo LLC, 2021 Term Loan, (1 mo. LIBOR + 3.25%, 0.75% Floor), 7.39%, 08/02/28 | | | | | | | 1,644 | | | | 1,595,909 | |
Starfruit Finco BV, 2018 USD Term Loan B, (3 mo. LIBOR + 2.75%), 7.16%, 10/01/25 | | | | | | | 159 | | | | 156,505 | |
W.R. Grace Holdings LLC, 2021 Term Loan B, (3 mo. LIBOR + 3.75%, 0.50% Floor), 8.50%, 09/22/28 | | | | | | | 536 | | | | 524,546 | |
| | | | | | | | |
| | | | | | | | | | | 20,553,284 | |
| | | |
Commercial Services & Supplies — 4.1% | | | | | | | | | | | | |
Allied Universal Holdco LLC, 2021 USD Incremental Term Loan B, (1 mo. LIBOR + 3.75%, 0.50% Floor), 8.17%, 05/12/28 | | | | | | | 2,622 | | | | 2,486,552 | |
Amentum Government Services Holdings LLC, 2022 Term Loan, (1 mo. SOFR CME + 4.00%), 8.64%, 02/15/29 | | | | | | | 787 | | | | 765,157 | |
Aramark Services, Inc., 2018 Term Loan B3, (1 mo. LIBOR + 1.75%), 6.13%, 03/11/25 | | | | | | | 155 | | | | 153,519 | |
Asurion LLC | | | | | | | | | | | | |
2018 Term Loan B7, (1 mo. LIBOR + 3.00%), 7.38%, 11/03/24 | | | | | | | 1,127 | | | | 1,092,090 | |
2020 Term Loan B8, (1 mo. LIBOR + 3.25%), 7.63%, 12/23/26 | | | | | | | 768 | | | | 683,080 | |
2021 2nd Lien Term Loan B3, (1 mo. LIBOR + 5.25%), 9.63%, 01/31/28 | | | | | | | 1,117 | | | | 866,399 | |
2021 Second Lien Term Loan B4, (1 mo. LIBOR + 5.25%), 9.63%, 01/20/29 | | | | | | | 1,596 | | | | 1,233,485 | |
Clean Harbors, Inc., 2021 Incremental Term Loan B, (1 mo. LIBOR + 2.00%),
6.38%, 10/08/28 | | | | | | | 697 | | | | 692,702 | |
Covanta Holding Corp. | | | | | | | | | | | | |
2021 Term Loan B, (1 mo. SOFR CME + 2.50%, 0.50% Floor), 6.82%, 11/30/28 | | | | | | | 1,135 | | | | 1,125,131 | |
2021 Term Loan C, (1 mo. SOFR CME + 2.50%, 0.50% Floor), 6.82%, 11/30/28 | | | | | | | 85 | | | | 84,916 | |
Creative Artists Agency LLC, 2020 Incremental Term Loan B1, (1 mo. LIBOR + 4.25%, 1.00% Floor), 8.63%, 11/27/26 | | | | | | | 1,950 | | | | 1,932,803 | |
| | | | | | | | | | | | |
| Security | | | | | Par (000) | | | Value | |
|
Commercial Services & Supplies (continued) | |
EnergySolutions LLC, 2018 Term Loan B, (3 mo. LIBOR + 3.75%, 1.00% Floor),
8.48%, 05/09/25 | | | USD | | | | 515 | | | $ | 477,472 | |
Packers Holdings LLC, 2021 Term Loan, (3 mo. LIBOR + 3.25%, 0.75% Floor),
7.54%, 03/09/28 | | | | | | | 1,317 | | | | 1,146,329 | |
Prime Security Services Borrower LLC, 2021 Term Loan, (3 mo. LIBOR + 2.75%, 0.75% Floor), 6.50%, 09/23/26 | | | | | | | 1,928 | | | | 1,908,667 | |
Verscend Holding Corp., 2021 Term Loan B, (1 mo. LIBOR + 4.00%), 8.38%, 08/27/25 | | | | | | | 3,117 | | | | 3,090,512 | |
Viad Corp., Initial Term Loan, (1 mo. LIBOR + 5.00%, 0.50% Floor), 9.38%, 07/30/28 | | | | | | | 782 | | | | 735,174 | |
| | | | | | | | |
| | | | | | | | | | | 18,473,988 | |
| | | |
| Communications Equipment — 0.4% | | | | | | | | | |
ViaSat, Inc., Term Loan, (1 mo. SOFR CME + 4.50%, 0.50% Floor), 8.94%, 03/02/29 | | | | | | | 2,016 | | | | 1,957,704 | |
| | | | | | | | |
| | | |
Construction & Engineering — 1.7% | | | | | | | | | | | | |
Brand Energy & Infrastructure Services, Inc., 2017 Term Loan, (3 mo. LIBOR + 4.25%, 1.00% Floor), 8.49%, 06/21/24 | | | | | | | 2,529 | | | | 2,256,496 | |
Pike Corp., 2021 Incremental Term Loan B, (1 mo. LIBOR + 3.00%), 7.39%, 01/21/28 | | | | | | | 1,045 | | | | 1,029,084 | |
SRS Distribution, Inc., 2021 Term Loan B, (1 mo. LIBOR + 3.50%, 0.50% Floor),
7.88%, 06/02/28 | | | | | | | 2,772 | | | | 2,644,443 | |
USIC Holdings, Inc., 2021 Term Loan, (1 mo. LIBOR + 3.50%, 0.75% Floor),
7.88%, 05/12/28 | | | | | | | 1,751 | | | | 1,668,513 | |
| | | | | | | | |
| | | | | | | | | | | 7,598,536 | |
| | | |
Construction Materials — 1.8% | | | | | | | | | | | | |
Core & Main LP, 2021 Term Loan B, (3 mo. LIBOR + 2.50%), 6.88%, 07/27/28 | | | | | | | 4,099 | | | | 4,038,680 | |
Filtration Group Corp., 2018 1st Lien Term Loan, (1 mo. LIBOR + 3.00%),
7.38%, 03/29/25 | | | | | | | 2,378 | | | | 2,348,956 | |
Oscar AcquisitionCo. LLC, Term Loan B, (3 mo. SOFR CME + 4.50%, 0.50% Floor), 9.18%, 04/29/29 | | | | | | | 1,105 | | | | 1,043,757 | |
Tamko Building Products LLC, Term Loan B, (3 mo. LIBOR + 3.00%), 7.57%, 06/01/26 | | | | | | | 864 | | | | 832,812 | |
| | | | | | | | |
| | | | | | | | | | | 8,264,205 | |
| | | |
Containers & Packaging — 1.8% | | | | | | | | | | | | |
Charter Next Generation, Inc., 2021 Term Loan, (1 mo. LIBOR + 3.75%, 0.75% Floor), 8.13%, 12/01/27 | | | | | | | 3,497 | | | | 3,390,838 | |
Mauser Packaging Solutions Holding Co., 2017 Term Loan B, (1 mo. LIBOR + 3.25%), 7.37%, 04/03/24 | | | | | | | 2,367 | | | | 2,308,199 | |
Pregis TopCo Corp., 1st Lien Term Loan, (1 mo. SOFR CME + 3.75%), 8.19%, 07/31/26 | | | | | | | 615 | | | | 597,151 | |
Tosca Services LLC, 2021 Term Loan, (1 mo. LIBOR + 3.50%, 0.75% Floor),
7.94%, 08/18/27 | | | | | | | 1,177 | | | | 941,412 | |
Trident TPI Holdings, Inc., 2021 Incremental Term Loan, (3 mo. LIBOR + 4.00%, 0.50% Floor), 8.73%, 09/15/28 | | | | | | | 1,148 | | | | 1,100,061 | |
| | | | | | | | |
| | | | | | | | | | | 8,337,661 | |
| | | |
Distributors — 1.4% | | | | | | | | | | | | |
American Builders & Contractors Supply Co., Inc., 2019 Term Loan, (1 mo. LIBOR + 2.00%), 6.38%, 01/15/27 | | | | | | | 1,194 | | | | 1,182,449 | |
| | |
| 50 | | 2 0 2 2 BLACK ROCK ANNUAL REPORT TO SHAREHOLDERS |
| | |
Schedule of Investments (continued) December 31, 2022 | | BlackRock Floating Rate Income Strategies Fund, Inc. (FRA) (Percentages shown are based on Net Assets) |
| | | | | | | | | | | | |
| Security | | | | | Par
(000) | | | Value | |
| | | |
Distributors (continued) | | | | | | | | | | | | |
Dealer Tire Financial LLC, Term Loan B2, (1 mo. SOFR CME + 4.50%, 0.50% Floor), 8.82%, 12/14/27 | | | USD | | | | 2,545 | | | $ | 2,507,732 | |
TMK Hawk Parent Corp. | | | | | | | | | | | | |
2020 Super Priority First Out Term Loan A, (3 mo. LIBOR + 9.50%, 1.00% Floor), 14.26%, 05/30/24(b) | | | | | | | 958 | | | | 877,438 | |
2020 Super Priority Second Out Term Loan B, (3 mo. LIBOR + 3.50%, 1.00% Floor), 8.26%, 08/28/24 | | | | | | | 3,049 | | | | 1,555,141 | |
| | | | | | | | |
| | | | | | | | | | | 6,122,760 | |
| | | |
| Diversified Consumer Services — 2.3% | | | | | | | | | |
2U, Inc., Term Loan, (3 mo. LIBOR + 5.75%, 0.75% Floor), 10.16%, 12/30/24 | | | | | | | 1,425 | | | | 1,360,273 | |
Ascend Learning LLC | | | | | | | | | | | | |
2021 2nd Lien Term Loan, (1 mo. LIBOR + 5.75%, 0.50% Floor),
10.13%, 12/10/29 | | | | | | | 781 | | | | 666,779 | |
2021 Term Loan, (1 mo. LIBOR + 3.50%, 0.50% Floor), 7.88%, 12/11/28 | | | | | | | 1,924 | | | | 1,816,304 | |
Bright Horizons Family Solutions LLC, 2021 Term Loan B, (1 mo. LIBOR + 2.25%, 0.50% Floor), 6.69%, 11/24/28 | | | | | | | 928 | | | | 909,077 | |
Genuine Financial Holdings LLC, 2018 1st Lien Term Loan, (1 mo. LIBOR + 3.75%), 8.33%, 07/11/25 | | | | | | | 1,175 | | | | 1,128,327 | |
OLA Netherlands BV, Term Loan, (1 mo. SOFR CME + 6.25%, 0.75% Floor), 10.67%, 12/15/26 | | | | | | | 859 | | | | 807,275 | |
PAI Holdco, Inc., 2020 Term Loan B, (3 mo. LIBOR + 3.75%, 0.75% Floor),
8.16%, 10/28/27 | | | | | | | 1,021 | | | | 895,165 | |
Serta Simmons Bedding LLC | | | | | | | | | | | | |
2020 Super Priority First Out Term Loan, (3 mo. LIBOR + 7.50%), 12.27%, 08/10/23 | | | | | | | 465 | | | | 456,790 | |
2020 Super Priority Second Out Term Loan, (3 mo. LIBOR + 7.50%, 1.00% Floor), 12.27%, 08/10/23 | | | | | | | 728 | | | | 331,487 | |
Sotheby’s, 2021 Term Loan B, (3 mo. LIBOR + 4.50%, 0.50% Floor), 8.58%, 01/15/27 | | | | | | | 1,780 | | | | 1,732,125 | |
Voyage Australia Pty. Ltd., USD Term Loan B, (3 mo. LIBOR + 3.50%, 0.50% Floor), 7.74%, 07/20/28(b) | | | | | | | 327 | | | | 309,767 | |
| | | | | | | | |
| | | | | | | | | | | 10,413,369 | |
| | | |
| Diversified Financial Services — 5.7% | | | | | | | | | |
Acuris Finance U.S., Inc., 2021 USD Term Loan B, (3 mo. SOFR CME + 4.00%, 0.50% Floor), 8.73%, 02/16/28 | | | | | | | 429 | | | | 420,551 | |
Advisor Group, Inc., 2021 Term Loan, (1 mo. LIBOR + 4.50%), 8.88%, 07/31/26 | | | | | | | 1,021 | | | | 996,929 | |
AlixPartners LLP, 2021 USD Term Loan B, (1 mo. LIBOR + 2.75%, 0.50% Floor), 7.13%, 02/04/28 | | | | | | | 1,731 | | | | 1,714,773 | |
Castlelake Aviation Ltd., Term Loan B, (3 mo. LIBOR + 2.75%, 0.50% Floor), 7.52%, 10/22/26 | | | | | | | 1,598 | | | | 1,581,902 | |
Cogeco Financing 2 LP, 2021 Incremental Term Loan B, (1 mo. LIBOR + 2.50%, 0.50% Floor), 6.88%, 09/01/28 | | | | | | | 1,596 | | | | 1,547,782 | |
Delta TopCo, Inc. | | | | | | | | | | | | |
2020 2nd Lien Term Loan, (3 mo. LIBOR + 7.25%, 0.75% Floor), 11.65%, 12/01/28 | | | | | | | 385 | | | | 299,819 | |
| | | | | | | | | | | | |
| Security | | | | | Par
(000) | | | Value | |
| | | |
Diversified Financial Services (continued) | | | | | | | | | | | | |
Delta TopCo, Inc. (continued) | | | | | | | | | | | | |
2020 Term Loan B, (3 mo. LIBOR + 3.75%, 0.75% Floor), 8.15%, 12/01/27 | | | USD | | | | 589 | | | $ | 542,465 | |
EG America LLC, 2018 USD Term Loan, (3 mo. LIBOR + 4.00%), 8.73%, 02/07/25 | | | | | | | 904 | | | | 851,447 | |
Gainwell Acquisition Corp., Term Loan B, (3 mo. LIBOR + 4.00%, 0.75% Floor),
8.73%, 10/01/27 | | | | | | | 3,262 | | | | 3,054,089 | |
Kingpin Intermediate Holdings LLC, 2018 Term Loan B, (1 mo. LIBOR + 3.50%, 1.00% Floor), 7.89%, 07/03/24(b) | | | | | | | 1,673 | | | | 1,668,517 | |
KKR Apple Bidco LLC | | | | | | | | | | | | |
2021 2nd Lien Term Loan, (1 mo. LIBOR + 5.75%, 0.50% Floor), 10.13%, 09/21/29 | | | | | | | 248 | | | | 238,435 | |
2021 Term Loan, (1 mo. LIBOR + 2.75%, 0.50% Floor), 7.13%, 09/23/28 | | | | | | | 602 | | | | 592,795 | |
LBM Acquisition LLC, Term Loan B, (6 mo. LIBOR + 3.75%, 0.75% Floor),
7.12%, 12/17/27 | | | | | | | 509 | | | | 440,133 | |
Radiate Holdco LLC, 2021 Term Loan B, (1 mo. LIBOR + 3.25%, 0.75% Floor),
7.63%, 09/25/26 | | | | | | | 2,560 | | | | 2,070,474 | |
RVR Dealership Holdings LLC, Term Loan B, (1 mo. SOFRTE + 3.75%, 0.75% Floor), 8.17%, 02/08/28 | | | | | | | 731 | | | | 671,359 | |
Setanta Aircraft Leasing Designated Activity Co., Term Loan B, (3 mo. LIBOR + 2.00%), 6.73%, 11/05/28 | | | | | | | 1,340 | | | | 1,331,290 | |
SMG U.S. Midco 2, Inc., 2020 Term Loan, (3 mo. LIBOR + 2.50%), 6.91%, 01/23/25 | | | | | | | 418 | | | | 406,584 | |
SSH Group Holdings, Inc., 2018 1st Lien Term Loan, (3 mo. LIBOR + 4.00%),
8.73%, 07/30/25 | | | | | | | 225 | | | | 218,802 | |
Veritas U.S., Inc., 2021 USD Term Loan B, (3 mo. LIBOR + 5.00%, 1.00% Floor),
9.73%, 09/01/25 | | | | | | | 3,720 | | | | 2,607,789 | |
VS Buyer LLC, Term Loan B, (1 mo. LIBOR + 3.00%), 7.38%, 02/28/27 | | | | | | | 1,660 | | | | 1,607,966 | |
White Cap Buyer LLC, Term Loan B, (1 mo. SOFR CME + 3.75%), 8.07%, 10/19/27 | | | | | | | 1,229 | | | | 1,186,464 | |
Ziggo Financing Partnership, USD Term Loan I, (1 mo. LIBOR + 2.50%), 6.82%, 04/30/28 | | | | | | | 1,617 | | | | 1,574,052 | |
| | | | | | | | |
| | | | | | | | | | | 25,624,417 | |
|
| Diversified Telecommunication Services — 1.6% | |
Cablevision Lightpath LLC, Term Loan B, (1 mo. LIBOR + 3.25%, 0.50% Floor), 7.57%, 11/30/27 | | | | | | | 381 | | | | 363,350 | |
Consolidated Communications, Inc., 2021 Term Loan B, (1 mo. LIBOR + 3.50%, 0.75% Floor), 7.88%, 10/02/27 | | | | | | | 808 | | | | 710,465 | |
Frontier Communications Holdings LLC, 2021 1st Lien Term Loan, (3 mo. LIBOR + 3.75%, 0.75% Floor), 8.50%, 05/01/28 | | | | | | | 1,977 | | | | 1,881,880 | |
Iridium Satellite LLC, 2021 Term Loan B2,
(1 mo. LIBOR + 2.50%, 0.75% Floor), 6.92%, 11/04/26 | | | | | | | 1,803 | | | | 1,784,471 | |
Level 3 Financing, Inc., 2019 Term Loan B,
(1 mo. LIBOR + 1.75%), 6.13%, 03/01/27 | | | | | | | 1,496 | | | | 1,430,857 | |
Virgin Media SFA Finance Ltd., GBP Term Loan L, (1 mo. SONIA + 3.25%),
6.21%, 01/15/27 | | | GBP | | | | 1,000 | | | | 1,115,256 | |
| | | | | | | | |
| | | | | | | | | | | 7,286,279 | |
| | |
SCHEDULE OF INVESTMENTS | | 51 |
| | |
Schedule of Investments (continued) December 31, 2022 | | BlackRock Floating Rate Income Strategies Fund, Inc. (FRA) (Percentages shown are based on Net Assets) |
| | | | | | | | | | | | |
| Security | | | | | Par
(000) | | | Value | |
| | | |
Electric Utilities — 0.9% | | | | | | | | | | | | |
ExGen Renewables IV LLC, 2020 Term Loan, (3 mo. LIBOR + 2.50%, 1.00% Floor), 7.24%, 12/15/27 | | | USD | | | | 1,255 | | | $ | 1,241,891 | |
Triton Water Holdings, Inc., Term Loan, (3 mo. LIBOR + 3.50%, 0.50% Floor),
8.23%, 03/31/28 | | | | | | | 3,216 | | | | 2,979,536 | |
| | | | | | | | |
| | | | | | | | | | | 4,221,427 | |
| | | |
| Electrical Equipment — 0.9% | | | | | | | | | |
Arcline FM Holdings LLC, 2021 1st Lien Term Loan, (6 mo. LIBOR + 4.75%, 0.75% Floor), 9.48%, 06/23/28 | | | | | | | 1,529 | | | | 1,449,665 | |
AZZ, Inc., Term Loan B, (1 mo. SOFR CME + 4.25%, 0.50% Floor), 8.67%, 05/13/29 | | | | | | | 262 | | | | 262,022 | |
Gates Global LLC, 2021 Term Loan B3, (1 mo. LIBOR + 2.50%, 0.75% Floor),
6.88%, 03/31/27 | | | | | | | 2,419 | | | | 2,363,432 | |
| | | | | | | | |
| | | | | | | | | | | 4,075,119 | |
|
| Electronic Equipment, Instruments & Components — 0.4% | |
Coherent Corp., 2022 Term Loan B, (3 mo. LIBOR + 2.75%, 0.50% Floor),
7.13%, 07/02/29 | | | | | | | 1,701 | | | | 1,678,977 | |
| | | | | | | | |
| | | |
Entertainment — 0.3% | | | | | | | | | | | | |
Delta 2 Lux SARL, Term Loan B, (3 mo. SOFR CME + 3.25%, 0.50% Floor),
7.57%, 01/15/30 | | | | | | | 1,291 | | | | 1,289,386 | |
| | | | | | | | |
|
Environmental, Maintenance & Security Service — 0.7% | |
Asplundh Tree Expert LLC, 2021 Term Loan B, (1 mo. LIBOR + 1.75%),
6.13%, 09/07/27 | | | | | | | 1,968 | | | | 1,964,421 | |
TruGreen LP, 2020 Term Loan, (1 mo. LIBOR + 4.00%, 0.75% Floor), 8.38%, 11/02/27 | | | | | | | 1,211 | | | | 1,073,048 | |
| | | | | | | | |
| | | | | | | | | | | 3,037,469 | |
|
| Equity Real Estate Investment Trusts (REITs) — 0.2% | |
RHP Hotel Properties LP, 2017 Term Loan B, (1 mo. LIBOR + 2.00%), 6.39%, 05/11/24 | | | | | | | 865 | | | | 859,873 | |
| | | | | | | | |
| | | |
Food & Staples Retailing — 0.6% | | | | | | | | | | | | |
Nomad Foods U.S. LLC, 2022 Term Loan B, (3 mo. SOFR CME + 3.75%, 0.50% Floor), 8.23%, 11/12/29 | | | | | | | 1,012 | | | | 1,008,109 | |
U.S. Foods, Inc. | | | | | | | | | | | | |
2019 Term Loan B, (1 mo. LIBOR + 2.00%), 6.38%, 09/13/26 | | | | | | | 713 | | | | 705,193 | |
2021 Term Loan B, (1 mo. LIBOR + 2.75%), 7.13%, 11/22/28 | | | | | | | 977 | | | | 970,507 | |
| | | | | | | | |
| | | | | | | | | | | 2,683,809 | |
| | | |
| Food Products — 2.4% | | | | | | | | | |
8th Avenue Food & Provisions, Inc. | | | | | | | | | | | | |
2018 1st Lien Term Loan, (1 mo. LIBOR + 3.75%), 8.13%, 10/01/25 | | | | | | | 1,189 | | | | 985,483 | |
2021 Incremental Term Loan, (1 mo. LIBOR + 4.75%, 0.75% Floor),
9.13%, 10/01/25 | | | | | | | 1,523 | | | | 1,260,488 | |
Chobani LLC, 2020 Term Loan B, (1 mo. LIBOR + 3.50%, 1.00% Floor),
7.88%, 10/25/27 | | | | | | | 2,743 | | | | 2,683,211 | |
Froneri International Ltd., 2020 USD Term Loan, (1 mo. LIBOR + 2.25%),
6.63%, 01/29/27 | | | | | | | 3,551 | | | | 3,449,701 | |
Reynolds Group Holdings, Inc., 2020 Term Loan B2, (1 mo. LIBOR + 3.25%),
7.63%, 02/05/26 | | | | | | | 402 | | | | 396,141 | |
| | | | | | | | | | | | |
| Security | | | | | Par
(000) | | | Value | |
| | | |
Food Products (continued) | | | | | | | | | | | | |
Sovos Brands Intermediate, Inc., 2021 Term Loan, (3 mo. LIBOR + 3.50%, 0.75% Floor), 7.91%, 06/08/28 | | | USD | | | | 1,523 | | | $ | 1,479,755 | |
UTZ Quality Foods LLC, 2021 Term Loan B, (1 mo. SOFR CME + 3.00%),
7.44%, 01/20/28 | | | | | | | 683 | | | | 675,715 | |
| | | | | | | | |
| | | | | | | | | | | 10,930,494 | |
| | | |
| Gas Utilities — 0.7% | | | | | | | | | |
Freeport LNG Investments LLLP, Term Loan B, (3 mo. LIBOR + 3.50%, 0.50% Floor), 7.74%, 12/21/28 | | | | | | | 3,480 | | | | 3,301,476 | |
| | | | | | | | |
|
Health Care Equipment & Supplies — 1.7% | |
Electron BidCo, Inc., 2021 Term Loan, (1 mo. LIBOR + 3.00%, 0.50% Floor), 7.38%, 11/01/28 | | | | | | | 2,191 | | | | 2,129,887 | |
Insulet Corp., Term Loan B, (3 mo. SOFR CME + 3.25%), 7.69%, 05/04/28 | | | | | | | 765 | | | | 753,390 | |
Medline Borrower LP, USD Term Loan B, (1 mo. LIBOR + 3.25%, 0.50% Floor), 7.63%, 10/23/28 | | | | | | | 4,348 | | | | 4,125,649 | |
Venga Finance SARL, 2021 USD Term Loan B, (3 mo. LIBOR + 4.75%, 0.75% Floor), 9.48%, 12/04/28 | | | | | | | 649 | | | | 593,156 | |
| | | | | | | | |
| | | | | | | | | | | 7,602,082 | |
| | | |
| Health Care Providers & Services — 3.0% | | | | | | | | | |
CHG Healthcare Services, Inc., 2021 Term Loan, (1 mo. LIBOR + 3.25%, 0.50% Floor), 7.63%, 09/29/28 | | | | | | | 1,023 | | | | 999,182 | |
Envision Healthcare Corp. | | | | | | | | | | | | |
2022 First Out Term Loan, (3 mo. SOFR CME + 7.88%, 1.00% Floor),
12.61%, 03/31/27 | | | | | | | 177 | | | | 156,513 | |
2022 Second Out Term Loan, (3 mo. SOFR CME + 4.25%, 1.00% Floor),
8.83%, 03/31/27 | | | | | | | 1,176 | | | | 399,846 | |
EyeCare Partners LLC | | | | | | | | | | | | |
2020 Term Loan, (3 mo. LIBOR + 3.75%), 8.48%, 02/18/27 | | | | | | | 1,669 | | | | 1,329,382 | |
2021 2nd Lien Term Loan, (3 mo. LIBOR + 6.75%, 0.50% Floor), 11.48%, 11/15/29 | | | | | | | 581 | | | | 472,449 | |
2021 Incremental Term Loan, (3 mo. LIBOR + 3.75%, 0.50% Floor), 8.48%, 11/15/28 | | | | | | | 535 | | | | 448,648 | |
Femur Buyer, Inc., 1st Lien Term Loan, (3 mo. LIBOR + 4.50%), 9.23%, 03/05/26 | | | | | | | 1,044 | | | | 891,655 | |
Ingenovis Health, Inc., Term Loan B, (1 mo. LIBOR + 3.75%, 0.75% Floor),
8.14%, 03/06/28 | | | | | | | 1,620 | | | | 1,538,532 | |
Orbcomm, Inc., Term Loan B, (1 mo. LIBOR + 4.25%, 0.75% Floor), 8.81%, 09/01/28 | | | | | | | 872 | | | | 742,670 | |
PetVet Care Centers LLC, 2021 Term Loan B3, (1 mo. LIBOR + 3.50%, 0.75% Floor), 7.88%, 02/14/25 | | | | | | | 52 | | | | 48,658 | |
Sotera Health Holdings LLC, 2021 Term Loan, (3 mo. LIBOR + 2.75%, 0.50% Floor), 7.16%, 12/11/26 | | | | | | | 2,539 | | | | 2,335,880 | |
Surgery Center Holdings, Inc., 2021 Term Loan, (3 mo. LIBOR + 3.75%, 0.75% Floor), 8.05%, 08/31/26 | | | | | | | 595 | | | | 586,713 | |
Vizient, Inc., 2022 Term Loan B, (1 mo. SOFR CME + 2.25%, 0.50% Floor),
6.67%, 04/28/29 | | | | | | | 336 | | | | 335,553 | |
| | |
| 52 | | 2 0 2 2 BLACK ROCK ANNUAL REPORT TO SHAREHOLDERS |
| | |
Schedule of Investments (continued) December 31, 2022 | | BlackRock Floating Rate Income Strategies Fund, Inc. (FRA) (Percentages shown are based on Net Assets) |
| | | | | | | | | | | | |
| Security | | | | | Par
(000) | | | Value | |
| | |
Health Care Providers & Services (continued) | | | | | | | | | |
WCG Purchaser Corp., 2019 Term Loan, (1 mo. LIBOR + 4.00%, 1.00% Floor),
8.38%, 01/08/27 | | | USD | | | | 1,442 | | | $ | 1,304,831 | |
WP CityMD Bidco LLC, 2021 1st Lien Term Loan B, (1 mo. LIBOR + 3.25%, 0.50% Floor), 7.63%, 12/22/28 | | | | | | | 1,856 | | | | 1,851,732 | |
| | | | | | | | |
| | | | | | | | | | | 13,442,244 | |
| | | |
| Health Care Services — 0.3% | | | | | | | | | |
Azalea Topco, Inc., Term Loan, (1 mo. LIBOR + 3.50%), 7.88%, 07/24/26 | | | | | | | 968 | | | | 884,421 | |
Medical Solutions Holdings, Inc., 2021 2nd Lien Term Loan, (1 mo. LIBOR + 7.00%, 0.50% Floor), 11.38%, 11/01/29 | | | | | | | 611 | | | | 562,120 | |
| | | | | | | | |
| | | | | | | | | | | 1,446,541 | |
| | | |
| Health Care Technology — 2.6% | | | | | | | | | |
AthenaHealth Group, Inc. | | | | | | | | | | | | |
2022 Delayed Draw Term loan, (3 mo. SOFR CME + 3.50%), 7.82%, 02/15/29 | | | | | | | 367 | | | | 110,296 | |
2022 Term Loan B, (1 mo. SOFR CME + 3.50%, 0.50% Floor), 7.82%, 02/15/29 | | | | | | | 2,999 | | | | 2,589,877 | |
GoodRx, Inc., 1st Lien Term Loan, (1 mo. LIBOR + 2.75%), 7.13%, 10/10/25 | | | | | | | 719 | | | | 698,709 | |
Polaris Newco LLC, USD Term Loan B, (3 mo. LIBOR + 4.00%, 0.50% Floor),
8.73%, 06/02/28 | | | | | | | 4,160 | | | | 3,786,656 | |
Press Ganey Holdings, Inc., 2021 Term Loan B, (1 mo. LIBOR + 3.75%, 0.75% Floor), 8.13%, 07/24/26 | | | | | | | 1,689 | | | | 1,548,230 | |
Verscend Holding Corp., 2021 2nd Lien Term Loan, (1 mo. LIBOR + 7.00%, 0.50% Floor), 11.38%, 04/02/29(b) | | | | | | | 3,092 | | | | 3,045,620 | |
| | | | | | | | |
| | | | | | | | | | | 11,779,388 | |
| | | |
| Hotels, Restaurants & Leisure — 7.0% | | | | | | | | | |
Aristocrat Technologies, Inc., 2022 Term Loan B, (3 mo. SOFR CME + 2.25%, 0.50% Floor), 6.93%, 05/24/29 | | | | | | | 101 | | | | 100,779 | |
Bally’s Corp., 2021 Term Loan B, (3 mo. LIBOR + 3.25%, 0.50% Floor),
7.54%, 10/02/28 | | | | | | | 899 | | | | 829,296 | |
Burger King (Restaurant Brands Int), Term Loan B4, (3 mo. LIBOR + 1.75%),
6.14%, 11/19/26 | | | | | | | 2,430 | | | | 2,384,561 | |
Caesars Resort Collection LLC | | | | | | | | | | | | |
2017 1st Lien Term Loan B, (1 mo. LIBOR + 2.75%), 7.13%, 12/23/24 | | | | | | | 1,526 | | | | 1,520,927 | |
2020 Term Loan B1, (1 mo. LIBOR + 3.50%), 7.88%, 07/21/25 | | | | | | | 691 | | | | 689,070 | |
Carnival Corp., USD Term Loan B, (1 mo. LIBOR + 3.00%, 0.75% Floor), 7.38%, 06/30/25 | | | | | | | 1,443 | | | | 1,379,941 | |
Churchill Downs, Inc., 2021 Incremental Term Loan B1, (1 mo. LIBOR + 2.00%), 6.39%, 03/17/28 | | | | | | | 773 | | | | 764,853 | |
ECL Entertainment LLC, Term Loan, (1 mo. LIBOR + 7.50%, 0.75% Floor),
11.88%, 05/01/28 | | | | | | | 572 | | | | 570,379 | |
Equinox Holdings, Inc., 2017 1st Lien Term Loan, (3 mo. LIBOR + 3.00%, 1.00% Floor), 7.73%, 03/08/24 | | | | | | | 3,872 | | | | 2,899,121 | |
Fertitta Entertainment LLC, 2022 Term Loan B, (1 mo. SOFRTE + 4.00%, 0.50% Floor), 8.32%, 01/27/29 | | | | | | | 4,124 | | | | 3,913,045 | |
| | | | | | | | | | | | |
| Security | | | | | Par
(000) | | | Value | |
| | |
Hotels, Restaurants & Leisure (continued) | | | | | | | | | |
Flutter Financing B.V., 2022 USD Term Loan B, (3 mo. SOFR CME + 3.25%, 0.50% Floor), 8.09%, 07/22/28 | | | USD | | | | 1,182 | | | $ | 1,175,312 | |
Four Seasons Hotels Ltd., 2022 Term Loan B, (1 mo. SOFR CME + 3.25%, 0.50% Floor),
7.67%, 11/30/29 | | | | | | | 3,065 | | | | 3,064,032 | |
IRB Holding Corp., 2020 Term Loan B, (1 mo. LIBOR + 2.75%, 1.00% Floor), 7.13%, 02/05/25 | | | | | | | 1,573 | | | | 1,556,813 | |
Penn National Gaming, Inc., 2022 Term Loan B, (1 mo. SOFR CME + 2.75%, 0.50% Floor), 7.17%, 05/03/29 | | | | | | | 1,483 | | | | 1,465,726 | |
Playa Resorts Holding B.V., 2022 Term Loan B, (3 mo. SOFR CME + 4.25%, 0.50% Floor), 8.58%, 01/05/29 | | | | | | | 479 | | | | 466,129 | |
Playtika Holding Corp., 2021 Term Loan, (1 mo. LIBOR + 2.75%), 7.13%, 03/13/28 | | | | | | | 1,504 | | | | 1,432,386 | |
Scientific Games International, Inc., 2022 USD Term Loan, (1 mo. SOFR CME + 3.00%, 0.50% Floor), 7.42%, 04/14/29 | | | | | | | 814 | | | | 800,830 | |
Stars Group Holdings BV, 2018 USD Incremental Term Loan, (3 mo. LIBOR + 2.25%), 6.98%, 07/21/26 | | | | | | | 1,110 | | | | 1,092,844 | |
Station Casinos LLC, 2020 Term Loan B, (1 mo. LIBOR + 2.25%, 0.25% Floor),
6.64%, 02/08/27 | | | | | | | 2,049 | | | | 1,997,133 | |
Travelport Finance Luxembourg SARL, 2021 Consented Term Loan, 05/29/26(h) | | | | | | | 1,440 | | | | 994,646 | |
Whatabrands LLC, 2021 Term Loan B, (1 mo. LIBOR + 3.25%, 0.50% Floor),
7.63%, 08/03/28 | | | | | | | 2,262 | | | | 2,183,450 | |
Wyndham Hotels & Resorts, Inc., Term Loan B, (1 mo. LIBOR + 1.75%),
6.13%, 05/30/25 | | | | | | | 534 | | | | 532,899 | |
| | | | | | | | |
| | | | | | | | | | | 31,814,172 | |
| | | |
| Household Durables — 1.7% | | | | | | | | | |
ACProducts Holdings, Inc., 2021 Term Loan B, (6 mo. LIBOR + 4.25%, 0.50% Floor), 8.98%, 05/17/28 | | | | | | | 1,645 | | | | 1,224,252 | |
Hunter Douglas, Inc., USD Term Loan B1, (3 mo. SOFR CME + 3.50%),
7.86%, 02/26/29 | | | | | | | 2,408 | | | | 2,109,405 | |
Reynolds Consumer Products LLC, Term Loan, (1 mo. LIBOR + 1.75%),
6.13%, 02/04/27 | | | | | | | 1,491 | | | | 1,477,705 | |
Snap One Holdings Corp., Term Loan B, (1 mo. LIBOR + 4.50%, 0.50% Floor),
8.88%, 12/08/28(b) | | | | | | | 591 | | | | 539,587 | |
Sunset Debt Merger Sub, Inc., 2021 Term Loan B, (3 mo. LIBOR + 4.00%, 0.75% Floor), 8.75%, 10/06/28 | | | | | | | 825 | | | | 671,773 | |
Weber-Stephen Products LLC, Term Loan B, (1 mo. LIBOR + 3.25%, 0.75% Floor),
7.63%, 10/30/27 | | | | | | | 2,031 | | | | 1,706,017 | |
| | | | | | | | |
| | | | | | | | | | | 7,728,739 | |
| | | |
| Household Products — 0.1% | | | | | | | | | |
Spectrum Brands, Inc., 2021 Term Loan, (3 mo. LIBOR + 2.00%, 0.50% Floor),
6.60%, 03/03/28 | | | | | | | 534 | | | | 522,828 | |
| | | | | | | | |
|
Independent Power and Renewable Electricity Producers — 0.6% | |
Calpine Construction Finance Co. LP, 2017 Term Loan B, (1 mo. LIBOR + 2.00%), 6.38%, 01/15/25 | | | | | | | 501 | | | | 499,626 | |
| | |
SCHEDULE OF INVESTMENTS | | 53 |
| | |
Schedule of Investments (continued) December 31, 2022 | | BlackRock Floating Rate Income Strategies Fund, Inc. (FRA) (Percentages shown are based on Net Assets) |
| | | | | | | | | | | | |
| Security | | | | | Par
(000) | | | Value | |
|
Independent Power and Renewable Electricity Producers (continued) | |
Calpine Corp. | | | | | | | | | | | | |
2019 Term Loan B10, (1 mo. LIBOR + 2.00%), 6.38%, 08/12/26 | | | USD | | | | 702 | | | $ | 692,641 | |
Term Loan B9, (1 mo. LIBOR + 2.00%), 6.39%, 04/05/26 | | | | | | | 1,504 | | | | 1,482,452 | |
| | | | | | | | |
| | | | | | | | | | | 2,674,719 | |
| | | |
| Industrial Conglomerates — 1.9% | | | | | | | | | |
AVSC Holding Corp. | | | | | | | | | | | | |
2020 Term Loan B1, (3 mo. LIBOR + 3.25%, 1.00% Floor),
7.68%, 03/03/25 | | | | | | | 1,005 | | | | 919,086 | |
2020 Term Loan B3, (3 mo. LIBOR + 15.00%), 15.00%, 10/15/26 | | | | | | | 918 | | | | 967,060 | |
Diamond BC BV, 2021 Term Loan B, (3 mo. LIBOR + 2.75%, 0.50% Floor),
7.16%, 09/29/28 | | | | | | | 1,731 | | | | 1,670,471 | |
Stitch Aquisition Corp., Term Loan B, (3 mo. LIBOR + 6.75%, 0.75% Floor),
11.48%, 07/28/28 | | | | | | | 1,086 | | | | 919,695 | |
Vertical U.S. Newco, Inc., Term Loan B, (6 mo. LIBOR + 3.50%, 0.50% Floor),
6.87%, 07/30/27 | | | | | | | 1,896 | | | | 1,823,743 | |
Vertiv Group Corp., 2021 Term Loan B, (1 mo. LIBOR + 2.75%), 6.89%, 03/02/27 | | | | | | | 2,436 | | | | 2,339,387 | |
| | | | | | | | |
| | | | | | | | | | | 8,639,442 | |
| | | |
| Insurance — 5.1% | | | | | | | | | |
Alliant Holdings Intermediate LLC | | | | | | | | | | | | |
2018 Term Loan B, (1 mo. LIBOR + 3.25%), 7.63%, 05/09/25 | | | | | | | 2,884 | | | | 2,842,720 | |
2021 Term Loan B4, (1 mo. LIBOR + 3.50%, 0.50% Floor), 7.85%, 11/06/27 | | | | | | | 3,788 | | | | 3,697,226 | |
Term Loan B, (1 mo. LIBOR + 3.25%), 7.63%, 05/09/25 | | | | | | | 1,013 | | | | 999,044 | |
AmWINS Group, Inc., 2021 Term Loan B, (1 mo. LIBOR + 2.25%, 0.75% Floor),
6.63%, 02/19/28 | | | | | | | 3,363 | | | | 3,298,415 | |
AssuredPartners, Inc. | | | | | | | | | | | | |
2020 Term Loan B, (1 mo. LIBOR + 3.50%), 7.88%, 02/12/27 | | | | | | | 1,404 | | | | 1,361,028 | |
2021 Term Loan B, (1 mo. LIBOR + 3.50%, 0.50% Floor), 7.88%, 02/12/27 | | | | | | | 880 | | | | 850,947 | |
Hub International Ltd. | | | | | | | | | | | | |
2018 Term Loan B, (3 mo. LIBOR + 3.00%), 7.33%, 04/25/25 | | | | | | | 2,847 | | | | 2,812,410 | |
2021 Term Loan B, (3 mo. LIBOR + 3.25%, 0.75% Floor), 7.53%, 04/25/25 | | | | | | | 2,666 | | | | 2,639,054 | |
2022 Term Loan B, (3 mo. SOFR CME + 4.00%, 0.75% Floor), 8.22%, 11/10/29 | | | | | | | 547 | | | | 540,469 | |
NFP Corp., 2020 Term Loan, (1 mo. LIBOR + 3.25%), 7.63%, 02/15/27 | | | | | | | 186 | | | | 177,228 | |
Ryan Specialty Group LLC, Term Loan, (1 mo. SOFR CME + 3.00%, 0.75% Floor), 7.42%, 09/01/27 | | | | | | | 1,359 | | | | 1,348,118 | |
Sedgwick Claims Management Services, Inc.
2018 Term Loan B, (1 mo. LIBOR + 3.25%), 7.63%, 12/31/25 | | | | | | | 786 | | | | 763,594 | |
2019 Term Loan B, (1 mo. LIBOR + 3.75%), 8.13%, 09/03/26 | | | | | | | 1,018 | | | | 997,636 | |
2020 Term Loan B3, (1 mo. LIBOR + 4.25%, 1.00% Floor), 8.63%, 09/03/26 | | | | | | | 815 | | | | 803,461 | |
| | | | | | | | |
| | | | | | | | | | | 23,131,350 | |
| | | | | | | | | | | | |
| Security | | | | | Par
(000) | | | Value | |
| | | |
Interactive Media & Services — 1.6% | | | | | | | | | | | | |
Adevinta ASA, USD Term Loan B, (3 mo. LIBOR + 2.75%, 0.75% Floor),
7.48%, 06/26/28 | | | USD | | | | 1,733 | | | $ | 1,709,709 | |
Camelot U.S. Acquisition LLC, 2020 Incremental Term Loan B, (1 mo. LIBOR + 3.00%, 1.00% Floor),
7.38%, 10/30/26 | | | | | | | 2,338 | | | | 2,300,108 | |
Go Daddy Operating Co. LLC, 2021 Term Loan B4, (1 mo. LIBOR + 2.00%),
6.38%, 08/10/27 | | | | | | | 732 | | | | 724,420 | |
Grab Holdings, Inc., Term Loan B, (1 mo. LIBOR + 4.50%, 1.00% Floor),
8.89%, 01/29/26 | | | | | | | 2,311 | | | | 2,276,769 | |
| | | | | | | | |
| | | | | | | | | | | 7,011,006 | |
| | | |
| Internet & Direct Marketing Retail — 0.8% | | | | | | | | | |
CNT Holdings I Corp., 2020 Term Loan, (3 mo. SOFR CME + 3.50%, 0.75% Floor),
7.24%, 11/08/27 | | | | | | | 1,837 | | | | 1,775,133 | |
Go Daddy Operating Co. LLC, 2022 Term Loan B5, (1 mo. SOFR CME + 3.25%),
7.57%, 10/21/29 | | | | | | | 1,489 | | | | 1,485,069 | |
PUG LLC, 2021 Incremental Term Loan B, (1 mo. LIBOR + 4.25%, 0.50% Floor),
8.63%, 02/12/27(b) | | | | | | | 367 | | | | 303,064 | |
| | | | | | | | |
| | | | | | | | | | | 3,563,266 | |
| | | |
| Internet Software & Services — 0.4% | | | | | | | | | |
Uber Technologies, Inc., 2021 Term Loan B, (3 mo. LIBOR + 3.50%), 8.23%, 02/25/27 | | | | | | | 1,766 | | | | 1,761,432 | |
| | | | | | | | |
| | | |
IT Services — 6.8% | | | | | | | | | | | | |
Aruba Investments Holdings LLC | | | | | | | | | | | | |
2020 2nd Lien Term Loan, (1 mo. LIBOR + 7.75%, 0.75% Floor), 12.14%, 11/24/28 | | | | | | | 1,440 | | | | 1,303,200 | |
2020 USD Term Loan, (1 mo. LIBOR + 3.75%, 0.75% Floor), 8.14%, 11/24/27 | | | | | | | 765 | | | | 741,818 | |
Boxer Parent Co., Inc., 2021 USD Term Loan, (1 mo. LIBOR + 3.75%), 8.13%, 10/02/25 | | | | | | | 2,036 | | | | 1,946,426 | |
Camelot Finance SA, Term Loan B, (1 mo. LIBOR + 3.00%), 7.38%, 10/30/26 | | | | | | | 1,948 | | | | 1,914,501 | |
CCC Intelligent Solutions, Inc., Term Loan, (1 mo. LIBOR + 2.25%, 0.50% Floor),
6.63%, 09/21/28 | | | | | | | 1,683 | | | | 1,666,170 | |
CoreLogic, Inc. | | | | | | | | | | | | |
2nd Lien Term Loan, (1 mo. LIBOR + 6.50%, 0.50% Floor), 10.94%, 06/04/29 | | | | | | | 1,416 | | | | 991,558 | |
Term Loan, (1 mo. LIBOR + 3.50%, 0.50% Floor), 7.94%, 06/02/28 | | | | | | | 3,374 | | | | 2,804,275 | |
Fleetcor Technologies Operating Co. LLC, 2021 Term Loan B4, (1 mo. LIBOR + 1.75%), 6.13%, 04/28/28 | | | | | | | 2,044 | | | | 2,020,224 | |
Genesys Cloud Services Holdings II LLC, 2020 USD Term Loan B4, (1 mo. LIBOR + 4.00%, 0.75% Floor), 8.38%, 12/01/27 | | | | | | | 4,407 | | | | 4,222,237 | |
PUG LLC, USD Term Loan, (1 mo. LIBOR + 3.50%), 7.88%, 02/12/27 | | | | | | | 2,529 | | | | 2,082,276 | |
Sophia LP, 2020 2nd Lien Term Loan, (3 mo. LIBOR + 8.00%, 1.00% Floor),
12.73%, 10/09/28 | | | | | | | 4,215 | | | | 4,183,387 | |
TierPoint LLC, 2021 Term Loan, (1 mo. LIBOR + 3.75%, 0.75% Floor), 8.13%, 05/05/26 | | | | | | | 960 | | | | 895,378 | |
Trans Union LLC | | | | | | | | | | | | |
2019 Term Loan B5, (1 mo. LIBOR + 1.75%),
6.13%, 11/16/26 | | | | | | | 1,854 | | | | 1,825,628 | |
2021 Term Loan B6, (1 mo. LIBOR + 2.25%, 0.50% Floor), 6.63%, 12/01/28 | | | | | | | 2,405 | | | | 2,378,561 | |
| | |
| 54 | | 2 0 2 2 BLACK ROCK ANNUAL REPORT TO SHAREHOLDERS |
| | |
Schedule of Investments (continued) December 31, 2022 | | BlackRock Floating Rate Income Strategies Fund, Inc. (FRA) (Percentages shown are based on Net Assets) |
| | | | | | | | | | | | |
| Security | | | | | Par
(000) | | | Value | |
| | | |
IT Services (continued) | | | | | | | | | | | | |
Virtusa Corp., First Lien Term Loan B,
(1 mo. LIBOR + 3.75%, 0.75% Floor), 8.13%, 02/11/28 | | | USD | | | | 699 | | | $ | 673,067 | |
WEX, Inc., 2021 Term Loan, (1 mo. LIBOR + 2.25%), 6.63%, 03/31/28 | | | | | | | 973 | | | | 965,516 | |
ZoomInfo LLC, 2021 Term Loan B, (1 mo. SOFR CME + 3.00%), 7.48%, 02/02/26 | | | | | | | 218 | | | | 216,978 | |
| | | | | | | | |
| | | | | | | | | | | 30,831,200 | |
| | | |
| Leisure Products — 0.5% | | | | | | | | | |
Fender Musical Instruments Corp., 2021 Term Loan B, (3 mo. SOFRTE + 4.00%, 0.50% Floor), 8.42%, 12/01/28(b) | | | | | | | 976 | | | | 783,633 | |
MND Holdings III Corp., 2018 1st Lien Term Loan, (1 mo. LIBOR + 3.50%, 1.00% Floor), 8.23%, 06/19/24 | | | | | | | 979 | | | | 933,036 | |
Peloton Interactive, Inc., Term Loan, (2 mo. SOFR CME + 6.50%, 0.50% Floor), 11.76%, 05/25/27 | | | | | | | 344 | | | | 337,670 | |
| | | | | | | | |
| | | | | | | | | | | 2,054,339 | |
| | |
| Life Sciences Tools & Services — 2.9% | | | | | | | |
Avantor Funding, Inc., 2021 Term Loan B5, (1 mo. LIBOR + 2.25%, 0.50% Floor), 6.63%, 11/08/27 | | | | | | | 2,084 | | | | 2,071,407 | |
eResearchTechnology, Inc., 2020 1st Lien Term Loan, (1 mo. LIBOR + 4.50%, 1.00% Floor), 8.88%, 02/04/27 | | | | | | | 3,312 | | | | 2,913,058 | |
ICON Luxembourg SARL, LUX Term Loan, (3 mo. LIBOR + 2.25%, 0.50% Floor), 7.00%, 07/03/28 | | | | | | | 2,535 | | | | 2,524,996 | |
Maravai Intermediate Holdings LLC, 2022 Term Loan B, (3 mo. SOFRTE + 3.00%, 0.50% Floor), 6.96%, 10/19/27 | | | | | | | 1,491 | | | | 1,461,176 | |
Parexel International Corp., 2021 1st Lien Term Loan,
(1 mo. LIBOR + 3.25%, 0.50% Floor), 7.63%, 11/15/28 | | | | | | | 3,408 | | | | 3,276,589 | |
PRA Health Sciences, Inc., US Term Loan, (3 mo. LIBOR + 2.25%, 0.50% Floor), 7.00%, 07/03/28 | | | | | | | 632 | | | | 629,106 | |
| | | | | | | | |
| | | | | | | | | | | 12,876,332 | |
| | | |
| Machinery — 3.2% | | | | | | | | | |
Albion Acquisitions Ltd., USD Term Loan,
(3 mo. LIBOR + 5.25%, 0.50% Floor), 9.57%, 08/17/26 | | | | | | | 1,835 | | | | 1,730,701 | |
Clark Equipment Co., 2022 Term Loan B,
(3 mo. SOFR CME + 2.50%, 0.50% Floor), 7.18%, 04/20/29 | | | | | | | 303 | | | | 298,078 | |
Columbus McKinnon Corp., 2021 Term Loan B, (3 mo. LIBOR + 2.75%, 0.50% Floor), 7.50%, 05/14/28 | | | | | | | 388 | | | | 382,263 | |
Filtration Group Corp., 2021 Incremental Term Loan, (1 mo. LIBOR + 3.50%, 0.50% Floor), 7.88%, 10/21/28 | | | | | | | 1,173 | | | | 1,149,687 | |
Fluidra SA, 2022 USD Term Loan B, (1 mo. SOFR CME + 2.00%), 6.42%, 01/29/29 | | | | | | | 309 | | | | 292,741 | |
Ingersoll-Rand Services Co., 2020 USD Spinco Term Loan, (1 mo. SOFR CME + 1.75%), 6.17%, 03/01/27 | | | | | | | 2,224 | | | | 2,203,268 | |
Madison IAQ LLC, Term Loan, (3 mo. LIBOR + 3.25%, 0.50% Floor),
7.99%, 06/21/28 | | | | | | | 3,711 | | | | 3,443,915 | |
SPX Flow, Inc., 2022 Term Loan, (1 mo. SOFR CME + 4.50%, 0.50% Floor), 8.92%, 04/05/29 | | | | | | | 1,387 | | | | 1,291,950 | |
| | | | | | | | | | | | |
| Security | | | | | Par
(000) | | | Value | |
| | | |
Machinery (continued) | | | | | | | | | | | | |
Titan Acquisition Ltd., 2018 Term Loan B,
(6 mo. LIBOR + 3.00%), 8.15%, 03/28/25 | | | USD | | | | 3,874 | | | $ | 3,611,018 | |
Zurn LLC, 2021 Term Loan B, (1 mo. LIBOR + 2.00%, 0.50% Floor), 6.38%, 10/04/28 | | | | | | | 126 | | | | 125,259 | |
| | | | | | | | |
| | | | | | | | | | | 14,528,880 | |
| | | |
| Media — 11.5% | | | | | | | | | |
Altice Financing SA | | | | | | | | | | | | |
2017 USD Term Loan B, (3 mo. LIBOR + 2.75%), 6.83%, 07/15/25 | | | | | | | 1,084 | | | | 1,047,679 | |
USD 2017 1st Lien Term Loan, (3 mo. LIBOR + 2.75%), 6.83%, 01/31/26 | | | | | | | 1,555 | | | | 1,492,825 | |
Altice France SA/France, 2018 Term Loan B13, (3 mo. LIBOR + 4.00%),
8.65%, 08/14/26 | | | | | | | 3,465 | | | | 3,214,994 | |
AMC Entertainment Holdings, Inc., 2019 Term Loan B, (1 mo. LIBOR + 3.00%), 7.27%, 04/22/26 | | | | | | | 1,507 | | | | 811,444 | |
Cable One, Inc., 2021 Term Loan B4, (1 mo. LIBOR + 2.00%), 6.38%, 05/03/28 | | | | | | | 1,030 | | | | 1,003,522 | |
Charter Communications Operating LLC, Class A, 2019 Term Loan B1, (1 mo. LIBOR + 1.75%), 6.14%, 04/30/25 | | | | | | | 2,605 | | | | 2,587,590 | |
City Football Group Ltd., Term Loan, (1 mo. LIBOR + 3.00%, 0.50% Floor),
7.36%, 07/21/28 | | | | | | | 1,583 | | | | 1,476,157 | |
Clear Channel Outdoor Holdings, Inc., Term Loan B, (3 mo. LIBOR + 3.50%),
7.91%, 08/21/26 | | | | | | | 3,827 | | | | 3,478,164 | |
CMG Media Corp., 2021 Term Loan, (3 mo. LIBOR + 3.50%), 8.23%, 12/17/26 | | | | | | | — | (i) | | | 291 | |
Connect Finco SARL, 2021 Term Loan B,
(1 mo. LIBOR + 3.50%, 1.00% Floor), 7.89%, 12/11/26 | | | | | | | 6,657 | | | | 6,554,708 | |
CSC Holdings LLC | | | | | | | | | | | | |
2017 Term Loan B1, (1 mo. LIBOR + 2.25%), 6.57%, 07/17/25 | | | | | | | 1,187 | | | | 1,171,749 | |
2019 Term Loan B5, (1 mo. LIBOR + 2.50%), 6.82%, 04/15/27 | | | | | | | 837 | | | | 745,263 | |
E.W. Scripps Co., 2020 Term Loan B3,
(1 mo. LIBOR + 2.75%, 0.75% Floor), 7.13%, 01/07/28 | | | | | | | 551 | | | | 534,548 | |
Learfield Communications LLC, 2016 1st Lien Term Loan, (1 mo. LIBOR + 3.25%, 1.00% Floor), 7.64%, 12/01/23 | | | | | | | 872 | | | | 649,402 | |
Lions Gate Capital Holdings LLC, 2018 Term Loan B, (1 mo. LIBOR + 2.25%), 6.63%, 03/24/25 | | | | | | | 1,316 | | | | 1,253,212 | |
Live Nation Entertainment, Inc., Term Loan B4, (1 mo. LIBOR + 1.75%),
6.13%, 10/17/26 | | | | | | | 2,531 | | | | 2,467,405 | |
MH Sub I LLC | | | | | | | | | | | | |
2017 1st Lien Term Loan, (1 mo. LIBOR + 3.75%), 8.13%, 09/13/24 | | | | | | | 3,352 | | | | 3,251,999 | |
2020 Incremental Term Loan, (1 mo. LIBOR + 3.75%, 1.00% Floor),
8.13%, 09/13/24 | | | | | | | 1,929 | | | | 1,872,064 | |
2021 2nd Lien Term Loan, (3 mo. SOFR CME + 6.25%), 10.65%, 02/23/29 | | | | | | | 2,021 | | | | 1,801,329 | |
Nexstar Broadcasting, Inc., 2019 Term Loan B4, (1 mo. LIBOR + 2.50%),
6.88%, 09/18/26 | | | | | | | 794 | | | | 786,299 | |
Sinclair Television Group, Inc., 2022 Term Loan B4, (1 mo. SOFR CME + 3.75%), 8.17%, 04/21/29 | | | | | | | 1,813 | | | | 1,719,073 | |
UFC Holdings LLC, 2021 Term Loan B,
(3 mo. LIBOR + 2.75%, 0.75% Floor), 7.11%, 04/29/26 | | | | | | | 901 | | | | 888,130 | |
UPC Financing Partnership, 2021 USD Term Loan AX, (1 mo. LIBOR + 2.93%), 7.24%, 01/31/29 | | | | | | | 768 | | | | 748,513 | |
| | |
SCHEDULE OF INVESTMENTS | | 55 |
| | |
Schedule of Investments (continued) December 31, 2022 | | BlackRock Floating Rate Income Strategies Fund, Inc. (FRA) (Percentages shown are based on Net Assets) |
| | | | | | | | | | | | |
| Security | | | | | Par
(000) | | | Value | |
| | | |
Media (continued) | | | | | | | | | | | | |
Virgin Media Bristol LLC | | | | | | | | | | | | |
2020 USD Term Loan Q, (1 mo. LIBOR + 3.25%), 7.57%, 01/31/29 | | | USD | | | | 1,335 | | | $ | 1,320,649 | |
USD Term Loan N, (1 mo. LIBOR + 2.50%), 6.82%, 01/31/28 | | | | | | | 988 | | | | 970,220 | |
Voyage Digital Ltd., USD Term Loan B,
(3 mo. SOFRTE + 4.50%, 0.50% Floor), 8.78%, 05/11/29(b) | | | | | | | 1,013 | | | | 995,184 | |
William Morris Endeavor Entertainment LLC, 2018 1st Lien Term Loan, (3 mo. LIBOR + 2.75%), 7.14%, 05/18/25 | | | | | | | 2,726 | | | | 2,662,484 | |
WMG Acquisition Corp., 2021 Term Loan G, (1 mo. LIBOR + 2.13%), 6.51%, 01/20/28 | | | | | | | 2,123 | | | | 2,095,666 | |
Zayo Group Holdings, Inc., USD Term Loan, (1 mo. LIBOR + 3.00%), 7.38%, 03/09/27 | | | | | | | 5,045 | | | | 4,072,339 | |
| | | | | | | | |
| | | | | | | | | | | 51,672,902 | |
| | | |
| Oil, Gas & Consumable Fuels — 1.5% | | | | | | | | | |
Edgewater Generation LLC, Term Loan,
(1 mo. LIBOR + 3.75%), 8.13%, 12/13/25 | | | | | | | 914 | | | | 864,047 | |
Lealand Finance Co. BV | | | | | | | | | | | | |
2020 Make Whole Term Loan, (1 mo. LIBOR + 3.00%), 7.38%, 06/28/24 | | | | | | | 40 | | | | 25,152 | |
2020 Take Back Term Loan, (1 mo. LIBOR + 1.00%, 3.00% PIK),
5.38%, 06/30/25(f) | | | | | | | 300 | | | | 157,124 | |
M6 ETX Holdings II Midco LLC, Term Loan B, (3 mo. SOFR CME + 4.50%, 0.50% Floor), 9.16%, 09/19/29 | | | | | | | 266 | | | | 266,082 | |
Medallion Midland Acquisition LLC, 2021 Term Loan, (3 mo. SOFR CME + 3.75%, 0.75% Floor), 8.59%, 10/18/28 | | | | | | | 1,925 | | | | 1,903,368 | |
Murphy USA, Inc., Term Loan B, (1 mo. LIBOR + 1.75%, 0.50% Floor),
5.93%, 01/31/28 | | | | | | | 639 | | | | 638,439 | |
Oryx Midstream Services Permian Basin LLC, Term Loan B, (3 mo. LIBOR + 3.25%, 0.50% Floor), 7.92%, 10/05/28 | | | | | | | 3,093 | | | | 3,051,905 | |
| | | | | | | | |
| | | | | | | | | | | 6,906,117 | |
| | | |
| Personal Products — 1.4% | | | | | | | | | |
Kronos Acquisition Holdings, Inc., 2021 1st Lien Term Loan, (3 mo. SOFRTE + 6.00%, 1.00% Floor), 10.51%, 12/22/26 | | | | | | | 407 | | | | 391,631 | |
Prestige Brands, Inc., 2021 Term Loan B5, (1 mo. LIBOR + 2.00%, 0.50% Floor), 6.38%, 07/03/28 | | | | | | | 205 | | | | 203,943 | |
Sunshine Luxembourg VII SARL, 2021 Term Loan B3, (3 mo. LIBOR + 3.75%, 0.75% Floor), 8.48%, 10/01/26 | | | | | | | 6,060 | | | | 5,793,672 | |
| | | | | | | | |
| | | | | | | | | | | 6,389,246 | |
| | | |
| Pharmaceuticals — 2.4% | | | | | | | | | |
Amneal Pharmaceuticals LLC, 2018 Term Loan B, (1 mo. LIBOR + 3.50%),
8.09%, 05/04/25 | | | | | | | 1,214 | | | | 1,084,304 | |
Bausch Health Cos., Inc., 2022 Term Loan B, (1 mo. SOFR CME + 5.25%, 0.50% Floor), 9.67%, 02/01/27 | | | | | | | 1,137 | | | | 860,656 | |
Catalent Pharma Solutions, Inc., 2021 Term Loan B3, (1 mo. LIBOR + 2.00%, 0.50% Floor), 6.38%, 02/22/28 | | | | | | | 1,592 | | | | 1,563,350 | |
Elanco Animal Health, Inc., Term Loan B,
(1 mo. LIBOR + 1.75%), 5.87%, 08/01/27 | | | | | | | 1,470 | | | | 1,409,028 | |
| | | | | | | | | | | | |
| Security | | | | | Par
(000) | | | Value | |
| | | |
Pharmaceuticals (continued) | | | | | | | | | | | | |
Jazz Financing Lux SARL, USD Term Loan,
(1 mo. LIBOR + 3.50%, 0.50% Floor),
7.88%, 05/05/28 USD | | | | | | | 2,187 | | | $ | 2,164,949 | |
Option Care Health, Inc., 2021 Term Loan B, (1 mo. LIBOR + 2.75%, 0.50% Floor), 7.13%, 10/27/28 | | | | | | | 701 | | | | 694,576 | |
Organon & Co., USD Term Loan, (3 mo. LIBOR + 3.00%, 0.50% Floor),
7.75%, 06/02/28 | | | | | | | 1,542 | | | | 1,525,039 | |
Precision Medicine Group LLC, 2021 Term Loan, (3 mo. LIBOR + 3.00%, 0.75% Floor), 7.73%, 11/18/27(b) | | | | | | | 1,454 | | | | 1,345,605 | |
| | | | | | | | | | | | |
| | | |
| | | | | | | | | | | 10,647,507 | |
| | | |
| Professional Services — 1.5% | | | | | | | | | |
Dun & Bradstreet Corp. | | | | | | | | | | | | |
2022 Incremental Term Loan B2, (1 mo. SOFR CME + 3.25%), 7.57%, 01/18/29 | | | | | | | 712 | | | | 698,728 | |
Term Loan, (1 mo. LIBOR + 3.25%),
7.64%, 02/06/26 | | | | | | | 2,333 | | | | 2,307,433 | |
Element Materials Technology Group U.S. Holdings, Inc. | | | | | | | | | | | | |
2022 USD Delayed Draw Term Loan, (3 mo. SOFR CME + 4.25%, 0.50% Floor), 8.93%, 07/06/29 | | | | | | | 608 | | | | 592,902 | |
2022 USD Term Loan, (3 mo. SOFR CME + 4.25%, 0.50% Floor), 8.93%, 07/06/29 | | | | | | | 1,317 | | | | 1,284,622 | |
Galaxy U.S. Opco, Inc., Term Loan, (1 mo. SOFR CME + 4.75%, 0.50% Floor),
9.07%, 04/29/29 | | | | | | | 2,016 | | | | 1,819,440 | |
| | | | | | | | | | | | |
| | | | | | | | | | | 6,703,125 | |
| |
| Real Estate Management & Development — 1.0% | | | | |
Chariot Buyer LLC, Term Loan B, (1 mo. LIBOR + 3.25%, 0.50% Floor), 7.63%, 11/03/28 | | | | | | | 2,457 | | | | 2,311,789 | |
Cushman & Wakefield U.S. Borrower LLC, 2020 Term Loan B, (1 mo. LIBOR + 2.75%), 7.13%, 08/21/25 | | | | | | | 2,353 | | | | 2,295,014 | |
| | | | | | | | |
| | | | | | | | | | | 4,606,803 | |
| | | |
| Road & Rail — 0.4% | | | | | | | | | |
Avis Budget Car Rental LLC, 2020 Term Loan B, (1 mo. LIBOR + 1.75%), 6.14%, 08/06/27 | | | | | | | 659 | | | | 636,717 | |
SIRVA Worldwide, Inc., 2018 1st Lien Term Loan, (1 mo. LIBOR + 5.50%),
9.88%, 08/04/25 | | | | | | | 1,176 | | | | 1,048,326 | |
| | | | | | | | |
| | | | | | | | | | | 1,685,043 | |
| |
| Semiconductors & Semiconductor Equipment — 0.4% | | | | |
MKS Instruments, Inc., 2022 USD Term Loan B, 08/17/29(h) | | | | | | | 1,157 | | | | 1,141,190 | |
Synaptics, Inc., Term Loan B, (6 mo. LIBOR + 2.25%, 0.50% Floor), 7.40%, 12/02/28 | | | | | | | 626 | | | | 611,988 | |
| | | | | | | | |
| | | | | | | | | | | 1,753,178 | |
| | | |
| Software — 12.5% | | | | | | | | | |
Applied Systems, Inc., 2022 Extended 1st Lien Term Loan, (3 mo. SOFR CME + 4.50%, 0.50% Floor), 9.08%, 09/18/26 | | | | | | | 734 | | | | 729,315 | |
Barracuda Networks, Inc., 2022 Term Loan,
(3 mo. SOFR CME + 4.50%, 0.50% Floor), 8.59%, 08/15/29 | | | | | | | 766 | | | | 737,382 | |
Central Parent, Inc., 2022 USD Term Loan B, (3 mo. SOFR CME + 4.50%, 0.50% Floor), 9.08%, 07/06/29 | | | | | | | 733 | | | | 725,501 | |
Cloudera, Inc. | | | | | | | | | | | | |
2021 Second Lien Term Loan, (1 mo. LIBOR + 6.00%, 0.50% Floor),
10.38%, 10/08/29 | | | | | | | 780 | | | | 648,703 | |
| | |
| 56 | | 2 0 2 2 BLACK ROCK ANNUAL REPORT TO SHAREHOLDERS |
| | |
Schedule of Investments (continued) December 31, 2022 | | BlackRock Floating Rate Income Strategies Fund, Inc. (FRA) (Percentages shown are based on Net Assets) |
| | | | | | | | | | | | |
| Security | | | | | Par
(000) | | | Value | |
| | | |
Software (continued) | | | | | | | | | | | | |
Cloudera, Inc. (continued) | | | | | | | | | | | | |
2021 Term Loan, (1 mo. LIBOR + 3.75%, 0.50% Floor), 8.13%, 10/08/28 | | | USD | | | | 1,442 | | | $ | 1,353,123 | |
Cornerstone OnDemand, Inc., 2021 Term Loan, (1 mo. LIBOR + 3.75%, 0.50% Floor), 8.13%, 10/16/28 | | | | | | | 1,196 | | | | 1,064,407 | |
Digicel International Finance Ltd., 2017 Term Loan B, (1 mo. LIBOR + 3.25%),
7.63%, 05/28/24 | | | | | | | 1,028 | | | | 861,857 | |
E2open LLC, 2020 Term Loan B, (1 mo. LIBOR + 3.50%, 0.50% Floor),
7.68%, 02/04/28 | | | | | | | 284 | | | | 278,886 | |
Epicor Software Corp., 2020 2nd Lien Term Loan, (1 mo. LIBOR + 7.75%, 1.00% Floor), 12.13%, 07/31/28 | | | | | | | 2,141 | | | | 2,105,674 | |
Helios Software Holdings, Inc., 2021 USD Term Loan B, (3 mo. SOFR CME + 3.75%), 8.48%, 03/11/28 | | | | | | | 1,394 | | | | 1,364,543 | |
Informatica LLC, 2021 USD Term Loan B,
(1 mo. LIBOR + 2.75%), 7.19%, 10/27/28 | | | | | | | 3,839 | | | | 3,758,510 | |
Instructure Holdings, Inc., 2021 Term Loan B, (3 mo. LIBOR + 2.75%, 0.50% Floor), 6.12%, 10/30/28(b) | | | | | | | 729 | | | | 714,898 | |
IPS Corp. | | | | | | | | | | | | |
2021 2nd Lien Term Loan B, (1 mo. LIBOR + 3.50%, 0.50% Floor),
11.38%, 10/01/29(b) | | | | | | | 1,046 | | | | 878,640 | |
2021 Term Loan, (1 mo. LIBOR + 3.50%, 0.50% Floor), 7.88%, 10/02/28 | | | | | | | 596 | | | | 529,858 | |
Magenta Buyer LLC | | | | | | | | | | | | |
2021 USD 1st Lien Term Loan, (3 mo. LIBOR + 4.75%, 0.75% Floor),
9.17%, 07/27/28 | | | | | | | 2,420 | | | | 2,060,248 | |
2021 USD 2nd Lien Term Loan, (3 mo. LIBOR + 8.25%, 0.75% Floor),
12.67%, 07/27/29 | | | | | | | 2,204 | | | | 1,726,228 | |
McAfee Corp., 2022 USD Term Loan B,
(1 mo. SOFR CME + 3.75%),
7.97%, 03/01/29 | | | | | | | 3,476 | | | | 3,226,652 | |
Planview Parent, Inc. | | | | | | | | | | | | |
2nd Lien Term Loan, (3 mo. LIBOR + 7.25%, 0.75% Floor), 11.98%, 12/18/28 | | | | | | | 930 | | | | 823,050 | |
Term Loan, (3 mo. LIBOR + 4.00%, 0.75% Floor), 8.73%, 12/17/27 | | | | | | | 1,055 | | | | 976,571 | |
Proofpoint, Inc. | | | | | | | | | | | | |
1st Lien Term Loan, (3 mo. LIBOR + 3.25%, 0.50% Floor), 7.98%, 08/31/28 | | | | | | | 2,803 | | | | 2,689,087 | |
2nd Lien Term Loan, (3 mo. LIBOR + 6.25%, 0.50% Floor), 10.98%, 08/31/29 | | | | | | | 1,451 | | | | 1,388,128 | |
RealPage, Inc. | | | | | | | | | | | | |
1st Lien Term Loan, (1 mo. LIBOR + 3.00%, 0.50% Floor), 7.38%, 04/24/28 | | | | | | | 6,224 | | | | 5,906,827 | |
2nd Lien Term Loan, (1 mo. LIBOR + 6.50%, 0.75% Floor), 10.88%, 04/23/29 | | | | | | | 2,965 | | | | 2,839,133 | |
Renaissance Holding Corp., 2018 1st Lien Term Loan, (1 mo. LIBOR + 3.25%), 7.63%, 05/30/25 | | | | | | | 673 | | | | 640,602 | |
Severin Acquisition LLC, 2018 Term Loan B, (3 mo. SOFR CME + 3.00%),
7.09%, 08/01/25 | | | | | | | 2,769 | | | | 2,745,201 | |
Sophia LP, 2021 Term Loan B, (3 mo. LIBOR + 3.50%, 0.50% Floor), 8.23%, 10/07/27 | | | | | | | 2,304 | | | | 2,218,857 | |
Tempo Acquisition LLC, 2022 Term Loan B,
(1 mo. SOFR CME + 3.00%),
7.32%, 08/31/28 | | | | | | | 4,804 | | | | 4,784,406 | |
| | | | | | | | | | | | |
| Security | | | | | Par
(000) | | | Value | |
| | | |
Software (continued) | | | | | | | | | | | | |
TIBCO Software, Inc., 2022 USD Term Loan, (3 mo. SOFR CME + 4.50%, 0.50% Floor), 9.18%, 03/30/29 | | | USD | | | | 3,841 | | | $ | 3,423,291 | |
Ultimate Software Group, Inc. | | | | | | | | | | | | |
2021 2nd Lien Term Loan, (1 mo. LIBOR + 5.25%, 0.50% Floor), 9.00%, 05/03/27 | | | | | | | 1,402 | | | | 1,283,564 | |
2021 Term Loan, (3 mo. LIBOR + 3.25%, 0.50% Floor), 7.00%, 05/04/26 | | | | | | | 1,271 | | | | 1,206,991 | |
Term Loan B, (1 mo. LIBOR + 3.75%), 8.13%, 05/04/26 | | | | | | | 2,621 | | | | 2,522,987 | |
| | | | | | | | |
| | | | | | | | | | | 56,213,120 | |
| | | |
| Specialty Retail — 4.2% | | | | | | | | | |
Belron Finance U.S. LLC | | | | | | | | | | | | |
2018 Term Loan B, (3 mo. LIBOR + 2.25%), 6.94%, 11/13/25 | | | | | | | 435 | | | | 432,162 | |
2019 USD Term Loan B3, (3 mo. LIBOR + 2.25%), 6.69%, 10/30/26 | | | | | | | 866 | | | | 860,796 | |
2021 USD Term Loan B, (3 mo. LIBOR + 2.50%, 0.50% Floor), 7.06%, 04/13/28 | | | | | | | 2,997 | | | | 2,962,690 | |
CD&R Firefly Bidco Ltd., 2018 GBP Term Loan B1, (1 day SONIA + 4.25%),
6.54%, 06/23/25 | | | GBP | | | | 1,000 | | | | 1,102,828 | |
EG Group Ltd., 2021 Term Loan, (3 mo. LIBOR + 4.25%, 0.50% Floor),
8.98%, 03/31/26 | | | USD | | | | 567 | | | | 529,055 | |
Fanatics Commerce Intermediate Holdco LLC, Term Loan B, (1 mo. LIBOR + 3.25%, 0.50% Floor), 7.63%, 11/24/28(b) | | | | | | | 681 | | | | 667,498 | |
Mavis Tire Express Services Corp., 2021 Term Loan B, (1 mo. SOFR CME + 4.00%, 0.75% Floor), 8.50%, 05/04/28 | | | | | | | 2,995 | | | | 2,851,088 | |
MED ParentCo LP, 1st Lien Term Loan,
(1 mo. LIBOR + 4.25%), 8.63%, 08/31/26 | | | | | | | 1,702 | | | | 1,445,507 | |
Midas Intermediate Holdco II LLC, (1 mo. SOFR CME + 8.35%, 0.75% Floor), 12.67%, 06/30/27 | | | | | | | 1,720 | | | | 1,495,233 | |
PetSmart, Inc., 2021 Term Loan B, (1 mo. LIBOR + 3.75%, 0.75% Floor),
8.13%, 02/11/28 | | | | | | | 3,682 | | | | 3,595,870 | |
Restoration Hardware, Inc., 2022 Incremental Term Loan, (1 mo. SOFR CME + 3.25%, 0.50% Floor), 7.67%, 10/20/28 | | | | | | | 866 | | | | 807,655 | |
Reverb Buyer, Inc., 2021 1st Lien Term Loan, (1 mo. LIBOR + 3.50%, 0.50% Floor), 7.88%, 11/01/28 | | | | | | | 1,407 | | | | 1,315,435 | |
Woof Holdings, Inc. | | | | | | | | | | | | |
1st Lien Term Loan, (1 mo. LIBOR + 3.75%, 0.75% Floor), 8.10%, 12/21/27 | | | | | | | 545 | | | | 511,660 | |
2nd Lien Term Loan, (1 mo. LIBOR + 7.25%, 0.75% Floor), 11.60%, 12/21/28 | | | | | | | 560 | | | | 504,000 | |
| | | | | | | | |
| | | | | | | | | | | 19,081,477 | |
|
| Technology Hardware, Storage & Peripherals — 0.1% | |
Electronics for Imaging, Inc., Term Loan,
(1 mo. LIBOR + 5.00%), 9.38%, 07/23/26 | | | | | | | 803 | | | | 532,369 | |
| | | | | | | | |
| | | |
Textiles, Apparel & Luxury Goods — 0.3% | | | | | | | | | | | | |
Crocs, Inc., Term Loan B, (3 mo. SOFRTE + 3.50%, 0.50% Floor), 7.80%, 02/20/29 | | | | | | | 1,374 | | | | 1,344,446 | |
| | | | | | | | |
| | |
SCHEDULE OF INVESTMENTS | | 57 |
| | |
Schedule of Investments (continued) December 31, 2022 | | BlackRock Floating Rate Income Strategies Fund, Inc. (FRA) (Percentages shown are based on Net Assets) |
| | | | | | | | | | | | |
| Security | | | | | Par (000) | | | Value | |
| |
| |
Trading Companies & Distributors — 0.7% | | | | | |
Beacon Roofing Supply, Inc., 2021 Term Loan B, (1 mo. LIBOR + 2.25%), 6.63%, 05/19/28 | | | USD | | | | 1,375 | | | $ | 1,360,865 | |
ION Trading Finance Ltd., 2021 USD Term Loan, (3 mo. LIBOR + 4.75%), 9.48%, 04/03/28 | | | | | | | 674 | | | | 637,163 | |
SRS Distribution, Inc., 2022 Incremental Term Loan, (1 mo. SOFR CME + 3.50%), 7.92%, 06/02/28 | | | | | | | 989 | | | | 943,918 | |
| | | | | | | | |
| | | | | | | | | | | 2,941,946 | |
| |
| Wireless Telecommunication Services — 1.0% | | | | |
GOGO Intermediate Holdings LLC, Term Loan B, (3 mo. LIBOR + 3.75%, 0.75% Floor), 8.16%, 04/30/28 | | | | | | | 1,093 | | | | 1,082,657 | |
SBA Senior Finance II LLC, 2018 Term Loan B, (1 mo. LIBOR + 1.75%), 6.14%, 04/11/25 | | | | | | | 3,343 | | | | 3,327,812 | |
| | | | | | | | |
| | | | | | | | | | | 4,410,469 | |
| | | | | | | | |
| |
Total Floating Rate Loan Interests — 127.7%
(Cost: $606,949,250) | | | | 576,252,448 | |
| | | | | | | | |
| | | |
| | | | | | Shares | | | | |
| | | |
Investment Companies | | | | | | | | | | | | |
| | | |
Fixed Income Funds — 0.5% | | | | | | | | | | | | |
Invesco Senior Loan ETF | | | | | | | 64,300 | | | | 1,320,079 | |
iShares iBoxx High Yield Corporate Bond ETF(j) | | | | | | | 10,000 | | | | 736,300 | |
| | | | | | | | |
| | | |
| | | | | | | | | | | 2,056,379 | |
| | | | | | | | |
| | |
Total Investment Companies — 0.5%
(Cost: $2,126,126) | | | | | | | | 2,056,379 | |
| | | | | | | | |
| | | |
| | | | | | Benefical Interest (000) | | | | |
| | | |
Other Interests | | | | | | | | | | | | |
| | | |
IT Services(b)(k) — 0.0% | | | | | | | | | | | | |
Millennium Corp. Claim | | | USD | | | | 1,508 | | | | — | |
Millennium Lender Claim Trust | | | | | | | 1,607 | | | | — | |
| | | | | | | | |
| | | |
Total Other Interests — 0.0%
(Cost: $ —) | | | | | | | | | | | — | |
| | | | | | | | |
| | | | | | | | | | | | |
| Security | | | | | Shares | | | Value | |
| |
| |
Warrants | | | | | |
| |
Consumer Discretionary — 0.0% | | | | | |
Service King (Carnelian Point),
(Expires 06/30/27, Strike Price
USD 10.00)(a) | | | | | | | 1,895 | | | $ | — | |
| | | | | | | | | | | | |
| | | |
Oil, Gas & Consumable Fuels — 0.0% | | | | | | | | | | | | |
California Resources Corp., (Issued/Exercisable 11/03/20, 1 Share for 1 Warrant, Expires 10/27/24, Strike Price USD 36.00)(a) | | | | | | | 999 | | | | 12,587 | |
| | | | | | | | | | | | |
| | | |
Total Warrants — 0.0%
(Cost: $ — ) | | | | | | | | | | | 12,587 | |
| | | | | | | | | | | | |
| | | |
Total Investments — 130.5%
(Cost: $626,045,868) | | | | | | | | | | | 588,749,586 | |
| |
Liabilities in Excess of Other Assets — (30.5)% | | | | (137,562,068 | ) |
| | | | | | | | | | | | |
| |
Net Assets — 100.0% | | | $ | 451,187,518 | |
| | | | | | | | |
| (a) | Non-income producing security. |
| (b) | Security is valued using significant unobservable inputs and is classified as Level 3 in the fair value hierarchy. |
| (c) | Restricted security as to resale, excluding 144A securities. The Fund held restricted securities with a current value of $1,342, representing less than 0.05% of its net assets as of period end, and an original cost of $214,007. |
| (d) | Security exempt from registration pursuant to Rule 144A under the Securities Act of 1933, as amended. These securities may be resold in transactions exempt from registration to qualified institutional investors. |
| (e) | Issuer filed for bankruptcy and/or is in default. |
| (f) | Payment-in-kind security which may pay interest/dividends in additional par/shares and/or in cash. Rates shown are the current rate and possible payment rates. |
| (g) | Variable rate security. Interest rate resets periodically. The rate shown is the effective interest rate as of period end. Security description also includes the reference rate and spread if published and available. |
| (h) | Represents an unsettled loan commitment at period end. Certain details associated with this purchase are not known prior to the settlement date, including coupon rate. |
| (i) | Rounds to less than 1,000. |
| (j) | Affiliate of the Fund. |
| (k) | Other interests represent beneficial interests in liquidation trusts and other reorganization or private entities. |
For Fund compliance purposes, the Fund’s industry classifications refer to one or more of the industry sub-classifications used by one or more widely recognized market indexes or rating group indexes, and/or as defined by the investment adviser. These definitions may not apply for purposes of this report, which may combine such industry sub-classifications for reporting ease.
Affiliates
Investments in issuers considered to be affiliate(s) of the Fund during the year ended December 31, 2022 for purposes of Section 2(a)(3) of the Investment Company Act of 1940, as amended, were as follows:
| | | | | | | | | | | | | | | | | | | | | | | | | | | | | | | | | | | | |
| | | | | | | | | | |
| Affiliated Issuer | | Value at
12/31/21 | | | Purchases
at Cost | | | Proceeds
from Sales | | | Net Realized
Gain (Loss) | | | Change in
Unrealized
Appreciation (Depreciation) | | | Value at
12/31/22 | | | Shares
Held at
12/31/22 | | | Income | | | Capital Gain
Distributions
from
Underlying
Funds | |
| | | | | | | | | |
BlackRock Liquidity Funds, T-Fund, Institutional Class(a) | | $ | — | | | $ | 76,596,610 | | | $ | (76,596,610 | ) | | $ | — | | | $ | — | | | $ | — | | | | — | | | $ | 9,089 | | | $ | — | |
iShares iBoxx $ High Yield Corporate Bond ETF | | | — | | | | 719,537 | | | | — | | | | — | | | | 16,763 | | | | 736,300 | | | | 10,000 | | | | 7,156 | | | | — | |
| | | | | | | | | | | | | | | | | | | | | | | | | | | | | | | | | | | | |
| | | | | | | | | |
| | | | | | | | | | | | | | $ | — | | | $ | 16,763 | | | $ | 736,300 | | | | | | | $ | 16,245 | | | $ | — | |
| | | | | | | | | | | | | | | | | | | | | | | | | | | | | | | | | | | | |
| | (a) | As of period end, the entity is no longer held. | |
| | |
| 58 | | 2 0 2 2 BLACK ROCK ANNUAL REPORT TO SHAREHOLDERS |
| | |
Schedule of Investments (continued) December 31, 2022 | | BlackRock Floating Rate Income Strategies Fund, Inc. (FRA) |
Derivative Financial Instruments Outstanding as of Period End
Forward Foreign Currency Exchange Contracts
| | | | | | | | | | | | | | | | | | | | | | | | | | | | | | |
| | | | | | | |
| Currency Purchased | | | | | | Currency Sold | | | Counterparty | | Settlement Date | | | | | | Unrealized
Appreciation (Depreciation) | |
| | | | | | | | |
| USD | | | 2,099,701 | | | | | | | | GBP | | | | 1,717,000 | | | Westpac Banking Corp. | | | 03/15/23 | | | | | | | $ | 20,322 | |
| USD | | | 749,471 | | | | | | | | EUR | | | | 700,000 | | | Bank of America N.A. | | | 03/15/23 | | | | | | | | (3,437 | ) |
| | | | | | | | | | | | | | | | | | | | | | | | | | | | | | |
| | | | | | | | |
| | | | | | | | | | | | | | | | | | | | | | | | | | | | $ | 16,885 | |
| | | | | | | | | | | | | | | | | | | | | | | | | | | | | | |
Centrally Cleared Credit Default Swaps — Sell Protection
| | | | | | | | | | | | | | | | | | | | | | | | | | | | | | |
| | | | | | | | | |
| Reference Obligation/Index | | Financing
Rate Received
by the Fund | | | Payment
Frequency | | | Termination
Date | | | Credit
Rating(a) | | Notional
Amount (000)(b) | | | Value | | | Upfront
Premium
Paid
(Received) | | | Unrealized
Appreciation
(Depreciation) | |
| | | | | | | | |
CDX.NA.HY.38.V2 | | | 5.00 | % | | | Quarterly | | | | 06/20/27 | | | B | | USD | 4,544 | | | $ | 102,746 | | | $ | 32,238 | | | $ | 70,508 | |
| | | | | | | | | | | | | | | | | | | | | | | | | | | | | | |
| | (a) | Using the rating of the issuer or the underlying securities of the index, as applicable, provided by S&P Global Ratings. | |
| | (b) | The maximum potential amount the Fund may pay should a negative credit event take place as defined under the terms of the agreement. | |
Balances Reported in the Statements of Assets and Liabilities for Centrally Cleared Swaps
| | | | | | | | | | | | | | | | |
| | | | | |
| Description | | Swap
Premiums
Paid | | | Swap
Premiums
Received | | | Unrealized
Appreciation | | | Unrealized
Depreciation | |
| | | | |
Centrally Cleared Swaps(a) | | $ | 32,238 | | | $ | — | | | $ | 70,508 | | | $ | — | |
| | (a) | Includes cumulative appreciation (depreciation) on centrally cleared swaps, as reported in the Schedule of Investments. Only current day’s variation margin is reported within the Statements of Assets and Liabilities and is net of any previously paid (received) swap premium amounts. | |
Derivative Financial Instruments Categorized by Risk Exposure
As of period end, the fair values of derivative financial instruments located in the Statements of Assets and Liabilities were as follows:
| | | | | | | | | | | | | | | | | | | | | | | | | | | | |
| | | | | | | | |
| | | Commodity
Contracts | | | Credit
Contracts | | | Equity
Contracts | | | Foreign
Currency
Exchange
Contracts | | | Interest
Rate
Contracts | | | Other
Contracts | | | Total | |
| | | | | | | |
Assets — Derivative Financial Instruments | | | | | | | | | | | | | | | | | | | | | | | | | | | | |
Forward foreign currency exchange contracts | | | | | | | | | | | | | | | | | | | | | | | | | | | | |
Unrealized appreciation on forward foreign currency exchange contracts | | $ | — | | | $ | — | | | $ | — | | | $ | 20,322 | | | $ | — | | | $ | — | | | $ | 20,322 | |
Swaps — centrally cleared | | | | | | | | | | | | | | | | | | | | | | | | | | | | |
Unrealized appreciation on centrally cleared swaps(a) | | | — | | | | 70,508 | | | | — | | | | — | | | | — | | | | — | | | | 70,508 | |
| | | | | | | | | | | | | | | | | | | | | | | | | | | | |
| | | | | | | |
| | $ | — | | | $ | 70,508 | | | $ | — | | | $ | 20,322 | | | $ | — | | | $ | — | | | $ | 90,830 | |
| | | | | | | | | | | | | | | | | | | | | | | | | | | | |
Liabilities — Derivative Financial Instruments | | | | | | | | | | | | | | | | | | | | | | | | | | | | |
Forward foreign currency exchange contracts | | | | | | | | | | | | | | | | | | | | | | | | | | | | |
Unrealized depreciation on forward foreign currency exchange contracts | | $ | — | | | $ | — | | | $ | — | | | $ | 3,437 | | | $ | — | | | $ | — | | | $ | 3,437 | |
| | | | | | | | | | | | | | | | | | | | | | | | | | | | |
| | (a) | Net cumulative unrealized appreciation (depreciation) on futures contracts and centrally cleared swaps, if any, are reported in the Schedule of Investments. In the Statements of Assets and Liabilities, only current day’s variation margin is reported in receivables or payables and the net cumulative unrealized appreciation (depreciation) is included in accumulated earnings (loss). | |
| | |
SCHEDULE OF INVESTMENTS | | 59 |
| | |
Schedule of Investments (continued) December 31, 2022 | | BlackRock Floating Rate Income Strategies Fund, Inc. (FRA) |
For the period ended December 31, 2022, the effect of derivative financial instruments in the Statements of Operations was as follows:
| | | | | | | | | | | | | | | | | | | | | | | | | | | | |
| | | | | | | | |
| | | Commodity
Contracts | | | Credit
Contracts | | | Equity
Contracts | | | Foreign
Currency
Exchange
Contracts | | | Interest
Rate
Contracts | | | Other
Contracts | | | Total | |
| | | | | | | |
Net Realized Gain (Loss) from: | | | | | | | | | | | | | | | | | | | | | | | | | | | | |
Forward foreign currency exchange contracts | | $ | — | | | $ | — | | | $ | — | | | $ | 312,043 | | | $ | — | | | $ | — | | | $ | 312,043 | |
Swaps | | | — | | | | 14,580 | | | | — | | | | — | | | | — | | | | — | | | | 14,580 | |
| | | | | | | | | | | | | | | | | | | | | | | | | | | | |
| | | | | | | |
| | $ | — | | | $ | 14,580 | | | $ | — | | | $ | 312,043 | | | $ | — | | | $ | — | | | $ | 326,623 | |
| | | | | | | | | | | | | | | | | | | | | | | | | | | | |
Net Change in Unrealized Appreciation (Depreciation) on: | | | | | | | | | | | | | | | | | | | | | | | | | | | | |
Forward foreign currency exchange contracts | | $ | — | | | $ | — | | | $ | — | | | $ | 91,334 | | | $ | — | | | $ | — | | | $ | 91,334 | |
Swaps | | | — | | | | (39,474 | ) | | | — | | | | — | | | | — | | | | — | | | | (39,474 | ) |
| | | | | | | | | | | | | | | | | | | | | | | | | | | | |
| | | | | | | |
| | $ | — | | | $ | (39,474 | ) | | $ | — | | | $ | 91,334 | | | $ | — | | | $ | — | | | $ | 51,860 | |
| | | | | | | | | | | | | | | | | | | | | | | | | | | | |
Average Quarterly Balances of Outstanding Derivative Financial Instruments
| | | | |
| | |
Forward foreign currency exchange contracts: | | | | |
Average amounts purchased — in USD | | $ | 3,556,298 | |
Average amounts sold — in USD | | $ | 287,741 | |
Credit default swaps: | | | | |
Average notional value — sell protection | | $ | 6,444,050 | |
For more information about the Fund’s investment risks regarding derivative financial instruments, refer to the Notes to Financial Statements.
Derivative Financial Instruments — Offsetting as of Period End
The Fund’s derivative assets and liabilities (by type) were as follows:
| | | | | | | | |
| | | |
| | | Assets | | | Liabilities | |
| | |
Derivative Financial Instruments | | | | | | | | |
Forward foreign currency exchange contracts | | $ | 20,322 | | | $ | 3,437 | |
Swaps — centrally cleared | | | 14 | | | | — | |
| | | | | | | | |
| | |
Total derivative assets and liabilities in the Statements of Assets and Liabilities | | | 20,336 | | | | 3,437 | |
| | | | | | | | |
| | |
Derivatives not subject to a Master Netting Agreement or similar agreement (“MNA”) | | | (14 | ) | | | — | |
| | | | | | | | |
| | |
Total derivative assets and liabilities subject to an MNA | | $ | 20,322 | | | $ | 3,437 | |
| | | | | | | | |
The following table presents the Fund’s derivative assets and liabilities by counterparty net of amounts available for offset under an MNA and net of the related collateral received (and pledged) by the Fund:
| | | | | | | | | | | | | | | | | | | | | | | | |
| | | | | | |
| Counterparty | | Derivative
Assets
Subject to
an MNA by
Counterparty | | | Derivatives
Available
for Offset | | | Non-Cash
Collateral
Received | | | Cash
Collateral
Received | | | Net Amount
of Derivative
Assets(a)(b) | |
| | | | | | |
Westpac Banking Corp. | | $ | 20,322 | | | $ | — | | | $ | — | | | $ | — | | | $ | 20,322 | | | | | |
| | | | | | | | | | | | | | | | | | | | | | | | |
| | | | | | | | | | | | | | | | | | | | | | | | |
| | | | | | |
| Counterparty | | Derivative
Liabilities
Subject to
an MNA by
Counterparty | | | Derivatives
Available
for Offset | | | Non-Cash
Collateral
Pledged | | | Cash
Collateral
Pledged | | | Net Amount
of Derivative
Liabilities(a)(c) | |
| | | | | | |
Bank of America N.A. | | $ | 3,437 | | | $ | — | | | $ | — | | | $ | — | | | $ | 3,437 | | | | | |
| | | | | | | | | | | | | | | | | | | | | | | | |
| | (a) | Net amount may also include forward foreign currency exchange contracts that are not required to be collateralized. | |
| | (b) | Net amount represents the net amount receivable from the counterparty in the event of default. | |
| | (c) | Net amount represents the net amount payable due to counterparty in the event of default. | |
| | |
| 60 | | 2 0 2 2 BLACK ROCK ANNUAL REPORT TO SHAREHOLDERS |
| | |
Schedule of Investments (continued) December 31, 2022 | | BlackRock Floating Rate Income Strategies Fund, Inc. (FRA) |
Fair Value Hierarchy as of Period End
Various inputs are used in determining the fair value of financial instruments. For a description of the input levels and information about the Fund’s policy regarding valuation of financial instruments, refer to the Notes to Financial Statements.
The following table summarizes the Fund’s financial instruments categorized in the fair value hierarchy. The breakdown of the Fund’s financial instruments into major categories is disclosed in the Schedule of Investments above.
| | | | | | | | | | | | | | | | |
| |
| | | | |
| | | Level 1 | | | Level 2 | | | Level 3 | | | Total | |
| �� |
Assets | | | | | | | | | | | | | | | | |
Investments | | | | | | | | | | | | | | | | |
Long-Term Investments | | | | | | | | | | | | | | | | |
Common Stocks | | | | | | | | | | | | | | | | |
Construction & Engineering | | $ | 39,659 | | | $ | — | | | $ | — | | | $ | 39,659 | |
Diversified Financial Services | | | — | | | | — | | | | 3,098 | | | | 3,098 | |
Electrical Equipment | | | 33,536 | | | | — | | | | — | | | | 33,536 | |
Metals & Mining | | | — | | | | — | | | | 1,342 | | | | 1,342 | |
Semiconductors & Semiconductor Equipment | | | 3,726 | | | | — | | | | — | | | | 3,726 | |
Software | | | 13 | | | | — | | | | — | | | | 13 | |
Specialty Retail | | | — | | | | 548,437 | | | | — | | | | 548,437 | |
Corporate Bonds | | | — | | | | 9,798,361 | | | | — | | | | 9,798,361 | |
Floating Rate Loan Interests | | | — | | | | 564,122,997 | | | | 12,129,451 | | | | 576,252,448 | |
Investment Companies | | | 2,056,379 | | | | — | | | | — | | | | 2,056,379 | |
Other Interests | | | — | | | | — | | | | — | | | | — | |
Warrants | | | 12,587 | | | | — | | | | — | | | | 12,587 | |
Liabilities | | | | | | | | | | | | | | | | |
Unfunded Floating Rate Loan Interests(a) | | | — | | | | (48,486 | ) | | | — | | | | (48,486 | ) |
| | | | | | | | | | | | | | | | |
| | | | |
| | $ | 2,145,900 | | | $ | 574,421,309 | | | $ | 12,133,891 | | | $ | 588,701,100 | |
| | | | | | | | | | | | | | | | |
Derivative Financial Instruments(b) | | | | | | | | | | | | | | | | |
Assets | | | | | | | | | | | | | | | | |
Credit Contracts | | $ | — | | | $ | 70,508 | | | $ | — | | | $ | 70,508 | |
Foreign Currency Exchange Contracts | | | — | | | | 20,322 | | | | — | | | | 20,322 | |
Liabilities | | | | | | | | | | | | | | | | |
Foreign Currency Exchange Contracts | | | — | | | | (3,437 | ) | | | — | | | | (3,437 | ) |
| | | | | | | | | | | | | | | | |
| | | | |
| | $ | — | | | $ | 87,393 | | | $ | — | | | $ | 87,393 | |
| | | | | | | | | | | | | | | | |
| | (a) | Unfunded floating rate loan interests are valued at the unrealized appreciation (depreciation) on the commitment. | |
| | (b) | Derivative financial instruments are swaps and forward foreign currency exchange contracts. Swaps and forward foreign currency exchange contracts are valued at the unrealized appreciation (depreciation) on the instrument. | |
The Fund may hold assets and/or liabilities in which the fair value approximates the carrying amount for financial statement purposes. As of period end, bank borrowings payable of $147,000,000 are categorized as Level 2 within the fair value hierarchy.
A reconciliation of Level 3 financial instruments is presented when the Fund had a significant amount of Level 3 investments and derivative financial instruments at the beginning and/or end of the year in relation to net assets. The following table is a reconciliation of Level 3 investments for which significant unobservable inputs were used in determining fair value:
| | | | | | | | | | | | | | | | | | | | | | | | |
| |
| | | | | | |
| | | Common
Stocks | | | Corporate Bonds | | | Floating
Rate Loan
Interests | | | Other Interests | | | Unfunded
Floating
Rate
Loan
Interests | | | Total | |
| |
| | | | | | |
Assets | | | | | | | | | | | | | | | | | | | | | | | | |
Opening balance, as of December 31, 2021 | | $ | 3,891 | | | | $ — | (a) | | $ | 27,319,074 | | | | $ — | (a) | | | $ (589 | ) | | $ | 27,322,376 | |
Transfers into Level 3(b) | | | — | | | | — | | | | 8,539,037 | | | | — | | | | — | | | | 8,539,037 | |
Transfers out of Level 3(c) | | | — | | | | — | | | | (12,534,605 | ) | | | — | | | | 589 | | | | (12,534,016 | ) |
Accrued discounts/premiums | | | — | | | | — | | | | 23,465 | | | | — | | | | — | | | | 23,465 | |
Net realized gain (loss) | | | — | | | | — | | | | 57,705 | | | | — | | | | — | | | | 57,705 | |
Net change in unrealized appreciation (depreciation)(d)(e) | | | 549 | | | | — | | | | (827,372 | ) | | | — | | | | — | | | | (826,823 | ) |
| | |
SCHEDULE OF INVESTMENTS | | 61 |
| | |
Schedule of Investments (continued) December 31, 2022 | | BlackRock Floating Rate Income Strategies Fund, Inc. (FRA) |
| | | | | | | | | | | | | | | | | | | | | | | | |
| |
| | | | | | |
| | | Common
Stocks | | | Corporate Bonds | | | Floating Rate Loan
Interests | | | Other Interests | | | Unfunded
Floating
Rate
Loan
Interests | | | Total | |
| |
| | | | | | |
Purchases | | $ | — | | | $ | — | | | $ | 1,204,048 | | | $ | — | | | $ | — | | | $ | 1,204,048 | |
Sales | | | — | | | | — | | | | (11,651,901 | ) | | | — | | | | — | | | | (11,651,901 | ) |
| | | | | | | | | | | | | | | | | | | | | | | | |
| | | | | | |
Closing balance, as of December 31, 2022 | | $ | 4,440 | | | $ | — | (a) | | $ | 12,129,451 | | | $ | — | (a) | | $ | — | | | $ | 12,133,891 | |
| | | | | | | | | | | | | | | | | | | | | | | | |
| | | | | | |
Net change in unrealized appreciation (depreciation) on investments still held at December 31, 2022(e) | | $ | 549 | | | $ | — | | | $ | (701,462 | ) | | $ | — | | | $ | — | | | $ | (700,913 | ) |
| | | | | | | | | | | | | | | | | | | | | | | | |
| | (a) | Rounds to less than $1. | |
| | (b) | As of December 31, 2021, the Fund used observable inputs in determining the value of certain investments. As of December 31, 2022, the Fund used significant unobservable inputs in determining the value of the same investments. As a result, investments at beginning of period value were transferred from Level 2 to Level 3 in the disclosure hierarchy. | |
| | (c) | As of December 31, 2021, the Fund used significant unobservable inputs in determining the value of certain investments. As of December 31, 2022, the Fund used observable inputs in determining the value of the same investments. As a result, investments at beginning of period value were transferred from Level 3 to Level 2 in the disclosure hierarchy. | |
| | (d) | Included in the related net change in unrealized appreciation (depreciation) in the Statements of Operations. | |
| | (e) | Any difference between net change in unrealized appreciation (depreciation) and net change in unrealized appreciation (depreciation) on investments still held at December 31, 2022 is generally due to investments no longer held or categorized as Level 3 at period end. | |
The Fund’s financial instruments that are categorized as Level 3 were valued utilizing third-party pricing information without adjustment. Such valuations are based on unobservable inputs. A significant change in third-party information could result in a significantly lower or higher value of such Level 3 financial instruments.
See notes to financial statements.
| | |
| 62 | | 2 0 2 2 BLACK ROCK ANNUAL REPORT TO SHAREHOLDERS |
| | |
Schedule of Investments December 31, 2022 | | BlackRock Income Trust, Inc. (BKT) (Percentages shown are based on Net Assets) |
| | | | | | | | |
| Security | | Par (000) | | | Value | |
| | |
Asset-Backed Securities | | | | | | | | |
Small Business Administration, Series 2000-1, 1.00%, 11/10/21(a) | | $ | 4 | | | $ | — | |
Sterling Coofs Trust(a) | | | | | | | | |
Series 2004-1, Class A, 2.36%, 04/15/29 | | | 483 | | | | 5,371 | |
Series 2004-2, Class Note, 2.08%, 03/30/30(b) | | | 384 | | | | 3,838 | |
| | | | | | | | |
| |
Total Asset-Backed Securities — 0.0%
(Cost: $88,076) | | | | 9,209 | |
| | | | | | | | |
|
Non-Agency Mortgage-Backed Securities | |
| |
| Collateralized Mortgage Obligations — 3.1% | | | | |
Fannie Mae REMICS, Series 2019-36, Class NJ, 3.00%, 07/25/49 | | | 2,355 | | | | 1,911,944 | |
Freddie Mac REMICS, Series 5083, Class IN, 4.50%, 07/25/32 | | | 14,765 | | | | 1,561,079 | |
Kidder Peabody Acceptance Corp., Series 1993-1, Class A6, (1 mo. LIBOR US + 16.62%), 8.47%, 08/25/23(c) | | | 2 | | | | 2,037 | |
Seasoned Credit Risk Transfer Trust | | | | | | | | |
Series 2018-2, Class MA, 3.50%, 11/25/57 | | | 584 | | | | 554,444 | |
Series 2018-4, Class MA, 3.50%, 03/25/58 | | | 3,321 | | | | 3,169,364 | |
Series 2019-1, Class MA, 3.50%, 07/25/58 | | | 1,054 | | | | 996,862 | |
Series 2019-2, Class MA, 3.50%, 08/25/58 | | | 419 | | | | 394,866 | |
| | | | | | | | |
| | |
| | | | | | | 8,590,596 | |
|
| Commercial Mortgage-Backed Securities — 2.3% | |
CSAIL Commercial Mortgage Trust(c) | | | | | | | | |
Series 2018-C14, Class XA, 0.56%, 11/15/51 | | | 2,054 | | | | 51,935 | |
Series 2019-C16, Class XA, 1.55%, 06/15/52 | | | 6,380 | | | | 457,028 | |
Freddie Mac, Series 5249, Class LB, 4.00%, 08/25/52 . | | | 6,295 | | | | 5,713,823 | |
Natixis Commercial Mortgage Securities Trust, Series 2018-FL1, Class A, (1 mo. LIBOR US + 0.95%), 5.27%, 06/15/35(b)(c) | | | 153 | | | | 147,937 | |
Wells Fargo Commercial Mortgage Trust, Series 2018- C44, Class XA, 0.72%, 05/15/51(c) | | | 4,842 | | | | 140,948 | |
| | | | | | | | |
| | |
| | | | | | | 6,511,671 | |
|
| Interest Only Collateralized Mortgage Obligations — 0.0% | |
CitiMortgage Alternative Loan Trust, Series 2007-A5, Class 1A7, 6.00%, 05/25/37 | | | 140 | | | | 24,827 | |
IndyMac INDX Mortgage Loan Trust, Series 2006- AR33, Class 4AX, 0.17%, 01/25/37(a) | | | 19,035 | | | | 2 | |
Vendee Mortgage Trust, Series 1999-2, Class 1, 0.00%, 05/15/29(a)(c) | | | 6,643 | | | | 7 | |
| | | | | | | | |
| | |
| | | | | | | 24,836 | |
|
| Mortgage-Backed Securities — 3.6% | |
Fannie Mae REMICS, Series 2021-26, Class AI, 3.50%, 05/25/50 | | | 28,431 | | | | 4,677,097 | |
Freddie Mac REMICS, Series 3745, Class LK, 4.00%, 10/15/40 | | | 3,500 | | | | 3,346,093 | |
Ginnie Mae, Series 2022-10, Class IT, 3.50%, 01/20/52 | | | 12,133 | | | | 1,981,326 | |
| | | | | | | | |
| | |
| | | | | | | 10,004,516 | |
| | | | | | | | |
| Security | | Par (000) | | | Value | |
|
| Principal Only Collateralized Mortgage Obligations — 0.1% | |
CHL Mortgage Pass-Through Trust, Series 2003-J8, Class PO, 0.01%, 09/25/23 | | $ | 8 | | | $ | 8,011 | |
Residential Asset Securitization Trust, Series 2005- A15, Class 1A8, 0.00%, 02/25/36 | | | 99 | | | | 69,345 | |
Washington Mutual Mortgage Pass-Through Certificates Trust, Series 2005-9, Class CP, 0.01%, 11/25/35 | | | 45 | | | | 24,760 | |
| | | | | | | | |
| | |
| | | | | | | 102,116 | |
| | | | | | | | |
| |
Total Non-Agency Mortgage-Backed Securities — 9.1%
(Cost: $26,233,824) | | | | 25,233,735 | |
| | | | | | | | |
|
U.S. Government Sponsored Agency Securities | |
| | |
| Agency Obligations — 3.4% | | | | | | |
Federal Housing Administration, USGI Projects, Series 99, 7.43%, 10/01/23(a) | | | 5 | | | | 5,088 | |
Resolution Funding Corp. Principal Strip, 0.00%, 04/15/30(d) | | | 13,000 | | | | 9,431,219 | |
| | | | | | | | |
| | |
| | | | | | | 9,436,307 | |
|
| Collateralized Mortgage Obligations — 63.9% | |
Fannie Mae, Series 0040, Class K, 6.50%, 08/17/24 | | | 5 | | | | 4,819 | |
Fannie Mae REMICS | | | | | | | | |
Series 1993-247, Class SN, (12 mo. LIBOR US + 63.85%), 10.00%, 12/25/23(c) | | | 54,952 | | | | | |
Series 2004-31, Class ZG, 7.50%, 05/25/34 | | | 2,168 | | | | 2,349,107 | |
Series 2004-84, Class SD, (1 mo. LIBOR US + 12.75%), 5.29%, 04/25/34(c) | | | 389 | | | | 380,764 | |
Series 2005-73, Class DS, (1 mo. LIBOR US + 17.55%), 6.14%, 08/25/35(c) | | | 48 | | | | 45,531 | |
Series 2010-134, Class DB, 4.50%, 12/25/40 | | | 6,933 | | | | 6,771,887 | |
Series 2010-136, Class CY, 4.00%, 12/25/40 | | | 3,060 | | | | 2,909,099 | |
Series 2010-47, Class JB, 5.00%, 05/25/30 | | | 2,256 | | | | 2,234,268 | |
Series 2011-117, Class CP, 4.00%, 11/25/41 | | | 14,351 | | | | 13,593,226 | |
Series 2011-8, Class ZA, 4.00%, 02/25/41 | | | 4,038 | | | | 3,844,310 | |
Series 2011-99, Class CB, 4.50%, 10/25/41 | | | 33,499 | | | | 32,695,915 | |
Series 2012-104, Class QD, 4.00%, 09/25/42 | | | 1,639 | | | | 1,500,308 | |
Series 2013-81, Class YK, 4.00%, 08/25/43 | | | 7,000 | | | | 6,483,898 | |
Series 2017-76, Class PB, 3.00%, 10/25/57 | | | 3,415 | | | | 2,530,186 | |
Series 2018-32, Class PS, (1 mo. LIBOR US + 7.23%), 2.11%, 05/25/48(c) | | | 4,642 | | | | 4,085,612 | |
Series 2018-50, Class EB, 4.00%, 07/25/48 | | | 2,001 | | | | 1,915,183 | |
Freddie Mac REMICS | | | | | | | | |
Series 2218, Class Z, 8.50%, 03/15/30 | | | 414 | | | | 439,897 | |
Series 2731, Class ZA, 4.50%, 01/15/34 | | | 1,710 | | | | 1,672,144 | |
Series 2927, Class BZ, 5.50%, 02/15/35 | | | 1,782 | | | | 1,790,920 | |
Series 3745, Class ZA, 4.00%, 10/15/40 | | | 1,243 | | | | 1,178,257 | |
Series 3762, Class LN, 4.00%, 11/15/40 | | | 2,000 | | | | 1,890,983 | |
Series 3780, Class ZA, 4.00%, 12/15/40 | | | 3,196 | | | | 3,037,318 | |
Series 3856, Class PB, 5.00%, 05/15/41 | | | 6,932 | | | | 6,978,309 | |
Series 3960, Class PL, 4.00%, 11/15/41 | | | 2,859 | | | | 2,740,298 | |
Series 3963, Class JB, 4.50%, 11/15/41 | | | 564 | | | | 549,355 | |
Series 4016, Class BX, 4.00%, 09/15/41 | | | 15,408 | | | | 14,656,277 | |
Series 4269, Class PM, 4.00%, 08/15/41 | | | 8,884 | | | | 8,262,560 | |
Series 4299, Class JY, 4.00%, 01/15/44 | | | 1,000 | | | | 933,787 | |
Series 4384, Class LB, 3.50%, 08/15/43 | | | 4,378 | | | | 4,195,904 | |
| | |
SCHEDULE OF INVESTMENTS | | 63 |
| | |
Schedule of Investments (continued) December 31, 2022 | | BlackRock Income Trust, Inc. (BKT) (Percentages shown are based on Net Assets) |
| | | | | | | | |
| Security | | Par (000) | | | Value | |
|
| Collateralized Mortgage Obligations (continued) | |
Freddie Mac REMICS (continued) | | | | | | | | |
Series 4471, Class JB, 3.50%, 09/15/43 | | $ | 3,932 | | | $ | 3,341,740 | |
Series 4615, Class LB, 4.50%, 09/15/41 | | | 7,431 | | | | 7,251,791 | |
Series 4748, Class BM, 3.50%, 11/15/47 | | | 3,351 | | | | 2,828,446 | |
Series 4774, Class L, 4.50%, 03/15/48 | | | 5,824 | | | | 5,709,372 | |
Series 4830, Class AV, 4.00%, 10/15/33 | | | 1,069 | | | | 989,202 | |
Series 4880, Class LG, 3.50%, 05/15/49 | | | 2,196 | | | | 1,914,992 | |
Ginnie Mae | | | | | | | | |
Series 2011-88, Class PY, 4.00%, 06/20/41 | | | 8,393 | | | | 8,122,891 | |
Series 2012-16, Class HJ, 4.00%, 09/20/40 | | | 5,773 | | | | 5,549,247 | |
Series 2015-96, Class ZM, 4.00%, 07/20/45 | | | 8,441 | | | | 7,752,269 | |
Series 2018-91, Class ZL, 4.00%, 07/20/48 | | | 6,131 | | | | 5,312,052 | |
| | | | | | | | |
| | |
| | | | | | | 178,447,076 | |
|
| Interest Only Collateralized Mortgage Obligations — 4.9% | |
Fannie Mae REMIC Trust, Series 1999-W4, Class IO, 6.50%, 12/25/28 | | | 37 | | | | 1,916 | |
Fannie Mae REMICS | | | | | | | | |
Series 1997-90, Class M, 6.00%, 01/25/28 | | | 76 | | | | 1,493 | |
Series 2006-36, Class PS, (1 mo. LIBOR US + 6.60%), 2.21%, 05/25/36(c) | | | 2,400 | | | | 191,003 | |
Series 2011-134, Class ST, (1 mo. LIBOR US + 6.00%), 1.61%, 12/25/41(c) | | | 13,188 | | | | 1,378,543 | |
Series 2013-10, Class PI, 3.00%, 02/25/43 | | | 3,885 | | | | 535,517 | |
Series 2013-45, Class EI, 4.00%, 04/25/43 | | | 1,371 | | | | 129,754 | |
Series 2015-66, Class AS, (1 mo. LIBOR US + 6.25%), 1.86%, 09/25/45(c) | | | 12,236 | | | | 818,543 | |
Series 2017-70, Class SA, (1 mo. LIBOR US + 6.15%), 1.76%, 09/25/47(a)(c) | | | 18,066 | | | | 2,058,316 | |
Series 2019-25, Class SA, (1 mo. LIBOR US + 6.05%), 1.66%, 06/25/49(c) | | | 8,960 | | | | 870,498 | |
Series 2019-35, Class SA, (1 mo. LIBOR US + 6.10%), 1.71%, 07/25/49(c) | | | 2,885 | | | | 274,428 | |
Series 2020-12, Class JI, 4.50%, 03/25/50 | | | 8,021 | | | | 1,671,844 | |
Freddie Mac REMICS | | | | | | | | |
Series 3744, Class PI, 4.00%, 06/15/39 | | | 1,305 | | | | 62,188 | |
Series 3796, Class WS, (1 mo. LIBOR US + 6.55%), 2.23%, 02/15/40(c) | | | 444 | | | | 2,957 | |
Series 3923, Class SD, (1 mo. LIBOR US + 6.00%), 1.68%, 09/15/41(c) | | | 17,313 | | | | 1,477,284 | |
Series 3954, Class SL, (1 mo. LIBOR US + 6.00%), 1.68%, 11/15/41(c) | | | 10,768 | | | | 994,077 | |
Series 4026, Class IO, 4.50%, 04/15/32 | | | 639 | | | | 56,506 | |
Series 4119, Class SC, (1 mo. LIBOR US + 6.15%), 1.83%, 10/15/42(a)(c) | | | 235 | | | | 25,470 | |
Series 4706, Class IG, 4.00%, 07/15/47 | | | 8,451 | | | | 1,468,624 | |
Ginnie Mae(c) | | | | | | | | |
Series 2009-116, Class KS, (1 mo. LIBOR US + 6.47%), 2.14%, 12/16/39 | | | 390 | | | | 27,679 | |
Series 2011-52, Class MJ, (1 mo. LIBOR US + 6.65%), 2.30%, 04/20/41 | | | 2,998 | | | | 140,023 | |
Series 2011-52, Class NS, (1 mo. LIBOR US + 6.67%), 2.34%, 04/16/41 | | | 3,678 | | | | 250,444 | |
| | | | | | | | |
| Security | | Par (000) | | | Value | |
|
| Interest Only Collateralized Mortgage Obligations (continued) | |
Ginnie Mae(c) (continued) | | | | | | | | |
Series 2012-97, Class JS, (1 mo. LIBOR US + 6.25%), 1.92%, 08/16/42 | | $ | 5,218 | | | $ | 145,948 | |
Series 2017-101, Class SL, (1 mo. LIBOR US + 6.20%), 1.85%, 07/20/47 | | | 9,287 | | | | 1,013,963 | |
| | | | | | | | |
| | |
| | | | | | | 13,597,018 | |
|
| Mortgage-Backed Securities — 72.1% | |
Fannie Mae, Series 2020-M21, Class AX, 1.81%, 01/25/58(c) | | | 1,719 | | | | 188,212 | |
Fannie Mae Mortgage-Backed Securities(e) | | | | | | | | |
4.00%, 02/01/56 - 01/01/57 | | | 32,690 | | | | 31,310,569 | |
3.50%, 08/01/56 | | | 4,592 | | | | 4,199,899 | |
3.00%, 09/01/60 | | | 4,413 | | | | 3,885,199 | |
Fannie Mae REMICS, Series 2021-23, Class CI, 3.50%, 07/25/46 | | | 20,011 | | | | 3,373,113 | |
Freddie Mac Mortgage-Backed Securities, 5.50%, 01/01/39(e) | | | 4,850 | | | | 5,012,763 | |
Freddie Mac REMICS, Series 5013, Class JI, 4.00%, 09/25/50 | | | 20,923 | | | | 3,221,870 | |
Freddie Mac Structured Pass-Through Certificates(c) | | | | | | | | |
Series K094, Class X1, 0.88%, 06/25/29 | | | 1,404 | | | | 63,261 | |
Series K104, Class X1, 1.12%, 01/25/30 | | | 1,353 | | | | 81,938 | |
Series K105, Class X1, 1.52%, 01/25/30 | | | 1,820 | | | | 150,911 | |
Series K107, Class X1, 1.59%, 01/25/30 | | | 1,231 | | | | 107,696 | |
Series K109, Class X1, 1.58%, 04/25/30 | | | 940 | | | | 81,163 | |
Series K110, Class X1, 1.70%, 04/25/30 | | | 394 | | | | 35,906 | |
Series K113, Class X1, 1.38%, 06/25/30 | | | 1,592 | | | | 124,887 | |
Series K115, Class X1, 1.33%, 06/25/30 | | | 1,952 | | | | 148,884 | |
Series K120, Class X1, 1.04%, 10/25/30 | | | 3,893 | | | | 233,374 | |
Series K122, Class X1, 0.88%, 11/25/30 | | | 1,671 | | | | 86,869 | |
Series T-11, Class A9, 0.13%, 01/25/28 | | | 102 | | | | 100,588 | |
Ginnie Mae | | | | | | | | |
Series 2013-63, Class IO, 0.73%, 09/16/51(c) | | | 4,729 | | | | 102,485 | |
Series 2014-169, Class IO, 0.63%, 10/16/56(c) | | | 12,958 | | | | 290,072 | |
Series 2016-113, Class IO, 1.18%, 02/16/58(c) | | | 3,455 | | | | 182,071 | |
Series 2022-60, Class IH, 2.50%, 02/20/51 | | | 25,298 | | | | 3,120,355 | |
Ginnie Mae Mortgage-Backed Securities | | | | | | | | |
7.50%, 02/15/23 - 11/15/23 | | | 1 | | | | 1,113 | |
8.00%, 05/15/26 - 06/15/27 | | | 9 | | | | 9,201 | |
5.00%, 10/20/39 | | | 1,058 | | | | 1,075,888 | |
Uniform Mortgage-Backed Securities | | | | | | | | |
4.50%, 09/01/25 - 09/01/49(e) | | | 18,732 | | | | 18,480,175 | |
5.50%, 02/01/33 - 10/01/39 | | | 3,512 | | | | 3,638,794 | |
5.00%, 06/01/33 - 02/13/53(e)(f) | | | 12,150 | | | | 12,257,575 | |
2.50%, 01/18/37 - 01/01/52(e)(f) | | | 17,545 | | | | 14,937,699 | |
6.50%, 10/01/38 - 10/01/39 | | | 1,207 | | | | 1,271,407 | |
4.00%, 01/01/41 - 05/01/52(e) | | | 22,568 | | | | 21,490,803 | |
3.50%, 02/25/49(f) | | | 3,664 | | | | 3,328,021 | |
2.00%, 12/01/51(e) | | | 37,455 | | | | 30,728,378 | |
3.00%, 01/12/53(f) | | | 40,100 | | | | 35,182,507 | |
Series 1839, Class QA, 4.00%, 08/01/49(e) | | | 2,816 | | | | 2,685,477 | |
| | | | | | | | |
| | |
| | | | | | | 201,189,123 | |
|
| Principal Only Collateralized Mortgage Obligations — 0.0% | |
Fannie Mae Interest Strip | | | | | | | | |
Series 203, Class 1, 0.00%, 02/25/23 | | | — | (g) | | | 10 | |
Series 228, Class 1, 0.00%, 06/25/23 | | | — | (g) | | | 46 | |
| | |
| 64 | | 2 0 2 2 BLACK ROCK ANNUAL REPORT TO SHAREHOLDERS |
| | |
Schedule of Investments (continued) December 31, 2022 | | BlackRock Income Trust, Inc. (BKT) (Percentages shown are based on Net Assets) |
| | | | | | | | |
| Security | | Par (000) | | | Value | |
| |
|
| Principal Only Collateralized Mortgage Obligations (continued) | |
Fannie Mae REMIC Trust, Series 1999-W4, Class PO, 0.00%, 02/25/29 | | $ | 17 | | | $ | 16,021 | |
Fannie Mae REMICS | | | | | | | | |
Series 1993-51, Class E, 0.00%, 02/25/23 | | | — | (g) | | | 31 | |
Series 1993-70, Class A, 0.00%, 05/25/23 | | | — | (g) | | | 39 | |
Series 2002-13, Class PR, 0.01%, 03/25/32 | | | 24 | | | | 21,547 | |
Series G93-2, Class KB, 0.01%, 01/25/23 | | | — | (g) | | | 10 | |
Freddie Mac REMICS | | | | | | | | |
Series 1571, Class G, 0.01%, 08/15/23 | | | — | (g) | | | 275 | |
Series 1691, Class B, 0.01%, 03/15/24 | | | 14 | | | | 13,415 | |
| | | | | | | | |
| | |
| | | | | | | 51,394 | |
| | | | | | | | |
| |
Total U.S. Government Sponsored Agency Securities — 144.3%
(Cost: $465,881,140) | | | | 402,720,918 | |
| | | | | | | | |
| |
Total Long-Term Investments — 153.4%
(Cost: $492,203,040) | | | | 427,963,862 | |
| | | | | | | | |
| | |
Short-Term Securities | | | | | | | | |
| | |
| Borrowed Bond Agreement — 0.3% | | | | | | |
Credit Suisse AG, 4.25%, open (Purchased 11/30/2022 to be repurchased at $785,092, Collateralized by U.S. Treasury Bonds, 2.75%,11/15/42, par and fair values of $917,000 and $735,033,
respectively)(h)(i) | | | 753 | | | | 753,086 | |
| | | | | | | | |
| | |
| | | Shares | | | | |
| | |
| Money Market Funds — 2.1% | | | | | | |
BlackRock Liquidity Funds, T-Fund, Institutional Class, 4.03%(j)(k) | | | 5,814,963 | | | | 5,814,963 | |
| | | | | | | | |
| | |
Total Short-Term Securities — 2.4%
(Cost: $6,568,049) | | | | | | | 6,568,049 | |
| | | | | | | | |
| |
Total Investments Before Borrowed Bonds and TBA Sale Commitments — 155.8%
(Cost: $498,771,089) | | | | 434,531,911 | |
| | | | | | | | |
| | | | | | | | |
| Security | | Par (000) | | | Value | |
| |
| | |
Borrowed Bonds | | | | | | | | |
| | |
| U.S. Governments Obligations — (0.3)% | | | | | | |
U.S. Treasury Bonds, 2.75%, 11/15/42(l) | | $ | (917 | ) | | $ | (735,033 | ) |
| | | | | | | | |
| |
Total Borrowed Bonds — (0.3)%
(Proceeds: $(842,347)) | | | | (735,033 | ) |
| | | | | | | | |
| | |
TBA Sale Commitments | | | | | | | | |
| | |
| Mortgage-Backed Securities — (0.1)% | | | | | | |
Uniform Mortgage-Backed Securities, 5.00%, 01/12/53(f) | | | (200 | ) | | | (197,044 | ) |
| | | | | | | | |
| | |
Total TBA Sale Commitments — (0.1)%
(Proceeds: $(199,664)) | | | | | | | (197,044 | ) |
| | | | | | | | |
| |
Total Investments, Net of Borrowed Bonds and TBA Sale Commitments — 155.4%
(Cost: $497,729,078) | | | | 433,599,834 | |
| |
Liabilities in Excess of Other Assets — (55.4)% | | | | (154,565,149 | ) |
| | | | | | | | |
| |
Net Assets — 100.0% | | | $ | 279,034,685 | |
| | | | | | | | |
| (a) | Security is valued using significant unobservable inputs and is classified as Level 3 in the fair value hierarchy. |
| (b) | Security exempt from registration pursuant to Rule 144A under the Securities Act of 1933, as amended. These securities may be resold in transactions exempt from registration to qualified institutional investors. |
| (c) | Variable rate security. Interest rate resets periodically. The rate shown is the effective interest rate as of period end. Security description also includes the reference rate and spread if published and available. |
| (e) | All or a portion of the security has been pledged as collateral in connection with outstanding reverse repurchase agreements. |
| (f) | Represents or includes a TBA transaction. |
| (g) | Rounds to less than 1,000. |
| (h) | Certain agreements have no stated maturity and can be terminated by either party at any time. |
| (i) | The amount to be repurchased assumes the maturity will be the day after the period end. |
| (j) | Affiliate of the Fund. |
| (k) | Annualized 7-day yield as of period end. |
| (l) | All or a portion of the security has been pledged as collateral in connection with outstanding borrowed bonds. |
Affiliates
Investments in issuers considered to be affiliate(s) of the Fund during the year ended December 31, 2022 for purposes of Section 2(a)(3) of the Investment Company Act of 1940, as amended, were as follows:
| | | | | | | | | | | | | | | | | | | | | | | | | | | | | | | | | | | | |
| | | | | | | | | | |
| Affiliated Issuer | | Value at
12/31/21 | | | Purchases at Cost | | | Proceeds from Sales | | | Net Realized Gain (Loss) | | | Change in Unrealized Appreciation
(Depreciation) | | | Value at
12/31/22 | | | Shares Held at 12/31/22 | | | Income | | | Capital Gain Distributions from Underlying Funds | |
| | | | | | | | | |
BlackRock Liquidity Funds, T-Fund, Institutional Class | | $ | 12,560,167 | | | $ | — | | | $ | (6,745,204 | )(a) | | $ | — | | | $ | — | | | $ | 5,814,963 | | | | 5,814,963 | | | $ | 130,377 | | | $ | — | |
| | | | | | | | | | | | | | | | | | | | | | | | | | | | | | | | | | | | |
| | (a) | Represents net amount purchased (sold). | |
| | |
SCHEDULE OF INVESTMENTS | | 65 |
| | |
Schedule of Investments (continued) December 31, 2022 | | BlackRock Income Trust, Inc. (BKT) |
Reverse Repurchase Agreements
| | | | | | | | | | | | | | | | | | | | | | | | |
| | | | | | | | |
| Counterparty | | Interest Rate | | | Trade Date | | | Maturity Date | | | Face Value | | | Face Value
Including
Accrued Interest | | | Type of Non-Cash Underlying Collateral | | Remaining Contractual Maturity of the Agreements |
| | | | | | | |
HSBC Securities (USA), Inc. | | | 4.24 | % | | | 11/10/22 | | | | 01/12/23 | | | $ | 4,074,509 | | | $ | 4,097,543 | | | U.S. Government Sponsored Agency Securities | | Up to 30 Days |
HSBC Securities (USA), Inc. | | | 4.24 | | | | 11/10/22 | | | | 01/12/23 | | | | 21,115,617 | | | | 21,234,991 | | | U.S. Government Sponsored Agency Securities | | Up to 30 Days |
HSBC Securities (USA), Inc. | | | 4.24 | | | | 11/10/22 | | | | 01/12/23 | | | | 5,153,750 | | | | 5,182,886 | | | U.S. Government Sponsored Agency Securities | | Up to 30 Days |
HSBC Securities (USA), Inc. | | | 4.24 | | | | 11/10/22 | | | | 01/12/23 | | | | 6,134,742 | | | | 6,169,423 | | | U.S. Government Sponsored Agency Securities | | Up to 30 Days |
HSBC Securities (USA), Inc. | | | 4.24 | | | | 11/10/22 | | | | 01/12/23 | | | | 5,514,219 | | | | 5,545,393 | | | U.S. Government Sponsored Agency Securities | | Up to 30 Days |
HSBC Securities (USA), Inc. | | | 4.24 | | | | 11/10/22 | | | | 01/12/23 | | | | 6,133,955 | | | | 6,168,632 | | | U.S. Government Sponsored Agency Securities | | Up to 30 Days |
HSBC Securities (USA), Inc. | | | 4.24 | | | | 11/10/22 | | | | 01/12/23 | | | | 3,788,417 | | | | 3,809,834 | | | U.S. Government Sponsored Agency Securities | | Up to 30 Days |
HSBC Securities (USA), Inc. | | | 4.24 | | | | 11/10/22 | | | | 01/12/23 | | | | 5,716,404 | | | | 5,748,721 | | | U.S. Government Sponsored Agency Securities | | Up to 30 Days |
HSBC Securities (USA), Inc. | | | 4.24 | | | | 11/10/22 | | | | 01/12/23 | | | | 6,154,228 | | | | 6,189,020 | | | U.S. Government Sponsored Agency Securities | | Up to 30 Days |
HSBC Securities (USA), Inc. | | | 4.24 | | | | 11/10/22 | | | | 01/12/23 | | | | 9,263,300 | | | | 9,317,822 | | | U.S. Government Sponsored Agency Securities | | Up to 30 Days |
HSBC Securities (USA), Inc. | | | 4.24 | | | | 11/10/22 | | | | 01/12/23 | | | | 6,190,161 | | | | 6,225,156 | | | U.S. Government Sponsored Agency Securities | | Up to 30 Days |
HSBC Securities (USA), Inc. | | | 4.24 | | | | 11/10/22 | | | | 01/12/23 | | | | 6,147,437 | | | | 6,182,191 | | | U.S. Government Sponsored Agency Securities | | Up to 30 Days |
HSBC Securities (USA), Inc. | | | 4.24 | | | | 11/10/22 | | | | 01/12/23 | | | | 4,098,819 | | | | 4,121,991 | | | U.S. Government Sponsored Agency Securities | | Up to 30 Days |
HSBC Securities (USA), Inc. | | | 4.24 | | | | 11/10/22 | | | | 01/12/23 | | | | 4,957,498 | | | | 4,985,525 | | | U.S. Government Sponsored Agency Securities | | Up to 30 Days |
Royal Bank of Canada | | | 4.45 | | | | 12/12/22 | | | | 01/12/23 | | | | 2,634,901 | | | | 2,641,089 | | | U.S. Government Sponsored Agency Securities | | Up to 30 Days |
Royal Bank of Canada | | | 4.45 | | | | 12/12/22 | | | | 01/12/23 | | | | 4,168,716 | | | | 4,178,507 | | | U.S. Government Sponsored Agency Securities | | Up to 30 Days |
Royal Bank of Canada | | | 4.45 | | | | 12/12/22 | | | | 01/12/23 | | | | 4,124,525 | | | | 4,134,213 | | | U.S. Government Sponsored Agency Securities | | Up to 30 Days |
Royal Bank of Canada | | | 4.45 | | | | 12/12/22 | | | | 01/12/23 | | | | 2,724,496 | | | | 2,730,895 | | | U.S. Government Sponsored Agency Securities | | Up to 30 Days |
Royal Bank of Canada | | | 4.45 | | | | 12/12/22 | | | | 01/12/23 | | | | 3,280,816 | | | | 3,288,521 | | | U.S. Government Sponsored Agency Securities | | Up to 30 Days |
BNP Paribas S.A | | | 4.45 | | | | 12/27/22 | | | | 01/12/23 | | | | 2,309,192 | | | | 2,310,619 | | | U.S. Government Sponsored Agency Securities | | Up to 30 Days |
BNP Paribas S.A | | | 4.45 | | | | 12/27/22 | | | | 01/12/23 | | | | 1,499,677 | | | | 1,500,604 | | | U.S. Government Sponsored Agency Securities | | Up to 30 Days |
| | | | | | | | | | | | | | | | | | | | | | | | |
| | | | | | | |
| | | | | | | | | | | | | | $ | 115,185,379 | | | $ | 115,763,576 | | | | | |
| | | | | | | | | | | | | | | | | | | | | | | | |
| | |
| 66 | | 2 0 2 2 BLACK ROCK ANNUAL REPORT TO SHAREHOLDERS |
| | |
Schedule of Investments (continued) December 31, 2022 | | BlackRock Income Trust, Inc. (BKT) |
Derivative Financial Instruments Outstanding as of Period End
Futures Contracts
| | | | | | | | | | | | | | | | |
| | | | | |
| Description | | Number of
Contracts | | | Expiration
Date | | | Notional
Amount (000) | | | Value/
Unrealized
Appreciation
(Depreciation) | |
| | | | |
Long Contracts | | | | | | | | | | | | | | | | |
10-Year U.S. Treasury Note | | | 348 | | | | 03/22/23 | | | $ | 39,025 | | | $ | (214,060 | ) |
| | | | | | | | | | | | | | | | |
| | | | |
Short Contracts | | | | | | | | | | | | | | | | |
10-Year U.S. Ultra Long Treasury Note | | | 174 | | | | 03/22/23 | | | | 20,513 | | | | 131,545 | |
U.S. Long Bond | | | 165 | | | | 03/22/23 | | | | 20,573 | | | | 143,603 | |
2-Year U.S. Treasury Note | | | 179 | | | | 03/31/23 | | | | 36,695 | | | | (32,903 | ) |
5-Year U.S. Treasury Note | | | 127 | | | | 03/31/23 | | | | 13,694 | | | | 35,811 | |
| | | | | | | | | | | | | | | | |
| | | | |
| | | | | | | | | | | | | | | 278,056 | |
| | | | | | | | | | | | | | | | |
| | | | |
| | | | | | | | | | | | | | $ | 63,996 | |
| | | | | | | | | | | | | | | | |
Centrally Cleared Interest Rate Swaps
| | | | | | | | | | | | | | | | | | | | | | | | | | | | | | | | |
| | | | | | | | |
Paid by the Fund | | Received by the Fund | | Effective Date | | | Termination Date | | | Notional Amount (000) | | | Value | | | Upfront
Premium
Paid (Received) | | | Unrealized
Appreciation (Depreciation) | |
| Rate | | Frequency | | Rate | | Frequency |
| | | | | | | | | | | |
1-Day SOFR, 4.32% | | Quarterly | | 0.17% | | Quarterly | | | N/A | | | | 10/21/25 | | | USD | | | 137 | | | $ | (15,220 | ) | | $ | (20 | ) | | $ | (15,200 | ) |
| 0.18% | | Quarterly | | 1-Day FEDL, 4.33% | | Quarterly | | | N/A | | | | 10/21/25 | | | USD | | | 137 | | | | 15,209 | | | | 16 | | | | 15,193 | |
| | | | | | | | | | | | | | | | | | | | | | | | | | | | | | | | |
| | | | | | | | | | | | | | | | | | | | | | $ | (11 | ) | | $ | (4 | ) | | $ | (7 | ) |
| | | | | | | | | | | | | | | | | | | | | | | | | | | | | | | | |
Balances Reported in the Statements of Assets and Liabilities for Centrally Cleared Swaps
| | | | | | | | | | | | | | | | |
| | | | | |
| Description | | Swap
Premiums
Paid | | | Swap
Premiums
Received | | | Unrealized
Appreciation | | | Unrealized
Depreciation | |
| | | | |
Centrally Cleared Swaps(a) | | $ | 16 | | | $ | (20 | ) | | $ | 15,193 | | | $ | (15,200 | ) |
| | (a) | Includes cumulative appreciation (depreciation) on centrally cleared swaps, as reported in the Schedule of Investments. Only current day’s variation margin is reported within the Statements of Assets and Liabilities and is net of any previously paid (received) swap premium amounts. | |
Derivative Financial Instruments Categorized by Risk Exposure
As of period end, the fair values of derivative financial instruments located in the Statements of Assets and Liabilities were as follows:
| | | | | | | | | | | | | | | | | | | | | | | | | | | | |
| | | | | | | | |
| | | Commodity
Contracts | | | Credit
Contracts | | | Equity
Contracts | | | Foreign
Currency
Exchange
Contracts | | | Interest
Rate
Contracts | | | Other
Contracts | | | Total | |
| | | | | | | |
Assets — Derivative Financial Instruments | | | | | | | | | | | | | | | | | | | | | | | | | | | | |
Futures contracts | | | | | | | | | | | | | | | | | | | | | | | | | | | | |
Unrealized appreciation on futures contracts(a) | | $ | — | | | $ | — | | | $ | — | | | $ | — | | | $ | 310,959 | | | $ | — | | | $ | 310,959 | |
Swaps — centrally cleared | | | | | | | | | | | | | | | | | | | | | | | | | | | | |
Unrealized appreciation on centrally cleared swaps(a) | | | — | | | | — | | | | — | | | | — | | | | 15,193 | | | | — | | | | 15,193 | |
| | | | | | | | | | | | | | | | | | | | | | | | | | | | |
| | $ | — | | | $ | — | | | $ | — | | | $ | — | | | $ | 326,152 | | | $ | — | | | $ | 326,152 | |
| | | | | | | | | | | | | | | | | | | | | | | | | | | | |
| | | | | | | |
Liabilities — Derivative Financial Instruments | | | | | | | | | | | | | | | | | | | | | | | | | | | | |
Futures contracts | | | | | | | | | | | | | | | | | | | | | | | | | | | | |
Unrealized depreciation on futures contracts(a) | | $ | — | | | $ | — | | | $ | — | | | $ | — | | | $ | 246,963 | | | $ | — | | | $ | 246,963 | |
Swaps — centrally cleared | | | | | | | | | | | | | | | | | | | | | | | | | | | | |
Unrealized depreciation on centrally cleared swaps(a) | | | — | | | | — | | | | — | | | | — | | | | 15,200 | | | | — | | | | 15,200 | |
| | | | | | | | | | | | | | | | | | | | | | | | | | | | |
| | $ | — | | | $ | — | | | $ | — | | | $ | — | | | $ | 262,163 | | | $ | — | | | $ | 262,163 | |
| | | | | | | | | | | | | | | | | | | | | | | | | | | | |
| | (a) | Net cumulative unrealized appreciation (depreciation) on futures contracts and centrally cleared swaps, if any, are reported in the Schedule of Investments. In the Statements of Assets and Liabilities, only current day’s variation margin is reported in receivables or payables and the net cumulative unrealized appreciation (depreciation) is included in accumulated earnings (loss). | |
| | |
SCHEDULE OF INVESTMENTS | | 67 |
| | |
Schedule of Investments (continued) December 31, 2022 | | BlackRock Income Trust, Inc. (BKT) |
For the period ended December 31, 2022, the effect of derivative financial instruments in the Statements of Operations was as follows:
| | | | | | | | | | | | | | | | | | | | | | | | | | | | |
| | | | | | | | |
| | | Commodity
Contracts | | | Credit
Contracts | | | Equity
Contracts | | | Foreign Currency Exchange
Contracts | | | Interest
Rate
Contracts | | | Other
Contracts | | | Total | |
| | | | | | | |
Net Realized Gain (Loss) from: | | | | | | | | | | | | | | | | | | | | | | | | | | | | |
Futures contracts | | $ | — | | | $ | — | | | $ | — | | | $ | — | | | $ | 2,390,388 | | | $ | — | | | $ | 2,390,388 | |
Swaps | | | — | | | | — | | | | — | | | | — | | | | 2,925,079 | | | | — | | | | 2,925,079 | |
| | | | | | | | | | | | | | | | | | | | | | | | | | | | |
| | $ | — | | | $ | — | | | $ | — | | | $ | — | | | $ | 5,315,467 | | | $ | — | | | $ | 5,315,467 | |
| | | | | | | | | | | | | | | | | | | | | | | | | | | | |
Net Change in Unrealized Appreciation (Depreciation) on: | | | | | | | | | | | | | | | | | | | | | | | | | | | | |
Futures contracts | | $ | — | | | $ | — | | | $ | — | | | $ | — | | | $ | (103,319 | ) | | $ | — | | | $ | (103,319 | ) |
Swaps | | | — | | | | — | | | | — | | | | — | | | | 343,085 | | | | — | | | | 343,085 | |
| | | | | | | | | | | | | | | | | | | | | | | | | | | | |
| | $ | — | | | $ | — | | | $ | — | | | $ | — | | | $ | 239,766 | | | $ | — | | | $ | 239,766 | |
| | | | | | | | | | | | | | | | | | | | | | | | | | | | |
Average Quarterly Balances of Outstanding Derivative Financial Instruments
| | | | |
| | |
Futures contracts: | | | | |
Average notional value of contracts — long | | $ | 58,381,828 | |
Average notional value of contracts — short | | $ | 80,367,329 | |
Interest rate swaps: | | | | |
Average notional value — pays fixed rate | | $ | 31,170,574 | |
Average notional value — receives fixed rate | | $ | 6,148,074 | |
For more information about the Fund’s investment risks regarding derivative financial instruments, refer to the Notes to Financial Statements.
Fair Value Hierarchy as of Period End
Various inputs are used in determining the fair value of financial instruments. For a description of the input levels and information about the Fund’s policy regarding valuation of financial instruments, refer to the Notes to Financial Statements.
The following table summarizes the Fund’s financial instruments categorized in the fair value hierarchy. The breakdown of the Fund’s financial instruments into major categories is disclosed in the Schedule of Investments above.
| | | | | | | | | | | | | | | | |
| | | | | |
| | | Level 1 | | | Level 2 | | | Level 3 | | | Total | |
| | | | |
Assets | | | | | | | | | | | | | | | | |
Investments | | | | | | | | | | | | | | | | |
Long-Term Investments | | | | | | | | | | | | | | | | |
Asset-Backed Securities | | $ | — | | | $ | — | | | $ | 9,209 | | | $ | 9,209 | |
Non-Agency Mortgage-Backed Securities | | | — | | | | 25,233,726 | | | | 9 | | | | 25,233,735 | |
U.S. Government Sponsored Agency Securities | | | — | | | | 400,632,044 | | | | 2,088,874 | | | | 402,720,918 | |
Short-Term Securities | | | | | | | | | | | | | | | | |
Borrowed Bond Agreement | | | — | | | | 753,086 | | | | — | | | | 753,086 | |
Money Market Funds | | | 5,814,963 | | | | — | | | | — | | | | 5,814,963 | |
| | | | |
Liabilities | | | | | | | | | | | | | | | | |
Investments | | | | | | | | | | | | | | | | |
Borrowed Bonds | | | — | | | | (735,033 | ) | | | — | | | | (735,033 | ) |
TBA Sale Commitments | | | — | | | | (197,044 | ) | | | — | | | | (197,044 | ) |
| | | | | | | | | | | | | | | | |
| | $ | 5,814,963 | | | $ | 425,686,779 | | | $ | 2,098,092 | | | $ | 433,599,834 | |
| | | | | | | | | | | | | | | | |
| | | | |
Derivative Financial Instruments(a) | | | | | | | | | | | | | | | | |
Assets | | | | | | | | | | | | | | | | |
Interest Rate Contracts | | $ | 310,959 | | | $ | 15,193 | | | $ | — | | | $ | 326,152 | |
Liabilities | | | | | | | | | | | | | | | | |
Interest Rate Contracts | | | (246,963 | ) | | | (15,200 | ) | | | — | | | | (262,163 | ) |
| | | | | | | | | | | | | | | | |
| | $ | 63,996 | | | $ | (7 | ) | | $ | — | | | $ | 63,989 | |
| | | | | | | | | | | | | | | | |
| | (a) | Derivative financial instruments are swaps and futures contracts. Swaps and futures contracts are valued at the unrealized appreciation (depreciation) on the instrument. | |
The Fund may hold assets and/or liabilities in which the fair value approximates the carrying amount or face value, including accrued interest, for financial statement purposes. As of period end, reverse repurchase agreements of $115,763,576 are categorized as Level 2 within the fair value hierarchy.
See notes to financial statements.
| | |
| 68 | | 2 0 2 2 BLACK ROCK ANNUAL REPORT TO SHAREHOLDERS |
| | |
Schedule of Investments December 31, 2022 | | BlackRock Limited Duration Income Trust (BLW) (Percentages shown are based on Net Assets) |
| | | | | | | | | | | | |
| Security | | | | | Par
(000) | | | Value | |
|
Asset-Backed Securities | |
AIMCO CLO, Series 2017-AA, Class CR, (3 mo. LIBOR US + 2.10%),
6.34%, 04/20/34(a)(b) | | | USD | | | | 1,000 | | | $ | 936,605 | |
Allegro CLO II-S Ltd., Series 2014-1RA, Class C, (3 mo. LIBOR US + 3.00%), 7.28%, 10/21/28(a)(b) | | | | | | | 1,000 | | | | 915,107 | |
ALM Ltd., Series 2020-1A, Class D, (3 mo. LIBOR US + 6.00%), 10.08%, 10/15/29(a)(b) | | | | | | | 285 | | | | 247,674 | |
Anchorage Capital CLO 3-R Ltd., Series 2014-3RA, Class E, (3 mo. LIBOR US + 5.50%), 9.87%, 01/28/31(a)(b) | | | | | | | 850 | | | | 677,091 | |
Anchorage Capital CLO 4-R Ltd., Series 2014-4RA, Class D, (3 mo. LIBOR US + 2.60%), 6.97%, 01/28/31(a)(b) | | | | | | | 250 | | | | 221,126 | |
Anchorage Capital CLO 7 Ltd., Series 2015-7A, Class D1R2, (3 mo. LIBOR US + 3.50%), 7.87%, 01/28/31(a)(b) | | | | | | | 1,000 | | | | 898,396 | |
Apidos CLO XXVI, Series 2017-26A, Class A1AR, (3 mo. LIBOR US + 0.90%), 5.09%, 07/18/29(a)(b) | | | | | | | 450 | | | | 444,453 | |
Argent Securities Trust, Series 2006-W5, Class A1A, (1 mo. LIBOR US + 0.30%), 4.69%, 06/25/36(a) | | | | | | | 4,244 | | | | 2,787,792 | |
Bain Capital Credit CLO Ltd.(a)(b) | | | | | | | | | | | | |
Series 2020-2A, Class DR, (3 mo. LIBOR US + 3.30%), 7.53%, 07/19/34 | | | | | | | 300 | | | | 268,807 | |
Series 2021-3A, Class D, (3 mo. LIBOR US + 3.10%), 7.42%, 07/24/34 | | | | | | | 250 | | | | 224,592 | |
Barings CLO Ltd., Series 2017-1A, Class D, 7.79%, 07/18/29 | | | | | | | 250 | | | | 237,314 | |
Benefit Street Partners CLO II Ltd., Series 2013-IIA, Class A1R2, (3 mo. LIBOR US + 0.87%), 4.95%, 07/15/29(a)(b) | | | | | | | 267 | | | | 264,864 | |
Benefit Street Partners CLO XX Ltd., Series 2020- 20A, Class CR, (3 mo. LIBOR US + 2.05%), 6.13%, 07/15/34(a)(b) | | | | | | | 250 | | | | 231,849 | |
BlueMountain CLO XXVIII Ltd., Series 2021-28A, Class D, (3 mo. LIBOR US + 2.90%), 6.98%, 04/15/34(a)(b) | | | | | | | 500 | | | | 454,783 | |
Carlyle U.S. CLO Ltd., Series 2018-1A, Class A1, (3 mo. LIBOR US + 1.02%), 5.26%, 04/20/31(a)(b) | | | | | | | 250 | | | | 246,855 | |
CarVal CLO II Ltd., Series 2019-1A, Class CR, (3 mo. LIBOR US + 2.00%), 6.24%, 04/20/32(a)(b) | | | | | | | 250 | | | | 235,424 | |
CarVal CLO III Ltd., Series 2019-2A, Class E, (3 mo. LIBOR US + 6.44%), 10.68%, 07/20/32(a)(b) | | | | | | | 500 | | | | 432,979 | |
Cayuga Park CLO Ltd., Series 2020-1A, Class B1R, (3 mo. LIBOR US + 1.65%), 5.73%, 07/17/34(a)(b) | | | | | | | 250 | | | | 238,663 | |
Cedar Funding XIV CLO Ltd., Series 2021-14A, Class B, (3 mo. LIBOR US + 1.60%), 5.68%, 07/15/33(a)(b) | | | | | | | 500 | | | | 483,433 | |
CIFC Funding I Ltd., Series 2019-1A, Class DR, (3 mo. LIBOR US + 3.10%), 7.34%, 04/20/32(a)(b) | | | | | | | 500 | | | | 473,933 | |
CIFC Funding Ltd., Series 2013-4A, Class DRR, (3 mo. LIBOR US + 2.80%), 7.16%, 04/27/31(a)(b) | | | | | | | 250 | | | | 232,785 | |
| | | | | | | | | | | | |
| Security | | | | | Par
(000) | | | Value | |
| |
Asset-Backed Securities (continued) | | | | | |
CIFC Funding VII Ltd. | | | | | | | | | | | | |
Series 2022-7A, Class D, 9.56%, 10/22/35 | | | USD | | | | 250 | | | $ | 244,640 | |
Series 2022-7A, Class E, 13.15%, 10/22/35 | | | | | | | 500 | | | | 485,563 | |
Citigroup Mortgage Loan Trust, Series 2006-FX1, Class A7, 5.78%, 10/25/36 | | | | | | | 345 | | | | 223,920 | |
Clear Creek CLO, Series 2015-1A, Class DR, (3 mo. LIBOR US + 2.95%), 7.19%, 10/20/30(a)(b) | | | | | | | 250 | | | | 214,840 | |
Countrywide Asset-Backed Certificates Trust, Series 2006-26, Class 1A, (1 mo. LIBOR US + 0.14%), 4.53%, 06/25/37(a) | | | | | | | 539 | | | | 491,416 | |
Credit Suisse ABS Repackaging Trust, Series 2013-A, Class B, 2.50%, 01/25/30(b) | | | | | | | 216 | | | | 203,233 | |
Dryden 106 CLO Ltd., 13.43%, 10/15/35 | | | | | | | 500 | | | | 483,500 | |
Dryden 64 CLO Ltd., Series 2018-64A, Class D, (3 mo. LIBOR US + 2.65%), 6.84%, 04/18/31(a)(b) | | | | | | | 250 | | | | 230,778 | |
Elmwood CLO II Ltd., Series 2019-2A, Class ER, (3 mo. LIBOR US + 6.80%), 11.04%, 04/20/34(a)(b) | | | | | | | 250 | | | | 229,945 | |
Elmwood CLO IV Ltd., Series 2020-1A, Class B, (3 mo. LIBOR US + 1.70%), 5.78%, 04/15/33(a)(b) | | | | | | | 500 | | | | 482,750 | |
Elmwood CLO V Ltd., Series 2020-2A, Class CR, (3 mo. LIBOR US + 2.00%), 6.24%, 10/20/34(a)(b) | | | | | | | 436 | | | | 406,624 | |
Generate CLO 3 Ltd., Series 3A, Class DR, (3 mo. LIBOR US + 3.60%),
7.84%, 10/20/29(a)(b) | | | | | | | 250 | | | | 228,529 | |
Generate CLO 4 Ltd., Series 4A, Class ER, (3 mo. LIBOR US + 6.75%), 10.99%, 04/20/32(a)(b) | | | | | | | 1,000 | | | | 892,273 | |
Generate CLO 6 Ltd., Series 6A, Class DR, (3 mo. LIBOR US + 3.50%),
7.82%, 01/22/35(a)(b) | | | | | | | 750 | | | | 664,406 | |
Golub Capital Partners CLO 55B Ltd., Series 2021- 55A, Class E, (3 mo. LIBOR US + 6.56%), 10.80%, 07/20/34(a)(b) | | | | | | | 250 | | | | 220,129 | |
Gulf Stream Meridian 1 Ltd., Series 2020-IA, Class E, (3 mo. LIBOR US + 6.45%), 10.53%, 04/15/33(a)(b) | | | | | | | 250 | | | | 216,740 | |
Gulf Stream Meridian 5 Ltd., Series 2021-5A, Class A2, (3 mo. LIBOR US + 1.80%), 5.88%, 07/15/34(a)(b) | | | | | | | 250 | | | | 241,479 | |
Jay Park CLO Ltd., Series 2016-1A, Class CR, (3 mo. LIBOR US + 2.65%), 6.89%, 10/20/27(a)(b) | | | | | | | 250 | | | | 236,811 | |
LCM XIII LP, Series 13A, Class AR3, (3 mo. LIBOR US + 0.87%), 5.10%, 07/19/27(a)(b) | | | | | | | 527 | | | | 521,398 | |
Madison Park Funding XVII Ltd., Series 2015-17A, Class DR, (3 mo. LIBOR US + 3.60%), 7.88%, 07/21/30(a)(b) | | | | | | | 500 | | | | 469,277 | |
Madison Park Funding XVIII Ltd., Series 2015-18A, Class ARR, (3 mo. LIBOR US + 0.94%), 5.22%, 10/21/30(a)(b) | | | | | | | 500 | | | | 493,040 | |
Madison Park Funding XXIX Ltd.(a)(b) | | | | | | | | | | | | |
Series 2018-29A, Class D, (3 mo. LIBOR US + 3.00%), 7.19%, 10/18/30 | | | | | | | 510 | | | | 471,500 | |
Series 2018-29A, Class E, (3 mo. LIBOR US + 5.70%), 9.89%, 10/18/30 | | | | | | | 250 | | | | 225,505 | |
| | |
SCHEDULE OF INVESTMENTS | | 69 |
| | |
Schedule of Investments (continued) December 31, 2022 | | BlackRock Limited Duration Income Trust (BLW) (Percentages shown are based on Net Assets) |
| | | | | | | | | | | | |
| Security | | | | | Par
(000) | | | Value | |
| |
Asset-Backed Securities (continued) | | | | | |
Madison Park Funding XXV Ltd., Series 2017-25A, Class A1R, (3 mo. LIBOR US + 0.97%), 5.33%, 04/25/29(a)(b) | | | USD | | | | 985 | | | $ | 971,214 | |
Madison Park Funding XXVI Ltd., Series 2007-4A, Class DR, (3 mo. LIBOR US + 3.00%), 7.41%, 07/29/30(a)(b) | | | | | | | 250 | | | | 228,561 | |
Madison Park Funding XXXVIII Ltd., Series 2021- 38A, Class B, (3 mo. LIBOR US + 1.65%), 5.73%, 07/17/34(a)(b) | | | | | | | 250 | | | | 237,848 | |
Neuberger Berman CLO XX Ltd., Series 2015-20A, Class ERR, (3 mo. LIBOR US + 6.50%), 10.58%, 07/15/34(a)(b) | | | | | | | 790 | | | | 686,068 | |
Neuberger Berman Loan Advisers CLO 32 Ltd., Series 2019-32A, Class ER, (3 mo. LIBOR US + 6.10%), 10.33%, 01/20/32(a)(b) | | | | | | | 425 | | | | 382,079 | |
Neuberger Berman Loan Advisers NBLA CLO 52 Ltd., Series 2022-52A, Class D, 10.33%, 10/24/35(c) | | | | | | | 500 | | | | 500,000 | |
OCP CLO Ltd., Series 2019-16A, Class DR, (3 mo. LIBOR US + 3.15%), 7.06%, 04/10/33(a)(b) | | | | | | | 250 | | | | 228,918 | |
Octagon 54 Ltd., Series 2021-1A, Class D, (3 mo. LIBOR US + 3.05%), 7.13%, 07/15/34(a)(b) | | | | | | | 250 | | | | 231,309 | |
Octagon Investment Partners 31 Ltd., Series 2017- 1A, Class E, (3 mo. LIBOR US + 6.30%), 10.54%, 07/20/30(a)(b) | | | | | | | 500 | | | | 433,312 | |
Octagon Investment Partners XV Ltd., Series 2013- 1A, Class A1RR, (3 mo. LIBOR US + 0.97%), 5.20%, 07/19/30(a)(b) | | | | | | | 1,795 | | | | 1,771,626 | |
Octagon Investment Partners XVII Ltd., Series 2013- 1A, Class BR2, (3 mo. LIBOR US + 1.40%), 5.76%, 01/25/31(a)(b) | | | | | | | 250 | | | | 240,942 | |
OHA Credit Partners XIII Ltd., Series 2016-13A, Class BR, (3 mo. LIBOR US + 1.70%), 5.98%, 10/25/34(a)(b) | | | | | | | 250 | | | | 239,395 | |
OZLM VIII Ltd., Series 2014-8A, Class CRR, (3 mo. LIBOR US + 3.15%), 7.23%, 10/17/29(a)(b) | | | | | | | 250 | | | | 230,072 | |
OZLM XXI Ltd., Series 2017-21A, Class D, (3 mo. LIBOR US + 5.54%), 9.78%, 01/20/31(a)(b) | | | | | | | 250 | | | | 199,312 | |
Rad CLO 17 Ltd., Series 2022-17A, Class E, (3 mo. SOFR + 8.30%), 12.26%, 10/20/35(a)(b) | | | | | | | 250 | | | | 236,471 | |
Regatta IX Funding Ltd., 7.98%, 04/17/30 | | | | | | | 500 | | | | 471,284 | |
Regatta XXIV Funding Ltd., Series 2021-5A, Class D, (3 mo. LIBOR US + 3.10%), 7.34%, 01/20/35(a)(b) | | | | | | | 250 | | | | 230,818 | |
Regional Management Issuance, 3.88%, 10/17/33(c) | | | | | | | 980 | | | | 836,430 | |
Rockford Tower CLO Ltd., Series 2017-2A, Class DR, (3 mo. LIBOR US + 2.85%), 6.93%, 10/15/29(a)(b) | | | | | | | 500 | | | | 461,790 | |
Sterling Coofs Trust(c) | | | | | | | | | | | | |
Series 2004-1, Class A, 2.36%, 04/15/29 | | | | | | | 672 | | | | 7,190 | |
Series 2004-2, Class Note, 2.08%, 03/30/30(b) | | | | | | | 1,041 | | | | 10,405 | |
TICP CLO I-2 Ltd., Series 2018-IA, Class C, (3 mo. LIBOR US + 3.04%), 7.37%, 04/26/28(a)(b) | | | | | | | 500 | | | | 481,299 | |
TICP CLO VII Ltd., Series 2017-7A, Class ER, (3 mo. LIBOR US + 7.05%), 11.13%, 04/15/33(a)(b) | | | | | | | 250 | | | | 223,438 | |
| | | | | | | | | | | | |
| Security | | | | | Par (000) | | | Value | |
| |
Asset-Backed Securities (continued) | | | | | |
Trimaran CAVU Ltd.(a)(b) | | | | | | | | | | | | |
Series 2021-1A, Class D, (3 mo. LIBOR US + 3.45%), 7.77%, 04/23/32 | | | USD | | | | 250 | | | $ | 227,623 | |
Series 2021-2A, Class D1, (3 mo. LIBOR US + 3.25%), 7.61%, 10/25/34 | | | | | | | 500 | | | | 453,243 | |
Unique Pub Finance Co. PLC(d) | | | | | | | | | | | | |
Series A4, 5.66%, 06/30/27 | | | GBP | | | | 35 | | | | 42,173 | |
Series N, 6.46%, 03/30/32 | | | | | | | 50 | | | | 60,451 | |
Voya CLO Ltd., Series 2019-3A, Class BR, (3 mo. LIBOR US + 1.65%), 5.73%, 10/17/32(a)(b) | | | USD | | | | 500 | | | | 481,431 | |
Whitebox CLO II Ltd., Series 2020-2A, Class DR, (3 mo. LIBOR US + 3.35%), 7.67%, 10/24/34(a)(b) | | | | | | | 500 | | | | 453,309 | |
Whitebox CLO III Ltd., Series 2021-3A, Class D, (3 mo. LIBOR US + 3.35%), 7.43%, 10/15/34(a)(b) | | | | | | | 250 | | | | 233,839 | |
| | | | | | | | | | | | |
| | |
Total Asset-Backed Securities — 6.5%
(Cost: $33,102,103) | | | | | | | | 31,224,671 | |
| | | | | | | | | | | | |
| | | |
| | | | | | Shares | | | | |
| | | |
Common Stocks | | | | | | | | | | | | |
| | | |
| Construction & Engineering — 0.0% | | | | | | | | | |
McDermott International Ltd.(e) | | | | | | | 47,837 | | | | 15,308 | |
| | | | | | | | | | | | |
|
| Diversified Financial Services — 0.0% | |
Kcad Holdings I Ltd.(c) | | | | | | | 546,753,936 | | | | 5,467 | |
| | | | | | | | | | | | |
|
| Household Durables — 0.0% | |
Berkline Benchcraft Equity LLC(c) | | | | | | | 3,155 | | | | — | |
| | | | | | | | | | | | |
|
| Metals & Mining — 0.0% | |
Ameriforge Group, Inc. | | | | | | | 801 | | | | 401 | |
Project Investor Holdings LLC, (Acquired 02/12/19,
Cost: $100,687)(c)(f) | | | | | | | 2,869 | | | | 631 | |
| | | | | | | | | | | | |
| | | | | | | | | | | 1,032 | |
|
| Software — 0.0% | |
Avaya Holdings Corp.(e) | | | | | | | 19 | | | | 4 | |
| | | | | | | | | | | | |
|
| Specialty Retail — 0.0% | |
NMG Parent LLC | | | | | | | 1,330 | | | | 201,162 | |
| | | | | | | | | | | | |
| | |
Total Common Stocks — 0.0%
(Cost: $6,923,500) | | | | | | | | 222,973 | |
| | | | | | | | | | | | |
| | | |
| | | | | | Par (000) | | | | |
| | | |
Corporate Bonds | | | | | | | | | | | | |
| | | |
| Advertising Agencies — 0.0% | | | | | | | | | |
Interpublic Group of Cos., Inc., 5.40%, 10/01/48(g) | | | USD | | | | 200 | | | | 182,757 | |
| | | | | | | | | | | | |
|
| Aerospace & Defense — 2.9% | |
Amsted Industries, Inc., 5.63%, 07/01/27(b) | | | | | | | 156 | | | | 147,991 | |
Boeing Co., 5.15%, 05/01/30(g) | | | | | | | 1,695 | | | | 1,653,709 | |
Bombardier, Inc.(b) | | | | | | | | | | | | |
7.50%, 03/15/25 | | | | | | | 39 | | | | 38,622 | |
7.13%, 06/15/26(g) | | | | | | | 715 | | | | 693,703 | |
7.88%, 04/15/27(g) | | | | | | | 605 | | | | 586,835 | |
| | |
| 70 | | 2 0 2 2 BLACK ROCK ANNUAL REPORT TO SHAREHOLDERS |
| | |
Schedule of Investments (continued) December 31, 2022 | | BlackRock Limited Duration Income Trust (BLW) (Percentages shown are based on Net Assets) |
| | | | | | | | | | | | |
| Security | | | | | Par (000) | | | Value | |
| | | |
| Aerospace & Defense (continued) | | | | | | | | | |
Bombardier, Inc.(b) (continued) | | | | | | | | | | | | |
6.00%, 02/15/28(g) | | | USD | | | | 539 | | | $ | 498,424 | |
7.45%, 05/01/34 | | | | | | | 100 | | | | 100,000 | |
F-Brasile SpA/F-Brasile U.S. LLC, Series XR, 7.38%, 08/15/26(b)(g) | | | | | | | 423 | | | | 345,803 | |
Howmet Aerospace, Inc., 5.13%, 10/01/24 | | | | | | | 5 | | | | 4,944 | |
Northrop Grumman Corp., 3.85%, 04/15/45(g) | | | | | | | 600 | | | | 478,541 | |
Rolls-Royce PLC, 5.75%, 10/15/27(b)(g) | | | | | | | 1,018 | | | | 969,645 | |
Spirit AeroSystems, Inc. | | | | | | | | | | | | |
7.50%, 04/15/25(b) | | | | | | | 32 | | | | 31,621 | |
9.38%, 11/30/29 | | | | | | | 463 | | | | 487,400 | |
TransDigm, Inc. | | | | | | | | | | | | |
8.00%, 12/15/25(b) | | | | | | | 815 | | | | 827,054 | |
6.25%, 03/15/26(b)(g) | | | | | | | 5,693 | | | | 5,614,380 | |
6.38%, 06/15/26 | | | | | | | 46 | | | | 44,756 | |
7.50%, 03/15/27 | | | | | | | 105 | | | | 103,888 | |
4.63%, 01/15/29(g) | | | | | | | 457 | | | | 401,826 | |
4.88%, 05/01/29(g) | | | | | | | 300 | | | | 261,675 | |
Triumph Group, Inc., 8.88%, 06/01/24(b)(g) | | | | | | | 661 | | | | 672,567 | |
| | | | | | | | | | | | |
| | | |
| | | | | | | | | | | 13,963,384 | |
| | | |
| Airlines — 1.4% | | | | | | | | | |
Air Canada, 3.88%, 08/15/26(b)(g) | | | | | | | 464 | | | | 410,980 | |
Allegiant Travel Co., 7.25%, 08/15/27(b) | | | | | | | 113 | | | | 107,481 | |
American Airlines Pass-Through Trust, Series 2013-2, Class A, 4.95%, 07/15/24 | | | | | | | 622 | | | | 621,503 | |
American Airlines, Inc.,
11.75%, 07/15/25(b)(g) | | | | | | | 609 | | | | 653,213 | |
American Airlines, Inc./AAdvantage Loyalty IP Ltd.(b) | | | | | | | | | | | | |
5.50%, 04/20/26 | | | | | | | 217 | | | | 209,052 | |
5.75%, 04/20/29(g) | | | | | | | 1,219 | | | | 1,113,933 | |
Avianca Midco 2 PLC, 9.00%, 12/01/28(b) | | | | | | | 152 | | | | 110,547 | |
Delta Air Lines, Inc./SkyMiles IP Ltd., 4.75%, 10/20/28(b) | | | | | | | 9 | | | | 8,648 | |
Deutsche Lufthansa AG, 3.50%, 07/14/29(d) | | | EUR | | | | 100 | | | | 90,584 | |
Finnair OYJ, 4.25%, 05/19/25(d) | | | | | | | 100 | | | | 78,349 | |
Gol Finance SA, 7.00%, 01/31/25(b) | | | USD | | | | 200 | | | | 87,037 | |
Hawaiian Brand Intellectual Property | | | | | | | | | | | | |
Ltd./HawaiianMiles Loyalty Ltd., 5.75%, 01/20/26(b) | | | | | | | 249 | | | | 225,345 | |
International Consolidated Airlines Group SA, 2.75%, 03/25/25(d) | | | EUR | | | | 100 | | | | 97,445 | |
Mileage Plus Holdings LLC/Mileage Plus Intellectual Property Assets Ltd., 6.50%, 06/20/27(b)(g) | | | USD | | | | 1,043 | | | | 1,094,666 | |
United Airlines Pass-Through Trust(g) | | | | | | | | | | | | |
Series 2020-1, Class A, 5.88%, 10/15/27 | | | | | | | 556 | | | | 547,830 | |
Series 2020-1, Class B, 4.88%, 01/15/26 | | | | | | | 38 | | | | 36,248 | |
United Airlines, Inc.(b)(g) | | | | | | | | | | | | |
4.38%, 04/15/26 | | | | | | | 582 | | | | 539,471 | |
4.63%, 04/15/29 | | | | | | | 649 | | | | 565,082 | |
| | | | | | | | | | | | |
| | | |
| | | | | | | | | | | 6,597,414 | |
| | | |
| Auto Components — 1.1% | | | | | | | | | |
Aptiv PLC, 4.40%, 10/01/46(g) | | | | | | | 240 | | | | 177,653 | |
Clarios Global LP, 6.75%, 05/15/25(b) | | | | | | | 486 | | | | 487,123 | |
Clarios Global LP/Clarios U.S. Finance
Co.(b) | | | | | | | | | | | | |
6.25%, 05/15/26 | | | | | | | 1,409 | | | | 1,377,300 | |
8.50%, 05/15/27(g) | | | | | | | 2,612 | | | | 2,550,609 | |
Dealer Tire LLC/DT Issuer LLC, 8.00%, 02/01/28(b) | | | | | | | 174 | | | | 153,098 | |
Faurecia SE, 2.75%, 02/15/27(d) | | | EUR | | | | 100 | | | | 90,068 | |
Goodyear Tire & Rubber Co. | | | | | | | | | | | | |
5.00%, 07/15/29 | | | USD | | | | 104 | | | | 86,752 | |
| | | | | | | | | | | | |
| Security | | | | | Par (000) | | | Value | |
| | | |
| Auto Components (continued) | | | | | | | | | |
Goodyear Tire & Rubber Co. (continued) | | | | | | | | | | | | |
5.63%, 04/30/33 | | | USD | | | | 109 | | | $ | 88,977 | |
ZF Finance GmbH(d) | | | | | | | | | | | | |
3.00%, 09/21/25 | | | EUR | | | | 100 | | | | 98,349 | |
2.00%, 05/06/27 | | | | | | | 100 | | | | 87,263 | |
| | | | | | | | | | | | |
| | | |
| | | | | | | | | | | 5,197,192 | |
| | | |
| Automobiles — 1.6% | | | | | | | | | |
Asbury Automotive Group, Inc. | | | | | | | | | | | | |
4.50%, 03/01/28 | | | USD | | | | 129 | | | | 113,572 | |
4.75%, 03/01/30 | | | | | | | 124 | | | | 103,708 | |
5.00%, 02/15/32(b) | | | | | | | 157 | | | | 129,164 | |
Constellation Automotive Financing PLC, 4.88%, 07/15/27(d) | | | GBP | | | | 100 | | | | 78,789 | |
Ford Motor Co. | | | | | | | | | | | | |
0.00%, 03/15/26(h)(i) | | | USD | | | | 406 | | | | 383,061 | |
4.35%, 12/08/26 | | | | | | | 11 | | | | 10,432 | |
3.25%, 02/12/32(g) | | | | | | | 623 | | | | 467,214 | |
6.10%, 08/19/32(g) | | | | | | | 179 | | | | 165,281 | |
Ford Motor Credit Co. LLC | | | | | | | | | | | | |
3.81%, 01/09/24(g) | | | | | | | 629 | | | | 611,720 | |
4.69%, 06/09/25 | | | | | | | 200 | | | | 190,293 | |
5.13%, 06/16/25(g) | | | | | | | 490 | | | | 471,057 | |
3.38%, 11/13/25(g) | | | | | | | 200 | | | | 180,803 | |
4.39%, 01/08/26(g) | | | | | | | 400 | | | | 372,584 | |
2.70%, 08/10/26 | | | | | | | 295 | | | | 256,178 | |
4.95%, 05/28/27(g) | | | | | | | 200 | | | | 186,580 | |
2.90%, 02/16/28(g) | | | | | | | 295 | | | | 243,646 | |
4.00%, 11/13/30 | | | | | | | 200 | | | | 164,168 | |
3.63%, 06/17/31(g) | | | | | | | 400 | | | | 314,223 | |
General Motors Co., 5.40%, 10/15/29(g) | | | | | | | 679 | | | | 647,968 | |
General Motors Financial Co., Inc., 2.70%, 08/20/27(g) | | | | | | | 1,500 | | | | 1,311,227 | |
Group 1 Automotive, Inc., 4.00%, 08/15/28(b) | | | | | | | 45 | | | | 38,089 | |
Jaguar Land Rover Automotive PLC, 4.50%, 07/15/28(d) | | | EUR | | | | 100 | | | | 80,837 | |
Ken Garff Automotive LLC, 4.88%, 09/15/28(b) | | | USD | | | | 122 | | | | 102,056 | |
LCM Investments Holdings II LLC, 4.88%, 05/01/29(b) | | | | | | | 292 | | | | 233,830 | |
Lithia Motors, Inc., 3.88%, 06/01/29(b) | | | | | | | 131 | | | | 107,696 | |
MajorDrive Holdings IV LLC, 6.38%, 06/01/29(b) | | | | | | | 178 | | | | 132,822 | |
Penske Automotive Group, Inc. | | | | | | | | | | | | |
3.50%, 09/01/25(g) | | | | | | | 214 | | | | 198,605 | |
3.75%, 06/15/29 | | | | | | | 69 | | | | 56,003 | |
Renault SA, 2.38%, 05/25/26(d) | | | EUR | | | | 100 | | | | 96,156 | |
TML Holdings Pte. Ltd., 4.35%, 06/09/26(d) | | | USD | | | | 200 | | | | 178,600 | |
Wabash National Corp., 4.50%, 10/15/28(b) | | | | | | | 220 | | | | 187,349 | |
| | | | | | | | | | | | |
| | | |
| | | | | | | | | | | 7,813,711 | |
| | | |
| Banks — 0.8% | | | | | | | | | |
Banco BPM SpA, (5 year EUR Swap + 3.17%), 2.88%, 06/29/31(a)(d) | | | EUR | | | | 100 | | | | 88,582 | |
Banco Espirito Santo SA(e)(j) | | | | | | | | | | | | |
4.75%, 01/15/22 | | | | | | | 100 | | | | 12,845 | |
4.00%, 01/21/22 | | | | | | | 100 | | | | 12,845 | |
Bangkok Bank PCL, (5 year CMT + 4.73%), 5.00% | | | USD | | | | 201 | | | | 190,297 | |
Bank of Communications Co. Ltd., (5 year CMT + 3.35%), 3.80%(a)(d)(k) | | | | | | | 200 | | | | 191,000 | |
Chong Hing Bank Ltd., (5 year CMT + 3.86%), 5.70%(a)(d)(k) | | | | | | | 250 | | | | 235,906 | |
Grupo Aval Ltd., 4.38%, 02/04/30(b) | | | | | | | 200 | | | | 161,600 | |
Intesa Sanpaolo SpA, 5.71%, 01/15/26(b) | | | | | | | 200 | | | | 192,200 | |
| | |
SCHEDULE OF INVESTMENTS | | 71 |
| | |
Schedule of Investments (continued) December 31, 2022 | | BlackRock Limited Duration Income Trust (BLW) (Percentages shown are based on Net Assets) |
| | | | | | | | | | | | |
| Security | | | | | Par (000) | | | Value | |
| | | |
| Banks (continued) | | | | | | | | | |
Krung Thai Bank PCL, (5 year CMT + 3.53%), 4.40%(a)(d)(k) | | | USD | | | | 202 | | | $ | 180,007 | |
Northern Trust Corp., 6.13%, 11/02/32(g) | | | | | | | 219 | | | | 230,923 | |
Standard Chartered PLC, (3 mo. LIBOR US + 1.08%), 3.89%, 03/15/24(a)(b)(g) | | | | | | | 1,500 | | | | 1,492,771 | |
SVB Financial Group, Series D, (5 year CMT + 3.07%), 4.25%(a)(g)(k) | | | | | | | 1,000 | | | | 656,049 | |
Wells Fargo & Co., Series BB, (5 year CMT + 3.45%), 3.90%(a)(g)(k) | | | | | | | 365 | | | | 319,472 | |
| | | | | | | | | | | | |
| | | |
| | | | | | | | | | | 3,964,497 | |
| | | |
| Beverages — 1.5% | | | | | | | | | |
Anheuser-Busch Cos. LLC/Anheuser-Busch InBev Worldwide, Inc., 4.90%, 02/01/46(g) | | | | | | | 800 | | | | 727,260 | |
ARD Finance SA, (6.50% Cash or 7.25% PIK), 6.50%, 06/30/27(b)(g)(l) | | | | | | | 834 | | | | 579,715 | |
Ardagh Metal Packaging Finance USA LLC/Ardagh Metal Packaging Finance PLC(b) | | | | | | | | | | | | |
6.00%, 06/15/27(g) | | | | | | | 400 | | | | 391,578 | |
3.25%, 09/01/28 | | | | | | | 200 | | | | 169,889 | |
4.00%, 09/01/29(g) | | | | | | | 2,234 | | | | 1,770,506 | |
Ball Corp. | | | | | | | | | | | | |
2.88%, 08/15/30 | | | | | | | 36 | | | | 28,732 | |
3.13%, 09/15/31(g) | | | | | | | 377 | | | | 302,780 | |
Canpack SA/Canpack U.S. LLC, 3.13%, 11/01/25(b) | | | | | | | 211 | | | | 183,636 | |
Crown Cork & Seal Co., Inc., 7.38%, 12/15/26 | | | | | | | 34 | | | | 35,003 | |
Mauser Packaging Solutions Holding Co., 5.50%, 04/15/24(b)(g) | | | | | | | 794 | | | | 772,044 | |
OI European Group BV, 2.88%, 02/15/25(d) | | | EUR | | | | 100 | | | | 102,763 | |
Silgan Holdings, Inc., 4.13%, 02/01/28 | | | USD | | | | 84 | | | | 77,713 | |
Trivium Packaging Finance BV(b)(g) | | | | | | | | | | | | |
5.50%, 08/15/26 | | | | | | | 1,004 | | | | 920,604 | |
8.50%, 08/15/27 | | | | | | | 1,367 | | | | 1,254,257 | |
| | | | | | | | | | | | |
| | | |
| | | | | | | | | | | 7,316,480 | |
| | | |
| Biotechnology — 0.0% | | | | | | | | | |
Cidron Aida Finco SARL, 5.00%, 04/01/28(d) | | | EUR | | | | 100 | | | | 91,256 | |
| | | | | | | | | | | | |
| | | |
| Building Materials(b) — 0.5% | | | | | | | | | |
Camelot Return Merger Sub, Inc., 8.75%, 08/01/28 | | | USD | | | | 207 | | | | 189,949 | |
James Hardie International Finance DAC, 5.00%, 01/15/28 | | | | | | | 200 | | | | 183,500 | |
Jeld-Wen, Inc., 6.25%, 05/15/25 | | | | | | | 146 | | | | 136,560 | |
Masonite International Corp. | | | | | | | | | | | | |
Class C, 5.38%, 02/01/28 | | | | | | | 101 | | | | 93,386 | |
Class C, 3.50%, 02/15/30 | | | | | | | 214 | | | | 173,110 | |
New Enterprise Stone & Lime Co., Inc. | | | | | | | | | | | | |
5.25%, 07/15/28 | | | | | | | 81 | | | | 71,926 | |
9.75%, 07/15/28 | | | | | | | 38 | | | | 35,110 | |
Smyrna Ready Mix Concrete LLC, 6.00%, 11/01/28(g) | | | | | | | 503 | | | | 450,034 | |
Standard Industries, Inc.(g) | | | | | | | | | | | | |
5.00%, 02/15/27 | | | | | | | 209 | | | | 192,851 | |
4.75%, 01/15/28 | | | | | | | 80 | | | | 71,991 | |
4.38%, 07/15/30 | | | | | | | 683 | | | | 556,594 | |
3.38%, 01/15/31 | | | | | | | 283 | | | | 212,958 | |
Summit Materials LLC/Summit Materials Finance Corp., 5.25%, 01/15/29 | | | | | | | 235 | | | | 218,791 | |
| | | | | | | | | | | | |
| | | |
| | | | | | | | | | | 2,586,760 | |
| | | |
| Building Products(b) — 0.8% | | | | | | | | | |
Advanced Drainage Systems, Inc. 5.00%, 09/30/27 | | | | | | | 218 | | | | 203,285 | |
| | | | | | | | | | | | |
| Security | | | | | Par (000) | | | Value | |
| | | |
| Building Products (continued) | | | | | | | | | |
Advanced Drainage Systems, Inc. (continued) 6.38%, 06/15/30(g) | | | USD | | | | 499 | | | $ | 484,858 | |
Beacon Roofing Supply, Inc.,
4.13%, 05/15/29 | | | | | | | 123 | | | | 102,212 | |
Foundation Building Materials, Inc., 6.00%, 03/01/29(g) | | | | | | | 111 | | | | 83,106 | |
GYP Holdings III Corp., 4.63%, 05/01/29 | | | | | | | 237 | | | | 193,503 | |
LBM Acquisition LLC, 6.25%, 01/15/29 | | | | | | | 37 | | | | 23,545 | |
Specialty Building Products Holdings LLC/SBP Finance Corp., 6.38%, 09/30/26 | | | | | | | 87 | | | | 70,049 | |
SRS Distribution, Inc.(g) | | | | | | | | | | | | |
4.63%, 07/01/28 | | | | | | | 516 | | | | 457,419 | |
6.13%, 07/01/29 | | | | | | | 499 | | | | 403,451 | |
6.00%, 12/01/29 | | | | | | | 397 | | | | 315,954 | |
White Cap Buyer LLC, 6.88%, 10/15/28(g) | | | | | | | 1,369 | | | | 1,184,197 | |
White Cap Parent LLC, (8.25% PIK), 8.25%, 03/15/26(l) | | | | | | | 235 | | | | 203,155 | |
| | | | | | | | | | | | |
| | | |
| | | | | | | | | | | 3,724,734 | |
| | | |
| Capital Markets — 1.4% | | | | | | | | | |
AG TTMT Escrow Issuer LLC, 8.63%, 09/30/27(b) | | | | | | | 77 | | | | 77,385 | |
Blackstone Private Credit Fund | | | | | | | | | | | | |
7.05%, 09/29/25(b) | | | | | | | 79 | | | | 78,374 | |
3.25%, 03/15/27 | | | | | | | 75 | | | | 63,147 | |
Charles Schwab Corp., Series H, (10 year CMT + 3.08%), 4.00%(a)(g)(k) | | | | | | | 2,835 | | | | 2,260,771 | |
Compass Group Diversified Holdings LLC, 5.25%, 04/15/29(b)(g) | | | | | | | 214 | | | | 183,139 | |
GLP Capital LP/GLP Financing II, Inc., 3.25%, 01/15/32 | | | | | | | 498 | | | | 398,094 | |
Icahn Enterprises LP/Icahn Enterprises Finance Corp. | | | | | | | | | | | | |
6.25%, 05/15/26(g) | | | | | | | 394 | | | | 378,593 | |
5.25%, 05/15/27(g) | | | | | | | 674 | | | | 617,114 | |
4.38%, 02/01/29 | | | | | | | 295 | | | | 249,467 | |
Kane Bidco Ltd., 6.50%, 02/15/27(d) | | | GBP | | | | 100 | | | | 100,343 | |
NFP Corp.(b) | | | | | | | | | | | | |
4.88%, 08/15/28(g) | | | USD | | | | 595 | | | | 506,521 | |
6.88%, 08/15/28(g) | | | | | | | 1,373 | | | | 1,131,735 | |
7.50%, 10/01/30 | | | | | | | 105 | | | | 98,740 | |
Owl Rock Capital Corp. | | | | | | | | | | | | |
4.25%, 01/15/26 | | | | | | | 17 | | | | 15,606 | |
3.40%, 07/15/26 | | | | | | | 63 | | | | 55,009 | |
Owl Rock Core Income Corp. | | | | | | | | | | | | |
3.13%, 09/23/26 | | | | | | | 43 | | | | 36,591 | |
7.75%, 09/16/27(b)(g) | | | | | | | 302 | | | | 301,023 | |
SURA Asset Management SA, 4.88%, 04/17/24(d) | | | | | | | 188 | | | | 186,590 | |
| | | | | | | | | | | | |
| | | |
| | | | | | | | | | | 6,738,242 | |
| | | |
| Chemicals — 1.7% | | | | | | | | | |
Alpek SAB de CV, 3.25%, 02/25/31(b) | | | | | | | 200 | | | | 166,163 | |
Ashland LLC, 3.38%, 09/01/31(b)(g) | | | | | | | 296 | | | | 236,584 | |
Avient Corp., 7.13%, 08/01/30(b) | | | | | | | 164 | | | | 160,315 | |
Axalta Coating Systems LLC, 3.38%, 02/15/29(b)(g) . | | | | | | | 447 | | | | 368,849 | |
Axalta Coating Systems LLC/Axalta Coating Systems Dutch Holding B BV, 4.75%, 06/15/27(b)(g) | | | | | | | 170 | | | | 157,148 | |
Celanese U.S. Holdings LLC, 6.17%, 07/15/27(g) | | | | | | | 275 | | | | 271,240 | |
Diamond BC BV, 4.63%, 10/01/29(b)(g) | | | | | | | 571 | | | | 458,227 | |
Element Solutions, Inc.,
3.88%, 09/01/28(b)(g) | | | | | | | 1,442 | | | | 1,225,700 | |
Equate Petrochemical BV, 4.25%, 11/03/26(d) | | | | | | | 200 | | | | 190,850 | |
HB Fuller Co., 4.25%, 10/15/28 | | | | | | | 110 | | | | 97,350 | |
| | |
| 72 | | 2 0 2 2 BLACK ROCK ANNUAL REPORT TO SHAREHOLDERS |
| | |
Schedule of Investments (continued) December 31, 2022 | | BlackRock Limited Duration Income Trust (BLW) (Percentages shown are based on Net Assets) |
| | | | | | | | | | | | |
| Security | | | | | Par (000) | | | Value | |
| | | |
| Chemicals (continued) | | | | | | | | | |
Herens Holdco SARL, 4.75%, 05/15/28(b)(g) | | | USD | | | | 612 | | | $ | 457,415 | |
Herens Midco SARL, 5.25%, 05/15/29(d) | | | EUR | | | | 100 | | | | 73,931 | |
Illuminate Buyer LLC/Illuminate Holdings IV, Inc., 9.00%, 07/01/28(b)(g) | | | USD | | | | 368 | | | | 308,099 | |
Ingevity Corp., 3.88%, 11/01/28(b) | | | | | | | 84 | | | | 72,229 | |
Kobe U.S. Midco 2, Inc., (9.25% Cash or 10.00% PIK), 9.25%, 11/01/26(b)(l) | | | | | | | 259 | | | | 181,300 | |
LSF11 A5 HoldCo LLC, 6.63%, 10/15/29(b) | | | | | | | 113 | | | | 93,351 | |
Minerals Technologies, Inc., 5.00%, 07/01/28(b) | | | | | | | 169 | | | | 150,511 | |
Monitchem HoldCo 3 SA, 5.25%, 03/15/25(d) | | | EUR | | | | 100 | | | | 102,619 | |
NOVA Chemicals Corp., 4.88%, 06/01/24(b) | | | USD | | | | 67 | | | | 64,822 | |
Sasol Financing USA LLC, 5.50%, 03/18/31 | | | | | | | 200 | | | | 161,913 | |
SCIL IV LLC/SCIL USA Holdings LLC, 5.38%, 11/01/26(b)(g) | | | | | | | 239 | | | | 202,553 | |
Scotts Miracle-Gro Co. | | | | | | | | | | | | |
4.00%, 04/01/31 | | | | | | | 169 | | | | 129,106 | |
4.38%, 02/01/32 | | | | | | | 27 | | | | 20,350 | |
SK Invictus Intermediate II Sarl,
5.00%, 10/30/29(b)(g) | | | | | | | 550 | | | | 451,000 | |
WESCO Distribution, Inc.(b)(g) | | | | | | | | | | | | |
7.13%, 06/15/25 | | | | | | | 676 | | | | 684,458 | |
7.25%, 06/15/28 | | | | | | | 636 | | | | 644,251 | |
WR Grace Holdings LLC(b) | | | | | | | | | | | | |
5.63%, 10/01/24 | | | | | | | 216 | | | | 212,760 | |
4.88%, 06/15/27 | | | | | | | 122 | | | | 108,108 | |
5.63%, 08/15/29(g) | | | | | | | 1,131 | | | | 913,022 | |
| | | | | | | | | | | | |
| | | |
| | | | | | | | | | | 8,364,224 | |
|
| Commercial Services & Supplies — 0.8% | |
ADT Security Corp. | | | | | | | | | | | | |
4.13%, 06/15/23 | | | | | | | 9 | | | | 8,910 | |
4.13%, 08/01/29(b) | | | | | | | 27 | | | | 22,962 | |
4.88%, 07/15/32(b) | | | | | | | 44 | | | | 37,392 | |
Albion Financing 1 SARL/Aggreko Holdings, Inc., 6.13%, 10/15/26(b) | | | | | | | 200 | | | | 178,362 | |
APX Group, Inc., 5.75%, 07/15/29(b)(g) | | | | | | | 268 | | | | 221,954 | |
Avis Budget Car Rental LLC/Avis Budget Finance, Inc., 5.38%, 03/01/29(b)(g) | | | | | | | 36 | | | | 30,796 | |
Fortress Transportation & Infrastructure Investors LLC(b) | | | | | | | | | | | | |
6.50%, 10/01/25 | | | | | | | 57 | | | | 53,592 | |
5.50%, 05/01/28(g) | | | | | | | 310 | | | | 264,464 | |
Herc Holdings, Inc., 5.50%, 07/15/27(b)(g) | | | | | | | 362 | | | | 337,655 | |
Hertz Corp.(b) | | | | | | | | | | | | |
4.63%, 12/01/26 | | | | | | | 126 | | | | 105,525 | |
5.00%, 12/01/29(g) | | | | | | | 101 | | | | 76,619 | |
Metis Merger Sub LLC, 6.50%, 05/15/29(b) | | | | | | | 125 | | | | 104,935 | |
NESCO Holdings II, Inc., 5.50%, 04/15/29(b) | | | | | | | 239 | | | | 209,125 | |
Prime Security Services Borrower LLC/Prime Finance, Inc.(b) | | | | | | | | | | | | |
5.25%, 04/15/24 | | | | | | | 141 | | | | 138,506 | |
5.75%, 04/15/26(g) | | | | | | | 480 | | | | 462,000 | |
6.25%, 01/15/28(g) | | | | | | | 180 | | | | 163,829 | |
Ritchie Bros Auctioneers, Inc., 5.38%, 01/15/25(b) | | | | | | | 187 | | | | 183,728 | |
Sotheby’s/Bidfair Holdings, Inc., 5.88%, 06/01/29(b)(g) | | | | | | | 653 | | | | 548,324 | |
United Rentals North America, Inc., 5.25%, 01/15/30 | | | | | | | 161 | | | | 151,272 | |
| | | | | | | | | | | | |
| Security | | | | | Par (000) | | | Value | |
|
| Commercial Services & Supplies (continued) | |
Williams Scotsman International, Inc.(b) | | | | | | | | | | | | |
6.13%, 06/15/25(g) | | | USD | | | | 403 | | | $ | 398,970 | |
4.63%, 08/15/28 | | | | | | | 243 | | | | 219,308 | |
| | | | | | | | | | | | |
| | | |
| | | | | | | | | | | 3,918,228 | |
| | | |
| Communications Equipment — 0.5% | | | | | | | | | |
Ciena Corp., 4.00%, 01/31/30(b) | | | | | | | 104 | | | | 91,531 | |
CommScope Technologies LLC, 6.00%, 06/15/25(b)(g) | | | | | | | 713 | | | | 648,830 | |
CommScope, Inc.(b) | | | | | | | | | | | | |
6.00%, 03/01/26 | | | | | | | 132 | | | | 121,822 | |
8.25%, 03/01/27 | | | | | | | 158 | | | | 122,450 | |
7.13%, 07/01/28(g) | | | | | | | 138 | | | | 98,652 | |
4.75%, 09/01/29(g) | | | | | | | 416 | | | | 335,379 | |
Nokia OYJ, 4.38%, 06/12/27 | | | | | | | 149 | | | | 140,666 | |
Viasat, Inc.(b) | | | | | | | | | | | | |
5.63%, 09/15/25 | | | | | | | 270 | | | | 250,503 | |
5.63%, 04/15/27(g) | | | | | | | 67 | | | | 60,860 | |
6.50%, 07/15/28(g) | | | | | | | 161 | | | | 120,786 | |
Viavi Solutions, Inc., 3.75%, 10/01/29(b)(g) | | | | | | | 355 | | | | 298,361 | |
| | | | | | | | | | | | |
| | | |
| | | | | | | | | | | 2,289,840 | |
| | | |
| Construction Materials(b) — 0.2% | | | | | | | | | |
American Builders & Contractors Supply Co., Inc. | | | | | | | | | | | | |
4.00%, 01/15/28(g) | | | | | | | 281 | | | | 250,708 | |
3.88%, 11/15/29 | | | | | | | 59 | | | | 48,230 | |
BCPE Empire Holdings, Inc., 7.63%, 05/01/27 | | | | | | | 131 | | | | 117,478 | |
H&E Equipment Services, Inc., 3.88%, 12/15/28 | | | | | | | 58 | | | | 49,404 | |
Resideo Funding, Inc., 4.00%, 09/01/29 | | | | | | | 59 | | | | 47,704 | |
Wesco Aircraft Holdings, Inc., 9.00%, 11/15/26 | | | | | | | 672 | | | | 450,240 | |
| | | | | | | | | | | | |
| | | |
| | | | | | | | | | | 963,764 | |
| | | |
| Consumer Discretionary — 1.3% | | | | | | | | | |
APi Group DE, Inc.(b) | | | | | | | | | | | | |
4.13%, 07/15/29 | | | | | | | 132 | | | | 109,404 | |
4.75%, 10/15/29 | | | | | | | 100 | | | | 86,686 | |
Carnival Corp. | | | | | | | | | | | | |
10.13%, 02/01/26(d) | | | EUR | | | | 100 | | | | 105,829 | |
10.50%, 02/01/26(b)(g) | | | USD | | | | 361 | | | | 362,718 | |
7.63%, 03/01/26(b) | | | | | | | 71 | | | | 56,274 | |
5.75%, 03/01/27(b)(g) | | | | | | | 893 | | | | 637,638 | |
9.88%, 08/01/27(b) | | | | | | | 262 | | | | 247,590 | |
4.00%, 08/01/28(b)(g) | | | | | | | 477 | | | | 388,951 | |
6.00%, 05/01/29(b)(g) | | | | | | | 371 | | | | 247,228 | |
Carnival Holdings Bermuda Ltd., 10.38%, 05/01/28(b)(g) | | | | | | | 1,138 | | | | 1,168,282 | |
CoreLogic, Inc., 4.50%, 05/01/28(b)(g) | | | | | | | 511 | | | | 392,039 | |
Legends Hospitality Holding Co. LLC/Legends | | | | | | | | | | | | |
Hospitality Co.-Issuer, Inc., 5.00%, 02/01/26(b) | | | | | | | 91 | | | | 80,990 | |
Life Time, Inc.(b) | | | | | | | | | | | | |
5.75%, 01/15/26 | | | | | | | 258 | | | | 240,069 | |
8.00%, 04/15/26 | | | | | | | 215 | | | | 193,500 | |
Lindblad Expeditions LLC, 6.75%, 02/15/27(b) | | | | | | | 305 | | | | 276,687 | |
NCL Corp. Ltd.(b) | | | | | | | | | | | | |
5.88%, 03/15/26 | | | | | | | 253 | | | | 198,724 | |
7.75%, 02/15/29 | | | | | | | 67 | | | | 50,420 | |
NCL Finance Ltd., 6.13%, 03/15/28(b)(g) | | | | | | | 261 | | | | 192,676 | |
Royal Caribbean Cruises Ltd.(b) | | | | | | | | | | | | |
11.50%, 06/01/25 | | | | | | | 120 | | | | 128,700 | |
4.25%, 07/01/26 | | | | | | | 72 | | | | 58,201 | |
5.50%, 08/31/26 | | | | | | | 91 | | | | 76,554 | |
| | |
SCHEDULE OF INVESTMENTS | | 73 |
| | |
Schedule of Investments (continued) December 31, 2022 | | BlackRock Limited Duration Income Trust (BLW) (Percentages shown are based on Net Assets) |
| | | | | | | | | | | | |
| Security | | | | | Par (000) | | | Value | |
| | | |
| Consumer Discretionary (continued) | | | | | | | | | |
Royal Caribbean Cruises Ltd.(b) (continued) | | | | | | | | | | | | |
5.38%, 07/15/27 | | | USD | | | | 134 | | | $ | 108,500 | |
11.63%, 08/15/27 | | | | | | | 176 | | | | 176,744 | |
5.50%, 04/01/28(g) | | | | | | | 73 | | | | 58,257 | |
8.25%, 01/15/29 | | | | | | | 191 | | | | 191,477 | |
9.25%, 01/15/29(g) | | | | | | | 345 | | | | 354,522 | |
Viking Ocean Cruises Ship VII Ltd., 5.63%, 02/15/29(b) | | | | | | | 57 | | | | 45,885 | |
| | | | | | | | | | | | |
| | | | | | | | | | | 6,234,545 | |
| | | |
| Consumer Finance — 1.7% | | | | | | | | | |
American Express Co., (5 year CMT + 2.85%), 3.55%(a)(g)(k) | | | | | | | 735 | | | | 603,803 | |
Block, Inc., 3.50%, 06/01/31(g) | | | | | | | 1,224 | | | | 976,660 | |
Discover Financial Services, 6.70%, 11/29/32 | | | | | | | 85 | | | | 86,401 | |
Equifax, Inc., 2.60%, 12/15/25 | | | | | | | 59 | | | | 54,880 | |
Global Payments, Inc. | | | | | | | | | | | | |
4.95%, 08/15/27(g) | | | | | | | 100 | | | | 97,000 | |
3.20%, 08/15/29(g) | | | | | | | 564 | | | | 479,429 | |
2.90%, 05/15/30(g) | | | | | | | 754 | | | | 617,803 | |
5.40%, 08/15/32 | | | | | | | 86 | | | | 81,902 | |
HealthEquity, Inc., 4.50%, 10/01/29(b)(g) | | | | | | | 640 | | | | 559,296 | |
MPH Acquisition Holdings LLC, 5.50%, 09/01/28(b)(g) | | | | | | | 220 | | | | 171,622 | |
Navient Corp. | | | | | | | | | | | | |
7.25%, 09/25/23 | | | | | | | 77 | | | | 76,937 | |
6.13%, 03/25/24 | | | | | | | 86 | | | | 84,247 | |
5.88%, 10/25/24 | | | | | | | 82 | | | | 79,339 | |
5.50%, 03/15/29 | | | | | | | 211 | | | | 172,176 | |
OneMain Finance Corp. | | | | | | | | | | | | |
6.88%, 03/15/25 | | | | | | | 226 | | | | 217,113 | |
7.13%, 03/15/26(g) | | | | | | | 305 | | | | 290,018 | |
3.50%, 01/15/27 | | | | | | | 304 | | | | 251,703 | |
6.63%, 01/15/28(g) | | | | | | | 240 | | | | 220,999 | |
5.38%, 11/15/29 | | | | | | | 105 | | | | 85,880 | |
4.00%, 09/15/30 | | | | | | | 110 | | | | 82,075 | |
Sabre Global, Inc.(b) | | | | | | | | | | | | |
9.25%, 04/15/25 | | | | | | | 164 | | | | 163,365 | |
7.38%, 09/01/25 | | | | | | | 252 | | | | 242,182 | |
11.25%, 12/15/27 | | | | | | | 90 | | | | 92,675 | |
Shift4 Payments LLC/Shift4 Payments Finance Sub, Inc.,
4.63%, 11/01/26(b)(g) | | | | | | | 431 | | | | 407,204 | |
Shift4 Payments, Inc., 0.00%, 12/15/25(h)(i) | | | | | | | 174 | | | | 172,369 | |
SLM Corp., 3.13%, 11/02/26 | | | | | | | 173 | | | | 147,128 | |
Verscend Escrow Corp.,
9.75%, 08/15/26(b)(g) | | | | | | | 1,817 | | | | 1,780,133 | |
| | | | | | | | | | | | |
| | | | | | | | | | | 8,294,339 | |
| | | |
| Containers & Packaging — 0.5% | | | | | | | | | |
Clydesdale Acquisition Holdings, Inc.(b)(g) | | | | | | | | | | | | |
6.63%, 04/15/29 | | | | | | | 558 | | | | 530,519 | |
8.75%, 04/15/30 | | | | | | | 377 | | | | 322,701 | |
Crown Americas LLC/Crown Americas Capital Corp. V, 4.25%, 09/30/26 | | | | | | | 196 | | | | 186,902 | |
Crown Americas LLC/Crown Americas Capital Corp. VI, 4.75%, 02/01/26(g) | | | | | | | 424 | | | | 411,598 | |
Graham Packaging Co., Inc., 7.13%, 08/15/28(b) | | | | | | | 60 | | | | 50,061 | |
Graphic Packaging International LLC(b) | | | | | | | | | | | | |
4.75%, 07/15/27 | | | | | | | 89 | | | | 83,771 | |
3.50%, 03/15/28 | | | | | | | 17 | | | | 14,795 | |
3.50%, 03/01/29 | | | | | | | 61 | | | | 51,974 | |
Klabin Austria GmbH, 3.20%, 01/12/31(b) | | | | | | | 200 | | | | 161,000 | |
| | | | | | | | | | | | |
| Security | | | | | Par (000) | | | Value | |
| | | |
| Containers & Packaging (continued) | | | | | | | | | |
LABL, Inc., 5.88%, 11/01/28(b) | | | USD | | | | 261 | | | $ | 227,402 | |
Sealed Air Corp.(b) | | | | | | | | | | | | |
5.13%, 12/01/24 | | | | | | | 46 | | | | 45,195 | |
4.00%, 12/01/27 | | | | | | | 73 | | | | 66,221 | |
Suzano Austria GmbH, 3.13%, 01/15/32 | | | | | | | 71 | | | | 55,291 | |
| | | | | | | | | | | | |
| | | |
| | | | | | | | | | | 2,207,430 | |
| | | |
| Diversified Consumer Services — 1.4% | | | | | | | | | |
Allied Universal Holdco LLC/Allied Universal Finance Corp.(b) | | | | | | | | | | | | |
6.63%, 07/15/26 | | | | | | | 1,737 | | | | 1,589,355 | |
9.75%, 07/15/27(g) | | | | | | | 601 | | | | 522,870 | |
6.00%, 06/01/29(g) | | | | | | | 1,356 | | | | 984,130 | |
Allied Universal Holdco LLC/Allied Universal Finance Corp./Atlas Luxco 4 SARL,
4.63%, 06/01/28(b)(g) | | | | | | | 1,348 | | | | 1,104,257 | |
Clarivate Science Holdings Corp.(b)(g) | | | | | | | | | | | | |
3.88%, 07/01/28 | | | | | | | 631 | | | | 546,696 | |
4.88%, 07/01/29 | | | | | | | 459 | | | | 390,311 | |
Garda World Security Corp., 4.63%, 02/15/27(b) | | | | | | | 132 | | | | 116,553 | |
Graham Holdings Co., 5.75%, 06/01/26(b) | | | | | | | 140 | | | | 137,564 | |
Rekeep SpA, 7.25%, 02/01/26(d) | | | EUR | | | | 100 | | | | 88,979 | |
Service Corp. International | | | | | | | | | | | | |
5.13%, 06/01/29 | | | USD | | | | 238 | | | | 223,131 | |
3.38%, 08/15/30(g) | | | | | | | 263 | | | | 213,794 | |
4.00%, 05/15/31(g) | | | | | | | 333 | | | | 280,461 | |
Sotheby’s, 7.38%, 10/15/27(b)(g) | | | | | | | 451 | | | | 422,871 | |
| | | | | | | | | | | | |
| | | | | | | | | | | 6,620,972 | |
| | | |
| Diversified Financial Services — 2.8% | | | | | | | | | |
Acuris Finance U.S., Inc./Acuris Finance SARL, 5.00%, 05/01/28(b)(g) | | | | | | | 403 | | | | 321,392 | |
ASG Finance Designated Activity Co., 7.88%, 12/03/24(b) | | | | | | | 200 | | | | 193,000 | |
Bank of America Corp., (1 day SOFR + 1.99%), 6.20%, 11/10/28(a)(g) | | | | | | | 435 | | | | 449,125 | |
Barclays PLC | | | | | | | | | | | | |
3.65%, 03/16/25(g) | | | | | | | 3,600 | | | | 3,458,315 | |
5.20%, 05/12/26 | | | | | | | 200 | | | | 194,499 | |
Blackstone Holdings Finance Co. LLC, 5.90%, 11/03/27(g) | | | | | | | 631 | | | | 635,725 | |
BNP Paribas SA, (5 year CMT + 3.34%), 4.63%(a)(b)(g)(k) | | | | | | | 1,500 | | | | 1,158,901 | |
Citigroup, Inc.(a)(k) | | | | | | | | | | | | |
(5 year CMT + 3.42%), 3.88%(g) | | | | | | | 2,000 | | | | 1,705,000 | |
Series W, (5 year CMT + 3.60%), 4.00% | | | | | | | 155 | | | | 135,024 | |
Series Y, (5 year CMT + 3.00%), 4.15%(g) | | | | | | | 490 | | | | 400,050 | |
Credit Suisse Group AG, (1 year EURIBOR ICE Swap Rate + 4.95%),
7.75%, 03/01/29(a)(d) | | | EUR | | | | 100 | | | | 106,291 | |
Garfunkelux Holdco 3 SA, 7.75%, 11/01/25(d) | | | GBP | | | | 100 | | | | 93,932 | |
Global Aircraft Leasing Co. Ltd., (6.50% Cash or 7.25% PIK), 6.50%, 09/15/24(b)(l) | | | USD | | | | 231 | | | | 196,783 | |
Goldman Sachs Group, Inc., Series R, (5 year CMT + 3.22%), 4.95%(a)(k) | | | | | | | 730 | | | | 664,289 | |
HSBC Holdings PLC | | | | | | | | | | | | |
4.38%, 11/23/26(g) | | | | | | | 395 | | | | 379,328 | |
(5 year CMT + 3.22%), 4.00%(a)(g)(k) | | | | | | | 290 | | | | 250,837 | |
(5 year USD ICE Swap + 4.37%),
6.38%(a)(g)(k) | | | | | | | 500 | | | | 484,539 | |
(1 day SOFR + 3.35%), 7.39%, 11/03/28(a) | | | | | | | 265 | | | | 278,502 | |
Intrum AB, 3.00%, 09/15/27(d) | | | EUR | | | | 100 | | | | 84,903 | |
| | |
| 74 | | 2 0 2 2 BLACK ROCK ANNUAL REPORT TO SHAREHOLDERS |
| | |
Schedule of Investments (continued) December 31, 2022 | | BlackRock Limited Duration Income Trust (BLW) (Percentages shown are based on Net Assets) |
| | | | | | | | | | | | |
| Security | | | | | Par (000) | | | Value | |
|
| Diversified Financial Services (continued) | |
ION Trading Technologies SARL, 5.75%, 05/15/28(b) | | | USD | | | | 200 | | | $ | 166,750 | |
Jefferies Finance LLC/JFIN Co.-Issuer Corp., 5.00%, 08/15/28(b) | | | | | | | 325 | | | | 265,112 | |
JPMorgan Chase & Co., (1 day SOFR + 2.58%), 5.72%, 09/14/33(a)(g) | | | | | | | 195 | | | | 190,330 | |
Ladder Capital Finance Holdings LLLP/Ladder Capital Finance Corp.(b) | | | | | | | | | | | | |
4.25%, 02/01/27(g) | | | | | | | 170 | | | | 142,805 | |
4.75%, 06/15/29 | | | | | | | 67 | | | | 54,093 | |
Lloyds Banking Group PLC, (5 year CMT + 4.82%), 6.75%(a)(g)(k) | | | | | | | 450 | | | | 427,058 | |
Morgan Stanley, 4.00%, 07/23/25(g) | | | | | | | 965 | | | | 942,313 | |
Spectrum Brands, Inc.(b) | | | | | | | | | | | | |
5.00%, 10/01/29 | | | | | | | 141 | | | | 122,025 | |
5.50%, 07/15/30 | | | | | | | 154 | | | | 135,910 | |
| | | | | | | | | | | | |
| | | | | | | | | | | 13,636,831 | |
|
| Diversified Telecommunication Services — 2.5% | |
AT&T, Inc., 4.30%, 02/15/30(g) | | | | | | | 1,350 | | | | 1,273,836 | |
Consolidated Communications, Inc., 6.50%, 10/01/28(b)(g) | | | | | | | 489 | | | | 379,983 | |
Level 3 Financing, Inc.(b) | | | | | | | | | | | | |
3.40%, 03/01/27(g) | | | | | | | 420 | | | | 354,894 | |
4.63%, 09/15/27 | | | | | | | 202 | | | | 168,165 | |
4.25%, 07/01/28(g) | | | | | | | 919 | | | | 723,896 | |
3.63%, 01/15/29 | | | | | | | 136 | | | | 99,585 | |
3.75%, 07/15/29(g) | | | | | | | 380 | | | | 273,361 | |
3.88%, 11/15/29 | | | | | | | 39 | | | | 30,776 | |
Lumen Technologies, Inc.(b) | | | | | | | | | | | | |
4.00%, 02/15/27(g) | | | | | | | 1,026 | | | | 869,486 | |
4.50%, 01/15/29(g) | | | | | | | 664 | | | | 458,301 | |
5.38%, 06/15/29 | | | | | | | 42 | | | | 30,237 | |
Oi SA, (10.00% Cash or 8.00% Cash + 4.00% PIK), 10.00%, 07/27/25(l) | | | | | | | 200 | | | | 33,475 | |
SoftBank Group Corp., 4.75%, 07/30/25(d) | | | EUR | | | | 100 | | | | 100,087 | |
Sprint Capital Corp.(g) | | | | | | | | | | | | |
6.88%, 11/15/28 | | | USD | | | | 1,197 | | | | 1,242,414 | |
8.75%, 03/15/32 | | | | | | | 919 | | | | 1,093,702 | |
Telecom Italia Capital SA | | | | | | | | | | | | |
6.38%, 11/15/33 | | | | | | | 222 | | | | 181,616 | |
6.00%, 09/30/34(g) | | | | | | | 432 | | | | 326,463 | |
7.20%, 07/18/36 | | | | | | | 98 | | | | 79,566 | |
7.72%, 06/04/38 | | | | | | | 44 | | | | 36,520 | |
Telecom Italia SpA | | | | | | | | | | | | |
4.00%, 04/11/24(d) | | | EUR | | | | 150 | | | | 156,152 | |
5.30%, 05/30/24(b)(g) | | | USD | | | | 200 | | | | 189,488 | |
1.63%, 01/18/29(d) | | | EUR | | | | 100 | | | | 81,329 | |
Uniti Group LP/Uniti Group Finance, Inc./CSL Capital LLC, 4.75%, 04/15/28(b) | | | USD | | | | 70 | | | | 56,000 | |
Verizon Communications, Inc., 3.70%, 03/22/61(g) | | | | | | | 1,000 | | | | 697,490 | |
Zayo Group Holdings, Inc.(b)(g) | | | | | | | | | | | | |
4.00%, 03/01/27 | | | | | | | 3,087 | | | | 2,279,966 | |
6.13%, 03/01/28 | | | | | | | 1,772 | | | | 1,004,863 | |
| | | | | | | | | | | | |
| | | | | | | | | | | 12,221,651 | |
| | | |
| Electric Utilities — 0.6% | | | | | | | | | |
Black Hills Corp., 3.15%, 01/15/27(g) | | | | | | | 305 | | | | 282,064 | |
Comision Federal de Electricidad, 4.88%, 01/15/24 | | | | | | | 200 | | | | 197,663 | |
| | | | | | | | | | | | |
| Security | | | | | Par (000) | | | Value | |
| | | |
| Electric Utilities (continued) | | | | | | | | | |
Empresas Publicas de Medellin ESP, 4.25%, 07/18/29(b) | | | USD | | | | 200 | | | $ | 158,413 | |
Enel Finance International NV, 3.63%, 05/25/27(b)(g) | | | | | | | 900 | | | | 831,739 | |
FirstEnergy Corp. | | | | | | | | | | | | |
2.65%, 03/01/30 | | | | | | | 87 | | | | 70,935 | |
Series B, 2.25%, 09/01/30 | | | | | | | 21 | | | | 16,668 | |
Series C, 3.40%, 03/01/50(g) | | | | | | | 598 | | | | 394,560 | |
FirstEnergy Transmission LLC(b)(g) | | | | | | | | | | | | |
5.45%, 07/15/44 | | | | | | | 458 | | | | 426,043 | |
4.55%, 04/01/49 | | | | | | | 163 | | | | 131,891 | |
NextEra Energy Operating Partners LP(b) | | | | | | | | | | | | |
4.25%, 07/15/24(g) | | | | | | | 170 | | | | 164,900 | |
4.25%, 09/15/24 | | | | | | | 9 | | | | 8,367 | |
Pike Corp., 5.50%, 09/01/28(b) | | | | | | | 80 | | | | 69,939 | |
Texas Competitive Electric Holdings, 1.00%, 11/10/21(c)(e)(j) | | | | | | | 780 | | | | — | |
| | | | | | | | | | | | |
| | | | | | | | | | | 2,753,182 | |
| | | |
| Electrical Equipment(b) — 0.1% | | | | | | | | | |
Gates Global LLC/Gates Corp., 6.25%, 01/15/26(g) | | | | | | | 416 | | | | 401,440 | |
GrafTech Finance, Inc., 4.63%, 12/15/28 | | | | | | | 136 | | | | 111,686 | |
| | | | | | | | | | | | |
| | | |
| | | | | | | | | | | 513,126 | |
|
| Electronic Equipment, Instruments & Components — 0.4% | |
BWX Technologies, Inc.(b) | | | | | | | | | | | | |
4.13%, 06/30/28 | | | | | | | 268 | | | | 240,865 | |
4.13%, 04/15/29 | | | | | | | 208 | | | | 182,041 | |
CDW LLC/CDW Finance Corp. | | | | | | | | | | | | |
3.28%, 12/01/28 | | | | | | | 130 | | | | 111,301 | |
3.25%, 02/15/29 | | | | | | | 212 | | | | 180,558 | |
Imola Merger Corp., 4.75%, 05/15/29(b)(g) | | | | | | | 510 | | | | 442,483 | |
Vertiv Group Corp., 4.13%, 11/15/28(b)(g) | | | | | | | 920 | | | | 782,000 | |
| | | | | | | | | | | | |
| | | | | | | | | | | 1,939,248 | |
| | | |
| Energy Equipment & Services — 0.4% | | | | | | | | | |
Archrock Partners LP/Archrock Partners Finance Corp.(b) | | | | | | | | | | | | |
6.88%, 04/01/27 | | | | | | | 170 | | | | 162,293 | |
6.25%, 04/01/28(g) | | | | | | | 729 | | | | 667,044 | |
Halliburton Co., 3.80%, 11/15/25(g) | | | | | | | 3 | | | | 2,918 | |
USA Compression Partners LP/USA Compression Finance Corp. | | | | | | | | | | | | |
6.88%, 04/01/26(g) | | | | | | | 355 | | | | 340,548 | |
6.88%, 09/01/27 | | | | | | | 406 | | | | 379,610 | |
Vallourec SA, 8.50%, 06/30/26(d) | | | EUR | | | | 25 | | | | 26,236 | |
Weatherford International Ltd.(b) | | | | | | | | | | | | |
11.00%, 12/01/24 | | | USD | | | | 7 | | | | 7,140 | |
6.50%, 09/15/28 | | | | | | | 215 | | | | 210,764 | |
8.63%, 04/30/30(g) | | | | | | | 314 | | | | 301,537 | |
| | | | | | | | | | | | |
| | | | | | | | | | | 2,098,090 | |
|
| Environmental, Maintenance & Security Service — 0.8% | |
Clean Harbors, Inc.(b)(g) | | | | | | | | | | | | |
4.88%, 07/15/27 | | | | | | | 250 | | | | 236,875 | |
5.13%, 07/15/29 | | | | | | | 129 | | | | 119,641 | |
Covanta Holding Corp. | | | | | | | | | | | | |
4.88%, 12/01/29(b) | | | | | | | 142 | | | | 116,336 | |
5.00%, 09/01/30 | | | | | | | 70 | | | | 56,528 | |
GFL Environmental, Inc.(b) | | | | | | | | | | | | |
4.25%, 06/01/25 | | | | | | | 86 | | | | 82,147 | |
3.75%, 08/01/25 | | | | | | | 136 | | | | 128,520 | |
| | |
SCHEDULE OF INVESTMENTS | | 75 |
| | |
Schedule of Investments (continued) December 31, 2022 | | BlackRock Limited Duration Income Trust (BLW) (Percentages shown are based on Net Assets) |
| | | | | | | | | | | | |
| Security | | | | | Par
(000) | | | Value | |
|
Environmental, Maintenance & Security Service (continued) | |
GFL Environmental, Inc.(b) (continued) | | | | | | | | | | | | |
5.13%, 12/15/26(g) | | | USD | | | | 243 | | | $ | 232,383 | |
4.00%, 08/01/28(g) | | | | | | | 431 | | | | 368,505 | |
3.50%, 09/01/28 | | | | | | | 198 | | | | 174,074 | |
4.75%, 06/15/29(g) | | | | | | | 378 | | | | 330,844 | |
4.38%, 08/15/29 | | | | | | | 317 | | | | 268,642 | |
Republic Services, Inc., 3.38%, 11/15/27(g) | | | | | | | 750 | | | | 698,783 | |
Stericycle, Inc., 3.88%, 01/15/29(b) | | | | | | | 162 | | | | 141,345 | |
Tervita Corp., 11.00%, 12/01/25(b) | | | | | | | 114 | | | | 122,558 | |
Waste Pro USA, Inc., 5.50%, 02/15/26(b)(g) | | | | | | | 601 | | | | 530,743 | |
| | | | | | | | | | | | |
| | | |
| | | | | | | | | | | 3,607,924 | |
|
| Equity Real Estate Investment Trusts (REITs) — 1.2% | |
Alexandria Real Estate Equities, Inc., 4.00%, 02/01/50(g) | | | | | | | 450 | | | | 341,023 | |
American Tower Corp. | | | | | | | | | | | | |
2.90%, 01/15/30(g) | | | | | | | 280 | | | | 237,123 | |
2.70%, 04/15/31 | | | | | | | 90 | | | | 73,256 | |
4.05%, 03/15/32(g) | | | | | | | 180 | | | | 160,523 | |
Brookfield Property REIT, Inc./BPR Cumulus LLC/BPR Nimbus LLC/GGSI Sellco LLC, 4.50%, 04/01/27(b) | | | | | | | 178 | | | | 148,775 | |
Digital Realty Trust LP, 5.55%, 01/15/28(g) | | | | | | | 115 | | | | 115,760 | |
Equinix, Inc., 3.90%, 04/15/32(g) | | | | | | | 551 | | | | 489,532 | |
Global Net Lease, Inc./Global Net Lease Operating Partnership LP, 3.75%, 12/15/27(b)(g) | | | | | | | 142 | | | | 117,422 | |
Healthpeak Properties, Inc., 2.88%, 01/15/31(g) | | | | | | | 1,000 | | | | 835,730 | |
Iron Mountain, Inc.(b) | | | | | | | | | | | | |
5.00%, 07/15/28 | | | | | | | 32 | | | | 28,742 | |
5.25%, 07/15/30 | | | | | | | 172 | | | | 149,468 | |
5.63%, 07/15/32(g) | | | | | | | 57 | | | | 49,397 | |
LMIRT Capital Pte. Ltd., 7.25%, 06/19/24(d) | | | | | | | 229 | | | | 151,140 | |
MPT Operating Partnership LP/MPT Finance Corp.(g) | | | | | | | | | | | | |
5.00%, 10/15/27 | | | | | | | 66 | | | | 55,475 | |
4.63%, 08/01/29 | | | | | | | 488 | | | | 372,141 | |
3.50%, 03/15/31 | | | | | | | 1,388 | | | | 951,451 | |
RHP Hotel Properties LP/RHP Finance Corp. | | | | | | | | | | | | |
4.75%, 10/15/27(g) | | | | | | | 678 | | | | 613,598 | |
4.50%, 02/15/29(b) | | | | | | | 179 | | | | 154,404 | |
RLJ Lodging Trust LP(b) | | | | | | | | | | | | |
3.75%, 07/01/26 | | | | | | | 135 | | | | 120,229 | |
4.00%, 09/15/29 | | | | | | | 97 | | | | 78,635 | |
Ventas Realty LP, 4.13%, 01/15/26(g) | | | | | | | 650 | | | | 630,464 | |
VICI Properties LP/VICI Note Co., Inc., 3.88%, 02/15/29(b) | | | | | | | 50 | | | | 43,822 | |
| | | | | | | | | | | | |
| | | | | | | | | | | 5,918,110 | |
| | | |
| Food & Staples Retailing — 0.9% | | | | | | | | | |
Albertsons Cos., Inc./Safeway, Inc./New Albertsons LP/Albertsons LLC(b) | | | | | | | | | | | | |
3.25%, 03/15/26(g) | | | | | | | 582 | | | | 530,816 | |
7.50%, 03/15/26 | | | | | | | 107 | | | | 109,262 | |
4.63%, 01/15/27(g) | | | | | | | 429 | | | | 398,485 | |
5.88%, 02/15/28 | | | | | | | 320 | | | | 304,218 | |
4.88%, 02/15/30(g) | | | | | | | 214 | | | | 190,986 | |
Bellis Acquisition Co. PLC, 3.25%, 02/16/26(d) | | | GBP | | | | 100 | | | | 98,167 | |
Darling Ingredients, Inc., 6.00%, 06/15/30(b)(g) | | | USD | | | | 434 | | | | 424,235 | |
Kraft Heinz Foods Co.(g) | | | | | | | | | | | | |
4.88%, 10/01/49 | | | | | | | 245 | | | | 212,671 | |
| | | | | | | | | | | | |
| Security | | | | | Par (000) | | | Value | |
|
Food & Staples Retailing (continued) | |
Kraft Heinz Foods Co.(g) (continued) | | | | | | | | | | | | |
5.50%, 06/01/50 | | | USD | | | | 412 | | | $ | 393,747 | |
Lamb Weston Holdings, Inc.(b)(g) | | | | | | | | | | | | |
4.88%, 05/15/28 | | | | | | | 257 | | | | 243,508 | |
4.13%, 01/31/30 | | | | | | | 312 | | | | 275,558 | |
4.38%, 01/31/32 | | | | | | | 216 | | | | 188,719 | |
Ocado Group PLC, 3.88%, 10/08/26(d) | | | GBP | | | | 100 | | | | 93,089 | |
Performance Food Group, Inc., 4.25%, 08/01/29(b)(g) | | | USD | | | | 395 | | | | 342,315 | |
Post Holdings, Inc.(b) | | | | | | | | | | | | |
5.75%, 03/01/27 | | | | | | | 89 | | | | 86,070 | |
4.63%, 04/15/30(g) | | | | | | | 118 | | | | 101,803 | |
U.S. Foods, Inc.(b) | | | | | | | | | | | | |
4.75%, 02/15/29 | | | | | | | 335 | | | | 297,453 | |
4.63%, 06/01/30 | | | | | | | 39 | | | | 34,344 | |
United Natural Foods, Inc., 6.75%, 10/15/28(b) | | | | | | | 34 | | | | 32,668 | |
| | | | | | | | | | | | |
| | | | | | | | | | | 4,358,114 | |
|
| Food Products — 0.6% | |
Aramark International Finance SARL, 3.13%, 04/01/25(d) | | | EUR | | | | 138 | | | | 141,075 | |
Aramark Services, Inc.(b)(g) | | | | | | | | | | | | |
5.00%, 04/01/25 | | | USD | | | | 435 | | | | 424,467 | |
6.38%, 05/01/25 | | | | | | | 188 | | | | 185,689 | |
5.00%, 02/01/28 | | | | | | | 242 | | | | 225,770 | |
BRF SA, 4.88%, 01/24/30(d) | | | | | | | 200 | | | | 168,413 | |
Chobani LLC/Chobani Finance Corp., Inc.(b)(g) | | | | | | | | | | | | |
7.50%, 04/15/25 | | | | | | | 840 | | | | 817,950 | |
4.63%, 11/15/28 | | | | | | | 480 | | | | 417,893 | |
JBS USA LUX SA/JBS USA Food Co./JBS USA Finance, Inc., 3.75%, 12/01/31(b) | | | | | | | 280 | | | | 228,732 | |
Pilgrim’s Pride Corp., 3.50%, 03/01/32(b)(g) | | | | | | | 175 | | | | 136,938 | |
Simmons Foods, Inc./Simmons Prepared Foods, Inc./Simmons Pet Food, Inc./Simmons Feed, 4.63%, 03/01/29(b) | | | | | | | 171 | | | | 139,203 | |
| | | | | | | | | | | | |
| | | |
| | | | | | | | | | | 2,886,130 | |
| | | |
| Gas Utilities — 0.0% | | | | | | | | | |
Suburban Propane Partners LP/Suburban Energy Finance Corp., 5.00%, 06/01/31(b) | | | | | | | 91 | | | | 77,348 | |
| | | | | | | | | | | | |
| | | |
| Health Care Equipment & Supplies(b) — 0.2% | | | | | | | | | |
Avantor Funding, Inc. | | | | | | | | | | | | |
4.63%, 07/15/28(g) | | | | | | | 594 | | | | 539,732 | |
3.88%, 11/01/29 | | | | | | | 185 | | | | 155,354 | |
Embecta Corp., 6.75%, 02/15/30 | | | | | | | 75 | | | | 67,687 | |
Garden Spinco Corp., 8.63%, 07/20/30 | | | | | | | 199 | | | | 210,940 | |
| | | | | | | | | | | | |
| | | |
| | | | | | | | | | | 973,713 | |
| | | |
| Health Care Providers & Services — 2.7% | | | | | | | | | |
Acadia Healthcare Co., Inc.(b) | | | | | | | | | | | | |
5.50%, 07/01/28 | | | | | | | 115 | | | | 109,078 | |
5.00%, 04/15/29 | | | | | | | 86 | | | | 79,094 | |
AdaptHealth LLC(b) | | | | | | | | | | | | |
6.13%, 08/01/28 | | | | | | | 73 | | | | 66,918 | |
5.13%, 03/01/30 | | | | | | | 26 | | | | 22,134 | |
AHP Health Partners, Inc., 5.75%, 07/15/29(b) | | | | | | | 324 | | | | 253,125 | |
Cano Health LLC, 6.25%, 10/01/28(b) | | | | | | | 104 | | | | 62,920 | |
Centene Corp. | | | | | | | | | | | | |
2.45%, 07/15/28(g) | | | | | | | 480 | | | | 405,144 | |
3.00%, 10/15/30(g) | | | | | | | 584 | | | | 478,734 | |
| | |
| 76 | | 2 0 2 2 BLACK ROCK ANNUAL REPORT TO SHAREHOLDERS |
| | |
Schedule of Investments (continued) December 31, 2022 | | BlackRock Limited Duration Income Trust (BLW) (Percentages shown are based on Net Assets) |
| | | | | | | | | | | | |
| Security | | | | | Par
(000) | | | Value | |
|
| Health Care Providers & Services (continued) | |
Centene Corp. (continued) | | | | | | | | | | | | |
2.50%, 03/01/31(g) | | | USD | | | | 1,002 | | | $ | 784,038 | |
2.63%, 08/01/31 | | | | | | | 270 | | | | 212,166 | |
CHS/Community Health Systems, Inc.(b) | | | | | | | | | | | | |
5.63%, 03/15/27(g) | | | | | | | 185 | | | | 158,630 | |
6.00%, 01/15/29(g) | | | | | | | 525 | | | | 439,152 | |
5.25%, 05/15/30 | | | | | | | 267 | | | | 201,328 | |
4.75%, 02/15/31 | | | | | | | 55 | | | | 39,931 | |
Elevance Health, Inc. | | | | | | | | | | | | |
3.65%, 12/01/27(g) | | | | | | | 1,000 | | | | 942,909 | |
2.75%, 10/15/42(h) | | | | | | | 19 | | | | 138,941 | |
Encompass Health Corp. | | | | | | | | | | | | |
4.50%, 02/01/28 | | | | | | | 15 | | | | 13,626 | |
4.75%, 02/01/30(g) | | | | | | | 472 | | | | 414,483 | |
4.63%, 04/01/31 | | | | | | | 211 | | | | 181,358 | |
HCA, Inc., 5.50%, 06/15/47(g) | | | | | | | 650 | | | | 577,279 | |
Legacy LifePoint Health LLC(b) | | | | | | | | | | | | |
6.75%, 04/15/25 | | | | | | | 190 | | | | 178,807 | |
4.38%, 02/15/27 | | | | | | | 191 | | | | 161,552 | |
Medline Borrower LP(b)(g) | | | | | | | | | | | | |
3.88%, 04/01/29 | | | | | | | 487 | | | | 392,503 | |
5.25%, 10/01/29 | | | | | | | 1,030 | | | | 818,098 | |
Molina Healthcare, Inc.(b) | | | | | | | | | | | | |
4.38%, 06/15/28(g) | | | | | | | 303 | | | | 276,515 | |
3.88%, 11/15/30 | | | | | | | 80 | | | | 67,795 | |
3.88%, 05/15/32(g) | | | | | | | 238 | | | | 197,645 | |
Surgery Center Holdings, Inc.(b)(g) | | | | | | | | | | | | |
6.75%, 07/01/25 | | | | | | | 547 | | | | 539,210 | |
10.00%, 04/15/27 | | | | | | | 621 | | | | 631,867 | |
Teleflex, Inc. | | | | | | | | | | | | |
4.63%, 11/15/27 | | | | | | | 80 | | | | 76,247 | |
4.25%, 06/01/28(b) | | | | | | | 331 | | | | 302,157 | |
Tenet Healthcare Corp. | | | | | | | | | | | | |
4.63%, 07/15/24(g) | | | | | | | 204 | | | | 198,952 | |
4.63%, 09/01/24(b)(g) | | | | | | | 367 | | | | 356,451 | |
4.88%, 01/01/26(b)(g) | | | | | | | 958 | | | | 905,926 | |
6.25%, 02/01/27(b) | | | | | | | 179 | | | | 171,931 | |
5.13%, 11/01/27(b)(g) | | | | | | | 192 | | | | 178,606 | |
4.63%, 06/15/28(b) | | | | | | | 81 | | | | 72,474 | |
6.13%, 10/01/28(b) | | | | | | | 183 | | | | 163,844 | |
4.25%, 06/01/29(b) | | | | | | | 48 | | | | 41,582 | |
6.13%, 06/15/30(b)(g) | | | | | | | 353 | | | | 336,338 | |
UnitedHealth Group, Inc., 3.75%, 07/15/25(g) | | | | | | | 1,470 | | | | 1,437,013 | |
| | | | | | | | | | | | |
| | | | | | | | | | | 13,086,501 | |
| | | |
| Health Care Technology — 0.6% | | | | | | | | | |
AthenaHealth Group, Inc., 6.50%, 02/15/30(b)(g) | | | | | | | 1,408 | | | | 1,037,601 | |
Catalent Pharma Solutions, Inc.(b) | | | | | | | | | | | | |
5.00%, 07/15/27(g) | | | | | | | 365 | | | | 339,639 | |
3.13%, 02/15/29 | | | | | | | 157 | | | | 125,007 | |
3.50%, 04/01/30(g) | | | | | | | 349 | | | | 275,567 | |
Charles River Laboratories International, Inc.(b) | | | | | | | | | | | | |
4.25%, 05/01/28 | | | | | | | 159 | | | | 146,434 | |
3.75%, 03/15/29 | | | | | | | 34 | | | | 30,070 | |
4.00%, 03/15/31 | | | | | | | 67 | | | | 57,955 | |
Chrome Bidco SASU, 3.50%, 05/31/28(d) | | | EUR | | | | 100 | | | | 89,650 | |
IQVIA, Inc.(b)(g) | | | | | | | | | | | | |
5.00%, 10/15/26 | | | USD | | | | 463 | | | | 442,095 | |
| | | | | | | | | | | | |
| Security | | | | | Par (000) | | | Value | |
| | | |
| Health Care Technology (continued) | | | | | | | | | |
IQVIA, Inc.(b)(g) (continued) | | | | | | | | | | | | |
5.00%, 05/15/27 | | | USD | | | | 437 | | | $ | 416,592 | |
Syneos Health, Inc., 3.63%, 01/15/29(b)(g) | | | | | | | 145 | | | | 115,470 | |
| | | | | | | | | | | | |
| | | | | | | | | | | 3,076,080 | |
| | | |
| Hotels, Restaurants & Leisure — 2.8% | | | | | | | | | |
Accor SA, 0.70%, 12/07/27(d) | | | EUR | | | | 32 | | | | 13,828 | |
Boyd Gaming Corp. | | | | | | | | | | | | |
4.75%, 12/01/27 | | | USD | | | | 179 | | | | 166,717 | |
4.75%, 06/15/31(b)(g) | | | | | | | 376 | | | | 327,120 | |
Boyne USA, Inc., 4.75%, 05/15/29(b)(g) | | | | | | | 344 | | | | 304,455 | |
Burger King (Restaurant Brands Int)/New Red | | | | | | | | | | | | |
Finance, Inc.(b) | | | | | | | | | | | | |
5.75%, 04/15/25 | | | | | | | 207 | | | | 205,385 | |
3.88%, 01/15/28(g) | | | | | | | 153 | | | | 136,866 | |
4.38%, 01/15/28(g) | | | | | | | 134 | | | | 119,984 | |
4.00%, 10/15/30 | | | | | | | 146 | | | | 118,232 | |
Caesars Entertainment, Inc.(b)(g) | | | | | | | | | | | | |
6.25%, 07/01/25 | | | | | | | 1,011 | | | | 982,364 | |
8.13%, 07/01/27 | | | | | | | 1,508 | | | | 1,481,685 | |
4.63%, 10/15/29 | | | | | | | 624 | | | | 507,817 | |
Caesars Resort Collection LLC/CRC Finco, Inc., 5.75%, 07/01/25(b)(g) | | | | | | | 478 | | | | 467,917 | |
CDI Escrow Issuer, Inc., 5.75%, 04/01/30(b)(g) | | | | | | | 691 | | | | 619,433 | |
Cedar Fair LP/Canada’s Wonderland Co./Magnum Management Corp./Millennium Op, 5.50%, 05/01/25(b)(g) | | | | | | | 296 | | | | 292,779 | |
Champion Path Holdings Ltd., 4.50%, 01/27/26(d) | | | | | | | 232 | | | | 199,520 | |
Churchill Downs, Inc., 5.50%, 04/01/27(b)(g) | | | | | | | 675 | | | | 639,600 | |
Fertitta Entertainment LLC/Fertitta Entertainment Finance Co., Inc.(b) | | | | | | | | | | | | |
4.63%, 01/15/29(g) | | | | | | | 483 | | | | 408,732 | |
6.75%, 01/15/30 | | | | | | | 68 | | | | 54,849 | |
Fortune Star BVI Ltd., 6.75%, 07/02/23(d) | | | | | | | 200 | | | | 188,000 | |
Hilton Domestic Operating Co., Inc. | | | | | | | | | | | | |
5.38%, 05/01/25(b) | | | | | | | 145 | | | | 143,522 | |
5.75%, 05/01/28(b) | | | | | | | 112 | | | | 108,640 | |
3.75%, 05/01/29(b) | | | | | | | 146 | | | | 126,290 | |
4.88%, 01/15/30(g) | | | | | | | 604 | | | | 547,351 | |
4.00%, 05/01/31(b) | | | | | | | 281 | | | | 235,093 | |
3.63%, 02/15/32(b) | | | | | | | 15 | | | | 12,012 | |
McDonald’s Corp., 3.70%, 01/30/26(g) | | | | | | | 405 | | | | 393,759 | |
Melco Resorts Finance Ltd., 5.25%, 04/26/26(d) | | | | | | | 250 | | | | 219,375 | |
Merlin Entertainments Ltd., 5.75%, 06/15/26(b) | | | | | | | 200 | | | | 187,248 | |
MGM China Holdings Ltd., 5.88%, 05/15/26(d) | | | | | | | 250 | | | | 231,531 | |
MGM Resorts International | | | | | | | | | | | | |
6.00%, 03/15/23 | | | | | | | 416 | | | | 414,523 | |
5.75%, 06/15/25 | | | | | | | 29 | | | | 28,184 | |
Midwest Gaming Borrower LLC/Midwest Gaming Finance Corp., 4.88%, 05/01/29(b) | | | | | | | 235 | | | | 199,953 | |
Premier Entertainment Sub LLC/Premier Entertainment Finance Corp.(b) | | | | | | | | | | | | |
5.63%, 09/01/29 | | | | | | | 116 | | | | 85,538 | |
5.88%, 09/01/31 | | | | | | | 116 | | | | 82,058 | |
Raptor Acquisition Corp./Raptor Co.-Issuer LLC, 4.88%, 11/01/26(b) | | | | | | | 177 | | | | 157,247 | |
Scientific Games International, Inc.(b) | | | | | | | | | | | | |
8.63%, 07/01/25 | | | | | | | 203 | | | | 207,101 | |
7.00%, 05/15/28 | | | | | | | 174 | | | | 165,980 | |
7.25%, 11/15/29 | | | | | | | 51 | | | | 48,960 | |
| | |
SCHEDULE OF INVESTMENTS | | 77 |
| | |
Schedule of Investments (continued) December 31, 2022 | | BlackRock Limited Duration Income Trust (BLW) (Percentages shown are based on Net Assets) |
| | | | | | | | | | | | |
| Security | | | | | Par (000) | | | Value | |
|
Hotels, Restaurants & Leisure (continued) | |
Six Flags Theme Parks, Inc., 7.00%, 07/01/25(b)(g) | | | USD | | | | 269 | | | $ | 270,832 | |
Station Casinos LLC, 4.63%, 12/01/31(b) | | | | | | | 277 | | | | 222,202 | |
Stonegate Pub Co. Financing PLC, 8.25%, 07/31/25(d) | | | GBP | | | | 100 | | | | 109,047 | |
Vail Resorts, Inc., 6.25%, 05/15/25(b) | | | USD | | | | 154 | | | | 154,000 | |
Wyndham Hotels & Resorts, Inc., 4.38%, 08/15/28(b) | | | | | | | 158 | | | | 141,758 | |
Wynn Las Vegas LLC/Wynn Las Vegas Capital Corp., 5.25%, 05/15/27(b)(g) | | | | | | | 192 | | | | 173,274 | |
Wynn Macau Ltd., 5.50%, 01/15/26(d) | | | | | | | 347 | | | | 315,944 | |
Wynn Resorts Finance LLC/Wynn Resorts Capital Corp.(b)(g) | | | | | | | | | | | | |
7.75%, 04/15/25 | | | | | | | 239 | | | | 237,675 | |
5.13%, 10/01/29 | | | | | | | 740 | | | | 634,276 | |
Yum! Brands, Inc. | | | | | | | | | | | | |
4.75%, 01/15/30(b)(g) | | | | | | | 196 | | | | 179,830 | |
3.63%, 03/15/31 | | | | | | | 96 | | | | 80,496 | |
5.38%, 04/01/32 | | | | | | | 38 | | | | 35,198 | |
5.35%, 11/01/43 | | | | | | | 71 | | | | 58,398 | |
| | | | | | | | | | | | |
| | | | | | | | | | | 13,442,578 | |
| | | |
| Household Durables — 0.5% | | | | | | | | | |
Ashton Woods USA LLC/Ashton Woods Finance Co.(b) | | | | | | | | | | | | |
4.63%, 08/01/29 | | | | | | | 100 | | | | 80,073 | |
4.63%, 04/01/30 | | | | | | | 145 | | | | 116,378 | |
Brookfield Residential Properties, Inc./Brookfield Residential U.S. LLC(b) | | | | | | | | | | | | |
5.00%, 06/15/29 | | | | | | | 208 | | | | 162,525 | |
4.88%, 02/15/30(g) | | | | | | | 364 | | | | 283,799 | |
CD&R Smokey Buyer, Inc., 6.75%, 07/15/25(b) | | | | | | | 253 | | | | 217,104 | |
K Hovnanian Enterprises, Inc., 7.75%, 02/15/26(b) | | | | | | | 219 | | | | 210,240 | |
Mattamy Group Corp., 4.63%, 03/01/30(b)(g) | | | | | | | 199 | | | | 161,282 | |
Meritage Homes Corp., 5.13%, 06/06/27 | | | | | | | 50 | | | | 47,010 | |
NCR Corp.(b) | | | | | | | | | | | | |
5.75%, 09/01/27 | | | | | | | 220 | | | | 210,523 | |
5.00%, 10/01/28 | | | | | | | 110 | | | | 93,779 | |
5.13%, 04/15/29 | | | | | | | 145 | | | | 121,267 | |
6.13%, 09/01/29 | | | | | | | 92 | | | | 86,025 | |
SWF Escrow Issuer Corp., 6.50%, 10/01/29(b)(g) | | | | | | | 330 | | | | 191,219 | |
Taylor Morrison Communities, Inc.(b) | | | | | | | | | | | | |
5.88%, 06/15/27 | | | | | | | 245 | | | | 235,230 | |
5.13%, 08/01/30 | | | | | | | 54 | | | | 46,777 | |
Tempur Sealy International, Inc.(b) | | | | | | | | | | | | |
4.00%, 04/15/29 | | | | | | | 204 | | | | 171,393 | |
3.88%, 10/15/31(g) | | | | | | | 145 | | | | 113,829 | |
Tri Pointe Group, Inc./Tri Pointe Homes, Inc., 5.88%, 06/15/24 | | | | | | | 11 | | | | 10,946 | |
Tri Pointe Homes, Inc., 5.25%, 06/01/27 | | | | | | | 15 | | | | 13,391 | |
| | | | | | | | | | | | |
| | | | | | | | | | | 2,572,790 | |
|
| Household Products — 0.1% | |
Berkline Benchcraft LLC,
4.50%, 06/01/22(c)(e)(j) | | | | | | | 200 | | | | — | |
Central Garden & Pet Co. | | | | | | | | | | | | |
5.13%, 02/01/28 | | | | | | | 15 | | | | 13,954 | |
4.13%, 10/15/30 | | | | | | | 194 | | | | 159,353 | |
4.13%, 04/30/31(b) | | | | | | | 177 | | | | 146,525 | |
| | | | | | | | | | | | |
| | | | | | | | | | | 319,832 | |
|
| Independent Power and Renewable Electricity Producers — 0.8% | |
Azure Power Solar Energy Pvt Ltd., 5.65%, 12/24/24(d) | | | | | | | 200 | | | | 175,000 | |
| | | | | | | | | | | | |
| Security | | | | | Par (000) | | | Value | |
|
Independent Power and Renewable Electricity Producers (continued) | |
Calpine Corp.(b) | | | | | | | | | | | | |
5.25%, 06/01/26 | | | USD | | | | 221 | | | $ | 210,508 | |
5.13%, 03/15/28(g) | | | | | | | 1,060 | | | | 945,830 | |
4.63%, 02/01/29(g) | | | | | | | 106 | | | | 90,954 | |
5.00%, 02/01/31 | | | | | | | 43 | | | | 36,073 | |
Clearway Energy Operating LLC(b) | | | | | | | | | | | | |
4.75%, 03/15/28(g) | | | | | | | 336 | | | | 310,110 | |
3.75%, 01/15/32 | | | | | | | 262 | | | | 210,602 | |
Greenko Mauritius Ltd., 6.25%, 02/21/23(d) | | | | | | | 200 | | | | 198,500 | |
Greenko Solar Mauritius Ltd., 5.95%, 07/29/26(d) | | | | | | | 200 | | | | 181,250 | |
NRG Energy, Inc. | | | | | | | | | | | | |
6.63%, 01/15/27 | | | | | | | 720 | | | | 713,916 | |
5.75%, 01/15/28 | | | | | | | 63 | | | | 59,136 | |
5.25%, 06/15/29(b) | | | | | | | 253 | | | | 223,333 | |
3.63%, 02/15/31(b)(g) | | | | | | | 277 | | | | 210,575 | |
3.88%, 02/15/32(b) | | | | | | | 16 | | | | 12,017 | |
TerraForm Power Operating LLC(b) | | | | | | | | | | | | |
5.00%, 01/31/28 | | | | | | | 96 | | | | 86,399 | |
4.75%, 01/15/30 | | | | | | | 186 | | | | 161,820 | |
| | | | | | | | | | | | |
| | | | | | | | | | | 3,826,023 | |
| | | |
| Insurance — 2.4% | | | | | | | | | |
Acrisure LLC/Acrisure Finance, Inc., 6.00%, 08/01/29(b) | | | | | | | 231 | | | | 188,780 | |
Alliant Holdings Intermediate LLC/Alliant Holdings Co-Issuer(b)(g) | | | | | | | | | | | | |
4.25%, 10/15/27 | | | | | | | 1,166 | | | | 1,044,302 | |
6.75%, 10/15/27 | | | | | | | 1,896 | | | | 1,704,239 | |
5.88%, 11/01/29 | | | | | | | 1,182 | | | | 972,077 | |
Allied World Assurance Co. Holdings Ltd., 4.35%, 10/29/25(g) | | | | | | | 360 | | | | 344,721 | |
AmWINS Group, Inc., 4.88%, 06/30/29(b) | | | | | | | 285 | | | | 241,722 | |
Aon Global Ltd., 3.88%, 12/15/25(g) | | | | | | | 1,115 | | | | 1,087,052 | |
GTCR AP Finance, Inc., 8.00%, 05/15/27(b) | | | | | | | 330 | | | | 316,100 | |
HUB International Ltd.(b) | | | | | | | | | | | | |
7.00%, 05/01/26(g) | | | | | | | 1,280 | | | | 1,253,107 | |
5.63%, 12/01/29 | | | | | | | 53 | | | | 46,289 | |
Jones Deslauriers Insurance Management, Inc., 10.50%, 12/15/30 | | | | | | | 268 | | | | 263,941 | |
Marsh & McLennan Cos., Inc., 3.75%, 03/14/26(g) | | | | | | | 750 | | | | 727,365 | |
Ryan Specialty Group LLC, 4.38%, 02/01/30(b) | | | | | | | 135 | | | | 116,896 | |
Voya Financial, Inc., (3 mo. LIBOR US + 3.58%), 5.65%, 05/15/53(a)(g) | | | | | | | 3,500 | | | | 3,404,450 | |
| | | | | | | | | | | | |
| | | | | | | | | | | 11,711,041 | |
| | | |
| Interactive Media & Services — 0.3% | | | | | | | | | |
Arches Buyer, Inc., 4.25%, 06/01/28(b) | | | | | | | 110 | | | | 86,031 | |
Cablevision Lightpath LLC(b) | | | | | | | | | | | | |
3.88%, 09/15/27 | | | | | | | 200 | | | | 164,829 | |
5.63%, 09/15/28(g) | | | | | | | 400 | | | | 297,171 | |
iliad SA(d) | | | | | | | | | | | | |
2.38%, 06/17/26 | | | EUR | | | | 100 | | | | 96,250 | |
5.38%, 06/14/27 | | | | | | | 100 | | | | 106,189 | |
Northwest Fiber LLC/Northwest Fiber Finance Sub, Inc.(b) | | | | | | | | | | | | |
4.75%, 04/30/27 | | | USD | | | | 303 | | | | 266,598 | |
6.00%, 02/15/28 | | | | | | | 309 | | | | 239,253 | |
United Group BV, 4.88%, 07/01/24(d) | | | EUR | | | | 100 | | | | 99,369 | |
| | | | | | | | | | | | |
| | | | | | | | | | | 1,355,690 | |
| | | |
| Internet Software & Services — 1.0% | | | | | | | | | |
ANGI Group LLC, 3.88%, 08/15/28(b) | | | USD | | | | 262 | | | | 194,426 | |
| | |
| 78 | | 2 0 2 2 BLACK ROCK ANNUAL REPORT TO SHAREHOLDERS |
| | |
Schedule of Investments (continued) December 31, 2022 | | BlackRock Limited Duration Income Trust (BLW) (Percentages shown are based on Net Assets) |
| | | | | | | | | | | | |
| Security | | | | | Par (000) | | | Value | |
|
Internet Software & Services (continued) | |
Booking Holdings, Inc., 0.75%, 05/01/25(g)(h) | | | USD | | | | 49 | | | $ | 65,263 | |
Gen Digital, Inc., 7.13%, 09/30/30(b) | | | | | | | 231 | | | | 226,958 | |
Go Daddy Operating Co. LLC/GD Finance Co., Inc.(b) | | | | | | | | | | | | |
5.25%, 12/01/27 | | | | | | | 303 | | | | 286,777 | |
3.50%, 03/01/29 | | | | | | | 204 | | | | 170,787 | |
Match Group Holdings II LLC(b) | | | | | | | | | | | | |
4.63%, 06/01/28 | | | | | | | 157 | | | | 139,959 | |
5.63%, 02/15/29 | | | | | | | 177 | | | | 164,610 | |
4.13%, 08/01/30 | | | | | | | 198 | | | | 161,641 | |
3.63%, 10/01/31(g) | | | | | | | 207 | | | | 158,741 | |
Uber Technologies, Inc.(g) | | | | | | | | | | | | |
7.50%, 05/15/25(b) | | | | | | | 667 | | | | 666,514 | |
0.00%, 12/15/25(h)(i) | | | | | | | 916 | | | | 771,507 | |
8.00%, 11/01/26(b) | | | | | | | 419 | | | | 420,442 | |
7.50%, 09/15/27(b) | | | | | | | 622 | | | | 622,436 | |
6.25%, 01/15/28(b) | | | | | | | 402 | | | | 385,920 | |
4.50%, 08/15/29(b) | | | | | | | 671 | | | | 584,612 | |
| | | | | | | | | | | | |
| | | | | | | | | | | 5,020,593 | |
| | | |
| IT Services — 1.0% | | | | | | | | | |
Ahead DB Holdings LLC, 6.63%, 05/01/28(b) | | | | | | | 150 | | | | 120,563 | |
Booz Allen Hamilton, Inc.(b)(g) | | | | | | | | | | | | |
3.88%, 09/01/28 | | | | | | | 272 | | | | 240,982 | |
4.00%, 07/01/29 | | | | | | | 391 | | | | 344,136 | |
CA Magnum Holdings, 5.38%, 10/31/26(b)(g) | | | | | | | 382 | | | | 345,760 | |
Camelot Finance SA, 4.50%, 11/01/26(b)(g) | | | | | | | 564 | | | | 528,609 | |
Condor Merger Sub, Inc.,
7.38%, 02/15/30(b)(g) | | | | | | | 786 | | | | 631,968 | |
Dun & Bradstreet Corp., 5.00%, 12/15/29(b)(g) | | | | | | | 503 | | | | 430,449 | |
Fair Isaac Corp., 4.00%, 06/15/28(b)(g) | | | | | | | 366 | | | | 332,147 | |
Gartner, Inc.(b) | | | | | | | | | | | | |
4.50%, 07/01/28 | | | | | | | 67 | | | | 62,466 | |
3.63%, 06/15/29 | | | | | | | 87 | | | | 76,449 | |
3.75%, 10/01/30(g) | | | | | | | 308 | | | | 265,486 | |
KBR, Inc., 4.75%, 09/30/28(b) | | | | | | | 206 | | | | 181,962 | |
La Financiere Atalian SASU, 5.13%, 05/15/25(d) | | | EUR | | | | 100 | | | | 73,106 | |
Science Applications International Corp., 4.88%, 04/01/28(b)(g) | | | USD | | | | 289 | | | | 267,324 | |
Tempo Acquisition LLC/Tempo Acquisition Finance Corp., 5.75%, 06/01/25(b) | | | | | | | 163 | | | | 163,280 | |
Twilio, Inc., 3.88%, 03/15/31(g) | | | | | | | 304 | | | | 241,180 | |
ZoomInfo Technologies LLC/ZoomInfo Finance Corp., 3.88%, 02/01/29(b)(g) | | | | | | | 692 | | | | 581,545 | |
| | | | | | | | | | | | |
| | | | | | | | | | | 4,887,412 | |
| | | |
| Leisure Products — 0.1% | | | | | | | | | |
Mattel, Inc. | | | | | | | | | | | | |
3.75%, 04/01/29(b) | | | | | | | 74 | | | | 64,996 | |
6.20%, 10/01/40 | | | | | | | 219 | | | | 189,033 | |
5.45%, 11/01/41 | | | | | | | 278 | | | | 226,289 | |
| | | | | | | | | | | | |
| | | | | | | | | | | 480,318 | |
| | | |
| Machinery — 0.9% | | | | | | | | | |
ATS Corp., 4.13%, 12/15/28(b) | | | | | | | 108 | | | | 93,178 | |
Chart Industries, Inc. | | | | | | | | | | | | |
7.50%, 01/01/30(b) | | | | | | | 598 | | | | 601,163 | |
9.50%, 01/01/31 | | | | | | | 92 | | | | 94,356 | |
Husky III Holding Ltd., (13.00% Cash or 13.75% PIK), 13.00%, 02/15/25(b)(l) | | | | | | | 240 | | | | 212,400 | |
Madison IAQ LLC, 5.88%, 06/30/29(b)(g) | | | | | | | 649 | | | | 444,824 | |
Mueller Water Products, Inc., 4.00%, 06/15/29(b) | | | | | | | 138 | | | | 121,268 | |
OT Merger Corp., 7.88%, 10/15/29(b) | | | | | | | 115 | | | | 60,950 | |
| | | | | | | | | | | | |
| Security | | | | | Par (000) | | | Value | |
|
Machinery (continued) | |
Stevens Holding Co., Inc., 6.13%, 10/01/26(b) | | | USD | | | | 167 | | | $ | 167,418 | |
Terex Corp., 5.00%, 05/15/29(b) | | | | | | | 333 | | | | 299,284 | |
Titan Acquisition Ltd./Titan Co.-Borrower LLC, 7.75%, 04/15/26(b)(g) | | | | | | | 852 | | | | 767,301 | |
TK Elevator Holdco GmbH, 7.63%, 07/15/28(b)(g) | | | | | | | 400 | | | | 326,605 | |
TK Elevator Midco GmbH, 4.38%, 07/15/27(d) | | | EUR | | | | 205 | | | | 194,140 | |
TK Elevator U.S. Newco, Inc., 5.25%, 07/15/27(b)(g) | | | USD | | | | 1,033 | | | | 916,829 | |
| | | | | | | | | | | | |
| | | | | | | | | | | 4,299,716 | |
| | | |
| Marine — 0.0% | | | | | | | | | |
Huntington Ingalls Industries, Inc., 4.20%, 05/01/30(g) | | | | | | | 178 | | | | 161,558 | |
| | | | | | | | | | | | |
| | | |
Media — 8.4% | | | | | | | | | | | | |
Altice Financing SA | | | | | | | | | | | | |
3.00%, 01/15/28(d) | | | EUR | | | | 100 | | | | 84,351 | |
5.00%, 01/15/28(b)(g) | | | USD | | | | 378 | | | | 304,290 | |
5.75%, 08/15/29(b)(g) | | | | | | | 1,324 | | | | 1,041,409 | |
Altice France Holding SA, 10.50%, 05/15/27(b)(g) | | | | | | | 372 | | | | 283,650 | |
AMC Networks, Inc. | | | | | | | | | | | | |
4.75%, 08/01/25 | | | | | | | 189 | | | | 143,640 | |
4.25%, 02/15/29 | | | | | | | 123 | | | | 76,641 | |
Block Communications, Inc., 4.88%, 03/01/28(b) | | | | | | | 128 | | | | 111,680 | |
Cable One, Inc. | | | | | | | | | | | | |
0.00%, 03/15/26(h)(i) | | | | | | | 88 | | | | 69,124 | |
1.13%, 03/15/28(h) | | | | | | | 620 | | | | 460,660 | |
4.00%, 11/15/30(b)(g) | | | | | | | 298 | | | | 233,845 | |
CCO Holdings LLC/CCO Holdings Capital Corp.(g) | | | | | | | | | | | | |
5.13%, 05/01/27(b) | | | | | | | 565 | | | | 526,620 | |
5.38%, 06/01/29(b) | | | | | | | 731 | | | | 661,021 | |
6.38%, 09/01/29(b) | | | | | | | 734 | | | | 689,769 | |
4.75%, 03/01/30(b) | | | | | | | 287 | | | | 247,513 | |
4.50%, 08/15/30(b) | | | | | | | 233 | | | | 192,494 | |
4.25%, 02/01/31(b) | | | | | | | 764 | | | | 612,816 | |
4.75%, 02/01/32(b) | | | | | | | 562 | | | | 455,613 | |
4.50%, 05/01/32 | | | | | | | 463 | | | | 368,548 | |
4.50%, 06/01/33(b) | | | | | | | 260 | | | | 199,480 | |
4.25%, 01/15/34(b) | | | | | | | 991 | | | | 731,403 | |
Charter Communications Operating LLC/Charter Communications Operating Capital(g) | | | | | | | | | | | | |
4.91%, 07/23/25 | | | | | | | 2,425 | | | | 2,376,745 | |
4.40%, 04/01/33 | | | | | | | 754 | | | | 645,167 | |
5.38%, 05/01/47 | | | | | | | 425 | | | | 333,388 | |
Clear Channel International BV, 6.63%, 08/01/25(b)(g) | | | | | | | 384 | | | | 366,414 | |
Clear Channel Outdoor Holdings, Inc.(b)(g) | | | | | | | | | | | | |
5.13%, 08/15/27 | | | | | | | 1,711 | | | | 1,482,581 | |
7.75%, 04/15/28 | | | | | | | 956 | | | | 697,889 | |
7.50%, 06/01/29 | | | | | | | 803 | | | | 589,619 | |
CMG Media Corp., 8.88%, 12/15/27(b)(g) | | | | | | | 498 | | | | 374,845 | |
Comcast Corp., 3.95%, 10/15/25(g) | | | | | | | 3,000 | | | | 2,937,937 | |
Connect Finco SARL/Connect U.S. Finco LLC, 6.75%, 10/01/26(b)(g) | | | | | | | 1,866 | | | | 1,729,333 | |
CSC Holdings LLC(g) | | | | | | | | | | | | |
5.25%, 06/01/24 | | | | | | | 164 | | | | 152,686 | |
6.50%, 02/01/29(b) | | | | | | | 865 | | | | 707,137 | |
4.13%, 12/01/30(b) | | | | | | | 899 | | | | 634,541 | |
3.38%, 02/15/31(b) | | | | | | | 257 | | | | 167,599 | |
4.50%, 11/15/31(b) | | | | | | | 875 | | | | 607,087 | |
Directv Financing LLC/Directv Financing Co.- Obligor, Inc., 5.88%, 08/15/27(b)(g) | | | | | | | 459 | | | | 410,649 | |
| | |
SCHEDULE OF INVESTMENTS | | 79 |
| | |
Schedule of Investments (continued) December 31, 2022 | | BlackRock Limited Duration Income Trust (BLW) (Percentages shown are based on Net Assets) |
| | | | | | | | | | | | |
| Security | | | | | Par (000) | | | Value | |
| | | |
Media (continued) | | | | | | | | | | | | |
Discovery Communications LLC, 3.45%, 03/15/25(g) | | | USD | | | | 170 | | | $ | 161,254 | |
DISH DBS Corp.(g) | | | | | | | | | | | | |
7.75%, 07/01/26 | | | | | | | 601 | | | | 484,640 | |
5.25%, 12/01/26(b) | | | | | | | 1,102 | | | | 928,253 | |
5.75%, 12/01/28(b) | | | | | | | 847 | | | | 676,012 | |
Frontier Communications Holdings LLC(b) | | | | | | | | | | | | |
5.88%, 10/15/27(g) | | | | | | | 267 | | | | 247,928 | |
5.00%, 05/01/28(g) | | | | | | | 668 | | | | 582,509 | |
6.75%, 05/01/29(g) | | | | | | | 573 | | | | 474,020 | |
6.00%, 01/15/30(g) | | | | | | | 196 | | | | 153,972 | |
8.75%, 05/15/30 | | | | | | | 300 | | | | 305,025 | |
GCI LLC, 4.75%, 10/15/28(b) | | | | | | | 107 | | | | 89,889 | |
iHeartCommunications, Inc. | | | | | | | | | | | | |
6.38%, 05/01/26(g) | | | | | | | 264 | | | | 243,037 | |
5.25%, 08/15/27(b) | | | | | | | 122 | | | | 103,344 | |
4.75%, 01/15/28(b) | | | | | | | 78 | | | | 63,519 | |
Iliad Holding SASU(b)(g) | | | | | | | | | | | | |
6.50%, 10/15/26 | | | | | | | 1,223 | | | | 1,134,276 | |
7.00%, 10/15/28 | | | | | | | 498 | | | | 450,087 | |
Lamar Media Corp. | | | | | | | | | | | | |
3.75%, 02/15/28 | | | | | | | 39 | | | | 34,909 | |
4.00%, 02/15/30 | | | | | | | 126 | | | | 110,124 | |
LCPR Senior Secured Financing DAC(b)(g) | | | | | | | | | | | | |
6.75%, 10/15/27 | | | | | | | 360 | | | | 336,600 | |
5.13%, 07/15/29 | | | | | | | 768 | | | | 636,217 | |
Liberty Broadband Corp.(b)(h) | | | | | | | | | | | | |
1.25%, 09/30/50 | | | | | | | 413 | | | | 398,545 | |
2.75%, 09/30/50 | | | | | | | 478 | | | | 465,549 | |
Ligado Networks LLC, (15.50% PIK), 15.50%, 11/01/23(b)(l) | | | | | | | 389 | | | | 114,855 | |
Lions Gate Capital Holdings LLC, 5.50%, 04/15/29(b)(g) | | | | | | | 748 | | | | 433,688 | |
Live Nation Entertainment, Inc.(b) | | | | | | | | | | | | |
4.88%, 11/01/24 | | | | | | | 31 | | | | 30,016 | |
6.50%, 05/15/27(g) | | | | | | | 1,314 | | | | 1,285,815 | |
4.75%, 10/15/27(g) | | | | | | | 279 | | | | 248,401 | |
3.75%, 01/15/28 | | | | | | | 196 | | | | 167,007 | |
Midcontinent Communications/Midcontinent Finance Corp., 5.38%, 08/15/27(b) | | | | | | | 177 | | | | 160,253 | |
Network i2i Ltd., (5 year CMT + 4.27%), 5.65%(a)(d)(g)(k) | | | | | | | 300 | | | | 284,775 | |
Outfront Media Capital LLC/Outfront Media Capital Corp.(b) | | | | | | | | | | | | |
5.00%, 08/15/27(g) | | | | | | | 454 | | | | 408,712 | |
4.25%, 01/15/29 | | | | | | | 187 | | | | 155,160 | |
4.63%, 03/15/30 | | | | | | | 81 | | | | 67,013 | |
Radiate Holdco LLC/Radiate Finance, Inc.(b) | | | | | | | | | | | | |
4.50%, 09/15/26 | | | | | | | 995 | | | | 731,026 | |
6.50%, 09/15/28(g) | | | | | | | 1,708 | | | | 715,678 | |
Sable International Finance Ltd., 5.75%, 09/07/27(b) | | | | | | | 200 | | | | 184,750 | |
Sinclair Television Group, Inc., 4.13%, 12/01/30(b)(g) | | | | | | | 495 | | | | 371,095 | |
Sirius XM Radio, Inc.(b) | | | | | | | | | | | | |
3.13%, 09/01/26(g) | | | | | | | 491 | | | | 435,979 | |
5.00%, 08/01/27(g) | | | | | | | 548 | | | | 506,550 | |
4.00%, 07/15/28(g) | | | | | | | 347 | | | | 301,994 | |
5.50%, 07/01/29(g) | | | | | | | 384 | | | | 350,508 | |
4.13%, 07/01/30 | | | | | | | 36 | | | | 29,708 | |
| | | | | | | | | | | | |
| Security | | | | | Par
(000) | | | Value | |
|
Media (continued) | |
Sirius XM Radio, Inc.(b) (continued) 3.88%, 09/01/31(g) | | | USD | | | | 324 | | | $ | 252,775 | |
Stagwell Global LLC, 5.63%, 08/15/29(b) | | | | | | | 101 | | | | 83,283 | |
Summer BC Holdco B SARL, 5.75%, 10/31/26(d) | | | EUR | | | | 100 | | | | 90,052 | |
Telenet Finance Luxembourg Notes SARL, 5.50%, 03/01/28(b) | | | USD | | | | 200 | | | | 180,000 | |
Univision Communications, Inc.(b) | | | | | | | | | | | | |
5.13%, 02/15/25 | | | | | | | 133 | | | | 126,668 | |
6.63%, 06/01/27 | | | | | | | 234 | | | | 225,766 | |
7.38%, 06/30/30 | | | | | | | 209 | | | | 199,741 | |
UPC Broadband Finco BV, 4.88%, 07/15/31(b)(g) | | | | | | | 449 | | | | 373,476 | |
Videotron Ltd., 3.63%, 06/15/29(b) | | | | | | | 262 | | | | 220,735 | |
Virgin Media Vendor Financing Notes IV DAC, 5.00%, 07/15/28(b) | | | | | | | 754 | | | | 659,077 | |
VZ Secured Financing BV, 3.50%, 01/15/32(d) | | | EUR | | | | 100 | | | | 83,495 | |
Warnermedia Holdings, Inc., 4.28%, 03/15/32(b)(g) | | | USD | | | | 752 | | | | 619,471 | |
WMG Acquisition Corp., 3.88%, 07/15/30(b) | | | | | | | 136 | | | | 117,144 | |
Ziggo Bond Co. BV(b)(g) | | | | | | | | | | | | |
6.00%, 01/15/27 | | | | | | | 199 | | | | 185,154 | |
5.13%, 02/28/30 | | | | | | | 225 | | | | 181,687 | |
Ziggo BV, 4.88%, 01/15/30(b)(g) | | | | | | | 200 | | | | 167,354 | |
| | | | | | | | | | | | |
| | | | | | | | | | | 40,536,754 | |
| | | |
| Metals & Mining — 1.7% | | | | | | | | | |
ABJA Investment Co. Pte. Ltd., 5.95%, 07/31/24(d) | | | | | | | 250 | | | | 249,062 | |
AngloGold Ashanti Holdings PLC, 3.75%, 10/01/30 | | | | | | | 200 | | | | 173,538 | |
Arconic Corp.(b)(g) | | | | | | | | | | | | |
6.00%, 05/15/25 | | | | | | | 83 | | | | 81,597 | |
6.13%, 02/15/28 | | | | | | | 378 | | | | 354,664 | |
ATI, Inc. | | | | | | | | | | | | |
5.88%, 12/01/27 | | | | | | | 17 | | | | 16,257 | |
4.88%, 10/01/29 | | | | | | | 101 | | | | 89,257 | |
5.13%, 10/01/31 | | | | | | | 273 | | | | 240,404 | |
Big River Steel LLC/BRS Finance Corp., 6.63%, 01/31/29(b) | | | | | | | 1,083 | | | | 1,031,802 | |
Carpenter Technology Corp. | | | | | | | | | | | | |
6.38%, 07/15/28 | | | | | | | 44 | | | | 41,845 | |
7.63%, 03/15/30 | | | | | | | 326 | | | | 326,778 | |
Commercial Metals Co. | | | | | | | | | | | | |
4.13%, 01/15/30 | | | | | | | 70 | | | | 61,940 | |
4.38%, 03/15/32 | | | | | | | 75 | | | | 65,244 | |
Constellium SE | | | | | | | | | | | | |
4.25%, 02/15/26(d) | | | EUR | | | | 100 | | | | 102,603 | |
5.88%, 02/15/26(b)(g) | | | USD | | | | 588 | | | | 566,403 | |
5.63%, 06/15/28(b)(g) | | | | | | | 500 | | | | 462,110 | |
3.75%, 04/15/29(b)(g) | | | | | | | 756 | | | | 614,203 | |
JSW Steel Ltd., 5.95%, 04/18/24(d) | | | | | | | 200 | | | | 197,500 | |
Kaiser Aluminum Corp.(b) | | | | | | | | | | | | |
4.63%, 03/01/28 | | | | | | | 191 | | | | 166,672 | |
4.50%, 06/01/31(g) | | | | | | | 347 | | | | 278,901 | |
New Gold, Inc., 7.50%, 07/15/27(b)(g) | | | | | | | 545 | | | | 478,267 | |
Novelis Corp.(b)(g) | | | | | | | | | | | | |
3.25%, 11/15/26 | | | | | | | 650 | | | | 582,731 | |
4.75%, 01/30/30 | | | | | | | 951 | | | | 843,123 | |
3.88%, 08/15/31 | | | | | | | 571 | | | | 466,160 | |
Novelis Sheet Ingot GmbH, 3.38%, 04/15/29(d) | | | EUR | | | | 200 | | | | 181,844 | |
Roller Bearing Co. of America, Inc., 4.38%, 10/15/29(b) | | | USD | | | | 122 | | | | 105,493 | |
| | |
| 80 | | 2 0 2 2 BLACK ROCK ANNUAL REPORT TO SHAREHOLDERS |
| | |
Schedule of Investments (continued) December 31, 2022 | | BlackRock Limited Duration Income Trust (BLW) (Percentages shown are based on Net Assets) |
| | | | | | | | | | | | |
| Security | | | | | Par
(000) | | | Value | |
|
| Metals & Mining (continued) | |
Stillwater Mining Co., 4.00%, 11/16/26(d) | | | USD | | | | 200 | | | $ | 175,787 | |
Vedanta Resources Finance II PLC, 13.88%, 01/21/24(d) | | | | | | | 200 | | | | 173,413 | |
| | | | | | | | | | | | |
| | | | | | | | | | | 8,127,598 | |
|
| Multiline Retail — 0.1% | |
NMG Holding Co., Inc./Neiman Marcus Group LLC, 7.13%, 04/01/26(b)(g) | | | | | | | 314 | | | | 294,302 | |
| | | | | | | | | | | | |
|
| Multi-Utilities — 0.1% | |
Edison International, 6.95%, 11/15/29(g) | | | | | | | 100 | | | | 104,428 | |
TransAlta Corp., 7.75%, 11/15/29 | | | | | | | 109 | | | | 111,320 | |
| | | | | | | | | | | | |
| | | | | | | | | | | 215,748 | |
|
| Offshore Drilling & Other Services — 0.4% | |
Applied Materials, Inc., 3.90%, 10/01/25(g) | | | | | | | 285 | | | | 278,647 | |
Entegris Escrow Corp., 4.75%, 04/15/29(b)(g) | | | | | | | 1,366 | | | | 1,245,706 | |
Entegris, Inc.(b) | | | | | | | | | | | | |
4.38%, 04/15/28 | | | | | | | 246 | | | | 217,522 | |
3.63%, 05/01/29 | | | | | | | 158 | | | | 128,651 | |
| | | | | | | | | | | | |
| | | | | | | | | | | 1,870,526 | |
|
| Oil, Gas & Consumable Fuels — 9.3% | |
Aethon United BR LP/Aethon United Finance Corp., 8.25%, 02/15/26(b)(g) | | | | | | | 728 | | | | 722,137 | |
Antero Midstream Partners LP/Antero Midstream Finance Corp.(b) | | | | | | | | | | | | |
5.75%, 03/01/27 | | | | | | | 298 | | | | 281,716 | |
5.75%, 01/15/28 | | | | | | | 59 | | | | 54,729 | |
5.38%, 06/15/29 | | | | | | | 206 | | | | 188,333 | |
Apache Corp. | | | | | | | | | | | | |
4.25%, 01/15/30 | | | | | | | 205 | | | | 181,406 | |
5.10%, 09/01/40(g) | | | | | | | 269 | | | | 222,924 | |
5.35%, 07/01/49 | | | | | | | 137 | | | | 110,682 | |
Arcosa, Inc., 4.38%, 04/15/29(b)(g) | | | | | | | 374 | | | | 324,326 | |
Ascent Resources Utica Holdings LLC/ARU Finance Corp.(b) | | | | | | | | | | | | |
9.00%, 11/01/27(g) | | | | | | | 672 | | | | 826,560 | |
5.88%, 06/30/29 | | | | | | | 291 | | | | 259,464 | |
Buckeye Partners LP | | | | | | | | | | | | |
4.13%, 03/01/25(b) | | | | | | | 262 | | | | 249,530 | |
5.85%, 11/15/43 | | | | | | | 145 | | | | 108,036 | |
5.60%, 10/15/44 | | | | | | | 86 | | | | 62,798 | |
Callon Petroleum Co. | | | | | | | | | | | | |
6.38%, 07/01/26 | | | | | | | 119 | | | | 110,913 | |
8.00%, 08/01/28(b)(g) | | | | | | | 583 | | | | 555,764 | |
7.50%, 06/15/30(b)(g) | | | | | | | 599 | | | | 548,085 | |
Cellnex Telecom SA, Series CLNX, 0.75%, 11/20/31(d) | | | EUR | | | | 100 | | | | 77,168 | |
Cheniere Energy Partners LP(g) | | | | | | | | | | | | |
4.50%, 10/01/29 | | | USD | | | | 872 | | | | 784,121 | |
4.00%, 03/01/31 | | | | | | | 940 | | | | 800,278 | |
3.25%, 01/31/32 | | | | | | | 639 | | | | 507,818 | |
Cheniere Energy, Inc., 4.63%, 10/15/28 | | | | | | | 77 | | | | 69,598 | |
Chesapeake Energy Corp.(b) | | | | | | | | | | | | |
5.88%, 02/01/29 | | | | | | | 41 | | | | 38,847 | |
6.75%, 04/15/29 | | | | | | | 476 | | | | 463,434 | |
Civitas Resources, Inc., 5.00%, 10/15/26(b) | | | | | | | 88 | | | | 80,455 | |
CNX Midstream Partners LP, 4.75%, 04/15/30(b) | | | | | | | 96 | | | | 78,784 | |
CNX Resources Corp. | | | | | | | | | | | | |
2.25%, 05/01/26(h) | | | | | | | 298 | | | | 436,868 | |
6.00%, 01/15/29(b) | | | | | | | 110 | | | | 101,216 | |
| | | | | | | | | | | | |
| Security | | | | | Par
(000) | | | Value | |
| | | |
| Oil, Gas & Consumable Fuels (continued) | | | | | | | | | |
CNX Resources Corp. (continued) 7.38%, 01/15/31(b) | | | USD | | | | 205 | | | $ | 196,490 | |
Colgate Energy Partners III LLC(b)(g) | | | | | | | | | | | | |
7.75%, 02/15/26 | | | | | | | 509 | | | | 493,750 | |
5.88%, 07/01/29 | | | | | | | 353 | | | | 303,178 | |
Comstock Resources, Inc.(b)(g) | | | | | | | | | | | | |
6.75%, 03/01/29 | | | | | | | 647 | | | | 583,917 | |
5.88%, 01/15/30 | | | | | | | 543 | | | | 466,817 | |
CQP Holdco LP/BIP-V Chinook Holdco LLC, 5.50%, 06/15/31(b)(g) | | | | | | | 1,367 | | | | 1,194,088 | |
Crescent Energy Finance LLC, 7.25%, 05/01/26(b)(g) | | | | | | | 708 | | | | 667,177 | |
Crestwood Midstream Partners LP/Crestwood Midstream Finance Corp.(b) | | | | | | | | | | | | |
5.63%, 05/01/27 | | | | | | | 52 | | | | 48,360 | |
6.00%, 02/01/29 | | | | | | | 142 | | | | 130,287 | |
8.00%, 04/01/29 | | | | | | | 90 | | | | 89,558 | |
CrownRock LP/CrownRock Finance, Inc.(b) | | | | | | | | | | | | |
5.63%, 10/15/25(g) | | | | | | | 685 | | | | 661,025 | |
5.00%, 05/01/29 | | | | | | | 44 | | | | 39,535 | |
DCP Midstream Operating LP | | | | | | | | | | | | |
5.63%, 07/15/27 | | | | | | | 49 | | | | 48,606 | |
6.45%, 11/03/36(b) | | | | | | | 162 | | | | 158,748 | |
6.75%, 09/15/37(b)(g) | | | | | | | 295 | | | | 297,357 | |
Diamondback Energy, Inc., 6.25%, 03/15/33(g) | | | | | | | 784 | | | | 795,733 | |
DT Midstream, Inc.(b)(g) | | | | | | | | | | | | |
4.13%, 06/15/29 | | | | | | | 384 | | | | 329,898 | |
4.38%, 06/15/31 | | | | | | | 518 | | | | 434,550 | |
Dycom Industries, Inc., 4.50%, 04/15/29(b) | | | | | | | 119 | | | | 103,577 | |
Earthstone Energy Holdings LLC, 8.00%, 04/15/27(b)(g) | | | | | | | 350 | | | | 334,828 | |
Ecopetrol SA, 4.13%, 01/16/25 | | | | | | | 198 | | | | 188,199 | |
eG Global Finance PLC(b) | | | | | | | | | | | | |
6.75%, 02/07/25(g) | | | | | | | 396 | | | | 345,720 | |
8.50%, 10/30/25 | | | | | | | 252 | | | | 234,769 | |
EIG Pearl Holdings SARL, 3.55%, 08/31/36(b) | | | | | | | 244 | | | | 204,625 | |
Enbridge, Inc., (3 mo. LIBOR US + 3.64%), 6.25%, 03/01/78(a)(g) | | | | | | | 1,565 | | | | 1,423,804 | |
Endeavor Energy Resources LP/EER Finance, Inc., 5.75%, 01/30/28(b)(g) | | | | | | | 386 | | | | 369,603 | |
Energy Transfer LP(g) | | | | | | | | | | | | |
3.90%, 07/15/26 | | | | | | | 235 | | | | 222,031 | |
5.55%, 02/15/28 | | | | | | | 160 | | | | 158,709 | |
3.75%, 05/15/30 | | | | | | | 905 | | | | 797,926 | |
5.75%, 02/15/33 | | | | | | | 185 | | | | 180,997 | |
Series H, (5 year CMT + 5.69%), 6.50%(a)(k) | | | | | | | 701 | | | | 602,860 | |
EnLink Midstream LLC | | | | | | | | | | | | |
5.63%, 01/15/28(b)(g) | | | | | | | 348 | | | | 331,469 | |
5.38%, 06/01/29 | | | | | | | 339 | | | | 313,669 | |
6.50%, 09/01/30(b) | | | | | | | 232 | | | | 229,610 | |
EnLink Midstream Partners LP | | | | | | | | | | | | |
4.15%, 06/01/25 | | | | | | | 7 | | | | 6,615 | |
4.85%, 07/15/26 | | | | | | | 115 | | | | 108,103 | |
5.60%, 04/01/44 | | | | | | | 226 | | | | 186,397 | |
5.05%, 04/01/45 | | | | | | | 40 | | | | 30,313 | |
5.45%, 06/01/47 | | | | | | | 60 | | | | 48,195 | |
EQM Midstream Partners LP | | | | | | | | | | | | |
6.00%, 07/01/25(b) | | | | | | | 128 | | | | 123,520 | |
4.13%, 12/01/26 | | | | | | | 100 | | | | 88,944 | |
6.50%, 07/01/27(b)(g) | | | | | | | 364 | | | | 347,893 | |
| | |
SCHEDULE OF INVESTMENTS | | 81 |
| | |
Schedule of Investments (continued) December 31, 2022 | | BlackRock Limited Duration Income Trust (BLW) (Percentages shown are based on Net Assets) |
| | | | | | | | | | | | |
| Security | | | | | Par (000) | | | Value | |
| | | |
| Oil, Gas & Consumable Fuels (continued) | | | | | | | | | |
EQM Midstream Partners LP (continued) | |
4.50%, 01/15/29(b) | | | USD | | | | 21 | | | $ | 17,638 | |
7.50%, 06/01/30(b) | | | | | | | 84 | | | | 80,936 | |
4.75%, 01/15/31(b)(g) | | | | | | | 506 | | | | 413,655 | |
EQT Corp., 1.75%, 05/01/26(h) | | | | | | | 76 | | | | 176,472 | |
Genesis Energy LP/Genesis Energy Finance Corp. | | | | | | | | | | | | |
6.50%, 10/01/25 | | | | | | | 112 | | | | 107,040 | |
7.75%, 02/01/28 | | | | | | | 150 | | | | 138,072 | |
Gulfport Energy Corp., 8.00%, 05/17/26(b) | | | | | | | 37 | | | | 36,075 | |
Harvest Midstream I LP, 7.50%, 09/01/28(b) | | | | | | | 60 | | | | 57,266 | |
Hess Corp., 4.30%, 04/01/27(g) | | | | | | | 50 | | | | 47,753 | |
Hess Midstream Operations LP, 4.25%, 02/15/30(b) | | | | | | | 240 | | | | 205,181 | |
Hilcorp Energy I LP/Hilcorp Finance Co.(b) | | | | | | | | | | | | |
6.25%, 11/01/28 | | | | | | | 145 | | | | 131,225 | |
5.75%, 02/01/29 | | | | | | | 214 | | | | 190,474 | |
6.00%, 04/15/30 | | | | | | | 27 | | | | 24,010 | |
6.00%, 02/01/31 | | | | | | | 16 | | | | 13,801 | |
6.25%, 04/15/32 | | | | | | | 7 | | | | 6,040 | |
HPCL-Mittal Energy Ltd., 5.45%, 10/22/26(d) | | | | | | | 200 | | | | 186,750 | |
HTA Group Ltd., 7.00%, 12/18/25(b) | | | | | | | 200 | | | | 183,600 | |
IHS Holding Ltd., 6.25%, 11/29/28(b) | | | | | | | 200 | | | | 160,788 | |
Impulsora Pipeline LLC, 6.05%, 12/31/42(c) | | | | | | | 1,364 | | | | 1,198,484 | |
ITT Holdings LLC, 6.50%, 08/01/29(b)(g) | | | | | | | 343 | | | | 288,854 | |
Kinder Morgan, Inc., 4.80%, 02/01/33(g) | | | | | | | 517 | | | | 479,319 | |
Kinetik Holdings LP, 5.88%, 06/15/30(b)(g) | | | | | | | 553 | | | | 518,594 | |
Leviathan Bond Ltd., 5.75%, 06/30/23(b)(d) | | | | | | | 58 | | | | 58,007 | |
Magnolia Oil & Gas Operating LLC/Magnolia Oil & Gas Finance Corp., 6.00%, 08/01/26(b) | | | | | | | 32 | | | | 30,720 | |
Matador Resources Co., 5.88%, 09/15/26(g) | | | | | | | 466 | | | | 448,040 | |
Medco Bell Pte. Ltd., 6.38%, 01/30/27(d) | | | | | | | 250 | | | | 224,375 | |
MPLX LP, 4.25%, 12/01/27(g) | | | | | | | 185 | | | | 174,810 | |
Murphy Oil Corp. | | | | | | | | | | | | |
5.75%, 08/15/25 | | | | | | | 14 | | | | 13,756 | |
5.88%, 12/01/27 | | | | | | | 56 | | | | 53,888 | |
6.13%, 12/01/42 | | | | | | | 29 | | | | 22,620 | |
Murphy Oil USA, Inc., 4.75%, 09/15/29 | | | | | | | 146 | | | | 133,594 | |
Nabors Industries Ltd.(b) | | | | | | | | | | | | |
7.25%, 01/15/26 | | | | | | | 199 | | | | 187,537 | |
7.50%, 01/15/28 | | | | | | | 248 | | | | 226,894 | |
Nabors Industries, Inc.(g) | | | | | | | | | | | | |
5.75%, 02/01/25 | | | | | | | 630 | | | | 600,774 | |
7.38%, 05/15/27(b) | | | | | | | 331 | | | | 320,638 | |
New Fortress Energy, Inc.(b)(g) | | | | | | | | | | | | |
6.75%, 09/15/25 | | | | | | | 762 | | | | 720,700 | |
6.50%, 09/30/26 | | | | | | | 1,162 | | | | 1,079,149 | |
NGL Energy Operating LLC/NGL Energy Finance Corp., 7.50%, 02/01/26(b)(g) | | | | | | | 171 | | | | 152,257 | |
NGPL PipeCo LLC, 7.77%, 12/15/37(b)(g) | | | | | | | 227 | | | | 236,197 | |
Northern Oil & Gas, Inc., 8.13%, 03/01/28(b)(g) | | | | | | | 873 | | | | 838,249 | |
NuStar Logistics LP | | | | | | | | | | | | |
6.00%, 06/01/26 | | | | | | | 163 | | | | 156,954 | |
6.38%, 10/01/30 | | | | | | | 25 | | | | 23,117 | |
Occidental Petroleum Corp. | | | | | | | | | | | | |
6.95%, 07/01/24 | | | | | | | 30 | | | | 30,571 | |
5.88%, 09/01/25 | | | | | | | 117 | | | | 116,576 | |
8.88%, 07/15/30 | | | | | | | 100 | | | | 112,900 | |
6.63%, 09/01/30(g) | | | | | | | 713 | | | | 736,800 | |
7.50%, 05/01/31 | | | | | | | 94 | | | | 100,436 | |
6.45%, 09/15/36 | | | | | | | 179 | | | | 182,580 | |
6.20%, 03/15/40(g) | | | | | | | 899 | | | | 879,758 | |
6.60%, 03/15/46 | | | | | | | 64 | | | | 65,855 | |
| | | | | | | | | | | | |
| Security | | | | | Par (000) | | | Value | |
| | | |
| Oil, Gas & Consumable Fuels (continued) | | | | | | | | | |
Odebrecht Offshore Drilling Finance Ltd., (7.72% PIK), 7.72%, 12/01/26(b)(l) | | | USD | | | | — | (m) | | $ | 45 | |
ONEOK, Inc., 4.35%, 03/15/29(g) | | | | | | | 280 | | | | 258,774 | |
PDC Energy, Inc. | | | | | | | | | | | | |
6.13%, 09/15/24 | | | | | | | 75 | | | | 74,573 | |
5.75%, 05/15/26 | | | | | | | 235 | | | | 224,324 | |
Permian Resources Operating LLC | | | | | | | | | | | | |
6.88%, 04/01/27(b) | | | | | | | 46 | | | | 43,343 | |
3.25%, 04/01/28(h) | | | | | | | 192 | | | | 324,192 | |
Pertamina Persero PT, 3.65%, 07/30/29(d) | | | | | | | 384 | | | | 350,442 | |
Petroleos Mexicanos(g) | | | | | | | | | | | | |
6.50%, 03/13/27 | | | | | | | 130 | | | | 118,138 | |
8.75%, 06/02/29 | | | | | | | 130 | | | | 121,452 | |
5.95%, 01/28/31 | | | | | | | 158 | | | | 119,448 | |
6.70%, 02/16/32 | | | | | | | 97 | | | | 76,024 | |
Pioneer Natural Resources Co., 0.25%, 05/15/25(g)(h) | | | | | | | 129 | | | | 300,828 | |
Plains All American Pipeline LP/PAA Finance Corp., 3.80%, 09/15/30(g) | | | | | | | 443 | | | | 385,003 | |
Precision Drilling Corp., 6.88%, 01/15/29(b) | | | | | | | 12 | | | | 11,172 | |
Puma International Financing SA, 5.13%, 10/06/24(b) | | | | | | | 200 | | | | 185,000 | |
Range Resources Corp. | | | | | | | | | | | | |
4.88%, 05/15/25 | | | | | | | 14 | | | | 13,299 | |
4.75%, 02/15/30(b) | | | | | | | 17 | | | | 14,979 | |
Rockcliff Energy II LLC, 5.50%, 10/15/29(b)(g) | | | | | | | 377 | | | | 344,936 | |
Rockies Express Pipeline LLC, 4.95%, 07/15/29(b) | | | | | | | 51 | | | | 45,765 | |
Sabine Pass Liquefaction LLC, 5.90%, 09/15/37(g) | | | | | | | 145 | | | | 145,100 | |
SM Energy Co. | | | | | | | | | | | | |
5.63%, 06/01/25 | | | | | | | 74 | | | | 71,039 | |
6.75%, 09/15/26(g) | | | | | | | 156 | | | | 151,453 | |
6.63%, 01/15/27 | | | | | | | 21 | | | | 20,228 | |
6.50%, 07/15/28(g) | | | | | | | 91 | | | | 87,248 | |
Southwestern Energy Co. | | | | | | | | | | | | |
5.70%, 01/23/25 | | | | | | | 18 | | | | 17,685 | |
5.38%, 02/01/29(g) | | | | | | | 279 | | | | 258,650 | |
4.75%, 02/01/32 | | | | | | | 161 | | | | 137,589 | |
Sunoco LP/Sunoco Finance Corp. | | | | | | | | | | | | |
6.00%, 04/15/27 | | | | | | | 63 | | | | 62,036 | |
5.88%, 03/15/28 | | | | | | | 124 | | | | 117,433 | |
Tallgrass Energy Partners LP/Tallgrass Energy Finance Corp.(b) | | | | | | | | | | | | |
6.00%, 03/01/27 | | | | | | | 41 | | | | 38,278 | |
5.50%, 01/15/28 | | | | | | | 34 | | | | 30,153 | |
6.00%, 12/31/30 | | | | | | | 28 | | | | 24,212 | |
6.00%, 09/01/31 | | | | | | | 131 | | | | 112,632 | |
Tap Rock Resources LLC, 7.00%, 10/01/26(b)(g) | | | | | | | 768 | | | | 714,317 | |
Targa Resources Partners LP/Targa Resources Partners Finance Corp., 6.88%, 01/15/29(g) | | | | | | | 525 | | | | 529,178 | |
Transcontinental Gas Pipe Line Co. LLC, 4.00%, 03/15/28(g) | | | | | | | 280 | | | | 262,711 | |
Transocean, Inc., 11.50%, 01/30/27(b) | | | | | | | 171 | | | | 171,428 | |
Venture Global Calcasieu Pass LLC(b)(g) | | | | | | | | | | | | |
3.88%, 08/15/29 | | | | | | | 870 | | | | 761,250 | |
4.13%, 08/15/31 | | | | | | | 805 | | | | 685,856 | |
3.88%, 11/01/33 | | | | | | | 1,545 | | | | 1,262,110 | |
Vermilion Energy, Inc., 6.88%, 05/01/30(b) | | | | | | | 159 | | | | 145,101 | |
Vivo Energy Investments BV, 5.13%, 09/24/27(b) | | | | | | | 200 | | | | 178,225 | |
Western Midstream Operating LP | | | | | | | | | | | | |
4.75%, 08/15/28 | | | | | | | 37 | | | | 33,792 | |
5.45%, 04/01/44 | | | | | | | 339 | | | | 281,614 | |
| | |
| 82 | | 2 0 2 2 BLACK ROCK ANNUAL REPORT TO SHAREHOLDERS |
| | |
Schedule of Investments (continued) December 31, 2022 | | BlackRock Limited Duration Income Trust (BLW) (Percentages shown are based on Net Assets) |
| | | | | | | | | | | | |
| Security | | | | | Par (000) | | | Value | |
|
| Oil, Gas & Consumable Fuels (continued) | |
Western Midstream Operating LP (continued) | |
5.30%, 03/01/48 | | | USD | | | | 199 | | | $ | 163,623 | |
5.50%, 08/15/48 | | | | | | | 99 | | | | 82,167 | |
5.50%, 02/01/50(g) | | | | | | | 795 | | | | 654,921 | |
| | | | | | | | | | | | |
| | | | | | | | | | | 44,968,985 | |
|
| Pharmaceuticals — 0.9% | |
AbbVie, Inc., 4.25%, 11/14/28(g) | | | | | | | 1,000 | | | | 964,572 | |
Cheplapharm Arzneimittel GmbH, 4.38%, 01/15/28(d) | | | EUR | | | | 100 | | | | 93,777 | |
CVS Health Corp., 1.30%, 08/21/27(g) | | | USD | | | | 1,000 | | | | 846,635 | |
Elanco Animal Health, Inc., 6.40%, 08/28/28 | | | | | | | 128 | | | | 121,793 | |
Gruenenthal GmbH, 4.13%, 05/15/28(d) | | | EUR | | | | 100 | | | | 96,073 | |
Jazz Securities DAC, 4.38%, 01/15/29(b)(g) | | | USD | | | | 200 | | | | 178,230 | |
Nidda Healthcare Holding GmbH, 7.50%, 08/21/26(d) | | | EUR | | | | 100 | | | | 101,827 | |
Option Care Health, Inc., 4.38%, 10/31/29(b) | | | USD | | | | 245 | | | | 214,304 | |
Organon & Co./Organon Foreign Debt Co.-Issuer BV(b)(g) | | | | | | | | | | | | |
4.13%, 04/30/28 | | | | | | | 428 | | | | 378,951 | |
5.13%, 04/30/31 | | | | | | | 398 | | | | 344,620 | |
PRA Health Sciences, Inc., 2.88%, 07/15/26(b)(g) | | | | | | | 484 | | | | 438,046 | |
Prestige Brands, Inc., 3.75%, 04/01/31(b) | | | | | | | 149 | | | | 122,876 | |
Teva Pharmaceutical Finance Netherlands II BV, 6.00%, 01/31/25 | | | EUR | | | | 100 | | | | 105,024 | |
Teva Pharmaceutical Finance Netherlands III BV, 4.75%, 05/09/27(g) | | | USD | | | | 400 | | | | 360,450 | |
| | | | | | | | | | | | |
| | | | | | | | | | | 4,367,178 | |
|
| Real Estate — 0.0% | |
VICI Properties LP/VICI Note Co., Inc., 4.50%, 01/15/28(b) | | | | | | | 98 | | | | 89,927 | |
| | | | | | | | | | | | |
|
| Real Estate Management & Development — 0.6% | |
Adler Group SA, 2.75%, 11/13/26(d)(e)(j) | | | EUR | | | | 100 | | | | 42,283 | |
CIFI Holdings Group Co. Ltd., 6.00%, 07/16/25(d)(e)(j) | | | USD | | | | 200 | | | | 50,000 | |
Country Garden Holdings Co. Ltd.,
6.50%, 04/08/24(d) | | | | | | | 200 | | | | 149,600 | |
DIC Asset AG, 2.25%, 09/22/26(d) | | | EUR | | | | 100 | | | | 61,016 | |
Easy Tactic Ltd., (6.50% Cash or 7.50% PIK), 7.50%, 07/11/27(l) | | | USD | | | | 210 | | | | 42,378 | |
Fantasia Holdings Group Co. Ltd.(d)(e)(j) | | | | | | | | | | | | |
11.75%, 04/17/22 | | | | | | | 400 | | | | 31,000 | |
11.88%, 06/01/23 | | | | | | | 200 | | | | 15,500 | |
9.25%, 07/28/23 | | | | | | | 200 | | | | 15,500 | |
9.88%, 10/19/23 | | | | | | | 200 | | | | 15,500 | |
Greystar Real Estate Partners LLC, 5.75%, 12/01/25(b) | | | | | | | 100 | | | | 97,725 | |
Howard Hughes Corp.(b) | | | | | | | | | | | | |
5.38%, 08/01/28 | | | | | | | 79 | | | | 71,158 | |
4.13%, 02/01/29 | | | | | | | 149 | | | | 124,787 | |
4.38%, 02/01/31 | | | | | | | 140 | | | | 113,270 | |
Jingrui Holdings Ltd.,
12.00%, 07/25/22(d)(e)(j) | | | | | | | 200 | | | | 18,400 | |
MAF Sukuk Ltd., 4.64%, 05/14/29(d)(g) | | | | | | | 275 | | | | 266,802 | |
Modern Land China Co. Ltd., 9.80%, 04/11/23(d)(e)(j) | | | | | | | 431 | | | | 24,782 | |
Realogy Group LLC/Realogy Co.-Issuer Corp.(b) | | | | | | | | | | | | |
5.75%, 01/15/29 | | | | | | | 456 | | | | 344,914 | |
5.25%, 04/15/30 | | | | | | | 135 | | | | 98,484 | |
Ronshine China Holdings Ltd., 6.75%, 08/05/24(d)(e)(j) | | | | | | | 200 | | | | 10,000 | |
Sinic Holdings Group Co. Ltd., 10.50%, 06/18/22(e)(j) | | | | | | | 200 | | | | 2,000 | |
| | | | | | | | | | | | |
| Security | | | | | Par (000) | | | Value | |
|
| Real Estate Management & Development (continued) | |
Starwood Property Trust, Inc., 4.38%, 01/15/27(b) | | | USD | | | | 77 | | | $ | 67,381 | |
Theta Capital Pte. Ltd., 8.13%, 01/22/25(d) | | | | | | | 200 | | | | 150,787 | |
VICI Properties LP, 5.13%, 05/15/32(g) | | | | | | | 851 | | | | 787,983 | |
Yanlord Land HK Co. Ltd., 6.80%, 02/27/24(d) | | | | | | | 200 | | | | 192,000 | |
Yuzhou Group Holdings Co. Ltd.(d)(e)(j) | | | | | | | | | | | | |
7.70%, 02/20/25 | | | | | | | 200 | | | | 17,500 | |
8.30%, 05/27/25 | | | | | | | 200 | | | | 17,500 | |
| | | | | | | | | | | | |
| | | | | | | | | | | 2,828,250 | |
|
| Road & Rail — 0.8% | |
Danaos Corp., 8.50%, 03/01/28(b) | | | | | | | 100 | | | | 96,000 | |
Lima Metro Line 2 Finance Ltd., 5.88%, 07/05/34(b)(g) | | | | | | | 1,419 | | | | 1,374,783 | |
Seaspan Corp., 5.50%, 08/01/29(b)(g) | | | | | | | 328 | | | | 248,558 | |
Union Pacific Corp., 3.20%, 05/20/41(g) | | | | | | | 600 | | | | 470,740 | |
United Rentals North America, Inc., 6.00%, 12/15/29(g) | | | | | | | 1,560 | | | | 1,550,250 | |
| | | | | | | | | | | | |
| | | | | | | | | | | 3,740,331 | |
|
| Semiconductors & Semiconductor Equipment — 1.4% | |
Broadcom Corp./Broadcom Cayman Finance Ltd., 3.88%, 01/15/27(g) | | | | | | | 600 | | | | 567,534 | |
Broadcom, Inc. | | | | | | | | | | | | |
4.11%, 09/15/28(g) | | | | | | | 1,739 | | | | 1,617,261 | |
4.15%, 11/15/30 | | | | | | | 86 | | | | 77,069 | |
2.45%, 02/15/31(b)(g) | | | | | | | 170 | | | | 133,895 | |
4.30%, 11/15/32(g) | | | | | | | 400 | | | | 352,536 | |
2.60%, 02/15/33(b)(g) | | | | | | | 216 | | | | 162,129 | |
3.42%, 04/15/33(b)(g) | | | | | | | 241 | | | | 193,212 | |
3.47%, 04/15/34(b) | | | | | | | 9 | | | | 7,180 | |
Marvell Technology, Inc., 2.95%, 04/15/31(g) | | | | | | | 324 | | | | 260,606 | |
Microchip Technology, Inc.(h) | | | | | | | | | | | | |
0.13%, 11/15/24 | | | | | | | 125 | | | | 134,062 | |
1.63%, 02/15/25 | | | | | | | 30 | | | | 93,458 | |
1.63%, 02/15/27 | | | | | | | 30 | | | | 59,550 | |
NXP BV/NXP Funding LLC/NXP USA, Inc., 2.70%, 05/01/25 | | | | | | | 33 | | | | 30,995 | |
QUALCOMM, Inc., 1.65%, 05/20/32(g) | | | | | | | 1,779 | | | | 1,370,204 | |
Sensata Technologies BV(b) | | | | | | | | | | | | |
5.63%, 11/01/24(g) | | | | | | | 229 | | | | 226,797 | |
5.00%, 10/01/25(g) | | | | | | | 324 | | | | 316,422 | |
4.00%, 04/15/29 | | | | | | | 168 | | | | 144,900 | |
5.88%, 09/01/30 | | | | | | | 237 | | | | 224,611 | |
Sensata Technologies, Inc.(b) | | | | | | | | | | | | |
4.38%, 02/15/30(g) | | | | | | | 596 | | | | 518,821 | |
3.75%, 02/15/31 | | | | | | | 34 | | | | 27,970 | |
Synaptics, Inc., 4.00%, 06/15/29(b) | | | | | | | 226 | | | | 190,416 | |
| | | | | | | | | | | | |
| | | | | | | | | | | 6,709,628 | |
| | | |
| Software — 2.4% | | | | | | | | | |
ACI Worldwide, Inc., 5.75%, 08/15/26(b)(g) | | | | | | | 444 | | | | 430,125 | |
Black Knight InfoServ LLC,
3.63%, 09/01/28(b)(g) | | | | | | | 386 | | | | 334,855 | |
Boxer Parent Co., Inc. | | | | | | | | | | | | |
6.50%, 10/02/25(d) | | | EUR | | | | 100 | | | | 101,636 | |
7.13%, 10/02/25(b)(g) | | | USD | | | | 398 | | | | 387,060 | |
9.13%, 03/01/26(b)(g) | | | | | | | 678 | | | | 639,635 | |
Central Parent, Inc./CDK Global, Inc., 7.25%, 06/15/29(b)(g) | | | | | | | 558 | | | | 545,792 | |
Cloud Software Group Holdings, Inc., 6.50%, 03/31/29(b)(g) | | | | | | | 2,441 | | | | 2,056,008 | |
Elastic NV, 4.13%, 07/15/29(b)(g) | | | | | | | 376 | | | | 303,695 | |
Helios Software Holdings, Inc./ION Corporate Solutions Finance SARL, 4.63%, 05/01/28(b) | | | | | | | 200 | | | | 151,995 | |
| | |
SCHEDULE OF INVESTMENTS | | 83 |
| | |
Schedule of Investments (continued) December 31, 2022 | | BlackRock Limited Duration Income Trust (BLW) (Percentages shown are based on Net Assets) |
| | | | | | | | | | | | |
| Security | | | | | Par (000) | | | Value | |
|
| Software (continued) | |
Iron Mountain Information Management Services, Inc., 5.00%, 07/15/32(b) | | | USD | | | | 230 | | | $ | 191,061 | |
MicroStrategy, Inc., 6.13%, 06/15/28(b)(g) | | | | | | | 451 | | | | 322,488 | |
MSCI, Inc.(b) | | | | | | | | | | | | |
4.00%, 11/15/29 | | | | | | | 83 | | | | 72,296 | |
3.63%, 09/01/30 | | | | | | | 147 | | | | 122,194 | |
3.88%, 02/15/31(g) | | | | | | | 190 | | | | 157,971 | |
3.63%, 11/01/31 | | | | | | | 129 | | | | 106,680 | |
3.25%, 08/15/33 | | | | | | | 183 | | | | 141,323 | |
Open Text Corp., 6.90%, 12/01/27 | | | | | | | 835 | | | | 835,000 | |
Oracle Corp. | | | | | | | | | | | | |
6.15%, 11/09/29(g) | | | | | | | 535 | | | | 555,312 | |
2.95%, 04/01/30 | | | | | | | 89 | | | | 75,882 | |
6.25%, 11/09/32(g) | | | | | | | 1,563 | | | | 1,635,868 | |
3.60%, 04/01/50(g) | | | | | | | 785 | | | | 528,514 | |
PTC, Inc.(b) | | | | | | | | | | | | |
3.63%, 02/15/25 | | | | | | | 76 | | | | 72,385 | |
4.00%, 02/15/28 | | | | | | | 187 | | | | 168,306 | |
SS&C Technologies, Inc.,
5.50%, 09/30/27(b)(g) | | | | | | | 1,020 | | | | 955,124 | |
Veritas U.S., Inc./Veritas Bermuda Ltd., 7.50%, 09/01/25(b)(g) | | | | | | | 609 | | | | 419,430 | |
| | | | | | | | | | | | |
| | | | | | | | | | | 11,310,635 | |
|
| Specialty Retail(b) — 0.3% | |
Arko Corp., 5.13%, 11/15/29 | | | | | | | 181 | | | | 142,121 | |
PetSmart, Inc./PetSmart Finance Corp. | | | | | | | | | | | | |
4.75%, 02/15/28 | | | | | | | 343 | | | | 310,589 | |
7.75%, 02/15/29(g) | | | | | | | 587 | | | | 551,306 | |
Staples, Inc., 7.50%, 04/15/26(g) | | | | | | | 411 | | | | 353,740 | |
| | | | | | | | | | | | |
| | | | | | | | | | | 1,357,756 | |
|
| Technology Hardware, Storage & Peripherals — 0.1% | |
Coherent Corp., 5.00%, 12/15/29(b)(g) | | | | | | | 495 | | | | 426,903 | |
| | | | | | | | | | | | |
|
| Textiles, Apparel & Luxury Goods(b) — 0.1% | |
Crocs, Inc. | | | | | | | | | | | | |
4.25%, 03/15/29 | | | | | | | 25 | | | | 21,177 | |
4.13%, 08/15/31 | | | | | | | 149 | | | | 121,428 | |
Kontoor Brands, Inc., 4.13%, 11/15/29 | | | | | | | 98 | | | | 79,979 | |
Levi Strauss & Co., 3.50%, 03/01/31(g) | | | | | | | 190 | | | | 150,801 | |
William Carter Co., 5.63%, 03/15/27 | | | | | | | 160 | | | | 153,475 | |
| | | | | | | | | | | | |
| | | | | | | | | | | 526,860 | |
|
| Thrifts & Mortgage Finance — 0.2% | |
Home Point Capital, Inc., 5.00%, 02/01/26(b) | | | | | | | 194 | | | | 134,149 | |
MGIC Investment Corp., 5.25%, 08/15/28(g) | | | | | | | 167 | | | | 153,988 | |
Nationstar Mortgage Holdings, Inc.(b) | | | | | | | | | | | | |
6.00%, 01/15/27 | | | | | | | 147 | | | | 131,565 | |
5.13%, 12/15/30 | | | | | | | 104 | | | | 80,323 | |
5.75%, 11/15/31 | | | | | | | 114 | | | | 88,635 | |
Rocket Mortgage LLC/Rocket Mortgage Co.-Issuer, Inc., 2.88%, 10/15/26(b) | | | | | | | 442 | | | | 378,866 | |
| | | | | | | | | | | | |
| | | | | | | | | | | 967,526 | |
| | | |
| Transportation — 0.0% | | | | | | | | | |
XPO Escrow Sub LLC, 7.50%, 11/15/27(g) | | | | | | | 106 | | | | 107,264 | |
| | | | | | | | | | | | |
|
| Transportation Infrastructure — 0.3% | |
Aeropuertos Dominicanos Siglo XXI SA, 6.75%, 03/30/29(b) | | | | | | | 200 | | | | 193,750 | |
DP World Salaam, (5 year CMT + 5.75%), 6.00%(a)(d)(k) | | | | | | | 200 | | | | 197,500 | |
GMR Hyderabad International Airport Ltd., 4.25%, 10/27/27(d) | | | | | | | 200 | | | | 172,100 | |
| | | | | | | | | | | | |
| Security | | | | | Par (000) | | | Value | |
|
| Transportation Infrastructure (continued) | |
Heathrow Finance PLC, 4.13%, 09/01/29(d)(n) | | | GBP | | | | 100 | | | $ | 90,067 | |
Mexico City Airport Trust, 5.50%, 07/31/47(d) | | | USD | | | | 200 | | | | 154,000 | |
Transurban Finance Co. Pty. Ltd., 4.13%, 02/02/26(b)(g) | | | | | | | 435 | | | | 417,825 | |
| | | | | | | | | | | | |
| | | | | | | | | | | 1,225,242 | |
|
| Utilities — 0.5% | |
American Water Capital Corp., 4.45%, 06/01/32(g) | | | | | | | 900 | | | | 861,037 | |
Consensus Cloud Solutions, Inc.(b) | | | | | | | | | | | | |
6.00%, 10/15/26 | | | | | | | 71 | | | | 66,402 | |
6.50%, 10/15/28 | | | | | | | 64 | | | | 58,865 | |
FEL Energy VI SARL, 5.75%, 12/01/40 | | | | | | | 185 | | | | 157,453 | |
Genneia SA, 8.75%, 09/02/27(b) | | | | | | | 70 | | | | 67,657 | |
Mong Duong Finance Holdings BV, 5.13%, 05/07/29(d) | | | | | | | 250 | | | | 207,469 | |
Pattern Energy Operations LP/Pattern Energy Operations, Inc., 4.50%, 08/15/28(b)(g) | | | | | | | 352 | | | | 315,615 | |
Star Energy Geothermal Wayang Windu Ltd., 6.75%, 04/24/33(d) | | | | | | | 162 | | | | 152,968 | |
Thames Water Kemble Finance PLC, 4.63%, 05/19/26(d) | | | GBP | | | | 168 | | | | 171,228 | |
Vistra Operations Co. LLC(b) | | | | | | | | | | | | |
5.50%, 09/01/26 | | | USD | | | | 19 | | | | 18,305 | |
5.00%, 07/31/27 | | | | | | | 10 | | | | 9,281 | |
4.38%, 05/01/29 | | | | | | | 140 | | | | 120,626 | |
| | | | | | | | | | | | |
| | | | | | | | | | | 2,206,906 | |
|
| Wireless Telecommunication Services — 1.2% | |
Altice France SA/France | | | | | | | | | | | | |
5.88%, 02/01/27(d) | | | EUR | | | | 100 | | | | 93,114 | |
8.13%, 02/01/27(b)(g) | | | USD | | | | 507 | | | | 461,816 | |
5.50%, 01/15/28(b)(g) | | | | | | | 381 | | | | 298,369 | |
5.13%, 01/15/29(b) | | | | | | | 200 | | | | 150,382 | |
5.13%, 07/15/29(b)(g) | | | | | | | 702 | | | | 526,320 | |
Kenbourne Invest SA, 6.88%, 11/26/24(b) | | | | | | | 275 | | | | 259,755 | |
Rogers Communications, Inc., 5.00%, 03/15/44(g) | | | | | | | 545 | | | | 466,905 | |
SBA Communications Corp. | | | | | | | | | | | | |
3.13%, 02/01/29 | | | | | | | 343 | | | | 285,201 | |
3.88%, 02/15/27(g) | | | | | | | 1,106 | | | | 999,286 | |
Sprint LLC, 7.63%, 03/01/26(g) | | | | | | | 506 | | | | 532,467 | |
VICI Properties LP/VICI Note Co., Inc.(b) | | | | | | | | | | | | |
5.63%, 05/01/24 | | | | | | | 54 | | | | 53,474 | |
3.50%, 02/15/25 | | | | | | | 108 | | | | 101,826 | |
4.63%, 06/15/25 | | | | | | | 120 | | | | 115,050 | |
4.50%, 09/01/26 | | | | | | | 8 | | | | 7,528 | |
4.25%, 12/01/26 | | | | | | | 104 | | | | 97,024 | |
4.63%, 12/01/29(g) | | | | | | | 414 | | | | 376,740 | |
4.13%, 08/15/30(g) | | | | | | | 378 | | | | 330,812 | |
Vmed O2 U.K. Financing I PLC | | | | | | | | | | | | |
4.00%, 01/31/29(d) | | | GBP | | | | 100 | | | | 93,939 | |
4.50%, 07/15/31(d) | | | | | | | 100 | | | | 91,892 | |
4.75%, 07/15/31(b)(g) | | | USD | | | | 797 | | | | 647,443 | |
| | | | | | | | | | | | |
| | | | | | | | | | | 5,989,343 | |
| | | | | | | | | | | | |
| |
Total Corporate Bonds — 72.6%
(Cost: $391,402,699) | | | | 350,161,030 | |
| | | | | | | | | | | | |
| | |
| 84 | | 2 0 2 2 BLACK ROCK ANNUAL REPORT TO SHAREHOLDERS |
| | |
Schedule of Investments (continued) December 31, 2022 | | BlackRock Limited Duration Income Trust (BLW) (Percentages shown are based on Net Assets) |
| | | | | | | | | | | | |
| Security | | | | | Par (000) | | | Value | |
|
Floating Rate Loan Interests(a) | |
|
| Aerospace & Defense — 1.4% | |
Atlas CC Acquisition Corp. | | | | | | | | | | | | |
Term Loan B, (3 mo. LIBOR + 4.25%, 0.75% Floor), 8.98%, 05/25/28 | | | USD | | | | 1,241 | | | $ | 1,040,118 | |
Term Loan C, (3 mo. LIBOR + 4.25%, 0.75% Floor), 8.98%, 05/25/28 | | | | | | | 253 | | | | 211,549 | |
Bleriot U.S. Bidco, Inc., 2021 Term Loan B,
(3 mo. LIBOR + 4.00%), 8.73%, 10/31/26 | | | | | | | 283 | | | | 280,175 | |
Cobham Ultra U.S. Co-Borrower LLC, USD Term Loan B, (6 mo. LIBOR + 3.75%, 0.50% Floor), 7.06%, 08/03/29 | | | | | | | 155 | | | | 149,974 | |
Dynasty Acquisition Co., Inc. | | | | | | | | | | | | |
2020 CAD Term Loan B2, (1 mo. LIBOR + 3.50%), 7.92%, 04/06/26 | | | | | | | 597 | | | | 568,178 | |
2020 Term Loan B1, (1 mo. LIBOR + 3.50%), 7.92%, 04/06/26 | | | | | | | 1,111 | | | | 1,056,925 | |
Peraton Corp. | | | | | | | | | | | | |
2nd Lien Term Loan B1, (1 mo. LIBOR + 7.75%, 0.75% Floor), 12.09%, 02/01/29 | | | | | | | 455 | | | | 431,624 | |
Term Loan B, (1 mo. LIBOR + 3.75%, 0.75% Floor), 8.13%, 02/01/28 | | | | | | | 2,253 | | | | 2,196,420 | |
TransDigm, Inc., 2020 Term Loan F, (3 mo. LIBOR + 2.25%), 6.98%, 12/09/25 | | | | | | | 849 | | | | 837,552 | |
| | | | | | | | | | | | |
| | | |
| | | | | | | | | | | 6,772,515 | |
|
| Air Freight & Logistics — 0.2% | |
AIT Worldwide Logistics Holdings, Inc., 2021 Term Loan, (3 mo. LIBOR + 4.75%, 0.75% Floor), 8.49%, 04/06/28 | | | | | | | 274 | | | | 250,287 | |
Kestrel Bidco, Inc., Term Loan B, (1 mo. LIBOR + 3.00%, 1.00% Floor), 7.35%, 12/11/26 | | | | | | | 177 | | | | 160,683 | |
PECF USS Intermediate Holding III Corp., Term Loan B, (1 mo. LIBOR + 4.25%, 0.50% Floor), 8.63%, 12/15/28 | | | | | | | 532 | | | | 442,352 | |
| | | | | | | | | | | | |
| | | |
| | | | | | | | | | | 853,322 | |
|
| Airlines — 1.5% | |
AAdvantage Loyalty IP Ltd., 2021 Term Loan, (3 mo. LIBOR + 4.75%, 0.75% Floor), 8.99%, 04/20/28 | | | | | | | 1,502 | | | | 1,494,181 | |
Air Canada, 2021 Term Loan B, (3 mo. LIBOR + 3.50%, 0.75% Floor), 8.13%, 08/11/28 | | | | | | | 1,172 | | | | 1,156,190 | |
American Airlines, Inc. | | | | | | | | | | | | |
2017 1st Lien Term Loan, (1 mo. LIBOR + 1.75%), 6.14%, 01/29/27 | | | | | | | 353 | | | | 334,300 | |
2018 Term Loan B, (1 mo. LIBOR + 1.75%), 6.14%, 06/27/25 | | | | | | | 653 | | | | 626,218 | |
Mileage Plus Holdings LLC, 2020 Term Loan B, (3 mo. LIBOR + 5.25%, 1.00% Floor), 10.00%, 06/21/27 | | | | | | | 1,927 | | | | 1,979,439 | |
United Airlines, Inc., 2021 Term Loan B,
(3 mo. LIBOR + 3.75%, 0.75% Floor), 8.11%, 04/21/28 | | | | | | | 1,668 | | | | 1,644,195 | |
| | | | | | | | | | | | |
| | | | | | | | | | | 7,234,523 | |
|
| Auto Components — 1.0% | |
Adient U.S. LLC, 2021 Term Loan B, (1 mo. LIBOR + 3.25%), 7.63%, 04/10/28 | | | | | | | 336 | | | | 331,790 | |
Clarios Global LP, 2021 USD Term Loan B,
(1 mo. LIBOR + 3.25%), 7.63%, 04/30/26 | | | | | | | 2,276 | | | | 2,225,417 | |
| | | | | | | | | | | | |
| Security | | | | | Par (000) | | | Value | |
|
| Auto Components (continued) | |
USI, Inc. | | | | | | | | | | | | |
2019 Incremental Term Loan B, (3 mo. LIBOR + 3.25%), 7.98%, 12/02/26 | | | USD | | | | 83 | | | $ | 81,731 | |
2022 Incremental Term Loan, (1 mo. SOFR CME + 3.75%, 0.50% Floor), 8.33%, 11/22/29 | | | | | | | 1,213 | | | | 1,200,248 | |
Wand NewCo 3, Inc., 2020 Term Loan, (1 mo. LIBOR + 3.00%), 7.38%, 02/05/26 | | | | | | | 1,040 | | | | 984,195 | |
| | | | | | | | | | | | |
| | | |
| | | | | | | | | | | 4,823,381 | |
| | | |
| Banks — 0.4% | | | | | | | | | |
DirecTV Financing LLC, Term Loan, (1 mo. LIBOR + 5.00%, 0.75% Floor), 9.38%, 08/02/27 | | | | | | | 1,205 | | | | 1,170,732 | |
LABL, Inc., 2021 USD 1st Lien Term Loan,
(1 mo. LIBOR + 5.00%, 0.50% Floor), 9.38%, 10/29/28 | | | | | | | 608 | | | | 575,358 | |
| | | | | | | | | | | | |
| | | |
| | | | | | | | | | | 1,746,090 | |
| | | |
| Beverages — 0.5% | | | | | | | | | |
Naked Juice LLC | | | | | | | | | | | | |
2nd Lien Term Loan, (3 mo. SOFRTE + 6.00%, 0.50% Floor), 10.68%, 01/24/30 | | | | | | | 861 | | | | 677,278 | |
Term Loan, (3 mo. SOFRTE + 3.25%, 0.50% Floor), 7.93%, 01/24/29 | | | | | | | 2,219 | | | | 1,979,086 | |
| | | | | | | | | | | | |
| | | |
| | | | | | | | | | | 2,656,364 | |
|
| Building Materials — 0.0% | |
Cornerstone Building Brands, Inc., 2021 Term Loan B, (1 mo. LIBOR + 3.25%, 0.50% Floor), 7.57%, 04/12/28 | | | | | | | 76 | | | | 67,953 | |
| | | | | | | | | | | | |
|
| Building Products — 0.8% | |
CP Atlas Buyer, Inc., 2021 Term Loan B, (1 mo. LIBOR + 3.50%, 0.50% Floor), 7.88%, 11/23/27 | | | | | | | 800 | | | | 698,753 | |
CPG International LLC, 2022 Term Loan B,
(1 mo. SOFR CME + 2.50%, 0.50% Floor), 6.92%, 04/28/29 | | | | | | | 359 | | | | 348,327 | |
Jeld-Wen, Inc., 2021 Term Loan B, (1 mo. LIBOR + 2.25%), 6.63%, 07/28/28 | | | | | | | 334 | | | | 311,036 | |
New AMI I LLC, 2022 Term Loan B, (1 mo. SOFRTE + 6.00%, 0.50% Floor), 10.32%, 03/08/29 | | | | | | | 394 | | | | 335,770 | |
Standard Industries, Inc., 2021 Term Loan B,
(3 mo. LIBOR + 2.25%, 0.50% Floor), 6.43%, 09/22/28 | | | | | | | 671 | | | | 661,727 | |
Wilsonart LLC, 2021 Term Loan E, (3 mo. LIBOR + 3.25%, 1.00% Floor), 7.98%, 12/31/26 | | | | | | | 1,466 | | | | 1,392,044 | |
| | | | | | | | | | | | |
| | | | | | | | | | | 3,747,657 | |
|
| Capital Markets — 1.3% | |
Ascensus Holdings, Inc. | | | | | | | | | | | | |
2021 2nd Lien Term Loan, (3 mo. LIBOR + 6.50%, 0.50% Floor), 10.25%, 08/02/29 | | | | | | | 231 | | | | 200,595 | |
Term Loan, (3 mo. LIBOR + 3.50%, 0.50% Floor), 8.25%, 08/02/28 | | | | | | | 1,502 | | | | 1,431,144 | |
Deerfield Dakota Holding LLC | | | | | | | | | | | | |
2020 USD Term Loan B, (1 mo. SOFR CME + 3.75%, 1.00% Floor), 8.07%, 04/09/27 | | | | | | | 2,500 | | | | 2,330,907 | |
2021 USD 2nd Lien Term Loan, (1 mo. LIBOR + 6.75%, 0.75% Floor), 11.13%, 04/07/28 | | | | | | | 792 | | | | 750,096 | |
Eagle Broadband Investments LLC, Term Loan, (3 mo. LIBOR + 3.00%, 0.75% Floor), 7.75%, 11/12/27 | | | | | | | 573 | | | | 548,223 | |
| | |
SCHEDULE OF INVESTMENTS | | 85 |
| | |
Schedule of Investments (continued) December 31, 2022 | | BlackRock Limited Duration Income Trust (BLW) (Percentages shown are based on Net Assets) |
| | | | | | | | | | | | |
| Security | | | | | Par (000) | | | Value | |
| | | |
| Capital Markets (continued) | | | | | | | | | |
Focus Financial Partners LLC, 2021 Term Loan B4, (1 mo. SOFR CME + 2.50%, 0.50% Floor), 6.82%, 06/30/28 | | | USD | | | | 625 | | | $ | 611,868 | |
Greenhill & Co., Inc., Term Loan B, (1 mo. LIBOR + 3.25%), 7.63%, 04/12/24 | | | | | | | 222 | | | | 215,428 | |
| | | | | | | | | | | | |
| | | | | | | | | | | 6,088,261 | |
| | | |
| Chemicals — 1.7% | | | | | | | | | |
Arc Falcon I, Inc., 2021 Term Loan, (1 mo. LIBOR + 3.75%, 0.50% Floor), 8.13%, 09/30/28 | | | | | | | 512 | | | | 448,576 | |
Ascend Performance Materials Operations LLC, 2021 Term Loan B, (6 mo. SOFR CME + 4.75%, 0.75% Floor), 8.83%, 08/27/26 | | | | | | | 1,030 | | | | 965,197 | |
Axalta Coating Systems U.S. Holdings, Inc., 2022 USD Term Loan B, (3 mo. SOFR CME + 3.00%, 0.50% Floor), 7.51%, 12/20/29 | | | | | | | 578 | | | | 578,000 | |
CPC Acquisition Corp., Term Loan, (3 mo. LIBOR + 3.75%, 0.75% Floor), 8.48%, 12/29/27 | | | | | | | 284 | | | | 204,154 | |
Discovery Purchaser Corp., Term Loan,
(3 mo. SOFR CME + 4.375%, 0.50% Floor), 7.97%, 10/04/29 | | | | | | | 571 | | | | 519,182 | |
Element Solutions, Inc., 2019 Term Loan B1, (1 mo. LIBOR + 2.00%), 6.32%, 01/31/26 | | | | | | | 844 | | | | 840,261 | |
Illuminate Buyer LLC, 2021 Term Loan, (1 mo. LIBOR + 3.50%), 7.88%, 06/30/27 | | | | | | | 411 | | | | 393,085 | |
Lonza Group AG, USD Term Loan B, (3 mo. LIBOR + 4.00%, 0.75% Floor), 8.73%, 07/03/28 | | | | | | | 397 | | | | 362,827 | |
Messer Industries GmbH, 2018 USD Term Loan, (3 mo. LIBOR + 2.50%), 7.23%, 03/02/26 | | | | | | | 602 | | | | 595,561 | |
Momentive Performance Materials, Inc., Term Loan B, (1 mo. LIBOR + 3.25%), 7.64%, 05/15/24 | | | | | | | 681 | | | | 677,681 | |
OQ Chemicals Corp., 2017 USD Term Loan B2, (3 mo. LIBOR + 3.25%), 7.00%, 10/14/24 | | | | | | | 726 | | | | 684,344 | |
PQ Corp., 2021 Term Loan B, (3 mo. LIBOR + 2.50%, 0.50% Floor), 6.91%, 06/09/28 | | | | | | | 667 | | | | 655,455 | |
SCIH Salt Holdings, Inc., 2021 Incremental Term Loan B, (3 mo. LIBOR + 4.00%, 0.75% Floor), 8.41%, 03/16/27 | | | | | | | 431 | | | | 417,531 | |
Sparta U.S. HoldCo LLC, 2021 Term Loan,
(1 mo. LIBOR + 3.25%, 0.75% Floor), 7.39%, 08/02/28 | | | | | | | 799 | | | | 775,585 | |
Starfruit Finco BV, 2018 USD Term Loan B,
(3 mo. LIBOR + 2.75%), 7.16%, 10/01/25 | | | | | | | 90 | | | | 88,786 | |
W.R. Grace Holdings LLC, 2021 Term Loan B, (3 mo. LIBOR + 3.75%, 0.50% Floor), 8.50%, 09/22/28 | | | | | | | 220 | | | | 215,248 | |
| | | | | | | | | | | | |
| | | | | | | | | | | 8,421,473 | |
| | | |
| Commercial Services & Supplies — 1.7% | | | | | | | | | |
Allied Universal Holdco LLC, 2021 USD Incremental Term Loan B, (1 mo. LIBOR + 3.75%, 0.50% Floor), 8.17%, 05/12/28 | | | | | | | 1,237 | | | | 1,172,854 | |
Amentum Government Services Holdings LLC, 2022 Term Loan, (1 mo. SOFR CME + 4.00%), 8.64%, 02/15/29 | | | | | | | 326 | | | | 317,284 | |
Aramark Services, Inc. | | | | | | | | | | | | |
2018 Term Loan B3, (1 mo. LIBOR + 1.75%), 6.13%, 03/11/25 | | | | | | | 375 | | | | 371,600 | |
2021 Term Loan B, (1 mo. LIBOR + 2.50%), 6.88%, 04/06/28 | | | | | | | 383 | | | | 377,056 | |
| | | | | | | | | | | | |
| Security | | | | | Par (000) | | | Value | |
|
| Commercial Services & Supplies (continued) | |
Asurion LLC | | | | | | | | | | | | |
2018 Term Loan B7, (1 mo. LIBOR + 3.00%), 7.38%, 11/03/24 | | | USD | | | | 374 | | | $ | 362,796 | |
2020 Term Loan B8, (1 mo. LIBOR + 3.25%), 7.63%, 12/23/26 | | | | | | | 1,088 | | | | 967,658 | |
2021 2nd Lien Term Loan B3, (1 mo. LIBOR + 5.25%), 9.63%, 01/31/28 | | | | | | | 364 | | | | 282,402 | |
2021 Second Lien Term Loan B4, (1 mo. LIBOR + 5.25%), 9.63%, 01/20/29 | | | | | | | 646 | | | | 499,267 | |
Clean Harbors, Inc., 2021 Incremental Term Loan B, (1 mo. LIBOR + 2.00%), 6.38%, 10/08/28 | | | | | | | 422 | | | | 419,163 | |
Covanta Holding Corp. | | | | | | | | | | | | |
2021 Term Loan B, (1 mo. SOFR CME + 2.50%, 0.50% Floor), 6.82%, 11/30/28 | | | | | | | 483 | | | | 479,239 | |
2021 Term Loan C, (1 mo. SOFR CME + 2.50%, 0.50% Floor), 6.82%, 11/30/28 | | | | | | | 37 | | | | 36,169 | |
EnergySolutions LLC, 2018 Term Loan B,
(3 mo. LIBOR + 3.75%, 1.00% Floor), 8.48%, 05/09/25 | | | | | | | 170 | | | | 157,795 | |
GFL Environmental, Inc., 2020 Term Loan,
(3 mo. LIBOR + 3.00%, 0.50% Floor), 7.41%, 05/30/25 | | | | | | | 174 | | | | 173,698 | |
Packers Holdings LLC, 2021 Term Loan,
(3 mo. LIBOR + 3.25%, 0.75% Floor), 7.54%, 03/09/28 | | | | | | | 696 | | | | 605,525 | |
Prime Security Services Borrower LLC, 2021 Term Loan, (3 mo. LIBOR + 2.75%, 0.75% Floor), 6.50%, 09/23/26 | | | | | | | 604 | | | | 598,335 | |
Verscend Holding Corp., 2021 Term Loan B,
(1 mo. LIBOR + 4.00%), 8.38%, 08/27/25 | | | | | | | 1,261 | | | | 1,250,632 | |
Viad Corp., Initial Term Loan, (1 mo. LIBOR + 5.00%, 0.50% Floor), 9.38%, 07/30/28 | | | | | | | 352 | | | | 330,457 | |
| | | | | | | | | | | | |
| | | | | | | | | | | 8,401,930 | |
| | | |
| Communications Equipment — 0.2% | | | | | | | | | |
ViaSat, Inc., Term Loan, (1 mo. SOFR CME + 4.50%, 0.50% Floor), 8.94%, 03/02/29 | | | | | | | 791 | | | | 768,130 | |
| | | | | | | | | | | | |
| | | |
| Construction & Engineering — 0.8% | | | | | | | | | |
Brand Energy & Infrastructure Services, Inc., 2017 Term Loan, (3 mo. LIBOR + 4.25%, 1.00% Floor), 8.49%, 06/21/24 | | | | | | | 1,190 | | | | 1,061,732 | |
Pike Corp., 2021 Incremental Term Loan B,
(1 mo. LIBOR + 3.00%), 7.39%, 01/21/28 | | | | | | | 424 | | | | 417,655 | |
SRS Distribution, Inc., 2021 Term Loan B,
(1 mo. LIBOR + 3.50%, 0.50% Floor), 7.88%, 06/02/28 | | | | | | | 1,819 | | | | 1,736,040 | |
USIC Holdings, Inc., 2021 Term Loan, (1 mo. LIBOR + 3.50%, 0.75% Floor), 7.88%, 05/12/28 | | | | | | | 707 | | | | 673,381 | |
| | | | | | | | | | | | |
| | | | | | | | | | | 3,888,808 | |
| | | |
| Construction Materials — 0.8% | | | | | | | | | |
Core & Main LP, 2021 Term Loan B, (3 mo. LIBOR + 2.50%), 6.88%, 07/27/28 | | | | | | | 1,810 | | | | 1,783,129 | |
Filtration Group Corp., 2018 1st Lien Term Loan, (1 mo. LIBOR + 3.00%), 7.38%, 03/29/25 | | | | | | | 1,110 | | | | 1,096,562 | |
Oscar AcquisitionCo. LLC, Term Loan B, (3 mo. SOFR CME + 4.50%, 0.50% Floor), 9.18%, 04/29/29 | | | | | | | 496 | | | | 468,184 | |
Tamko Building Products LLC, Term Loan B,
(3 mo. LIBOR + 3.00%), 7.57%, 06/01/26 | | | | | | | 353 | | | | 340,867 | |
| | | | | | | | | | | | |
| | | |
| | | | | | | | | | | 3,688,742 | |
| | |
| 86 | | 2 0 2 2 BLACK ROCK ANNUAL REPORT TO SHAREHOLDERS |
| | |
Schedule of Investments (continued) December 31, 2022 | | BlackRock Limited Duration Income Trust (BLW) (Percentages shown are based on Net Assets) |
| | | | | | | | | | | | |
| Security | | | | | Par (000) | | | Value | |
| | | |
| Containers & Packaging — 0.8% | | | | | | | | | |
Charter Next Generation, Inc., 2021 Term Loan, (1 mo. LIBOR + 3.75%, 0.75% Floor), 8.13%, 12/01/27 | | | USD | | | | 1,632 | | | $ | 1,582,419 | |
Mauser Packaging Solutions Holding Co., 2017 Term Loan B, (1 mo. LIBOR + 3.25%), 7.37%, 04/03/24 | | | | | | | 1,043 | | | | 1,017,075 | |
Pregis TopCo Corp., 1st Lien Term Loan,
(1 mo. SOFR CME + 3.75%), 8.19%, 07/31/26 | | | | | | | 135 | | | | 131,380 | |
Tosca Services LLC, 2021 Term Loan, (1 mo. LIBOR + 3.50%, 0.75% Floor), 7.94%, 08/18/27 | | | | | | | 577 | | | | 461,538 | |
Trident TPI Holdings, Inc. | | | | | | | | | | | | |
2021 Delayed Draw Term Loan, (1 mo. LIBOR + 4.00%, 0.50% Floor), 8.60%, 09/15/28 | | | | | | | 64 | | | | 61,705 | |
2021 Incremental Term Loan, (3 mo. LIBOR + 4.00%, 0.50% Floor), 8.73%, 09/15/28 | | | | | | | 452 | | | | 433,128 | |
| | | | | | | | | | | | |
| | | | | | | | | | | 3,687,245 | |
| | | |
| Distributors — 0.4% | | | | | | | | | |
American Builders & Contractors Supply Co., Inc., 2019 Term Loan, (1 mo. LIBOR + 2.00%), 6.38%, 01/15/27 | | | | | | | 504 | | | | 498,979 | |
Dealer Tire Financial LLC, Term Loan B2,
(1 mo. SOFR CME + 4.50%, 0.50% Floor), 8.82%, 12/14/27 | | | | | | | 829 | | | | 817,514 | |
TMK Hawk Parent Corp. | | | | | | | | | | | | |
2020 Super Priority First Out Term Loan A, (3 mo. LIBOR + 9.50%, 1.00% Floor), 14.26%, 05/30/24(c) | | | | | | | 162 | | | | 147,716 | |
2020 Super Priority Second Out Term Loan B, (3 mo. LIBOR + 3.50%, 1.00% Floor), 8.26%, 08/28/24 | | | | | | | 1,304 | | | | 664,906 | |
| | | | | | | | | | | | |
| | | | | | | | | | | 2,129,115 | |
| | | |
| Diversified Consumer Services — 0.9% | | | | | | | | | |
Ascend Learning LLC | | | | | | | | | | | | |
2021 2nd Lien Term Loan, (1 mo. LIBOR + 5.75%, 0.50% Floor), 10.13%, 12/10/29 | | | | | | | 299 | | | | 255,271 | |
2021 Term Loan, (1 mo. LIBOR + 3.50%, 0.50% Floor), 7.88%, 12/11/28 | | | | | | | 599 | | | | 565,037 | |
Bright Horizons Family Solutions LLC, 2021 Term Loan B, (1 mo. LIBOR + 2.25%, 0.50% Floor), 6.69%, 11/24/28 | | | | | | | 755 | | | | 740,028 | |
Genuine Financial Holdings LLC, 2018 1st Lien Term Loan, (1 mo. LIBOR + 3.75%), 8.33%, 07/11/25 | | | | | | | 384 | | | | 369,172 | |
OLA Netherlands BV, Term Loan, (1 mo. SOFR CME + 6.25%, 0.75% Floor), 10.67%, 12/15/26 | | | | | | | 349 | | | | 328,243 | |
PAI Holdco, Inc., 2020 Term Loan B, (3 mo. LIBOR + 3.75%, 0.75% Floor), 8.16%, 10/28/27 | | | | | | | 580 | | | | 508,501 | |
Serta Simmons Bedding LLC | | | | | | | | | | | | |
2020 Super Priority First Out Term Loan,
(3 mo. LIBOR + 7.50%), 12.27%, 08/10/23 | | | | | | | 186 | | | | 182,523 | |
2020 Super Priority Second Out Term Loan, (3 mo. LIBOR + 7.50%, 1.00% Floor), 12.27%, 08/10/23 | | | | | | | 249 | | | | 113,507 | |
| | | | | | | | | | | | |
| Security | | | | | Par (000) | | | Value | |
| | | |
| Diversified Consumer Services (continued) | | | | | | | | | |
Sotheby’s, 2021 Term Loan B, (3 mo. LIBOR + 4.50%, 0.50% Floor), 8.58%, 01/15/27 | | | USD | | | | 1,207 | | | $ | 1,174,711 | |
Voyage Australia Pty. Ltd., USD Term Loan B, (3 mo. LIBOR + 3.50%, 0.50% Floor), 7.74%, 07/20/28(c) | | | | | | | 135 | | | | 127,552 | |
| | | | | | | | | | | | |
| | | | | | | | | | | 4,364,545 | |
| | | |
| Diversified Financial Services — 2.8% | | | | | | | | | |
Acuris Finance U.S., Inc., 2021 USD Term Loan B, (3 mo. SOFR CME + 4.00%, 0.50% Floor), 8.73%, 02/16/28 | | | | | | | 207 | | | | 202,649 | |
Advisor Group, Inc., 2021 Term Loan, (1 mo. LIBOR + 4.50%), 8.88%, 07/31/26 | | | | | | | 915 | | | | 893,169 | |
AlixPartners LLP, 2021 USD Term Loan B,
(1 mo. LIBOR + 2.75%, 0.50% Floor), 7.13%, 02/04/28 | | | | | | | 768 | | | | 760,602 | |
Castlelake Aviation Ltd., Term Loan B, (3 mo. LIBOR + 2.75%, 0.50% Floor), 7.52%, 10/22/26 | | | | | | | 757 | | | | 749,679 | |
Cogeco Financing 2 LP, 2021 Incremental Term Loan B, (1 mo. LIBOR + 2.50%, 0.50% Floor), 6.88%, 09/01/28 | | | | | | | 672 | | | | 651,309 | |
Credito Real SAB de CV Sofom ENR, Term Loan B, (3 mo. LIBOR + 3.75%), 6.73%, 02/17/23(c) | | | | | | | 24 | | | | 465 | |
Delta TopCo, Inc. | | | | | | | | | | | | |
2020 2nd Lien Term Loan, (3 mo. LIBOR + 7.25%, 0.75% Floor), 11.65%, 12/01/28 | | | | | | | 186 | | | | 144,847 | |
2020 Term Loan B, (3 mo. LIBOR + 3.75%, 0.75% Floor), 8.15%, 12/01/27 | | | | | | | 549 | | | | 505,821 | |
EG America LLC, 2018 USD Term Loan, (3 mo. LIBOR + 4.00%), 8.73%, 02/07/25 | | | | | | | 509 | | | | 479,887 | |
Gainwell Acquisition Corp., Term Loan B,
(3 mo. LIBOR + 4.00%, 0.75% Floor), 8.73%, 10/01/27 | | | | | | | 1,489 | | | | 1,393,812 | |
Kingpin Intermediate Holdings LLC, 2018 Term Loan B, (1 mo. LIBOR + 3.50%, 1.00% Floor), 7.89%, 07/03/24(c) | | | | | | | 675 | | | | 673,568 | |
KKR Apple Bidco LLC | | | | | | | | | | | | |
2021 2nd Lien Term Loan, (1 mo. LIBOR + 5.75%, 0.50% Floor), 10.13%, 09/21/29 | | | | | | | 100 | | | | 96,143 | |
2021 Term Loan, (1 mo. LIBOR + 2.75%, 0.50% Floor), 7.13%, 09/23/28 | | | | | | | 244 | | | | 239,848 | |
LBM Acquisition LLC, Term Loan B, (6 mo. LIBOR + 3.75%, 0.75% Floor), 7.12%, 12/17/27 | | | | | | | 392 | | | | 338,807 | |
Radiate Holdco LLC, 2021 Term Loan B, (1 mo. LIBOR + 3.25%, 0.75% Floor), 7.63%, 09/25/26 | | | | | | | 867 | | | | 700,869 | |
RVR Dealership Holdings LLC, Term Loan B,
(1 mo. SOFRTE + 3.75%, 0.75% Floor), 8.17%, 02/08/28 | | | | | | | 295 | | | | 271,288 | |
Setanta Aircraft Leasing Designated Activity Co., Term Loan B, (3 mo. LIBOR + 2.00%), 6.73%, 11/05/28 | | | | | | | 591 | | | | 587,158 | |
SMG U.S. Midco 2, Inc., 2020 Term Loan,
(3 mo. LIBOR + 2.50%), 6.91%, 01/23/25 | | | | | | | 526 | | | | 511,208 | |
SSH Group Holdings, Inc., 2018 1st Lien Term Loan, (3 mo. LIBOR + 4.00%), 8.73%, 07/30/25 | | | | | | | 308 | | | | 300,065 | |
Veritas U.S., Inc., 2021 USD Term Loan B,
(3 mo. LIBOR + 5.00%, 1.00% Floor), 9.73%, 09/01/25 | | | | | | | 1,868 | | | | 1,309,623 | |
VS Buyer LLC, Term Loan B, (1 mo. LIBOR + 3.00%), 7.38%, 02/28/27 | | | | | | | 1,526 | | | | 1,478,115 | |
| | |
SCHEDULE OF INVESTMENTS | | 87 |
| | |
Schedule of Investments (continued) December 31, 2022 | | BlackRock Limited Duration Income Trust (BLW) (Percentages shown are based on Net Assets) |
| | | | | | | | | | | | |
| Security | | | | | Par (000) | | | Value | |
|
| Diversified Financial Services (continued) | |
White Cap Buyer LLC, Term Loan B, (1 mo. SOFR CME + 3.75%), 8.07%, 10/19/27 | | | USD | | | | 779 | | | $ | 752,513 | |
Ziggo Financing Partnership, USD Term Loan I, (1 mo. LIBOR + 2.50%), 6.82%, 04/30/28 | | | | | | | 510 | | | | 496,454 | |
| | | | | | | | | | | | |
| | | | | | | | | | | 13,537,899 | |
|
| Diversified Telecommunication Services — 0.5% | |
Cablevision Lightpath LLC, Term Loan B,
(1 mo. LIBOR + 3.25%, 0.50% Floor), 7.57%, 11/30/27 | | | | | | | 152 | | | | 144,856 | |
Consolidated Communications, Inc., 2021 Term Loan B, (1 mo. LIBOR + 3.50%, 0.75% Floor), 7.88%, 10/02/27 | | | | | | | 349 | | | | 307,177 | |
Frontier Communications Holdings LLC, 2021 1st Lien Term Loan, (3 mo. LIBOR + 3.75%, 0.75% Floor), 8.50%, 05/01/28 | | | | | | | 746 | | | | 709,970 | |
Iridium Satellite LLC, 2021 Term Loan B2,
(1 mo. LIBOR + 2.50%, 0.75% Floor), 6.92%, 11/04/26 | | | | | | | 680 | | | | 672,951 | |
Level 3 Financing, Inc., 2019 Term Loan B, (1 mo. LIBOR + 1.75%), 6.13%, 03/01/27 | | | | | | | 439 | | | | 419,597 | |
| | | | | | | | | | | | |
| | | | | | | | | | | 2,254,551 | |
| | | |
| Electric Utilities — 0.5% | | | | | | | | | |
ExGen Renewables IV LLC, 2020 Term Loan, (3 mo. LIBOR + 2.50%, 1.00% Floor), 7.24%, 12/15/27 | | | | | | | 670 | | | | 663,057 | |
Triton Water Holdings, Inc., Term Loan,
(3 mo. LIBOR + 3.50%, 0.50% Floor), 8.23%, 03/31/28 | | | | | | | 1,666 | | | | 1,543,537 | |
| | | | | | | | | | | | |
| | | | | | | | | | | 2,206,594 | |
| | | |
| Electrical Equipment — 0.4% | | | | | | | | | |
Arcline FM Holdings LLC, 2021 1st Lien Term Loan, (6 mo. LIBOR + 4.75%, 0.75% Floor), 9.48%, 06/23/28 | | | | | | | 628 | | | | 595,599 | |
AZZ, Inc., Term Loan B, (1 mo. SOFR CME + 4.25%, 0.50% Floor), 8.67%, 05/13/29 | | | | | | | 110 | | | | 109,573 | |
Gates Global LLC, 2021 Term Loan B3,
(1 mo. LIBOR + 2.50%, 0.75% Floor), 6.88%, 03/31/27 | | | | | | | 1,207 | | | | 1,180,122 | |
| | | | | | | | | | | | |
| | | | | | | | | | | 1,885,294 | |
|
| Electronic Equipment, Instruments & Components — 0.2% | |
Coherent Corp., 2022 Term Loan B, (3 mo. LIBOR + 2.75%, 0.50% Floor), 7.13%, 07/02/29 | | | | | | | 649 | | | | 640,255 | |
GrafTech Finance, Inc., 2018 Term Loan B, (1 mo. LIBOR + 3.00%, 0.50% Floor), 7.38%, 02/12/25 | | | | | | | 134 | | | | 132,552 | |
| | | | | | | | | | | | |
| | | | | | | | | | | 772,807 | |
| | | |
| Entertainment — 0.1% | | | | | | | | | |
Delta 2 Lux SARL, Term Loan B, (3 mo. SOFR CME + 3.25%, 0.50% Floor), 7.57%, 01/15/30 | | | | | | | 609 | | | | 608,239 | |
| | | | | | | | | | | | |
|
| Environmental, Maintenance & Security Service — 0.3% | |
Asplundh Tree Expert LLC, 2021 Term Loan B, (1 mo. LIBOR + 1.75%), 6.13%, 09/07/27 | | | | | | | 1,050 | | | | 1,047,896 | |
TruGreen LP, 2020 Term Loan, (1 mo. LIBOR + 4.00%, 0.75% Floor), 8.38%, 11/02/27 | | | | | | | 613 | | | | 543,257 | |
| | | | | | | | | | | | |
| | | | | | | | | | | 1,591,153 | |
|
| Equity Real Estate Investment Trusts (REITs) — 0.1% | |
RHP Hotel Properties LP, 2017 Term Loan B, (1 mo. LIBOR + 2.00%), 6.39%, 05/11/24 | | | | | | | 724 | | | | 719,555 | |
| | | | | | | | | | | | |
| | | | | | | | | | | | |
| Security | | | | | Par (000) | | | Value | |
| | | |
| Food & Staples Retailing — 0.3% | | | | | | | | | |
Nomad Foods U.S. LLC, 2022 Term Loan B,
(3 mo. SOFR CME + 3.75%, 0.50% Floor), 8.23%, 11/12/29 | | | USD | | | | 426 | | | $ | 424,313 | |
U.S. Foods, Inc. | | | | | | | | | | | | |
2019 Term Loan B, (1 mo. LIBOR + 2.00%), 6.38%, 09/13/26 | | | | | | | 653 | | | | 645,568 | |
2021 Term Loan B, (1 mo. LIBOR + 2.75%), 7.13%, 11/22/28 | | | | | | | 413 | | | | 410,197 | |
| | | | | | | | | | | | |
| | | | | | | | | | | 1,480,078 | |
| | | |
| Food Products — 1.5% | | | | | | | | | |
8th Avenue Food & Provisions, Inc., 2018 1st Lien Term Loan, (1 mo. LIBOR + 3.75%), 8.13%, 10/01/25 | | | | | | | 651 | | | | 539,385 | |
B&G Foods, Inc., 2019 Term Loan B4, (1 mo. LIBOR + 2.50%), 6.88%, 10/10/26 | | | | | | | 163 | | | | 153,407 | |
Chobani LLC, 2020 Term Loan B, (1 mo. LIBOR + 3.50%, 1.00% Floor), 7.88%, 10/25/27 | | | | | | | 1,894 | | | | 1,852,938 | |
Froneri International Ltd., 2020 USD Term Loan, (1 mo. LIBOR + 2.25%), 6.63%, 01/29/27 | | | | | | | 1,992 | | | | 1,936,551 | |
Hostess Brands LLC, 2019 Term Loan, (3 mo. LIBOR + 2.25%, 0.75% Floor), 6.66%, 08/03/25 | | | | | | | 818 | | | | 814,356 | |
Reynolds Group Holdings, Inc., 2020 Term Loan B2, (1 mo. LIBOR + 3.25%), 7.63%, 02/05/26 | | | | | | | 253 | | | | 249,170 | |
Sovos Brands Intermediate, Inc., 2021 Term Loan, (3 mo. LIBOR + 3.50%, 0.75% Floor), 7.91%, 06/08/28 | | | | | | | 667 | | | | 647,709 | |
UTZ Quality Foods LLC, 2021 Term Loan B,
(1 mo. SOFR CME + 3.00%), 7.44%, 01/20/28 | | | | | | | 1,048 | | | | 1,036,944 | |
| | | | | | | | | | | | |
| | | | | | | | | | | 7,230,460 | |
| | | |
| Gas Utilities — 0.4% | | | | | | | | | |
Freeport LNG Investments LLLP, Term Loan B, (3 mo. LIBOR + 3.50%, 0.50% Floor), 7.74%, 12/21/28 | | | | | | | 1,786 | | | | 1,694,110 | |
| | | | | | | | | | | | |
| | | |
| Health Care Equipment & Supplies — 0.8% | | | | | | | | | |
Electron BidCo, Inc., 2021 Term Loan, (1 mo. LIBOR + 3.00%, 0.50% Floor), 7.38%, 11/01/28 | | | | | | | 1,001 | | | | 973,729 | |
Insulet Corp., Term Loan B, (3 mo. SOFR CME + 3.25%), 7.69%, 05/04/28 | | | | | | | 284 | | | | 279,249 | |
Medline Borrower LP, USD Term Loan B,
(1 mo. LIBOR + 3.25%, 0.50% Floor), 7.63%, 10/23/28 | | | | | | | 2,617 | | | | 2,483,045 | |
Venga Finance SARL, 2021 USD Term Loan B, (3 mo. LIBOR + 4.75%, 0.75% Floor), 9.48%, 12/04/28 | | | | | | | 262 | | | | 239,439 | |
| | | | | | | | | | | | |
| | | | | | | | | | | 3,975,462 | |
| | | |
| Health Care Providers & Services — 1.0% | | | | | | | | | |
CHG Healthcare Services, Inc., 2021 Term Loan, (1 mo. LIBOR + 3.25%, 0.50% Floor), 7.63%, 09/29/28 | | | | | | | 464 | | | | 453,297 | |
Envision Healthcare Corp. | | | | | | | | | | | | |
2022 First Out Term Loan, (3 mo. SOFR CME + 7.88%, 1.00% Floor), 12.61%, 03/31/27 | | | | | | | 92 | | | | 81,243 | |
2022 Second Out Term Loan, (3 mo. SOFR CME + 4.25%, 1.00% Floor), 8.83%, 03/31/27 | | | | | | | 611 | | | | 207,554 | |
EyeCare Partners LLC | | | | | | | | | | | | |
2020 Term Loan, (3 mo. LIBOR + 3.75%), 8.48%, 02/18/27 | | | | | | | 855 | | | | 680,843 | |
| | |
| 88 | | 2 0 2 2 BLACK ROCK ANNUAL REPORT TO SHAREHOLDERS |
| | |
Schedule of Investments (continued) December 31, 2022 | | BlackRock Limited Duration Income Trust (BLW) (Percentages shown are based on Net Assets) |
| | | | | | | | | | | | |
| Security | | | | | Par (000) | | | Value | |
|
| Health Care Providers & Services (continued) | |
EyeCare Partners LLC (continued) | | | | | | | | | | | | |
2021 2nd Lien Term Loan, (3 mo. LIBOR + 6.75%, 0.50% Floor), 11.48%, 11/15/29 | | | USD | | | | 176 | | | $ | 143,106 | |
2021 Incremental Term Loan, (3 mo. LIBOR + 3.75%, 0.50% Floor), 8.48%, 11/15/28 | | | | | | | 195 | | | | 163,235 | |
Femur Buyer, Inc., 1st Lien Term Loan, (3 mo. LIBOR + 4.50%), 9.23%, 03/05/26 | | | | | | | 439 | | | | 375,078 | |
Orbcomm, Inc., Term Loan B, (3 mo. LIBOR + 4.25%, 0.75% Floor), 8.81%, 09/01/28 | | | | | | | 386 | | | | 328,660 | |
PetVet Care Centers LLC, 2021 Term Loan B3, (1 mo. LIBOR + 3.50%, 0.75% Floor), 7.88%, 02/14/25 | | | | | | | 21 | | | | 19,280 | |
Sotera Health Holdings LLC, 2021 Term Loan, (3 mo. LIBOR + 2.75%, 0.50% Floor), 7.16%, 12/11/26 | | | | | | | 775 | | | | 713,210 | |
Surgery Center Holdings, Inc., 2021 Term Loan, (3 mo. LIBOR + 3.75%, 0.75% Floor), 8.05%, 08/31/26 | | | | | | | 279 | | | | 275,577 | |
Vizient, Inc., 2022 Term Loan B, (1 mo. SOFR CME + 2.25%, 0.50% Floor), 6.67%, 04/28/29 | | | | | | | 126 | | | | 126,081 | |
WCG Purchaser Corp., 2019 Term Loan, (1 mo. LIBOR + 4.00%, 1.00% Floor), 8.38%, 01/08/27 | | | | | | | 672 | | | | 608,536 | |
WP CityMD Bidco LLC, 2021 1st Lien Term Loan B, (1 mo. LIBOR + 3.25%, 0.50% Floor), 7.63%, 12/22/28 | | | | | | | 754 | | | | 752,205 | |
| | | | | | | | | | | | |
| | | |
| | | | | | | | | | | 4,927,905 | |
| | | |
| Health Care Services — 0.3% | | | | | | | | | |
Azalea Topco, Inc., Term Loan, (1 mo. LIBOR + 3.50%), 7.88%, 07/24/26 | | | | | | | 1,077 | | | | 983,779 | |
Medical Solutions Holdings, Inc., 2021 2nd Lien Term Loan, (1 mo. LIBOR + 7.00%, 0.50% Floor), 11.38%, 11/01/29 | | | | | | | 247 | | | | 227,240 | |
| | | | | | | | | | | | |
| | | |
| | | | | | | | | | | 1,211,019 | |
| | | |
| Health Care Technology — 0.6% | | | | | | | | | |
AthenaHealth Group, Inc. | | | | | | | | | | | | |
2022 Delayed Draw Term loan, (3 mo. SOFR CME + 3.50%), 7.82%, 02/15/29 | | | | | | | 196 | | | | 58,892 | |
2022 Term Loan B, (1 mo. SOFR CME + 3.50%, 0.50% Floor), 7.82%, 02/15/29 | | | | | | | 1,601 | | | | 1,382,955 | |
GoodRx, Inc., 1st Lien Term Loan, (1 mo. LIBOR + 2.75%), 7.13%, 10/10/25 | | | | | | | 309 | | | | 300,053 | |
Polaris Newco LLC, USD Term Loan B, (3 mo. LIBOR + 4.00%, 0.50% Floor), 8.73%, 06/02/28 | | | | | | | 887 | | | | 807,031 | |
Press Ganey Holdings, Inc., 2021 Term Loan B, (1 mo. LIBOR + 3.75%, 0.75% Floor), 8.13%, 07/24/26 | | | | | | | 269 | | | | 246,738 | |
| | | | | | | | | | | | |
| | | |
| | | | | | | | | | | 2,795,669 | |
| | | |
| Hotels, Restaurants & Leisure — 3.7% | | | | | | | | | |
Aimbridge Acquisition Co., Inc., 2019 Term Loan B, (1 mo. LIBOR + 3.75%), 8.13%, 02/02/26 | | | | | | | 135 | | | | 122,338 | |
Aristocrat Technologies, Inc., 2022 Term Loan B, (3 mo. SOFR CME + 2.25%, 0.50% Floor), 6.93%, 05/24/29 | | | | | | | 46 | | | | 45,400 | |
Bally’s Corp., 2021 Term Loan B, (3 mo. LIBOR + 3.25%, 0.50% Floor), 7.54%, 10/02/28 | | | | | | | 299 | | | | 275,701 | |
Burger King (Restaurant Brands Int), Term Loan B4, (3 mo. LIBOR + 1.75%), 6.14%, 11/19/26 | | | | | | | 1,376 | | | | 1,349,706 | |
| | | | | | | | | | | | |
| Security | | | | | Par (000) | | | Value | |
|
| Hotels, Restaurants & Leisure (continued) | |
Caesars Resort Collection LLC | | | | | | | | | | | | |
2017 1st Lien Term Loan B, (1 mo. LIBOR + 2.75%), 7.13%, 12/23/24 | | | USD | | | | 895 | | | $ | 892,409 | |
2020 Term Loan B1, (1 mo. LIBOR + 3.50%), 7.88%, 07/21/25 | | | | | | | 202 | | | | 201,709 | |
Carnival Corp., USD Term Loan B, (1 mo. LIBOR + 3.00%, 0.75% Floor), 7.38%, 06/30/25 | | | | | | | 929 | | | | 888,241 | |
Churchill Downs, Inc., 2021 Incremental Term Loan B1, (1 mo. LIBOR + 2.00%), 6.39%, 03/17/28 | | | | | | | 485 | | | | 479,329 | |
Equinox Holdings, Inc., 2017 1st Lien Term Loan, (3 mo. LIBOR + 3.00%, 1.00% Floor), 7.73%, 03/08/24 | | | | | | | 1,982 | | | | 1,483,924 | |
Fertitta Entertainment LLC, 2022 Term Loan B, (1 mo. SOFRTE + 4.00%, 0.50% Floor), 8.32%, 01/27/29 | | | | | | | 1,984 | | | | 1,882,776 | |
Flutter Financing B.V., 2022 USD Term Loan B, (3 mo. SOFR CME + 3.25%, 0.50% Floor), 8.09%, 07/22/28 | | | | | | | 622 | | | | 618,898 | |
Four Seasons Hotels Ltd., 2022 Term Loan B, (1 mo. SOFR CME + 3.25%, 0.50% Floor), 7.67%, 11/30/29 | | | | | | | 1,364 | | | | 1,362,992 | |
Hilton Worldwide Finance LLC, 2019 Term Loan B2, (1 mo. LIBOR + 1.75%), 6.17%, 06/22/26 | | | | | | | 1,057 | | | | 1,053,155 | |
IRB Holding Corp. | | | | | | | | | | | | |
2020 Term Loan B, (1 mo. LIBOR + 2.75%, 1.00% Floor), 7.13%, 02/05/25 | | | | | | | 1,203 | | | | 1,190,532 | |
2022 Term Loan B, (1 mo. SOFRTE + 3.00%, 0.75% Floor), 7.32%, 12/15/27 | | | | | | | 925 | | | | 896,556 | |
Penn National Gaming, Inc., 2022 Term Loan B, (1 mo. SOFR CME + 2.75%, 0.50% Floor), 7.17%, 05/03/29 | | | | | | | 615 | | | | 608,156 | |
Playa Resorts Holding B.V., 2022 Term Loan B, (3 mo. SOFR CME + 4.25%, 0.50% Floor), 8.58%, 01/05/29 | | | | | | | 226 | | | | 219,927 | |
Playtika Holding Corp., 2021 Term Loan, (1 mo. LIBOR + 2.75%), 7.13%, 03/13/28 | | | | | | | 721 | | | | 686,787 | |
Scientific Games International, Inc., 2022 USD Term Loan, (1 mo. SOFR CME + 3.00%, 0.50% Floor), 7.42%, 04/14/29 | | | | | | | 349 | | | | 343,633 | |
Stars Group Holdings BV, 2018 USD Incremental Term Loan, (3 mo. LIBOR + 2.25%), 6.98%, 07/21/26 | | | | | | | 560 | | | | 551,288 | |
Station Casinos LLC, 2020 Term Loan B, (1 mo. LIBOR + 2.25%, 0.25% Floor), 6.64%, 02/08/27 | | | | | | | 1,028 | | | | 1,001,752 | |
Travelport Finance Luxembourg SARL, | | | | | | | | | | | | |
2021 Consented Term Loan, (3 mo. LIBOR + 6.75%), 11.48%, 05/29/26 | | | | | | | 489 | | | | 338,324 | |
Whatabrands LLC, 2021 Term Loan B, (1 mo. LIBOR + 3.25%, 0.50% Floor), 7.63%, 08/03/28 | | | | | | | 1,247 | | | | 1,203,604 | |
Wyndham Hotels & Resorts, Inc., Term Loan B, (1 mo. LIBOR + 1.75%), 6.13%, 05/30/25 | | | | | | | 199 | | | | 198,813 | |
| | | | | | | | | | | | |
| | | | | | | | | | | 17,895,950 | |
| | | |
| Household Durables — 0.7% | | | | | | | | | |
ACProducts Holdings, Inc., 2021 Term Loan B, (3 mo. LIBOR + 4.25%, 0.50% Floor), 8.98%, 05/17/28 | | | | | | | 693 | | | | 515,650 | |
Hunter Douglas, Inc., USD Term Loan B1, (3 mo. SOFR CME + 3.50%), 7.86%, 02/26/29 | | | | | | | 1,235 | | | | 1,082,058 | |
| | |
SCHEDULE OF INVESTMENTS | | 89 |
| | |
Schedule of Investments (continued) December 31, 2022 | | BlackRock Limited Duration Income Trust (BLW) (Percentages shown are based on Net Assets) |
| | | | | | | | | | | | |
| Security | | | | | Par
(000) | | | Value | |
| | | |
| Household Durables (continued) | | | | | | | | | |
Reynolds Consumer Products LLC, Term Loan, (1 mo. LIBOR + 1.75%), 6.13%, 02/04/27 | | | USD | | | | 138 | | | $ | 136,465 | |
Snap One Holdings Corp., Term Loan B, (1 mo. LIBOR + 4.50%, 0.50% Floor), 8.88%, 12/08/28(c) | | | | | | | 321 | | | | 292,807 | |
Sunset Debt Merger Sub, Inc., 2021 Term Loan B, (3 mo. LIBOR + 4.00%, 0.75% Floor), 8.75%, 10/06/28 | | | | | | | 451 | | | | 367,395 | |
Weber-Stephen Products LLC, Term Loan B, (1 mo. LIBOR + 3.25%, 0.75% Floor), 7.63%, 10/30/27 | | | | | | | 1,183 | | | | 993,933 | |
| | | | | | | | | | | | |
| | | |
| | | | | | | | | | | 3,388,308 | |
|
| Household Products — 0.1% | |
Spectrum Brands, Inc., 2021 Term Loan, (1 mo. LIBOR + 2.00%, 0.50% Floor), 6.60%, 03/03/28 | | | | | | | 456 | | | | 446,799 | |
| | | | | | | | | | | | |
|
| Independent Power and Renewable Electricity Producers — 0.2% | |
Calpine Construction Finance Co. LP, 2017 Term Loan B, (1 mo. LIBOR + 2.00%), 6.38%, 01/15/25 | | | | | | | 874 | | | | 871,249 | |
Calpine Corp., 2019 Term Loan B10, (1 mo. LIBOR + 2.00%), 6.38%, 08/12/26 | | | | | | | 284 | | | | 280,223 | |
| | | | | | | | | | | | |
| | | |
| | | | | | | | | | | 1,151,472 | |
| | | |
| Industrial Conglomerates — 0.9% | | | | | | | | | |
AVSC Holding Corp. | | | | | | | | | | | | |
2020 Term Loan B1, (3 mo. LIBOR + 3.25%, 1.00% Floor), 7.68%, 03/03/25 | | | | | | | 654 | | | | 598,152 | |
2020 Term Loan B3, (3 mo. LIBOR + 15.00%), 15.00%, 10/15/26 | | | | | | | 354 | | | | 372,251 | |
Diamond BC BV, 2021 Term Loan B, (3 mo. LIBOR + 2.75%, 0.50% Floor), 7.16%, 09/29/28 | | | | | | | 1,368 | | | | 1,320,419 | |
Stitch Aquisition Corp., Term Loan B, (3 mo. LIBOR + 6.75%, 0.75% Floor), 11.48%, 07/28/28 | | | | | | | 261 | | | | 220,727 | |
Vertical U.S. Newco, Inc., Term Loan B, (6 mo. LIBOR + 3.50%, 0.50% Floor), 6.87%, 07/30/27 | | | | | | | 728 | | | | 698,401 | |
Vertiv Group Corp., 2021 Term Loan B, (1 mo. LIBOR + 2.75%), 6.89%, 03/02/27 | | | | | | | 1,232 | | | | 1,186,710 | |
| | | | | | | | | | | | |
| | | |
| | | | | | | | | | | 4,396,660 | |
| | | |
| Insurance — 1.7% | | | | | | | | | |
Alliant Holdings Intermediate LLC | | | | | | | | | | | | |
2018 Term Loan B, (1 mo. LIBOR + 3.25%), 7.63%, 05/09/25 | | | | | | | 830 | | | | 817,874 | |
2021 Term Loan B4, (1 mo. LIBOR + 3.50%, 0.50% Floor), 7.85%, 11/06/27 | | | | | | | 2,124 | | | | 2,073,283 | |
AmWINS Group, Inc., 2021 Term Loan B, (1 mo. LIBOR + 2.25%, 0.75% Floor), 6.63%, 02/19/28 | | | | | | | 1,005 | | | | 985,465 | |
AssuredPartners, Inc. | | | | | | | | | | | | |
2020 Term Loan B, (1 mo. LIBOR + 3.50%), 7.88%, 02/12/27 | | | | | | | 534 | | | | 517,331 | |
2021 Term Loan B, (1 mo. LIBOR + 3.50%, 0.50% Floor), 7.88%, 02/12/27 | | | | | | | 283 | | | | 273,259 | |
Hub International Ltd. | | | | | | | | | | | | |
2018 Term Loan B, (3 mo. LIBOR + 3.00%), 7.33%, 04/25/25 | | | | | | | 347 | | | | 342,662 | |
2021 Term Loan B, (3 mo. LIBOR + 3.25%, 0.75% Floor), 7.53%, 04/25/25 | | | | | | | 1,421 | | | | 1,406,973 | |
2022 Term Loan B, (3 mo. SOFR CME + 4.00%, 0.75% Floor), 8.22%, 11/10/29 | | | | | | | 361 | | | | 356,690 | |
NFP Corp., 2020 Term Loan, (1 mo. LIBOR + 3.25%), 7.63%, 02/15/27 | | | | | | | 112 | | | | 107,468 | |
| | | | | | | | | | | | |
| Security | | | | | Par (000) | | | Value | |
| | | |
| Insurance (continued) | | | | | | | | | |
Ryan Specialty Group LLC, Term Loan, (1 mo. SOFR CME + 3.00%, 0.75% Floor), 7.42%, 09/01/27 | | | USD | | | | 650 | | | $ | 644,596 | |
Sedgwick Claims Management Services, Inc. | | | | | | | | | | | | |
2019 Term Loan B, (1 mo. LIBOR + 3.75%), 8.13%, 09/03/26 | | | | | | | 519 | | | | 508,783 | |
2020 Term Loan B3, (1 mo. LIBOR + 4.25%, 1.00% Floor), 8.63%, 09/03/26 | | | | | | | 182 | | | | 179,806 | |
| | | | | | | | | | | | |
| | | | | | | | | | | 8,214,190 | |
|
| Interactive Media & Services — 0.8% | |
Adevinta ASA, USD Term Loan B, (3 mo. LIBOR + 2.75%, 0.75% Floor), 7.48%, 06/26/28 | | | | | | | 752 | | | | 741,644 | |
Camelot U.S. Acquisition LLC, 2020 Incremental Term Loan B, (1 mo. LIBOR + 3.00%, 1.00% Floor), 7.38%, 10/30/26 | | | | | | | 1,202 | | | | 1,182,203 | |
Go Daddy Operating Co. LLC, 2021 Term Loan B4, (1 mo. LIBOR + 2.00%), 6.38%, 08/10/27 | | | | | | | 823 | | | | 814,161 | |
Grab Holdings, Inc., Term Loan B, (1 mo. LIBOR + 4.50%, 1.00% Floor), 8.89%, 01/29/26 | | | | | | | 1,064 | | | | 1,048,460 | |
| | | | | | | | | | | | |
| | | |
| | | | | | | | | | | 3,786,468 | |
| | | |
| Internet & Direct Marketing Retail — 0.3% | | | | | | | | | |
CNT Holdings I Corp., 2020 Term Loan, (3 mo. SOFR CME + 3.50%, 0.75% Floor), 7.24%, 11/08/27 | | | | | | | 770 | | | | 744,056 | |
Go Daddy Operating Co. LLC, 2022 Term Loan B5, (1 mo. SOFR CME + 3.25%), 7.57%, 10/21/29 | | | | | | | 655 | | | | 653,271 | |
PUG LLC, 2021 Incremental Term Loan B, (1 mo. LIBOR + 4.25%, 0.50% Floor), 8.63%, 02/12/27(c) | | | | | | | 111 | | | | 91,245 | |
| | | | | | | | | | | | |
| | | |
| | | | | | | | | | | 1,488,572 | |
| | | |
| Internet Software & Services — 0.4% | | | | | | | | | |
Uber Technologies, Inc., 2021 Term Loan B, (3 mo. LIBOR + 3.50%), 8.23%, 02/25/27 | | | | | | | 1,789 | | | | 1,784,593 | |
| | | | | | | | | | | | |
| | | |
| IT Services — 2.4% | | | | | | | | | |
Aruba Investments Holdings LLC, 2020 USD Term Loan, (1 mo. LIBOR + 3.75%, 0.75% Floor), 8.14%, 11/24/27 | | | | | | | 335 | | | | 324,724 | |
Boxer Parent Co., Inc., 2021 USD Term Loan, (1 mo. LIBOR + 3.75%), 8.13%, 10/02/25 | | | | | | | 751 | | | | 717,372 | |
Camelot Finance SA, Term Loan B, (1 mo. LIBOR + 3.00%), 7.38%, 10/30/26 | | | | | | | 1,053 | | | | 1,034,507 | |
CCC Intelligent Solutions, Inc., Term Loan, (1 mo. LIBOR + 2.25%, 0.50% Floor), 6.63%, 09/21/28 | | | | | | | 727 | | | | 719,393 | |
CoreLogic, Inc., Term Loan, (1 mo. LIBOR + 3.50%, 0.50% Floor), 7.94%, 06/02/28 | | | | | | | 1,811 | | | | 1,505,725 | |
Fleetcor Technologies Operating Co. LLC, | | | | | | | | | | | | |
2021 Term Loan B4, (1 mo. LIBOR + 1.75%), 6.13%, 04/28/28 | | | | | | | 947 | | | | 936,235 | |
Genesys Cloud Services Holdings II LLC, 2020 USD Term Loan B4, (1 mo. LIBOR + 4.00%, 0.75% Floor), 8.38%, 12/01/27 | | | | | | | 2,233 | | | | 2,139,008 | |
PUG LLC, USD Term Loan, (1 mo. LIBOR + 3.50%), 7.88%, 02/12/27 | | | | | | | 1,434 | | | | 1,176,155 | |
Trans Union LLC | | | | | | | | | | | | |
2019 Term Loan B5, (1 mo. LIBOR + 1.75%), 6.13%, 11/16/26 | | | | | | | 752 | | | | 740,704 | |
2021 Term Loan B6, (1 mo. LIBOR + 2.25%, 0.50% Floor), 6.63%, 12/01/28 | | | | | | | 1,389 | | | | 1,373,680 | |
| | |
| 90 | | 2 0 2 2 BLACK ROCK ANNUAL REPORT TO SHAREHOLDERS |
| | |
Schedule of Investments (continued) December 31, 2022 | | BlackRock Limited Duration Income Trust (BLW) (Percentages shown are based on Net Assets) |
| | | | | | | | | | | | |
| Security | | | | | Par (000) | | | Value | |
| | | |
| IT Services (continued) | | | | | | | | | |
Virtusa Corp., First Lien Term Loan B, (1 mo. LIBOR + 3.75%, 0.75% Floor), 8.13%, 02/11/28 | | | USD | | | | 307 | | | $ | 294,992 | |
WEX, Inc., 2021 Term Loan, (1 mo. LIBOR + 2.25%), 6.63%, 03/31/28 | | | | | | | 429 | | | | 426,193 | |
ZoomInfo LLC, 2021 Term Loan B, (1 mo. SOFR CME + 3.00%), 7.48%, 02/02/26 | | | | | | | 89 | | | | 88,583 | |
| | | | | | | | | | | | |
| | | |
| | | | | | | | | | | 11,477,271 | |
| | | |
| Leisure Products — 0.1% | | | | | | | | | |
Fender Musical Instruments Corp., 2021 Term Loan B, (3 mo. SOFRTE + 4.00%, 0.50% Floor), 8.42%, 12/01/28(c) | | | | | | | 297 | | | | 239,236 | |
Peloton Interactive, Inc., Term Loan, (2 mo. SOFR CME + 6.50%, 0.50% Floor), 11.76%, 05/25/27 | | | | | | | 165 | | | | 162,004 | |
| | | | | | | | | | | | |
| | | |
| | | | | | | | | | | 401,240 | |
| | | |
| Life Sciences Tools & Services — 1.4% | | | | | | | | | |
Avantor Funding, Inc., 2021 Term Loan B5, (1 mo. LIBOR + 2.25%, 0.50% Floor), 6.63%, 11/08/27 | | | | | | | 1,411 | | | | 1,401,990 | |
eResearchTechnology, Inc., 2020 1st Lien Term Loan, (1 mo. LIBOR + 4.50%, 1.00% Floor), 8.88%, 02/04/27 | | | | | | | 1,547 | | | | 1,360,336 | |
ICON Luxembourg SARL, LUX Term Loan, (3 mo. LIBOR + 2.25%, 0.50% Floor), 7.00%, 07/03/28 | | | | | | | 1,154 | | | | 1,149,314 | |
Maravai Intermediate Holdings LLC, 2022 Term Loan B, (3 mo. SOFRTE + 3.00%, 0.50% Floor), 6.96%, 10/19/27 | | | | | | | 964 | | | | 944,940 | |
Parexel International Corp., 2021 1st Lien Term Loan, (1 mo. LIBOR + 3.25%, 0.50% Floor), 7.63%, 11/15/28 | | | | | | | 1,674 | | | | 1,609,767 | |
PRA Health Sciences, Inc., US Term Loan, (3 mo. LIBOR + 2.25%, 0.50% Floor), 7.00%, 07/03/28 | | | | | | | 287 | | | | 286,353 | |
| | | | | | | | | | | | |
| | | |
| | | | | | | | | | | 6,752,700 | |
| | | |
| Machinery — 1.5% | | | | | | | | | |
Albion Acquisitions Ltd., USD Term Loan, (3 mo. LIBOR + 5.25%, 0.50% Floor), 9.57%, 08/17/26 | | | | | | | 755 | | | | 712,308 | |
Clark Equipment Co., 2022 Term Loan B, (3 mo. SOFR CME + 2.50%, 0.50% Floor), 7.18%, 04/20/29 | | | | | | | 165 | | | | 162,233 | |
Columbus McKinnon Corp., 2021 Term Loan B, (3 mo. LIBOR + 2.75%, 0.50% Floor), 7.50%, 05/14/28 | | | | | | | 154 | | | | 151,312 | |
Filtration Group Corp., 2021 Incremental Term Loan, (1 mo. LIBOR + 3.50%, 0.50% Floor), 7.88%, 10/21/28 | | | | | | | 493 | | | | 482,907 | |
Fluidra SA, 2022 USD Term Loan B, (1 mo. SOFR CME + 2.00%), 6.42%, 01/29/29 | | | | | | | 127 | | | | 120,099 | |
Gardner Denver, Inc., 2020 USD Term Loan B2, (1 mo. SOFR CME + 1.75%), 6.17%, 03/01/27 | | | | | | | 603 | | | | 597,794 | |
Ingersoll-Rand Services Co., 2020 USD Spinco Term Loan, (1 mo. SOFR CME + 1.75%), 6.17%, 03/01/27 | | | | | | | 565 | | | | 559,273 | |
Madison IAQ LLC, Term Loan, (3 mo. LIBOR + 3.25%, 0.50% Floor), 7.99%, 06/21/28 | | | | | | | 1,836 | | | | 1,703,761 | |
SPX Flow, Inc., 2022 Term Loan, (1 mo. SOFR CME + 4.50%, 0.50% Floor), 8.92%, 04/05/29 | | | | | | | 592 | | | | 547,287 | |
| | | | | | | | | | | | |
| Security | | | | | Par (000) | | | Value | |
| | | |
| Machinery (continued) | | | | | | | | | |
Titan Acquisition Ltd., 2018 Term Loan B, (6 mo. LIBOR + 3.00%), 8.15%, 03/28/25 | | | USD | | | | 1,813 | | | $ | 1,689,764 | |
Zurn LLC, 2021 Term Loan B, (1 mo. LIBOR + 2.00%, 0.50% Floor), 6.38%, 10/04/28 | | | | | | | 441 | | | | 439,795 | |
| | | | | | | | | | | | |
| | | | | | | | | | | 7,166,533 | |
| | | |
| Media — 5.1% | | | | | | | | | |
Altice Financing SA | | | | | | | | | | | | |
2017 USD Term Loan B, (3 mo. LIBOR + 2.75%), 6.83%, 07/15/25 | | | | | | | 436 | | | | 421,342 | |
USD 2017 1st Lien Term Loan, (3 mo. LIBOR + 2.75%), 6.83%, 01/31/26 | | | | | | | 525 | | | | 503,848 | |
Altice France SA/France, 2018 Term Loan B13, (3 mo. LIBOR + 4.00%), 8.65%, 08/14/26 | | | | | | | 1,318 | | | | 1,222,849 | |
AMC Entertainment Holdings, Inc., 2019 Term Loan B, (1 mo. LIBOR + 3.00%), 7.27%, 04/22/26 | | | | | | | 667 | | | | 359,078 | |
Cable One, Inc., 2021 Term Loan B4, (1 mo. LIBOR + 2.00%), 6.38%, 05/03/28 | | | | | | | 406 | | | | 395,269 | |
Charter Communications Operating LLC, Class A, 2019 Term Loan B1, (1 mo. LIBOR + 1.75%), 6.14%, 04/30/25 | | | | | | | 604 | | | | 600,224 | |
City Football Group Ltd., Term Loan, (1 mo. LIBOR + 3.00%, 0.50% Floor), 7.36%, 07/21/28 | | | | | | | 798 | | | | 743,735 | |
Clear Channel Outdoor Holdings, Inc., Term Loan B, (3 mo. LIBOR + 3.50%), 7.91%, 08/21/26 | | | | | | | 1,961 | | | | 1,782,597 | |
CMG Media Corp., 2021 Term Loan, (3 mo. LIBOR + 3.50%), 8.23%, 12/17/26 | | | | | | | 578 | | | | 540,431 | |
Connect Finco SARL, 2021 Term Loan B, (1 mo. LIBOR + 3.50%, 1.00% Floor), 7.89%, 12/11/26 | | | | | | | 3,086 | | | | 3,045,873 | |
CSC Holdings LLC | | | | | | | | | | | | |
2017 Term Loan B1, (1 mo. LIBOR + 2.25%), 6.57%, 07/17/25 | | | | | | | 611 | | | | 585,302 | |
2019 Term Loan B5, (1 mo. LIBOR + 2.50%), 6.82%, 04/15/27 | | | | | | | 865 | | | | 770,356 | |
E.W. Scripps Co., 2020 Term Loan B3, (1 mo. LIBOR + 2.75%, 0.75% Floor), 7.13%, 01/07/28 | | | | | | | 302 | | | | 292,967 | |
Learfield Communications LLC, 2016 1st Lien Term Loan, (1 mo. LIBOR + 3.25%, 1.00% Floor), 7.64%, 12/01/23 | | | | | | | 370 | | | | 275,747 | |
Lions Gate Capital Holdings LLC, 2018 Term Loan B, (1 mo. LIBOR + 2.25%), 6.63%, 03/24/25 | | | | | | | 1,051 | | | | 1,001,399 | |
Live Nation Entertainment, Inc., Term Loan B4, (1 mo. LIBOR + 1.75%), 6.13%, 10/17/26 | | | | | | | 1,073 | | | | 1,045,966 | |
MH Sub I LLC | | | | | | | | | | | | |
2017 1st Lien Term Loan, (1 mo. LIBOR + 3.75%), 8.13%, 09/13/24 | | | | | | | 1,705 | | | | 1,654,264 | |
2020 Incremental Term Loan, (1 mo. LIBOR + 3.75%, 1.00% Floor), 8.13%, 09/13/24 | | | | | | | 965 | | | | 936,732 | |
2021 2nd Lien Term Loan, (3 mo. SOFR CME + 6.25%), 10.65%, 02/23/29 | | | | | | | 1,005 | | | | 895,364 | |
Sinclair Television Group, Inc., 2022 Term Loan B4, (1 mo. SOFR CME + 3.75%), 8.17%, 04/21/29 | | | | | | | 802 | | | | 760,468 | |
UFC Holdings LLC, 2021 Term Loan B, (3 mo. LIBOR + 2.75%, 0.75% Floor), 7.11%, 04/29/26 | | | | | | | 593 | | | | 585,262 | |
UPC Financing Partnership, 2021 USD Term Loan AX, (1 mo. LIBOR + 2.93%), 7.24%, 01/31/29 | | | | | | | 341 | | | | 332,887 | |
Virgin Media Bristol LLC, 2020 USD Term Loan Q, (1 mo. LIBOR + 3.25%), 7.57%, 01/31/29 | | | | | | | 917 | | | | 907,142 | |
| | |
SCHEDULE OF INVESTMENTS | | 91 |
| | |
Schedule of Investments (continued) December 31, 2022 | | BlackRock Limited Duration Income Trust (BLW) (Percentages shown are based on Net Assets) |
| | | | | | | | | | | | |
| Security | | | | | Par (000) | | | Value | |
|
| Media (continued) | |
Voyage Digital Ltd., USD Term Loan B, (3 mo. SOFRTE + 4.50%, 0.50% Floor), 8.78%, 05/11/29(c) | | | USD | | | | 429 | | | $ | 421,340 | |
William Morris Endeavor Entertainment LLC, 2018 1st Lien Term Loan, (1 mo. LIBOR + 2.75%), 7.14%, 05/18/25 | | | | | | | 1,597 | | | | 1,559,821 | |
WMG Acquisition Corp., 2021 Term Loan G, (1 mo. LIBOR + 2.13%), 6.51%, 01/20/28 | | | | | | | 1,220 | | | | 1,203,952 | |
Zayo Group Holdings, Inc., USD Term Loan, (1 mo. LIBOR + 3.00%), 7.38%, 03/09/27 | | | | | | | 2,342 | | | | 1,890,229 | |
| | | | | | | | | | | | |
| | | |
| | | | | | | | | | | 24,734,444 | |
|
| Oil, Gas & Consumable Fuels — 0.6% | |
Ascent Resources Utica Holdings LLC, 2020 Fixed 2nd Lien Term Loan, (3 mo. LIBOR + 9.00%, 1.00% Floor), 12.94%, 11/01/25 | | | | | | | 330 | | | | 347,820 | |
Edgewater Generation LLC, Term Loan, (1 mo. LIBOR + 3.75%), 8.13%, 12/13/25 | | | | | | | 261 | | | | 247,280 | |
Lealand Finance Co. BV | | | | | | | | | | | | |
2020 Make Whole Term Loan, (1 mo. LIBOR + 3.00%), 7.38%, 06/28/24 | | | | | | | 16 | | | | 9,860 | |
2020 Take Back Term Loan, (1 mo. LIBOR + 1.00%, 3.00% PIK), 5.38%, 06/30/25(l) | | | | | | | 116 | | | | 60,648 | |
M6 ETX Holdings II Midco LLC, Term Loan B, (3 mo. SOFR CME + 4.50%, 0.50% Floor), 9.16%, 09/19/29 | | | | | | | 103 | | | | 102,646 | |
Medallion Midland Acquisition LLC, 2021 Term Loan, (3 mo. SOFR CME + 3.75%, 0.75% Floor), 8.59%, 10/18/28 | | | | | | | 896 | | | | 886,406 | |
Oryx Midstream Services Permian Basin LLC, Term Loan B, (3 mo. LIBOR + 3.25%, 0.50% Floor), 7.92%, 10/05/28 | | | | | | | 1,478 | | | | 1,457,902 | |
| | | | | | | | | | | | |
| | | |
| | | | | | | | | | | 3,112,562 | |
| | | |
| Personal Products — 0.6% | | | | | | | | | |
Sunshine Luxembourg VII SARL, 2021 Term Loan B3, (3 mo. LIBOR + 3.75%, 0.75% Floor), 8.48%, 10/01/26 | | | | | | | 3,037 | | | | 2,903,287 | |
| | | | | | | | | | | | |
| | | |
| Pharmaceuticals — 1.3% | | | | | | | | | |
Amneal Pharmaceuticals LLC, 2018 Term Loan B, (3 mo. LIBOR + 3.50%), 8.09%, 05/04/25 | | | | | | | 748 | | | | 667,769 | |
Bausch Health Cos., Inc., 2022 Term Loan B, (1 mo. SOFR CME + 5.25%, 0.50% Floor), 9.67%, 02/01/27 | | | | | | | 593 | | | | 449,001 | |
Catalent Pharma Solutions, Inc., 2021 Term Loan B3, (1 mo. LIBOR + 2.00%, 0.50% Floor), 6.38%, 02/22/28 | | | | | | | 1,037 | | | | 1,018,904 | |
Elanco Animal Health, Inc., Term Loan B, (1 mo. LIBOR + 1.75%), 5.87%, 08/01/27 | | | | | | | 609 | | | | 583,925 | |
Jazz Financing Lux SARL, USD Term Loan, (1 mo. LIBOR + 3.50%, 0.50% Floor), 7.88%, 05/05/28 | | | | | | | 1,078 | | | | 1,067,032 | |
Option Care Health, Inc., 2021 Term Loan B, (1 mo. LIBOR + 2.75%, 0.50% Floor), 7.13%, 10/27/28 | | | | | | | 448 | | | | 444,465 | |
| | | | | | | | | | | | |
| Security | | | | | Par (000) | | | Value | |
|
| Pharmaceuticals (continued) | |
Organon & Co., USD Term Loan, (3 mo. LIBOR + 3.00%, 0.50% Floor), 7.75%, 06/02/28 | | | USD | | | | 907 | | | $ | 896,384 | |
Precision Medicine Group LLC, 2021 Term Loan, (3 mo. LIBOR + 3.00%, 0.75% Floor), 7.73%, 11/18/27(c) | | | | | | | 1,195 | | | | 1,108,292 | |
| | | | | | | | | | | | |
| | | |
| | | | | | | | | | | 6,235,772 | |
| | | |
| Professional Services — 0.9% | | | | | | | | | |
Dun & Bradstreet Corp. | | | | | | | | | | | | |
2022 Incremental Term Loan B2, (1 mo. SOFR CME + 3.25%), 7.57%, 01/18/29 | | | | | | | 304 | | | | 298,202 | |
Term Loan, (1 mo. LIBOR + 3.25%), 7.64%, 02/06/26 | | | | | | | 1,957 | | | | 1,935,604 | |
Element Materials Technology Group U.S. Holdings, Inc. | | | | | | | | | | | | |
2022 USD Delayed Draw Term Loan, (3 mo. SOFR CME + 4.25%, 0.50% Floor), 8.93%, 07/06/29 | | | | | | | 309 | | | | 301,931 | |
2022 USD Term Loan, (3 mo. SOFR CME + 4.25%, 0.50% Floor), 8.93%, 07/06/29 | | | | | | | 671 | | | | 654,185 | |
Galaxy U.S. Opco, Inc., Term Loan, (1 mo. SOFR CME + 4.75%, 0.50% Floor), 9.07%, 04/29/29 | | | | | | | 1,089 | | | | 982,822 | |
| | | | | | | | | | | | |
| | | |
| | | | | | | | | | | 4,172,744 | |
| |
| Real Estate Management & Development — 0.5% | | | | |
Chariot Buyer LLC, Term Loan B, (1 mo. LIBOR + 3.25%, 0.50% Floor), 7.63%, 11/03/28 | | | | | | | 1,445 | | | | 1,359,909 | |
Cushman & Wakefield U.S. Borrower LLC, 2020 Term Loan B, (1 mo. LIBOR + 2.75%), 7.13%, 08/21/25 | | | | | | | 1,202 | | | | 1,172,169 | |
| | | | | | | | | | | | |
| | | | | | | | | | | 2,532,078 | |
| | | |
| Road & Rail — 0.1% | | | | | | | | | |
Avis Budget Car Rental LLC, 2020 Term Loan B, (1 mo. LIBOR + 1.75%), 6.14%, 08/06/27 | | | | | | | 287 | | | | 277,544 | |
SIRVA Worldwide, Inc., 2018 1st Lien Term Loan, (1 mo. LIBOR + 5.50%), 9.86%, 08/04/25 | | | | | | | 371 | | | | 330,437 | |
| | | | | | | | | | | | |
| | | |
| | | | | | | | | | | 607,981 | |
| |
| Semiconductors & Semiconductor Equipment — 0.1% | | | | |
MKS Instruments, Inc., 2022 USD Term Loan B, 08/17/29(o) | | | | | | | 459 | | | | 452,541 | |
Synaptics, Inc., Term Loan B, (6 mo. LIBOR + 2.25%, 0.50% Floor), 7.40%, 12/02/28 | | | | | | | 253 | | | | 247,112 | |
| | | | | | | | | | | | |
| | | | | | | | | | | 699,653 | |
| | | |
| Software — 5.1% | | | | | | | | | |
Applied Systems, Inc. | | | | | | | | | | | | |
2021 2nd Lien Term Loan, (3 mo. SOFR CME + 6.75%, 0.75% Floor), 11.33%, 09/19/25 | | | | | | | 90 | | | | 88,988 | |
2022 Extended 1st Lien Term Loan, (3 mo. SOFR CME + 4.50%, 0.50% Floor), 9.08%, 09/18/26 | | | | | | | 95 | | | | 58,288 | |
Barracuda Networks, Inc., 2022 Term Loan, (3 mo. SOFR CME + 4.50%, 0.50% Floor), 8.59%, 08/15/29 | | | | | | | 333 | | | | 320,559 | |
Central Parent, Inc., 2022 USD Term Loan B, (3 mo. SOFR CME + 4.50%, 0.50% Floor), 9.08%, 07/06/29 | | | | | | | 1,207 | | | | 1,194,652 | |
| | |
| 92 | | 2 0 2 2 BLACK ROCK ANNUAL REPORT TO SHAREHOLDERS |
| | |
Schedule of Investments (continued) December 31, 2022 | | BlackRock Limited Duration Income Trust (BLW) (Percentages shown are based on Net Assets) |
| | | | | | | | | | | | |
| Security | | | | | Par (000) | | | Value | |
|
| Software (continued) | |
Cloudera, Inc. | | | | | | | | | | | | |
2021 Second Lien Term Loan, (1 mo. LIBOR + 6.00%, 0.50% Floor), 10.38%, 10/08/29 | | | USD | | | | 457 | | | $ | 380,073 | |
2021 Term Loan, (1 mo. LIBOR + 3.75%, 0.50% Floor), 8.13%, 10/08/28 | | | | | | | 636 | | | | 596,471 | |
Cornerstone OnDemand, Inc., 2021 Term Loan, (1 mo. LIBOR + 3.75%, 0.50% Floor), 8.13%, 10/16/28 | | | | | | | 516 | | | | 459,329 | |
Digicel International Finance Ltd., 2017 Term Loan B, (1 mo. LIBOR + 3.25%), 7.63%, 05/28/24 | | | | | | | 437 | | | | 365,860 | |
E2open LLC, 2020 Term Loan B, (1 mo. LIBOR + 3.50%, 0.50% Floor), 7.68%, 02/04/28 | | | | | | | 113 | | | | 110,392 | |
Epicor Software Corp. | | | | | | | | | | | | |
2020 2nd Lien Term Loan, (1 mo. LIBOR + 7.75%, 1.00% Floor), 12.13%, 07/31/28 | | | | | | | 296 | | | | 291,116 | |
2020 Term Loan, (1 mo. LIBOR + 3.25%, 0.75% Floor), 7.63%, 07/30/27 | | | | | | | 287 | | | | 275,049 | |
Helios Software Holdings, Inc., 2021 USD Term Loan B, (3 mo. SOFR CME + 3.75%), 8.48%, 03/11/28 | | | | | | | 613 | | | | 600,567 | |
Informatica LLC, 2021 USD Term Loan B, (1 mo. LIBOR + 2.75%), 7.19%, 10/27/28 | | | | | | | 1,718 | | | | 1,682,107 | |
Instructure Holdings, Inc., 2021 Term Loan B, (3 mo. LIBOR + 2.75%, 0.50% Floor), 6.12%, 10/30/28(c) | | | | | | | 310 | | | | 303,467 | |
IPS Corp., 2021 Term Loan, (1 mo. LIBOR + 3.50%, 0.50% Floor), 7.88%, 10/02/28 | | | | | | | 257 | | | | 228,727 | |
Magenta Buyer LLC | | | | | | | | | | | | |
2021 USD 1st Lien Term Loan, (3 mo. LIBOR + 4.75%, 0.75% Floor), 9.17%, 07/27/28 | | | | | | | 1,017 | | | | 866,007 | |
2021 USD 2nd Lien Term Loan, (3 mo. LIBOR + 8.25%, 0.75% Floor), 12.67%, 07/27/29 | | | | | | | 936 | | | | 732,990 | |
McAfee Corp., 2022 USD Term Loan B, (1 mo. SOFR CME + 3.75%), 7.97%, 03/01/29 | | | | | | | 1,634 | | | | 1,516,794 | |
Planview Parent, Inc., Term Loan, (3 mo. LIBOR + 4.00%, 0.75% Floor), 8.73%, 12/17/27 | | | | | | | 473 | | | | 437,650 | |
Proofpoint, Inc., 1st Lien Term Loan, (3 mo. LIBOR + 3.25%, 0.50% Floor), 7.98%, 08/31/28 | | | | | | | 1,760 | | | | 1,688,811 | |
RealPage, Inc., 1st Lien Term Loan, (1 mo. LIBOR + 3.00%, 0.50% Floor), 7.38%, 04/24/28 | | | | | | | 3,453 | | | | 3,276,973 | |
Renaissance Holding Corp., 2018 1st Lien Term Loan, (1 mo. LIBOR + 3.25%), 7.63%, 05/30/25 | | | | | | | 31 | | | | 29,399 | |
Restoration Hardware, Inc., Term Loan B, (1 mo. LIBOR + 2.50%, 0.50% Floor), 6.88%, 10/20/28 | | | | | | | 314 | | | | 288,636 | |
Severin Acquisition LLC, 2018 Term Loan B, (3 mo. SOFR CME + 3.00%), 7.09%, 08/01/25 | | | | | | | 958 | | | | 949,645 | |
Sophia LP, 2021 Term Loan B, (3 mo. LIBOR + 3.50%, 0.50% Floor), 8.23%, 10/07/27 | | | | | | | 746 | | | | 718,843 | |
SS&C Technologies, Inc. | | | | | | | | | | | | |
2018 Term Loan B3, (1 mo. LIBOR + 1.75%), 6.13%, 04/16/25 | | | | | | | 557 | | | | 546,557 | |
2018 Term Loan B4, (1 mo. LIBOR + 1.75%), 6.13%, 04/16/25 | | | | | | | 452 | | | | 444,079 | |
Tempo Acquisition LLC, 2022 Term Loan B, (1 mo. SOFR CME + 3.00%), 7.32%, 08/31/28 | | | | | | | 2,284 | | | | 2,274,506 | |
TIBCO Software, Inc., 2022 USD Term Loan, (3 mo. SOFR CME + 4.50%, 0.50% Floor), 9.18%, 03/30/29 | | | | | | | 2,054 | | | | 1,831,047 | |
| | | | | | | | | | | | |
| Security | | | | | Par (000) | | | Value | |
|
| Software (continued) | |
Ultimate Software Group, Inc. | | | | | | | | | | | | |
2021 2nd Lien Term Loan, (1 mo. LIBOR + 5.25%, 0.50% Floor), 9.00%, 05/03/27 | | | USD | | | | 453 | | | $ | 414,830 | |
2021 Term Loan, (3 mo. LIBOR + 3.25%, 0.50% Floor), 7.00%, 05/04/26 | | | | | | | 590 | | | | 560,069 | |
Term Loan B, (1 mo. LIBOR + 3.75%), 8.13%, 05/04/26 | | | | | | | 1,043 | | | | 1,004,108 | |
| | | | | | | | | | | | |
| | | |
| | | | | | | | | | | 24,536,589 | |
| | | |
| Specialty Retail — 2.1% | | | | | | | | | |
Belron Finance U.S. LLC | | | | | | | | | | | | |
2018 Term Loan B, (3 mo. LIBOR + 2.25%), 6.94%, 11/13/25 | | | | | | | 179 | | | | 177,444 | |
2019 USD Term Loan B3, (3 mo. LIBOR + 2.25%), 6.69%, 10/30/26 | | | | | | | 407 | | | | 404,854 | |
2021 USD Term Loan B, (3 mo. LIBOR + 2.50%, 0.50% Floor), 7.06%, 04/13/28 | | | | | | | 1,218 | | | | 1,203,473 | |
CD&R Firefly Bidco Ltd., 2018 GBP Term Loan B1, (1 day SONIA + 4.25%), 6.54%, 06/23/25 | | | GBP | | | | 1,000 | | | | 1,102,828 | |
EG Group Ltd., 2021 Term Loan, (3 mo. LIBOR + 4.25%, 0.50% Floor), 8.98%, 03/31/26 | | | USD | | | | 233 | | | | 217,521 | |
Fanatics Commerce Intermediate Holdco LLC, Term Loan B, (1 mo. LIBOR + 3.25%, 0.50% Floor), 7.63%, 11/24/28(c) | | | | | | | 311 | | | | 304,643 | |
Mavis Tire Express Services Corp., 2021 Term Loan B, (1 mo. SOFR CME + 4.00%, 0.75% Floor), 8.50%, 05/04/28 | | | | | | | 1,268 | | | | 1,207,023 | |
MED ParentCo LP, 1st Lien Term Loan, (1 mo. LIBOR + 4.25%), 8.63%, 08/31/26 | | | | | | | 820 | | | | 696,727 | |
Midas Intermediate Holdco II LLC, (1 mo. SOFR CME + 8.35%, 0.75% Floor), 12.67%, 06/30/27 | | | | | | | 1,560 | | | | 1,345,364 | |
PetSmart, Inc., 2021 Term Loan B, (1 mo. LIBOR + 3.75%, 0.75% Floor), 8.13%, 02/11/28 | | | | | | | 1,618 | | | | 1,579,818 | |
Pilot Travel Centers LLC, 2021 Term Loan B, (1 mo. SOFR CME + 2.00%), 6.42%, 08/04/28 | | | | | | | 428 | | | | 422,136 | |
Restoration Hardware, Inc., 2022 Incremental Term Loan, (1 mo. SOFR CME + 3.25%, 0.50% Floor), 7.67%, 10/20/28 | | | | | | | 363 | | | | 338,694 | |
Reverb Buyer, Inc., 2021 1st Lien Term Loan, (1 mo. LIBOR + 3.50%, 0.50% Floor), 7.88%, 11/01/28 | | | | | | | 1,006 | | | | 940,655 | |
Woof Holdings, Inc., 1st Lien Term Loan, (1 mo. LIBOR + 3.75%, 0.75% Floor), 8.10%, 12/21/27 | | | | | | | 226 | | | | 212,039 | |
| | | | | | | | | | | | |
| | | |
| | | | | | | | | | | 10,153,219 | |
| |
| Technology Hardware, Storage & Peripherals — 0.0% | | | | |
Electronics for Imaging, Inc., Term Loan, (1 mo. LIBOR + 5.00%), 9.38%, 07/23/26 | | | | | | | 278 | | | | 184,626 | |
| | | | | | | | | | | | |
| | | |
| Textiles, Apparel & Luxury Goods — 0.1% | | | | | | | | | |
Crocs, Inc., Term Loan B, (3 mo. SOFRTE + 3.50%, 0.50% Floor), 7.80%, 02/20/29 | | | | | | | 613 | | | | 600,023 | |
| | | | | | | | | | | | |
| | | |
| Trading Companies & Distributors — 0.3% | | | | | | | | | |
Beacon Roofing Supply, Inc., 2021 Term Loan B, (1 mo. LIBOR + 2.25%), 6.63%, 05/19/28 | | | | | | | 613 | | | | 606,360 | |
| | |
SCHEDULE OF INVESTMENTS | | 93 |
| | |
Schedule of Investments (continued) December 31, 2022 | | BlackRock Limited Duration Income Trust (BLW) (Percentages shown are based on Net Assets) |
| | | | | | | | | | | | |
| Security | | | | | Par
(000) | | | Value | |
| |
| Trading Companies & Distributors (continued) | | | | |
ION Trading Finance Ltd., 2021 USD Term Loan, (3 mo. LIBOR + 4.75%), 9.48%, 04/03/28 | | | USD | | | | 298 | | | $ | 282,252 | |
SRS Distribution, Inc., 2022 Incremental Term Loan, (1 mo. SOFR CME + 3.50%), 7.92%, 06/02/28 | | | | | | | 407 | | | | 388,011 | |
| | | | | | | | | | | | |
| | | |
| | | | | | | | | | | 1,276,623 | |
| |
Wireless Telecommunication Services — 0.3% | | | | | |
GOGO Intermediate Holdings LLC, Term Loan B, (3 mo. LIBOR + 3.75%, 0.75% Floor), 8.16%, 04/30/28 | | | | | | | 431 | | | | 426,235 | |
SBA Senior Finance II LLC, 2018 Term Loan B, (1 mo. LIBOR + 1.75%), 6.14%, 04/11/25 | | | | | | | 1,052 | | | | 1,047,803 | |
| | | | | | | | | | | | |
| | | |
| | | | | | | | | | | 1,474,038 | |
| | | | | | | | | | | | |
| |
Total Floating Rate Loan Interests — 55.5%
(Cost: $280,582,587) | | | | 267,805,244 | |
| | | | | | | | | | | | |
| | | |
Foreign Agency Obligations | | | | | | | | | | | | |
| | | |
| Bahrain — 0.1% | | | | | | | | | |
Bahrain Government International Bond, 6.75%, 09/20/29(d) | | | | | | | 200 | | | | 198,162 | |
| | | | | | | | | | | | |
| | | |
| Chile — 0.0% | | | | | | | | | |
Chile Government International Bond, 4.34%, 03/07/42(g) | | | | | | | 200 | | | | 168,475 | |
| | | | | | | | | | | | |
| | | |
| Colombia — 0.2% | | | | | | | | | |
Colombia Government International Bond | | | | | | | | | | | | |
4.50%, 01/28/26 | | | | | | | 200 | | | | 187,725 | |
3.13%, 04/15/31 | | | | | | | 430 | | | | 318,684 | |
Republic of Colombia Senior Unsecured, 8.00%, 04/20/33 | | | | | | | 200 | | | | 199,600 | |
| | | | | | | | | | | | |
| | | |
| | | | | | | | | | | 706,009 | |
| | | |
Dominican Republic — 0.1% | | | | | | | | | | | | |
Dominican Republic International Bond | | | | | | | | | | | | |
5.95%, 01/25/27(d)(g) | | | | | | | 157 | | | | 153,203 | |
4.50%, 01/30/30(b) | | | | | | | 200 | | | | 169,662 | |
4.88%, 09/23/32(b)(g) | | | | | | | 300 | | | | 248,025 | |
| | | | | | | | | | | | |
| | | |
| | | | | | | | | | | 570,890 | |
| | | |
| Egypt — 0.0% | | | | | | | | | |
Egypt Government International Bond, 7.50%, 02/16/61(b) | | | | | | | 200 | | | | 122,000 | |
| | | | | | | | | | | | |
| | | |
| Guatemala — 0.1% | | | | | | | | | |
Guatemala Government Bond | | | | | | | | | | | | |
4.50%, 05/03/26(d) | | | | | | | 200 | | | | 191,662 | |
4.65%, 10/07/41(b) | | | | | | | 200 | | | | 160,038 | |
| | | | | | | | | | | | |
| | | | | | | | | | | 351,700 | |
| | | |
| Hungary — 0.0% | | | | | | | | | |
Hungary Government International Bond, 5.25%, 06/16/29(b) | | | | | | | 200 | | | | 190,163 | |
| | | | | | | | | | | | |
| | | |
| Indonesia — 0.1% | | | | | | | | | |
Indonesia Government International Bond, 4.10%, 04/24/28 | | | | | | | 200 | | | | 195,725 | |
| | | | | | | | | | | | |
| | | | | | | | | | | | |
| Security | | | | | Par (000) | | | Value | |
| | | |
| Ivory Coast — 0.0% | | | | | | | | | |
Ivory Coast Government International Bond, 6.38%, 03/03/28(d) | | | USD | | | | 200 | | | $ | 193,500 | |
| | | | | | | | | | | | |
| | | |
| Mexico — 0.1% | | | | | | | | | |
Mexico Government International Bond | | | | | | | | | | | | |
3.75%, 01/11/28(g) | | | | | | | 200 | | | | 188,400 | |
2.66%, 05/24/31 | | | | | | | 278 | | | | 224,624 | |
| | | | | | | | | | | | |
| | | | | | | | | | | 413,024 | |
| | | |
Morocco — 0.0% | | | | | | | | | | | | |
Morocco Government International Bond, 2.38%, 12/15/27(b) | | | | | | | 200 | | | | 173,225 | |
| | | | | | | | | | | | |
| | | |
| Nigeria — 0.0% | | | | | | | | | |
Nigeria Government International Bond, 8.38%, 03/24/29(b) | | | | | | | 200 | | | | 165,000 | |
| | | | | | | | | | | | |
| | | |
| Oman — 0.1% | | | | | | | | | |
Oman Government International Bond, 6.50%, 03/08/47(d) | | | | | | | 308 | | | | 279,510 | |
| | | | | | | | | | | | |
| | | |
| Panama — 0.1% | | | | | | | | | |
Panama Government International Bond | | | | | | | | | | | | |
3.88%, 03/17/28 | | | | | | | 200 | | | | 188,725 | |
3.16%, 01/23/30(g) | | | | | | | 377 | | | | 323,702 | |
| | | | | | | | | | | | |
| | | | | | | | | | | 512,427 | |
| | | |
Paraguay — 0.0% | | | | | | | | | | | | |
Paraguay Government International Bond, 5.40%, 03/30/50(d) | | | | | | | 200 | | | | 171,725 | |
| | | | | | | | | | | | |
| | | |
| Peru — 0.1% | | | | | | | | | |
Corp. Financiera de Desarrollo SA, 4.75%, 07/15/25(d) | | | | | | | 219 | | | | 211,307 | |
Peruvian Government International Bond | | | | | | | | | | | | |
2.78%, 01/23/31 | | | | | | | 97 | | | | 80,195 | |
1.86%, 12/01/32(g) | | | | | | | 259 | | | | 189,038 | |
| | | | | | | | | | | | |
| | | | | | | | | | | 480,540 | |
| | | |
Romania — 0.1% | | | | | | | | | | | | |
Romanian Government International Bond | | | | | | | | | | | | |
5.25%, 11/25/27(b) | | | | | | | 122 | | | | 116,723 | |
2.88%, 03/11/29(d) | | | EUR | | | | 133 | | | | 117,482 | |
2.50%, 02/08/30(d) | | | | | | | 138 | | | | 113,912 | |
2.12%, 07/16/31(d) | | | | | | | 156 | | | | 114,733 | |
| | | | | | | | | | | | |
| | | | | | | | | | | 462,850 | |
| | | |
Saudi Arabia — 0.1% | | | | | | | | | | | | |
Saudi Government International Bond, 4.50%, 04/17/30(d)(g) | | | USD | | | | 325 | | | | 320,998 | |
| | | | | | | | | | | | |
| | | |
| South Africa — 0.1% | | | | | | | | | |
Republic of South Africa Government International Bond | | | | | | | | | | | | |
4.85%, 09/30/29 | | | | | | | 200 | | | | 177,475 | |
5.00%, 10/12/46 | | | | | | | 230 | | | | 160,252 | |
| | | | | | | | | | | | |
| | | | | | | | | | | 337,727 | |
| | |
| 94 | | 2 0 2 2 BLACK ROCK ANNUAL REPORT TO SHAREHOLDERS |
| | |
Schedule of Investments (continued) December 31, 2022 | | BlackRock Limited Duration Income Trust (BLW) (Percentages shown are based on Net Assets) |
| | | | | | | | | | | | |
| Security | | | | | Par (000) | | | Value | |
|
| Sri Lanka — 0.0% | |
Sri Lanka Government International Bond(d)(e)(j) | | | | | | | | | | | | |
6.85%, 03/14/24 | | | USD | | | | 200 | | | $ | 58,750 | |
6.35%, 06/28/24 | | | | | | | 200 | | | | 58,475 | |
| | | | | | | | | | | | |
| | | |
| | | | | | | | | | | 117,225 | |
| | | |
| Ukraine — 0.0% | | | | | | | | | |
Ukraine Government International
Bond(e)(j) | | | | | | | | | | | | |
9.75%, 11/01/30(d) | | | | | | | 236 | | | | 50,710 | |
7.25%, 03/15/35(b) | | | | | | | 200 | | | | 37,288 | |
| | | | | | | | | | | | |
| | | |
| | | | | | | | | | | 87,998 | |
| | | |
| Uruguay — 0.0% | | | | | | | | | |
Uruguay Government International Bond, 5.75%, 10/28/34 | | | | | | | 135 | | | | 146,117 | |
| | | | | | | | | | | | |
| | |
Total Foreign Agency Obligations — 1.3%
(Cost: $7,367,177) | | | | | | | | 6,364,990 | |
| | | | | | | | | | | | |
| | | |
| | | | | | Shares | | | | |
|
Investment Companies | |
| | | |
| Fixed Income Funds — 1.0% | | | | | | | | | |
Invesco Senior Loan ETF | | | | | | | 230,501 | | | | 4,732,186 | |
| | | | | | | | | | | | |
| | | |
Total Investment Companies — 1.0%
(Cost: $4,877,550) | | | | | | | | | | | 4,732,186 | |
| | | | | | | | | | | | |
| | | |
| | | | | | Par (000) | | | | |
|
Non-Agency Mortgage-Backed Securities | |
|
| Collateralized Mortgage Obligations — 2.4% | |
Alternative Loan Trust | | | | | | | | | | | | |
Series 2005-54CB, Class 3A4, 5.50%, 11/25/35 | | | USD | | | | 1,061 | | | | 611,856 | |
Series 2006-J8, Class A5, 6.00%, 02/25/37 | | | | | | | 1,849 | | | | 833,934 | |
Series 2007-19, Class 1A1, 6.00%, 08/25/37 | | | | | | | 546 | | | | 281,655 | |
CHL Mortgage Pass-Through Trust | | | | | | | | | | | | |
Series 2005-17, Class 1A6, 5.50%, 09/25/35 | | | | | | | 99 | | | | 84,398 | |
Series 2006-17, Class A2, 6.00%, 12/25/36 | | | | | | | 627 | | | | 283,516 | |
Series 2007-HY5, Class 3A1, 4.03%, 09/25/37(a) . | | | | | | | 303 | | | | 271,552 | |
COLT Mortgage Loan Trust | | | | | | | | | | | | |
Series 2022-7, Class A1, 5.16%, 04/25/67(b) | | | | | | | 2,372 | | | | 2,329,801 | |
Series 2022-9, Class A1, 6.79%, 12/25/67 | | | | | | | 312 | | | | 314,676 | |
Ellington Financial Mortgage Trust, Series 2021-2, Class A1, 0.93%, 06/25/66(a)(b) | | | | | | | 227 | | | | 174,844 | |
GCAT Trust, Series 2022-NQM3, Class A1, 4.35%, 04/25/67(a)(b) | | | | | | | 1,508 | | | | 1,441,242 | |
GSR Mortgage Loan Trust, Series 2005-AR5, Class 2A3, 3.56%, 10/25/35(a) | | | | | | | 309 | | | | 177,886 | |
JP Morgan Mortgage Trust, Series 2022-DSC1, Class A1, 4.75%, 01/25/63(c) | | | | | | | 406 | | | | 384,933 | |
ONSLOW Bay Financial LLC, Series 2022-NQM9, Class A1A, 6.45%, 09/25/62 | | | | | | | 100 | | | | 99,511 | |
Spruce Hill Mortgage Loan Trust, Class A1A, 4.10%, 07/25/57 | | | | | | | 618 | | | | 565,876 | |
Verus Securitization Trust Series 2022-3, Class A1, 4.13%, 02/25/67(b) | | | | | | | 1,509 | | | | 1,424,827 | |
| | | | | | | | | | | | |
| Security | | | | | Par (000) | | | Value | |
|
| Collateralized Mortgage Obligations (continued) | |
Verus Securitization Trust (continued) | | | | | | | | | | | | |
Series 2022-7, Class A1, 5.15%, 07/25/67(b) | | | USD | | | | 1,785 | | | $ | 1,735,632 | |
Series 2022-INV2, Class A1, 6.79%, 10/25/67 | | | | | | | 478 | | | | 481,722 | |
| | | | | | | | | | | | |
| | | | | | | | | | | 11,497,861 | |
|
| Commercial Mortgage-Backed Securities — 0.9% | |
BX Commercial Mortgage Trust(a)(b) | | | | | | | | | | | | |
Series 2019-XL, Class A, (1 mo. SOFR CME + 1.03%), 5.37%, 10/15/36 | | | | | | | 1,129 | | | | 1,115,069 | |
Series 2021-CIP, Class A, (1 mo. LIBOR US + 0.92%), 5.24%, 12/15/38 | | | | | | | 1,000 | | | | 964,891 | |
Series 2021-XL2, Class A, (1 mo. LIBOR US + 0.69%), 5.01%, 10/15/38 | | | | | | | 454 | | | | 436,437 | |
BX Trust, Class A, 5.19%, 01/15/39 | | | | | | | 1,200 | | | | 1,145,871 | |
Citigroup Commercial Mortgage Trust, Series 2019- SMRT, Class A, 4.15%, 01/10/36(b) | | | | | | | 800 | | | | 780,016 | |
| | | | | | | | | | | | |
| | | | | | | | | | | 4,442,284 | |
| | | | | | | | | | | | |
| |
Total Non-Agency Mortgage-Backed Securities — 3.3%
(Cost: $16,973,462) | | | | 15,940,145 | |
| | | | | | | | | | | | |
| | | |
| | | | | | Benefical Interest (000) | | | | |
| | | |
Other Interests(c)(p) | | | | | | | | | | | | |
| | | |
| IT Services — 0.0% | | | | | | | | | |
Millennium Corp. Claim | | | USD | | | | 861 | | | | — | |
Millennium Lender Claim Trust | | | | | | | 918 | | | | — | |
| | | | | | | | | | | | |
| | | |
Total Other Interests — 0.0%
(Cost: $ — ) | | | | | | | | | | | — | |
| | | | | | | | | | | | |
| | | |
| | | | | | Par (000) | | | | |
| | | |
Preferred Securities | | | | | | | | | | | | |
| | | |
| Capital Trusts — 5.0% | | | | | | | | | |
| | | |
| Aerospace & Defense — 0.0% | | | | | | | | | |
Air France-KLM, 6.50%, 12/31/99 | | | EUR | | | | 100 | | | | 105,258 | |
| | | | | | | | | | | | |
| | | |
| Automobiles — 0.1% | | | | | | | | | |
General Motors Financial Co., Inc., Series C, 5.70%(a)(g)(k) | | | USD | | | | 365 | | | | 308,927 | |
| | | | | | | | | | | | |
| | | |
| Banks(a)(k) — 1.2% | | | | | | | | | |
Bank of East Asia Ltd., 5.88%(d) | | | | | | | 250 | | | | 229,578 | |
Industrial & Commercial Bank of China Ltd., 3.20%(d) | | | | | | | 200 | | | | 186,750 | |
ING Groep NV, 3.88%(g) | | | | | | | 1,750 | | | | 1,275,084 | |
Kasikornbank PCL, 5.28%(d) | | | | | | | 200 | | | | 189,225 | |
Nordea Bank Abp, 3.75%(b)(g) | | | | | | | 560 | | | | 432,350 | |
PNC Financial Services Group, Inc., Series V, 6.20%(g) | | | | | | | 290 | | | | 283,402 | |
Rizal Commercial Banking Corp., 6.50%(d) | | | | | | | 200 | | | | 170,225 | |
U.S. Bancorp, 3.70%(g) | | | | | | | 1,665 | | | | 1,361,137 | |
Wells Fargo & Co. | | | | | | | | | | | | |
Series S, 5.90%(g) | | | | | | | 1,500 | | | | 1,343,415 | |
Series U, 5.88% | | | | | | | 384 | | | | 370,560 | |
| | | | | | | | | | | | |
| | | |
| | | | | | | | | | | 5,841,726 | |
| | |
SCHEDULE OF INVESTMENTS | | 95 |
| | |
Schedule of Investments (continued) December 31, 2022 | | BlackRock Limited Duration Income Trust (BLW) (Percentages shown are based on Net Assets) |
| | | | | | | | | | | | |
| Security | | | | | Par (000) | | | Value | |
|
| Capital Markets — 0.5% | |
Bank of New York Mellon Corp., Series I, 3.75%(a)(g)(k) | | | USD | | | | 3,110 | | | $ | 2,504,971 | |
| | | | | | | | | | | | |
|
| Diversified Financial Services(a)(k) — 2.6% | |
Bank of America Corp.(g) | | | | | | | | | | | | |
Series DD, 6.30% | | | | | | | 215 | | | | 213,403 | |
Series X, 6.25% | | | | | | | 1,929 | | | | 1,852,536 | |
Series Z, 6.50% | | | | | | | 143 | | | | 141,045 | |
Barclays PLC | | | | | | | | | | | | |
4.38%(g) | | | | | | | 455 | | | | 346,938 | |
8.00% | | | | | | | 210 | | | | 196,350 | |
BNP Paribas SA, 6.88%(d) | | | EUR | | | | 200 | | | | 211,414 | |
Credit Agricole SA, 4.75%(b)(g) | | | USD | | | | 200 | | | | 160,284 | |
HSBC Holdings PLC(g) | | | | | | | | | | | | |
6.25% | | | | | | | 695 | | | | 678,213 | |
6.00% | | | | | | | 415 | | | | 380,891 | |
JPMorgan Chase & Co.(g) | | | | | | | | | | | | |
Series FF, 5.00% | | | | | | | 2,865 | | | | 2,621,277 | |
Series HH, 4.60% | | | | | | | 253 | | | | 222,956 | |
Lloyds Banking Group PLC, 7.50%(g) | | | | | | | 1,250 | | | | 1,205,884 | |
NatWest Group PLC, 6.00%(g) | | | | | | | 1,185 | | | | 1,094,284 | |
Societe Generale SA, 5.38%(b)(g) | | | | | | | 2,250 | | | | 1,822,808 | |
UBS Group AG, 3.88%(b)(g) | | | | | | | 1,500 | | | | 1,253,477 | |
Woori Bank, 4.25%(d) | | | | | | | 250 | | | | 234,734 | |
| | | | | | | | | | | | |
| | | |
| | | | | | | | | | | 12,636,494 | |
|
| Diversified Telecommunication Services — 0.0% | |
Telefonica Europe BV, 7.13%(a)(d)(k) | | | EUR | | | | 100 | | | | 109,186 | |
| | | | | | | | | | | | |
|
| Electric Utilities(a) — 0.4% | |
Edison International, Series B, 5.00%(k) | | | USD | | | | 175 | | | | 146,291 | |
NextEra Energy Capital Holdings, Inc., 5.65%, 05/01/79(g) | | | | | | | 1,750 | | | | 1,589,358 | |
| | | | | | | | | | | | |
| | | |
| | | | | | | | | | | 1,735,649 | |
|
| Independent Power and Renewable Electricity Producers — 0.1% | |
Vistra Corp., 7.00%(a)(b)(k) | | | | | | | 240 | | | | 218,384 | |
| | | | | | | | | | | | |
| | | |
| Media — 0.0% | | | | | | | | | |
SES SA, 2.88%(a)(d)(k) | | | EUR | | | | 100 | | | | 84,951 | |
| | | | | | | | | | | | |
| | | |
| Oil, Gas & Consumable Fuels — 0.0% | | | | | | | | | |
Abertis Infraestructuras Finance BV, 3.25%(a)(d)(k) | | | | | | | 100 | | | | 90,346 | |
| | | | | | | | | | | | |
| | | |
| Utilities — 0.1% | | | | | | | | | |
Electricite de France SA, 3.00%(a)(d)(k) | | | | | | | 200 | | | | 174,579 | |
| | | | | | | | | | | | |
|
| Wireless Telecommunication Services — 0.0% | |
Vodafone Group PLC,
2.63%, 08/27/80(a)(d) | | | | | | | 100 | | | | 93,842 | |
| | | | | | | | | | | | |
| | | |
| | | | | | | | | | | 23,904,313 | |
| | | | | | | | | | | | |
| | | |
| | | | | | Shares | | | | |
| | | |
| Preferred Stocks — 1.9% | | | | | | | | | |
| | | |
| Banks — 0.0% | | | | | | | | | |
CF-B L2 (D) LLC, (Acquired 04/08/15, Cost: $134,650)(f) | | | | | | | 137,556 | | | | 2,282 | |
| | | | | | | | | | | | |
| | | | | | | | | | | | |
Security | | | | | Shares | | | Value | |
|
| Capital Markets(a)(k) — 1.9% | |
Goldman Sachs Group, Inc., Series J, 5.50% | | | | | | | 202,526 | | | $ | 4,992,266 | |
Morgan Stanley | | | | | | | | | | | | |
Series F, 6.88% | | | | | | | 120,000 | | | | 2,997,600 | |
Series K, 5.90% | | | | | | | 53,253 | | | | 1,225,352 | |
| | | | | | | | | | | | |
| | | |
| | | | | | | | | | | 9,215,218 | |
| | | | | | | | | | | | |
| | | |
| | | | | | | | | | | 9,217,500 | |
| | | | | | | | | | | | |
| |
Total Preferred Securities — 6.9%
(Cost: $37,478,693) | | | | 33,121,813 | |
| | | | | | | | | | | | |
| | | |
| | | | | | Par (000) | | | | |
|
U.S. Government Sponsored Agency Securities | |
|
| Mortgage-Backed Securities — 10.1% | |
Freddie Mac Multifamily Structured Pass Through Certificates, Series K042, Class X1, 1.02%, 12/25/24(a) | | | USD | | | | 32,012 | | | | 538,034 | |
Uniform Mortgage-Backed Securities(q) | | | | | | | | | | | | |
4.00%, 12/01/44 - 01/12/53(g) | | | | | | | 20,507 | | | | 19,415,660 | |
3.50%, 02/25/49 - 04/01/52(g) | | | | | | | 7,420 | | | | 6,802,840 | |
4.50%, 01/12/53 - 02/13/53 | | | | | | | 10,700 | | | | 10,296,068 | |
5.00%, 01/12/53 - 02/13/53 | | | | | | | 12,000 | | | | 11,821,907 | |
| | | | | | | | | | | | |
| | | |
| | | | | | | | | | | 48,874,509 | |
| | | | | | | | | | | | |
| |
Total U.S. Government Sponsored Agency
Securities — 10.1%
(Cost: $50,489,621) | | | | 48,874,509 | |
| | | | | | | | | | | | |
| | | |
U.S. Treasury Obligations | | | | | | | | | | | | |
U.S. Treasury Notes, 3.25%, 08/31/24(g) | | | | | | | 12,500 | | | | 12,239,258 | |
| | | | | | | | | | | | |
| |
Total U.S. Treasury Obligations — 2.5%
(Cost: $12,437,898) | | | | 12,239,258 | |
| | | | | | | | | | | | |
| | | |
| | | | | | Shares | | | | |
| | | |
Warrants | | | | | | | | | | | | |
| | | |
| Consumer Discretionary — 0.0% | | | | | | | | | |
Service King (Carnelian Point), (Expires 06/30/27, Strike Price USD 10.00)(e) | | | | | | | 1,720 | | | | — | |
| | | | | | | | | | | | |
| | | |
| Oil, Gas & Consumable Fuels — 0.0% | | | | | | | | | |
California Resources Corp., (Issued/Exercisable 11/03/20, 1 Share for 1 Warrant, Expires 10/27/24, Strike Price USD 36.00)(e) | | | | | | | 345 | | | | 4,347 | |
| | | | | | | | | | | | |
| |
Total Warrants — 0.0%
(Cost: $ — ) | | | | 4,347 | |
| | | | | | | | | | | | |
| |
Total Long-Term Investments — 159.7%
(Cost: $841,635,290) | | | | 770,691,166 | |
| | | | | | | | | | | | |
| | |
| 96 | | 2 0 2 2 BLACK ROCK ANNUAL REPORT TO SHAREHOLDERS |
| | |
Schedule of Investments (continued) December 31, 2022 | | BlackRock Limited Duration Income Trust (BLW) (Percentages shown are based on Net Assets) |
| | | | | | | | | | | | |
| Security | | | | | Shares | | | Value | |
| |
| | | |
Short-Term Securities | | | | | | | | | | | | |
| | | |
| Money Market Funds — 0.3% | | | | | | | | | |
BlackRock Liquidity Funds, T-Fund, Institutional
Class, 4.03%(r)(s) | | | | | | | 1,474,663 | | | $ | 1,474,663 | |
| | | | | | | | | | | | |
| | | |
| | | | | | Par (000) | | | | |
| |
|
| U.S. Government Sponsored Agency Securities — 0.0% | |
Uniform Mortgage-Backed Securities, 5.00%, 08/01/23 | | | USD | | | | — | (m) | | | 308 | |
| | | | | | | | | | | | |
| |
Total Short-Term Securities — 0.3%
(Cost: $1,474,971) | | | | 1,474,971 | |
| | | | | | | | | | | | |
| |
Total Investments Before TBA Sale Commitments — 160.0%
(Cost: $843,110,261) | | | | 772,166,137 | |
|
TBA Sale Commitments(q) | |
|
| Mortgage-Backed Securities — (0.9)% | |
Uniform Mortgage-Backed Securities | | | | | | | | | |
4.50%, 01/12/53 | | | | | | | (1,900 | ) | | | (1,828,287 | ) |
5.00%, 01/12/53 | | | | | | | (2,400 | ) | | | (2,364,531 | ) |
| | | | | | | | | | | | |
| |
Total TBA Sale Commitments — (0.9)%
(Proceeds: $(4,248,367)) | | | | (4,192,818 | ) |
| | | | | | | | | | | | |
| |
Total Investments, Net of TBA Sale
Commitments — 159.1%
(Cost: $838,861,894) | | | | 767,973,319 | |
Liabilities in Excess of Other Assets — (59.1)% | | | | (285,386,116 | ) |
| | | | | | | | | | | | |
| |
Net Assets — 100.0% | | | $ | 482,587,203 | |
| | | | | | | | | | | | |
| (a) | Variable rate security. Interest rate resets periodically. The rate shown is the effective interest rate as of period end. Security description also includes the reference rate and spread if published and available. |
| (b) | Security exempt from registration pursuant to Rule 144A under the Securities Act of 1933, as amended. These securities may be resold in transactions exempt from registration to qualified institutional investors. |
| (c) | Security is valued using significant unobservable inputs and is classified as Level 3 in the fair value hierarchy. |
| (d) | This security may be resold to qualified foreign investors and foreign institutional buyers under Regulation S of the Securities Act of 1933. |
| (e) | Non-income producing security. |
| (f) | Restricted security as to resale, excluding 144A securities. The Fund held restricted securities with a current value of $2,913, representing less than 0.05% of its net assets as of period end, and an original cost of $235,337. |
| (g) | All or a portion of the security has been pledged as collateral in connection with outstanding reverse repurchase agreements. |
| (h) | Convertible security. |
| (j) | Issuer filed for bankruptcy and/or is in default. |
| (k) | Perpetual security with no stated maturity date. |
| (l) | Payment-in-kind security which may pay interest/dividends in additional par/shares and/or in cash. Rates shown are the current rate and possible payment rates. |
| (m) | Rounds to less than 1,000. |
| (n) | Step-up bond that pays an initial coupon rate for the first period and then a higher coupon rate for the following periods. Rate as of period end. |
| (o) | Represents an unsettled loan commitment at period end. Certain details associated with this purchase are not known prior to the settlement date, including coupon rate. |
| (p) | Other interests represent beneficial interests in liquidation trusts and other reorganization or private entities. |
| (q) | Represents or includes a TBA transaction. |
| (r) | Affiliate of the Fund. |
| (s) | Annualized 7-day yield as of period end. |
For Fund compliance purposes, the Fund’s industry classifications refer to one or more of the industry sub-classifications used by one or more widely recognized market indexes or rating group indexes, and/or as defined by the investment adviser. These definitions may not apply for purposes of this report, which may combine such industry sub-classifications for reporting ease.
Affiliates
Investments in issuers considered to be affiliate(s) of the Fund during the year ended December 31, 2022 for purposes of Section 2(a)(3) of the Investment Company Act of 1940, as amended, were as follows:
| | | | | | | | | | | | | | | | | | | | | | | | | | | | | | | | | | | | |
| | | | | | | | | | |
| Affiliated Issuer | | Value at 12/31/21 | | | Purchases at Cost | | | Proceeds from Sales | | | Net Realized Gain (Loss) | | | Change in Unrealized Appreciation (Depreciation) | | | Value at 12/31/22 | | | Shares Held at 12/31/22 | | | Income | | | Capital Gain Distributions from Underlying Funds | |
| | | | | | | | | |
BlackRock Liquidity Funds, T-Fund, Institutional Class | | $ | 4,969,680 | | | $ | — | | | $ | (3,495,017 | )(a) | | $ | — | | | $ | — | | | $ | 1,474,663 | | | | 1,474,663 | | | $ | 66,945 | | | $ | — | |
| | | | | | | | | | | | | | | | | | | | | | | | | | | | | | | | | | | | |
| | (a) | Represents net amount purchased (sold). | |
Reverse Repurchase Agreements
| | | | | | | | | | | | | | | | | | | | | | | | | | |
| Counterparty | |
| Interest
Rate |
| |
| Trade
Date |
| |
| Maturity
Date |
(a) | | | Face Value | | |
| Face Value
Including Accrued Interest |
| | Type of Non-Cash Underlying Collateral | |
| Remaining
Contractual Maturity
of the Agreements |
(a) |
| | | | | | | |
Credit Agricole Corporate and Investment Bank | | | 4.37 | %(b) | | | 09/12/22 | | | | Open | | | $ | 12,437,500 | | | $ | 12,524,712 | | | U.S. Treasury Obligations | | | Open/Demand | |
Barclays Capital, Inc. | | | 4.75 | (b) | | | 11/09/22 | | | | Open | | | | 142,263 | | | | 143,140 | | | Corporate Bonds | | | Open/Demand | |
Barclays Capital, Inc. | | | 4.75 | (b) | | | 11/09/22 | | | | Open | | | | 199,260 | | | | 200,489 | | | Corporate Bonds | | | Open/Demand | |
Barclays Capital, Inc. | | | 4.75 | (b) | | | 11/09/22 | | | | Open | | | | 39,401 | | | | 39,644 | | | Corporate Bonds | | | Open/Demand | |
Barclays Capital, Inc. | | | 4.75 | (b) | | | 11/09/22 | | | | Open | | | | 808,350 | | | | 813,335 | | | Corporate Bonds | | | Open/Demand | |
BNP Paribas S.A. | | | 4.70 | (b) | | | 11/09/22 | | | | Open | | | | 193,903 | | | | 195,084 | | | Corporate Bonds | | | Open/Demand | |
BNP Paribas S.A. | | | 4.80 | (b) | | | 11/09/22 | | | | Open | | | | 345,881 | | | | 348,039 | | | Corporate Bonds | | | Open/Demand | |
| | |
SCHEDULE OF INVESTMENTS | | 97 |
| | |
Schedule of Investments (continued) December 31, 2022 | | BlackRock Limited Duration Income Trust (BLW) |
Reverse Repurchase Agreements (continued)
| | | | | | | | | | | | | | | | | | | | | | | | | | |
| | | | | | | | |
| Counterparty | |
| Interest
Rate |
| |
| Trade
Date |
| |
| Maturity
Date |
(a) | | | Face Value | | |
| Face Value
Including Accrued Interest |
| | Type of Non-Cash Underlying Collateral | |
| Remaining
Contractual Maturity of the Agreements |
(a) |
| | | | | | | |
BNP Paribas S.A | | | 4.80 | %(b) | | | 11/09/22 | | | | Open | | | $ | 5,066,770 | | | $ | 5,098,381 | | | Corporate Bonds | | | Open/Demand | |
BNP Paribas S.A | | | 4.80 | (b) | | | 11/09/22 | | | | Open | | | | 1,036,017 | | | | 1,042,481 | | | Corporate Bonds | | | Open/Demand | |
BNP Paribas S.A | | | 4.80 | (b) | | | 11/09/22 | | | | Open | | | | 854,295 | | | | 859,625 | | | Corporate Bonds | | | Open/Demand | |
BNP Paribas S.A | | | 4.80 | (b) | | | 11/09/22 | | | | Open | | | | 320,160 | | | | 322,157 | | | Corporate Bonds | | | Open/Demand | |
Credit Agricole Corporate and Investment Bank | | | 4.50 | (b) | | | 11/09/22 | | | | Open | | | | 1,044,549 | | | | 1,050,613 | | | Corporate Bonds | | | Open/Demand | |
Credit Agricole Corporate and Investment Bank | | | 4.55 | (b) | | | 11/09/22 | | | | Open | | | | 125,269 | | | | 126,005 | | | Corporate Bonds | | | Open/Demand | |
Credit Agricole Corporate and Investment Bank | | | 4.55 | (b) | | | 11/09/22 | | | | Open | | | | 77,398 | | | | 77,852 | | | Corporate Bonds | | | Open/Demand | |
Credit Agricole Corporate and Investment Bank | | | 4.59 | (b) | | | 11/09/22 | | | | Open | | | | 334,375 | | | | 336,360 | | | Corporate Bonds | | | Open/Demand | |
HSBC Securities (USA), Inc. | | | 4.50 | (b) | | | 11/09/22 | | | | Open | | | | 751,150 | | | | 755,511 | | | Corporate Bonds | | | Open/Demand | |
HSBC Securities (USA), Inc. | | | 4.50 | (b) | | | 11/09/22 | | | | Open | | | | 445,560 | | | | 448,147 | | | Corporate Bonds | | | Open/Demand | |
HSBC Securities (USA), Inc. | | | 4.50 | (b) | | | 11/09/22 | | | | Open | | | | 534,000 | | | | 537,100 | | | Corporate Bonds | | | Open/Demand | |
Nomura Securities International, Inc. | | | 4.48 | (b) | | | 11/09/22 | | | | Open | | | | 1,426,875 | | | | 1,435,118 | | | Corporate Bonds | | | Open/Demand | |
Nomura Securities International, Inc. | | | 4.48 | (b) | | | 11/09/22 | | | | Open | | | | 393,125 | | | | 395,396 | | | Corporate Bonds | | | Open/Demand | |
Nomura Securities International, Inc. | | | 4.48 | (b) | | | 11/09/22 | | | | Open | | | | 192,075 | | | | 193,185 | | | Corporate Bonds | | | Open/Demand | |
RBC Capital Markets LLC | | | 4.50 | (b) | | | 11/09/22 | | | | Open | | | | 220,150 | | | | 221,428 | | | Corporate Bonds | | | Open/Demand | |
RBC Capital Markets LLC | | | 4.50 | (b) | | | 11/09/22 | | | | Open | | | | 444,244 | | | | 446,823 | | | Corporate Bonds | | | Open/Demand | |
RBC Capital Markets LLC | | | 4.50 | (b) | | | 11/09/22 | | | | Open | | | | 210,240 | | | | 211,461 | | | Corporate Bonds | | | Open/Demand | |
RBC Capital Markets LLC | | | 4.50 | (b) | | | 11/09/22 | | | | Open | | | | 509,906 | | | | 512,867 | | | Corporate Bonds | | | Open/Demand | |
RBC Capital Markets LLC | | | 4.63 | (b) | | | 11/09/22 | | | | Open | | | | 141,250 | | | | 142,097 | | | Corporate Bonds | | | Open/Demand | |
RBC Capital Markets LLC | | | 4.65 | (b) | | | 11/09/22 | | | | Open | | | | 268,153 | | | | 269,767 | | | Corporate Bonds | | | Open/Demand | |
RBC Capital Markets LLC | | | 4.65 | (b) | | | 11/09/22 | | | | Open | | | | 724,487 | | | | 728,851 | | | Corporate Bonds | | | Open/Demand | |
RBC Capital Markets LLC | | | 4.65 | (b) | | | 11/09/22 | | | | Open | | | | 429,907 | | | | 432,496 | | | Corporate Bonds | | | Open/Demand | |
TD Securities (USA) LLC | | | 4.49 | (b) | | | 11/09/22 | | | | Open | | | | 1,506,431 | | | | 1,515,155 | | | Corporate Bonds | | | Open/Demand | |
TD Securities (USA) LLC | | | 4.49 | (b) | | | 11/09/22 | | | | Open | | | | 354,954 | | | | 357,009 | | | Corporate Bonds | | | Open/Demand | |
TD Securities (USA) LLC | | | 4.49 | (b) | | | 11/09/22 | | | | Open | | | | 416,512 | | | | 418,925 | | | Corporate Bonds | | | Open/Demand | |
TD Securities (USA) LLC | | | 4.49 | (b) | | | 11/09/22 | | | | Open | | | | 238,950 | | | | 240,334 | | | Corporate Bonds | | | Open/Demand | |
TD Securities (USA) LLC | | | 4.49 | (b) | | | 11/09/22 | | | | Open | | | | 239,050 | | | | 240,434 | | | Corporate Bonds | | | Open/Demand | |
TD Securities (USA) LLC | | | 4.49 | (b) | | | 11/09/22 | | | | Open | | | | 577,752 | | | | 581,098 | | | Corporate Bonds | | | Open/Demand | |
TD Securities (USA) LLC | | | 4.49 | (b) | | | 11/09/22 | | | | Open | | | | 748,720 | | | | 753,056 | | | Corporate Bonds | | | Open/Demand | |
TD Securities (USA) LLC | | | 4.49 | (b) | | | 11/09/22 | | | | Open | | | | 451,082 | | | | 453,695 | | | Corporate Bonds | | | Open/Demand | |
HSBC Securities (USA), Inc. | | | 4.24 | | | | 11/10/22 | | | | 01/12/23 | | | | 9,706,684 | | | | 9,761,560 | | | U.S. Government Sponsored Agency Securities | | | Up to 30 Days | |
HSBC Securities (USA), Inc. | | | 4.24 | | | | 11/10/22 | | | | 01/12/23 | | | | 1,422,310 | | | | 1,430,351 | | | U.S. Government Sponsored Agency Securities | | | Up to 30 Days | |
HSBC Securities (USA), Inc. | | | 4.24 | | | | 11/10/22 | | | | 01/12/23 | | | | 1,503,361 | | | | 1,511,860 | | | U.S. Government Sponsored Agency Securities | | | Up to 30 Days | |
HSBC Securities (USA), Inc. | | | 4.24 | | | | 11/10/22 | | | | 01/12/23 | | | | 1,529,961 | | | | 1,538,610 | | | U.S. Government Sponsored Agency Securities | | | Up to 30 Days | |
HSBC Securities (USA), Inc. | | | 4.24 | | | | 11/10/22 | | | | 01/12/23 | | | | 5,906,598 | | | | 5,939,990 | | | U.S. Government Sponsored Agency Securities | | | Up to 30 Days | |
Credit Agricole Corporate and Investment Bank | | | 4.57 | (b) | | | 11/10/22 | | | | Open | | | | 693,499 | | | | 697,281 | | | Corporate Bonds | | | Open/Demand | |
Nomura Securities International, Inc. | | | 4.35 | (b) | | | 11/14/22 | | | | Open | | | | 737,019 | | | | 740,744 | | | Corporate Bonds | | | Open/Demand | |
RBC Capital Markets LLC | | | 4.63 | (b) | | | 11/14/22 | | | | Open | | | | 563,200 | | | | 566,252 | | | Corporate Bonds | | | Open/Demand | |
RBC Capital Markets LLC | | | 4.65 | (b) | | | 11/14/22 | | | | Open | | | | 396,506 | | | | 398,666 | | | Corporate Bonds | | | Open/Demand | |
Barclays Capital, Inc. | | | 4.50 | (b) | | | 11/16/22 | | | | Open | | | | 667,535 | | | | 670,891 | | | Corporate Bonds | | | Open/Demand | |
Barclays Capital, Inc. | | | 4.55 | (b) | | | 11/16/22 | | | | Open | | | | 503,851 | | | | 506,416 | | | Corporate Bonds | | | Open/Demand | |
Barclays Capital, Inc. | | | 4.75 | (b) | | | 11/16/22 | | | | Open | | | | 396,839 | | | | 398,958 | | | Corporate Bonds | | | Open/Demand | |
Barclays Capital, Inc. | | | 4.75 | (b) | | | 11/16/22 | | | | Open | | | | 700,096 | | | | 703,835 | | | Corporate Bonds | | | Open/Demand | |
Barclays Capital, Inc. | | | 4.75 | (b) | | | 11/16/22 | | | | Open | | | | 256,960 | | | | 258,332 | | | Corporate Bonds | | | Open/Demand | |
BNP Paribas S.A | | | 4.60 | (b) | | | 11/16/22 | | | | Open | | | | 242,190 | | | | 243,438 | | | Corporate Bonds | | | Open/Demand | |
BNP Paribas S.A | | | 4.80 | (b) | | | 11/16/22 | | | | Open | | | | 434,350 | | | | 436,697 | | | Corporate Bonds | | | Open/Demand | |
BNP Paribas S.A | | | 4.80 | (b) | | | 11/16/22 | | | | Open | | | | 427,461 | | | | 429,771 | | | Corporate Bonds | | | Open/Demand | |
BNP Paribas S.A | | | 4.85 | (b) | | | 11/16/22 | | | | Open | | | | 82,748 | | | | 83,200 | | | Corporate Bonds | | | Open/Demand | |
Credit Agricole Corporate and Investment Bank | | | 4.55 | (b) | | | 11/16/22 | | | | Open | | | | 207,803 | | | | 208,860 | | | Corporate Bonds | | | Open/Demand | |
Credit Suisse Securities (USA) LLC | | | (1.75 | )(b) | | | 11/16/22 | | | | Open | | | | 73,775 | | | | 73,570 | | | Corporate Bonds | | | Open/Demand | |
RBC Capital Markets LLC | | | 4.50 | (b) | | | 11/16/22 | | | | Open | | | | 807,840 | | | | 811,902 | | | Corporate Bonds | | | Open/Demand | |
| | |
| 98 | | 2 0 2 2 BLACK ROCK ANNUAL REPORT TO SHAREHOLDERS |
| | |
Schedule of Investments (continued) December 31, 2022 | | BlackRock Limited Duration Income Trust (BLW) |
Reverse Repurchase Agreements (continued)
| | | | | | | | | | | | | | | | | | | | | | | | | | |
| | | | | | | | |
| Counterparty | |
| Interest
Rate |
| |
| Trade
Date |
| |
| Maturity
Date |
(a) | | | Face Value | | |
| Face Value
Including Accrued Interest |
| | Type of Non-Cash Underlying Collateral | |
| Remaining
Contractual Maturity of the Agreements |
(a) |
| | | | | | | |
RBC Capital Markets LLC | | | 4.63 | %(b) | | | 11/16/22 | | | | Open | | | $ | 950,802 | | | $ | 955,737 | | | Corporate Bonds | | | Open/Demand | |
RBC Capital Markets LLC | | | 4.65 | (b) | | | 11/16/22 | | | | Open | | | | 129,634 | | | | 130,310 | | | Corporate Bonds | | | Open/Demand | |
RBC Capital Markets LLC | | | 4.65 | (b) | | | 11/16/22 | | | | Open | | | | 202,751 | | | | 203,809 | | | Corporate Bonds | | | Open/Demand | |
RBC Capital Markets LLC | | | 4.65 | (b) | | | 11/16/22 | | | | Open | | | | 342,540 | | | | 344,326 | | | Corporate Bonds | | | Open/Demand | |
RBC Capital Markets LLC | | | 4.65 | (b) | | | 11/16/22 | | | | Open | | | | 180,600 | | | | 181,542 | | | Corporate Bonds | | | Open/Demand | |
RBC Capital Markets LLC | | | 4.65 | (b) | | | 11/16/22 | | | | Open | | | | 163,443 | | | | 164,295 | | | Corporate Bonds | | | Open/Demand | |
RBC Capital Markets LLC | | | 4.65 | (b) | | | 11/16/22 | | | | Open | | | | 72,573 | | | | 72,951 | | | Corporate Bonds | | | Open/Demand | |
RBC Capital Markets LLC | | | 4.65 | (b) | | | 11/16/22 | | | | Open | | | | 379,952 | | | | 381,934 | | | Corporate Bonds | | | Open/Demand | |
Barclays Capital, Inc. | | | 4.75 | (b) | | | 11/23/22 | | | | Open | | | | 291,555 | | | | 292,837 | | | Corporate Bonds | | | Open/Demand | |
BNP Paribas S.A. | | | 4.73 | (b) | | | 11/23/22 | | | | Open | | | | 940,144 | | | | 944,257 | | | Corporate Bonds | | | Open/Demand | |
RBC Capital Markets LLC | | | 4.50 | (b) | | | 11/28/22 | | | | Open | | | | 608,915 | | | | 611,165 | | | Corporate Bonds | | | Open/Demand | |
RBC Capital Markets LLC | | | 4.65 | (b) | | | 11/28/22 | | | | Open | | | | 529,685 | | | | 531,715 | | | Corporate Bonds | | | Open/Demand | |
RBC Capital Markets LLC | | | 4.65 | (b) | | | 11/28/22 | | | | Open | | | | 638,250 | | | | 640,696 | | | Corporate Bonds | | | Open/Demand | |
Barclays Bank PLC | | | 4.50 | (b) | | | 11/29/22 | | | | Open | | | | 817,875 | | | | 820,806 | | | Corporate Bonds | | | Open/Demand | |
Barclays Bank PLC | | | 4.50 | (b) | | | 11/29/22 | | | | Open | | | | 442,500 | | | | 444,086 | | | Corporate Bonds | | | Open/Demand | |
Barclays Bank PLC | | | 4.50 | (b) | | | 11/29/22 | | | | Open | | | | 456,000 | | | | 457,634 | | | Corporate Bonds | | | Open/Demand | |
Barclays Bank PLC | | | 4.55 | (b) | | | 11/29/22 | | | | Open | | | | 278,281 | | | | 279,291 | | | Foreign Agency Obligations | | | Open/Demand | |
Barclays Bank PLC | | | 4.55 | (b) | | | 11/29/22 | | | | Open | | | | 172,235 | | | | 172,860 | | | Foreign Agency Obligations | | | Open/Demand | |
Barclays Bank PLC | | | 4.55 | (b) | | | 11/29/22 | | | | Open | | | | 394,100 | | | | 395,530 | | | Capital Trusts | | | Open/Demand | |
Barclays Bank PLC | | | 4.55 | (b) | | | 11/29/22 | | | | Open | | | | 570,769 | | | | 572,839 | | | Capital Trusts | | | Open/Demand | |
Barclays Bank PLC | | | 4.55 | (b) | | | 11/29/22 | | | | Open | | | | 1,422,637 | | | | 1,427,799 | | | Capital Trusts | | | Open/Demand | |
Barclays Bank PLC | | | 4.55 | (b) | | | 11/29/22 | | | | Open | | | | 1,737,500 | | | | 1,743,803 | | | Capital Trusts | | | Open/Demand | |
Barclays Bank PLC | | | 4.55 | (b) | | | 11/29/22 | | | | Open | | | | 1,148,437 | | | | 1,152,604 | | | Capital Trusts | | | Open/Demand | |
Barclays Bank PLC | | | 4.55 | (b) | | | 11/29/22 | | | | Open | | | | 439,375 | | | | 440,969 | | | Corporate Bonds | | | Open/Demand | |
Barclays Bank PLC | | | 4.55 | (b) | | | 11/29/22 | | | | Open | | | | 62,114 | | | | 62,339 | | | Corporate Bonds | | | Open/Demand | |
Barclays Bank PLC | | | 4.75 | (b) | | | 11/29/22 | | | | Open | | | | 2,559,375 | | | | 2,569,115 | | | Corporate Bonds | | | Open/Demand | |
Barclays Bank PLC | | | 4.75 | (b) | | | 11/29/22 | | | | Open | | | | 281,050 | | | | 282,120 | | | Capital Trusts | | | Open/Demand | |
Barclays Bank PLC | | | 4.75 | (b) | | | 11/29/22 | | | | Open | | | | 322,875 | | | | 324,104 | | | Corporate Bonds | | | Open/Demand | |
Barclays Bank PLC | | | 4.75 | (b) | | | 11/29/22 | | | | Open | | | | 507,812 | | | | 509,745 | | | Corporate Bonds | | | Open/Demand | |
Barclays Bank PLC | | | 4.75 | (b) | | | 11/29/22 | | | | Open | | | | 876,900 | | | | 880,237 | | | Capital Trusts | | | Open/Demand | |
Barclays Bank PLC | | | 4.75 | (b) | | | 11/29/22 | | | | Open | | | | 1,071,875 | | | | 1,075,954 | | | Capital Trusts | | | Open/Demand | |
Barclays Bank PLC | | | 4.75 | (b) | | | 11/29/22 | | | | Open | | | | 1,064,200 | | | | 1,068,250 | | | Corporate Bonds | | | Open/Demand | |
Barclays Capital, Inc. | | | (1.75 | )(b) | | | 11/29/22 | | | | Open | | | | 206,644 | | | | 206,322 | | | Corporate Bonds | | | Open/Demand | |
Barclays Capital, Inc. | | | 4.55 | (b) | | | 11/29/22 | | | | Open | | | | 131,024 | | | | 131,499 | | | Capital Trusts | | | Open/Demand | |
Barclays Capital, Inc. | | | 4.55 | (b) | | | 11/29/22 | | | | Open | | | | 500,120 | | | | 501,934 | | | Corporate Bonds | | | Open/Demand | |
Barclays Capital, Inc. | | | 4.55 | (b) | | | 11/29/22 | | | | Open | | | | 208,409 | | | | 209,165 | | | Capital Trusts | | | Open/Demand | |
Barclays Capital, Inc. | | | 4.55 | (b) | | | 11/29/22 | | | | Open | | | | 774,090 | | | | 776,898 | | | Corporate Bonds | | | Open/Demand | |
Barclays Capital, Inc. | | | 4.55 | (b) | | | 11/29/22 | | | | Open | | | | 271,825 | | | | 272,811 | | | Capital Trusts | | | Open/Demand | |
Barclays Capital, Inc. | | | 4.55 | (b) | | | 11/29/22 | | | | Open | | | | 31,657 | | | | 31,772 | | | Corporate Bonds | | | Open/Demand | |
Barclays Capital, Inc. | | | 4.55 | (b) | | | 11/29/22 | | | | Open | | | | 225,298 | | | | 226,115 | | | Corporate Bonds | | | Open/Demand | |
Barclays Capital, Inc. | | | 4.55 | (b) | | | 11/29/22 | | | | Open | | | | 198,069 | | | | 198,787 | | | Capital Trusts | | | Open/Demand | |
Barclays Capital, Inc. | | | 4.55 | (b) | | | 11/29/22 | | | | Open | | | | 547,150 | | | | 549,135 | | | Corporate Bonds | | | Open/Demand | |
Barclays Capital, Inc. | | | 4.70 | (b) | | | 11/29/22 | | | | Open | | | | 104,370 | | | | 104,763 | | | Corporate Bonds | | | Open/Demand | |
Barclays Capital, Inc. | | | 4.70 | (b) | | | 11/29/22 | | | | Open | | | | 287,933 | | | | 289,015 | | | Corporate Bonds | | | Open/Demand | |
Barclays Capital, Inc. | | | 4.75 | (b) | | | 11/29/22 | | | | Open | | | | 208,680 | | | | 209,474 | | | Corporate Bonds | | | Open/Demand | |
Barclays Capital, Inc. | | | 4.75 | (b) | | | 11/29/22 | | | | Open | | | | 380,239 | | | | 381,686 | | | Corporate Bonds | | | Open/Demand | |
Barclays Capital, Inc. | | | 4.75 | (b) | | | 11/29/22 | | | | Open | | | | 312,585 | | | | 313,775 | | | Corporate Bonds | | | Open/Demand | |
Barclays Capital, Inc. | | | 4.75 | (b) | | | 11/29/22 | | | | Open | | | | 385,687 | | | | 387,155 | | | Corporate Bonds | | | Open/Demand | |
Barclays Capital, Inc. | | | 4.75 | (b) | | | 11/29/22 | | | | Open | | | | 151,500 | | | | 152,077 | | | Corporate Bonds | | | Open/Demand | |
Barclays Capital, Inc. | | | 4.75 | (b) | | | 11/29/22 | | | | Open | | | | 260,074 | | | | 261,063 | | | Corporate Bonds | | | Open/Demand | |
Barclays Capital, Inc. | | | 4.75 | (b) | | | 11/29/22 | | | | Open | | | | 553,324 | | | | 555,429 | | | Corporate Bonds | | | Open/Demand | |
Barclays Capital, Inc. | | | 4.75 | (b) | | | 11/29/22 | | | | Open | | | | 285,175 | | | | 286,260 | | | Corporate Bonds | | | Open/Demand | |
Barclays Capital, Inc. | | | 4.75 | (b) | | | 11/29/22 | | | | Open | | | | 317,500 | | | | 318,708 | | | Corporate Bonds | | | Open/Demand | |
Barclays Capital, Inc. | | | 4.75 | (b) | | | 11/29/22 | | | | Open | | | | 329,700 | | | | 330,955 | | | Corporate Bonds | | | Open/Demand | |
Barclays Capital, Inc. | | | 4.75 | (b) | | | 11/29/22 | | | | Open | | | | 143,550 | | | | 144,096 | | | Corporate Bonds | | | Open/Demand | |
Barclays Capital, Inc. | | | 4.75 | (b) | | | 11/29/22 | | | | Open | | | | 555,555 | | | | 557,669 | | | Corporate Bonds | | | Open/Demand | |
Barclays Capital, Inc. | | | 4.75 | (b) | | | 11/29/22 | | | | Open | | | | 338,530 | | | | 339,818 | | | Corporate Bonds | | | Open/Demand | |
Barclays Capital, Inc. | | | 4.75 | (b) | | | 11/29/22 | | | | Open | | | | 465,370 | | | | 467,141 | | | Corporate Bonds | | | Open/Demand | |
Barclays Capital, Inc. | | | 4.75 | (b) | | | 11/29/22 | | | | Open | | | | 808,322 | | | | 811,399 | | | Corporate Bonds | | | Open/Demand | |
Barclays Capital, Inc. | | | 4.75 | (b) | | | 11/29/22 | | | | Open | | | | 142,240 | | | | 142,781 | | | Corporate Bonds | | | Open/Demand | |
Barclays Capital, Inc. | | | 4.75 | (b) | | | 11/29/22 | | | | Open | | | | 200,661 | | | | 201,425 | | | Corporate Bonds | | | Open/Demand | |
Barclays Capital, Inc. | | | 4.75 | (b) | | | 11/29/22 | | | | Open | | | | 1,050,881 | | | | 1,054,880 | | | Corporate Bonds | | | Open/Demand | |
| | |
SCHEDULE OF INVESTMENTS | | 99 |
| | |
Schedule of Investments (continued) December 31, 2022 | | BlackRock Limited Duration Income Trust (BLW) |
Reverse Repurchase Agreements (continued)
| | | | | | | | | | | | | | | | | | | | | | | | | | |
| | | | | | | | |
| Counterparty | |
| Interest
Rate |
| |
| Trade
Date |
| |
| Maturity
Date |
(a) | | | Face Value | | |
| Face Value
Including Accrued Interest |
| | Type of Non-Cash Underlying Collateral | |
| Remaining
Contractual Maturity of the Agreements |
(a) |
| | | | | | | |
Barclays Capital, Inc. | | | 4.75 | %(b) | | | 11/29/22 | | | | Open | | | $ | 433,637 | | | $ | 435,288 | | | Corporate Bonds | | | Open/Demand | |
Barclays Capital, Inc. | | | 4.75 | (b) | | | 11/29/22 | | | | Open | | | | 124,800 | | | | 125,275 | | | Corporate Bonds | | | Open/Demand | |
Barclays Capital, Inc. | | | 4.75 | (b) | | | 11/29/22 | | | | Open | | | | 1,110,469 | | | | 1,114,695 | | | Corporate Bonds | | | Open/Demand | |
Barclays Capital, Inc. | | | 4.75 | (b) | | | 11/29/22 | | | | Open | | | | 141,738 | | | | 142,277 | | | Corporate Bonds | | | Open/Demand | |
Barclays Capital, Inc. | | | 4.75 | (b) | | | 11/29/22 | | | | Open | | | | 680,074 | | | | 682,662 | | | Corporate Bonds | | | Open/Demand | |
Barclays Capital, Inc. | | | 4.75 | (b) | | | 11/29/22 | | | | Open | | | | 534,060 | | | | 536,092 | | | Corporate Bonds | | | Open/Demand | |
Barclays Capital, Inc. | | | 4.75 | (b) | | | 11/29/22 | | | | Open | | | | 513,590 | | | | 515,544 | | | Corporate Bonds | | | Open/Demand | |
Barclays Capital, Inc. | | | 4.75 | (b) | | | 11/29/22 | | | | Open | | | | 686,594 | | | | 689,207 | | | Capital Trusts | | | Open/Demand | |
Barclays Capital, Inc. | | | 4.75 | (b) | | | 11/29/22 | | | | Open | | | | 229,856 | | | | 230,731 | | | Corporate Bonds | | | Open/Demand | |
Barclays Capital, Inc. | | | 4.75 | (b) | | | 11/29/22 | | | | Open | | | | 228,883 | | | | 229,754 | | | Corporate Bonds | | | Open/Demand | |
Barclays Capital, Inc. | | | 4.75 | (b) | | | 11/29/22 | | | | Open | | | | 968,540 | | | | 972,226 | | | Corporate Bonds | | | Open/Demand | |
Barclays Capital, Inc. | | | 4.75 | (b) | | | 11/29/22 | | | | Open | | | | 309,760 | | | | 310,939 | | | Corporate Bonds | | | Open/Demand | |
Barclays Capital, Inc. | | | 4.75 | (b) | | | 11/29/22 | | | | Open | | | | 36,915 | | | | 37,055 | | | Corporate Bonds | | | Open/Demand | |
Barclays Capital, Inc. | | | 4.75 | (b) | | | 11/29/22 | | | | Open | | | | 187,059 | | | | 187,771 | | | Corporate Bonds | | | Open/Demand | |
Barclays Capital, Inc. | | | 4.75 | (b) | | | 11/29/22 | | | | Open | | | | 559,446 | | | | 561,575 | | | Corporate Bonds | | | Open/Demand | |
Barclays Capital, Inc. | | | 4.75 | (b) | | | 11/29/22 | | | | Open | | | | 494,092 | | | | 495,973 | | | Corporate Bonds | | | Open/Demand | |
Barclays Capital, Inc. | | | 4.75 | (b) | | | 11/29/22 | | | | Open | | | | 173,750 | | | | 174,411 | | | Corporate Bonds | | | Open/Demand | |
Barclays Capital, Inc. | | | 4.75 | (b) | | | 11/29/22 | | | | Open | | | | 148,096 | | | | 148,660 | | | Corporate Bonds | | | Open/Demand | |
Barclays Capital, Inc. | | | 4.75 | (b) | | | 11/29/22 | | | | Open | | | | 497,736 | | | | 499,630 | | | Corporate Bonds | | | Open/Demand | |
BNP Paribas S.A. | | | 4.53 | (b) | | | 11/29/22 | | | | Open | | | | 2,274,187 | | | | 2,282,397 | | | Capital Trusts | | | Open/Demand | |
BNP Paribas S.A. | | | 4.53 | (b) | | | 11/29/22 | | | | Open | | | | 1,225,856 | | | | 1,230,282 | | | Capital Trusts | | | Open/Demand | |
BNP Paribas S.A. | | | 4.54 | (b) | | | 11/29/22 | | | | Open | | | | 208,075 | | | | 208,828 | | | Corporate Bonds | | | Open/Demand | |
BNP Paribas S.A. | | | 4.56 | (b) | | | 11/29/22 | | | | Open | | | | 510,250 | | | | 512,106 | | | Corporate Bonds | | | Open/Demand | |
BNP Paribas S.A. | | | 4.65 | (b) | | | 11/29/22 | | | | Open | | | | 563,625 | | | | 565,720 | | | Corporate Bonds | | | Open/Demand | |
BNP Paribas S.A. | | | 4.65 | (b) | | | 11/29/22 | | | | Open | | | | 476,962 | | | | 478,735 | | | Corporate Bonds | | | Open/Demand | |
BNP Paribas S.A. | | | 4.65 | (b) | | | 11/29/22 | | | | Open | | | | 601,944 | | | | 604,181 | | | Corporate Bonds | | | Open/Demand | |
BNP Paribas S.A. | | | 4.65 | (b) | | | 11/29/22 | | | | Open | | | | 486,392 | | | | 488,200 | | | Corporate Bonds | | | Open/Demand | |
BNP Paribas S.A. | | | 4.65 | (b) | | | 11/29/22 | | | | Open | | | | 613,305 | | | | 615,584 | | | Corporate Bonds | | | Open/Demand | |
BNP Paribas S.A. | | | 4.65 | (b) | | | 11/29/22 | | | | Open | | | | 493,652 | | | | 495,487 | | | Corporate Bonds | | | Open/Demand | |
BNP Paribas S.A. | | | 4.65 | (b) | | | 11/29/22 | | | | Open | | | | 96,425 | | | | 96,783 | | | Corporate Bonds | | | Open/Demand | |
BNP Paribas S.A. | | | 4.68 | (b) | | | 11/29/22 | | | | Open | | | | 332,456 | | | | 333,701 | | | Corporate Bonds | | | Open/Demand | |
BNP Paribas S.A. | | | 4.68 | (b) | | | 11/29/22 | | | | Open | | | | 374,884 | | | | 376,287 | | | Corporate Bonds | | | Open/Demand | |
BNP Paribas S.A. | | | 4.68 | (b) | | | 11/29/22 | | | | Open | | | | 339,412 | | | | 340,683 | | | Corporate Bonds | | | Open/Demand | |
BNP Paribas S.A. | | | 4.68 | (b) | | | 11/29/22 | | | | Open | | | | 316,988 | | | | 318,174 | | | Corporate Bonds | | | Open/Demand | |
BNP Paribas S.A. | | | 4.68 | (b) | | | 11/29/22 | | | | Open | | | | 404,002 | | | | 405,515 | | | Corporate Bonds | | | Open/Demand | |
BNP Paribas S.A. | | | 4.68 | (b) | | | 11/29/22 | | | | Open | | | | 393,937 | | | | 395,412 | | | Corporate Bonds | | | Open/Demand | |
BNP Paribas S.A. | | | 4.68 | (b) | | | 11/29/22 | | | | Open | | | | 342,370 | | | | 343,652 | | | Corporate Bonds | | | Open/Demand | |
BNP Paribas S.A. | | | 4.68 | (b) | | | 11/29/22 | | | | Open | | | | 345,470 | | | | 346,763 | | | Corporate Bonds | | | Open/Demand | |
BNP Paribas S.A. | | | 4.68 | (b) | | | 11/29/22 | | | | Open | | | | 394,412 | | | | 395,889 | | | Corporate Bonds | | | Open/Demand | |
BNP Paribas S.A. | | | 4.68 | (b) | | | 11/29/22 | | | | Open | | | | 347,762 | | | | 349,064 | | | Corporate Bonds | | | Open/Demand | |
BNP Paribas S.A. | | | 4.68 | (b) | | | 11/29/22 | | | | Open | | | | 716,479 | | | | 719,161 | | | Corporate Bonds | | | Open/Demand | |
BNP Paribas S.A. | | | 4.68 | (b) | | | 11/29/22 | | | | Open | | | | 294,000 | | | | 295,101 | | | Corporate Bonds | | | Open/Demand | |
BNP Paribas S.A. | | | 4.68 | (b) | | | 11/29/22 | | | | Open | | | | 315,348 | | | | 316,528 | | | Corporate Bonds | | | Open/Demand | |
BNP Paribas S.A. | | | 4.70 | (b) | | | 11/29/22 | | | | Open | | | | 296,079 | | | | 297,192 | | | Corporate Bonds | | | Open/Demand | |
BNP Paribas S.A. | | | 4.70 | (b) | | | 11/29/22 | | | | Open | | | | 490,342 | | | | 492,187 | | | Corporate Bonds | | | Open/Demand | |
BNP Paribas S.A. | | | 4.70 | (b) | | | 11/29/22 | | | | Open | | | | 380,725 | | | | 382,157 | | | Corporate Bonds | | | Open/Demand | |
BNP Paribas S.A. | | | 4.70 | (b) | | | 11/29/22 | | | | Open | | | | 249,200 | | | | 250,137 | | | Corporate Bonds | | | Open/Demand | |
BNP Paribas S.A. | | | 4.70 | (b) | | | 11/29/22 | | | | Open | | | | 728,000 | | | | 730,738 | | | Corporate Bonds | | | Open/Demand | |
BNP Paribas S.A. | | | 4.70 | (b) | | | 11/29/22 | | | | Open | | | | 573,750 | | | | 575,908 | | | Corporate Bonds | | | Open/Demand | |
BNP Paribas S.A. | | | 4.70 | (b) | | | 11/29/22 | | | | Open | | | | 446,219 | | | | 447,897 | | | Corporate Bonds | | | Open/Demand | |
BNP Paribas S.A. | | | 4.70 | (b) | | | 11/29/22 | | | | Open | | | | 1,589,062 | | | | 1,595,039 | | | Capital Trusts | | | Open/Demand | |
BNP Paribas S.A. | | | 4.70 | (b) | | | 11/29/22 | | | | Open | | | | 1,082,812 | | | | 1,086,885 | | | Capital Trusts | | | Open/Demand | |
BNP Paribas S.A. | | | 4.70 | (b) | | | 11/29/22 | | | | Open | | | | 907,100 | | | | 910,512 | | | Corporate Bonds | | | Open/Demand | |
BNP Paribas S.A. | | | 4.70 | (b) | | | 11/29/22 | | | | Open | | | | 3,276,000 | | | | 3,288,321 | | | Corporate Bonds | | | Open/Demand | |
BNP Paribas S.A. | | | 4.70 | (b) | | | 11/29/22 | | | | Open | | | | 439,285 | | | | 440,937 | | | Corporate Bonds | | | Open/Demand | |
BNP Paribas S.A. | | | 4.70 | (b) | | | 11/29/22 | | | | Open | | | | 165,938 | | | | 166,562 | | | Corporate Bonds | | | Open/Demand | |
BNP Paribas S.A. | | | 4.70 | (b) | | | 11/29/22 | | | | Open | | | | 558,060 | | | | 560,159 | | | Corporate Bonds | | | Open/Demand | |
BNP Paribas S.A. | | | 4.73 | (b) | | | 11/29/22 | | | | Open | | | | 432,845 | | | | 434,485 | | | Corporate Bonds | | | Open/Demand | |
BNP Paribas S.A. | | | 4.73 | (b) | | | 11/29/22 | | | | Open | | | | 509,906 | | | | 511,838 | | | Corporate Bonds | | | Open/Demand | |
BNP Paribas S.A. | | | 4.73 | (b) | | | 11/29/22 | | | | Open | | | | 623,407 | | | | 625,769 | | | Corporate Bonds | | | Open/Demand | |
BNP Paribas S.A. | | | 4.73 | (b) | | | 11/29/22 | | | | Open | | | | 1,096,875 | | | | 1,101,030 | | | Capital Trusts | | | Open/Demand | |
BNP Paribas S.A. | | | 4.73 | (b) | | | 11/29/22 | | | | Open | | | | 277,400 | | | | 278,451 | | | Corporate Bonds | | | Open/Demand | |
| | |
| 100 | | 2 0 2 2 BLACK ROCK ANNUAL REPORT TO SHAREHOLDERS |
| | |
Schedule of Investments (continued) December 31, 2022 | | BlackRock Limited Duration Income Trust (BLW) |
Reverse Repurchase Agreements (continued)
| | | | | | | | | | | | | | | | | | | | | | | | | | |
| | | | | | | | |
| Counterparty | |
| Interest
Rate |
| |
| Trade
Date |
| |
| Maturity
Date |
(a) | | | Face Value | | |
| Face Value
Including Accrued Interest |
| | Type of Non-Cash Underlying Collateral | |
| Remaining
Contractual Maturity of the Agreements |
(a) |
| | | | | | | |
BNP Paribas S.A. | | | 4.73 | %(b) | | | 11/29/22 | | | | Open | | | $ | 345,450 | | | $ | 346,758 | | | Corporate Bonds | | | Open/Demand | |
BNP Paribas S.A. | | | 4.73 | (b) | | | 11/29/22 | | | | Open | | | | 541,969 | | | | 544,022 | | | Corporate Bonds | | | Open/Demand | |
BNP Paribas S.A. | | | 4.73 | (b) | | | 11/29/22 | | | | Open | | | | 579,817 | | | | 582,014 | | | Corporate Bonds | | | Open/Demand | |
BNP Paribas S.A. | | | 4.75 | (b) | | | 11/29/22 | | | | Open | | | | 850,030 | | | | 853,265 | | | Corporate Bonds | | | Open/Demand | |
BNP Paribas S.A. | | | 4.80 | (b) | | | 11/29/22 | | | | Open | | | | 286,740 | | | | 287,844 | | | Corporate Bonds | | | Open/Demand | |
BNP Paribas S.A. | | | 4.80 | (b) | | | 11/29/22 | | | | Open | | | | 616,005 | | | | 618,377 | | | Corporate Bonds | | | Open/Demand | |
BNP Paribas S.A. | | | 4.80 | (b) | | | 11/29/22 | | | | Open | | | | 697,727 | | | | 700,414 | | | Corporate Bonds | | | Open/Demand | |
BNP Paribas S.A. | | | 4.80 | (b) | | | 11/29/22 | | | | Open | | | | 370,256 | | | | 371,682 | | | Corporate Bonds | | | Open/Demand | |
BNP Paribas S.A. | | | 4.80 | (b) | | | 11/29/22 | | | | Open | | | | 361,594 | | | | 362,986 | | | Corporate Bonds | | | Open/Demand | |
BNP Paribas S.A. | | | 4.80 | (b) | | | 11/29/22 | | | | Open | | | | 310,115 | | | | 311,309 | | | Corporate Bonds | | | Open/Demand | |
BNP Paribas S.A. | | | 4.80 | (b) | | | 11/29/22 | | | | Open | | | | 859,675 | | | | 862,985 | | | Corporate Bonds | | | Open/Demand | |
BNP Paribas S.A. | | | 4.80 | (b) | | | 11/29/22 | | | | Open | | | | 553,900 | | | | 556,032 | | | Corporate Bonds | | | Open/Demand | |
BNP Paribas S.A. | | | 4.80 | (b) | | | 11/29/22 | | | | Open | | | | 376,877 | | | | 378,328 | | | Corporate Bonds | | | Open/Demand | |
BNP Paribas S.A. | | | 4.80 | (b) | | | 11/29/22 | | | | Open | | | | 248,640 | | | | 249,597 | | | Corporate Bonds | | | Open/Demand | |
BNP Paribas S.A. | | | 4.80 | (b) | | | 11/29/22 | | | | Open | | | | 54,438 | | | | 54,647 | | | Corporate Bonds | | | Open/Demand | |
BNP Paribas S.A. | | | 4.80 | (b) | | | 11/29/22 | | | | Open | | | | 713,625 | | | | 716,372 | | | Corporate Bonds | | | Open/Demand | |
BNP Paribas S.A. | | | 4.80 | (b) | | | 11/29/22 | | | | Open | | | | 284,800 | | | | 285,896 | | | Corporate Bonds | | | Open/Demand | |
BNP Paribas S.A. | | | 4.80 | (b) | | | 11/29/22 | | | | Open | | | | 471,501 | | | | 473,317 | | | Corporate Bonds | | | Open/Demand | |
BNP Paribas S.A. | | | 4.85 | (b) | | | 11/29/22 | | | | Open | | | | 805,815 | | | | 808,953 | | | Corporate Bonds | | | Open/Demand | |
BNP Paribas S.A. | | | 4.85 | (b) | | | 11/29/22 | | | | Open | | | | 165,250 | | | | 165,894 | | | Corporate Bonds | | | Open/Demand | |
BNP Paribas S.A. | | | 4.85 | (b) | | | 11/29/22 | | | | Open | | | | 475,785 | | | | 477,638 | | �� | Corporate Bonds | | | Open/Demand | |
BNP Paribas S.A. | | | 4.85 | (b) | | | 11/29/22 | | | | Open | | | | 900,720 | | | | 904,228 | | | Corporate Bonds | | | Open/Demand | |
BNP Paribas S.A. | | | 4.85 | (b) | | | 11/29/22 | | | | Open | | | | 81,620 | | | | 81,938 | | | Corporate Bonds | | | Open/Demand | |
BNP Paribas S.A. | | | 4.88 | (b) | | | 11/29/22 | | | | Open | | | | 111,090 | | | | 111,526 | | | Corporate Bonds | | | Open/Demand | |
BNP Paribas S.A. | | | 4.88 | (b) | | | 11/29/22 | | | | Open | | | | 207,328 | | | | 208,140 | | | Corporate Bonds | | | Open/Demand | |
BNP Paribas S.A. | | | 4.88 | (b) | | | 11/29/22 | | | | Open | | | | 551,880 | | | | 554,044 | | | Corporate Bonds | | | Open/Demand | |
BNP Paribas S.A. | | | 4.88 | (b) | | | 11/29/22 | | | | Open | | | | 263,200 | | | | 264,232 | | | Corporate Bonds | | | Open/Demand | |
BNP Paribas S.A. | | | 4.88 | (b) | | | 11/29/22 | | | | Open | | | | 367,200 | | | | 368,640 | | | Corporate Bonds | | | Open/Demand | |
BNP Paribas S.A. | | | 4.88 | (b) | | | 11/29/22 | | | | Open | | | | 425,100 | | | | 426,767 | | | Corporate Bonds | | | Open/Demand | |
Credit Agricole Corporate and Investment Bank | | | 4.47 | (b) | | | 11/29/22 | | | | Open | | | | 1,260,000 | | | | 1,264,481 | | | Corporate Bonds | | | Open/Demand | |
Credit Agricole Corporate and Investment Bank | | | 4.47 | (b) | | | 11/29/22 | | | | Open | | | | 1,233,562 | | | | 1,237,950 | | | Corporate Bonds | | | Open/Demand | |
Credit Agricole Corporate and Investment Bank | | | 4.50 | (b) | | | 11/29/22 | | | | Open | | | | 655,000 | | | | 657,347 | | | Corporate Bonds | | | Open/Demand | |
Credit Agricole Corporate and Investment Bank | | | 4.52 | (b) | | | 11/29/22 | | | | Open | | | | 172,250 | | | | 172,870 | | | Corporate Bonds | | | Open/Demand | |
Credit Agricole Corporate and Investment Bank | | | 4.52 | (b) | | | 11/29/22 | | | | Open | | | | 328,312 | | | | 329,495 | | | Corporate Bonds | | | Open/Demand | |
Credit Agricole Corporate and Investment Bank | | | 4.52 | (b) | | | 11/29/22 | | | | Open | | | | 170,400 | | | | 171,014 | | | Corporate Bonds | | | Open/Demand | |
Credit Agricole Corporate and Investment Bank | | | 4.52 | (b) | | | 11/29/22 | | | | Open | | | | 170,200 | | | | 170,813 | | | Corporate Bonds | | | Open/Demand | |
Credit Agricole Corporate and Investment Bank | | | 4.52 | (b) | | | 11/29/22 | | | | Open | | | | 45,938 | | | | 46,103 | | | Corporate Bonds | | | Open/Demand | |
Credit Agricole Corporate and Investment Bank | | | 4.55 | (b) | | | 11/29/22 | | | | Open | | | | 209,135 | | | | 209,894 | | | Corporate Bonds | | | Open/Demand | |
Credit Agricole Corporate and Investment Bank | | | 4.55 | (b) | | | 11/29/22 | | | | Open | | | | 317,199 | | | | 318,349 | | | Corporate Bonds | | | Open/Demand | |
Credit Agricole Corporate and Investment Bank | | | 4.57 | (b) | | | 11/29/22 | | | | Open | | | | 285,123 | | | | 286,162 | | | Corporate Bonds | | | Open/Demand | |
Credit Agricole Corporate and Investment Bank | | | 4.58 | (b) | | | 11/29/22 | | | | Open | | | | 374,987 | | | | 376,358 | | | Corporate Bonds | | | Open/Demand | |
Credit Agricole Corporate and Investment Bank | | | 4.59 | (b) | | | 11/29/22 | | | | Open | | | | 299,145 | | | | 300,241 | | | Corporate Bonds | | | Open/Demand | |
Credit Agricole Corporate and Investment Bank | | | 4.59 | (b) | | | 11/29/22 | | | | Open | | | | 303,480 | | | | 304,592 | | | Corporate Bonds | | | Open/Demand | |
Credit Agricole Corporate and Investment Bank | | | 4.59 | (b) | | | 11/29/22 | | | | Open | | | | 293,550 | | | | 294,625 | | | Corporate Bonds | | | Open/Demand | |
Credit Agricole Corporate and Investment Bank | | | 4.59 | (b) | | | 11/29/22 | | | | Open | | | | 387,004 | | | | 388,421 | | | Corporate Bonds | | | Open/Demand | |
| | |
SCHEDULE OF INVESTMENTS | | 101 |
| | |
Schedule of Investments (continued) December 31, 2022 | | BlackRock Limited Duration Income Trust (BLW) |
Reverse Repurchase Agreements (continued)
| | | | | | | | | | | | | | | | | | | | | | | | | | |
| | | | | | | | |
| Counterparty | |
| Interest
Rate |
| |
| Trade
Date |
| |
| Maturity
Date |
(a) | | | Face Value | | |
| Face Value
Including
Accrued Interest |
| | Type of Non-Cash Underlying Collateral | |
| Remaining
Contractual Maturity
of the Agreements |
(a) |
| | | | | | | |
Credit Agricole Corporate and Investment Bank | | | 4.59 | %(b) | | | 11/29/22 | | | | Open | | | $ | 388,410 | | | $ | 389,833 | | | Corporate Bonds | | | Open/Demand | |
Credit Agricole Corporate and Investment Bank | | | 4.59 | (b) | | | 11/29/22 | | | | Open | | | | 261,500 | | | | 262,458 | | | Corporate Bonds | | | Open/Demand | |
Credit Agricole Corporate and Investment Bank | | | 4.59 | (b) | | | 11/29/22 | | | | Open | | | | 285,188 | | | | 286,232 | | | Corporate Bonds | | | Open/Demand | |
Credit Agricole Corporate and Investment Bank | | | 4.59 | (b) | | | 11/29/22 | | | | Open | | | | 333,629 | | | | 334,851 | | | Corporate Bonds | | | Open/Demand | |
Credit Agricole Corporate and Investment Bank | | | 4.61 | (b) | | | 11/29/22 | | | | Open | | | | 309,375 | | | | 310,514 | | | Corporate Bonds | | | Open/Demand | |
Credit Agricole Corporate and Investment Bank | | | 4.61 | (b) | | | 11/29/22 | | | | Open | | | | 438,019 | | | | 439,631 | | | Corporate Bonds | | | Open/Demand | |
Credit Agricole Corporate and Investment Bank | | | 4.63 | (b) | | | 11/29/22 | | | | Open | | | | 244,125 | | | | 245,028 | | | Corporate Bonds | | | Open/Demand | |
Credit Agricole Corporate and Investment Bank | | | 4.65 | (b) | | | 11/29/22 | | | | Open | | | | 305,428 | | | | 306,563 | | | Corporate Bonds | | | Open/Demand | |
Credit Suisse Securities (USA) LLC | | | 4.50 | (b) | | | 11/29/22 | | | | Open | | | | 83,663 | | | | 83,962 | | | Corporate Bonds | | | Open/Demand | |
Credit Suisse Securities (USA) LLC | | | 4.60 | (b) | | | 11/29/22 | | | | Open | | | | 236,500 | | | | 237,368 | | | Corporate Bonds | | | Open/Demand | |
Credit Suisse Securities (USA) LLC | | | 4.60 | (b) | | | 11/29/22 | | | | Open | | | | 600,702 | | | | 602,908 | | | Corporate Bonds | | | Open/Demand | |
Credit Suisse Securities (USA) LLC | | | 4.65 | (b) | | | 11/29/22 | | | | Open | | | | 303,956 | | | | 305,086 | | | Corporate Bonds | | | Open/Demand | |
Credit Suisse Securities (USA) LLC | | | 4.70 | (b) | | | 11/29/22 | | | | Open | | | | 83,140 | | | | 83,453 | | | Corporate Bonds | | | Open/Demand | |
Credit Suisse Securities (USA) LLC | | | 4.80 | (b) | | | 11/29/22 | | | | Open | | | | 1,342,500 | | | | 1,347,557 | | | Corporate Bonds | | | Open/Demand | |
Credit Suisse Securities (USA) LLC | | | 4.80 | (b) | | | 11/29/22 | | | | Open | | | | 1,035,000 | | | | 1,038,769 | | | Corporate Bonds | | | Open/Demand | |
Credit Suisse Securities (USA) LLC | | | 4.80 | (b) | | | 11/29/22 | | | | Open | | | | 254,231 | | | | 255,178 | | | Capital Trusts | | | Open/Demand | |
HSBC Securities (USA), Inc. | | | 4.50 | (b) | | | 11/29/22 | | | | Open | | | | 811,250 | | | | 814,157 | | | Corporate Bonds | | | Open/Demand | |
Nomura Securities International, Inc. | | | 4.48 | (b) | | | 11/29/22 | | | | Open | | | | 1,451,250 | | | | 1,456,425 | | | Corporate Bonds | | | Open/Demand | |
Nomura Securities International, Inc. | | | 4.48 | (b) | | | 11/29/22 | | | | Open | | | | 685,506 | | | | 687,950 | | | Corporate Bonds | | | Open/Demand | |
Nomura Securities International, Inc. | | | 4.48 | (b) | | | 11/29/22 | | | | Open | | | | 947,077 | | | | 950,454 | | | Corporate Bonds | | | Open/Demand | |
Nomura Securities International, Inc. | | | 4.48 | (b) | | | 11/29/22 | | | | Open | | | | 531,885 | | | | 533,781 | | | Corporate Bonds | | | Open/Demand | |
Nomura Securities International, Inc. | | | 4.48 | (b) | | | 11/29/22 | | | | Open | | | | 871,250 | | | | 874,356 | | | Corporate Bonds | | | Open/Demand | |
RBC Capital Markets LLC | | | 4.50 | (b) | | | 11/29/22 | | | | Open | | | | 152,363 | | | | 152,908 | | | Corporate Bonds | | | Open/Demand | |
RBC Capital Markets LLC | | | 4.50 | (b) | | | 11/29/22 | | | | Open | | | | 1,296,446 | | | | 1,301,092 | | | Corporate Bonds | | | Open/Demand | |
RBC Capital Markets LLC | | | 4.50 | (b) | | | 11/29/22 | | | | Open | | | | 779,625 | | | | 782,419 | | | Corporate Bonds | | | Open/Demand | |
RBC Capital Markets LLC | | | 4.50 | (b) | | | 11/29/22 | | | | Open | | | | 398,569 | | | | 399,997 | | | Corporate Bonds | | | Open/Demand | |
RBC Capital Markets LLC | | | 4.50 | (b) | | | 11/29/22 | | | | Open | | | | 1,031,375 | | | | 1,035,071 | | | Corporate Bonds | | | Open/Demand | |
RBC Capital Markets LLC | | | 4.50 | (b) | | | 11/29/22 | | | | Open | | | | 324,900 | | | | 326,064 | | | Corporate Bonds | | | Open/Demand | |
RBC Capital Markets LLC | | | 4.50 | (b) | | | 11/29/22 | | | | Open | | | | 268,781 | | | | 269,744 | | | Corporate Bonds | | | Open/Demand | |
RBC Capital Markets LLC | | | 4.50 | (b) | | | 11/29/22 | | | | Open | | | | 355,500 | | | | 356,774 | | | Corporate Bonds | | | Open/Demand | |
RBC Capital Markets LLC | | | 4.53 | (b) | | | 11/29/22 | | | | Open | | | | 1,410,000 | | | | 1,415,090 | | | Corporate Bonds | | | Open/Demand | |
RBC Capital Markets LLC | | | 4.53 | (b) | | | 11/29/22 | | | | Open | | | | 598,000 | | | | 600,159 | | | Corporate Bonds | | | Open/Demand | |
RBC Capital Markets LLC | | | 4.53 | (b) | | | 11/29/22 | | | | Open | | | | 336,937 | | | | 338,154 | | | Corporate Bonds | | | Open/Demand | |
RBC Capital Markets LLC | | | 4.53 | (b) | | | 11/29/22 | | | | Open | | | | 264,338 | | | | 265,292 | | | Corporate Bonds | | | Open/Demand | |
RBC Capital Markets LLC | | | 4.53 | (b) | | | 11/29/22 | | | | Open | | | | 2,753 | | | | 2,762 | | | Corporate Bonds | | | Open/Demand | |
RBC Capital Markets LLC | | | 4.53 | (b) | | | 11/29/22 | | | | Open | | | | 1,400,727 | | | | 1,405,784 | | | Corporate Bonds | | | Open/Demand | |
RBC Capital Markets LLC | | | 4.53 | (b) | | | 11/29/22 | | | | Open | | | | 211,206 | | | | 211,969 | | | Corporate Bonds | | | Open/Demand | |
RBC Capital Markets LLC | | | 4.53 | (b) | | | 11/29/22 | | | | Open | | | | 1,378,125 | | | | 1,383,100 | | | Corporate Bonds | | | Open/Demand | |
RBC Capital Markets LLC | | | 4.53 | (b) | | | 11/29/22 | | | | Open | | | | 377,662 | | | | 379,026 | | | Corporate Bonds | | | Open/Demand | |
RBC Capital Markets LLC | | | 4.63 | (b) | | | 11/29/22 | | | | Open | | | | 463,150 | | | | 464,863 | | | Corporate Bonds | | | Open/Demand | |
RBC Capital Markets LLC | | | 4.63 | (b) | | | 11/29/22 | | | | Open | | | | 355,975 | | | | 357,292 | | | Corporate Bonds | | | Open/Demand | |
RBC Capital Markets LLC | | | 4.63 | (b) | | | 11/29/22 | | | | Open | | | | 312,200 | | | | 313,355 | | | Corporate Bonds | | | Open/Demand | |
RBC Capital Markets LLC | | | 4.63 | (b) | | | 11/29/22 | | | | Open | | | | 256,856 | | | | 257,806 | | | Corporate Bonds | | | Open/Demand | |
RBC Capital Markets LLC | | | 4.63 | (b) | | | 11/29/22 | | | | Open | | | | 499,905 | | | | 501,754 | | | Corporate Bonds | | | Open/Demand | |
RBC Capital Markets LLC | | | 4.63 | (b) | | | 11/29/22 | | | | Open | | | | 321,195 | | | | 322,383 | | | Corporate Bonds | | | Open/Demand | |
RBC Capital Markets LLC | | | 4.63 | (b) | | | 11/29/22 | | | | Open | | | | 44,963 | | | | 45,129 | | | Corporate Bonds | | | Open/Demand | |
RBC Capital Markets LLC | | | 4.63 | (b) | | | 11/29/22 | | | | Open | | | | 728,460 | | | | 731,154 | | | Corporate Bonds | | | Open/Demand | |
RBC Capital Markets LLC | | | 4.63 | (b) | | | 11/29/22 | | | | Open | | | | 281,320 | | | | 282,361 | | | Corporate Bonds | | | Open/Demand | |
RBC Capital Markets LLC | | | 4.63 | (b) | | | 11/29/22 | | | | Open | | | | 463,125 | | | | 464,838 | | | Corporate Bonds | | | Open/Demand | |
RBC Capital Markets LLC | | | 4.63 | (b) | | | 11/29/22 | | | | Open | | | | 332,310 | | | | 333,539 | | | Corporate Bonds | | | Open/Demand | |
RBC Capital Markets LLC | | | 4.65 | (b) | | | 11/29/22 | | | | Open | | | | 272,213 | | | | 273,224 | | | Corporate Bonds | | | Open/Demand | |
RBC Capital Markets LLC | | | 4.65 | (b) | | | 11/29/22 | | | | Open | | | | 246,325 | | | | 247,241 | | | Corporate Bonds | | | Open/Demand | |
RBC Capital Markets LLC | | | 4.65 | (b) | | | 11/29/22 | | | | Open | | | | 426,161 | | | | 427,745 | | | Corporate Bonds | | | Open/Demand | |
RBC Capital Markets LLC | | | 4.65 | (b) | | | 11/29/22 | | | | Open | | | | 281,295 | | | | 282,340 | | | Corporate Bonds | | | Open/Demand | |
| | |
| 102 | | 2 0 2 2 BLACK ROCK ANNUAL REPORT TO SHAREHOLDERS |
| | |
Schedule of Investments (continued) December 31, 2022 | | BlackRock Limited Duration Income Trust (BLW) |
Reverse Repurchase Agreements (continued)
| | | | | | | | | | | | | | | | | | | | | | | | | | |
| | | | | | | | |
| Counterparty | |
| Interest
Rate |
| |
| Trade
Date |
| |
| Maturity
Date |
(a) | | | Face Value | | |
| Face Value
Including Accrued Interest |
| | Type of Non-Cash Underlying Collateral | |
| Remaining
Contractual Maturity of the Agreements |
(a) |
| | | | | | | |
RBC Capital Markets LLC | | | 4.65 | %(b) | | | 11/29/22 | | | | Open | | | $ | 283,650 | | | $ | 284,704 | | | Corporate Bonds | | | Open/Demand | |
RBC Capital Markets LLC | | | 4.65 | (b) | | | 11/29/22 | | | | Open | | | | 311,231 | | | | 312,388 | | | Corporate Bonds | | | Open/Demand | |
RBC Capital Markets LLC | | | 4.65 | (b) | | | 11/29/22 | | | | Open | | | | 377,097 | | | | 378,499 | | | Corporate Bonds | | | Open/Demand | |
RBC Capital Markets LLC | | | 4.65 | (b) | | | 11/29/22 | | | | Open | | | | 156,750 | | | | 157,333 | | | Corporate Bonds | | | Open/Demand | |
RBC Capital Markets LLC | | | 4.65 | (b) | | | 11/29/22 | | | | Open | | | | 499,177 | | | | 501,033 | | | Corporate Bonds | | | Open/Demand | |
RBC Capital Markets LLC | | | 4.65 | (b) | | | 11/29/22 | | | | Open | | | | 414,199 | | | | 415,738 | | | Corporate Bonds | | | Open/Demand | |
RBC Capital Markets LLC | | | 4.65 | (b) | | | 11/29/22 | | | | Open | | | | 380,052 | | | | 381,465 | | | Corporate Bonds | | | Open/Demand | |
RBC Capital Markets LLC | | | 4.65 | (b) | | | 11/29/22 | | | | Open | | | | 191,563 | | | | 192,274 | | | Corporate Bonds | | | Open/Demand | |
RBC Capital Markets LLC | | | 4.65 | (b) | | | 11/29/22 | | | | Open | | | | 424,462 | | | | 426,040 | | | Corporate Bonds | | | Open/Demand | |
RBC Capital Markets LLC | | | 4.65 | (b) | | | 11/29/22 | | | | Open | | | | 346,320 | | | | 347,607 | | | Corporate Bonds | | | Open/Demand | |
RBC Capital Markets LLC | | | 4.65 | (b) | | | 11/29/22 | | | | Open | | | | 575,040 | | | | 577,177 | | | Corporate Bonds | | | Open/Demand | |
RBC Capital Markets LLC | | | 4.65 | (b) | | | 11/29/22 | | | | Open | | | | 341,077 | | | | 342,345 | | | Corporate Bonds | | | Open/Demand | |
RBC Capital Markets LLC | | | 4.65 | (b) | | | 11/29/22 | | | | Open | | | | 324,327 | | | | 325,533 | | | Corporate Bonds | | | Open/Demand | |
RBC Capital Markets LLC | | | 4.65 | (b) | | | 11/29/22 | | | | Open | | | | 445,491 | | | | 447,147 | | | Corporate Bonds | | | Open/Demand | |
RBC Capital Markets LLC | | | 4.65 | (b) | | | 11/29/22 | | | | Open | | | | 313,739 | | | | 314,905 | | | Corporate Bonds | | | Open/Demand | |
RBC Capital Markets LLC | | | 4.65 | (b) | | | 11/29/22 | | | | Open | | | | 212,040 | | | | 212,828 | | | Corporate Bonds | | | Open/Demand | |
RBC Capital Markets LLC | | | 4.65 | (b) | | | 11/29/22 | | | | Open | | | | 444,652 | | | | 446,305 | | | Corporate Bonds | | | Open/Demand | |
RBC Capital Markets LLC | | | 4.65 | (b) | | | 11/29/22 | | | | Open | | | | 378,750 | | | | 380,158 | | | Corporate Bonds | | | Open/Demand | |
RBC Capital Markets LLC | | | 4.65 | (b) | | | 11/29/22 | | | | Open | | | | 329,040 | | | | 330,263 | | | Corporate Bonds | | | Open/Demand | |
RBC Capital Markets LLC | | | 4.65 | (b) | | | 11/29/22 | | | | Open | | | | 170,048 | | | | 170,680 | | | Corporate Bonds | | | Open/Demand | |
RBC Capital Markets LLC | | | 4.65 | (b) | | | 11/29/22 | | | | Open | | | | 158,790 | | | | 159,380 | | | Corporate Bonds | | | Open/Demand | |
RBC Capital Markets LLC | | | 4.65 | (b) | | | 11/29/22 | | | | Open | | | | 247,690 | | | | 248,611 | | | Corporate Bonds | | | Open/Demand | |
RBC Capital Markets LLC | | | 4.65 | (b) | | | 11/29/22 | | | | Open | | | | 234,175 | | | | 235,045 | | | Corporate Bonds | | | Open/Demand | |
RBC Capital Markets LLC | | | 4.65 | (b) | | | 11/29/22 | | | | Open | | | | 385,387 | | | | 386,820 | | | Corporate Bonds | | | Open/Demand | |
RBC Capital Markets LLC | | | 4.67 | (b) | | | 11/29/22 | | | | Open | | | | 313,565 | | | | 314,736 | | | Corporate Bonds | | | Open/Demand | |
RBC Capital Markets LLC | | | 4.67 | (b) | | | 11/29/22 | | | | Open | | | | 392,700 | | | | 394,167 | | | Corporate Bonds | | | Open/Demand | |
TD Securities (USA) LLC | | | 4.62 | (b) | | | 11/29/22 | | | | Open | | | | 225,760 | | | | 226,593 | | | Corporate Bonds | | | Open/Demand | |
BNP Paribas S.A. | | | 4.15 | (b) | | | 12/05/22 | | | | Open | | | | 164,588 | | | | 165,026 | | | Corporate Bonds | | | Open/Demand | |
BNP Paribas S.A. | | | 4.30 | (b) | | | 12/05/22 | | | | Open | | | | 398,571 | | | | 399,676 | | | Corporate Bonds | | | Open/Demand | |
BNP Paribas S.A. | | | 4.45 | (b) | | | 12/05/22 | | | | Open | | | | 452,454 | | | | 453,757 | | | Corporate Bonds | | | Open/Demand | |
BNP Paribas S.A. | | | 4.54 | (b) | | | 12/05/22 | | | | Open | | | | 1,563,000 | | | | 1,567,458 | | | Corporate Bonds | | | Open/Demand | |
Barclays Capital, Inc. | | | 4.25 | (b) | | | 12/06/22 | | | | Open | | | | 163,660 | | | | 164,143 | | | Corporate Bonds | | | Open/Demand | |
Barclays Bank PLC | | | 4.05 | (b) | | | 12/08/22 | | | | Open | | | | 122,064 | | | | 122,380 | | | Corporate Bonds | | | Open/Demand | |
BNP Paribas S.A. | | | 4.35 | (b) | | | 12/08/22 | | | | Open | | | | 745,500 | | | | 747,354 | | | Corporate Bonds | | | Open/Demand | |
BNP Paribas S.A. | | | 4.45 | (b) | | | 12/08/22 | | | | Open | | | | 590,625 | | | | 592,132 | | | Corporate Bonds | | | Open/Demand | |
BNP Paribas S.A. | | | 4.45 | (b) | | | 12/09/22 | | �� | | Open | | | | 266,875 | | | | 267,468 | | | Corporate Bonds | | | Open/Demand | |
BNP Paribas S.A. | | | 4.73 | (b) | | | 12/09/22 | | | | Open | | | | 267,300 | | | | 267,936 | | | Corporate Bonds | | | Open/Demand | |
BNP Paribas S.A. | | | 4.39 | (b) | | | 12/12/22 | | | | Open | | | | 98,714 | | | | 98,919 | | | Corporate Bonds | | | Open/Demand | |
BNP Paribas S.A. | | | 4.45 | (b) | | | 12/13/22 | | | | Open | | | | 603,000 | | | | 604,208 | | | Corporate Bonds | | | Open/Demand | |
BNP Paribas S.A. | | | 4.45 | (b) | | | 12/13/22 | | | | Open | | | | 1,507,500 | | | | 1,510,519 | | | Corporate Bonds | | | Open/Demand | |
Nomura Securities International, Inc. | | | 4.48 | (b) | | | 12/13/22 | | | | Open | | | | 246,103 | | | | 246,599 | | | Corporate Bonds | | | Open/Demand | |
Nomura Securities International, Inc. | | | 4.48 | (b) | | | 12/13/22 | | | | Open | | | | 177,620 | | | | 177,978 | | | Corporate Bonds | | | Open/Demand | |
RBC Capital Markets LLC | | | 4.65 | (b) | | | 12/13/22 | | | | Open | | | | 304,188 | | | | 304,827 | | | Corporate Bonds | | | Open/Demand | |
BNP Paribas S.A. | | | 4.42 | (b) | | | 12/14/22 | | | | Open | | | | 398,095 | | | | 398,843 | | | Corporate Bonds | | | Open/Demand | |
RBC Capital Markets LLC | | | 4.65 | (b) | | | 12/14/22 | | | | Open | | | | 375,990 | | | | 376,737 | | | Corporate Bonds | | | Open/Demand | |
J.P. Morgan Securities LLC | | | 4.45 | | | | 12/15/22 | | | | 01/06/23 | | | | 505,304 | | | | 506,303 | | | Corporate Bonds | | | Up to 30 Days | |
J.P. Morgan Securities LLC | | | 4.45 | | | | 12/15/22 | | | | 01/06/23 | | | | 844,050 | | | | 845,719 | | | Corporate Bonds | | | Up to 30 Days | |
BofA Securities, Inc. | | | 1.50 | | | | 12/15/22 | | | | 02/03/23 | | | | 119,850 | | | | 119,930 | | | Corporate Bonds | | | 31 - 90 Days | |
BofA Securities, Inc. | | | 3.50 | | | | 12/15/22 | | | | 02/03/23 | | | | 92,566 | | | | 92,710 | | | Corporate Bonds | | | 31 - 90 Days | |
BofA Securities, Inc. | | | 3.60 | | | | 12/15/22 | | | | 02/03/23 | | | | 362,500 | | | | 363,080 | | | Corporate Bonds | | | 31 - 90 Days | |
BofA Securities, Inc. | | | 4.25 | | | | 12/15/22 | | | | 02/03/23 | | | | 370,301 | | | | 371,001 | | | Corporate Bonds | | | 31 - 90 Days | |
BofA Securities, Inc. | | | 4.35 | | | | 12/15/22 | | | | 02/03/23 | | | | 191,239 | | | | 191,608 | | | Corporate Bonds | | | 31 - 90 Days | |
BofA Securities, Inc. | | | 4.35 | | | | 12/15/22 | | | | 02/03/23 | | | | 185,133 | | | | 185,490 | | | Corporate Bonds | | | 31 - 90 Days | |
BofA Securities, Inc. | | | 4.40 | | | | 12/15/22 | | | | 02/03/23 | | | | 209,625 | | | | 210,035 | | | Corporate Bonds | | | 31 - 90 Days | |
BofA Securities, Inc. | | | 4.40 | | | | 12/15/22 | | | | 02/03/23 | | | | 204,000 | | | | 204,399 | | | Corporate Bonds | | | 31 - 90 Days | |
BofA Securities, Inc. | | | 4.40 | | | | 12/15/22 | | | | 02/03/23 | | | | 526,875 | | | | 527,905 | | | Corporate Bonds | | | 31 - 90 Days | |
BofA Securities, Inc. | | | 4.40 | | | | 12/15/22 | | | | 02/03/23 | | | | 189,638 | | | | 190,008 | | | Corporate Bonds | | | 31 - 90 Days | |
BofA Securities, Inc. | | | 4.40 | | | | 12/15/22 | | | | 02/03/23 | | | | 323,595 | | | | 324,228 | | | Corporate Bonds | | | 31 - 90 Days | |
BofA Securities, Inc. | | | 4.40 | | | | 12/15/22 | | | | 02/03/23 | | | | 143,500 | | | | 143,781 | | | Corporate Bonds | | | 31 - 90 Days | |
BofA Securities, Inc. | | | 4.40 | | | | 12/15/22 | | | | 02/03/23 | | | | 118,631 | | | | 118,863 | | | Corporate Bonds | | | 31 - 90 Days | |
BofA Securities, Inc. | | | 4.40 | | | | 12/15/22 | | | | 02/03/23 | | | | 195,000 | | | | 195,381 | | | Corporate Bonds | | | 31 - 90 Days | |
BofA Securities, Inc. | | | 4.40 | | | | 12/15/22 | | | | 02/03/23 | | | | 480,495 | | | | 481,435 | | | Corporate Bonds | | | 31 - 90 Days | |
| | |
SCHEDULE OF INVESTMENTS | | 103 |
| | |
Schedule of Investments (continued) December 31, 2022 | | BlackRock Limited Duration Income Trust (BLW) |
Reverse Repurchase Agreements (continued)
| | | | | | | | | | | | | | | | | | | | | | | | | | |
| | | | | | | | |
| Counterparty | |
| Interest
Rate |
| |
| Trade
Date |
| |
| Maturity
Date |
(a) | | | Face Value | | |
| Face Value
Including
Accrued Interest |
| | Type of Non-Cash Underlying Collateral | |
| Remaining
Contractual Maturity of the Agreements |
(a) |
| | | | | | | |
BofA Securities, Inc. | | | 4.40 | % | | | 12/15/22 | | | | 02/03/23 | | | $ | 725,580 | | | $ | 726,999 | | | Corporate Bonds | | | 31 - 90 Days | |
BofA Securities, Inc. | | | 4.40 | | | | 12/15/22 | | | | 02/03/23 | | | | 655,001 | | | | 656,282 | | | Corporate Bonds | | | 31 - 90 Days | |
BofA Securities, Inc. | | | 4.40 | | | | 12/15/22 | | | | 02/03/23 | | | | 92,293 | | | | 92,473 | | | Corporate Bonds | | | 31 - 90 Days | |
BofA Securities, Inc. | | | 4.40 | | | | 12/15/22 | | | | 02/03/23 | | | | 782,495 | | | | 784,025 | | | Corporate Bonds | | | 31 - 90 Days | |
BofA Securities, Inc. | | | 4.40 | | | | 12/15/22 | | | | 02/03/23 | | | | 147,690 | | | | 147,979 | | | Corporate Bonds | | | 31 - 90 Days | |
BofA Securities, Inc. | | | 4.40 | | | | 12/15/22 | | | | 02/03/23 | | | | 241,448 | | | | 241,920 | | | Corporate Bonds | | | 31 - 90 Days | |
BofA Securities, Inc. | | | 4.40 | | | | 12/15/22 | | | | 02/03/23 | | | | 453,764 | | | | 454,651 | | | Corporate Bonds | | | 31 - 90 Days | |
BofA Securities, Inc. | | | 4.40 | | | | 12/15/22 | | | | 02/03/23 | | | | 132,750 | | | | 133,010 | | | Corporate Bonds | | | 31 - 90 Days | |
BofA Securities, Inc. | | | 4.40 | | | | 12/15/22 | | | | 02/03/23 | | | | 603,480 | | | | 604,660 | | | Corporate Bonds | | | 31 - 90 Days | |
BofA Securities, Inc. | | | 4.40 | | | | 12/15/22 | | | | 02/03/23 | | | | 1,035,000 | | | | 1,037,024 | | | Capital Trusts | | | 31 - 90 Days | |
BofA Securities, Inc. | | | 4.40 | | | | 12/15/22 | | | | 02/03/23 | | | | 1,569,800 | | | | 1,572,870 | | | Corporate Bonds | | | 31 - 90 Days | |
BofA Securities, Inc. | | | 4.45 | | | | 12/15/22 | | | | 02/03/23 | | | | 60,095 | | | | 60,214 | | | Corporate Bonds | | | 31 - 90 Days | |
BofA Securities, Inc. | | | 4.45 | | | | 12/15/22 | | | | 02/03/23 | | | | 133,131 | | | | 133,395 | | | Corporate Bonds | | | 31 - 90 Days | |
BofA Securities, Inc. | | | 4.45 | | | | 12/15/22 | | | | 02/03/23 | | | | 271,688 | | | | 272,225 | | | Corporate Bonds | | | 31 - 90 Days | |
BofA Securities, Inc. | | | 4.45 | | | | 12/15/22 | | | | 02/03/23 | | | | 893,330 | | | | 895,097 | | | Corporate Bonds | | | 31 - 90 Days | |
BofA Securities, Inc. | | | 4.45 | | | | 12/15/22 | | | | 02/03/23 | | | | 211,188 | | | | 211,605 | | | Corporate Bonds | | | 31 - 90 Days | |
BofA Securities, Inc. | | | 4.45 | | | | 12/15/22 | | | | 02/03/23 | | | | 141,900 | | | | 142,181 | | | Corporate Bonds | | | 31 - 90 Days | |
BofA Securities, Inc. | | | 4.45 | | | | 12/15/22 | | | | 02/03/23 | | | | 205,590 | | | | 205,997 | | | Corporate Bonds | | | 31 - 90 Days | |
BofA Securities, Inc. | | | 4.45 | | | | 12/15/22 | | | | 02/03/23 | | | | 180,476 | | | | 180,833 | | | Foreign Agency Obligations | | | 31 - 90 Days | |
BofA Securities, Inc. | | | 4.50 | | | | 12/15/22 | | | | 02/03/23 | | | | 117,195 | | | | 117,429 | | | Corporate Bonds | | | 31 - 90 Days | |
BofA Securities, Inc. | | | 4.50 | | | | 12/15/22 | | | | 02/03/23 | | | | 86,869 | | | | 87,042 | | | Corporate Bonds | | | 31 - 90 Days | |
BofA Securities, Inc. | | | 4.50 | | | | 12/15/22 | | | | 02/03/23 | | | | 482,275 | | | | 483,240 | | | Corporate Bonds | | | 31 - 90 Days | |
BofA Securities, Inc. | | | 4.50 | | | | 12/15/22 | | | | 02/03/23 | | | | 414,675 | | | | 415,504 | | | Corporate Bonds | | | 31 - 90 Days | |
BofA Securities, Inc. | | | 4.50 | | | | 12/15/22 | | | | 02/03/23 | | | | 137,520 | | | | 137,795 | | | Corporate Bonds | | | 31 - 90 Days | |
BofA Securities, Inc. | | | 4.50 | | | | 12/15/22 | | | | 02/03/23 | | | | 307,419 | | | | 308,034 | | | Corporate Bonds | | | 31 - 90 Days | |
BofA Securities, Inc. | | | 4.50 | | | | 12/15/22 | | | | 02/03/23 | | | | 429,000 | | | | 429,858 | | | Corporate Bonds | | | 31 - 90 Days | |
BofA Securities, Inc. | | | 4.50 | | | | 12/15/22 | | | | 02/03/23 | | | | 334,200 | | | | 334,868 | | | Corporate Bonds | | | 31 - 90 Days | |
BofA Securities, Inc. | | | 4.50 | | | | 12/15/22 | | | | 02/03/23 | | | | 276,925 | | | | 277,479 | | | Corporate Bonds | | | 31 - 90 Days | |
BofA Securities, Inc. | | | 4.50 | | | | 12/15/22 | | | | 02/03/23 | | | | 130,611 | | | | 130,872 | | | Corporate Bonds | | | 31 - 90 Days | |
BofA Securities, Inc. | | | 4.50 | | | | 12/15/22 | | | | 02/03/23 | | | | 191,750 | | | | 192,134 | | | Corporate Bonds | | | 31 - 90 Days | |
BofA Securities, Inc. | | | 4.50 | | | | 12/15/22 | | | | 02/03/23 | | | | 128,106 | | | | 128,362 | | | Corporate Bonds | | | 31 - 90 Days | |
BofA Securities, Inc. | | | 4.50 | | | | 12/15/22 | | | | 02/03/23 | | | | 255,484 | | | | 255,995 | | | Corporate Bonds | | | 31 - 90 Days | |
BofA Securities, Inc. | | | 4.50 | | | | 12/15/22 | | | | 02/03/23 | | | | 243,285 | | | | 243,772 | | | Corporate Bonds | | | 31 - 90 Days | |
BofA Securities, Inc. | | | 4.50 | | | | 12/15/22 | | | | 02/03/23 | | | | 150,868 | | | | 151,169 | | | Corporate Bonds | | | 31 - 90 Days | |
BofA Securities, Inc. | | | 4.50 | | | | 12/15/22 | | | | 02/03/23 | | | | 577,821 | | | | 578,977 | | | Corporate Bonds | | | 31 - 90 Days | |
BofA Securities, Inc. | | | 4.50 | | | | 12/15/22 | | | | 02/03/23 | | | | 125,100 | | | | 125,350 | | | Corporate Bonds | | | 31 - 90 Days | |
BofA Securities, Inc. | | | 4.50 | | | | 12/15/22 | | | | 02/03/23 | | | | 347,156 | | | | 347,851 | | | Corporate Bonds | | | 31 - 90 Days | |
BofA Securities, Inc. | | | 4.50 | | | | 12/15/22 | | | | 02/03/23 | | | | 143,280 | | | | 143,567 | | | Corporate Bonds | | | 31 - 90 Days | |
BofA Securities, Inc. | | | 4.50 | | | | 12/15/22 | | | | 02/03/23 | | | | 228,043 | | | | 228,499 | | | Corporate Bonds | | | 31 - 90 Days | |
BofA Securities, Inc. | | | 4.50 | | | | 12/15/22 | | | | 02/03/23 | | | | 402,369 | | | | 403,173 | | | Corporate Bonds | | | 31 - 90 Days | |
BofA Securities, Inc. | | | 4.50 | | | | 12/15/22 | | | | 02/03/23 | | | | 320,850 | | | | 321,492 | | | Corporate Bonds | | | 31 - 90 Days | |
BofA Securities, Inc. | | | 4.50 | | | | 12/15/22 | | | | 02/03/23 | | | | 322,245 | | | | 322,889 | | | Corporate Bonds | | | 31 - 90 Days | |
BofA Securities, Inc. | | | 4.50 | | | | 12/15/22 | | | | 02/03/23 | | | | 234,659 | | | | 235,128 | | | Corporate Bonds | | | 31 - 90 Days | |
BofA Securities, Inc. | | | 4.50 | | | | 12/15/22 | | | | 02/03/23 | | | | 141,470 | | | | 141,753 | | | Corporate Bonds | | | 31 - 90 Days | |
BofA Securities, Inc. | | | 4.50 | | | | 12/15/22 | | | | 02/03/23 | | | | 212,063 | | | | 212,487 | | | Corporate Bonds | | | 31 - 90 Days | |
BofA Securities, Inc. | | | 4.50 | | | | 12/15/22 | | | | 02/03/23 | | | | 416,377 | | | | 417,210 | | | Corporate Bonds | | | 31 - 90 Days | |
BofA Securities, Inc. | | | 4.50 | | | | 12/15/22 | | | | 02/03/23 | | | | 220,125 | | | | 220,565 | | | Corporate Bonds | | | 31 - 90 Days | |
BofA Securities, Inc. | | | 4.50 | | | | 12/15/22 | | | | 02/03/23 | | | | 265,538 | | | | 266,069 | | | Corporate Bonds | | | 31 - 90 Days | |
BofA Securities, Inc. | | | 4.50 | | | | 12/15/22 | | | | 02/03/23 | | | | 928,880 | | | | 930,738 | | | Corporate Bonds | | | 31 - 90 Days | |
BofA Securities, Inc. | | | 4.50 | | | | 12/15/22 | | | | 02/03/23 | | | | 465,289 | | | | 466,219 | | | Corporate Bonds | | | 31 - 90 Days | |
BofA Securities, Inc. | | | 4.50 | | | | 12/15/22 | | | | 02/03/23 | | | | 1,247,380 | | | | 1,249,875 | | | Corporate Bonds | | | 31 - 90 Days | |
BofA Securities, Inc. | | | 4.50 | | | | 12/15/22 | | | | 02/03/23 | | | | 192,750 | | | | 193,136 | | | Foreign Agency Obligations | | | 31 - 90 Days | |
BofA Securities, Inc. | | | 4.53 | | | | 12/15/22 | | | | 02/03/23 | | | | 742,000 | | | | 743,494 | | | Corporate Bonds | | | 31 - 90 Days | |
BofA Securities, Inc. | | | 4.55 | | | | 12/15/22 | | | | 02/03/23 | | | | 838,500 | | | | 840,196 | | | Corporate Bonds | | | 31 - 90 Days | |
BofA Securities, Inc. | | | 4.55 | | | | 12/15/22 | | | | 02/03/23 | | | | 257,950 | | | | 258,472 | | �� | Corporate Bonds | | | 31 - 90 Days | |
BofA Securities, Inc. | | | 4.55 | | | | 12/15/22 | | | | 02/03/23 | | | | 443,000 | | | | 443,896 | | | Corporate Bonds | | | 31 - 90 Days | |
BofA Securities, Inc. | | | 4.65 | | | | 12/15/22 | | | | 02/03/23 | | | | 1,423,406 | | | | 1,426,348 | | | Corporate Bonds | | | 31 - 90 Days | |
BofA Securities, Inc. | | | 4.75 | | | | 12/15/22 | | | | 02/03/23 | | | | 1,322,190 | | | | 1,324,981 | | | Corporate Bonds | | | 31 - 90 Days | |
Barclays Capital, Inc. | | | 4.75 | (b) | | | 12/15/22 | | | | Open | | | | 118,356 | | | | 118,606 | | | Corporate Bonds | | | Open/Demand | |
Barclays Capital, Inc. | | | 4.75 | (b) | | | 12/16/22 | | | | Open | | | | 231,219 | | | | 231,615 | | | Corporate Bonds | | | Open/Demand | |
BNP Paribas S.A. | | | 4.85 | (b) | | | 12/19/22 | | | | Open | | | | 635,775 | | | | 636,803 | | | Corporate Bonds | | | Open/Demand | |
Barclays Capital, Inc. | | | 4.75 | (b) | | | 12/20/22 | | | | Open | | | | 557,060 | | | | 557,869 | | | Corporate Bonds | | | Open/Demand | |
| | |
| 104 | | 2 0 2 2 BLACK ROCK ANNUAL REPORT TO SHAREHOLDERS |
| | |
Schedule of Investments (continued) December 31, 2022 | | BlackRock Limited Duration Income Trust (BLW) |
Reverse Repurchase Agreements (continued)
| | | | | | | | | | | | | | | | | | | | | | | | | | |
| | | | | | | | |
| Counterparty | |
| Interest
Rate |
| |
| Trade
Date |
| |
| Maturity
Date |
(a) | | | Face Value | | |
| Face Value
Including
Accrued Interest |
| | Type of Non-Cash Underlying Collateral | |
| Remaining
Contractual Maturity of the Agreements |
(a) |
| | | | | | | |
RBC Capital Markets LLC | | | 4.50 | %(b) | | | 12/21/22 | | | | Open | | | $ | 1,489,800 | | | $ | 1,491,662 | | | Corporate Bonds | | | Open/Demand | |
RBC Capital Markets LLC | | | 4.50 | (b) | | | 12/21/22 | | | | Open | | | | 111,981 | | | | 112,121 | | | Corporate Bonds | | | Open/Demand | |
RBC Capital Markets LLC | | | 4.50 | (b) | | | 12/21/22 | | | | Open | | | | 130,863 | | | | 131,026 | | | Corporate Bonds | | | Open/Demand | |
RBC Capital Markets LLC | | | 4.50 | (b) | | | 12/21/22 | | | | Open | | | | 156,418 | | | | 156,613 | | | Corporate Bonds | | | Open/Demand | |
RBC Capital Markets LLC | | | 4.50 | (b) | | | 12/21/22 | | | | Open | | | | 130,263 | | | | 130,425 | | | Corporate Bonds | | | Open/Demand | |
RBC Capital Markets LLC | | | 4.50 | (b) | | | 12/21/22 | | | | Open | | | | 94,500 | | | | 94,618 | | | Corporate Bonds | | | Open/Demand | |
RBC Capital Markets LLC | | | 4.50 | (b) | | | 12/21/22 | | | | Open | | | | 157,050 | | | | 157,246 | | | Corporate Bonds | | | Open/Demand | |
RBC Capital Markets LLC | | | 4.50 | (b) | | | 12/21/22 | | | | Open | | | | 101,000 | | | | 101,126 | | | Corporate Bonds | | | Open/Demand | |
TD Securities (USA) LLC | | | 4.49 | (b) | | | 12/21/22 | | | | Open | | | | 61,128 | | | | 61,204 | | | Corporate Bonds | | | Open/Demand | |
TD Securities (USA) LLC | | | 4.50 | (b) | | | 12/21/22 | | | | Open | | | | 139,744 | | | | 139,918 | | | Corporate Bonds | | | Open/Demand | |
TD Securities (USA) LLC | | | 4.50 | (b) | | | 12/21/22 | | | | Open | | | | 175,056 | | | | 175,275 | | | Corporate Bonds | | | Open/Demand | |
TD Securities (USA) LLC | | | 4.50 | (b) | | | 12/21/22 | | | | Open | | | | 152,400 | | | | 152,591 | | | Corporate Bonds | | | Open/Demand | |
TD Securities (USA) LLC | | | 4.65 | (b) | | | 12/21/22 | | | | Open | | | | 100,303 | | | | 100,432 | | | Corporate Bonds | | | Open/Demand | |
BNP Paribas S.A. | | | 4.50 | (b) | | | 12/27/22 | | | | Open | | | | 215,698 | | | | 215,805 | | | Corporate Bonds | | | Open/Demand | |
Barclays Bank PLC | | | 4.10 | (b) | | | 12/28/22 | | | | Open | | | | 2,437,500 | | | | 2,438,333 | | | Corporate Bonds | | | Open/Demand | |
Barclays Bank PLC | | | 4.65 | (b) | | | 12/28/22 | | | | Open | | | | 288,405 | | | | 288,517 | | | Foreign Agency Obligations | | | Open/Demand | |
Barclays Capital, Inc. | | | (3.00 | )(b) | | | 12/28/22 | | | | Open | | | | 26,865 | | | | 26,858 | | | Corporate Bonds | | | Open/Demand | |
Barclays Capital, Inc. | | | 4.50 | (b) | | | 12/28/22 | | | | Open | | | | 144,500 | | | | 144,554 | | | Capital Trusts | | | Open/Demand | |
Barclays Capital, Inc. | | | 4.70 | (b) | | | 12/28/22 | | | | Open | | | | 423,400 | | | | 423,566 | | | Corporate Bonds | | | Open/Demand | |
Barclays Capital, Inc. | | | 4.70 | (b) | | | 12/28/22 | | | | Open | | | | 386,000 | | | | 386,151 | | | Corporate Bonds | | | Open/Demand | |
Barclays Capital, Inc. | | | 4.75 | (b) | | | 12/28/22 | | | | Open | | | | 223,125 | | | | 223,213 | | | Corporate Bonds | | | Open/Demand | |
Barclays Capital, Inc. | | | 4.75 | (b) | | | 12/28/22 | | | | Open | | | | 954,611 | | | | 954,989 | | | Corporate Bonds | | | Open/Demand | |
Barclays Capital, Inc. | | | 4.75 | (b) | | | 12/28/22 | | | | Open | | | | 141,063 | | | | 141,118 | | | Corporate Bonds | | | Open/Demand | |
Barclays Capital, Inc. | | | 4.75 | (b) | | | 12/28/22 | | | | Open | | | | 335,711 | | | | 335,844 | | | Corporate Bonds | | | Open/Demand | |
Barclays Capital, Inc. | | | 4.75 | (b) | | | 12/28/22 | | | | Open | | | | 711,200 | | | | 711,482 | | | Corporate Bonds | | | Open/Demand | |
Barclays Capital, Inc. | | | 4.75 | (b) | | | 12/28/22 | | | | Open | | | | 458,932 | | | | 459,114 | | | Corporate Bonds | | | Open/Demand | |
Barclays Capital, Inc. | | | 4.75 | (b) | | | 12/28/22 | | | | Open | | | | 2,083,070 | | | | 2,083,895 | | | Corporate Bonds | | | Open/Demand | |
Barclays Capital, Inc. | | | 4.75 | (b) | | | 12/28/22 | | | | Open | | | | 837,520 | | | | 837,852 | | | Corporate Bonds | | | Open/Demand | |
Barclays Capital, Inc. | | | 4.75 | (b) | | | 12/28/22 | | | | Open | | | | 223,450 | | | | 223,538 | | | Corporate Bonds | | | Open/Demand | |
Barclays Capital, Inc. | | | 4.75 | (b) | | | 12/28/22 | | | | Open | | | | 1,441,485 | | | | 1,442,056 | | | Corporate Bonds | | | Open/Demand | |
BNP Paribas S.A. | | | 4.65 | (b) | | | 12/28/22 | | | | Open | | | | 1,074,804 | | | | 1,075,220 | | | Corporate Bonds | | | Open/Demand | |
BNP Paribas S.A. | | | 4.68 | (b) | | | 12/28/22 | | | | Open | | | | 52,195 | | | | 52,215 | | | Corporate Bonds | | | Open/Demand | |
BNP Paribas S.A. | | | 4.70 | (b) | | | 12/28/22 | | | | Open | | | | 75,480 | | | | 75,510 | | | Corporate Bonds | | | Open/Demand | |
BNP Paribas S.A. | | | 4.70 | (b) | | | 12/28/22 | | | | Open | | | | 2,194,625 | | | | 2,195,485 | | | Corporate Bonds | | | Open/Demand | |
BNP Paribas S.A. | | | 4.74 | (b) | | | 12/28/22 | | | | Open | | | | 459,420 | | | | 459,601 | | | Corporate Bonds | | | Open/Demand | |
BNP Paribas S.A. | | | 4.75 | (b) | | | 12/28/22 | | | | Open | | | | 756,585 | | | | 756,884 | | | Corporate Bonds | | | Open/Demand | |
BNP Paribas S.A. | | | 4.80 | (b) | | | 12/28/22 | | | | Open | | | | 238,738 | | | | 238,833 | | | Corporate Bonds | | | Open/Demand | |
BNP Paribas S.A. | | | 4.80 | (b) | | | 12/28/22 | | | | Open | | | | 310,819 | | | | 310,943 | | | Corporate Bonds | | | Open/Demand | |
BNP Paribas S.A. | | | 4.80 | (b) | | | 12/28/22 | | | | Open | | | | 1,118,542 | | | | 1,118,990 | | | Corporate Bonds | | | Open/Demand | |
BNP Paribas S.A. | | | 4.80 | (b) | | | 12/28/22 | | | | Open | | | | 130,475 | | | | 130,527 | | | Corporate Bonds | | | Open/Demand | |
BNP Paribas S.A. | | | 4.80 | (b) | | | 12/28/22 | | | | Open | | | | 167,090 | | | | 167,157 | | | Corporate Bonds | | | Open/Demand | |
BNP Paribas S.A. | | | 4.85 | (b) | | | 12/28/22 | | | | Open | | | | 232,879 | | | | 232,973 | | | Corporate Bonds | | | Open/Demand | |
BNP Paribas S.A. | | | 4.85 | (b) | | | 12/28/22 | | | | Open | | | | 1,144,587 | | | | 1,145,050 | | | Corporate Bonds | | | Open/Demand | |
BNP Paribas S.A. | | | 4.88 | (b) | | | 12/28/22 | | | | Open | | | | 704,947 | | | | 705,234 | | | Corporate Bonds | | | Open/Demand | |
Credit Agricole Corporate and Investment Bank | | | 4.55 | (b) | | | 12/28/22 | | | | Open | | | | 496,915 | | | | 497,103 | | | Corporate Bonds | | | Open/Demand | |
Credit Agricole Corporate and Investment Bank | | | 4.59 | (b) | | | 12/28/22 | | | | Open | | | | 314,150 | | | | 314,270 | | | Corporate Bonds | | | Open/Demand | |
Credit Agricole Corporate and Investment Bank | | | 4.59 | (b) | | | 12/28/22 | | | | Open | | | | 262,990 | | | | 263,091 | | | Corporate Bonds | | | Open/Demand | |
Credit Agricole Corporate and Investment Bank | | | 4.59 | (b) | | | 12/28/22 | | | | Open | | | | 365,527 | | | | 365,667 | | | Corporate Bonds | | | Open/Demand | |
Credit Agricole Corporate and Investment Bank | | | 4.59 | (b) | | | 12/28/22 | | | | Open | | | | 597,120 | | | | 597,348 | | | Corporate Bonds | | | Open/Demand | |
Credit Agricole Corporate and Investment Bank | | | 4.60 | (b) | | | 12/28/22 | | | | Open | | | | 636,635 | | | | 636,879 | | | Corporate Bonds | | | Open/Demand | |
Credit Agricole Corporate and Investment Bank | | | 4.63 | (b) | | | 12/28/22 | | | | Open | | | | 142,085 | | | | 142,140 | | | Foreign Agency Obligations | | | Open/Demand | |
Credit Suisse Securities (USA) LLC | | | 2.00 | (b) | | | 12/28/22 | | | | Open | | | | 131,520 | | | | 131,542 | | | Corporate Bonds | | | Open/Demand | |
Credit Suisse Securities (USA) LLC | | | 4.60 | (b) | | | 12/28/22 | | | | Open | | | | 106,531 | | | | 106,572 | | | Corporate Bonds | | | Open/Demand | |
HSBC Securities (USA), Inc. | | | 4.50 | (b) | | | 12/28/22 | | | | Open | | | | 289,766 | | | | 289,875 | | | Corporate Bonds | | | Open/Demand | |
HSBC Securities (USA), Inc. | | | 4.50 | (b) | | | 12/28/22 | | | | Open | | | | 270,425 | | | | 270,526 | | | Capital Trusts | | | Open/Demand | |
| | |
SCHEDULE OF INVESTMENTS | | 105 |
| | |
Schedule of Investments (continued) December 31, 2022 | | BlackRock Limited Duration Income Trust (BLW) |
Reverse Repurchase Agreements (continued)
| | | | | | | | | | | | | | | | | | | | | | | | | | |
| | | | | | | | |
| Counterparty | |
| Interest
Rate |
| |
| Trade
Date |
| |
| Maturity
Date |
(a) | | | Face Value | | |
| Face Value
Including
Accrued Interest |
| | Type of Non-Cash Underlying Collateral | |
| Remaining
Contractual Maturity of the Agreements |
(a) |
| | | | | | | |
HSBC Securities (USA), Inc. | | | 4.50 | %(b) | | | 12/28/22 | | | | Open | | | $ | 925,000 | | | $ | 925,347 | | | Corporate Bonds | | | Open/Demand | |
HSBC Securities (USA), Inc. | | | 4.50 | (b) | | | 12/28/22 | | | | Open | | | | 670,312 | | | | 670,564 | | | Corporate Bonds | | | Open/Demand | |
HSBC Securities (USA), Inc. | | | 4.50 | (b) | | | 12/28/22 | | | | Open | | | | 812,500 | | | | 812,805 | | | Corporate Bonds | | | Open/Demand | |
HSBC Securities (USA), Inc. | | | 4.50 | (b) | | | 12/28/22 | | | | Open | | | | 900,000 | | | | 900,337 | | | Corporate Bonds | | | Open/Demand | |
HSBC Securities (USA), Inc. | | | 4.50 | (b) | | | 12/28/22 | | | | Open | | | | 701,250 | | | | 701,513 | | | Corporate Bonds | | | Open/Demand | |
Nomura Securities International, Inc. | | | 4.35 | (b) | | | 12/28/22 | | | | Open | | | | 777,094 | | | | 777,375 | | | Corporate Bonds | | | Open/Demand | |
Nomura Securities International, Inc. | | | 4.35 | (b) | | | 12/28/22 | | | | Open | | | | 693,000 | | | | 693,251 | | | Corporate Bonds | | | Open/Demand | |
Nomura Securities International, Inc. | | | 4.48 | (b) | | | 12/28/22 | | | | Open | | | | 187,250 | | | | 187,320 | | | Corporate Bonds | | | Open/Demand | |
Nomura Securities International, Inc. | | | 4.48 | (b) | | | 12/28/22 | | | | Open | | | | 625,657 | | | | 625,891 | | | Corporate Bonds | | | Open/Demand | |
Nomura Securities International, Inc. | | | 4.48 | (b) | | | 12/28/22 | | | | Open | | | | 283,208 | | | | 283,313 | | | Corporate Bonds | | | Open/Demand | |
Nomura Securities International, Inc. | | | 4.48 | (b) | | | 12/28/22 | | | | Open | | | | 185,209 | | | | 185,278 | | | Corporate Bonds | | | Open/Demand | |
Nomura Securities International, Inc. | | | 4.48 | (b) | | | 12/28/22 | | | | Open | | | | 192,780 | | | | 192,852 | | | Corporate Bonds | | | Open/Demand | |
Nomura Securities International, Inc. | | | 4.48 | (b) | | | 12/28/22 | | | | Open | | | | 175,964 | | | | 176,029 | | | Corporate Bonds | | | Open/Demand | |
Nomura Securities International, Inc. | | | 4.48 | (b) | | | 12/28/22 | | | | Open | | | | 288,876 | | | | 288,984 | | | Corporate Bonds | | | Open/Demand | |
Nomura Securities International, Inc. | | | 4.48 | (b) | | | 12/28/22 | | | | Open | | | | 317,250 | | | | 317,368 | | | Corporate Bonds | | | Open/Demand | |
Nomura Securities International, Inc. | | | 4.50 | (b) | | | 12/28/22 | | | | Open | | | | 157,690 | | | | 157,749 | | | Foreign Agency Obligations | | | Open/Demand | |
RBC Capital Markets LLC | | | 4.50 | (b) | | | 12/28/22 | | | | Open | | | | 339,500 | | | | 339,627 | | | Corporate Bonds | | | Open/Demand | |
RBC Capital Markets LLC | | | 4.63 | (b) | | | 12/28/22 | | | | Open | | | | 161,494 | | | | 161,556 | | | Corporate Bonds | | | Open/Demand | |
RBC Capital Markets LLC | | | 4.63 | (b) | | | 12/28/22 | | | | Open | | | | 267,840 | | | | 267,943 | | | Corporate Bonds | | | Open/Demand | |
RBC Capital Markets LLC | | | 4.63 | (b) | | | 12/28/22 | | | | Open | | | | 574,795 | | | | 575,017 | | | Corporate Bonds | | | Open/Demand | |
RBC Capital Markets LLC | | | 4.63 | (b) | | | 12/28/22 | | | | Open | | | | 225,541 | | | | 225,628 | | | Corporate Bonds | | | Open/Demand | |
RBC Capital Markets LLC | | | 4.63 | (b) | | | 12/28/22 | | | | Open | | | | 338,100 | | | | 338,230 | | | Corporate Bonds | | | Open/Demand | |
RBC Capital Markets LLC | | | 4.65 | (b) | | | 12/28/22 | | | | Open | | | | 292,478 | | | | 292,591 | | | Corporate Bonds | | | Open/Demand | |
RBC Capital Markets LLC | | | 4.65 | (b) | | | 12/28/22 | | | | Open | | | | 241,400 | | | | 241,494 | | | Corporate Bonds | | | Open/Demand | |
RBC Capital Markets LLC | | | 4.65 | (b) | | | 12/28/22 | | | | Open | | | | 313,500 | | | | 313,621 | | | Corporate Bonds | | | Open/Demand | |
RBC Capital Markets LLC | | | 4.65 | (b) | | | 12/28/22 | | | | Open | | | | 492,975 | | | | 493,166 | | | Corporate Bonds | | | Open/Demand | |
RBC Capital Markets LLC | | | 4.65 | (b) | | | 12/28/22 | | | | Open | | | | 259,539 | | | | 259,639 | | | Corporate Bonds | | | Open/Demand | |
RBC Capital Markets LLC | | | 4.65 | (b) | | | 12/28/22 | | | | Open | | | | 249,555 | | | | 249,652 | | | Corporate Bonds | | | Open/Demand | |
RBC Capital Markets LLC | | | 4.65 | (b) | | | 12/28/22 | | | | Open | | | | 269,325 | | | | 269,429 | | | Corporate Bonds | | | Open/Demand | |
RBC Capital Markets LLC | | | 4.65 | (b) | | | 12/28/22 | | | | Open | | | | 270,969 | | | | 271,074 | | | Corporate Bonds | | | Open/Demand | |
RBC Capital Markets LLC | | | 4.65 | (b) | | | 12/28/22 | | | | Open | | | | 267,435 | | | | 267,539 | | | Corporate Bonds | | | Open/Demand | |
RBC Capital Markets LLC | | | 4.65 | (b) | | | 12/28/22 | | | | Open | | | | 124,450 | | | | 124,498 | | | Corporate Bonds | | | Open/Demand | |
RBC Capital Markets LLC | | | 4.65 | (b) | | | 12/28/22 | | | | Open | | | | 227,050 | | | | 227,138 | | | Corporate Bonds | | | Open/Demand | |
RBC Capital Markets LLC | | | 4.65 | (b) | | | 12/28/22 | | | | Open | | | | 304,808 | | | | 304,926 | | | Corporate Bonds | | | Open/Demand | |
RBC Capital Markets LLC | | | 4.65 | (b) | | | 12/28/22 | | | | Open | | | | 328,200 | | | | 328,327 | | | Corporate Bonds | | | Open/Demand | |
RBC Capital Markets LLC | | | 4.65 | (b) | | | 12/28/22 | | | | Open | | | | 881,667 | | | | 882,009 | | | Corporate Bonds | | | Open/Demand | |
RBC Capital Markets LLC | | | 4.65 | (b) | | | 12/28/22 | | | | Open | | | | 532,657 | | | | 532,864 | | | Corporate Bonds | | | Open/Demand | |
RBC Capital Markets LLC | | | 4.65 | (b) | | | 12/28/22 | | | | Open | | | | 490,145 | | | | 490,335 | | | Corporate Bonds | | | Open/Demand | |
RBC Capital Markets LLC | | | 4.65 | (b) | | | 12/28/22 | | | | Open | | | | 278,000 | | | | 278,108 | | | Corporate Bonds | | | Open/Demand | |
RBC Capital Markets LLC | | | 4.65 | (b) | | | 12/28/22 | | | | Open | | | | 264,690 | | | | 264,793 | | | Corporate Bonds | | | Open/Demand | |
RBC Capital Markets LLC | | | 4.65 | (b) | | | 12/28/22 | | | | Open | | | | 498,482 | | | | 498,676 | | | Corporate Bonds | | | Open/Demand | |
RBC Capital Markets LLC | | | 4.65 | (b) | | | 12/28/22 | | | | Open | | | | 98,201 | | | | 98,239 | | | Corporate Bonds | | | Open/Demand | |
RBC Capital Markets LLC | | | 4.65 | (b) | | | 12/28/22 | | | | Open | | | | 279,000 | | | | 279,108 | | | Corporate Bonds | | | Open/Demand | |
RBC Capital Markets LLC | | | 4.65 | (b) | | | 12/28/22 | | | | Open | | | | 292,000 | | | | 292,113 | | | Corporate Bonds | | | Open/Demand | |
RBC Capital Markets LLC | | | 4.65 | (b) | | | 12/28/22 | | | | Open | | | | 637,522 | | | | 637,770 | | | Corporate Bonds | | | Open/Demand | |
RBC Capital Markets LLC | | | 4.65 | (b) | | | 12/28/22 | | | | Open | | | | 668,930 | | | | 669,189 | | | Corporate Bonds | | | Open/Demand | |
RBC Capital Markets LLC | | | 4.65 | (b) | | | 12/28/22 | | | | Open | | | | 278,509 | | | | 278,617 | | | Corporate Bonds | | | Open/Demand | |
RBC Capital Markets LLC | | | 4.65 | (b) | | | 12/28/22 | | | | Open | | | | 279,645 | | | | 279,753 | | | Corporate Bonds | | | Open/Demand | |
RBC Capital Markets LLC | | | 4.65 | (b) | | | 12/28/22 | | | | Open | | | | 189,945 | | | | 190,019 | | | Corporate Bonds | | | Open/Demand | |
RBC Capital Markets LLC | | | 4.65 | (b) | | | 12/28/22 | | | | Open | | | | 196,080 | | | | 196,156 | | | Corporate Bonds | | | Open/Demand | |
RBC Capital Markets LLC | | | 4.65 | (b) | | | 12/28/22 | | | | Open | | | | 275,790 | | | | 275,897 | | | Corporate Bonds | | | Open/Demand | |
RBC Capital Markets LLC | | | 4.65 | (b) | | | 12/28/22 | | | | Open | | | | 423,000 | | | | 423,164 | | | Corporate Bonds | | | Open/Demand | |
RBC Capital Markets LLC | | | 4.65 | (b) | | | 12/28/22 | | | | Open | | | | 460,845 | | | | 461,024 | | | Corporate Bonds | | | Open/Demand | |
RBC Capital Markets LLC | | | 4.67 | (b) | | | 12/28/22 | | | | Open | | | | 550,550 | | | | 550,764 | | | Corporate Bonds | | | Open/Demand | |
TD Securities (USA) LLC | | | 4.49 | (b) | | | 12/28/22 | | | | Open | | | | 157,140 | | | | 157,199 | | | Corporate Bonds | | | Open/Demand | |
TD Securities (USA) LLC | | | 4.49 | (b) | | | 12/28/22 | | | | Open | | | | 186,775 | | | | 186,845 | | | Corporate Bonds | | | Open/Demand | |
TD Securities (USA) LLC | | | 4.49 | (b) | | | 12/28/22 | | | | Open | | | | 265,719 | | | | 265,818 | | | Corporate Bonds | | | Open/Demand | |
TD Securities (USA) LLC | | | 4.49 | (b) | | | 12/28/22 | | | | Open | | | | 293,318 | | | | 293,427 | | | Corporate Bonds | | | Open/Demand | |
TD Securities (USA) LLC | | | 4.49 | (b) | | | 12/28/22 | | | | Open | | | | 532,325 | | | | 532,524 | | | Corporate Bonds | | | Open/Demand | |
TD Securities (USA) LLC | | | 4.60 | (b) | | | 12/28/22 | | | | Open | | | | 145,081 | | | | 145,137 | | | Corporate Bonds | | | Open/Demand | |
TD Securities (USA) LLC | | | 4.60 | (b) | | | 12/28/22 | | | | Open | | | | 125,103 | | | | 125,150 | | | Corporate Bonds | | | Open/Demand | |
TD Securities (USA) LLC | | | 4.62 | (b) | | | 12/28/22 | | | | Open | | | | 1,118,700 | | | | 1,119,131 | | | Corporate Bonds | | | Open/Demand | |
| | |
| 106 | | 2 0 2 2 BLACK ROCK ANNUAL REPORT TO SHAREHOLDERS |
| | |
Schedule of Investments (continued) December 31, 2022 | | BlackRock Limited Duration Income Trust (BLW) |
Reverse Repurchase Agreements (continued)
| | | | | | | | | | | | | | | | | | | | | | | | |
| | | | | | | | |
| Counterparty | |
| Interest
Rate |
| | Trade Date | |
| Maturity
Date |
(a) | | | Face Value | | |
| Face Value
Including Accrued Interest |
| | Type of Non-Cash Underlying Collateral | |
| Remaining
Contractual Maturity of the Agreements |
(a) |
| | | | | | | |
TD Securities (USA) LLC | | | 4.64 | %(b) | | 12/28/22 | | | Open | | | $ | 623,819 | | | $ | 624,060 | | | Corporate Bonds | | | Open/Demand | |
TD Securities (USA) LLC | | | 4.67 | (b) | | 12/28/22 | | | Open | | | | 388,384 | | | | 388,535 | | | Corporate Bonds | | | Open/Demand | |
TD Securities (USA) LLC | | | 4.67 | (b) | | 12/28/22 | | | Open | | | | 264,588 | | | | 264,690 | | | Corporate Bonds | | | Open/Demand | |
TD Securities (USA) LLC | | | 4.67 | (b) | | 12/28/22 | | | Open | | | | 321,275 | | | | 321,400 | | | Corporate Bonds | | | Open/Demand | |
TD Securities (USA) LLC | | | 4.67 | (b) | | 12/28/22 | | | Open | | | | 286,303 | | | | 286,414 | | | Corporate Bonds | | | Open/Demand | |
TD Securities (USA) LLC | | | 4.67 | (b) | | 12/28/22 | | | Open | | | | 285,520 | | | | 285,631 | | | Corporate Bonds | | | Open/Demand | |
TD Securities (USA) LLC | | | 4.67 | (b) | | 12/28/22 | | | Open | | | | 280,403 | | | | 280,512 | | | Corporate Bonds | | | Open/Demand | |
Barclays Capital, Inc. | | | 4.75 | (b) | | 12/30/22 | | | Open | | | | 191,595 | | | | 191,595 | | | Corporate Bonds | | | Open/Demand | |
| | | | | | | | | | | | | | | | | | | | | | | | |
| | | | | | | |
| | | | | | | | | | | | $ | 274,713,779 | | | $ | 275,638,800 | | | | | | | |
| | | | | | | | | | | | | | | | | | | | | | | | |
| | (a) | Certain agreements have no stated maturity and can be terminated by either party at any time. | |
| | (b) | Variable rate security. Rate as of period end and maturity is the date the principal owed can be recovered through demand. | |
Derivative Financial Instruments Outstanding as of Period End
Futures Contracts
| | | | | | | | | | | | | | | | |
| Description | | Number of Contracts | | | Expiration Date | | | Notional Amount (000) | | | Value/ Unrealized Appreciation (Depreciation) | |
| | | | |
Long Contracts | | | | | | | | | | | | | | | | |
10-Year U.S. Ultra Long Treasury Note | | | 119 | | | | 03/22/23 | | | $ | 14,029 | | | $ | (165,639 | ) |
2-Year U.S. Treasury Note | | | 1,605 | | | | 03/31/23 | | | | 329,025 | | | | (212,043 | ) |
5-Year U.S. Treasury Note | | | 377 | | | | 03/31/23 | | | | 40,651 | | | | (299,926 | ) |
| | | | | | | | | | | | | | | | |
| | | | |
| | | | | | | | | | | | | | | (677,608 | ) |
| | | | | | | | | | | | | | | | |
| | | | |
Short Contracts | | | | | | | | | | | | | | | | |
10-Year Japanese Government Treasury Bonds | | | 34 | | | | 03/13/23 | | | | 37,684 | | | | 567,840 | |
10-Year U.S. Treasury Note | | | 618 | | | | 03/22/23 | | | | 69,303 | | | | 524,988 | |
U.S. Long Bond | | | 148 | | | | 03/22/23 | | | | 18,454 | | | | 81,716 | |
Ultra U.S. Treasury Bond | | | 65 | | | | 03/22/23 | | | | 8,680 | | | | 296,502 | |
| | | | | | | | | | | | | | | | |
| | | | |
| | | | | | | | | | | | | | | 1,471,046 | |
| | | | | | | | | | | | | | | | |
| | | | |
| | | | | | | | | | | | | | $ | 793,438 | |
| | | | | | | | | | | | | | | | |
Forward Foreign Currency Exchange Contracts
| | | | | | | | | | | | | | | | | | | | |
| Currency Purchased | | | Currency Sold | | | Counterparty | | Settlement Date | | | | Unrealized Appreciation (Depreciation) | |
| | | | | | | |
| USD | | | 1,099,103 | | | GBP | | | 901,000 | | | State Street Bank and Trust Co. | | 03/15/23 | | | | $ | 7,944 | |
| USD | | | 1,106,431 | | | GBP | | | 907,000 | | | State Street Bank and Trust Co. | | 03/15/23 | | | | | 8,006 | |
| | | | | | | | | | | | | | | | | | | | |
| | | | | | | |
| | | | | | | | | | | | | | | | | | | 15,950 | |
| | | | | | | | | | | | | | | | | | | | |
| | | | | | | |
| USD | | | 876,477 | | | EUR | | | 820,000 | | | Bank of America N.A. | | 03/15/23 | | | | | (5,501 | ) |
| USD | | | 4,577,970 | | | EUR | | | 4,283,000 | | | Bank of America N.A. | | 03/15/23 | | | | | (28,755 | ) |
| USD | | | 124,600 | | | EUR | | | 116,430 | | | JPMorgan Chase Bank N.A. | | 03/15/23 | | | | | (630 | ) |
| USD | | | 266,243 | | | EUR | | | 251,250 | | | The Bank of New York Mellon | | 03/15/23 | | | | | (3,997 | ) |
| | | | | | | | | | | | | | | | | | | | |
| | | | | | | |
| | | | | | | | | | | | | | | | | | | (38,883 | ) |
| | | | | | | | | | | | | | | | | | | | |
| | | | | | | |
| | | | | | | | | | | | | | | | | | $ | (22,933 | ) |
| | | | | | | | | | | | | | | | | | | | |
| | |
SCHEDULE OF INVESTMENTS | | 107 |
| | |
Schedule of Investments (continued) December 31, 2022 | | BlackRock Limited Duration Income Trust (BLW) |
Centrally Cleared Credit Default Swaps — Buy Protection
| | | | | | | | | | | | | | | | | | | | | | | | | | |
| Reference Obligation/Index | | Financing Rate Paid by the Fund | | | Payment Frequency | | | Termination Date | | Notional Amount (000) | | | Value | | | Upfront Premium Paid (Received) | | | Unrealized Appreciation (Depreciation) | |
| | | | | | | |
CDX.NA.HY.39.V1 | | | 5.00 | % | | | Quarterly | | | 12/20/27 | | USD | 6,170 | | | | $ (47,931) | | | $ | 190,677 | | | $ | (238,608 | ) |
CDX.NA.IG.39.V1 | | | 1.00 | | | | Quarterly | | | 12/20/27 | | USD | 26,250 | | | | (219,412) | | | | (38,915 | ) | | | (180,497 | ) |
| | | | | | | | | | | | | | | | | | | | | | | | | | |
| | | | | | | |
| | | | | | | | | | | | | | | | $ | (267,343 | ) | | $ | 151,762 | | | $ | (419,105 | ) |
| | | | | | | | | | | | | | | | | | | | | | | | | | |
Centrally Cleared Interest Rate Swaps
| | | | | | | | | | | | | | | | | | | | | | | | | | | | | | | | | | |
Paid by the Fund | | Received by the Fund | | Effective Date | | Termination Date | | | Notional Amount (000) | | | Value | | | Upfront Premium Paid (Received) | | | Unrealized Appreciation (Depreciation) | |
| Rate | | Frequency | | Rate | | | Frequency |
| | | | | | | | | | |
| 3-Month LIBOR, 4.77% | | Quarterly | | | 1.57% | | | Semi-Annual | | N/A | | | 02/11/30 | | | | USD | | | | 5 | | | $ | (724 | ) | | $ | 153 | | | $ | (877 | ) |
| 1.61% | | Semi-Annual | | | 3-Month LIBOR, 4.77% | | | Quarterly | | N/A | | | 03/28/32 | | | | USD | | | | 9,300 | | | | 1,582,065 | | | | 138 | | | | 1,581,927 | |
| 1.66% | | Semi-Annual | | | 3-Month LIBOR, 4.77% | | | Quarterly | | N/A | | | 04/25/32 | | | | USD | | | | 9,020 | | | | 1,589,110 | | | | 137 | | | | 1,588,973 | |
| 1-Day SOFR, 4.32% | | Annual | | | 3.32% | | | Annual | | N/A | | | 11/28/42 | | | | USD | | | | 4,800 | | | | (95,596 | ) | | | 115 | | | | (95,711 | ) |
| 1-Day SOFR, 4.32% | | Annual | | | 3.31% | | | Annual | | N/A | | | 12/01/42 | | | | USD | | | | 1,600 | | | | (33,709 | ) | | | 39 | | | | (33,748 | ) |
| 3-Month LIBOR, 4.77% | | Quarterly | | | 1.93% | | | Semi-Annual | | N/A | | | 10/22/51 | | | | USD | | | | 2,500 | | | | (735,823 | ) | | | 76 | | | | (735,899 | ) |
| | | | | | | | | | | | | | | | | | | | | | | | | | | | | | | | | | |
| | | | | | | | | | |
| | | | | | | | | | | | | | | | | | | | | | | | $ | 2,305,323 | | | $ | 658 | | | $ | 2,304,665 | |
| | | | | | | | | | | | | | | | | | | | | | | | | | | | | | | | | | |
OTC Credit Default Swaps — Sell Protection
| | | | | | | | | | | | | | | | | | | | | | | | | | | | | | | | | | | | | | | | |
| | | | | | | |
| | Reference Obligation/Index | |
| Financing
Rate Received by the Fund |
| |
| Payment
Frequency |
| | Counterparty | |
| Termination
Date |
| |
| Credit
Rating |
(a) | |
| Notional
Amount (000) |
(b) | | | Value | | |
| Upfront
Premium Paid (Received |
) | |
| Unrealized
Appreciation (Depreciation |
) | | | | |
| | | | | | | |
| | | | | | | | | | | |
| | Casino, Guichard-Perrachon S.A | | | 5.00 | % | | | Quarterly | | | JPMorgan Chase Bank N.A. | | | 06/20/23 | | | | CCC+ | | | EUR | 20 | | | $ | (1,025 | ) | | $ | (845 | ) | | $ | (180 | ) | | | | |
| | Novafives S.A.S | | | 5.00 | | | | Quarterly | | | Citibank N.A. | | | 06/20/23 | | | | B- | | | EUR | 10 | | | | (315 | ) | | | (333 | ) | | | 18 | | | | | |
| | Thyssenkrupp AG | | | 1.00 | | | | Quarterly | | | Bank of America N.A. | | | 12/20/23 | | | | BB | | | EUR | 20 | | | | (444 | ) | | | (424 | ) | | | (20 | ) | | | | |
| | Virgin Media Finance PLC | | | 5.00 | | | | Quarterly | | | JPMorgan Chase Bank N.A. | | | 12/20/25 | | | | B | | | EUR | 10 | | | | 396 | | | | 836 | | | | (440 | ) | | | | |
| | Jaguar Land Rover Automotive PLC | | | 5.00 | | | | Quarterly | | | Bank of America N.A. | | | 12/20/26 | | | | B+ | | | EUR | 20 | | | | (3,026 | ) | | | (701 | ) | | | (2,325 | ) | | | | |
| | Jaguar Land Rover Automotive PLC | | | 5.00 | | | | Quarterly | | | Barclays Bank PLC | | | 12/20/26 | | | | B+ | | | EUR | 10 | | | | (1,537 | ) | | | 357 | | | | (1,894 | ) | | | | |
| | Jaguar Land Rover Automotive PLC | | | 5.00 | | | | Quarterly | | | Credit Suisse International | | | 12/20/26 | | | | B+ | | | EUR | 10 | | | | (1,493 | ) | | | 368 | | | | (1,861 | ) | | | | |
| | K&S AG | | | 5.00 | | | | Quarterly | | | JPMorgan Chase Bank N.A. | | | 12/20/26 | | | | BB+ | | | EUR | 10 | | | | 955 | | | | 722 | | | | 233 | | | | | |
| | CMA CGM SA | | | 5.00 | | | | Quarterly | | | Credit Suisse International | | | 06/20/27 | | | | BB+ | | | EUR | 40 | | | | 1,524 | | | | 1,658 | | | | (134 | ) | | | | |
| | CMA CGM SA | | | 5.00 | | | | Quarterly | | | JPMorgan Chase Bank N.A. | | | 06/20/27 | | | | BB+ | | | EUR | 10 | | | | 381 | | | | 331 | | | | 50 | | | | | |
| | CMA CGM SA | | | 5.00 | | | | Quarterly | | | JPMorgan Chase Bank N.A. | | | 06/20/27 | | | | BB+ | | | EUR | 10 | | | | 381 | | | | 331 | | | | 50 | | | | | |
| | Ladbrokes Coral Group Ltd | | | 1.00 | | | | Quarterly | | | JPMorgan Chase Bank N.A. | | | 06/20/27 | | | | BB | | | EUR | 10 | | | | (786 | ) | | | (1,006 | ) | | | 220 | | | | | |
| | Ladbrokes Coral Group Ltd | | | 1.00 | | | | Quarterly | | | JPMorgan Chase Bank N.A. | | | 06/20/27 | | | | BB | | | EUR | 40 | | | | (3,143 | ) | | | (6,420 | ) | | | 3,277 | | | | | |
| | Adler Real Estate AG | | | 5.00 | | | | Quarterly | | | Bank of America N.A. | | | 12/20/27 | | | | CCC- | | | EUR | 7 | | | | (1,861 | ) | | | (1,700 | ) | | | (161 | ) | | | | |
| | Adler Real Estate AG | | | 5.00 | | | | Quarterly | | | Barclays Bank PLC | | | 12/20/27 | | | | CCC- | | | EUR | 4 | | | | (1,119 | ) | | | (1,008 | ) | | | (111 | ) | | | | |
| | Adler Real Estate AG | | | 5.00 | | | | Quarterly | | | Barclays Bank PLC | | | 12/20/27 | | | | CCC- | | | EUR | 12 | | | | (3,145 | ) | | | (2,833 | ) | | | (312 | ) | | | | |
| | Adler Real Estate AG | | | 5.00 | | | | Quarterly | | | Citibank N.A. | | | 12/20/27 | | | | CCC- | | | EUR | 4 | | | | (913 | ) | | | (845 | ) | | | (68 | ) | | | | |
| | Adler Real Estate AG | | | 5.00 | | | | Quarterly | | | JPMorgan Chase Bank N.A. | | | 12/20/27 | | | | CCC- | | | EUR | 8 | | | | (1,910 | ) | | | (1,750 | ) | | | (160 | ) | | | | |
| | | | | | | | | | | | Morgan Stanley & Co. | | | | | | | | | | | | | | | | | | | | | | | | | | | | |
| | Adler Real Estate AG | | | 5.00 | | | | Quarterly | | | International PLC | | | 12/20/27 | | | | CCC- | | | EUR | 5 | | | | (1,384 | ) | | | (1,252 | ) | | | (132 | ) | | | | |
| | CMBX.NA.9 | | | 3.00 | | | | Monthly | | | Credit Suisse International | | | 09/17/58 | | | | N/R | | | USD | 2,227 | | | | (418,340 | ) | | | (229,138 | ) | | | (189,202 | ) | | | | |
| | | | | | | | | | | | Morgan Stanley & Co. | | | | | | | | | | | | | | | | | | | | | | | | | | | | |
| | CMBX.NA.15 | | | 3.00 | | | | Monthly | | | International PLC | | | 11/15/64 | | | | N/R | | | USD | 2,318 | | | | (442,533 | ) | | | (434,741 | ) | | | (7,792 | ) | | | | |
| | | | | | | | | | | | | | | | | | | | | | | | | | | | | | | | | | | | | | | | |
| | | | | | | | | | | |
| | | | | | | | | | | | | | | | | | | | | | | | | | $ | (879,337 | ) | | $ | (678,393 | ) | | $ | (200,944 | ) | | | | |
| | | | | | | | | | | | | | | | | | | | | | | | | | | | | | | | | | | | | | | | |
| | (a) | Using the rating of the issuer or the underlying securities of the index, as applicable, provided by S&P Global Ratings. | |
| | (b) | The maximum potential amount the Fund may pay should a negative credit event take place as defined under the terms of the agreement. | |
| | |
| 108 | | 2 0 2 2 BLACK ROCK ANNUAL REPORT TO SHAREHOLDERS |
| | |
Schedule of Investments (continued) December 31, 2022 | | BlackRock Limited Duration Income Trust (BLW) |
Balances Reported in the Statements of Assets and Liabilities for Centrally Cleared Swaps and OTC Swaps
| | | | | | | | | | | | | | | | |
| | | | | |
| Description | | Swap Premiums Paid | | | Swap Premiums Received | | | Unrealized Appreciation | | | Unrealized Depreciation | |
| | | | |
Centrally Cleared Swaps(a) | | $ | 191,335 | | | $ | (38,915 | ) | | $ | 3,170,900 | | | $ | (1,285,340 | ) |
OTC Swaps | | | 4,603 | | | | (682,996 | ) | | | 3,848 | | | | (204,792 | ) |
| | (a) | Includes cumulative appreciation (depreciation) on centrally cleared swaps, as reported in the Schedule of Investments. Only current day’s variation margin is reported within the Statements of Assets and Liabilities and is net of any previously paid (received) swap premium amounts. | |
Derivative Financial Instruments Categorized by Risk Exposure
As of period end, the fair values of derivative financial instruments located in the Statements of Assets and Liabilities were as follows:
| | | | | | | | | | | | | | | | | | | | | | | | | | | | |
| | | | | | | | |
| | | Commodity Contracts | | | Credit Contracts | | | Equity Contracts | | | Foreign Currency Exchange Contracts | | | Interest Rate Contracts | | | Other Contracts | | | Total | |
| | | | | | | |
Assets — Derivative Financial Instruments | | | | | | | | | | | | | | | | | | | | | | | | | | | | |
Futures contracts | | | | | | | | | | | | | | | | | | | | | | | | | | | | |
Unrealized appreciation on futures contracts(a) | | $ | — | | | $ | — | | | $ | — | | | $ | — | | | $ | 1,471,046 | | | $ | — | | | $ | 1,471,046 | |
Forward foreign currency exchange contracts | | | | | | | | | | | | | | | | | | | | | | | | | | | | |
Unrealized appreciation on forward foreign currency exchange contracts | | | — | | | | — | | | | — | | | | 15,950 | | | | — | | | | — | | | | 15,950 | |
Swaps — centrally cleared | | | | | | | | | | | | | | | | | | | | | | | | | | | | |
Unrealized appreciation on centrally cleared swaps(a) | | | — | | | | — | | | | — | | | | — | | | | 3,170,900 | | | | — | | | | 3,170,900 | |
Swaps — OTC | | | | | | | | | | | | | | | | | | | | | | | | | | | | |
Unrealized appreciation on OTC swaps; Swap premiums paid | | | — | | | | 8,451 | | | | — | | | | — | | | | — | | | | — | | | | 8,451 | |
| | | | | | | | | | | | | | | | | | | | | | | | | | | | |
| | | | | | | |
| | $ | — | | | $ | 8,451 | | | $ | — | | | $ | 15,950 | | | $ | 4,641,946 | | | $ | — | | | $ | 4,666,347 | |
| | | | | | | | | | | | | | | | | | | | | | | | | | | | |
| | | | | | | |
Liabilities — Derivative Financial Instruments | | | | | | | | | | | | | | | | | | | | | | | | | | | | |
Futures contracts | | | | | | | | | | | | | | | | | | | | | | | | | | | | |
Unrealized depreciation on futures contracts(a) | | $ | — | | | $ | — | | | $ | — | | | $ | — | | | $ | 677,608 | | | $ | — | | | $ | 677,608 | |
Forward foreign currency exchange contracts | | | | | | | | | | | | | | | | | | | | | | | | | | | | |
Unrealized depreciation on forward foreign currency exchange contracts | | | — | | | | — | | | | — | | | | 38,883 | | | | — | | | | — | | | | 38,883 | |
Swaps — centrally cleared | | | | | | | | | | | | | | | | | | | | | | | | | | | | |
Unrealized depreciation on centrally cleared swaps(a) | | | — | | | | 419,105 | | | | — | | | | — | | | | 866,235 | | | | — | | | | 1,285,340 | |
Swaps — OTC | | | | | | | | | | | | | | | | | | | | | | | | | | | | |
Unrealized depreciation on OTC swaps; Swap premiums received | | | — | | | | 887,788 | | | | — | | | | — | | | | — | | | | — | | | | 887,788 | |
| | | | | | | | | | | | | | | | | | | | | | | | | | | | |
| | | | | | | |
| | $ | — | | | $ | 1,306,893 | | | $ | — | | | $ | 38,883 | | | $ | 1,543,843 | | | $ | — | | | $ | 2,889,619 | |
| | | | | | | | | | | | | | | | | | | | | | | | | | | | |
| | (a) | Net cumulative unrealized appreciation (depreciation) on futures contracts and centrally cleared swaps, if any, are reported in the Schedule of Investments. In the Statements of Assets and Liabilities, only current day’s variation margin is reported in receivables or payables and the net cumulative unrealized appreciation (depreciation) is included in accumulated earnings (loss). | |
For the period ended December 31, 2022, the effect of derivative financial instruments in the Statements of Operations was as follows:
| | | | | | | | | | | | | | | | | | | | | | | | | | | | |
| | | | | | | | |
| | | Commodity Contracts | | | Credit Contracts | | | Equity Contracts | | | Foreign Currency Exchange Contracts | | | Interest Rate Contracts | | | Other Contracts | | | Total | |
| | | | | | | |
Net Realized Gain (Loss) from: | | | | | | | | | | | | | | | | | | | | | | | | | | | | |
Futures contracts | | $ | — | | | $ | — | | | $ | — | | | $ | — | | | $ | 4,631,342 | | | $ | — | | | $ | 4,631,342 | |
Forward foreign currency exchange contracts | | | — | | | | — | | | | — | | | | 1,348,459 | | | | — | | | | — | | | | 1,348,459 | |
Options purchased(a) | | | — | | | | (5,006 | ) | | | — | | | | — | | | | 1,023,225 | | | | — | | | | 1,018,219 | |
Options written | | | — | | | | (2,903 | ) | | | — | | | | — | | | | (2,977,365 | ) | | | — | | | | (2,980,268 | ) |
Swaps | | | — | | | | 204,323 | | | | — | | | | — | | | | 1,622,987 | | | | — | | | | 1,827,310 | |
| | | | | | | | | | | | | | | | | | | | | | | | | | | | |
| | | | | | | |
| | $ | — | | | $ | 196,414 | | | $ | — | | | $ | 1,348,459 | | | $ | 4,300,189 | | | $ | — | | | $ | 5,845,062 | |
| | | | | | | | | | | | | | | | | | | | | | | | | | | | |
| | | | | | | |
Net Change in Unrealized Appreciation (Depreciation) on: | | | | | | | | | | | | | | | | | | | | | | | | | | | | |
Futures contracts | | $ | — | | | $ | — | | | $ | — | | | $ | — | | | $ | 1,194,806 | | | $ | — | | | $ | 1,194,806 | |
Forward foreign currency exchange contracts | | | — | | | | — | | | | — | | | | 178,076 | | | | — | | | | — | | | | 178,076 | |
Options purchased(b) | | | — | | | | — | | | | — | | | | — | | | | 214,358 | | | | — | | | | 214,358 | |
| | |
SCHEDULE OF INVESTMENTS | | 109 |
| | |
Schedule of Investments (continued) December 31, 2022 | | BlackRock Limited Duration Income Trust (BLW) |
| | | | | | | | | | | | | | | | | | | | | | | | | | | | |
| | | | | | | | |
| | | Commodity Contracts | | | Credit Contracts | | | Equity Contracts | | | Foreign Currency Exchange Contracts | | | Interest Rate Contracts | | | Other Contracts | | | Total | |
| | | | | | | |
Options written | | $ | — | | | $ | — | | | $ | — | | | $ | — | | | $ | 416,433 | | | $ | — | | | $ | 416,433 | |
Swaps | | | — | | | | (318,612 | ) | | | — | | | | — | | | | 1,651,181 | | | | — | | | | 1,332,569 | |
| | | | | | | | | | | | | | | | | | | | | | | | | | | | |
| | | | | | | |
| | $ | — | | | $ | (318,612 | ) | | $ | — | | | $ | 178,076 | | | $ | 3,476,778 | | | $ | — | | | $ | 3,336,242 | |
| | | | | | | | | | | | | | | | | | | | | | | | | | | | |
| | (a) | Options purchased are included in net realized gain (loss) from investments — unaffiliated. | |
| | (b) | Options purchased are included in net change in unrealized appreciation (depreciation) on investments — unaffiliated. | |
Average Quarterly Balances of Outstanding Derivative Financial Instruments
| | | | |
| | |
Futures contracts: | | | | |
Average notional value of contracts — long | | $ | 147,378,293 | |
Average notional value of contracts — short | | $ | 82,785,572 | |
Forward foreign currency exchange contracts: | | | | |
Average amounts purchased — in USD | | $ | 12,500,358 | |
Average amounts sold — in USD | | $ | 298,719 | |
Options: | | | | |
Average value of option contracts purchased | | $ | 2,289 | |
Average value of option contracts written | | $ | 363 | |
Average notional value of swaption contracts purchased | | $ | 12,370,253 | |
Average notional value of swaption contracts written | | $ | 64,292,626 | |
Credit default swaps: | | | | |
Average notional value — buy protection | | $ | 24,831,813 | |
Average notional value — sell protection | | $ | 15,252,404 | |
Interest rate swaps: | | | | |
Average notional value — pays fixed rate | | $ | 108,677,500 | |
Average notional value — receives fixed rate | | $ | 78,724,750 | |
For more information about the Fund’s investment risks regarding derivative financial instruments, refer to the Notes to Financial Statements.
Derivative Financial Instruments — Offsetting as of Period End
The Fund’s derivative assets and liabilities (by type) were as follows:
| | | | | | | | | | | | |
| | | | |
| | | Assets | | | | | | Liabilities | |
| | | |
Derivative Financial Instruments | | | | | | | | | | | | |
Futures contracts | | $ | 405,135 | | | | | | | $ | 462,006 | |
Forward foreign currency exchange contracts | | | 15,950 | | | | | | | | 38,883 | |
Swaps — centrally cleared | | | 16,642 | | | | | | | | — | |
Swaps — OTC(a) | | | 8,451 | | | | | | | | 887,788 | |
| | | | | | | | | | | | |
| | | |
Total derivative assets and liabilities in the Statements of Assets and Liabilities | | | 446,178 | | | | | | | | 1,388,677 | |
| | | | | | | | | | | | |
| | | |
Derivatives not subject to a Master Netting Agreement or similar agreement (“MNA”) | | | (421,777 | ) | | | | | | | (462,006 | ) |
| | | | | | | | | | | | |
| | | |
Total derivative assets and liabilities subject to an MNA | | $ | 24,401 | | | | | | | $ | 926,671 | |
| | | | | | | | | | | | |
| | (a) | Includes unrealized appreciation (depreciation) on OTC swaps and swap premiums (paid/received) in the Statements of Assets and Liabilities. | |
The following table presents the Fund’s derivative assets and liabilities by counterparty net of amounts available for offset under an MNA and net of the related collateral received (and pledged) by the Fund:
| | | | | | | | | | | | | | | | | | | | |
| | | | | | |
| Counterparty | |
| Derivative
Assets Subject to an MNA by Counterparty |
| |
| Derivatives
Available for Offset |
(a) | |
| Non-Cash
Collateral Received |
| |
| Cash
Collateral
Received |
| |
| Net Amount
of Derivative Assets |
(b)(c) |
| | | | | |
Barclays Bank PLC | | $ | 357 | | | $ | (357 | ) | | $ | — | | | $ | — | | | $ | — | |
Citibank N.A. | | | 18 | | | | (18 | ) | | | — | | | | — | | | | — | |
Credit Suisse International | | | 2,026 | | | | (2,026 | ) | | | — | | | | — | | | | — | |
JPMorgan Chase Bank N.A. | | | 6,050 | | | | (6,050 | ) | | | — | | | | — | | | | — | |
State Street Bank and Trust Co. | | | 15,950 | | | | — | | | | — | | | | — | | | | 15,950 | |
| | | | | | | | | | | | | | | | | | | | |
| | | | | |
| | $ | 24,401 | | | $ | (8,451 | ) | | $ | — | | | $ | — | | | $ | 15,950 | |
| | | | | | | | | | | | | | | | | | | | |
| | |
| 110 | | 2 0 2 2 BLACK ROCK ANNUAL REPORT TO SHAREHOLDERS |
| | |
Schedule of Investments (continued) December 31, 2022 | | BlackRock Limited Duration Income Trust (BLW) |
| | | | | | | | | | | | | | | | | | | | |
| | | | | | |
| Counterparty | |
| Derivative
Liabilities Subject to an MNA by Counterparty |
| |
| Derivatives
Available for Offset |
(a) | |
| Non-Cash
Collateral Pledged |
| |
| Cash
CollateralPledged |
(d) | |
| Net Amount
of Derivative Liabilities |
(b)(e) |
| | | | | |
Bank of America N.A. | | $ | 39,587 | | | $ | — | | | $ | — | | | $ | — | | | $ | 39,587 | |
Barclays Bank PLC | | | 6,158 | | | | (357 | ) | | | — | | | | (5,801 | ) | | | — | |
Citibank N.A. | | | 1,246 | | | | (18 | ) | | | — | | | | — | | | | 1,228 | |
Credit Suisse International | | | 420,335 | | | | (2,026 | ) | | | — | | | | (418,309 | ) | | | — | |
JPMorgan Chase Bank N.A. | | | 11,431 | | | | (6,050 | ) | | | — | | | | — | | | | 5,381 | |
Morgan Stanley & Co. International PLC | | | 443,917 | | | | — | | | | — | | | | (443,917 | ) | | | — | |
The Bank of New York Mellon | | | 3,997 | | | | — | | | | — | | | | — | | | | 3,997 | |
| | | | | | | | | | | | | | | | | | | | |
| | | | | |
| | $ | 926,671 | | | $ | (8,451 | ) | | $ | — | | | $ | (868,027 | ) | | $ | 50,193 | |
| | | | | | | | | | | | | | | | | | | | |
| | (a) | The amount of derivatives available for offset is limited to the amount of derivative asset and/or liabilities that are subject to an MNA. | |
| | (b) | Net amount may also include forward foreign currency exchange contracts that are not required to be collateralized. | |
| | (c) | Net amount represents the net amount receivable from the counterparty in the event of default. | |
| | (d) | Excess of collateral received/pledged, if any, from the individual counterparty is not shown for financial reporting purposes. | |
| | (e) | Net amount represents the net amount payable due to counterparty in the event of default. | |
Fair Value Hierarchy as of Period End
Various inputs are used in determining the fair value of financial instruments. For a description of the input levels and information about the Fund’s policy regarding valuation of financial instruments, refer to the Notes to Financial Statements.
The following table summarizes the Fund’s financial instruments categorized in the fair value hierarchy. The breakdown of the Fund’s financial instruments into major categories is disclosed in the Schedule of Investments above.
| | | | | | | | | | | | | | | | |
| | | | | |
| | | Level 1 | | | Level 2 | | | Level 3 | | | Total | |
| | | | |
Assets | | | | | | | | | | | | | | | | |
Investments | | | | | | | | | | | | | | | | |
Long-Term Investments | | | | | | | | | | | | | | | | |
Asset-Backed Securities | | $ | — | | | $ | 29,870,646 | | | $ | 1,354,025 | | | $ | 31,224,671 | |
Common Stocks | | | | | | | | | | | | | | | | |
Construction & Engineering | | | 15,308 | | | | — | | | | — | | | | 15,308 | |
Diversified Financial Services | | | — | | | | — | | | | 5,467 | | | | 5,467 | |
Household Durables | | | — | | | | — | | | | — | | | | — | |
Metals & Mining | | | — | | | | 401 | | | | 631 | | | | 1,032 | |
Software | | | 4 | | | | — | | | | — | | | | 4 | |
Specialty Retail | | | — | | | | 201,162 | | | | — | | | | 201,162 | |
Corporate Bonds | | | | | | | | | | | | | | | | |
Advertising Agencies | | | — | | | | 182,757 | | | | — | | | | 182,757 | |
Aerospace & Defense | | | — | | | | 13,963,384 | | | | — | | | | 13,963,384 | |
Airlines | | | — | | | | 6,597,414 | | | | — | | | | 6,597,414 | |
Auto Components | | | — | | | | 5,197,192 | | | | — | | | | 5,197,192 | |
Automobiles | | | — | | | | 7,813,711 | | | | — | | | | 7,813,711 | |
Banks | | | — | | | | 3,964,497 | | | | — | | | | 3,964,497 | |
Beverages | | | — | | | | 7,316,480 | | | | — | | | | 7,316,480 | |
Biotechnology | | | — | | | | 91,256 | | | | — | | | | 91,256 | |
Building Materials | | | — | | | | 2,586,760 | | | | — | | | | 2,586,760 | |
Building Products | | | — | | | | 3,724,734 | | | | — | | | | 3,724,734 | |
Capital Markets | | | — | | | | 6,738,242 | | | | — | | | | 6,738,242 | |
Chemicals | | | — | | | | 8,364,224 | | | | — | | | | 8,364,224 | |
Commercial Services & Supplies | | | — | | | | 3,918,228 | | | | — | | | | 3,918,228 | |
Communications Equipment | | | — | | | | 2,289,840 | | | | — | | | | 2,289,840 | |
Construction Materials | | | — | | | | 963,764 | | | | — | | | | 963,764 | |
Consumer Discretionary | | | — | | | | 6,234,545 | | | | — | | | | 6,234,545 | |
Consumer Finance | | | — | | | | 8,294,339 | | | | — | | | | 8,294,339 | |
Containers & Packaging | | | — | | | | 2,207,430 | | | | — | | | | 2,207,430 | |
Diversified Consumer Services | | | — | | | | 6,620,972 | | | | — | | | | 6,620,972 | |
Diversified Financial Services | | | — | | | | 13,636,831 | | | | — | | | | 13,636,831 | |
Diversified Telecommunication Services | | | — | | | | 12,221,651 | | | | — | | | | 12,221,651 | |
Electric Utilities | | | — | | | | 2,753,182 | | | | — | | | | 2,753,182 | |
Electrical Equipment | | | — | | | | 513,126 | | | | — | | | | 513,126 | |
Electronic Equipment, Instruments & Components | | | — | | | | 1,939,248 | | | | — | | | | 1,939,248 | |
| | |
SCHEDULE OF INVESTMENTS | | 111 |
| | |
Schedule of Investments (continued) December 31, 2022 | | BlackRock Limited Duration Income Trust (BLW) |
Fair Value Hierarchy as of Period End (continued)
| | | | | | | | | | | | | | | | |
| | | Level 1 | | | Level 2 | | | Level 3 | | | Total | |
Corporate Bonds (continued) | | | | | | | | | | | | | | | | |
Energy Equipment & Services | | $ | — | | | $ | 2,098,090 | | | $ | — | | | $ | 2,098,090 | |
Environmental, Maintenance & Security Service | | | — | | | | 3,607,924 | | | | — | | | | 3,607,924 | |
Equity Real Estate Investment Trusts (REITs) | | | — | | | | 5,918,110 | | | | — | | | | 5,918,110 | |
Food & Staples Retailing | | | — | | | | 4,358,114 | | | | — | | | | 4,358,114 | |
Food Products | | | — | | | | 2,886,130 | | | | — | | | | 2,886,130 | |
Gas Utilities | | | — | | | | 77,348 | | | | — | | | | 77,348 | |
Health Care Equipment & Supplies | | | — | | | | 973,713 | | | | — | | | | 973,713 | |
Health Care Providers & Services | | | — | | | | 13,086,501 | | | | — | | | | 13,086,501 | |
Health Care Technology | | | — | | | | 3,076,080 | | | | — | | | | 3,076,080 | |
Hotels, Restaurants & Leisure | | | 13,828 | | | | 13,428,750 | | | | — | | | | 13,442,578 | |
Household Durables | | | — | | | | 2,572,790 | | | | — | | | | 2,572,790 | |
Household Products | | | — | | | | 319,832 | | | | — | | | | 319,832 | |
Independent Power and Renewable Electricity Producers | | | — | | | | 3,826,023 | | | | — | | | | 3,826,023 | |
Insurance | | | — | | | | 11,711,041 | | | | — | | | | 11,711,041 | |
Interactive Media & Services | | | — | | | | 1,355,690 | | | | — | | | | 1,355,690 | |
Internet Software & Services | | | — | | | | 5,020,593 | | | | — | | | | 5,020,593 | |
IT Services | | | — | | | | 4,887,412 | | | | — | | | | 4,887,412 | |
Leisure Products | | | — | | | | 480,318 | | | | — | | | | 480,318 | |
Machinery | | | — | | | | 4,299,716 | | | | — | | | | 4,299,716 | |
Marine | | | — | | | | 161,558 | | | | — | | | | 161,558 | |
Media | | | — | | | | 40,536,754 | | | | — | | | | 40,536,754 | |
Metals & Mining | | | — | | | | 8,127,598 | | | | — | | | | 8,127,598 | |
Multiline Retail | | | — | | | | 294,302 | | | | — | | | | 294,302 | |
Multi-Utilities | | | — | | | | 215,748 | | | | — | | | | 215,748 | |
Offshore Drilling & Other Services | | | — | | | | 1,870,526 | | | | — | | | | 1,870,526 | |
Oil, Gas & Consumable Fuels | | | 77,168 | | | | 43,693,333 | | | | 1,198,484 | | | | 44,968,985 | |
Pharmaceuticals | | | — | | | | 4,367,178 | | | | — | | | | 4,367,178 | |
Real Estate | | | — | | | | 89,927 | | | | — | | | | 89,927 | |
Real Estate Management & Development | | | — | | | | 2,828,250 | | | | — | | | | 2,828,250 | |
Road & Rail | | | — | | | | 3,740,331 | | | | — | | | | 3,740,331 | |
Semiconductors & Semiconductor Equipment | | | — | | | | 6,709,628 | | | | — | | | | 6,709,628 | |
Software | | | — | | | | 11,310,635 | | | | — | | | | 11,310,635 | |
Specialty Retail | | | — | | | | 1,357,756 | | | | — | | | | 1,357,756 | |
Technology Hardware, Storage & Peripherals | | | — | | | | 426,903 | | | | — | | | | 426,903 | |
Textiles, Apparel & Luxury Goods | | | — | | | | 526,860 | | | | — | | | | 526,860 | |
Thrifts & Mortgage Finance | | | — | | | | 967,526 | | | | — | | | | 967,526 | |
Transportation | | | — | | | | 107,264 | | | | — | | | | 107,264 | |
Transportation Infrastructure | | | — | | | | 1,225,242 | | | | — | | | | 1,225,242 | |
Utilities | | | — | | | | 2,206,906 | | | | — | | | | 2,206,906 | |
Wireless Telecommunication Services | | | — | | | | 5,989,343 | | | | — | | | | 5,989,343 | |
Floating Rate Loan Interests | | | — | | | | 264,094,913 | | | | 3,710,331 | | | | 267,805,244 | |
Foreign Agency Obligations | | | — | | | | 6,364,990 | | | | — | | | | 6,364,990 | |
Investment Companies | | | 4,732,186 | | | | — | | | | — | | | | 4,732,186 | |
Non-Agency Mortgage-Backed Securities | | | — | | | | 15,555,212 | | | | 384,933 | | | | 15,940,145 | |
Other Interests | | | — | | | | — | | | | — | | | | — | |
Preferred Securities | | | | | | | | | | | | | | | | |
Capital Trusts | | | | | | | | | | | | | | | | |
Aerospace & Defense | | | 105,258 | | | | — | | | | — | | | | 105,258 | |
Automobiles | | | — | | | | 308,927 | | | | — | | | | 308,927 | |
Banks | | | — | | | | 5,841,726 | | | | — | | | | 5,841,726 | |
Capital Markets | | | — | | | | 2,504,971 | | | | — | | | | 2,504,971 | |
Diversified Financial Services | | | — | | | | 12,636,494 | | | | — | | | | 12,636,494 | |
Diversified Telecommunication Services | | | — | | | | 109,186 | | | | — | | | | 109,186 | |
Electric Utilities | | | — | | | | 1,735,649 | | | | — | | | | 1,735,649 | |
Independent Power and Renewable Electricity Producers | | | — | | | | 218,384 | | | | — | | | | 218,384 | |
Media | | | — | | | | 84,951 | | | | — | | | | 84,951 | |
Oil, Gas & Consumable Fuels | | | — | | | | 90,346 | | | | — | | | | 90,346 | |
Utilities | | | — | | | | 174,579 | | | | — | | | | 174,579 | |
Wireless Telecommunication Services | | | — | | | | 93,842 | | | | — | | | | 93,842 | |
Preferred Stocks | | | 9,215,218 | | | | — | | | | — | | | | 9,215,218 | |
U.S. Government Sponsored Agency Securities | | | — | | | | 48,874,509 | | | | — | | | | 48,874,509 | |
U.S. Treasury Obligations | | | — | | | | 12,239,258 | | | | — | | | | 12,239,258 | |
Warrants | | | 4,347 | | | | — | | | | — | | | | 4,347 | |
| | |
| 112 | | 2 0 2 2 BLACK ROCK ANNUAL REPORT TO SHAREHOLDERS |
| | |
Schedule of Investments (continued) December 31, 2022 | | BlackRock Limited Duration Income Trust (BLW) |
Fair Value Hierarchy as of Period End (continued)
| | | | | | | | | | | | | | | | |
| | | Level 1 | | | Level 2 | | | Level 3 | | | Total | |
Short-Term Securities | | | | | | | | | | | | | | | | |
Money Market Funds | | $ | 1,474,663 | | | $ | — | | | $ | — | | | $ | 1,474,663 | |
U.S. Government Sponsored Agency Securities | | | — | | | | 308 | | | | — | | | | 308 | |
Liabilities | | | | | | | | | | | | | | | | |
Investments | | | | | | | | | | | | | | | | |
TBA Sale Commitments | | | — | | | | (4,192,818 | ) | | | — | | | | (4,192,818 | ) |
Unfunded Floating Rate Loan Interests(a) | | | — | | | | (31,405 | ) | | | — | | | | (31,405 | ) |
| | | | | | | | | | | | | | | | |
| | | | |
| | $ | 15,637,980 | | | $ | 745,647,781 | | | $ | 6,653,871 | | | | 767,939,632 | |
| | | | | | | | | | | | | | | | |
Investments Valued at NAV(b) | | | | | | | | | | | | | | | 2,282 | |
| | | | | | | | | | | | | | | | |
| | | | |
| | | | | | | | | | | | | | $ | 767,941,914 | |
| | | | | | | | | | | | | | | | |
Derivative Financial Instruments(c) | | | | | | | | | | | | | | | | |
Assets | | | | | | | | | | | | | | | | |
Credit Contracts | | $ | — | | | $ | 3,848 | | | $ | — | | | $ | 3,848 | |
Foreign Currency Exchange Contracts | | | — | | | | 15,950 | | | | — | | | | 15,950 | |
Interest Rate Contracts | | | 1,471,046 | | | | 3,170,900 | | | | — | | | | 4,641,946 | |
Liabilities | | | | | | | | | | | | | | | | |
Credit Contracts | | | — | | | | (623,897 | ) | | | — | | | | (623,897 | ) |
Foreign Currency Exchange Contracts | | | — | | | | (38,883 | ) | | | — | | | | (38,883 | ) |
Interest Rate Contracts | | | (677,608 | ) | | | (866,235 | ) | | | — | | | | (1,543,843 | ) |
| | | | | | | | | | | | | | | | |
| | | | |
| | $ | 793,438 | | | $ | 1,661,683 | | | $ | — | | | $ | 2,455,121 | |
| | | | | | | | | | | | | | | | |
| | (a) | Unfunded floating rate loan interests are valued at the unrealized appreciation (depreciation) on the commitment. | |
| | (b) | Certain investments of the Fund were fair valued using NAV as a practical expedient as no quoted market value is available and therefore have been excluded from the fair value hierarchy. | |
| | (c) | Derivative financial instruments are swaps, futures contracts and forward foreign currency exchange contracts. Swaps, futures contracts and forward foreign currency exchange contracts are valued at the unrealized appreciation (depreciation) on the instrument. | |
The Fund may hold assets and/or liabilities in which the fair value approximates the carrying amount or face value, including accrued interest, for financial statement purposes. As of period end, reverse repurchase agreements of $275,638,800 are categorized as Level 2 within the fair value hierarchy.
A reconciliation of Level 3 financial instruments is presented when the Fund had a significant amount of Level 3 investments and derivative financial instruments at the beginning and/or end of the year in relation to net assets. The following table is a reconciliation of Level 3 investments for which significant unobservable inputs were used in determining fair value:
| | | | | | | | | | | | | | | | | | | | | | | | | | | | | | | | | | | | | | | | | | | | |
| | | Asset-Backed
Securities | | | Common Stocks | | | Corporate Bonds | | | Floating Rate Loan Interests | | | Non-Agency Mortgage-Backed Securities | | | | | | Other Interests | | | | | | Unfunded Floating Rate Loan
Interests | | | | | | Total | |
| | | | | | | | | | | |
Assets/Liabilities | | | | | | | | | | | | | | | | | | | | | | | | | | | | | | | | | | | | | | | | | | | | |
Opening balance, as of December 31, 2021 | | $ | 1,084,298 | | | $ | 5,841 | | | $ | 1,347,279 | | | $ | 6,516,371 | | | $ | — | | | | | | | $ | — | (a) | | | | | | $ | (127 | ) | | | | | | $ | 8,953,662 | |
Transfers into Level 3 | | | — | | | | — | | | | — | | | | 3,106,748 | | | | — | | | | | | | | — | | | | | | | | — | | | | | | | | 3,106,748 | |
Transfers out of Level 3 | | | — | | | | — | | | | — | | | | (3,747,212 | ) | | | — | | | | | | | | — | | | | | | | | 127 | | | | | | | | (3,747,085 | ) |
Accrued discounts/premiums | | | (49,868 | ) | | | — | | | | — | | | | 3,603 | | | | — | | | | | | | | — | | | | | | | | — | | | | | | | | (46,265 | ) |
Net realized gain (loss) | | | — | | | | — | | | | — | | | | (2,398 | ) | | | 119 | | | | | | | | — | | | | | | | | — | | | | | | | | (2,279 | ) |
Net change in unrealized appreciation (depreciation)(b)(c) | | | (83,991 | ) | | | 257 | | | | (112,080 | ) | | | (248,973 | ) | | | 7,757 | | | | | | | | — | | | | | | | | — | | | | | | | | (437,030 | ) |
Purchases | | | 492,500 | | | | — | | | | — | | | | 1,139,634 | | | | 378,706 | | | | | | | | — | | | | | | | | — | | | | | | | | 2,010,840 | |
Sales | | | (88,914 | ) | | | — | | | | (36,715 | ) | | | (3,057,442 | ) | | | (1,649 | ) | | | | | | | — | | | | | | | | — | | | | | | | | (3,184,720 | ) |
| | | | | | | | | | | | | | | | | | | | | | | | | | | | | | | | | | | | | | | | | | | | |
Closing balance, as of December 31, 2022 | | $ | 1,354,025 | | | $ | 6,098 | | | $ | 1,198,484 | | | $ | 3,710,331 | | | $ | 384,933 | | | | | | | $ | — | (a) | | | | | | $ | — | | | | | | | $ | 6,653,871 | |
| | | | | | | | | | | | | | | | | | | | | | | | | | | | | | | | | | | | | | | | | | | | |
Net change in unrealized appreciation (depreciation) on investments still held at December 31, 2022(c) | | $ | (85,310 | ) | | $ | 257 | | | $ | (112,080 | ) | | $ | (223,059 | ) | | $ | 7,757 | | | | | | | $ | — | | | | | | | $ | — | | | | | | | $ | (412,435 | ) |
| | | | | | | | | | | | | | | | | | | | | | | | | | | | | | | | | | | | | | | | | | | | |
| | (a) | Rounds to less than $1. | |
| | (b) | Included in the related net change in unrealized appreciation (depreciation) in the Statements of Operations. | |
| | (c) | Any difference between net change in unrealized appreciation (depreciation) and net change in unrealized appreciation (depreciation) on investments still held at December 31, 2022 is generally due to investments no longer held or categorized as Level 3 at period end. | |
The Fund’s financial instruments that are categorized as Level 3 were valued utilizing third-party pricing information without adjustment. Such valuations are based on unobservable inputs. A significant change in third-party information could result in a significantly lower or higher value of such Level 3 financial instruments.
See notes to financial statements.
| | |
SCHEDULE OF INVESTMENTS | | 113 |
Statements of Assets and Liabilities
December 31, 2022
| | | | | | | | | | | | | | | | |
| | | DSU | | | FRA | | | BKT | | | BLW | |
| |
| | | | |
ASSETS | | | | | | | | | | | | | | | | |
Investments, at value — unaffiliated(a) | | $ | 638,698,802 | | | $ | 588,013,286 | | | $ | 428,716,948 | | | $ | 770,691,474 | |
Investments, at value — affiliated(b) | | | 482,274 | | | | 736,300 | | | | 5,814,963 | | | | 1,474,663 | |
Cash | | | 4,015,984 | | | | 3,186,869 | | | | — | | | | 2,066,594 | |
Cash pledged: | | | | | | | | | | | | | | | | |
Collateral — reverse repurchase agreements | | | — | | | | — | | | | — | | | | 1,207,198 | |
Collateral — OTC derivatives | | | 30,000 | | | | — | | | | — | | | | 890,000 | |
Futures contracts | | | — | | | | — | | | | 1,130,260 | | | | 2,377,470 | |
Centrally cleared swaps | | | 369,000 | | | | 429,000 | | | | 1,000 | | | | 1,024,000 | |
Foreign currency, at value(c) | | | 4,059 | | | | 1,024 | | | | — | | | | 515,340 | |
Receivables: | | | | | | | | | | | | | | | | |
Investments sold | | | 6,913,627 | | | | 7,273,770 | | | | 1,316 | | | | 3,604,251 | |
Reverse repurchase agreements | | | — | | | | — | | | | — | | | | 191,595 | |
TBA sale commitments | | | — | | | | — | | | | 199,664 | | | | 4,248,367 | |
Dividends — unaffiliated | | | — | | | | — | | | | — | | | | 71,033 | |
Dividends — affiliated | | | 7,215 | | | | 3,976 | | | | 28,554 | | | | 11,303 | |
Interest — unaffiliated | | | 4,087,371 | | | | 2,756,295 | | | | 3,045,882 | | | | 8,043,786 | |
Due from broker | | | — | | | | — | | | | — | | | | 1,220,000 | |
Principal paydowns | | | 1,584 | | | | — | | | | — | | | | — | |
Variation margin on futures contracts | | | — | | | | — | | | | 278,672 | | | | 405,135 | |
Variation margin on centrally cleared swaps | | | 14 | | | | 14 | | | | 36 | | | | 16,642 | |
Swap premiums paid | | | 1,949 | | | | — | | | | — | | | | 4,603 | |
Unrealized appreciation on: | | | | | | | | | | | | | | | | |
Forward foreign currency exchange contracts | | | 18,400 | | | | 20,322 | | | | — | | | | 15,950 | |
OTC swaps | | | 764 | | | | — | | | | — | | | | 3,848 | |
Deferred offering costs | | | 99,943 | | | | 9,048 | | | | 115,813 | | | | 110,250 | |
Prepaid expenses | | | 4,079 | | | | 3,771 | | | | 17,232 | | | | 3,938 | |
| | | | | | | | | | | | | | | | |
| | | | |
Total assets | | | 654,735,065 | | | | 602,433,675 | | | | 439,350,340 | | | | 798,197,440 | |
| | | | | | | | | | | | | | | | |
| | | | |
LIABILITIES | | | | | | | | | | | | | | | | |
Bank overdraft | | | — | | | | — | | | | 878 | | | | — | |
Cash received: | | | | | | | | | | | | | | | | |
Collateral — reverse repurchase agreements | | | — | | | | — | | | | — | | | | 294,376 | |
Collateral — TBA commitments | | | — | | | | — | | | | 2,152,000 | | | | — | |
Borrowed bonds, at value(d) | | | — | | | | — | | | | 735,033 | | | | — | |
TBA sale commitments, at value(e) | | | — | | | | — | | | | 197,044 | | | | 4,192,818 | |
Reverse repurchase agreements, at value | | | — | | | | — | | | | 115,763,576 | | | | 275,638,800 | |
Payables: | | | | | | | | | | | | | | | | |
Investments purchased | | | 2,443,199 | | | | 2,893,469 | | | | 39,580,831 | | | | 32,579,785 | |
Reverse repurchase agreements | | | — | | | | — | | | | — | | | | 391,480 | |
Accounting services fees | | | 35,584 | | | | 33,614 | | | | 25,153 | | | | 38,322 | |
Administration fees | | | — | | | | — | | | | 36,378 | | | | — | |
Bank borrowings | | | 164,000,000 | | | | 147,000,000 | | | | — | | | | — | |
Custodian fees | | | 16,999 | | | | 17,861 | | | | 7,969 | | | | 30,523 | |
Interest expense and fees | | | 793,101 | | | | 699,840 | | | | 1,251 | | | | — | |
Investment advisory fees | | | 309,026 | | | | 386,084 | | | | 157,136 | | | | 358,207 | |
Offering costs | | | — | | | | — | | | | — | | | | 8,226 | |
Directors’ and Officer’s fees | | | 313,570 | | | | 571 | | | | 172,341 | | | | 387,368 | |
Other accrued expenses | | | 54,972 | | | | 19,407 | | | | 17,416 | | | | 70,313 | |
Principal payups | | | — | | | | — | | | | 1,257,182 | | | | 62,569 | |
Professional fees | | | 101,961 | | | | 123,363 | | | | 84,854 | | | | 113,979 | |
Transfer agent fees | | | 29,107 | | | | 20,025 | | | | 23,349 | | | | 23,389 | |
Variation margin on futures contracts | | | — | | | | — | | | | 103,264 | | | | 462,006 | |
Swap premiums received | | | 6,542 | | | | — | | | | — | | | | 682,996 | |
Unrealized depreciation on: | | | | | | | | | | | | | | | | |
Forward foreign currency exchange contracts | | | 16,242 | | | | 3,437 | | | | — | | | | 38,883 | |
OTC swaps | | | 7,225 | | | | — | | | | — | | | | 204,792 | |
Unfunded floating rate loan interests | | | 42,384 | | | | 48,486 | | | | — | | | | 31,405 | |
| | | | | | | | | | | | | | | | |
| | | | |
Total liabilities | | | 168,169,912 | | | | 151,246,157 | | | | 160,315,655 | | | | 315,610,237 | |
| | | | | | | | | | | | | | | | |
| | | | |
NET ASSETS | | $ | 486,565,153 | | | $ | 451,187,518 | | | $ | 279,034,685 | | | $ | 482,587,203 | |
| | | | | | | | | | | | | | | | |
| | |
| 114 | | 2 0 2 2 BLACK ROCK ANNUAL REPORT TO SHAREHOLDERS |
Statements of Assets and Liabilities (continued)
December 31, 2022
| | | | | | | | | | | | | | | | |
| | | DSU | | | FRA | | | BKT | | | BLW | |
| |
| | | | |
NET ASSETS CONSIST OF | | | | | | | | | | | | | | | | |
Paid-in capital(f)(g)(h) | | $ | 652,300,917 | | | $ | 538,835,342 | | | $ | 442,873,904 | | | $ | 618,119,596 | |
Accumulated loss | | | (165,735,764 | ) | | | (87,647,824 | ) | | | (163,839,219 | ) | | | (135,532,393 | ) |
| | | | | | | | | | | | | | | | |
| | | | |
NET ASSETS | | $ | 486,565,153 | | | $ | 451,187,518 | | | $ | 279,034,685 | | | $ | 482,587,203 | |
| | | | | | | | | | | | | | | | |
| | | | |
Net asset value(f)(g)(h) | | $ | 10.44 | | | $ | 12.81 | | | $ | 13.10 | (i) | | $ | 13.51 | |
| | | | | | | | | | | | | | | | |
| | | | |
(a) Investments, at cost — unaffiliated | | $ | 702,238,011 | | | $ | 625,326,331 | | | $ | 492,956,126 | | | $ | 841,635,598 | |
(b) Investments, at cost — affiliated | | $ | 482,274 | | | $ | 719,537 | | | $ | 5,814,963 | | | $ | 1,474,663 | |
(c) Foreign currency, at cost | | $ | 4,049 | | | $ | 1,016 | | | $ | — | | | $ | 514,276 | |
(d) Proceeds received from borrowed bonds | | $ | — | | | $ | — | | | $ | 842,347 | | | $ | — | |
(e) Proceeds from TBA sale commitments | | $ | — | | | $ | — | | | $ | 199,664 | | | $ | 4,248,367 | |
(f) Shares outstanding | | | 46,610,312 | | | | 35,232,197 | | | | 21,304,278 | | | | 35,711,253 | |
(g) Shares authorized | | | 400 million | | | | 200 million | | | | 200 million | | | | Unlimited | |
(h) Par value | | $ | 0.10 | | | $ | 0.10 | | | $ | 0.010 | | | $ | 0.001 | |
(i) Shares outstanding and net asset value per share reflect a 1-for-3 reverse stock split prior to the open of trading on the NYSE on October 18, 2022 for common stockholders of record as of the close of business on October 17, 2022. | |
See notes to financial statements.
Statements of Operations
Year Ended December 31, 2022
| | | | | | | | | | | | | | | | |
| | | DSU | | | FRA | | | BKT | | | BLW | |
| |
| | | | |
INVESTMENT INCOME | | | | | | | | | | | | | | | | |
Dividends — unaffiliated | | $ | 29,070 | | | $ | 58,889 | | | $ | — | | | $ | 667,305 | |
Dividends — affiliated | | | 49,288 | | | | 16,245 | | | | 130,377 | | | | 66,945 | |
Interest — unaffiliated | | | 42,508,039 | | | | 38,919,929 | | | | 14,199,208 | | | | 44,153,947 | |
Other income — unaffiliated | | | 499,384 | | | | 525,581 | | | | — | | | | 221,673 | |
| | | | | | | | | | | | | | | | |
| | | | |
Total investment income | | | 43,085,781 | | | | 39,520,644 | | | | 14,329,585 | | | | 45,109,870 | |
| | | | | | | | | | | | | | | | |
| | | | |
EXPENSES | | | | | | | | | | | | | | | | |
Investment advisory | | | 3,959,864 | | | | 4,941,913 | | | | 2,031,168 | | | | 4,467,146 | |
Professional | | | 107,361 | | | | 90,896 | | | | 191,815 | | | | 103,328 | |
Accounting services | | | 77,873 | | | | 91,871 | | | | 64,576 | | | | 105,934 | |
Custodian | | | 45,404 | | | | 50,728 | | | | 37,203 | | | | 111,856 | |
Printing and postage | | | 17,991 | | | | 17,527 | | | | 12,804 | | | | 33,708 | |
Registration | | | 14,313 | | | | 11,365 | | | | 20,976 | | | | 11,663 | |
Transfer agent | | | 3,645 | | | | 60,824 | | | | 118,444 | | | | 69,567 | |
Administration | | | — | | | | — | | | | 468,731 | | | | — | |
Directors and Officer | | | — | | | | 24,770 | | | | — | | | | — | |
Miscellaneous | | | 34,000 | | | | 16,561 | | | | 22,129 | | | | 36,664 | |
| | | | | | | | | | | | | | | | |
| | | | |
Total expenses excluding interest expense | | | 4,260,451 | | | | 5,306,455 | | | | 2,967,846 | | | | 4,939,866 | |
Interest expense and fees | | | 5,302,553 | | | | 4,752,320 | | | | 2,176,479 | | | | 5,608,007 | |
| | | | | | | | | | | | | | | | |
| | | | |
Total expenses | | | 9,563,004 | | | | 10,058,775 | | | | 5,144,325 | | | | 10,547,873 | |
Less: | | | | | | | | | | | | | | | | |
Fees waived and/or reimbursed by the Manager | | | (1,925 | ) | | | (1,049 | ) | | | (5,297 | ) | | | (2,971 | ) |
| | | | | | | | | | | | | | | | |
| | | | |
Total expenses after fees waived and/or reimbursed | | | 9,561,079 | | | | 10,057,726 | | | | 5,139,028 | | | | 10,544,902 | |
| | | | | | | | | | | | | | | | |
| | | | |
Net investment income | | | 33,524,702 | | | | 29,462,918 | | | | 9,190,557 | | | | 34,564,968 | |
| | | | | | | | | | | | | | | | |
| | | | |
REALIZED AND UNREALIZED GAIN (LOSS) | | | | | | | | | | | | | | | | |
Net realized gain (loss) from: | | | | | | | | | | | | | | | | |
Investments — unaffiliated | | | (9,966,210 | ) | | | (6,848,764 | ) | | | (7,337,425 | ) | | | (34,140,270 | ) |
Forward foreign currency exchange contracts | | | 600,851 | | | | 312,043 | | | | — | | | | 1,348,459 | |
Foreign currency transactions | | | 8,212 | | | | 21,074 | | | | — | | | | 218,761 | |
Futures contracts | | | (374 | ) | | | — | | | | 2,390,388 | | | | 4,631,342 | |
Options written | | | — | | | | — | | | | — | | | | (2,980,268 | ) |
Swaps | | | 14,460 | | | | 14,580 | | | | 2,925,079 | | | | 1,827,310 | |
| | | | | | | | | | | | | | | | |
| | | | |
| | | (9,343,061 | ) | | | (6,501,067 | ) | | | (2,021,958 | ) | | | (29,094,666 | ) |
| | | | | | | | | | | | | | | | |
Net change in unrealized appreciation (depreciation) on: | | | | | | | | | | | | | | | | |
Investments — unaffiliated | | | (43,912,857 | ) | | | (32,328,273 | ) | | | (67,553,120 | ) | | | (74,537,105 | ) |
Investments — affiliated | | | — | | | | 16,763 | | | | — | | | | — | |
Borrowed bonds | | | — | | | | — | | | | 310,061 | | | | — | |
Forward foreign currency exchange contracts | | | 90,227 | | | | 91,334 | | | | — | | | | 178,076 | |
Foreign currency translations | | | (1,422 | ) | | | (2,618 | ) | | | — | | | | (46,363 | ) |
Futures contracts | | | — | | | | — | | | | (103,319 | ) | | | 1,194,806 | |
Options written | | | — | | | | — | | | | — | | | | 416,433 | |
Swaps | | | (57,967 | ) | | | (39,474 | ) | | | 343,085 | | | | 1,332,569 | |
Unfunded floating rate loan interests | | | (41,126 | ) | | | (47,116 | ) | | | — | | | | (31,507 | ) |
| | | | | | | | | | | | | | | | |
| | | | |
| | | (43,923,145 | ) | | | (32,309,384 | ) | | | (67,003,293 | ) | | | (71,493,091 | ) |
| | | | | | | | | | | | | | | | |
| | | | |
Net realized and unrealized loss | | | (53,266,206 | ) | | | (38,810,451 | ) | | | (69,025,251 | ) | | | (100,587,757 | ) |
| | | | | | | | | | | | | | | | |
| | | | |
NET DECREASE IN NET ASSETS RESULTING FROM OPERATIONS | | $ | (19,741,504 | ) | | $ | (9,347,533 | ) | | $ | (59,834,694 | ) | | $ | (66,022,789 | ) |
| | | | | | | | | | | | | | | | |
See notes to financial statements.
| | |
| 116 | | 2 0 2 2 BLACK ROCK ANNUAL REPORT TO SHAREHOLDERS |
Statements of Changes in Net Assets
| | | | | | | | | | | | | | | | |
| | | DSU | | | FRA | |
| | | | | | | | |
| | | | |
| | | Year Ended
12/31/22 | | | Year Ended
12/31/21 | | | Year Ended
12/31/22 | | | Year Ended
12/31/21 | |
| |
| | | | |
INCREASE (DECREASE) IN NET ASSETS | | | | | | | | | | | | | | | | |
| | | | |
OPERATIONS | | | | | | | | | | | | | | | | |
Net investment income | | $ | 33,524,702 | | | $ | 28,307,179 | | | $ | 29,462,918 | | | $ | 23,442,141 | |
Net realized gain (loss) | | | (9,343,061 | ) | | | 8,095,408 | | | | (6,501,067 | ) | | | 6,531,134 | |
Net change in unrealized appreciation (depreciation) | | | (43,923,145 | ) | | | (2,024,097 | ) | | | (32,309,384 | ) | | | (741,676 | ) |
| | | | | | | | | | | | | | | | |
Net increase (decrease) in net assets resulting from operations | | | (19,741,504 | ) | | | 34,378,490 | | | | (9,347,533 | ) | | | 29,231,599 | |
| | | | | | | | | | | | | | | | |
| | | | |
DISTRIBUTIONS TO SHAREHOLDERS(a) | | | | | | | | | | | | | | | | |
From net investment income | | | (31,579,170 | ) | | | (28,723,773 | ) | | | (27,297,906 | ) | | | (23,507,568 | ) |
Return of capital | | | (838,309 | ) | | | (5,103,734 | ) | | | — | | | | (4,692,282 | ) |
| | | | | | | | | | | | | | | | |
Decrease in net assets resulting from distributions to shareholders | | | (32,417,479 | ) | | | (33,827,507 | ) | | | (27,297,906 | ) | | | (28,199,850 | ) |
| | | | | | | | | | | | | | | | |
| | | | |
CAPITAL SHARE TRANSACTIONS | | | | | | | | | | | | | | | | |
Reinvestment of distributions | | | 43,132 | | | | 171,418 | | | | — | | | | — | |
Redemption of shares resulting from share repurchase program (including transaction costs) | | | — | | | | — | | | | — | | | | (1,250,043 | ) |
| | | | | | | | | | | | | | | | |
Net increase (decrease) in net assets derived from capital share transactions | | | 43,132 | | | | 171,418 | | | | — | | | | (1,250,043 | ) |
| | | | | | | | | | | | | | | | |
| | | | |
NET ASSETS | | | | | | | | | | | | | | | | |
Total increase (decrease) in net assets | | | (52,115,851 | ) | | | 722,401 | | | | (36,645,439 | ) | | | (218,294 | ) |
Beginning of year | | | 538,681,004 | | | | 537,958,603 | | | | 487,832,957 | | | | 488,051,251 | |
| | | | | | | | | | | | | | | | |
End of year | | $ | 486,565,153 | | | $ | 538,681,004 | | | $ | 451,187,518 | | | $ | 487,832,957 | |
| | | | | | | | | | | | | | | | |
| (a) | Distributions for annual periods determined in accordance with U.S. federal income tax regulations. |
See notes to financial statements.
Statements of Changes in Net Assets (continued)
| | | | | | | | | | | | | | | | |
| | | BKT | | | BLW | |
| | | | | | | | |
| | | | |
| | | Year Ended
12/31/22 | | | Year Ended 12/31/21 | | | Year Ended 12/31/22 | | | Year Ended 12/31/21 | |
| |
| | | | |
INCREASE (DECREASE) IN NET ASSETS | | | | | | | | | | | | | | | | |
| | | | |
OPERATIONS | | | | | | | | | | | | | | | | |
Net investment income | | $ | 9,190,557 | | | $ | 14,986,442 | | | $ | 34,564,968 | | | $ | 35,675,687 | |
Net realized gain (loss) | | | (2,021,958 | ) | | | 3,553,479 | | | | (29,094,666 | ) | | | 12,937,429 | |
Net change in unrealized appreciation (depreciation) | | | (67,003,293 | ) | | | (26,249,597 | ) | | | (71,493,091 | ) | | | (24,223,210 | ) |
| | | | | | | | | | | | | | | | |
Net increase (decrease) in net assets resulting from operations | | | (59,834,694 | ) | | | (7,709,676 | ) | | | (66,022,789 | ) | | | 24,389,906 | |
| | | | | | | | | | | | | | | | |
| | | | |
DISTRIBUTIONS TO SHAREHOLDERS(a) | | | | | | | | | | | | | | | | |
From net investment income | | | (10,487,125 | ) | | | (18,883,406 | ) | | | (32,930,219 | ) | | | (36,216,307 | ) |
Return of capital | | | (11,460,544 | ) | | | (7,473,844 | ) | | | (5,605,804 | ) | | | (5,785,872 | ) |
| | | | | | | | | | | | | | | | |
Decrease in net assets resulting from distributions to shareholders | | | (21,947,669 | ) | | | (26,357,250 | ) | | | (38,536,023 | ) | | | (42,002,179 | ) |
| | | | | | | | | | | | | | | | |
| | | | |
CAPITAL SHARE TRANSACTIONS | | | | | | | | | | | | | | | | |
Reinvestment of distributions | | | 64,960 | | | | 623,562 | | | | — | | | | 825,681 | |
| | | | | | | | | | | | | | | | |
| | | | |
NET ASSETS | | | | | | | | | | | | | | | | |
Total decrease in net assets | | | (81,717,403 | ) | | | (33,443,364 | ) | | | (104,558,812 | ) | | | (16,786,592 | ) |
Beginning of year | | | 360,752,088 | | | | 394,195,452 | | | | 587,146,015 | | | | 603,932,607 | |
| | | | | | | | | | | | | | | | |
End of year | | $ | 279,034,685 | | | $ | 360,752,088 | | | $ | 482,587,203 | | | $ | 587,146,015 | |
| | | | | | | | | | | | | | | | |
| (a) | Distributions for annual periods determined in accordance with U.S. federal income tax regulations. |
See notes to financial statements.
| | |
| 118 | | 2 0 2 2 BLACK ROCK ANNUAL REPORT TO SHAREHOLDERS |
Statements of Cash Flows
Year Ended December 31, 2022
| | | | | | | | | | | | | | | | |
| | | DSU | | | FRA | | | BKT | | | BLW | |
| |
| | | | |
CASH PROVIDED BY (USED FOR) OPERATING ACTIVITIES | | | | | | | | | | | | | | | | |
Net decrease in net assets resulting from operations | | $ | (19,741,504 | ) | | $ | (9,347,533 | ) | | $ | (59,834,694 | ) | | $ | (66,022,789 | ) |
Adjustments to reconcile net decrease in net assets resulting from operations to net cash provided by operating activities: | | | | | | | | | | | | | | | | |
Proceeds from sales of long-term investments and principal paydowns/payups | | | 232,663,016 | | | | 196,655,211 | | | | 1,241,829,802 | | | | 679,652,988 | |
Purchases of long-term investments | | | (145,218,335 | ) | | | (117,485,161 | ) | | | (1,253,359,594 | ) | | | (645,649,087 | ) |
Net proceeds from sales (purchases) of short-term securities | | | (46,282 | ) | | | — | | | | 7,022,597 | | | | 3,686,099 | |
Amortization of premium and accretion of discount on investments and other fees | | | (1,158,528 | ) | | | (1,174,865 | ) | | | 12,116,001 | | | | (322,115 | ) |
Paid-in-kind income | | | (220,746 | ) | | | (358,643 | ) | | | — | | | | (267,081 | ) |
Premiums paid on closing options written | | | — | | | | — | | | | — | | | | (7,982,398 | ) |
Premiums received from options written | | | — | | | | — | | | | — | | | | 1,524,357 | |
Net realized loss on investments and options written | | | 9,977,212 | | | | 6,858,260 | | | | 7,387,251 | | | | 36,615,006 | |
Net unrealized depreciation on investments, options written, swaps, borrowed bonds, foreign currency translations and unfunded floating rate loan interests | | | 43,884,124 | | | | 32,267,292 | | | | 67,738,619 | | | | 74,011,711 | |
(Increase) Decrease in Assets | | | | | | | | | | | | | | | | |
Receivables | | | | | | | | | | | | | | | | |
Dividends — affiliated | | | (7,205 | ) | | | (3,974 | ) | | | (27,693 | ) | | | (11,264 | ) |
Dividends — unaffiliated | | | — | | | | — | | | | — | | | | 1 | |
Interest — unaffiliated | | | (709,592 | ) | | | (664,040 | ) | | | (1,002,977 | ) | | | 458,115 | |
Variation margin on futures contracts | | | — | | | | — | | | | (266,100 | ) | | | (364,936 | ) |
Variation margin on centrally cleared swaps | | | 9,048 | | | | 10,138 | | | | (36 | ) | | | (16,642 | ) |
Swap premiums paid | | | (1,809 | ) | | | — | | | | — | | | | (194 | ) |
Prepaid expenses | | | (1,290 | ) | | | (480 | ) | | | (14,971 | ) | | | 314 | |
Deferred offering costs | | | (99,943 | ) | | | (9,048 | ) | | | (115,813 | ) | | | (110,250 | ) |
Increase (Decrease) in Liabilities | | | | | | | | | | | | | | | | |
Cash received | | | | | | | | | | | | | | | | |
Collateral — reverse repurchase agreements | | | — | | | | — | | | | — | | | | 29,911 | |
Collateral — OTC derivatives | | | — | | | | — | | | | (500,000 | ) | | | — | |
Collateral — TBA commitments | | | — | | | | — | | | | 2,152,000 | | | | — | |
Payables | | | | | | | | | | | | | | | | |
Accounting services fees | | | (2,755 | ) | | | (1,838 | ) | | | (2,109 | ) | | | (4,778 | ) |
Administration fees | | | — | | | | — | | | | (10,133 | ) | | | — | |
Custodian fees | | | 3,689 | | | | 2,337 | | | | 908 | | | | (1,886 | ) |
Interest expense and fees | | | 567,210 | | | | 508,281 | | | | 553,409 | | | | 400,136 | |
Investment advisory fees | | | (57,524 | ) | | | (64,000 | ) | | | (44,164 | ) | | | (62,559 | ) |
Directors’ and Officer’s fees | | | (125,937 | ) | | | (1,464 | ) | | | (130,893 | ) | | | (163,098 | ) |
Other accrued expenses | | | 6,890 | | | | (6,226 | ) | | | (9,014 | ) | | | 20,861 | |
Professional fees | | | (6,771 | ) | | | (24,028 | ) | | | (5,781 | ) | | | (24,402 | ) |
Transfer agent fees | | | (95,777 | ) | | | 11,802 | | | | 10,863 | | | | 10,504 | |
Variation margin on futures contracts | | | — | | | | — | | | | 30,862 | | | | 404,035 | |
Variation margin on centrally cleared swaps | | | — | | | | — | | | | (4,232 | ) | | | (26,424 | ) |
Swap premiums received | | | (16,685 | ) | | | — | | | | — | | | | (1,391,403 | ) |
| | | | | | | | | | | | | | | | |
| | | | |
Net cash provided by operating activities | | | 119,600,506 | | | | 107,172,021 | | | | 23,514,108 | | | | 74,392,732 | |
| | | | | | | | | | | | | | | | |
| | | | |
CASH PROVIDED BY (USED FOR) FINANCING ACTIVITIES | | | | | | | | | | | | | | | | |
Cash dividends paid to shareholders | | | (35,194,046 | ) | | | (29,647,894 | ) | | | (24,080,909 | ) | | | (42,039,297 | ) |
Payments for offering costs | | | — | | | | — | | | | — | | | | 8,226 | |
Payments for bank borrowings | | | (154,000,000 | ) | | | (159,000,000 | ) | | | — | | | | — | |
Proceeds from bank borrowings | | | 70,000,000 | | | | 83,000,000 | | | | — | | | | — | |
Increase in bank overdraft | | | — | | | | — | | | | 878 | | | | — | |
Net borrowing of reverse repurchase agreements | | | — | | | | — | | | | 8,923 | | | | (36,927,259 | ) |
| | | | | | | | | | | | | | | | |
| | | | |
Net cash used for financing activities | | | (119,194,046 | ) | | | (105,647,894 | ) | | | (24,071,108 | ) | | | (78,958,330 | ) |
| | | | | | | | | | | | | | | | |
| | | | |
CASH IMPACT FROM FOREIGN EXCHANGE FLUCTUATIONS | | | | | | | | | | | | | | | | |
Cash impact from foreign exchange fluctuations | | | (129 | ) | | | 4 | | | | — | | | | 6,793 | |
| | | | | | | | | | | | | | | | |
Statements of Cash Flows (continued)
Year Ended December 31, 2022
| | | | | | | | | | | | | | | | |
| | | DSU | | | FRA | | | BKT | | | BLW | |
| |
| | | | |
CASH AND FOREIGN CURRENCY | | | | | | | | | | | | | | | | |
Net increase (decrease) in restricted and unrestricted cash and foreign currency | | $ | 406,331 | | | $ | 1,524,131 | | | $ | (557,000 | ) | | $ | (4,558,805 | ) |
Restricted and unrestricted cash and foreign currency at beginning of year | | | 4,012,712 | | | | 2,092,762 | | | | 1,688,260 | | | | 13,859,407 | |
| | | | | | | | | | | | | | | | |
Restricted and unrestricted cash and foreign currency at end of year | | $ | 4,419,043 | | | $ | 3,616,893 | | | $ | 1,131,260 | | | $ | 9,300,602 | |
| | | | | | | | | | | | | | | | |
| | | | |
SUPPLEMENTAL DISCLOSURE OFCASH FLOW INFORMATION | | | | | | | | | | | | | | | | |
Cash paid during the year for interest expense | | $ | 4,735,343 | | | $ | 4,244,039 | | | $ | 1,623,070 | | | $ | 5,207,871 | |
| | | | | | | | | | | | | | | | |
| | | | |
NON-CASH FINANCING ACTIVITIES | | | | | | | | | | | | | | | | |
Reinvestment of distributions | | $ | 43,132 | | | $ | — | | | $ | 64,960 | | | $ | — | |
| | | | | | | | | | | | | | | | |
| | | | |
RECONCILIATION OF RESTRICTED AND UNRESTRICTED CASH AND FOREIGN CURRENCY AT THE END OF YEAR TO THE STATEMENTS OF ASSETS AND LIABILITIES | | | | | | | | | | | | | | | | |
Cash | | $ | 4,015,984 | | | $ | 3,186,869 | | | $ | — | | | $ | 2,066,594 | |
Cash pledged | | | | | | | | | | | | | | | | |
Collateral — reverse repurchase agreements | | | — | | | | — | | | | — | | | | 1,207,198 | |
Collateral — OTC derivatives | | | 30,000 | | | | — | | | | — | | | | 890,000 | |
Futures contracts | | | — | | | | — | | | | 1,130,260 | | | | 2,377,470 | |
Centrally cleared swaps | | | 369,000 | | | | 429,000 | | | | 1,000 | | | | 1,024,000 | |
Foreign currency at value | | | 4,059 | | | | 1,024 | | | | — | | | | 515,340 | |
Due from broker | | | — | | | | — | | | | — | | | | 1,220,000 | |
| | | | | | | | | | | | | | | | |
| | | | |
| | $ | 4,419,043 | | | $ | 3,616,893 | | | $ | 1,131,260 | | | $ | 9,300,602 | |
| | | | | | | | | | | | | | | | |
See notes to financial statements.
| | |
| 120 | | 2 0 2 2 BLACK ROCK ANNUAL REPORT TO SHAREHOLDERS |
Financial Highlights
(For a share outstanding throughout each period)
| | | | | | | | | | | | | | | | | | | | | | | | | | | | | | | | | | | | | | | | | | | | | | |
| | | DSU | |
| | | | | | |
| | | | | | | | | | | | | | Period from | | | | | | | | | |
| | | Year Ended | | | | Year Ended | | | Year Ended | | | | 03/01/19 | | | | Year Ended | | | | Year Ended | |
| | | | | | | | 12/31/22 | | | | | | | | 12/31/21 | | | | | | 12/31/20 | | | | | | | | to 12/31/19 | | | | | | | | 02/28/19 | | | | | | | | 02/28/18 | (a) |
| | | | | | | | | | | | |
Net asset value, beginning of period | | | | | | $ | 11.56 | | | | | | | $ | 11.55 | | | | | $ | 12.25 | | | | | | | $ | 12.16 | | | | | | | $ | 12.62 | | | | | | | $ | 12.70 | |
| | | | | | | | | | | | | | | | | | | | | | | | | | | | | | | | | | | | | | | | | | | | | | |
| | | | | | | | | | | | |
Net investment income(b) | | | | | | | 0.72 | | | | | | | | 0.61 | | | | | | 0.63 | | | | | | | | 0.64 | | | | | | | | 0.79 | | | | | | | | 0.78 | |
Net realized and unrealized gain (loss) | | | | | | | (1.14 | ) | | | | | | | 0.13 | | | | | | (0.50 | ) | | | | | | | 0.21 | | | | | | | | (0.43 | ) | | | | | | | (0.04 | ) |
| | | | | | | | | | | | | | | | | | | | | | | | | | | | | | | | | | | | | | | | | | | | | | |
| | | | | | | | | | | | |
Net increase (decrease) from investment operations | | | | | | | (0.42 | ) | | | | | | | 0.74 | | | | | | 0.13 | | | | | | | | 0.85 | | | | | | | | 0.36 | | | | | | | | 0.74 | |
| | | | | | | | | | | | | | | | | | | | | | | | | | | | | | | | | | | | | | | | | | | | | | |
| | | | | | | | | | | | |
Distributions(c) | | | | | | | | | | | | | | | | | | | | | | | | | | | | | | | | | | | | | | | | | | | | | | |
From net investment income | | | | | | | (0.68 | ) | | | | | | | (0.62 | ) | | | | | (0.61 | ) | | | | | | | (0.73 | ) | | | | | | | (0.82 | ) | | | | | | | (0.82 | ) |
Return of capital | | | | | | | (0.02 | ) | | | | | | | (0.11 | ) | | | | | (0.22 | ) | | | | | | | (0.03 | ) | | | | | | | — | | | | | | | | — | |
| | | | | | | | | | | | | | | | | | | | | | | | | | | | | | | | | | | | | | | | | | | | | | |
| | | | | | | | | | | | |
Total distributions | | | | | | | (0.70 | ) | | | | | | | (0.73 | ) | | | | | (0.83 | ) | | | | | | | (0.76 | ) | | | | | | | (0.82 | ) | | | | | | | (0.82 | ) |
| | | | | | | | | | | | | | | | | | | | | | | | | | | | | | | | | | | | | | | | | | | | | | |
| | | | | | | | | | | | |
Net asset value, end of period | | | | | | $ | 10.44 | | | | | | | $ | 11.56 | | | | | $ | 11.55 | | | | | | | $ | 12.25 | | | | | | | $ | 12.16 | | | | | | | $ | 12.62 | |
| | | | | | | | | | | | | | | | | | | | | | | | | | | | | | | | | | | | | | | | | | | | | | |
| | | | | | | | | | | | |
Market price, end of period | | | | | | $ | 9.20 | | | | | | | $ | 11.70 | | | | | $ | 10.45 | | | | | | | $ | 11.20 | | | | | | | $ | 10.78 | | | | | | | $ | 11.47 | |
| | | | | | | | | | | | | | | | | | | | | | | | | | | | | | | | | | | | | | | | | | | | | | |
| | | | | | | | | | | | |
Total Return(d) | | | | | | | | | | | | | | | | | | | | | | | | | | | | | | | | | | | | | | | | | | | | | | |
Based on net asset value | | | | | | | (2.97 | )% | | | | | | | 6.67 | % | | | | | 2.57 | % | | | | | | | 8.03 | %(e) | | | | | | | 3.86 | % | | | | | | | 6.60 | %(f) |
| | | | | | | | | | | | | | | | | | | | | | | | | | | | | | | | | | | | | | | | | | | | | | |
| | | | | | | | | | | | |
Based on market price | | | | | | | (15.51 | )% | | | | | | | 19.33 | % | | | | | 1.50 | % | | | | | | | 11.42 | %(e) | | | | | | | 1.30 | % | | | | | | | 5.35 | % |
| | | | | | | | | | | | | | | | | | | | | | | | | | | | | | | | | | | | | | | | | | | | | | |
| | | | | | | | | | | | |
Ratios to Average Net Assets(g) | | | | | | | | | | | | | | | | | | | | | | | | | | | | | | | | | | | | | | | | | | | | | | |
Total expenses | | | | | | | 1.90 | % | | | | | | | 1.34 | % | | | | | 1.48 | % | | | | | | | 2.21 | %(h)(i) | | | | | | | 2.23 | % | | | | | | | 1.86 | % |
| | | | | | | | | | | | | | | | | | | | | | | | | | | | | | | | | | | | | | | | | | | | | | |
| | | | | | | | | | | | |
Total expenses after fees waived and/or reimbursed | | | | | | | 1.90 | % | | | | | | | 1.34 | % | | | | | 1.47 | % | | | | | | | 2.21 | %(h)(i) | | | | | | | 2.23 | % | | | | | | | 1.85 | % |
| | | | | | | | | | | | | | | | | | | | | | | | | | | | | | | | | | | | | | | | | | | | | | |
| | | | | | | | | | | | |
Total expenses after fees waived and/or reimbursed and excluding interest expense and fees | | | | | | | 0.84 | % | | | | | | | 0.92 | % | | | | | 0.91 | % | | | | | | | 0.92 | %(h) | | | | | | | 0.96 | % | | | | | | | 0.94 | % |
| | | | | | | | | | | | | | | | | | | | | | | | | | | | | | | | | | | | | | | | | | | | | | |
| | | | | | | | | | | | |
Net investment income | | | | | | | 6.65 | % | | | | | | | 5.21 | % | | | | | 5.65 | % | | | | | | | 6.25 | %(h) | | | | | | | 6.40 | % | | | | | | | 6.12 | % |
| | | | | | | | | | | | | | | | | | | | | | | | | | | | | | | | | | | | | | | | | | | | | | |
| | | | | | | | | | | | |
Supplemental Data | | | | | | | | | | | | | | | | | | | | | | | | | | | | | | | | | | | | | | | | | | | | | | |
Net assets, end of period (000) | | | | | | $ | 486,565 | | | | | | | $ | 538,681 | | | | | $ | 537,959 | | | | | | | $ | 605,240 | | | | | | | $ | 641,220 | | | | | | | $ | 742,204 | |
| | | | | | | | | | | | | | | | | | | | | | | | | | | | | | | | | | | | | | | | | | | | | | |
| | | | | | | | | | | | |
Borrowings outstanding, end of period (000) | | | | | | $ | 164,000 | | | | | | | $ | 248,000 | | | | | $ | 229,000 | | | | | | | $ | 262,000 | | | | | | | $ | 278,000 | | | | | | | $ | 338,000 | |
| | | | | | | | | | | | | | | | | | | | | | | | | | | | | | | | | | | | | | | | | | | | | | |
| | | | | | | | | | | | |
Asset coverage, end of period per $1,000 of bank borrowings(j) | | | | | | $ | 3,967 | | | | | | | $ | 3,172 | | | | | $ | 3,349 | | | | | | | $ | 3,310 | | | | | | | $ | 3,308 | | | | | | | $ | 3,196 | |
| | | | | | | | | | | | | | | | | | | | | | | | | | | | | | | | | | | | | | | | | | | | | | |
| | | | | | | | | | | | |
Portfolio turnover rate | | | | | | | 18 | % | | | | | | | 47 | % | | | | | 67 | % | | | | | | | 53 | % | | | | | | | 62 | % | | | | | | | 59 | % |
| | | | | | | | | | | | | | | | | | | | | | | | | | | | | | | | | | | | | | | | | | | | | | |
| (a) | Consolidated Financial Highlights through November 30, 2017. |
| (b) | Based on average shares outstanding. |
| (c) | Distributions for annual periods determined in accordance with U.S. federal income tax regulations. |
| (d) | Total returns based on market price, which can be significantly greater or less than the net asset value, may result in substantially different returns. Where applicable, excludes the effects of any sales charges and assumes the reinvestment of distributions at actual reinvestment prices. |
| (f) | Includes payment from an affiliate, which had no impact on the Fund’s total return. |
| (g) | Excludes fees and expenses incurred indirectly as a result of investments in underlying funds. |
| (i) | Audit costs were not annualized in the calculation of the expense ratios. If these expenses were annualized, the total expenses and total expenses after fees waived and/or reimbursed would have been 2.23%. |
| (j) | Calculated by subtracting the Fund’s total liabilities (not including bank borrowings) from the Fund’s total assets and dividing this by the amount of bank borrowings, and by multiplying the results by 1,000. |
See notes to financial statements.
Financial Highlights (continued)
(For a share outstanding throughout each period)
| | | | | | | | | | | | | | | | | | | | | | | | | | | | | | | | | | | | | | | | | | | | | | |
| | | FRA | |
| | | | | | |
| | | | | | | | | | | | | | Period from | | | | | | | | | |
| | | Year Ended | | | | Year Ended | | | Year Ended | | | | 09/01/19 | | | | Year Ended | | | | Year Ended | |
| | | | | | | | 12/31/22 | | | | | | | | 12/31/21 | | | | | | 12/31/20 | | | | | | | | to 12/31/19 | | | | | | | | 08/31/19 | | | | | | | | 08/31/18 | (a) |
| | | | | | | | | | | | |
Net asset value, beginning of period | | | | | | $ | 13.85 | | | | | | | $ | 13.81 | | | | | $ | 14.55 | | | | | | | $ | 14.49 | | | | | | | $ | 14.92 | | | | | | | $ | 14.93 | |
| | | | | | | | | | | | | | | | | | | | | | | | | | | | | | | | | | | | | | | | | | | | | | |
| | | | | | | | | | | | |
Net investment income(b) | | | | | | | 0.84 | | | | | | | | 0.67 | | | | | | 0.69 | | | | | | | | 0.25 | | | | | | | | 0.84 | | | | | | | | 0.79 | |
Net realized and unrealized gain (loss) | | | | | | | (1.11 | ) | | | | | | | 0.17 | | | | | | (0.51 | ) | | | | | | | 0.19 | | | | | | | | (0.40 | ) | | | | | | | (0.06 | ) |
| | | | | | | | | | | | | | | | | | | | | | | | | | | | | | | | | | | | | | | | | | | | | | |
| | | | | | | | | | | | |
Net increase (decrease) from investment operations | | | | | | | (0.27 | ) | | | | | | | 0.84 | | | | | | 0.18 | | | | | | | | 0.44 | | | | | | | | 0.44 | | | | | | | | 0.73 | |
| | | | | | | | | | | | | | | | | | | | | | | | | | | | | | | | | | | | | | | | | | | | | | |
| | | | | | | | | | | | |
Distributions(c) | | | | | | | | | | | | | | | | | | | | | | | | | | | | | | | | | | | | | | | | | | | | | | |
From net investment income | | | | | | | (0.77 | ) | | | | | | | (0.67 | ) | | | | | (0.70 | ) | | | | | | | (0.38 | ) | | | | | | | (0.87 | ) | | | | | | | (0.74 | ) |
Return of capital | | | | | | | — | | | | | | | | (0.13 | ) | | | | | (0.22 | ) | | | | | | | — | | | | | | | | — | | | | | | | | — | |
| | | | | | | | | | | | | | | | | | | | | | | | | | | | | | | | | | | | | | | | | | | | | | |
| | | | | | | | | | | | |
Total distributions | | | | | | | (0.77 | ) | | | | | | | (0.80 | ) | | | | | (0.92 | ) | | | | | | | (0.38 | ) | | | | | | | (0.87 | ) | | | | | | | (0.74 | ) |
| | | | | | | | | | | | | | | | | | | | | | | | | | | | | | | | | | | | | | | | | | | | | | |
| | | | | | | | | | | | |
Net asset value, end of period | | | | | | $ | 12.81 | | | | | | | $ | 13.85 | | | | | $ | 13.81 | | | | | | | $ | 14.55 | | | | | | | $ | 14.49 | | | | | | | $ | 14.92 | |
| | | | | | | | | | | | | | | | | | | | | | | | | | | | | | | | | | | | | | | | | | | | | | |
| | | | | | | | | | | | |
Market price, end of period | | | | | | $ | 11.26 | | | | | | | $ | 13.43 | | | | | $ | 12.11 | | | | | | | $ | 13.44 | | | | | | | $ | 12.46 | | | | | | | $ | 13.80 | |
| | | | | | | | | | | | | | | | | | | | | | | | | | | | | | | | | | | | | | | | | | | | | | |
| | | | | | | | | | | | |
Total Return(d) | | | | | | | | | | | | | | | | | | | | | | | | | | | | | | | | | | | | | | | | | | | | | | |
Based on net asset value | | | | | | | (1.34 | )% | | | | | | | 6.48 | % | | | | | 2.76 | % | | | | | | | 3.41 | %(e) | | | | | | | 3.94 | % | | | | | | | 5.28 | % |
| | | | | | | | | | | | | | | | | | | | | | | | | | | | | | | | | | | | | | | | | | | | | | |
Based on market price | | | | | | | (10.57 | )% | | | | | | | 17.74 | % | | | | | (2.45 | )% | | | | | | | 11.08 | %(e) | | | | | | | (3.37 | )% | | | | | | | 3.11 | % |
| | | | | | | | | | | | | | | | | | | | | | | | | | | | | | | | | | | | | | | | | | | | | | |
| | | | | | | | | | | | |
Ratios to Average Net Assets(f) | | | | | | | | | | | | | | | | | | | | | | | | | | | | | | | | | | | | | | | | | | | | | | |
Total expenses | | | | | | | 2.17 | % | | | | | | | 1.55 | % | | | | | 1.69 | % | | | | | | | 2.20 | %(g)(h) | | | | | | | 2.45 | % | | | | | | | 2.23 | % |
| | | | | | | | | | | | | | | | | | | | | | | | | | | | | | | | | | | | | | | | | | | | | | |
| | | | | | | | | | | | |
Total expenses after fees waived and/or reimbursed | | | | | | | 2.17 | % | | | | | | | 1.54 | % | | | | | 1.67 | % | | | | | | | 2.20 | %(g)(h) | | | | | | | 2.45 | % | | | | | | | 2.22 | % |
| | | | | | | | | | | | | | | | | | | | | | | | | | | | | | | | | | | | | | | | | | | | | | |
| | | | | | | | | | | | |
Total expenses after fees waived and/or reimbursed and excluding interest expense and fees | | | | | | | 1.15 | % | | | | | | | 1.14 | % | | | | | 1.13 | % | | | | | | | 1.19 | %(g) | | | | | | | 1.16 | % | | | | | | | 1.20 | % |
| | | | | | | | | | | | | | | | | | | | | | | | | | | | | | | | | | | | | | | | | | | | | | |
| | | | | | | | | | | | |
Net investment income | | | | | | | 6.36 | % | | | | | | | 4.76 | % | | | | | 5.15 | % | | | | | | | 5.26 | %(g) | | | | | | | 5.74 | % | | | | | | | 5.27 | % |
| | | | | | | | | | | | | | | | | | | | | | | | | | | | | | | | | | | | | | | | | | | | | | |
| | | | | | | | | | | | |
Supplemental Data | | | | | | | | | | | | | | | | | | | | | | | | | | | | | | | | | | | | | | | | | | | | | | |
Net assets, end of period (000) | | | | | | $ | 451,188 | | | | | | | $ | 487,833 | | | | | $ | 488,051 | | | | | | | $ | 522,545 | | | | | | | $ | 526,447 | | | | | | | $ | 555,370 | |
| | | | | | | | | | | | | | | | | | | | | | | | | | | | | | | | | | | | | | | | | | | | | | |
| | | | | | | | | | | | |
Borrowings outstanding, end of period (000) | | | | | | $ | 147,000 | | | | | | | $ | 223,000 | | | | | $ | 208,000 | | | | | | | $ | 214,000 | | | | | | | $ | 204,000 | | | | | | | $ | 233,000 | |
| | | | | | | | | | | | | | | | | | | | | | | | | | | | | | | | | | | | | | | | | | | | | | |
| | | | | | | | | | | | |
Asset coverage, end of period per $1,000 of bank borrowings(i) | | | | | | $ | 4,069 | | | | | | | $ | 3,188 | | | | | $ | 3,346 | | | | | | | $ | 3,342 | | | | | | | $ | 3,582 | | | | | | | $ | 3,385 | |
| | | | | | | | | | | | | | | | | | | | | | | | | | | | | | | | | | | | | | | | | | | | | | |
| | | | | | | | | | | | |
Portfolio turnover rate | | | | | | | 14 | % | | | | | | | 49 | % | | | | | 65 | % | | | | | | | 16 | % | | | | | | | 53 | % | | | | | | | 57 | % |
| | | | | | | | | | | | | | | | | | | | | | | | | | | | | | | | | | | | | | | | | | | | | | |
| (a) | Consolidated Financial Highlights through November 30, 2017. |
| (b) | Based on average shares outstanding. |
| (c) | Distributions for annual periods determined in accordance with U.S. federal income tax regulations. |
| (d) | Total returns based on market price, which can be significantly greater or less than the net asset value, may result in substantially different returns. Where applicable, excludes the effects of any sales charges and assumes the reinvestment of distributions at actual reinvestment prices. |
| (f) | Excludes fees and expenses incurred indirectly as a result of investments in underlying funds. |
| (h) | Audit costs were not annualized in the calculation of the expense ratios. If these expenses were annualized, the total expenses and total expenses after fees waived and/or reimbursed would have been 2.23%. |
| (i) | Calculated by subtracting the Fund’s total liabilities (not including bank borrowings) from the Fund’s total assets and dividing this by the amount of bank borrowings, and by multiplying the results by 1,000. |
See notes to financial statements.
| | |
| 122 | | 2 0 2 2 BLACK ROCK ANNUAL REPORT TO SHAREHOLDERS |
Financial Highlights (continued)
(For a share outstanding throughout each period)
| | | | | | | | | | | | | | | | | | | | | | | | | | | | | | | | | | | | | | | | | | | | | | | | | | |
| | | BKT | |
| | | | | | |
| | | | | | | | | | | | | | | | | | | Period from | | | | | |
| | | Year Ended | | | | Year Ended | | | | Year Ended | | | | Year Ended | | | | 09/01/18 | | | | Year Ended | |
| | | | | | | | | | 12/31/22 | (a) | | | | | | | 12/31/21 | (a) | | | | | | | 12/31/20 | (a) | | | | | | | 12/31/19 | (a) | | | | | | | to 12/31/18 | (a) | | | | | | | 08/31/18 | (a) |
| | | | | | | | | | | | |
Net asset value, beginning of period | | | | | | $ | 16.94 | | | | | | | $ | 18.54 | | | | | | | $ | 18.89 | | | | | | | $ | 18.75 | | | | | | | $ | 18.94 | | | | | | | $ | 20.21 | |
| | | | | | | | | | | | | | | | | | | | | | | | | | | | | | | | | | | | | | | | | | | | | | | | | | |
| | | | | | | | | | | | |
Net investment income(b) | | | | | | | 0.43 | | | | | | | | 0.70 | | | | | | | | 0.86 | | | | | | | | 0.75 | | | | | | | | 0.25 | | | | | | | | 0.72 | |
Net realized and unrealized gain (loss) | | | | | | | (3.24 | ) | | | | | | | (1.06 | ) | | | | | | | 0.02 | | | | | | | | 0.63 | | | | | | | | 0.07 | | | | | | | | (1.02 | ) |
| | | | | | | | | | | | | | | | | | | | | | | | | | | | | | | | | | | | | | | | | | | | | | | | | | |
| | | | | | | | | | | | |
Net increase (decrease) from investment operations | | | | | | | (2.81 | ) | | | | | | | (0.36 | ) | | | | | | | 0.88 | | | | | | | | 1.38 | | | | | | | | 0.32 | | | | | | | | (0.30 | ) |
| | | | | | | | | | | | | | | | | | | | | | | | | | | | | | | | | | | | | | | | | | | | | | | | | | |
| | | | | | | | | | | | |
Distributions(c) | | | | | | | | | | | | | | | | | | | | | | | | | | | | | | | | | | | | | | | | | | | | | | | | |
From net investment income | | | | | | | (0.49 | ) | | | | | | | (0.89 | ) | | | | | | | (1.01 | ) | | | | | | | (0.89 | ) | | | | | | | (0.40 | ) | | | | | | | (0.90 | ) |
Return of capital | | | | | | | (0.54 | ) | | | | | | | (0.35 | ) | | | | | | | (0.22 | ) | | | | | | | (0.35 | ) | | | | | | | (0.11 | ) | | | | | | | (0.07 | ) |
| | | | | | | | | | | | | | | | | | | | | | | | | | | | | | | | | | | | | | | | | | | | | | | | | | |
| | | | | | | | | | | | |
Total distributions | | | | | | | (1.03 | ) | | | | | | | (1.24 | ) | | | | | | | (1.23 | ) | | | | | | | (1.24 | ) | | | | | | | (0.51 | ) | | | | | | | (0.97 | ) |
| | | | | | | | | | | | | | | | | | | | | | | | | | | | | | | | | | | | | | | | | | | | | | | | | | |
| | | | | | | | | | | | |
Net asset value, end of period | | | | | | $ | 13.10 | | | | | | | $ | 16.94 | | | | | | | $ | 18.54 | | | | | | | $ | 18.89 | | | | | | | $ | 18.75 | | | | | | | $ | 18.94 | |
| | | | | | | | | | | | | | | | | | | | | | | | | | | | | | | | | | | | | | | | | | | | | | | | | | |
| | | | | | | | | | | | |
Market price, end of period | | | | | | $ | 12.34 | | | | | | | $ | 16.95 | | | | | | | $ | 18.21 | | | | | | | $ | 18.15 | | | | | | | $ | 16.92 | | | | | | | $ | 17.31 | |
| | | | | | | | | | | | | | | | | | | | | | | | | | | | | | | | | | | | | | | | | | | | | | | | | | |
| | | | | | | | | | | | |
Total Return(d) | | | | | | | | | | | | | | | | | | | | | | | | | | | | | | | | | | | | | | | | | | | | | | | | |
Based on net asset value | | | | | | | (16.67 | )% | | | | | | | (2.01 | )% | | | | | | | 4.92 | % | | | | | | | 7.91 | % | | | | | | | 2.06 | %(e) | | | | | | | (1.14 | )% |
| | | | | | | | | | | | | | | | | | | | | | | | | | | | | | | | | | | | | | | | | | | | | | | | | | |
| | | | | | | | | | | | |
Based on market price | | | | | | | (21.50 | )% | | | | | | | (0.23 | )% | | | | | | | 7.31 | % | | | | | | | 14.83 | % | | | | | | | 0.72 | %(e) | | | | | | | (3.44 | )% |
| | | | | | | | | | | | | | | | | | | | | | | | | | | | | | | | | | | | | | | | | | | | | | | | | | |
| | | | | | | | | | | | |
Ratios to Average Net Assets(f) | | | | | | | | | | | | | | | | | | | | | | | | | | | | | | | | | | | | | | | | | | | | | | | | |
Total expenses | | | | | | | 1.65 | % | | | | | | | 0.94 | % | | | | | | | 1.18 | % | | | | | | | 2.06 | % | | | | | | | 2.08 | %(g)(h) | | | | | | | 1.79 | % |
| | | | | | | | | | | | | | | | | | | | | | | | | | | | | | | | | | | | | | | | | | | | | | | | | | |
| | | | | | | | | | | | |
Total expenses after fees waived and/or reimbursed | | | | | | | 1.64 | % | | | | | | | 0.94 | % | | | | | | | 1.18 | % | | | | | | | 2.06 | % | | | | | | | 2.08 | %(g) | | | | | | | 1.79 | % |
| | | | | | | | | | | | | | | | | | | | | | | | | | | | | | | | | | | | | | | | | | | | | | | | | | |
| | | | | | | | | | | | |
Total expenses after fees waived and/or reimbursed and excluding interest expense | | | | | | | 0.95 | % | | | | | | | 0.90 | % | | | | | | | 0.89 | % | | | | | | | 0.94 | % | | | | | | | 0.99 | %(g) | | | | | | | 1.04 | % |
| | | | | | | | | | | | | | | | | | | | | | | | | | | | | | | | | | | | | | | | | | | | | | | | | | |
| | | | | | | | | | | | |
Net investment income | | | | | | | 2.94 | % | | | | | | | 3.91 | % | | | | | | | 4.55 | % | | | | | | | 3.95 | % | | | | | | | 4.04 | %(g) | | | | | | | 3.72 | % |
| | | | | | | | | | | | | | | | | | | | | | | | | | | | | | | | | | | | | | | | | | | | | | | | | | |
| | | | | | | | | | | | |
Supplemental Data | | | | | | | | | | | | | | | | | | | | | | | | | | | | | | | | | | | | | | | | | | | | | | | | |
Net assets, end of period (000) | | | | | | $ | 279,035 | | | | | | | $ | 360,752 | | | | | | | $ | 394,195 | | | | | | | $ | 401,715 | | | | | | | $ | 398,629 | | | | | | | $ | 402,763 | |
| | | | | | | | | | | | | | | | | | | | | | | | | | | | | | | | | | | | | | | | | | | | | | | | | | |
| | | | | | | | | | | | |
Borrowings outstanding, end of period (000) | | | | | | $ | 115,764 | | | | | | | $ | 115,184 | | | | | | | $ | 156,936 | | | | | | | $ | 175,655 | | | | | | | $ | 186,799 | | | | | | | $ | 186,441 | |
| | | | | | | | | | | | | | | | | | | | | | | | | | | | | | | | | | | | | | | | | | | | | | | | | | |
| | | | | | | | | | | | |
Portfolio turnover rate(i) | | | | | | | 237 | % | | | | | | | 248 | % | | | | | | | 69 | % | | | | | | | 255 | % | | | | | | | 95 | % | | | | | | | 373 | % |
| | | | | | | | | | | | | | | | | | | | | | | | | | | | | | | | | | | | | | | | | | | | | | | | | | |
|
(a) Per share operating performance amounts have been adjusted to reflect a 1-for-3 reverse stock split prior to the open of trading on the NYSE on October 18, 2022 for common stockholders of record as of the close of business on October 17, 2022. (b) Based on average shares outstanding. (c) Distributions for annual periods determined in accordance with U.S. federal income tax regulations. (d) Total returns based on market price, which can be significantly greater or less than the net asset value, may result in substantially different returns. Where applicable, excludes the effects of any sales charges and assumes the reinvestment of distributions at actual reinvestment prices. (e) Not annualized. (f) Excludes fees and expenses incurred indirectly as a result of investments in underlying funds. (g) Annualized. (h) Audit costs were not annualized in the calculation of the expense ratio. If these expenses were annualized, the total expenses would have been 2.11%. (i) Includes mortgage dollar roll transactions (“MDRs”). Additional information regarding portfolio turnover rate is as follows: | |
| | | | | | | |
| | | |
| Year Ended
12/31/22 |
| |
| Year Ended
12/31/21 |
| |
| Year Ended
12/31/20 |
| |
| Year Ended
12/31/19 |
| |
| Period from
09/01/18 to 12/31/18 |
| |
| Year Ended
08/31/18 |
|
| | | | | | | | | | | | | |
| | Portfolio turnover rate (excluding MDRs) | | | | | | | 122 | % | | | | | | | 119 | % | | | | | | | 31 | % | | | | | | | 136 | % | | | | | | | 45 | % | | | | | | | 181 | % |
| | | | | | | | | | | | | | | | | | | | | | | | | | | | | | | | | | | | | | | | | | | | | | | | | | |
See notes to financial statements.
Financial Highlights (continued)
(For a share outstanding throughout each period)
| | | | | | | | | | | | | | | | | | | | | | | | | | | | | | | | | | | | | | | | | | | | | | | | | | |
| | | BLW | |
| | | | | | |
| | | | Year Ended 12/31/22 | | |
| Year Ended
12/31/21 |
| |
| Year Ended
12/31/20 |
| |
| Period from
09/01/19 to 12/31/19 |
| |
| Year Ended
08/31/19 |
| |
| Year Ended
08/31/18 |
|
| | | | | | | | | | | | |
Net asset value, beginning of period | | | | | | $ | 16.44 | | | | | | | $ | 16.93 | | | | | | | $ | 17.05 | | | | | | | $ | 17.03 | | | | | | | $ | 16.71 | | | | | | | $ | 17.02 | |
| | | | | | | | | | | | | | | | | | | | | | | | | | | | | | | | | | | | | | | | | | | | | | | | | | |
Net investment income(a) | | | | | | | 0.97 | | | | | | | | 1.00 | | | | | | | | 0.98 | | | | | | | | 0.31 | | | | | | | | 0.94 | | | | | | | | 0.95 | |
Net realized and unrealized gain (loss) | | | | | | | (2.82 | ) | | | | | | | (0.31 | ) | | | | | | | 0.08 | | | | | | | | 0.18 | | | | | | | | 0.33 | | | | | | | | (0.31 | ) |
| | | | | | | | | | | | | | | | | | | | | | | | | | | | | | | | | | | | | | | | | | | | | | | | | | |
| | | | | | | | | | | | |
Net increase (decrease) from investment operations | | | | | | | (1.85 | ) | | | | | | | 0.69 | | | | | | | | 1.06 | | | | | | | | 0.49 | | | | | | | | 1.27 | | | | | | | | 0.64 | |
| | | | | | | | | | | | | | | | | | | | | | | | | | | | | | | | | | | | | | | | | | | | | | | | | | |
| | | | | | | | | | | | |
Distributions(b) | | | | | | | | | | | | | | | | | | | | | | | | | | | | | | | | | | | | | | | | | | | | | | | | |
From net investment income | | | | | | | (0.92 | ) | | | | | | | (1.02 | ) | | | | | | | (1.03 | ) | | | | | | | (0.47 | ) | | | | | | | (0.95 | ) | | | | | | | (0.95 | ) |
Return of capital | | | | | | | (0.16 | ) | | | | | | | (0.16 | ) | | | | | | | (0.15 | ) | | | | | | | — | | | | | | | | — | | | | | | | | — | |
| | | | | | | | | | | | | | | | | | | | | | | | | | | | | | | | | | | | | | | | | | | | | | | | | | |
| | | | | | | | | | | | |
Total distributions | | | | | | | (1.08 | ) | | | | | | | (1.18 | ) | | | | | | | (1.18 | ) | | | | | | | (0.47 | ) | | | | | | | (0.95 | ) | | | | | | | (0.95 | ) |
| | | | | | | | | | | | | | | | | | | | | | | | | | | | | | | | | | | | | | | | | | | | | | | | | | |
| | | | | | | | | | | | |
Net asset value, end of period | | | | | | $ | 13.51 | | | | | | | $ | 16.44 | | | | | | | $ | 16.93 | | | | | | | $ | 17.05 | | | | | | | $ | 17.03 | | | | | | | $ | 16.71 | |
| | | | | | | | | | | | | | | | | | | | | | | | | | | | | | | | | | | | | | | | | | | | | | | | | | |
| | | | | | | | | | | | |
Market price, end of period | | | | | | $ | 13.07 | | | | | | | $ | 16.85 | | | | | | | $ | 15.92 | | | | | | | $ | 16.39 | | | | | | | $ | 15.44 | | | | | | | $ | 15.06 | |
| | | | | | | | | | | | | | | | | | | | | | | | | | | | | | | | | | | | | | | | | | | | | | | | | | |
| | | | | | | | | | | | |
Total Return(c) | | | | | | | | | | | | | | | | | | | | | | | | | | | | | | | | | | | | | | | | | | | | | | | | |
Based on net asset value | | | | | | | (10.96 | )% | | | | | | | 4.18 | %(d) | | | | | | | 7.58 | % | | | | | | | 3.11 | %(e) | | | | | | | 8.77 | % | | | | | | | 4.42 | % |
| | | | | | | | | | | | | | | | | | | | | | | | | | | | | | | | | | | | | | | | | | | | | | | | | | |
| | | | | | | | | | | | |
Based on market price | | | | | | | (15.96 | )% | | | | | | | 13.55 | % | | | | | | | 5.24 | % | | | | | | | 9.32 | %(e) | | | | | | | 9.41 | % | | | | | | | 0.18 | % |
| | | | | | | | | | | | | | | | | | | | | | | | | | | | | | | | | | | | | | | | | | | | | | | | | | |
| | | | | | | | | | | | |
Ratios to Average Net Assets(f) | | | | | | | | | | | | | | | | | | | | | | | | | | | | | | | | | | | | | | | | | | | | | | | | |
Total expenses | | | | | | | 2.04 | % | | | | | | | 1.18 | % | | | | | | | 1.39 | % | | | | | | | 1.64 | %(g)(h) | | | | | | | 1.81 | % | | | | | | | 1.73 | % |
| | | | | | | | | | | | | | | | | | | | | | | | | | | | | | | | | | | | | | | | | | | | | | | | | | |
| | | | | | | | | | | | |
Total expenses after fees waived and/or reimbursed | | | | | | | 2.04 | % | | | | | | | 1.18 | % | | | | | | | 1.39 | % | | | | | | | 1.64 | %(g)(h) | | | | | | | 1.81 | % | | | | | | | 1.73 | % |
| | | | | | | | | | | | | | | | | | | | | | | | | | | | | | | | | | | | | | | | | | | | | | | | | | |
| | | | | | | | | | | | |
Total expenses after fees waived and/or reimbursed and excluding interest expense | | | | | | | 0.96 | % | | | | | | | 0.92 | % | | | | | | | 0.90 | % | | | | | | | 0.89 | %(g) | | | | | | | 0.84 | % | | | | | | | 0.89 | % |
| | | | | | | | | | | | | | | | | | | | | | | | | | | | | | | | | | | | | | | | | | | | | | | | | | |
| | | | | | | | | | | | |
Net investment income | | | | | | | 6.70 | % | | | | | | | 5.90 | % | | | | | | | 6.07 | % | | | | | | | 5.32 | %(g) | | | | | | | 5.69 | % | | | | | | | 5.60 | % |
| | | | | | | | | | | | | | | | | | | | | | | | | | | | | | | | | | | | | | | | | | | | | | | | | | |
| | | | | | | | | | | | |
Supplemental Data | | | | | | | | | | | | | | | | | | | | | | | | | | | | | | | | | | | | | | | | | | | | | | | | |
Net assets, end of period (000) | | | | | | $ | 482,587 | | | | | | | $ | 587,146 | | | | | | | $ | 603,933 | | | | | | | $ | 611,068 | | | | | | | $ | 610,251 | | | | | | | $ | 612,048 | |
| | | | | | | | | | | | | | | | | | | | | | | | | | | | | | | | | | | | | | | | | | | | | | | | | | |
| | | | | | | | | | | | |
Borrowings outstanding, end of period (000) | | | | | | $ | 275,639 | | | | | | | $ | 312,356 | | | | | | | $ | 275,105 | | | | | | | $ | 213,399 | | | | | | | $ | 202,539 | | | | | | | $ | 234,622 | |
| | | | | | | | | | | | | | | | | | | | | | | | | | | | | | | | | | | | | | | | | | | | | | | | | | |
| | | | | | | | | | | | |
Portfolio turnover rate(i) | | | | | | | 77 | % | | | | | | | 66 | % | | | | | | | 65 | % | | | | | | | 14 | % | | | | | | | 50 | % | | | | | | | 50 | % |
| | | | | | | | | | | | | | | | | | | | | | | | | | | | | | | | | | | | | | | | | | | | | | | | | | |
(a) Based on average shares outstanding. (b) Distributions for annual periods determined in accordance with U.S. federal income tax regulations. (c) Total returns based on market price, which can be significantly greater or less than the net asset value, may result in substantially different returns. Where applicable, excludes the effects of any sales charges and assumes the reinvestment of distributions at actual reinvestment prices. (d) Includes payment from an affiliate, which had no impact on the Fund’s total return. (e) Not annualized. (f) Excludes fees and expenses incurred indirectly as a result of investments in underlying funds. (g) Annualized. (h) Audit costs were not annualized in the calculation of the expense ratios. If these expenses were annualized, the total expenses and total expenses after fees waived and/or reimbursed would have been 1.66%. (i) Includes mortgage dollar roll transactions (“MDRs”). Additional information regarding portfolio turnover rate is as follows: | |
| | | | | | | |
| | | |
| Year Ended
12/31/22 |
| |
| Year Ended
12/31/21 |
| |
| Year Ended
12/31/20 |
| |
| Period from
09/01/19 to 12/31/19 |
| |
| Year Ended
08/31/19 |
| |
| Year Ended
08/31/18 |
|
| | | | | | | | | | | | | |
| | Portfolio turnover rate (excluding MDRs) | | | | | | | 58 | % | | | | | | | 52 | % | | | | | | | 58 | % | | | | | | | 14 | % | | | | | | | 50 | % | | | | | | | 50 | % |
| | | | | | | | | | | | | | | | | | | | | | | | | | | | | | | | | | | | | | | | | | | | | | | | | | |
See notes to financial statements.
| | |
| 124 | | 2 0 2 2 BLACK ROCK ANNUAL REPORT TO SHAREHOLDERS |
Notes to Financial Statements
The following are registered under the Investment Company Act of 1940, as amended (the “1940 Act”), as closed-end management investment companies and are referred to herein collectively as the “Funds”, or individually as a “Fund”:
| | | | | | | | | | | | |
| |
| | | |
| Fund Name | | Herein Referred To As | | | Organized | | | Diversification Classification | |
| |
| | | |
BlackRock Debt Strategies Fund, Inc. | | | DSU | | | | Maryland | | | | Diversified | |
BlackRock Floating Rate Income Strategies Fund, Inc. | | | FRA | | | | Maryland | | | | Diversified | |
BlackRock Income Trust, Inc. | | | BKT | | | | Maryland | | | | Diversified | |
BlackRock Limited Duration Income Trust | | | BLW | | | | Delaware | | | | Diversified | |
| |
The Boards of Directors and Boards of Trustees of the Funds are collectively referred to throughout this report as the “Board,” and the directors/trustees thereof are collectively referred to throughout this report as “Directors”. The Funds determine and make available for publication the net asset values (“NAVs”) of their Common Shares on a daily basis.
The Funds, together with certain other registered investment companies advised by BlackRock Advisors, LLC (the “Manager”) or its affiliates, are included in a complex of funds referred to as the BlackRock Fixed-Income Complex.
| 2. | SIGNIFICANT ACCOUNTING POLICIES |
The financial statements are prepared in conformity with accounting principles generally accepted in the United States of America (“U.S. GAAP”), which may require management to make estimates and assumptions that affect the reported amounts of assets and liabilities in the financial statements, disclosure of contingent assets and liabilities at the date of the financial statements and the reported amounts of increases and decreases in net assets from operations during the reporting period. Actual results could differ from those estimates. Each Fund is considered an investment company under U.S. GAAP and follows the accounting and reporting guidance applicable to investment companies. Below is a summary of significant accounting policies:
Investment Transactions and Income Recognition: For financial reporting purposes, investment transactions are recorded on the dates the transactions are executed. Realized gains and losses on investment transactions are determined using the specific identification method. Dividend income and capital gain distributions, if any, are recorded on the ex-dividend dates. Non-cash dividends, if any, are recorded on the ex-dividend dates at fair value. Dividends from foreign securities where the ex-dividend dates may have passed are subsequently recorded when the Funds are informed of the ex-dividend dates. Under the applicable foreign tax laws, a withholding tax at various rates may be imposed on capital gains, dividends and interest. Upon notification from issuers, a portion of the dividend income received from a real estate investment trust may be redesignated as a reduction of cost of the related investment and/or realized gain. Interest income, including amortization and accretion of premiums and discounts on debt securities, and payment-in-kind interest are recognized daily on an accrual basis. For convertible securities, premiums attributable to the debt instrument are amortized, but premiums attributable to the conversion feature are not amortized.
Foreign Currency Translation: Each Fund’s books and records are maintained in U.S. dollars. Securities and other assets and liabilities denominated in foreign currencies are translated into U.S. dollars using exchange rates determined as of the close of trading on the New York Stock Exchange (“NYSE”). Purchases and sales of investments are recorded at the rates of exchange prevailing on the respective dates of such transactions. Generally, when the U.S. dollar rises in value against a foreign currency, the investments denominated in that currency will lose value; the opposite effect occurs if the U.S. dollar falls in relative value.
Each Fund does not isolate the effect of fluctuations in foreign exchange rates from the effect of fluctuations in the market prices of investments for financial reporting purposes. Accordingly, the effects of changes in exchange rates on investments are not segregated in the Statements of Operations from the effects of changes in market prices of those investments, but are included as a component of net realized and unrealized gain (loss) from investments. Each Fund reports realized currency gains (losses) on foreign currency related transactions as components of net realized gain (loss) for financial reporting purposes, whereas such components are generally treated as ordinary income for U.S. federal income tax purposes.
Collateralization: If required by an exchange or counterparty agreement, the Funds may be required to deliver/deposit cash and/or securities to/with an exchange, or broker-dealer or custodian as collateral for certain investments.
Distributions: Distributions paid by the Funds are recorded on the ex-dividend dates. Subject to the Funds’ managed distribution plan, the Funds intend to make monthly cash distributions to shareholders, which may consist of net investment income, and net realized and unrealized gains on investments and/or return of capital.
The character of distributions is determined in accordance with U.S. federal income tax regulations, which may differ from U.S. GAAP. The portion of distributions that exceeds a Fund’s current and accumulated earnings and profits, which are measured on a tax basis, will constitute a non-taxable return of capital. See Income Tax Information note for the tax character of each Fund’s distributions paid during the year.
Deferred Compensation Plan: Under the Deferred Compensation Plan (the “Plan”) approved by each Fund’s Board, the directors who are not “interested persons” of the Funds, as defined in the 1940 Act (“Independent Directors”), may defer a portion of their annual complex-wide compensation. Deferred amounts earn an approximate return as though equivalent dollar amounts had been invested in common shares of certain funds in the BlackRock Fixed-Income Complex selected by the Independent Directors. This has the same economic effect for the Independent Directors as if the Independent Directors had invested the deferred amounts directly in certain funds in the BlackRock Fixed-Income Complex.
The Plan is not funded and obligations thereunder represent general unsecured claims against the general assets of each Fund, as applicable. Deferred compensation liabilities, if any, are included in the Directors’ and Officer’s fees payable in the Statements of Assets and Liabilities and will remain as a liability of the Funds until such amounts
| | |
NOTES TO FINANCIAL STATEMENTS | | 125 |
Notes to Financial Statements (continued)
are distributed in accordance with the Plan. Net appreciation (depreciation) in the value of participants’ deferral accounts is allocated among the participating funds in the BlackRock Fixed-Income Complex and reflected as Directors and Officer expense on the Statements of Operations. The Directors and Officer expense may be negative as a result of a decrease in value of the deferred accounts.
Indemnifications: In the normal course of business, a Fund enters into contracts that contain a variety of representations that provide general indemnification. A Fund’s maximum exposure under these arrangements is unknown because it involves future potential claims against a Fund, which cannot be predicted with any certainty.
Other: Expenses directly related to a Fund are charged to that Fund. Other operating expenses shared by several funds, including other funds managed by the Manager, are prorated among those funds on the basis of relative net assets or other appropriate methods.
| 3. | INVESTMENT VALUATION AND FAIR VALUE MEASUREMENTS |
Investment Valuation Policies: Each Fund’s investments are valued at fair value (also referred to as “market value” within the financial statements) each day that the Fund is open for business and, for financial reporting purposes, as of the report date. U.S. GAAP defines fair value as the price a fund would receive to sell an asset or pay to transfer a liability in an orderly transaction between market participants at the measurement date. The Board has approved the designation of each Fund’s Manager as the valuation designee for each Fund. Each Fund determines the fair values of its financial instruments using various independent dealers or pricing services under the Manager’s policies. If a security’s market price is not readily available or does not otherwise accurately represent the fair value of the security, the security will be valued in accordance with the Manager’s policies and procedures as reflecting fair value. The Manager has formed a committee (the “Valuation Committee”) to develop pricing policies and procedures and to oversee the pricing function for all financial instruments, with assistance from other BlackRock pricing committees.
Fair Value Inputs and Methodologies: The following methods and inputs are used to establish the fair value of each Fund’s assets and liabilities:
| | • | | Equity investments traded on a recognized securities exchange are valued at that day’s official closing price, as applicable, on the exchange where the stock is primarily traded. Equity investments traded on a recognized exchange for which there were no sales on that day may be valued at the last available bid (long positions) or ask (short positions) price. |
| | • | | Fixed-income investments for which market quotations are readily available are generally valued using the last available bid price or current market quotations provided by independent dealers or third-party pricing services. Floating rate loan interests are valued at the mean of the bid prices from one or more independent brokers or dealers as obtained from a third-party pricing service. Pricing services generally value fixed-income securities assuming orderly transactions of an institutional round lot size, but a fund may hold or transact in such securities in smaller, odd lot sizes. Odd lots may trade at lower prices than institutional round lots. The pricing services may use matrix pricing or valuation models that utilize certain inputs and assumptions to derive values, including transaction data (e.g., recent representative bids and offers), market data, credit quality information, perceived market movements, news, and other relevant information. Certain fixed-income securities, including asset-backed and mortgage related securities may be valued based on valuation models that consider the estimated cash flows of each tranche of the entity, establish a benchmark yield and develop an estimated tranche specific spread to the benchmark yield based on the unique attributes of the tranche. The amortized cost method of valuation may be used with respect to debt obligations with sixty days or less remaining to maturity unless the Manager determines such method does not represent fair value. |
| | • | | Investments in open-end U.S. mutual funds (including money market funds) are valued at that day’s published NAV. |
| | • | | Futures contracts are valued based on that day’s last reported settlement or trade price on the exchange where the contract is traded. |
| | • | | Forward foreign currency exchange contracts are valued at the mean between the bid and ask prices and are determined as of the close of trading on the NYSE based on that day’s prevailing forward exchange rate for the underlying currencies. |
| | • | | Swap agreements are valued utilizing quotes received daily by independent pricing services or through brokers, which are derived using daily swap curves and models that incorporate a number of market data factors, such as discounted cash flows, trades and values of the underlying reference instruments. |
Generally, trading in foreign instruments is substantially completed each day at various times prior to the close of trading on the NYSE. Each business day, the Funds use current market factors supplied by independent pricing services to value certain foreign instruments (“Systematic Fair Value Price”). The Systematic Fair Value Price is designed to value such foreign securities at fair value as of the close of trading on the NYSE, which follows the close of the local markets.
If events (e.g., market volatility, company announcement or a natural disaster) occur that are expected to materially affect the value of such investment, or in the event that application of these methods of valuation results in a price for an investment that is deemed not to be representative of the market value of such investment, or if a price is not available, the investment will be valued by the Valuation Committee in accordance with the Manager’s policies and procedures as reflecting fair value (“Fair Valued Investments”). The fair valuation approaches that may be used by the Valuation Committee include market approach, income approach and cost approach. Valuation techniques such as discounted cash flow, use of market comparables and matrix pricing are types of valuation approaches and are typically used in determining fair value. When determining the price for Fair Valued Investments, the Valuation Committee seeks to determine the price that each Fund might reasonably expect to receive or pay from the current sale or purchase of that asset or liability in an arm’s-length transaction. Fair value determinations shall be based upon all available factors that the Valuation Committee deems relevant and consistent with the principles of fair value measurement.
| | |
| 126 | | 2 0 2 2 BLACK ROCK ANNUAL REPORT TO SHAREHOLDERS |
Notes to Financial Statements (continued)
For investments in equity or debt issued by privately held companies or funds (“Private Company” or collectively, the “Private Companies”) and other Fair Valued Investments, the fair valuation approaches that are used by the Valuation Committee and third-party pricing services utilized by the Valuation Committee include one or a combination of, but not limited to, the following inputs.
| | | | |
| | | Standard Inputs Generally Considered By The Valuation Committee And Third-Party Pricing Services |
| |
Market approach | | (i) recent market transactions, including subsequent rounds of financing, in the underlying investment or comparable issuers; (ii) recapitalizations and other transactions across the capital structure; and (iii) market multiples of comparable issuers. |
| |
Income approach | | (i) future cash flows discounted to present and adjusted as appropriate for liquidity, credit, and/or market risks; (ii) quoted prices for similar investments or assets in active markets; and (iii) other risk factors, such as interest rates, yield curves, volatilities, prepayment speeds, loss severities, credit risks, recovery rates, liquidation amounts and/or default rates. |
| |
Cost approach | | (i) audited or unaudited financial statements, investor communications and financial or operational metrics issued by the Private Company; (ii) changes in the valuation of relevant indices or publicly traded companies comparable to the Private Company; (iii) relevant news and other public sources; and (iv) known secondary market transactions in the Private Company’s interests and merger or acquisition activity in companies comparable to the Private Company. |
Investments in series of preferred stock issued by Private Companies are typically valued utilizing market approach in determining the enterprise value of the company. Such investments often contain rights and preferences that differ from other series of preferred and common stock of the same issuer. Enterprise valuation techniques such as an option pricing model (“OPM”), a probability weighted expected return model (“PWERM”), current value method or a hybrid of those techniques are used as deemed appropriate under the circumstances. The use of these valuation techniques involve a determination of the exit scenarios of the investment in order to appropriately allocate the enterprise value of the company among the various parts of its capital structure.
The Private Companies are not subject to the public company disclosure, timing, and reporting standards applicable to other investments held by a Fund. Typically, the most recently available information by a Private Company is as of a date that is earlier than the date a Fund is calculating its NAV. This factor may result in a difference between the value of the investment and the price a Fund could receive upon the sale of the investment.
Fair Value Hierarchy: Various inputs are used in determining the fair value of financial instruments. These inputs to valuation techniques are categorized into a fair value hierarchy consisting of three broad levels for financial reporting purposes as follows:
| | • | | Level 1 – Unadjusted price quotations in active markets/exchanges for identical assets or liabilities that each Fund has the ability to access; |
| | • | | Level 2 – Other observable inputs (including, but not limited to, quoted prices for similar assets or liabilities in markets that are active, quoted prices for identical or similar assets or liabilities in markets that are not active, inputs other than quoted prices that are observable for the assets or liabilities (such as interest rates, yield curves, volatilities, prepayment speeds, loss severities, credit risks and default rates) or other market–corroborated inputs); and |
| | • | | Level 3 – Unobservable inputs based on the best information available in the circumstances, to the extent observable inputs are not available (including the Valuation Committee’s assumptions used in determining the fair value of financial instruments). |
The hierarchy gives the highest priority to unadjusted quoted prices in active markets for identical assets or liabilities (Level 1 measurements) and the lowest priority to unobservable inputs (Level 3 measurements). Accordingly, the degree of judgment exercised in determining fair value is greatest for instruments categorized in Level 3. The inputs used to measure fair value may fall into different levels of the fair value hierarchy. In such cases, for disclosure purposes, the fair value hierarchy classification is determined based on the lowest level input that is significant to the fair value measurement in its entirety. Investments classified within Level 3 have significant unobservable inputs used by the Valuation Committee in determining the price for Fair Valued Investments. Level 3 investments include equity or debt issued by Private Companies that may not have a secondary market and/or may have a limited number of investors. The categorization of a value determined for financial instruments is based on the pricing transparency of the financial instruments and is not necessarily an indication of the risks associated with investing in those securities.
As of December 31, 2022, certain investments of BLW were fair valued using NAV as a practical expedient as no quoted market value is available and therefore have been excluded from the fair value hierarchy.
| 4. | SECURITIES AND OTHER INVESTMENTS |
Asset-Backed and Mortgage-Backed Securities: Asset-backed securities are generally issued as pass-through certificates or as debt instruments. Asset-backed securities issued as pass-through certificates represent undivided fractional ownership interests in an underlying pool of assets. Asset-backed securities issued as debt instruments, which are also known as collateralized obligations, are typically issued as the debt of a special purpose entity organized solely for the purpose of owning such assets and issuing such debt. Asset-backed securities are often backed by a pool of assets representing the obligations of a number of different parties. The yield characteristics of certain asset-backed securities may differ from traditional debt securities. One such major difference is that all or a principal part of the obligations may be prepaid at any time because the underlying assets (i.e., loans) may be prepaid at any time. As a result, a decrease in interest rates in the market may result in increases in the level of prepayments as borrowers, particularly mortgagors, refinance and repay their loans. An increased prepayment rate with respect to an asset-backed security will have the effect of shortening the maturity of the security. In addition, a fund may subsequently have to reinvest the proceeds at lower interest rates. If a fund has purchased such an asset-backed security at a premium, a faster than anticipated prepayment rate could result in a loss of principal to the extent of the premium paid.
| | |
NOTES TO FINANCIAL STATEMENTS | | 127 |
Notes to Financial Statements (continued)
For mortgage pass-through securities (the “Mortgage Assets”) there are a number of important differences among the agencies and instrumentalities of the U.S. Government that issue mortgage-related securities and among the securities that they issue. For example, mortgage-related securities guaranteed by Ginnie Mae are guaranteed as to the timely payment of principal and interest by Ginnie Mae and such guarantee is backed by the full faith and credit of the United States. However, mortgage-related securities issued by Freddie Mac and Fannie Mae, including Freddie Mac and Fannie Mae guaranteed mortgage pass-through certificates, which are solely the obligations of Freddie Mac and Fannie Mae, are not backed by or entitled to the full faith and credit of the United States, but are supported by the right of the issuer to borrow from the U.S. Treasury.
Non-agency mortgage-backed securities are securities issued by non-governmental issuers and have no direct or indirect government guarantees of payment and are subject to various risks. Non-agency mortgage loans are obligations of the borrowers thereunder only and are not typically insured or guaranteed by any other person or entity. The ability of a borrower to repay a loan is dependent upon the income or assets of the borrower. A number of factors, including a general economic downturn, acts of God, terrorism, social unrest and civil disturbances, may impair a borrower’s ability to repay its loans.
Collateralized Debt Obligations: Collateralized debt obligations (“CDOs”), including collateralized bond obligations (“CBOs”) and collateralized loan obligations (“CLOs”), are types of asset-backed securities. A CDO is an entity that is backed by a diversified pool of debt securities (CBOs) or syndicated bank loans (CLOs). The cash flows of the CDO can be split into multiple segments, called “tranches,” which will vary in risk profile and yield. The riskiest segment is the subordinated or “equity” tranche. This tranche bears the greatest risk of defaults from the underlying assets in the CDO and serves to protect the other, more senior, tranches from default in all but the most severe circumstances. Since it is shielded from defaults by the more junior tranches, a “senior” tranche will typically have higher credit ratings and lower yields than their underlying securities, and often receive investment grade ratings from one or more of the nationally recognized rating agencies. Despite the protection from the more junior tranches, senior tranches can experience substantial losses due to actual defaults, increased sensitivity to future defaults and the disappearance of one or more protecting tranches as a result of changes in the credit profile of the underlying pool of assets.
Multiple Class Pass-Through Securities: Multiple class pass-through securities, including collateralized mortgage obligations (“CMOs”) and commercial mortgage-backed securities, may be issued by Ginnie Mae, U.S. Government agencies or instrumentalities or by trusts formed by private originators of, or investors in, mortgage loans. In general, CMOs are debt obligations of a legal entity that are collateralized by a pool of residential or commercial mortgage loans or Mortgage Assets. The payments on these are used to make payments on the CMOs or multiple pass-through securities. Multiple class pass-through securities represent direct ownership interests in the Mortgage Assets. Classes of CMOs include interest only (“IOs”), principal only (“POs”), planned amortization classes and targeted amortization classes. IOs and POs are stripped mortgage-backed securities representing interests in a pool of mortgages, the cash flow from which has been separated into interest and principal components. IOs receive the interest portion of the cash flow while POs receive the principal portion. IOs and POs can be extremely volatile in response to changes in interest rates. As interest rates rise and fall, the value of IOs tends to move in the same direction as interest rates. POs perform best when prepayments on the underlying mortgages rise since this increases the rate at which the principal is returned and the yield to maturity on the PO. When payments on mortgages underlying a PO are slower than anticipated, the life of the PO is lengthened and the yield to maturity is reduced. If the underlying Mortgage Assets experience greater than anticipated prepayments of principal, a fund’s initial investment in the IOs may not fully recoup.
Stripped Mortgage-Backed Securities: Stripped mortgage-backed securities are typically issued by the U.S. Government, its agencies and instrumentalities. Stripped mortgage-backed securities are usually structured with two classes that receive different proportions of the interest (IOs) and principal (POs) distributions on a pool of Mortgage Assets. Stripped mortgage-backed securities may be privately issued.
Zero-Coupon Bonds: Zero-coupon bonds are normally issued at a significant discount from face value and do not provide for periodic interest payments. These bonds may experience greater volatility in market value than other debt obligations of similar maturity which provide for regular interest payments.
Capital Securities and Trust Preferred Securities: Capital securities, including trust preferred securities, are typically issued by corporations, generally in the form of interest-bearing notes with preferred securities characteristics. In the case of trust preferred securities, an affiliated business trust of a corporation issues these securities, generally in the form of beneficial interests in subordinated debentures or similarly structured securities. The securities can be structured with either a fixed or adjustable coupon that can have either a perpetual or stated maturity date. For trust preferred securities, the issuing bank or corporation pays interest to the trust, which is then distributed to holders of these securities as a dividend. Dividends can be deferred without creating an event of default or acceleration, although maturity cannot take place unless all cumulative payment obligations have been met. The deferral of payments does not affect the purchase or sale of these securities in the open market. These securities generally are rated below that of the issuing company’s senior debt securities and are freely callable at the issuer’s option.
Preferred Stocks: Preferred stock has a preference over common stock in liquidation (and generally in receiving dividends as well), but is subordinated to the liabilities of the issuer in all respects. As a general rule, the market value of preferred stock with a fixed dividend rate and no conversion element varies inversely with interest rates and perceived credit risk, while the market price of convertible preferred stock generally also reflects some element of conversion value. Because preferred stock is junior to debt securities and other obligations of the issuer, deterioration in the credit quality of the issuer will cause greater changes in the value of a preferred stock than in a more senior debt security with similar stated yield characteristics. Unlike interest payments on debt securities, preferred stock dividends are payable only if declared by the issuer’s board of directors. Preferred stock also may be subject to optional or mandatory redemption provisions.
Warrants: Warrants entitle a fund to purchase a specified number of shares of common stock and are non-income producing. The purchase price and number of shares are subject to adjustment under certain conditions until the expiration date of the warrants, if any. If the price of the underlying stock does not rise above the strike price before the warrant expires, the warrant generally expires without any value and a fund will lose any amount it paid for the warrant. Thus, investments in warrants may involve more risk than investments in common stock. Warrants may trade in the same markets as their underlying stock; however, the price of the warrant does not necessarily move with the price of the underlying stock.
Floating Rate Loan Interests: Floating rate loan interests are typically issued to companies (the “borrower”) by banks, other financial institutions, or privately and publicly offered corporations (the “lender”). Floating rate loan interests are generally non-investment grade, often involve borrowers whose financial condition is troubled or uncertain and companies that are highly leveraged or in bankruptcy proceedings. In addition, transactions in floating rate loan interests may settle on a delayed basis, which may result in proceeds from the sale not being readily available for a fund to make additional investments or meet its redemption obligations. Floating rate loan interests may include fully
| | |
| 128 | | 2 0 2 2 BLACK ROCK ANNUAL REPORT TO SHAREHOLDERS |
Notes to Financial Statements (continued)
funded term loans or revolving lines of credit. Floating rate loan interests are typically senior in the corporate capital structure of the borrower. Floating rate loan interests generally pay interest at rates that are periodically determined by reference to a base lending rate plus a premium. Since the rates reset only periodically, changes in prevailing interest rates (and particularly sudden and significant changes) can be expected to cause some fluctuations in the NAV of a fund to the extent that it invests in floating rate loan interests. The base lending rates are generally the lending rate offered by one or more European banks, such as the London Interbank Offered Rate (“LIBOR”), the prime rate offered by one or more U.S. banks or the certificate of deposit rate. Floating rate loan interests may involve foreign borrowers, and investments may be denominated in foreign currencies. These investments are treated as investments in debt securities for purposes of a fund’s investment policies.
When a fund purchases a floating rate loan interest, it may receive a facility fee and when it sells a floating rate loan interest, it may pay a facility fee. On an ongoing basis, a fund may receive a commitment fee based on the undrawn portion of the underlying line of credit amount of a floating rate loan interest. Facility and commitment fees are typically amortized to income over the term of the loan or term of the commitment, respectively. Consent and amendment fees are recorded to income as earned. Prepayment penalty fees, which may be received by a fund upon the prepayment of a floating rate loan interest by a borrower, are recorded as realized gains. A fund may invest in multiple series or tranches of a loan. A different series or tranche may have varying terms and carry different associated risks.
Floating rate loan interests are usually freely callable at the borrower’s option. A fund may invest in such loans in the form of participations in loans (“Participations”) or assignments (“Assignments”) of all or a portion of loans from third parties. Participations typically will result in a fund having a contractual relationship only with the lender, not with the borrower. A fund has the right to receive payments of principal, interest and any fees to which it is entitled only from the lender selling the Participation and only upon receipt by the lender of the payments from the borrower. In connection with purchasing Participations, a fund generally will have no right to enforce compliance by the borrower with the terms of the loan agreement, nor any rights of offset against the borrower. A fund may not benefit directly from any collateral supporting the loan in which it has purchased the Participation. As a result, a fund assumes the credit risk of both the borrower and the lender that is selling the Participation. A fund’s investment in loan participation interests involves the risk of insolvency of the financial intermediaries who are parties to the transactions. In the event of the insolvency of the lender selling the Participation, a fund may be treated as a general creditor of the lender and may not benefit from any offset between the lender and the borrower. Assignments typically result in a fund having a direct contractual relationship with the borrower, and a fund may enforce compliance by the borrower with the terms of the loan agreement.
In connection with floating rate loan interests, the Funds may also enter into unfunded floating rate loan interests (“commitments”). In connection with these commitments, a fund earns a commitment fee, typically set as a percentage of the commitment amount. Such fee income, which is included in interest income in the Statements of Operations, is recognized ratably over the commitment period. Unfunded floating rate loan interests are marked-to-market daily, and any unrealized appreciation (depreciation) is included in the Statements of Assets and Liabilities and Statements of Operations. As of period end, the Funds had the following unfunded floating rate loan interests:
| | | | | | | | | | | | | | | | | | |
| |
| | | | | |
| Fund Name | | Borrower | | Par | | | Commitment
Amount | | | Value | | | Unrealized
Appreciation
(Depreciation) | |
| |
| | | | | |
DSU | | AthenaHealth Group, Inc. | | $ | 320,815 | | | $ | 320,815 | | | $ | 288,849 | | | $ | (31,966) | |
| | IPS Corp. | | | 93,645 | | | | 93,645 | | | | 83,227 | | | | (10,418) | |
FRA | | AthenaHealth Group, Inc. | | | 367,506 | | | | 367,506 | | | | 330,888 | | | | (36,618) | |
| | IPS Corp. | | | 106,675 | | | | 106,675 | | | | 94,807 | | | | (11,868) | |
BLW | | Arc Falcon I, Inc. | | | 75,553 | | | | 75,176 | | | | 66,147 | | | | (9,029) | |
| | AthenaHealth Group, Inc. | | | 196,229 | | | | 193,928 | | | | 176,677 | | | | (17,251) | |
| | IPS Corp. | | | 46,066 | | | | 46,066 | | | | 40,941 | | | | (5,125) | |
| |
TBA Commitments: TBA commitments are forward agreements for the purchase or sale of securities, including mortgage-backed securities for a fixed price, with payment and delivery on an agreed upon future settlement date. The specific securities to be delivered are not identified at the trade date. However, delivered securities must meet specified terms, including issuer, rate and mortgage terms. When entering into TBA commitments, a fund may take possession of or deliver the underlying mortgage-backed securities but can extend the settlement or roll the transaction. TBA commitments involve a risk of loss if the value of the security to be purchased or sold declines or increases, respectively, prior to settlement date, if there are expenses or delays in connection with the TBA transactions, or if the counterparty fails to complete the transaction.
In order to better define contractual rights and to secure rights that will help a fund mitigate its counterparty risk, TBA commitments may be entered into by a fund under Master Securities Forward Transaction Agreements (each, an “MSFTA”). An MSFTA typically contains, among other things, collateral posting terms and netting provisions in the event of default and/or termination event. The collateral requirements are typically calculated by netting the mark-to-market amount for each transaction under such agreement and comparing that amount to the value of the collateral currently pledged by a fund and the counterparty. Cash collateral that has been pledged to cover the obligations of a fund and cash collateral received from the counterparty, if any, is reported separately in the Statements of Assets and Liabilities as cash pledged as collateral for TBA commitments or cash received as collateral for TBA commitments, respectively. Non-cash collateral pledged by a fund, if any, is noted in the Schedules of Investments. Typically, a fund is permitted to sell, re-pledge or use the collateral it receives; however, the counterparty is not permitted to do so. To the extent amounts due to a fund are not fully collateralized, contractually or otherwise, a fund bears the risk of loss from counterparty non-performance.
Mortgage Dollar Roll Transactions: The Funds may sell TBA mortgage-backed securities and simultaneously contract to repurchase substantially similar (i.e., same type, coupon and maturity) securities on a specific future date at an agreed upon price. During the period between the sale and repurchase, a fund is not entitled to receive interest and principal payments on the securities sold. Mortgage dollar roll transactions are treated as purchases and sales and a fund realizes gains and losses on these transactions. Mortgage dollar rolls involve the risk that the market value of the securities that a fund is required to purchase may decline below the agreed upon repurchase price of those securities.
Borrowed Bond Agreements: Repurchase agreements may be referred to as borrowed bond agreements when entered into in connection with short sales of bonds. In a borrowed bond agreement, a fund borrows a bond from a counterparty in exchange for cash collateral. The agreement contains a commitment that the security and the cash will be returned to the counterparty and a fund at a mutually agreed upon date. Certain agreements have no stated maturity and can be terminated by either party at any time. Earnings on cash collateral and compensation to the lender of the bond are based on agreed upon rates between a fund and the counterparty. The value of the underlying cash collateral approximates the market value and accrued interest of the borrowed bond. To the extent that a borrowed bond transaction exceeds one business day, the value of
| | |
NOTES TO FINANCIAL STATEMENTS | | 129 |
Notes to Financial Statements (continued)
the cash collateral in the possession of the counterparty is monitored on a daily basis to ensure the adequacy of the collateral. As the market value of the borrowed bond changes, the cash collateral is periodically increased or decreased with a frequency and in amounts prescribed in the borrowed bond agreement. A fund may also experience delays in gaining access to the collateral.
Reverse Repurchase Agreements: Reverse repurchase agreements are agreements with qualified third-party broker dealers in which a fund sells securities to a bank or broker-dealer and agrees to repurchase the same securities at a mutually agreed upon date and price. A fund receives cash from the sale to use for other investment purposes. During the term of the reverse repurchase agreement, a fund continues to receive the principal and interest payments on the securities sold. Certain agreements have no stated maturity and can be terminated by either party at any time. Interest on the value of the reverse repurchase agreements issued and outstanding is based upon competitive market rates determined at the time of issuance. A fund may utilize reverse repurchase agreements when it is anticipated that the interest income to be earned from the investment of the proceeds of the transaction is greater than the interest expense of the transaction. Reverse repurchase agreements involve leverage risk. If a fund suffers a loss on its investment of the transaction proceeds from a reverse repurchase agreement, a fund would still be required to pay the full repurchase price. Further, a fund remains subject to the risk that the market value of the securities repurchased declines below the repurchase price. In such cases, a fund would be required to return a portion of the cash received from the transaction or provide additional securities to the counterparty.
Cash received in exchange for securities delivered plus accrued interest due to the counterparty is recorded as a liability in the Statements of Assets and Liabilities at face value including accrued interest. Due to the short-term nature of the reverse repurchase agreements, face value approximates fair value. Interest payments made by a fund to the counterparties are recorded as a component of interest expense in the Statements of Operations. In periods of increased demand for the security, a fund may receive a fee for the use of the security by the counterparty, which may result in interest income to a fund.
For the year ended December 31, 2022, the average daily amount of reverse repurchase agreements outstanding and the weighted average interest rate for the Funds were as follows:
| | | | |
|
| | |
| Fund Name | | Average Amount Outstanding | | Weighted Average Interest Rate |
|
| | |
BKT | | $ 128,487,079 | | 1.67% |
BLW | | 296,293,812 | | 1.89 |
|
Borrowed bond agreements and reverse repurchase transactions are entered into by a fund under Master Repurchase Agreements (each, an “MRA”), which permit a fund, under certain circumstances, including an event of default (such as bankruptcy or insolvency), to offset payables and/or receivables under the MRA with collateral held and/or posted to the counterparty and create one single net payment due to or from a fund. With borrowed bond agreements and reverse repurchase transactions, typically a fund and counterparty under an MRA are permitted to sell, re-pledge, or use the collateral associated with the transaction. Bankruptcy or insolvency laws of a particular jurisdiction may impose restrictions on or prohibitions against such a right of offset in the event of the MRA counterparty’s bankruptcy or insolvency. Pursuant to the terms of the MRA, a fund receives or posts securities and cash as collateral with a market value in excess of the repurchase price to be paid or received by a fund upon the maturity of the transaction. Upon a bankruptcy or insolvency of the MRA counterparty, a fund is considered an unsecured creditor with respect to excess collateral and, as such, the return of excess collateral may be delayed.
As of period end, the following table is a summary of BKT’s open borrowed bond agreements and reverse repurchase agreements by counterparty which are subject to offset under an MRA on a net basis:
| | | | | | | | | | | | | | | | | | | | | | | | | | | | | | | | | | | | | | | | | | | | | | |
| | |
| | | BKT | | | | |
| | | | | | | | | | | | |
| | | Counterparty | |
| Borrowed
Bonds
Agreements |
(a) | |
| Reverse
Repurchase
Agreements |
| |
| Borrowed
Bonds at
Value
including
Accrued
Interest |
(b) | |
| Net
Amount before
Collateral |
| |
| Non-Cash
Collateral
Received |
| |
| Cash
Collateral
Received |
| |
| Fair Value of
Non-Cash
Collateral
Pledged
Including
Accrued
Interest |
(c) | |
| Cash
Collateral
Pledged |
| |
| Net
Collateral (Received)/ Pledged |
(c) | |
| Net
Exposure Due (to)/ from Counterparty |
(d) | | | | |
| | | | | | | | | | | | |
| | BNP Paribas S.A. | | $ | — | | | $ | (3,811,223 | ) | | $ | — | | | $ | (3,811,223 | ) | | $ | — | | | $ | — | | | $ | 3,811,223 | | | $ | — | | | $ | 3,811,223 | | | $ | — | | | | | |
| | Credit Suissie AG | | | 753,086 | | | | — | | | | (736,284 | ) | | | 16,802 | | | | — | | | | — | | | | — | | | | — | | | | — | | | | 16,802 | | | | | |
| | HSBC Securities (USA), Inc. | | | — | | | | (94,979,128 | ) | | | — | | | | (94,979,128 | ) | | | — | | | | — | | | | 94,979,128 | | | | — | | | | 94,979,128 | | | | — | | | | | |
| | Royal Bank of Canada | | | — | | | | (16,973,225 | ) | | | — | | | | (16,973,225 | ) | | | — | | | | — | | | | 16,973,225 | | | | — | | | | 16,973,225 | | | | — | | | | | |
| | | | | | | | | | | | | | | | | | | | | | | | | | | | | | | | | | | | | | | | | | | | | | |
| | | | | | | | | | | | |
| | | | $ | 753,086 | | | $ | (115,763,576 | ) | | $ | (736,284 | ) | | $ | (115,746,774 | ) | | $ | — | | | $ | — | | | $ | 115,763,576 | | | $ | — | | | $ | 115,763,576 | | | $ | 16,802 | | | | | |
| | | | | | | | | | | | | | | | | | | | | | | | | | | | | | | | | | | | | | | | | | | | | | |
| | (a) | Included in Investments at value-unaffiliated in the Statements of Assets and Liabilities. | |
| | (b) | Includes accrued interest on borrowed bonds in the amount of $1,251 which is included in interest expense payable in the Statements of Assets and Liabilities. | |
| | (c) | Net collateral, including accrued interest, if any, with a value of $118,323,095 has been pledged/received in connection with open reverse repurchase agreements. Excess of net collateral pledged, if any, to the individual counterparty is not shown for financial reporting purposes. | |
| | (d) | Net exposure represents the net receivable (payable) that would be due from/to the counterparty in the event of default. | |
| | |
| 130 | | 2 0 2 2 BLACK ROCK ANNUAL REPORT TO SHAREHOLDERS |
Notes to Financial Statements (continued)
As of period end, the following table is a summary of BLW’s open reverse repurchase agreements by counterparty which are subject to offset under an MRA on a net basis:
| | | | | | | | | | | | | | | | |
| |
| | | | |
Counterparty | |
| Reverse Repurchase
Agreements |
| |
| Fair Value of
Non-Cash Collateral
Pledged Including
Accrued Interest |
(a) | |
| Cash Collateral
Pledged/Received |
(a) | | | Net Amount | |
| |
| | | | |
Barclays Bank PLC | | $ | (17,529,315 | ) | | $ | 17,529,315 | | | $ | — | | | $ | — | |
Barclays Capital, Inc. | | | (32,189,707 | ) | | | 32,189,707 | | | | — | | | | — | |
BNP Paribas S.A. | | | (66,211,938 | ) | | | 66,211,938 | | | | — | | | | — | |
BofA Securities, Inc. | | | (27,809,212 | ) | | | 27,809,212 | | | | — | | | | — | |
Credit Agricole Corporate and Investment Bank | | | (26,942,006 | ) | | | 26,942,006 | | | | — | | | | — | |
Credit Suisse Securities (USA) LLC | | | (4,265,965 | ) | | | 4,265,965 | | | | — | | | | — | |
HSBC Securities (USA), Inc. | | | (27,308,253 | ) | | | 27,308,253 | | | | — | | | | — | |
J.P. Morgan Securities LLC | | | (1,352,022 | ) | | | 1,352,022 | | | | — | | | | — | |
Nomura Securities International, Inc. | | | (11,577,396 | ) | | | 11,577,396 | | | | — | | | | — | |
RBC Capital Markets LLC | | | (49,760,794 | ) | | | 49,760,794 | | | | — | | | | — | |
TD Securities (USA) LLC | | | (10,692,192 | ) | | | 10,692,192 | | | | — | | | | — | |
| | | | | | | | | | | | | | | | |
| | | | |
| | $ | (275,638,800 | ) | | $ | 275,638,800 | | | $ | — | | | $ | — | |
| | | | | | | | | | | | | | | | |
| | (a) | Net collateral, including accrued interest, if any, with a value of $312,275,324 has been pledged/received in connection with open reverse repurchase agreements. Excess of net collateral pledged, if any, to the individual counterparty is not shown for financial reporting purposes. | |
In the event the counterparty of securities under an MRA files for bankruptcy or becomes insolvent, a fund’s use of the proceeds from the agreement may be restricted while the counterparty, or its trustee or receiver, determines whether or not to enforce a fund’s obligation to repurchase the securities.
| 5. | DERIVATIVE FINANCIAL INSTRUMENTS |
The Funds engage in various portfolio investment strategies using derivative contracts both to increase the returns of the Funds and/or to manage their exposure to certain risks such as credit risk, equity risk, interest rate risk, foreign currency exchange rate risk, commodity price risk or other risks (e.g., inflation risk). Derivative financial instruments categorized by risk exposure are included in the Schedules of Investments. These contracts may be transacted on an exchange or OTC.
Futures Contracts: Futures contracts are purchased or sold to gain exposure to, or manage exposure to, changes in interest rates (interest rate risk) and changes in the value of equity securities (equity risk) or foreign currencies (foreign currency exchange rate risk).
Futures contracts are exchange-traded agreements between the Funds and a counterparty to buy or sell a specific quantity of an underlying instrument at a specified price and on a specified date. Depending on the terms of a contract, it is settled either through physical delivery of the underlying instrument on the settlement date or by payment of a cash amount on the settlement date. Upon entering into a futures contract, the Funds are required to deposit initial margin with the broker in the form of cash or securities in an amount that varies depending on a contract’s size and risk profile. The initial margin deposit must then be maintained at an established level over the life of the contract. Amounts pledged, which are considered restricted, are included in cash pledged for futures contracts in the Statements of Assets and Liabilities.
Securities deposited as initial margin are designated in the Schedules of Investments and cash deposited, if any, are shown as cash pledged for futures contracts in the Statements of Assets and Liabilities. Pursuant to the contract, the Funds agree to receive from or pay to the broker an amount of cash equal to the daily fluctuation in market value of the contract (“variation margin”). Variation margin is recorded as unrealized appreciation (depreciation) and, if any, shown as variation margin receivable (or payable) on futures contracts in the Statements of Assets and Liabilities. When the contract is closed, a realized gain or loss is recorded in the Statements of Operations equal to the difference between the notional amount of the contract at the time it was opened and the notional amount at the time it was closed. The use of futures contracts involves the risk of an imperfect correlation in the movements in the price of futures contracts and interest rates, foreign currency exchange rates or underlying assets.
Forward Foreign Currency Exchange Contracts: Forward foreign currency exchange contracts are entered into to gain or reduce exposure to foreign currencies (foreign currency exchange rate risk).
A forward foreign currency exchange contract is an agreement between two parties to buy and sell a currency at a set exchange rate on a specified date. These contracts help to manage the overall exposure to the currencies in which some of the investments held by the Funds are denominated and in some cases, may be used to obtain exposure to a particular market. The contracts are traded OTC and not on an organized exchange.
The contract is marked-to-market daily and the change in market value is recorded as unrealized appreciation (depreciation) in the Statements of Assets and Liabilities. When a contract is closed, a realized gain or loss is recorded in the Statements of Operations equal to the difference between the value at the time it was opened and the value at the time it was closed. Non-deliverable forward foreign currency exchange contracts are settled with the counterparty in cash without the delivery of foreign currency. The use of forward foreign currency exchange contracts involves the risk that the value of a forward foreign currency exchange contract changes unfavorably due to movements in the value of the referenced foreign currencies, and such value may exceed the amount(s) reflected in the Statements of Assets and Liabilities. Cash amounts pledged for forward foreign currency exchange contracts are considered restricted and are included in cash pledged as collateral for OTC derivatives in the Statements of Assets and Liabilities. A Fund’s risk of loss from counterparty credit risk on OTC derivatives is generally limited to the aggregate unrealized gain netted against any collateral held by the Fund.
Options: The Funds may purchase and write call and put options to increase or decrease their exposure to the risks of underlying instruments, including equity risk, interest rate risk and/or commodity price risk and/or, in the case of options written, to generate gains from options premiums.
| | |
NOTES TO FINANCIAL STATEMENTS | | 131 |
Notes to Financial Statements (continued)
A call option gives the purchaser (holder) of the option the right (but not the obligation) to buy, and obligates the seller (writer) to sell (when the option is exercised) the underlying instrument at the exercise or strike price at any time or at a specified time during the option period. A put option gives the holder the right to sell and obligates the writer to buy the underlying instrument at the exercise or strike price at any time or at a specified time during the option period.
Premiums paid on options purchased and premiums received on options written, as well as the daily fluctuation in market value, are included in investments at value – unaffiliated and options written at value, respectively, in the Statements of Assets and Liabilities. When an instrument is purchased or sold through the exercise of an option, the premium is offset against the cost or proceeds of the underlying instrument. When an option expires, a realized gain or loss is recorded in the Statements of Operations to the extent of the premiums received or paid. When an option is closed or sold, a gain or loss is recorded in the Statements of Operations to the extent the cost of the closing transaction exceeds the premiums received or paid. When the Funds write a call option, such option is typically “covered,” meaning that they hold the underlying instrument subject to being called by the option counterparty. When the Funds write a put option, cash is segregated in an amount sufficient to cover the obligation. These amounts, which are considered restricted, are included in cash pledged as collateral for options written in the Statements of Assets and Liabilities.
| | • | | Swaptions — The Funds may purchase and write options on swaps (“swaptions”) primarily to preserve a return or spread on a particular investment or portion of the Funds’ holdings, as a duration management technique or to protect against an increase in the price of securities it anticipates purchasing at a later date. The purchaser and writer of a swaption is buying or granting the right to enter into a previously agreed upon interest rate or credit default swap agreement (interest rate risk and/or credit risk) at any time before the expiration of the option. |
In purchasing and writing options, the Funds bear the risk of an unfavorable change in the value of the underlying instrument or the risk that they may not be able to enter into a closing transaction due to an illiquid market. Exercise of a written option could result in the Funds purchasing or selling a security when they otherwise would not, or at a price different from the current market value.
Swaps: Swap contracts are entered into to manage exposure to issuers, markets and securities. Such contracts are agreements between the Funds and a counterparty to make periodic net payments on a specified notional amount or a net payment upon termination. Swap agreements are privately negotiated in the OTC market and may be entered into as a bilateral contract (“OTC swaps”) or centrally cleared (“centrally cleared swaps”).
For OTC swaps, any upfront premiums paid and any upfront fees received are shown as swap premiums paid and swap premiums received, respectively, in the Statements of Assets and Liabilities and amortized over the term of the contract. The daily fluctuation in market value is recorded as unrealized appreciation (depreciation) on OTC Swaps in the Statements of Assets and Liabilities. Payments received or paid are recorded in the Statements of Operations as realized gains or losses, respectively. When an OTC swap is terminated, a realized gain or loss is recorded in the Statements of Operations equal to the difference between the proceeds from (or cost of) the closing transaction and the Funds’ basis in the contract, if any. Generally, the basis of the contract is the premium received or paid.
In a centrally cleared swap, immediately following execution of the swap contract, the swap contract is novated to a central counterparty (the “CCP”) and the CCP becomes the Funds’ counterparty on the swap. Each Fund is required to interface with the CCP through the broker. Upon entering into a centrally cleared swap, each Fund is required to deposit initial margin with the broker in the form of cash or securities in an amount that varies depending on the size and risk profile of the particular swap. Securities deposited as initial margin are designated in the Schedules of Investments and cash deposited is shown as cash pledged for centrally cleared swaps in the Statements of Assets and Liabilities. Amounts pledged, which are considered restricted cash, are included in cash pledged for centrally cleared swaps in the Statements of Assets and Liabilities. Pursuant to the contract, each Fund agrees to receive from or pay to the broker variation margin. Variation margin is recorded as unrealized appreciation (depreciation) and shown as variation margin receivable (or payable) on centrally cleared swaps in the Statements of Assets and Liabilities. Payments received from (paid to) the counterparty are amortized over the term of the contract and recorded as realized gains (losses) in the Statements of Operations, including those at termination.
| | • | | Credit default swaps — Credit default swaps are entered into to manage exposure to the market or certain sectors of the market, to reduce risk exposure to defaults of corporate and/or sovereign issuers or to create exposure to corporate and/or sovereign issuers to which a fund is not otherwise exposed (credit risk). |
The Funds may either buy or sell (write) credit default swaps on single-name issuers (corporate or sovereign), a combination or basket of single-name issuers or traded indexes. Credit default swaps are agreements in which the protection buyer pays fixed periodic payments to the seller in consideration for a promise from the protection seller to make a specific payment should a negative credit event take place with respect to the referenced entity (e.g., bankruptcy, failure to pay, obligation acceleration, repudiation, moratorium or restructuring). As a buyer, if an underlying credit event occurs, the Funds will either (i) receive from the seller an amount equal to the notional amount of the swap and deliver the referenced security or underlying securities comprising the index, or (ii) receive a net settlement of cash equal to the notional amount of the swap less the recovery value of the security or underlying securities comprising the index. As a seller (writer), if an underlying credit event occurs, the Funds will either pay the buyer an amount equal to the notional amount of the swap and take delivery of the referenced security or underlying securities comprising the index or pay a net settlement of cash equal to the notional amount of the swap less the recovery value of the security or underlying securities comprising the index.
| | • | | Interest rate swaps — Interest rate swaps are entered into to gain or reduce exposure to interest rates or to manage duration, the yield curve or interest rate (interest rate risk). |
Interest rate swaps are agreements in which one party pays a stream of interest payments, either fixed or floating, in exchange for another party’s stream of interest payments, either fixed or floating, on the same notional amount for a specified period of time. In more complex interest rate swaps, the notional principal amount may decline (or amortize) over time.
Swap transactions involve, to varying degrees, elements of interest rate, credit and market risks in excess of the amounts recognized in the Statements of Assets and Liabilities. Such risks involve the possibility that there will be no liquid market for these agreements, that the counterparty to the agreements may default on its obligation to perform or disagree as to the meaning of the contractual terms in the agreements, and that there may be unfavorable changes in interest rates and/or market values associated with these transactions.
| | |
| 132 | | 2 0 2 2 BLACK ROCK ANNUAL REPORT TO SHAREHOLDERS |
Notes to Financial Statements (continued)
Master Netting Arrangements: In order to define its contractual rights and to secure rights that will help it mitigate its counterparty risk, a Fund may enter into an International Swaps and Derivatives Association, Inc. Master Agreement (“ISDA Master Agreement”) or similar agreement with its counterparties. An ISDA Master Agreement is a bilateral agreement between a Fund and a counterparty that governs certain OTC derivatives and typically contains, among other things, collateral posting terms and netting provisions in the event of a default and/or termination event. Under an ISDA Master Agreement, a Fund may, under certain circumstances, offset with the counterparty certain derivative financial instruments’ payables and/or receivables with collateral held and/or posted and create one single net payment. The provisions of the ISDA Master Agreement typically permit a single net payment in the event of default including the bankruptcy or insolvency of the counterparty. However, bankruptcy or insolvency laws of a particular jurisdiction may impose restrictions on or prohibitions against the right of offset in bankruptcy, insolvency or other events.
Collateral Requirements: For derivatives traded under an ISDA Master Agreement, the collateral requirements are typically calculated by netting the mark-to-market amount for each transaction under such agreement and comparing that amount to the value of any collateral currently pledged by the Fund and the counterparty.
Cash collateral that has been pledged to cover obligations of the Funds and cash collateral received from the counterparty, if any, is reported separately in the Statements of Assets and Liabilities as cash pledged as collateral and cash received as collateral, respectively. Non-cash collateral pledged by the Funds, if any, is noted in the Schedules of Investments. Generally, the amount of collateral due from or to a counterparty is subject to a certain minimum transfer amount threshold before a transfer is required, which is determined at the close of business of the Funds. Any additional required collateral is delivered to/pledged by the Funds on the next business day. Typically, the counterparty is not permitted to sell, re-pledge or use cash and non-cash collateral it receives. A Fund generally agrees not to use non-cash collateral that it receives but may, absent default or certain other circumstances defined in the underlying ISDA Master Agreement, be permitted to use cash collateral received. In such cases, interest may be paid pursuant to the collateral arrangement with the counterparty. To the extent amounts due to the Funds from the counterparties are not fully collateralized, each Fund bears the risk of loss from counterparty non-performance. Likewise, to the extent the Funds have delivered collateral to a counterparty and stand ready to perform under the terms of their agreement with such counterparty, each Fund bears the risk of loss from a counterparty in the amount of the value of the collateral in the event the counterparty fails to return such collateral. Based on the terms of agreements, collateral may not be required for all derivative contracts.
For financial reporting purposes, the Funds do not offset derivative assets and derivative liabilities that are subject to netting arrangements, if any, in the Statements of Assets and Liabilities.
| 6. | INVESTMENT ADVISORY AGREEMENT AND OTHER TRANSACTIONS WITH AFFILIATES |
Investment Advisory: Each Fund entered into an Investment Advisory Agreement with the Manager, the Funds’ investment adviser and an indirect, wholly-owned subsidiary of BlackRock, Inc. (“BlackRock”), to provide investment advisory and administrative services. The Manager is responsible for the management of each Fund’s portfolio and provides the personnel, facilities, equipment and certain other services necessary to the operations of each Fund.
For such services, DSU and FRA pay the Manager a monthly fee at an annual rate equal to the following percentages of the average daily value of each Fund’s net assets, plus the proceeds of any debt securities or outstanding borrowings used for leverage:
| | | | | | | | |
| | | DSU | | | FRA | |
| | |
Investment advisory fees | | | 0.55 | % | | | 0.75 | % |
For purposes of calculating these fees, “net assets” mean the total assets of each Fund minus the sum of its accrued liabilities.
For such services, BKT pays the Manager a monthly fee at an annual rate equal to 0.65% of the average weekly value of the Fund’s net assets. For purposes of calculating this fee, “net assets” means the total assets of the Fund minus the sum of its accrued liabilities (including the aggregate indebtedness constituting financial leverage).
For such services, BLW pays the Manager a monthly fee at an annual rate equal to 0.55% of the average weekly value of the Fund’s managed assets, plus the proceeds of any debt securities or outstanding borrowings used for leverage. For purposes of calculating this fee, “managed assets” are determined as total assets of the Fund (including any assets attributable to money borrowed for investment purposes) less the sum of its accrued liabilities (other than money borrowed for investment purposes).
With respect to each Fund, the Manager entered into separate sub-advisory agreements with BlackRock International Limited (“BIL”), an affiliate of the Manager. With respect to BLW, the Manager also entered into a separate sub-advisory agreement with BlackRock (Singapore) Limited (“BSL”), an affiliate of the Manager. The Manager pays BIL and, with respect to BLW, BSL for services they provide for that portion of each Fund for which BIL, and, with respect to BLW, BSL acts as sub-adviser, a monthly fee that is equal to a percentage of the investment advisory fees paid by each Fund to the Manager.
Administration: BKT has an Administration Agreement with the Manager. The administration fee paid monthly to the Manager is computed at an annual rate of 0.15% of the Fund’s average weekly net assets. For BKT, the Manager may reduce or discontinue this arrangement at any time without notice.
Distribution Fees: BKT and BLW have entered into a Distribution Agreement with BlackRock Investments, LLC (“BRIL”), an affiliate of the Manager, to provide for distribution of BKT and BLW common shares on a reasonable best efforts basis through an equity shelf offering (a “Shelf Offering”) (the “Distribution Agreement”). Pursuant to the Distribution Agreement, BRIL will receive commissions with respect to sales of common shares at a commission rate of 1.00% of the gross proceeds of the sale of BKT’s and BLW’s common shares and a portion of such commission is re-allowed to broker-dealers engaged by BRIL. The commissions retained by BRIL during the period ended December 31, 2022 amounted to $0.
Expense Waivers and Reimbursements: With respect to each Fund, the Manager contractually agreed to waive its investment advisory fees by the amount of investment advisory fees each Fund pays to the Manager indirectly through its investment in affiliated money market funds (the “affiliated money market fund waiver”) through June 30,
| | |
NOTES TO FINANCIAL STATEMENTS | | 133 |
Notes to Financial Statements (continued)
2024. The contractual agreement may be terminated upon 90 days’ notice by a majority of the Independent Directors, or by a vote of a majority of the outstanding voting securities of a Fund. These amounts are included in fees waived and/or reimbursed by the Manager in the Statements of Operations. For the year ended December 31, 2022, the amounts waived were as follows:
| | | | |
| |
| |
| Fund Name | | Fees Waived and/or Reimbursed
by the Manager | |
| |
| |
DSU | | $ | 1,925 | |
FRA | | | 267 | |
BKT | | | 5,297 | |
BLW | | | 2,971 | |
| |
The Manager contractually agreed to waive its investment advisory fee with respect to any portion of each Fund’s assets invested in affiliated equity and fixed-income mutual funds and affiliated exchange-traded funds that have a contractual management fee through June 30, 2024. The agreement can be renewed for annual periods thereafter, and may be terminated on 90 days’ notice, each subject to approval by a majority of the Funds’ Independent Directors. This amount is included in fees waived and/or reimbursed by the Manager in the Statements of Operations. For the year ended December 31, 2022, the amount waived was as follows:
| | | | |
| |
| |
| Fund Name | | Fees Waived and/or Reimbursed
by the Manager | |
| |
| |
FRA | | $ | 782 | |
| |
Directors and Officers: Certain directors and/or officers of the Funds are directors and/or officers of BlackRock or its affiliates. The Funds reimburse the Manager for a portion of the compensation paid to the Funds’ Chief Compliance Officer, which is included in Directors and Officer in the Statements of Operations.
Other Transactions: The Funds may purchase securities from, or sell securities to, an affiliated fund provided the affiliation is due solely to having a common investment adviser, common officers, or common directors. For the year ended December 31, 2022, the purchase and sale transactions and any net realized gains (losses) with affiliated funds in compliance with Rule 17a-7 under the 1940 Act were as follows:
| | | | | | | | | | | | |
| |
| | | |
| Fund Name | | Purchases | | | Sales | | | Net Realized
Gain (Loss) | |
| |
| | | |
DSU | | $ | 456,617 | | | $ | 236,523 | | | $ | 323 | |
BLW | | | 2,929,282 | | | | 816,204 | | | | (216,595 | ) |
| |
For the year ended December 31, 2022, purchases and sales of investments, including paydowns/payups, mortgage dollar rolls and excluding short-term securities, were as follows:
| | | | | | | | | | | | | | | | |
| |
| | |
| | | U.S. Government Securities | | | Other Securities | |
| | | | |
| | | | |
| Fund Name | | Purchases | | | Sales | | | Purchases | | | Sales | |
| |
| | | | |
DSU | | $ | — | | | $ | — | | | $ | 128,492,772 | | | $ | 236,176,057 | |
FRA | | | — | | | | — | | | | 95,141,601 | | | | 198,070,301 | |
BKT | | | — | | | | — | | | | 1,124,919,817 | | | | 1,144,246,292 | |
BLW | | | 12,426,779 | | | | 30,008,005 | | | | 614,451,862 | | | | 638,532,762 | |
| |
For the year ended December 31, 2022, purchases and sales related to mortgage dollar rolls were as follows:
| | | | | | | | |
| |
| | |
| Fund Name | | Purchases | | | Sales | |
| |
| | |
BKT | | $ | 543,965,437 | | | $ | 544,532,456 | |
BLW | | | 157,984,317 | | | | 158,154,707 | |
| |
It is each Fund’s policy to comply with the requirements of the Internal Revenue Code of 1986, as amended, applicable to regulated investment companies, and to distribute substantially all of its taxable income to its shareholders. Therefore, no U.S. federal income tax provision is required.
Each Fund files U.S. federal and various state and local tax returns. No income tax returns are currently under examination. The statute of limitations on each Fund’s U.S. federal tax returns generally remains open for a period of three years after they are filed. The statutes of limitations on each Fund’s state and local tax returns may remain open for an additional year depending upon the jurisdiction.
Management has analyzed tax laws and regulations and their application to the Funds as of December 31, 2022, inclusive of the open tax return years, and does not believe that there are any uncertain tax positions that require recognition of a tax liability in the Funds’ financial statements.
| | |
| 134 | | 2 0 2 2 BLACK ROCK ANNUAL REPORT TO SHAREHOLDERS |
Notes to Financial Statements (continued)
The tax character of distributions paid was as follows:
| | | | | | | | |
| |
| | |
| Fund Name | | Year Ended
12/31/22 | | | Year Ended
12/31/21 | |
| |
DSU | | | | | | | | |
| | |
Ordinary income | | $ | 31,579,170 | | | $ | 28,723,773 | |
Return of capital | | | 838,309 | | | | 5,103,734 | |
| | | | | | | | |
| | |
| | $ | 32,417,479 | | | $ | 33,827,507 | |
FRA | | | | | | | | |
| | |
Ordinary income | | $ | 27,297,906 | | | $ | 23,507,568 | |
Return of capital | | | — | | | | 4,692,282 | |
| | | | | | | | |
| | |
| | $ | 27,297,906 | | | $ | 28,199,850 | |
BKT | | | | | | | | |
| | |
Ordinary income | | $ | 10,487,125 | | | $ | 18,883,406 | |
Return of capital | | | 11,460,544 | | | | 7,473,844 | |
| | | | | | | | |
| | |
| | $ | 21,947,669 | | | $ | 26,357,250 | |
BLW | | | | | | | | |
| | |
Ordinary income | | $ | 32,930,219 | | | $ | 36,216,307 | |
Return of capital | | | 5,605,804 | | | | 5,785,872 | |
| | | | | | | | |
| | |
| | $ | 38,536,023 | | | $ | 42,002,179 | |
| | | | | | | | |
As of December 31, 2022, the tax components of accumulated earnings (loss) were as follows:
| | | | | | | | | | | | | | | | | | | | |
| |
| | | | | |
| Fund Name | | Undistributed Ordinary Income | | | Non-Expiring
Capital Loss
Carryforwards(a) | | | Net Unrealized
Gains (Losses)(b) | | | Qualified
Late-Year Losses(c) | | | Total | |
| |
| | | | | |
DSU | | $ | — | | | $ | (100,929,367 | ) | | $ | (64,436,350 | ) | | $ | (370,047 | ) | | $ | (165,735,764 | ) |
FRA | | | 211,621 | | | | (50,314,987 | ) | | | (37,544,458 | ) | | | — | | | | (87,647,824 | ) |
BKT | | | — | | | | (99,550,857 | ) | | | (64,288,362 | ) | | | — | | | | (163,839,219 | ) |
BLW | | | — | | | | (63,978,243 | ) | | | (70,278,715 | ) | | | (1,275,435 | ) | | | (135,532,393 | ) |
| |
| | (a) | Amounts available to offset future realized capital gains. | |
| | (b) | The difference between book-basis and tax-basis net unrealized gains (losses) were attributable primarily to the tax deferral of losses on wash sales and straddles, the accrual of income on securities in default, the classification of investments, the realization for tax purposes of unrealized gains/losses on certain futures and foreign currency contracts, the timing and recognition of partnership income, amortization methods for premiums on fixed income securities, the deferral of compensation to directors and the accounting for swap agreements. | |
| | (c) | The Fund has elected to defer certain qualified late-year losses and recognize such losses in the next taxable year. | |
As of December 31, 2022, gross unrealized appreciation and depreciation based on cost of investments (including short positions and derivatives, if any) for U.S. federal income tax purposes were as follows:
| | | | | | | | | | | | | | | | |
| |
| | | | |
| Fund Name | | Tax Cost | | | Gross Unrealized
Appreciation | | | Gross Unrealized
Depreciation | | | Net Unrealized
Appreciation
(Depreciation) | |
| |
| | | | |
DSU | | $ | 703,292,132 | | | $ | 1,439,156 | | | $ | (65,482,732) | | | $ | (64,043,576 | ) |
FRA | | | 626,304,616 | | | | 814,719 | | | | (38,308,077) | | | | (37,493,358 | ) |
BKT | | | 498,771,089 | | | | 5,226,203 | | | | (69,343,107) | | | | (64,116,904 | ) |
BLW | | | 844,542,620 | | | | 7,951,999 | | | | (77,685,962) | | | | (69,733,963 | ) |
| |
DSU and FRA are party to a senior committed secured, 360-day rolling line of credit facility and a separate security agreement (the “SSB Agreement”) with State Street Bank and Trust Company (“SSB”). SSB may elect to terminate its commitment upon 360-days written notice to DSU and FRA. As of period end, DSU and FRA have not received any notice to terminate. DSU and FRA have granted a security interest in substantially all of their assets to SSB.
The SSB Agreement allows for the following maximum commitment amounts:
| | | | |
| |
| Fund Name | | Commitment Amounts | |
| |
| |
DSU | | $ | 340,000,000 | |
FRA | | | 274,000,000 | |
| |
Advances will be made by SSB to DSU and FRA, at DSU’s and FRA’s option of (a) the higher of (i) 0.80% above the Fed Funds rate and (ii) 0.80% above Overnight LIBOR or (b) 0.80% above 7-day, 30-day, 60-day or 90-day LIBOR. Overnight LIBOR and LIBOR rates are subject to a 0% floor.
In addition, DSU and FRA paid a commitment fee (based on the daily unused portion of the commitments). Advances to DSU and FRA as of period end, if any, are shown in the Statements of Assets and Liabilities as bank borrowings payable. Based on the short-term nature of the borrowings under the line of credit and the variable interest rate,the carrying amount of the borrowings approximates fair value.
| | |
NOTES TO FINANCIAL STATEMENTS | | 135 |
Notes to Financial Statements (continued)
DSU and FRA may not declare dividends or make other distributions on shares or purchase any such shares if, at the time of the declaration, distribution or purchase, asset coverage with respect to the outstanding short-term borrowings is less than 300%.
For the year ended December 31, 2022, the maximum amount borrowed, the average daily borrowing and the weighted average interest rate, if any, under the credit agreement were as follows:
| | | | | | | | | | | | |
| |
| | | |
| Fund Name | | Maximum Amount Borrowed | | | Average Amount Outstanding | | | Daily Weighted Average Interest Rate | |
| |
| | | |
DSU | | $ | 255,000,000 | | | $ | 215,813,699 | | | | 2.37% | |
FRA | | | 233,000,000 | | | | 195,517,808 | | | | 2.37 | |
In the normal course of business, the Funds invest in securities or other instruments and may enter into certain transactions, and such activities subject each Fund to various risks, including among others, fluctuations in the market (market risk) or failure of an issuer to meet all of its obligations. The value of securities or other instruments may also be affected by various factors, including, without limitation: (i) the general economy; (ii) the overall market as well as local, regional or global political and/or social instability; (iii) regulation, taxation or international tax treaties between various countries; or (iv) currency, interest rate and price fluctuations. Local, regional or global events such as war, acts of terrorism, the spread of infectious illness or other public health issues, recessions, or other events could have a significant impact on the Funds and their investments.
Each Fund may invest without limitation in illiquid or less liquid investments or investments in which no secondary market is readily available or which are otherwise illiquid, including private placement securities. A Fund may not be able to readily dispose of such investments at prices that approximate those at which a Fund could sell such investments if they were more widely traded and, as a result of such illiquidity, a Fund may have to sell other investments or engage in borrowing transactions if necessary to raise funds to meet its obligations. Limited liquidity can also affect the market price of investments, thereby adversely affecting a Fund’s NAV and ability to make dividend distributions. Privately issued debt securities are often of below investment grade quality, frequently are unrated and present many of the same risks as investing in below investment grade public debt securities.
Market Risk: Each Fund may be exposed to prepayment risk, which is the risk that borrowers may exercise their option to prepay principal earlier than scheduled during periods of declining interest rates, which would force each Fund to reinvest in lower yielding securities. Each Fund may also be exposed to reinvestment risk, which is the risk that income from each Fund’s portfolio will decline if each Fund invests the proceeds from matured, traded or called fixed-income securities at market interest rates that are below each Fund portfolio’s current earnings rate.
Infectious Illness Risk: An outbreak of an infectious illness, such as the COVID-19 pandemic, may adversely impact the economies of many nations and the global economy, and may impact individual issuers and capital markets in ways that cannot be foreseen. An infectious illness outbreak may result in, among other things, closed international borders, prolonged quarantines, supply chain disruptions, market volatility or disruptions and other significant economic, social and political impacts.
Valuation Risk: The market values of equities, such as common stocks and preferred securities or equity related investments, such as futures and options, may decline due to general market conditions which are not specifically related to a particular company. They may also decline due to factors which affect a particular industry or industries. A Fund may invest in illiquid investments. An illiquid investment is any investment that a Fund reasonably expects cannot be sold or disposed of in current market conditions in seven calendar days or less without the sale or disposition significantly changing the market value of the investment. A Fund may experience difficulty in selling illiquid investments in a timely manner at the price that it believes the investments are worth. Prices may fluctuate widely over short or extended periods in response to company, market or economic news. Markets also tend to move in cycles, with periods of rising and falling prices. This volatility may cause each Fund’s NAV to experience significant increases or decreases over short periods of time. If there is a general decline in the securities and other markets, the NAV of a Fund may lose value, regardless of the individual results of the securities and other instruments in which a Fund invests.
The price a Fund could receive upon the sale of any particular portfolio investment may differ from a Fund’s valuation of the investment, particularly for securities that trade in thin or volatile markets or that are valued using a fair valuation technique or a price provided by an independent pricing service. Changes to significant unobservable inputs and assumptions (i.e., publicly traded company multiples, growth rate, time to exit) due to the lack of observable inputs may significantly impact the resulting fair value and therefore a Fund’s results of operations. As a result, the price received upon the sale of an investment may be less than the value ascribed by a Fund, and a Fund could realize a greater than expected loss or lesser than expected gain upon the sale of the investment. A Fund’s ability to value its investments may also be impacted by technological issues and/or errors by pricing services or other third-party service providers.
Counterparty Credit Risk: The Funds may be exposed to counterparty credit risk, or the risk that an entity may fail to or be unable to perform on its commitments related to unsettled or open transactions, including making timely interest and/or principal payments or otherwise honoring its obligations. The Funds manage counterparty credit risk by entering into transactions only with counterparties that the Manager believes have the financial resources to honor their obligations and by monitoring the financial stability of those counterparties. Financial assets, which potentially expose the Funds to market, issuer and counterparty credit risks, consist principally of financial instruments and receivables due from counterparties. The extent of the Funds’ exposure to market, issuer and counterparty credit risks with respect to these financial assets is approximately their value recorded in the Statements of Assets and Liabilities, less any collateral held by the Funds.
A derivative contract may suffer a mark-to-market loss if the value of the contract decreases due to an unfavorable change in the market rates or values of the underlying instrument. Losses can also occur if the counterparty does not perform under the contract.
For OTC options purchased, each Fund bears the risk of loss in the amount of the premiums paid plus the positive change in market values net of any collateral held by the Funds should the counterparty fail to perform under the contracts. Options written by the Funds do not typically give rise to counterparty credit risk, as options written generally obligate the Funds, and not the counterparty, to perform. The Funds may be exposed to counterparty credit risk with respect to options written to the extent each Fund deposits collateral with its counterparty to a written option.
| | |
| 136 | | 2 0 2 2 BLACK ROCK ANNUAL REPORT TO SHAREHOLDERS |
Notes to Financial Statements (continued)
With exchange-traded options purchased, exchange-traded futures and centrally cleared swaps, there is less counterparty credit risk to the Funds since the exchange or clearinghouse, as counterparty to such instruments, guarantees against a possible default. The clearinghouse stands between the buyer and the seller of the contract; therefore, credit risk is limited to failure of the clearinghouse. While offset rights may exist under applicable law, a Fund does not have a contractual right of offset against a clearing broker or clearinghouse in the event of a default (including the bankruptcy or insolvency). Additionally, credit risk exists in exchange-traded futures and centrally cleared swaps with respect to initial and variation margin that is held in a clearing broker’s customer accounts. While clearing brokers are required to segregate customer margin from their own assets, in the event that a clearing broker becomes insolvent or goes into bankruptcy and at that time there is a shortfall in the aggregate amount of margin held by the clearing broker for all its clients, typically the shortfall would be allocated on a pro rata basis across all the clearing broker’s customers, potentially resulting in losses to the Funds.
Concentration Risk: A diversified portfolio, where this is appropriate and consistent with a fund’s objectives, minimizes the risk that a price change of a particular investment will have a material impact on the NAV of a fund. The investment concentrations within each Fund’s portfolio are disclosed in its Schedule of Investments.
Certain Funds invest a significant portion of their assets in high yield securities. High yield securities that are rated below investment-grade (commonly referred to as “junk bonds”) or are unrated may be deemed speculative, involve greater levels of risk than higher-rated securities of similar maturity and are more likely to default. High yield securities may be issued by less creditworthy issuers, and issuers of high yield securities may be unable to meet their interest or principal payment obligations. High yield securities are subject to extreme price fluctuations, may be less liquid than higher rated fixed-income securities, even under normal economic conditions, and frequently have redemption features.
Certain Funds invest a significant portion of their assets in fixed-income securities and/or use derivatives tied to the fixed-income markets. Changes in market interest rates or economic conditions may affect the value and/or liquidity of such investments. Interest rate risk is the risk that prices of bonds and other fixed-income securities will decrease as interest rates rise and increase as interest rates fall. The Funds may be subject to a greater risk of rising interest rates due to the recent period of historically low interest rates. The Federal Reserve has recently begun to raise the federal funds rate as part of its efforts to address inflation. There is a risk that interest rates will continue to rise, which will likely drive down the prices of bonds and other fixed-income securities, and could negatively impact the Funds’ performance.
Certain Funds invest a significant portion of their assets in securities backed by commercial or residential mortgage loans or in issuers that hold mortgage and other asset-backed securities. When a Fund concentrates its investments in this manner, it assumes a greater risk of prepayment or payment extension by securities issuers. Changes in economic conditions, including delinquencies and/or defaults on assets underlying these securities, can affect the value, income and/or liquidity of such positions. Investment percentages in these securities are presented in the Schedules of Investments.
LIBOR Transition Risk: The United Kingdom’s Financial Conduct Authority announced a phase out of the LIBOR. Although many LIBOR rates ceased to be published or no longer are representative of the underlying market they seek to measure after December 31, 2021, a selection of widely used USD LIBOR rates will continue to be published through June 2023 in order to assist with the transition. The Funds may be exposed to financial instruments tied to LIBOR to determine payment obligations, financing terms, hedging strategies or investment value. The transition process away from LIBOR might lead to increased volatility and illiquidity in markets for, and reduce the effectiveness of new hedges placed against instruments whose terms currently include LIBOR. The ultimate effect of the LIBOR transition process on the Funds is uncertain.
| 11. | CAPITAL SHARE TRANSACTIONS |
DSU is authorized to issue 400 million shares, all of which were initially classified as Common Shares. FRA and BKT are authorized to issue 200 million shares, all of which were initially classified as Common Shares. BLW is authorized to issue an unlimited number of shares, all of which were initially classified as Common Shares. The par value for DSU’s, FRA’s, BKT’s and BLW’s shares is $0.10, $0.10, $0.010 and $0.001, respectively. The Board for DSU, FRA and BLW are each authorized, however, to reclassify any unissued Common Shares to Preferred Shares without the approval of Common Shareholders.
The Board authorized a 1-for-3 reverse stock split for BKT, effective after the close of trading on October 17, 2022, for the shareholders of record on October 17, 2022. The impact of the reverse stock split was a decrease in the number of shares outstanding by a factor of three, while increasing the NAV per share by a factor of three, resulting in no effect on the net assets of BKT. The financial statements for BKT have been adjusted to reflect the reverse stock split.
Common Shares
For the periods shown, shares issued and outstanding increased by the following amounts as a result of dividend reinvestment:
| | | | | | | | |
| |
| |
| | | Year Ended | |
| | | | |
| | |
| Fund Name | | 12/31/22 | | | 12/31/21 | |
| |
| | |
DSU | | | 3,721 | | | | 14,784 | |
BKT(a) | | | 3,887 | | | | 34,687 | |
BLW | | | — | | | | 49,148 | |
| |
| | (a) | Share transactions reflect 1-for-3 reverse stock split effective after the close of trading on October 17, 2022. | |
The Funds participate in an open market share repurchase program (the “Repurchase Program”). From December 1, 2021 through November 30, 2022, each Fund may repurchase up to 5% of its outstanding common shares under the Repurchase Program, based on common shares outstanding as of the close of business on November 30, 2021, subject to certain conditions. From December 1, 2022 through November 30, 2023, each Fund may repurchase up to 5% of its outstanding common shares under the Repurchase Program, based on common shares outstanding as of the close of business on November 30, 2022, subject to certain conditions. The Repurchase Program has an accretive effect as shares are purchased at a discount to the Fund’s NAV. There is no assurance that the Funds will purchase shares in any particular amounts. For the year ended December 31, 2022, the Funds did not repurchase any shares.
| | |
NOTES TO FINANCIAL STATEMENTS | | 137 |
Notes to Financial Statements (continued)
For the year ended December 31, 2021, shares issued and outstanding decreased by 102,939 as a result of share repurchase for FRA.
DSU filed a registration statement with the SEC seeking the ability to issue additional Common Shares through a Shelf Offering, which was declared effective on December 28, 2022. DSU may not sell any Common Shares in the Shelf Offering until a definitive prospectus relating to the Shelf Offering has been filed with the SEC. Under the Shelf Offering, DSU subject to market conditions, may raise additional equity capital from time to time in varying amounts and utilizing various offering methods at a net price at or above DSU’s NAV per Common Share (calculated within 48 hours of pricing). See Additional Information - Shelf Offering Program for additional information.
BKT and BLW have filed a prospectus with the SEC allowing them to issue an additional 8,333,333 and 10,000,000 Common Shares, respectively, through an equity Shelf Offering. Under the Shelf Offering, BKT and BLW, subject to market conditions, may raise additional equity capital from time to time in varying amounts and utilizing various offering methods at a net price at or above each Fund’s NAV per Common Share (calculated within 48 hours of pricing). As of period end, 8,333,333 and 10,000,000 Common Shares, respectively, remain available for issuance under the Shelf Offering. For the year ended December 31, 2022, Common Shares issued and outstanding under the Shelf Offering remained constant for BKT and BLW. See Additional Information - Shelf Offering Program for additional information.
Initial costs incurred by DSU, BKT and BLW in connection with their Shelf Offerings are recorded as “Deferred offering costs” in the Statements of Assets and Liabilities. As shares are sold, a portion of the costs attributable to the shares sold will be charged against paid-in-capital. Any remaining deferred charges at the end of the Shelf Offering period will be charged to expense.
Management’s evaluation of the impact of all subsequent events on the Funds’ financial statements was completed through the date the financial statements were issued and the following items were noted:
The Funds declared and paid or will pay distributions to Common Shareholders as follows:
| | | | | | | | | | | | | | | | |
| |
| | | | |
| Fund Name | | Declaration Date | | | Record Date | | | Payable/ Paid Date | | | Dividend Per Common Share | |
| |
| | | | |
DSU | | | 01/03/23 | | | | 01/13/23 | | | | 01/31/23 | | | $ | 0.070500 | |
| | | 02/01/23 | | | | 02/15/23 | | | | 02/28/23 | | | | 0.070500 | |
FRA | | | 01/03/23 | | | | 01/13/23 | | | | 01/31/23 | | | | 0.080400 | |
| | | 02/01/23 | | | | 02/15/23 | | | | 02/28/23 | | | | 0.080400 | |
BKT | | | 01/03/23 | | | | 01/13/23 | | | | 01/31/23 | | | | 0.088200 | |
| | | 02/01/23 | | | | 02/15/23 | | | | 02/28/23 | | | | 0.088200 | |
BLW | | | 01/03/23 | | | | 01/13/23 | | | | 01/31/23 | | | | 0.098100 | |
| | | 02/01/23 | | | | 02/15/23 | | | | 02/28/23 | | | | 0.098100 | |
| |
On January 13, 2023, DSU filed a definitive prospectus with the SEC in connection with its Shelf Offering and may sell additional Common Shares through the Shelf Offering.
| | |
| 138 | | 2 0 2 2 BLACK ROCK ANNUAL REPORT TO SHAREHOLDERS |
Report of Independent Registered Public Accounting Firm
To the Shareholders and the Board of Trustees/Directors of BlackRock Debt Strategies Fund, Inc., BlackRock Floating Rate Income Strategies Fund, Inc., BlackRock Income Trust, Inc., and BlackRock Limited Duration Income Trust:
Opinion on the Financial Statements and Financial Highlights
We have audited the accompanying statements of assets and liabilities of BlackRock Debt Strategies Fund, Inc., BlackRock Floating Rate Income Strategies Fund, Inc., BlackRock Income Trust, Inc., and BlackRock Limited Duration Income Trust (the “Funds”), including the schedules of investments, as of December 31, 2022, the related statements of operations and cash flows for the year then ended, the statements of changes in net assets for each of the two years in the period then ended, the financial highlights for the periods indicated in the table below, and the related notes. In our opinion, the financial statements and financial highlights present fairly, in all material respects, the financial position of the Funds as of December 31, 2022, and the results of their operations and their cash flows for the year then ended, the changes in their net assets for each of the two years in the period then ended, and the financial highlights for the periods indicated in the table below, in conformity with accounting principles generally accepted in the United States of America.
| | |
| Fund | | Financial Highlights |
| |
BlackRock Debt Strategies Fund, Inc. | | For each of the three years in the period ended December 31, 2022, for the period from March 1, 2019 through December 31, 2019, and for each of the two years in the period ended February 28, 2019. The presented financial highlights were consolidated through November 30, 2017 |
| |
BlackRock Floating Rate Income Strategies Fund, Inc. | | For each of the three years in the period ended December 31, 2022, for the period from September 1, 2019 through December 31, 2019, and for each of the two years in the period ended August 31, 2019. The presented financial highlights were consolidated through November 30, 2017 |
| |
BlackRock Income Trust, Inc. | | For each of the four years in the period ended December 31, 2022, the period from September 1, 2018 through December 31, 2018, and for the year ended August 31, 2018 |
| |
BlackRock Limited Duration Income Trust | | For each of the three years in the period ended December 31, 2022, for the period from September 1, 2019 through December 31, 2019, and for each of the two years in the period ended August 31, 2019 |
Basis for Opinion
These financial statements and financial highlights are the responsibility of the Funds’ management. Our responsibility is to express an opinion on the Funds’ financial statements and financial highlights based on our audits. We are a public accounting firm registered with the Public Company Accounting Oversight Board (United States) (PCAOB) and are required to be independent with respect to the Funds in accordance with the U.S. federal securities laws and the applicable rules and regulations of the Securities and Exchange Commission and the PCAOB.
We conducted our audits in accordance with the standards of the PCAOB. Those standards require that we plan and perform the audit to obtain reasonable assurance about whether the financial statements and financial highlights are free of material misstatement, whether due to error or fraud. The Funds are not required to have, nor were we engaged to perform, an audit of their internal control over financial reporting. As part of our audits we are required to obtain an understanding of internal control over financial reporting but not for the purpose of expressing an opinion on the effectiveness of the Funds’ internal control over financial reporting. Accordingly, we express no such opinion.
Our audits included performing procedures to assess the risks of material misstatement of the financial statements and financial highlights, whether due to error or fraud, and performing procedures that respond to those risks. Such procedures included examining, on a test basis, evidence regarding the amounts and disclosures in the financial statements and financial highlights. Our audits also included evaluating the accounting principles used and significant estimates made by management, as well as evaluating the overall presentation of the financial statements and financial highlights. Our procedures included confirmation of securities owned as of December 31, 2022, by correspondence with custodians or counterparties; when replies were not received, we performed other auditing procedures. We believe that our audits provide a reasonable basis for our opinion.
Deloitte & Touche LLP
Boston, Massachusetts
February 23, 2023
We have served as the auditor of one or more BlackRock investment companies since 1992.
| | |
REPORT OF INDEPENDENT REGISTERED PUBLIC ACCOUNTING FIRM | | 139 |
| | |
| Important Tax Information (unaudited) | | |
The following amount, or maximum amount allowable by law, is hereby designated as qualified dividend income for individuals for the fiscal year ended December 31, 2022:
| | | | |
| |
| |
| Fund Name | | Qualified Dividend Income | |
| |
| |
BLW | | $ | 2,718,163 | |
| |
The Fund hereby designates the following amount, or maximum amount allowable by law, of distributions from direct federal obligation interest for the fiscal year ended December 31, 2022:
| | | | |
| |
| |
| Fund Name | | Federal Obligation Interest | |
| |
| |
BLW | | $ | 341,523 | |
| |
The law varies in each state as to whether and what percent of ordinary income dividends attributable to federal obligations is exempt from state income tax. Shareholders are advised to check with their tax advisers to determine if any portion of the dividends received is exempt from state income tax.
The following percentage, or maximum percentage allowable by law, of ordinary income distributions paid during the fiscal year ended December 31, 2022 qualified for the dividends-received deduction for corporate shareholders:
| | | | |
| |
| |
| Fund Name | | Dividends-Received Deduction | |
| |
| |
BLW | | | 4.49% | |
| |
The Funds hereby designate the following amounts, or maximum amounts allowable by law, as interest income eligible to be treated as a Section 163(j) interest dividend for the fiscal year ended December 31, 2022:
| | | | |
| |
| |
| Fund Name | | Interest Dividends | |
| |
| |
DSU | | $ | 33,466,516 | |
FRA | | | 29,455,717 | |
BKT | | | 12,685,325 | |
BLW | | | 34,883,954 | |
| |
The Funds hereby designate the following amounts, or maximum amounts allowable by law, as interest-related dividends eligible for exemption from U.S. withholding tax for nonresident aliens and foreign corporations for the fiscal year ended December 31, 2022:
| | | | |
| |
| |
| Fund Name | | Interest Related Dividends | |
| |
| |
DSU | | $ | 26,483,342 | |
FRA | | | 22,488,001 | |
BKT | | | 12,685,325 | |
BLW | | | 24,865,803 | |
| |
| | |
| 140 | | 2 0 2 2 BLACK ROCK ANNUAL REPORT TO SHAREHOLDERS |
Investment Objectives, Policies and Risks
Recent Changes
The following information is a summary of certain changes since December 31, 2021.This information may not reflect all of the changes that have occurred since you purchased the relevant Fund.
During each Fund’s most recent fiscal year, there were no material changes in the Fund’s investment objectives or policies that have not been approved by shareholders or in the principal risk factors associated with investment in the Fund.
Investment Objectives and Policies
BlackRock Debt Strategies Fund, Inc. (DSU)
The Fund’s primary investment objective is to seek to provide current income by investing primarily in a diversified portfolio of U.S. companies’ debt instruments, including Corporate Loans (as defined below), which are rated in the lower rating categories of the established rating services (Baa or lower by Moody’s Investor’s Service (“Moody’s”) or BBB or lower by S&P Global Ratings (“S&P”)) or unrated debt instruments which are in the judgment of BlackRock Advisors, LLC (the “Manager”) of equivalent quality. Such investments generally involve greater volatility of price and risks to principal and income than securities in the higher rating categories. As a secondary objective, the Fund will seek to provide capital appreciation. The Fund’s investment objectives are fundamental policies and may not be changed without the approval of a majority of the outstanding voting securities of the Fund (as defined in the Investment Company Act of 1940, as amended (the “1940 Act”)).
Under normal market conditions, at least 80% of the Fund’s total assets will be invested in debt instruments. The Fund may invest directly in debt instruments or synthetically through the use of derivatives. The Fund has no restrictions on portfolio maturity or duration of the debt securities in which it may invest.
The Fund’s investment policies permit investment in the following asset classes which are described in greater detail below: (i) senior and subordinated corporate loans, both secured and unsecured (“Corporate Loans”), issued either directly by the borrower or in the form of participation interests in Corporate Loans made by banks and other financial institutions; (ii) publicly offered and privately placed high-yield debt securities, senior and subordinated, both secured and unsecured; and (iii) convertible debt instruments and preferred stock, each of which may be converted into common stock or other securities of the same or a different issuer, and nonconvertible preferred stock. The debt securities and Corporate Loans in which the Fund invests may pay interest at fixed rates or at rates that float at a margin above a generally recognized base lending rate such as the prime rate of a designated U.S. bank, or that adjust periodically at a margin above the CD rate or LIBOR.
In connection with its investments in corporate debt securities, or restructuring of investments owned by the Fund, the Fund may receive warrants or other non-income producing debt or equity securities. The Fund may retain such securities until the Manager determines it is appropriate in light of current market conditions to effect a disposition of such securities.
The Fund will not invest in Corporate Loans that would require the Fund to make any additional investments in connection with its obligation to make future advances to a borrower in connection with revolving credit facilities if such commitments would exceed 20% of the Fund’s total assets or would cause the Fund to fail to meet the diversification requirements described herein.
The Fund may invest in high-yield corporate debt securities, including Corporate Loans, which are rated in the lower rating categories of the established rating services (Baa or lower by Moody’s and BBB or lower by S&P Global Ratings), or in unrated securities considered by the Manager to be of comparable quality. Securities rated below Baa or lower by Moody’s or BBB or lower by S&P and unrated securities of comparable quality, are commonly known as “junk bonds.” Securities which subsequently are downgraded may continue to be held by the Fund and will be sold only if, in the judgment of the Manager, it is advantageous to do so.
Up to 20% of the Fund’s total assets may be invested in Distressed Securities (defined below), which includes publicly offered or privately placed debt securities and Corporate Loans which, at the time of investment, are the subject of bankruptcy proceedings or otherwise in default as to the repayment of principal and/or payment of interest or are rated in the lowest rating categories (Ca or lower by Moody’s and CC or lower by S&P) or which, if unrated, are in the judgment of the Manager of equivalent quality (“Distressed Securities”). Although the Fund will invest primarily in lower-rated securities, other than with respect to Distressed Securities (which are discussed below) it will not invest in securities in the lowest rating categories (Ca or below by Moody’s and CC or below by S&P) unless the Manager believes that the financial condition of the issuer or the protection afforded to the particular securities is stronger than would otherwise be indicated by such low ratings. Securities which subsequently are downgraded may continue to be held by the Fund and will be sold only if, in the judgment of the Manager, it is advantageous to do so.
Up to 20% of the Fund’s total assets may be invested in financial instruments of issuers domiciled outside the United States or that are denominated in various foreign currencies and multinational foreign currency units, provided that the foreign issuers of any non-U.S. dollar denominated instruments purchased by the Fund are domiciled in a country that is a member of the Organisation for Economic Co-operation and Development (OECD).
Up to 20% of the Fund’s total assets can be invested in convertible debt instruments and preferred stock, each of which may be converted into common stock or other securities of the same or a different issuer, and non-convertible preferred stock. The types of preferred securities in which the Fund may invest include trust preferred securities.
As a result of conversions of convertible securities or upon an exchange offer or bankruptcy plan of reorganization, a significant portion of the Fund’s total assets may be invested in common stock at certain points in time.
The Fund may engage in various portfolio strategies to seek to increase its return and to hedge its portfolio against movements in interest rates or foreign currencies through the use of interest rate or foreign currency swap transactions, the purchase of call and put options on securities, the sale of covered call and put options on its portfolio securities and transactions in financial futures and related options on such futures. There can be no assurance that the Fund will employ these strategies or that, if employed, they will be effective.
| | |
INVESTMENT OBJECTIVES , POLICIES AND RISKS | | 141 |
Investment Objectives, Policies and Risks (continued)
Investment Objectives and Policies (continued)
The Fund may make short sales of securities, provided that the market value of all securities sold short does not exceed 10% of its total assets. The Fund may make short sales both as a form of hedging to offset potential declines in long positions in similar securities and in order to seek to enhance return. The Fund’s obligation to replace the borrowed security will be secured by collateral deposited with the broker dealer, usually cash, U.S. government securities or other liquid securities similar to those borrowed. The Fund also will be required to segregate similar collateral with its custodian or designate such collateral on its books and records to the extent, if any, necessary so that the value of both collateral amounts in the aggregate is at all times equal to at least 100% of the current market value of the security sold short. The Fund also may make short sales “against the box.” Short sales “against the box” are not subject to the foregoing 10% limitation.
Subject to other investment restrictions applicable to the Fund, up to 10% of the Fund’s assets may be invested in debt instruments, including Corporate Loans, of investment companies (which may or may not be registered under the 1940 Act) whose portfolio securities consist entirely of (i) corporate debt or equity securities acceptable to the Manager or (ii) money market instruments.
The Fund has no limitation on the amount of its investments that are not readily marketable or are subject to restrictions on resale.
Leverage: The Fund currently utilizes leverage for investment purposes in the form of a bank credit facility. The Fund generally will not utilize leverage if it anticipates that the Fund’s leveraged capital structure would result in a lower return to common stockholders than that obtainable if the common stock were unleveraged for any significant amount of time. At times, the Fund could utilize leverage through borrowings, including the issuance of short term debt securities, the issuance of shares of preferred stock or a combination thereof. The Fund also has the ability to utilize leverage through the issuance of shares of preferred stock. The Fund may also utilize leverage through the use of reverse repurchase agreements.
The Fund may also borrow money as a temporary measure for extraordinary or emergency purposes, including the payment of dividends and the settlement of securities transactions which may otherwise require untimely dispositions of Fund securities. The Fund at times may borrow from affiliates of the Manager, provided that the terms of such borrowings are no less favorable than those available from comparable sources of funds in the marketplace.
There can be no assurance that the Fund will borrow in order to leverage its assets or, if it does, what percentage of the Fund’s assets such borrowings will represent. The Fund does not currently anticipate issuing any preferred stock.
BlackRock Floating Rate Income Strategies Fund, Inc. (FRA)
The Fund’s investment objective is to provide stockholders with high current income and such preservation of capital as is consistent with investment in a diversified, leveraged portfolio consisting primarily of floating rate debt securities and instruments (“floating rate debt securities”). The Fund’s investment objective is a fundamental policy and may not be changed without stockholder approval.
The Fund seeks to achieve its investment objective by investing, under normal market conditions, at least 80% of its Managed Assets in floating rate debt securities, including floating or variable rate debt securities that pay interest at rates that adjust whenever a specified interest rate changes and/or which reset on predetermined dates (such as the last day of a month or calendar quarter). “Managed Assets” means the total assets of the Fund (including any assets attributable to money borrowed for investment purposes) minus the sum of the Fund’s accrued liabilities (other than money borrowed for investment purposes). The Fund invests a substantial portion of its investments in floating rate debt securities consisting of secured or unsecured senior floating rate loans that are rated below investment grade at the time of investment or, if unrated, are considered by BlackRock Advisors, LLC (the “Manager”) or BlackRock International Limited (“BIL” and together with the Manager, the “Advisors”), the Fund’s sub-advisor, to be of comparable quality. Secured loans may be either wholly or partially secured at the time of investment. In addition to senior loans, floating rate debt securities may include, without limitation, instruments such as catastrophe and other event linked bonds, bank capital securities, corporate bonds, notes, money market instruments and certain types of mortgage related and other asset backed securities. Due to their floating or variable rate features, these instruments will generally pay higher levels of income in a rising interest rate environment and lower levels of income as interest rates decline. For the same reason, the market value of a floating rate debt security is generally expected to have less sensitivity to fluctuations in market interest rates than a fixed rate debt instrument, although the value of a floating rate debt security may nonetheless decline as interest rates rise and due to other factors, such as real or perceived changes in credit quality or financial condition of the issuer or borrower, volatility in the capital markets or other adverse market conditions.
The Fund may invest directly in floating rate debt securities or synthetically through the use of derivatives.
The Fund’s policy to invest, under normal market conditions, at least 80% of its Managed Assets in floating rate debt securities, as described above, is a non-fundamental policy and may be changed by the Board of Directors of the Fund provided that stockholders are provided with at least 60 days’ prior notice of any change, unless such change was previously approved by shareholders, as required by the rules under the Investment Company Act of 1940, as amended (the “1940 Act”).
The Fund may invest up to 20% of its total assets in securities other than floating rate debt securities, including, but not limited to, fixed rate debt securities such as convertible securities, bonds, notes, fixed rate loans and mortgage related and other asset backed securities issued on a public or private basis, collateralized debt obligations, preferred securities, commercial paper, U.S. government securities, structured notes, credit linked notes, credit linked trust certificates and other hybrid instruments.
To a limited extent, incidental to and in connection with its investment activities or pursuant to a convertible feature in a security, the Fund may acquire warrants and other debt and equity securities. The Fund may also acquire other debt and equity securities of a borrower or issuer in connection with an amendment, waiver, conversion or exchange of a senior loan or other debt security or in connection with a bankruptcy or workout of the borrower or issuer.
The Fund may invest without limit, and generally intends to invest a substantial portion of its assets, in high yield securities, including senior loans and other floating or fixed rate debt securities, that are rated below investment grade by the established rating services (Ba or lower by Moody’s Investor’s Service (“Moody’s”) or BB or lower by S&P Global Ratings (“S&P”)) or, if unrated, are considered by the Advisors to be of comparable quality. High yield bonds commonly are referred to as “junk” bonds. The high yield securities in which the Fund invests may include credit linked notes, structured notes, credit linked trust certificates or other instruments evidencing interests in special purpose vehicles
| | |
| 142 | | 2 0 2 2 BLACK ROCK ANNUAL REPORT TO SHAREHOLDERS |
Investment Objectives, Policies and Risks (continued)
Investment Objectives and Policies (continued)
or trusts that hold interests in high yield securities. Other than with respect to Distressed Securities (which are discussed below), the high yield securities in which the Fund may invest do not include securities which, at the time of investment, are in default or the issuers of which are in bankruptcy. The Fund may also invest in investment grade securities, which are securities rated at least BBB– as determined by S&P, Baa3 as determined by Moody’s or, if unrated, determined to be of comparable quality by the Advisors.
The Fund may not invest more than 10% of its total assets (at the time of investment) in securities that are rated Caa1 or lower (if rated by Moody’s) or CCC+ or lower (if rated by S&P) by each agency rating such security or, if unrated, are considered by the Advisors to be of comparable quality or are otherwise considered to be distressed securities (“Distressed Securities”).
The Fund may invest without limitation in debt securities of issuers domiciled outside the United States. The Fund, however, will not invest more than 10% of its total assets in debt securities of issuers located in emerging market countries. Emerging market countries generally include every nation in the world (including countries that may be considered “frontier” markets) except the United States, Canada, Japan, Australia, New Zealand and most countries located in Western Europe. The Fund will invest primarily in U.S. dollar denominated debt securities. The Fund will not invest more than 10% of its total assets in debt securities denominated in currencies other than the U.S. dollar or that do not provide for payment to the Fund in U.S. dollars, including obligations of non-U.S. governments and their respective subdivisions, agencies and government sponsored enterprises.
The Fund may invest in bonds of varying maturities issued by U.S. and non-U.S. corporations and other business or governmental entities. Bonds can be variable or fixed rate debt obligations, including bills, notes, debentures, money market instruments and similar instruments and securities. The Fund may also invest in catastrophe or other “event linked” bonds. The Fund may invest in securities of any maturity.
The Fund may invest in preferred securities, including preferred securities that may be converted into common stock or other securities of the same or a different issuer. The types of preferred securities in which the Fund may invest include trust preferred securities.
The Fund may invest in convertible securities. A convertible security is a bond, debenture, note, preferred security or other security that may be converted into or exchanged for a prescribed amount of common stock or other equity security of the same or a different issuer within a particular period of time at a specified price or formula.
The Fund may invest without limit in illiquid securities, which are floating rate debt securities, senior loans, high yield securities and other securities that lack a secondary trading market or are otherwise considered illiquid.
Leverage: The Fund currently utilizes leverage for investment purposes in the form of a bank credit facility. At times, the Fund could utilize leverage through borrowings, the issuance of short term debt securities, the issuance of shares of preferred stock or a combination thereof. The Fund also has the ability to utilize leverage through the issuance of shares of preferred stock. The Fund may also leverage through the use of reverse repurchase agreements. There can be no assurance that the Fund will borrow in order to leverage its assets or, if it does, what percentage of the Fund’s assets such borrowings will represent. The Fund does not currently anticipate issuing any preferred stock.
BlackRock Income Trust, Inc. (BKT)
The Fund’s investment objective is to manage a portfolio of high-quality securities to achieve both preservation of capital and high monthly income. The Fund will seek to distribute monthly income that is greater than that obtainable on an annualized basis by investment in United States government securities having the same maturity as the weighted average maturity of the Fund’s investments. The Fund’s portfolio is expected to consist primarily of mortgage-backed securities and, to a lesser extent, asset-backed securities.
Mortgage-backed securities are securities that directly or indirectly represent a participation in, or are secured by and payable from, mortgage loans secured by real property. There are three basic types of mortgage-backed securities: (i) those issued or guaranteed by the United States government or one of its agencies or instrumentalities, such as the Government National Mortgage Association (“GNMA”), the Federal National Mortgage Association (“Fannie Mae”) and the Federal Home Loan Mortgage Corporation (“Freddie Mac”); (ii) those issued by private issuers that are collateralized by securities issued or guaranteed by the United States government or one of its agencies or instrumentalities; and (iii) those issued by private issuers and collateralized by securities without a government guarantee but usually with some form of private credit enhancement.
The Fund will invest at least 65% of its assets in mortgage-backed securities. The balance of the Fund’s assets generally will be invested in asset-backed securities, which have structural characteristics similar to mortgage-backed securities but have underlying assets that are not mortgage loans or interests in mortgage loans. The Fund may also invest in various derivative mortgage-backed and asset-backed securities, such as collateralized mortgage obligations and asset-backed security residual interests and stripped mortgage-backed securities. The Fund may invest directly in such securities or synthetically through the use of derivatives. In addition, for hedging purposes, the Fund may utilize a portion of its assets for certain options, futures, interest rate swaps and related transactions. For purposes of enhancing liquidity and/or preserving capital, the Fund may invest without limit in securities issued by the United States government and its agencies and instrumentalities, or repurchase agreements collateralized by such securities, certificates of deposit, time deposits or bankers’ acceptances of similar quality.
At least 80% of the Fund’s assets will be invested in securities that are (i) issued or guaranteed by the United States government or one of its agencies or instrumentalities or (ii) rated at the time of investment either AAA by S&P Global Ratings (“S&P”) or Aaa by Moody’s Investors Service (“Moody’s”). Securities issued or guaranteed by the United States government or its agencies or instrumentalities are generally considered to be of the same or higher quality than privately issued securities rated AAA or Aaa. No more than 20% of the Fund’s assets will be invested in other securities, all of which will have been determined by BlackRock Advisors, LLC (the “Manager”) or BlackRock International Limited (“BIL” and together with the Manager, the “Advisors”), the Fund’s sub-advisor, to be of comparable credit quality.
The yield characteristics of mortgage-backed and asset-backed securities differ from traditional debt securities. Among the major differences are that interest and principal payments are made more frequently, usually monthly, and that principal may be prepaid at any time because the underlying mortgage loans or other assets generally may be
| | |
INVESTMENT OBJECTIVES , POLICIES AND RISKS | | 143 |
Investment Objectives, Policies and Risks (continued)
Investment Objectives and Policies (continued)
prepaid at any time. As a result, if the Fund purchases such a security at a premium, a prepayment rate that is faster than expected will reduce yield to maturity, while a prepayment rate that is slower than expected will have the opposite effect of increasing yield to maturity. Conversely, if the Fund purchases these securities at a discount, faster than expected prepayments will increase, while slower than expected prepayments will reduce, yield to maturity. The Fund may also invest in derivative securities such as stripped mortgage-backed securities or residual interests, which generally are more sensitive to changes in prepayment and interest rates. The Advisors will seek to manage these risks (and potential benefits) by investing in a variety of such securities and through hedging techniques.
Prepayments on a pool of mortgage loans are influenced by a variety of economic, geographic, social and other factors, including changes in mortgagors’ housing needs, job transfers, unemployment, mortgagors’ net equity in the mortgaged properties and servicing decisions. Generally, however, prepayments on fixed rate mortgage loans will increase during a period of falling interest rates and decrease during a period of rising interest rates. The same factors apply to prepayments on asset-backed securities but the predominant factor in a particular case may be different than in the case of mortgage-backed securities. Accordingly, amounts available for reinvestment by the Fund are likely to be greater during a period of declining interest rates than during a period of rising interest rates.
The Fund’s yield will also be affected by the interest rates on instruments in which the Fund is able to reinvest the proceeds of payments and prepayments. Accelerated prepayments on securities purchased by the Fund at a premium also impose a risk of loss of principal because the premium may not have been fully amortized at the time the principal is repaid in full.
Leverage: The Fund may borrow from time to time, at the Advisors’ discretion, for purposes of investment leverage when yields on available investments exceed interest rates and other expenses of related borrowing, or when, in the Advisors’ opinion, unusual market conditions otherwise make it advantageous for the Fund to increase its investment capacity.
The Fund may also borrow for emergency purposes, for the payment of dividends or for the clearance of transactions.
The Fund may enter into reverse repurchase agreements.
BlackRock Limited Duration Income Trust (BLW)
The Fund’s investment objective is to provide current income and capital appreciation. The Fund pursues its objective by investing primarily in three distinct asset classes:
| | • | | intermediate duration, investment grade corporate bonds, mortgage related securities and asset-backed securities and U.S. government and agency securities; |
| | • | | senior, secured floating rate loans made to corporate and other business entities; and |
| | • | | U.S. dollar-denominated securities of U.S. and non-U.S. issuers rated below investment grade and, to a limited extent, non-U.S. dollar denominated securities of non-U.S. issuers rated below investment grade. |
The Fund may invest directly in such securities or synthetically through the use of derivatives.
BlackRock Advisors, LLC (the “Manager”) and the Fund’s sub-advisers, BlackRock International Limited (“BIL”) and BlackRock (Singapore) Limited (“BSL” and collectively with BIL and the Manager, the “Advisors”), have broad discretion to allocate the Fund’s assets among these three principal asset classes.
The Fund’s investment objective may be changed by the Board of Trustees of the Fund without prior shareholder approval.
The Fund’s portfolio normally has an average portfolio duration of less than five years (including the effect of anticipated leverage), although it may be longer from time to time depending on market conditions. In comparison to maturity (which is the date on which the issuer of a debt instrument is obligated to repay the principal amount), duration is a measure of the price volatility of a debt instrument as a result in changes in market rates of interest, based on the weighted average timing of the instrument’s expected principal and interest payments. Specifically, duration measures the anticipated percentage change in net asset value that is expected for every percentage point change in interest rates. The two have an inverse relationship. Duration differs from maturity in that it takes into account a security’s yield, coupon payments and its principal payments in addition to the amount of time until the security finally matures. As the value of a security changes over time, so will its duration. Prices of securities with longer durations tend to be more sensitive to interest rate changes than securities with shorter durations. In general, a portfolio of securities with a longer duration can be expected to be more sensitive to interest rate changes than a portfolio with a shorter duration.
The Fund is intended to have a relatively low level of interest rate risk compared to investment portfolios of similar credit quality but with longer durations. Certain of the Fund’s other strategies, however, may result in an above average amount of risk and volatility or loss of principal.
The Fund may invest in corporate bonds.
The Fund anticipates that, under normal market conditions, a significant portion of its Managed Assets will be invested in securities rated below investment grade, such as those rated (Ba or lower by Moody’s Investor’s Service (“Moody’s”) or BB or lower by S&P Global Ratings (“S&P”)) or securities comparably rated by other rating agencies or in unrated securities determined by the Advisors to be of comparable quality. High yield securities commonly are referred to as “junk” bonds. The Fund may invest in individual securities of any credit quality. “Managed Assets” means the total assets of the Fund (including any assets attributable to money borrowed for investment purposes) minus the sum of the Fund’s accrued liabilities (other than money borrowed for investment purposes).
The Fund may also invest in investment grade securities, which are securities rated at least BBB– as determined by S&P, Baa3 as determined by Moody’s or, if unrated, determined to be of comparable quality by the Advisors. When the Advisors believe it to be in the best interests of the Fund’s shareholders, the Fund will reduce its investment in lower grade securities and, in certain market conditions, the Fund may invest none of its assets in lower grade securities.
| | |
| 144 | | 2 0 2 2 BLACK ROCK ANNUAL REPORT TO SHAREHOLDERS |
Investment Objectives, Policies and Risks (continued)
Investment Objectives and Policies (continued)
The Fund may invest without limitation in U.S. dollar denominated securities of non-U.S. issuers and, to a limited extent, non-U.S. dollar-denominated securities of non-U.S. issuers (“Non-U.S. Securities”), including up to 20% of its Managed Assets in issuers located in emerging market countries. The Fund can hold no more than 10% of its Managed Assets in non-U.S. dollar-denominated Non-U.S. Securities.
Non-U.S. Securities may include debt securities issued by foreign governments and other sovereign entities and debt securities issued by foreign corporations or supranational entities and securities denominated in U.S. dollars or, to a limited extent (as described above), in foreign currencies or multinational currency units. The Fund may invest in Brady Bonds and other sovereign debt of countries that have restructured their debt pursuant to the Brady Plan, which are viewed as speculative investments. The Fund may also purchase debt securities of supranational organizations such as the European Coal and Steel Community, the European Economic Community and theWorld Bank, which are chartered to promote economic development.
The Fund may invest in debt securities issued or guaranteed by the U.S. government, its agencies or instrumentalities including but not limited to: (1) U.S. Treasury obligations, which differ in their interest rates, maturities and times of issuance, such as U.S. Treasury bills (maturity of one year or less), U.S. Treasury notes (maturity of one to ten years), and U.S. Treasury bonds (generally maturities of greater than ten years), including the principal components or the interest components issued by the U.S. government under the separate trading of registered interest and principal securities program (i.e., “STRIPS”), all of which are backed by the full faith and credit of the United States; and (2) obligations issued or guaranteed by U.S. government agencies or instrumentalities, including government guaranteed mortgage-related securities, some of which are backed by the full faith and credit of the U.S. Treasury, some of which are supported by the right of the issuer to borrow from the U.S. government and some of which are backed only by the credit of the issuer itself.
The Fund may invest in mortgage-related securities, which include collateralized mortgage obligations, stripped mortgage-backed securities, mortgage pass-through securities, interests in real estate mortgage investment conduits, real estate investment trusts (“REITs”), including debt and preferred stock issued by REITs, as well as other real estate-related securities. The mortgage-related securities in which the Fund may invest include those with fixed, floating or variable interest rates, those with interest rates that change based on multiples of changes in a specified index of interest rates and those with interest rates that change inversely to changes in interest rates, as well as those that do not bear interest. The Fund may invest in residential and commercial mortgage-related securities issued by governmental entities and private issuers, including subordinated mortgage-related securities. The Fund will not invest more than 15% of its Managed Assets in commercial mortgage-related securities.
Asset-backed securities are a form of structured debt obligations. The securitization techniques used for asset-backed securities are similar to those used for mortgage-related securities. The collateral for these securities may include home equity loans, automobile and credit card receivables, boat loans, computer leases, airplane leases, mobile home loans, recreational vehicle loans and hospital account receivables. The Fund may invest in these and other types of asset-backed securities that may be developed in the future.
In addition to senior, secured floating rate loans made to corporate and other business entities, the Fund may also purchase unsecured loans, other floating rate debt securities, and credit-linked notes.
A senior loan is typically originated, negotiated and structured by a U.S. or foreign commercial bank, insurance company, finance company or other financial institution (the “Agent”) for a group of loan investors (“Loan Investors”). The Fund may purchase “Assignments” from the Agent or other Loan Investors. The Fund also may invest in “Participations.” Participations by the Fund in a Loan Investor’s portion of a senior loan typically will result in the Fund having a contractual relationship only with such Loan Investor, not with the borrower, whereas the Fund, as a purchaser of an Assignment, would typically succeed to all the rights and obligations under the loan agreement of the assigning Loan Investor and become a Loan Investor under the loan agreement with the same rights and obligations as the assigning Loan Investor. The Fund will only acquire Participations if the Loan Investor selling the Participation, and any other persons interpositioned between the Fund and the Loan Investor, are believed by the Advisors to be creditworthy at the time they enter into such transactions.
The Fund may also acquire equity securities or debt securities (including non-dollar denominated debt securities) issued in exchange for a senior loan or issued in connection with the debt restructuring or reorganization of a borrower, or if such acquisition, in the judgment of the Advisors, may enhance the value of a senior loan or would otherwise be consistent with the Fund’s investment policies.
The Fund may invest in collateralized bond obligations (“CBOs”), which are structured securities backed by a diversified pool of high yield, public or private fixed income securities. Under normal market conditions, the Fund expects to invest in the lower tranches of CBOs.
The Fund may purchase and sell futures contracts, enter into various interest rate transactions such as swaps, caps, floors or collars, currency transactions such as currency forward contracts, currency futures contracts, currency swaps or options on currency or currency futures and swap contracts (including, but not limited to, credit default swaps) and may purchase and sell exchange-listed and over-the-counter put and call options on securities and swap contracts, financial indices and futures contracts and use other derivative instruments or management techniques. The Fund also may purchase derivative instruments that combine features of these instruments.
The Fund may invest up to 10% of its Managed Assets in securities of other open- or closed-end investment companies that invest primarily in bonds of the types in which the Fund may invest directly. The Fund generally expects to invest in other investment companies either during periods when it has large amounts of uninvested cash, such as the period shortly after the Fund receives the proceeds of the offering of its common shares, or during periods when there is a shortage of attractive opportunities in the fixed income market.
Leverage: The Fund currently utilizes leverage for investment purposes in the form of reverse repurchase agreements. The Fund may borrow from banks and other financial institutions and may also borrow additional funds using such investment techniques as the Advisors may from time to time determine. Of these investment techniques, the Fund expects primarily to use reverse repurchase agreements and dollar rolls.
The Fund also has the ability to utilize leverage through the issuance of preferred shares. The Fund does not currently anticipate issuing any preferred shares.
| | |
INVESTMENT OBJECTIVES , POLICIES AND RISKS | | 145 |
Investment Objectives, Policies and Risks (continued)
Investment Objectives and Policies (continued)
The Fund generally will not utilize leverage if it anticipates that the Fund’s leveraged capital structure would result in a lower return to shareholders than that obtainable over time with an unleveraged capital structure. There can be no assurance that the Fund will borrow in order to leverage its assets or, if it does, what percentage of the Fund’s assets such borrowings will represent.
Risk Factors
This section contains a discussion of the general risks of investing in each Fund. The net asset value and market price of, and dividends paid on, the common shares will fluctuate with and be affected by, among other things, the risks more fully described below. As with any fund, there can be no guarantee that a Fund will meet its investment objective or that the Fund’s performance will be positive for any period of time. Each risk noted below is applicable to each Fund unless the specific Fund or Funds are noted in a parenthetical. The order of the below risk factors does not indicate the significance of any particular risk.
Investment and Market Discount Risk: An investment in the Fund’s common shares is subject to investment risk, including the possible loss of the entire amount that you invest. As with any stock, the price of the Fund’s common shares will fluctuate with market conditions and other factors. If shares are sold, the price received may be more or less than the original investment. Common shares are designed for long-term investors and the Fund should not be treated as a trading vehicle. Shares of closed-end management investment companies frequently trade at a discount from their net asset value. This risk is separate and distinct from the risk that the Fund’s net asset value could decrease as a result of its investment activities. At any point in time an investment in the Fund’s common shares may be worth less than the original amount invested, even after taking into account distributions paid by the Fund. During periods in which the Fund may use leverage, the Fund’s investment, market discount and certain other risks will be magnified.
Debt Securities Risk: Debt securities, such as bonds, involve interest rate risk, credit risk, extension risk, and prepayment risk, among other things.
| | • | | Interest Rate Risk — The market value of bonds and other fixed-income securities changes in response to interest rate changes and other factors. Interest rate risk is the risk that prices of bonds and other fixed-income securities will increase as interest rates fall and decrease as interest rates rise. |
The Fund may be subject to a greater risk of rising interest rates due to the recent period of historically low interest rates. For example, if interest rates increase by 1%, assuming a current portfolio duration of ten years, and all other factors being equal, the value of the Fund’s investments would be expected to decrease by 10%. (Duration is a measure of the price sensitivity of a debt security or portfolio of debt securities to relative changes in interest rates.) The magnitude of these fluctuations in the market price of bonds and other fixed-income securities is generally greater for those securities with longer maturities. Fluctuations in the market price of the Fund’s investments will not affect interest income derived from instruments already owned by the Fund, but will be reflected in the Fund’s net asset value. The Fund may lose money if short-term or long-term interest rates rise sharply in a manner not anticipated by Fund management.
To the extent the Fund invests in debt securities that may be prepaid at the option of the obligor (such as mortgage-backed securities), the sensitivity of such securities to changes in interest rates may increase (to the detriment of the Fund) when interest rates rise. Moreover, because rates on certain floating rate debt securities typically reset only periodically, changes in prevailing interest rates (and particularly sudden and significant changes) can be expected to cause some fluctuations in the net asset value of the Fund to the extent that it invests in floating rate debt securities.
These basic principles of bond prices also apply to U.S. Government securities. Asecurity backed by the “full faith and credit” of the U.S. Government is guaranteed only as to its stated interest rate and face value at maturity, not its current market price. Just like other fixed-income securities, government-guaranteed securities will fluctuate in value when interest rates change.
A general rise in interest rates has the potential to cause investors to move out of fixed-income securities on a large scale, which may increase redemptions from funds that hold large amounts of fixed-income securities. Heavy redemptions could cause the Fund to sell assets at inopportune times or at a loss or depressed value and could hurt the Fund’s performance.
| | • | | Credit Risk — Credit risk refers to the possibility that the issuer of a debt security (i.e., the borrower) will not be able to make payments of interest and principal when due. Changes in an issuer’s credit rating or the market’s perception of an issuer’s creditworthiness may also affect the value of the Fund’s investment in that issuer. The degree of credit risk depends on both the financial condition of the issuer and the terms of the obligation. |
| | • | | Extension Risk — When interest rates rise, certain obligations will be paid off by the obligor more slowly than anticipated, causing the value of these obligations to fall. |
| | • | | Prepayment Risk — When interest rates fall, certain obligations will be paid off by the obligor more quickly than originally anticipated, and the Fund may have to invest the proceeds in securities with lower yields. |
U.S. Government Obligations Risk: Certain securities in which the Fund may invest, including securities issued by certain U.S. Government agencies and U.S. Government sponsored enterprises, are not guaranteed by the U.S. Government or supported by the full faith and credit of the United States.
U.S. Government Mortgage-Related Securities Risk (FRA, BKT and BLW): There are a number of important differences among the agencies and instrumentalities of the U.S. Government that issue mortgage-related securities and among the securities that they issue. Mortgage-related securities guaranteed by the Government National Mortgage Association (“GNMA” or “Ginnie Mae”) are guaranteed as to the timely payment of principal and interest by GNMAand such guarantee is backed by the full faith and credit of the United States. GNMA securities also are supported by the right of GNMA to borrow funds from the U.S. Treasury to make payments under its guarantee. Mortgage-related securities issued by Fannie Mae or Freddie Mac are solely the obligations of Fannie Mae or Freddie Mac, as the case may be, and are not backed by or entitled to the full faith and credit of the United States but are supported by the right of the issuer to borrow from the Treasury.
| | |
| 146 | | 2 0 2 2 BLACK ROCK ANNUAL REPORT TO SHAREHOLDERS |
Investment Objectives, Policies and Risks (continued)
Risk Factors (continued)
Mortgage- and Asset-Backed Securities Risks (FRA, BKT and BLW): Mortgage- and asset-backed securities represent interests in “pools” of mortgages or other assets, including consumer loans or receivables held in trust. Mortgage- and asset-backed securities are subject to credit, interest rate, prepayment and extension risks. These securities also are subject to risk of default on the underlying mortgage or asset, particularly during periods of economic downturn. Small movements in interest rates (both increases and decreases) may quickly and significantly reduce the value of certain mortgage-backed securities.
Senior Loans Risk (DSU, FRA and BLW): There is less readily available, reliable information about most senior loans than is the case for many other types of securities. An economic downturn generally leads to a higher non-payment rate, and a senior loan may lose significant value before a default occurs. Moreover, any specific collateral used to secure a senior loan may decline in value or become illiquid, which would adversely affect the senior loan’s value. No active trading market may exist for certain senior loans, which may impair the ability of the Fund to realize full value in the event of the need to sell a senior loan and which may make it difficult to value senior loans. Although senior loans in which the Fund will invest generally will be secured by specific collateral, there can be no assurance that liquidation of such collateral would satisfy the borrower’s obligation in the event of non-payment of scheduled interest or principal or that such collateral could be readily liquidated. To the extent that a senior loan is collateralized by stock in the borrower or its subsidiaries, such stock may lose all of its value in the event of the bankruptcy of the borrower. Uncollateralized senior loans involve a greater risk of loss.
Risks of Loan Assignments and Participations (BLW): As the purchaser of an assignment, the Fund typically succeeds to all the rights and obligations of the assigning institution and becomes a lender under the credit agreement with respect to the debt obligation; however, the Fund may not be able unilaterally to enforce all rights and remedies under the loan and with regard to any associated collateral. Because assignments may be arranged through private negotiations between potential assignees and potential assignors, the rights and obligations acquired by the Fund as the purchaser of an assignment may differ from, and be more limited than, those held by the assigning lender. In addition, if the loan is foreclosed, the Fund could become part owner of any collateral and could bear the costs and liabilities of owning and disposing of the collateral. The Fund may be required to pass along to a purchaser that buys a loan from the Fund by way of assignment a portion of any fees to which the Fund is entitled under the loan. In connection with purchasing participations, the Fund generally will have no right to enforce compliance by the borrower with the terms of the loan agreement relating to the loan, nor any rights of set-off against the borrower, and the Fund may not directly benefit from any collateral supporting the loan in which it has purchased the participation. As a result, the Fund will be subject to the credit risk of both the borrower and the lender that is selling the participation. In the event of the insolvency of the lender selling a participation, the Fund may be treated as a general creditor of the lender and may not benefit from any set-off between the lender and the borrower.
Corporate Loans Risk (DSU): Commercial banks and other financial institutions or institutional investors make corporate loans to companies that need capital to grow or restructure. Borrowers generally pay interest on corporate loans at rates that change in response to changes in market interest rates such as the London Interbank Offered Rate (“LIBOR”) or the prime rates of U.S. banks. As a result, the value of corporate loan investments is generally less exposed to the adverse effects of shifts in market interest rates than investments that pay a fixed rate of interest. The market for corporate loans may be subject to irregular trading activity and wide bid/ask spreads. In addition, transactions in corporate loans may settle on a delayed basis. As a result, the proceeds from the sale of corporate loans may not be readily available to make additional investments or to meet the Fund’s redemption obligations. To the extent the extended settlement process gives rise to short-term liquidity needs, the Fund may hold additional cash, sell investments or temporarily borrow from banks and other lenders. The corporate loans in which the Fund invests are usually rated below investment grade.
Variable and Floating Rate Instrument Risk (DSU, FRA and BLW): Variable and floating rate securities provide for periodic adjustment in the interest rate paid on the securities. These securities may be subject to greater illiquidity risk than other fixed income securities, meaning the absence of an active market for these securities could make it difficult for the Fund to dispose of them at any given time.
Junk Bonds Risk (DSU, FRA and BLW): Although junk bonds generally pay higher rates of interest than investment grade bonds, junk bonds are high risk investments that are considered speculative and may cause income and principal losses for the Fund.
Distressed Securities Risk (DSU and FRA): Distressed securities are speculative and involve substantial risks in addition to the risks of investing in junk bonds. The Fund will generally not receive interest payments on the distressed securities and may incur costs to protect its investment. In addition, distressed securities involve the substantial risk that principal will not be repaid. These securities may present a substantial risk of default or may be in default at the time of investment. The Fund may incur additional expenses to the extent it is required to seek recovery upon a default in the payment of principal of or interest on its portfolio holdings. In any reorganization or liquidation proceeding relating to a portfolio company, the Fund may lose its entire investment or may be required to accept cash or securities with a value less than its original investment. Distressed securities and any securities received in an exchange for such securities may be subject to restrictions on resale.
Collateralized Bond Obligations Risk (BLW): The pool of high yield securities underlying collateralized bond obligations is typically separated into groupings called tranches representing different degrees of credit quality. The higher quality tranches have greater degrees of protection and pay lower interest rates. The lower tranches, with greater risk, pay higher interest rates.
Collateralized Debt Obligations Risk (FRA): In addition to the typical risks associated with fixed-income securities and asset-backed securities, collateralized debt obligations (“CDOs”), including collateralized loan obligations, carry additional risks including, but not limited to: (i) the possibility that distributions from collateral securities will not be adequate to make interest or other payments; (ii) the risk that the collateral may default or decline in value or be downgraded, if rated by a nationally recognized statistical rating organization; (iii) the Fund may invest in tranches of CDOs that are subordinate to other tranches; (iv) the structure and complexity of the transaction and the legal documents could lead to disputes among investors regarding the characterization of proceeds; (v) the investment return achieved by the Fund could be significantly different than those predicted by financial models; (vi) the lack of a readily available secondary market for CDOs; (vii) the risk of forced “fire sale” liquidation due to technical defaults such as coverage test failures; and (viii) the CDO’s manager may perform poorly.
Sovereign Debt Risk (FRA and BLW): Sovereign debt instruments are subject to the risk that a governmental entity may delay or refuse to pay interest or repay principal on its sovereign debt, due, for example, to cash flow problems, insufficient foreign currency reserves, political considerations, the relative size of the governmental entity’s debt position in relation to the economy or the failure to put in place economic reforms required by the International Monetary Fund or other multilateral agencies.
| | |
INVESTMENT OBJECTIVES , POLICIES AND RISKS | | 147 |
Investment Objectives, Policies and Risks (continued)
Risk Factors (continued)
Brady Bonds Risk (BLW): Brady Bonds involve various risk factors described above associated with investing in non-U.S. securities, including the history of defaults with respect to commercial bank loans by public and private entities of countries issuing Brady Bonds.
Supranational Entities Risk (BLW): The Fund may invest in obligations issued or guaranteed by the World Bank. The government members, or “stockholders,” usually make initial capital contributions to the World Bank and in many cases are committed to make additional capital contributions if the World Bank is unable to repay its borrowings. There is no guarantee that one or more stockholders of the World Bank will continue to make any necessary additional capital contributions. If such contributions are not made, the entity may be unable to pay interest or repay principal on its debt securities, and the Fund may lose money on such investments.
Yield and Ratings Risk (BKT): The yields on debt obligations are dependent on a variety of factors, including general market conditions, conditions in the particular market for the obligation, the financial condition of the issuer, the size of the offering, the maturity of the obligation and the ratings of the issue. The ratings of Moody’s, S&P and Fitch, represent their respective opinions as to the quality of the obligations they undertake to rate. Ratings, however, are general and are not absolute standards of quality. Consequently, obligations with the same rating, maturity and interest rate may have different market prices. Subsequent to its purchase by the Fund, a rated security may cease to be rated. The Manager will consider such an event in determining whether the Fund should continue to hold the security.
Repurchase Agreements and Purchase and Sale Contracts Risk (BKT): If the other party to a repurchase agreement or purchase and sale contract defaults on its obligation under the agreement, the Fund may suffer delays and incur costs or lose money in exercising its rights under the agreement. If the seller fails to repurchase the security in either situation and the market value of the security declines, the Fund may lose money.
Foreign Securities Risk (DSU, FRA and BLW): Foreign investments often involve special risks not present in U.S. investments that can increase the chances that the Fund will lose money. These risks include:
| | • | | The Fund generally holds its foreign securities and cash in foreign banks and securities depositories, which may be recently organized or new to the foreign custody business and may be subject to only limited or no regulatory oversight. |
| | • | | Changes in foreign currency exchange rates can affect the value of the Fund’s portfolio. |
| | • | | The economies of certain foreign markets may not compare favorably with the economy of the United States with respect to such issues as growth of gross national product, reinvestment of capital, resources and balance of payments position. |
| | • | | The governments of certain countries, or the U.S. Government with respect to certain countries, may prohibit or impose substantial restrictions through capital controls and/or sanctions on foreign investments in the capital markets or certain industries in those countries, which may prohibit or restrict the ability to own or transfer currency, securities, derivatives or other assets. |
| | • | | Many foreign governments do not supervise and regulate stock exchanges, brokers and the sale of securities to the same extent as does the United States and may not have laws to protect investors that are comparable to U.S. securities laws. |
| | • | | Settlement and clearance procedures in certain foreign markets may result in delays in payment for or delivery of securities not typically associated with settlement and clearance of U.S. investments. |
| | • | | The Fund’s claims to recover foreign withholding taxes may not be successful, and if the likelihood of recovery of foreign withholding taxes materially decreases, due to, for example, a change in tax regulation or approach in the foreign country, accruals in the Fund’s net asset value for such refunds may be written down partially or in full, which will adversely affect the Fund’s net asset value. |
| | • | | The European financial markets have recently experienced volatility and adverse trends due to concerns about economic downturns in, or rising government debt levels of, several European countries as well as acts of war in the region. These events may spread to other countries in Europe and may affect the value and liquidity of certain of the Fund’s investments. |
Emerging Markets Risk (FRA and BLW): Emerging markets are riskier than more developed markets because they tend to develop unevenly and may never fully develop. Investments in emerging markets may be considered speculative. Emerging markets are more likely to experience hyperinflation and currency devaluations, which adversely affect returns to U.S. investors. In addition, many emerging securities markets have far lower trading volumes and less liquidity than developed markets.
Equity Securities Risk (DSU, FRA and BLW): Stock markets are volatile. The price of equity securities fluctuates based on changes in a company’s financial condition and overall market and economic conditions.
Preferred Securities Risk (DSU, FRA and BLW): Preferred securities may pay fixed or adjustable rates of return. Preferred securities are subject to issuer-specific and market risks applicable generally to equity securities. In addition, a company’s preferred securities generally pay dividends only after the company makes required payments to holders of its bonds and other debt. For this reason, the value of preferred securities will usually react more strongly than bonds and other debt to actual or perceived changes in the company’s financial condition or prospects. Preferred securities of smaller companies may be more vulnerable to adverse developments than preferred securities of larger companies.
Convertible Securities Risk (DSU and FRA): The market value of a convertible security performs like that of a regular debt security; that is, if market interest rates rise, the value of a convertible security usually falls. In addition, convertible securities are subject to the risk that the issuer will not be able to pay interest or dividends when due, and
| | |
| 148 | | 2 0 2 2 BLACK ROCK ANNUAL REPORT TO SHAREHOLDERS |
Investment Objectives, Policies and Risks (continued)
Risk Factors (continued)
their market value may change based on changes in the issuer’s credit rating or the market’s perception of the issuer’s creditworthiness. Since it derives a portion of its value from the common stock into which it may be converted, a convertible security is also subject to the same types of market and issuer risks that apply to the underlying common stock.
Warrants Risk (DSU and FRA): If the price of the underlying stock does not rise above the exercise price before the warrant expires, the warrant generally expires without any value and the Fund will lose any amount it paid for the warrant. Thus, investments in warrants may involve substantially more risk than investments in common stock. Warrants may trade in the same markets as their underlying stock; however, the price of the warrant does not necessarily move with the price of the underlying stock.
Real Estate-Related Securities Risk (BLW): The main risk of real estate-related securities is that the value of the underlying real estate may go down. Many factors may affect real estate values. These factors include both the general and local economies, vacancy rates, tenant bankruptcies, the ability to re-lease space under expiring leases on attractive terms, the amount of new construction in a particular area, the laws and regulations (including zoning, environmental and tax laws) affecting real estate and the costs of owning, maintaining and improving real estate. The availability of mortgage financing and changes in interest rates may also affect real estate values. If the Fund’s real estate-related investments are concentrated in one geographic area or in one property type, the Fund will be particularly subject to the risks associated with that area or property type. Many issuers of real estate-related securities are highly leveraged, which increases the risk to holders of such securities. The value of the securities the Fund buys will not necessarily track the value of the underlying investments of the issuers of such securities.
REIT Investment Risk (BLW): Investments in REITs involve unique risks. REITs may have limited financial resources, may trade less frequently and in limited volume, may engage in dilutive offerings of securities and may be more volatile than other securities. REIT issuers may also fail to maintain their exemptions from investment company registration or fail to qualify for the “dividends paid deduction” under the Internal Revenue Code of 1986, as amended, which allows REITs to reduce their corporate taxable income for dividends paid to their shareholders.
Derivatives Risk: The Fund’s use of derivatives may increase its costs, reduce the Fund’s returns and/or increase volatility. Derivatives involve significant risks, including:
| | • | | Leverage Risk — The Fund’s use of derivatives can magnify the Fund’s gains and losses. Relatively small market movements may result in large changes in the value of a derivatives position and can result in losses that greatly exceed the amount originally invested. |
| | • | | Market Risk — Some derivatives are more sensitive to interest rate changes and market price fluctuations than other securities. The Fund could also suffer losses related to its derivatives positions as a result of unanticipated market movements, which losses are potentially unlimited. Finally, the Manager may not be able to predict correctly the direction of securities prices, interest rates and other economic factors, which could cause the Fund’s derivatives positions to lose value. |
| | • | | Counterparty Risk — Derivatives are also subject to counterparty risk, which is the risk that the other party in the transaction will be unable or unwilling to fulfill its contractual obligation, and the related risks of having concentrated exposure to such a counterparty. |
| | • | | Illiquidity Risk — The possible lack of a liquid secondary market for derivatives and the resulting inability of the Fund to sell or otherwise close a derivatives position could expose the Fund to losses and could make derivatives more difficult for the Fund to value accurately. |
| | • | | Operational Risk — The use of derivatives includes the risk of potential operational issues, including documentation issues, settlement issues, systems failures, inadequate controls and human error. |
| | • | | Legal Risk — The risk of insufficient documentation, insufficient capacity or authority of counterparty, or legality or enforceability of a contract. |
| | • | | Volatility and Correlation Risk — Volatility is defined as the characteristic of a security, an index or a market to fluctuate significantly in price within a short time period. A risk of the Fund’s use of derivatives is that the fluctuations in their values may not correlate with the overall securities markets. |
| | • | | Valuation Risk — Valuation for derivatives may not be readily available in the market. Valuation may be more difficult in times of market turmoil since many investors and market makers may be reluctant to purchase complex instruments or quote prices for them. |
| | • | | Hedging Risk — Hedges are sometimes subject to imperfect matching between the derivative and the underlying security, and there can be no assurance that the Fund’s hedging transactions will be effective. The use of hedging may result in certain adverse tax consequences. |
| | • | | Tax Risk — Certain aspects of the tax treatment of derivative instruments, including swap agreements and commodity-linked derivative instruments, are currently unclear and may be affected by changes in legislation, regulations or other legally binding authority. Such treatment may be less favorable than that given to a direct investment in an underlying asset and may adversely affect the timing, character and amount of income the Fund realizes from its investments. |
| | • | | Regulatory Risk — Derivative contracts are subject to regulation under the Dodd-Frank Wall Street Reform and Consumer Protection Act (the “Dodd-Frank Act”) in the United States and under comparable regimes in Europe, Asia and other non-U.S. jurisdictions. Under the Dodd-Frank Act, with respect to uncleared swaps, swap dealers are required to collect variation margin from the Fund and may be required by applicable regulations to collect initial margin from the Fund. Both initial and variation margin may be comprised of cash and/or securities, subject to applicable regulatory haircuts. Shares of investment companies (other than certain money market funds) may not be posted as collateral under applicable regulations. In addition, regulations adopted by global prudential regulators that are now in effect require certain bank-regulated counterparties and certain of their affiliates to include in certain financial contracts, including many derivatives contracts, terms that delay or restrict the rights of counterparties, such as the Fund, to terminate such contracts, foreclose upon collateral, exercise other default rights or restrict transfers of credit support in the event that the counterparty and/or its affiliates are subject to certain types of resolution or insolvency proceedings. The implementation of these requirements with respect to derivatives, as well as regulations under the Dodd-Frank Act regarding clearing, mandatory trading and margining of other derivatives, may increase the costs and risks to the Fund of trading in these instruments and, as a result, may affect returns to investors in the Fund. |
| | |
INVESTMENT OBJECTIVES , POLICIES AND RISKS | | 149 |
Investment Objectives, Policies and Risks (continued)
Risk Factors (continued)
Structured Notes Risk (FRA): Structured notes and other related instruments purchased by the Fund are generally privately negotiated debt obligations where the principal and/or interest is determined by reference to the performance of a specific asset, benchmark asset, market or interest rate (“reference measure”). The purchase of structured notes exposes the Fund to the credit risk of the issuer of the structured product. Structured notes may be leveraged, increasing the volatility of each structured note’s value relative to the change in the reference measure. Structured notes may also be less liquid and more difficult to price accurately than less complex securities and instruments or more traditional debt securities.
Leverage Risk: The Fund’s use of leverage may increase or decrease from time to time in its discretion and the Fund may, in the future, determine not to use leverage.
The use of leverage creates an opportunity for increased common share net investment income dividends, but also creates risks for the holders of common shares. The Fund cannot assure you that the use of leverage will result in a higher yield on the common shares. Any leveraging strategy the Fund employs may not be successful.
Leverage involves risks and special considerations for common shareholders, including:
| | • | | the likelihood of greater volatility of net asset value, market price and dividend rate of the common shares than a comparable portfolio without leverage; |
| | • | | the risk that fluctuations in interest rates or dividend rates on any leverage that the Fund must pay will reduce the return to the common shareholders; |
| | • | | the effect of leverage in a declining market, which is likely to cause a greater decline in the net asset value of the common shares than if the Fund were not leveraged, which may result in a greater decline in the market price of the common shares; |
| | • | | leverage may increase operating costs, which may reduce total return. |
Any decline in the net asset value of the Fund’s investments will be borne entirely by the holders of common shares. Therefore, if the market value of the Fund’s portfolio declines, leverage will result in a greater decrease in net asset value to the holders of common shares than if the Fund were not leveraged. This greater net asset value decrease will also tend to cause a greater decline in the market price for the common shares.
Reverse Repurchase Agreements Risk: Reverse repurchase agreements involve the sale of securities held by the Fund with an agreement to repurchase the securities at an agreed-upon price, date and interest payment. Reverse repurchase agreements involve the risk that the other party may fail to return the securities in a timely manner or at all. The Fund could lose money if it is unable to recover the securities and the value of the collateral held by the Fund, including the value of the investments made with cash collateral, is less than the value of the securities. These events could also trigger adverse tax consequences for the Fund. In addition, reverse repurchase agreements involve the risk that the interest income earned in the investment of the proceeds will be less than the interest expense.
Dollar Rolls Risk (BLW): Dollar rolls involve the risk that the market value of the securities that the Fund is committed to buy may decline below the price of the securities the Fund has sold. These transactions may involve leverage.
Short Sales Risk (DSU): Because making short sales in securities that it does not own exposes the Fund to the risks associated with those securities, such short sales involve speculative exposure risk. The Fund will incur a loss as a result of a short sale if the price of the security increases between the date of the short sale and the date on which the Fund replaces the security sold short.
Illiquid Investments Risk: The Fund may invest without limitation in illiquid or less liquid investments or investments in which no secondary market is readily available or which are otherwise illiquid, including private placement securities. The Fund may not be able to readily dispose of such investments at prices that approximate those at which the Fund could sell such investments if they were more widely traded and, as a result of such illiquidity, the Fund may have to sell other investments or engage in borrowing transactions if necessary to raise cash to meet its obligations. Limited liquidity can also affect the market price of investments, thereby adversely affecting the Fund’s net asset value and ability to make dividend distributions. The financial markets in general, and certain segments of the mortgage-related securities markets in particular, have in recent years experienced periods of extreme secondary market supply and demand imbalance, resulting in a loss of liquidity during which market prices were suddenly and substantially below traditional measures of intrinsic value. During such periods, some investments could be sold only at arbitrary prices and with substantial losses. Periods of such market dislocation may occur again at any time. Privately issued debt securities are often of below investment grade quality, frequently are unrated and present many of the same risks as investing in below investment grade public debt securities.
Investment Companies and ETFs Risk (DSU and BLW): Subject to the limitations set forth in the Investment Company Act of 1940, as amended, and the rules thereunder, the Fund may acquire shares in other investment companies and in exchange-traded funds (“ETFs”), some of which may be affiliated investment companies. The market value of the shares of other investment companies and ETFs may differ from their net asset value. As an investor in investment companies and ETFs, the Fund would bear its ratable share of that entity’s expenses, including its investment advisory and administration fees, while continuing to pay its own advisory and administration fees and other expenses (to the extent not offset by the Manager through waivers). As a result, shareholders will be absorbing duplicate levels of fees with respect to investments in other investment companies and ETFs (to the extent not offset by the Manager through waivers).
The securities of other investment companies and ETFs in which the Fund may invest may be leveraged. As a result, the Fund may be indirectly exposed to leverage through an investment in such securities. An investment in securities of other investment companies and ETFs that use leverage may expose the Fund to higher volatility in the market value of such securities and the possibility that the Fund’s long-term returns on such securities (and, indirectly, the long-term returns of shares of the Fund) will be diminished.
As with other investments, investments in other investment companies, including ETFs, are subject to market and selection risk. To the extent the Fund is held by an affiliated fund, the ability of the Fund itself to hold other investment companies may be limited.
Market Risk and Selection Risk: Market risk is the risk that one or more markets in which the Fund invests will go down in value, including the possibility that the markets will go down sharply and unpredictably. The value of a security or other asset may decline due to changes in general market conditions, economic trends or events that are not
| | |
| 150 | | 2 0 2 2 BLACK ROCK ANNUAL REPORT TO SHAREHOLDERS |
Investment Objectives, Policies and Risks (continued)
Risk Factors (continued)
specifically related to the issuer of the security or other asset, or factors that affect a particular issuer or issuers, exchange, country, group of countries, region, market, industry, group of industries, sector or asset class. Local, regional or global events such as war, acts of terrorism, the spread of infectious illness or other public health issues like pandemics or epidemics, recessions, or other events could have a significant impact on the Fund and its investments. Selection risk is the risk that the securities selected by Fund management will underperform the markets, the relevant indices or the securities selected by other funds with similar investment objectives and investment strategies. This means you may lose money.
An outbreak of an infectious coronavirus (COVID-19) that was first developed into a global pandemic that has resulted in numerous disruptions in the market and has had significant economic impact leaving general concern and uncertainty. Although vaccines have been developed and approved for use by various governments, the duration of the pandemic and its effects cannot be predicted with certainty. The impact of this coronavirus, and other epidemics and pandemics that may arise in the future, could affect the economies of many nations, individual companies and the market in general ways that cannot necessarily be foreseen at the present time.
| | |
INVESTMENT OBJECTIVES , POLICIES AND RISKS | | 151 |
Shareholder Update
The following includes additional required disclosures for certain Funds, each of which has filed a shelf offering registration statement.
Summary of Expenses
BlackRock Debt Strategies Fund, Inc. (DSU)
The following table and example are intended to assist shareholders in understanding the various costs and expenses directly or indirectly associated with investing in DSU’s common shares.
| | | | |
| | | DSU | |
| |
Shareholder Transaction Expenses | | | | |
Maximum sales load (as a percentage of offering price)(a) | | | 1.00 | % |
Offering expenses borne by the Fund (as a percentage of offering price)(a) | | | 0.03 | % |
| |
| $0.02 per share
for open market
purchases of |
|
Dividend reinvestment plan fees | | | common shares | (b) |
Estimated Annual Expenses (as a percentage of net assets attributable to common shares) | | | | |
Investment advisory fees(c),(d) | | | 0.79 | % |
Other expenses | | | 1.11 | |
Miscellaneous | | | 0.09 | |
Interest expense(e) | | | 1.02 | |
Total annual expenses | | | 1.90 | |
Fee waiver(d) | | | — | |
Total annual Fund operating expenses after fee waiver(d) | | | 1.90 | |
| | (a) | If the common shares are sold to or through underwriters, the Prospectus Supplement will set forth any applicable sales load and the estimated offering expenses. Fund shareholders will pay all offering expenses involved with an offering. | |
| | (b) | Computershare Trust Company, N.A.’s (the “Reinvestment Plan Agent”) fees for the handling of the reinvestment of dividends will be paid by the Fund. However, shareholders will pay a $0.02 per share fee incurred in connection with open-market purchases, which will be deducted from the value of the dividend. Shareholders will also be charged a $0.02 per share fee if a shareholder directs the Reinvestment Plan Agent to sell the common shares held in a dividend reinvestment account. Per share fees include any applicable brokerage commissions the Reinvestment Plan Agent is required to pay. | |
| | (c) | The Fund currently pays the Manager a monthly fee at an annual contractual investment advisory fee rate of 0.55% of the average daily value of the Fund’s net assets, plus the proceeds of any outstanding debt securities or borrowings used for leverage (together, “average daily Managed Assets”). | |
| | (d) | The Fund and the Manager have entered into a fee waiver agreement (the “Fee Waiver Agreement”), pursuant to which the Manager has contractually agreed to waive the investment advisory fees with respect to any portion of Fund’s assets attributable to investments in any equity and fixed-income mutual funds and exchange-traded funds (the “ETFs”) managed by the Manager or its affiliates that have a contractual management fee, through June 30, 2024. In addition, pursuant to the Fee Waiver Agreement, the Manager has contractually agreed to waive its investment advisory fees by the amount of investment advisory fees Fund pays to the Manager indirectly through its investment in money market funds managed by the Manager or its affiliates, through June 30, 2024. The Fee Waiver Agreement may be terminated at any time, without the payment of any penalty, only by Fund (upon the vote of a majority of the Directors who are not “interested persons” (as defined in the Investment Company Act of 1940, as amended (the “Investment Company Act”), of Fund (the “Independent Directors”)) or a majority of the outstanding voting securities of Fund), upon 90 days’ written notice by Fund to the Manager. | |
| | (e) | The Fund uses leverage in the form of a credit facility, in an amount equal to approximately 25.2% of the Fund’s Managed Assets as of December 31, 2022. The interest expense borne by the Fund will vary over time in accordance with the level of the Fund’s use of leverage and variations in market interest rates. Interest expense is required to be treated as expense of the Fund for accounting purposes. | |
The following example illustrates the expenses (including the sales load of $10.00 and offering costs of $0.29) that shareholders would pay on a $1,000 investment in common shares, assuming (i) total net annual expenses of 1.90% of net assets attributable to common shares and (ii) a 5% annual return:
| | | | | | | | | | | | | | | | |
| | | 1 Year | | | 3 Years | | | 5 Years | | | 10 Years | |
Total expenses incurred | | $ | 29 | | | $ | 69 | | | $ | 112 | | | $ | 230 | |
The example should not be considered a representation of future expenses. The example assumes that the estimated “Other expenses” set forth in the Estimated Annual Expenses table are accurate and that all dividends and distributions are reinvested at NAV. Actual expenses may be greater or less than those assumed. The Fund’s actual rate of return may be greater or less than the hypothetical 5% return shown in the example.
| | |
| 152 | | 2 0 2 2 BLACK ROCK ANNUAL REPORT TO SHAREHOLDERS |
Shareholder Update (continued)
BlackRock Income Trust, Inc. (BKT)
The following table and example are intended to assist shareholders in understanding the various costs and expenses directly or indirectly associated with investing in BKT’s common shares.
| | | | |
| | |
| | | BKT | |
| |
Shareholder Transaction Expenses | | | | |
Maximum sales load (as a percentage of offering price)(a) | | | 1.00 | % |
Offering expenses borne by the Fund (as a percentage of offering price)(a) | | | 0.03 | % |
| |
| $0.02 per share
for open market
purchases of |
|
Dividend reinvestment plan fees | | | common shares | (b) |
Dividend reinvestment plan sale transaction fee(b) | | | $2.50 | |
Estimated Annual Expenses (as a percentage of net assets attributable to common shares) | | | | |
Investment advisory fees(c),(d) | | | 0.65 | % |
Other expenses | | | 1.00 | |
Miscellaneous | | | 0.31 | |
Interest expense(e) | | | 0.69 | |
Total annual expenses | | | 1.65 | |
Fee waiver(d) | | | 0.01 | |
Total annual Fund operating expenses after fee waiver(d) | | | 1.64 | |
| | (a) | If the common shares are sold to or through underwriters, the Prospectus Supplement will set forth any applicable sales load and the estimated offering expenses. Fund shareholders will pay all offering expenses involved with an offering. | |
| | (b) | Computershare Trust Company, N.A.’s (the “Reinvestment Plan Agent”) fees for the handling of the reinvestment of dividends will be paid by the Fund. However, shareholders will pay a $0.02 per share fee incurred in connection with open-market purchases, which will be deducted from the value of the dividend. Shareholders will also be charged a $2.50 sales fee and pay a $0.15 per share fee if a shareholder directs the Reinvestment Plan Agent to sell the common shares held in a dividend reinvestment account. Per share fees include any applicable brokerage commissions the Reinvestment Plan Agent is required to pay. | |
| | (c) | The Fund currently pays the Manager a monthly fee at an annual contractual investment advisory fee rate of 0.65% of the average weekly value of the Fund’s net assets. For purposes of calculating this fee, “net assets” means the total assets of the Fund minus the sum of its accrued liabilities (including the aggregate indebtedness constituting financial leverage). | |
| | (d) | The Fund and the Manager have entered into a fee waiver agreement (the “Fee Waiver Agreement”), pursuant to which the Manager has contractually agreed to waive the investment advisory fees with respect to any portion of the Fund’s assets attributable to investments in any equity and fixed-income mutual funds and exchange-traded funds managed by the Manager or its affiliates that have a contractual management fee, through June 30, 2024. In addition, pursuant to the Fee Waiver Agreement, the Manager has contractually agreed to waive its investment advisory fees by the amount of investment advisory fees the Fund pays to the Manager indirectly through its investment in money market funds managed by the Manager or its affiliates, through June 30, 2024. The Fee Waiver Agreement may be terminated at any time, without the payment of any penalty, only by the Fund (upon the vote of a majority of the Trustees who are not “interested persons” (as defined in the Investment Company Act of 1940, as amended (the “Investment Company Act”), of the Fund or a majority of the outstanding voting securities of the Fund), upon 90 days’ written notice by the Fund to the Manager. | |
| | (e) | The Fund uses leverage in the form of reverse repurchase agreements representing 29.3% of Managed Assets at an annual interest expense to the Fund of 1.7% which is based on current market conditions. The actual amount of interest expenses borne by the Fund will vary over time in accordance with the level of the Fund’s use of reverse repurchase agreements and variations in market interest rates. Interest expense is required to be treated as an expense of the Fund for accounting purposes. | |
The following example illustrates the expenses (including the sales load of $10.00 and offering costs of $0.38) that shareholders would pay on a $1,000 investment in common shares, assuming (i) total net annual expenses of 1.64% of net assets attributable to common shares and (ii) a 5% annual return:
| | | | | | | | | | | | | | | | |
| | | 1 Year | | | 3 Years | | | 5 Years | | | 10 Years | |
Total expenses incurred | | $ | 27 | | | $ | 62 | | | $ | 99 | | | $ | 204 | |
The example should not be considered a representation of future expenses. The example assumes that the estimated “Other expenses” set forth in the Estimated Annual Expenses table are accurate and that all dividends and distributions are reinvested at NAV. Actual expenses may be greater or less than those assumed. The Fund’s actual rate of return may be greater or less than the hypothetical 5% return shown in the example.
Shareholder Update
BlackRock Limited Duration Income Trust (BLW)
The following table and example are intended to assist shareholders in understanding the various costs and expenses directly or indirectly associated with investing in BLW’s common shares.
| | | | |
| | |
| | | BLW | |
| |
Shareholder Transaction Expenses | | | | |
Maximum sales load (as a percentage of offering price)(a) | | | 1.00 | % |
Offering expenses borne by the Fund (as a percentage of offering price)(a) | | | 0.02 | % |
| |
| $0.02 per share
for open market
purchases of |
|
Dividend reinvestment plan fees | | | common shares | (b) |
Dividend reinvestment plan sale transaction fee(b) | | | $2.50 | |
Estimated Annual Expenses (as a percentage of net assets attributable to common shares) | | | | |
Investment advisory fees(c),(d) | | | 0.87 | % |
Other expenses | | | 1.17 | |
Miscellaneous | | | 0.09 | |
Interest expense(e) | | | 1.08 | |
Total annual expenses | | | 2.04 | |
Fee waiver(d) | | | — | |
Total annual Fund operating expenses after fee waiver(d) | | | 2.04 | |
| | (a) | If the common shares are sold to or through underwriters, the Prospectus Supplement will set forth any applicable sales load and the estimated offering expenses. Fund shareholders will pay all offering expenses involved with an offering. | |
| | (b) | Computershare Trust Company, N.A.’s (the “Reinvestment Plan Agent”) fees for the handling of the reinvestment of dividends will be paid by the Fund. However, shareholders will pay a $0.02 per share fee incurred in connection with open-market purchases, which will be deducted from the value of the dividend. Shareholders will also be charged a $2.50 sales fee and pay a $0.15 per share fee if a shareholder directs the Reinvestment Plan Agent to sell the common shares held in a dividend reinvestment account. Per share fees include any applicable brokerage commissions the Reinvestment Plan Agent is required to pay. | |
| | (c) | The Fund currently pays the Manager a monthly fee at an annual contractual investment advisory fee rate of 0.55% of the average weekly value of the Fund’s managed assets, plus the proceeds of any debt securities or outstanding borrowings used for leverage. For purposes of calculating this fee, “managed assets” are determined as total assets of the Fund (including any assets attributable to money borrowed for investment purposes) less the sum of its accrued liabilities (other than money borrowed for investment purposes). | |
| | (d) | The Fund and the Manager have entered into a fee waiver agreement (the “Fee Waiver Agreement”), pursuant to which the Manager has contractually agreed to waive the investment advisory fees with respect to any portion of the Fund’s assets attributable to investments in any equity and fixed-income mutual funds and exchange-traded funds managed by the Manager or its affiliates that have a contractual management fee, through June 30, 2024. In addition, pursuant to the Fee Waiver Agreement, the Manager has contractually agreed to waive its investment advisory fees by the amount of investment advisory fees the Fund pays to the Manager indirectly through its investment in money market funds managed by the Manager or its affiliates, through June 30, 2024. The Fee Waiver Agreement may be terminated at any time, without the payment of any penalty, only by the Fund (upon the vote of a majority of the Trustees who are not “interested persons” (as defined in the Investment Company Act) of the Fund or a majority of the outstanding voting securities of the Fund), upon 90 days’ written notice by the Fund to the Manager. | |
| | (e) | The Fund uses leverage in the form of reverse repurchase agreements representing 36.4% of Managed Assets at an annual interest expense to the Fund of 1.89%, which is based on current market conditions. The actual amount of interest expense borne by the Fund will vary over time in accordance with the level of the Fund’s use of reverse repurchase agreements and variations in market interest rates. Interest expense is required to be treated as an expense of the Fund for accounting purposes. | |
The following example illustrates the expenses (including the sales load of $10.00 and offering costs of $0.23) that shareholders would pay on a $1,000 investment in common shares, assuming (i) total net annual expenses of 2.04% of net assets attributable to common shares and (ii) a 5% annual return:
| | | | | | | | | | | | | | | | |
| | | 1 Year | | | 3 Years | | | 5 Years | | | 10 Years | |
Total expenses incurred | | $ | 31 | | | $ | 74 | | | $ | 119 | | | $ | 245 | |
The example should not be considered a representation of future expenses. The example assumes that the estimated “Other expenses” set forth in the Estimated Annual Expenses table are accurate and that all dividends and distributions are reinvested at NAV. Actual expenses may be greater or less than those assumed. The Fund’s actual rate of return may be greater or less than the hypothetical 5% return shown in the example.
| | |
| 154 | | 2 0 2 2 BLACK ROCK ANNUAL REPORT TO SHAREHOLDERS |
Shareholder Update (continued)
Share Price Data
The following tables summarize each Fund’s highest and lowest daily closing market prices on the NYSE per common share, the NAV per common share, and the premium to or discount from NAV, on the date of each of the high and low market prices. The trading volume indicates the number of common shares traded on the NYSE during the respective quarters.
| | | | | | | | | | | | | | | | | | | | | | | | | | | | |
| | | NYSE Market Price
Per Common Share | | | NAV per Common Share on Date of Market Price | | | Premium/
(Discount) on Date of Market Price | | | | |
| | | | | | | | | | | | | | | | |
| | | | | | | |
| DSU — During Quarter Ended | | High | | | Low | | | High | | | Low | | | High | | | Low | | | Trading Volume | |
| | | | | | | |
December 31, 2022 | | | $ 9.77 | | | | $ 8.80 | | | | $ 10.48 | | | | $ 10.24 | | | | (6.77 | )% | | | (14.06 | )% | | | 9,860,686 | |
September 30, 2022 | | | 10.15 | | | | 8.83 | | | | 10.84 | | | | 10.27 | | | | (6.37 | ) | | | (14.02 | ) | | | 6,897,776 | |
June 30, 2022 | | | 10.52 | | | | 8.59 | | | | 11.34 | | | | 10.40 | | | | (7.23 | ) | | | (17.40 | ) | | | 11,465,492 | |
March 31, 2022 | | | 11.75 | | | | 10.06 | | | | 11.57 | | | | 11.20 | | | | 1.56 | | | | (10.18 | ) | | | 11,354,361 | |
December 31, 2021 | | | 12.14 | | | | 11.47 | | | | 11.61 | | | | 11.69 | | | | 4.57 | | | | (1.88 | ) | | | 7,344,194 | |
September 30, 2021 | | | 11.73 | | | | 10.93 | | | | 11.68 | | | | 11.65 | | | | 0.43 | | | | (6.18 | ) | | | 9,105,172 | |
June 30, 2021 | | | 11.53 | | | | 10.86 | | | | 11.71 | | | | 11.61 | | | | (1.54 | ) | | | (6.46 | ) | | | 6,975,149 | |
March 31, 2021 | | | 11.00 | | | | 10.37 | | | | 11.64 | | | | 11.62 | | | | (5.50 | ) | | | (10.76 | ) | | | 10,570,729 | |
As of December 31, 2022, DSU’s market price, NAV per Common Share, and premium/(discount) to NAV per Common Share were $9.20, $10.44, and (11.88)%, respectively.
| | | | | | | | | | | | | | | | | | | | | | | | | | | | |
| | | NYSE Market Price
Per Common Share | | | NAV per Common
Share on Date of
Market Price | | | Premium/
(Discount) on Date of
Market Price | | | | |
| | | | | | | | | | | | | | | | |
| | | | | | | |
| BKT — During Quarter Ended | | High | | | Low | | | High | | | Low | | | High | | | Low | | | Trading Volume | |
| | | | | | | |
December 31, 2022 | | | $ 12.82 | | | | $ 11.63 | | | | $ 13.54 | | | | $ 12.70 | | | | (5.32 | )% | | | (8.43 | )% | | | 4,348,585 | |
September 30, 2022 | | | 14.43 | | | | 12.06 | | | | 14.82 | | | | 13.08 | | | | (2.63 | ) | | | (7.80 | ) | | | 7,412,087 | |
June 30, 2022 | | | 15.36 | | | | 12.93 | | | | 15.51 | | | | 14.43 | | | | (0.97 | ) | | | (10.40 | ) | | | 18,907,464 | |
March 31, 2022 | | | 16.92 | | | | 14.85 | | | | 16.89 | | | | 15.66 | | | | 0.18 | | | | (5.17 | ) | | | 21,937,873 | |
December 31, 2021 | | | 18.90 | | | | 16.95 | | | | 17.58 | | | | 16.95 | | | | 7.51 | | | | — | | | | 16,500,738 | |
September 30, 2021 | | | 19.50 | | | | 17.88 | | | | 17.88 | | | | 17.67 | | | | 9.06 | | | | 1.19 | | | | 13,508,607 | |
June 30, 2021 | | | 19.23 | | | | 18.27 | | | | 18.18 | | | | 18.39 | | | | 5.78 | | | | (0.65 | ) | | | 16,030,457 | |
March 31, 2021 | | | 18.51 | | | | 18.00 | | | | 18.54 | | | | 18.57 | | | | (0.16 | ) | | | (3.07 | ) | | | 14,365,814 | |
As of December 31, 2022, BKT’s market price, NAV per Common Share, and premium/(discount) to NAV per Common Share were $12.34, $13.10, and (5.80)%, respectively.
| | | | | | | | | | | | | | | | | | | | | | | | | | | | |
| | | NYSE Market Price
Per Common Share | | | NAV per Common
Share on Date of
Market Price | | | Premium/
(Discount) on Date of
Market Price | | | | |
| | | | | | | | | | | | | | | | |
| | | | | | | |
| BLW — During Quarter Ended | | High | | | Low | | | High | | | Low | | | High | | | Low | | | Trading Volume | |
| | | | | | | |
December 31, 2022 | | | $ 13.53 | | | | $ 11.76 | | | | $ 13.64 | | | | $ 13.11 | | | | (0.81 | )% | | | (10.30 | )% | | | 7,021,181 | |
September 30, 2022 | | | 13.95 | | | | 12.10 | | | | 14.47 | | | | 13.15 | | | | (3.59 | ) | | | (7.98 | ) | | | 4,846,321 | |
June 30, 2022 | | | 14.50 | | | | 12.16 | | | | 15.50 | | | | 13.74 | | | | (6.45 | ) | | | (11.50 | ) | | | 7,688,521 | |
March 31, 2022 | | | 16.45 | | | | 13.65 | | | | 16.44 | | | | 14.99 | | | | 0.06 | | | | (8.94 | ) | | | 8,580,380 | |
December 31, 2021 | | | 17.33 | | | | 16.38 | | | | 16.67 | | | | 16.41 | | | | 3.96 | | | | (0.18 | ) | | | 3,883,694 | |
September 30, 2021 | | | 17.58 | | | | 13.09 | | | | 16.97 | | | | 16.96 | | | | 3.59 | | | | (22.82 | ) | | | 4,757,160 | |
June 30, 2021 | | | 17.24 | | | | 16.55 | | | | 17.10 | | | | 17.00 | | | | 0.82 | | | | (2.65 | ) | | | 5,334,238 | |
March 31, 2021 | | | 16.75 | | | | 14.83 | | | | 17.04 | | | | 16.32 | | | | (1.70 | ) | | | (9.13 | ) | | | 6,372,773 | |
As of December 31, 2022, BLW’s market price, NAV per Common Share, and premium/(discount) to NAV per Common Share were $13.07, $13.51, and (3.26)%, respectively.
Common shares of each Fund have historically traded at both a premium and discount to NAV.
Shares of closed-end funds frequently trade at a discount to their NAV. Because of this possibility and the recognition that any such discount may not be in the interest of shareholders, the Board might consider from time to time engaging in open-market repurchases, managed distribution plans, or other programs intended to reduce the discount. We cannot guarantee or assure, however, that the Board will decide to engage in any of these actions. Nor is there any guarantee or assurance that such actions, if undertaken, would result in the shares trading at a price equal or close to the NAV.
Shareholder Update (continued)
Senior Securities
The following table sets forth information regarding DSU’s outstanding senior securities as of the end of each of DSU’s last ten fiscal years, as applicable. DSU’s audited financial statements, including Deloitte & Touche LLP’s Report of Independent Registered Public Accounting Firm, and accompanying notes to financial statements, are included in this annual report.
| | | | | | | | | | | | | | | | | | | | |
| DSU — Fiscal Year Ended | | Total Amount Outstanding (000) | | | Asset Coverage | | | Liquidating Preference | | | Average Market Value (000) | | | Type of Senior Security | |
December 31, 2022 | | $ | 164,000 | | | $ | 3,967 | | | $ | N/A | | | $ | 215,814 | | | | Bank Borrowings | |
December 31, 2021 | | | 248,000 | | | | 3,172 | | | | N/A | | | | 239,134 | | | | Bank Borrowings | |
December 31, 2020 | | | 229,000 | | | | 3,349 | | | | N/A | | �� | | 220,721 | | | | Bank Borrowings | |
December 31, 2019 | | | 262,000 | | | | 3,310 | | | | N/A | | | | 264,317 | | | | Bank Borrowings | |
February 28, 2019 | | | 278,000 | | | | 3,308 | | | | N/A | | | | 293,419 | | | | Bank Borrowings | |
February 28, 2018 | | | 338,000 | | | | 3,196 | | | | N/A | | | | 348,104 | | | | Bank Borrowings | |
February 28, 2017 | | | 318,000 | | | | 3,455 | | | | N/A | | | | 234,238 | | | | Bank Borrowings | |
February 29, 2016 | | | 190,000 | | | | 4,733 | | | | N/A | | | | 254,199 | | | | Bank Borrowings | |
February 28, 2015 | | | 295,000 | | | | 3,719 | | | | N/A | | | | 303,926 | | | | Bank Borrowings | |
February 28, 2014 | | | 315,000 | | | | 3,634 | | | | N/A | | | | 315,000 | | | | Bank Borrowings | |
| | |
| 156 | | 2 0 2 2 BLACK ROCK ANNUAL REPORT TO SHAREHOLDERS |
Automatic Dividend Reinvestment Plan
Pursuant to DSU, FRA, BKT and BLW’s Dividend Reinvestment Plan (the “Reinvestment Plan”), Common Shareholders are automatically enrolled to have all distributions of dividends and capital gains and other distributions reinvested by Computershare Trust Company, N.A. (the “Reinvestment Plan Agent”) in the respective Fund’s Common Shares pursuant to the Reinvestment Plan. Shareholders who do not participate in the Reinvestment Plan will receive all distributions in cash paid by check and mailed directly to the shareholders of record (or if the shares are held in street name or other nominee name, then to the nominee) by the Reinvestment Plan Agent, which serves as agent for the shareholders in administering the Reinvestment Plan.
After DSU, FRA, BKT and BLWdeclare a dividend or determine to make a capital gain or other distribution, the Reinvestment Plan Agent will acquire shares for the participants’ accounts, depending upon the following circumstances, either (i) through receipt of unissued but authorized shares from the Funds (“newly issued shares”) or (ii) by purchase of outstanding shares on the open market or on the Fund’s primary exchange (“open-market purchases”). If, on the dividend payment date, the net asset value (“NAV”) per share is equal to or less than the market price per share plus estimated brokerage commissions (such condition often referred to as a “market premium”), the Reinvestment Plan Agent will invest the dividend amount in newly issued shares acquired on behalf of the participants. The number of newly issued shares to be credited to each participant’s account will be determined by dividing the dollar amount of the dividend by the NAV on the date the shares are issued. However, if the NAV is less than 95% of the market price on the dividend payment date, the dollar amount of the dividend will be divided by 95% of the market price on the dividend payment date. If, on the dividend payment date, the NAV is greater than the market price per share plus estimated brokerage commissions (such condition often referred to as a “market discount”), the Reinvestment Plan Agent will invest the dividend amount in shares acquired on behalf of the participants in open-market purchases. If the Reinvestment Plan Agent is unable to invest the full dividend amount in open-market purchases, or if the market discount shifts to a market premium during the purchase period, the Reinvestment Plan Agent will invest any un-invested portion in newly issued shares. Investments in newly issued shares made in this manner would be made pursuant to the same process described above and the date of issue for such newly issued shares will substitute for the dividend payment date.
You may elect not to participate in the Reinvestment Plan and to receive all dividends in cash by contacting the Reinvestment Plan Agent, at the address set forth below.
Participation in the Reinvestment Plan is completely voluntary and may be terminated or resumed at any time without penalty by notice if received and processed by the Reinvestment Plan Agent prior to the dividend record date. Additionally, the Reinvestment Plan Agent seeks to process notices received after the record date but prior to the payable date and such notices often will become effective by the payable date. Where late notices are not processed by the applicable payable date, such termination or resumption will be effective with respect to any subsequently declared dividend or other distribution.
The Reinvestment Plan Agent’s fees for the handling of the reinvestment of distributions will be paid by each Fund. However, each participant will pay a pro rata share of brokerage commissions incurred with respect to the Reinvestment Plan Agent’s open-market purchases in connection with the reinvestment of all distributions. The automatic reinvestment of all distributions will not relieve participants of any U.S. federal, state or local income tax that may be payable on such dividends or distributions.
Each Fund reserves the right to amend or terminate the Reinvestment Plan. There is no direct service charge to participants in the Reinvestment Plan; however, each Fund reserves the right to amend the Reinvestment Plan to include a service charge payable by the participants. Participants in FRA, BKT and BLWthat request a sale of shares are subject to a $2.50 sales fee and a $0.15 per share sold fee. Per share fees include any applicable brokerage commissions the Reinvestment Plan Agent is required to pay. Participants in DSU that request a sale of shares are subject to a $0.02 per share sold brokerage commission. All correspondence concerning the Reinvestment Plan should be directed to Computershare Trust Company, N.A. through the internet at computershare.com/blackrock, or in writing to Computershare, P.O. Box 43006, Providence, RI 02940-3078, Telephone: (800) 699-1236. Overnight correspondence should be directed to the Reinvestment Plan Agent at Computershare, 150 Royall Street, Suite 101, Canton, MA 02021.
| | |
AUTOMATIC DIVIDEND REINVESTMENT PLAN | | 157 |
Director and Officer Information
| | | | | | | | |
| Independent Directors(a) |
| | | | | |
Name Year of Birth(b) | | Position(s) Held (Length of Service)(c) | | Principal Occupation(s) During Past 5 Years | | Number of BlackRock-Advised Registered Investment Companies (“RICs”) Consisting of Investment Portfolios (“Portfolios”) Overseen | | Public Company and Other Investment Company Directorships Held During Past 5 Years |
| | | | |
R. Glenn Hubbard 1958 | | Chair of the Board (Since 2022) Director (Since 2007) | | Dean, Columbia Business School from 2004 to 2019; Faculty member, Columbia Business School since 1988. | | 70 RICs consisting of 102 Portfolios | | ADP (data and information services) from 2004 to 2020; Metropolitan Life Insurance Company (insurance); TotalEnergies SE (multi-energy) |
| | | | |
W. Carl Kester(d) 1951 | | Vice Chair of the Board (Since 2022) Director (Since 2007) | | George Fisher Baker Jr. Professor of Business Administration, Harvard Business School since 2008; Deputy Dean for Academic Affairs from 2006 to 2010; Chairman of the Finance Unit, from 2005 to 2006; Senior Associate Dean and Chairman of the MBA Program from 1999 to 2005; Member of the faculty of Harvard Business School since 1981. | | 72 RICs consisting of 104 Portfolios | | None |
| | | | |
Cynthia L. Egan 1955 | | Director (Since 2016) | | Advisor, U.S. Department of the Treasury from 2014 to 2015; President, Retirement Plan Services, for T. Rowe Price Group, Inc. from 2007 to 2012; executive positions within Fidelity Investments from 1989 to 2007. | | 70 RICs consisting of 102 Portfolios | | Unum (insurance); The Hanover Insurance Group (Board Chair); Huntsman Corporation (Lead Independent Director and non Executive Vice Chair of the Board) (chemical products) |
| | | | |
Frank J. Fabozzi(d) 1948 | | Director (Since 2007) | | Editor of The Journal of Portfolio Management since 1986; Professor of Finance, EDHEC Business School (France) from 2011 to 2022; Professor of Practice, Johns Hopkins University since 2021; Professor in the Practice of Finance, Yale University School of Management from 1994 to 2011 and currently a Teaching Fellow in Yale’s Executive Programs; Visiting Professor, Rutgers University for the Spring 2019 semester; Visiting Professor, New York University for the 2019 academic year; Adjunct Professor of Finance, Carnegie Mellon University in fall 2020 semester. | | 72 RICs consisting of 104 Portfolios | | None |
| | | | |
Lorenzo A. Flores 1964 | | Director (Since 2021) | | Vice Chairman, Kioxia, Inc. since 2019; Chief Financial Officer, Xilinx, Inc. from 2016 to 2019; Corporate Controller, Xilinx, Inc. from 2008 to 2016. | | 70 RICs consisting of 102 Portfolios | | None |
| | | | |
Stayce D. Harris 1959 | | Director (Since 2021) | | Lieutenant General, Inspector General, Office of the Secretary of the United States Air Force from 2017 to 2019; Lieutenant General, Assistant Vice Chief of Staff and Director, Air Staff, United States Air Force from 2016 to 2017; Major General, Commander, 22nd Air Force, AFRC, Dobbins Air Reserve Base, Georgia from 2014 to 2016; Pilot, United Airlines from 1990 to 2020. | | 70 RICs consisting of 102 Portfolios | | The Boeing Company (airplane manufacturer) |
| | | | |
J. Phillip Holloman 1955 | | Director (Since 2021) | | President and Chief Operating Officer, Cintas Corporation from 2008 to 2018. | | 70 RICs consisting of 102 Portfolios | | PulteGroup, Inc. (home construction); Rockwell Automation Inc. (industrial automation) |
| | |
| 158 | | 2 0 2 2 BLACK ROCK ANNUAL REPORT TO SHAREHOLDERS |
Director and Officer Information (continued)
| | | | | | | | |
| Independent Directors(a) (continued) |
| | | | | |
Name Year of Birth(b) | | Position(s) Held (Length of Service)(c) | | Principal Occupation(s) During Past 5 Years | | Number of BlackRock-Advised Registered Investment Companies (“RICs”) Consisting of Investment Portfolios (“Portfolios”) Overseen | | Public Company and Other Investment Company Directorships Held During Past 5 Years |
| | | | |
Catherine A. Lynch(d) 1961 | | Director (Since 2016) | | Chief Executive Officer, Chief Investment Officer and various other positions, National Railroad Retirement Investment Trust from 2003 to 2016; Associate Vice President for Treasury Management, The George Washington University from 1999 to 2003; Assistant Treasurer, Episcopal Church of America from 1995 to 1999. | | 72 RICs consisting of 104 Portfolios | | PennyMac Mortgage Investment Trust |
|
| Interested Directors(a)(e) |
| | | | | |
Name Year of Birth(b) | | Position(s) Held (Length of Service)(c) | | Principal Occupation(s) During Past 5 Years | | Number of BlackRock-Advised Registered Investment Companies (“RICs”) Consisting of Investment Portfolios (“Portfolios”) Overseen | | Public Company and Other Investment Company Directorships Held During Past 5 Years |
| | | | |
Robert Fairbairn 1965 | | Director (Since 2018) | | Vice Chairman of BlackRock, Inc. since 2019; Member of BlackRock’s Global Executive and Global Operating Committees; Co-Chair of BlackRock’s Human Capital Committee; Senior Managing Director of BlackRock, Inc. from 2010 to 2019; oversaw BlackRock’s Strategic Partner Program and Strategic Product Management Group from 2012 to 2019; Member of the Board of Managers of BlackRock Investments, LLC from 2011 to 2018; Global Head of BlackRock’s Retail and iShares® businesses from 2012 to 2016. | | 98 RICs consisting of 266 Portfolios | | None |
| | | | |
John M. Perlowski(d) 1964 | | Director (Since 2015) President and Chief Executive Officer (Since 2010) | | Managing Director of BlackRock, Inc. since 2009; Head of BlackRock Global Accounting and Product Services since 2009; Advisory Director of Family Resource Network (charitable foundation) since 2009. | | 100 RICs consisting of 268 Portfolios | | None |
| (a) | The address of each Director is c/o BlackRock, Inc., 55 East 52nd Street, New York, New York 10055. |
| (b) | Each Independent Director holds office until his or her successor is duly elected and qualifies or until his or her earlier death, resignation, retirement or removal as provided by the Fund’s by-laws or charter or statute, or until December 31 of the year in which he or she turns 75. Directors who are “interested persons,” as defined in the Investment Company Act serve until their successor is duly elected and qualifies or until their earlier death, resignation, retirement or removal as provided by the Fund’s by-laws or statute, or until December 31 of the year in which they turn 72. The Board may determine to extend the terms of Independent Directors on a case-by-case basis, as appropriate. |
| (c) | Following the combination of Merrill Lynch Investment Managers, L.P. (“MLIM”) and BlackRock, Inc. in September 2006, the various legacy MLIM and legacy BlackRock fund boards were realigned and consolidated into three new fund boards in 2007. Certain Independent Directors first became members of the boards of other legacy MLIM or legacy BlackRock funds as follows: Frank J. Fabozzi, 1988; R. Glenn Hubbard, 2004; and W. Carl Kester, 1995. |
| (d) | Dr. Fabozzi, Dr. Kester, Ms. Lynch and Mr. Perlowski are also trustees of the BlackRock Credit Strategies Fund and BlackRock Private Investments Fund. |
| (e) | Mr. Fairbairn and Mr. Perlowski are both “interested persons,” as defined in the 1940 Act, of the Fund based on their positions with BlackRock, Inc. and its affiliates. Mr. Fairbairn and Mr. Perlowski are also board members of the BlackRock Multi-Asset Complex. |
| | |
DIRECTOR AND OFFICER INFORMATION | | 159 |
Director and Officer Information (continued)
| | | | |
| Officers Who Are Not Directors(a) |
| | | |
Name Year of Birth(b) | | Position(s) Held (Length of Service) | | Principal Occupation(s) During Past 5 Years |
| | |
Jonathan Diorio 1980 | | Vice President (Since 2015) | | Managing Director of BlackRock, Inc. since 2015; Director of BlackRock, Inc. from 2011 to 2015. |
| | |
Trent Walker 1974 | | Chief Financial Officer (Since 2021) | | Managing Director of BlackRock, Inc. since September 2019; Executive Vice President of PIMCO from 2016 to 2019; Senior Vice President of PIMCO from 2008 to 2015; Treasurer from 2013 to 2019 and Assistant Treasurer from 2007 to 2017 of PIMCO Funds, PIMCO Variable Insurance Trust, PIMCO ETF Trust, PIMCO Equity Series, PIMCO Equity Series VIT, PIMCO Managed Accounts Trust, 2 PIMCO-sponsored interval funds and 21 PIMCO-sponsored closed-end funds. |
| | |
Jay M. Fife 1970 | | Treasurer (Since 2007) | | Managing Director of BlackRock, Inc. since 2007. |
| | |
Charles Park 1967 | | Chief Compliance Officer (Since 2014) | | Anti-Money Laundering Compliance Officer for certain BlackRock-advised Funds from 2014 to 2015; Chief Compliance Officer of BlackRock Advisors, LLC and the BlackRock-advised Funds in the BlackRock Multi-Asset Complex and the BlackRock Fixed-Income Complex since 2014; Principal of and Chief Compliance Officer for iShares® Delaware Trust Sponsor LLC since 2012 and BlackRock Fund Advisors (“BFA”) since 2006; Chief Compliance Officer for the BFA-advised iShares® exchange traded funds since 2006; Chief Compliance Officer for BlackRock Asset Management International Inc. since 2012. |
| | |
Janey Ahn 1975 | | Secretary (Since 2012) | | Managing Director of BlackRock, Inc. since 2018; Director of BlackRock, Inc. from 2009 to 2017. |
| (a) | The address of each Officer is c/o BlackRock, Inc., 55 East 52nd Street, New York, New York 10055. |
| (b) | Officers of the Fund serve at the pleasure of the Board. |
Further information about DSU’s, BKT’s and BLW’s Directors and Officers is available in the Fund’s Statement of Additional Information, which can be obtained without charge by calling (800) 882-0052.
| | |
| 160 | | 2 0 2 2 BLACK ROCK ANNUAL REPORT TO SHAREHOLDERS |
Additional Information
Proxy Results
The Annual Meeting of Shareholders was held on July 25, 2022 for shareholders of record on May 27, 2022, to elect director nominees for each Fund. There were no broker non-votes with regard to any of the Funds.
Shareholders elected the Class III Directors as follows:
| | | | | | | | | | | | | | | | | | | | | | | | |
| |
| | | |
| | | Cynthia L. Egan | | | Robert Fairbairn | | | Stayce D. Harris | |
| | | | | | | | | | | | |
| | | | | | |
| Fund Name | | Votes For | | | Votes Withheld | | | Votes For | | | Votes Withheld | | | Votes For | | | Votes Withheld | |
| |
| | | | | | |
BLW | | | 28,376,244 | | | | 726,008 | | | | 28,337,243 | | | | 765,009 | | | | 28,381,810 | | | | 720,442 | |
| | | | | | |
BKT | | | 41,418,617 | | | | 2,618,693 | | | | 41,408,520 | | | | 2,628,790 | | | | 41,348,538 | | | | 2,688,772 | |
| |
For the Funds listed above, Directors whose term of office continued after the Annual Meeting of Shareholders because they were not up for election are Lorenzo A. Flores, J. Phillip Holloman, R. Glenn Hubbard, Catherine A. Lynch, John M. Perlowski, Frank J. Fabozzi and W. Carl Kester.
Shareholders elected the Class III Directors as follows:
| | | | | | | | | | | | | | | | | | | | | | | | |
| |
| | | |
| | | Frank J. Fabozzi | | | Robert Fairbairn | | | J. Phillip Holloman | |
| | | | | | | | | | | | |
| | | | | | |
| Fund Name | | Votes For | | | Votes Withheld | | | Votes For | | | Votes Withheld | | | Votes For | | | Votes Withheld | |
| |
| | | | | | |
FRA | | | 24,423,706 | | | | 1,149,621 | | | | 24,772,010 | | | | 801,317 | | | | 24,704,960 | | | | 868,367 | |
| | | | | | |
DSU | | | 34,497,091 | | | | 1,549,074 | | | | 35,049,471 | | | | 996,694 | | | | 34,589,950 | | | | 1,456,215 | |
| |
For the Funds listed above, Directors whose term of office continued after the Annual Meeting of Shareholders because they were not up for election are Cynthia L. Egan, Lorenzo A. Flores, Stayce D. Harris, R. Glenn Hubbard, Catherine A. Lynch, John M. Perlowski and W. Carl Kester.
Fund Certification
The Funds are listed for trading on the NYSE and have filed with the NYSE their annual chief executive officer certification regarding compliance with the NYSE’s listing standards. The Funds filed with the SEC the certification of its chief executive officer and chief financial officer required by Section 302 of the Sarbanes-Oxley Act.
Environmental, Social and Governance (“ESG”) Integration
Although a Fund does not seek to implement a specific sustainability strategy unless otherwise disclosed, Fund management will consider ESG characteristics as part of the investment process for actively managed Funds. These considerations will vary depending on a Fund’s particular investment strategies and may include consideration of third-party research as well as consideration of proprietary BlackRock research across the ESG risks and opportunities regarding an issuer. Fund management will consider such ESG characteristics it deems relevant or additive, if any, when making investment decisions for a Fund. The ESG characteristics utilized in a Fund’s investment process are anticipated to evolve over time and one or more characteristics may not be relevant with respect to all issuers that are eligible for investment. ESG characteristics are not the sole considerations when making investment decisions for a Fund. Further, investors can differ in their views of what constitutes positive or negative ESG characteristics. As a result, a Fund may invest in issuers that do not reflect the beliefs and values with respect to ESG of any particular investor. ESG considerations may affect a Fund’s exposure to certain companies or industries and a Fund may forego certain investment opportunities. While Fund management views ESG considerations as having the potential to contribute to a Fund’s long-term performance, there is no guarantee that such results will be achieved.
Dividend Policy
Each Fund’s policy is to make monthly distributions to shareholders. In order to provide shareholders with a more stable level of dividend distributions, each Fund employs a managed distribution plan (the “Plan”), the goal of which is to provide shareholders with consistent and predictable cash flows by setting distribution rates based on expected long-term returns of each Fund.
The distributions paid by a Fund for any particular month may be more or less than the amount of net investment income earned by a Fund during such month. Furthermore, the final tax characterization of distributions is determined after the year-end of a Fund and is reported in each Fund’s annual report to shareholders. Distributions can be characterized as ordinary income, capital gains and/or return of capital. Each Fund’s taxable net investment income and net realized capital gains (“taxable income”) may not be sufficient to support the level of distributions paid. To the extent that distributions exceed the Fund’s current and accumulated earnings and profits, the excess may be treated as a non-taxable return of capital.
A return of capital is a return of a portion of an investor’s original investment. A return of capital is not expected to be taxable, but it reduces a shareholder’s tax basis in his or her shares, thus reducing any loss or increasing any gain on a subsequent disposition by the shareholder of his or her shares. It is possible that a substantial portion of the distributions paid during a calendar year may ultimately be classified as return of capital for U.S. federal income tax purposes when the final determination of the source and character of the distributions is made.
Such distributions, under certain circumstances, may exceed a Fund’s total return performance. When total distributions exceed total return performance for the period, the difference reduces the Fund’s total assets and net asset value (“NAV”) per share and, therefore, could have the effect of increasing the Fund’s expense ratio and reducing the amount of assets the Fund has available for long term investment.
| | |
ADDITIONAL INFORMATION | | 161 |
Additional Information (continued)
General Information
The Funds, other than DSU, BKT and BLW, do not make available copies of their Statements of Additional Information because the Funds’ shares, other than DSU, BKT and BLW, are not continuously offered, which means that the Statement of Additional Information of each Fund, other than DSU, BKT and BLW, has not been updated after completion of the respective Fund’s offerings and the information contained in each Fund’s Statement of Additional Information may have become outdated.
DSU’s, BKT’s and BLW’s Statement of Additional Information includes additional information about the Board and is available, without charge upon request by calling (800)-882-0052.
The following information is a summary of certain changes since December 31, 2021. This information may not reflect all of the changes that have occurred since you purchased the relevant Fund.
Except if noted otherwise herein, there were no changes to the Funds’ charters or by-laws that would delay or prevent a change of control of the Funds that were not approved by the shareholders. Except if noted otherwise herein, there have been no changes in the persons who are primarily responsible for the day-to-day management of the Funds’ portfolios.
Effective August 1, 2022, the State of Delaware enacted new control beneficial interest acquisition provisions of the Delaware Statutory Trust Act (the “Delaware CBIA Statute”) that automatically applies to Delaware statutory trusts that are registered as closed-end management investment companies under the Investment Company Act of 1940, such as BLW. In general, the Delaware CBIA Statute limits the right of holders who acquire “control beneficial interests” of a statutory trust to vote those beneficial interests on matters under the Delaware Statutory Trust Act or the governing instrument of BLW unless approved by disinterested shareholders holding two-thirds of the votes entitled to be cast. The Delaware CBIA Statute generally defines “control beneficial interests” to include beneficial interests that, in the absence of the Delaware CBIA Statute, if aggregated with all other beneficial interests of the statutory trust that are either (i) owned by the acquiring person (or an associate) or (ii) in respect of which the acquiring person (or an associate) is entitled to exercise or direct the exercise of voting power, would entitle that person to exercise or direct the exercise of voting power of beneficial interests in the election of trustees, within any of certain specified ranges of voting power starting at 10%. The Delaware CBIA Statute requires acquiring persons to disclose to the statutory trust any control beneficial interest acquisition within 10 days of such acquisition. The Delaware CBIA Statute allows a statutory trust’s governing instrument or board of trustees to provide exemptions from the statute’s limitations to acquisitions of beneficial interests, including as to any series or classes of beneficial interests. The foregoing is only a summary of certain aspects of the Delaware CBIA Statute. Shareholders should consult their own legal counsel to determine the application of the Delaware CBIA Statute with respect to their beneficial interests of BLW and any subsequent acquisitions of beneficial interests.
In accordance with Section 23(c) of the Investment Company Act of 1940, each Fund may from time to time purchase shares of its common stock in the open market or in private transactions.
Quarterly performance, semi-annual and annual reports, current net asset value and other information regarding the Funds may be found on BlackRock’s website, which can be accessed at blackrock.com. Any reference to BlackRock’s website in this report is intended to allow investors public access to information regarding the Funds and does not, and is not intended to, incorporate BlackRock’s website in this report.
Electronic Delivery
Shareholders can sign up for e-mail notifications of quarterly statements, annual and semi-annual shareholder reports and, for DSU, BKT and BLW only, prospectuses, by enrolling in the electronic delivery program. Electronic copies of shareholder reports and, for DSU, BKT and BLW only, prospectuses, are available on BlackRock’s website.
To enroll in electronic delivery:
Shareholders Who Hold Accounts with Investment Advisers, Banks or Brokerages:
Please contact your financial adviser. Please note that not all investment advisers, banks or brokerages may offer this service.
Householding
The Funds will mail only one copy of shareholder documents, including for DSU, BKT and BLW only, prospectuses, annual and semi-annual reports, Rule 30e-3 notices and proxy statements, to shareholders with multiple accounts at the same address. This practice is commonly called “householding” and is intended to reduce expenses and eliminate duplicate mailings of shareholder documents. Mailings of your shareholder documents may be householded indefinitely unless you instruct us otherwise. If you do not want the mailing of these documents to be combined with those for other members of your household, please call the Funds at (800) 882-0052.
Availability of Quarterly Schedule of Investments
The Funds file their complete schedules of portfolio holdings with the SEC for the first and third quarters of each fiscal year as an exhibit to their reports on Form N-PORT. The Funds’ Forms N-PORT are available on the SEC’s website at sec.gov. Additionally, each Fund makes its portfolio holdings for the first and third quarters of each fiscal year available at blackrock.com/fundreports.
| | |
| 162 | | 2 0 2 2 BLACK ROCK ANNUAL REPORT TO SHAREHOLDERS |
Additional Information (continued)
Availability of Proxy Voting Policies, Procedures and Voting Records
A description of the policies and procedures that the Funds use to determine how to vote proxies relating to portfolio securities and information about how the Funds voted proxies relating to securities held in the Funds’ portfolios during the most recent 12-month period ended June 30 is available without charge, upon request (1) by calling (800) 882-0052; (2) on the BlackRock website at blackrock.com; and (3) on the SEC’s website at sec.gov.
Availability of Fund Updates
BlackRock will update performance and certain other data for the Funds on a monthly basis on its website in the “Closed-end Funds” section of blackrock.com as well as certain other material information as necessary from time to time. Investors and others are advised to check the website for updated performance information and the release of other material information about the Funds. This reference to BlackRock’s website is intended to allow investors public access to information regarding the Funds and does not, and is not intended to, incorporate BlackRock’s website in this report.
Shelf Offering Program
From time-to-time, BKT and BLWmay seek to raise additional equity capital through a Shelf Offering. In a Shelf Offering, BKT and BLWmay, subject to market conditions, raise additional equity capital by issuing new Common Shares from time to time in varying amounts at a net price at or above BKT’s and BLW’s NAV per Common Share (calculated within 48 hours of pricing). While any such Shelf Offering may allow BKT and BLW to pursue additional investment opportunities without the need to sell existing portfolio investments, it could also entail risks – including that the issuance of additional Common Shares may limit the extent to which the Common Shares are able to trade at a premium to NAV in the secondary market.
BKT and BLWfiled final prospectuses with the SEC in connection with their Shelf Offerings on June 23, 2022 and May 17, 2022, respectively. This report and the prospectuses of BKT and BLW are not offers to sell BKT and BLW Common Shares or solicitations of an offer to buy BKT and BLW Common Shares in any jurisdiction where such offers or sales are not permitted. The prospectuses of BKT and BLW contain important information about BKT and BLW, including their investment objectives, risks, charges and expenses. Investors are urged to read the prospectuses of BKT and BLWcarefully and in their entirety before investing. Copies of the final prospectuses for BKT and BLWcan be obtained from BlackRock at blackrock.com.
On December 28, 2022, DSU’s registration statement with the SEC to issue additional Common Shares through a Shelf Offering was declared effective. DSU may not sell any Common Shares in a Shelf Offering until a definitive prospectus relating to the Shelf Offering has been filed with the SEC. This report and the prospectus of DSU are not offers to sell DSU Common Shares or solicitations of an offer to buy DSU Common Shares in any jurisdiction where such offers or sales are not permitted. The prospectus of DSU contains important information about DSU, including its investment objective, risks, charges and expenses. Investors are urged to read the prospectus of DSU carefully and in its entirety before investing. Copies of the final prospectus for DSU can be obtained from BlackRock at blackrock.com, when available.
BlackRock Privacy Principles
BlackRock is committed to maintaining the privacy of its current and former fund investors and individual clients (collectively, “Clients”) and to safeguarding their non-public personal information. The following information is provided to help you understand what personal information BlackRock collects, how we protect that information and why in certain cases we share such information with select parties.
If you are located in a jurisdiction where specific laws, rules or regulations require BlackRock to provide you with additional or different privacy-related rights beyond what is set forth below, then BlackRock will comply with those specific laws, rules or regulations.
BlackRock obtains or verifies personal non-public information from and about you from different sources, including the following: (i) information we receive from you or, if applicable, your financial intermediary, on applications, forms or other documents; (ii) information about your transactions with us, our affiliates, or others; (iii) information we receive from a consumer reporting agency; and (iv) from visits to our websites.
BlackRock does not sell or disclose to non-affiliated third parties any non-public personal information about its Clients, except as permitted by law or as is necessary to respond to regulatory requests or to service Client accounts. These non-affiliated third parties are required to protect the confidentiality and security of this information and to use it only for its intended purpose.
We may share information with our affiliates to service your account or to provide you with information about other BlackRock products or services that may be of interest to you. In addition, BlackRock restricts access to non-public personal information about its Clients to those BlackRock employees with a legitimate business need for the information. BlackRock maintains physical, electronic and procedural safeguards that are designed to protect the non-public personal information of its Clients, including procedures relating to the proper storage and disposal of such information.
Fund and Service Providers
Investment Adviser
BlackRock Advisors, LLC
Wilmington, DE 19809
Sub-Adviser
BlackRock International Limited
Edinburgh, EH3 8BL
United Kingdom
BlackRock (Singapore) Limited(a)
079912 Singapore
| | |
ADDITIONAL INFORMATION | | 163 |
Additional Information (continued)
Fund and Service Providers (continued)
Accounting Agent and Custodian
State Street Bank and Trust Company
Boston, MA 02111
Transfer Agent
Computershare Trust Company, N.A.
Canton, MA 02021
(a) For BLW.
Independent Registered Public Accounting Firm
Deloitte & Touche LLP
Boston, MA 02116
Legal Counsel
Willkie Farr & Gallagher LLP
New York, NY 10019
Address of the Funds
100 Bellevue Parkway
Wilmington, DE 19809
| | |
| 164 | | 2 0 2 2 BLACK ROCK ANNUAL REPORT TO SHAREHOLDERS |
Glossary of Terms Used in this Report
| | |
| Currency Abbreviation |
| |
| EUR | | Euro |
| |
| GBP | | British Pound |
| |
| USD | | United States Dollar |
| | |
| Portfolio Abbreviation |
| |
| ABS | | Asset-Backed Security |
| |
| CDI | | CREST Depository Interest |
| |
| CLO | | Collateralized Loan Obligation |
| |
| CMT | | Constant Maturity Treasury |
| |
| DAC | | Designated Activity Company |
| |
| ETF | | Exchange-Traded Fund |
| |
| EURIBOR | | Euro Interbank Offered Rate |
| |
| FEDL | | Fed Funds Effective Rate |
| |
| IO | | Interest Only |
| |
| LIBOR | | London Interbank Offered Rate |
| |
| PCL | | Public Company Limited |
| |
| PIK | | Payment-in-Kind |
| |
| PO | | Principal Only |
| |
| REIT | | Real Estate Investment Trust |
| |
| REMIC | | Real Estate Mortgage Investment Conduit |
| |
| SAB | | Special Assessment Bonds |
| |
| SCA | | Societe en Commandite par Actions |
| |
| SOFR | | Secured Overnight Financing Rate |
| |
| SOFR CME | | Secured Overnight Financing Rate Chicago Mercantile Exchange |
| |
| SOFRTE | | Term Secured Overnight Financing Rate |
| |
| SONIA | | Sterling Overnight Interbank Average Rate |
| |
| TBA | | To-Be-Announced |
| | |
GLOSSARY OF TERMS USED IN THIS REPORT | | 165 |
Want to know more?
blackrock.com | 800-882-0052
This report is intended for current holders. It is not a prospectus. Past performance results shown in this report should not be considered a representation of future performance. Statements and other information herein are as dated and are subject to change.
CEFT-BK3-12/22-AR
(b) Not Applicable
| Item 2 – | Code of Ethics – The registrant (or the “Fund”) has adopted a code of ethics, as of the end of the period covered by this report, applicable to the registrant’s principal executive officer, principal financial officer, principal accounting officer or controller, or persons performing similar functions. During the period covered by this report, the code of ethics was amended to update certain information and to make other non-material changes. During the period covered by this report, there have been no waivers granted under the code of ethics. The registrant undertakes to provide a copy of the code of ethics to any person upon request, without charge, who calls 1-800-882-0052, option 4. |
| Item 3 – | Audit Committee Financial Expert – The registrant’s board of directors (the “board of directors”), has determined that (i) the registrant has the following audit committee financial experts serving on its audit committee and (ii) each audit committee financial expert is independent: |
Frank J. Fabozzi
Lorenzo A. Flores
Catherine A. Lynch
Under applicable securities laws, a person determined to be an audit committee financial expert will not be deemed an “expert” for any purpose, including without limitation for the purposes of Section 11 of the Securities Act of 1933, as a result of being designated or identified as an audit committee financial expert. The designation or identification of a person as an audit committee financial expert does not impose on such person any duties, obligations, or liabilities greater than the duties, obligations, and liabilities imposed on such person as a member of the audit committee and board of directors in the absence of such designation or identification. The designation or identification of a person as an audit committee financial expert does not affect the duties, obligations, or liability of any other member of the audit committee or board of directors.
| Item 4 – | Principal Accountant Fees and Services |
The following table presents fees billed by Deloitte & Touche LLP (“D&T”) in each of the last two fiscal years for the services rendered to the Fund:
| | | | | | | | | | | | | | | | |
| | | (a) Audit Fees | | (b) Audit-Related Fees1 | | (c) Tax Fees2 | | (d) All Other Fees |
| Entity Name | | Current Fiscal Year End | | Previous Fiscal Year End | | Current Fiscal Year End | | Previous Fiscal Year End | | Current Fiscal Year End | | Previous Fiscal Year End3 | | Current Fiscal Year End | | Previous Fiscal Year End |
BlackRock Floating Rate Income Strategies Fund, Inc. | | $69,972 | | $69,286 | | $0 | | $207 | | $14,700 | | $12,700 | | $431 | | $0 |
The following table presents fees billed by D&T that were required to be approved by the registrant’s audit committee (the “Committee”) for services that relate directly to the operations or financial reporting of the Fund and that are rendered on behalf of BlackRock Advisors, LLC (“Investment Adviser” or “BlackRock”) and entities controlling, controlled by, or under common control with BlackRock (not including any sub-adviser whose role is primarily portfolio management and is
2
subcontracted with or overseen by another investment adviser) that provide ongoing services to the Fund (“Affiliated Service Providers”):
| | | | |
| | | Current Fiscal Year End | | Previous Fiscal Year End |
(b) Audit-Related Fees1 | | $0 | | $0 |
(c) Tax Fees2 | | $0 | | $0 |
(d) All Other Fees3 | | $2,098,000 | | $2,032,000 |
1 The nature of the services includes assurance and related services reasonably related to the performance of the audit or review of financial statements not included in Audit Fees, including accounting consultations, agreed-upon procedure reports, attestation reports, comfort letters, out-of-pocket expenses and internal control reviews not required by regulators.
2 The nature of the services includes tax compliance and/or tax preparation, including services relating to the filing or amendment of federal, state or local income tax returns, regulated investment company qualification reviews, taxable income and tax distribution calculations.
3 Non-audit fees of $2,098,000 and $2,032,000 for the current fiscal year and previous fiscal year, respectively, were paid to the Fund’s principal accountant in their entirety by BlackRock, in connection with services provided to the Affiliated Service Providers of the Fund and of certain other funds sponsored and advised by BlackRock or its affiliates for a service organization review and an accounting research tool subscription. These amounts represent aggregate fees paid by BlackRock and were not allocated on a per fund basis.
(e)(1) Audit Committee Pre-Approval Policies and Procedures:
The Committee has adopted policies and procedures with regard to the pre-approval of services. Audit, audit-related and tax compliance services provided to the registrant on an annual basis require specific pre-approval by the Committee. The Committee also must approve other non-audit services provided to the registrant and those non-audit services provided to the Investment Adviser and Affiliated Service Providers that relate directly to the operations and the financial reporting of the registrant. Certain of these non-audit services that the Committee believes are (a) consistent with the SEC’s auditor independence rules and (b) routine and recurring services that will not impair the independence of the independent accountants may be approved by the Committee without consideration on a specific case-by-case basis (“general pre-approval”). The term of any general pre-approval is 12 months from the date of the pre-approval, unless the Committee provides for a different period. Tax or other non-audit services provided to the registrant which have a direct impact on the operations or financial reporting of the registrant will only be deemed pre-approved provided that any individual project does not exceed $10,000 attributable to the registrant or $50,000 per project. For this purpose, multiple projects will be aggregated to determine if they exceed the previously mentioned cost levels.
Any proposed services exceeding the pre-approved cost levels will require specific pre-approval by the Committee, as will any other services not subject to general pre-approval (e.g., unanticipated but permissible services). The Committee is informed of each service approved subject to general pre-approval at the next regularly scheduled in-person board meeting. At this meeting, an analysis of such services is presented to the Committee for ratification. The Committee may delegate to the Committee Chairman the authority to approve the provision of and fees for any specific engagement of permitted non-audit services, including services exceeding pre-approved cost levels.
(e)(2) None of the services described in each of Items 4(b) through (d) were approved by the Committee pursuant to the de minimis exception in paragraph (c)(7)(i)(C) of Rule 2-01 of Regulation S-X.
(f) Not Applicable
3
(g) The aggregate non-audit fees, defined as the sum of the fees shown under “Audit-Related Fees,” “Tax Fees” and “All Other Fees,” paid to the accountant for services rendered by the accountant to the registrant, the Investment Adviser and the Affiliated Service Providers were:
| | | | | | |
| Entity Name | | Current Fiscal Year End | | Previous Fiscal Year End | | |
BlackRock Floating Rate Income Strategies Fund, Inc. | | $15,131 | | $12,907 | | |
Additionally, the amounts billed by D&T in connection with services provided to the Affiliated Service Providers of the Fund and of other funds sponsored or advised by BlackRock or its affiliates during the current and previous fiscal years for a service organization review and an accounting research tool subscription were:
| | |
Current Fiscal Year End | | Previous Fiscal Year End |
$2,098,000 | | $2,032,000 |
These amounts represent aggregate fees paid by BlackRock and were not allocated on a per fund basis.
(h) The Committee has considered and determined that the provision of non-audit services that were rendered to the Investment Adviser, and the Affiliated Service Providers that were not pre-approved pursuant to paragraph (c)(7)(ii) of Rule 2-01 of Regulation S-X is compatible with maintaining the principal accountant’s independence.
(i) – Not Applicable
(j) – Not Applicable
| Item 5 – | Audit Committee of Listed Registrant |
| | (a) | | The following individuals are members of the registrant’s separately designated standing audit committee established in accordance with Section 3(a)(58)(A) of the Securities Exchange Act of 1934 (15 U.S.C. 78c(a)(58)(A)): |
Frank J. Fabozzi
Lorenzo A. Flores
J. Phillip Holloman
Catherine A. Lynch
4
(a) The registrant’s Schedule of Investments is included as part of the Report to Stockholders filed under Item 1(a) of this Form.
(b) Not Applicable due to no such divestments during the semi-annual period covered since the previous Form N-CSR filing.
| Item 7 – | Disclosure of Proxy Voting Policies and Procedures for Closed-End Management Investment Companies – The board of directors has delegated the voting of proxies for the Fund’s portfolio securities to the Investment Adviser pursuant to the Investment Adviser’s proxy voting guidelines. Under these guidelines, the Investment Adviser will vote proxies related to Fund securities in the best interests of the Fund and its stockholders. From time to time, a vote may present a conflict between the interests of the Fund’s stockholders, on the one hand, and those of the Investment Adviser, or any affiliated person of the Fund or the Investment Adviser, on the other. In such event, provided that the Investment Adviser’s Equity Investment Policy Oversight Committee, or a sub-committee thereof (the “Oversight Committee”) is aware of the real or potential conflict or material non-routine matter and if the Oversight Committee does not reasonably believe it is able to follow its general voting guidelines (or if the particular proxy matter is not addressed in the guidelines) and vote impartially, the Oversight Committee may retain an independent fiduciary to advise the Oversight Committee on how to vote or to cast votes on behalf of the Investment Adviser’s clients. If the Investment Adviser determines not to retain an independent fiduciary, or does not desire to follow the advice of such independent fiduciary, the Oversight Committee shall determine how to vote the proxy after consulting with the Investment Adviser’s Portfolio Management Group and/or the Investment Adviser’s Legal and Compliance Department and concluding that the vote cast is in its client’s best interest notwithstanding the conflict. A copy of the Fund’s Proxy Voting Policy and Procedures are attached as Exhibit 99.PROXYPOL, a copy of the Fund’s Global Corporate Governance & Engagement Principles are attached as Exhibit 99.GLOBAL.CORP.GOV and a copy of the Fund’s Corporate Governance and Proxy Voting Guidelines for U.S. Securities are attached as Exhibit 99.US.CORP.GOV. Information on how the Fund voted proxies relating to portfolio securities during the most recent 12-month period ended June 30 is available without charge, (i) at www.blackrock.com and (ii) on the SEC’s website at http://www.sec.gov. |
| Item 8 – | Portfolio Managers of Closed-End Management Investment Companies |
(a)(1) As of the date of filing this Report:
The registrant is managed by a team of investment professionals comprised of David Delbos, Managing Director at BlackRock, Mitchell Garfin, Managing Director at BlackRock, Carly Wilson, Managing Director at BlackRock, and Abigail Parzanese, Director at BlackRock. Each is jointly responsible for the day-to-day management of the registrant’s portfolio, which includes setting the registrant’s overall investment strategy, overseeing the management of the registrant and/or selection of its investments. Messrs. Delbos and Garfin and Mses. Wilson and Parzanese have been members of the registrant’s portfolio management team since 2018.
5
| | |
| Portfolio Manager | | Biography |
| David Delbos | | Managing Director of BlackRock, Inc. since 2012; Director of BlackRock, Inc. from 2007 to 2011; Vice President of BlackRock, Inc. from 2005 to 2006. |
| Mitchell Garfin, CFA | | Managing Director of BlackRock, Inc. since 2009; Director of BlackRock, Inc. from 2005 to 2008. |
| Carly Wilson | | Managing Director of BlackRock, Inc. since 2019; Director of BlackRock, Inc. from 2016 to 2018; Vice President of BlackRock, Inc. from 2011 to 2015; Associate at BlackRock, Inc. from 2009 to 2010; Associate at R3 Capital Partners from 2008 to 2009; Associate at Lehman Brothers from 2004 to 2008. |
| Abigail Parzanese | | Director of BlackRock, Inc. since 2022; Vice President of BlackRock, Inc. from 2019 to 2021; Associate of BlackRock, Inc. from 2016 to 2018; Associate at Morgan Stanley from 2012 to 2016; Analyst at Morgan Stanley from 2012 to 2014. |
(a)(2) As of December 31, 2021:
| | | | | | | | | | | | |
| | | (ii) Number of Other Accounts Managed and Assets by Account Type | | (iii) Number of Other Accounts and Assets for Which Advisory Fee is Performance-Based |
(i) Name of Portfolio Manager | | Other Registered Investment Companies | | Other Pooled Investment Vehicles | | Other Accounts | | Other Registered Investment Companies | | Other Pooled Investment Vehicles | | Other Accounts |
| | | | | | | |
David Delbos | | 28 | | 26 | | 149 | | 0 | | $0 | | 5 |
| | | $35.22 Billion | | $11.93 Billion | | $16.41 Billion | | $0 | | 0 | | $818.5 Million |
| | | | | | | |
Mitchell Garfin, CFA | | 26 | | 28 | | 156 | | 0 | | $0 | | 5 |
| | | $36.52 Billion | | $12.05 Billion | | $16.13 Billion | | $0 | | 0 | | $818.5 Million |
| | | | | | | |
Carly Wilson | | 13 | | 12 | | 11 | | 0 | | $0 | | $0 |
| | | $9.00 Billion | | $1.51 Billion | | $1.18 Billion | | $0 | | 0 | | 0 |
| | | | | | | |
Abigail Parzanese | | 14 | | 11 | | 13 | | 0 | | $0 | | $0 |
| | | $8.84 Billion | | $1.50 Billion | | $3.22 Billion | | $0 | | 0 | | 0 |
(iv) Portfolio Manager Potential Material Conflicts of Interest
BlackRock has built a professional working environment, firm-wide compliance culture and compliance procedures and systems designed to protect against potential incentives that may favor one account over another. BlackRock has adopted policies and procedures that address the allocation of investment opportunities, execution of portfolio transactions, personal trading by employees and other potential conflicts of interest that are designed to ensure that all client accounts are treated equitably over time. Nevertheless, BlackRock furnishes investment management and advisory services to numerous clients in addition to the Fund, and BlackRock may, consistent with applicable law, make investment recommendations to other clients or accounts (including accounts which are hedge funds or have performance or higher fees paid to BlackRock, or in which portfolio managers have a personal interest in the receipt of such fees), which may be the same as or different from those made to the Fund. In addition, BlackRock, Inc., its affiliates and significant shareholders and any officer, director, shareholder or employee may or may not have an interest in the securities whose purchase and sale BlackRock recommends to the Fund. BlackRock, Inc., or any of its
6
affiliates or significant shareholders, or any officer, director, shareholder, employee or any member of their families may take different actions than those recommended to the Fund by BlackRock with respect to the same securities. Moreover, BlackRock may refrain from rendering any advice or services concerning securities of companies of which any of BlackRock, Inc.’s (or its affiliates’ or significant shareholders’) officers, directors or employees are directors or officers, or companies as to which BlackRock, Inc. or any of its affiliates or significant shareholders or the officers, directors and employees of any of them has any substantial economic interest or possesses material non-public information. Certain portfolio managers also may manage accounts whose investment strategies may at times be opposed to the strategy utilized for a fund. It should also be noted that Messrs. Delbos and Garfin and Mses. Wilson and Parzanese may be managing hedge fund and/or long only accounts, or may be part of a team managing hedge fund and/or long only accounts, subject to incentive fees. Messrs. Delbos and Garfin and Mses. Wilson and Parzanese may therefore be entitled to receive a portion of any incentive fees earned on such accounts.
As a fiduciary, BlackRock owes a duty of loyalty to its clients and must treat each client fairly. When BlackRock purchases or sells securities for more than one account, the trades must be allocated in a manner consistent with its fiduciary duties. BlackRock attempts to allocate investments in a fair and equitable manner among client accounts, with no account receiving preferential treatment. To this end, BlackRock, Inc. has adopted policies that are intended to ensure reasonable efficiency in client transactions and provide BlackRock with sufficient flexibility to allocate investments in a manner that is consistent with the particular investment discipline and client base, as appropriate.
(a)(3) As of December 31, 2022:
Portfolio Manager Compensation Overview
The discussion below describes the portfolio managers’ compensation as of December 31, 2022.
BlackRock’s financial arrangements with its portfolio managers, its competitive compensation and its career path emphasis at all levels reflect the value senior management places on key resources. Compensation may include a variety of components and may vary from year to year based on a number of factors. The principal components of compensation include a base salary, a performance-based discretionary bonus, participation in various benefits programs and one or more of the incentive compensation programs established by BlackRock.
Base Compensation. Generally, portfolio managers receive base compensation based on their position with the firm.
Discretionary Incentive Compensation. Discretionary incentive compensation is a function of several components: the performance of BlackRock, Inc., the performance of the portfolio manager’s group within BlackRock, the investment performance, including risk-adjusted returns, of the firm’s assets under management or supervision by that portfolio manager relative to predetermined benchmarks, and the individual’s performance and contribution to the overall performance of these portfolios and BlackRock. In most cases, these benchmarks are the same as the benchmark or benchmarks against which the performance of the Funds or other accounts managed by the portfolio managers are measured. Among other things, BlackRock’s Chief Investment Officers make a subjective determination with respect to each portfolio manager’s compensation based on the performance of the Funds and other accounts
7
managed by each portfolio manager relative to the various benchmarks. Performance of fixed income funds is measured on a pre-tax and/or after-tax basis over various time periods including 1-, 3- and 5- year periods, as applicable. With respect to these portfolio managers, such benchmarks for the Fund and other accounts are:
| | |
| Portfolio Manager | | Benchmarks |
| Carly Wilson | | A combination of market-based indices (e.g. ICE BofA 3-Month U.S. Treasury Bill Index). |
David Delbos
Mitchell Garfin, CFA | | A combination of market-based indices (e.g., The Bloomberg U.S. Corporate High Yield 2% Issuer Cap Index), certain customized indices and certain fund industry peer groups. |
| Abigail Parzanese | | A combination of market-based indices (e.g., S&P Leveraged
All Loan Index), certain customized indices and certain fund industry
peer groups. |
Distribution of Discretionary Incentive Compensation. Discretionary incentive compensation is distributed to portfolio managers in a combination of cash, deferred BlackRock, Inc. stock awards, and/or deferred cash awards that notionally track the return of certain BlackRock investment products.
Portfolio managers receive their annual discretionary incentive compensation in the form of cash. Portfolio managers whose total compensation is above a specified threshold also receive deferred BlackRock, Inc. stock awards annually as part of their discretionary incentive compensation. Paying a portion of discretionary incentive compensation in the form of deferred BlackRock, Inc. stock puts compensation earned by a portfolio manager for a given year “at risk” based on BlackRock’s ability to sustain and improve its performance over future periods. In some cases, additional deferred BlackRock, Inc. stock may be granted to certain key employees as part of a long-term incentive award to aid in retention, align interests with long-term shareholders and motivate performance. Deferred BlackRock, Inc. stock awards are generally granted in the form of BlackRock, Inc. restricted stock units that vest pursuant to the terms of the applicable plan and, once vested, settle in BlackRock, Inc. common stock. The portfolio managers of this Fund have deferred BlackRock, Inc. stock awards.
For certain portfolio managers, a portion of the discretionary incentive compensation is also distributed in the form of deferred cash awards that notionally track the returns of select BlackRock investment products they manage, which provides direct alignment of portfolio manager discretionary incentive compensation with investment product results. Deferred cash awards vest ratably over a number of years and, once vested, settle in the form of cash. Only portfolio managers who manage specified products and whose total compensation is above a specified threshold are eligible to participate in the deferred cash award program.
Other Compensation Benefits. In addition to base salary and discretionary incentive compensation, portfolio managers may be eligible to receive or participate in one or more of the following:
8
Incentive Savings Plans — BlackRock, Inc. has created a variety of incentive savings plans in which BlackRock, Inc. employees are eligible to participate, including a 401(k) plan, the BlackRock Retirement Savings Plan (RSP), and the BlackRock Employee Stock Purchase Plan (ESPP). The employer contribution components of the RSP include a company match equal to 50% of the first 8% of eligible pay contributed to the plan capped at $5,000 per year, and a company retirement contribution equal to 3-5% of eligible compensation up to the Internal Revenue Service limit ($305,000 for 2022). The RSP offers a range of investment options, including registered investment companies and collective investment funds managed by the firm. BlackRock, Inc. contributions follow the investment direction set by participants for their own contributions or, absent participant investment direction, are invested into a target date fund that corresponds to, or is closest to, the year in which the participant attains age 65. The ESPP allows for investment in BlackRock, Inc. common stock at a 5% discount on the fair market value of the stock on the purchase date. Annual participation in the ESPP is limited to the purchase of 1,000 shares of common stock or a dollar value of $25,000 based on its fair market value on the purchase date. All of the eligible portfolio managers are eligible to participate in these plans.
(a)(4) Beneficial Ownership of Securities – As of December 31, 2022.
| | |
| Portfolio Manager | | Dollar Range of Equity Securities of the Fund Beneficially Owned |
| David Delbos | | $100,001 - $500,000 |
| Mitchell Garfin, CFA | | $10,001 - $50,000 |
| Carly Wilson | | $10,001 - $50,000 |
| Abigail Parzanese | | $1 - $10,000 |
(b) Not Applicable
| Item 9 – | Purchases of Equity Securities by Closed-End Management Investment Company and Affiliated Purchasers – Not Applicable due to no such purchases during the period covered by this report. |
| Item 10 – | Submission of Matters to a Vote of Security Holders – There have been no material changes to these procedures. |
| Item 11 – | Controls and Procedures |
(a) The registrant’s principal executive and principal financial officers, or persons performing similar functions, have concluded that the registrant’s disclosure controls and procedures (as defined in Rule 30a-3(c) under the Investment Company Act of 1940, as amended (the “1940 Act”)) are effective as of a date within 90 days of the filing of this report based on the evaluation of these controls and procedures required by Rule 30a-3(b) under the 1940 Act and Rule 13a-15(b) under the Securities Exchange Act of 1934, as amended.
(b) There were no changes in the registrant’s internal control over financial reporting (as defined in Rule 30a-3(d) under the 1940 Act) that occurred during the period covered by this report that have
9
materially affected, or are reasonably likely to materially affect, the registrant’s internal control over financial reporting.
| Item 12 – | Disclosure of Securities Lending Activities for Closed-End Management Investment Companies – Not Applicable |
| Item 13 – | Exhibits attached hereto |
(a)(1) Code of Ethics – See Item 2
(a)(2) Section 302 Certifications are attached
(a)(3) Any written solicitation to purchase securities under Rule 23c-1 – Not Applicable
(a)(4) Change in Registrant’s independent public accountant – Not Applicable
(b) Section 906 Certifications are attached
(c) Notices to the registrant’s common shareholders in accordance with the order under Section 6(c) of the 1940 Act granting an exemption from Section 19(b) of the 1940 Act and Rule 19b-1 under the 1940 Act, dated May 9, 20091
1 The Fund has received exemptive relief from the Securities and Exchange Commission permitting it to make periodic distributions of long-term capital gains with respect to its outstanding common stock as frequently as twelve times each year, and as frequently as distributions are specified by or in accordance with the terms of its outstanding preferred stock. This relief is conditioned, in part, on an undertaking by the Fund to make the disclosures to the holders of the Fund’s common shares, in addition to the information required by Section 19(a) of the 1940 Act and Rule 19a-1 thereunder. The Fund is likewise obligated to file with the SEC the information contained in any such notice to shareholders and, in that regard, has attached hereto copies of each such notice made during the period
10
Pursuant to the requirements of the Securities Exchange Act of 1934 and the Investment Company Act of 1940, the registrant has duly caused this report to be signed on its behalf by the undersigned, thereunto duly authorized.
BlackRock Floating Rate Income Strategies Fund, Inc.
| | | | |
| | By: | | /s/ John M. Perlowski |
| | | | John M. Perlowski |
| | | | Chief Executive Officer (principal executive officer) of |
| | | | BlackRock Floating Rate Income Strategies Fund, Inc. |
Date: February 23, 2023
Pursuant to the requirements of the Securities Exchange Act of 1934 and the Investment Company Act of 1940, this report has been signed below by the following persons on behalf of the registrant and in the capacities and on the dates indicated.
| | | | |
| | By: | | /s/ John M. Perlowski |
| | | | John M. Perlowski |
| | | | Chief Executive Officer (principal executive officer) of |
| | | | BlackRock Floating Rate Income Strategies Fund, Inc. |
Date: February 23, 2023
| | | | |
| | By: | | /s/ Trent Walker |
| | | | Trent Walker |
| | | | Chief Financial Officer (principal financial officer) of |
| | | | BlackRock Floating Rate Income Strategies Fund, Inc. |
Date: February 23, 2023
11