UNITED STATES
SECURITIES AND EXCHANGE COMMISSION
Washington, D.C. 20549
|
FORM N-CSR
CERTIFIED SHAREHOLDER REPORT OF REGISTERED
MANAGEMENT INVESTMENT COMPANIES
Investment Company Act file number 811- 21416
John Hancock Tax-Advantaged Dividend Income Fund
(Exact name of registrant as specified in charter)
601 Congress Street, Boston, Massachusetts 02210
(Address of principal executive offices) (Zip code)
Alfred P. Ouellette
Senior Attorney and Assistant Secretary
601 Congress Street
|
Boston, Massachusetts 02210
(Name and address of agent for service)
|
Registrant's telephone number, including area code: 617-663-4324
| Date of fiscal year end: | December 31 | |
| Date of reporting period: | December 31, 2005 | |
ITEM 1. REPORT TO SHAREHOLDERS.
|


| Table of contents |
|
| Your fund at a glance |
| page 1 |
|
| Managers’ report |
| page 2 |
|
| Fund’s investments |
| page 6 |
|
| Financial statements |
| page 11 |
|
| Trustees & officers |
| page 33 |
|
| For more information |
| page 37 |
|
To Our Shareholders,
The mutual fund industry has seen enormous growth over the last several decades. A good half of all American households are now invested in at least one mutual fund and the industry has grown to more than $8 trillion invested in some 7,000–8,000 mutual funds. With this growth, investors and their financial professionals have had access to an increasing array of investment choices -- and greater challenges as they try to find the best-performing funds to fit their investment objectives.
Morningstar, Inc., a major independent analyst of the mutual fund industry, has provided investors and their advisors with an important evaluation tool since 1985, when it launched its “star” rating. Based on certain measurements, the Morningstar Rating for funds reflects each fund’s risk-adjusted return compared to a peer group, designating the results with a certain number of stars, from five stars for the best down to one star. The star ranking system has become the gold standard, with 4- and 5-star funds accounting for the bulk of fund sales.
As good, and important, as this ranking measurement has been, we have long taken issue with part of the process that adjusts performance on broker-sold Class A shares for “loads” -- or up-front commissions. We have argued that this often does not accurately reflect an A share investor’s experience, since they increasingly are purchasing A shares in retirement plans and fee-based platforms that waive the up-front fee.
We are pleased to report that Morningstar has acknowledged this trend and has added a new rating for Class A shares on a no-load basis, called the “Load-Waived A Share” rating, that captures the experience of an investor who is not paying a front-end load. This new rating will better assist our plan sponsors, 401(k) plan participants and clients of financial professionals who invest via fee-based platforms or commit to invest more than a certain dollar amount, in evaluating their choice of mutual funds.
Since being implemented in early December 2005, the impact on our funds has been terrific. Under the new load-waived rating, 11 of our 32 open-end retail mutual funds increased their ratings to either a 4- or 5-star rank. In total, 12 of our funds now have 4- or 5-star rankings on their load-waived A shares, as of December 31, 2005.
We commend Morningstar for its move and urge our shareholders to consider this another tool at your disposal as you and your financial professional are evaluating investment choices.
Sincerely,

Keith F. Hartstein,
President and Chief Executive Officer
|
This commentary reflects the CEO’s views as of December 31, 2005. They are subject to change at any time.
The Fund seeks to
provide a high level
of after-tax total
return from divi-
dend income and
capital appreciation.
To meet its objec-
tives, the Fund
normally invests at
least 80% of its
assets in dividend-
paying common and
preferred securities
that the Adviser
believes are eligible
to pay dividends
that qualify for U.S.
taxation rates
applicable to long-
term capital gains,
which currently are
taxed at a maximum
rate of 15%.
|
Over the last twelve months
* Dividend-paying securities posted decent gains, fueled by strong investor demand.
* Utility common stocks and preferred stocks performed best, driven in part by strong demand for high-quality and high income-producing investments.
* Bank stocks lagged, as the difference between what banks pay depositors and what they collect from loans shrunk.
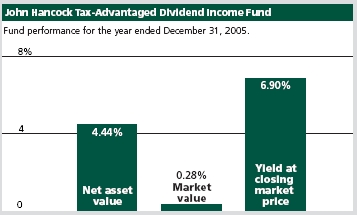
The total returns for the Fund include all distributions reinvested. The performance data contained within this material represents past performance, which does not guarantee future results.
The yield on closing market price is calculated by dividing the current annualized distribution per share by the closing market price.
Top 10 issuers
| 2.8% | Bank of America Corp. |
| 2.6% | NSTAR |
| 2.4% | Dominion Resources, Inc. |
| 2.4% | Public Service Enterprise Group, Inc. |
| 2.4% | Ameren Corp. |
| 2.2% | Regions Financial Corp. |
| 2.1% | DTE Energy Co. |
| 2.1% | Progress Energy, Inc. |
| 2.0% | Xcel Energy, Inc. |
| 2.0% | KeyCorp. |
As a percentage of net assets plus the value of preferred shares on December 31, 2005.
1
BY GREGORY K. PHELPS, JAMES K. SCHMIDT, CFA, MARK T. MALONEY AND
LISA A. WELCH, PORTFOLIO MANAGERS, SOVEREIGN ASSET MANAGEMENT LLC
|
JOHN HANCOCK
Tax-Advantaged
Dividend Income Fund
|
Dividend-paying securities posted decent gains for the 12-month period ended December 31, 2005. Utility common stocks led the way, and were among the overall stock market’s best-performing industry groups in the first nine months of the period. Robust demand for utility common stocks stemmed from investors seeking the equities’ high dividend payouts, which were very attractive given other alternatives in the then-low interest rate environment. Also boosting utility commons were those companies’ success in improving their fundamentals by reducing debt loads and improving their balance sheets. A spate of merger and acquisition activity in the sector also helped power their gains. In October and November, however, utility common stocks came under pressure due to a weak Treasury market, and also were burdened by falling energy prices and a robust round of profit taking. But they began to recover in December, as energy prices moved higher. Preferred stocks followed a similar path during the year, performing well through the fall in response to strong investor demand, slumping in October and November as the Treasury market sold off and rallying again in December. Banking stocks -- which are a key element of our strategy -- struggled during the period as the difference between what banks pay depositors and what they collect from loans shrunk as the gap between short- and long-term interest rates narrowed.
“Dividend-paying securities
posted decent gains for the
12-month period ended
December 31, 2005.”
|
Performance
For the 12 months ended December 31, 2005, John Hancock Tax-Advantaged Dividend Income Fund returned 4.44% at net asset value and 0.28% at market value. The difference in the Fund’s net asset value (NAV) performance and its market performance stems from the fact that the market share price is subject to the dynamics of secondary market trading, which could cause it to trade at a
2

discount or premium to the Fund’s NAV share price at any time. Over the same 12-month period, the Standard & Poor’s 500 Index returned 4.91% and the average closed-end value fund returned 6.63% at net asset value, according to Lipper, Inc.
Energy producers shine
High energy prices helped bolster our holdings in the common stocks of utilities that owned energy production operations. Investments in Dominion Resources, Inc. for example, performed quite well in large part because of strong financial results from the company’s energy exploration and production business. Another chart topper was National Fuel Gas Co., which benefited from its pipeline and storage and exploration and production operations. Also performing well was electric utility Black Hills Corp., which benefited from strong results in its coal mining and oil and gas exploration and production businesses.
Preferred stock holdings: leaders and laggards
Among our preferred-stock holdings, some of the better performers were those with a certain tax advantage for corporations known as the dividends received deduction (DRD). As mentioned earlier, the demand for tax-advantaged investments was strong overall, and particularly for DRD-eligible securities. At the same time, new DRD issuance was light compared with other preferred stocks. The DRD tax advantage, coupled with the strong fundamental performance of the underlying issuer, helped boost our holdings in insurance giant MetLife, Inc. Another positive contributor was Southern California Edison Co. Like MetLife, our holdings in Southern California Edison were helped by the company’s strong fundamental performance, as well as the preferred stock’s relatively high coupon, which helped cushion it as the market declined. Detracting from performance were some holdings where new issue supply became a factor. Holdings such as Lehman Brothers Holdings, Inc. were dragged lower by the fact that newly issued preferred securities offered more tempting yields, which ultimately suppressed prices for existing securities.
“High energy prices helped
bolster our holdings in the com-
mon stocks of utilities that owned
energy production operations.”
|
3
| Sector |
| distribution1 |
|
| |
| Multi-utilities & |
| unregulated |
| power -- 29% |
|
| |
| Electric |
| utilities -- 19% |
|
| |
| Regional |
| banks -- 15% |
|
| |
| Diversified |
| banks -- 9% |
|
| |
| Gas utilities -- 9% |
|
| |
| Other diversified |
| financial |
| services -- 4% |
|
| |
| Investment banking & |
| brokerage -- 3% |
|
| |
| Oil & gas exploration |
| & production -- 3% |
|
| |
| Integrated |
| telecommunication |
| services -- 2% |
|
| |
| Thrifts & mortgage |
| finance -- 2% |
|
| |
| Multi-line |
| insurance -- 2% |
|
| |
| Integrated |
| oil & gas -- 1% |
Financial stocks mixed
Having a significant exposure to the common stocks of regional banks was a drawback for the Fund, as they struggled with margin compression which led to tough spread-revenue growth. What’s more, bank merger activity slowed down, with fewer deals done in 2005 than in the prior year. Nevertheless, the Fund benefited from a bank takeout in 2005, as TD Bank North announced its planned acquisition of Fund holding Hudson United Bancorp. One of the Fund’s detractors was First Horizon National Corp., which missed quarterly earnings targets. Although the bank industry exposure generally held us back, we benefited from many excellent stock picks. For instance, one of the Fund’s better performers was Colonial BancGroup, Inc., which was perceived to be asset sensitive -- that is, improving spread income as interest rates rise. We also saw good gains in the common stocks of diversified bank holdings, including Wells Fargo & Co., PNC Financial Services Group, Inc. and Wachovia Corp., which were boosted by diverse sources of income that held up despite rising interest rates.
Outlook
We’re approaching the coming year with cautious optimism. In our view, there are a number of signs to suggest that we’re at or near the end of the current cycle of interest rate hikes. The Treasury yield curve -- a commonly used, although not entirely foolproof, economic forecasting tool that plots differences between yields on long- and short-term Treasuries -- was quite flat at the end of period. That means that short-term and long-term yields were roughly the same, indicating that investors are nervous about near-term bets and so are demanding relatively more return on
4

them. Several other signs suggest that the Federal Reserve Board may only raise short-term interest rates one or two more times, if at all, including a dip in inflation expectations and the better performance of bank stocks toward the end of the period. If interest rates do stabilize, we believe that dividend-paying stocks are likely to benefit. Despite the recent weakness in their stock prices, utility companies continue to post strong fundamental performances and could also benefit to the extent that energy prices remain high. Financial stocks typically start a period of outperformance prior to when the Fed stops raising rates, which we believe could happen in the first half of 2006. We also believe that long-term demand for dividend-paying securities, including preferred and utility common stocks, will provide a strong underpinning for them in the coming year. The first wave of the Baby Boomer generation hits 60 years old in January 2006, an event we expect to further fuel demand for income-producing investments.
“...there are a number of signs to
suggest that we’re at or near the
end of the current cycle of interest
rate hikes.”
|
This commentary reflects the views of the portfolio managers through the end of the Fund’s period discussed in this report. The managers’ statements reflect their own opinions. As such, they are in no way guarantees of future events, and are not intended to be used as investment advice or a recommendation regarding any specific security. They are also subject to change at any time as market and other conditions warrant.
1 As a percentage of the Fund’s portfolio on December 31, 2005.
5
F I N A N C I A L S TAT E M E N T S
Securities owned
by the Fund on
December 31, 2005
|
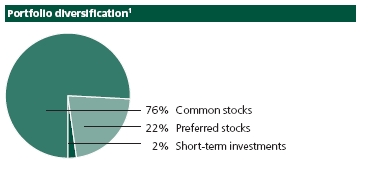
This schedule is divided into three main categories: common stocks, preferred stocks and short-term investments. Common stocks and preferred stocks are further broken down by industry group. Short-term investments, which represent the Fund’s cash position, are listed last.
| Issuer | Shares | Value |
|
| Common stocks 110.74% | | $928,519,085 |
| (Cost $872,508,155) | | |
Diversified Banks 10.75% | | 90,154,990 |
|
| Bank of America Corp. | 730,000 | 33,689,500 |
|
| Comerica, Inc. | 296,000 | 16,800,960 |
|
| U.S. Bancorp. | 647,000 | 19,338,830 |
|
| Wachovia Corp. | 230,000 | 12,157,800 |
|
| Wells Fargo & Co. | 130,000 | 8,167,900 |
Electric Utilities 16.95% | | 142,078,907 |
|
| American Electric Power Co., Inc. | 335,500 | 12,443,695 |
|
| Black Hills Corp. | 454,000 | 15,712,940 |
|
| Cinergy Corp. | 539,100 | 22,890,186 |
|
| Empire District Electric Co. (The) | 330,400 | 6,717,032 |
|
| Great Plains Energy, Inc. | 67,000 | 1,873,320 |
|
| Pinnacle West Capital Corp. | 230,000 | 9,510,500 |
|
| Progress Energy, Inc. | 569,600 | 25,016,832 |
|
| Scottish Power Plc, American Depositary Receipt (United Kingdom) | 610,000 | 22,801,800 |
|
| Southern Co. (The) | 593,400 | 20,490,102 |
|
| Westar Energy, Inc. | 215,000 | 4,622,500 |
Gas Utilities 11.27% | | 94,513,639 |
|
| Atmos Energy Corp. | 756,200 | 19,782,192 |
|
| National Fuel Gas Co. | 466,000 | 14,534,540 |
|
| Northwest Natural Gas Co. | 325,000 | 11,108,500 |
|
| ONEOK, Inc. | 821,100 | 21,865,893 |
|
| Peoples Energy Corp. | 585,200 | 20,522,964 |
|
| Piedmont Natural Gas Co., Inc. | 100,000 | 2,416,000 |
|
| WGL Holdings, Inc. | 142,500 | 4,283,550 |
Integrated Oil & Gas 0.97% | | 8,174,880 |
|
| ChevronTexaco Corp. | 144,000 | 8,174,880 |
See notes to
financial statements.
|
6
F I N A N C I A L S TAT E M E N T S
| Issuer | | Shares | Value |
Integrated Telecommunication Services 2.96% | | $24,813,286 |
|
| AT&T, Inc. | | 670,000 | 16,408,300 |
|
| Verizon Communications, Inc. | | 279,050 | 8,404,986 |
Multi-Utilities & Unregulated Power 40.57% | | | 340,189,481 |
|
| Alliant Energy Corp. | | 50,000 | 1,402,000 |
|
| Ameren Corp. | | 561,100 | 28,750,764 |
|
| CH Energy Group, Inc. | | 373,600 | 17,148,240 |
|
| Consolidated Edison, Inc. | | 525,100 | 24,327,883 |
|
| Dominion Resources, Inc. | | 385,000 | 29,722,000 |
|
| DTE Energy Co. | | 584,914 | 25,262,436 |
|
| Duke Energy Corp. | | 533,400 | 14,641,830 |
|
| Energy East Corp. | | 561,000 | 12,790,800 |
|
| KeySpan Corp. | | 690,647 | 24,649,191 |
|
| NiSource, Inc. | | 642,700 | 13,406,722 |
|
| NSTAR | | 1,086,000 | 31,168,200 |
|
| OGE Energy Corp. | | 884,800 | 23,703,792 |
|
| Public Service Enterprise Group, Inc. | | 454,700 | 29,541,859 |
|
| SCANA Corp. | | 257,500 | 10,140,350 |
|
| TECO Energy, Inc. | | 40,000 | 687,200 |
|
| Vectren Corp. | | 689,900 | 18,737,684 |
|
| WPS Resources Corp. | | 343,000 | 18,971,330 |
|
| Xcel Energy, Inc. | | 820,000 | 15,137,200 |
Other Diversified Financial Services 2.43% | | | 20,339,132 |
|
| Citigroup, Inc. | | 187,000 | 9,075,110 |
|
| JPMorgan Chase & Co. | | 283,800 | 11,264,022 |
Regional Banks 21.89% | | | 183,518,270 |
|
| AmSouth Bancorp. | | 775,000 | 20,312,750 |
|
| BB&T Corp. | | 495,000 | 20,745,450 |
|
| Colonial BancGroup, Inc. (The) | | 275,000 | 6,550,500 |
|
| F.N.B. Corp. | | 190,000 | 3,298,400 |
|
| First Horizon National Corp. | | 315,000 | 12,108,600 |
|
| FirstMerit Corp. | | 365,000 | 9,457,150 |
|
| Hudson United Bancorp. | | 195,000 | 8,127,600 |
|
| KeyCorp | | 749,000 | 24,664,570 |
|
| National City Corp. | | 505,000 | 16,952,850 |
|
| PNC Financial Services Group, Inc. | | 370,000 | 22,877,100 |
|
| Regions Financial Corp. | | 795,000 | 27,157,200 |
|
| Susquehanna Bancshares, Inc. | | 275,000 | 6,512,000 |
|
| Whitney Holding Corp. | | 172,500 | 4,754,100 |
See notes to
financial statements.
|
7
F I N A N C I A L S TAT E M E N T S
| Issuer | | Shares | Value |
Thrifts & Mortgage Finance 2.95% | | | $24,736,500 |
|
| People’s Bank | | 225,000 | 6,988,500 |
|
| Washington Mutual, Inc. | | 408,000 | 17,748,000 |
| |
| | Credit | | |
| Issuer, description | rating (A) | Shares | Value |
|
| Preferred stocks 31.84% | | | $266,996,896 |
| (Cost $273,398,941) | | | |
Consumer Finance 0.62% | | | 5,230,644 |
|
| HSBC Finance Corp., 6.36%, Depositary Shares, Ser B | BBB+ | 150,000 | 3,832,500 |
|
| SLM Corp., 6.97%, Ser A | BBB+ | 26,400 | 1,398,144 |
Diversified Banks 3.21% | | | 26,889,909 |
|
| Abbey National Plc, 7.375%, Depositary Shares, Ser B | | | |
| (United Kingdom) | A– | 93,100 | 2,456,909 |
|
| Royal Bank of Scotland Group Plc, 5.75%, Ser L | | | |
| (United Kingdom) | A | 1,060,000 | 24,433,000 |
Electric Utilities 10.57% | | | 88,656,231 |
|
| Alabama Power Co., 5.20% | BBB+ | 304,400 | 7,351,260 |
|
| Alabama Power Co., 5.30% (Class A) | BBB+ | 213,000 | 5,037,450 |
|
| Carolina Power & Light Co., $5.44 | BB+ | 111,493 | 10,368,849 |
|
| Connecticut Light & Power Co., $3.24, Ser 68G | BB+ | 20,686 | 1,064,036 |
|
| Connecticut Light & Power Co., 5.28%, Ser 1967 | BB+ | 18,294 | 858,104 |
|
| Connecticut Light & Power Co., 6.56%, Ser 1968 | BB+ | 7,224 | 369,102 |
|
| Duquesne Light Co., 6.50% | BB+ | 227,000 | 11,554,300 |
|
| Entergy Arkansas, Inc., $1.96 | BB+ | 150,466 | 3,771,054 |
|
| Entergy Arkansas, Inc., 4.56% | BB+ | 9,388 | 740,772 |
|
| Entergy Arkansas, Inc., 4.56%, Ser 1965 | BB+ | 9,818 | 781,452 |
|
| Entergy Arkansas, Inc., $6.08 | Ba1 | 11,372 | 1,110,547 |
|
| Entergy Gulf States, Inc., $7.56 | BB+ | 28,422 | 2,714,301 |
|
| Entergy Louisiana, Inc., 5.16% | Ba1 | 12,982 | 1,141,605 |
|
| Entergy Mississippi, Inc., 4.92% | Ba2 | 8,190 | 686,681 |
|
| Entergy Mississippi, Inc., 6.25% | BB+ | 197,500 | 4,912,812 |
|
| FPL Group Capital Trust I, 5.875% | BBB+ | 318,200 | 7,687,712 |
|
| Interstate Power & Light Co., 7.10%, Ser C | BBB– | 20,600 | 554,912 |
|
| Interstate Power & Light Co., 8.375%, Ser B | Baa3 | 233,000 | 7,689,000 |
|
| Northern Indiana Public Service Co., 4.50% | BB+ | 28,863 | 2,433,512 |
|
| Northern Indiana Public Service Co., 4.88% (G) | BBB | 7,971 | 728,848 |
|
| Ohio Edison Co., 4.56% | BB+ | 15,325 | 1,271,975 |
|
| Southern California Edison Co., 6.125% | BBB– | 50,000 | 5,048,440 |
|
| Union Electric Co., $4.50 | BBB– | 10,370 | 830,118 |
See notes to
financial statements.
|
8
F I N A N C I A L S TAT E M E N T S
| | Credit | | |
| Issuer, description | rating (A) | Shares | Value |
Electric Utilities (continued) | | | |
|
| Wisconsin Power & Light Co., 4.50% | BBB | 4,600 | $387,090 |
|
| Xcel Energy, Inc., $4.08, Ser B | BB+ | 66,070 | 5,317,314 |
|
| Xcel Energy, Inc., $4.56, Ser G | BB+ | 53,700 | 4,244,985 |
Gas Utilities 1.30% | | | 10,871,156 |
|
| Southern Union Co., 7.55% | BB+ | 417,800 | 10,871,156 |
Investment Banking & Brokerage 4.41% | | | 37,000,925 |
|
| Bear Stearns Cos., Inc. (The), 5.49%, Depositary Shares, Ser G | BBB | 243,700 | 11,721,970 |
|
| Bear Stearns Cos., Inc. (The), 5.72%, Depositary Shares, Ser F | BBB | 5,000 | 239,050 |
|
| Bear Stearns Cos., Inc. (The), 6.15%, Depositary Shares, Ser E | BBB | 71,600 | 3,601,480 |
|
| Lehman Brothers Holdings, Inc., 5.67%, Depositary Shares, Ser D | A– | 63,000 | 3,046,050 |
|
| Lehman Brothers Holdings, Inc., 5.94%, Depositary Shares, Ser C | A– | 266,260 | 13,313,000 |
|
| Lehman Brothers Holdings, Inc., 6.50%, Depositary Shares, Ser F | A– | 193,500 | 5,079,375 |
Multi-Line Insurance 2.81% | | | 23,538,280 |
|
| ING Groep N.V., 6.20% (Netherlands) | A | 109,100 | 2,705,680 |
|
| ING Groep N.V., 7.05% (Netherlands) | A | 100,000 | 2,559,000 |
|
| MetLife, Inc., 6.50%, Ser B | BBB | 705,000 | 18,273,600 |
Multi-Utilities & Unregulated Power 1.17% | | | 9,828,831 |
|
| Avista Corp., $6.95, Ser K | BB– | 38,009 | 3,819,904 |
|
| Public Service Electric & Gas Co., 5.05%, Ser D | BB+ | 23,002 | 1,996,574 |
|
| Public Service Electric & Gas Co., 5.28%, Ser E | BB+ | 21,930 | 1,996,727 |
|
| South Carolina Electric & Gas Co., 6.52% | Baa1 | 20,000 | 2,015,626 |
Oil & Gas Exploration & Production 4.12% | | | 34,554,774 |
|
| Anadarko Petroleum Corp., 5.46%, Depositary Shares, Ser B | BBB– | 50,000 | 4,864,065 |
|
| Apache Corp., 5.68%, Depositary Shares, Ser B | BBB | 50,000 | 5,078,125 |
|
| Devon Energy Corp., 6.49%, Ser A | BB+ | 150,000 | 15,328,125 |
|
| Nexen, Inc., 7.35% (Canada) | BB+ | 359,584 | 9,284,459 |
Other Diversified Financial Services 3.36% | | | 28,163,746 |
|
| ABN AMRO Capital Funding Trust V, 5.90% | A | 140,000 | 3,316,600 |
|
| ABN AMRO Capital Funding Trust VII, 6.08% | A | 950,000 | 23,180,000 |
|
| General Electric Capital Corp., 6.10% | AAA | 20,200 | 509,646 |
|
| JPMorgan Chase Capital XI, 5.875%, Ser K | A– | 50,000 | 1,157,500 |
Reinsurance 0.27% | | | 2,262,400 |
|
| RenaissanceRe Holdings Ltd., 6.08%, Ser C (Bermuda) | BBB | 112,000 | 2,262,400 |
See notes to
financial statements.
|
9
F I N A N C I A L S TAT E M E N T S
| | | Interest | Maturity | Credit | Par value | |
| Issuer, description | | rate | date | rating (A) | (000) | Value |
|
| Short-term investments 2.28% | | | | | | $19,100,000 |
| (Cost $19,096,551) | | | | | | |
Government U.S. Agency 2.28% | | | | | | 19,100,000 |
|
| Federal Home Loan Bank, | | | | | | |
| Disc Note | | 3.250% | 01-03-06 | AAA | $19,100 | 19,100,000 |
|
| Total investments 144.86% | | | | | | $1,214,615,981 |
|
| |
| Other assets and liabilities, net 0.46% | | | | | | $3,874,769 |
|
| |
| Fund preferred shares (45.32%) | | | | | | ($380,000,000) |
|
| |
| Total net assets 100.00% | | | | | | $838,490,750 |
(A) Credit ratings are unaudited and are rated by Moody’s Investors Service where Standard & Poor’s ratings are not available, unless indicated otherwise.
(G) Security rated internally by John Hancock Advisers, LLC.
Parenthetical disclosure of a foreign country in the security description represents country of a foreign issuer.
The percentage shown for each investment category is the total value of that category as a percentage of the net assets of the Fund.
See notes to
financial statements.
|
10
F I N A N C I A L S TAT E M E N T S
December 31, 2005
This Statement
of Assets and
Liabilities is the
Fund’s balance
sheet. It shows
the value of
what the Fund
owns, is due
and owes. You’ll
also find the net
asset value for each
common share.
|
| Assets | |
| Investments at value (cost $1,165,003,647) | $1,214,615,981 |
| Cash | 424,572 |
| Receivable for investments sold | 603,325 |
| Dividends receivable | 3,226,945 |
| Other assets | 42,645 |
| Total assets | 1,218,913,468 |
|
| Liabilities | |
| Payable for investments purchased | 247,382 |
| Payable to affiliates | |
| Management fees | 36,813 |
| Other | 50,640 |
| Other payables and accrued expenses | 87,883 |
| Total liabilities | 422,718 |
| Auction Preferred Shares (APS), at value, | |
| unlimited number of shares of beneficial | |
| interest authorized with no par value, | |
| 15,200 shares issued, liquidation | |
| preference of $25,000 per share | 380,000,000 |
|
| Net assets | |
| Common shares capital paid-in | 798,551,773 |
| Accumulated net realized loss on investments | |
| and financial futures contracts | (9,676,342) |
| Net unrealized appreciation of investments | 49,612,334 |
| Distributions in excess of net investment income | 2,985 |
| Net assets applicable to common shares | $838,490,750 |
|
| Net asset value per common share | |
| Based on 42,077,487 shares of beneficial interest | |
| outstanding -- unlimited number of shares authorized | |
| with no par value | $19.93 |
See notes to
financial statements.
|
11
F I N A N C I A L S TAT E M E N T S
OPERATIONS
For the year ended
December 31, 2005
|
This Statement
of Operations
summarizes the
Fund’s investment
income earned and
expenses incurred
in operating the
Fund. It also shows
net gains (losses)
for the period
stated.
|
| Investment income | |
| Dividends | $59,720,184 |
| Interest | 382,099 |
| Total investment income | 60,102,283 |
|
| Expenses | |
| Investment management fees | 9,287,035 |
| APS auction fees | 985,505 |
| Accounting and legal services fees | 306,642 |
| Custodian fees | 190,771 |
| Printing | 120,053 |
| Miscellaneous | 83,749 |
| Trustees’ fees | 80,699 |
| Federal excise tax | 73,641 |
| Professional fees | 65,395 |
| Registration and filing fees | 51,521 |
| Transfer agent fees | 34,702 |
| Compliance fees | 30,625 |
| Total expenses | 11,310,338 |
| Less expense reductions | (2,476,543) |
| Net expenses | 8,833,795 |
| Net investment income | 51,268,488 |
|
| Realized and unrealized gain (loss) | |
| Net realized gain on | |
| Investments | 16,649,823 |
| Financial futures contracts | 422,176 |
| Change in net unrealized appreciation (depreciation) of | |
| Investments | (27,003,827) |
| Financial futures contracts | (10,945) |
| Net realized and unrealized loss | (9,942,773) |
| Distribution to APS | (12,079,966) |
| Increase in net assets from operations | $29,245,749 |
See notes to
financial statements.
|
12
F I N A N C I A L S TAT E M E N T S
These Statements
of Changes in Net
Assets show how
the value of the
Fund’s net assets
has changed
during the last
two periods. The
difference reflects
earnings less
expenses, any
investment
gains and losses,
distributions, if
any, paid to
shareholders and
the net of Fund
share transactions.
|
| | Period | Year |
| | ended | ended |
| | 12-31-041 | 12-31-05 |
|
| Increase in net assets | | |
| From operations | | |
| Net investment income | $40,282,604 | $51,268,488 |
| Net realized gain (loss) | (12,611,373) | 17,071,999 |
| Change in net unrealized | | |
| appreciation (depreciation) | 76,627,106 | (27,014,772) |
| Distributions to APS | (4,363,999) | (12,079,966) |
| Increase in net assets resulting | | |
| from operations | 99,934,338 | 29,245,749 |
| Distributions to common shareholders | | |
| From net investment income | (36,620,037) | (48,826,716) |
| From net realized gain | -- | (3,871,550) |
| | (36,620,037) | (52,698,266) |
| From Fund share transactions | 798,628,966 | -- |
|
| |
| Net assets | | |
| Beginning of period | -- | 861,943,267 |
| End of period2 | $861,943,267 | $838,490,750 |
1 Commencement of operations period from 2-27-04 through 12-31-04.
2 Includes (distributions in excess of) net investment income of ($15,295) and $2,985, accumulated respectively.
See notes to
financial statements.
|
13
F I N A N C I A L H I G H L I G H T S
COMMON SHARES
The Financial Highlights show how the Fund’s net asset value for a
share has changed since the end of the previous period.
| Period ended | 12-31-041 | 12-31-05 |
|
| Per share operating performance | | |
| Net asset value, beginning of period | $19.102 | $20.48 |
| Net investment income3 | 1.14 | 1.22 |
| Net realized and unrealized gain (loss) on investments | 1.54 | (0.23) |
| Distributions to APS | (0.29) | (0.29) |
| Total from investment operations | 2.39 | 0.70 |
| Less distributions to common shareholders | | |
| From net investment income | (0.87) | (1.16) |
| From net realized gain | -- | (0.09) |
| | (0.87) | (1.25) |
| Capital charges | | |
| Offering costs related to common shares | (0.02) | -- |
| Offering costs and underwriting discounts related to APS | (0.12) | -- |
| Net asset value, end of period | $20.48 | $19.93 |
| Per share market value, end of period | $17.99 | $16.81 |
| Total return at market value4,5 (%) | (5.47)6,7 | 0.28 |
|
| Ratios and supplemental data | | |
| Net assets applicable to common shares, end of period (in millions) | $862 | $838 |
| Ratio of expenses to average net assets8 (%) | 0.959 | 1.03 |
| Ratio of adjusted expenses to average net assets10 (%) | 1.239 | 1.32 |
| Ratio of net investment income to average net assets11 (%) | 6.11 | 5.97 |
| Portfolio turnover (%) | 42 | 24 |
|
| Senior securities | | |
| Total value of APS outstanding (in millions) | $380 | $380 |
| Involuntary liquidation preference per unit (in thousands) | $25 | $25 |
| Average market value per unit (in thousands) | $25 | $25 |
| Asset coverage per unit12 | $79,542 | $79,901 |
See notes to
financial statements.
|
14
F I N A N C I A L H I G H L I G H T S
Notes to Financial Highlights
1 Commencement of operations period from 2-27-04 through 12-31-04.
2 Reflects the deduction of a $0.90 per share sales load.
3 Based on the average of the shares outstanding.
4 Assumes dividend reinvestment.
5 Total returns would have been lower had certain expenses not been reduced during the periods shown.
6 Assumes dividend reinvestment and a purchase at $20.01 per share on the inception date and a sale at the current market price on the last day of the period.
7 Not annualized.
8 Ratios calculated on the basis of expenses relative to the average net assets of common shares. Without the exclusion of preferred shares, the annualized ratios of expenses would have been 0.69% and 0.71%, respectively.
9 Annualized.
10 Ratios calculated on the basis of expenses relative to the average net assets of common shares that does not take into consideration expense reductions during the period shown. Without the exclusion of preferred shares, the adjusted annualized ratios of expenses would have been 0.89% and 0.91%, respectively.
11 Ratios calculated on the basis of net investment income relative to the average net assets of common shares. Without the exclusion of preferred shares, the annualized ratios of net investment income would have been 4.42% and 4.14%, respectively.
12 Calculated by subtracting the Fund’s total liabilities from the Fund’s total assets and dividing that amount by the number of APS outstanding as of the applicable 1940 Act Evaluation Date, which may differ from the financial reporting date.
See notes to
financial statements.
|
15
Note A
Accounting policies
John Hancock Tax-Advantaged Dividend Income Fund (the “Fund”) is a diversified closed-end management investment company registered under the Investment Company Act of 1940.
Significant accounting policies
of the Fund are as follows:
Valuation of investments
Securities in the Fund’s portfolio are valued on the basis of market quotations, valuations provided by independent pricing services or at fair value as determined in good faith in accordance with procedures approved by the Trustees. Short-term debt investments which have a remaining maturity of 60 days or less may be valued at amortized cost, which approximates market value. The Fund determines the net asset value of the common shares each business day.
Investment transactions
Investment transactions are recorded as of the date of purchase, sale or maturity. Net realized gains and losses on sales of investments are determined on the identified cost basis.
Expenses
The majority of expenses are directly identifiable to an individual fund. Expenses that are not readily identifiable to a specific fund are allocated in such a manner as deemed equitable, taking into consideration, among other things, the nature and type of expense and the relative size of the funds.
Financial futures contracts
The Fund may buy and sell finan-cial futures contracts. Buying futures tends to increase the Fund’s exposure to the underlying instrument. Selling futures tends to decrease the Fund’s exposure to the underlying instrument or hedge other Fund instruments. At the time the Fund enters into financial futures contracts, it is required to deposit with its custodian a specified amount of cash or U.S. government securities, known as “initial margin,” equal to a certain percentage of the value of the financial futures contract being traded. Each day, the futures contract is valued at the official settlement price of the board of trade or U.S. commodities exchange on which it trades. Subsequent payments to and from the broker, known as “variation margin,” are made on a daily basis as the market price of the financial futures contract fluctuates. Daily variation margin adjustments arising from this “mark to market” are recorded by the Fund as unrealized gains or losses.
When the contracts are closed, the Fund recognizes a gain or loss. Risks of entering into finan-cial futures contracts include the possibility that there may be an illiquid market and/or that a change in the value of the contracts may not correlate with changes in the value of the underlying securities. In addition, the Fund could be prevented from opening or realizing the benefits of closing out financial futures positions because of
16
position limits or limits on daily price fluctuation imposed by an exchange.
The Fund had no outstanding financial futures contracts open on December 31, 2005.
Federal income taxes
The Fund qualifies as a “regulated investment company” by complying with the applicable provisions of the Internal Revenue Code and will not be subject to federal income tax on taxable income that is distributed to shareholders. Therefore, no federal income tax provision is required.
Dividends, interest and
distributions
Dividend income on investment securities is recorded on the ex-dividend date or, in the case of some foreign securities, on the date thereafter when the Fund identifies the dividend. Interest income on investment securities is recorded on the accrual basis. Foreign income may be subject to foreign withholding taxes, which are accrued as applicable.
The Fund records distributions to shareholders from net investment income and net realized gains, if any, on the ex-dividend date. During the year ended December 31, 2004, the tax character of distributions paid was as follows: ordinary income $40,984,036. During the year ended December 31, 2005, the tax character of distributions paid was as follows: ordinary income $60,184,580 and long-term capital gain $4,593,652.
As of December 31, 2005, the components of distributable earnings on a tax basis included $3,808,512 of undistributed ordinary income and $1,796,531 of undistributed long-term gain.
Such distributions and distributable earnings, on a tax basis, are determined in conformity with income tax regulations, which may differ from accounting principles generally accepted in the United States of America. Distributions in excess of tax basis earnings and profits, if any, are reported in the Fund’s financial statements as a return of capital.
Use of estimates
The preparation of these financial statements, in accordance with accounting principles generally accepted in the United States of America, incorporates estimates made by management in determining the reported amount of assets, liabilities, revenues and expenses of the Fund. Actual results could differ from these estimates.
Note B
Management fee and
transactions with
affiliates and others
The Fund has an investment management contract with John Hancock Advisers, LLC (the”Adviser”), a wholly owned subsidiary of John Hancock Financial Services, Inc. Under the investment management contract, the Fund pays a daily management fee to the Adviser at an annual rate of 0.75% of the Fund’s average daily net asset value and the value attributable to the Auction Preferred Shares (collectively, “managed assets”).
The Adviser has contractually agreed to limit the Fund’s management fee to the following: 0.55% of the Fund’s average daily managed assets until the fifth anniversary of the commencement of the Fund’s operations, 0.60% of such assets in the sixth year, 0.65% of such assets in the seventh year and 0.70% of average daily managed assets in the eighth year. Accordingly, the expense reductions related to the reduction in the management fee amounted to $2,476,543 for the year ended December 31, 2005. After the eighth year, the Adviser will no longer waive a portion of the management fee.
Effective December 31, 2005, the investment management teams of the Adviser were reorganized into Sovereign Asset Management LLC (“Sovereign”), a wholly owned subsidiary of John Hancock Life Insurance Company (“JHLICo”). The Adviser remains the principal advisor on the Fund and Sovereign acts as subadviser under the supervision of the Adviser. The restructuring did not have
17
an impact on the Fund, which continues to be managed using the same investment philosophy and process. The Fund is not responsible for payment of the subadvisory fees.
The Fund has an agreement with the Adviser to perform necessary tax, accounting and legal services for the Fund. The compensation for the year amounted to $306,642. The Fund also reimbursed JHLICo for certain compliance costs, included in the Fund’s Statement of Operations.
Mr. James R. Boyle is Chairman of the Adviser, as well as affiliated Trustee of the Fund, and is compensated by the Adviser and/or its affiliates. The compensation of unaffiliated Trustees is borne by the Fund. The unaffiliated Trustees may elect to defer, for tax purposes, their receipt of this compensation under the John Hancock Group of Funds Deferred Compensation Plan. The Fund makes investments into other John Hancock funds, as applicable, to cover its liability for the deferred compensation. Investments to cover the Fund’s deferred compensation liability are recorded on the Fund’s books as an other asset. The deferred compensation liability and the related other asset are always equal and are marked to market on a periodic basis to reflect any income earned by the investments, as well as any unrealized gains or losses. The Deferred Compensation Plan investments had no impact on the operations of the Fund.
The Fund is listed for trading on the New York Stock Exchange (“NYSE”) and has filed with the NYSE its chief executive officer certification regarding compliance with the NYSE’s listing standards. The Fund also files with the Securities and Exchange Commission the certification of its chief executive officer and chief financial officer required by Section 302 of the Sarbanes-Oxley Act.
Note C
Fund share transactions
This listing illustrates the number of Fund common shares sold, offering costs and underwriting discount charged to capital paid-in, reclassification of capital accounts and the number of common shares outstanding at the end of the period, along with the corresponding dollar value.
| | Period ended 12-31-041 | Year ended 12-31-05 |
| | Shares | Amount | Shares | Amount |
| Beginning of period | -- | -- | 42,077,487 | $798,628,966 |
| Shares sold | 42,077,487 | $803,680,0022 | -- | -- |
| Offering cost related to | | | | |
| common shares | -- | (854,726) | -- | -- |
| Offering costs and | | | | |
| underwriting discount | | | | |
| related to Auction | | | | |
| Preferred Shares | -- | (4,196,310) | -- | -- |
| Reclassification of | | | | |
| capital accounts | -- | -- | -- | (77,193) |
| Net increase | 42,077,487 | $798,628,966 | 42,077,487 | $798,551,773 |
1 Commencement of operations period from 2-27-04 through 12-31-04.
2 Net of $0.90 per share sales load of the initial offering price of $20.00 per share.
18
Auction preferred shares
The Fund issued total of 15,200 Auction Preferred Shares (3,800 shares of Series M, 3,800 shares of Series W, 3,800 of shares of Series TH and 3,800 shares of Series F) (collectively, the “APS”) on May 3, 2004, in a public offering. The underwriting discount of $3,800,000 and offering costs of $396,310 incurred in connection with the preferred shares and offering cost of $854,726 related to common shares were charged to capital paid-in of common shares during the period ended December 31, 2004.
Dividends on the APS, which accrue daily, are cumulative at a rate that was established at the offering of the APS and has been reset every 7 days thereafter by an auction (except for the Series TH, which reset its rate on October 27, 2004, at which time the Fund elected a Special Dividend Payment of 182 days for the subsequent distributions). During the year ended December 31, 2005, dividend rates on APS ranged as follows: Series M from 2.25% to 4.25%, Series W from 2.19% to 4.30%, Series TH from 2.45% to 4.35% and Series F from 2.15% to 4.25% . Accrued dividends on APS, if any, are included in the value of APS on the Fund’s Statement of Assets and Liabilities.
The APS are redeemable at the option of the Fund, at a redemption price equal to $25,000 per share, plus accumulated and unpaid dividends on any dividend payment date. The APS are also subject to mandatory redemption at a redemption price equal to $25,000 per share, plus accumulated and unpaid dividends, if the Fund is in default on its asset coverage requirements with respect to the APS as defined in the Fund’s by-laws. If the dividends on the APS shall remain unpaid in an amount equal to two full years’ dividends, the holders of the APS, as a class, have the right to elect a majority of the Board of Trustees. In general, the holders of the APS and the common shareholders have equal voting rights of one vote per share, except that the holders of the APS, as a class, vote to elect two members of the Board of Trustees, and separate class votes are required on certain matters that affect the respective interests of the APS and common shareholders.
Note D
Investment
transactions
Purchases and proceeds from sales or maturities of securities, other than short-term securities and obligations of the U.S. government, during the year ended December 31, 2005, aggregated $287,711,344 and $304,660,886, respectively.
The cost of investments owned on December 31, 2005, including short-term investments, for federal income tax purposes, was $1,180,285,032. Gross unrealized appreciation and depreciation of investments aggregated $74,144,193 and $39,813,244, respectively, resulting in net unrealized appreciation of $34,330,949. The difference between book basis and tax basis net unrealized appreciation of investments is attributable primarily to the tax deferral of losses on certain sales of securities.
Note E
Reclassification
of accounts
During the year ended December 31, 2005, the Fund reclassified amounts to reflect an increase in accumulated net realized loss on investments of $9,579,281, a decrease in accumulated net investment loss of $9,656,474 and a decrease in capital paid-in of $77,193. This represents the amounts necessary to report these balances on a tax basis, excluding certain temporary differences, as of December 31, 2005. Additional adjustments may be needed in subsequent reporting periods. These reclassifications, which have no impact on the net asset value of the Fund, are primarily attributable to certain differences in the computation of distributable income and capital gains under federal tax rules versus accounting principles generally accepted in the
19
United States of America, book and tax differences in accounting for deferred compensation, federal excise tax and non-deductible organizational costs. The calculation of net investment income per share in the Fund’s Financial Highlights excludes these adjustments.
Change in
independent auditor
(unaudited)
Based on the recommendation of the Audit Committee of the Fund, the Board of Directors has determined not to retain Deloitte & Touche LLP as the Fund’s Independent Registered Public Accounting Firm and voted to appoint PricewaterhouseCoopers LLP for the fiscal year ended December 31, 2006. During the two most recent fiscal years, Deloitte & Touche LLP’s audit reports contained no adverse opinion or disclaimer of opinion; nor were their reports quali-fied as to uncertainty, audit scope or accounting principles. Further, there were no disagreements between the Fund and Deloitte & Touche LLP on accounting principles, financial statements disclosure or audit scope, which, if not resolved to the satisfaction of Deloitte & Touche LLP, would have caused them to make reference to the disagreement in their reports.
20
Report of Deloitte
& Touche LLP,
Independent
Registered Public
Accounting Firm
|
To the Board of Trustees and Shareholders of John Hancock
Tax-Advantaged Dividend Income Fund,
|
We have audited the accompanying statement of assets and liabilities, including the schedule of investments, of John Hancock Tax-Advantaged Dividend Income Fund (the “Fund”), as of December 31, 2005, and the related statement of operations for the year then ended, and the statements of changes in net assets and the financial highlights for each of the years in the two-year period ended December 31, 2005. These financial statements and financial highlights are the responsibility of the Fund’s management. Our responsibility is to express an opinion on these financial statements and financial highlights based on our audits.
We conducted our audits in accordance with standards of the Public Company Accounting Oversight Board (United States). Those standards require that we plan and perform the audit to obtain reasonable assurance about whether the financial statements and financial highlights are free of material misstatement. The Fund is not required to have, nor were we engaged to perform, an audit of its internal control over financial reporting. Our audits included consideration of internal control over financial reporting as a basis for designing audit procedures that are appropriate in the circumstances, but not for the purpose of expressing an opinion on effectiveness of the Fund’s internal control over financial reporting. Accordingly, we express no such opinion. An audit also includes examining, on a test basis, evidence supporting the amounts and disclosures in the financial statements, assessing the accounting principles used and significant estimates made by management, as well as evaluating the overall financial statement presentation. Our procedures included confirmation of securities owned at December 31, 2005, by correspondence with the custodian and brokers; where replies were not received from brokers, we performed other auditing procedures. We believe that our audits provide a reasonable basis for our opinion.
In our opinion, the financial statements and financial highlights referred to above present fairly, in all material respects, the financial position of the Fund as of December 31, 2005, and the results of its operations, the changes in its net assets and its financial highlights for the respective stated periods in conformity with accounting principles generally accepted in the United States of America.
DELOITTE & TOUCHE LLP
Boston, Massachusetts
February 16, 2006
|
21
Unaudited
For federal income tax purposes, the following information is furnished with respect to the distributions of the Fund, if any, paid during its taxable year ended December 31, 2005.
This Fund has designated distributions of $3,871,550 to shareholders as a long-term capital gain dividend.
With respect to the ordinary dividends paid by the Fund for the fiscal year ended December 31, 2005, 89.11% of the dividends qualifies for the corporate dividends-received deduction.
The Fund hereby designates the maximum amount allowable of its net taxable income as qualified dividend income as provided in the Jobs and Growth Tax Relief Reconciliation Act of 2003. This amount will be reflected on Form 1099-DIV for the calendar year 2005.
Shareholders will be mailed a 2005 U.S. Treasury Department Form 1099-DIV in January 2006. This will reflect the total of all distributions that are taxable for calendar year 2005.
22
Investment
objective
and policy
|
The Fund’s investment objective is to provide a high level of after-tax total return from dividend income and capital appreciation.
Under normal market conditions, the Fund will invest at least 80% of its assets (net assets plus borrowings for investment purposes) in dividend-paying common and preferred securities that the Adviser believes at the time of acquisition are eligible to pay dividends which, for individual shareholders, qualify for U.S. federal income taxation at rates applicable to long-term capital gains, which currently are taxed at a maximum rate of 15% (“tax-advantaged dividends”). Tax-advantaged dividends generally include dividends from domestic corporations and dividends from foreign corporations that meet certain specified criteria. The Fund generally can pass the tax treatment of tax-advantaged dividends it receives through to its common shareholders.
Dividends and
distributions
|
During the year ended December 31, 2005, dividends from net investment income totaling $1.1604 and distributions from capital gains totaling $0.0920 per share were paid to common shareholders. The dates of payments and the amounts per share are as follows:
| PAYMENT | INCOME |
| DATE | DIVIDEND |
|
| January 31, 2005 | $0.0967 |
| February 28, 2005 | 0.0967 |
| March 31, 2005 | 0.0967 |
| April 29, 2005 | 0.0967 |
| May 31, 2005 | 0.0967 |
| June 30, 2005 | 0.0967 |
| July 29, 2005 | 0.0967 |
| August 31, 2005 | 0.0967 |
| September 30, 2005 | 0.0967 |
| October 31, 2005 | 0.0967 |
| November 30, 2005 | 0.0967 |
| December 30, 2005 | 0.0967 |
| |
| | CAPITAL |
| | GAIN |
| PAYMENT DATE | DISTRIBUTION |
|
| December 30, 2005 | $0.0920 |
Dividend
reinvestment plan
|
The Fund offers its shareholders a Dividend Reinvestment Plan (the “Plan”), which offers the opportunity to earn compounded yields. Each holder of common shares will automatically have all distributions of dividends and capital gains reinvested by Mellon Investor Services, as Plan Agent for the common shareholders (the “Plan Agent”), unless an election is made to receive cash. Holders of common shares who elect not to participate in the Plan will receive all distributions in cash, paid by check and mailed directly to the shareholder of record (or, if the common shares are held in street or other nominee name, then to the nominee) by the Plan Agent, as dividend-disbursing agent. Shareholders whose shares are held in the name of a broker or a nominee should contact the broker or nominee to determine whether and how they may participate in the Plan.
If the Fund declares a dividend payable either in common shares or in cash, non-participants will receive cash and participants in the Plan will receive the equivalent in common shares. If the market price of the common shares on the payment date of the dividend is equal to, or exceeds, their net asset value as determined on the payment date, participants will be issued common shares (out of authorized but unissued shares) at a value equal to the higher of net asset value or 95% of the market price. If the net asset value exceeds the market price of the common shares at such time, or if the Board of Trustees declares a dividend payable only in cash, the Plan Agent will, as agent for Plan participants, buy shares in the open market, on the New York Stock Exchange or elsewhere, for the participants’ accounts. Such purchases will be made promptly after the payable date for such dividend and, in any event, prior to the next ex-dividend date after such date, except where necessary to comply with federal securities laws. If, before the Plan Agent has completed its purchases, the market price exceeds the net asset value of the common shares, the average per share purchase price paid by the Plan Agent may exceed the net asset value of the common shares, resulting in the acquisition of fewer shares than if the dividend had been paid in shares issued by the Fund.
23
Each participant will pay a pro rata share of brokerage commissions incurred with respect to the Plan Agent’s open market purchases in connection with the reinvestment of dividends and distributions. The cost per share of the shares purchased for each participant’s account will be the average cost, including brokerage commissions, of any shares purchased on the open market, plus the cost of any shares issued by the Fund. There will be no brokerage charges with respect to common shares issued directly by the Fund. There are no other charges to participants for reinvesting dividends or capital gain distributions.
Participants in the Plan may withdraw from the Plan at any time by contacting the Plan Agent by telephone, in writing or by visiting the Plan Agent’s Web site at www.melloninvestor.com. Such withdrawal will be effective immediately if received not less than ten days prior to a dividend record date; otherwise, it will be effective for all subsequent dividend record dates. When a participant withdraws from the Plan or upon termination of the Plan, as provided below, certificates for whole common shares credited to his or her account under the Plan will be issued and a cash payment will be made for any fraction of a share credited to such account.
The Plan Agent maintains each shareholder’s account in the Plan and furnishes monthly written confirmations of all transactions in the accounts, including information needed by the shareholders for personal and tax records. The Plan Agent will hold common shares in the account of each Plan participant in non-certificated form in the name of the participant. Proxy material relating to the shareholders’ meetings of the Fund will include those shares purchased, as well as shares held pursuant to the Plan.
The reinvestment of dividends and distributions will not relieve participants of any federal income tax that may be payable or required to be withheld on such dividends or distributions. Participants under the Plan will receive tax information annually. The amount of dividend to be reported on the 1099-DIV should be: (1) in the case of shares issued by the Fund, the fair market value of such shares on the dividend payment date and (2) in the case of shares purchased by the Plan Agent in the open market, the amount of cash used by the Plan Agent to purchase shares in the open market, including the amount of cash allocated to brokerage commissions paid on such purchases.
Experience under the Plan may indicate that changes are desirable. Accordingly, the Fund reserves the right to amend or terminate the Plan as applied to any dividend or distribution paid subsequent to written notice of the change sent to all shareholders of the Fund at least 90 days before the record date for the dividend or distribution. The Plan may be amended or terminated by the Plan Agent after at least 90 days’ written notice to all shareholders of the Fund. All correspondence or additional information concerning the Plan should be directed to the Plan Agent, Mellon Bank, N.A., c/o Mellon Investor Services, P.O. Box 3338, South Hackensack, NJ 07606-1938 (Telephone: 1-800-852-0218).
Shareholder
communication
and assistance
If you have any questions concerning the Fund, we will be pleased to assist you. If you hold shares in your own name and not with a brokerage firm, please address all notices, correspondence, questions or other communications regarding the Fund to the transfer agent at:
Mellon Investor Services
Newport Office Center VII
480 Washington Boulevard
Jersey City, NJ 07310
Telephone: 1-800-852-0218
If your shares are held with a brokerage firm, you should contact that firm, bank or other nominee for assistance.
24
Shareholder meeting
On March 2, 2005, the Annual Meeting of the Fund was held to elect five Trustees and to ratify the actions of the Trustees in selecting independent auditors for the Fund.
Proxies covering 41,825,690 shares of beneficial interest were voted at the meeting. The common shareholders elected the following Trustees to serve until their respective successors are duly elected and qualified, with the votes tabulated as follows:
| | | W I T H H E L D |
| | F O R | A U T H O R I T Y |
|
| |
| James F. Carlin | 41,469,089 | 342,286 |
| William H. Cunningham | 41,475,285 | 336,090 |
| Richard P. Chapman, Jr. | 41,465,452 | 345,923 |
| James A. Shepherdson* | 41,481,981 | 329,394 |
| *Mr. James A. Shepherdson resigned effective July 15, 2005. | |
The preferred shareholders elected Patti McGill Peterson to serve as the Fund’s Trustee until her successor is duly elected and qualified, with the votes tabulated as follows: 14,258 FOR, 0 AGAINST, 57 WITHHELD.
The common and preferred shareholders ratified the Trustees’ selection of Deloitte & Touche LLP as the Fund’s independent auditor for the fiscal year ending December 31, 2005, with votes tabulated as follows: 41,484,857 FOR, 141,984 AGAINST and 198,849 ABSTAINING.
25
Board Consideration
of and Continuation
of Investment
Advisory Agreement:
John Hancock
Tax-Advantaged
Dividend Income Fund
|
Section 15(c) of the Investment Company Act of 1940 (the “1940 Act”) requires the Board of Trustees (the “Board”) of John Hancock Tax-Advantaged Dividend Income Fund (the “Fund”), including a majority of the Trustees who have no direct or indirect interest in the investment advisory agreement and are not “interested persons” of the Fund, as defined in the 1940 Act (the “Independent Trustees”), annually to review and consider the continuation of the investment advisory agreement (the “Advisory Agreement”) with John Hancock Advisers, LLC (the “Adviser”) for the Fund.
At meetings held on May 19-20 and June 6-7, 2005, the Board, including the Independent Trustees, considered the factors and reached the conclusions described below relating to the selection of the Adviser and the continuation of the Advisory Agreement. During such meetings, the Board’s Contracts/Operations Committee and the Independent Trustees also met in executive sessions with their independent legal counsel. In evaluating the Advisory Agreement, the Board, including the Contracts/Operations Committee and the Independent Trustees, reviewed a broad range of information requested for this purpose by the Independent Trustees, including but not limited to the following: (i) the investment performance of the Fund and a broader universe of relevant funds (the “Universe”) selected by Lipper Inc. (“Lipper”), an independent provider of investment company data, for a range of periods, (ii) advisory and other fees incurred by, and the expense ratios of, the Fund and a peer group of comparable funds selected by Lipper (the “Peer Group”), (iii) the advisory fees of comparable portfolios of other clients of the Adviser, (iv) the Adviser’s financial results and condition, including its and certain of its affiliates’ profitability from services performed for the Fund, (v) breakpoints in the Fund’s and the Peer Group’s fees and a study undertaken at the direction of the Independent Trustees as to the allocation of the benefits of economies of scale between the Fund and the Adviser, (vi) the Adviser’s record of compliance with applicable laws and regulations, with the Fund’s investment policies and restrictions, and with the Fund’s Code of Ethics and the structure and responsibilities of the Adviser’s compliance department, (vii) the background and experience of senior management and investment professionals, and (viii) the nature, cost and character of advisory and non-investment management services provided by the Adviser and its affiliates.
Nature, extent and quality
of services
|
The Board considered the ability of the Adviser, based on its resources, reputation and other attributes, to attract and retain qualified investment professionals, including research, advisory, and supervisory personnel. The Board further considered the compliance programs and compliance records of the Adviser. In addition, the Board took into account the administrative services provided to the Fund by the Adviser and its affiliates.
Based on the above factors, together with those referenced below, the Board concluded that, within the context of its full deliberations, the nature, extent and quality of the investment advisory services provided to the Fund by the Adviser were sufficient to support renewal of the Advisory Agreement.
Fund performance
The Board noted that the Fund had less than one full year of operational history, and considered the performance results for the Fund since its inception through December 31, 2004. The Board also considered these
26
results in comparison to the performance of the Universe, as well as the Fund’s benchmark index. Lipper determined the Universe for the Fund. The Board reviewed with a representative of Lipper the methodology used by Lipper to select the funds in the Universe and the Peer Group.
The Board noted that the performance of the Fund was not appreciably below the median and average performance of its Universe for the time period under review. The Board also noted that the Fund performed lower than the Dow Jones Utility Average Index, the Fund’s benchmark index, as did the Universe. The Board recognized the short operational history of the Fund and indicated its intent to continue to monitor the Fund’s performance trends.
Investment advisory fee
rates and expenses
The Board reviewed and considered the contractual investment advisory fee rate payable by the Fund to the Adviser for investment advisory services (the “Advisory Agreement Rate”). The Board noted the fee waiver arrangement applicable to the Advisory Agreement Rate and considered the Advisory Agreement Rate after taking the waivers into account (the “Net Advisory Rate”). The Board received and considered information comparing the Advisory Agreement Rate and Net Advisory Rate with the advisory fees for the Peer Group. The Board noted that the Advisory Agreement Rate and Net Advisory Rate were lower than the median rate of the Peer Group, and reasonable in relation to the services provided.
The Board received and considered information regarding the Fund’s total operating expense ratio and its various components, including contractual advisory fees, actual advisory fees, non-management fees, transfer agent fees and custodian fees, including and excluding investment-related expenses. The Board also considered comparisons of these expenses to the Peer Group and the Universe. The Board noted that the total operating expense ratio of the Fund was lower than the Peer Group’s and Universe’s median total operating expense ratio.
The Adviser also discussed the Lipper data and rankings, and other relevant information, for the Fund. Based on the above-referenced considerations and other factors, the Board concluded that the Fund’s overall expense results and performance supported the re-approval of the Advisory Agreement.
Profitability
The Board received and considered a detailed profitability analysis of the Adviser based on the Advisory Agreement, as well as on other relationships between the Fund and the Adviser and its affiliates. The Board concluded that, in light of the costs of providing investment management and other services to the Fund, the profits and other ancillary benefits reported by the Adviser were not unreasonable.
Economies of scale
The Board received and considered general information regarding economies of scale with respect to the management of the Fund, including the Fund’s ability to appropriately benefit from economies of scale under the Fund’s fee structure. The Board recognized the inherent limitations of any analysis of economies of scale, stemming largely from the Board’s understanding that most of the Adviser’s costs are not specific to individual Funds, but rather are incurred across a variety of products and services.
The Board observed that the Advisory Agreement did not offer breakpoints. However, the Board considered the limited relevance of economies of scale in the context of a closed-end fund that, unlike an open-end fund, does not continuously offer its shares, and concluded that the fees were fair and equitable based on relevant factors, including the Fund’s total expenses ranking relative to its Peer Group.
27
Information about
services to other clients
The Board also received information about the nature, extent and quality of services and fee rates offered by the Adviser to its other clients, including other registered investment companies, institutional investors and separate accounts. The Board concluded that the Advisory Agreement Rate was not unreasonable, taking into account fee rates offered to others by the Adviser and giving effect to differences in services covered by such fee rates.
Other benefits to
the Adviser
The Board received information regarding potential “fall-out” or ancillary bene-fits received by the Adviser and its affiliates as a result of the Adviser’s relationship with the Fund. Such benefits could include, among others, benefits directly attributable to the relationship of the Adviser with the Fund and benefits potentially derived from an increase in the business of the Adviser as a result of its relationship with the Fund (such as the ability to market to shareholders other finan-cial products offered by the Adviser and its affiliates).
The Board also considered the effectiveness of the Adviser’s and the Fund’s policies and procedures for complying with the requirements of the federal securities laws, including those relating to best execution of portfolio transactions and brokerage allocation.
Other factors and
broader review
As discussed above, the Board reviewed detailed materials received from the Adviser as part of the annual re-approval process under Section 15(c) of the 1940 Act. The Board also regularly reviews and assesses the quality of the services that the Fund receives throughout the year. In this regard, the Board reviews reports of the Adviser at least quarterly, which include, among other things, a detailed portfolio review, detailed fund performance reports and compliance reports. In addition, the Board meets with portfolio managers and senior investment officers at various times throughout the year.
After considering the above-described factors and based on its deliberations and its evaluation of the information described above, the Board concluded that approval of the continuation of the Advisory Agreement for the Fund was in the best interest of the Fund and its shareholders. Accordingly, the Board unanimously approved the continuation of the Advisory Agreement.
At a meeting held on December 6, 2005, the Board reviewed a Sub-Advisory Agreement among the Fund, the Adviser and Sovereign Asset Management, LLC, an affili-ate of the Adviser (the “Sub-Adviser”). At that meeting, the Adviser proposed, and the Board accepted, a reorganization of the Adviser’s operations and the transfer to the Sub-Adviser of all of the Adviser’s investment personnel. As a result of this restructuring, the Adviser remains the principal adviser to the Fund and the Sub-Adviser acts as sub-adviser under the supervision of the Adviser. In evaluating the Sub-Adviser Agreement, the Board relied upon the review that it conducted at its May and June 2005 meetings, its familiarity with the operations and personnel transferred to Sovereign and representations by the Adviser that the reorganization would not result in a change in the quality of services provided under the Sub-Advisory Agreement or the personnel responsible for the day-to-day management of the Fund. The Board also reviewed an analysis of the fee paid by the Adviser to the Sub-Adviser under the Sub-Advisory Agreement relative to sub-advisory fees paid by the Adviser and its affiliates to third party sub-advisers and fees paid by a peer group of unaffiliated investment companies. After considering the above-described factors and based on its deliberations and its
28
evaluation of the information described above, the Board concluded that approval of the Sub-Advisory Agreement was the in the best interest of the Fund and its shareholders. Accordingly, the Board unanimously approved the Sub-Advisory Agreement, which became effective on December 31, 2005.
29
Information about the portfolio managers
Management Biographies and Fund ownership
Below is an alphabetical list of the portfolio managers who share joint responsibility for the day-to-day investment management of the Fund. It provides a brief summary of their business careers over the past five years and their range of beneficial share ownership in the Fund as of December 31, 2005.
Mark T. Maloney
Vice President, Sovereign Asset Management LLC since 2005
Vice President, John Hancock Advisers, LLC (1982-2005)
Began business career in 1982
Joined fund team in 2004
Fund ownership – None
|
Gregory K. Phelps
Senior Vice President, Sovereign Asset Management LLC since 2005
Senior Vice President, John Hancock Advisers, LLC (1995-2005)
Began business career in 1983
Joined fund team in 2004
Fund ownership – None
|
James K. Schmidt, CFA
Executive Vice President, Sovereign Asset Management LLC since 2005
Executive Vice President, John Hancock Advisers, LLC (1992-2005)
Began business career in 1979
Joined fund team in 2004
Fund ownership – None
|
Lisa A. Welch
Vice President, Sovereign Asset Management LLC since 2005
Vice President, John Hancock Advisers, LLC (1998-2005)
Began business career in 1986
Joined fund team in 2004
Fund ownership – None
|
Other Accounts the Portfolio Managers are Managing
The table below indicates for each portfolio manager information about the accounts over which the portfolio manager has day-to-day investment responsibility. All information on the number of accounts and total assets in the table is as of December 31, 2005. For purposes of the table, “Other Pooled Investment Vehicles” may include investment partnerships and group trusts, and “Other Accounts” may include separate accounts for institutions or individuals, insurance company general or separate accounts, pension funds and other similar institutionalaccounts.
| P O R T F O L I O M A N A G E R | O T H E R A C C O U N T S M A N A G E D B Y T H E P O R T F O L I O M A N A G E R S |
|
| Mark T. Maloney | Other Investment Companies: 8 funds with assets of |
| | approximately $3.8 billion. |
| | Other Pooled Investment Vehicles: 2 accounts with assets of |
| | approximately $75 million. |
| | Other Accounts: None |
30
| Gregory K. Phelps | Other Investment Companies: 8 funds with assets of |
| | approximately $3.8 billion. |
| | Other Pooled Investment Vehicles: 2 accounts with assets of |
| | approximately $75 million. |
| | Other Accounts: None |
| |
| James K. Schmidt, CFA | Other Investment Companies: 6 funds with assets of |
| | approximately $4.2 billion. |
| | Other Pooled Investment Vehicles: None |
| | Other Accounts: None |
| |
| Lisa A. Welch | Other Investment Companies: 6 funds with assets of |
| | approximately $4.2 billion. |
| | Other Pooled Investment Vehicles: None |
| | Other Accounts: None |
When a portfolio manager is responsible for the management of more than one account, the potential arises for the portfolio manager to favor one account over another. For the reasons outlined below, the Fund does not believe that any material conflicts are likely to arise out of a portfolio manager’s responsibility for the management of the Fund as well as one or more other accounts. The Adviser and the Sub-Adviser have adopted procedures, overseen by the Chief Compliance Officer, that are intended to monitor compliance with the policies referred to in the following paragraphs.
* The Sub-Adviser has policies that require a portfolio manager to allocate investment opportunities in an equitable manner and generally to allocate such investments proportionately among all accounts with similar investment objectives.
* When a portfolio manager intends to trade the same security for more than one account, the policies of the Sub-Adviser generally require that such trades for the individual accounts are aggregated so each account receives the same price. Where not possible or may not result in the best possible price, the Sub-Adviser will place the order in a manner intended to result in as favorable a price as possible for such client.
* The investment performance on specific accounts is not a factor in determining the portfolio manager’s compensation. See “Compensation of Portfolio Managers” below. Neither the Adviser nor the Sub-Adviser receives a performance-based fee with respect to other accounts managed by the Fund’s portfolio managers.
* The Sub-Adviser imposes certain trading restrictions and reporting requirements for accounts in which a portfolio manager or certain family members have a personal interest in order to confirm that such accounts are not favored over other accounts.
* The Sub-Adviser seeks to avoid portfolio manager assignments with potentially conflicting situations. However, where a portfolio manager is responsible for accounts with differing investment objectives and policies, it is possible that the portfolio manager will conclude that it is in the best interest of one account to sell a portfolio security while another account continues to hold or increase the holding in such security.
31
Compensation of Portfolio Managers
The Sub-Adviser has adopted a system of compensation for portfolio managers and others involved in the investment process that is applied consistently among investment professionals. At the Sub-Adviser, the structure of compensation of investment professionals is currently comprised of the following basic components: fixed base salary, and an annual investment bonus plan, as well as customary benefits that are offered generally to all full-time employees of the Sub-Adviser. A limited number of senior portfolio managers, who serve as officers of both the Sub-Adviser and its parent company, may also receive options or restricted stock grants of common shares of Manulife Financial.
Only investment professionals are eligible to participate in the Investment Bonus Plan on an annual basis. While the amount of any bonus is discretionary, the following factors are generally used in determining bonuses: 1) The investment performance of all accounts managed by the investment professional over one- and three- year periods are considered. The pre-tax performance of each account is measured relative to an appropriate peer group benchmark. 2) The profitability of the Sub-Adviser and its parent company are also considered in determining bonus awards, with greater emphasis placed upon the profitability of the Adviser. 3) The more intangible contributions of an investment professional to the Sub-Adviser’s business, including the investment professional’s support of sales activities, new fund/strategy idea generation, professional growth and development, and management, where applicable, are evaluating in determining the amount of any bonus award.
While the profitability of the Sub-Adviser and the investment performance of the accounts that the investment professionals maintain are factors in determining an investment professional’s overall compensation, the investment professional’s compensation is not linked directly to the net asset value of any fund.
32
This chart provides information about the Trustees and Officers who oversee your John Hancock fund. Officers elected by the Trustees manage the day-to-day operations of the Fund and execute policies formulated by the Trustees.
Independent Trustees
| Name, age | | Number of |
| Position(s) held with Fund | Trustee | John Hancock |
| Principal occupation(s) and other | of Fund | funds overseen |
| directorships during past 5 years | since1 | by Trustee |
|
| Ronald R. Dion, Born: 1946 | 2004 | 53 |
| Independent Chairman (since 2005); Chairman and Chief Executive Officer, | | |
| R.M. Bradley & Co., Inc.; Director, The New England Council and Massachusetts | |
| Roundtable; Trustee, North Shore Medical Center; Director, Boston Stock | | |
| Exchange; Director, BJ’s Wholesale Club, Inc. and a corporator of the Eastern | | |
| Bank; Trustee, Emmanuel College; Director, Boston Municipal Research Bureau; | |
| Member of the Advisory Board, Carroll Graduate School of Management at | | |
| Boston College. | | |
|
| |
| James F. Carlin, Born: 1940 | 2004 | 53 |
| Director and Treasurer, Alpha Analytical Inc. (analytical laboratory) (since 1985); | |
| Part Owner and Treasurer, Lawrence Carlin Insurance Agency, Inc. (since 1995); | |
| Part Owner and Vice President, Mone Lawrence Carlin Insurance Agency, Inc. | | |
| (since 1996); Director and Treasurer, Rizzo Associates (engineering) (until 2000); | |
| Chairman and CEO, Carlin Consolidated, Inc. (management/investments) (since | |
| 1987); Director and Partner, Proctor Carlin & Co., Inc. (until 1999); Trustee, | | |
| Massachusetts Health and Education Tax Exempt Trust (since 1993); Director of | |
| the following: Uno Restaurant Corp. (until 2001), Arbella Mutual (insurance) | | |
| (until 2000), HealthPlan Services, Inc. (until 1999), Flagship Healthcare, Inc. (until | |
| 1999), Carlin Insurance Agency, Inc. (until 1999); Chairman, Massachusetts | | |
| Board of Higher Education (until 1999). | | |
|
| |
| Richard P. Chapman, Jr.,2 Born: 1935 | 2004 | 53 |
| President and Chief Executive Officer, Brookline Bancorp Inc. (lending) | | |
| (since 1972); Director, Lumber Insurance Co. (insurance) (until 2000); | | |
| Chairman and Director, Northeast Retirement Services, Inc. (retirement | | |
| administration) (since 1998). | | |
|
| |
| William H. Cunningham, Born: 1944 | 2004 | 143 |
| Former Chancellor, University of Texas System and former President of the | | |
| University of Texas, Austin, Texas; Chairman and CEO, IBT Technologies (until | | |
| 2001); Director of the following: Hire.com (until 2004), STC Broadcasting, Inc. | | |
| and Sunrise Television Corp. (until 2001), Symtx, Inc. (electronic manufacturing) | |
| (since 2001), Adorno/Rogers Technology, Inc. (until 2004), Pinnacle Foods | | |
| Corporation (until 2003), rateGenius (until 2003), Jefferson-Pilot Corporation | | |
| (diversified life insurance company), New Century Equity Holdings (formerly | | |
33
Independent Trustees (continued)
| Name, age | | Number of |
| Position(s) held with Fund | Trustee | John Hancock |
| Principal occupation(s) and other | of Fund | funds overseen |
| directorships during past 5 years | since1 | by Trustee |
|
| William H. Cunningham, Born: 1944 (continued) | 2004 | 143 |
| Billing Concepts) (until 2001), eCertain (until 2001), ClassMap.com (until | | |
| 2001), Agile Ventures (until 2001), AskRed.com (until 2001), Southwest Airlines, | |
| Introgen and Viasystems, Group, Inc. (electronic manufacturer) (until 2003); | | |
| Advisory Director, Interactive Bridge, Inc. (college fundraising) (until 2001); | | |
| Advisory Director, Q Investments (until 2003); Advisory Director, JP Morgan | | |
| Chase Bank (formerly Texas Commerce Bank – Austin), LIN Television (since | | |
| 2002), WilTel Communications (until 2003) and Hayes Lemmerz International, | | |
| Inc. (diversified automotive parts supply company) (since 2003). | | |
|
| |
| Charles L. Ladner,2 Born: 1938 | 2004 | 143 |
| Chairman and Trustee, Dunwoody Village, Inc. (retirement services) (until 2003); | |
| Senior Vice President and Chief Financial Officer, UGI Corporation (public utility | |
| holding company) (retired 1998); Vice President and Director for AmeriGas, Inc. | |
| (retired 1998); Director of AmeriGas Partners, L.P. (until 1997) (gas distribution); | |
| Director, EnergyNorth, Inc. (until 1995); Director, Parks and History Association | | |
| (since 2001). | | |
|
| |
| John A. Moore,2 Born: 1939 | 2004 | 53 |
| President and Chief Executive Officer, Institute for Evaluating Health Risks, | | |
| (nonprofit institution) (until 2001); Chief Scientist, Sciences International (health | |
| research) (until 2003); Principal, Hollyhouse (consulting) (since 2000); Director, | | |
| CIIT (nonprofit research) (since 2002). | | |
|
| |
| Patti McGill Peterson,2 Born: 1943 | 2004 | 53 |
| Executive Director, Council for International Exchange of Scholars and Vice | | |
| President, Institute of International Education (since 1998); Senior Fellow, Cornell | |
| Institute of Public Affairs, Cornell University (until 1998); Former President of | | |
| Wells College and St. Lawrence University; Director, Niagara Mohawk Power | | |
| Corporation (until 2003); Director, Ford Foundation, International Fellowships | | |
| Program (since 2002); Director, Lois Roth Endowment (since 2002); Director, | | |
| Council for International Educational Exchange (since 2003). | | |
|
| |
| Steven R. Pruchansky, Born: 1944 | 2004 | 53 |
| Chairman and Chief Executive Officer, Greenscapes of Southwest Florida, Inc. | | |
| (since 2000); Director and President, Greenscapes of Southwest Florida, Inc. | | |
| (until 2000); Managing Director, JonJames, LLC (real estate) (since 2001); | | |
| Director, First Signature Bank & Trust Company (until 1991); Director, Mast | | |
| Realty Trust (until 1994); President, Maxwell Building Corp. (until 1991). | | |
34
Non-Independent Trustee3
| Name, age | | Number of |
| Position(s) held with Fund | Trustee | John Hancock |
| Principal occupation(s) and other | of Fund | funds overseen |
| directorships during past 5 years | since1 | by Trustee |
|
| James R. Boyle, Born: 1959 | 2005 | 237 |
| President, John Hancock Annuities; Executive Vice President, John Hancock | | |
| Life Insurance Company (since June, 2004); Chairman and Director, John | | |
| Hancock Advisers, LLC (the “Adviser”); John Hancock Funds, LLC (“John | | |
| Hancock Funds”) and The Berkeley Financial Group, LLC (“The Berkeley | | |
| Group”) (holding company) (since 2005); President, U.S. Annuities; Senior | | |
| Vice President, The Manufacturers Life Insurance Company (U.S.A.) (prior | | |
| to 2004). | | |
| |
| Principal officers who are not Trustees | | |
| Name, age | | |
| Position(s) held with Fund | | Officer |
| Principal occupation(s) and | | of Fund |
| directorships during past 5 years | | since |
|
| Keith F. Hartstein, Born: 1956 | | 2005 |
| President and Chief Executive Officer | | |
| Senior Vice President, Manulife Financial Corporation (since 2004); Director, | | |
| President and Chief Executive Officer, the Adviser and The Berkeley Group; | | |
| Director, President and Chief Executive Officer, John Hancock Funds; Director, | | |
| President and Chief Executive Officer, Sovereign Asset Management LLC | | |
| (“Sovereign”); Director, John Hancock Signature Services, Inc.; President, John | | |
| Hancock Trust; Chairman and President, NM Capital Management, Inc. (NM | | |
| Capital) (since 2005); Chairman, Investment Company Institute Sales Force | | |
| Marketing Committee (since 2003); Executive Vice President, John Hancock | | |
| Funds (until 2005). | | |
|
| |
| William H. King, Born: 1952 | | 2004 |
| Vice President and Treasurer | | |
| Vice President and Assistant Treasurer, the Adviser; Vice President and Treasurer | |
| of each of the John Hancock funds advised by the Adviser; Assistant Treasurer | | |
| of each of the John Hancock funds (until 2001). | | |
|
| |
| Francis V. Knox, Jr., Born: 1947 | | 2005 |
| Vice President and Chief Compliance Officer | | |
| Vice President and Chief Compliance Officer for John Hancock Investment | | |
| Company, John Hancock Life Insurance Company (U.S.A.), John Hancock Life | | |
| Insurance Company and John Hancock Funds (since 2005); Vice President and | | |
| Assistant Treasurer, Fidelity Group of Funds (until 2004); Vice President and | | |
| Ethics & Compliance Officer, Fidelity Investments (until 2001). | | |
|
| |
| John G. Vrysen, Born: 1955 | | 2005 |
| Executive Vice President and Chief Financial Officer; Director, the Adviser, | | |
| The Berkeley Group and John Hancock Funds. | | |
| Executive Vice President and Chief Financial Officer, the Adviser, Sovereign, | | |
| The Berkeley Group and John Hancock Funds (since 2005); Vice President and | | |
| General Manager, Fixed Annuities, U.S. Wealth Management (until 2005); Vice | |
| President, Operations, Manulife Wood Logan (July 2000 thru September 2004). | |
35
Notes to Trustees and Officers pages
The business address for all Trustees and Officers is 601 Congress Street, Boston, Massachusetts 02210-2805.
The Statement of Additional Information of the Fund includes additional information about members of the Board of Trustees of the Fund and is available, without charge, upon request, by calling 1-800-225-5291.
1 Each Trustee serves until resignation, retirement age or until his or her successor is elected.
2 Member of Audit Committee.
3 Non-independent Trustees hold positions with the Fund’s investment adviser, underwriter and certain other affiliates.
36
For more information
The Fund’s proxy voting policies, procedures and records are available without charge, upon request:
| By phone | On the Fund’s Web site | On the SEC’s Web site |
| 1-800-225-5291 | www.jhfunds.com/proxy | www.sec.gov |
|
| |
| |
| Investment adviser | Transfer agent | Independent registered |
| John Hancock Advisers, LLC | and registrar | public accounting firm |
| 601 Congress Street | Mellon Investor Services | Deloitte & Touche LLP |
| Boston, MA 02210-2805 | Newport Office Center VII | 200 Berkeley Street |
| | 480 Washington Boulevard | Boston, MA 02116-5022 |
| Subadviser | | |
| | Jersey City, NJ 07310 | |
| Sovereign Asset Management | | Stock symbol |
| LLC | Transfer agent for APS | Listed New York Stock |
| 101 Huntington Avenue | Deutsche Bank Trust | Exchange: |
| Boston, MA 02199 | Company Americas | HTD |
| | 280 Park Avenue | |
| Custodian | | For shareholder assistance |
| | New York, NY 10017 | |
| The Bank of New York | | refer to page 24 |
| One Wall Street | Legal counsel | |
| New York, NY 10286 | Wilmer Cutler Pickering | |
| | Hale and Dorr LLP | |
| | 60 State Street | |
| | Boston, MA 02109-1803 | |
| How to contact us | |
|
| |
| Internet | www.jhfunds.com | |
|
| |
| Mail | Regular mail: | |
| | Mellon Investor Services | |
| | Newport Office Center VII | |
| | 480 Washington Boulevard | |
| | Jersey City, NJ 07310 | |
|
| |
| Phone | Customer service representatives | 1-800-852-0218 |
| | Portfolio commentary | 1-800-344-7054 |
| | 24-hour automated information | 1-800-843-0090 |
| | TDD line | 1-800-231-5469 |
A listing of month-end portfolio holdings is available on our Web site, www.jhfunds.com. A more detailed portfolio holdings summary is available on a quarterly basis 60 days after the fiscal quarter on our Web site or upon request by calling 1-800-225-5291, or on the Securities and Exchange Commission’s Web site, www.sec.gov.
37

1-800-852-0218
1-800-843-0090 EASI-Line
1-800-231-5469 (TDD)
www.jhfunds. com
|
PRESORTED
STANDARD
U. S. POSTAGE
PAID
MIS
|
P130A 12/05
2/06
As of the end of the period, December 31, 2005, the registrant has adopted a code of ethics, as defined in Item 2 of Form N-CSR, that applies to its Chief Executive Officer, Chief Financial Officer and Treasurer (respectively, the principal executive officer, the principal financial officer and the principal accounting officer, the “Senior Financial Officers”). A copy of the code of ethics is filed as an exhibit to this Form N-CSR.
The code of ethics was amended effective May 1, 2005 to address new Rule 204A-1 under the Investment Advisers Act of 1940 and to make other related changes.
The most significant amendments were:
|
(a) Broadening of the General Principles of the code to cover compliance with all federal securities laws.
(b) Eliminating the interim requirements (since the first quarter of 2004) for access persons to preclear their personal trades of John Hancock mutual funds. This was replaced by post-trade reporting and a 30 day hold requirement for all employees.
(c) A new requirement for “heightened preclearance” with investment supervisors by any access person trading in a personal position worth $100,000 or more.
ITEM 3. AUDIT COMMITTEE FINANCIAL EXPERT.
Charles L. Ladner is the audit committee financial expert and is “independent”, pursuant to general instructions on Form N-CSR Item 3.
ITEM 4. PRINCIPAL ACCOUNTANT FEES AND SERVICES.
(a) Audit Fees
The aggregate fees billed for professional services rendered by the principal accountant(s) for the audit of the registrant’s annual financial statements or services that are normally provided by the accountant(s) in connection with statutory and regulatory filings or engagements amounted to $32,850 for the fiscal year ended December 31, 2004 and $34,500 for the fiscal year ended December 31, 2005. These fees were billed to the registrant and were approved by the registrant’s audit committee.
(b) Audit-Related Services
There were no audit-related fees during the fiscal year ended December 31, 2004 and fiscal year ended December 31, 2005 billed to the registrant or to the registrant's investment adviser (not including any sub-adviser whose role is primarily portfolio management and is subcontracted with or overseen by another investment adviser), and any entity controlling, controlled by, or under common control with the adviser that provides ongoing services to the registrant ("control affiliates").
(c) Tax Fees
The aggregate fees billed for professional services rendered by the principal accountant(s) for the tax compliance, tax advice and tax planning (“tax fees”) amounted to $2,250 for the fiscal year ended December 31, 2004 and $2,400 for the fiscal year ended December 31, 2005. The nature of the services comprising the tax fees was the review of the registrant’s income tax returns and tax distribution requirements. These fees were billed to the registrant and were approved by the registrant’s audit committee. There were no tax fees billed to the control affiliates.
The all other fees billed to the registrant for products and services provided by the principal accountant were $4,000 for the fiscal year ended December 31, 2004 and $4,000 for the fiscal year ended December 31, 2005. There were no other fees during the fiscal year ended December 31, 2004 and December 31, 2005 billed to control affiliates for products and services provided by the principal accountant. The nature of the services comprising the all other fees was related to the principal accountant’s report on the registrant’s Eligible Asset Coverage. These fees were approved by the registrant’s audit committee.
(e)(1) See attachment "Approval of Audit, Audit-related, Tax and Other Services", with the audit committee pre-approval policies and procedures.
(e)(2) There were no fees that were approved by the audit committee pursuant to the de minimis exception for the fiscal years ended December 31, 2004 and December 31, 2005 on behalf of the registrant or on behalf of the control affiliates that relate directly to the operations and financial reporting of the registrant.
(f) According to the registrant’s principal accountant, for the fiscal year ended December 31, 2005, the percentage of hours spent on the audit of the registrant's financial statements for the most recent fiscal year that were attributed to work performed by persons who were not full-time, permanent employees of principal accountant was less than 50%.
(g) The aggregate non-audit fees billed by the registrant's accountant(s) for services rendered to the registrant and rendered to the registrant's control affiliates for each of the last two fiscal years of the registrant were $71,250 for the fiscal year ended December 31, 2004, and $8,600 for the fiscal year ended December 31, 2005.
(h) The audit committee of the registrant has considered the non-audit services provided by the registrant’s principal accountant(s) to the control affiliates and has determined that the services that were not pre-approved are compatible with maintaining the principal accountant(s)' independence.
ITEM 5. AUDIT COMMITTEE OF LISTED REGISTRANTS.
The registrant has a separately-designated standing audit committee comprised of independent trustees. The members of the audit committee are as follows:
Dr. John A. Moore - Chairman
Richard P. Chapman, Jr.
Charles L. Ladner
Patti McGill Peterson
ITEM 6. SCHEDULE OF INVESTMENTS.
|
ITEM 7. DISCLOSURE OF PROXY VOTING POLICIES AND PROCEDURES FOR CLOSED-END MANAGEMENT INVESTMENT COMPANIES.
See attached Exhibit “Proxy Voting Policies and Procedures”.
ITEM 8. PORTFOLIO MANAGERS OF CLOSED-END MANAGEMENT INVESTMENT COMPANIES.
(a) Management Biographies and Fund ownership
Below is an alphabetical list of the portfolio managers who share joint responsibility for the day-to-day investment management of the Fund. It provides a brief summary of their business careers over the past five years and their range of beneficial share ownership in the Fund as of December 31, 2005.
Mark T. Maloney
Vice President, Sovereign Asset Management LLC since 2005
Vice President, John Hancock Advisers, LLC (1982-2005)
Began business career in 1982
Joined fund team in 2004
Fund ownership - None
Gregory K. Phelps
Senior Vice President, Sovereign Asset Management LLC since 2005
Senior Vice President, John Hancock Advisers, LLC (1995-2005)
Began business career in 1983
Joined fund team in 2004
Fund ownership - None
James K. Schmidt, CFA
Executive Vice President, Sovereign Asset Management LLC since 2005
Executive Vice President, John Hancock Advisers, LLC (1992-2005)
Began business career in 1979
Joined fund team in 2004
Fund ownership - None
Lisa A. Welch
Vice President, Sovereign Asset Management LLC since 2005
Vice President, John Hancock Advisers, LLC (1998-2005)
Began business career in 1986
Joined fund team in 2004
Fund ownership - None
|
(b) Other Accounts the Portfolio Managers are Managing
The table below indicates for each portfolio manager information about the accounts over which the portfolio manager has day-to-day investment responsibility. All information on the number of accounts and total assets in the table is as of December 31, 2005. For purposes of the table, “Other Pooled Investment Vehicles” may include investment partnerships and group trusts, and “Other Accounts” may include separate accounts for institutions or individuals, insurance company general or separate accounts, pension funds and other similar institutionalaccounts.
| PORTFOLIO MANAGER | OTHER ACCOUNTS MANAGED BY THE PORTFOLIO MANAGERS |
| Mark T. Maloney | Other Investment Companies: 8 funds with assets of |
| | approximately $3.8 billion. |
| | Other Pooled Investment Vehicles: 2 accounts with assets of |
| | approximately $75 million. |
| | Other Accounts: None |
| |
| Gregory K. Phelps | Other Investment Companies: 8 funds with assets of |
| | approximately $3.8 billion. |
| | Other Pooled Investment Vehicles: 2 accounts with assets of |
| | approximately $75 million. |
| | Other Accounts: None |
| |
| James K. Schmidt, CFA | Other Investment Companies: 6 funds with assets of |
| | approximately $4.2 billion. |
| | Other Pooled Investment Vehicles: None |
| | Other Accounts: None |
| |
| Lisa A. Welch | Other Investment Companies: 6 funds with assets of |
| | approximately $4.2 billion. |
| | Other Pooled Investment Vehicles: None |
| | Other Accounts: None |
(c) When a portfolio manager is responsible for the management of more than one account, the potential arises for the portfolio manager to favor one account over another. For the reasons outlined below, the Fund does not believe that any material conflicts are likely to arise out of a portfolio manager’s responsibility for the management of the Fund as well as one or more other accounts. The Adviser and the Sub-Adviser have adopted procedures, overseen by the Chief Compliance Officer, that are intended to monitor compliance with the policies referred to in the following paragraphs.
* The Sub-Adviser has policies that require a portfolio manager to allocate investment opportunities in an equitable manner and generally to allocate such investments proportionately among all accounts with similar investment objectives.
* When a portfolio manager intends to trade the same security for more than one account, the policies of the Sub-Adviser generally require that such trades for the individual accounts are aggregated so each account receives the same price. Where not possible or may not result in the best possible price, the Sub-Adviser will place the order in a manner intended to result in as favorable a price as possible for such client.
* The investment performance on specific accounts is not a factor in determining the portfolio manager’s compensation. See “Compensation of Portfolio Managers” below. Neither the Adviser nor the Sub-Adviser receives a performance-based fee with respect to other accounts managed by the Fund’s portfolio managers.
* The Sub-Adviser imposes certain trading restrictions and reporting requirements for accounts in which a portfolio manager or certain family members have a personal interest in order to confirm that such accounts are not favored over other accounts.
* The Sub-Adviser seeks to avoid portfolio manager assignments with potentially conflicting situations. However, where a portfolio manager is responsible for accounts with differing investment objectives and policies, it is possible that the portfolio manager will conclude that it is in the best interest of one account to sell a portfolio security while another account continues to hold or increase the holding in such security.
(d) Compensation of Portfolio Managers
The Sub-Adviser has adopted a system of compensation for portfolio managers and others involved in the investment process that is applied consistently among investment professionals. At the Sub-Adviser, the structure of compensation of investment professionals is currently comprised of the following basic components: fixed base salary, and an annual investment bonus plan, as well as customary benefits that are offered generally to all full-time employees of the Sub-Adviser. A limited number of senior portfolio managers, who serve as officers of both the Sub-Adviser and its parent company, may also receive options or restricted stock grants of common shares of Manulife Financial.
Only investment professionals are eligible to participate in the Investment Bonus Plan on an annual basis. While the amount of any bonus is discretionary, the following factors are generally used in determining bonuses: 1) The investment performance of all accounts managed by the investment professional over one- and three- year periods are considered. The pre-tax
performance of each account is measured relative to an appropriate peer group benchmark.
2) The profitability of the Sub-Adviser and its parent company are also considered in determining bonus awards, with greater emphasis placed upon the profitability of the Adviser.
3) The more intangible contributions of an investment professional to the Sub-Adviser’s business, including the investment professional’s support of sales activities, new fund/strategy idea generation, professional growth and development, and management, where applicable, are evaluating in determining the amount of any bonus award.
While the profitability of the Sub-Adviser and the investment performance of the accounts that the investment professionals maintain are factors in determining an investment professional’s overall compensation, the investment professional’s compensation is not linked directly to the net asset value of any fund.
ITEM 9. PURCHASES OF EQUITY SECURITIES BY CLOSED-END MANAGEMENT INVESTMENT COMPANY AND AFFILIATED PURCHASERS.
ITEM 10. SUBMISSION OF MATTERS TO A VOTE OF SECURITY HOLDERS.
There were no material changes to previously disclosed John Hancock Funds - Administration Committee Charter and John Hancock Funds - Governance Committee Charter.
ITEM 11. CONTROLS AND PROCEDURES.
|
(a) Based upon their evaluation of the registrant's disclosure controls and procedures as conducted within 90 days of the filing date of this Form N-CSR, the registrant's principal executive officer and principal financial officer have concluded that those disclosure controls and procedures provide reasonable assurance that the material information required to be disclosed by the registrant on this report is recorded, processed, summarized and reported within the time periods specified in the Securities and Exchange Commission's rules and forms.
(b) There were no changes in the registrant's internal control over financial reporting that occurred during the registrant's most recent fiscal half-year (the registrant's second fiscal half-year in the case of an annual report) that have materially affected, or are reasonably likely to materially affect, the registrant's internal control over financial reporting.
(a)(1) Code of Ethics for Senior Financial Officers is attached.
(a)(2) Separate certifications for the registrant's principal executive officer and principal financial officer, as required by Section 302 of the Sarbanes-Oxley Act of 2002 and Rule 30a-2(a) under the Investment Company Act of 1940, are attached.
(b) Separate certifications for the registrant's principal executive officer and principal financial officer, as required by 18 U.S.C. Section 1350, as adopted pursuant to Section 906 of the Sarbanes-Oxley Act of 2002, and Rule 30a-2(b) under the Investment Company Act of 1940, are attached. The certifications furnished pursuant to this paragraph are not deemed to be "filed" for purposes of Section 18 of the Securities Exchange Act of 1934, or otherwise subject to the liability of that section. Such certifications are not deemed to be incorporated by reference into
any filing under the Securities Act of 1933 or the Securities Exchange Act of 1934, except to the extent that the Registrant specifically incorporates them by reference.
(c)(1) Proxy Voting Policies and Procedures are attached.
(c)(2) Approval of Audit, Audit-related, Tax and Other Services is attached.
(c)(3) Contact person at the registrant.
|
Pursuant to the requirements of the Securities Exchange Act of 1934 and the Investment Company Act of 1940, the registrant has duly caused this report to be signed on its behalf by the undersigned, thereunto duly authorized.
John Hancock Tax-Advantaged Dividend Income Fund
By: /s/ Keith F. Hartstein
-------------------------------------
Keith F. Hartstein
President and Chief Executive Officer
Date: February 27, 2006
|
Pursuant to the requirements of the Securities Exchange Act of 1934 and the Investment Company Act of 1940, this report has been signed below by the following persons on behalf of the registrant and in the capacities and on the dates indicated.
By: /s/ Keith F. Hartstein
-------------------------------------
Keith F. Hartstein
President and Chief Executive Officer
Date: February 27, 2006
|
By: /s/ John G. Vrysen
-------------------------------------
John G. Vrysen
Executive Vice President and Chief Financial Officer