| |
| UNITED STATES |
| SECURITIES AND EXCHANGE COMMISSION |
| Washington, D.C. 20549 |
| |
| FORM N-CSR |
| |
| CERTIFIED SHAREHOLDER REPORT OF REGISTERED |
| |
| MANAGEMENT INVESTMENT COMPANIES |
| |
| Investment Company Act file number 811-21416 |
| |
| John Hancock Tax-Advantaged Dividend Income Fund |
| (Exact name of registrant as specified in charter) |
| |
| 601 Congress Street, Boston, Massachusetts 02210 |
| (Address of principal executive offices) (Zip code) |
| |
| Salvatore Schiavone |
| Treasurer |
| |
| 601 Congress Street |
| |
| Boston, Massachusetts 02210 |
| (Name and address of agent for service) |
| |
| Registrant's telephone number, including area code: 617-663-4497 |
| |
|
| Date of fiscal year end: | October 31 |
| |
| Date of reporting period: | October 31, 2012 |
ITEM 1. SCHEDULE OF INVESTMENTS

Management’s discussion of
Fund performance
By John Hancock Asset Management a division of Manulife Asset
Management (US) LLC and Analytic Investors, LLC
Preferred securities posted solid gains in the 12-month period ended October 31, 2012, due to several factors, including global economic uncertainty, low U.S. interest rates and improved corporate earnings among the industry groups that comprise a large portion of the preferred market.
For the 12-month period ended October 31, 2012, John Hancock Tax-Advantaged Dividend Income Fund returned 19.64% at net asset value (NAV) and 22.25% at market price. The difference in the Fund’s NAV and market performance stems from the fact that the market share price is subject to the dynamics of secondary market trading, which could cause it to trade at a discount or premium to the Fund’s NAV share price at any time. By comparison, the group of closed-end diversified equity dividend funds tracked by UBS Securities LLC returned an average of 14.81% at NAV and 19.75% at market price. For the same 12-month period, the Bank of America Merrill Lynch Preferred Stock DRD-Eligible Index rose 13.89% and the S&P MidCap 400 Utilities Index gained 11.80%. These indexes are unleveraged. The Fund’s current annualized distribution rate was 5.77% at NAV and 6.20% at market price on October 31, 2012.
Among the Fund’s best performing holdings during the 12-month period ended October 31, 2012 were the preferred stocks of financial companies. In this category were Royal Bank of Scotland Group PLC, Bank of America Corp. and Wells Fargo & Company. Also, newly issued, tax-advantaged preferred securities issued by U.S. financial companies added value. Among the Fund’s common-stock holdings, an investment in Black Hills Corp., a diversified energy company, was among the standouts. An investment in energy company Phillips 66 also performed well. The company’s value was highlighted when it was spun off from its parent company, ConocoPhillips, in May 2012. Elsewhere, Verizon Communications, Inc. and AT&T, Inc. performed well, bolstered largely by improving fundamentals driven by the rapidly growing use of smartphones and other mobile applications. Detracting from the Fund’s performance were the securities issued by energy company Apache Corp.
This commentary reflects the views of the portfolio managers through the end of the period discussed in this report. The managers’ statements reflect their own opinions. As such, they are in no way guarantees of future events and are not intended to be used as investment advice or a recommendation regarding any specific security. They are also subject to change at any time as market and other conditions warrant.
Past performance is no guarantee of future results.
Tax changes — In prior years, certain dividends paid by the Fund were generally taxed to individuals at a rate of 15%. For tax years beginning after December 31, 2012, such favorable treatment of dividend income is scheduled to expire as are certain other favorable tax provisions. As a result, absent congressional action, the maximum tax rate on dividend income will increase from 15% to 39.6%. Congress is considering various tax law changes that could alter these changes in tax rates or that could otherwise affect the Fund or its shareholders.
Sector investing is subject to greater risks than the market as a whole. Because the Fund may focus on particular sectors of the economy, its performance may depend on the performance of those sectors.
| |
| 6 | Tax-Advantaged Dividend Income Fund | Annual report |
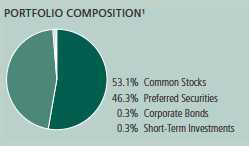
Portfolio summary
| | | | |
| Top 10 Issuers (26.0% of Total Investments on 10-31-12)1,2 | |
|
| DTE Energy Company | 3.2% | | Spectra Energy Corp. | 2.5% |
| |
|
| Wells Fargo & Company | 3.2% | | CH Energy Group, Inc. | 2.4% |
| |
|
| OGE Energy Corp. | 2.8% | | American Electric Power Company, Inc. | 2.3% |
| |
|
| ONEOK, Inc. | 2.6% | | Integrys Energy Group, Inc. | 2.3% |
| |
|
| Bank of America Corp. | 2.5% | | Atmos Energy Corp. | 2.2% |
| |
|
| |
| Sector Composition1,3 | | | | |
|
| Utilities | 53.2% | | Industrials | 0.8% |
| |
|
| Financials | 31.5% | | Materials | 0.3% |
| |
|
| Energy | 9.0% | | Short-Term Investments | 0.3% |
| |
|
| Telecommunication Services | 4.9% | | | |
| | |
1 As a percentage of the Fund’s total investments on 10-31-12.
2 Cash and cash equivalents not included.
3 Sector investing is subject to greater risks than the market as a whole. Because the Fund may focus on particular sectors of the economy, its performance may depend on the performance of those sectors.
| |
| Annual report | Tax-Advantaged Dividend Income Fund | 7 |
Fund’s investments
As of 10-31-12
| | |
| | Shares | Value |
| Common Stocks 79.8% (53.1% of Total Investments) | | $617,152,880 |
|
| (Cost $509,121,247) | | |
| | | |
| Energy 9.8% | | 75,980,090 |
| | | |
| Oil, Gas & Consumable Fuels 9.8% | | |
|
| BP PLC, ADR (Z) | 187,500 | 8,041,875 |
|
| Chevron Corp. | 92,000 | 10,139,320 |
|
| ConocoPhillips | 142,500 | 8,243,625 |
|
| Phillips 66 | 71,250 | 3,360,150 |
|
| Royal Dutch Shell PLC, ADR | 69,000 | 4,725,120 |
|
| Spectra Energy Corp. (Z) | 1,000,000 | 28,870,000 |
|
| Total SA, ADR (Z) | 250,000 | 12,600,000 |
| | | |
| Industrials 1.2% | | 9,687,600 |
| | | |
| Industrial Conglomerates 1.2% | | |
|
| General Electric Company (Z) | 460,000 | 9,687,600 |
| | | |
| Materials 0.4% | | 3,188,160 |
| | | |
| Metals & Mining 0.4% | | |
|
| Freeport-McMoRan Copper & Gold, Inc. (Z) | 82,000 | 3,188,160 |
| | | |
| Telecommunication Services 4.7% | | 36,033,520 |
| | | |
| Diversified Telecommunication Services 3.1% | | |
|
| AT&T, Inc. (Z) | 390,000 | 13,490,100 |
|
| Verizon Communications, Inc. (Z) | 230,000 | 10,267,200 |
| | | |
| Wireless Telecommunication Services 1.6% | | |
|
| Vodafone Group PLC, ADR (Z) | 451,000 | 12,276,220 |
| | | |
| Utilities 63.7% | | 492,263,510 |
| | | |
| Electric Utilities 25.8% | | |
|
| American Electric Power Company, Inc. (Z) | 595,000 | 26,441,800 |
|
| Duke Energy Corp. | 330,000 | 21,677,700 |
|
| Entergy Corp. (Z) | 192,500 | 13,971,650 |
|
| FirstEnergy Corp. (Z) | 530,000 | 24,231,600 |
|
| Northeast Utilities | 657,500 | 25,839,750 |
|
| NV Energy, Inc. | 40,000 | 760,400 |
|
| OGE Energy Corp. | 560,000 | 32,244,800 |
|
| The Southern Company (Z) | 375,000 | 17,565,000 |
|
| UIL Holdings Corp. (C)(Z) | 510,000 | 18,446,700 |
|
| Xcel Energy, Inc. (Z) | 635,000 | 17,938,750 |
| | |
| 8 | Tax-Advantaged Dividend Income Fund | Annual report | See notes to financial statements |
| | |
| | Shares | Value |
| Gas Utilities 8.3% | | |
|
| AGL Resources, Inc. | 90,000 | $3,674,700 |
|
| Atmos Energy Corp. | 725,000 | 26,078,250 |
|
| Northwest Natural Gas Company | 85,000 | 3,955,050 |
|
| ONEOK, Inc. | 650,000 | 30,745,000 |
| | | |
| Multi-Utilities 29.6% | | |
|
| Alliant Energy Corp. | 160,000 | 7,152,000 |
|
| Ameren Corp. (Z) | 555,000 | 18,248,400 |
|
| Black Hills Corp. (Z) | 602,500 | 21,551,425 |
|
| CH Energy Group, Inc. (C)(Z) | 435,000 | 28,288,050 |
|
| Dominion Resources, Inc. (Z) | 420,000 | 22,167,600 |
|
| DTE Energy Company | 500,000 | 31,050,000 |
|
| Integrys Energy Group, Inc. (Z) | 485,000 | 26,209,400 |
|
| National Grid PLC, ADR | 200,000 | 11,402,000 |
|
| NiSource, Inc. (Z) | 790,500 | 20,134,035 |
|
| Public Service Enterprise Group, Inc. (Z) | 360,000 | 11,534,400 |
|
| TECO Energy, Inc. | 425,000 | 7,594,750 |
|
| Vectren Corp. (Z) | 790,000 | 23,360,300 |
| |
| Preferred Securities 69.6% (46.3% of Total Investments) | | $537,905,096 |
|
| (Cost $497,521,438) | | |
| | | |
| Energy 3.7% | | 28,797,621 |
| | | |
| Oil, Gas & Consumable Fuels 3.7% | | |
|
| Apache Corp., Series D, 6.000% | 125,000 | 5,832,500 |
|
| Nexen, Inc., 7.350% (C)(Z) | 901,300 | 22,965,121 |
| | | |
| Financials 47.4% | | 366,298,860 |
| | | |
| Capital Markets 2.5% | | |
|
| State Street Corp., 5.250% (I) | 628,000 | 16,221,240 |
|
| The Goldman Sachs Group, Inc., Series B, | | |
| 6.200% | 123,000 | 3,098,370 |
| | | |
| Commercial Banks 16.3% | | |
|
| Barclays Bank PLC, Series 3, 7.100% | 30,000 | 756,900 |
|
| Barclays Bank PLC, Series 5, 8.125% (Z) | 505,000 | 13,054,250 |
|
| BB&T Corp., 5.625% (Z) | 507,500 | 12,966,625 |
|
| BB&T Corp., 5.200% (I) | 202,750 | 5,018,063 |
|
| HSBC Holdings PLC, 8.125% (Z) | 50,000 | 1,289,500 |
|
| HSBC Holdings PLC, 8.000% (C)(Z) | 325,000 | 9,171,500 |
|
| PNC Financial Services Group, Inc., 5.375% (I) | 354,500 | 8,912,130 |
|
| PNC Financial Services Group, Inc. (6.125% to | | |
| 5-1-22, then 3 month LIBOR + 4.067%) | 40,000 | 1,120,000 |
|
| Royal Bank of Scotland Group PLC, Series L, | | |
| 5.750% (Z) | 858,500 | 19,874,275 |
|
| Santander Finance Preferred SA Unipersonal, | | |
| Series 10, 10.500% | 277,000 | 7,548,250 |
|
| Santander Finance Preferred SA, Series 1, | | |
| 6.410% | 15,500 | 370,915 |
|
| Santander Holdings USA, Inc., Series C, | | |
| 7.300% | 111,610 | 2,866,145 |
| | |
| See notes to financial statements | Annual report | Tax-Advantaged Dividend Income Fund | 9 |
| | |
| | Shares | Value |
| Commercial Banks (continued) | | |
|
| US Bancorp (6.500% to 1-15-22, then 3 month | | |
| LIBOR + 4.468%) | 204,500 | $6,047,065 |
|
| Wells Fargo & Company, 8.000% (Z) | 1,207,000 | 36,680,730 |
| | | |
| Consumer Finance 2.0% | | |
|
| HSBC Finance Corp., Depositary Shares, | | |
| Series B, 6.360% (Z) | 469,003 | 11,851,706 |
|
| SLM Corp., Series A, 6.970% (Z) | 74,000 | 3,543,860 |
| | | |
| Diversified Financial Services 23.3% | | |
|
| Bank of America Corp., 6.700% (Z) | 500,000 | 12,925,000 |
|
| Bank of America Corp., 6.375% (Z) | 139,000 | 3,487,510 |
|
| Bank of America Corp., 6.625% (Z) | 355,000 | 9,418,150 |
|
| Bank of America Corp., 8.200% (Z) | 135,000 | 3,439,800 |
|
| Bank of America Corp., Depositary Shares, | | |
| Series D, 6.204% (Z) | 240,000 | 5,985,600 |
|
| Bank of America Corp., Series MER, 8.625% (C)(Z) | 652,800 | 16,972,800 |
|
| Bank of New York Mellon Corp., 5.200% (I)(Z) | 415,000 | 10,441,400 |
|
| Citigroup Capital VIII, 6.950% (Z) | 540,000 | 13,635,000 |
|
| Citigroup, Inc., 8.125% | 270,400 | 7,828,080 |
|
| Deutsche Bank Capital Funding Trust VIII, | | |
| 6.375% (Z) | 282,000 | 7,007,700 |
|
| Deutsche Bank Contingent Capital Trust II, | | |
| 6.550% | 310,000 | 8,025,900 |
|
| Deutsche Bank Contingent Capital Trust III, | | |
| 7.600% (Z) | 797,893 | 21,359,596 |
|
| Goldman Sachs Group, Inc., 5.950% (I) | 487,000 | 12,199,350 |
|
| ING Groep NV, 7.050% (Z) | 140,000 | 3,523,800 |
|
| ING Groep NV, 6.200% (Z) | 109,100 | 2,651,130 |
|
| JPMorgan Chase & Company, 8.625% (Z) | 140,000 | 3,670,800 |
|
| JPMorgan Chase & Company, 5.500% (Z) | 770,000 | 19,327,000 |
|
| RBS Capital Funding Trust VII, 6.080% (I) | 983,000 | 18,382,100 |
| | | |
| Insurance 3.3% | | |
|
| MetLife, Inc., Series B, 6.500% (Z) | 995,500 | 25,524,620 |
| | | |
| Thrifts & Mortgage Finance 0.0% | | |
|
| Federal National Mortgage Association, Series S, 8.250% (I) | 60,000 | 102,000 |
| | | |
| Telecommunication Services 2.7% | | 20,837,790 |
| | | |
| Diversified Telecommunication Services 1.7% | | |
|
| Qwest Corp., 7.500% (Z) | 120,000 | 3,290,400 |
|
| Qwest Corp., 7.375% (Z) | 366,000 | 9,969,840 |
| | | |
| Wireless Telecommunication Services 1.0% | | |
|
| Telephone & Data Systems, Inc., 6.875% (Z) | 243,000 | 6,743,250 |
|
| United States Cellular Corp., 6.950% | 30,000 | 834,300 |
| | | |
| Utilities 15.8% | | 121,970,825 |
| | | |
| Electric Utilities 11.6% | | |
|
| Alabama Power Company, Class A, 5.300% | 186,780 | 4,912,314 |
|
| Carolina Power & Light Company, 5.440% (Z) | 111,493 | 11,295,635 |
|
| Duquesne Light Company, 6.500% | 427,000 | 21,264,600 |
|
| Entergy Arkansas, Inc., 4.560% (Z) | 9,388 | 935,280 |
|
| Entergy Arkansas, Inc., 6.450% (Z) | 110,000 | 2,767,193 |
| | |
| 10 | Tax-Advantaged Dividend Income Fund | Annual report | See notes to financial statements |
| | | | | |
| | | | | Shares | Value |
| Electric Utilities (continued) | | | | | |
|
| Entergy Mississippi, Inc., 4.920% (Z) | | | | 8,190 | $796,734 |
|
| Entergy Mississippi, Inc., 6.250% (Z) | | | | 197,500 | 4,974,531 |
|
| Mississippi Power Company, 5.250% | | | | 262,500 | 6,906,375 |
|
| NextEra Energy Capital Holdings, Inc., 5.700% | | | | 72,500 | 1,928,500 |
|
| PPL Corp., 9.500% (C)(Z) | | | | 285,000 | 15,484,050 |
|
| SCE Trust I, 5.625% | | | | 55,000 | 1,436,600 |
|
| Southern California Edison Company, | | | | | |
| 6.125% (Z) | | | | 50,000 | 5,056,250 |
|
| Southern California Edison Company, Series C, | | | | | |
| 6.000% (Z) | | | | 117,000 | 11,751,188 |
| | | | | | |
| Independent Power Producers & Energy Traders 2.0% | | |
|
| Constellation Energy Group, Inc., Series A, | | | | | |
| 8.625% (Z) | | | | 600,000 | 15,774,000 |
| | | | | | |
| Multi-Utilities 2.2% | | | | | |
|
| BGE Capital Trust II, 6.200% (Z) | | | | 160,500 | 4,156,950 |
|
| DTE Energy Company, 5.250% (I) | | | | 100,000 | 2,548,000 |
|
| DTE Energy Company, 6.500% | | | | 130,000 | 3,680,625 |
|
| Interstate Power & Light Company, Series B, | | | | | |
| 8.375% | | | | 230,000 | 6,302,000 |
| |
| | | | Maturity | | |
| | Rate (%) | | date | Par value | Value |
| Corporate Bonds 0.4% (0.3% of Total Investments) | | $3,297,780 |
|
| (Cost $3,000,000) | | | | | |
| | | | | | |
| Utilities 0.4% | | | | | 3,297,780 |
| | | | | | |
| Southern California Edison Company | | | | | |
| (6.25% to 2-1-22, then 3 month LIBOR + | | | | | |
| 4.199%) (Q) | 6.250 | | 02-01-22 | $3,000,000 | 3,297,780 |
| |
| | | | | Shares | Value |
| Short-Term Investments 0.4% (0.3% of Total Investments) | | $3,086,000 |
|
| (Cost $3,086,000) | | | | | |
| | | | | | |
| Repurchase Agreement 0.4% | | | | | 3,086,000 |
| | | | | | |
| Repurchase Agreement with State Street Corp. dated 10-31-12 at 0.010% | | |
| to be repurchased at $3,086,001 on 11-1-12, collateralized by $2,305,000 | | |
| U.S. Treasury Notes, 4.625% due 2-15-40 (valued at $3,155,305, | | |
| including interest) | | | | 3,086,000 | 3,086,000 |
| |
| Total investments (Cost $1,012,728,685)† 150.2% | $1,161,441,756 |
|
| |
| Other assets and liabilities, net (50.2%) | | | ($388,293,853) |
|
| |
| Total net assets 100.0% | | | | | $773,147,903 |
|
The percentage shown for each investment category is the total value the category as a percentage of the net assets of the Fund.
| | |
| See notes to financial statements | Annual report | Tax-Advantaged Dividend Income Fund | 11 |
Notes to Schedule of Investments
ADR American Depositary Receipts
LIBOR London Interbank Offered Rate
(C) All or a portion of this security is segregated as collateral for options. Total collateral value at 10-31-12 was $106,582,410.
(I) Non-income producing security.
(Q) Perpetual bonds have no stated maturity date. Date shown is next call date.
(Z) A portion of this security is segregated as collateral pursuant to the Credit Facility Agreement. Total collateral value at 10-31-12 was $555,147,429.
† At 10-31-12, the aggregate cost of investment securities for federal income tax purposes was $1,020,678,287. Net unrealized appreciation aggregated $140,763,469, of which $167,180,639 related to appreciated investment securities and $26,417,170 related to depreciated investment securities.
| | |
| 12 | Tax-Advantaged Dividend Income Fund | Annual report | See notes to financial statements |
F I N A N C I A L S T A T E M E N T S
Financial statements
Statement of assets and liabilities 10-31-12
This Statement of assets and liabilities is the Fund’s balance sheet. It shows the value of what the Fund owns, is due and owes. You’ll also find the net asset value for each common share.
| |
| Assets | |
|
| Investments, at value (Cost $1,012,728,685) | $1,161,441,756 |
| Cash | 97,227 |
| Cash segregated at custodian for swap contracts | 3,080,000 |
| Receivable for investments sold | 1,636,838 |
| Dividends and interest receivable | 2,338,340 |
| Other receivables and prepaid expenses | 71,948 |
| | |
| Total assets | 1,168,666,109 |
| |
| Liabilities | |
|
| Credit facility agreement payable | 390,300,000 |
| Payable for investments purchased | 955,600 |
| Written options, at value (Premiums received $609,525) | 112,690 |
| Swap contracts, at value | 3,724,865 |
| Interest payable | 245,059 |
| Payable to affiliates | |
| Accounting and legal services fees | 27,416 |
| Trustees’ fees | 44,563 |
| Other liabilities and accrued expenses | 108,013 |
| | |
| Total liabilities | 395,518,206 |
| |
| Net assets | |
|
| Paid-in capital | $705,004,523 |
| Undistributed net investment income | 2,299,694 |
| Accumulated net realized gain (loss) on investments, written options and | |
| swap agreements | (79,641,355) |
| Net unrealized appreciation (depreciation) on investments, written options | |
| and swap agreements | 145,485,041 |
| | |
| Net assets | $773,147,903 |
| |
| Net asset value per share | |
|
| Based on 37,734,746 shares of beneficial interest outstanding — unlimited | |
| number of shares authorized with no par value | $20.49 |
| | |
| See notes to financial statements | Annual report | Tax-Advantaged Dividend Income Fund | 13 |
F I N A N C I A L S T A T E M E N T S
Statement of operations For the year ended 10-31-12
This Statement of operations summarizes the Fund’s investment income earned, expenses incurred in operating the Fund and net gains (losses) for the period stated.
| |
| Investment income | |
|
| Dividends | $56,754,770 |
| Interest | 392,876 |
| Less foreign taxes withheld | (162,284) |
| | |
| Total investment income | 56,985,362 |
| |
| Expenses | |
|
| Investment management fees | 8,105,175 |
| Accounting and legal services fees | 152,119 |
| Transfer agent fees | 38,284 |
| Trustees’ fees | 54,503 |
| Printing and postage | 101,989 |
| Professional fees | 107,607 |
| Custodian fees | 86,365 |
| Registration and filing fees | 16,582 |
| Interest expense | 3,266,525 |
| Stock exchange listing fees | 33,449 |
| Other | 35,252 |
| | |
| Total expenses | 11,997,850 |
| Less expense reductions | (169,439) |
| | |
| Net expenses | 11,828,411 |
| | |
| Net investment income | 45,156,951 |
| |
| Realized and unrealized gain (loss) | |
|
| Net realized gain (loss) on | |
| Investments | 4,192,611 |
| Written options | (1,182,643) |
| Swap contracts | (786,294) |
| | |
| | 2,223,674 |
| Change in net unrealized appreciation (depreciation) of | |
| Investments | 82,747,441 |
| Written options | 634,486 |
| Swap contracts | (2,569,800) |
| | |
| | 80,812,127 |
| | |
| Net realized and unrealized gain | 83,035,801 |
| | |
| Increase in net assets from operations | $128,192,752 |
| | |
| 14 | Tax-Advantaged Dividend Income Fund | Annual report | See notes to financial statements |
F I N A N C I A L S T A T E M E N T S
Statements of changes in net assets
These Statements of changes in net assets show how the value of the Fund’s net assets has changed during the last two periods. The difference reflects earnings less expenses, any investment gains and losses, distributions, if any, paid to shareholders and the net of Fund share transactions.
| | |
| | Year | Year |
| | ended | ended |
| | 10-31-12 | 10-31-11 |
| Increase (decrease) in net assets | | |
|
| From operations | | |
| Net investment income | $45,156,951 | $45,397,254 |
| Net realized gain | 2,223,674 | 14,383,305 |
| Change in net unrealized appreciation (depreciation) | 80,812,127 | 46,038,333 |
| | | |
| Increase in net assets resulting from operations | 128,192,752 | 105,818,892 |
| | | |
| Distributions to shareholders | | |
| From net investment income | (44,602,470) | (42,434,737) |
| | | |
| From Fund share transactions | — | (4,227,969) |
| | | |
| Total increase | 83,590,282 | 59,156,186 |
| | | |
| Net assets | | |
|
| Beginning of year | 689,557,621 | 630,401,435 |
| | | |
| End of year | $773,147,903 | $689,557,621 |
| | | |
| Undistributed net investment income | $2,299,694 | $2,709,412 |
| | | |
| Share activity | | |
|
| Shares outstanding | | |
| Beginning of year | 37,734,746 | 38,011,417 |
| Shares repurchased | — | 276,671 |
| | | |
| End of year | 37,734,746 | 37,734,746 |
| | |
| See notes to financial statements | Annual report | Tax-Advantaged Dividend Income Fund | 15 |
F I N A N C I A L S T A T E M E N T S
Statement of cash flows 10-31-12
This Statement of cash flows shows cash flow from operating and financing activities for the period stated.
| |
| | For the |
| | year ended |
| | 10-31-12 |
| Cash flows from operating activities | |
|
| Net increase in net assets from operations | $128,192,752 |
| Adjustments to reconcile net increase in net assets from operations to net | |
| cash used in operating activities: | |
| Long-term investments purchased | (175,385,265) |
| Long-term investments sold | 126,027,552 |
| Increase in short term investments | (121,000) |
| Decrease in dividends and interest receivable | 92,568 |
| Increase in payable for investments purchased | 853,274 |
| Decrease in receivable for investments sold | 6,289,217 |
| Increase in cash segregated at custodian for swap contracts | (2,670,000) |
| Decrease in other receivables and prepaid expenses | 24,745 |
| Increase in unrealized depreciation of swap contracts | 2,569,800 |
| Decrease in payable for written options | (1,853,410) |
| Increase in payable to affiliates | 28,633 |
| Increase in interest payable | 208,921 |
| Decrease in other liabilities and accrued expenses | (11,312) |
| Net change in unrealized (appreciation) depreciation on investments | (82,747,441) |
| Net realized gain on investments | (4,192,611) |
| | |
| Net cash used in operating activities | ($2,693,577) |
|
| Cash flows from financing activities | |
| Borrowings from credit facility agreement payable | $46,300,000 |
| Distributions to common shareholders | (44,602,470) |
| | |
| Net cash provided by financing activities | $1,697,530 |
| | |
| Net decrease in cash | ($996,047) |
| |
| Cash at beginning of period | $1,093,274 |
| | |
| Cash at end of period | $97,227 |
| | |
| Supplemental disclosure of cash flow information | |
|
| Cash paid for interest | $3,057,604 |
| | |
| 16 | Tax-Advantaged Dividend Income Fund | Annual report | See notes to financial statements |
Financial highlights
The Financial highlights show how the Fund’s net asset value for a share has changed during the period.
| | | | | | |
| COMMON SHARES Period ended | 10-31-12 | 10-31-11 | 10-31-10 | 10-31-091 | 12-31-08 | 12-31-07 |
| |
| Per share operating performance | | | | | | |
|
| Net asset value, beginning of period | $18.27 | $16.58 | $12.87 | $12.48 | $19.99 | $22.90 |
| Net investment income2 | 1.20 | 1.20 | 1.10 | 0.88 | 1.13 | 1.26 |
| Net realized and unrealized gain (loss) | | | | | | |
| on investments | 2.20 | 1.60 | 3.69 | 0.56 | (7.07) | (1.98) |
| Distributions to Auction Preferred | | | | | | |
| Shares (APS)* | — | — | — | — | (0.15) | (0.41) |
| Total from investment operations | 3.40 | 2.80 | 4.79 | 1.44 | (6.09) | (1.13) |
| Less distributions to | | | | | | |
| common shareholders | | | | | | |
| From net investment income | (1.18) | (1.12) | (1.09) | (0.83) | (0.99) | (1.19) |
| From net realized gain | — | — | — | — | (0.15) | (0.59) |
| From tax return of capital | — | — | — | (0.23) | (0.44) | — |
| Total distributions | (1.18) | (1.12) | (1.09) | (1.06) | (1.58) | (1.78) |
| Anti-dilutive impact of repurchase plan | — | 0.013 | 0.013 | 0.013 | 0.163 | — |
| Net asset value, end of period | $20.49 | $18.27 | $16.58 | $12.87 | $12.48 | $19.99 |
| Per share market value, end of period | $19.07 | $16.64 | $15.41 | $11.35 | $10.30 | $17.90 |
| Total return at net asset value (%)4,5 | 19.64 | 18.16 | 39.49 | 15.346 | (29.97) | (4.19) |
| Total return at market value (%)4 | 22.25 | 15.79 | 47.01 | 23.246 | (35.46) | (3.32) |
| |
| Ratios and supplemental data | | | | | | |
|
| Net assets applicable to common | | | | | | |
| shares, end of period (in millions) | $773 | $690 | $630 | $493 | $480 | $841 |
| Ratios (as a percentage of average | | | | | | |
| net assets): | | | | | | |
| Expenses before reductions | 1.65 | 1.777 | 2.03 | 2.268 | 2.29 | 1.279 |
| Expenses net of fee waivers | | | | | | |
| and credits | 1.62 | 1.567 | 1.86 | 2.018 | 1.99 | 0.9910 |
| Net investment income | 6.19 | 6.98 | 7.37 | 9.448 | 7.02 | 5.6511 |
| Portfolio turnover (%) | 12 | 16 | 20 | 21 | 29 | 26 |
| |
| Senior securities | | | | | | |
|
| Total value of APS outstanding | | | | | | |
| (in millions) | — | — | — | — | — | $380 |
| Involuntary liquidation preference per | | | | | | |
| unit (in thousands) | — | — | — | — | — | 25 |
| Average market value per unit | | | | | | |
| (in thousands) | — | — | — | — | — | 25 |
| Asset coverage per unit12 | — | — | — | — | — | $81,737 |
| Total debt outstanding end of period (in | | | | | | |
| millions) (Note 8) | $390 | $344 | $311 | $253 | $267 | — |
| Asset coverage per $1,000 of APS13 | — | — | — | — | — | $3,212 |
| Asset coverage per $1,000 of debt14 | $2,981 | $3,005 | $3,030 | $2,946 | $2,797 | — |
| | |
| See notes to financial statements | Annual report | Tax-Advantaged Dividend Income Fund | 17 |
* Auction Preferred Shares (APS).
1 For the ten-month period ended 10-31-09. The Fund changed its fiscal year end from December 31 to October 31.
2 Based on the average daily shares outstanding.
3 The repurchase plan was completed at an average repurchase price of $15.28, $13.80, $10.29 and $14.92, respectively, for 276,671 shares, 302,900 shares, 173,600 shares and 3,589,570 shares, respectively. The repurchases for the periods ended 10-31-11, 10-31-10, 10-31-09 and 12-31-08 were $4,227,969, $4,178,919, $1,786,938 and $53,556,991, respectively, and had a $0.01, $0.01, $0.01 and $0.16 NAV impact, respectively.
4 Total return based on net asset value reflects changes in the Fund’s net asset value during each period. Total return based on market value reflects changes in market value. Each figure assumes that net investment income, capital gain and return of capital gain distributions, if any, were reinvested. These figures will differ depending upon the level of any discount from or premium to net asset value at which the Fund’s shares traded during the period.
5 Total returns would have been lower had certain expenses not been reduced during the periods shown.
6 Not annualized.
7 Includes non-recurring litigation fees which represent 0.02% and 0.14% of average net assets for the years ended 10-31-11 and 10-31-10, respectively. Insurance recovery expense reduction for the year ended 10-31-11 represents 0.11% of average net assets.
8 Annualized.
9 Ratios calculated on the basis of gross expenses relative to the average net assets of common shares that does not take into consideration expense reductions during the periods shown. Without the exclusion of preferred shares, the annualized ratio of expenses would have been 0.90% for the period ended 12-31-07.
10 Ratios calculated on the basis of net expenses relative to the average net assets of common shares. Without the exclusion of preferred shares, the annualized ratio of expenses would have been 0.70% for the period ended 12-31-07.
11 Ratios calculated on the basis of net investment income relative to the average net assets of common shares. Without the exclusion of preferred shares, the annualized ratio of net investment income would have been 4.03% for the period ended 12-31-07.
12 Calculated by subtracting the Fund’s total liabilities from the Fund’s total assets and dividing that amount by the number of APS outstanding as of the applicable 1940 Act Evaluation Date, which may differ from the financial reporting date.
13 Asset coverage equals the total net assets plus APS divided by the APS of the Fund outstanding at period end.
14 Asset coverage equals the total net assets plus borrowings divided by the borrowings of the Fund outstanding at period end (Note 8). As debt outstanding changes, the level of invested assets may change accordingly. Asset coverage ratio provides a consistent measure of leverage.
| | |
| 18 | Tax-Advantaged Dividend Income Fund | Annual report | See notes to financial statements |
Notes to financial statements
Note 1 — Organization
John Hancock Tax-Advantaged Dividend Income Fund (the Fund) is a closed-end management investment company organized as a Massachusetts business trust and registered under the Investment Company Act of 1940, as amended (the 1940 Act).
Note 2 — Significant accounting policies
The financial statements have been prepared in conformity with accounting principles generally accepted in the United States of America, which require management to make certain estimates and assumptions at the date of the financial statements. Actual results could differ from those estimates. Events or transactions occurring after the end of the fiscal period through the date that the financial statements were issued have been evaluated in the preparation of the financial statements. The following summarizes the significant accounting policies of the Fund:
Security valuation. Investments are stated at value as of the close of regular trading on the New York Stock Exchange (NYSE), normally at 4:00 P.M., Eastern Time. In order to value the securities, the Fund uses the following valuation techniques: Equity securities held by the Fund are valued at the last sale price or official closing price on the principal securities exchange on which they trade. In the event there were no sales during the day or closing prices are not available, then the securities are valued using the last quoted bid or evaluated price. Options listed on an exchange are valued at the mean between the last bid and ask prices from the exchange on which they are principally traded. For options not listed on an exchange, an independent pricing source is used to value the options at the mean between the last bid and ask prices. Swaps are marked-to-market daily based upon values from third party vendors, which may include a registered commodities exchange, or broker quotations. Foreign securities and currencies are valued in U.S. dollars, based on foreign currency exchange rates supplied by an independent pricing service. Certain securities traded only in the over-the-counter market are valued at the last bid price quoted by brokers making markets in the securities at the close of trading. Certain short-term securities are valued at amortized cost. Other portfolio securities and assets, where reliable market quotations are not available, are valued at fair value as determined in good faith by the Fund’s Pricing Committee following procedures established by the Board of Trustees, which include price verification procedures. The frequency with which these fair valuation procedures are used cannot be predicted.
The Fund uses a three-tier hierarchy to prioritize the pricing assumptions, referred to as inputs, used in valuation techniques to measure fair value. Level 1 includes securities valued using quoted prices in active markets for identical securities. Level 2 includes securities valued using significant observable inputs. Observable inputs may include quoted prices for similar securities, interest rates, prepayment speeds and credit risk. Prices for securities valued using these inputs are received from independent pricing vendors and brokers and are based on an evaluation of the inputs described. Level 3 includes securities valued using significant unobservable inputs when market prices are not readily available or reliable, including the Fund’s own assumptions in determining the fair value of investments. Factors used in determining value may include market or issuer specific events or trends, changes in interest rates and credit quality. The inputs or methodology used for valuing securities are not necessarily an indication of the risks associated with investing in those securities. Changes in valuation techniques may result in transfers into or out of an assigned level within the disclosure hierarchy. Securities with a market value of approximately $21,737,000 at the beginning
| |
| Annual report | Tax-Advantaged Dividend Income Fund | 19 |
of the year were transferred from Level 2 to Level 1 during the year since quoted prices in active markets for identical securities became available.
The following is a summary of the values by input classification of the Fund’s investments as of October 31, 2012, by major security category or type:
| | | | |
| | | | | LEVEL 3 |
| | | | LEVEL 2 | SIGNIFICANT |
| | TOTAL MARKET | LEVEL 1 | SIGNIFICANT | UNOBSERVABLE |
| | VALUE AT 10-31-12 | QUOTED PRICE | OBSERVABLE INPUTS | INPUTS |
|
| Common Stocks | | | | |
| Energy | $75,980,090 | $75,980,090 | — | — |
| Industrials | 9,687,600 | 9,687,600 | — | — |
| Materials | 3,188,160 | 3,188,160 | — | — |
| Telecommunication | | | | |
| Services | 36,033,520 | 36,033,520 | — | — |
| Utilities | 492,263,510 | 492,263,510 | — | — |
| Preferred Securities | | | | |
| Energy | 28,797,621 | 28,797,621 | — | — |
| Financials | 366,298,860 | 366,298,860 | — | — |
| Telecommunication | | | | |
| Services | 20,837,790 | 20,837,790 | — | — |
| Utilities | 121,970,825 | 78,784,889 | $43,185,936 | — |
| Corporate Bonds | | | | |
| Utilities | 3,297,780 | — | 3,297,780 | — |
| Short-Term Investments | 3,086,000 | — | 3,086,000 | — |
| |
|
| Total Investments in | | | | |
| Securities | $1,161,441,756 | $1,111,872,040 | $49,569,716 | — |
| Other Financial | | | | |
| Instruments | | | | |
| Written Options | ($112,690) | ($112,690) | — | — |
| Interest Rate Swaps | ($3,724,865) | — | ($3,724,865) | — |
Repurchase agreements. The Fund may enter into repurchase agreements. When the Fund enters into a repurchase agreement, it receives collateral which is held in a segregated account by the Fund’s custodian. The collateral amount is marked-to-market and monitored on a daily basis to ensure that the collateral held is in an amount not less than the principal amount of the repurchase agreement plus any accrued interest. In the event of a default by the counterparty, realization of the collateral proceeds could be delayed, during which time the collateral value may decline.
Security transactions and related investment income. Investment security transactions are accounted for on a trade date plus one basis for daily net asset value calculations. However, for financial reporting purposes, investment transactions are reported on trade date. Interest income is accrued as earned. Dividend income is recorded on the ex-date, except for dividends of foreign securities where the dividend may not be known until after the ex-date. In those cases, dividend income, net of withholding taxes, is recorded when the Fund becomes aware of the dividends. Foreign taxes are provided for based on the Fund’s understanding of the tax rules and rates that exist in the foreign markets in which it invests. Gains and losses on securities sold are determined on the basis of identified cost and may include proceeds from litigation.
Foreign taxes. The Fund may be subject to withholding tax on income or capital gains or repatriation taxes as imposed by certain countries in which it invests. Taxes are accrued based upon net investment income, net realized gains or net unrealized appreciation.
| |
| 20 | Tax-Advantaged Dividend Income Fund | Annual report |
Overdrafts. Pursuant to the custodian agreement, the Fund’s custodian may, in its discretion, advance funds to the Fund to make properly authorized payments. When such payments result in an overdraft, the Fund is obligated to repay the custodian for any overdraft, including any costs or expenses associated with the overdraft. The custodian may have a lien, security interest or security entitlement in any Fund property that is not otherwise segregated or pledged, to the maximum extent permitted by law, to the extent of any overdraft.
Expenses. Within the John Hancock Funds complex, expenses that are directly attributable to an individual fund are allocated to such fund. Expenses that are not readily attributable to a specific fund are allocated among all funds in an equitable manner, taking into consideration, among other things, the nature and type of expense and the fund’s relative net assets. Expense estimates are accrued in the period to which they relate and adjustments are made when actual amounts are known.
Federal income taxes. The Fund intends to continue to qualify as a regulated investment company by complying with the applicable provisions of the Internal Revenue Code and will not be subject to federal income tax on taxable income that is distributed to shareholders. Therefore, no federal income tax provision is required.
Under the Regulated Investment Company Modernization Act of 2010, the Fund is permitted to carry forward capital losses incurred in taxable years beginning after December 22, 2010 for an unlimited period. Any losses incurred during those taxable years will be required to be utilized prior to the losses incurred in pre-enactment taxable years. As a result of this ordering rule, pre-enactment capital loss carryforwards may be more likely to expire unused. Additionally, post-enactment capital losses that are carried forward will retain their character as either short-term or long-term capital losses rather than being considered all short-term as under previous law.
For federal income tax purposes, the Fund has a capital loss carryforward of $71,605,008 available to offset future net realized capital gains as of October 31, 2012, which expires on October 31, 2017.
As of October 31, 2012, the Fund had no uncertain tax positions that would require financial statement recognition, derecognition or disclosure. The Fund’s federal tax returns are subject to examination by the Internal Revenue Service for a period of three years.
Distribution of income and gains. Distributions to shareholders from net investment income and net realized gains, if any, are recorded on the ex-date. The Fund generally declares and pays dividends monthly and capital gain distributions, if any, annually. The tax character of distributions for the years ended October 31, 2012 and October 31, 2011 was as follows:
| | | | | |
| | OCTOBER 31, 2012 | OCTOBER 31, 2011 | | | |
| | | |
| Ordinary Income | $44,602,470 | $42,434,737 | | | |
As of October 31, 2012, the components of distributable earnings on a tax basis consisted of $2,329,170 of undistributed ordinary income.
Such distributions and distributable earnings, on a tax basis, are determined in conformity with income tax regulations, which may differ from accounting principles generally accepted in the United States of America. Material distributions in excess of tax basis earnings and profits, if any, are reported in the Fund’s financial statements as a return of capital.
Capital accounts within the financial statements are adjusted for permanent book-tax differences. These adjustments have no impact on net assets or the results of operations. Temporary book-tax differences, if any, will reverse in a subsequent period. Book-tax differences are primarily attributable to derivative transactions and wash sale loss deferrals.
| |
| Annual report | Tax-Advantaged Dividend Income Fund | 21 |
Statement of cash flows. Information on financial transactions that have been settled through the receipt and disbursement of cash is presented in the Statement of cash flows. The cash amount shown in the Statement of cash flows is the amount included in the Fund’s Statement of assets and liabilities and represents the cash on hand at its custodian and does not include any short-term investments or cash segregated at custodian for swap contracts.
New accounting pronouncement. In December 2011, the Financial Accounting Standards Board issued Accounting Standards Update No. 2011-11 (ASU 2011-11), Disclosures about Offsetting Assets and Liabilities. The update creates new disclosure requirements requiring entities to disclose both gross and net information for derivatives and other financial instruments that are either offset in the Statement of assets and liabilities or subject to an enforceable master netting arrangement or similar agreement. The disclosure requirements are effective for annual reporting periods beginning on or after January 1, 2013 and interim periods within those annual periods. ASU 2011-11 may result in additional disclosure relating to the presentation of derivatives and certain other financial instruments.
Note 3 — Derivative instruments
The Fund invests in derivatives in order to meet its investment objective. The use of derivatives may involve risks different from, or potentially greater than, the risks associated with investing directly in securities. Specifically, the Fund is exposed to the risk that the counterparty to an over-the-counter (OTC) derivatives contract will be unable or unwilling to make timely settlement payments or otherwise honor its obligations. OTC derivatives transactions typically can only be closed out with the other party to the transaction. If the counterparty defaults, the Fund will have contractual remedies, but there is no assurance that the counterparty will meet its contractual obligations or that the Fund will succeed in enforcing them.
The Fund has entered into collateral agreements with certain counterparties to mitigate counterparty risk on over-the-counter derivatives. Subject to established minimum levels, collateral is generally determined based on the net aggregate unrealized gain or loss on contracts with a particular counterparty. Collateral pledged to the Fund is held by the custodian bank for the benefit of the Fund and can be in the form of cash or debt securities issued by the U.S. government or related agencies; collateral posted by the Fund is held in a segregated account at the Fund’s custodian and is noted in the accompanying portfolio of investments, or if cash is posted, on the Statement of assets and liabilities. As of October 31, 2012, $3,080,000 was posted by the Fund for the benefit of counterparties.
Options. There are two types of options, a put option and a call option. Options are traded either over-the-counter or on an exchange. A call option gives the purchaser of the option the right to buy (and the seller the obligation to sell) the underlying instrument at the exercise price. A put option gives the purchaser of the option the right to sell (and the writer the obligation to buy) the underlying instrument at the exercise price. Writing puts and buying calls may increase the Fund’s exposure to changes in the value of the underlying instrument. Buying puts and writing calls may decrease the Fund’s exposure to such changes. Risks related to the use of options include the loss of the premium, possible illiquidity of the options markets, trading restrictions imposed by an exchange and movements in underlying security values, and for written options, potential losses in excess of the amounts recognized on the Statement of assets and liabilities.
When the Fund purchases an option, the premium paid by the Fund is included in the portfolio of investments and subsequently “marked-to-market” to reflect current market value. If the purchased option expires, the Fund realizes a loss equal to the cost of the option. If the Fund exercises a call option, the cost of the securities acquired by exercising the call is increased by the premium paid to buy the call. If the Fund exercises a put option, it realizes a gain or loss from the sale of the
| |
| 22 | Tax-Advantaged Dividend Income Fund | Annual report |
underlying security and the proceeds from such sale are decreased by the premium paid. If the Fund enters into a closing sale transaction, the Fund realizes a gain or loss, depending on whether proceeds from the closing sale are greater or less than the original cost. When the Fund writes an option, the premium received is included as a liability and subsequently “marked-to-market” to reflect current market value of the option written. Premiums received from writing options that expire unexercised are recorded as realized gains. Premiums received from writing options which are exercised or are closed are added to or offset against the proceeds or amount paid on the transaction to determine the realized gain or loss. If a put option on a security is exercised, the premium received reduces the cost basis of the securities purchased by the Fund.
During the year ended October 31, 2012, the Fund wrote option contracts to hedge against anticipated changes in securities markets. The following tables summarize the Fund’s written options activities during the year ended October 31, 2012 and the contracts held at October 31, 2012.
| | |
| | NUMBER OF | PREMIUM |
| | CONTRACTS | RECEIVED (PAID) |
|
| Outstanding, beginning of period | 2,045 | $1,828,449 |
| Options written | 29,444 | 26,429,548 |
| Options expired | (4,825) | (5,156,295) |
| Options closed | (21,369) | (22,492,177) |
| Outstanding, end of period | 5,295 | $609,525 |
| | | | | | |
| | EXERCISE | | EXPIRATION | NUMBER OF | | |
| OPTIONS | PRICE | | DATE | CONTRACTS | PREMIUM | VALUE |
|
| CALLS | | | | | | |
| Dow Jones Industrial | | | | | | |
| Ave Index | $136 | | Nov 2012 | 4,520 | $343,388 | ($54,240) |
| S&P 500 Index | 1,530 | | Nov 2012 | 335 | 17,745 | (5,862) |
| S&P 500 Index | 675 | | Nov 2012 | 245 | 71,533 | (11,638) |
| S&P 500 Index | 1,465 | | Nov 2012 | 195 | 176,859 | (40,950) |
| Total | | | | 5,295 | $609,525 | ($112,690) |
Interest rate swaps. Interest rate swaps represent an agreement between a Fund and counterparty to exchange cash flows based on the difference between two interest rates applied to a notional amount. The payment flows are usually netted against each other, with the difference being paid by one party to the other. The Fund settles accrued net interest receivable or payable under the swap contracts at specified, future intervals. Upfront payments made/received by the Fund are amortized/accreted for financial reporting purposes, with the unamortized/unaccreted portion included in the Statement of assets and liabilities. Swaps are marked-to-market daily based upon values from third party vendors or broker quotations, and the change in value is recorded as unrealized appreciation/depreciation of swap contracts. A termination payment by the counterparty or the Fund is recorded as realized gain or loss, as well as the net periodic payments received or paid by the Fund.
Entering into swap agreements involves, to varying degrees, elements of credit, market and documentation risk that may amount to values that are in excess of the amounts recognized on the Statement of assets and liabilities. Such risks involve the possibility that there will be no liquid market for the swap, or that a counterparty may default on its obligation or delay payment under the swap terms. The counterparty may disagree or contest the terms of the swap. Market risks may also accompany the swap, including interest rate risk. The Fund may also suffer losses if it is unable to terminate or assign outstanding swaps or reduce its exposure through offsetting transactions.
| |
| Annual report | Tax-Advantaged Dividend Income Fund | 23 |
During the year ended October 31, 2012, the Fund used interest rate swaps in anticipation of rising interest rates. During the year ended October 31, 2012, the Fund held interest rate swaps with total USD notional amounts ranging from $86 million to $172 million, as measured at each quarter end. The following table summarizes the interest rate swap contracts held as of October 31, 2012.
| | | | | | |
| | USD | | PAYMENTS | PAYMENTS | | |
| | NOTIONAL | | MADE | RECEIVED | MATURITY | MARKET |
| COUNTERPARTY | AMOUNT | | BY FUND | BY FUND | DATE | VALUE |
|
| Morgan Stanley | $86,000,000 | | 1.4625% | 3-month LIBOR(a) | Aug 2016 | ($3,026,667) |
| Capital Services | | | | | | |
| Morgan Stanley | 86,000,000 | | 0.8750% | 3-month LIBOR(a) | Jul 2017 | (698,198) |
| Capital Services | | | | | | |
| | $172,000,000 | | | | | ($3,724,865) |
(a) At 10-31-12, the 3-month LIBOR rate was 0.31275%.
Fair value of derivative instruments by risk category
The table below summarizes the fair value of derivatives held by the Fund at October 31, 2012 by risk category:
| | | | |
| | | FINANCIAL | ASSET | LIABILITY |
| | STATEMENT OF ASSETS AND | INSTRUMENTS | DERIVATIVES | DERIVATIVES |
| RISK | LIABILITIES LOCATION | LOCATION | FAIR VALUE | FAIR VALUE |
|
| Equity contracts | Payable for written options, | Written options | — | ($112,690) |
| | at value | | | |
| Interest rate contracts | Unrealized depreciation of | Interest rate | — | (3,724,865) |
| | swap contracts | swaps | | |
| Total | | | — | ($3,837,555) |
Effect of derivative instruments on the Statement of operations
The table below summarizes the net realized gain (loss) included in the net increase (decrease) in net assets from operations, classified by derivative instrument and risk category, for the year ended October 31, 2012:
| | | | |
| | STATEMENT OF | | SWAP | |
| RISK | OPERATIONS LOCATION | WRITTEN OPTIONS | CONTRACTS | TOTAL |
|
| Equity contracts | Net realized gain (loss) | ($1,182,643) | — | ($1,182,643) |
| Interest rate | Net realized gain (loss) | — | ($786,294) | ($786,294) |
| contracts | | | | |
| Total | | ($1,182,643) | ($786,294) | ($1,968,937) |
The table below summarizes the net change in unrealized appreciation (depreciation) included in the net increase (decrease) in net assets from operations, classified by derivative instrument and risk category, for the year ended October 31, 2012:
| | | | |
| | STATEMENT OF | | SWAP | |
| RISK | OPERATIONS LOCATION | WRITTEN OPTIONS | CONTRACTS | TOTAL |
|
| Equity contracts | Change in unrealized | $634,486 | — | $634,486 |
| | appreciation | | | |
| | (depreciation) | | | |
| Interest rate | Change in unrealized | — | ($2,569,800) | ($2,569,800) |
| contracts | appreciation | | | |
| | (depreciation) | | | |
| Total | | $634,486 | ($2,569,800) | ($1,935,314) |
| |
| 24 | Tax-Advantaged Dividend Income Fund | Annual report |
Note 4 — Guarantees and indemnifications
Under the Fund’s organizational documents, its Officers and Trustees are indemnified against certain liabilities arising out of the performance of their duties to the Fund. Additionally, in the normal course of business, the Fund enters into contracts with service providers that contain general indemnification clauses. The Fund’s maximum exposure under these arrangements is unknown, as this would involve future claims that may be made against the Fund that have not yet occurred. The risk of material loss from such claims is considered remote.
Note 5 — Fees and transactions with affiliates
John Hancock Advisers, LLC (the Adviser) serves as investment adviser for the Fund. The Adviser is an indirect, wholly owned subsidiary of Manulife Financial Corporation (MFC).
Management fee. The Fund has an investment management agreement with the Adviser under which the Fund pays a daily management fee to the Adviser equivalent, on an annual basis, to 0.75% of the Fund’s average daily net assets and the value attributed to the Credit Facility Agreement (see Note 8) (collectively, managed assets). The Adviser has a subadvisory agreement with John Hancock Asset Management a division of Manulife Asset Management (US) LLC, an indirectly owned subsidiary of MFC and an affiliate of the Adviser, and a subadvisory agreement with Analytic Investors, LLC. The Fund is not responsible for payment of the subadvisory fees.
The Adviser has contractually agreed to limit the Fund’s management fee to 0.70% of average daily managed assets from February 27, 2011 until February 26, 2012. Accordingly, the expense reductions related to the reduction in the management fee amounted to $169,439 for the year ended October 31, 2012.
The investment management fees, including the impact of the waivers and reimbursements described above, incurred for the year ended October 31, 2012 were equivalent to a net annual effective rate of 0.73% of the Fund’s average daily managed assets.
Accounting and legal services. Pursuant to a service agreement, the Fund reimburses the Adviser for all expenses associated with providing the administrative, financial, legal, accounting and recordkeeping services to the Fund, including the preparation of all tax returns, periodic reports to shareholders and regulatory reports, among other services. These accounting and legal services fees incurred for the year ended October 31, 2012 amounted to an annual rate of 0.01% of the Fund’s average daily managed assets.
Trustee expenses. The Fund compensates each Trustee who is not an employee of the Adviser or its affiliates. The John Hancock Group of Funds Deferred Compensation Plan (the Plan) was in effect on October 31, 2012 but since then has been terminated. Under the Plan, deferred amounts were invested in various John Hancock funds. The investment of deferred amounts and the offsetting liability are included within Other receivables and prepaid expenses and Payable to affiliates — Trustees’ fees, respectively, in the accompanying Statement of assets and liabilities.
Note 6 — Fund share transactions
In December 2007, the Trustees approved a share repurchase plan, which has been subsequently reviewed and approved by the Board of Trustees each year in December. Under the current share repurchase plan, the Fund may repurchase in the open market up to 10% of its outstanding common shares as of December 31, 2011. The current plan is in effect between January 1, 2012 and December 31, 2012. On December 12, 2012, the Board renewed the share repurchase plan. As renewed, the Fund may purchase in the open market, between January 1, 2013 and December 31, 2013, up to an additional 10% of its outstanding common shares (based on common shares outstanding as of December 31, 2012).
| |
| Annual report | Tax-Advantaged Dividend Income Fund | 25 |
During the year ended October 31, 2012, the Fund did not repurchase any shares under the repurchase plan. During the year ended October 31, 2011, the Fund repurchased 0.73% of its common shares outstanding under the repurchase plan. The weighted average discount per share on these repurchases amounted to 9.3% for the year ended October 31, 2011. Shares repurchased and corresponding dollar amounts are included on the Statements of changes in net assets. The anti-dilutive impact of these share repurchases is included on the Financial highlights.
Note 7 — Leverage risk
The Fund utilizes a Credit Facility Agreement (CFA) to increase its assets available for investment. When the Fund leverages its assets, common shareholders bear the fees associated with the CFA and have the potential to benefit or be disadvantaged from the use of leverage. The Adviser’s fee is also increased in dollar terms from the use of leverage. Consequently, the Fund and the Adviser may have differing interests in determining whether to leverage the Fund’s assets. Leverage creates risks that may adversely affect the return for the shareholders of common shares, including:
• the likelihood of greater volatility of net asset value and market price of common shares
• fluctuations in the interest rate paid for the use of the credit facility
• increased operating costs, which may reduce the Fund’s total return
• the potential for a decline in the value of an investment acquired through leverage, while the Fund’s obligations under such leverage remains fixed
• the Fund is more likely to have to sell securities in a volatile market in order to meet asset coverage or other debt compliance requirements
To the extent the income or capital appreciation derived from securities purchased with funds received from leverage exceeds the cost of leverage, the Fund’s return will be greater than if leverage had not been used, conversely, returns would be lower if the cost of the leverage exceeds the income or capital appreciation derived.
In addition to the risk created by the Fund’s use of leverage, the Fund is subject to the risk that it would be unable to timely, or at all, obtain replacement financing if the CFA is terminated. Were this to happen, the Fund would be required to de-leverage, selling securities at a potentially inopportune time and incurring tax consequences. Further, the Fund’s ability to generate income from the use of leverage would be adversely affected.
Note 8 — Credit Facility Agreement
Effective August 15, 2012, the Fund has entered into a CFA with Credit Suisse Securities (USA) LLC (CSSU), pursuant to which the Fund borrows money to increase its assets available for investment. In accordance with the 1940 Act, the Fund’s borrowings under the CFA will not exceed 33 1/3% of the Fund’s managed assets (net assets plus borrowings) at the time of any borrowing.
The Fund pledges a portion of its assets as collateral to secure borrowings under the CFA. Such pledged assets are held in a special custody account with the Fund’s custodian. The amount of assets required to be pledged by the Fund is determined in accordance with the CFA. The Fund retains the benefits of ownership of assets pledged to secure borrowings under the CFA. Interest charged is at the rate of three month LIBOR plus 0.41% and is payable monthly. As of October 31, 2012, the Fund had borrowings of $390,300,000 at an interest rate of 0.72%, which are reflected in the Credit facility agreement payable on the Statement of assets and liabilities. During the period from August 15, 2012 to October 31, 2012, the average borrowing under the CFA and the effective average interest rate were $379,793,590 and 0.80%, respectively.
| |
| 26 | Tax-Advantaged Dividend Income Fund | Annual report |
The Fund may terminate the CFA with CSSU at any time. If certain asset coverage and collateral requirements or other covenants are not met, the CFA could be deemed in default and result in termination. Absent a default or termination event, CSSU is generally required to provide the Fund with 270 calendar days’ notice before terminating or amending the CFA.
Prior to August 15, 2012, the Fund borrowed money pursuant to a CFA with a subsidiary of BNP Paribas (BNP). Interest charged was at the rate of one-month LIBOR plus 0.70% payable monthly. The Fund also paid a commitment fee of 0.60% per annum on the unused portion of the facility. During the period ended August 14, 2012, the average borrowings under the CFA with BNP and the effective average interest rate were $344,000,000 and 0.97%, respectively.
Prior to August 15, 2012, the Fund had an agreement with BNP that allowed BNP to borrow a portion of the pledged collateral (Lent Securities) in an amount not to exceed the lesser of: (i) outstanding borrowings owed by the Fund to BNP and (ii) thirty-three and one-third percent of the Fund’s total assets. Income earned from Lent Securities is recorded as a component of interest income on the Statement of operations. During the year ended October 31, 2012, the Fund recorded $244,184 in income from Lent Securities.
Note 9 — Purchase and sale of securities
Purchases and sales of securities, other than short-term securities, aggregated $175,385,265 and $126,027,552, respectively, for the year ended October 31, 2012.
Note 10 — Industry or sector risk
From time to time the Fund may invest a large percentage of its assets in one or more particular industries or sectors of the economy. If a large percentage of the Fund’s assets are economically tied to a single or small number of industries or sectors of the economy, the Fund will be less diversified than a more broadly diversified fund, and it may cause the Fund to underperform if that industry or sector underperforms. In addition, focusing on a particular industry or sector may make the Fund’s net asset value more volatile. Further, a fund that invests in particular industries or sectors is particularly susceptible to the impact of market, economic, regulatory and other factors affecting those industries or sectors.
| |
| Annual report | Tax-Advantaged Dividend Income Fund | 27 |
Auditor’s report
Report of Independent Registered Public Accounting Firm
To the Board of Trustees and Shareholders of
John Hancock Tax-Advantaged Dividend Income Fund:
In our opinion, the accompanying statement of assets and liabilities, including the portfolio of investments, and the related statements of operations, of changes in net assets and of cash flows and the financial highlights present fairly, in all material respects, the financial position of John Hancock Tax-Advantaged Dividend Income Fund (the “Fund”) at October 31, 2012, the results of its operations and its cash flows for the year then ended, the changes in its net assets for each of the two years in the period then ended and the financial highlights for each of the periods indicated, in conformity with accounting principles generally accepted in the United States of America. These financial statements and financial highlights (hereafter referred to as “financial statements”) are the responsibility of the Fund’s management; our responsibility is to express an opinion on these financial statements based on our audits. We conducted our audits of these financial statements in accordance with the standards of the Public Company Accounting Oversight Board (United States). Those standards require that we plan and perform the audit to obtain reasonable assurance about whether the financial statements are free of material misstatement. An audit includes examining, on a test basis, evidence supporting the amounts and disclosures in the financial statements, assessing the accounting principles used and significant estimates made by management, and evaluating the overall financial statement presentation. We believe that our audits, which included confirmation of securities at October 31, 2012 by correspondence with the custodian and brokers, and the application of alternative auditing procedures where securities purchased confirmations had not been received, provide a reasonable basis for our opinion.
PricewaterhouseCoopers LLP
Boston, Massachusetts
December 21, 2012
| |
| 28 | Tax-Advantaged Dividend Income Fund | Annual report |
Tax information
Unaudited
For federal income tax purposes, the following information is furnished with respect to the distributions of the Fund, if any, paid during its taxable year ended October 31, 2012.
The Fund reports the maximum amount allowable of its net taxable income as eligible for the corporate dividends-received deduction.
The Fund reports the maximum amount allowable of its net taxable income as qualified dividend income as provided in the Jobs and Growth Tax Relief Reconciliation Act of 2003.
Eligible shareholders will be mailed a 2012 Form 1099-DIV in early 2013. This will reflect the tax character of all distributions paid in calendar year 2012.
In prior years, certain dividends paid by the Fund were generally taxed to individuals at a rate of 15%. For tax years beginning after December 31, 2012, such favorable treatment of dividend income is scheduled to expire as are certain other favorable tax provisions. As a result, absent congressional action, the maximum tax rate on dividend income will increase from 15% to 39.6%. Congress is considering various tax law changes that could alter these changes in tax rates or that could otherwise affect the Fund or its shareholders.
| |
| Annual report | Tax-Advantaged Dividend Income Fund | 29 |
Additional information
Unaudited
Investment objective and policy
The Fund’s investment objective is to provide a high level of after-tax total return from dividend income and gains and capital appreciation.
Under normal market conditions, the Fund will invest at least 80% of its assets (net assets plus borrowings for investment purposes) in dividend-paying common and preferred securities that the Adviser believes at the time of acquisition are eligible to pay dividends which, for individual shareholders, qualify for U.S. federal income taxation at rates applicable to long-term capital gains, which currently are taxed at a maximum rate of 15% (tax-advantaged dividends). Tax-advantaged dividends generally include dividends from domestic corporations and dividends from foreign corporations that meet certain specified criteria. The Fund generally can pass the tax treatment of tax-advantaged dividends it receives through to its common shareholders. The Fund may write (sell) covered call index options on up to 30% of the value of the Fund’s total assets.
Dividends and distributions
During the year ended October 31, 2012, dividends from net investment income totaling $1.1820 per share were paid to shareholders. The dates of payments and the amounts per share were as follows:
| | | | | |
| | INCOME | | | | |
| PAYMENT DATE | DIVIDENDS | | | | |
| | | | |
| November 30, 2011 | $0.0985 | | | | |
| December 30, 2011 | 0.0985 | | | | |
| January 31, 2012 | 0.0985 | | | | |
| February 29, 2012 | 0.0985 | | | | |
| March 30, 2012 | 0.0985 | | | | |
| April 30, 2012 | 0.0985 | | | | |
| May 31, 2012 | 0.0985 | | | | |
| June 29, 2012 | 0.0985 | | | | |
| July 31, 2012 | 0.0985 | | | | |
| August 31, 2012 | 0.0985 | | | | |
| September 28, 2012 | 0.0985 | | | | |
| October 31,2012 | 0.0985 | | | | |
| Total | $1.1820 | | | | |
Dividend reinvestment plan
The Fund’s Dividend Reinvestment Plan (the Plan) provides that distributions of dividends and capital gains are automatically reinvested in common shares of the Fund by Computershare Trust Company, N.A. (formerly known as The Bank of New York Mellon) (the Plan Agent). Every shareholder holding at least one full share of the Fund is entitled to participate in the Plan. In addition, every shareholder who became a shareholder of the Fund after June 30, 2011 and holds at least one full share of the Fund will be automatically enrolled in the Plan. Shareholders may withdraw from the Plan at any time and shareholders who do not participate in the Plan will receive all distributions in cash.
If the Fund declares a dividend or distribution payable either in cash or in common shares of the Fund and the market price of shares on the payment date for the distribution or dividend equals or exceeds the Fund’s net asset value per share (NAV), the Fund will issue common shares to participants at a value equal to the higher of NAV or 95% of the market price. The number of additional shares to be credited to each participant’s account will be determined by dividing the dollar amount of the distribution or dividend by the higher of NAV or 95% of the market price. If
| |
| 30 | Tax-Advantaged Dividend Income Fund | Annual report |
the market price is lower than NAV, or if dividends or distributions are payable only in cash, then participants will receive shares purchased by the Plan Agent on participants’ behalf on the New York Stock Exchange (the NYSE) or otherwise on the open market. If the market price exceeds NAV before the Plan Agent has completed its purchases, the average per share purchase price may exceed NAV, resulting in fewer shares being acquired than if the Fund had issued new shares.
There are no brokerage charges with respect to common shares issued directly by the Fund. However, whenever shares are purchased or sold on the NYSE or otherwise on the open market, each participant will pay a pro rata portion of brokerage trading fees, currently $0.05 per share purchased or sold. Brokerage trading fees will be deducted from amounts to be invested.
The reinvestment of dividends and net capital gains distributions does not relieve participants of any income tax that may be payable on such dividends or distributions.
Shareholders participating in the Plan may buy additional shares of the Fund through the Plan at any time in amounts of at least $50 per investment, up to a maximum of $10,000, with a total calendar year limit of $100,000. Shareholders will be charged a $5 transaction fee plus $0.05 per share brokerage trading fee for each order. Purchases of additional shares of the Fund will be made on the open market. Shareholders who elect to utilize monthly electronic fund transfers to buy additional shares of the Fund will be charged a $2 transaction fee plus $0.05 per share brokerage trading fee for each automatic purchase. Shareholders can also sell Fund shares held in the Plan account at any time by contacting the Plan Agent by telephone, in writing or by visiting the Plan Agent’s Web site at www.computershare.com and clicking on EquityAccess & More. The Plan Agent will mail a check to you (less applicable brokerage trading fees) on settlement date, which is three business days after your shares have been sold. If you choose to sell your shares through your stockbroker, you will need to request that the Plan Agent electronically transfer your shares to your stockbroker through the Direct Registration System.
Shareholders participating in the Plan may withdraw from the Plan at any time by contacting the Plan Agent by telephone, in writing or by visiting the Plan Agent’s Web site at www.computershare.com and clicking on EquityAccess & More. Such termination will be effective immediately if the notice is received by the Plan Agent prior to any dividend or distribution record date; otherwise, such termination will be effective on the first trading day after the payment date for such dividend or distribution, with respect to any subsequent dividend or distribution. If you withdraw, your shares will be credited to your account; or, if you wish, the Plan Agent will sell your full and fractional shares and send you the proceeds, less a transaction fee of $5.00 and less brokerage trading fees of $0.05 per share. If a shareholder does not maintain at least one whole share of common stock in the Plan account, the Plan Agent may terminate such shareholder’s participation in the Plan after written notice. Upon termination, shareholders will be sent a check for the cash value of any fractional share in the Plan account, less any applicable broker commissions and taxes.
Shareholders who hold at least one full share of the Fund may join the Plan by notifying the Plan Agent by telephone, in writing or by visiting the Plan Agent’s Web site at www.computershare.com and clicking on EquityAccess & More. If received in proper form by the Plan Agent before the record date of a dividend, the election will be effective with respect to all dividends paid after such record date. If you wish to participate in the Plan and your shares are held in the name of a brokerage firm, bank or other nominee, please contact your nominee to see if it will participate in the Plan for you. If you wish to participate in the Plan, but your brokerage firm, bank or other nominee is unable to participate on your behalf, you will need to request that your shares be re-registered in your own name, or you will not be able to participate. The Plan Agent will administer the Plan on the basis of the number of shares certified from time to time by you as representing the total amount registered in your name and held for your account by your nominee.
| |
| Annual report | Tax-Advantaged Dividend Income Fund | 31 |
Experience under the Plan may indicate that changes are desirable. Accordingly, the Fund and the Plan Agent reserve the right to amend or terminate the Plan. Participants generally will receive written notice at least 90 days before the effective date of any amendment. In the case of termination, participants will receive written notice at least 90 days before the record date for the payment of any dividend or distribution by the Fund.
All correspondence or requests for additional information about the Plan should be directed to Computershare Trust Company, N.A., at the address stated below or by calling 1-800-852-0218, 1-201-680-6578 (For International Telephone Inquiries) and 1-201-680-6610 (For the Hearing Impaired (TDD)).
Shareholder communication and assistance
If you have any questions concerning the Fund, we will be pleased to assist you. If you hold shares in your own name and not with a brokerage firm, please address all notices, correspondence, questions or other communications regarding the Fund to the transfer agent at:
Computershare Trust Company, N.A.
Newport Office Center VII
480 Washington Boulevard
Jersey City, NJ 07310–1900
Telephone: 1-800-852-0218
If your shares are held with a brokerage firm, you should contact that firm, bank or other nominee for assistance.
Shareholder meeting
The Fund held its Annual Meeting of Shareholders on November 9, 2012. The following proposal was considered by the shareholders:
Proposal: Election of thirteen (13) Trustees to serve until the expiration of their respective terms as shown below. Each nominee was elected by the Fund’s shareholders and the votes cast with respect to each Trustee are set forth below.
| | |
| For a Term to Expire in 2016: | | |
| | TOTAL VOTES | TOTAL VOTES WITHHELD |
| | FOR THE NOMINEE | FROM THE NOMINEE |
|
| Independent Trustees | | |
| Deborah C. Jackson | 33,565,855 | 639,458 |
| James M. Oates | 33,562,903 | 642,410 |
| Steven R. Pruchansky | 33,585,679 | 619,634 |
| Non-Independent Trustee | | |
| Craig Bromley | 33,469,466 | 735,847 |
| |
| For a Term to Expire in 2015: | | |
| | TOTAL VOTES | TOTAL VOTES WITHHELD |
| | FOR THE NOMINEE | FROM THE NOMINEE |
|
| Independent Trustees | | |
| Charles L. Bardelis | 33,578,296 | 627,017 |
| Peter S. Burgess | 33,560,510 | 644,803 |
| Theron S. Hoffman | 33,600,410 | 604,903 |
| Non-Independent Trustee | | |
| Warren A. Thomson | 33,601,166 | 604,147 |
| |
| 32 | Tax-Advantaged Dividend Income Fund | Annual report |
| | |
| For a Term to Expire in 2014: | | |
| | TOTAL VOTES | TOTAL VOTES WITHHELD |
| | FOR THE NOMINEE | FROM THE NOMINEE |
|
| Independent Trustees | | |
| William H. Cunningham | 33,543,658 | 661,655 |
| Grace K. Fey | 33,605,042 | 600,271 |
| Hassell H. McClellan | 33,555,342 | 649,971 |
| Gregory A. Russo | 33,585,013 | 620,300 |
| Non-Independent Trustee | | |
| James R. Boyle | 33,611,390 | 593,923 |
| |
| Annual report | Tax-Advantaged Dividend Income Fund | 33 |
Board Consideration of and Continuation of Investment Advisory Agreement and Subadvisory Agreements
The Board of Trustees (the Board, the members of which are referred to as Trustees) of John Hancock Tax-Advantaged Dividend Income Fund (the Fund) met in-person on May 6–8 and June 3–5, 2012 to consider the approval of the Fund’s investment advisory agreement (the Advisory Agreement) with John Hancock Advisers, LLC (the Adviser), the Fund’s investment adviser. The Board also considered the approval of the investment subadvisory agreements (together, the Subadvisory Agreements) between the Adviser and each of Manulife Asset Management (US) LLC (Manulife US) and Analytic Investors, LLC (Analytic) (together, the Subadvisers) on behalf of the Fund. The Advisory Agreement and the Subadvisory Agreements are referred to as the Agreements.
Activities and composition of the Board
On June 3–5, 2012, the Board consisted of nine individuals, seven of whom were Independent Trustees. Independent Trustees are generally those individuals who are not employed by or have any significant business or professional relationship with the Adviser or the Subadviser. The Trustees are responsible for the oversight of operations of the Fund and perform various duties required of directors of investment companies by the Investment Company Act of 1940, as amended (the 1940 Act). The Independent Trustees have independent legal counsel to assist them in connection with their duties. The Board has appointed an Independent Trustee as Chairman. On June 3–5, 2012, the Board had four standing committees that were composed entirely of Independent Trustees: the Audit Committee; the Compliance Committee; the Nominating, Governance and Administration Committee; and the Contracts & Operations Committee. Additionally, on June 3–5, 2012, Investment Performance Committee A was a standing committee of the Board composed of Independent Trustees and one Trustee who is affiliated with the Adviser. Investment Performance Committee A was responsible for overseeing and monitoring matters relating to the investment performance of the Fund. The Board also designated an Independent Trustee as Vice Chairman to serve in the absence of the Chairman. The Board also designates working groups or ad hoc committees as it deems appropriate.
The approval process
Under the 1940 Act, the Board is required to consider the continuation of the Agreements each year. Throughout the year, the Board, acting directly and through its committees, regularly reviews and assesses the quality of the services that the Fund receives under these Agreements. The Board reviews reports of the Adviser at least quarterly, which include Fund performance reports and compliance reports. In addition, the Board meets with portfolio managers and senior investment officers at various times throughout the year. The Board considers at each of its meetings factors that are relevant to its annual consideration of the renewal of the Agreements, including the services and support provided by the Adviser and Subadvisers to the Fund and its shareholders.
Prior to the May 6–8, 2012 meeting, the Board requested and received materials specifically relating to the Agreements. The materials provided in connection with the May meeting included information compiled and prepared by Lipper, a Thomson Reuters company (Lipper), on Fund fees and expenses, the investment performance of the Fund and other matters including the prices at which Fund shares have traded. This Fund information is assembled in a format that permits comparison with similar information from a Category and a subset of the Category referred to as the Expense Group, each as determined by Lipper, and with the Fund’s benchmark index. The Category includes all funds that invest similarly to the way the Fund invests. The Expense Group represents funds of similar size, excluding passively managed funds and funds-of-funds. The Fund’s benchmark index is an unmanaged index of securities that is provided as a basis for comparison with the Fund’s performance. Other material provided for the Fund review included (a) information on the profitability of the Agreements to the Adviser and a discussion of any additional benefits to the Adviser or Subadvisers or their affiliates that result from being the Adviser or Subadvisers to the
| |
| 34 | Tax-Advantaged Dividend Income Fund | Annual report |
Fund; (b) a general analysis provided by the Adviser and the Subadvisers concerning investment advisory fees charged to other clients, such as institutional clients and other investment companies, having similar investment mandates, as well as the performance of those other clients and a comparison of the services provided to those other clients and the services provided to the Fund; (c) the impact of economies of scale; and (d) a summary of aggregate amounts paid by the Fund to the Adviser.
At an in-person meeting held on May 6–8, 2012, the Board reviewed materials relevant to its consideration of the Agreements. As a result of the discussions that occurred during the May 6–8, 2012 meeting, the Board asked the Adviser for additional information on certain matters. The Adviser provided the additional information and the Board also considered this information as part of its consideration of the Agreements.
At an in-person meeting held on June 3–5, 2012, the Board, including the Independent Trustees, formally considered the continuation of the Advisory Agreement and the Subadvisory Agreements, each for an additional one-year term. The Board considered what it believed were key relevant factors that are described under separate headings presented below.
The Board also considered other matters important to the approval process, such as services related to the valuation and pricing of Fund portfolio holdings. Other important matters considered by the Board were the direct and indirect benefits to the Adviser, the Subadvisers and their affiliates from their relationship with the Fund and advice from independent legal counsel with respect to the review process and materials submitted for the Board’s review.
Nature, extent and quality of services
The Board reviewed the nature, extent and quality of services provided by the Adviser and the Subadvisers, including the investment advisory services and the resulting performance of the Fund.
The Board considered the ability of the Adviser and the Subadvisers, based on their resources, reputation and other attributes, to attract and retain qualified investment professionals, including research, advisory and supervisory personnel. It considered the background and experience of senior management and investment professionals responsible for managing the Fund. The Board considered the investment philosophy, research and investment decision-making processes of the Subadvisers responsible for the daily investment activities of the Fund, including, among other things, portfolio trading capabilities, use of technology, commitment to compliance and approach to training and retaining portfolio managers and other research, advisory and management personnel.
The Board considered each Subadviser’s history and experience providing investment services to the Fund. The Board considered the Adviser’s investment manager analytical capabilities, market and economic knowledge and execution of its Subadviser oversight responsibilities. The Board further considered the culture of compliance, resources dedicated to compliance, compliance programs, record of compliance with applicable laws and regulations, with the Fund’s investment policies and restrictions and with the applicable Code of Ethics, and the responsibilities of the Adviser’s and Subadvisers’ compliance departments.
In addition to advisory services, the Board considered the quality of the administrative services provided to the Fund by the Adviser under a separate agreement. The Board noted that the Adviser and its affiliates provide the Fund with certain administrative services (in addition to any such services provided to the Fund by third parties) and officers and other personnel as are necessary for the operations of the Fund. The Board reviewed the structure and duties of the Adviser’s administration, accounting, legal and compliance departments and considered the Adviser’s and its affiliate’s policies and procedures for assuring compliance with applicable laws and regulations.
| |
| Annual report | Tax-Advantaged Dividend Income Fund | 35 |
The Board also received information about the nature, extent and quality of services provided by and fee rates charged by the Adviser and Subadvisers to their other clients, including other registered investment companies, institutional investors and separate accounts. The Board reviewed a general analysis provided by the Adviser and the Subadvisers concerning investment advisory fees charged to other clients having similar investment mandates, the services provided to those other clients as compared to the services provided to the Fund, the performance of those other clients as compared to the performance by the Fund and other factors relating to those other clients. The Board considered the significant differences between the Adviser’s and Subadvisers’ services to the Fund and the services they provide to other clients. For other clients that are not closed-end funds, the differences in services relate to the more burdensome regulatory and legal obligations of closed-end funds, the enhanced management and oversight arising from the public trading of Fund shares on an exchange and the potentially higher turnover of closed-end fund portfolio holdings. When compared to all clients including mutual funds, the Adviser has greater oversight and supervisory responsibility for the Fund and undertakes greater entrepreneurial risk as the sponsor of the Fund.
Fund performance
The Board was provided with reports, independently prepared by Lipper, which included a comprehensive analysis of the Fund’s performance. The Board also examined materials discussing Fund performance and the Fund’s investment objective, strategies and outlook. The Board also reviewed a narrative and statistical analysis of the Lipper data that was prepared by the Adviser, which analyzed various factors that may affect the Lipper rankings. The Board reviewed information regarding the investment performance of the Fund as compared to its Lipper Category as well as its benchmark index (see chart below). The Board was provided with a description of the methodology used by Lipper to select the funds in the Category. The Board also considered updated performance information provided by the Adviser at its May and June 2012 meetings. The Board regularly reviews the performance of the Fund throughout the year and attaches more importance to performance over relatively longer periods of time, typically three to five years.
Set forth below is the performance of the Fund (based on net asset value (NAV) and market value (Market)) over certain time periods ended December 31, 2011 and that of its Category average and benchmark index over the same periods:
| | | | |
| | | | | SINCE INCEPTION |
| | 1 YEAR | 3 YEAR | 5 YEAR | (2-27-04) |
|
| Tax-Advantaged Dividend Income | 22.17% | 24.57% | 4.87% | 8.05% |
| Fund (NAV) | | | | |
| Value Category Average (NAV) | 4.37% | 17.21% | –1.42% | 4.08% |
| Custom Benchmark (25% ML Pref Stk | 11.08% | 15.37% | 1.14% | 7.47% |
| Drd / 25% S&P 500 / S&P 400 Util) | | | | |
| Tax-Advantaged Dividend Income | 24.16% | 29.30% | 5.66% | 6.31% |
| Fund (Market) | | | | |
| Value Category Average (Market) | 2.74% | 20.09% | –3.11% | 2.50% |
The Board noted that the Fund at NAV outperformed its Category average NAV performance and its benchmark index’s performance over all periods shown.
Expenses and fees
The Board, including the Independent Trustees, reviewed the Fund’s contractual advisory fee rate payable by the Fund to the Adviser as compared with the other funds in its Expense Group. The Board also received information about the investment subadvisory fee rate payable by the Adviser to the Subadvisers for investment subadvisory services. The Board considered the services provided and the fees charged by the Adviser and the Subadvisers to other clients with similar investment mandates, including other registered investment companies, institutional investors and separate accounts.
| |
| 36 | Tax-Advantaged Dividend Income Fund | Annual report |
In addition, the Board considered the cost of the services provided to the Fund by the Adviser. The Board received and considered expense information regarding the Fund’s various components, including advisory fees and fees other than advisory and distribution fees, including transfer agent fees, custodian fees, administration fees and other miscellaneous fees (e.g., fees for accounting and legal services). The Board considered comparisons of these expenses to the Expense Group median. The Board also considered expense information regarding the Fund’s total operating expense ratio (Gross Expense Ratio) and total operating expense ratio after taking any fee limitation arrangement by the Adviser into account (Net Expense Ratio). The Gross Expense Ratio and Net Expense Ratio are based on common and leveraged assets and include interest expense relating to leverage. The Board considered information comparing the Gross Expense Ratio and Net Expense Ratio of the Fund to that of the Expense Group median.
The Board noted that the Fund’s advisory fee ratio was thirteen basis points below the Expense Group median advisory fee ratio. The Board noted the following information about the Fund’s Gross and Net Expense Ratios derived from the Fund’s 2011 financial statements in relation with the Fund’s Expense Group median provided by Lipper in April 2012:
| | |
| | FUND | EXPENSE GROUP MEDIAN |
|
| Advisory Fee Ratio | 0.75% | 0.88% |
| Gross Expense Ratio | 1.17% | 1.17% |
| Net Expense Ratio | 1.03% | 1.14% |
The Board was aware that the Expense Group includes funds with varying amounts of leverage and funds that use borrowing and preferred stocks as leverage; that the Expense Group comparison shows advisory fees and expense ratios as percentages of assets attributable to total managed assets; and that the Fund’s fees and expenses may be higher than funds in the Expense Group with lower levels of leverage or funds that leverage with preferred stocks. The Board also reviewed comparative information which illustrated the expenses of the Fund and the Expense Group for the cost of leverage or interest expense and the Fund compared favorably to peers in this analysis. The Board viewed favorably the Adviser’s limitation on the Fund’s management fee to the following: 0.60% of the Fund’s average daily managed assets from February 27, 2009 until February 26, 2010, 0.65% of such assets from February 27, 2010 until February 26, 2011 and 0.70% of average daily managed assets from February 27, 2011 until February 26, 2012.
The Board received and reviewed statements relating to the Adviser’s financial condition and was also provided with a profitability analysis that detailed the revenues earned and the expenses incurred by the Adviser for services under the Advisory Agreement, as well as from other relationships between the Fund and the Adviser and its affiliates. The Board reviewed the Adviser’s profitability with respect to the Fund and other funds the Board currently oversees for the year ended December 31, 2011 compared to available aggregate profitability data provided for the year ended December 31, 2010. The Board reviewed the Adviser’s profitability with respect to other fund complexes managed by the Adviser and/or its affiliates. The Board reviewed the Adviser’s assumptions and methodology of allocating expenses in the profitability analysis, noting the inherent limitations in allocating costs among various advisory products.
The Board also considered a comparison of the Adviser’s profitability to that of a limited number of other investment advisers whose profitability information is publicly available. The Board recognized that profitability may be affected by numerous factors including, among other things, fee waivers and expense reimbursements by the Adviser, the types of funds managed, expense allocations and business mix, and therefore comparability of profitability is limited.
| |
| Annual report | Tax-Advantaged Dividend Income Fund | 37 |
The Board considered limited profitability information with respect to Manulife US, which is affiliated with the Adviser. In addition, as noted above, the Board considered basic assumptions and methodology for allocating expenses in Manulife US’s profitability information.
The Board did not consider profitability information with respect to Analytic, which is not affiliated with the Adviser. The Board considered that the subadvisory fee under the Subadvisory Agreement had been negotiated by the Adviser and Analytic on an arm’s-length basis. For this reason, Analytic’s separate profitability from its relationship with the Fund was not a factor in determining whether to renew the Subadvisory Agreement. In evaluating overall fees for investment management, the Board recognized the inherently higher cost structure of subadvised funds.
Economies of scale
The Board, including the Independent Trustees, considered the extent to which economies of scale might be realized as the assets of the Fund increase but recognized that there is limited ability to grow assets for a closed-end fund. Possible changes in the advisory fee rate or structure in order to enable the Fund to participate in these economies of scale (e.g., through the use of breakpoints in the advisory fee at higher asset levels) are periodically discussed. The Board also considered the Adviser’s overall operations and its ongoing investment in its business in order to expand the scale of, and improve the quality of, its operations that benefit the Fund.
The Board recognized the inherent limitations of any analysis of economies of scale, stemming largely from the Board’s understanding that most of the Adviser’s costs are not specific to individual funds, but rather are incurred across a variety of products and services.
Other benefits to the Adviser and the Subadvisers
The Board understands that the Adviser, the Subadvisers or their affiliates may derive other ancillary benefits from their relationship with the Fund, both tangible and intangible, such as their ability to leverage investment professionals who manage other portfolios, an increase in their profile in the investment advisory community and the engagement of their affiliates and/or significant shareholders as service providers to the Fund, including for administrative and distribution services. The Board believes that certain of these benefits are difficult to quantify. The Board also was informed that the Subadvisers may use third-party research obtained by soft dollars generated by certain mutual fund transactions to assist themselves in managing all or a number of their other client accounts.
Board determination
The Board unanimously approved the continuation of the Advisory Agreement and the Subadvisory Agreements each for an additional one-year term. Based upon its evaluation of relevant factors in their totality, the Board was satisfied that the terms of the Agreements, including the advisory and subadvisory fee rates, were fair and reasonable and in the best interest of the Fund and its shareholders. In arriving at its decision to approve the Agreements, the Board did not identify any single factor or any group of factors as all-important or controlling, but considered all factors together. Different Trustees may have attributed different weights to the various factors considered. The Independent Trustees were also assisted by independent legal counsel in making this determination. The Trustees’ conclusions may be based in part on their consideration of these arrangements in prior years and on their ongoing regular review of Fund performance and operations throughout the year.
| |
| 38 | Tax-Advantaged Dividend Income Fund | Annual report |
Trustees and Officers
This chart provides information about the Trustees and Officers who oversee your John Hancock fund as of December 1, 2012. Officers elected by the Trustees manage the day-to-day operations of the Portfolio and execute policies formulated by the Trustees.
| | |
| Independent Trustees | | |
| | | |
| Name, Year of Birth | Trustee | Number of |
| Position(s) held with Fund | of the | John Hancock |
| Principal occupation(s) and other | Trust | funds overseen |
| directorships during past 5 years | since1 | by Trustee |
| |
| James M. Oates,2 Born: 1946 | 2012 | 240 |
|
| Managing Director, Wydown Group (financial consulting firm) (since 1994); Chairman and Director, |
| Emerson Investment Management, Inc. (since 2000); Independent Chairman, Hudson Castle Group, Inc. |
| (formerly IBEX Capital Markets, Inc.) (financial services company) (1997–2011); Director, Stifel Financial |
| (since 1996); Director, Investor Financial Services Corporation (1995–2007); Director, Connecticut River |
| Bancorp (since 1998); Director, Virtus Funds (formerly Phoenix Mutual Funds) (since 1988). Trustee |
| and Chairman of the Board, John Hancock retail funds (since 2012); Trustee, John Hancock Funds III |
| (2005–2006); Trustee (since 2004) and Chairman of the Board (since 2005), John Hancock Variable |
| Insurance Trust; Trustee and Chairman of the Board (since 2005), John Hancock Funds II. | |
| |
| Charles L. Bardelis,2,3 Born: 1941 | 2012 | 240 |
|
| Director, Island Commuter Corp. (marine transport). Trustee, John Hancock retail funds (since 2012); |
| Trustee, John Hancock Funds III (2005–2006); Trustee, John Hancock Variable Insurance Trust (since |
| 1988); Trustee, John Hancock Funds II (since 2005). | | |
| |
| Peter S. Burgess,2,3 Born: 1942 | 2012 | 240 |
|
| Consultant (financial, accounting and auditing matters) (since 1999); Certified Public Accountant; |
| Partner, Arthur Andersen (independent public accounting firm) (prior to 1999); Director, Lincoln |
| Educational Services Corporation (since 2004); Director, Symetra Financial Corporation (since 2010); |
| former Director, PMA Capital Corporation (2004–2010). Trustee, John Hancock retail funds (since 2012); |
| Trustee, John Hancock Funds III (2005–2006); Trustee, John Hancock Variable Insurance Trust and |
| John Hancock Funds II (since 2005). | | |
| |
| William H. Cunningham, Born: 1944 | 2004 | 240 |
|
| Professor, University of Texas, Austin, Texas (since 1971); former Chancellor, University of Texas |
| System and former President of the University of Texas, Austin, Texas; Director, LIN Television (since |
| 2009); Chairman (since 2009) and Director (since 2006), Lincoln National Corporation (insurance); |
| Director, Resolute Energy Corporation (since 2009); Director, Southwest Airlines (since 2000); |
| former Director, Introgen (manufacturer of biopharmaceuticals) (until 2008); former Director, Hicks |
| Acquisition Company I, Inc. (until 2007); former Advisory Director, JP Morgan Chase Bank (formerly |
| Texas Commerce Bank–Austin) (until 2009). Trustee, John Hancock retail funds (since 1986); Trustee, |
| John Hancock Variable Insurance Trust (since 2012); Trustee, John Hancock Funds II (since 2012 |
| and 2005–2006). | | |
| |
| Grace K. Fey,2 Born: 1946 | 2012 | 240 |
|
| Chief Executive Officer, Grace Fey Advisors (since 2007); Director and Executive Vice President, |
| Frontier Capital Management Company (1988–2007); Director, Fiduciary Trust (since 2009). |
| Trustee, John Hancock retail funds (since 2012); Trustee, John Hancock Variable Insurance Trust and |
| John Hancock Funds II (since 2008). | | |
| |
| Annual report | Tax-Advantaged Dividend Income Fund | 39 |
| | |
| Independent Trustees (continued) | | |
| | | |
| Name, Year of Birth | Trustee | Number of |
| Position(s) held with Fund | of the | John Hancock |
| Principal occupation(s) and other | Trust | funds overseen |
| directorships during past 5 years | since1 | by Trustee |
| |
| Theron S. Hoffman,2,3 Born: 1947 | 2012 | 240 |
|
| Chief Executive Officer, T. Hoffman Associates, LLC (consulting firm) (since 2003); Director, The Todd |
| Organization (consulting firm) (2003–2010); President, Westport Resources Management (investment |
| management consulting firm) (2006–2008); Senior Managing Director, Partner and Operating Head, |
| Putnam Investments (2000–2003); Executive Vice President, The Thomson Corp. (financial and |
| legal information publishing) (1997–2000). Trustee, John Hancock retail funds (since 2012); Trustee, |
| John Hancock Variable Insurance Trust and John Hancock Funds II (since 2008). | |
| |
| Deborah C. Jackson, Born: 1952 | 2008 | 240 |
|
| President, Cambridge College, Cambridge, Massachusetts (since 2011); Chief Executive Officer, |
| American Red Cross of Massachusetts Bay (2002–2011); Board of Directors of Eastern Bank Corporation |
| (since 2001); Board of Directors of Eastern Bank Charitable Foundation (since 2001); Board of Directors |
| of American Student Assistance Corporation (1996–2009); Board of Directors of Boston Stock Exchange |
| (2002–2008); Board of Directors of Harvard Pilgrim Healthcare (health benefits company) (2007–2011). |
| Trustee, John Hancock retail funds (since 2008); Trustee of John Hancock Variable Insurance Trust and |
| John Hancock Funds II (since 2012). | | |
| |
| Hassell H. McClellan,2 Born: 1945 | 2012 | 240 |
|
| Associate Professor, The Wallace E. Carroll School of Management, Boston College (since 1984); |
| Trustee, Virtus Variable Insurance Trust (formerly Phoenix Edge Series Funds) (since 2008); Director, |
| The Barnes Group (since 2010). Trustee, John Hancock retail funds (since 2012); Trustee, John Hancock |
| Funds III (2005–2006); Trustee, John Hancock Variable Insurance Trust and John Hancock Funds II |
| (since 2005). | | |
| |
| Steven R. Pruchansky, Born: 1944 | 2004 | 240 |
|
| Chairman and Chief Executive Officer, Greenscapes of Southwest Florida, Inc. (since 2000); Director |
| and President, Greenscapes of Southwest Florida, Inc. (until 2000); Member, Board of Advisors, First |
| American Bank (until 2010); Managing Director, Jon James, LLC (real estate) (since 2000); Director, |
| First Signature Bank & Trust Company (until 1991); Director, Mast Realty Trust (until 1994); President, |
| Maxwell Building Corp. (until 1991). Trustee (since 1992) and Chairman of the Board (2011–2012), |
| John Hancock retail funds; Trustee, John Hancock Variable Insurance Trust and John Hancock Funds II |
| (since 2012). | | |
| |
| Gregory A. Russo, Born: 1949 | 2008 | 240 |
|
| Director and Audit Committee Chairman (since 2012) and Member, Audit Committee and Finance |
| Committee (since 2011), NCH Healthcare System, Inc. (holding company for multi-entity healthcare |
| system); Director and Member of Finance Committee, The Moorings, Inc. (nonprofit continuing care |
| community) (since 2012); Vice Chairman, Risk & Regulatory Matters, KPMG LLP (KPMG) (2002–2006); |
| Vice Chairman, Industrial Markets, KPMG (1998–2002); Chairman and Treasurer, Westchester |
| County, New York, Chamber of Commerce (1986–1992); Director, Treasurer and Chairman of |
| Audit and Finance Committees, Putnam Hospital Center (1989–1995); Director and Chairman of |
| Fundraising Campaign, United Way of Westchester and Putnam Counties, New York (1990–1995). |
| Trustee, John Hancock retail funds (since 2008); Trustee, John Hancock Variable Insurance Trust and |
| John Hancock Funds II (since 2012). | | |
| |
| 40 | Tax-Advantaged Dividend Income Fund | Annual report |
| | |
| Non-Independent Trustees4 | | |
| | | |
| Name, Year of Birth | Trustee | Number of |
| Position(s) held with Fund | of the | John Hancock |
| Principal occupation(s) and other | Trust | funds overseen |
| directorships during past 5 years | since1 | by Trustee |
| |
| James R. Boyle,2 Born: 1959 | 2012 | 240 |
|
| Senior Executive Vice President, John Hancock Financial Services (since 1999, including prior positions); |
| Chairman and Director, John Hancock Advisers, LLC, John Hancock Funds, LLC and John Hancock |
| Investment Management Services, LLC (2005–2010). Trustee, John Hancock retail funds (since 2012 and |
| 2005–2010), Trustee, John Hancock Variable Insurance Trust and John Hancock Funds II (since 2005). |
| |
| Craig Bromley,2 Born: 1966 | 2012 | 240 |
|
| President, John Hancock Financial Services (since 2012); Senior Executive Vice President and General |
| Manager, U.S. Division, John Hancock Financial Services (since 2012); President and Chief Executive |
| Officer, Manulife Insurance Company (Manulife (Japan) (2005–2010), including prior positions). |
| Trustee, John Hancock retail funds (since 2012); Trustee, John Hancock Variable Insurance Trust and |
| John Hancock Funds II (since 2012). | | |
| |
| Warren A. Thomson,2 Born: 1955 | 2012 | 240 |
|
| Senior Executive Vice President and Chief Investment Officer, Manulife Financial Corporation (since |
| 2001, including prior positions); Director, Manulife Trust Company and Manulife Bank of Canada (since |
| 2001, including prior positions); Director and Chairman, Manulife Asset Management (since 2001, |
| including prior positions). Trustee, John Hancock retail funds, John Hancock Variable Insurance Trust and |
| John Hancock Funds II (since 2012). | | |
| |
| Principal officers who are not Trustees | | |
| | | |
| Name, Year of Birth | | Officer |
| Position(s) held with Fund | | of the |
| Principal occupation(s) and other | | Trust |
| directorships during past 5 years | | since |
| |
| Hugh McHaffie, Born: 1959 | | 2012 |
|
| President | | |
| Executive Vice President, John Hancock Financial Services (since 2006, including prior positions); |
| Chairman and Director, John Hancock Advisers, LLC, John Hancock Investment Management Services, |
| LLC and John Hancock Funds, LLC (since 2010); President, John Hancock Advisers, LLC (since 2012); |
| President, John Hancock Investment Management Services, LLC (since 2010). President (since 2012) and |
| former Trustee (2010–2012), John Hancock retail funds; President, John Hancock Variable Insurance |
| Trust and John Hancock Funds II (since 2009). | | |
| |
| Andrew G. Arnott, Born: 1971 | | 2009 |
|
| Executive Vice President | | |
| Senior Vice President, John Hancock Financial Services (since 2009); Executive Vice President, |
| John Hancock Advisers, LLC (since 2005); Executive Vice President, John Hancock Investment |
| Management Services, LLC (since 2006); President, John Hancock Funds, LLC (since 2004, including |
| prior positions); Executive Vice President, John Hancock retail funds (since 2007, including prior |
| positions); Executive Vice President, John Hancock Variable Insurance Trust and John Hancock Funds II |
| (since 2007, including prior positions). | | |
| |
| Thomas M. Kinzler, Born: 1955 | | 2006 |
|
| Secretary and Chief Legal Officer | | |
| Vice President, John Hancock Financial Services (since 2006); Secretary and Chief Legal Counsel, |
| John Hancock Funds, LLC (since 2007); Secretary and Chief Legal Officer, John Hancock retail funds, |
| John Hancock Variable Insurance Trust and John Hancock Funds II (since 2006). | |
| |
| Annual report | Tax-Advantaged Dividend Income Fund | 41 |
| |
| Principal officers who are not Trustees (continued) | |
| | |
| Name, Year of Birth | Officer |
| Position(s) held with Fund | of the |
| Principal occupation(s) and other | Trust |
| directorships during past 5 years | since |
| |
| Francis V. Knox, Jr., Born: 1947 | 2005 |
|
| Chief Compliance Officer | |
| Vice President, John Hancock Financial Services (since 2005); Chief Compliance Officer, John Hancock |
| retail funds, John Hancock Variable Insurance Trust, John Hancock Funds II, John Hancock Advisers, |
| LLC and John Hancock Investment Management Services, LLC (since 2005); Vice President and Chief |
| Compliance Officer, John Hancock Asset Management a division of Manulife Asset Management (US) |
| LLC (2005–2008). | |
| |
| Charles A. Rizzo, Born: 1957 | 2007 |
|
| Chief Financial Officer | |
| Vice President, John Hancock Financial Services (since 2008); Senior Vice President, John Hancock | |
| Advisers, LLC and John Hancock Investment Management Services, LLC (since 2008); Chief Financial |
| Officer, John Hancock retail funds, John Hancock Variable Insurance Trust and John Hancock | |
| Funds II (since 2007). | |
| |
| Salvatore Schiavone, Born: 1965 | 2009 |
|
| Treasurer | |
| Assistant Vice President, John Hancock Financial Services (since 2007); Vice President, John Hancock |
| Advisers, LLC and John Hancock Investment Management Services, LLC (since 2007); Treasurer, | |
| John Hancock retail funds (since 2007, including prior positions); Treasurer, John Hancock Variable | |
| Insurance Trust (since 2010 and 2007–2009, including prior positions); Treasurer, John Hancock Fund II |
| (since 2010, including prior positions). | |
John Hancock retail funds is comprised of John Hancock Funds III and 33 other John Hancock funds consisting of 23 series of other John Hancock trusts and 10 closed-end funds.
The business address for all Trustees and Officers is 601 Congress Street, Boston, Massachusetts 02210–2805.
1 Mr. Bromley, Ms. Jackson, Mr. Oates and Mr. Pruchansky serve as Trustees for a term expiring in 2016; Mr. Bardelis, Mr. Burgess, Mr. Hoffman and Mr. Thomson serve as Trustees for a term expiring in 2015; Mr. Boyle, Mr. Cunningham, Ms. Fey, Mr. McClellan and Mr. Russo serve for a term expiring in 2014.
2 Became a Trustee of the Fund, effective December 1, 2012.
3 Member of Audit Committee.
4 Because Messrs. Bromley and Thomson are senior executives or directors and Mr. Boyle held prior positions as a senior executive or director with the Adviser and/or its affiliates, each of them is considered an “interested person,” as defined in the Investment Company Act of 1940, of the Fund.
| |
| 42 | Tax-Advantaged Dividend Income Fund | Annual report |
More information
| | |
| Trustees | Officers | Investment adviser |
| James M. Oates | Hugh McHaffie | John Hancock Advisers, LLC |
| Chairman | President | |
| Charles L. Bardelis* | | Subadviser |
| James R. Boyle† | Andrew G. Arnott | John Hancock Asset Management |
| Craig Bromley† | Executive Vice President | a division of Manulife Asset |
| Peter S. Burgess* | | Management (US) LLC |
| William H. Cunningham | Thomas M. Kinzler | |
| Grace K. Fey | Secretary and Chief Legal Officer | Analytic Investors, LLC |
| Theron S. Hoffman* | | |
| Deborah C. Jackson | Francis V. Knox, Jr. | Custodian |
| Hassell H. McClellan | Chief Compliance Officer | State Street Bank and |
| Steven R. Pruchansky | | Trust Company |
| Vice Chairman | Charles A. Rizzo | |
| Gregory A. Russo | Chief Financial Officer | Transfer agent |
| Warren A. Thomson† | | Computershare Shareowner |
| Salvatore Schiavone | Services, LLC |
| *Member of the | Treasurer | |
| Audit Committee | | Legal counsel |
| †Non-Independent Trustee | | K&L Gates LLP |
| | |
| | | Independent registered |
| | | public accounting firm |
| | | PricewaterhouseCoopers LLP |
| | | |
| | | Stock symbol |
| | | Listed New York Stock |
| | Exchange: HTD |
For shareholder assistance refer to page 32
| |
| You can also contact us: | |
| 1-800-852-0218 | Regular mail: |
| jhfunds.com | Computershare Shareowner Services, LLC |
| | Newport Office Center VII |
| | 480 Washington Boulevard |
| | Jersey City, NJ 07310-1900 |
The Fund’s proxy voting policies and procedures, as well as the Fund’s proxy voting record for the most recent twelve-month period ended June 30, are available free of charge on the Securities and Exchange Commission (SEC) Web site at www.sec.gov or on our Web site.
The Fund’s complete list of portfolio holdings, for the first and third fiscal quarters, is filed with the SEC on Form N-Q. The Fund’s Form N-Q is available on our Web site and the SEC’s Web site, www.sec.gov, and can be reviewed and copied (for a fee) at the SEC’s Public Reference Room in Washington, DC. Call 1-202-551-8090 to receive information on the operation of the SEC’s Public Reference Room.
We make this information on your fund, as well as monthly portfolio holdings, and other fund details available on our Web site at www.jhfunds.com or by calling 1-800-852-0218.
The report is certified under the Sarbanes-Oxley Act, which requires closed-end funds and other public companies to affirm that, to the best of their knowledge, the information in their financial reports is fairly and accurately stated in all material respects.
| |
| Annual report | Tax-Advantaged Dividend Income Fund | 43 |

| |
| PRESORTED |
| STANDARD |
| U.S. POSTAGE |
| PAID |
| MIS |
1-800-852-0218
1-800-231-5469 TDD
1-800-843-0090 EASI-Line
www.jhfunds.com
ITEM 2. CODE OF ETHICS.
As of the end of the period, October 31, 2012, the registrant has adopted a code of ethics, as defined in Item 2 of Form N-CSR, that applies to its Chief Executive Officer and Chief Financial Officer (respectively, the principal executive officer, the principal financial officer, the “Covered Officers”). A copy of the code of ethics is filed as an exhibit to this Form N-CSR.
ITEM 3. AUDIT COMMITTEE FINANCIAL EXPERT.
Peter S. Bardelis is the audit committee financial expert and is “independent”, pursuant to general instructions on Form N-CSR Item 3.
ITEM 4. PRINCIPAL ACCOUNTANT FEES AND SERVICES.
(a) Audit Fees
The aggregate fees billed for professional services rendered by the principal accountant(s) for the audit of the registrant’s annual financial statements or services that are normally provided by the accountant(s) in connection with statutory and regulatory filings or engagements amounted to $35,048 for the fiscal year ended October 31, 2012 and $34,190 for the fiscal period ended October 31, 2011. These fees were billed to the registrant and were approved by the registrant’s audit committee.
(b) Audit-Related Services
The audit-related fees amounted to $0 for the fiscal year ended October 31, 2012 and $6,374 for the fiscal period ended October 31, 2011 billed to the registrant or to the registrant's investment adviser (not including any sub-adviser whose role is primarily portfolio management and is subcontracted with or overseen by another investment adviser), and any entity controlling, controlled by, or under common control with the adviser that provides ongoing services to the registrant ("control affiliates"). The nature of the services comprising the audit-related services was the review of litigation related expenses.
(c) Tax Fees
The aggregate fees billed for professional services rendered by the principal accountant(s) for the tax compliance, tax advice and tax planning (“tax fees”) amounted to $3,260 for the fiscal year ended October 31, 2012 and $3,165 for the fiscal period ended October 31, 2011. The nature of the services comprising the tax fees was the review of the registrant’s tax returns and tax distribution requirements. These fees were billed to the registrant and were approved by the registrant’s audit committee.
(d) All Other Fees
The all other fees billed to the registrant for products and services provided by the principal accountant were $171 for the fiscal year ended October 31, 2012 and $73 for the fiscal period ended October 31, 2011 billed to control affiliates for products and services provided by the principal accountant. These fees were approved by the registrant’s audit committee.
(e)(1) Audit Committee Pre-Approval Policies and Procedures:
The trust’s Audit Committee must pre-approve all audit and non-audit services provided by the independent registered public accounting firm (the “Auditor”) relating to the operations or financial reporting of the funds. Prior to the commencement of any audit or non-audit services to a fund, the Audit Committee reviews the services to determine whether they are appropriate and permissible under applicable law.
The trust’s Audit Committee has adopted policies and procedures to, among other purposes, provide a framework for the Committee’s consideration of audit-related and non-audit services by the Auditor. The policies and procedures require that any audit-related and non-audit service provided by the Auditor and any non-audit service provided by the Auditor to a fund service
provider that relates directly to the operations and financial reporting of a fund are subject to approval by the Audit Committee before such service is provided. Audit-related services provided by the Auditor that are expected to exceed $25,000 per instance/per fund are subject to specific pre-approval by the Audit Committee. Tax services provided by the Auditor that are expected to exceed $30,000 per instance/per fund are subject to specific pre-approval by the Audit Committee.
All audit services, as well as the audit-related and non-audit services that are expected to exceed the amounts stated above, must be approved in advance of provision of the service by formal resolution of the Audit Committee. At the regularly scheduled Audit Committee meetings, the Committee reviews a report summarizing the services, including fees, provided by the Auditor.
(e)(2) Services approved pursuant to paragraph (c)(7)(i)(C) of Rule 2-01 of Regulation S-X:
Audit-Related Fees, Tax Fees and All Other Fees:
There were no amounts that were approved by the Audit Committee pursuant to the de minimis exception under Rule 2-01 of Regulation S-X.
(f) According to the registrant’s principal accountant, for the fiscal period ended October 31, 2012, the percentage of hours spent on the audit of the registrant's financial statements for the most recent fiscal year that were attributed to work performed by persons who were not full-time, permanent employees of principal accountant was less than 50%.
(g) The aggregate non-audit fees billed by the registrant's accountant(s) for services rendered to the registrant and rendered to the registrant's control affiliates for each of the last two fiscal years of the registrant were $3,659,365 for the fiscal year ended October 31, 2012 and $1,675,016 for the fiscal period ended October 31, 2011.
(h) The audit committee of the registrant has considered the non-audit services provided by the registrant’s principal accountant(s) to the control affiliates and has determined that the services that were not pre-approved are compatible with maintaining the principal accountant(s)' independence.
ITEM 5. AUDIT COMMITTEE OF LISTED REGISTRANTS.
The registrant has a separately-designated standing audit committee comprised of independent trustees. The members of the audit committee are as follows:
Peter S. Burgess - Chairman
Charles L. Bardelis
Theron S. Hoffman
ITEM 6. SCHEDULE OF INVESTMENTS.
(a) Not applicable.
(b) Not applicable.
ITEM 7. DISCLOSURE OF PROXY VOTING POLICIES AND PROCEDURES FOR CLOSED-END MANAGEMENT INVESTMENT COMPANIES.
See attached Exhibit “Proxy Voting Policies and Procedures”.
ITEM 8. PORTFOLIO MANAGERS OF CLOSED-END MANAGEMENT INVESTMENT COMPANIES.
Information about the JHAM portfolio managers
Management Biographies
Below is a list of the JHAM portfolio managers who share joint responsibility for the day-to-day investment management of the Fund. It provides a brief summary of their business careers over the past five years. Information is provided as of November 1, 2012.
Gregory K. Phelps
Senior Vice President, John Hancock Asset Management since 2005
Began business career in 1981
Joined fund team in 2002 (inception)
Mark T. Maloney
Vice President, John Hancock Asset Management since 2005
Began business career in 1976
Joined fund team in 2002 (inception)
Lisa A. Welch
Vice President, John Hancock Asset Management since 2005
Began business career in 1986
Joined fund team in 2004
Other Accounts the Portfolio Managers are Managing
The table below indicates for each portfolio manager information about the accounts over which the portfolio manager has day-to-day investment responsibility. All information on the number of accounts and total assets in the table is as of October 31, 2012. For purposes of the table, “Other Pooled Investment Vehicles” may include investment partnerships and group trusts, and “Other Accounts” may include separate accounts for institutions or individuals, insurance company general or separate accounts, pension funds and other similar institutional accounts.
| |
| PORTFOLIO MANAGER | OTHER ACCOUNTS MANAGED BY THE PORTFOLIO |
| NAME | MANAGER |
|
| Gregory K. Phelps | Other Registered Investment Companies: Four (4) funds |
| | with assets of approximately $3.6 billion |
| | Other Pooled Investment Vehicles: None |
| | Other Accounts: None |
|
| |
| Mark T. Maloney | Other Registered Investment Companies: Four (4) funds |
| | with assets of approximately $3.6 billion |
| | Other Pooled Investment Vehicles: None |
| | Other Accounts: None |
|
| |
| Lisa A. Welch | Other Investment Companies: Three (3) funds with |
| | assets of approximately $1.2 billion. |
| | Other Pooled Investment Vehicles: Three (3) accounts |
| | with assets of approximately $51 million. |
| | Other Accounts: None |
|
The Subadviser does not receive a fee based upon the investment performance of any of the accounts included under “Other Accounts Managed by the Portfolio Managers” in the table above.
Conflicts of Interest. When a portfolio manager is responsible for the management of more than one account, the potential arises for the portfolio manager to favor one account over another. The principal types of potential conflicts of interest that may arise are discussed below. For the reasons outlined below, the Fund does not believe that any material conflicts are likely to arise out of a portfolio manager’s responsibility for the management of the Fund as well as one or more other accounts. The Subadviser has adopted procedures that are intended to monitor compliance with the policies referred to in the following paragraphs. Generally, the risks of such conflicts of interests are increased to the extent that a portfolio manager has a financial incentive to favor one account over another. The Subadviser has structured its compensation arrangements in a manner that is intended to limit such potential for conflicts of interests. See “Compensation of Portfolio Managers” below.
• A portfolio manager could favor one account over another in allocating new investment opportunities that have limited supply, such as initial public offerings (“IPOs”) and private placements. If, for example, an IPO that was expected to appreciate in value significantly shortly after the offering was allocated to a single account, that account may be expected to have better investment performance than other accounts that did not receive an allocation on the IPO. The Subadviser has policies that require a portfolio manager to allocate such investment opportunities in an equitable manner and generally to allocate such investments proportionately among all accounts with similar investment objectives.
• A portfolio manager could favor one account over another in the order in which trades for the accounts are placed. If a portfolio manager determines to purchase a security for more than one account in an aggregate amount that may influence the market price of the security, accounts that purchased or sold the security first may receive a more favorable price than accounts that made subsequent transactions. The less liquid the market for the security or the greater the percentage that the proposed aggregate purchases or sales represent of average daily trading volume, the greater the potential for accounts that make subsequent purchases or sales to receive a less favorable price. When a portfolio manager intends to trade the same security for more than one account, the policies of the Subadviser generally require that such trades be “bunched,” which means that the trades for the individual accounts
are aggregated and each account receives the same price. There are some types of accounts as to which bunching may not be possible for contractual reasons (such as directed brokerage arrangements). Circumstances also may arise where the trader believes that bunching the orders may not result in the best possible price. Where those accounts or circumstances are involved, the Subadviser will place the order in a manner intended to result in as favorable a price as possible for such client.
• A portfolio manager could favor an account if the portfolio manager’s compensation is tied to the performance of that account rather than all accounts managed by the portfolio manager. If, for example, the portfolio manager receives a bonus based upon the performance of certain accounts relative to a benchmark while other accounts are disregarded for this purpose, the portfolio manager will have a financial incentive to seek to have the accounts that determine the portfolio manager’s bonus achieve the best possible performance to the possible detriment of other accounts. Similarly, if the Subadviser receives a performance-based advisory fee, the portfolio manager may favor that account, whether or not the performance of that account directly determines the portfolio manager’s compensation. The investment performance on specific accounts is not a factor in determining the portfolio manager’s compensation. See “Compensation of Portfolio Managers” below. The Subadviser does not receive a performance-based fee with respect to any of the other accounts managed by the portfolio managers of the Fund described above.
• A portfolio manager could favor an account if the portfolio manager has a beneficial interest in the account, in order to benefit a large client or to compensate a client that had poor returns. For example, if the portfolio manager held an interest in an investment partnership that was one of the accounts managed by the portfolio manager, the portfolio manager would have an economic incentive to favor the account in which the portfolio manager held an interest. The Subadviser imposes certain trading restrictions and reporting requirements for accounts in which a portfolio manager or certain family members have a personal interest in order to confirm that such accounts are not favored over other accounts.
• If the different accounts have materially and potentially conflicting investment objectives or strategies, a conflict of interest may arise. For example, if a portfolio manager purchases a security for one account and sells the same security short for another account, such trading pattern could disadvantage either the account that is long or short. In making portfolio manager assignments, the Subadviser seeks to avoid such potentially conflicting situations. However, where a portfolio manager is responsible for accounts with differing investment objectives and policies, it is possible that the portfolio manager will conclude that it is in the best interest of one account to sell a portfolio security while another account continues to hold or increase the holding in such security. While these accounts have many similarities, the investment performance of each account will be different due to differences in fees, expenses and cash flows.
Compensation of Portfolio Managers. The Subadviser has adopted a system of compensation for portfolio managers and others involved in the investment process that is applied systematically among investment professionals. At the Subadviser, investment professionals are compensated with a combination of base salary and performance bonuses (e.g., cash and deferral awards). The following describes each component of the compensation package for the individuals identified as a portfolio manager for the Fund.
• Base salaries. Base salaries are market-based and fixed. Salary ranges are reviewed and adjusted annually. Individual salary adjustments are based on individual performance against mutually-agreed-upon objectives and development of technical and experiential skills.
• Performance Bonuses. Performance bonuses take the form of cash and deferred incentives.
• Short-Term Cash Incentives. Short-term incentives take the form of annual cash awards. Individual targets are market-based and actual awards are tied to performance against various objective measures and on overall personal performance ratings. These include:
• Investment Performance. The majority of the bonus considered under the plan is based on investment performance of accounts managed by the investment professional over one, three and five year periods (to the extent applicable) and no specific benchmark is used to measure performance.
• Financial Performance of the Subadviser. The financial performance of the Subadviser and its parent corporation are also considered in determining bonus awards.
• Non-Investment Performance. The more intangible contributions of an investment professional to the Subadviser’s business, including new strategy idea generation, professional growth and development, and management, where applicable, are evaluated in determining the amount of any bonus award.
• Long-Term Incentives. All investment professionals are eligible for participation in a deferred incentive plan. 100% of the eligible awards are invested in the strategies that the team manages as well as other strategies managed by other teams at the Subadviser. The Subadviser believes that owning units in the same strategies a team manages aligns the performance goals of both client and manager giving the team added incentive to act in the best interest of the Company’s clients.
As an added incentive, certain investment professionals (considered officers of Manulife Financial) would receive a portion of their award in Manulife Restricted Share Units (“RSUs”) or stock options. This plan is based on the value of the underlying common shares of Manulife Financial.
Share Ownership by Portfolio Managers. The following table indicates as of October 31, 2012 the value, within the indicated range, of shares beneficially owned by the portfolio managers in the Fund.
| |
| Portfolio Manager | Range of Beneficial Ownership |
|
| Gregory K. Phelps | $1-$10,000 |
|
| Mark T. Maloney | $1-$10,000 |
|
| Lisa A. Welch | $0 |
|
Information about the Analytic portfolio managers
Management Biographies
Below is an alphabetical list of the Analytic portfolio managers who share joint responsibility for the implementation and execution of the Fund’s options strategy. It provides a brief summary of their business careers. Information is provided as of November 1, 2012.
Harindra de Silva, Ph. D., CFA
President and portfolio manager, Analytic Investors, LLC since 1995
Began business career in 1984
Joined Fund team in 2007
Gregory M. McMurran
Chief investment officer and portfolio manager, Analytic Investors, LLC since 1976
Began business career in 1976
Joined Fund team in 2007
Dennis Bein, CFA
Chief investment officer and portfolio manager, Analytic Investors, LLC since 1995
Began business career in 1990
Joined Fund team in 2007
Other Accounts the Portfolio Managers are Managing
The table below indicates for each portfolio manager information about the accounts over which the portfolio manager has day-to-day investment responsibility. All information on the number of accounts and total assets in the table is as of October 31, 2012. For purposes of the table, “Other Pooled Investment Vehicles” may include investment partnerships and group trusts, and “Other Accounts” may include separate accounts for institutions or individuals, insurance company general or separate accounts, pension funds and other similar institutional accounts.
| | | | | | |
| | Registered | | | | |
| | Investment | Other Pooled | | |
| | Companies | Investment Vehicles | Other Accounts |
|
| | Number | Total | Number | Total | Number | Total |
| | of | Assets | of | Assets | of | Assets |
| | Accounts | $Million | Accounts | $Million | Accounts | $Million |
|
| Harindra | 8 | $2,096.9 | 21 | $1,220.0 | 21 | $2,702.9 |
| de Silva | (0) | ($0) | (4) | ($151.1) | (4) | ($225.2) |
|
| Gregory | 2 | $128.3 | 3 | $117.9 | 2 | $122.7 |
| McMurran | (0) | ($0) | (0) | ($0) | (0) | ($0) |
|
| Dennis | 7 | $2,040.1 | 19 | $1,164.4 | 21 | $2,592.4 |
| Bein | (0) | ($0) | (4) | ($151.1) | (4) | ($255.2) |
|
Note: ( ) represent the number and value of accounts, within the total accounts that are subject to a performance-based advisory fee.
Conflicts of Interest. Conflicts of interest may arise because the Fund’s portfolio managers have day-to-day management responsibilities with respect to both the Fund and various other accounts. These potential conflicts include:
• Limited Resources. The portfolio managers cannot devote their full time and attention to the management of each of the accounts that they manage. Accordingly, the portfolio managers may be limited in their ability to identify investment opportunities for each of the accounts that are as attractive as might be the case if the portfolio managers were to devote substantially more attention to the management of a single account. The effects of this potential conflict may be more pronounced where the accounts have different investment strategies.
• Limited Investment Opportunities. Other clients of either Subadviser may have investment objectives and policies similar to those of the Fund. Either Subadviser may, from time to time, make recommendations which result in the purchase or sale of a particular security by its other clients simultaneously with the Fund. If transactions on behalf of more than one client during the same period increase the demand for securities being purchased or the supply of securities being sold, there may be an adverse effect on price or quantity. It is the policy of each Subadviser to allocate advisory recommendations and the placing of orders in a manner that it believes is equitable to the accounts involved, including the Fund. When two or more clients of a Subadviser are purchasing or selling the same security on a given day from the same broker-dealer, such transactions may be averaged as to price.
• Different Investment Strategies. The accounts managed by the portfolio managers have differing investment strategies. If the portfolio managers determine that an investment opportunity may be appropriate for only some of the accounts or decide that certain of the accounts should take different positions with respect to a particular security, the portfolio managers may effect transactions for one or more accounts which may affect the market price of the security or the execution of the transaction, or both, to the detriment or benefit of one or more other accounts.
• Variation in Compensation. A conflict of interest may arise where a Subadviser is compensated differently by the accounts that are managed by the portfolio managers. If certain accounts pay higher management fees or performance-based incentive fees, the portfolio managers might be motivated to prefer certain accounts over others. The portfolio managers might also be motivated to favor accounts in which they have a greater ownership interest or accounts that are more likely to enhance the portfolio managers’ performance record or to otherwise benefit the portfolio managers.
• Selection of Brokers. The portfolio managers select the brokers that execute securities transactions for the accounts that they supervise. In addition to executing trades, some brokers provide the portfolio managers with research and other services which may require the payment of higher brokerage fees than might otherwise be available. The portfolio managers’ decision as to the selection of brokers could yield disproportionate costs and benefits among the accounts that they manage, since the research and other services provided by brokers may be more beneficial to some accounts than to others.
Where conflicts of interest arise between the Fund and other accounts managed by the portfolio managers, the portfolio managers will use good faith efforts so that the Fund will not be treated materially less favorably than other accounts. There may be instances
where similar portfolio transactions may be executed for the same security for numerous accounts managed by the portfolio managers. In such instances, securities will be allocated in accordance with the Adviser’s trade allocation policy.
Compensation of Portfolio Managers. Our compensation structure for professional employees consists of an industry median base salary (based on independent industry information) and an annual discretionary bonus. Bonus amounts are determined using following factors: the overall success of the firm in terms of profitability; the overall success of the department or team; and an individual’s contribution to the team, based goals established during the performance period and no specific benchmark is used measure performance. Compensation based on investment strategy performance is not to individual account performance, but rather, each strategy as a whole. Strategy performance information is based on pre-tax calculations for the prior calendar year. portfolio manager is directly compensated a portion of an advisory fee based on performance of a specific account. Members of Analytic’s senior management team investment management professionals may also have a deferred component to their compensation (with a three-year vesting period) that is invested in the firm’s investment products to tie the interests of the individual to the interests of the firm and our clients Portfolio managers’ base salaries are typically reviewed on an annual basis determined each portfolio manager’s anniversary date of employment. Discretionary bonuses determined annually, upon analysis of information from the prior calendar year.
Share Ownership by Portfolio Managers. The following table indicates as of October 31, 2012 the value, within the indicated range, of shares beneficially owned by the portfolio managers in the Fund.
| |
| | Range of |
| | Beneficial |
| Portfolio Manager | Ownership |
|
| Harindra de Silva, PH. D., CFA | $0 |
|
| Gregory M McMurran | $0 |
|
| Dennis Bein, CFA | $0 |
|
ITEM 9. PURCHASES OF EQUITY SECURITIES BY CLOSED-END MANAGEMENT INVESTMENT COMPANY AND AFFILIATED PURCHASERS.
(a) Not applicable
(b) In December 2007, the Trustees approved a share repurchase plan, which has been subsequently reviewed and approved by the Board of Trustees each year in December. Under the current share repurchase plan, the Fund may repurchase in the open market up to 10% of its outstanding common shares as of December 31, 2011. The current plan is in effect between January 1, 2012 and December 31, 2012. On December 12, 2012, the Board renewed the share repurchase plan. As renewed, the Fund may purchase in the open market, between January 1, 2013 and December 31, 2013, up to an additional 10% of its outstanding common shares (based on common shares outstanding as of December 31, 2012). During the year ended October 31, 2012, the Fund did not repurchase any shares under the repurchase plan.
ITEM 10. SUBMISSION OF MATTERS TO A VOTE OF SECURITY HOLDERS.
There were no material changes to previously disclosed John Hancock Funds – Governance Committee Charter.
ITEM 11. CONTROLS AND PROCEDURES.
(a) Based upon their evaluation of the registrant's disclosure controls and procedures as conducted within 90 days of the filing date of this Form N-CSR, the registrant's principal executive officer and principal financial officer have concluded that those disclosure controls and procedures provide reasonable assurance that the material information required to be disclosed by the registrant on this report is recorded, processed, summarized and reported within the time periods specified in the Securities and Exchange Commission's rules and forms.
(b) There were no changes in the registrant's internal control over financial reporting that occurred during the registrant's most recent fiscal half-year (the registrant's second fiscal half-year in the case of an annual report) that have materially affected, or are reasonably likely to materially affect, the registrant's internal control over financial reporting.
ITEM 12. EXHIBITS.
(a)(1) Code of Ethics for Senior Financial Officers is attached.
(a)(2) Separate certifications for the registrant's principal executive officer and principal financial officer, as required by Section 302 of the Sarbanes-Oxley Act of 2002 and Rule 30a-2(a) under the Investment Company Act of 1940, are attached.
(b) Separate certifications for the registrant's principal executive officer and principal financial officer, as required by 18 U.S.C. Section 1350, as adopted pursuant to Section 906 of the Sarbanes-Oxley Act of 2002, and Rule 30a-2(b) under the Investment Company Act of 1940, are attached. The certifications furnished pursuant to this paragraph are not deemed to be "filed" for purposes of Section 18 of the Securities Exchange Act of 1934, or otherwise subject to the liability of that section. Such certifications are not deemed to be incorporated by reference into any filing under the Securities Act of 1933 or the Securities Exchange Act of 1934, except to the extent that the Registrant specifically incorporates them by reference.
(c)(1) Proxy Voting Policies and Procedures are attached.
(c)(2) Submission of Matters to a Vote of Security Holders is attached. See attached “John Hancock Funds – Governance Committee Charter”.
(c)(3) Contact person at the registrant.
Pursuant to the requirements of the Securities Exchange Act of 1934 and the Investment Company Act of 1940, the registrant has duly caused this report to be signed on its behalf by the undersigned, thereunto duly authorized.
John Hancock Tax-Advantaged Dividend Income Fund
| |
| By: | /s/ Hugh McHaffie |
| | ------------------------------ |
| Hugh McHaffie |
| | President |
| |
| |
| Date: | December 20, 2012 |
Pursuant to the requirements of the Securities Exchange Act of 1934 and the Investment Company Act of 1940, this report has been signed below by the following persons on behalf of the registrant and in the capacities and on the dates indicated.
| |
| By: | /s/ Hugh McHaffie |
| | ------------------------------- |
| Hugh McHaffie |
| | President |
| |
| |
| Date: | December 20, 2012 |
| |
| |
| By: | /s/ Charles A. Rizzo |
| | -------------------------------- |
| Charles A. Rizzo |
| | Chief Financial Officer |
| |
| |
| Date: | December 20, 2012 |