UNITED STATES
SECURITIES AND EXCHANGE COMMISSION
Washington, D.C. 20549
FORM N-CSR
CERTIFIED SHAREHOLDER REPORT OF REGISTERED
MANAGEMENT INVESTMENT COMPANIES
Investment Company Act file number811-21416
John Hancock Tax-Advantaged Dividend Income Fund
(Exact name of registrant as specified in charter)
200 Berkeley Street, Boston, Massachusetts 02116
(Address of principal executive offices) (Zip code)
Salvatore Schiavone
Treasurer
200 Berkeley Street
Boston, Massachusetts 02116
(Name and address of agent for service)
Registrant's telephone number, including area code:617-663-4497
| Date of fiscal year end: | October 31 | |
| Date of reporting period: | October 31, 2019 |
ITEM 1. REPORTS TO STOCKHOLDERS.
John Hancock
Tax-Advantaged Dividend Income Fund
Ticker: HTD
Annual report 10/31/19
Beginning on January 1, 2021, as permitted by regulations adopted by the Securities and Exchange Commission, paper copies of the fund's shareholder reports such as this one will no longer be sent by mail, unless you specifically request paper copies of the reports from the transfer agent or from your financial intermediary. Instead, the reports will be made available on our website, and you will be notified by mail each time a report is posted and be provided with a website link to access the report.
If you have already elected to receive shareholder reports electronically, you will not be affected by this change and you do not need to take any action. You may elect to receive shareholder reports and other communications electronically by calling the transfer agent, Computershare, at 800-852-0218, by going to "Communication Preferences" at computershare.com/investor, or by contacting your financial intermediary.
You may elect to receive all reports in paper, free of charge, at any time. You can inform the transfer agent or your financial intermediary that you wish to continue receiving paper copies of your shareholder reports by following the instructions listed above. Your election to receive reports in paper will apply to all funds held with John Hancock Investment Management or your financial intermediary.

Managed distribution plan
On September 19, 2016, the fund adopted a managed distribution plan (Plan). Under the Plan, the fund makes monthly distributions of an amount equal to $0.1380 per share, which will be paid monthly until further notice. The fund may make additional distributions (i) for purposes of not incurring federal income tax on investment company taxable income and net capital gain, if any, not included in such regular distributions and (ii) for purposes of not incurring federal excise tax on ordinary income and capital gain net income, if any, not included in such regular monthly distributions.
The Plan provides that the Board of Trustees of the fund may amend the terms of the Plan or terminate the Plan at any time without prior notice to the fund's shareholders. The Plan is subject to periodic review by the fund's Board of Trustees.
You should not draw any conclusions about the fund's investment performance from the amount of the fund's distributions or from the terms of the Plan. The fund's total return at NAV is presented in the Financial highlights.
With each distribution that does not consist solely of net investment income, the fund will issue a notice to shareholders and an accompanying press release that will provide detailed information regarding the amount and composition of the distribution and other related information. The amounts and sources of distributions reported in the notice to shareholders are only estimates and are not being provided for tax reporting purposes. The actual amounts and sources of the amounts for tax reporting purposes will depend upon the fund's investment experience during the remainder of its fiscal year and may be subject to changes based on tax regulations. The fund will send you a Form 1099-DIV for the calendar year that will tell you how to report these distributions for federal income tax purposes. The fund may at times distribute more than its net investment income and net realized capital gains; therefore, a portion of your distribution may result in a return of capital. A return of capital may occur, for example, when some or all of the money that you invested in the fund is paid back to you. A return of capital does not necessarily reflect the fund's investment performance and should not be confused with "yield" or "income."

A message to shareholders
Dear shareholder,
It was a volatile time for stock investors in the United States during the 12 months ended October 31, 2019, although many segments of the market delivered attractive absolute returns for the period. Uncertainty surrounding trade with China, the impeachment inquiry against President Trump, and the broader health of the global economy led to some dramatic swings in performance. Investors, who had generally shunned riskier assets in the final months of 2018, regained their risk appetites in the first half of 2019. Despite setbacks in May and August, the markets closed the period on record highs. Against this backdrop, the U.S. Federal Reserve pivoted from raising short-term interest rates to an easing stance, cutting interest rates three times in the latter half of the period.
While the economic fundamentals in the United States appear fairly solid, with a strong labor market and a confident consumer base, there are sure to be patches of market turbulence as the year goes on, particularly if the likelihood of a recession is perceived to increase. As always, your best resource in unpredictable markets is your financial advisor, who can help position your portfolio so that it's sufficiently diversified to meet your long-term objectives and to withstand the inevitable bouts of market volatility along the way.
On behalf of everyone at John Hancock Investment Management, I'd like to take this opportunity to welcome new shareholders and thank existing shareholders for the continued trust you've placed in us.
Sincerely,

Andrew G. Arnott
President and CEO,
John Hancock Investment Management
Head of Wealth and Asset Management,
United States and Europe
This commentary reflects the CEO's views as of this report's period end and are subject to change at any time. Diversification does not guarantee investment returns and does not eliminate risk of loss. All investments entail risks, including the possible loss of principal. For more up-to-date information, you can visit our website at jhinvestments.com.
John Hancock
Tax-Advantaged Dividend Income Fund
Table of contents
| 2 | Your fund at a glance | |
| 5 | Manager's Discussion of fund performance | |
| 7 | Fund's investments | |
| 15 | Financial statements | |
| 19 | Financial highlights | |
| 20 | Notes to financial statements | |
| 31 | Report of independent registered public accounting firm | |
| 32 | Tax information | |
| 33 | Additional information | |
| 36 | Continuation of investment advisory and subadvisory agreements | |
| 43 | Trustees and Officers | |
| 47 | More information |
INVESTMENT OBJECTIVE
The fund seeks to provide a high level of after-tax total return from dividend income and capital appreciation.
AVERAGE ANNUAL TOTAL RETURNS AS OF 10/31/19 (%)
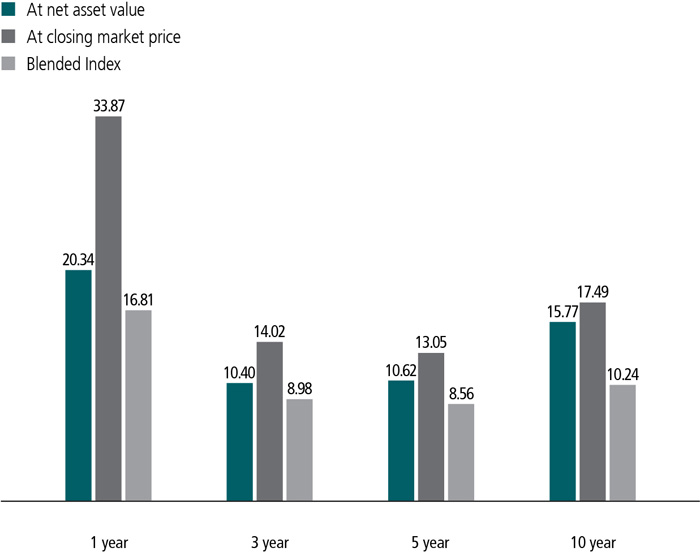
The blended index is 55% ICE Bank of America Merrill Lynch Preferred Stock DRD Eligible Index and 45% S&P 500 Utilities Index.
The ICE Bank of America Merrill Lynch Preferred Stock DRD Eligible Index consists of investment-grade fixed-rate U.S. dollar-denominated preferred securities and fixed-to-floating-rate securities. The index includes securities having a minimum remaining term of at least one year, dividend received deduction (DRD) eligible preferred stock and senior debt.
The S&P 500 Utilities Index is a capitalization-weighted index that consists of companies in the S&P 500 Index that are primarily involved in water, electrical power, and natural gas distribution industries.
It is not possible to invest directly in an index. Index figures do not reflect expenses or sales charges, which would result in lower returns.
The performance data contained within this material represents past performance, which does not guarantee future results.
Investment returns and principal value will fluctuate and a shareholder may sustain losses. Further, the fund's performance at net asset value (NAV) is different from the fund's performance at closing market price because the closing market price is subject to the dynamics of secondary market trading. Market risk may be augmented when shares are purchased at a premium to NAV or sold at a discount to NAV. Current month-end performance may be higher or lower than the performance cited. The fund's most recent performance can be found at jhinvestments.com or by calling 800-852-0218.
PERFORMANCE HIGHLIGHTS OVER THE LAST TWELVE MONTHS
Income-producing securities delivered strong returns for the period
Thanks largely to a drop in interest rates, preferred securities and utility common stocks rallied strongly.
Security selection helped boost the fund's performance
Many of the fund's largest holdings across a number of industry sectors—particularly utilities—helped drive returns.
An interest-rate hedge was the key detractor
The fund's holdings in U.S. Treasury futures contracts detracted from performance as interest rates declined.
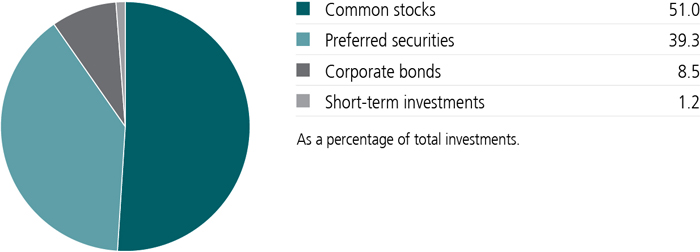
PORTFOLIO COMPOSITION AS OF 10/31/19 (%)
SECTOR COMPOSITION AS OF 10/31/19 (%)

A note about risks
As is the case with all exchange-listed closed-end funds, shares of this fund may trade at a discount or a premium to the fund's net asset value (NAV). An investment in the fund is subject to investment and market risks, including the possible loss of the entire principal invested. There is no guarantee prior distribution levels will be maintained, and distributions may include a substantial return of capital. The value of a company's equity securities is subject to changes in its financial condition and overall market and economic conditions. Fixed-income investments are subject to interest-rate and credit risk; their value will normally decline as interest rates rise or if an issuer, grantor, or counterparty is unable or unwilling to make principal, interest, or settlement payments. Investments in higher-yielding, lower-rated securities are subject to a higher risk of default. An issuer of securities held by the fund may default, have its credit rating downgraded, or otherwise perform poorly, which may affect fund performance. Liquidity—the extent to which a security may be sold or a derivative position closed without negatively affecting its market value—may be impaired by reduced trading volume, heightened volatility, rising interest rates, and other market conditions. The fund's use of leverage creates additional risks, including greater volatility of the fund's NAV, market price, and returns. There is no assurance that the fund's leverage strategy will be successful. Focusing on a particular industry or sector may increase the fund's volatility and make it more susceptible to market, economic, and regulatory risks as well as other factors affecting those industries or sectors. Derivatives transactions, such as hedging and other strategic transactions, may increase a fund's volatility and could produce disproportionate losses, potentially more than the fund's principal investment. Cybersecurity incidents may allow an unauthorized party to gain access to fund assets, customer data, or proprietary information, or cause a fund or its service providers to suffer data corruption or lose operational functionality. Similar incidents affecting issuers of fund securities may negatively affect performance.
Income-producing securities generally posted very strong gains during the past 12 months, helped largely by an increasingly favorable interest-rate backdrop. In early 2019, there was a dovish shift in tone from global monetary policy makers that many investors hoped would lead the U.S. Federal Reserve (Fed) to make cuts in interest rates during the second half of this year. That's exactly what happened as the Fed cut interest rates by a quarter point each three times amid some signs of a slowdown in global economic growth and muted inflation pressures.
Against this backdrop, preferred securities and utility common stocks—two of the fund's biggest areas of emphasis among income-producing securities—rallied strongly. Demand for both preferreds and utilities—whose yields still outshone most other income-oriented securities—increased, further bolstering their prices.
Which elements of the fund's positioning helped and hurt results?
The fund's sizable weighting in the utilities sector was a key driver of performance, with some of the largest holdings in the group performing particularly well. On top of falling interest rates, utility securities were boosted by better investor enthusiasm for the group given their attractive yields and valuations. Individual contributors in this space included Entergy Corp., American Electric Power Company, Inc., and Eversource Energy, among the fund's best-performing holdings during the period.
| TOP 10 ISSUERS AS OF 10/31/19 (%) | COUNTRY COMPOSITION AS OF 10/31/19 (%) | |||
| CenterPoint Energy, Inc. | 4.6 | United States | 89.0 | |
| Dominion Energy, Inc. | 4.5 | United Kingdom | 4.9 | |
| The Southern Company | 3.6 | Canada | 2.7 | |
| DTE Energy Company | 3.5 | Netherlands | 1.1 | |
| American Electric Power Company, Inc. | 3.4 | France | 1.1 | |
| PPL Corp. | 3.3 | Other countries | 1.2 | |
| Morgan Stanley | 3.2 | TOTAL | 100.0 | |
| Ameren Corp. | 3.0 | |||
| Duke Energy Corp. | 3.0 | |||
| Entergy Corp. | 2.8 | |||
| TOTAL | 34.9 | |||
| As a percentage of total investments. | As a percentage of total investments. | |||
| Cash and cash equivalents are not included. | ||||
In contrast, a position in U.S. Treasury futures—which were used to offset higher interest rates—was the biggest detractor from performance as interest rates declined significantly during the period. The fund's exposure to the energy sector also detracted as oil prices trended lower amid news of slowing global economic growth.
What were some key aspects of your portfolio activity?
Some of the more notable transactions were our sales of utility common stocks, the proceeds of which we most often redeployed into more attractively valued mandatory convertible preferred securities. For example, we sold some common stock holdings in Centerpoint Energy, Inc. and Dominion Energy, Inc., and added the convertible preferred securities of those companies.
MANAGED BY
 | Joseph H. Bozoyan, CFA, Manulife IM (US) On the fund since 2015 Investing since 1993 |
 | Brad Lutz, CFA, Manulife IM (US) On the fund since 2017 Investing since 1992 |
 | Gregory M. McMurran, Wells Fargo Asset Management On the fund since 2009 Investing since 1976 |
 | Dennis M. Bein, CFA, Wells Fargo Asset Management On the fund since 2009 Investing since 1992 |
 | Harindra de Silva, Ph.D., CFA, Wells Fargo Asset Management On the fund since 2009 Investing since 1988 |
 | Megan N. Miller, CFA, Wells Fargo Asset Management On the fund since 2018 Investing since 2008 |
![]()
![]()
| Fund’s investments |
| Shares | Value | ||||
| Common stocks 74.6% (51.0% of Total investments) | $708,564,744 | ||||
| (Cost $441,637,259) | |||||
| Communication services 3.8% | 36,236,205 | ||||
| Diversified telecommunication services 3.8% | |||||
| AT&T, Inc. (A) | 550,000 | 21,169,500 | |||
| Verizon Communications, Inc. (A)(B) | 249,160 | 15,066,705 | |||
| Consumer staples 0.9% | 8,795,520 | ||||
| Tobacco 0.9% | |||||
| Philip Morris International, Inc. (A) | 108,000 | 8,795,520 | |||
| Energy 13.8% | 131,161,499 | ||||
| Oil, gas and consumable fuels 13.8% | |||||
| BP PLC, ADR (C) | 810,450 | 30,724,160 | |||
| Enbridge, Inc. (A)(B) | 347,106 | 12,638,129 | |||
| Equitrans Midstream Corp. (A)(B) | 720,000 | 10,022,400 | |||
| Kinder Morgan, Inc. | 550,000 | 10,989,000 | |||
| ONEOK, Inc. | 525,000 | 36,660,750 | |||
| Royal Dutch Shell PLC, ADR, Class A | 258,000 | 14,956,260 | |||
| The Williams Companies, Inc. | 680,000 | 15,170,800 | |||
| Financials 1.8% | 16,854,900 | ||||
| Capital markets 1.8% | |||||
| Ares Management Corp., Class A | 570,000 | 16,854,900 | |||
| Utilities 54.3% | 515,516,620 | ||||
| Electric utilities 31.8% | |||||
| Alliant Energy Corp. | 390,000 | 20,802,600 | |||
| American Electric Power Company, Inc. (C) | 500,000 | 47,195,000 | |||
| Avangrid, Inc. (A)(B) | 465,000 | 23,273,250 | |||
| Duke Energy Corp. (A)(B) | 320,000 | 30,163,200 | |||
| Entergy Corp. | 318,000 | 38,630,639 | |||
| Eversource Energy | 400,000 | 33,496,000 | |||
| FirstEnergy Corp. (A)(B) | 290,000 | 14,012,800 | |||
| NextEra Energy, Inc. (A) | 33,718 | 8,036,348 | |||
| OGE Energy Corp. (C) | 540,000 | 23,252,400 | |||
| Pinnacle West Capital Corp. | 50,000 | 4,706,000 | |||
| PPL Corp. (A)(B) | 590,000 | 19,759,100 | |||
| The Southern Company (A)(B) | 405,000 | 25,377,300 | |||
| Xcel Energy, Inc. | 207,000 | 13,146,570 | |||
| Independent power and renewable electricity producers 1.4% | |||||
| AES Corp. | 800,000 | 13,640,000 | |||
| Multi-utilities 21.1% | |||||
| Ameren Corp. (A)(B)(C) | 540,000 | 41,958,000 | |||
| 7 | JOHN HANCOCK TAX-ADVANTAGED DIVIDEND INCOME FUND | ANNUAL REPORT | SEE NOTES TO FINANCIAL STATEMENTS |
| Shares | Value | ||||
| Utilities (continued) | |||||
| Multi-utilities (continued) | |||||
| Black Hills Corp. (A)(B) | 394,775 | $31,120,113 | |||
| CenterPoint Energy, Inc. (A)(B) | 880,000 | 25,581,600 | |||
| Dominion Energy, Inc. (A)(B) | 400,000 | 33,020,000 | |||
| DTE Energy Company (C) | 240,000 | 30,556,800 | |||
| National Grid PLC, ADR | 201,583 | 11,766,400 | |||
| NiSource, Inc. | 770,000 | 21,590,800 | |||
| Public Service Enterprise Group, Inc. (A) | 70,000 | 4,431,700 | |||
| Preferred securities 57.5% (39.3% of Total investments) | $545,937,898 | ||||
| (Cost $520,587,079) | |||||
| Communication services 3.7% | 35,057,288 | ||||
| Diversified telecommunication services 1.9% | |||||
| Qwest Corp., 6.125% (C) | 730,000 | 18,031,000 | |||
| Wireless telecommunication services 1.8% | |||||
| Telephone & Data Systems, Inc., 5.875% | 340,000 | 8,510,200 | |||
| Telephone & Data Systems, Inc., 6.625% | 39,768 | 1,120,662 | |||
| Telephone & Data Systems, Inc., 6.875% | 261,064 | 6,631,026 | |||
| United States Cellular Corp., 6.950% | 30,000 | 764,400 | |||
| Energy 0.6% | 5,766,600 | ||||
| Oil, gas and consumable fuels 0.6% | |||||
| Enbridge, Inc., Series B (6.375% to 4-15-23, then 3 month LIBOR + 3.593%) | 210,000 | 5,766,600 | |||
| Financials 21.7% | 205,893,995 | ||||
| Banks 11.0% | |||||
| Bank of America Corp., 6.500% | 177,178 | 4,528,670 | |||
| BB&T Corp. (Callable 12-3-19), 5.200% | 480,000 | 12,254,400 | |||
| BB&T Corp. (Callable 3-1-20), 5.200% | 150,000 | 3,832,500 | |||
| Citigroup, Inc. (7.125% to 9-30-23, then 3 month LIBOR + 4.040%) | 210,854 | 6,083,138 | |||
| Fifth Third Bancorp, 6.000% (A)(B) | 400,000 | 10,984,000 | |||
| JPMorgan Chase & Co., 5.450% | 245,000 | 6,134,800 | |||
| JPMorgan Chase & Co., 6.100% | 510,000 | 13,086,600 | |||
| JPMorgan Chase & Co., 6.125% | 98,888 | 2,502,855 | |||
| Synovus Financial Corp. (6.300% to 6-21-23, then 3 month LIBOR + 3.352%) | 188,000 | 4,985,760 | |||
| The PNC Financial Services Group, Inc., 5.375% (C) | 280,000 | 7,243,600 | |||
| The PNC Financial Services Group, Inc. (6.125% to 5-1-22, then 3 month LIBOR + 4.067%) | 40,000 | 1,087,600 | |||
| U.S. Bancorp, 5.150% (C) | 720,000 | 18,316,800 | |||
| U.S. Bancorp (6.500% to 1-15-22, then 3 month LIBOR + 4.468%) | 296,000 | 8,098,560 | |||
| Wells Fargo & Company, 6.000% | 215,000 | 5,471,750 | |||
| Capital markets 8.8% | |||||
| Morgan Stanley (6.375% to 10-15-24, then 3 month LIBOR + 3.708%) | 220,000 | 6,193,000 | |||
| Morgan Stanley, 6.625% | 1,057,915 | 26,945,095 | |||
| SEE NOTES TO FINANCIAL STATEMENTS | ANNUAL REPORT | JOHN HANCOCK TAX-ADVANTAGED DIVIDEND INCOME FUND | 8 |
| Shares | Value | ||||
| Financials (continued) | |||||
| Capital markets (continued) | |||||
| Morgan Stanley (7.125% to 10-15-23, then 3 month LIBOR + 4.320%) | 395,862 | $11,507,708 | |||
| State Street Corp., 5.250% | 900,000 | 22,887,000 | |||
| State Street Corp., 6.000% | 192,065 | 4,878,451 | |||
| State Street Corp. (5.900% to 3-15-24, then 3 month LIBOR + 3.108%) | 25,000 | 690,000 | |||
| The Bank of New York Mellon Corp., 5.200% | 425,000 | 10,867,250 | |||
| Consumer finance 0.7% | |||||
| Capital One Financial Corp., 6.200% | 100,183 | 2,618,784 | |||
| Capital One Financial Corp., 6.700% | 136,569 | 3,463,390 | |||
| Insurance 1.2% | |||||
| Athene Holding, Ltd., Series A (6.350% to 6-30-29, then 3 month LIBOR + 4.253%) | 355,787 | 10,001,172 | |||
| Prudential Financial, Inc., 5.750% | 47,460 | 1,231,112 | |||
| Industrials 0.4% | 3,500,884 | ||||
| Machinery 0.4% | |||||
| Stanley Black & Decker, Inc., 5.750% | 135,326 | 3,500,884 | |||
| Information technology 2.2% | 20,577,380 | ||||
| Semiconductors and semiconductor equipment 2.2% | |||||
| Broadcom, Inc., 8.000% (A) | 19,000 | 20,577,380 | |||
| Real estate 0.7% | 7,029,950 | ||||
| Equity real estate investment trusts 0.7% | |||||
| American Homes 4 Rent, Series D, 6.500% | 30,000 | 803,700 | |||
| Crown Castle International Corp., 6.875% (A) | 5,000 | 6,226,250 | |||
| Utilities 28.2% | 268,111,801 | ||||
| Electric utilities 13.2% | |||||
| Duke Energy Corp., 5.125% | 221,008 | 5,602,553 | |||
| Duke Energy Corp., 5.750% | 200,000 | 5,580,000 | |||
| Interstate Power & Light Company, 5.100% (C) | 1,302,023 | 33,930,719 | |||
| NextEra Energy Capital Holdings, Inc., 5.000% | 110,000 | 2,758,800 | |||
| PPL Capital Funding, Inc., 5.900% | 1,013,052 | 25,761,912 | |||
| SCE Trust II, 5.100% | 1,157,500 | 26,321,550 | |||
| The Southern Company, 6.250% | 80,000 | 2,111,200 | |||
| The Southern Company, 6.750% (A) | 435,000 | 23,124,600 | |||
| Gas utilities 1.8% | |||||
| South Jersey Industries, Inc., 7.250% (A) | 220,200 | 11,230,200 | |||
| Spire, Inc., 5.900% | 219,650 | 5,943,729 | |||
| Multi-utilities 13.2% | |||||
| Algonquin Power & Utilities Corp. (6.200% to 7-1-24, then 3 month LIBOR + 4.010%) (A)(B) | 200,000 | 5,554,000 | |||
| Algonquin Power & Utilities Corp. (6.875% to 10-17-23, then 3 month LIBOR + 3.677%) | 479,050 | 13,389,448 | |||
| 9 | JOHN HANCOCK TAX-ADVANTAGED DIVIDEND INCOME FUND | ANNUAL REPORT | SEE NOTES TO FINANCIAL STATEMENTS |
| Shares | Value | ||||
| Utilities (continued) | |||||
| Multi-utilities (continued) | |||||
| CenterPoint Energy, Inc., 7.000% (A) | 528,000 | $26,928,000 | |||
| Dominion Energy, Inc., 7.250% (A) | 281,000 | 30,126,010 | |||
| DTE Energy Company (Callable 12-3-19), 5.250% (C) | 166,933 | 4,246,776 | |||
| DTE Energy Company, 6.250% | 284,000 | 14,421,520 | |||
| Integrys Holding, Inc. (6.000% to 8-1-23, then 3 month LIBOR + 3.220%) | 210,000 | 5,775,000 | |||
| NiSource, Inc. (6.500% to 3-15-24, then 5 Year CMT + 3.632%) | 250,000 | 6,927,500 | |||
| Sempra Energy, 5.750% | 45,000 | 1,192,500 | |||
| Sempra Energy, 6.000% (A) | 64,600 | 7,495,538 | |||
| Sempra Energy, 6.750% (A) | 83,400 | 9,690,246 | |||
| Rate (%) | Maturity date | Par value^ | Value | ||
| Corporate bonds 12.4% (8.5% of Total investments) | $117,754,298 | ||||
| (Cost $111,606,857) | |||||
| Consumer discretionary 1.1% | 10,639,750 | ||||
| Automobiles 1.1% | |||||
| General Motors Financial Company, Inc. (6.500% to 9-30-28, then 3 month LIBOR + 3.436%) (A)(B)(D) | 6.500 | 09-30-28 | 10,600,000 | 10,639,750 | |
| Financials 9.2% | 86,989,548 | ||||
| Banks 8.4% | |||||
| Bank of America Corp. (5.875% to 3-15-28, then 3 month LIBOR + 2.931%) (A)(B)(D) | 5.875 | 03-15-28 | 8,500,000 | 9,345,325 | |
| BNP Paribas SA (7.375% to 8-19-25, then 5 Year U.S. Swap Rate + 5.150%) (A)(D) | 7.375 | 08-19-25 | 13,000,000 | 14,690,000 | |
| Citizens Financial Group, Inc. (6.000% to 7-6-23, then 3 month LIBOR + 3.003%) (A)(D) | 6.000 | 07-06-23 | 13,000,000 | 13,650,000 | |
| Citizens Financial Group, Inc. (6.375% to 4-6-24, then 3 month LIBOR + 3.157%) (A)(D) | 6.375 | 04-06-24 | 10,500,000 | 11,156,250 | |
| HSBC Holdings PLC (6.500% to 3-23-28, then 5 Year U.S. ISDAFIX + 3.606%) (A)(D) | 6.500 | 03-23-28 | 2,500,000 | 2,646,875 | |
| Huntington Bancshares, Inc. (5.700% to 4-15-23, then 3 month LIBOR + 2.880%) (A)(B)(D) | 5.700 | 04-15-23 | 3,000,000 | 3,093,210 | |
| Lloyds Banking Group PLC (7.500% to 6-27-24, then 5 Year U.S. Swap Rate + 4.760%) (A)(D) | 7.500 | 06-27-24 | 11,500,000 | 12,592,500 | |
| The Royal Bank of Scotland Group PLC (8.000% to 8-10-25, then 5 Year U.S. Swap Rate + 5.720%) (A)(B)(C)(D) | 8.000 | 08-10-25 | 8,624,000 | 9,863,700 | |
| Wells Fargo & Company (5.900% to 6-15-24, then 3 month LIBOR + 3.110%) (A)(B)(D) | 5.900 | 06-15-24 | 2,000,000 | 2,160,000 | |
| SEE NOTES TO FINANCIAL STATEMENTS | ANNUAL REPORT | JOHN HANCOCK TAX-ADVANTAGED DIVIDEND INCOME FUND | 10 |
| Rate (%) | Maturity date | Par value^ | Value | ||
| Financials (continued) | |||||
| Capital markets 0.7% | |||||
| Credit Suisse Group AG (7.500% to 7-17-23, then 5 Year U.S. Swap Rate + 4.600%) (A)(B)(D)(E) | 7.500 | 07-17-23 | 6,214,000 | $6,701,178 | |
| Insurance 0.1% | |||||
| MetLife, Inc. (5.875% to 3-15-28, then 3 month LIBOR + 2.959%) (A)(D) | 5.875 | 03-15-28 | 1,000,000 | 1,090,510 | |
| Utilities 2.1% | 20,125,000 | ||||
| Electric utilities 0.5% | |||||
| Southern California Edison Company (6.250% to 2-1-22, then 3 month LIBOR + 4.199%) (A)(D) | 6.250 | 02-01-22 | 4,750,000 | 4,643,125 | |
| Multi-utilities 1.6% | |||||
| CenterPoint Energy, Inc. (6.125% to 9-1-23, then 3 month LIBOR + 3.270%) (A)(D) | 6.125 | 09-01-23 | 10,750,000 | 11,421,875 | |
| NiSource, Inc. (5.650% to 6-15-23, then 5 Year CMT + 2.843%) (A)(D) | 5.650 | 06-15-23 | 4,000,000 | 4,060,000 | |
| Yield* (%) | Maturity date | Par value^ | Value | ||
| Short-term investments 1.8% (1.2% of Total investments) | $17,371,000 | ||||
| (Cost $17,371,000) | |||||
| U.S. Government Agency 1.1% | 10,501,000 | ||||
| Federal Agricultural Mortgage Corp. Discount Note | 1.500 | 11-01-19 | 1,866,000 | 1,866,000 | |
| Federal Home Loan Bank Discount Note | 1.500 | 11-01-19 | 8,635,000 | 8,635,000 | |
| Par value^ | Value | ||||
| Repurchase agreement 0.7% | 6,870,000 | ||||
| Repurchase Agreement with State Street Corp. dated 10-31-19 at 0.550% to be repurchased at $6,870,105 on 11-1-19, collateralized by $6,945,000 U.S. Treasury Notes, 1.875% due 1-31-22 (valued at $7,011,283, including interest) | 6,870,000 | 6,870,000 | |||
| Total investments (Cost $1,091,202,195) 146.3% | $1,389,627,940 | ||||
| Other assets and liabilities, net (46.3%) | (439,636,554) | ||||
| Total net assets 100.0% | $949,991,386 | ||||
| The percentage shown for each investment category is the total value of the category as a percentage of the net assets of the fund unless otherwise indicated. | |
| ^All par values are denominated in U.S. dollars unless otherwise indicated. | |
| Security Abbreviations and Legend | |
| ADR | American Depositary Receipt |
| CMT | Constant Maturity Treasury |
| ISDAFIX | International Swaps and Derivatives Association Fixed Interest Rate Swap Rate |
| LIBOR | London Interbank Offered Rate |
| 11 | JOHN HANCOCK TAX-ADVANTAGED DIVIDEND INCOME FUND | ANNUAL REPORT | SEE NOTES TO FINANCIAL STATEMENTS |
| (A) | All or a portion of this security is pledged as collateral pursuant to the Liquidity Agreement. Total collateral value at 10-31-19 was $506,414,381. A portion of the securities pledged as collateral were loaned pursuant to the Liquidity Agreement. The value of securities on loan amounted to $259,006,787. |
| (B) | All or a portion of this security is on loan as of 10-31-19, and is a component of the fund's leverage under the Liquidity Agreement. |
| (C) | All or a portion of this security is segregated as collateral for options. Total collateral value at 10-31-19 was $107,646,954. |
| (D) | Perpetual bonds have no stated maturity date. Date shown as maturity date is next call date. |
| (E) | These securities are exempt from registration under Rule 144A of the Securities Act of 1933. Such securities may be resold, normally to qualified institutional buyers, in transactions exempt from registration. |
| * | Yield represents either the annualized yield at the date of purchase, the stated coupon rate or, for floating rate securities, the rate at period end. |
| SEE NOTES TO FINANCIAL STATEMENTS | ANNUAL REPORT | JOHN HANCOCK TAX-ADVANTAGED DIVIDEND INCOME FUND | 12 |
| Open contracts | Number of contracts | Position | Expiration date | Notional basis^ | Notional value^ | Unrealized appreciation (depreciation) |
| 10-Year U.S. Treasury Note Futures | 980 | Short | Dec 2019 | $(128,806,673) | $(127,690,938) | $1,115,735 |
| $1,115,735 |
| Options on index | ||||||||
| Counterparty (OTC)/ Exchange- traded | Name of issuer | Exercise price | Expiration date | Number of contracts | Notional amount | Premium | Value | |
| Calls | ||||||||
| Exchange-traded | Dow Jones Industrial Average Index | USD | 285.00 | Nov 2019 | 499 | 49,900 | $30,330 | $(749) |
| Exchange-traded | Russell 2000 Index | USD | 1,535.00 | Nov 2019 | 66 | 6,600 | 217,487 | (276,540) |
| Exchange-traded | S&P 500 Index | USD | 3,005.00 | Nov 2019 | 38 | 3,800 | 81,670 | (133,950) |
| Exchange-traded | S&P 500 Index | USD | 3,050.00 | Nov 2019 | 38 | 3,800 | 40,700 | (41,800) |
| Exchange-traded | S&P 500 Index | USD | 3,225.00 | Nov 2019 | 181 | 18,100 | 44,344 | (2,715) |
| Exchange-traded | S&P 500 Index | USD | 1,275.00 | Nov 2019 | 276 | 27,600 | 1,248,061 | (2,133,479) |
| Exchange-traded | S&P 500 Index | USD | 3,040.00 | Nov 2019 | 37 | 3,700 | 58,801 | (86,580) |
| Exchange-traded | S&P 500 Index | USD | 3,085.00 | Nov 2019 | 38 | 3,800 | 34,550 | (39,900) |
| Exchange-traded | S&P 500 Index | USD | 1,430.00 | Dec 2019 | 148 | 14,800 | 40,233 | (14,800) |
| $1,796,176 | $(2,730,513) | |||||||
| Interest rate swaps | ||||||||||
| Counterparty (OTC)/ Centrally cleared | Notional amount | Currency | Payments made | Payments received | Fixed payment frequency | Floating payment frequency | Maturity date | Unamortized upfront payment paid (received) | Unrealized appreciation (depreciation) | Value |
| Centrally cleared | 107,000,000 | USD | Fixed 2.136% | USD 3 Month LIBOR BBA(a) | Semi Annual | Quarterly | Oct 2022 | — | $(1,970,925) | $(1,970,925) |
| — | $(1,970,925) | $(1,970,925) | ||||||||
| (a) | At 10-31-19, the 3 month LIBOR was 1.902%. |
| Derivatives Currency Abbreviations | |
| USD | U.S. Dollar |
| Derivatives Abbreviations | |
| BBA | The British Banker's Association |
| LIBOR | London Interbank Offered Rate |
| OTC | Over-the-counter |
| 13 | JOHN HANCOCK TAX-ADVANTAGED DIVIDEND INCOME FUND | ANNUAL REPORT | SEE NOTES TO FINANCIAL STATEMENTS |
| SEE NOTES TO FINANCIAL STATEMENTS | ANNUAL REPORT | JOHN HANCOCK TAX-ADVANTAGED DIVIDEND INCOME FUND | 14 |
| Financial statements |
| Assets | |
| Unaffiliated investments, at value (Cost $1,091,202,195) | $1,389,627,940 |
| Receivable for centrally cleared swaps | 959,267 |
| Cash | 107,216 |
| Collateral held at broker for futures contracts | 1,278,975 |
| Dividends and interest receivable | 3,010,076 |
| Receivable for investments sold | 2,905,125 |
| Other assets | 28,963 |
| Total assets | 1,397,917,562 |
| Liabilities | |
| Written options, at value (Premiums received $1,796,176) | 2,730,513 |
| Payable for futures variation margin | 796,250 |
| Liquidity agreement | 427,900,000 |
| Payable for investments purchased | 15,322,980 |
| Interest payable | 923,164 |
| Payable to affiliates | |
| Accounting and legal services fees | 82,787 |
| Trustees' fees | 683 |
| Other liabilities and accrued expenses | 169,799 |
| Total liabilities | 447,926,176 |
| Net assets | $949,991,386 |
| Net assets consist of | |
| Paid-in capital | $658,867,875 |
| Total distributable earnings (loss) | 291,123,511 |
| Net assets | $949,991,386 |
| Net asset value per share | |
| Based on 35,392,935 shares of beneficial interest outstanding - unlimited number of shares authorized with no par value | $26.84 |
| 15 | JOHN HANCOCK TAX-ADVANTAGED DIVIDEND INCOME FUND | ANNUAL REPORT | SEE NOTES TO FINANCIAL STATEMENTS |
| Investment income | |
| Dividends | $57,308,407 |
| Interest | 7,967,157 |
| Less foreign taxes withheld | (262,108) |
| Total investment income | 65,013,456 |
| Expenses | |
| Investment management fees | 9,945,823 |
| Interest expense | 12,827,659 |
| Accounting and legal services fees | 150,510 |
| Transfer agent fees | 24,486 |
| Trustees' fees | 45,134 |
| Custodian fees | 113,215 |
| Printing and postage | 294,042 |
| Professional fees | 65,477 |
| Stock exchange listing fees | 34,439 |
| Other | 32,814 |
| Total expenses | 23,533,599 |
| Less expense reductions | (97,519) |
| Net expenses | 23,436,080 |
| Net investment income | 41,577,376 |
| Realized and unrealized gain (loss) | |
| Net realized gain (loss) on | |
| Unaffiliated investments and foreign currency transactions | 33,306,705 |
| Futures contracts | (9,873,069) |
| Written options | (4,320,332) |
| Swap contracts | 462,917 |
| 19,576,221 | |
| Change in net unrealized appreciation (depreciation) of | |
| Unaffiliated investments | 108,932,262 |
| Futures contracts | (635,505) |
| Written options | (1,891,374) |
| Swap contracts | (5,958,816) |
| 100,446,567 | |
| Net realized and unrealized gain | 120,022,788 |
| Increase in net assets from operations | $161,600,164 |
| SEE NOTES TO FINANCIAL STATEMENTS | ANNUAL REPORT | JOHN HANCOCK TAX-ADVANTAGED DIVIDEND INCOME FUND | 16 |
| Year ended 10-31-19 | Year ended 10-31-18 | |
| Increase (decrease) in net assets | ||
| From operations | ||
| Net investment income | $41,577,376 | $47,048,170 |
| Net realized gain | 19,576,221 | 20,124,740 |
| Change in net unrealized appreciation (depreciation) | 100,446,567 | (63,732,339) |
| Increase in net assets resulting from operations | 161,600,164 | 3,440,571 |
| Distributions to shareholders | ||
| From earnings | (72,932,499) | (77,227,677) |
| Total distributions | (72,932,499) | (77,227,677) |
| Fund share transactions | ||
| Issued pursuant to Dividend Reinvestment Plan | 214,746 | — |
| Total increase (decrease) | 88,882,411 | (73,787,106) |
| Net assets | ||
| Beginning of year | 861,108,975 | 934,896,081 |
| End of year | $949,991,386 | $861,108,975 |
| Share activity | ||
| Shares outstanding | ||
| Beginning of year | 35,384,961 | 35,384,961 |
| Issued pursuant to Dividend Reinvestment Plan | 7,974 | — |
| End of year | 35,392,935 | 35,384,961 |
| 17 | JOHN HANCOCK TAX-ADVANTAGED DIVIDEND INCOME FUND | ANNUAL REPORT | SEE NOTES TO FINANCIAL STATEMENTS |
| Cash flows from operating activities | |
| Net increase in net assets from operations | $161,600,164 |
| Adjustments to reconcile net increase in net assets from operations to net cash provided by operating activities: | |
| Long-term investments purchased | (173,274,467) |
| Long-term investments sold | 220,456,437 |
| Net purchases and sales in short-term investments | (10,592,575) |
| Net amortization of premium (discount) | (62,423) |
| (Increase) Decrease in assets: | |
| Receivable for futures variation margin | 336,865 |
| Receivable for centrally cleared swaps | 356,265 |
| Collateral held at broker for futures contracts | (249,975) |
| Dividends and interest receivable | 37,991 |
| Receivable for investments sold | 5,555,008 |
| Other assets | 11,492 |
| Increase (Decrease) in liabilities: | |
| Payable for futures variation margin | 796,250 |
| Written options, at value | 1,654,783 |
| Payable for investments purchased | 15,322,980 |
| Interest payable | (149,157) |
| Payable to affiliates | (57,109) |
| Other liabilities and accrued expenses | (1,583) |
| Net change in unrealized (appreciation) depreciation on: | |
| Investments | (108,932,262) |
| Net realized (gain) loss on: | |
| Investments | (33,306,663) |
| Proceeds received as return of capital | 1,782,607 |
| Net cash provided by operating activities | $81,284,628 |
| Cash flows provided by (used in) financing activities | |
| Distributions to shareholders | $(72,717,753) |
| Decrease in due to custodian | (8,459,659) |
| Net cash used in financing activities | $(81,177,412) |
| Net increase in cash | $107,216 |
| Cash at beginning of year | — |
| Cash at end of year | $107,216 |
| Supplemental disclosure of cash flow information: | |
| Cash paid for interest | $(12,976,816) |
| Noncash financing activities not included herein consists of reinvestment distributions: | $(214,746) |
| SEE NOTES TO FINANCIAL STATEMENTS | ANNUAL REPORT | JOHN HANCOCK TAX-ADVANTAGED DIVIDEND INCOME FUND | 18 |
| Financial highlights |
| Period ended | 10-31-19 | 10-31-18 | 10-31-17 | 10-31-16 | 10-31-15 |
| Per share operating performance | |||||
| Net asset value, beginning of period | $24.34 | $26.42 | $25.68 | $23.40 | $23.82 |
| Net investment income1 | 1.17 | 1.33 | 1.65 | 1.44 | 1.38 |
| Net realized and unrealized gain (loss) on investments | 3.39 | (1.22) | 0.91 | 2.29 | (0.44) |
| Total from investment operations | 4.56 | 0.11 | 2.56 | 3.73 | 0.94 |
| Less distributions | |||||
| From net investment income | (1.65) | (1.66) | (1.66) | (1.47) | (1.45) |
| From net realized gain | (0.41) | (0.53) | (0.16) | — | — |
| Total distributions | (2.06) | (2.19) | (1.82) | (1.47) | (1.45) |
| Anti-dilutive impact of repurchase plan | — | — | — | 0.022 | 0.092 |
| Net asset value, end of period | $26.84 | $24.34 | $26.42 | $25.68 | $23.40 |
| Per share market value, end of period | $27.44 | $22.37 | $25.60 | $23.83 | $20.98 |
| Total return at net asset value (%)3,4 | 20.34 | 0.97 | 10.73 | 16.97 | 5.24 |
| Total return at market value (%)3 | 33.87 | (4.23) | 15.62 | 21.06 | 2.91 |
| Ratios and supplemental data | |||||
| Net assets, end of period (in millions) | $950 | $861 | $935 | $909 | $836 |
| Ratios (as a percentage of average net assets): | |||||
| Expenses before reductions | 2.62 | 2.45 | 1.97 | 1.72 | 1.64 |
| Expenses including reductions5 | 2.61 | 2.44 | 1.96 | 1.71 | 1.63 |
| Net investment income | 4.63 | 5.40 | 6.41 | 5.78 | 5.88 |
| Portfolio turnover (%) | 13 | 24 | 11 | 18 | 11 |
| Senior securities | |||||
| Total debt outstanding end of period (in millions) | $428 | $428 | $428 | $428 | $428 |
| Asset coverage per $1,000 of debt6 | $3,220 | $3,012 | $3,185 | $3,123 | $2,953 |
| 1 | Based on average daily shares outstanding. |
| 2 | The repurchase plan was completed at an average repurchase price of $20.47 and $20.33 for 326,200 shares and 1,341,340 shares for the periods ended 10-31-16 and 10-31-15, respectively. |
| 3 | Total return based on net asset value reflects changes in the fund’s net asset value during each period. Total return based on market value reflects changes in market value. Each figure assumes that distributions from income, capital gains and tax return of capital, if any, were reinvested. |
| 4 | Total returns would have been lower had certain expenses not been reduced during the applicable periods. |
| 5 | Expenses including reductions excluding interest expense were 1.18%, 1.20%, 1.19%, 1.19% and 1.20% for the periods ended 10-31-19, 10-31-18, 10-31-17, 10-31-16 and 10-31-15, respectively. |
| 6 | Asset coverage equals the total net assets plus borrowings divided by the borrowings of the fund outstanding at period end (Note 8). As debt outstanding changes, the level of invested assets may change accordingly. Asset coverage ratio provides a measure of leverage. |
| 19 | JOHN HANCOCK Tax-Advantaged Dividend Income Fund | ANNUAL REPORT | SEE NOTES TO FINANCIAL STATEMENTS |
| Notes to financial statements |
| ANNUAL REPORT | JOHN HANCOCK Tax-Advantaged Dividend Income Fund | 20 |
| Total value at 10-31-19 | Level 1 quoted price | Level 2 significant observable inputs | Level 3 significant unobservable inputs | |
| Investments in securities: | ||||
| Assets | ||||
| Common stocks | $708,564,744 | $708,564,744 | — | — |
| Preferred securities | ||||
| Communication services | 35,057,288 | 35,057,288 | — | — |
| Energy | 5,766,600 | 5,766,600 | — | — |
| Financials | 205,893,995 | 205,893,995 | — | — |
| Industrials | 3,500,884 | 3,500,884 | — | — |
| Information technology | 20,577,380 | 20,577,380 | — | — |
| Real estate | 7,029,950 | 803,700 | $6,226,250 | — |
| Utilities | 268,111,801 | 262,336,801 | 5,775,000 | — |
| Corporate bonds | 117,754,298 | — | 117,754,298 | — |
| Short-term investments | 17,371,000 | — | 17,371,000 | — |
| Total investments in securities | $1,389,627,940 | $1,242,501,392 | $147,126,548 | — |
| Derivatives: | ||||
| Assets | ||||
| Futures | $1,115,735 | $1,115,735 | — | — |
| Liabilities | ||||
| Written options | (2,730,513) | (2,730,513) | — | — |
| Swap contracts | (1,970,925) | — | $(1,970,925) | — |
| 21 | JOHN HANCOCK Tax-Advantaged Dividend Income Fund | ANNUAL REPORT |
| ANNUAL REPORT | JOHN HANCOCK Tax-Advantaged Dividend Income Fund | 22 |
| October 31, 2019 | October 31, 2018 | |
| Ordinary income | $43,299,735 | $51,245,756 |
| Long-term capital gains | 29,632,764 | 25,981,921 |
| Total | $72,932,499 | $77,227,677 |
| 23 | JOHN HANCOCK Tax-Advantaged Dividend Income Fund | ANNUAL REPORT |
| ANNUAL REPORT | JOHN HANCOCK Tax-Advantaged Dividend Income Fund | 24 |
| 25 | JOHN HANCOCK Tax-Advantaged Dividend Income Fund | ANNUAL REPORT |
| Risk | Statement of assets and liabilities location | Financial instruments location | Assets derivatives fair value | Liabilities derivatives fair value |
| Interest rate | Receivable/payable for futures variation margin | Futures1 | $1,115,735 | — |
| Equity | Written options, at value | Written options | — | $(2,730,513) |
| Interest rate | Swap contracts, at value | Interest rate swaps2 | — | (1,970,925) |
| $1,115,735 | $(4,701,438) |
| 1 | Reflects cumulative appreciation/depreciation on futures as disclosed in Fund's investments. Only the year end variation margin is separately disclosed on the Statement of assets and liabilities. |
| 2 | Reflects cumulative value of swap contracts. Receivable/payable for centrally cleared swaps, which includes value and margin, and swap contracts at value, which represents OTC swaps, are shown separately on the Statement of assets and liabilities. |
| Statement of operations location - Net realized gain (loss) on: | ||||
| Risk | Futures contracts | Written options | Swap contracts | Total |
| Interest rate | $(9,873,069) | — | $462,917 | $(9,410,152) |
| Equity | — | $(4,320,332) | — | (4,320,332) |
| Total | $(9,873,069) | $(4,320,332) | $462,917 | $(13,730,484) |
| Statement of operations location - Change in net unrealized appreciation (depreciation) of: | ||||
| Risk | Futures contracts | Written options | Swap contracts | Total |
| Interest rate | $(635,505) | — | $(5,958,816) | $(6,594,321) |
| ANNUAL REPORT | JOHN HANCOCK Tax-Advantaged Dividend Income Fund | 26 |
| Statement of operations location - Change in net unrealized appreciation (depreciation) of: | ||||
| Risk | Futures contracts | Written options | Swap contracts | Total |
| Equity | — | $(1,891,374) | — | $(1,891,374) |
| Total | $(635,505) | $(1,891,374) | $(5,958,816) | $(8,485,695) |
| 27 | JOHN HANCOCK Tax-Advantaged Dividend Income Fund | ANNUAL REPORT |
| • | the likelihood of greater volatility of NAV and market price of shares; |
| • | fluctuations in the interest rate paid for the use of the LA; |
| • | increased operating costs, which may reduce the fund’s total return; |
| • | the potential for a decline in the value of an investment acquired through leverage, while the fund’s obligations under such leverage remains fixed; and |
| • | the fund is more likely to have to sell securities in a volatile market in order to meet asset coverage or other debt compliance requirements. |
| ANNUAL REPORT | JOHN HANCOCK Tax-Advantaged Dividend Income Fund | 28 |
| 29 | JOHN HANCOCK Tax-Advantaged Dividend Income Fund | ANNUAL REPORT |
| ANNUAL REPORT | JOHN HANCOCK Tax-Advantaged Dividend Income Fund | 30 |
| 31 | JOHN HANCOCK TAX-ADVANTAGED DIVIDEND INCOME FUND | ANNUAL REPORT |
| Tax information (Unaudited) |
| ANNUAL REPORT | JOHN HANCOCK TAX-ADVANTAGED DIVIDEND INCOME FUND | 32 |
Unaudited
Investment objective and policy
The fund is a closed-end, diversified management investment company, common shares of which were initially offered to the public on February 25, 2004, and are publicly traded on the New York Stock Exchange (the NYSE). The fund's investment objective is to provide a high level of after-tax total return from dividend income and gains and capital appreciation. The fund utilizes a liquidity agreement to increase its assets available for investments.
Under normal market conditions, the fund will invest at least 80% of its assets (net assets plus borrowings for investment purposes) in dividend-paying common and preferred securities that the subadvisors believe at the time of acquisition are eligible to pay dividends which, for individual shareholders, qualify for U.S. federal income taxation at rates applicable to long-term capital gains, which are currently taxed to noncorporate taxpayers at a maximum rate of 20% (15% or 0% for individuals in certain tax brackets) (tax-advantaged dividends). The fund will notify shareholders at least 60 days prior to any change in this 80% investment policy. Tax-advantaged dividends generally include dividends from domestic corporations and dividends from foreign corporations that meet certain specified criteria. The fund generally can pass the tax treatment of tax-advantaged dividends it receives through to its common shareholders. The fund may write (sell) covered call index options on up to 30% of the value of the fund's total assets.
Dividends and distributions
During the year ended October 31, 2019, distributions from net investment income totaling $1.6560 per share and distributions from capital gains totaling $0.4051 per share were paid to shareholders. The dates of payments and the amounts per share were as follows:
| Payment Date | Income Distributions |
| November 30, 2018 | $0.1380 |
| December 20, 2018 | 0.1380 |
| January 31, 2019 | 0.1380 |
| February 28, 2019 | 0.1380 |
| March 29, 2019 | 0.1380 |
| April 30, 2019 | 0.1380 |
| May 31, 2019 | 0.1380 |
| June 28, 2019 | 0.1380 |
| July 31, 2019 | 0.1380 |
| August 30, 2019 | 0.1380 |
| September 30, 2019 | 0.1380 |
| October 31, 2019 | 0.1380 |
| Total | $1.6560 |
| Payment Date | Additional Distributions |
| December 20, 2018 | $0.4051 |
| Total | $2.0611 |
Dividend reinvestment plan
The fund's Dividend Reinvestment Plan (the Plan) provides that distributions of dividends and capital gains are automatically reinvested in common shares of the fund by Computershare Trust Company, N.A. (the Plan Agent). Every shareholder holding at least one full share of the fund is entitled to participate in the Plan. In addition, every
shareholder who became a shareholder of the fund after June 30, 2011, and holds at least one full share of the fund will be automatically enrolled in the Plan. Shareholders may withdraw from the Plan at any time and shareholders who do not participate in the Plan will receive all distributions in cash.
If the fund declares a dividend or distribution payable either in cash or in common shares of the fund and the market price of shares on the payment date for the distribution or dividend equals or exceeds the fund's net asset value per share (NAV), the fund will issue common shares to participants at a value equal to the higher of NAV or 95% of the market price. The number of additional shares to be credited to each participant's account will be determined by dividing the dollar amount of the distribution or dividend by the higher of NAV or 95% of the market price. If the market price is lower than NAV, or if dividends or distributions are payable only in cash, then participants will receive shares purchased by the Plan Agent on participants' behalf on the NYSE or otherwise on the open market. If the market price exceeds NAV before the Plan Agent has completed its purchases, the average per share purchase price may exceed NAV, resulting in fewer shares being acquired than if the fund had issued new shares.
There are no brokerage charges with respect to common shares issued directly by the fund. However, whenever shares are purchased or sold on the NYSE or otherwise on the open market, each participant will pay a pro rata portion of brokerage trading fees, currently $0.05 per share purchased or sold. Brokerage trading fees will be deducted from amounts to be invested.
The reinvestment of dividends and net capital gains distributions does not relieve participants of any income tax that may be payable on such dividends or distributions.
Shareholders participating in the Plan may buy additional shares of the fund through the Plan at any time in amounts of at least $50 per investment, up to a maximum of $10,000, with a total calendar year limit of $100,000. Shareholders will be charged a $5 transaction fee plus $0.05 per share brokerage trading fee for each order. Purchases of additional shares of the fund will be made on the open market. Shareholders who elect to utilize monthly electronic fund transfers to buy additional shares of the fund will be charged a $2 transaction fee plus $0.05 per share brokerage trading fee for each automatic purchase. Shareholders can also sell fund shares held in the Plan account at any time by contacting the Plan Agent by telephone, in writing or by visiting the Plan Agent's website at www.computershare.com/investor. The Plan Agent will mail a check (less applicable brokerage trading fees) on settlement date. Pursuant to regulatory changes, effective September 5, 2017, the settlement date is changed from three business days after the shares have been sold to two business days after the shares have been sold. If shareholders choose to sell shares through their stockbroker, they will need to request that the Plan Agent electronically transfer those shares to their stockbroker through the Direct Registration System.
Shareholders participating in the Plan may withdraw from the Plan at any time by contacting the Plan Agent by telephone, in writing or by visiting the Plan Agent's website at www.computershare.com/investor. Such termination will be effective immediately if the notice is received by the Plan Agent prior to any dividend or distribution record date; otherwise, such termination will be effective on the first trading day after the payment date for such dividend or distribution, with respect to any subsequent dividend or distribution. If shareholders withdraw from the Plan, their shares will be credited to their account; or, if they wish, the Plan Agent will sell their full and fractional shares and send the shareholders the proceeds, less a transaction fee of $5 and less brokerage trading fees of $0.05 per share. If a shareholder does not maintain at least one whole share of common stock in the Plan account, the Plan Agent may terminate such shareholder's participation in the Plan after written notice. Upon termination, shareholders will be sent a check for the cash value of any fractional share in the Plan account, less any applicable broker commissions and taxes.
Shareholders who hold at least one full share of the fund may join the Plan by notifying the Plan Agent by telephone, in writing or by visiting the Plan Agent's website at www.computershare.com/investor. If received in proper form by the Plan Agent before the record date of a dividend, the election will be effective with respect to all dividends paid after
such record date. If shareholders wish to participate in the Plan and their shares are held in the name of a brokerage firm, bank or other nominee, shareholders should contact their nominee to see if it will participate in the Plan. If shareholders wish to participate in the Plan, but their brokerage firm, bank or other nominee is unable to participate on their behalf, they will need to request that their shares be re-registered in their own name, or they will not be able to participate. The Plan Agent will administer the Plan on the basis of the number of shares certified from time to time by shareholders as representing the total amount registered in their name and held for their account by their nominee.
Experience under the Plan may indicate that changes are desirable. Accordingly, the fund and the Plan Agent reserve the right to amend or terminate the Plan. Participants generally will receive written notice at least 90 days before the effective date of any amendment. In the case of termination, participants will receive written notice at least 90 days before the record date for the payment of any dividend or distribution by the fund.
Effective November 1, 2013, the Plan was revised to provide that Computershare Trust Company, N.A. no longer provides mail loss insurance coverage when shareholders mail their certificates to the fund's administrator.
All correspondence or requests for additional information about the Plan should be directed to Computershare Trust Company, N.A., at the address stated below, or by calling 800-852-0218, 201-680-6578 (For International Telephone Inquiries) and 800-952-9245 (For the Hearing Impaired (TDD)).
Shareholder communication and assistance
If you have any questions concerning the fund, we will be pleased to assist you. If you hold shares in your own name and not with a brokerage firm, please address all notices, correspondence, questions or other communications regarding the fund to the transfer agent at:
Regular Mail:
Computershare
P.O. Box 505000
Louisville, KY 40233
Registered or Overnight Mail:
Computershare
462 South 4th Street, Suite 1600
Louisville, KY 40202
If your shares are held with a brokerage firm, you should contact that firm, bank or other nominee for assistance.
Continuation of Investment Advisory and Subadvisory Agreements
Evaluation of Advisory and Subadvisory Agreements by the Board of Trustees
This section describes the evaluation by the Board of Trustees (the Board) of John Hancock Tax-Advantaged Dividend Income Fund (the fund) of the Advisory Agreement (the Advisory Agreement) with John Hancock Investment Management, LLC (the Advisor, formerly John Hancock Advisers, LLC) and the Subadvisory Agreements (the Subadvisory Agreements) with Manulife Investment Management (US) LLC (Manulife IM (US), formerly John Hancock Asset Management a division of Manulife Asset Management (US) LLC or JHAM) and Wells Capital Management Incorporated (formerly known as Analytic Investors, LLC) (Wells Capital and collectively, the Subadvisors). The Advisory Agreement and Subadvisory Agreements are collectively referred to as the Agreements. Prior to the June23-26, 2019 in-person meeting at which the Agreements were approved, the Board also discussed and considered information regarding the proposed continuation of the Agreements at an in-person meeting held on May28-30, 2019.
Approval of Advisory and Subadvisory Agreements
At in-person meetings held on June 23-26, 2019, the Board, including the Trustees who are not parties to any Agreement or considered to be interested persons of the fund under the Investment Company Act of 1940, as amended (the 1940 Act) (the Independent Trustees), reapproved for an annual period the continuation of the Advisory Agreement between the fund and the Advisor and the Subadvisory Agreements between the Advisor and the Subadvisors with respect to the fund.
In considering the Advisory Agreement and the Subadvisory Agreements, the Board received in advance of the meetings a variety of materials relating to the fund, the Advisor and the Subadvisors, including comparative performance, fee and expense information for a peer group of similar funds prepared by an independent third-party provider of fund data, performance information for an applicable benchmark index; and other pertinent information, such as the market premium and discount information, and, with respect to the Subadvisors, comparative performance information for comparably managed accounts, as applicable, and other information provided by the Advisor and the Subadvisors regarding the nature, extent and quality of services provided by the Advisor and the Subadvisors under their respective Agreements, as well as information regarding the Advisor's revenues and costs of providing services to the fund and any compensation paid to affiliates of the Advisor. At the meetings at which the renewal of the Advisory Agreement and Subadvisory Agreements are considered, particular focus is given to information concerning fund performance, comparability of fees and total expenses, and profitability. However, the Board noted that the evaluation process with respect to the Advisor and the Subadvisors is an ongoing one. In this regard, the Board also took into account discussions with management and information provided to the Board (including its various committees) at prior meetings with respect to the services provided by the Advisor and the Subadvisors to the fund, including quarterly performance reports prepared by management containing reviews of investment results and prior presentations from the Subadvisors with respect to the fund. The information received and considered by the Board in connection with the May and June meetings and throughout the year was both written and oral. The Board noted the affiliation of Manulife IM (US) with the Advisor, noting any potential conflicts of interest. The Board also considered the nature, quality, and extent of non-advisory services, if any, to be provided to the fund by the Advisor's affiliates. The Board considered the Advisory Agreement and Subadvisory Agreements separately in the course of its review. In doing so, the Board noted the respective roles of the Advisor and Subadvisors in providing services to the fund.
Throughout the process, the Board asked questions of and requested additional information from management. The Board is assisted by counsel for the fund and the Independent Trustees are also separately assisted by independent legal counsel throughout the process. The Independent Trustees also received a memorandum from their independent legal counsel discussing the legal standards for their consideration of the proposed continuation of the Agreements and discussed the proposed continuation of the Agreements in private sessions with their independent legal counsel at which no representatives of management were present.
Approval of Advisory Agreement
In approving the Advisory Agreement with respect to the fund, the Board, including the Independent Trustees, considered a variety of factors, including those discussed below. The Board also considered other factors (including conditions and trends prevailing generally in the economy, the securities markets, and the industry) and did not treat any single factor as determinative, and each Trustee may have attributed different weights to different factors. The Board's conclusions may be based in part on its consideration of the advisory and subadvisory arrangements in prior years and on the Board's ongoing regular review of fund performance and operations throughout the year.
Nature, extent, and quality of services. Among the information received by the Board from the Advisor relating to the nature, extent, and quality of services provided to the fund, the Board reviewed information provided by the Advisor relating to its operations and personnel, descriptions of its organizational and management structure, and information regarding the Advisor's compliance and regulatory history, including its Form ADV. The Board also noted that on a regular basis it receives and reviews information from the fund's Chief Compliance Officer (CCO) regarding the fund's compliance policies and procedures established pursuant to Rule 38a-1 under the 1940 Act. The Board observed that the scope of services provided by the Advisor, and of the undertakings required of the Advisor in connection with those services, including maintaining and monitoring its own and the fund's compliance programs, risk management programs, liquidity management programs and cybersecurity programs, had expanded over time as a result of regulatory, market and other developments. The Board considered that the Advisor is responsible for the management of the day-to-day operations of the fund, including, but not limited to, general supervision of and coordination of the services provided by the Subadvisors, and is also responsible for monitoring and reviewing the activities of the Subadvisors and other third-party service providers. The Board also considered the significant risks assumed by the Advisor in connection with the services provided to the fund including entrepreneurial risk in sponsoring new funds and ongoing risks including investment, operational, enterprise, litigation, regulatory and compliance risk with respect to all funds.
The Board also considered the differences between the Advisor's services to the fund and the services it provides to other clients that are not closed-end funds, including, for example, the differences in services related to the regulatory and legal obligations of closed-end funds.
In considering the nature, extent, and quality of the services provided by the Advisor, the Trustees also took into account their knowledge of the Advisor's management and the quality of the performance of the Advisor's duties, through Board meetings, discussions and reports during the preceding year and through each Trustee's experience as a Trustee of the fund and of the other funds in the John Hancock group of funds complex (the John Hancock Fund Complex).
In the course of their deliberations regarding the Advisory Agreement, the Board considered, among other things:
| (a) | the skills and competency with which the Advisor has in the past managed the fund's affairs and its subadvisory relationships, the Advisor's oversight and monitoring of the Subadvisors' investment performance and compliance programs, such as the Subadvisors' compliance with fund policies and |
The Board concluded that the Advisor may reasonably be expected to continue to provide a high quality of services under the Advisory Agreement with respect to the fund.
Investment performance.In considering the fund's performance, the Board noted that it reviews at its regularly scheduled meetings information about the fund's performance results. In connection with the consideration of the Advisory Agreement, the Board:
| (a) | reviewed information prepared by management regarding the fund's performance; |
| (b) | considered the comparative performance of an applicable benchmark index; |
| (c) | considered the performance of comparable funds, if any, as included in the report prepared by an independent third-party provider of fund data; |
| (d) | took into account the Advisor's analysis of the fund's performance; and |
| (e) | considered the fund's share performance and premium/discount information. |
The Board noted that while it found the data provided by the independent third-party generally useful it recognized its limitations, including in particular that the data may vary depending on the end date selected and the results of the performance comparisons may vary depending on the selection of the peer group. The Board noted that, based on its net asset value, the fund underperformed its benchmark index for the one-year period and outperformed its benchmark index for the three-, five- and ten-year periods ended December 31, 2018. The Board also noted that, based on its net asset value, the fund outperformed its peer group average for the one-, three-, five- and ten-year periods ended December 31, 2018.The Board took into account management's discussion of the fund's performance, including the favorable performance relative to the benchmark index for the three-, five- and ten-year periods and to the peer group for the one-, three-,five- and ten-year periods. The Board concluded that the fund's performance has generally been in line with or outperformed the historical performance of comparable funds and the fund's benchmark index.
Fees and expenses. The Board reviewed comparative information prepared by an independent third-party provider of fund data, including, among other data, the fund's contractual and net management fees (and subadvisory fees, to the extent available) and total expenses as compared to similarly situated investment companies deemed to be comparable to the fund in light of the nature, extent and quality of the management and advisory and subadvisory services provided by the Advisor and the Subadvisor. The Board considered the fund's ranking within a smaller group of peer funds chosen by the independent third-party provider, as well as the fund's ranking within a broader group of funds. In comparing the fund's contractual and net management fees to those of comparable funds, the Board noted that such fees include both advisory and administrative costs.
The Board also took into account the impact of leverage on fund expenses. The Board took into account the management fee structure, including that management fees for the fund were based on the fund's total managed assets, which are attributable to common stock and borrowings. The Board noted that net management fees for the fund are lower than the peer group median and that net total expenses for the fund are higher than the peer group median.
The Board took into account management's discussion of the fund's expenses. The Board took into account management's discussion with respect to the overall management fee and the fees of the Subadvisors, including the amount of the advisory fee retained by the Advisor after payment of the subadvisory fee, in each case in light of the services rendered for those amounts and the risks undertaken by the Advisor. The Board also noted that the Advisor pays the subadvisory fees. In addition, the Board took into account that management had agreed to implement an overall fee waiver across the complex, including the fund, which is discussed further below. The Board reviewed information provided by the Advisor concerning the investment advisory fee charged by the Advisor or one of its advisory affiliates to other clients (including other funds in the John Hancock Fund Complex) having similar investment mandates, if any. The Board considered any differences between the Advisor's and Subadvisors' services to the fund and the services they provide to other comparable clients or funds. The Board concluded that the advisory fee paid with respect to the fund is reasonable in light of the nature, extent and quality of the services provided to the fund under the Advisory Agreement.
Profitability/Fall out benefits. In considering the costs of the services to be provided and the profits to be realized by the Advisor and its affiliates (including Manulife IM (US)) from the Advisor's relationship with the fund, the Board:
| (a) | reviewed financial information of the Advisor; |
| (b) | reviewed and considered information presented by the Advisor regarding the net profitability to the Advisor and its affiliates with respect to the fund; |
| (c) | received and reviewed profitability information with respect to the John Hancock Fund Complex as a whole and with respect to the fund; |
| (d) | received information with respect to the Advisor's allocation methodologies used in preparing the profitability data and considered that the advisor hired an independent third-party consultant to provide an analysis of the Advisor's allocation methodologies; |
| (e) | considered that the Advisor also provides administrative services to the fund on a cost basis pursuant to an administrative services agreement; |
| (f) | noted that Manulife IM (US) is an affiliate of the Advisor; |
| (g) | noted that the Advisor also derives reputational and other indirect benefits from providing advisory services to the fund; |
| (h) | noted that the subadvisory fees for the fund are paid by the Advisor, and are negotiated at arm's length for Wells Capital; |
| (i) | considered the Advisor's ongoing costs and expenditures necessary to improve services, meet new regulatory and compliance requirements, and adapt to the other challenges impacting the fund industry; and |
| (j) | considered that the Advisor should be entitled to earn a reasonable level of profits in exchange for the level of services it provides to the fund and the risks that it assumes as Advisor, including entrepreneurial, operational, reputational, litigation and regulatory risk. |
Based upon its review, the Board concluded that the level of profitability, if any, of the Advisor and its affiliates (including Manulife IM (US)) from their relationship with the fund was reasonable and not excessive.
Economies of scale. In considering the extent to which the fund may realize any economies of scale and whether fee levels reflect these economies of scale for the benefit of the fund shareholders, the Board noted that the fund has a limited ability to increase its assets as a closed-end fund. The Board took into account management's discussions of the current advisory fee structure, and, as noted above, the services the Advisor provides in performing its functions under the Advisory Agreement and in supervising the Subadvisors.
The Board also considered potential economies of scale that may be realized by the fund as part of the John Hancock Fund Complex. Among them, the Board noted that the Advisor has contractually agreed to waive a portion of its management fee and/or reimburse expenses for certain funds of the John Hancock Fund Complex, including the fund (the participating portfolios). This waiver is based upon aggregate net assets of all the participating portfolios. The amount of the reimbursement is calculated daily and allocated among all the participating portfolios in proportion to the daily net assets of each fund. The Board also considered the Advisor's overall operations and its ongoing investment in its business in order to expand the scale of, and improve the quality of, its operations that benefit the fund. The Board determined that the management fee structure for the fund was reasonable.
Approval of Subadvisory Agreements
In making its determination with respect to approval of the Subadvisory Agreements, the Board reviewed:
| (1) | information relating to the Subadvisors' business, including current subadvisory services to the fund (and other funds in the John Hancock Fund Complex); |
| (2) | the historical and current performance of the fund and comparative performance information relating to an applicable benchmark index and comparable funds; |
| (3) | the subadvisory fees for the fund and to the extent available, comparable fee information prepared by an independent third party provider of fund data; and |
| (4) | information relating to the nature and scope of any material relationships and their significance to the fund's Advisor and the Subadvisors. |
Nature, extent, and quality of services. With respect to the services provided by the Subadvisors, the Board received information provided to the Board by the Subadvisors, including the Subadvisors' respective Form ADV, as well as took into account information presented throughout the past year. The Board considered each Subadvisor's current level of staffing and its overall resources, as well as received information relating to each Subadvisor's compensation program. The Board reviewed each Subadvisor's history and investment experience, as well as information regarding the qualifications, background, and responsibilities of each Subadvisor's investment and compliance personnel who
provide services to the fund. The Board also considered, among other things, each Subadvisor's compliance program and any disciplinary history. The Board also considered each Subadvisor's risk assessment and monitoring process. The Board reviewed each Subadvisor's regulatory history, including whether it was involved in any regulatory actions or investigations as well as material litigation, and any settlements and amelioratory actions undertaken, as appropriate. The Board noted that the Advisor conducts regular, periodic reviews of each Subadvisor and its operations, including regarding investment processes and organizational and staffing matters. The Board also noted that the fund's CCO and his staff conduct regular, periodic compliance reviews with each Subadvisor and present reports to the Independent Trustees regarding the same, which includes evaluating the regulatory compliance systems of each Subadvisor and procedures reasonably designed to assure compliance with the federal securities laws. The Board also took into account the financial condition of each Subadvisor.
The Board considered each Subadvisor's investment process and philosophy. The Board took into account that each Subadvisor's responsibilities include the development and maintenance of an investment program for the fund that is consistent with the fund's investment objective, the selection of investment securities and the placement of orders for the purchase and sale of such securities, as well as the implementation of compliance controls related to performance of these services. The Board also received information with respect to each Subadvisor's brokerage policies and practices, including with respect to best execution and soft dollars.
Subadvisor compensation. In considering the cost of services to be provided by each Subadvisor and the profitability to each Subadvisor of its relationship with the fund, the Board noted that the fees under each Subadvisory Agreement are paid by the Advisor and not the fund. The Board also received information and took into account any other potential conflicts of interest the Advisor might have in connection with the Subadvisory Agreements.
The Board also relied on the ability of the Advisor to negotiate the Wells Capital Subadvisory Agreement and the fees thereunder at arm's length. As a result, the costs of the services to be provided and the profits to be realized by Wells Capital from its relationship with the fund were not a material factor in the Board's consideration of the Wells Capital Subadvisory Agreement.
The Board also received information regarding the nature and scope (including their significance to the Advisor and its affiliates and Wells Capital) of any material relationships with respect to the Wells Capital, which include arrangements in which the Wells Capital or its affiliates provide advisory, distribution, or management services in connection with financial products sponsored by the Advisor or its affiliates, and may include other registered investment companies, a 529 education savings plan, managed separate accounts and exempt group annuity contracts sold to qualified plans. The Board also received information and took into account any other potential conflicts of interest the Advisor might have in connection with the Wells Capital Subadvisory Agreement.
In addition, the Board considered other potential indirect benefits that the Subadvisors and its affiliates may receive from the Subadvisors' relationship with the fund, such as the opportunity to provide advisory services to additional funds in the John Hancock Fund Complex and reputational benefits.
Subadvisory fees. The Board considered that the fund pays an advisory fee to the Advisor and that, in turn, the Advisor pays subadvisory fees to the Subadvisors. As noted above, the Board also considered the fund's subadvisory fees as compared to similarly situated investment companies deemed to be comparable to the fund as included in the report prepared by the independent third party provider of fund data, to the extent available. The Board noted that the limited size of the Lipper peer group was not sufficient for comparative purposes. The Board also took into account the subadvisory fees paid by the Advisor to the Subadvisors with respect to the fund and compared them to fees charged by the Subadvisors to manage other subadvised portfolios and portfolios not subject to regulation under the 1940 Act, as applicable.
Subadvisor performance. As noted above, the Board considered the fund's performance as compared to the fund's peer group and the benchmark index and noted that the Board reviews information about the fund's performance results at its regularly scheduled meetings. The Board noted the Advisor's expertise and resources in monitoring the performance, investment style and risk-adjusted performance of the Subadvisors. The Board was mindful of the Advisor's focus on the Subadvisors' performance. The Board also noted the Subadvisors' long-term performance record for similar accounts, as applicable.
The Board's decision to approve the Subadvisory Agreements was based on a number of determinations, including the following:
| (1) | the Subadvisor has extensive experience and demonstrated skills as a manager; |
| (2) | the fund's performance, based on net asset value, has generally been in line with or outperformed the historical performance of comparable funds and the fund's benchmark index; and |
| (3) | the subadvisory fees are reasonable in relation to the level and quality of services being provided under the Subadvisory Agreement. |
* * *
Based on the Board's evaluation of all factors that the Board deemed to be material, including those factors described above, the Board, including the Independent Trustees, concluded that renewal of the Advisory Agreement and the Subadvisory Agreements would be in the best interest of the fund and its shareholders. Accordingly, the Board, and the Independent Trustees voting separately, approved the Advisory Agreement and Subadvisory Agreements for an additional one-year period.
This chart provides information about the Trustees and Officers who oversee your John Hancock fund. Officers elected by the Trustees manage the day-to-day operations of the fund and execute policies formulated by the Trustees.
Independent Trustees
| Name, year of birth Position(s) held with fund Principal occupation(s) and other directorships during past 5 years | Trustee of the Trust since1 | Number of John Hancock funds overseen by Trustee |
| Hassell H. McClellan, Born: 1945 | 2012 | 207 |
| Trustee and Chairperson of the Board Director/Trustee, Virtus Funds (since 2008); Director, The Barnes Group (since 2010); Associate Professor, The Wallace E. Carroll School of Management, Boston College (retired 2013). Trustee (since 2005) and Chairperson of the Board (since 2017) of various trusts within the John Hancock Fund Complex. | ||
| Charles L. Bardelis,2 Born: 1941 | 2012 | 207 |
| Trustee Director, Island Commuter Corp. (marine transport). Trustee of various trusts within the John Hancock Fund Complex (since 1988). | ||
| James R. Boyle,Born: 1959 | 2015 | 207 |
| Trustee Chief Executive Officer, Foresters Financial (since 2018); Chairman and Chief Executive Officer, Zillion Group, Inc. (formerly HealthFleet, Inc.) (healthcare) (2014-2018); Executive Vice President and Chief Executive Officer, U.S. Life Insurance Division of Genworth Financial, Inc. (insurance) (January 2014-July 2014); Senior Executive Vice President, Manulife Financial, President and Chief Executive Officer, John Hancock (1999-2012); Chairman and Director, John Hancock Investment Management LLC, John Hancock Investment Management Distributors LLC, and John Hancock Variable Trust Advisers LLC (2005-2010). Trustee of various trusts within the John Hancock Fund Complex (2005-2014 and since 2015). | ||
| Peter S. Burgess,2 Born: 1942 | 2012 | 207 |
| Trustee Consultant (financial, accounting, and auditing matters) (since 1999); Certified Public Accountant; Partner, Arthur Andersen (independent public accounting firm) (prior to 1999); Director, Lincoln Educational Services Corporation (since 2004); Director, Symetra Financial Corporation (2010-2016); Director, PMA Capital Corporation (2004-2010). Trustee of various trusts within the John Hancock Fund Complex (since 2005). | ||
| William H. Cunningham, Born: 1944 | 2004 | 207 |
| Trustee Professor, University of Texas, Austin, Texas (since 1971); former Chancellor, University of Texas System and former President of the University of Texas, Austin, Texas; Chairman (since 2009) and Director (since 2006), Lincoln National Corporation (insurance); Director, Southwest Airlines (since 2000); former Director, LIN Television (2009-2014). Trustee of various trusts within the John Hancock Fund Complex (since 1986). | ||
| Grace K. Fey, Born: 1946 | 2012 | 207 |
| Trustee Chief Executive Officer, Grace Fey Advisors (since 2007); Director and Executive Vice President, Frontier Capital Management Company (1988-2007); Director, Fiduciary Trust (since 2009). Trustee of various trusts within the John Hancock Fund Complex (since 2008). | ||
Independent Trustees (continued)
| Name, year of birth Position(s) held with fund Principal occupation(s) and other directorships during past 5 years | Trustee of the Trust since1 | Number of John Hancock funds overseen by Trustee |
| Deborah C. Jackson, Born: 1952 | 2008 | 207 |
| Trustee President, Cambridge College, Cambridge, Massachusetts (since 2011); Board of Directors, Massachusetts Women's Forum (since 2018); Board of Directors, National Association of Corporate Directors/New England (since 2015); Board of Directors, Association of Independent Colleges and Universities of Massachusetts (2014-2017); Chief Executive Officer, American Red Cross of Massachusetts Bay (2002-2011); Board of Directors of Eastern Bank Corporation (since 2001); Board of Directors of Eastern Bank Charitable Foundation (since 2001); Board of Directors of American Student Assistance Corporation (1996-2009); Board of Directors of Boston Stock Exchange (2002-2008); Board of Directors of Harvard Pilgrim Healthcare (health benefits company) (2007-2011). Trustee of various trusts within the John Hancock Fund Complex (since 2008). | ||
| James M. Oates,2Born: 1946 | 2012 | 207 |
| Trustee Managing Director, Wydown Group (financial consulting firm) (since 1994); Chairman and Director, Emerson Investment Management, Inc. (2000-2015); Independent Chairman, Hudson Castle Group, Inc. (formerly IBEX Capital Markets, Inc.) (financial services company) (1997-2011); Director, Stifel Financial (since 1996); Director, Investor Financial Services Corporation (1995-2007); Director, Connecticut River Bancorp (1998-2014); Director/Trustee, Virtus Funds (since 1988). Trustee (since 2004) and Chairperson of the Board (2005-2016) of various trusts within the John Hancock Fund Complex. | ||
| Steven R. Pruchansky, Born: 1944 | 2004 | 207 |
| Trustee and Vice Chairperson of the Board Managing Director, Pru Realty (since 2017); Chairman and Chief Executive Officer, Greenscapes of Southwest Florida, Inc. (since 2014); Director and President, Greenscapes of Southwest Florida, Inc. (until 2000); Member, Board of Advisors, First American Bank (until 2010); Managing Director, Jon James, LLC (real estate) (since 2000); Partner, Right Funding, LLC (2014-2017); Director, First Signature Bank & Trust Company (until 1991); Director, Mast Realty Trust (until 1994); President, Maxwell Building Corp. (until 1991). Trustee (since 1992), Chairperson of the Board (2011-2012), and Vice Chairperson of the Board (since 2012) of various trusts within the John Hancock Fund Complex. | ||
| Gregory A. Russo, Born: 1949 | 2008 | 207 |
| Trustee Director and Audit Committee Chairman (since 2012), and Member, Audit Committee and Finance Committee (since 2011), NCH Healthcare System, Inc. (holding company for multi-entity healthcare system); Director and Member (2012-2018) and Finance Committee Chairman (2014-2018), The Moorings, Inc. (nonprofit continuing care community); Vice Chairman, Risk & Regulatory Matters, KPMG LLP (KPMG) (2002-2006); Vice Chairman, Industrial Markets, KPMG (1998-2002); Chairman and Treasurer, Westchester County, New York, Chamber of Commerce (1986-1992); Director, Treasurer, and Chairman of Audit and Finance Committees, Putnam Hospital Center (1989-1995); Director and Chairman of Fundraising Campaign, United Way of Westchester and Putnam Counties, New York (1990-1995). Trustee of various trusts within the John Hancock Fund Complex (since 2008). | ||
Non-Independent Trustees3
| Name, year of birth Position(s) held with fund Principal occupation(s) and other directorships during past 5 years | Trustee of the Trust since1 | Number of John Hancock funds overseen by Trustee |
| Andrew G. Arnott, Born: 1971 | 2017 | 207 |
| President and Non-Independent Trustee Head of Wealth and Asset Management, United States and Europe, for John Hancock and Manulife (since 2018); Executive Vice President, John Hancock Financial Services (since 2009, including prior positions); Director and Executive Vice President, John Hancock Investment Management LLC (since 2005, including prior positions); Director and Executive Vice President, John Hancock Variable Trust Advisers LLC (since 2006, including prior positions); President, John Hancock Investment Management Distributors LLC (since 2004, including prior positions); President of various trusts within the John Hancock Fund Complex (since 2007, including prior positions). Trustee of various trusts within the John Hancock Fund Complex (since 2017). | ||
| Marianne Harrison, Born: 1963 | 2018 | 207 |
| Non-Independent Trustee President and CEO, John Hancock (since 2017); President and CEO, Manulife Canadian Division (2013-2017); Member, Board of Directors, CAE Inc. (since 2019); Member, Board of Directors, MA Competitive Partnership Board (since 2018); Member, Board of Directors, American Council of Life Insurers (ACLI) (since 2018); Member, Board of Directors, Communitech, an industry-led innovation center that fosters technology companies in Canada (2017-2019); Member, Board of Directors, Manulife Assurance Canada (2015-2017); Board Member, St. Mary's General Hospital Foundation (2014-2017); Member, Board of Directors, Manulife Bank of Canada (2013-2017); Member, Standing Committee of the Canadian Life & Health Assurance Association (2013-2017); Member, Board of Directors, John Hancock USA, John Hancock Life & Health, John Hancock New York (2012-2013). Trustee of various trusts within the John Hancock Fund Complex (since 2018). | ||
Principal officers who are not Trustees
| Name, year of birth Position(s) held with fund Principal occupation(s) during past 5 years | Officer of the Trust since |
| Francis V. Knox, Jr.,Born: 1947 | 2005 |
| Chief Compliance Officer Vice President, John Hancock Financial Services (since 2005); Chief Compliance Officer, various trusts within the John Hancock Fund Complex, John Hancock Investment Management LLC, and John Hancock Variable Trust Advisers LLC (since 2005). | |
| Charles A. Rizzo, Born: 1957 | 2007 |
| Chief Financial Officer Vice President, John Hancock Financial Services (since 2008); Senior Vice President, John Hancock Investment Management LLC and John Hancock Variable Trust Advisers LLC (since 2008); Chief Financial Officer of various trusts within the John Hancock Fund Complex (since 2007). | |
| Salvatore Schiavone, Born: 1965 | 2010 |
| Treasurer Assistant Vice President, John Hancock Financial Services (since 2007); Vice President, John Hancock Investment Management LLC and John Hancock Variable Trust Advisers LLC (since 2007); Treasurer of various trusts within the John Hancock Fund Complex (since 2007, including prior positions). | |
Principal officers who are not Trustees (continued)
| Name, year of birth Position(s) held with fund Principal occupation(s) during past 5 years | Officer of the Trust since |
| Christopher (Kit) Sechler,Born: 1973 | 2018 |
| Chief Legal Officer and Secretary Vice President and Deputy Chief Counsel, John Hancock Investments (since 2015); Assistant Vice President and Senior Counsel (2009-2015), John Hancock Investment Management; Chief Legal Officer and Secretary of various trusts within the John Hancock Fund Complex (since 2018); Assistant Secretary of John Hancock Investment Management LLC and John Hancock Variable Trust Advisers LLC (since 2009). | |
The business address for all Trustees and Officers is 200 Berkeley Street, Boston, Massachusetts 02116-5023.
| 1 | Mr. Boyle, Mr. Cunningham, Ms. Fey, Mr. McClellan and Mr. Russo serve as Trustees for a term expiring in 2020; Mr. Bardelis, Mr. Burgess and Ms. Harrison serve as Trustees for a term expiring in 2021; Mr. Arnott, Ms. Jackson, Mr. Oates and Mr. Pruchansky serve as Trustees for a term expiring in 2022; Mr. Boyle has served as Trustee at various times prior to date listed in the table. |
| 2 | Member of the Audit Committee. |
| 3 | The Trustee is a Non-Independent Trustee due to current or former positions with the Advisor and certain of its affiliates. |
Trustees Hassell H. McClellan,Chairperson Officers Andrew G. Arnott Francis V. Knox, Jr. Charles A. Rizzo Salvatore Schiavone Christopher (Kit) Sechler | Investment advisor John Hancock Investment Management LLC Subadvisors Manulife Investment Management (US) LLC (Manulife IM (US)) Portfolio Managers The Investment Team at Manulife IM (US) and WellsCap Custodian State Street Bank and Trust Company Transfer agent Computershare Shareowner Services, LLC Legal counsel K&L Gates LLP Independent registered public accounting firm PricewaterhouseCoopers LLP Stock symbol Listed New York Stock Exchange: HTD |
* Member of the Audit Committee
† Non-Independent Trustee
For shareholder assistance refer to page 6
| You can also contact us: | |||
| 800-852-0218 jhinvestments.com | Regular mail: Computershare | Express mail: Computershare | |
The fund's proxy voting policies and procedures, as well as the fund's proxy voting record for the most recent twelve-month period ended June 30, are available free of charge on the Securities and Exchange Commission (SEC) website at sec.gov or on our website.
All of the fund's holdings as of the end of the third month of every fiscal quarter are filed with the SEC on Form N-PORT within 60 days of the end of the fiscal quarter. The fund's Form N-PORT filings are available on our website and the SEC's website, sec.gov.
We make this information on your fund, as well asmonthly portfolio holdings, and other fund details available on our website at jhinvestments.com or by calling 800-852-0218.
The report is certified under the Sarbanes-Oxley Act, which requires closed-end funds and other public companies to affirm that, to the best of their knowledge, the information in their financial reports is fairly and accurately stated in all material respects.
John Hancock family of funds
DOMESTIC EQUITY FUNDS Blue Chip Growth Classic Value Disciplined Value Disciplined Value Mid Cap Equity Income Financial Industries Fundamental All Cap Core Fundamental Large Cap Core New Opportunities Regional Bank Small Cap Core Small Cap Growth Small Cap Value U.S. Global Leaders Growth U.S. Quality Growth GLOBAL AND INTERNATIONAL EQUITY FUNDS Disciplined Value International Emerging Markets Emerging Markets Equity Fundamental Global Franchise Global Equity Global Shareholder Yield Global Thematic Opportunities International Dynamic Growth International Growth International Small Company | INCOME FUNDS Bond California Tax-Free Income Emerging Markets Debt Floating Rate Income Government Income High Yield High Yield Municipal Bond Income Investment Grade Bond Money Market Short Duration Bond Short Duration Credit Opportunities Strategic Income Opportunities Tax-Free Bond ALTERNATIVE AND SPECIALTY FUNDS Absolute Return Currency Alternative Asset Allocation Alternative Risk Premia Disciplined Alternative Yield Diversified Macro Infrastructure Multi-Asset Absolute Return Seaport Long/Short |
The fund's investment objectives, risks, charges, and expenses are included in the prospectus and should be considered carefully before investing. For a prospectus, contact your financial professional, call John Hancock Investment Management at 800-852-0218, or visit the fund's website at jhinvestments.com. Please read the prospectus carefully before investing or sending money.
ASSET ALLOCATION Balanced Income Allocation Multi-Index Lifetime Portfolios Multi-Index Preservation Portfolios Multimanager Lifestyle Portfolios Multimanager Lifetime Portfolios Retirement Income 2040 EXCHANGE-TRADED FUNDS John Hancock Multifactor Consumer Discretionary ETF John Hancock Multifactor Consumer Staples ETF John Hancock Multifactor Developed International ETF John Hancock Multifactor Emerging Markets ETF John Hancock Multifactor Energy ETF John Hancock Multifactor Financials ETF John Hancock Multifactor Healthcare ETF John Hancock Multifactor Industrials ETF John Hancock Multifactor Large Cap ETF John Hancock Multifactor Materials ETF John Hancock Multifactor Media and John Hancock Multifactor Mid Cap ETF John Hancock Multifactor Small Cap ETF John Hancock Multifactor Technology ETF John Hancock Multifactor Utilities ETF | ENVIRONMENTAL, SOCIAL, AND ESG All Cap Core ESG Core Bond ESG International Equity ESG Large Cap Core CLOSED-END FUNDS Financial Opportunities Hedged Equity & Income Income Securities Trust Investors Trust Preferred Income Preferred Income II Preferred Income III Premium Dividend Tax-Advantaged Dividend Income Tax-Advantaged Global Shareholder Yield |
John Hancock Multifactor ETF shares are bought and sold at market price (not NAV), and are not individually redeemed
from the fund. Brokerage commissions will reduce returns.
John Hancock ETFs are distributed by Foreside Fund Services, LLC, and are subadvised by Dimensional Fund Advisors LP.
Foreside is not affiliated with John Hancock Investment Management Distributors LLC or Dimensional Fund Advisors LP.
Dimensional Fund Advisors LP receives compensation from John Hancock in connection with licensing rights to the
John Hancock Dimensional indexes. Dimensional Fund Advisors LP does not sponsor, endorse, or sell, and makes no
representation as to the advisability of investing in, John Hancock Multifactor ETFs.
John Hancock Investment Management
A trusted brand
John Hancock Investment Management is a premier asset manager
representing one of America's most trusted brands, with a heritage of
financial stewardship dating back to 1862. Helping our shareholders
pursue their financial goals is at the core of everything we do. It's why
we support the role of professional financial advice and operate with
the highest standards of conduct and integrity.
A better way to invest
We serve investors globally through a unique multimanager approach:
We search the world to find proven portfolio teams with specialized
expertise for every strategy we offer, then we apply robust investment
oversight to ensure they continue to meet our uncompromising
standards and serve the best interests of our shareholders.
Results for investors
Our unique approach to asset management enables us to provide
a diverse set of investments backed by some of the world's best
managers, along with strong risk-adjusted returns across asset classes.
![]()
John Hancock Investment Management Distributors LLC n Member FINRA, SIPC
200 Berkeley Street n Boston, MA 02116-5010 n 800-225-5291 n jhinvestments.com
| MF1003891 | P13A 10/19 12/19 |
ITEM 2. CODE OF ETHICS.
As of the end of the period, October 31, 2019, the registrant has adopted a code of ethics, as defined in Item 2 of Form N-CSR, that applies to its Chief Executive Officer and Chief Financial Officer (respectively, the principal executive officer, the principal financial officer, the “Covered Officers”). A copy of the code of ethics is filed as an exhibit to this Form N-CSR.
ITEM 3. AUDIT COMMITTEE FINANCIAL EXPERT.
Peter S. Burgess is the audit committee financial expert and is “independent”, pursuant to general instructions on Form N-CSR Item 3.
ITEM 4. PRINCIPAL ACCOUNTANT FEES AND SERVICES.
(a) Audit Fees
The aggregate fees for John Hancock Tax-Advantaged Dividend Income Fund billed for professional services rendered by the principal accountant(s) for the audit of the registrant’s annual financial statements or services that are normally provided by the accountant(s) in connection with statutory and regulatory filings or engagements amounted to $39,508 for the fiscal year ended October 31, 2019 and $42,441 for the fiscal period ended October 31, 2018. These fees were billed to the registrant and were approved by the registrant’s audit committee.
(b) Audit-Related Services
The audit-related fees for John Hancock Tax-Advantaged Dividend Income Fund amounted to $5 for the fiscal year ended October 31, 2019 and $0 for the fiscal period ended October 31, 2018 billed to the registrant or to the registrant's investment adviser (not including any sub-adviser whose role is primarily portfolio management and is subcontracted with or overseen by another investment adviser), and any entity controlling, controlled by, or under common control with the adviser that provides ongoing services to the registrant ("control affiliates"). In addition, amounts billed to control affiliates for service provider internal controls reviews were $116,467 and $110,200 for the fiscal years ended October 31, 2019 and 2018, respectively.
(c) Tax Fees
The aggregate fees for John Hancock Tax-Advantaged Dividend Income Fund billed for professional services rendered by the principal accountant(s) for the tax compliance, tax advice and tax planning (“tax fees”) amounted to $3,837 for the fiscal year ended October 31, 2019 and $3,725 for the fiscal period ended October 31, 2018. The nature of the services comprising the tax fees was the review of the registrant’s tax returns and tax distribution requirements. These fees were billed to the registrant and were approved by the registrant’s audit committee.
(d) All Other Fees
The all other fees for John Hancock Tax-Advantaged Dividend Income Fund billed to the registrant for products and services provided by the principal accountant were $84 for the fiscal year ended October 31, 2019 and $$239 for the fiscal year ended October 31, 2018 billed to control affiliates for products and services provided by the principal accountant. These fees were approved by the registrant’s audit committee.
(e)(1) Audit Committee Pre-Approval Policies and Procedures:
The trust’s Audit Committee must pre-approve all audit and non-audit services provided by the independent registered public accounting firm (the “Auditor”) relating to the operations or financial reporting of the funds. Prior to the commencement of any audit or non-audit services to a fund, the Audit Committee reviews the services to determine whether they are appropriate and permissible under applicable law.
The trust’s Audit Committee has adopted policies and procedures to, among other purposes, provide a framework for the Committee’s consideration of audit-related and non-audit services by the Auditor. The policies and procedures require that any audit-related and non-audit service provided by the Auditor and any non-audit service provided by the Auditor to a fund service provider that relates directly to the operations and financial reporting of a fund are subject to approval by the Audit Committee before such service is provided. Audit-related services provided by the Auditor that are expected to exceed $25,000 per instance/per fund are subject to specific pre-approval by the Audit Committee. Tax services provided by the Auditor that are expected to exceed $30,000 per instance/per fund are subject to specific pre-approval by the Audit Committee.
All audit services, as well as the audit-related and non-audit services that are expected to exceed the amounts stated above, must be approved in advance of provision of the service by formal resolution of the Audit Committee. At the regularly scheduled Audit Committee meetings, the Committee reviews a report summarizing the services, including fees, provided by the Auditor.
(e)(2) Services approved pursuant to paragraph (c)(7)(i)(C) of Rule 2-01 of Regulation S-X:
Audit-Related Fees, Tax Fees and All Other Fees:
There were no amounts that were approved by the Audit Committee pursuant to the de minimis exception under Rule 2-01 of Regulation S-X.
(f) According to the registrant’s principal accountant, for the fiscal period ended October 31, 2019, the percentage of hours spent on the audit of the registrant's financial statements for the most recent fiscal year that were attributed to work performed by persons who were not full-time, permanent employees of principal accountant was less than 50%.
(g) The aggregate non-audit fees billed by the registrant's accountant(s) for services rendered to the registrant and rendered to the registrant's control affiliates for each of the last two fiscal years of the registrant were $$962,139 for the fiscal year ended October 31, 2019 and $2,064,999 for the fiscal period ended October 31, 2018.
(h) The audit committee of the registrant has considered the non-audit services provided by the registrant’s principal accountant(s) to the control affiliates and has determined that the services that were not pre-approved are compatible with maintaining the principal accountant(s)' independence.
ITEM 5. AUDIT COMMITTEE OF LISTED REGISTRANTS.
The registrant has a separately-designated standing audit committee comprised of independent trustees. The members of the audit committee are as follows:
Peter S. Burgess - Chairman
Charles L. Bardelis
Theron S. Hoffman
ITEM 6. SCHEDULE OF INVESTMENTS.
(a) Not applicable.
(b) Not applicable.
ITEM 7. DISCLOSURE OF PROXY VOTING POLICIES AND PROCEDURES FOR CLOSED-END MANAGEMENT INVESTMENT COMPANIES.
See attached exhibit - Proxy Voting Policies and Procedures.
ITEM 8. PORTFOLIO MANAGERS OF CLOSED-END MANAGEMENT INVESTMENT COMPANIES.
Information about the portfolio managers
Management Biographies
Management Biographies
Below is a list of the Manulife Investment Management (US) LLC (“Manulife IM (US)”) portfolio managers who share joint responsibility for the day-to-day investment management of the Fund. It provides a brief summary of their business careers over the past five years. Information is provided as of October 31, 2019.
Joseph H. Bozoyan, CFA
Managing Director and Portfolio Manager
Manulife Investment Management (US) LLC since 2015
Began business career in 1993
Managed the Fund since 2015
Bradley Lutz, CFA
Managing Director and Portfolio Manager
Manulife Investment Management (US) LLC since 2002
Began business career in 1992
Managed the Fund since 2018
Other Accounts the Portfolio Managers are Managing
The table below indicates for each portfolio manager information about the accounts over which the portfolio manager has day-to-day investment responsibility. All information on the number of accounts and total assets in the table is as of October 31, 2019. For purposes of the table, “Other Pooled Investment Vehicles” may include investment partnerships and group trusts, and “Other Accounts” may include separate accounts for institutions or individuals, insurance company general or separate accounts, pension funds and other similar institutional accounts.
| Registered Investment | Other Pooled Investment | |||||
| Companies | Vehicles | Other Accounts | ||||
| Total | Total | Total | ||||
| Number of | Assets | Number of | Assets | Number of | Assets | |
| Accounts | $Million | Accounts | $Million | Accounts | $Million | |
| Joseph H. | 4 | 3,620 | 3 | 464 | None | None |
| Bozoyan, | ||||||
| CFA | ||||||
| Bradley | 4 | 3,620 | 2 | 413 | 4 | 263 |
| Lutz, CFA | ||||||
Number and value of accounts within the total accounts that are subject to a performance-based advisory fee: None.
Conflicts of Interest.When a portfolio manager is responsible for the management of more than one account, the potential arises for the portfolio manager to favor one account over another. The principal types of potential conflicts of interest that may arise are discussed below. For the reasons outlined below, the Fund does not believe that any material conflicts are likely to arise out of a portfolio manager’s responsibility for the management of the Fund as well as one or more other accounts. The Advisor and Subadvisor have adopted procedures that are intended to monitor compliance with the policies referred to in the following paragraphs. Generally, the risks of such conflicts of interests are increased to the extent that a portfolio manager has a financial incentive to favor one account over another. The Advisor and Subadvisor have structured their compensation arrangements in a manner that is intended to limit such potential for conflicts of interests. See “Compensation of Portfolio Managers” below.
| ● | A portfolio manager could favor one account over another in allocating new investment opportunities that have limited supply, such as initial public offerings and private placements. If, for example, an initial public offering that was expected to appreciate in value significantly shortly after the offering was allocated to a single account, that account may be expected to have better investment performance than other accounts that did not receive an allocation on the initial public offering. The Subadvisor has policies that require a portfolio manager to allocate such investment opportunities in an equitable manner and generally to allocate such investments proportionately among all accounts with similar investment objectives. |
| ● | A portfolio manager could favor one account over another in the order in which trades for the accounts are placed. If a portfolio manager determines to purchase a security for more than one account in an aggregate amount that may influence the market price of the security, accounts that purchased or sold the security first may receive a more favorable price than accounts that made subsequent transactions. The less liquid the market for the security or the greater the percentage that the proposed aggregate purchases or sales represent of average daily trading volume, the greater the potential for accounts that make subsequent purchases or sales to receive a less favorable price. When a portfolio manager intends to trade the same security for more than one account, the policies of the Subadvisor generally require that such trades be “bunched,” which means that the trades for the individual accounts are aggregated and each account receives the same price. There are some types of accounts as to which bunching may not be possible for contractual reasons (such as directed brokerage arrangements). Circumstances may also arise where the trader believes that bunching the orders may not result in the best possible price. Where those accounts or circumstances are involved, the Subadvisor will place the order in a manner intended to result in as favorable a price as possible for such client. |
| ● | A portfolio manager could favor an account if the portfolio manager’s compensation is tied to the performance of that account rather than all accounts managed by the portfolio manager. If, for example, the portfolio manager receives a bonus based upon the performance of certain accounts relative to a benchmark while other accounts are disregarded for this purpose, the portfolio manager will have a financial incentive to seek to have the accounts that determine the portfolio manager’s bonus achieve the best possible performance to the possible detriment of other accounts. Similarly, if the Subadvisor receives a performance-based advisory fee, the portfolio manager may favor that account, whether or not the performance of that account directly determines the portfolio manager’s compensation. The investment performance on specific accounts is not a factor in determining the portfolio manager’s compensation. See “Compensation of Portfolio Managers” below. Neither the Advisor nor the Subadvisor receives a performance-based fee with respect to any of the accounts managed by the portfolio managers. |
| ● | A portfolio manager could favor an account if the portfolio manager has a beneficial interest in the account, in order to benefit a large client or to compensate a client that had poor returns. For example, if the portfolio manager held an interest in an investment partnership that was one of the accounts managed by the portfolio manager, the portfolio manager would have an economic incentive to favor the account in which the portfolio manager held an interest. The Subadvisor imposes certain trading restrictions and reporting requirements for accounts in which a portfolio manager or certain family members have a personal interest in order to confirm that such accounts are not favored over other accounts. |
| ● | If the different accounts have materially and potentially conflicting investment objectives or strategies, a conflict of interest may arise. For example, if a portfolio manager purchases a security for one account and sells the same security short for another account, such trading pattern could disadvantage either the account that is long or short. In making portfolio manager assignments, the Subadvisor seeks to avoid such potentially conflicting situations. However, where a portfolio manager is responsible for accounts with differing investment objectives and policies, it is possible that the portfolio manager will conclude that it is in the best interest of one account to sell a portfolio security while another account continues to hold or increase the holding in such security. |
Compensation of Portfolio Managers.The Subadvisor has adopted a system of compensation for portfolio managers and others involved in the investment process that is applied systematically among investment professionals. At the Subadvisor, the structure of compensation of investment professionals is currently composed of the following basic components: base salary and short-and long-term incentives. The following describes each component of the compensation package for the individuals identified as a portfolio manager for the Funds.
| ● | Base salary. Base compensation is fixed and normally reevaluated on an annual basis. The Subadvisor seeks to set compensation at market rates, taking into account the experience and responsibilities of the investment professional. |
| ● | Incentives. Only investment professionals are eligible to participate in the short-and long-term incentive plan. Under the plan, investment professionals are eligible for an annual cash award. The plan is intended to provide a competitive level of annual bonus compensation that is tied to the investment professional achieving superior investment performance and aligns the financial incentives of the Subadvisor and the investment professional. Any bonus under the plan is completely discretionary, with a maximum annual bonus that may be well in excess of base salary. Payout of a portion of this bonus may be deferred for up to five years. While the amount of any bonus is discretionary, the following factors are generally used in determining bonuses under the plan: |
| ● | Investment Performance: The investment performance of all accounts managed by the investment professional over one, three and five-year periods are considered and no specific benchmark is used to measure performance. With respect to fixed income accounts, relative yields are also used to measure performance. |
| ● | Financial Performance: The profitability of the Subadvisor and its parent company are also considered in determining bonus awards. |
| ● | Non-Investment Performance: To a lesser extent, intangible contributions, including the investment professional’s support of client service and sales activities, new fund/strategy idea generation, professional growth and development, and management, where applicable, are also evaluated when determining bonus awards. |
| ● | In addition to the above, compensation may also include a revenue component for an investment team derived from a number of factors including, but not limited to, client assets under management, investment performance, and firm metrics. |
| ● | Manulife Equity Awards. A limited number of senior investment professionals may receive options to purchase shares of Manulife Financial stock. Generally, such option would permit the investment professional to purchase a set amount of stock at the market price on the date of grant. The option can be exercised for a set period (normally a number of years or until termination of employment) and the investment professional would exercise the option if the market value of Manulife Financial stock increases. Some investment professionals may receive restricted stock grants, where the investment professional is entitled to receive the stock at no or nominal cost, provided that the stock is forgone if the investment professional’s employment is terminated prior to a vesting date. |
| ● | Deferred Incentives. Investment professionals may receive deferred incentives which are fully invested in strategies managed by the team/individual as well as other Manulife Asset Management strategies. |
The Subadvisor also permits investment professionals to participate on a voluntary basis in a deferred compensation plan, under which the investment professional may elect on an annual basis to defer receipt of a portion of their compensation until retirement. Participation in the plan is voluntary.
Share Ownership by Portfolio Managers. For purposes of these tables, “similarly managed accounts” include all accounts that are managed (i) by the same portfolio managers that are jointly and primarily responsible for the day-to-day management of the Fund; and (ii) with an investment style, objective, policies and strategies substantially similar to those that are used to manage the Fund.
| Range of Beneficial | ||
| Range of Beneficial Ownership | Ownership in similarly | |
| Portfolio Manager | in the Fund | managed accounts |
| Joseph H. Bozoyan, CFA | $10,001-$50,000 | $10,001-$50,000 |
| Bradley Lutz, CFA | $10,001-$50,000 | $10,001-$50,000 |
Information about the Wells Capital Management Incorporated portfolio managers
Management Biographies
Below is an alphabetical list of the Wells Capital Management Incorporated (“WellsCap”) portfolio managers who share joint responsibility for the implementation and execution of the Fund’s options strategy. It provides a brief summary of their business careers. Information is provided as of October 31, 2019.
Dennis M. Bein, CFA
Chief Investment Officer and Portfolio Manager, Wells Capital Management Incorporated since 1995
Began business career in 1990
Managed the Fund since 2007
Harindra de Silva, Ph.D., CFA
President and Portfolio Manager, Wells Capital Management Incorporated since 1995
Began business career in 1984
Managed the Fund since 2007
Gregory M. McMurran
Chief Investment Officer and Portfolio Manager, Wells Capital Management Incorporated since 1976
Began business career in 1976
Managed the Fund since 2007
Megan N. Miller, CFA
Portfolio Manager, Wells Capital Management Incorporated since 2014
Began business career in 2008
Managed Fund since 2018
Other Accounts the Portfolio Managers are Managing
The table below indicates for each portfolio manager information about the accounts over which the portfolio manager has day-to-day investment responsibility. All information on the number of accounts and total assets in the table is as of October 31, 2019. For purposes of the table, “Other Pooled Investment Vehicles” may include investment partnerships and group trusts, and “Other Accounts” may include separate accounts for institutions or individuals, insurance company general or separate accounts, pension funds and other similar institutional accounts.
| Registered Investment | Other Pooled Investment | |||||
| Companies | Vehicles | Other Accounts | ||||
| Total | Total | Total | ||||
| Number of | Assets | Number of | Assets | Number of | Assets | |
| Accounts | $Million | Accounts | $Million | Accounts | $Million | |
| Dennis M. | 18 | 5,858.42 | 20 | 7,768.72 | 27 | 6,340.94 |
| Bein, CFA | *(0) | *(0) | *(2) | *(169.89) | *(3) | *(427.28) |
| Harindra de | 18 | 5,858.42 | 21 | 7,793.09 | 31 | 6,431.06 |
| Silva, Ph.D., | ||||||
| CFA | *(0) | *(0) | *(2) | *(169.89) | *(3) | *(427.28) |
| Gregory M. | 2 | 80.94 | 1 | 24.37 | 0 | 0 |
| McMurran | *(0) | *(0) | *(0) | *(0) | *(0) | *(0) |
| Megan N. | 2 | 80.94 | 1 | 24.37 | 0 | 0 |
| Miller, CFA | *(0) | *(0) | *(0) | *(0) | *(0) | *(0) |
Note: (*) represents the number and value of accounts, within the total accounts that are subject to a performance-based advisory fee.
POTENTIAL CONFLICTS OF INTEREST
Wells Capital Management’s Portfolio Managers often provide investment management for separate accounts advised in the same or similar investment style as that provided to mutual funds. While management of multiple accounts could potentially lead to conflicts of interest over various issues such as trade allocation, fee disparities and research acquisition, Wells Capital Management has implemented policies and procedures for the express purpose of ensuring that clients are treated fairly and that potential conflicts of interest are minimized.
Wells Capital Management investment professionals have responsibilities for managing investments of multiple accounts with a common investment strategy, including other registered investment companies, unregistered investment vehicles, pension plans, separate accounts, collective trusts and charitable foundations. Potential conflicts of interest may arise when an investment professional has responsibilities for the investments of more than one account because, inter alia, the investment professional may be unable to devote equal time and attention to each account; other accounts may have higher fee arrangements and may also have a performance-based fee; the side-by-side management of these funds may raise potential conflicts of interest relating to cross trading, the allocation of investment opportunities and the aggregation and allocation of trades.
As an investment adviser, Wells Capital Management has fiduciary responsibilities to act in the best interests of its clients. Such duties include: reasonable and independent basis for its investment advice, seeking best price execution for clients' securities transactions, ensuring that the investment advice is suitable to the client's objectives, and refraining from engaging in personal securities transactions inconsistent with client interests. To minimize any potential client investment conflicts, Wells Capital Management manages its advisory services, fee structure, and investment selection process in accordance with pre-established client investment guidelines, the advisory contract with the client, and all applicable policies and procedures pursuant to Rule 206(4)-7 of the Advisers Act. Wells Capital Management has a fiduciary responsibility to manage all client accounts in a fair and equitable manner. It seeks to provide best execution of all securities transactions and aggregate and allocate securities to client accounts in a fair and timely manner. To this end, Wells Capital Management has developed policies and procedures designed to mitigate and manage the potential conflicts of interest that may arise from side-by-side management. In addition, Wells Capital Management has adopted policies limiting the circumstances under which cross-trades may be affected between the Portfolio and another client account. Wells Capital Management conducts periodic reviews of trades for consistency with these policies.
COMPENSATION
The compensation structure for Wells Capital Management's Portfolio Managers includes a competitive fixed base salary plus variable incentives, payable annually and over a longer term period. Wells Capital Management participates in third party investment management compensation surveys for market-based compensation information to help support individual pay decisions. In addition to surveys, Wells Capital Management also considers prior professional experience, tenure, seniority and a Portfolio Manager's team size, scope and assets under management when determining his/her fixed base salary.
In addition, Portfolio Managers, who meet the eligibility requirements, may participate in Wells Fargo's 401(k) plan that features a limited matching contribution. Eligibility for and participation in this plan is on the same basis for all employees. Wells Capital Management also contributes to other employee benefits such as health and disability plans and paid time off, and encourages and supports personal professional development. The compensation structure and incentive programs will continually evolve in order to provide career growth, pay increase opportunities, incentive payment plan rewards and to balance the overall needs of the organization and its employees. In addition, senior management at Wells Capital maintains an ongoing assessment of resources within each team to support portfolio management and research needs.
Wells Capital Management's investment incentive program plays an important role in aligning the interests of our portfolio managers, investment team members, clients and shareholders. Incentive awards for portfolio managers are determined based on a review of relative investment and business/team performance. Investment performance is generally evaluated for 1, 3, and 5 year performance results, with a predominant weighting on the 3- and 5- year time periods, versus the relevant benchmarks and/or peer groups consistent with the investment style. In the case of each Fund, the benchmark(s) against which the performance of the Fund's portfolio may be compared for these purposes generally are indicated in the "Average Annual Total Returns" table in the Prospectus. Once determined, incentives are awarded to portfolio managers annually, with a portion awarded as annual cash and a portion awarded as long term incentive. The long term portion of incentives generally carry a pro-rated vesting schedule over a three year period. For many of our portfolio managers, Wells Capital Management further requires a portion of their annual long-term award be allocated directly into each strategy they manage through a deferred compensation vehicle. In addition, our investment team members who are eligible for long term awards also have the opportunity to invest up to 100% of their awards into investment strategies they support (through a deferred compensation vehicle).
Share Ownership by Portfolio Managers. The following table indicates as of October 31, 2019 the value of shares beneficially owned by the portfolio managers in the Fund.
| Range of Beneficial Ownership in the | |
| Portfolio Manager | Fund |
| Dennis M. Bein, CFA | None |
| Harindra de Silva, Ph.D., CFA | None |
| Gregory M. McMurran | None |
| Megan N. Miller, CFA | None |
(a) Not applicable
(b)
REGISTRANT PURCHASES OF EQUITY SECURITIES
| Maximum | ||||
| Total number | number of | |||
| of shares | shares that | |||
| purchased as | may yet be | |||
| Total number | part of publicly | purchased | ||
| of shares | Average price | announced | under the | |
| Period | purchased | per share | plans* | plans* |
| Nov-18 | - | - | - | 3,539,294 |
| Dec-18 | - | - | - | 3,539,294 |
| Jan-19 | - | - | - | 3,539,294 |
| Feb-19 | - | - | - | 3,539,294 |
| Mar-19 | - | - | - | 3,539,294 |
| Apr-19 | - | - | - | 3,539,294 |
| May-19 | - | - | - | 3,539,294 |
| Jun-19 | - | - | - | 3,539,294 |
| Jul-19 | - | - | - | 3,539,294 |
| Aug-19 | - | - | - | 3,539,294 |
| Sep-19 | - | - | - | 3,539,294 |
| Oct-19 | - | - | - | 3,539,294 |
| Total | - | - | - |
*In December 2007, the Board of Trustees approved a share repurchase plan, which is subsequently reviewed and approved by the Board of Trustees each year in December. Under the current share repurchase plan, the Fund may purchase in the open market up to 10% of its outstanding common shares as of December 31, 2018. The current share repurchase plan will remain in effect between January 1, 2019 and December 31, 2019.
ITEM 10. SUBMISSION OF MATTERS TO A VOTE OF SECURITY HOLDERS.
(a) The registrant has adopted procedures by which shareholders may recommend nominees to the registrant's Board of Trustees. A copy of the procedures is filed as an exhibit to this Form N-CSR. See attached "John Hancock Funds – Nominating and Governance Committee Charter".
ITEM 11. CONTROLS AND PROCEDURES.
(a) Based upon their evaluation of the registrant's disclosure controls and procedures as conducted within 90 days of the filing date of this Form N-CSR, the registrant's principal executive officer and principal financial officer have concluded that those disclosure controls and procedures provide reasonable assurance that the material information required to be disclosed by the registrant on this report is recorded, processed, summarized and reported within the time periods specified in the Securities and Exchange Commission's rules and forms.
(b) There were no changes in the registrant's internal control over financial reporting that occurred during the period covered by this report that have materially affected, or are reasonably likely to materially affect, the registrant's internal control over financial reporting.
ITEM 12. DISCLOSURE OF SECURITIES LENDING ACTIVITIES FOR CLOSED-END MANAGEMENT INVESTMENT COMPANIES.
The Fund did not participate directly in securities lending activities. See Note 8 to financial statements in Item 1.
ITEM 13. EXHIBITS.
(a)(1) Code of Ethics for Senior Financial Officers is attached.
(a)(2) Separate certifications for the registrant's principal executive officer and principal financial officer, as required by Section 302 of the Sarbanes-Oxley Act of 2002 and Rule 30a-2(a) under the Investment Company Act of 1940, are attached.
(b) Separate certifications for the registrant's principal executive officer and principal financial officer, as required by 18 U.S.C. Section 1350, as adopted pursuant to Section 906 of the Sarbanes-Oxley Act of 2002, and Rule 30a-2(b) under the Investment Company Act of 1940, are attached. The certifications furnished pursuant to this paragraph are not deemed to be "filed" for purposes of Section 18 of the Securities Exchange Act of 1934, or otherwise subject to the liability of that section. Such certifications are not deemed to be incorporated by reference into any filing under the Securities Act of 1933 or the Securities Exchange Act of 1934, except to the extent that the Registrant specifically incorporates them by reference.
(c)(1) Proxy Voting Policies and Procedures are attached.
(c)(2) Submission of Matters to a Vote of Security Holders is attached. See attached “John Hancock Funds – Nominating and Governance Committee Charter”.
(c)(3) Registrant’s notice to shareholders pursuant to Registrant’s exemptive order granting an exemption from Section 19(b) of the Investment Company Act of 1940, as amended and Rule 19b-1 thereunder regarding distributions made pursuant to the Registrant’s Managed Distribution Plan.
SIGNATURES
Pursuant to the requirements of the Securities Exchange Act of 1934 and the Investment Company Act of 1940, the registrant has duly caused this report to be signed on its behalf by the undersigned, thereunto duly authorized.
John Hancock Tax-Advantaged Dividend Income Fund
| By: | /s/ Andrew Arnott |
| Andrew Arnott | |
| President | |
| Date: | December 13, 2019 |
Pursuant to the requirements of the Securities Exchange Act of 1934 and the Investment Company Act of 1940, this report has been signed below by the following persons on behalf of the registrant and in the capacities and on the dates indicated.
| By: | /s/ Andrew Arnott |
| Andrew Arnott | |
| President | |
| Date: | December 13, 2019 |
| By: | /s/ Charles A. Rizzo |
| Charles A. Rizzo | |
| Chief Financial Officer | |
| Date: | December 13, 2019 |