Pay for Value Creation Pay for Value Creation Exhibit 99.1 |
Proposingg unique public company option plan
Goal
| | • | | Generate superior returnsby . . . . |
| | • | | Maintain the value focus & culture of private equity in a public environment |
Simple concept
| | • | | Management / shareholders are partners |
| | • | | If management creates significant value for shareholders, management is rewarded |
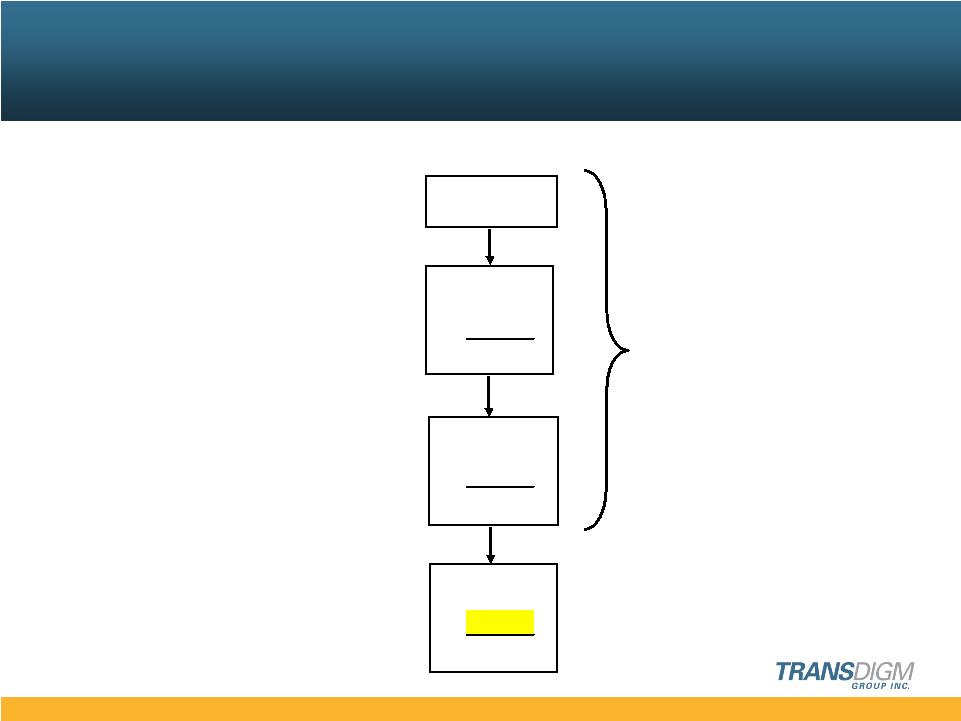
1 Successful Culture and Organization Successful Culture and Organization Successful Culture and Organization Corporate Control Local Autonomy Economy of Scale Mgmt Resources Value Generation Strategy Structure Execution Central Control Local Autonomy Emp- loyees Owners CORPORATE OPERATING UNIT Motivation Key Element Key Element |
| • | | Significant part of our ability to create value is our organizational concept & culture |
| | • | | Significant local autonomy |
| | • | | Minimize corporate interferenceg minimize corporate staffg erodes ownership |
| | • | | Motivationg think like an ownerg create value |
| | • | | Stock options & ownership for key peopleg significant |
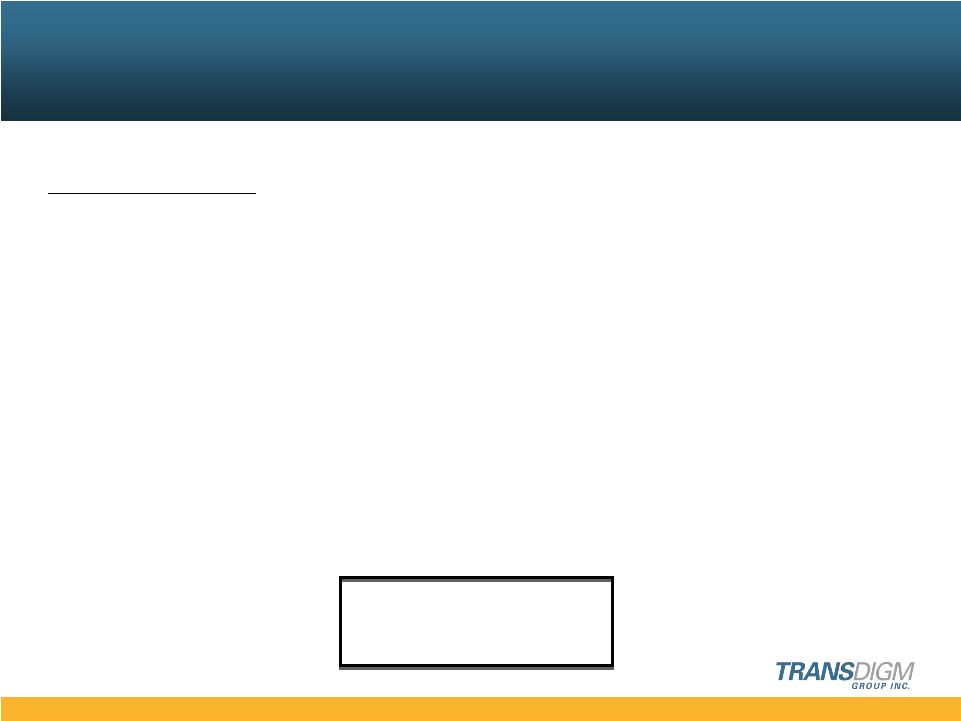
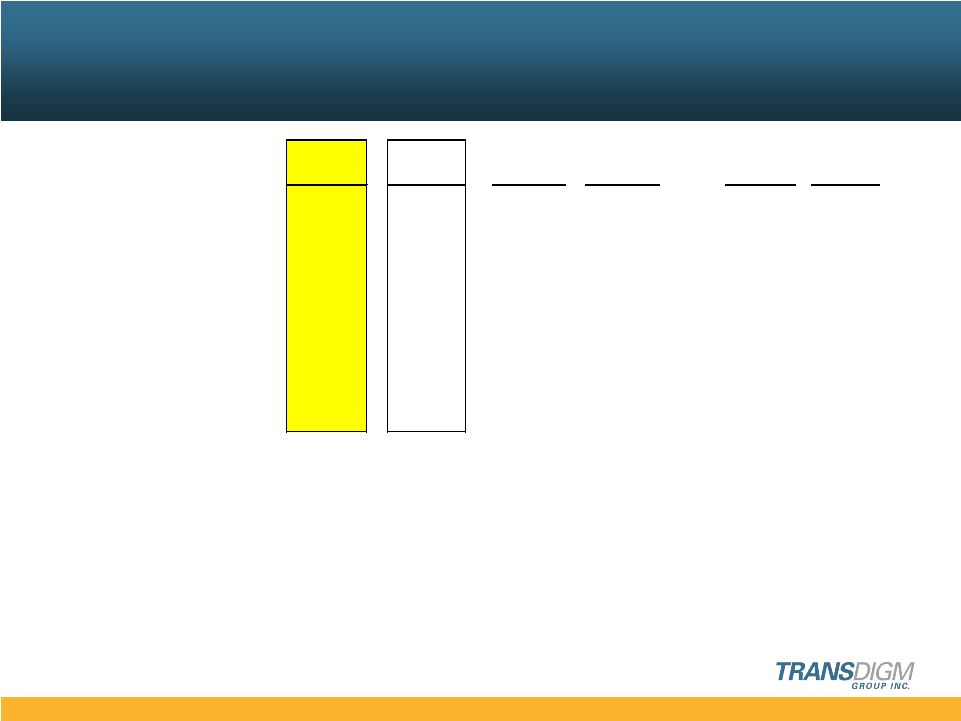
2 Compensation Concept – “Think / act like an owner” Compensation Concept – Compensation Concept – “Think / act like an owner” “Think / act like an owner” Low High Low Equity Based Compensation (2) (1) Salary and Bonus (2) Options High Cash Compensation (1) |
| • | | We want managers who can think & act like owners |
| • | | We have historically paid executives & key managerscash compensation below the average |
| • | | We pay well above average in equity based compensation |
| • | | Goal = create real value for shareholders, net of management’s share |
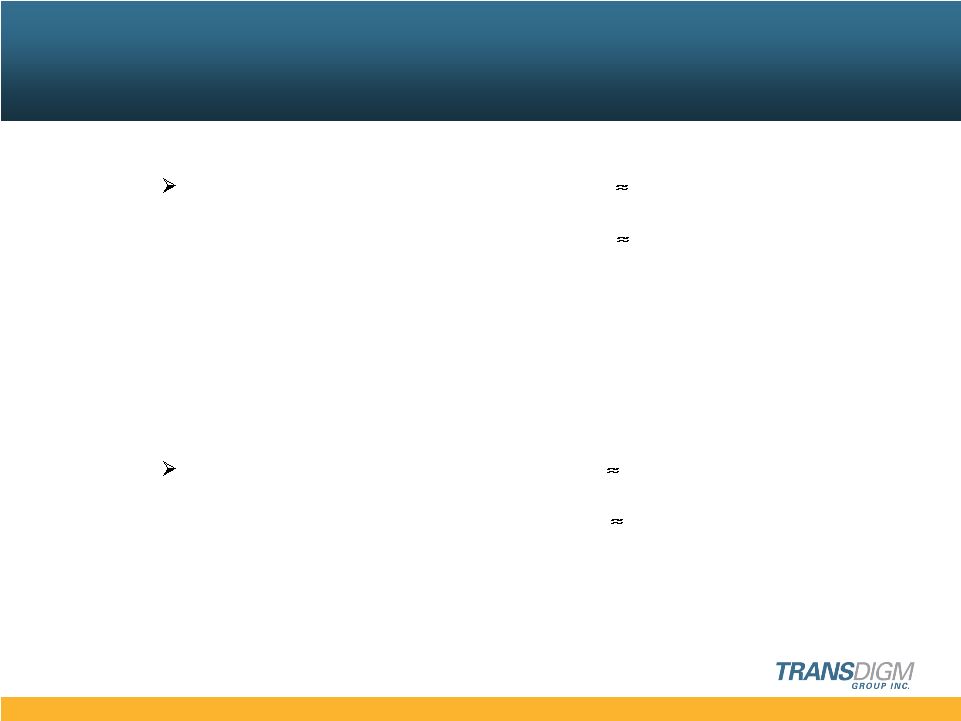
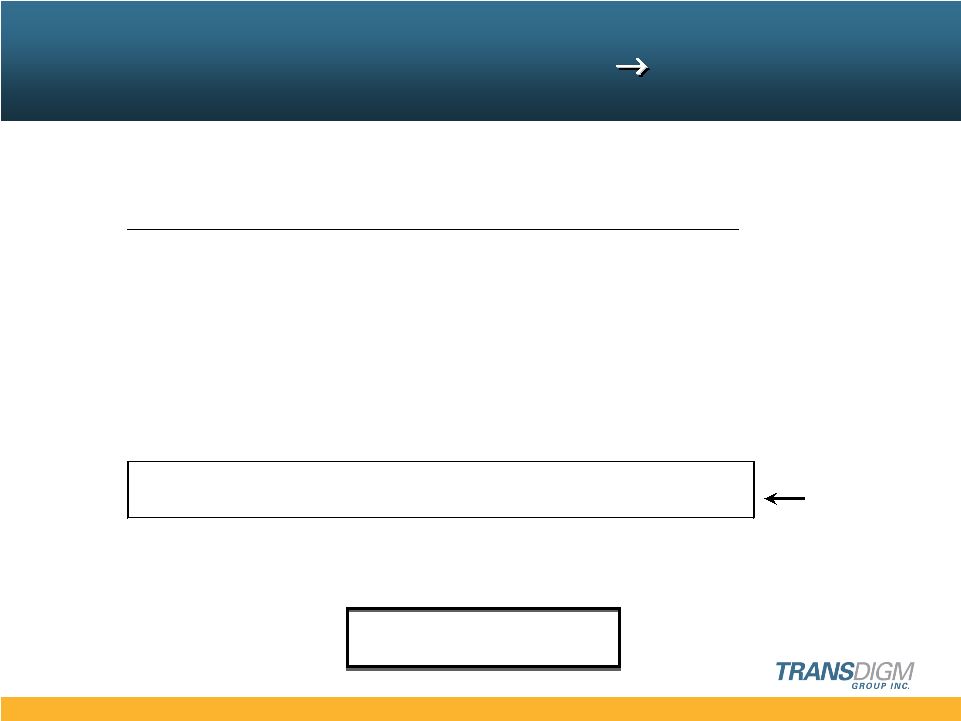
3 Key Managers Aligned with Shareholders Key Managers Aligned with Shareholders Key Managers Aligned with Shareholders Value Generating Activities |
We want to maintain our clear management alignment with shareholders
A. 3 Value Drivers
1. Price
2. Productivity
3. New Business
B.Maintain Efficient Capitalstructure
C. Make Accretive Acquisitions
| • | | Very difficult to get this day to day focus on “details of value creation” withoutreal ownership |
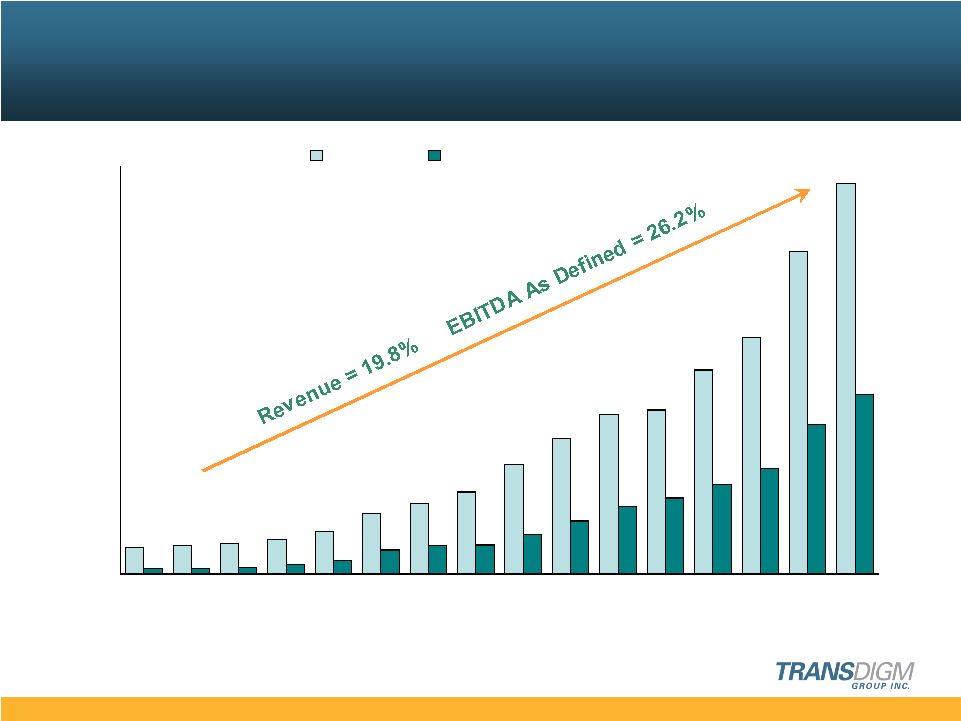
4 Proven Record of Growth and Margin Expansion ($ in millions) % of Sales 20% 19% 23% 27% 31% 39% 39% 36% 36% 39% 42% 46% 44% 45% 46% (1) (1) EBITDA As Defined is a non-GAAP financial measure presented here as supplemental disclosures to net income. For a presentation of the most directly comparable GAAP measure and a reconciliation of EBITDA As Defined, please see appendix. (2) Midpoint of May 6, 2008 guidance (including CEF Industries). (2) $48 $10 $52 $10 $57 $13 $63 $17 $78 $25 $111 $44 $131 $51 $151 $54 $201 $72 $249 $98 $293 $124 $301 $139 $374 $164 $435 $194 $593 $275 $717 $329 $0 $150 $300 $450 $600 $750 '93 '94 '95 '96 '97 '98 '99 '00 '01 '02 '03 '04 '05 '06 '07 '08 (F) Revenue EBITDA As Defined |
| • | | This has worked for us – look at history of company |
| • | | Thru good and bad markets the company has been able to consistently improve |
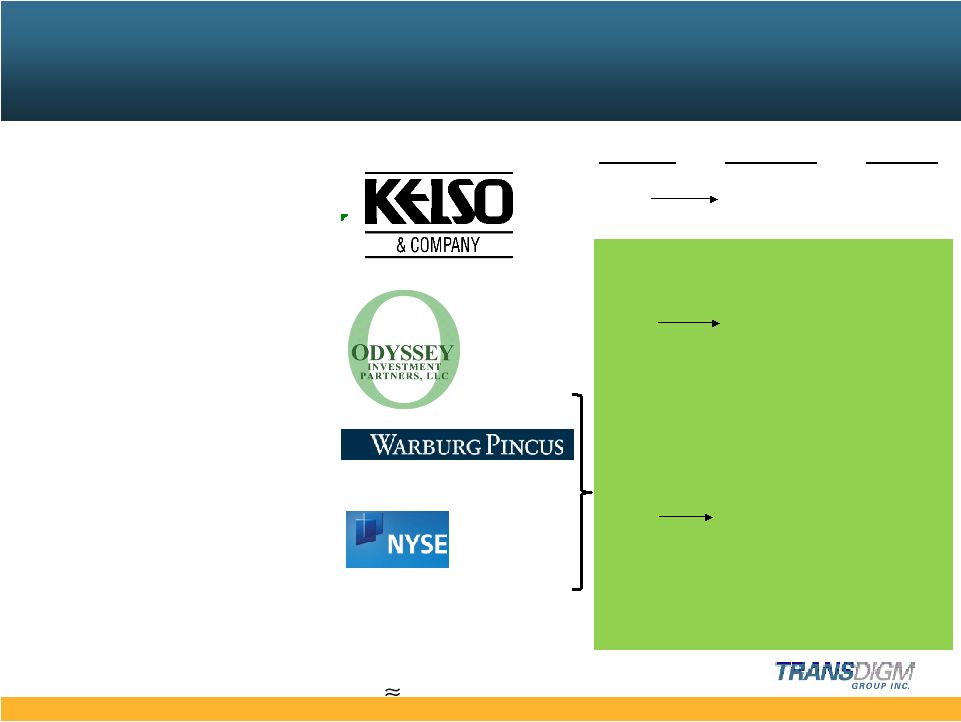
5 Equity In Equity Out Multiple Formation 1993 $25M $347M 13.9x to 1998 (1) Equity Recap 1998 $100M $503M 5.0x to 2003 Equity Recap 2003 Leveraged Dividend 2005 $471M $2,138M (2) 4.5x IPO 2006 Secondary Offering 2007 Consistent Growth in Equity Value Consistent Growth in Equity Value Consistent Growth in Equity Value (1) Approximately 90% of Kelso ownership sold in 1998, balance cashed out in 2003. (2) Assumes Warburg Pincus maintained 100% ownership of 43.6 million shares valued at a stock price of $43 plus repayment of shareholder notes including interest of $263 million. |
(% of total shares) (1) 1993 New Awards 15% 1998 Rollover 10% Recap New Awards 12% Total 22% 2003 Rollover 7% Recap New Awards 10% Total 17% 2008 Rollover 8% New Plan New Awards 7% Total 15% 6 Management Ownership / Options Management Ownership / Options Management Ownership / Options Historical Pattern (1) Calculated on a fully diluted basis. |
7 Unique Performance Based Option Plan Unique Performance Based Option Plan Unique Performance Based Option Plan Public Private Equity Equity Current Historical Proposal Time Based 20% 20% Operating Performance (1) 80% 40% Market Performance --- 40% 100% 100% (1) Includes annual and 5 year targets. |
| • | | Performance based plans are common in private equity butunusual in public equity |
| • | | We are trying to make this look like a private equity plan |
| • | | Minimal time vesting » 20% only / 5 years |
| • | | Highly performance driven |
40% — based on operating performance to support 20% IRR
40% — based on stock market growth of 20% IRR
8 Vest Criteria – Meet Targets After Dilution for Options to Vest Vest Criteria – Vest Criteria – Meet Targets After Dilution for Options to Vest Meet Targets After Dilution for Options to Vest Definitions Operating (EBITDA As Defined x multiple) - net debt) / diluted shares Performance Market Performance Share price gain & Dividend Required Growth Less than 12.5% per year = No performance vesting Greater than 12.5% per year = Partial performance vesting 20% per year & greater = Full vesting After Dilution |
9 “Skin in The Game” “Skin in The Game” “Skin in The Game” Minimum Rollover Investment Required $35 Million * Top 5 Officers $25 Million Years of base compensation 14 years Minimum hold for 30% of new awards $35 Million Top 5 Officers $18 Million * @ $40/share |
10 Net Result – Shareholders Make Superior Return Management Share Increases Net Result – Net Result – Shareholders Make Superior Return Shareholders Make Superior Return Management Share Increases Management Share Increases IRR (1) Gain In Mkt.Cap. Mgmt. $ Mgmt. % of Gain 10.0% 1,465 $ 16 $ 1.1% 12.5% 1,865 $ 42 $ 2.3% 15.0% 2,300 $ 80 $ 3.5% 20.0% 3,300 $ 197 $ 6.0% 25.0% 4,500 $ 275 $ 6.1% (1) After management share (Dollars in Millions) Example based on 2008 estimate IRR = After Dilution |
| • | | Net resultggraduated sharing |
| • | | IRR isafter management take |
| • | | Highly incentivized to increase equity value |
# of Options Previously Authorized 2.6 Million Newly Authorized + 1.2 Total Per Program 3.8 Miscellaneous + 0.3 4.1 Million 11 New Authorization 1.5 Million Options New Authorization 1.5 Million Options New Authorization 1.5 Million Options New Authorization of 1.5 Million Shares ISS Will Not Recommend |
12 New Plan EPS Impact New Plan EPS Impact New Plan EPS Impact Peer (1) 2008 2009 2013 2009 2013 Average Est. 12.5% IRR 12.5% IRR 20% IRR 20% IRR EPS Diluted 2.31 $ 2.72 $ 3.06 $ 4.90 $ 3.26 $ 6.77 $ Option Expense (Per Share) 0.10 $ 0.06 $ 0.05 $ 0.08 $ 0.08 $ 0.12 $ % of EPS Diluted 4.4% 2.2% 1.6% 1.6% 2.5% 1.8% (1) Peer group includes Goodrich, Rockwell Collins, BE Aerospace, Hexcel, Triumph, Woodward-Governor, Curtis Wright, Esterline & Precision Cast Parts |
| • | | Impact on eps is less than peers & roughly in line with current TDG level |
Pay for Value Creation Pay for Value Creation Pay for Value Creation |
14 Appendix Reconciliation of Net Income to EBITDA As Defined (in millions) 1994 1995 1996 1997 1998 1999 2000 2001 2002 2003 2004 2005 2006 2007 Net Income ($5) $0 $1 $3 $14 ($17) $11 $14 $31 ($76) $14 $35 $25 $89 Depreciation and amortization 7 7 7 6 7 6 7 9 13 10 18 17 16 24 Interest expense, net 5 5 5 3 3 23 28 32 37 43 75 80 77 92 Income tax provision (2) - 2 5 13 (2) 8 9 17 (45) 6 23 16 53 Warrant put value adjustment 1 1 2 5 7 - - - - - - - - - Extraordinary item - - - 2 - - - - - - - - - - EBITDA 6 13 17 24 44 10 54 64 98 (68) 113 155 134 258 Merger expense - - - - - 40 - - - 176 - - - - Acquisition-related costs 4 - - 1 - 1 - 8 - 15 20 2 1 9 Non-cash compensation and deferred compensation costs - - - - - - - - - 1 6 7 1 6 One-time special bonus - - - - - - - - - - - - 6 - Public offering costs - - - - - - - - - - - - 3 2 Refinancing costs - - - - - - - - - - - - 49 - EBITDA As Defined $10 $13 $17 $25 $44 $51 $54 $72 $98 $124 $139 $164 $194 $275 |