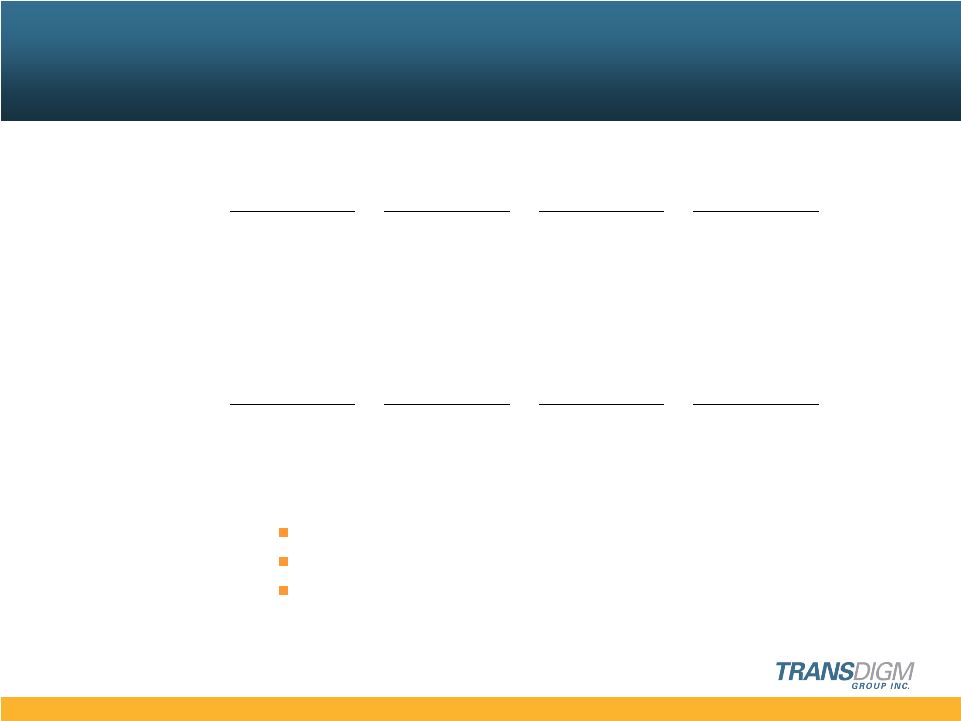
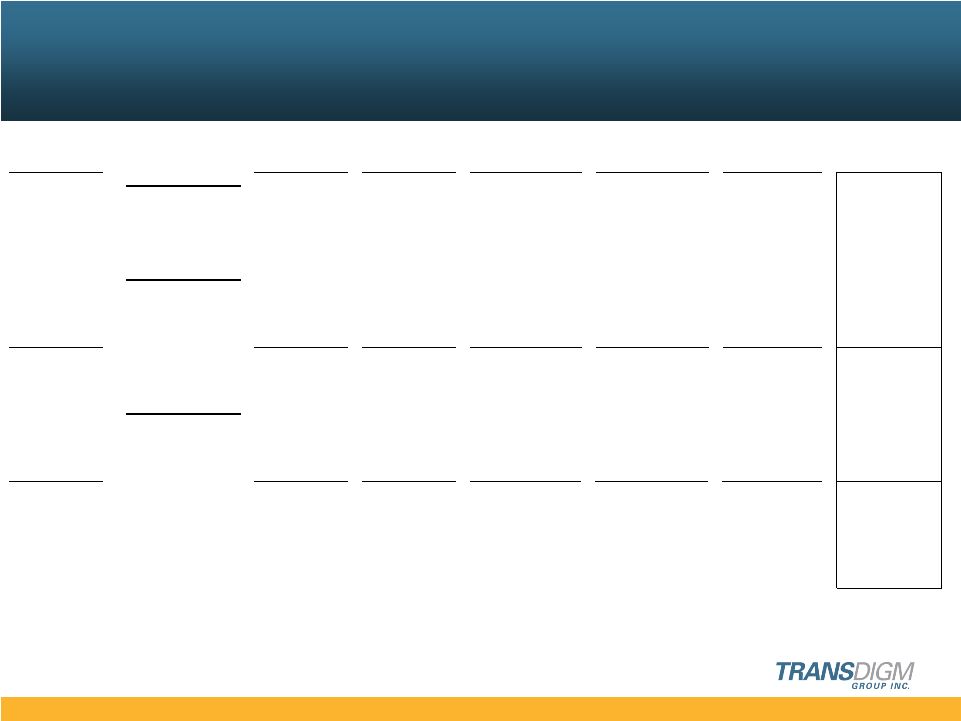
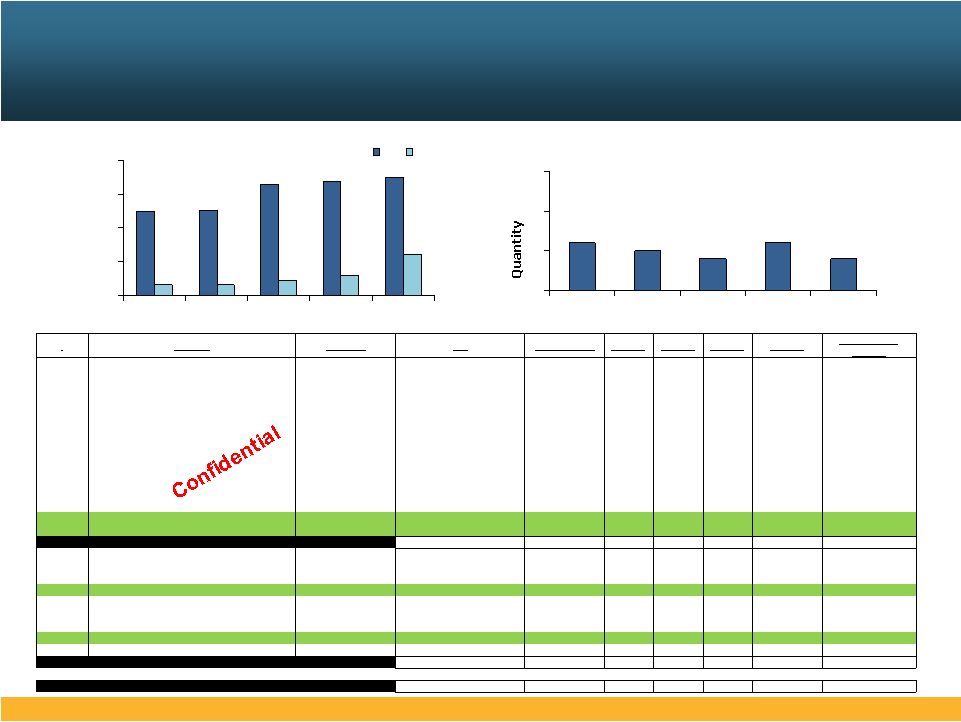
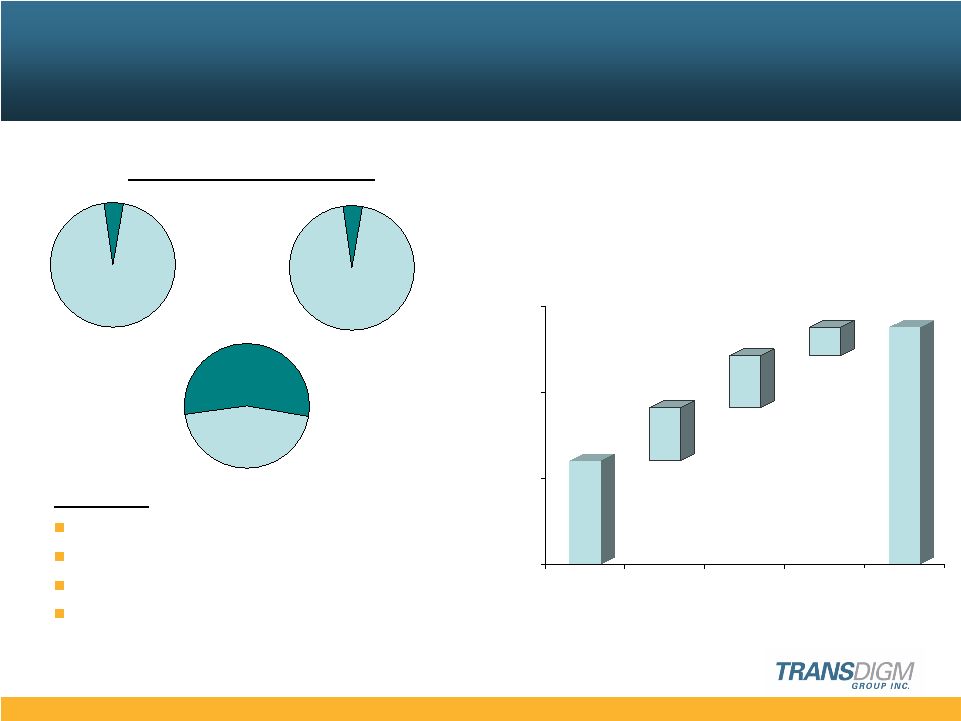
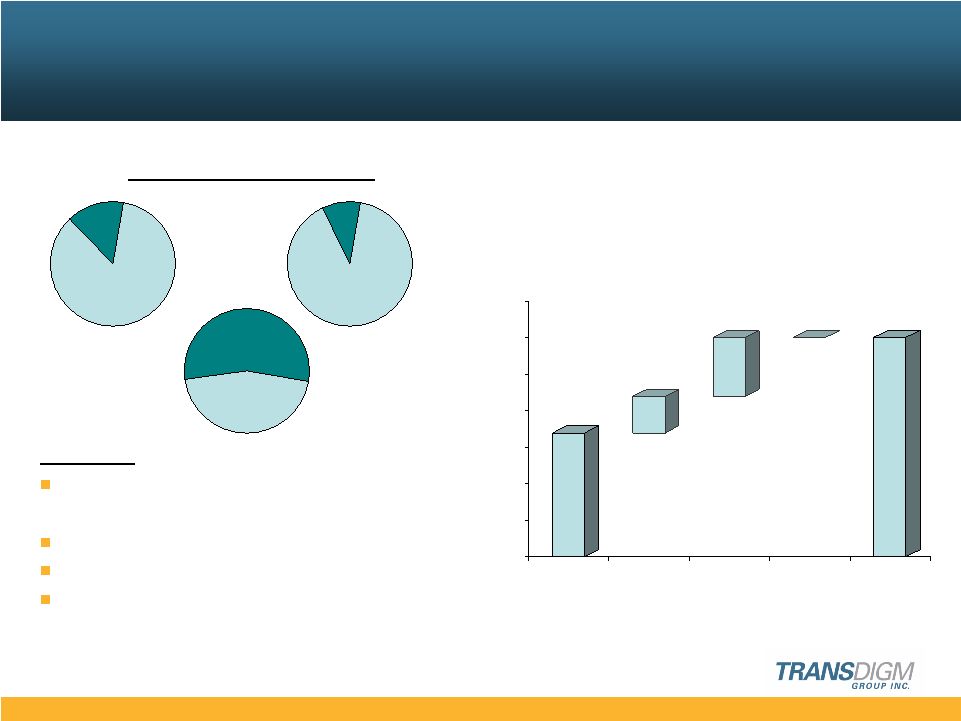
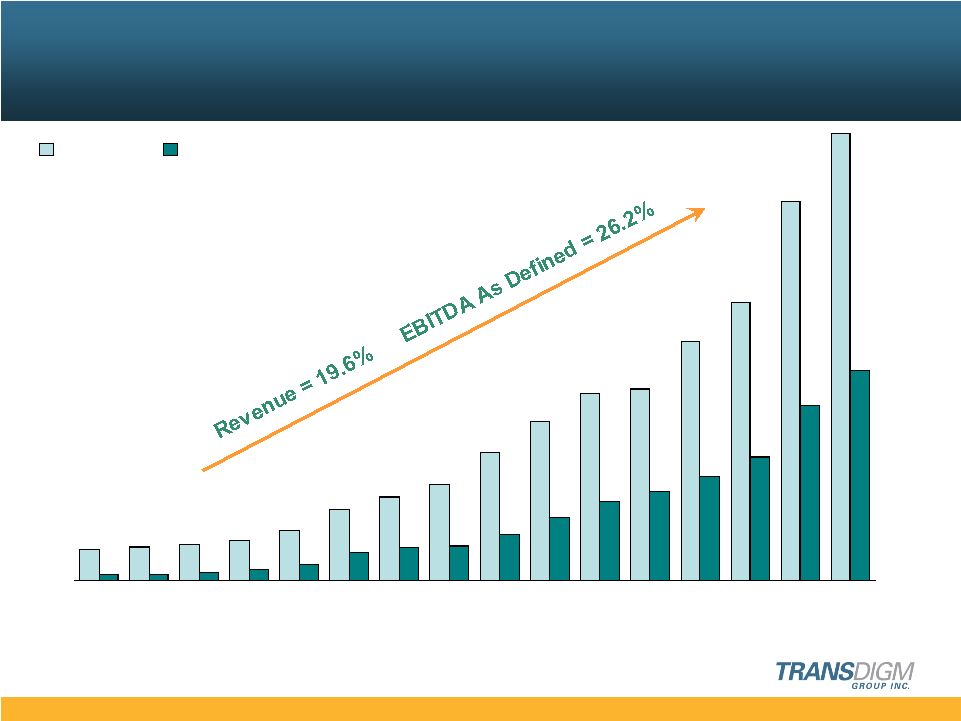
Product Line Income Statement FY 2007 % to Q1 08 % to Q2 08 % to Q3 08 % to Q4 08 % to YTD Fcst % to YTD Plan % to Actual Sls Actual Sls Actual Sls Fcst Sls Fcst Sls Through Q3 Sls Through Q3 Sls Top Line Activity: 1,172 3.3% New Biz Bookings 372 4.6% 307 3.1% 480 4.8% 195 1.8% 1,159 4.1% 639 2.5% 38,648 109.8% Total Bookings 7,529 92.6% 13,081 131.4% 10,218 102.0% 10,619 99.4% 30,828 109.7% 27,832 107.2% 35,195 100.0% Sales 8,133 100.0% 9,957 100.0% 10,019 100.0% 10,678 100.0% 28,109 100.0% 25,974 100.0% Product Costs: 8,696 24.7% Material 2,049 25.2% 2,408 24.2% 2,584 25.8% 2,791 26.1% 7,041 25.0% 6,692 25.8% 2,678 7.6% Direct Labor 659 8.1% 770 7.7% 830 8.3% 850 8.0% 2,259 8.0% 1,924 7.4% 6,667 18.9% Overhead 1,349 16.6% 2,005 20.1% 2,047 20.4% 2,068 19.4% 5,401 19.2% 4,868 18.7% 928 2.6% Depreciation 219 2.7% 216 2.2% 215 2.1% 220 2.1% 650 2.3% 628 2.4% - 0.0% Other - 0.0% - 0.0% - 0.0% - 0.0% - 0.0% - 0.0% 18,969 53.9% Total Product Costs 4,276 52.6% 5,399 54.2% 5,676 56.7% 5,929 55.5% 15,351 54.6% 14,112 54.3% 16,226 46.1% Gross Profit 3,857 47.4% 4,558 45.8% 4,343 43.3% 4,749 44.5% 12,758 45.4% 11,862 45.7% G&A Costs: 60 0.2% Engineering 15 0.2% 15 0.2% 16 0.2% 16 0.1% 46 0.2% 48 0.2% 649 1.8% Sales 184 2.3% 177 1.8% 188 1.9% 188 1.8% 549 2.0% 562 2.2% 1,213 3.4% Admin 216 2.7% 203 2.0% 218 2.2% 222 2.1% 637 2.3% 641 2.5% (41) -0.1% Other (2) 0.0% 2 0.0% - 0.0% - 0.0% - 0.0% - 0.0% 64 0.2% Depreciation 16 0.2% 17 0.2% 17 0.2% 17 0.2% 50 0.2% 20 0.1% 1,945 5.5% Total G&A Costs 429 5.3% 414 4.2% 439 4.4% 443 4.1% 1,282 4.6% 1,271 4.9% 14,281 40.6% Product Line EBIT 3,428 42.1% 4,144 41.6% 3,904 39.0% 4,306 40.3% 11,476 40.8% 10,591 40.8% 15,273 43.4% Product Line EBITDA 3,663 45.0% 4,377 44.0% 4,136 41.3% 4,543 42.5% 12,176 43.3% 11,239 43.3% 1,874 5.3% Ttl Sales & Eng. Exp. 523 6.4% 586 5.9% 646 6.4% 646 6.0% 1,755 6.2% 1,816 7.0% 8,933 Ending 90day backlog 9,601 9,269 10,050 110% % to Nxt Qtr Sls 96% 93% 94% SAMPLE 32 |
