UNITED STATES
SECURITIES AND EXCHANGE COMMISSION
Washington, D.C. 20549
FORM N-CSR
CERTIFIED SHAREHOLDER REPORT OF REGISTERED
MANAGEMENT INVESTMENT COMPANIES
| Investment Company Act file number | 811-21417 | |||||||||||||||
| AllianzGI Dividend, Interest & Premium Strategy Fund | ||||||||||||||||
| (Exact name of registrant as specified in charter) | ||||||||||||||||
| 1633 Broadway, New York, New York | 10019 | |||||||||||||||
| (Address of principal executive offices) | (Zip code) | |||||||||||||||
| Scott Whisten – 1633 Broadway, New York, New York 10019 | ||||||||||||||||
| (Name and address of agent for service) | ||||||||||||||||
| Registrant’s telephone number, including area code: | 212-739-3367 | |||||||||||||||
| Date of fiscal year end: | January 31 | |||||||||||||||
| Date of reporting period: | July 31, 2020 | |||||||||||||||
ITEM 1. REPORT TO SHAREHOLDERS
AllianzGI Diversified Income & Convertible Fund
AllianzGI Dividend, Interest & Premium Strategy Fund (formerly AllianzGI NFJ Dividend, Interest & Premium Strategy Fund)
AllianzGI Equity & Convertible Income Fund
Semi-Annual Report
July 31, 2020
Beginning on January 1, 2021, as permitted by regulations adopted by the U.S. Securities and Exchange Commission, paper copies of shareholder reports will no longer be sent by mail, unless you specifically request paper copies of the reports. Instead, the reports will be made available on the Funds' website (us.allianzgi.com), and you will be notified by mail each time a report is posted and provided with a website link to access the report.
If you already elected to receive shareholder reports electronically, you will not be affected by this change and you need not take any action. You may elect to receive shareholder reports and other communications from a Fund electronically anytime by contacting your financial intermediary (such as a broker-dealer or bank) or, if you are a direct investor, by enrolling at us.allianzgi.com/edelivery.
If you prefer to receive paper copies of your shareholder reports after January 1, 2021, direct investors may inform a Fund at any time. If you invest through a financial intermediary, you should contact your financial intermediary directly. Paper copies are provided free of charge and your election to receive reports in paper will apply to all funds held with the fund complex if you invest directly with a Fund or all funds held in your account if you invest through your financial intermediary.


Table of Contents
2–3 | Letter from the President | ||||||||||
4–9 | Fund Insights | ||||||||||
10–12 | Performance & Statistics | ||||||||||
| 13–52 | Schedules of Investments | ||||||||||
| 53 | Statements of Assets and Liabilities | ||||||||||
| 54 | Statements of Operations | ||||||||||
| 55–56 | Statements of Changes in Net Assets | ||||||||||
| 57 | Statement of Cash Flows | ||||||||||
| 58–60 | Financial Highlights | ||||||||||
| 61–79 | Notes to Financial Statements | ||||||||||
| 80 | Annual Shareholder Meeting Results | ||||||||||
| 81 | Proxy Voting Policies & Procedures | ||||||||||
| 82–90 | Matters Relating to the Trustees' Consideration of the Investment Management Agreements | ||||||||||
| 91–94 | Privacy Policy | ||||||||||
July 31, 2020 | Semi-Annual Report 1
Letter from the President

Thomas J. Fuccillo
President & Chief
Executive Officer
Dear Shareholder:
The COVID-19 pandemic severely impacted the global economy during the six-month fiscal reporting period ended July 31, 2020. Economic growth in the US and overseas contracted as countries instituted lockdown orders in an attempt to contain the novel coronavirus. Over this period, global equities generated mixed results. Elsewhere, the overall US bond market posted positive results.
For the six-month reporting period ended July 31, 2020
n AllianzGI Diversified Income & Convertible Fund gained 15.97% on net asset value ("NAV") and rose 5.52% on market price.
n AllianzGI Dividend, Interest & Premium Strategy Fund returned -1.32% on NAV and -4.17% on market price.
n AllianzGI Equity & Convertible Income Fund returned 10.80% on NAV and returned 9.71% on market price.
During the six months ended July 31, 2020, the Russell 3000 Index, a broad measure of US stock market performance, returned 2.12%; the Russell 1000 Value Index, a measure of large-cap value-style stocks, returned -11.03%; and the Russell 1000 Growth Index, a measure of growth style stocks, gained 15.68%. Convertible securities, as reflected by the ICE BofA US Convertible Index, returned 11.88%.
Turning to the US economy, gross domestic product ("GDP"), the value of goods and services produced in the country, the broadest measure of economic activity and the principal indicator of economic performance, expanded at a revised 2.4% annual pace during the fourth quarter of 2019. COVID-19 pandemic then started to take its toll on the economy during the first quarter of 2020, resulting in a precipitous decline in GDP growth, to -5.0%, which at that time was the sharpest quarterly decline since the fourth quarter of 2008. The US Department of Commerce's initial estimate of second quarter annualized GDP growth of -32.9%, was the steepest decline on record.
The US Federal Reserve ("Fed") took a number of aggressive actions in an attempt to support the economy and keep the market functioning properly in the wake of the spreading novel coronavirus. On March 3, 2020, the Fed lowered the federal funds rate to a range between 1.00% and 1.25%, and on March 15, the federal funds rate was further reduced to a range between 0.00% and 0.25%. Then, on March 23, the Fed said it was "committed" to its full range of tools to support the US economy in this challenging time and thereby promote its maximum employment and price stability goals." Among its actions, the Fed announced that it would make unlimited purchases of US Treasury and mortgage securities. Meanwhile, also in March 2020, the U.S.
2 Semi-Annual Report | July 31, 2020
government passed a $2 trillion fiscal stimulus bill to aid the economy. Finally, on June 15, 2020, the Fed announced it would purchase existing corporate bonds on the open market.
Outlook
Since the market low on March 23, 2020, risk assets have rebounded impressively. While this year's US equity rally was mostly dominated by sectors well-positioned to capitalize on or be bolstered by certain of the circumstances caused by the COVID-19 pandemic (e.g., technology and healthcare), we have seen a broadening of leadership since mid-May: cyclical sectors such as industrials, financials and energy have performed well. We continue to believe in the reopening story broadly, and we see a slow march toward normalization in the US economy – perhaps punctuated by the arrival of a viable vaccine. Against this backdrop, we believe a "barbell" approach to risk would be prudent: focus on cyclical sectors during the reopening phase, while considering adding tactical exposure to secular growth themes over time. In our view, investors should expect natural periods of consolidation in the coming months and be mindful of looming risks – from a second wave of coronavirus infections to the outcome of the US presidential election in November. Finally, as we reemerge from this crisis, we believe it remains critical to make active bets and reposition for a post-COVID-19 world.
As announced on July 7, 2020, Allianz Global Investors plans to enter into a strategic partnership with Virtus Investment Partners. If approved by shareholders of the Funds, affiliates of Virtus will assume the role of investment adviser and administrator of the Funds. On behalf of Allianz Global Investors, it was our honor to have served your Funds and look forward to continuing to do so as sub-adviser.
On behalf of Allianz Global Investors U.S. LLC, the Funds' investment adviser, thank you for investing with us. We encourage you to consult with your financial advisor and to visit our website, us.allianzgi.com/closedendfunds, for additional information. We remain dedicated to serving your investment needs.
Sincerely,

Thomas J. Fuccillo
President & Chief Executive Officer
Receive this report electronically and eliminate paper mailings.
To enroll, visit: us.allianzgi.com/edelivery.
July 31, 2020 | Semi-Annual Report 3
Fund Insights
AllianzGI Diversified Income & Convertible Fund/
AllianzGI Dividend, Interest & Premium Strategy Fund*/
AllianzGI Equity & Convertible Income Fund
July 31, 2020 (unaudited)
AllianzGI Diversified Income & Convertible Fund
For the period of February 1, 2020 through July 31, 2020, as provided by Douglas G. Forsyth, CFA, Portfolio Manager.
For the six-month period ended July 31, 2020, the AllianzGI Diversified Income & Convertible Fund (the "Fund") returned 15.97% on net asset value ("NAV") and 5.52% on market price.
During the reporting period, the Russell 1000 Growth Index, a measure of growth-style stocks, returned 15.68%; convertible securities, as reflected by the ICE BofA US Convertible Index returned 11.88%; and high yield bonds, as reflected by the ICE BofA High Yield Master II Index, returned -0.23%.
Market Environment
Despite historic volatility, equities and convertible securities gained and high-yield bonds finished only modestly lower over the six-month reporting period.
Risk assets sold off aggressively in late February 2020 and throughout much of March 2020 as the virus outbreak intensified and the short-term trajectory of the global economy and corporate profitability became highly uncertain. Coinciding with
unprecedented monetary and fiscal policy responses, equities, convertible securities and high-yield bonds rebounded sharply off the March 2020 low and continued to advance over the remainder of period. A number of other factors had a positive impact on markets including stabilizing investor confidence, dovish US Federal Reserve ("Fed") commentary, improving economic data, better-than-feared corporate earnings and vaccine optimism.
The Fed's response was designed to ensure the normal functioning and stabilization of US credit markets. It was also extraordinary in terms of its swiftness, scope, and willingness to do more. Throughout the reporting period, Chair Powell reiterated the Fed's commitment to supporting the US economy.
The fiscal response was also immediate with President Trump signing into law several bills including the $2.2 trillion Coronavirus Aid, Relief & Security Act. To further support the economy, Congress was in the process of negotiating a fourth stimulus package heading into period-end.
As anticipated, the economy decelerated and the unemployment rate surged. However, economic data released over the remainder of the reporting period improved as lockdowns, travel restrictions and social-distancing measures eased.
* Effective on April 30, 2020 the AllianzGI NFJ Dividend, Interest & Premium Strategy Fund (NFJ) changed its name to the AllianzGI Dividend, Interest & Premium Strategy Fund (NFJ).
4 Semi-Annual Report | July 31, 2020
Fund Insights
AllianzGI Diversified Income & Convertible Fund/
AllianzGI Dividend, Interest & Premium Strategy Fund/
AllianzGI Equity & Convertible Income Fund
July 31, 2020 (unaudited) (continued)
A weak first-quarter earnings season was followed by better-than-feared second-quarter results and management outlooks.
Portfolio Specifics
The Fund benefited from exposure to equities, convertible securities and high-yield bonds. In addition to providing a positive total return, the Fund also delivered a high level of income over the reporting period.
Information technology, consumer discretionary and communication services were the top-contributing sectors among equities. Conversely, the energy, industrials and financial sectors detracted.
Outperforming convertible exposure included technology, consumer discretionary and health care, while financials, energy and media underperformed.
Among high-yield holdings, industries exhibiting strength included technology & electronics, automotive and cable & satellite television. In contrast, energy, theaters & entertainment and retail were sources of weakness.
Over the reporting period, many option positions expired below strike and the portfolio was able to retain the set premiums.
Outlook
While uncertainty remains elevated, it appears the visibility around the macro outlook and corporate profitability path have improved.
We believe the extraordinary monetary and fiscal policy measures instituted by the Fed and the US government have begun to stabilize the US economy and financial markets. Furthermore, Fed Chair Jerome Powell and US Treasury Secretary Mnuchin have pledged additional support to accelerate the recovery.
We believe the ongoing monetary and fiscal stimulus in conjunction with a healthy US consumer, the easing of pandemic-related restrictions and the reopening of America should lead to a resumption of expanded economic activity.
With economic progress, it is our belief that corporate profits should begin to trough and then start recovering over the second half of the year and into 2021. We believe US companies are not only positioned to directly benefit from Fed programs and US government fiscal support but also from a potentially significant boost in operating leverage as strengthening demand is met with lower input costs and productivity gains.
Against this backdrop, a number of risks could surface, triggering market volatility including geopolitical tensions, US elections and localized shutdowns due to virus waves and public health concerns.
July 31, 2020 | Semi-Annual Report 5
Fund Insights
AllianzGI Diversified Income & Convertible Fund/
AllianzGI Dividend, Interest & Premium Strategy Fund/
AllianzGI Equity & Convertible Income Fund
July 31, 2020 (unaudited) (continued)
AllianzGI Dividend, Interest & Premium Strategy Fund
For the period of February 1, 2020 through July 31, 2020, as provided by the Value Equity US team.
For the six-month period ended July 31, 2020, the AllianzGI Dividend, Interest & Premium Strategy Fund (the "Fund") returned -1.32% on net asset value ("NAV") and -4.17% on market price.
Market Environment
The 11-year bull market in the US finally ended in the first quarter of 2020. After touching fresh highs in mid-February, US stocks subsequently plunged as the extraordinary measures employed to control COVID-19 raised fears of a severe global recession. The rapidly evolving crisis led to heightened volatility, with US stocks suffering two of the largest one-day falls since 1987 in March, along with the largest daily gain since 2008. Sentiment turned in the second quarter, with a sharp rally helping the S&P 500 Index record its strongest quarterly performance since 1998. US equities continued to rally over July, with the S&P 500 Index touching its highest level since February as earnings surprised on the upside – more than 80% of companies that reported in July announcing better-than-expected earnings. Despite historic volatility, convertible securities gained over the six-month reporting period, with the ICE BofA
US Convertible Index up 16.10% as convertible securities benefited from strong underlying equity performance and credit spread tightening.
As the COVID-19 crisis gathered pace in the US, in March 2020 the US Federal Reserve ("Fed") announced two emergency rate cuts, taking the federal funds rate to virtually zero. The US central bank also extended the size of its asset-purchase program and announced the scope would be widened to include corporate bonds. Fed chair Jay Powell dispelled speculation of a V-shaped recovery, warning that the US faced a long path to recovery with unemployment remaining well above pre-COVID levels for the next two years at least. As a result, the Fed pledged to keep interest rates near zero until the end of 2022.
Within the Russell 1000 Value Index, just three of the eleven GICS economic sectors – materials, health care and consumer staples – delivered positive absolute returns. In contrast, the energy, financials, real estate investment trusts ("REITs"), industrials and utilities sectors recorded double-digit negative returns over the trailing sixth-month period ending July 31, 2020.
Portfolio Specifics
The Fund benefited from its exposure to convertible securities.
In the convertible sleeve, sectors that contributed positively to performance
6 Semi-Annual Report | July 31, 2020
Fund Insights
AllianzGI Diversified Income & Convertible Fund/
AllianzGI Dividend, Interest & Premium Strategy Fund/
AllianzGI Equity & Convertible Income Fund
July 31, 2020 (unaudited) (continued)
included technology, consumer discretionary and health care. Conversely, energy, financials and utilities underperformed.
In the equities sleeve, selection across the technology, REITs and consumer discretionary sectors contributed while holdings in the health care, materials and consumer staples sectors detracted from performance. From an allocation perspective, an underweight in financials and overweight in technology benefited returns. These positive allocations were only somewhat offset by underweight exposures in consumer staples and communication services that dampened relative results over the reporting period.
In the options sleeve, many option positions expired below strike and the portfolio was able to retain the set premiums.
Outlook
The US economy entered a recession during the beginning of the second quarter. It may have already exited, according to the technical definition. The recovery may have started out looking like a "V", but it has since flattened out below peak levels. Retail sales and industrial production, after falling by the most in at least 100 years, have bounced back, but to still-unhealthy levels. There has been severe damage to employment, particularly among small businesses and concentrated in certain
industries (leisure/hospitality, transportation, oil & gas), that may take a long time to recover from a workforce perspective. Going forward, people may remain hesitant to go out in large groups and risk aversion remains high. Many doctors project a return of the virus in the fall, the uncertainty around which could also keep consumer and business spending in check. However, the extraordinary stimulus could become a tailwind once the peak has passed. In the longer term, we may find growth on an even lower trajectory than existed prior to the virus due to deglobalization of supply chains, which will likely slow down productivity growth and hurt corporate profitability.
Our team understands the importance of efficiently reacting to the ever-changing market in order to capitalize on opportunities and add strength and quality in our portfolios. We believe a focus on what we determine to be higher-quality companies that pay a dividend within an attractive price-value framework offers many compelling characteristics, from less volatility with income to the potential to protect against inflation via dividend growth. As active managers committed to researching fundamentals and evaluating a company's prospects, we believe this approach will become critical in the current environment for clients seeking strong absolute returns and moderated volatility over the long term.
July 31, 2020 | Semi-Annual Report 7
Fund Insights
AllianzGI Diversified Income & Convertible Fund/
AllianzGI Dividend, Interest & Premium Strategy Fund/
AllianzGI Equity & Convertible Income Fund
July 31, 2020 (unaudited) (continued)
AllianzGI Equity & Convertible Income Fund
For the period of February 1, 2020 through July 31, 2020, as provided by Douglas G. Forsyth, CFA, Portfolio Manager.
For the six-month period ended July 31, 2020, the AllianzGI Equity & Convertible Income Fund (the "Fund") returned 10.80% on net asset value ("NAV") and 9.71% on market price.
Market Environment
Despite historic volatility, equities and convertible securities gained over the six-month reporting period.
Risk assets sold off aggressively in late February 2020 and throughout much of March 2020, as the virus outbreak intensified and the short-term trajectory of the global economy and corporate profitability became highly uncertain. Coinciding with unprecedented monetary and fiscal policy responses, equities and convertible securities rebounded sharply off the March 2020 low and continued to advance over the remainder of period. A number of other factors had positive impacts on markets including stabilizing investor confidence, dovish US Federal Reserve ("Fed") commentary, improving economic data, better-than-feared corporate earnings and vaccine optimism.
The Fed's response was designed to ensure the normal functioning and stabilization of US credit markets. It was also extraordinary in terms of its swiftness, scope, and willingness to do more. Throughout the reporting period Fed Chair Jerome Powell reiterated the Fed's commitment to supporting the US economy and implied that rates would remain low for a prolonged period of time.
The fiscal response was also immediate with President Trump signing into law several bills, including the $2.2 trillion Coronavirus Aid, Relief & Security Act. To further support the economy, Congress was in the process of negotiating a fourth stimulus package heading into period-end.
As anticipated, the economy decelerated and the unemployment rate surged. However, economic data released over the remainder of the reporting period improved as lockdowns, travel restrictions and social-distancing measures eased.
A weak first-quarter earnings season was followed by better-than-feared second-quarter results and management outlooks.
Portfolio Specifics
The Fund benefited from exposure to both equities and convertible securities. In addition to providing a positive total return, the Fund also delivered a high level of income over the reporting period.
8 Semi-Annual Report | July 31, 2020
Fund Insights
AllianzGI Diversified Income & Convertible Fund/
AllianzGI Dividend, Interest & Premium Strategy Fund/
AllianzGI Equity & Convertible Income Fund
July 31, 2020 (unaudited) (continued)
Information technology, consumer discretionary and communication services were the top-contributing sectors among equities. Conversely, the industrials, energy and financial sectors detracted.
Outperforming convertible exposure included technology, consumer discretionary and health care, while energy, financials and utilities underperformed.
Over the reporting period, many option positions expired below strike and the portfolio was able to retain the set premiums.
Outlook
While uncertainty remains elevated, it appears the visibility around the macro outlook and corporate profitability path have improved.
We believe the extraordinary monetary and fiscal policy measures instituted by the Fed and the US government have begun to stabilize the US economy and financial markets. Furthermore, Fed Chair Jerome Powell and US Treasury Secretary Mnuchin have pledged additional support to accelerate the recovery.
We believe the ongoing monetary and fiscal stimulus in conjunction with a healthy US consumer, the easing of pandemic-related restrictions and the reopening of America should lead to a resumption of expanded economic activity.
With economic progress, it is our belief that corporate profits should begin to trough and then start recovering over the second half of the year and into 2021. We believe US companies are not only positioned to directly benefit from Fed programs and US government fiscal support but also from a potentially significant boost in operating leverage as strengthening demand is met with lower input costs and productivity gains.
Against this backdrop, a number of risks could surface triggering market volatility, including geopolitical tensions, US elections and localized shutdowns due to virus waves and public health concerns.
July 31, 2020 | Semi-Annual Report 9
Performance and Statistics
AllianzGI Diversified Income & Convertible Fund
July 31, 2020 (unaudited)
Total Return(1) | Market Price | NAV | |||||||||
Six Months | 5.52 | % | 15.97 | % | |||||||
| 1 Year | 18.25 | % | 26.19 | % | |||||||
| 5 Year | 14.38 | % | 13.20 | % | |||||||
Commencement of Operations (5/27/15) to 7/31/20 | 10.19 | % | 12.34 | % | |||||||
Market Price/NAV Performance
Commencement of Operations (5/27/15) to 7/31/20

Market Price/NAV
Market Price | $ | 25.42 | |||||
NAV(2) | $ | 27.58 | |||||
Discount to NAV | -7.83 | % | |||||
Market Price Yield(3) | 7.88 | % | |||||
Leverage Ratio(4) | 26.89 | % | |||||
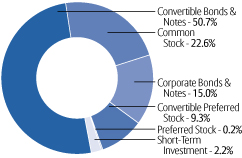
Investment Allocation
(as a % of total investments, before call options written)
(1) Past performance is no guarantee of future results. Total return is calculated by determining the percentage change in NAV or market price (as applicable) in the specified period. The calculation assumes that all dividends and distributions, if any, have been reinvested. Total return does not reflect broker commissions or sales charges in connection with the purchase or sale of Fund shares and includes the effect of any expense reductions, if any. Total return for a period of more than one year represents the average annual total return. Total return for a period of less than one year is not annualized.
Performance at market price will differ from results at NAV. Although market price returns typically reflect investment results over time, during shorter periods returns at market price can also be influenced by factors such as changing views about the Fund, market conditions, supply and demand for the Fund's shares, or changes in the Fund's dividends.
An investment in the Fund involves risk, including the loss of principal. Total return, market price, market price yield and NAV will fluctuate with changes in market conditions. This data is provided for information purposes only and is not intended for trading purposes. Closed-end funds, unlike open-end funds, are not continuously offered. There is a one-time public offering and once issued, shares of closed-end funds are traded in the open market through a stock exchange. NAV is equal to total assets attributable to common shareholders less total liabilities divided by the number of common shares outstanding. Holdings are subject to change daily.
(2) he NAV disclosed in the Fund's financial statements may differ due to accounting principles generally accepted in the United States of America.
(3) Market Price Yield is determined by dividing the annualized current (declared August 1, 2020) monthly dividend per common share (comprised of net investment income and net capital gains, if any) by the market price per common share at July 31, 2020.
(4) Represents Mandatory Redeemable Preferred Shares, Senior Secured Notes and amounts drawn under the short-term margin loan facility ("Leverage") outstanding, as a percentage of total managed assets. Total managed assets refer to total assets (including assets attributable to Leverage) minus liabilities (other than liabilities representing Leverage).
10 Semi-Annual Report | July 31, 2020
Performance & Statistics
AllianzGI Dividend, Interest & Premium Strategy Fund
July 31, 2020 (unaudited)
Total Return(1) | Market Price | NAV | |||||||||
Six Months | -4.17 | % | -1.32 | % | |||||||
| 1 Year | 3.62 | % | 4.33 | % | |||||||
| 5 Year | 4.87 | % | 3.98 | % | |||||||
| 10 Year | 7.50 | % | 6.23 | % | |||||||
Commencement of Operations (2/28/05) to 7/31/20 | 4.09 | % | 4.60 | % | |||||||
Market Price/NAV Performance
Commencement of Operations (2/28/05) to 7/31/20

Market Price/NAV
Market Price | $ | 12.02 | |||||
NAV(2) | $ | 13.64 | |||||
Discount to NAV | -11.88 | % | |||||
Market Price Yield(3) | 1.42 | % | |||||
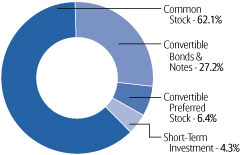
Investment Allocation
(as a % of total investments, before call options written)

(1) Past performance is no guarantee of future results. Total return is calculated by determining the percentage change in NAV or market price (as applicable) in the specified period. The calculation assumes that all dividends and distributions, if any, have been reinvested. Total return does not reflect broker commissions or sales charges in connection with the purchase or sale of Fund shares and includes the effect of any expense reductions, if any. Total return for a period of more than one year represents the average annual total return. Total return for a period of less than one year is not annualized.
Performance at market price will differ from results at NAV. Although market price returns typically reflect investment results over time, during shorter periods returns at market price can also be influenced by factors such as changing views about the Fund, market conditions, supply and demand for the Fund's shares, or changes in the Fund's dividends.
An investment in the Fund involves risk, including the loss of principal. Total return, market price, market price yield and NAV will fluctuate with changes in market conditions. This data is provided for information purposes only and is not intended for trading purposes. Closed-end funds, unlike open-end funds, are not continuously offered. There is a one-time public offering and once issued, shares of closed-end funds are traded in the open market through a stock exchange. NAV is equal to total assets less total liabilities divided by the number of shares outstanding. Holdings are subject to change daily.
(2) The NAV disclosed in the Fund's financial statements may differ due to accounting principles generally
accepted in the United States of America.
(3) Market Price Yield is determined by dividing the annualized current quarterly dividend per share (comprised of net investment income and net capital gains, if any) by the market price per share at July 31, 2020.
July 31, 2020 | Semi-Annual Report 11
Performance and Statistics
AllianzGI Equity & Convertible Income Fund
July 31, 2020 (unaudited)
Total Return(1) | Market Price | NAV | |||||||||
Six Months | 9.71 | % | 10.80 | % | |||||||
| 1 Year | 17.99 | % | 19.57 | % | |||||||
| 5 Year | 12.90 | % | 10.85 | % | |||||||
| 10 Year | 11.82 | % | 11.20 | % | |||||||
Commencement of Operations (2/27/07) to 7/31/20 | 7.80 | % | 8.11 | % | |||||||
Market Price/NAV Performance
Commencement of Operations (2/27/07) to 7/31/20

Market Price/NAV
Market Price | $ | 24.47 | |||||
NAV(2) | $ | 26.68 | |||||
Discount to NAV | -8.28 | % | |||||
Market Price Yield(3) | 6.21 | % | |||||
Investment Allocation
(as a % of total investments, before call options written)
(1) Past performance is no guarantee of future results. Total return is calculated by determining the percentage change in NAV or market price (as applicable) in the specified period. The calculation assumes that all dividends and distributions, if any, have been reinvested. Total return does not reflect broker commissions or sales charges in connection with the purchase or sale of Fund shares and includes the effect of any expense reductions, if any. Total return for a period of more than one year represents the average annual total return. Total return for a period of less than one year is not annualized.
Performance at market price will differ from results at NAV. Although market price returns typically reflect investment results over time, during shorter periods returns at market price can also be influenced by factors such as changing views about the Fund, market conditions, supply and demand for the Fund's shares, or changes in the Fund's dividends.
An investment in the Fund involves risk, including the loss of principal. Total return, market price, market price yield and NAV will fluctuate with changes in market conditions. This data is provided for information purposes only and is not intended for trading purposes. Closed-end funds, unlike open-end funds, are not continuously offered. There is a one-time public offering and once issued, shares of closed-end funds are traded in the open market through a stock exchange. NAV is equal to total assets less total liabilities divided by the number of shares outstanding. Holdings are subject to change daily.
(2) The NAV disclosed in the Fund's financial statements may differ due to accounting principles generally
accepted in the United States of America.
(3) Market Price Yield is determined by dividing the annualized current quarterly dividend per share (comprised of net investment income and net capital gains, if any) by the market price per share at July 31, 2020.
12 Semi-Annual Report | July 31, 2020
Schedule of Investments
AllianzGI Diversified Income & Convertible Fund
July 31, 2020 (unaudited)
| Principal Amount (000s) | Value | ||||||||||
Convertible Bonds & Notes – 69.7% | |||||||||||
Airlines – 1.1% | |||||||||||
$ | 550 | American Airlines Group, Inc., 6.50%, 7/1/25 | $ | 456,790 | |||||||
2,325 | Southwest Airlines Co., 1.25%, 5/1/25 (g) | 2,706,656 | |||||||||
3,163,446 | |||||||||||
Auto Manufacturers – 3.3% | |||||||||||
Tesla, Inc. (g), | |||||||||||
860 | 1.25%, 3/1/21 | 3,421,188 | |||||||||
1,315 | 2.00%, 5/15/24 | 6,080,297 | |||||||||
9,501,485 | |||||||||||
Banks – 1.4% | |||||||||||
1,505 | BofA Finance LLC, 0.125%, 9/1/22 (g) | 1,637,440 | |||||||||
2,030 | JPMorgan Chase Bank N.A., 0.125%, 1/1/23 (a)(b)(g) | 2,415,700 | |||||||||
4,053,140 | |||||||||||
Biotechnology – 4.6% | |||||||||||
2,040 | BioMarin Pharmaceutical, Inc., 0.599%, 8/1/24 (g) | 2,464,996 | |||||||||
2,605 | Exact Sciences Corp., 0.375%, 3/15/27 (g) | 2,875,975 | |||||||||
1,195 | Halozyme Therapeutics, Inc., 1.25%, 12/1/24 (a)(b)(g) | 1,578,894 | |||||||||
1,085 | Insmed, Inc., 1.75%, 1/15/25 (g) | 1,053,084 | |||||||||
470 | Karyopharm Therapeutics Inc., 3.00%, 10/15/25 (g) | 597,944 | |||||||||
980 | Livongo Health, Inc., 0.875%, 6/1/25 (a)(b) | 1,813,612 | |||||||||
1,275 | NeoGenomics, Inc., 1.25%, 5/1/25 | 1,612,875 | |||||||||
PTC Therapeutics, Inc., | |||||||||||
815 | 1.50%, 9/15/26 (a)(b)(g) | 919,976 | |||||||||
110 | 3.00%, 8/15/22 | 123,678 | |||||||||
13,041,034 | |||||||||||
Capital Markets – 0.4% | |||||||||||
1,050 | Colony Capital Operating Co. LLC, 5.75%, 7/15/25 (a)(b) | 1,194,375 | |||||||||
Commercial Services – 2.7% | |||||||||||
930 | 2U, Inc., 2.25%, 5/1/25 (a)(b)(g) | 1,679,107 | |||||||||
1,305 | Chegg, Inc., 0.125%, 3/15/25 (g) | 2,181,315 | |||||||||
Square, Inc. (g), | |||||||||||
1,190 | 0.125%, 3/1/25 (a)(b) | 1,582,971 | |||||||||
1,250 | 0.50%, 5/15/23 | 2,233,385 | |||||||||
7,676,778 | |||||||||||
Computers – 2.1% | |||||||||||
2,215 | Lumentum Holdings, Inc., 0.50%, 12/15/26 (a)(b)(g) | 2,592,461 | |||||||||
1,300 | Varonis Systems, Inc., 1.25%, 8/15/25 (a)(b)(g) | 1,771,754 | |||||||||
1,510 | Zscaler, Inc., 0.125%, 7/1/25 (a)(b)(g) | 1,720,826 | |||||||||
6,085,041 | |||||||||||
Diversified Financial Services – 1.0% | |||||||||||
1,610 | LendingTree, Inc., 0.50%, 7/15/25 (a)(b) | 1,679,375 | |||||||||
1,065 | PRA Group, Inc., 3.50%, 6/1/23 (g) | 1,129,912 | |||||||||
2,809,287 | |||||||||||
July 31, 2020 | Semi-Annual Report 13
Schedule of Investments
AllianzGI Diversified Income & Convertible Fund
July 31, 2020 (unaudited) (continued)
| Principal Amount (000s) | Value | ||||||||||
Electronics – 0.8% | |||||||||||
$ | 1,365 | II-VI, Inc., 0.25%, 9/1/22 | $ | 1,739,204 | |||||||
645 | SMART Global Holdings, Inc., 2.25%, 2/15/26 (a)(b)(g) | 600,307 | |||||||||
2,339,511 | |||||||||||
Energy-Alternate Sources – 0.8% | |||||||||||
1,585 | Enphase Energy, Inc., 0.25%, 3/1/25 (a)(b)(g) | 1,636,536 | |||||||||
415 | Plug Power, Inc., 3.75%, 6/1/25 (a)(b) | 680,371 | |||||||||
2,316,907 | |||||||||||
Entertainment – 0.5% | |||||||||||
865 | Penn National Gaming, Inc., 2.75%, 5/15/26 (g) | 1,432,116 | |||||||||
Equity Real Estate Investment Trusts (REITs) – 0.2% | |||||||||||
350 | IIP Operating Partnership L.P., 3.75%, 2/21/24 (a)(b) | 583,188 | |||||||||
Healthcare-Products – 4.5% | |||||||||||
2,850 | Insulet Corp., 0.375%, 9/1/26 (a)(b)(g) | 3,290,924 | |||||||||
1,375 | NanoString Technologies, Inc., 2.625%, 3/1/25 (a)(b)(g) | 1,423,503 | |||||||||
1,150 | Natera, Inc., 2.25%, 5/1/27 (a)(b) | 1,700,867 | |||||||||
Nevro Corp., | |||||||||||
175 | 1.75%, 6/1/21 | 254,953 | |||||||||
640 | 2.75%, 4/1/25 | 955,200 | |||||||||
2,100 | Repligen Corp., 0.375%, 7/15/24 (g) | 3,063,480 | |||||||||
1,655 | Tandem Diabetes Care, Inc., 1.50%, 5/1/25 (a)(b)(g) | 2,036,286 | |||||||||
12,725,213 | |||||||||||
Healthcare-Services – 1.6% | |||||||||||
135 | Anthem, Inc., 2.75%, 10/15/42 | 514,551 | |||||||||
535 | OPKO Health, Inc., 4.50%, 2/15/25 | 793,401 | |||||||||
2,615 | Teladoc Health, Inc., 1.25%, 6/1/27 (a)(b)(g) | 3,368,432 | |||||||||
4,676,384 | |||||||||||
Home Builders – 0.4% | |||||||||||
945 | Winnebago Industries, Inc., 1.50%, 4/1/25 (a)(b)(g) | 1,101,054 | |||||||||
Internet – 9.7% | |||||||||||
1,370 | Booking Holdings, Inc., 0.75%, 5/1/25 (a)(b)(g) | 1,730,995 | |||||||||
1,575 | Etsy, Inc., 0.125%, 10/1/26 (a)(b)(g) | 2,394,824 | |||||||||
835 | Farfetch Ltd., 3.75%, 5/1/27 (a)(b) | 1,519,324 | |||||||||
1,150 | Limelight Networks, Inc., 3.50%, 8/1/25 (a)(b) | 1,230,025 | |||||||||
2,155 | Match Group Financeco 2, Inc., 0.875%, 6/15/26 (a)(b)(g) | 2,970,949 | |||||||||
Okta, Inc. (a)(b)(g), | |||||||||||
1,435 | 0.125%, 9/1/25 | 1,943,535 | |||||||||
810 | 0.375%, 6/15/26 | 952,415 | |||||||||
Palo Alto Networks, Inc. (g), | |||||||||||
1,475 | 0.75%, 7/1/23 | 1,705,250 | |||||||||
1,745 | 0.375%, 6/1/25 (a)(b) | 1,896,938 | |||||||||
2,445 | Snap, Inc., 0.75%, 8/1/26 (a)(b)(g) | 3,074,587 | |||||||||
1,120 | Wayfair, Inc., 0.375%, 9/1/22 (g) | 2,862,410 | |||||||||
1,515 | Zendesk, Inc., 0.625%, 6/15/25 (a)(b)(g) | 1,714,836 | |||||||||
2,715 | Zillow Group, Inc., 2.75%, 5/15/25 (g) | 3,574,660 | |||||||||
27,570,748 | |||||||||||
14 Semi-Annual Report | July 31, 2020
Schedule of Investments
AllianzGI Diversified Income & Convertible Fund
July 31, 2020 (unaudited) (continued)
| Principal Amount (000s) | Value | ||||||||||
Iron/Steel – 0.3% | |||||||||||
$ | 1,125 | Cleveland-Cliffs, Inc., 1.50%, 1/15/25 (g) | $ | 983,413 | |||||||
Leisure – 1.5% | |||||||||||
NCL Corp., Ltd. (a)(b), | |||||||||||
500 | 5.375%, 8/1/25 | 467,494 | |||||||||
1,355 | 6.00%, 5/15/24 | 1,597,924 | |||||||||
2,345 | Royal Caribbean Cruises Ltd., 4.25%, 6/15/23 (a)(b)(g) | 2,235,616 | |||||||||
4,301,034 | |||||||||||
Leisure Time – 0.6% | |||||||||||
1,310 | Callaway Golf Co., 2.75%, 5/1/26 (a)(b)(g) | 1,748,972 | |||||||||
Machinery-Diversified – 0.7% | |||||||||||
1,510 | Chart Industries, Inc., 1.00%, 11/15/24 (a)(b)(g) | 2,009,606 | |||||||||
Media – 0.8% | |||||||||||
765 | DISH Network Corp., 3.375%, 8/15/26 (g) | 706,194 | |||||||||
1,405 | Liberty Media Corp., 1.375%, 10/15/23 (g) | 1,534,449 | |||||||||
2,240,643 | |||||||||||
Mining – 0.5% | |||||||||||
910 | SSR Mining, Inc., 2.50%, 4/1/39 (g) | 1,390,403 | |||||||||
Oil, Gas & Consumable Fuels – 1.8% | |||||||||||
380 | CNX Resources Corp., 2.25%, 5/1/26 (a)(b) | 384,750 | |||||||||
1,745 | EQT Corp., 1.75%, 5/1/26 (a)(b) | 2,109,594 | |||||||||
2,105 | Pioneer Natural Resources Co., 0.25%, 5/15/25 (a)(b)(g) | 2,498,635 | |||||||||
4,992,979 | |||||||||||
Pharmaceuticals – 3.0% | |||||||||||
DexCom, Inc., | |||||||||||
3,755 | 0.25%, 11/15/25 (a)(b) | 4,067,135 | |||||||||
250 | 0.75%, 12/1/23 | 668,906 | |||||||||
555 | Neurocrine Biosciences, Inc., 2.25%, 5/15/24 (g) | 920,369 | |||||||||
1,735 | Pacira BioSciences, Inc., 0.75%, 8/1/25 (a)(b)(g) | 1,770,732 | |||||||||
480 | Sarepta Therapeutics, Inc., 1.50%, 11/15/24 (g) | 1,064,280 | |||||||||
8,491,422 | |||||||||||
Retail – 2.4% | |||||||||||
1,945 | Burlington Stores, Inc., 2.25%, 4/15/25 (a)(b)(g) | 2,186,194 | |||||||||
815 | Dick's Sporting Goods, Inc., 3.25%, 4/15/25 (a)(b) | 1,230,397 | |||||||||
1,025 | National Vision Holdings, Inc., 2.50%, 5/15/25 (a)(b) | 1,286,095 | |||||||||
RH (g), | |||||||||||
365 | zero coupon, 6/15/23 | 577,101 | |||||||||
1,000 | zero coupon, 9/15/24 (a)(b) | 1,475,894 | |||||||||
6,755,681 | |||||||||||
Semiconductors – 4.8% | |||||||||||
165 | Advanced Micro Devices, Inc., 2.125%, 9/1/26 | 1,593,422 | |||||||||
945 | Cree, Inc., 1.75%, 5/1/26 (a)(b)(g) | 1,527,947 | |||||||||
1,625 | Inphi Corp., 0.75%, 4/15/25 (a)(b) | 2,123,452 | |||||||||
2,920 | Microchip Technology, Inc., 1.625%, 2/15/27 (g) | 4,266,996 | |||||||||
185 | Micron Technology, Inc., 3.125%, 5/1/32, Ser. D | 919,797 | |||||||||
July 31, 2020 | Semi-Annual Report 15
Schedule of Investments
AllianzGI Diversified Income & Convertible Fund
July 31, 2020 (unaudited) (continued)
| Principal Amount (000s) | Value | ||||||||||
| Semiconductors (continued) | |||||||||||
ON Semiconductor Corp. (g), | |||||||||||
$ | 1,095 | 1.00%, 12/1/20 | $ | 1,300,511 | |||||||
665 | 1.625%, 10/15/23 | 832,787 | |||||||||
935 | Synaptics, Inc., 0.50%, 6/15/22 | 1,164,796 | |||||||||
13,729,708 | |||||||||||
Software – 16.7% | |||||||||||
2,435 | Akamai Technologies, Inc., 0.125%, 5/1/25 (g) | 3,171,453 | |||||||||
1,745 | Alteryx, Inc., 1.00%, 8/1/26 (a)(b)(g) | 2,142,153 | |||||||||
900 | Atlassian, Inc., 0.625%, 5/1/23 (g) | 1,968,850 | |||||||||
735 | Bandwidth Inc,, 0.25%, 3/1/26 (a)(b)(g) | 1,242,033 | |||||||||
785 | Cerence, Inc., 3.00%, 6/1/25 (a)(b)(g) | 1,021,531 | |||||||||
855 | Cloudflare, Inc., 0.75%, 5/15/25 (a)(b)(g) | 1,145,166 | |||||||||
2,520 | Coupa Software, Inc., 0.375%, 6/15/26 (a)(b) | 3,159,644 | |||||||||
1,125 | Datadog, Inc., 0.125%, 6/15/25 (a)(b) | 1,425,843 | |||||||||
510 | DocuSign, Inc., 0.50%, 9/15/23 (g) | 1,552,612 | |||||||||
735 | Envestnet, Inc., 1.75%, 6/1/23 (g) | 977,792 | |||||||||
1,090 | Everbridge, Inc., 0.125%, 12/15/24 (a)(b)(g) | 1,545,244 | |||||||||
1,250 | Five9, Inc., 0.50%, 6/1/25 (a)(b) | 1,446,875 | |||||||||
1,400 | HubSpot, Inc., 0.375%, 6/1/25 (a)(b) | 1,572,549 | |||||||||
1,265 | i3 Verticals LLC, 1.00%, 2/15/25 (a)(b)(g) | 1,081,078 | |||||||||
1,815 | MongoDB, Inc., 0.25%, 1/15/26 (a)(b)(g) | 2,358,528 | |||||||||
1,180 | Nuance Communications, Inc., 1.25%, 4/1/25 (g) | 1,772,518 | |||||||||
2,235 | Pegasystems, Inc., 0.75%, 3/1/25 (a)(b)(g) | 2,512,242 | |||||||||
3,190 | RingCentral, Inc., zero coupon, 3/1/25 (a)(b)(g) | 3,510,789 | |||||||||
775 | Sea Ltd., 2.375%, 12/1/25 (a)(b)(g) | 1,201,032 | |||||||||
685 | ServiceNow, Inc., zero coupon, 6/1/22 (g) | 2,233,551 | |||||||||
1,255 | Slack Technologies, Inc., 0.50%, 4/15/25 (a)(b)(g) | 1,543,312 | |||||||||
3,725 | Splunk, Inc., 1.125%, 6/15/27 (a)(b)(g) | 4,234,559 | |||||||||
420 | Twilio, Inc., 0.25%, 6/1/23 (g) | 1,642,615 | |||||||||
935 | Workday, Inc., 0.25%, 10/1/22 (g) | 1,261,907 | |||||||||
1,510 | Zynga, Inc., 0.25%, 6/1/24 (g) | 2,026,231 | |||||||||
47,750,107 | |||||||||||
Telecommunications – 1.5% | |||||||||||
1,020 | GCI Liberty, Inc., 1.75%, 9/30/46 (a)(b)(g) | 1,616,148 | |||||||||
1,135 | Infinera Corp., 2.125%, 9/1/24 (g) | 1,164,532 | |||||||||
1,435 | Vonage Holdings Corp., 1.75%, 6/1/24 (g) | 1,461,710 | |||||||||
4,242,390 | |||||||||||
Total Convertible Bonds & Notes (cost-$167,583,548) | 198,906,065 | ||||||||||
Shares | |||||||||||
Common Stock – 31.0% | |||||||||||
Aerospace & Defense – 0.2% | |||||||||||
3,400 | Boeing Co. | 537,200 | |||||||||
Automobiles – 0.2% | |||||||||||
450 | Tesla, Inc. (g)(i) | 643,842 | |||||||||
16 Semi-Annual Report | July 31, 2020
Schedule of Investments
AllianzGI Diversified Income & Convertible Fund
July 31, 2020 (unaudited) (continued)
Shares | Value | ||||||||||
Banks – 0.2% | |||||||||||
4,911 | CCF Holdings LLC, Class A (cost-$0; purchased 12/18/18) (d)(f)(h)(i) | $ | – | † | |||||||
5,357 | CCF Holdings LLC, Class B (cost-$0; purchased 12/12/18) (d)(f)(h)(i) | 1 | |||||||||
7,600 | JPMorgan Chase & Co. | 734,464 | |||||||||
734,465 | |||||||||||
Beverages – 0.4% | |||||||||||
9,000 | PepsiCo, Inc. | 1,238,940 | |||||||||
Biotechnology – 1.5% | |||||||||||
21,860 | AbbVie, Inc. | 2,074,733 | |||||||||
1,100 | Biogen, Inc. (i) | 302,159 | |||||||||
11,300 | Gilead Sciences, Inc. | 785,689 | |||||||||
3,800 | Vertex Pharmaceuticals, Inc. (i) | 1,033,600 | |||||||||
4,196,181 | |||||||||||
Capital Markets – 0.5% | |||||||||||
12,800 | Charles Schwab Corp. | 424,320 | |||||||||
3,200 | S&P Global, Inc. | 1,120,800 | |||||||||
1,545,120 | |||||||||||
Chemicals – 0.2% | |||||||||||
16,600 | Chemours Co. | 307,598 | |||||||||
3,800 | Dow, Inc. (i) | 156,028 | |||||||||
3,800 | DuPont de Nemours, Inc. | 203,224 | |||||||||
666,850 | |||||||||||
Communications Equipment – 0.2% | |||||||||||
9,700 | Cisco Systems, Inc. | 456,870 | |||||||||
Diversified Telecommunication Services – 0.0% | |||||||||||
32,499 | Frontier Communications Corp. (i) | 3,039 | |||||||||
Entertainment – 1.0% | |||||||||||
8,100 | Activision Blizzard, Inc. | 669,303 | |||||||||
4,300 | Netflix, Inc. (g)(i) | 2,102,184 | |||||||||
2,771,487 | |||||||||||
Equity Real Estate Investment Trusts (REITs) – 0.7% | |||||||||||
4,500 | American Tower Corp. | 1,176,255 | |||||||||
4,300 | Crown Castle International Corp. | 716,810 | |||||||||
1,893,065 | |||||||||||
Food & Staples Retailing – 0.4% | |||||||||||
3,200 | Costco Wholesale Corp. | 1,041,696 | |||||||||
Healthcare Equipment & Supplies – 1.2% | |||||||||||
4,500 | Align Technology, Inc. (i) | 1,322,190 | |||||||||
25,500 | Boston Scientific Corp. (i) | 983,535 | |||||||||
1,700 | Intuitive Surgical, Inc. (i) | 1,165,248 | |||||||||
3,470,973 | |||||||||||
Healthcare Providers & Services – 0.8% | |||||||||||
7,200 | UnitedHealth Group, Inc. | 2,180,016 | |||||||||
July 31, 2020 | Semi-Annual Report 17
Schedule of Investments
AllianzGI Diversified Income & Convertible Fund
July 31, 2020 (unaudited) (continued)
Shares | Value | ||||||||||
Hotels, Restaurants & Leisure – 0.7% | |||||||||||
5,900 | McDonald's Corp. (g) | $ | 1,146,252 | ||||||||
11,500 | Starbucks Corp. | 880,095 | |||||||||
2,026,347 | |||||||||||
Household Durables – 0.5% | |||||||||||
19,900 | DR Horton, Inc. | 1,316,584 | |||||||||
Industrial Conglomerates – 0.2% | |||||||||||
4,800 | Honeywell International, Inc. | 716,976 | |||||||||
Insurance – 0.1% | |||||||||||
800 | Aon PLC, Class A | 164,176 | |||||||||
Interactive Media & Services – 2.6% | |||||||||||
2,650 | Alphabet, Inc., Class A (i) | 3,943,068 | |||||||||
13,800 | Facebook, Inc., Class A (i) | 3,500,646 | |||||||||
7,443,714 | |||||||||||
Internet & Direct Marketing Retail – 1.9% | |||||||||||
3,400 | Alibaba Group Holding Ltd., ADR (g)(i) | 853,468 | |||||||||
1,475 | Amazon.com, Inc. (i) | 4,667,903 | |||||||||
5,521,371 | |||||||||||
IT Services – 2.8% | |||||||||||
12,000 | Fiserv, Inc. (i) | 1,197,480 | |||||||||
6,050 | Mastercard, Inc., Class A (g) | 1,866,606 | |||||||||
9,600 | PayPal Holdings, Inc. (g)(i) | 1,882,272 | |||||||||
100 | Shopify, Inc., Class A (i) | 102,400 | |||||||||
875 | Twilio, Inc., Class A (i) | 242,743 | |||||||||
14,200 | Visa, Inc., Class A (g) | 2,703,680 | |||||||||
7,995,181 | |||||||||||
Life Sciences Tools & Services – 1.0% | |||||||||||
5,550 | IQVIA Holdings, Inc. (i) | 879,064 | |||||||||
4,525 | Thermo Fisher Scientific, Inc. | 1,873,124 | |||||||||
2,752,188 | |||||||||||
Machinery – 0.6% | |||||||||||
9,100 | Caterpillar, Inc. | 1,209,208 | |||||||||
2,800 | Deere & Co. | 493,668 | |||||||||
1,702,876 | |||||||||||
Media – 0.0% | |||||||||||
13,574 | LiveStyle, Inc. (d)(f)(i)(j) | 1 | |||||||||
Multi-Line Retail – 0.6% | |||||||||||
6,800 | Dollar General Corp. | 1,294,720 | |||||||||
3,800 | Target Corp. | 478,344 | |||||||||
1,773,064 | |||||||||||
Oil, Gas & Consumable Fuels – 0.1% | |||||||||||
60,184 | Southwestern Energy Co. (g)(i) | 146,247 | |||||||||
18 Semi-Annual Report | July 31, 2020
Schedule of Investments
AllianzGI Diversified Income & Convertible Fund
July 31, 2020 (unaudited) (continued)
Shares | Value | ||||||||||
Pharmaceuticals – 1.3% | |||||||||||
19,900 | Bristol-Myers Squibb Co. | $ | 1,167,334 | ||||||||
7,100 | Merck & Co., Inc. (g) | 569,704 | |||||||||
43,950 | Teva Pharmaceutical Industries Ltd., ADR (g)(i) | 507,183 | |||||||||
9,200 | Zoetis, Inc. | 1,395,456 | |||||||||
3,639,677 | |||||||||||
Road & Rail – 0.1% | |||||||||||
2,500 | Union Pacific Corp. | 433,375 | |||||||||
Semiconductors & Semiconductor Equipment – 2.9% | |||||||||||
19,400 | Advanced Micro Devices, Inc. (g)(i) | 1,502,142 | |||||||||
3,300 | Broadcom, Inc. | 1,045,275 | |||||||||
3,800 | Lam Research Corp. | 1,433,208 | |||||||||
23,700 | Marvell Technology Group Ltd. (g) | 864,339 | |||||||||
20,900 | Micron Technology, Inc. (i) | 1,046,149 | |||||||||
5,400 | NVIDIA Corp. (g) | 2,292,786 | |||||||||
8,183,899 | |||||||||||
Software – 5.2% | |||||||||||
4,650 | Adobe, Inc. (i) | 2,066,088 | |||||||||
3,900 | Atlassian Corp. PLC, Class A (g)(i) | 688,935 | |||||||||
8,700 | Crowdstrike Holdings, Inc., Class A (i) | 984,840 | |||||||||
1,000 | DocuSign, Inc. (i) | 216,830 | |||||||||
3,800 | Intuit, Inc. | 1,164,206 | |||||||||
21,100 | Microsoft Corp. | 4,325,711 | |||||||||
9,500 | Salesforce.com, Inc. (i) | 1,851,075 | |||||||||
3,900 | ServiceNow, Inc. (g)(i) | 1,712,880 | |||||||||
5,900 | Workday, Inc., Class A (i) | 1,067,428 | |||||||||
2,975 | Zoom Video Communications, Inc., Class A (g)(i) | 755,382 | |||||||||
14,833,375 | |||||||||||
Specialty Retail – 0.7% | |||||||||||
7,300 | Home Depot, Inc. | 1,938,077 | |||||||||
Technology Hardware, Storage & Peripherals – 1.7% | |||||||||||
11,800 | Apple, Inc. | 5,015,472 | |||||||||
Textiles, Apparel & Luxury Goods – 0.5% | |||||||||||
15,100 | NIKE, Inc., Class B (g) | 1,473,911 | |||||||||
Total Common Stock (cost-$87,795,629) | 88,456,255 | ||||||||||
| Principal Amount (000s) | |||||||||||
Corporate Bonds & Notes – 20.6% | |||||||||||
Aerospace & Defense – 0.5% | |||||||||||
TransDigm, Inc. (g), | |||||||||||
$ | 345 | 5.50%, 11/15/27 | 327,991 | ||||||||
715 | 6.50%, 5/15/25 | 702,563 | |||||||||
455 | Triumph Group, Inc., 6.25%, 9/15/24 (a)(b)(g) | 402,438 | |||||||||
1,432,992 | |||||||||||
July 31, 2020 | Semi-Annual Report 19
Schedule of Investments
AllianzGI Diversified Income & Convertible Fund
July 31, 2020 (unaudited) (continued)
| Principal Amount (000s) | Value | ||||||||||
Auto Components – 0.8% | |||||||||||
$ | 625 | Adient U.S. LLC, 7.00%, 5/15/26 (a)(b)(g) | $ | 674,459 | |||||||
445 | American Axle & Manufacturing, Inc., 6.25%, 4/1/25 | 460,720 | |||||||||
645 | Clarios Global L.P., 8.50%, 5/15/27 (a)(b)(g) | 678,959 | |||||||||
475 | Goodyear Tire & Rubber Co., 5.00%, 5/31/26 (g) | 475,803 | |||||||||
2,289,941 | |||||||||||
Auto Manufacturers – 0.8% | |||||||||||
Ford Motor Co., | |||||||||||
530 | 9.00%, 4/22/25 | 625,140 | |||||||||
460 | 9.625%, 4/22/30 | 611,062 | |||||||||
150 | Ford Motor Credit Co. LLC, 5.125%, 6/16/25 | 159,645 | |||||||||
445 | Navistar International Corp., 6.625%, 11/1/25 (a)(b)(g) | 457,284 | |||||||||
455 | Tesla, Inc., 5.30%, 8/15/25 (a)(b)(g) | 471,494 | |||||||||
2,324,625 | |||||||||||
Building Materials – 0.2% | |||||||||||
470 | Builders FirstSource, Inc., 5.00%, 3/1/30 (a)(b)(g) | 494,038 | |||||||||
Chemicals – 0.3% | |||||||||||
875 | Tronox, Inc., 6.50%, 4/15/26 (a)(b)(g) | 879,288 | |||||||||
Commercial Services – 1.0% | |||||||||||
245 | Avis Budget Car Rental LLC, 5.75%, 7/15/27 (a)(b) | 229,450 | |||||||||
350 | Cenveo Corp., 6.00%, 5/15/24 (a)(b)(c)(d)(f) | 6,416 | |||||||||
475 | Herc Holdings, Inc., 5.50%, 7/15/27 (a)(b)(g) | 503,500 | |||||||||
405 | Laureate Education, Inc., 8.25%, 5/1/25 (a)(b)(g) | 433,599 | |||||||||
915 | RR Donnelley & Sons Co., 6.00%, 4/1/24 (g) | 849,710 | |||||||||
United Rentals North America, Inc. (g), | |||||||||||
310 | 5.25%, 1/15/30 | 340,031 | |||||||||
500 | 5.50%, 7/15/25 | 514,550 | |||||||||
2,877,256 | |||||||||||
Computers – 0.2% | |||||||||||
420 | Dell International LLC, 7.125%, 6/15/24 (a)(b)(g) | 436,468 | |||||||||
Containers & Packaging – 0.5% | |||||||||||
455 | Berry Global, Inc., 5.625%, 7/15/27 (a)(b)(g) | 488,285 | |||||||||
415 | Owens-Brockway Glass Container, Inc., 6.625%, 5/13/27 (a)(b)(g) | 450,016 | |||||||||
355 | Trivium Packaging Finance BV, 8.50%, 8/15/27 (a)(b)(g) | 390,278 | |||||||||
1,328,579 | |||||||||||
Distribution/Wholesale – 0.4% | |||||||||||
495 | H&E Equipment Services, Inc., 5.625%, 9/1/25 (g) | 516,037 | |||||||||
600 | Performance Food Group, Inc., 5.50%, 10/15/27 (a)(b)(g) | 620,598 | |||||||||
1,136,635 | |||||||||||
Diversified Financial Services – 1.4% | |||||||||||
1,875 | CCF Holdings LLC, PIK 10.75%, 10.75%, 12/15/23 (a)(b)(d)(f) | 508,397 | |||||||||
1,500 | Community Choice Financial Issuer LLC, 9.00%, 6/15/23 (cost-$1,500,000; purchased 9/6/18) (a)(b)(g)(h) | 1,500,750 | |||||||||
Navient Corp., | |||||||||||
165 | 5.00%, 3/15/27 | 158,232 | |||||||||
595 | 6.75%, 6/15/26 (g) | 619,916 | |||||||||
20 Semi-Annual Report | July 31, 2020
Schedule of Investments
AllianzGI Diversified Income & Convertible Fund
July 31, 2020 (unaudited) (continued)
| Principal Amount (000s) | Value | ||||||||||
| Diversified Financial Services (continued) | |||||||||||
OneMain Finance Corp. (g), | |||||||||||
$ | 270 | 6.625%, 1/15/28 | $ | 309,864 | |||||||
835 | 8.25%, 10/1/23 | 946,593 | |||||||||
4,043,752 | |||||||||||
Electric Utilities – 0.3% | |||||||||||
290 | NRG Energy, Inc., 5.75%, 1/15/28 | 319,416 | |||||||||
1,000 | Talen Energy Supply LLC, 6.50%, 6/1/25 (g) | 673,645 | |||||||||
993,061 | |||||||||||
Electrical Equipment – 0.4% | |||||||||||
750 | Energizer Holdings, Inc., 7.75%, 1/15/27 (a)(b)(g) | 834,236 | |||||||||
210 | WESCO Distribution, Inc., 7.25%, 6/15/28 (a)(b)(g) | 229,720 | |||||||||
1,063,956 | |||||||||||
Engineering & Construction – 0.2% | |||||||||||
400 | AECOM, 5.875%, 10/15/24 (g) | 442,542 | |||||||||
Entertainment – 1.0% | |||||||||||
885 | AMC Entertainment Holdings, Inc., 6.125%, 5/15/27 (g) | 254,437 | |||||||||
Cedar Fair L.P., | |||||||||||
250 | 5.375%, 6/1/24 (g) | 245,169 | |||||||||
465 | 5.375%, 4/15/27 | 450,076 | |||||||||
430 | Colt Merger Sub, Inc., 6.25%, 7/1/25 (a)(b) | 450,793 | |||||||||
450 | International Game Technology PLC, 6.25%, 1/15/27 (a)(b) | 479,333 | |||||||||
430 | Scientific Games International, Inc., 8.25%, 3/15/26 (a)(b)(g) | 431,417 | |||||||||
425 | Stars Group Holdings BV, 7.00%, 7/15/26 (a)(b)(g) | 459,584 | |||||||||
2,770,809 | |||||||||||
Food & Beverage – 0.7% | |||||||||||
310 | Albertsons Cos., Inc., 7.50%, 3/15/26 (a)(b)(g) | 349,476 | |||||||||
440 | Kraft Heinz Foods Co., 6.50%, 2/9/40 (g) | 556,382 | |||||||||
495 | Post Holdings, Inc., 5.75%, 3/1/27 (a)(b)(g) | 528,569 | |||||||||
410 | U.S. Foods, Inc., 6.25%, 4/15/25 (a)(b)(g) | 440,272 | |||||||||
1,874,699 | |||||||||||
Food Service – 0.1% | |||||||||||
390 | Aramark Services, Inc., 5.00%, 2/1/28 (a)(b)(g) | 393,079 | |||||||||
Healthcare-Services – 0.7% | |||||||||||
1,000 | Community Health Systems, Inc., 6.875%, 2/1/22 (g) | 773,125 | |||||||||
150 | IQVIA, Inc., 5.00%, 5/15/27 (a)(b)(g) | 160,388 | |||||||||
345 | Select Medical Corp., 6.25%, 8/15/26 (a)(b)(g) | 372,269 | |||||||||
Tenet Healthcare Corp. (g), | |||||||||||
490 | 6.25%, 2/1/27 (a)(b) | 521,166 | |||||||||
245 | 8.125%, 4/1/22 | 264,294 | |||||||||
2,091,242 | |||||||||||
Home Builders – 0.1% | |||||||||||
305 | Picasso Finance Sub, Inc., 6.125%, 6/15/25 (a)(b)(g) | 324,505 | |||||||||
July 31, 2020 | Semi-Annual Report 21
Schedule of Investments
AllianzGI Diversified Income & Convertible Fund
July 31, 2020 (unaudited) (continued)
| Principal Amount (000s) | Value | ||||||||||
Internet – 0.6% | |||||||||||
$ | 460 | Go Daddy Operating Co. LLC, 5.25%, 12/1/27 (a)(b)(g) | $ | 491,540 | |||||||
410 | Match Group Holdings II LLC, 5.00%, 12/15/27 (a)(b)(g) | 431,960 | |||||||||
415 | Netflix, Inc., 5.375%, 11/15/29 (a)(b)(g) | 503,187 | |||||||||
325 | NortonLifeLock, Inc., 5.00%, 4/15/25 (a)(b)(g) | 335,468 | |||||||||
1,762,155 | |||||||||||
Iron/Steel – 0.1% | |||||||||||
360 | Cleveland-Cliffs, Inc., 5.875%, 6/1/27 | 310,043 | |||||||||
Leisure – 0.1% | |||||||||||
305 | Royal Caribbean Cruises Ltd., 11.50%, 6/1/25 (a)(b)(g) | 336,321 | |||||||||
Lodging – 0.5% | |||||||||||
285 | Boyd Gaming Corp., 8.625%, 6/1/25 (a)(b)(g) | 314,535 | |||||||||
315 | MGM Resorts International, 6.75%, 5/1/25 | 328,096 | |||||||||
450 | Wyndham Hotels & Resorts, Inc., 5.375%, 4/15/26 (a)(b) | 460,307 | |||||||||
325 | Wynn Las Vegas LLC, 5.50%, 3/1/25 (a)(b)(g) | 306,312 | |||||||||
1,409,250 | |||||||||||
Machinery-Construction & Mining – 0.2% | |||||||||||
435 | Terex Corp., 5.625%, 2/1/25 (a)(b)(g) | 443,213 | |||||||||
Media – 1.9% | |||||||||||
CCO Holdings LLC (a)(b), | |||||||||||
470 | 5.125%, 5/1/27 (g) | 499,268 | |||||||||
275 | 5.375%, 6/1/29 | 301,439 | |||||||||
300 | 5.50%, 5/1/26 (g) | 317,762 | |||||||||
417 | Clear Channel Worldwide Holdings, Inc., 9.25%, 2/15/24 | 379,543 | |||||||||
CSC Holdings LLC (a)(b)(g), | |||||||||||
535 | 7.50%, 4/1/28 | 616,151 | |||||||||
750 | 10.875%, 10/15/25 | 804,825 | |||||||||
DISH DBS Corp., | |||||||||||
370 | 5.875%, 11/15/24 (g) | 386,341 | |||||||||
420 | 7.375%, 7/1/28 (a)(b) | 445,603 | |||||||||
530 | Gray Television, Inc., 5.875%, 7/15/26 (a)(b)(g) | 549,409 | |||||||||
455 | Meredith Corp., 6.875%, 2/1/26 (g) | 396,225 | |||||||||
445 | Nexstar Broadcasting, Inc., 5.625%, 7/15/27 (a)(b)(g) | 476,980 | |||||||||
310 | Virgin Media Secured Finance PLC, 5.50%, 5/15/29 (a)(b)(g) | 338,393 | |||||||||
5,511,939 | |||||||||||
Metal Fabricate/Hardware – 0.1% | |||||||||||
470 | Park-Ohio Industries, Inc., 6.625%, 4/15/27 (g) | 414,098 | |||||||||
Mining – 0.8% | |||||||||||
430 | Alcoa Nederland Holding BV, 6.75%, 9/30/24 (a)(b)(g) | 449,662 | |||||||||
445 | Constellium SE, 6.625%, 3/1/25 (a)(b)(g) | 460,575 | |||||||||
475 | Freeport-McMoRan, Inc., 5.25%, 9/1/29 (g) | 523,303 | |||||||||
170 | Hudbay Minerals, Inc., 7.625%, 1/15/25 (a)(b)(g) | 172,455 | |||||||||
Joseph T. Ryerson & Son, Inc. (a)(b), | |||||||||||
225 | 8.50%, 8/1/28 | 245,954 | |||||||||
500 | 11.00%, 5/15/22 (g) | 515,900 | |||||||||
2,367,849 | |||||||||||
22 Semi-Annual Report | July 31, 2020
Schedule of Investments
AllianzGI Diversified Income & Convertible Fund
July 31, 2020 (unaudited) (continued)
| Principal Amount (000s) | Value | ||||||||||
Miscellaneous Manufacturing – 0.2% | |||||||||||
$ | 460 | Koppers, Inc., 6.00%, 2/15/25 (a)(b)(g) | $ | 475,231 | |||||||
Oil, Gas & Consumable Fuels – 0.9% | |||||||||||
295 | CNX Resources Corp., 7.25%, 3/14/27 (a)(b)(g) | 289,463 | |||||||||
190 | Continental Resources, Inc., 4.375%, 1/15/28 | 177,572 | |||||||||
265 | EQT Corp., 8.75%, 2/1/30 | 307,148 | |||||||||
510 | Occidental Petroleum Corp., 5.55%, 3/15/26 (g) | 512,560 | |||||||||
425 | PBF Holding Co. LLC, 6.00%, 2/15/28 (a)(b)(g) | 342,922 | |||||||||
Sunoco L.P., | |||||||||||
195 | 5.50%, 2/15/26 (g) | 200,569 | |||||||||
120 | 5.875%, 3/15/28 | 125,827 | |||||||||
300 | USA Compression Partners L.P., 6.875%, 9/1/27 (g) | 307,194 | |||||||||
160 | WPX Energy, Inc., 5.75%, 6/1/26 (g) | 163,665 | |||||||||
2,426,920 | |||||||||||
Paper & Forest Products – 0.1% | |||||||||||
385 | Mercer International, Inc., 7.375%, 1/15/25 (g) | 388,850 | |||||||||
Personal Products – 0.1% | |||||||||||
300 | Edgewell Personal Care Co., 5.50%, 6/1/28 (a)(b) | 325,166 | |||||||||
Pharmaceuticals – 0.7% | |||||||||||
550 | Bausch Health Americas, Inc., 8.50%, 1/31/27 (a)(b)(g) | 612,708 | |||||||||
Bausch Health Cos., Inc. (a)(b)(g), | |||||||||||
300 | 5.25%, 1/30/30 | 306,711 | |||||||||
450 | 7.25%, 5/30/29 | 495,758 | |||||||||
465 | Horizon Therapeutics USA, Inc., 5.50%, 8/1/27 (a)(b)(g) | 502,986 | |||||||||
1,918,163 | |||||||||||
Pipelines – 0.6% | |||||||||||
315 | Cheniere Energy Partners L.P., 5.625%, 10/1/26 (g) | 333,254 | |||||||||
365 | Crestwood Midstream Partners L.P., 5.75%, 4/1/25 (g) | 349,263 | |||||||||
370 | DCP Midstream Operating L.P., 5.125%, 5/15/29 (g) | 373,075 | |||||||||
290 | EQM Midstream Partners L.P., 6.50%, 7/1/27 (a)(b) | 320,164 | |||||||||
335 | Targa Resources Partners L.P., 6.50%, 7/15/27 (g) | 359,288 | |||||||||
1,735,044 | |||||||||||
Real Estate – 0.2% | |||||||||||
700 | Kennedy-Wilson, Inc., 5.875%, 4/1/24 (g) | 703,500 | |||||||||
Retail – 0.6% | |||||||||||
267 | Asbury Automotive Group, Inc., 4.75%, 3/1/30 (a)(b)(g) | 274,343 | |||||||||
1,000 | Conn's, Inc., 7.25%, 7/15/22 (g) | 875,000 | |||||||||
410 | Yum! Brands, Inc., 4.75%, 1/15/30 (a)(b)(g) | 445,963 | |||||||||
1,595,306 | |||||||||||
Semiconductors – 0.2% | |||||||||||
605 | Amkor Technology, Inc., 6.625%, 9/15/27 (a)(b)(g) | 666,901 | |||||||||
Software – 0.7% | |||||||||||
1,000 | j2 Cloud Services LLC, 6.00%, 7/15/25 (a)(b)(g) | 1,043,900 | |||||||||
440 | Rackspace Hosting, Inc., 8.625%, 11/15/24 (a)(b)(g) | 459,998 | |||||||||
480 | SS&C Technologies, Inc., 5.50%, 9/30/27 (a)(b)(g) | 516,600 | |||||||||
2,020,498 | |||||||||||
July 31, 2020 | Semi-Annual Report 23
Schedule of Investments
AllianzGI Diversified Income & Convertible Fund
July 31, 2020 (unaudited) (continued)
| Principal Amount (000s) | Value | ||||||||||
Telecommunications – 1.9% | |||||||||||
CenturyLink, Inc. (g), | |||||||||||
$ | 490 | 5.125%, 12/15/26 (a)(b) | $ | 514,649 | |||||||
420 | 7.50%, 4/1/24, Ser. Y | 476,175 | |||||||||
330 | Cincinnati Bell, Inc., 7.00%, 7/15/24 (a)(b)(g) | 342,472 | |||||||||
690 | CommScope Technologies LLC, 6.00%, 6/15/25 (a)(b)(g) | 705,974 | |||||||||
880 | Consolidated Communications, Inc., 6.50%, 10/1/22 (g) | 866,250 | |||||||||
1,000 | Hughes Satellite Systems Corp., 7.625%, 6/15/21 (g) | 1,051,250 | |||||||||
865 | Sprint Corp., 7.625%, 3/1/26 (g) | 1,082,543 | |||||||||
400 | T-Mobile USA, Inc., 6.50%, 1/15/26 (g) | 422,160 | |||||||||
5,461,473 | |||||||||||
Toys/Games/Hobbies – 0.1% | |||||||||||
170 | Mattel, Inc., 5.875%, 12/15/27 (a)(b)(g) | 183,490 | |||||||||
Transportation – 0.4% | |||||||||||
310 | Fortress Transportation and Infrastructure Investors LLC, 9.75%, 8/1/27 (a)(b) | 321,238 | |||||||||
XPO Logistics, Inc. (a)(b)(g), | |||||||||||
600 | 6.125%, 9/1/23 | 613,377 | |||||||||
315 | 6.50%, 6/15/22 | 316,488 | |||||||||
1,251,103 | |||||||||||
Total Corporate Bonds & Notes (cost-$59,814,786) | 58,903,980 | ||||||||||
Shares | |||||||||||
Convertible Preferred Stock – 12.7% | |||||||||||
Auto Components – 0.5% | |||||||||||
15,245 | Aptiv PLC, 5.50%, 6/15/23, Ser. A | 1,558,192 | |||||||||
Banks – 2.0% | |||||||||||
2,085 | Bank of America Corp., 7.25%, Ser. L (e)(g) | 3,125,436 | |||||||||
1,855 | Wells Fargo & Co., 7.50%, Ser. L (e)(g) | 2,507,032 | |||||||||
5,632,468 | |||||||||||
Diversified Financial Services – 0.6% | |||||||||||
1,420 | 2020 Mandatory Exchangeable Trust, 6.50%, 5/16/23 (a)(b)(g) | 1,711,100 | |||||||||
Electric Utilities – 1.4% | |||||||||||
81,925 | NextEra Energy, Inc., 5.279%, 3/1/23 (g) | 3,968,447 | |||||||||
Electronics – 0.8% | |||||||||||
2,140 | Fortive Corp., 5.00%, 7/1/21, Ser. A (g) | 1,892,231 | |||||||||
1,840 | II-VI, Inc., 6.00%, 7/1/23, Ser. A | 415,893 | |||||||||
2,308,124 | |||||||||||
Environmental Services – 0.5% | |||||||||||
27,880 | GFL Environmental Inc., 6.00%, 3/15/23 (g) | 1,542,600 | |||||||||
Hand/Machine Tools – 0.6% | |||||||||||
19,115 | Stanley Black & Decker, Inc., 5.25%, 11/15/22 (g) | 1,824,718 | |||||||||
Healthcare-Products – 3.2% | |||||||||||
22,710 | Avantor, Inc., 6.25%, 5/15/22, Ser. A (g) | 1,638,072 | |||||||||
14,635 | Boston Scientific Corp., 5.50%, 6/1/23, Ser. A (g) | 1,643,364 | |||||||||
24 Semi-Annual Report | July 31, 2020
Schedule of Investments
AllianzGI Diversified Income & Convertible Fund
July 31, 2020 (unaudited) (continued)
Shares | Value | ||||||||||
| Healthcare-Products (continued) | |||||||||||
Danaher Corp., | |||||||||||
3,430 | 4.75%, 4/15/22, Ser. A (g) | $ | 4,867,582 | ||||||||
705 | 5.00%, 4/15/23, Ser. B | 863,653 | |||||||||
9,012,671 | |||||||||||
Pharmaceuticals – 0.5% | |||||||||||
21,885 | Becton Dickinson and Co., 6.00%, 6/1/23, Ser. B (g) | 1,319,666 | |||||||||
Semiconductors – 1.7% | |||||||||||
4,300 | Broadcom, Inc., 8.00%, 9/30/22, Ser. A (g) | 4,905,913 | |||||||||
Telecommunications – 0.9% | |||||||||||
2,395 | 2020 Cash Mandatory Exchangeable Trust, 5.25%, 6/1/23 (a)(b) | 2,473,951 | |||||||||
Total Convertible Preferred Stock (cost-$33,284,666) | 36,257,850 | ||||||||||
Preferred Stock (a)(d)(f)(i)(j) – 0.3% | |||||||||||
Media – 0.3% | |||||||||||
532 | LiveStyle, Inc., Ser. A | 79,534 | |||||||||
11,500 | LiveStyle, Inc., Ser. B | 810,175 | |||||||||
1,250 | LiveStyle, Inc., Ser. B | 13 | |||||||||
Total Preferred Stock (cost-$2,429,842) | 889,722 | ||||||||||
Units | |||||||||||
Warrants (a)(d)(f)(i)(j) – 0.0% | |||||||||||
Media – 0.0% | |||||||||||
3,000 | LiveStyle, Inc., expires 11/30/21, Ser. C (cost-$0) | – | † | ||||||||
| Principal Amount (000s) | |||||||||||
Repurchase Agreements – 3.0% | |||||||||||
$ | 8,556 | State Street Bank and Trust Co., dated 7/31/20, 0.00%, due 8/3/20, proceeds $8,556,000; collateralized by U.S. Treasury Notes, 1.125%, due 2/28/25, valued at $8,727,206 including accrued interest (cost-$8,556,000) | 8,556,000 | ||||||||
| Total Investments, before options written (cost-$359,464,471) – 137.3% | 391,969,872 | ||||||||||
| Total Options Written – (0.0)% (premiums received-$72,477) (i)(k)(l) | (27,491 | ) | |||||||||
| Total Investments, net of options written (cost-$359,391,994) – 137.3% | 391,942,381 | ||||||||||
Other liabilities in excess of other assets – (37.3)% | (106,413,010 | ) | |||||||||
Net Assets – 100.0% | $ | 285,529,371 | |||||||||
Notes to Schedule of Investments:
† Actual amount rounds to less than $1.
(a) Private Placement–Restricted as to resale and may not have a readily available market. Securities with an aggregate value of $156,847,128, representing 54.9% of net assets.
July 31, 2020 | Semi-Annual Report 25
Schedule of Investments
AllianzGI Diversified Income & Convertible Fund
July 31, 2020 (unaudited) (continued)
(b) 144A–Exempt from registration under Rule 144A of the Securities Act of 1933. These securities may be resold in transactions exempt from registration, typically only to qualified institutional buyers. Securities with an aggregate value of $155,957,406, representing 54.6% of net assets.
(c) In default.
(d) Fair-Valued–Securities with an aggregate value of $1,404,537, representing 0.5% of net assets. See Note 1(a) and Note 1(b) in the Notes to Financial Statements.
(e) Perpetual maturity. The date shown, if any, is the next call date.
(f) Level 3 security. See Note 1(a) and Note 1(b) in the Notes to Financial Statements.
(g) All or partial amount segregated for the benefit of the counterparty as collateral for options written and long-term and short-term loan financing.
(h) Restricted. The aggregate cost of such securities is $1,500,000. The aggregate value is $1,500,751, representing 0.5% of net assets.
(i) Non-income producing.
(j) A member of the Fund's portfolio management team is a member of the board of directors of LiveStyle, Inc. The Fund's aggregate value of investments in LiveStyle, Inc. represents 0.3% of net assets.
(k) Exchange traded-Chicago Board Options Exchange.
(l) Exchange traded option contracts outstanding at July 31, 2020:
Options written contracts outstanding at July 31, 2020:
Description | Exercise Price | Expiration Date | Number of Contracts | Notional Amount | Market Value | Premiums Received | Unrealized Appreciation (Depreciation) | ||||||||||||||||||||||||
Call options: | |||||||||||||||||||||||||||||||
Advanced Micro Devices, Inc. | 85.00 | USD | 8/21/20 | (100 | ) | $ | (10,000 | ) | $ | (11,000 | ) | $ | (10,287 | ) | $ | (713 | ) | ||||||||||||||
Alibaba Group Holding Ltd. | 310.00 | USD | 8/21/20 | (11 | ) | (1,100 | ) | (347 | ) | (3,529 | ) | 3,182 | |||||||||||||||||||
Atlassian Corp. PLC | 230.00 | USD | 8/21/20 | (15 | ) | (1,500 | ) | (75 | ) | (1,321 | ) | 1,246 | |||||||||||||||||||
Marvell Technology Group Ltd. | 40.00 | USD | 8/21/20 | (30 | ) | (3,000 | ) | (825 | ) | (504 | ) | (321 | ) | ||||||||||||||||||
Mastercard, Inc. | 340.00 | USD | 8/21/20 | (30 | ) | (3,000 | ) | (1,530 | ) | (2,728 | ) | 1,198 | |||||||||||||||||||
McDonald's Corp. | 220.00 | USD | 8/21/20 | (30 | ) | (3,000 | ) | (135 | ) | (1,148 | ) | 1,013 | |||||||||||||||||||
Merck & Co., Inc. | 85.00 | USD | 8/21/20 | (36 | ) | (3,600 | ) | (1,638 | ) | (1,000 | ) | (638 | ) | ||||||||||||||||||
Netflix, Inc. | 675.00 | USD | 8/21/20 | (16 | ) | (1,600 | ) | (304 | ) | (20,406 | ) | 20,102 | |||||||||||||||||||
Nike, Inc. | 110.00 | USD | 8/21/20 | (35 | ) | (3,500 | ) | (297 | ) | (2,274 | ) | 1,977 | |||||||||||||||||||
NVIDIA Corp. | 510.00 | USD | 8/21/20 | (20 | ) | (2,000 | ) | (5,160 | ) | (10,519 | ) | 5,359 | |||||||||||||||||||
PayPal Holdings, Inc. | 220.00 | USD | 8/21/20 | (39 | ) | (3,900 | ) | (2,808 | ) | (3,199 | ) | 391 | |||||||||||||||||||
ServiceNow, Inc. | 520.00 | USD | 8/21/20 | (14 | ) | (1,400 | ) | (840 | ) | (2,887 | ) | 2,047 | |||||||||||||||||||
Tesla, Inc. | 2,000.00 | USD | 8/21/20 | (1 | ) | (100 | ) | (495 | ) | (7,366 | ) | 6,871 | |||||||||||||||||||
Visa, Inc. | 215.00 | USD | 8/21/20 | (57 | ) | (5,700 | ) | (912 | ) | (3,845 | ) | 2,933 | |||||||||||||||||||
Zoom Video Communications, Inc. | 300.00 | USD | 8/21/20 | (15 | ) | (1,500 | ) | (1,125 | ) | (1,464 | ) | 339 | |||||||||||||||||||
Total options written contracts | $ | (27,491 | ) | $ | (72,477 | ) | $ | 44,986 | |||||||||||||||||||||||
(m) Fair Value Measurements–See Note 1(b) in the Notes to Financial Statements.
| Level 1 – Quoted Prices | Level 2 – Other Significant Observable Inputs | Level 3 – Significant Unobservable Inputs | Value at 7/31/20 | ||||||||||||||||
Investments in Securities – Assets | |||||||||||||||||||
Convertible Bonds & Notes | $ | – | $ | 198,906,065 | $ | – | $ | 198,906,065 | |||||||||||
Common Stock: | |||||||||||||||||||
Banks | 734,464 | – | 1 | 734,465 | |||||||||||||||
Media | – | – | 1 | 1 | |||||||||||||||
All Other | 87,721,789 | – | – | 87,721,789 | |||||||||||||||
26 Semi-Annual Report | July 31, 2020
Schedule of Investments
AllianzGI Diversified Income & Convertible Fund
July 31, 2020 (unaudited) (continued)
| Level 1 – Quoted Prices | Level 2 – Other Significant Observable Inputs | Level 3 – Significant Unobservable Inputs | Value at 7/31/20 | ||||||||||||||||
Corporate Bonds & Notes: | |||||||||||||||||||
Commercial Services | $ | – | $ | 2,870,840 | $ | 6,416 | $ | 2,877,256 | |||||||||||
Diversified Financial Services | – | 3,535,355 | 508,397 | 4,043,752 | |||||||||||||||
All Other | – | 51,982,972 | – | 51,982,972 | |||||||||||||||
Convertible Preferred Stock: | |||||||||||||||||||
Diversified Financial Services | – | 1,711,100 | – | 1,711,100 | |||||||||||||||
All Other | 34,546,750 | – | – | 34,546,750 | |||||||||||||||
Preferred Stock | – | – | 889,722 | 889,722 | |||||||||||||||
Warrants | – | – | – | † | – | † | |||||||||||||
Repurchase Agreements | – | 8,556,000 | – | 8,556,000 | |||||||||||||||
123,003,003 | 267,562,332 | 1,404,537 | 391,969,872 | ||||||||||||||||
Investments in Securities – Liabilities | |||||||||||||||||||
Options Written: | |||||||||||||||||||
Market Price | (27,491 | ) | – | – | (27,491 | ) | |||||||||||||
Totals | $ | 122,975,512 | $ | 267,562,332 | $ | 1,404,537 | $ | 391,942,381 | |||||||||||
A roll forward of fair value measurements using significant unobservable inputs (Level 3) for the six months ended July 31, 2020, was as follows:
| Beginning Balance 1/31/20 | Purchases | Sales | Accrued Discount (Premiums) | Net Realized Gain (Loss) | Net Change in Unrealized Appreciation/ Depreciation | Transfers into Level 3 | Transfers out of Level 3 | Ending Balance 7/31/20 | |||||||||||||||||||||||||||||||
Investments in Securities – Assets | |||||||||||||||||||||||||||||||||||||||
Common Stock: | |||||||||||||||||||||||||||||||||||||||
Banks | $ | 1 | $ | – | – | $ | – | – | $ | – | – | – | $ | 1 | |||||||||||||||||||||||||
Media | 1 | – | – | – | – | – | – | – | 1 | ||||||||||||||||||||||||||||||
Corporate Bonds & Notes: | |||||||||||||||||||||||||||||||||||||||
Commercial Services | 6,416 | – | – | – | – | – | – | – | 6,416 | ||||||||||||||||||||||||||||||
| Diversified Financial Services | 774,754 | 95,621 | – | 16,063 | – | (378,041 | ) | – | – | 508,397 | |||||||||||||||||||||||||||||
Preferred Stock: | |||||||||||||||||||||||||||||||||||||||
Media | 1,230,371 | – | – | – | – | (340,649 | ) | – | – | 889,722 | |||||||||||||||||||||||||||||
Warrants | – | † | – | – | – | – | – | – | – | – | † | ||||||||||||||||||||||||||||
Totals | $ | 2,011,543 | $ | 95,621 | – | $ | 16,063 | – | $ | (718,690 | ) | – | – | $ | 1,404,537 | ||||||||||||||||||||||||
† Actual amount rounds to less than $1.
The table above includes Level 3 investments that are valued by brokers or independent pricing services. The inputs for these investments are not readily available or cannot be reasonably estimated and are generally those inputs described in Note 1(b).
July 31, 2020 | Semi-Annual Report 27
Schedule of Investments
AllianzGI Diversified Income & Convertible Fund
July 31, 2020 (unaudited) (continued)
The following table presents additional information about valuation techniques and inputs used for investments that are measured at fair value and categorized within Level 3 at July 31, 2020:
| Ending Balance at 7/31/20 | Valuation Technique Used | Unobservable Inputs | Input Values (Range) | ||||||||||||||||
Investments in Securities – Assets | |||||||||||||||||||
| Corporate Bonds & Notes: Diversified Financial Services | $ | 508,397 | Market and Company Comparables | EV Multiples Illiquidity Discount | 1.02x (0.66x – 1.64x) 3.04x (1.02x – 4.67x) 0.64x (0.38x – 0.78x) 20% | ||||||||||||||
| Preferred Stock: Media | $ | 79,534 | Market and Company Comparables | EV Multiples Illiquidity Discount | 0.58x (0.17x – 0.97x) (1% – 30%) | ||||||||||||||
| | $ | 810,175 | Market and Company Comparables | EV Multiples Illiquidity Discount | 0.58x (0.17x – 0.97x) (1% – 30%) | ||||||||||||||
The table above does not include Level 3 investments that are valued by brokers or independent pricing services.
The net change in unrealized appreciation/depreciation of Level 3 investments held at July 31, 2020 was $(718,690).
(n) The following is a summary of the Fund's derivatives categorized by risk exposure.
The effect of derivatives on the Fund's Statements of Assets and Liabilities at July 31, 2020:
Location | Market Price | ||||||
Liability derivatives: | |||||||
Options written, at value | $ | (27,491 | ) | ||||
The effect of derivatives on the Fund's Statements of Operations for the six months ended July 31, 2020:
Location | Market Price | ||||||
Net realized loss on: | |||||||
Options written | $ | (200,339 | ) | ||||
Net change in unrealized appreciation/depreciation of: | |||||||
Options written | $ | 30,895 | |||||
The average volume (based on the open positions at each month-end) of derivative activity during the six months ended July 31, 2020 was 848 call options written contracts.
Glossary:
ADR - American Depositary Receipt
PIK - Payment-in-Kind
REIT - Real Estate Investment Trust
28 Semi-Annual Report | July 31, 2020 | See accompanying Notes to Financial Statements
Schedule of Investments
AllianzGI Dividend, Interest & Premium Strategy Fund
(formerly AllianzGI NFJ Dividend, Interest & Premium Strategy Fund)†
July 31, 2020 (unaudited)
Shares | Value | ||||||||||
Common Stock – 63.1% | |||||||||||
Aerospace & Defense – 1.4% | |||||||||||
46,267 | Lockheed Martin Corp. | $ | 17,533,805 | ||||||||
Banks – 3.3% | |||||||||||
473,266 | Bank of America Corp. | 11,774,858 | |||||||||
225,008 | Citigroup, Inc. | 11,252,650 | |||||||||
37,770 | First Republic Bank | 4,248,370 | |||||||||
163,500 | JPMorgan Chase & Co. (g) | 15,800,640 | |||||||||
43,076,518 | |||||||||||
Beverages – 0.3% | |||||||||||
87,841 | Coca-Cola Co. | 4,149,609 | |||||||||
Biotechnology – 0.7% | |||||||||||
36,157 | Amgen, Inc. | 8,846,533 | |||||||||
Capital Markets – 3.2% | |||||||||||
38,057 | CME Group, Inc. | 6,324,312 | |||||||||
108,224 | Intercontinental Exchange, Inc. | 10,473,919 | |||||||||
16,265 | MarketAxess Holdings, Inc. | 8,404,126 | |||||||||
169,780 | Morgan Stanley (g) | 8,298,846 | |||||||||
63,881 | Nasdaq, Inc. | 8,388,214 | |||||||||
41,889,417 | |||||||||||
Chemicals – 1.2% | |||||||||||
69,051 | Celanese Corp. | 6,711,757 | |||||||||
34,091 | Linde PLC | 8,356,045 | |||||||||
15,067,802 | |||||||||||
Communications Equipment – 0.7% | |||||||||||
181,786 | Cisco Systems, Inc. | 8,562,121 | |||||||||
Construction & Engineering – 0.5% | |||||||||||
85,817 | EMCOR Group, Inc. | 5,878,464 | |||||||||
Consumer Finance – 0.3% | |||||||||||
44,241 | �� | American Express Co. | 4,128,570 | ||||||||
Containers & Packaging – 0.6% | |||||||||||
69,345 | Avery Dennison Corp. | 7,859,562 | |||||||||
Diversified Telecommunication Services – 0.7% | |||||||||||
146,729 | Frontier Communications Corp. (i) | 13,719 | |||||||||
149,423 | Verizon Communications, Inc. | 8,588,834 | |||||||||
8,602,553 | |||||||||||
Electric Utilities – 2.3% | |||||||||||
146,824 | Alliant Energy Corp. | 7,906,472 | |||||||||
75,682 | NextEra Energy, Inc. (g) | 21,243,938 | |||||||||
29,150,410 | |||||||||||
Electrical Equipment – 0.7% | |||||||||||
94,517 | AMETEK, Inc. | 8,813,710 | |||||||||
Entertainment – 1.3% | |||||||||||
34,416 | Netflix, Inc. (i) | 16,825,294 | |||||||||
July 31, 2020 | Semi-Annual Report 29
Schedule of Investments
AllianzGI Dividend, Interest & Premium Strategy Fund
(formerly AllianzGI NFJ Dividend, Interest & Premium Strategy Fund)†
July 31, 2020 (unaudited) (continued)
Shares | Value | ||||||||||
Equity Real Estate Investment Trusts (REITs) – 4.9% | |||||||||||
25,401 | Alexandria Real Estate Equities, Inc. | $ | 4,509,948 | ||||||||
33,522 | American Tower Corp. | 8,762,316 | |||||||||
41,958 | CoreSite Realty Corp. | 5,414,680 | |||||||||
74,402 | Crown Castle International Corp. | 12,402,813 | |||||||||
96,059 | CyrusOne, Inc. | 8,013,242 | |||||||||
5,693 | Equinix, Inc. | 4,471,738 | |||||||||
67,270 | Prologis, Inc. | 7,091,603 | |||||||||
85,437 | Sun Communities, Inc. | 12,809,569 | |||||||||
63,475,909 | |||||||||||
Food & Staples Retailing – 0.7% | |||||||||||
29,288 | Costco Wholesale Corp. | 9,534,123 | |||||||||
Food Products – 0.5% | |||||||||||
112,008 | Mondelez International, Inc., Class A | 6,215,324 | |||||||||
Gas Utilities – 1.0% | |||||||||||
119,131 | Atmos Energy Corp. | 12,626,695 | |||||||||
Healthcare Equipment & Supplies – 1.6% | |||||||||||
86,550 | Medtronic PLC | 8,350,344 | |||||||||
62,667 | Stryker Corp. | 12,113,531 | |||||||||
20,463,875 | |||||||||||
Healthcare Providers & Services – 1.4% | |||||||||||
27,140 | Anthem, Inc. | 7,430,932 | |||||||||
33,297 | UnitedHealth Group, Inc. | 10,081,666 | |||||||||
17,512,598 | |||||||||||
Hotels, Restaurants & Leisure – 2.1% | |||||||||||
98,494 | McDonald's Corp. (g) | 19,135,414 | |||||||||
111,677 | Starbucks Corp. | 8,546,641 | |||||||||
27,682,055 | |||||||||||
Household Products – 1.1% | |||||||||||
148,418 | Church & Dwight Co., Inc. | 14,297,106 | |||||||||
Industrial Conglomerates – 0.9% | |||||||||||
79,373 | Honeywell International, Inc. | 11,855,945 | |||||||||
Insurance – 0.8% | |||||||||||
60,361 | Allstate Corp. | 5,697,475 | |||||||||
21,861 | Willis Towers Watson PLC | 4,591,028 | |||||||||
10,288,503 | |||||||||||
Interactive Media & Services – 1.5% | |||||||||||
10,640 | Alphabet, Inc., Class A (i) | 15,831,788 | |||||||||
2,796 | Alphabet, Inc., Class C (i) | 4,146,356 | |||||||||
19,978,144 | |||||||||||
Internet & Direct Marketing Retail – 2.6% | |||||||||||
67,149 | Alibaba Group Holding Ltd., ADR (i) | 16,855,742 | |||||||||
5,316 | Amazon.com, Inc. (g)(i) | 16,823,439 | |||||||||
33,679,181 | |||||||||||
30 Semi-Annual Report | July 31, 2020
Schedule of Investments
AllianzGI Dividend, Interest & Premium Strategy Fund
(formerly AllianzGI NFJ Dividend, Interest & Premium Strategy Fund)†
July 31, 2020 (unaudited) (continued)
Shares | Value | ||||||||||
IT Services – 4.0% | |||||||||||
37,497 | Accenture PLC, Class A | $ | 8,428,576 | ||||||||
80,039 | Broadridge Financial Solutions, Inc. | 10,752,439 | |||||||||
49,336 | Global Payments, Inc. | 8,782,795 | |||||||||
27,069 | Mastercard, Inc., Class A | 8,351,599 | |||||||||
36,786 | VeriSign, Inc. (i) | 7,786,860 | |||||||||
41,903 | Visa, Inc., Class A | 7,978,331 | |||||||||
52,080,600 | |||||||||||
Life Sciences Tools & Services – 2.3% | |||||||||||
86,999 | Agilent Technologies, Inc. | 8,380,614 | |||||||||
50,642 | Thermo Fisher Scientific, Inc. | 20,963,256 | |||||||||
29,343,870 | |||||||||||
Machinery – 0.3% | |||||||||||
59,150 | Toro Co. | 4,220,352 | |||||||||
Multi-Utilities – 0.7% | |||||||||||
74,644 | DTE Energy Co. | 8,631,086 | |||||||||
Oil, Gas & Consumable Fuels – 1.3% | |||||||||||
87,000 | Chevron Corp. | 7,302,780 | |||||||||
143,770 | Marathon Petroleum Corp. | 5,492,014 | |||||||||
123,943 | ONEOK, Inc. | 3,459,249 | |||||||||
193,488 | Southwestern Energy Co. (i) | 470,176 | |||||||||
16,724,219 | |||||||||||
Personal Products – 1.3% | |||||||||||
65,130 | Estee Lauder Cos., Inc., Class A | 12,865,780 | |||||||||
69,751 | Unilever NV | 4,117,402 | |||||||||
16,983,182 | |||||||||||
Pharmaceuticals – 2.2% | |||||||||||
85,480 | Johnson & Johnson (g) | 12,459,565 | |||||||||
174,045 | Merck & Co., Inc. | 13,965,371 | |||||||||
118,438 | Teva Pharmaceutical Industries Ltd., ADR (i) | 1,366,774 | |||||||||
27,791,710 | |||||||||||
Professional Services – 0.6% | |||||||||||
93,298 | TransUnion | 8,356,702 | |||||||||
Road & Rail – 0.7% | |||||||||||
46,670 | Norfolk Southern Corp. | 8,970,441 | |||||||||
Semiconductors & Semiconductor Equipment – 2.7% | |||||||||||
53,197 | Broadcom, Inc. | 16,850,150 | |||||||||
29,825 | KLA Corp. | 5,959,930 | |||||||||
95,020 | Teradyne, Inc. | 8,452,979 | |||||||||
33,030 | Texas Instruments, Inc. | 4,212,976 | |||||||||
35,476,035 | |||||||||||
Software – 5.6% | |||||||||||
32,426 | Adobe, Inc. (i) | 14,407,520 | |||||||||
29,028 | Intuit, Inc. | 8,893,308 | |||||||||
197,176 | Microsoft Corp. (g) | 40,423,052 | |||||||||
July 31, 2020 | Semi-Annual Report 31
Schedule of Investments
AllianzGI Dividend, Interest & Premium Strategy Fund
(formerly AllianzGI NFJ Dividend, Interest & Premium Strategy Fund)†
July 31, 2020 (unaudited) (continued)
Shares | Value | ||||||||||
| Software (continued) | |||||||||||
167,826 | Oracle Corp. | $ | 9,305,952 | ||||||||
73,029,832 | |||||||||||
Specialty Retail – 1.3% | |||||||||||
61,228 | Home Depot, Inc. | 16,255,422 | |||||||||
Technology Hardware, Storage & Peripherals – 2.2% | |||||||||||
65,663 | Apple, Inc. (g) | 27,909,401 | |||||||||
Textiles, Apparel & Luxury Goods – 0.6% | |||||||||||
84,291 | NIKE, Inc., Class B (g) | 8,227,644 | |||||||||
Water Utilities – 1.0% | |||||||||||
88,775 | American Water Works Co., Inc. (g) | 13,073,894 | |||||||||
Total Common Stock (cost-$789,359,754) | 815,068,216 | ||||||||||
| Principal Amount (000s) | | ||||||||||
Convertible Bonds & Notes – 26.7% | |||||||||||
Airlines – 0.4% | |||||||||||
$ | 2,105 | American Airlines Group, Inc., 6.50%, 7/1/25 | 1,748,261 | ||||||||
3,090 | Southwest Airlines Co., 1.25%, 5/1/25 | 3,597,233 | |||||||||
5,345,494 | |||||||||||
Auto Components – 0.2% | |||||||||||
2,605 | Meritor, Inc., 3.25%, 10/15/37 | 2,691,280 | |||||||||
Auto Manufacturers – 1.1% | |||||||||||
3,680 | Tesla, Inc., 1.25%, 3/1/21 | 14,639,500 | |||||||||
Banks – 0.3% | |||||||||||
1,965 | BofA Finance LLC, 0.125%, 9/1/22 | 2,137,920 | |||||||||
1,875 | JPMorgan Chase Bank N.A., 0.125%, 1/1/23 (a)(b) | 2,231,250 | |||||||||
4,369,170 | |||||||||||
Beverages – 0.0% | |||||||||||
155 | Luckin Coffee, Inc., 0.75%, 1/15/25 (a)(b) | 65,100 | |||||||||
Biotechnology – 1.8% | |||||||||||
BioMarin Pharmaceutical, Inc., | |||||||||||
455 | 0.599%, 8/1/24 | 549,791 | |||||||||
920 | 1.25%, 5/15/27 (a)(b) | 1,071,739 | |||||||||
Exact Sciences Corp., | |||||||||||
4,915 | 0.375%, 3/15/27 | 5,426,263 | |||||||||
1,100 | 0.375%, 3/1/28 | 1,132,527 | |||||||||
1,885 | Halozyme Therapeutics, Inc., 1.25%, 12/1/24 (a)(b) | 2,490,556 | |||||||||
1,680 | Illumina, Inc., 0.50%, 6/15/21 | 2,582,607 | |||||||||
2,205 | Intercept Pharmaceuticals, Inc., 3.25%, 7/1/23 | 1,741,767 | |||||||||
700 | Ligand Pharmaceuticals, Inc., 0.75%, 5/15/23 | 643,303 | |||||||||
1,405 | Livongo Health, Inc., 0.875%, 6/1/25 (a)(b) | 2,600,128 | |||||||||
PTC Therapeutics, Inc., | |||||||||||
1,565 | 1.50%, 9/15/26 (a)(b) | 1,766,579 | |||||||||
32 Semi-Annual Report | July 31, 2020
Schedule of Investments
AllianzGI Dividend, Interest & Premium Strategy Fund
(formerly AllianzGI NFJ Dividend, Interest & Premium Strategy Fund)†
July 31, 2020 (unaudited) (continued)
| Principal Amount (000s) | Value | ||||||||||
| Biotechnology (continued) | |||||||||||
$ | 2,765 | 3.00%, 8/15/22 | $ | 3,108,811 | |||||||
23,114,071 | |||||||||||
Commercial Services – 0.8% | |||||||||||
3,005 | Chegg, Inc., 0.125%, 3/15/25 | 5,022,875 | |||||||||
Square, Inc., | |||||||||||
905 | 0.125%, 3/1/25 (a)(b) | 1,203,857 | |||||||||
2,530 | 0.50%, 5/15/23 | 4,520,370 | |||||||||
10,747,102 | |||||||||||
Computers – 1.2% | |||||||||||
Lumentum Holdings, Inc., | |||||||||||
340 | 0.25%, 3/15/24 | 555,205 | |||||||||
3,830 | 0.50%, 12/15/26 (a)(b) | 4,482,676 | |||||||||
2,570 | Pure Storage, Inc., 0.125%, 4/15/23 | 2,585,406 | |||||||||
3,910 | Western Digital Corp., 1.50%, 2/1/24 | 3,796,816 | |||||||||
3,210 | Zscaler, Inc., 0.125%, 7/1/25 (a)(b) | 3,658,179 | |||||||||
15,078,282 | |||||||||||
Diversified Financial Services – 0.1% | |||||||||||
1,315 | LendingTree, Inc., 0.50%, 7/15/25 (a)(b) | 1,371,663 | |||||||||
Electronics – 0.4% | |||||||||||
1,745 | Fortive Corp., 0.875%, 2/15/22 | 1,744,951 | |||||||||
730 | OSI Systems, Inc., 1.25%, 9/1/22 | 713,575 | |||||||||
1,915 | SMART Global Holdings, Inc., 2.25%, 2/15/26 (a)(b) | 1,782,307 | |||||||||
1,590 | Vishay Intertechnology, Inc., 2.25%, 6/15/25 | 1,528,488 | |||||||||
5,769,321 | |||||||||||
Energy-Alternate Sources – 0.1% | |||||||||||
2,195 | SunPower Corp., 4.00%, 1/15/23 | 1,936,318 | |||||||||
Engineering & Construction – 0.2% | |||||||||||
1,745 | KBR, Inc., 2.50%, 11/1/23 | 1,975,149 | |||||||||
Entertainment – 0.3% | |||||||||||
Live Nation Entertainment, Inc., | |||||||||||
815 | 2.00%, 2/15/25 (a)(b) | 712,800 | |||||||||
2,465 | 2.50%, 3/15/23 | 2,577,356 | |||||||||
3,290,156 | |||||||||||
Equity Real Estate Investment Trusts (REITs) – 0.3% | |||||||||||
3,460 | Two Harbors Investment Corp., 6.25%, 1/15/22 | 3,507,575 | |||||||||
Healthcare-Products – 0.9% | |||||||||||
4,940 | Insulet Corp., 0.375%, 9/1/26 (a)(b) | 5,704,267 | |||||||||
2,365 | NuVasive, Inc., 2.25%, 3/15/21 | 2,636,975 | |||||||||
1,880 | Repligen Corp., 0.375%, 7/15/24 | 2,742,544 | |||||||||
11,083,786 | |||||||||||
Healthcare-Services – 0.4% | |||||||||||
4,325 | Teladoc Health, Inc., 1.25%, 6/1/27 (a)(b) | 5,571,117 | |||||||||
July 31, 2020 | Semi-Annual Report 33
Schedule of Investments
AllianzGI Dividend, Interest & Premium Strategy Fund
(formerly AllianzGI NFJ Dividend, Interest & Premium Strategy Fund)†
July 31, 2020 (unaudited) (continued)
| Principal Amount (000s) | Value | ||||||||||
Internet – 4.5% | |||||||||||
$ | 2,840 | Boingo Wireless, Inc., 1.00%, 10/1/23 | $ | 2,556,191 | |||||||
1,385 | Booking Holdings, Inc., 0.75%, 5/1/25 (a)(b) | 1,749,948 | |||||||||
3,620 | Etsy, Inc., 0.125%, 10/1/26 (a)(b) | 5,504,293 | |||||||||
3,760 | Match Group Financeco 2, Inc., 0.875%, 6/15/26 (a)(b) | 5,183,651 | |||||||||
1,660 | Match Group Financeco 3, Inc., 2.00%, 1/15/30 (a)(b) | 2,424,108 | |||||||||
Okta, Inc. (a)(b), | |||||||||||
3,045 | 0.125%, 9/1/25 | 4,124,086 | |||||||||
1,480 | 0.375%, 6/15/26 | 1,740,215 | |||||||||
Palo Alto Networks, Inc., | |||||||||||
1,245 | 0.75%, 7/1/23 | 1,439,346 | |||||||||
3,675 | 0.375%, 6/1/25 (a)(b) | 3,994,984 | |||||||||
3,375 | Proofpoint, Inc., 0.25%, 8/15/24 (a)(b) | 3,474,311 | |||||||||
4,625 | Snap, Inc., 0.75%, 8/1/26 (a)(b) | 5,815,937 | |||||||||
3,680 | Twitter, Inc., 0.25%, 6/15/24 | 3,818,000 | |||||||||
Wayfair, Inc., | |||||||||||
2,165 | 1.00%, 8/15/26 (a)(b) | 4,083,079 | |||||||||
830 | 1.125%, 11/1/24 | 1,947,516 | |||||||||
3,230 | Zendesk, Inc., 0.625%, 6/15/25 (a)(b) | 3,656,054 | |||||||||
Zillow Group, Inc., | |||||||||||
1,850 | 1.50%, 7/1/23 | 2,123,257 | |||||||||
3,045 | 2.75%, 5/15/25 | 4,009,149 | |||||||||
57,644,125 | |||||||||||
Investment Companies – 0.3% | |||||||||||
4,155 | Prospect Capital Corp., 6.375%, 3/1/25 | 4,175,402 | |||||||||
Iron/Steel – 0.1% | |||||||||||
925 | Cleveland-Cliffs, Inc., 1.50%, 1/15/25 | 808,584 | |||||||||
Leisure – 0.5% | |||||||||||
NCL Corp., Ltd. (a)(b), | |||||||||||
615 | 5.375%, 8/1/25 | 575,017 | |||||||||
2,325 | 6.00%, 5/15/24 | 2,741,826 | |||||||||
3,205 | Royal Caribbean Cruises Ltd., 4.25%, 6/15/23 (a)(b) | 3,055,501 | |||||||||
6,372,344 | |||||||||||
Media – 1.3% | |||||||||||
DISH Network Corp., | |||||||||||
2,300 | 2.375%, 3/15/24 | 2,116,856 | |||||||||
6,545 | 3.375%, 8/15/26 | 6,041,885 | |||||||||
Liberty Media Corp., | |||||||||||
1,795 | 1.00%, 1/30/23 | 2,094,411 | |||||||||
1,865 | 1.375%, 10/15/23 | 2,036,831 | |||||||||
3,955 | 2.75%, 12/1/49 (a)(b) | 3,793,339 | |||||||||
325 | World Wrestling Entertainment, Inc., 3.375%, 12/15/23 | 641,649 | |||||||||
16,724,971 | |||||||||||
Oil, Gas & Consumable Fuels – 0.6% | |||||||||||
4,240 | Chesapeake Energy Corp., 5.50%, 9/15/26 (c) | 192,920 | |||||||||
2,400 | Ensco Jersey Finance Ltd., 3.00%, 1/31/24 | 288,000 | |||||||||
1,560 | EQT Corp., 1.75%, 5/1/26 (a)(b) | 1,885,941 | |||||||||
34 Semi-Annual Report | July 31, 2020
Schedule of Investments
AllianzGI Dividend, Interest & Premium Strategy Fund
(formerly AllianzGI NFJ Dividend, Interest & Premium Strategy Fund)†
July 31, 2020 (unaudited) (continued)
| Principal Amount (000s) | Value | ||||||||||
| Oil, Gas & Consumable Fuels (continued) | |||||||||||
$ | 2,000 | Nabors Industries, Inc., 0.75%, 1/15/24 | $ | 620,624 | |||||||
465 | Oil States International, Inc., 1.50%, 2/15/23 | 241,116 | |||||||||
2,620 | Pioneer Natural Resources Co., 0.25%, 5/15/25 (a)(b) | 3,109,940 | |||||||||
2,385 | Transocean, Inc., 0.50%, 1/30/23 | 916,393 | |||||||||
7,254,934 | |||||||||||
Pharmaceuticals – 0.9% | |||||||||||
DexCom, Inc., | |||||||||||
7,060 | 0.25%, 11/15/25 (a)(b) | 7,646,862 | |||||||||
145 | 0.75%, 12/1/23 | 387,966 | |||||||||
1,520 | Flexion Therapeutics, Inc., 3.375%, 5/1/24 | 1,296,750 | |||||||||
1,115 | Sarepta Therapeutics, Inc., 1.50%, 11/15/24 | 2,472,233 | |||||||||
11,803,811 | |||||||||||
Pipelines – 0.4% | |||||||||||
7,160 | Cheniere Energy, Inc., 4.25%, 3/15/45 | 4,688,413 | |||||||||
Retail – 0.4% | |||||||||||
1,135 | Burlington Stores, Inc., 2.25%, 4/15/25 (a)(b) | 1,275,748 | |||||||||
630 | Guess?, Inc., 2.00%, 4/15/24 | 435,177 | |||||||||
2,520 | RH, zero coupon, 6/15/23 | 3,984,369 | |||||||||
5,695,294 | |||||||||||
Semiconductors – 2.1% | |||||||||||
95 | Advanced Micro Devices, Inc., 2.125%, 9/1/26 | 917,425 | |||||||||
2,390 | Cree, Inc., 0.875%, 9/1/23 | 3,141,867 | |||||||||
3,215 | Inphi Corp., 0.75%, 4/15/25 (a)(b) | 4,201,169 | |||||||||
7,910 | Microchip Technology, Inc., 1.625%, 2/15/27 | 11,558,883 | |||||||||
255 | Micron Technology, Inc., 3.125%, 5/1/32, Ser. D | 1,267,828 | |||||||||
3,165 | ON Semiconductor Corp., 1.625%, 10/15/23 | 3,963,565 | |||||||||
1,290 | Veeco Instruments, Inc., 3.75%, 6/1/27 (a)(b) | 1,494,224 | |||||||||
26,544,961 | |||||||||||
Software – 6.4% | |||||||||||
4,870 | Akamai Technologies, Inc., 0.125%, 5/1/25 | 6,342,907 | |||||||||
4,165 | Alteryx, Inc., 0.50%, 8/1/24 (a)(b) | 4,999,441 | |||||||||
1,010 | Atlassian, Inc., 0.625%, 5/1/23 | 2,209,487 | |||||||||
1,065 | Cloudflare, Inc., 0.75%, 5/15/25 (a)(b) | 1,426,434 | |||||||||
5,340 | Coupa Software, Inc., 0.375%, 6/15/26 (a)(b) | 6,695,435 | |||||||||
2,905 | Datadog, Inc., 0.125%, 6/15/25 (a)(b) | 3,681,845 | |||||||||
785 | DocuSign, Inc., 0.50%, 9/15/23 | 2,389,805 | |||||||||
1,770 | Everbridge, Inc., 0.125%, 12/15/24 (a)(b) | 2,509,250 | |||||||||
2,220 | Evolent Health, Inc., 1.50%, 10/15/25 | 1,653,810 | |||||||||
2,665 | Five9, Inc., 0.50%, 6/1/25 (a)(b) | 3,084,738 | |||||||||
2,035 | HubSpot, Inc., 0.375%, 6/1/25 (a)(b) | 2,285,813 | |||||||||
2,990 | j2 Global, Inc., 1.75%, 11/1/26 (a)(b) | 2,283,768 | |||||||||
3,925 | MongoDB, Inc., 0.25%, 1/15/26 (a)(b) | 5,100,397 | |||||||||
July 31, 2020 | Semi-Annual Report 35
Schedule of Investments
AllianzGI Dividend, Interest & Premium Strategy Fund
(formerly AllianzGI NFJ Dividend, Interest & Premium Strategy Fund)†
July 31, 2020 (unaudited) (continued)
| Principal Amount (000s) | Value | ||||||||||
| Software (continued) | |||||||||||
$ | 2,125 | New Relic, Inc., 0.50%, 5/1/23 | $ | 2,122,384 | |||||||
2,705 | Nutanix, Inc., zero coupon, 1/15/23 | 2,496,890 | |||||||||
1,945 | Pegasystems, Inc., 0.75%, 3/1/25 (a)(b) | 2,186,269 | |||||||||
2,130 | Pluralsight, Inc., 0.375%, 3/1/24 | 1,986,611 | |||||||||
4,860 | RingCentral, Inc., zero coupon, 3/1/25 (a)(b) | 5,348,725 | |||||||||
1,235 | Sea Ltd., 2.375%, 12/1/25 (a)(b) | 1,913,903 | |||||||||
1,130 | ServiceNow, Inc., zero coupon, 6/1/22 | 3,684,545 | |||||||||
2,350 | Slack Technologies, Inc., 0.50%, 4/15/25 (a)(b) | 2,889,867 | |||||||||
7,115 | Splunk, Inc., 1.125%, 6/15/27 (a)(b) | 8,088,291 | |||||||||
2,820 | Workday, Inc., 0.25%, 10/1/22 | 3,805,965 | |||||||||
2,805 | Zynga, Inc., 0.25%, 6/1/24 | 3,763,959 | |||||||||
82,950,539 | |||||||||||
Telecommunications – 0.4% | |||||||||||
110 | Infinera Corp., 2.125%, 9/1/24 | 112,862 | |||||||||
2,950 | Viavi Solutions, Inc., 1.00%, 3/1/24 | 3,624,753 | |||||||||
1,290 | Vonage Holdings Corp., 1.75%, 6/1/24 | 1,314,011 | |||||||||
5,051,626 | |||||||||||
Transportation – 0.3% | |||||||||||
2,420 | Atlas Air Worldwide Holdings, Inc., 2.25%, 6/1/22 | 2,492,600 | |||||||||
2,065 | Greenbrier Cos., Inc., 2.875%, 2/1/24 | 1,843,088 | |||||||||
4,335,688 | |||||||||||
Total Convertible Bonds & Notes (cost-$310,549,335) | 344,605,776 | ||||||||||
Shares | |||||||||||
Convertible Preferred Stock – 6.2% | |||||||||||
Auto Components – 0.3% | |||||||||||
40,875 | Aptiv PLC, 5.50%, 6/15/23, Ser. A | 4,177,834 | |||||||||
Banks – 1.2% | |||||||||||
4,995 | Bank of America Corp., 7.25%, Ser. L (e) | 7,487,555 | |||||||||
6,055 | Wells Fargo & Co., 7.50%, Ser. L (e) | 8,183,332 | |||||||||
15,670,887 | |||||||||||
Chemicals – 0.3% | |||||||||||
72,875 | International Flavors & Fragrances, Inc., 6.00%, 9/15/21 | 3,334,760 | |||||||||
Diversified Financial Services – 0.2% | |||||||||||
1,700 | 2020 Mandatory Exchangeable Trust., 6.50%, 5/16/23 (a)(b) | 2,048,500 | |||||||||
Electric Utilities – 0.6% | |||||||||||
77,170 | NextEra Energy, Inc., 5.279%, 3/1/23 | 3,738,115 | |||||||||
24,295 | Sempra Energy, 6.00%, 1/15/21, Ser. A | 2,481,491 | |||||||||
39,150 | Southern Co., 6.75%, 8/1/22 | 1,805,598 | |||||||||
8,025,204 | |||||||||||
36 Semi-Annual Report | July 31, 2020
Schedule of Investments
AllianzGI Dividend, Interest & Premium Strategy Fund
(formerly AllianzGI NFJ Dividend, Interest & Premium Strategy Fund)†
July 31, 2020 (unaudited) (continued)
Shares | Value | ||||||||||
Electronics – 0.3% | |||||||||||
2,450 | Fortive Corp., 5.00%, 7/1/21, Ser. A | $ | 2,166,339 | ||||||||
6,350 | II-VI, Inc., 6.0%, 7/1/23, Ser. A | 1,435,284 | |||||||||
3,601,623 | |||||||||||
Environmental Services – 0.2% | |||||||||||
42,690 | GFL Environmental Inc., 6.00%, 3/15/23 | 2,362,038 | |||||||||
Equity Real Estate Investment Trusts (REITs) – 0.3% | |||||||||||
2,955 | Crown Castle International Corp., 6.875%, 8/1/20, Ser. A | 4,269,975 | |||||||||
Hand/Machine Tools – 0.0% | |||||||||||
2,535 | Stanley Black & Decker, Inc., 5.25%, 11/15/22 | 241,991 | |||||||||
Healthcare-Products – 1.4% | |||||||||||
57,740 | Avantor, Inc., 6.25%, 5/15/22, Ser. A | 4,164,786 | |||||||||
31,835 | Boston Scientific Corp., 5.50%, 6/1/23, Ser. A | 3,574,752 | |||||||||
Danaher Corp., | |||||||||||
5,070 | 4.75%, 4/15/22, Ser. A | 7,194,939 | |||||||||
2,460 | 5.00%, 4/15/23, Ser. B | 3,013,598 | |||||||||
17,948,075 | |||||||||||
Insurance – 0.1% | |||||||||||
15,750 | Assurant, Inc., 6.50%, 3/15/21, Ser. D | 1,702,418 | |||||||||
Oil, Gas & Consumable Fuels – 0.0% | |||||||||||
45,100 | ATP Oil & Gas Corp., 8.00% (cost-$4,510,000; purchased 9/23/09) (a)(b)(d)(e)(f)(h) | 4 | |||||||||
213,230 | Mesquite Energy, Inc., 6.50%, Ser. B (d)(e)(f) | 28,786 | |||||||||
15,975 | Nabors Industries Ltd., 6.00%, 5/1/21, Ser. A | 105,915 | |||||||||
134,705 | |||||||||||
Pharmaceuticals – 0.3% | |||||||||||
42,545 | Becton Dickinson and Co., 6.00%, 6/1/23, Ser. B | 2,565,463 | |||||||||
37,945 | Elanco Animal Health, Inc., 5.00%, 2/1/23 | 1,499,207 | |||||||||
4,064,670 | |||||||||||
Semiconductors – 0.6% | |||||||||||
7,025 | Broadcom, Inc., 8.00%, 9/30/22, Ser. A | 8,014,893 | |||||||||
Telecommunications – 0.4% | |||||||||||
4,575 | 2020 Cash Mandatory Exchangeable Trust, 5.25%, 6/1/23 (a)(b) | 4,725,815 | |||||||||
Total Convertible Preferred Stock (cost-$86,221,318) | 80,323,388 | ||||||||||
July 31, 2020 | Semi-Annual Report 37
Schedule of Investments
AllianzGI Dividend, Interest & Premium Strategy Fund
(formerly AllianzGI NFJ Dividend, Interest & Premium Strategy Fund)†
July 31, 2020 (unaudited) (continued)
| Principal Amount (000s) | Value | ||||||||||
Corporate Bonds & Notes – 0.0% | |||||||||||
Oil, Gas & Consumable Fuels – 0.0% | |||||||||||
$ | 4,647 | Cobalt International Energy, Inc., 7.75%, 12/1/23 (c) (cost-$1,873,281) | $ | 143,639 | |||||||
Repurchase Agreements – 4.1% | |||||||||||
53,273 | State Street Bank and Trust Co., dated 7/31/20, 0.00%, due 8/3/20, proceeds $53,273,000; collateralized by U.S. Treasury Notes, 1.125%, due 2/28/25, valued at $54,338,604 including accrued interest (cost-$53,273,000) | 53,273,000 | |||||||||
| Total Investments, before options written (cost-$1,241,276,688) – 100.1% | 1,293,414,019 | ||||||||||
| Total Options Written – (0.1)% (premiums received-$768,699) (i)(j)(k) | (709,168 | ) | |||||||||
| Total Investments, net of options written (cost-$1,240,507,989) – 100.0% | 1,292,704,851 | ||||||||||
Other assets less other liabilities – 0.0% | 196,869 | ||||||||||
Net Assets – 100.0% | $ | 1,292,901,720 | |||||||||
Notes to Schedule of Investments:
† Effective April 30, 2020, the AllianzGI NFJ Dividend, Interest & Premium Strategy Fund changed its name to AllianzGI Dividend, Interest & Premium Strategy Fund. See Note 10.
(a) Private Placement–Restricted as to resale and may not have a readily available market. Securities with an aggregate value of $165,510,946, representing 12.8% of net assets.
(b) 144A–Exempt from registration under Rule 144A of the Securities Act of 1933. These securities may be resold in transactions exempt from registration, typically only to qualified institutional buyers. Securities with an aggregate value of $165,510,946, representing 12.8% of net assets.
(c) In default.
(d) Fair-Valued–Securities with an aggregate value of $28,790, representing less than 0.05% of net assets. See Note 1(a) and Note 1(b) in the Notes to Financial Statements.
(e) Perpetual maturity. The date shown, if any, is the next call date.
(f) Level 3 security. See Note 1(a) and Note 1(b) in the Notes to Financial Statements.
(g) All or partial amount segregated for the benefit of the counterparty as collateral for options written.
(h) Restricted. The cost of such security is $4,510,000. The value is $4, representing less than 0.05% of net assets.
(i) Non-income producing.
(j) Exchange traded-Chicago Board Options Exchange.
38 Semi-Annual Report | July 31, 2020
Schedule of Investments
AllianzGI Dividend, Interest & Premium Strategy Fund
(formerly AllianzGI NFJ Dividend, Interest & Premium Strategy Fund)†
July 31, 2020 (unaudited) (continued)
(k) Exchange traded option contracts outstanding at July 31, 2020:
Options written contracts outstanding at July 31, 2020:
Description | Exercise Price | Expiration Date | Number of Contracts | Notional Amount | Market Value | Premiums Received | Unrealized Appreciation (Depreciation) | ||||||||||||||||||||||||
Call options: | |||||||||||||||||||||||||||||||
ADOBE, Inc. | 495.00 | USD | 8/21/20 | (130 | ) | $ | (13,000 | ) | $ | (6,825 | ) | $ | (8,475 | ) | $ | 1,650 | |||||||||||||||
Alibaba Group Holding Ltd. | 290.00 | USD | 8/21/20 | (200 | ) | (20,000 | ) | (20,400 | ) | (35,599 | ) | 15,199 | |||||||||||||||||||
Alphabet, Inc. | 1,730.00 | USD | 8/21/20 | (42 | ) | (4,200 | ) | (5,891 | ) | (40,665 | ) | 34,774 | |||||||||||||||||||
Amazon.com, Inc. | 3,560.00 | USD | 8/21/20 | (15 | ) | (1,500 | ) | (22,837 | ) | (40,618 | ) | 17,781 | |||||||||||||||||||
Apple, Inc. | 435.00 | USD | 8/21/20 | (95 | ) | (9,500 | ) | (88,113 | ) | (32,309 | ) | (55,804 | ) | ||||||||||||||||||
Apple, Inc. | 440.00 | USD | 8/21/20 | (235 | ) | (23,500 | ) | (179,188 | ) | (20,586 | ) | (158,602 | ) | ||||||||||||||||||
Bank of America Corp. | 27.00 | USD | 8/21/20 | (1,200 | ) | (120,000 | ) | (22,200 | ) | (20,399 | ) | (1,801 | ) | ||||||||||||||||||
Bank of America Corp. | 28.00 | USD | 8/21/20 | (1,200 | ) | (120,000 | ) | (10,200 | ) | (8,400 | ) | (1,800 | ) | ||||||||||||||||||
Broadcom, Inc. | 350.00 | USD | 8/21/20 | (110 | ) | (11,000 | ) | (4,675 | ) | (15,310 | ) | 10,635 | |||||||||||||||||||
Broadcom, Inc. | 360.00 | USD | 8/21/20 | (110 | ) | (11,000 | ) | (1,100 | ) | (6,405 | ) | 5,305 | |||||||||||||||||||
Chevron Corp. | 95.00 | USD | 8/21/20 | (175 | ) | (17,500 | ) | (2,800 | ) | (17,674 | ) | 14,874 | |||||||||||||||||||
Chevron Corp. | 100.00 | USD | 8/21/20 | (175 | ) | (17,500 | ) | (1,225 | ) | (6,125 | ) | 4,900 | |||||||||||||||||||
Citigroup, Inc. | 55.00 | USD | 8/21/20 | (675 | ) | (67,500 | ) | (25,650 | ) | (27,674 | ) | 2,024 | |||||||||||||||||||
Citigroup, Inc. | 57.50 | USD | 8/21/20 | (450 | ) | (45,000 | ) | (6,975 | ) | (22,049 | ) | 15,074 | |||||||||||||||||||
Estee Lauder Cos., Inc. | 220.00 | USD | 8/21/20 | (325 | ) | (32,500 | ) | (24,375 | ) | (9,500 | ) | (14,875 | ) | ||||||||||||||||||
Global Payments, Inc. | 200.00 | USD | 8/21/20 | (240 | ) | (24,000 | ) | (22,200 | ) | (16,560 | ) | (5,640 | ) | ||||||||||||||||||
Home Depot, Inc. | 295.00 | USD | 8/21/20 | (244 | ) | (24,400 | ) | (9,516 | ) | (13,939 | ) | 4,423 | |||||||||||||||||||
Honeywell International, Inc. | 162.50 | USD | 8/21/20 | (390 | ) | (39,000 | ) | (16,263 | ) | (14,430 | ) | (1,833 | ) | ||||||||||||||||||
Intuit, Inc. | 330.00 | USD | 8/21/20 | (120 | ) | (12,000 | ) | (22,200 | ) | (12,360 | ) | (9,840 | ) | ||||||||||||||||||
Johnson & Johnson | 170.00 | USD | 8/21/20 | (370 | ) | (37,000 | ) | (1,295 | ) | (8,880 | ) | 7,585 | |||||||||||||||||||
JPMorgan Chase & Co. | 110.00 | USD | 8/21/20 | (650 | ) | (65,000 | ) | (11,050 | ) | (59,800 | ) | 48,750 | |||||||||||||||||||
Marathon Petroleum Corp. | 42.50 | USD | 8/21/20 | (287 | ) | (28,700 | ) | (15,067 | ) | (33,865 | ) | 18,798 | |||||||||||||||||||
Marathon Petroleum Corp. | 45.00 | USD | 8/21/20 | (287 | ) | (28,700 | ) | (5,883 | ) | (16,932 | ) | 11,049 | |||||||||||||||||||
Mastercard, Inc. | 340.00 | USD | 8/21/20 | (110 | ) | (11,000 | ) | (5,610 | ) | (9,570 | ) | 3,960 | |||||||||||||||||||
McDonald's Corp. | 210.00 | USD | 8/21/20 | (300 | ) | (30,000 | ) | (7,650 | ) | (27,245 | ) | 19,595 | |||||||||||||||||||
McDonald's Corp. | 220.00 | USD | 8/21/20 | (100 | ) | (10,000 | ) | (450 | ) | (3,200 | ) | 2,750 | |||||||||||||||||||
Medtronic PLC | 110.00 | USD | 8/21/20 | (600 | ) | (60,000 | ) | (2,700 | ) | (11,400 | ) | 8,700 | |||||||||||||||||||
Microsoft Corp. | 222.50 | USD | 8/21/20 | (470 | ) | (47,000 | ) | (48,410 | ) | (34,835 | ) | (13,575 | ) | ||||||||||||||||||
Microsoft Corp. | 230.00 | USD | 8/21/20 | (315 | ) | (31,500 | ) | (16,380 | ) | (43,469 | ) | 27,089 | |||||||||||||||||||
Morgan Stanley | 53.50 | USD | 8/21/20 | (850 | ) | (85,000 | ) | (20,825 | ) | (22,949 | ) | 2,124 | |||||||||||||||||||
Nasdaq, Inc. | 145.00 | USD | 8/21/20 | (280 | ) | (28,000 | ) | (2,100 | ) | (13,725 | ) | 11,625 | |||||||||||||||||||
Netflix, Inc. | 555.00 | USD | 8/21/20 | (140 | ) | (14,000 | ) | (25,620 | ) | (29,819 | ) | 4,199 | |||||||||||||||||||
Nike, Inc. | 110.00 | USD | 8/21/20 | (340 | ) | (34,000 | ) | (2,890 | ) | (7,853 | ) | 4,963 | |||||||||||||||||||
Oracle Corp. | 60.00 | USD | 8/21/20 | (830 | ) | (83,000 | ) | (4,980 | ) | (5,957 | ) | 977 | |||||||||||||||||||
Starbucks Corp. | 82.50 | USD | 8/21/20 | (450 | ) | (45,000 | ) | (10,575 | ) | (20,774 | ) | 10,199 | |||||||||||||||||||
Stryker Corp. | 210.00 | USD | 8/21/20 | (170 | ) | (17,000 | ) | (17,425 | ) | (27,709 | ) | 10,284 | |||||||||||||||||||
Stryker Corp. | 220.00 | USD | 8/21/20 | (170 | ) | (17,000 | ) | (5,100 | ) | (7,480 | ) | 2,380 | |||||||||||||||||||
Thermo Fisher Scientific, Inc. | 450.00 | USD | 8/21/20 | (180 | ) | (18,000 | ) | (11,250 | ) | (7,020 | ) | (4,230 | ) | ||||||||||||||||||
Visa, Inc. | 220.00 | USD | 8/21/20 | (170 | ) | (17,000 | ) | (1,275 | ) | (7,140 | ) | 5,865 | |||||||||||||||||||
Total options written contracts | $ | (709,168 | ) | $ | (768,699 | ) | $ | 59,531 | |||||||||||||||||||||||
July 31, 2020 | Semi-Annual Report 39
Schedule of Investments
AllianzGI Dividend, Interest & Premium Strategy Fund
(formerly AllianzGI NFJ Dividend, Interest & Premium Strategy Fund)†
July 31, 2020 (unaudited) (continued)
(l) Fair Value Measurements–See Note 1(b) in the Notes to Financial Statements.
| Level 1 – Quoted Prices | Level 2 – Other Significant Observable Inputs | Level 3 – Significant Unobservable Inputs | Value at 7/31/20 | ||||||||||||||||
Investments in Securities – Assets | |||||||||||||||||||
Common Stock | $ | 815,068,216 | $ | – | $ | – | $ | 815,068,216 | |||||||||||
Convertible Bonds & Notes | – | 344,605,776 | – | 344,605,776 | |||||||||||||||
Convertible Preferred Stock: | |||||||||||||||||||
Diversified Financial Services | – | 2,048,500 | – | 2,048,500 | |||||||||||||||
Oil, Gas & Consumable Fuels | 105,915 | – | 28,790 | 134,705 | |||||||||||||||
All Other | 78,140,183 | – | – | 78,140,183 | |||||||||||||||
Corporate Bonds & Notes | – | 143,639 | – | 143,639 | |||||||||||||||
Repurchase Agreements | – | 53,273,000 | – | 53,273,000 | |||||||||||||||
893,314,314 | 400,070,915 | 28,790 | 1,293,414,019 | ||||||||||||||||
Investments in Securities – Liabilities | |||||||||||||||||||
Options Written: | |||||||||||||||||||
Market Price | (709,168 | ) | – | – | (709,168 | ) | |||||||||||||
Totals | $ | 892,605,146 | $ | 400,070,915 | $ | 28,790 | $ | 1,292,704,851 | |||||||||||
A roll forward of fair value measurements using significant unobservable inputs (Level 3) for the six months ended July 31, 2020, was as follows:
| Beginning Balance 1/31/20 | Purchases | Sales | Accrued Discount (Premiums) | Net Realized Gain (Loss) | Net Change in Unrealized Appreciation/ Depreciation | Transfers into Level 3* | Transfers out of Level 3 | Ending Balance 7/31/20 | |||||||||||||||||||||||||||||||
Investments in Securities – Assets | |||||||||||||||||||||||||||||||||||||||
Convertible Preferred Stock: | |||||||||||||||||||||||||||||||||||||||
| Oil, Gas & Consumable Fuels | $ | 4 | – | – | – | – | – | $ | 28,786 | – | $ | 28,790 | |||||||||||||||||||||||||||
* Transferred out of Level 2 and into Level 3 because an evaluated mean price was not available at July 31, 2020.
The table above may include Level 3 investments that are valued by brokers or independent pricing services. The inputs for these investments are not readily available or cannot be reasonably estimated and are generally those inputs described in Note 1(b).
The net change in unrealized appreciation/depreciation of Level 3 investments held at July 31, 2020, was $(104,483). The net realized gain (loss) and net change in unrealized appreciation/depreciation are reflected on the Statements of Operations.
(m) The following is a summary of the Fund's derivatives categorized by risk exposure.
The effect of derivatives on the Fund's Statements of Assets and Liabilities at July 31, 2020:
Location | Market Price | ||||||
Liability derivatives: | |||||||
Options written, at value | $ | (709,168 | ) | ||||
40 Semi-Annual Report | July 31, 2020
Schedule of Investments
AllianzGI Dividend, Interest & Premium Strategy Fund
(formerly AllianzGI NFJ Dividend, Interest & Premium Strategy Fund)†
July 31, 2020 (unaudited) (continued)
The effect of derivatives on the Fund's Statements of Operations for the six months ended July 31, 2020:
Location | Market Price | ||||||
Net realized loss on: | |||||||
Options written | $ | (2,285,645 | ) | ||||
Net change in unrealized appreciation/depreciation of: | |||||||
Options written | $ | (83,601 | ) | ||||
The average volume (based on the open positions at each month-end) of derivative activity during the six months ended July 31, 2020 was 13,758 call options written contracts.
Glossary:
ADR - American Depositary Receipt
REIT - Real Estate Investment Trust
See accompanying Notes to Financial Statements | July 31, 2020 | Semi-Annual Report 41
Schedule of Investments
AllianzGI Equity & Convertible Income Fund
July 31, 2020 (unaudited)
Shares | Value | ||||||||||
Common Stock – 62.1% | |||||||||||
Aerospace & Defense – 0.4% | |||||||||||
20,000 | Boeing Co. | $ | 3,160,000 | ||||||||
Automobiles – 0.5% | |||||||||||
2,375 | Tesla, Inc. (g)(i) | 3,398,055 | |||||||||
Banks – 0.7% | |||||||||||
50,200 | JPMorgan Chase & Co. | 4,851,328 | |||||||||
Beverages – 0.8% | |||||||||||
45,800 | PepsiCo, Inc. | 6,304,828 | |||||||||
Biotechnology – 2.3% | |||||||||||
59,400 | AbbVie, Inc. | 5,637,654 | |||||||||
5,500 | Biogen, Inc. (i) | 1,510,795 | |||||||||
70,600 | Gilead Sciences, Inc. | 4,908,818 | |||||||||
19,600 | Vertex Pharmaceuticals, Inc. (i) | 5,331,200 | |||||||||
17,388,467 | |||||||||||
Capital Markets – 1.1% | |||||||||||
66,500 | Charles Schwab Corp. | 2,204,475 | |||||||||
16,400 | S&P Global, Inc. | 5,744,100 | |||||||||
7,948,575 | |||||||||||
Chemicals – 0.3% | |||||||||||
46,400 | Chemours Co. | 859,792 | |||||||||
14,533 | Dow, Inc. (i) | 596,725 | |||||||||
14,533 | DuPont de Nemours, Inc. | 777,225 | |||||||||
2,233,742 | |||||||||||
Communications Equipment – 0.3% | |||||||||||
50,300 | Cisco Systems, Inc. | 2,369,130 | |||||||||
Entertainment – 2.0% | |||||||||||
42,700 | Activision Blizzard, Inc. | 3,528,301 | |||||||||
22,800 | Netflix, Inc. (g)(i) | 11,146,464 | |||||||||
14,674,765 | |||||||||||
Equity Real Estate Investment Trusts (REITs) – 1.3% | |||||||||||
24,000 | American Tower Corp. | 6,273,360 | |||||||||
22,400 | Crown Castle International Corp. | 3,734,080 | |||||||||
10,007,440 | |||||||||||
Food & Staples Retailing – 0.8% | |||||||||||
17,200 | Costco Wholesale Corp. | 5,599,116 | |||||||||
Healthcare Equipment & Supplies – 2.4% | |||||||||||
24,200 | Align Technology, Inc. (i) | 7,110,444 | |||||||||
133,000 | Boston Scientific Corp. (i) | 5,129,810 | |||||||||
8,300 | Intuitive Surgical, Inc. (i) | 5,689,152 | |||||||||
17,929,406 | |||||||||||
Healthcare Providers & Services – 1.6% | |||||||||||
38,500 | UnitedHealth Group, Inc. | 11,657,030 | |||||||||
42 Semi-Annual Report | July 31, 2020
Schedule of Investments
AllianzGI Equity & Convertible Income Fund
July 31, 2020 (unaudited) (continued)
Shares | Value | ||||||||||
Hotels, Restaurants & Leisure – 1.4% | |||||||||||
30,300 | McDonald's Corp. (g) | $ | 5,886,684 | ||||||||
58,900 | Starbucks Corp. | 4,507,617 | |||||||||
10,394,301 | |||||||||||
Household Durables – 0.9% | |||||||||||
104,100 | DR Horton, Inc. | 6,887,256 | |||||||||
Industrial Conglomerates – 0.5% | |||||||||||
24,900 | Honeywell International, Inc. | 3,719,313 | |||||||||
Insurance – 0.1% | |||||||||||
4,600 | Aon PLC, Class A | 944,012 | |||||||||
Interactive Media & Services – 5.1% | |||||||||||
13,875 | Alphabet, Inc., Class A (i) | 20,645,306 | |||||||||
67,400 | Facebook, Inc., Class A (i) | 17,097,358 | |||||||||
37,742,664 | |||||||||||
Internet & Direct Marketing Retail – 3.9% | |||||||||||
18,200 | Alibaba Group Holding Ltd., ADR (g)(i) | 4,568,564 | |||||||||
7,575 | Amazon.com, Inc. (i) | 23,972,451 | |||||||||
28,541,015 | |||||||||||
IT Services – 5.9% | |||||||||||
62,500 | Fiserv, Inc. (i) | 6,236,875 | |||||||||
35,250 | Mastercard, Inc., Class A (g) | 10,875,682 | |||||||||
53,300 | PayPal Holdings, Inc. (g)(i) | 10,450,531 | |||||||||
650 | Shopify, Inc., Class A (i) | 665,600 | |||||||||
4,575 | Twilio, Inc., Class A (i) | 1,269,197 | |||||||||
74,500 | Visa, Inc., Class A (g) | 14,184,800 | |||||||||
43,682,685 | |||||||||||
Life Sciences Tools & Services – 2.0% | |||||||||||
29,275 | IQVIA Holdings, Inc. (i) | 4,636,867 | |||||||||
23,850 | Thermo Fisher Scientific, Inc. | 9,872,708 | |||||||||
14,509,575 | |||||||||||
Machinery – 1.0% | |||||||||||
36,100 | Caterpillar, Inc. | 4,796,968 | |||||||||
13,500 | Deere & Co. | 2,380,185 | |||||||||
7,177,153 | |||||||||||
Multi-Line Retail – 1.3% | |||||||||||
36,200 | Dollar General Corp. | 6,892,480 | |||||||||
19,700 | Target Corp. | 2,479,836 | |||||||||
9,372,316 | |||||||||||
Pharmaceuticals – 2.3% | |||||||||||
112,200 | Bristol-Myers Squibb Co. | 6,581,652 | |||||||||
37,700 | Merck & Co., Inc. (g) | 3,025,048 | |||||||||
48,000 | Zoetis, Inc. | 7,280,640 | |||||||||
16,887,340 | |||||||||||
Road & Rail – 0.3% | |||||||||||
13,200 | Union Pacific Corp. | 2,288,220 | |||||||||
July 31, 2020 | Semi-Annual Report 43
Schedule of Investments
AllianzGI Equity & Convertible Income Fund
July 31, 2020 (unaudited) (continued)
Shares | Value | ||||||||||
Semiconductors & Semiconductor Equipment – 5.9% | |||||||||||
101,000 | Advanced Micro Devices, Inc. (g)(i) | $ | 7,820,430 | ||||||||
17,900 | Broadcom, Inc. | 5,669,825 | |||||||||
20,100 | Lam Research Corp. | 7,580,916 | |||||||||
124,600 | Marvell Technology Group Ltd. (g) | 4,544,162 | |||||||||
115,600 | Micron Technology, Inc. (i) | 5,786,358 | |||||||||
28,300 | NVIDIA Corp. (g) | 12,015,897 | |||||||||
43,417,588 | |||||||||||
Software – 11.1% | |||||||||||
24,375 | Adobe, Inc. (i) | 10,830,300 | |||||||||
21,100 | Atlassian Corp. PLC, Class A (g)(i) | 3,727,315 | |||||||||
56,900 | Crowdstrike Holdings, Inc., Class A (i) | 6,441,080 | |||||||||
5,700 | DocuSign, Inc. (i) | 1,235,931 | |||||||||
19,800 | Intuit, Inc. | 6,066,126 | |||||||||
111,100 | Microsoft Corp. | 22,776,611 | |||||||||
55,521 | Salesforce.com, Inc. (i) | 10,818,267 | |||||||||
23,900 | ServiceNow, Inc. (g)(i) | 10,496,880 | |||||||||
31,000 | Workday, Inc., Class A (i) | 5,608,520 | |||||||||
15,575 | Zoom Video Communications, Inc., Class A (g)(i) | 3,954,648 | |||||||||
81,955,678 | |||||||||||
Specialty Retail – 1.4% | |||||||||||
38,700 | Home Depot, Inc. | 10,274,463 | |||||||||
Technology Hardware, Storage & Peripherals – 3.5% | |||||||||||
60,900 | Apple, Inc. | 25,884,936 | |||||||||
Textiles, Apparel & Luxury Goods – 1.0% | |||||||||||
77,900 | NIKE, Inc., Class B (g) | 7,603,819 | |||||||||
Total Common Stock (cost-$415,143,952) | 458,804,216 | ||||||||||
| Principal Amount (000s) | |||||||||||
Convertible Bonds & Notes – 27.2% | |||||||||||
Airlines – 0.4% | |||||||||||
$ | 1,235 | American Airlines Group, Inc., 6.50%, 7/1/25 | 1,025,702 | ||||||||
1,815 | Southwest Airlines Co., 1.25%, 5/1/25 | 2,112,938 | |||||||||
3,138,640 | |||||||||||
Auto Components – 0.2% | |||||||||||
1,535 | Meritor, Inc., 3.25%, 10/15/37 | 1,585,841 | |||||||||
Auto Manufacturers – 1.2% | |||||||||||
2,155 | Tesla, Inc., 1.25%, 3/1/21 | 8,572,859 | |||||||||
Banks – 0.3% | |||||||||||
1,150 | BofA Finance LLC, 0.125%, 9/1/22 | 1,251,200 | |||||||||
1,100 | JPMorgan Chase Bank N.A., 0.125%, 1/1/23 (a)(b) | 1,309,000 | |||||||||
2,560,200 | |||||||||||
44 Semi-Annual Report | July 31, 2020
Schedule of Investments
AllianzGI Equity & Convertible Income Fund
July 31, 2020 (unaudited) (continued)
| Principal Amount (000s) | Value | ||||||||||
Beverages – 0.0% | |||||||||||
$ | 90 | Luckin Coffee, Inc., 0.75%, 1/15/25 (a)(b) | $ | 37,800 | |||||||
Biotechnology – 1.9% | |||||||||||
BioMarin Pharmaceutical, Inc., | |||||||||||
265 | 0.599%, 8/1/24 | 320,208 | |||||||||
585 | 1.25%, 5/15/27 (a)(b) | 681,486 | |||||||||
Exact Sciences Corp., | |||||||||||
2,875 | 0.375%, 3/15/27 | 3,174,060 | |||||||||
650 | 0.375%, 3/1/28 | 669,221 | |||||||||
1,110 | Halozyme Therapeutics, Inc., 1.25%, 12/1/24 (a)(b) | 1,466,587 | |||||||||
1,015 | Illumina, Inc., 0.50%, 6/15/21 | 1,560,325 | |||||||||
1,300 | Intercept Pharmaceuticals, Inc., 3.25%, 7/1/23 | 1,026,892 | |||||||||
420 | Ligand Pharmaceuticals, Inc., 0.75%, 5/15/23 | 385,982 | |||||||||
825 | Livongo Health, Inc., 0.875%, 6/1/25 (a)(b) | 1,526,766 | |||||||||
PTC Therapeutics, Inc., | |||||||||||
935 | 1.50%, 9/15/26 (a)(b) | 1,055,432 | |||||||||
1,655 | 3.00%, 8/15/22 | 1,860,789 | |||||||||
13,727,748 | |||||||||||
Commercial Services – 0.8% | |||||||||||
1,770 | Chegg, Inc., 0.125%, 3/15/25 | 2,958,565 | |||||||||
Square, Inc., | |||||||||||
530 | 0.125%, 3/1/25 (a)(b) | 705,021 | |||||||||
1,470 | 0.50%, 5/15/23 | 2,626,460 | |||||||||
6,290,046 | |||||||||||
Computers – 1.2% | |||||||||||
Lumentum Holdings, Inc., | |||||||||||
200 | 0.25%, 3/15/24 | 326,591 | |||||||||
2,250 | 0.50%, 12/15/26 (a)(b) | 2,633,426 | |||||||||
1,520 | Pure Storage, Inc., 0.125%, 4/15/23 | 1,529,112 | |||||||||
2,305 | Western Digital Corp., 1.50%, 2/1/24 | 2,238,276 | |||||||||
1,885 | Zscaler, Inc., 0.125%, 7/1/25 (a)(b) | 2,148,183 | |||||||||
8,875,588 | |||||||||||
Diversified Financial Services – 0.1% | |||||||||||
765 | LendingTree, Inc., 0.50%, 7/15/25 (a)(b) | 797,964 | |||||||||
Electronics – 0.5% | |||||||||||
1,010 | Fortive Corp., 0.875%, 2/15/22 | 1,009,972 | |||||||||
430 | OSI Systems, Inc., 1.25%, 9/1/22 | 420,325 | |||||||||
1,130 | SMART Global Holdings, Inc., 2.25%, 2/15/26 (a)(b) | 1,051,701 | |||||||||
910 | Vishay Intertechnology, Inc., 2.25%, 6/15/25 | 874,795 | |||||||||
3,356,793 | |||||||||||
Energy-Alternate Sources – 0.1% | |||||||||||
1,155 | SunPower Corp., 4.00%, 1/15/23 | 1,018,882 | |||||||||
Engineering & Construction – 0.2% | |||||||||||
1,010 | KBR, Inc., 2.50%, 11/1/23 | 1,143,209 | |||||||||
July 31, 2020 | Semi-Annual Report 45
Schedule of Investments
AllianzGI Equity & Convertible Income Fund
July 31, 2020 (unaudited) (continued)
| Principal Amount (000s) | Value | ||||||||||
Entertainment – 0.3% | |||||||||||
Live Nation Entertainment, Inc., | |||||||||||
$ | 485 | 2.00%, 2/15/25 (a)(b) | $ | 424,181 | |||||||
1,455 | 2.50%, 3/15/23 | 1,521,320 | |||||||||
1,945,501 | |||||||||||
Equity Real Estate Investment Trusts (REITs) – 0.3% | |||||||||||
2,000 | Two Harbors Investment Corp., 6.25%, 1/15/22 | 2,027,500 | |||||||||
Healthcare-Products – 0.9% | |||||||||||
2,860 | Insulet Corp., 0.375%, 9/1/26 (a)(b) | 3,302,471 | |||||||||
1,360 | NuVasive, Inc., 2.25%, 3/15/21 | 1,516,400 | |||||||||
1,120 | Repligen Corp., 0.375%, 7/15/24 | 1,633,856 | |||||||||
6,452,727 | |||||||||||
Healthcare-Services – 0.4% | |||||||||||
2,535 | Teladoc Health, Inc., 1.25%, 6/1/27 (a)(b) | 3,265,383 | |||||||||
Internet – 4.6% | |||||||||||
1,660 | Boingo Wireless, Inc., 1.00%, 10/1/23 | 1,494,112 | |||||||||
815 | Booking Holdings, Inc., 0.75%, 5/1/25 (a)(b) | 1,029,753 | |||||||||
2,125 | Etsy, Inc., 0.125%, 10/1/26 (a)(b) | 3,231,111 | |||||||||
2,190 | Match Group Financeco 2, Inc., 0.875%, 6/15/26 (a)(b) | 3,019,201 | |||||||||
975 | Match Group Financeco 3, Inc., 2.00%, 1/15/30 (a)(b) | 1,423,799 | |||||||||
Okta, Inc. (a)(b), | |||||||||||
1,785 | 0.125%, 9/1/25 | 2,417,568 | |||||||||
870 | 0.375%, 6/15/26 | 1,022,964 | |||||||||
Palo Alto Networks, Inc., | |||||||||||
740 | 0.75%, 7/1/23 | 855,515 | |||||||||
2,145 | 0.375%, 6/1/25 (a)(b) | 2,331,766 | |||||||||
1,975 | Proofpoint, Inc., 0.25%, 8/15/24 (a)(b) | 2,033,115 | |||||||||
2,700 | Snap, Inc., 0.75%, 8/1/26 (a)(b) | 3,395,250 | |||||||||
2,170 | Twitter, Inc., 0.25%, 6/15/24 | 2,251,375 | |||||||||
Wayfair, Inc., | |||||||||||
1,260 | 1.00%, 8/15/26 (a)(b) | 2,376,295 | |||||||||
495 | 1.125%, 11/1/24 | 1,161,470 | |||||||||
1,895 | Zendesk, Inc., 0.625%, 6/15/25 (a)(b) | 2,144,961 | |||||||||
Zillow Group, Inc., | |||||||||||
1,090 | 1.50%, 7/1/23 | 1,251,000 | |||||||||
1,780 | 2.75%, 5/15/25 | 2,343,607 | |||||||||
33,782,862 | |||||||||||
Investment Companies – 0.3% | |||||||||||
2,450 | Prospect Capital Corp., 6.375%, 3/1/25 | 2,462,030 | |||||||||
Iron/Steel – 0.1% | |||||||||||
530 | Cleveland-Cliffs, Inc., 1.50%, 1/15/25 | 463,297 | |||||||||
46 Semi-Annual Report | July 31, 2020
Schedule of Investments
AllianzGI Equity & Convertible Income Fund
July 31, 2020 (unaudited) (continued)
| Principal Amount (000s) | Value | ||||||||||
Leisure – 0.5% | |||||||||||
NCL Corp., Ltd. (a)(b), | |||||||||||
$ | 360 | 5.375%, 8/1/25 | $ | 336,596 | |||||||
1,355 | 6.00%, 5/15/24 | 1,597,924 | |||||||||
1,880 | Royal Caribbean Cruises Ltd., 4.25%, 6/15/23 (a)(b) | 1,792,306 | |||||||||
3,726,826 | |||||||||||
Media – 1.3% | |||||||||||
DISH Network Corp., | |||||||||||
1,385 | 2.375%, 3/15/24 | 1,274,716 | |||||||||
3,780 | 3.375%, 8/15/26 | 3,489,431 | |||||||||
Liberty Media Corp., | |||||||||||
1,055 | 1.00%, 1/30/23 | 1,230,977 | |||||||||
1,105 | 1.375%, 10/15/23 | 1,206,808 | |||||||||
2,305 | 2.75%, 12/1/49 (a)(b) | 2,210,783 | |||||||||
190 | World Wrestling Entertainment, Inc., 3.375%, 12/15/23 | 375,118 | |||||||||
9,787,833 | |||||||||||
Oil, Gas & Consumable Fuels – 0.5% | |||||||||||
1,400 | Ensco Jersey Finance Ltd., 3.00%, 1/31/24 | 168,000 | |||||||||
920 | EQT Corp., 1.75%, 5/1/26 (a)(b) | 1,112,221 | |||||||||
1,170 | Nabors Industries, Inc., 0.75%, 1/15/24 | 363,065 | |||||||||
200 | Oil States International, Inc., 1.50%, 2/15/23 | 103,706 | |||||||||
1,535 | Pioneer Natural Resources Co., 0.25%, 5/15/25 (a)(b) | 1,822,045 | |||||||||
3,569,037 | |||||||||||
Pharmaceuticals – 0.9% | |||||||||||
DexCom, Inc., | |||||||||||
4,145 | 0.25%, 11/15/25 (a)(b) | 4,489,553 | |||||||||
85 | 0.75%, 12/1/23 | 227,428 | |||||||||
880 | Flexion Therapeutics, Inc., 3.375%, 5/1/24 | 750,750 | |||||||||
655 | Sarepta Therapeutics, Inc., 1.50%, 11/15/24 | 1,452,299 | |||||||||
6,920,030 | |||||||||||
Pipelines – 0.4% | |||||||||||
4,200 | Cheniere Energy, Inc., 4.25%, 3/15/45 | 2,750,187 | |||||||||
Retail – 0.4% | |||||||||||
665 | Burlington Stores, Inc., 2.25%, 4/15/25 (a)(b) | 747,465 | |||||||||
370 | Guess?, Inc., 2.00%, 4/15/24 | 255,580 | |||||||||
1,480 | RH, zero coupon, 6/15/23 | 2,340,026 | |||||||||
3,343,071 | |||||||||||
Semiconductors – 2.1% | |||||||||||
65 | Advanced Micro Devices, Inc., 2.125%, 9/1/26 | 627,712 | |||||||||
1,400 | Cree, Inc., 0.875%, 9/1/23 | 1,840,424 | |||||||||
1,885 | Inphi Corp., 0.75%, 4/15/25 (a)(b) | 2,463,205 | |||||||||
4,645 | Microchip Technology, Inc., 1.625%, 2/15/27 | 6,787,738 | |||||||||
150 | Micron Technology, Inc., 3.125%, 5/1/32, Ser. D | 745,781 | |||||||||
1,850 | ON Semiconductor Corp., 1.625%, 10/15/23 | 2,316,776 | |||||||||
750 | Veeco Instruments, Inc., 3.75%, 6/1/27 (a)(b) | 868,735 | |||||||||
15,650,371 | |||||||||||
July 31, 2020 | Semi-Annual Report 47
Schedule of Investments
AllianzGI Equity & Convertible Income Fund
July 31, 2020 (unaudited) (continued)
| Principal Amount (000s) | Value | ||||||||||
Software – 6.6% | |||||||||||
$ | 2,860 | Akamai Technologies, Inc., 0.125%, 5/1/25 | $ | 3,724,992 | |||||||
2,425 | Alteryx, Inc., 0.50%, 8/1/24 (a)(b) | 2,910,839 | |||||||||
595 | Atlassian, Inc., 0.625%, 5/1/23 | 1,301,629 | |||||||||
625 | Cloudflare, Inc., 0.75%, 5/15/25 (a)(b) | 837,109 | |||||||||
3,115 | Coupa Software, Inc., 0.375%, 6/15/26 (a)(b) | 3,905,671 | |||||||||
1,695 | Datadog, Inc., 0.125%, 6/15/25 (a)(b) | 2,148,271 | |||||||||
460 | DocuSign, Inc., 0.50%, 9/15/23 | 1,400,395 | |||||||||
1,040 | Everbridge, Inc., 0.125%, 12/15/24 (a)(b) | 1,474,361 | |||||||||
1,250 | Evolent Health, Inc., 1.50%, 10/15/25 | 931,200 | |||||||||
1,555 | Five9, Inc., 0.50%, 6/1/25 (a)(b) | 1,799,912 | |||||||||
1,190 | HubSpot, Inc., 0.375%, 6/1/25 (a)(b) | 1,336,667 | |||||||||
1,740 | j2 Global, Inc., 1.75%, 11/1/26 (a)(b) | 1,329,016 | |||||||||
2,310 | MongoDB, Inc., 0.25%, 1/15/26 (a)(b) | 3,001,763 | |||||||||
1,250 | New Relic, Inc., 0.50%, 5/1/23 | 1,248,461 | |||||||||
1,595 | Nutanix, Inc., zero coupon, 1/15/23 | 1,472,288 | |||||||||
1,145 | Pegasystems, Inc., 0.75%, 3/1/25 (a)(b) | 1,287,032 | |||||||||
1,260 | Pluralsight, Inc., 0.375%, 3/1/24 | 1,175,179 | |||||||||
2,840 | RingCentral, Inc., zero coupon, 3/1/25 (a)(b) | 3,125,592 | |||||||||
725 | Sea Ltd., 2.375%, 12/1/25 (a)(b) | 1,123,546 | |||||||||
665 | ServiceNow, Inc., zero coupon, 6/1/22 | 2,168,338 | |||||||||
1,370 | Slack Technologies, Inc., 0.50%, 4/15/25 (a)(b) | 1,684,731 | |||||||||
4,175 | Splunk, Inc., 1.125%, 6/15/27 (a)(b) | 4,746,116 | |||||||||
1,650 | Workday, Inc., 0.25%, 10/1/22 | 2,226,895 | |||||||||
1,660 | Zynga, Inc., 0.25%, 6/1/24 | 2,227,512 | |||||||||
48,587,515 | |||||||||||
Telecommunications – 0.4% | |||||||||||
65 | Infinera Corp., 2.125%, 9/1/24 | 66,691 | |||||||||
1,745 | Viavi Solutions, Inc., 1.00%, 3/1/24 | 2,144,134 | |||||||||
765 | Vonage Holdings Corp., 1.75%, 6/1/24 | 779,239 | |||||||||
2,990,064 | |||||||||||
Transportation – 0.3% | |||||||||||
1,380 | Atlas Air Worldwide Holdings, Inc., 2.25%, 6/1/22 | 1,421,400 | |||||||||
1,125 | Greenbrier Cos., Inc., 2.875%, 2/1/24 | 1,004,104 | |||||||||
2,425,504 | |||||||||||
Total Convertible Bonds & Notes (cost-$178,463,460) | 201,255,308 | ||||||||||
Shares | |||||||||||
Convertible Preferred Stock – 6.4% | |||||||||||
Auto Components – 0.3% | |||||||||||
23,990 | Aptiv PLC, 5.50%, 6/15/23, Ser. A | 2,452,018 | |||||||||
Banks – 1.2% | |||||||||||
2,930 | Bank of America Corp., 7.25%, Ser. L (e) | 4,392,099 | |||||||||
3,555 | Wells Fargo & Co., 7.50%, Ser. L (e) | 4,804,583 | |||||||||
9,196,682 | |||||||||||
48 Semi-Annual Report | July 31, 2020
Schedule of Investments
AllianzGI Equity & Convertible Income Fund
July 31, 2020 (unaudited) (continued)
Shares | Value | ||||||||||
Chemicals – 0.3% | |||||||||||
42,800 | International Flavors & Fragrances, Inc., 6.00%, 9/15/21 | $ | 1,958,528 | ||||||||
Diversified Financial Services – 0.2% | |||||||||||
995 | 2020 Mandatory Exchangeable Trust, 6.50%, 5/16/23 (a)(b) | 1,198,975 | |||||||||
Electric Utilities – 0.7% | |||||||||||
45,625 | NextEra Energy, Inc., 5.279%, 3/1/23 | 2,210,075 | |||||||||
14,605 | Sempra Energy, 6.00%, 1/15/21, Ser. A | 1,491,755 | |||||||||
23,000 | Southern Co., 6.75%, 8/1/22 | 1,060,760 | |||||||||
4,762,590 | |||||||||||
Electronics – 0.3% | |||||||||||
1,455 | Fortive Corp., 5.00%, 7/1/21, Ser. A | 1,286,540 | |||||||||
3,710 | II-VI, Inc., 6.00%, 7/1/23, Ser. A | 838,567 | |||||||||
2,125,107 | |||||||||||
Environmental Services – 0.2% | |||||||||||
25,210 | GFL Environmental Inc., 6.00%, 3/15/23 | 1,394,869 | |||||||||
Equity Real Estate Investment Trusts (REITs) – 0.3% | |||||||||||
1,730 | Crown Castle International Corp., 6.875%, 8/1/20, Ser. A | 2,499,850 | |||||||||
Hand/Machine Tools – 0.0% | |||||||||||
1,505 | Stanley Black & Decker, Inc., 5.25%, 11/15/22 | 143,667 | |||||||||
Healthcare-Products – 1.5% | |||||||||||
33,900 | Avantor, Inc., 6.25%, 5/15/22, Ser. A | 2,445,207 | |||||||||
20,265 | Boston Scientific Corp., 5.50%, 6/1/23, Ser. A | 2,275,557 | |||||||||
Danaher Corp., | |||||||||||
2,975 | 4.75%, 4/15/22, Ser. A | 4,221,882 | |||||||||
1,445 | 5.00%, 4/15/23, Ser. B | 1,770,183 | |||||||||
10,712,829 | |||||||||||
Insurance – 0.1% | |||||||||||
9,250 | Assurant, Inc., 6.50%, 3/15/21, Ser. D | 999,832 | |||||||||
Oil, Gas & Consumable Fuels – 0.0% | |||||||||||
25,000 | ATP Oil & Gas Corp., 8.00% (cost-$3,160,750; purchased 4/21/10) (a)(b)(d)(e)(f)(h) | 2 | |||||||||
8,860 | Nabors Industries Ltd., 6.00%, 5/1/21, Ser. A | 58,742 | |||||||||
58,744 | |||||||||||
Pharmaceuticals – 0.3% | |||||||||||
25,015 | Becton Dickinson and Co., 6.00%, 6/1/23, Ser. B | 1,508,405 | |||||||||
22,420 | Elanco Animal Health, Inc., 5.00%, 2/1/23 | 885,814 | |||||||||
2,394,219 | |||||||||||
Semiconductors – 0.6% | |||||||||||
4,105 | Broadcom, Inc., 8.00%, 9/30/22, Ser. A | 4,683,436 | |||||||||
Telecommunications – 0.4% | |||||||||||
2,685 | 2020 Cash Mandatory Exchangeable Trust, 5.25%, 6/1/23 (a)(b) | 2,773,511 | |||||||||
Total Convertible Preferred Stock (cost-$47,125,657) | 47,354,857 | ||||||||||
July 31, 2020 | Semi-Annual Report 49
Schedule of Investments
AllianzGI Equity & Convertible Income Fund
July 31, 2020 (unaudited) (continued)
| Principal Amount (000s) | Value | ||||||||||
Corporate Bonds & Notes – 0.0% | |||||||||||
Oil, Gas & Consumable Fuels – 0.0% | |||||||||||
$ | 2,509 | Cobalt International Energy, Inc., 7.75%, 12/1/23 (c) (cost-$1,122,234) | $ | 77,553 | |||||||
Repurchase Agreements – 4.3% | |||||||||||
31,685 | State Street Bank and Trust Co., dated 7/31/20, 0.00%, due 8/3/20, proceeds $31,685,000; collateralized by U.S. Treasury Notes, 1.125%, due 2/28/25, valued at $32,318,785 including accrued interest (cost-$31,685,000) | 31,685,000 | |||||||||
| Total Investments, before options written (cost-$673,540,303) – 100.0% | 739,176,934 | ||||||||||
| Total Options Written – (0.0)% (premiums received-$403,642) (i)(j)(k) | (144,175 | ) | |||||||||
| Total Investments, net of options written (cost-$673,136,661) – 100.0% | 739,032,759 | ||||||||||
Other assets less other liabilities – 0.0% | 133,838 | ||||||||||
Net Assets – 100.0% | $ | 739,166,597 | |||||||||
Notes to Schedule of Investments:
(a) Private Placement–Restricted as to resale and may not have a readily available market. Securities with an aggregate value of $96,955,131, representing 13.1% of net assets.
(b) 144A–Exempt from registration under Rule 144A of the Securities Act of 1933. These securities may be resold in transactions exempt from registration, typically only to qualified institutional buyers. Securities with an aggregate value of $96,955,131, representing 13.1% of net assets.
(c) In default.
(d) Fair-Valued–Security with a value of $2, representing less than 0.05% of net assets. See Note 1(a) and Note 1(b) in the Notes to Financial Statements.
(e) Perpetual maturity. The date shown, if any, is the next call date.
(f) Level 3 security. See Note 1(a) and Note 1(b) in the Notes to Financial Statements.
(g) All or partial amount segregated for the benefit of the counterparty as collateral for options written.
(h) Restricted. The cost of such security is $3,160,750. The value is $2, representing less than 0.05% of net assets.
(i) Non-income producing.
(j) Exchange traded-Chicago Board Options Exchange.
(k) Exchange traded option contracts outstanding at July 31, 2020:
Options written contracts outstanding at July 31, 2020:
Description | Exercise Price | Expiration Date | Number of Contracts | Notional Amount | Market Value | Premiums Received | Unrealized Appreciation (Depreciation) | ||||||||||||||||||||||||
Call options: | |||||||||||||||||||||||||||||||
Advanced Micro Devices, Inc. | 85.00 | USD | 8/21/20 | (500 | ) | $ | (50,000 | ) | $ | (55,000 | ) | $ | (51,434 | ) | $ | (3,566 | ) | ||||||||||||||
Alibaba Group Holding Ltd. | 310.00 | USD | 8/21/20 | (60 | ) | (6,000 | ) | (1,890 | ) | (19,247 | ) | 17,357 | |||||||||||||||||||
Atlassian Corp. PLC | 230.00 | USD | 8/21/20 | (85 | ) | (8,500 | ) | (425 | ) | (7,487 | ) | 7,062 | |||||||||||||||||||
Marvell Technology Group Ltd. | 40.00 | USD | 8/21/20 | (155 | ) | (15,500 | ) | (4,263 | ) | (2,606 | ) | (1,657 | ) | ||||||||||||||||||
Mastercard, Inc. | 340.00 | USD | 8/21/20 | (180 | ) | (18,000 | ) | (9,180 | ) | (16,365 | ) | 7,185 | |||||||||||||||||||
McDonald's Corp. | 220.00 | USD | 8/21/20 | (150 | ) | (15,000 | ) | (675 | ) | (5,738 | ) | 5,063 | |||||||||||||||||||
Merck & Co., Inc. | 85.00 | USD | 8/21/20 | (190 | ) | (19,000 | ) | (8,645 | ) | (5,280 | ) | (3,365 | ) | ||||||||||||||||||
Netflix, Inc. | 675.00 | USD | 8/21/20 | (90 | ) | (9,000 | ) | (1,710 | ) | (114,783 | ) | 113,073 | |||||||||||||||||||
50 Semi-Annual Report | July 31, 2020
Schedule of Investments
AllianzGI Equity & Convertible Income Fund
July 31, 2020 (unaudited) (continued)
Description | Exercise Price | Expiration Date | Number of Contracts | Notional Amount | Market Value | Premiums Received | Unrealized Appreciation (Depreciation) | ||||||||||||||||||||||||
Nike, Inc. | 110.00 | USD | 8/21/20 | (205 | ) | $ | (20,500 | ) | $ | (1,742 | ) | $ | (13,335 | ) | $ | 11,593 | |||||||||||||||
NVIDIA Corp. | 510.00 | USD | 8/21/20 | (100 | ) | (10,000 | ) | (25,800 | ) | (52,595 | ) | 26,795 | |||||||||||||||||||
PayPal Holdings, Inc. | 220.00 | USD | 8/21/20 | (215 | ) | (21,500 | ) | (15,480 | ) | (17,634 | ) | 2,154 | |||||||||||||||||||
ServiceNow, Inc. | 520.00 | USD | 8/21/20 | (85 | ) | (8,500 | ) | (5,100 | ) | (17,529 | ) | 12,429 | |||||||||||||||||||
Tesla, Inc. | 2,000.00 | USD | 8/21/20 | (7 | ) | (700 | ) | (3,465 | ) | (51,565 | ) | 48,100 | |||||||||||||||||||
Visa, Inc. | 215.00 | USD | 8/21/20 | (300 | ) | (30,000 | ) | (4,800 | ) | (20,235 | ) | 15,435 | |||||||||||||||||||
| Zoom Video Communications, Inc. | 300.00 | USD | 8/21/20 | (80 | ) | (8,000 | ) | (6,000 | ) | (7,809 | ) | 1,809 | |||||||||||||||||||
Total options written contracts | $ | (144,175 | ) | $ | (403,642 | ) | $ | 259,467 | |||||||||||||||||||||||
(l) Fair Value Measurements–See Note 1(b) in the Notes to Financial Statements.
| Level 1 – Quoted Prices | Level 2 – Other Significant Observable Inputs | Level 3 – Significant Unobservable Inputs | Value at 7/31/20 | ||||||||||||||||
Investments in Securities – Assets | |||||||||||||||||||
Common Stock | $ | 458,804,216 | $ | – | $ | – | $ | 458,804,216 | |||||||||||
Convertible Bonds & Notes | – | 201,255,308 | – | 201,255,308 | |||||||||||||||
Convertible Preferred Stock: | |||||||||||||||||||
Diversified Financial Services | – | 1,198,975 | – | 1,198,975 | |||||||||||||||
Oil, Gas & Consumable Fuels | – | – | 2 | 2 | |||||||||||||||
All Other | 46,155,880 | – | – | 46,155,880 | |||||||||||||||
Corporate Bonds & Notes | – | 77,553 | – | 77,553 | |||||||||||||||
Repurchase Agreements | – | 31,685,000 | – | 31,685,000 | |||||||||||||||
504,960,096 | 234,216,836 | 2 | 739,176,934 | ||||||||||||||||
Investments in Securities – Liabilities | |||||||||||||||||||
Options Written: | |||||||||||||||||||
Market Price | (144,175 | ) | – | – | (144,175 | ) | |||||||||||||
Totals | $ | 504,815,921 | $ | 234,216,836 | $ | 2 | $ | 739,032,759 | |||||||||||
A roll forward of fair value measurements using significant unobservable inputs (Level 3) for the six months ended July 31, 2020, was as follows:
| Beginning Balance 1/31/20 | Purchases | Sales | Accrued Discount (Premiums) | Net Realized Gain (Loss) | Net Change in Unrealized Appreciation/ Depreciation | Transfers into Level 3 | Transfers out of Level 3 | Ending Balance 7/31/20 | |||||||||||||||||||||||||||||||
Investments in Securities – Assets | |||||||||||||||||||||||||||||||||||||||
Convertible Preferred Stock: | |||||||||||||||||||||||||||||||||||||||
| Oil, Gas & Consumable Fuels | $ | 2 | – | – | – | – | – | – | – | $ | 2 | ||||||||||||||||||||||||||||
The table above includes Level 3 investments that are valued by brokers and pricing services. The inputs for these investments are not readily available or cannot be reasonably estimated and are generally those inputs described in Note 1(b).
There was no change in unrealized appreciation/depreciation of Level 3 investments held at July 31, 2020.
(m) The following is a summary of the Fund's derivatives categorized by risk exposure.
July 31, 2020 | Semi-Annual Report 51
Schedule of Investments
AllianzGI Equity & Convertible Income Fund
July 31, 2020 (unaudited) (continued)
The effect of derivatives on the Fund's Statements of Assets and Liabilities at July 31, 2020:
Location | Market Price | ||||||
Liability derivatives: | |||||||
Options written, at value | $ | (144,175 | ) | ||||
The effect of derivatives on the Fund's Statements of Operations for the six months ended July 31, 2020:
Location | Market Price | ||||||
Net realized loss on: | |||||||
Options written | $ | (930,772 | ) | ||||
Net change in unrealized appreciation/depreciation of: | |||||||
Options written | $ | 168,668 | |||||
The average volume (based on the open positions at each month-end) of derivative activity during the six months ended July 31, 2019 was 4,469 call options written contracts.
Glossary:
ADR - American Depositary Receipt
REIT - Real Estate Investment Trust
52 Semi-Annual Report | July 31, 2020 | See accompanying Notes to Financial Statements
Statements of Assets and Liabilities
AllianzGI Diversified Income & Convertible Fund
AllianzGI Dividend, Interest & Premium Strategy Fund
AllianzGI Equity & Convertible Income Fund
July 31, 2020 (unaudited)
| Diversified Income & Convertible | Dividend, Interest & Premium Strategy | Equity & Convertible Income | |||||||||||||
Assets: | |||||||||||||||
| Investments, at value (cost-$359,464,471, $1,241,276,688 and $673,540,303, respectively) | $ | 391,969,872 | $ | 1,293,414,019 | $ | 739,176,934 | |||||||||
Cash | – | 202,602 | 92,168 | ||||||||||||
Receivable for investments sold | 1,898,331 | 48,094,343 | 57,181 | ||||||||||||
Interest and dividends receivable | 1,452,054 | 2,227,431 | 965,380 | ||||||||||||
| Investments in Affiliated Funds- Trustees Deferred Compensation Plan (see Note 4) | 42,961 | 236,524 | 107,386 | ||||||||||||
Prepaid expenses | 23,129 | 72,349 | 33,851 | ||||||||||||
Total Assets | 395,386,347 | 1,344,247,268 | 740,432,900 | ||||||||||||
Liabilities: | |||||||||||||||
Loan payable (See Note 7 and Note 8) | 75,000,000 | – | – | ||||||||||||
Dividends payable to common shareholders | 1,729,105 | – | – | ||||||||||||
Payable for investments purchased | 1,605,496 | 49,308,087 | 313,872 | ||||||||||||
Loan interest payable | 846,902 | – | – | ||||||||||||
Investment management fees payable | 321,686 | 960,671 | 610,888 | ||||||||||||
Payable to custodian for cash overdraft | 118,367 | – | – | ||||||||||||
| Interest payable on dividends to mandatory redeemable preferred shareholders | 92,497 | – | – | ||||||||||||
| Trustees Deferred Compensation Plan payable (see Note 4) | 42,961 | 236,524 | 107,386 | ||||||||||||
| Call options written, at value (premiums received- $72,477, $768,699 and $403,642, respectively) | 27,491 | 709,168 | 144,175 | ||||||||||||
Accrued expenses | 72,471 | 131,098 | 89,982 | ||||||||||||
| Mandatory redeemable preferred shares (see Note 7) | 30,000,000 | – | – | ||||||||||||
Total Liabilities | 109,856,976 | 51,345,548 | 1,266,303 | ||||||||||||
Net Assets Applicable to Common Shareholders | $ | 285,529,371 | $ | 1,292,901,720 | $ | 739,166,597 | |||||||||
| Composition of Net Assets Applicable to Common Shareholders: | |||||||||||||||
Common Stock: | |||||||||||||||
Par value ($0.00001 per share) | $ | 104 | $ | 948 | $ | 277 | |||||||||
Paid-in-capital in excess of par | 252,326,197 | 1,303,932,532 | 671,079,307 | ||||||||||||
Total distributable earnings (loss) | 33,203,070 | (11,031,760 | ) | 68,087,013 | |||||||||||
Net Assets Applicable to Common Shareholders | $ | 285,529,371 | $ | 1,292,901,720 | $ | 739,166,597 | |||||||||
Common Shares Issued and Outstanding | 10,353,920 | 94,801,581 | 27,708,965 | ||||||||||||
Net Asset Value Per Common Share | $ | 27.58 | $ | 13.64 | $ | 26.68 | |||||||||
See accompanying Notes to Financial Statements | July 31, 2020 | Semi-Annual Report 53
Statements of Operations
AllianzGI Diversified Income & Convertible Fund
AllianzGI Dividend, Interest & Premium Strategy Fund
AllianzGI Equity & Convertible Income Fund
Six Months ended July 31, 2020 (unaudited)
| Diversified Income & Convertible | Dividend, Interest & Premium Strategy | Equity & Convertible Income | |||||||||||||
Investment Income: | |||||||||||||||
Interest | $ | 2,778,491 | $ | 2,355,826 | $ | 1,364,667 | |||||||||
| Dividends (net of foreign withholding taxes of $0, $73,151 and $0, respectively) | 1,288,024 | 11,279,454 | 3,662,224 | ||||||||||||
Miscellaneous | 3,828 | 34,610 | – | ||||||||||||
Total Investment Income | 4,070,343 | 13,669,890 | 5,026,891 | ||||||||||||
Expenses: | |||||||||||||||
Investment management | 1,731,164 | 5,407,629 | 3,296,194 | ||||||||||||
Loan interest | 1,146,312 | – | – | ||||||||||||
| Interest on dividends to mandatory redeemable preferred shareholders | 647,443 | – | – | ||||||||||||
Custodian and accounting agent | 58,788 | 112,058 | 66,181 | ||||||||||||
Audit and tax services | 45,571 | 46,862 | 40,058 | ||||||||||||
Legal | 23,363 | 40,467 | 25,182 | ||||||||||||
Shareholder communications | 19,710 | 78,287 | 40,395 | ||||||||||||
Transfer agent | 15,563 | 12,491 | 12,491 | ||||||||||||
Trustees | 9,074 | 49,745 | 24,804 | ||||||||||||
Insurance | 5,231 | 19,278 | 10,645 | ||||||||||||
New York Stock Exchange listing | 3,686 | 14,330 | 4,188 | ||||||||||||
Miscellaneous | 15,214 | 8,589 | 6,757 | ||||||||||||
Total Expenses | 3,721,119 | 5,789,736 | 3,526,895 | ||||||||||||
Net Investment Income | 349,224 | 7,880,154 | 1,499,996 | ||||||||||||
Realized and Change in Unrealized Gain (Loss): | |||||||||||||||
Net realized gain (loss) on: | |||||||||||||||
Investments | 5,114,323 | (24,152,350 | ) | 9,977,491 | |||||||||||
Call options written | (200,339 | ) | (2,285,645 | ) | (930,772 | ) | |||||||||
Payments from Affiliates (See Note 9) | – | 3,693 | – | ||||||||||||
Net change in unrealized appreciation/depreciation of: | |||||||||||||||
Investments | 33,751,121 | (5,615,193 | ) | 59,860,431 | |||||||||||
Call options written | 30,895 | (83,601 | ) | 168,668 | |||||||||||
Net realized and change in unrealized gain (loss) | 38,696,000 | (32,133,096 | ) | 69,075,818 | |||||||||||
| Net Increase (Decrease) in Net Assets Resulting from Investment Operations | $ | 39,045,224 | $ | (24,252,942 | ) | $ | 70,575,814 | ||||||||
54 Semi-Annual Report | July 31, 2020 | See accompanying Notes to Financial Statements
Statement of Changes in Net Assets Applicable to Common Shareholders
AllianzGI Diversified Income & Convertible Fund
| Six Months ended July 31, 2020 (unaudited) | Year ended January 31, 2020 | ||||||||||
Investment Operations: | |||||||||||
Net investment income | $ | 349,224 | $ | 1,143,744 | |||||||
Net realized gain | 4,913,984 | 26,883,283 | |||||||||
Net change in unrealized appreciation/depreciation | 33,782,016 | 21,213,798 | |||||||||
Net increase in net assets resulting from investment operations | 39,045,224 | 49,240,825 | |||||||||
Total Distributions to Common Shareholders | (10,374,628 | ) | (20,701,709 | ) | |||||||
Common Share Transactions: | |||||||||||
Reinvestment of dividends and distributions | 134,324 | 865,275 | |||||||||
Total increase in net assets | 28,804,920 | 29,404,391 | |||||||||
Net Assets: | |||||||||||
Beginning of period | 256,724,451 | 227,320,060 | |||||||||
End of period | $ | 285,529,371 | $ | 256,724,451 | |||||||
Shares Activity: | |||||||||||
Shares outstanding, beginning of period | 10,348,562 | 10,311,385 | |||||||||
Shares reinvested | 5,358 | 37,177 | |||||||||
Shares outstanding, end of period | 10,353,920 | 10,348,562 | |||||||||
See accompanying Notes to Financial Statements | July 31, 2020 | Semi-Annual Report 55
Statements of Changes in Net Assets
AllianzGI Dividend, Interest & Premium Strategy Fund
AllianzGI Equity & Convertible Income Fund
Dividend, Interest & Premium Strategy: | |||||||||||
| Six Months ended July 31, 2020 (unaudited) | Year ended January 31, 2020 | ||||||||||
Investment Operations: | |||||||||||
Net investment income | $ | 7,880,154 | $ | 22,868,466 | |||||||
Net realized gain (loss) | (26,434,302 | ) | 67,872,643 | ||||||||
Net change in unrealized appreciation/depreciation | (5,698,794 | ) | 72,683,949 | ||||||||
| Net increase (decrease) in net assets resulting from investment operations | (24,252,942 | ) | 163,425,058 | ||||||||
Total distributions to shareholders | (42,660,711 | ) | (85,321,423 | ) | |||||||
Total increase (decrease) in net assets | (66,913,653 | ) | 78,103,635 | ||||||||
Net Assets: | |||||||||||
Beginning of period | 1,359,815,373 | 1,281,711,738 | |||||||||
End of period | $ | 1,292,901,720 | $ | 1,359,815,373 | |||||||
Equity & Convertible Income: | |||||||||||
| Six Months ended July 31, 2020 (unaudited) | Year ended January 31, 2020 | ||||||||||
Investment Operations: | |||||||||||
Net investment income | $ | 1,499,996 | $ | 4,861,533 | |||||||
Net realized gain | 9,046,719 | 42,915,719 | |||||||||
Net change in unrealized appreciation/depreciation | 60,029,099 | 59,675,373 | |||||||||
Net increase in net assets resulting from investment operations | 70,575,814 | 107,452,625 | |||||||||
Total Distributions to Shareholders | (21,058,813 | ) | (42,117,626 | ) | |||||||
Total increase in net assets | 49,517,001 | 65,334,999 | |||||||||
Net Assets: | |||||||||||
Beginning of period | 689,649,596 | 624,314,597 | |||||||||
End of period | $ | 739,166,597 | $ | 689,649,596 | |||||||
56 Semi-Annual Report | July 31, 2020 | See accompanying Notes to Financial Statements
Statement of Cash Flows*
Allianz Diversified Income & Convertible Fund
For the Six Months ended July 31, 2020 (unaudited)
Increase (Decrease) in Cash from: | |||||||
Cash Flows provided by Operating Activities: | |||||||
Net increase in net assets resulting from investment operations | $ | 39,045,224 | |||||
| Adjustments to Reconcile Net Increase in Net Assets Resulting from Investment Operations to Net Cash provided by Operating Activities: | |||||||
Purchases of long-term investments | (272,901,226 | ) | |||||
Proceeds from sales of long-term investments | 270,660,708 | ||||||
Sales of short-term portfolio investments, net | 10,085,210 | ||||||
Net change in unrealized appreciation/depreciation | (33,782,016 | ) | |||||
Net amortization/accretion on investments | 29,210 | ||||||
Net realized gain | (4,913,984 | ) | |||||
Decrease in payable for investments purchased | (3,195,879 | ) | |||||
Proceeds from sale of written options | 484,194 | ||||||
Payments to cover written options | (662,713 | ) | |||||
Increase in investments in Affiliated Funds – Trustees Deferred Compensation Plan | (1,107 | ) | |||||
Increase in Trustees Compensation Plan payable | 1,107 | ||||||
Decrease in receivable for investments sold | 4,892,708 | ||||||
Decrease in interest and dividends receivable | 234,411 | ||||||
Increase in prepaid expenses | (6,476 | ) | |||||
Increase in investment management fees payable | 21,253 | ||||||
Increase in accrued expenses and other liabilities | 2,442 | ||||||
Decrease in loan interest payable | (88,039 | ) | |||||
Net cash provided by operating activities | 9,905,027 | ||||||
Cash Flows used for Financing Activities: | |||||||
Increase in payable to custodian for cash overdraft | 118,367 | ||||||
Cash dividends paid | (10,242,966 | ) | |||||
Net cash used for financing activities | (10,124,599 | ) | |||||
Net decrease in cash | (219,572 | ) | |||||
Cash: | |||||||
Beginning of period | 219,572 | ||||||
End of period | $ | – | |||||
Cash Paid for Interest | $ | 1,234,351 | |||||
Cash Paid for Interest on Dividends to Mandatory Redeemable Preferred Shares | $ | 651,000 | |||||
* A Statement of Cash Flows is not required for Dividend, Interest & Premium Strategy and Equity & Convertible Income.
See accompanying Notes to Financial Statements | July 31, 2020 | Semi-Annual Report 57
Financial Highlights
AllianzGI Diversified Income & Convertible Fund
For a common share outstanding throughout each period^:
| Six Months ended July 31, 2020 | Year ended January 31, | For the period May 27, 2015* through | |||||||||||||||||||||||||
(unaudited) | 2020 | 2019 | 2018 | 2017 | January 31, 2016 | ||||||||||||||||||||||
Net asset value, beginning of period | $ | 24.81 | $ | 22.05 | $ | 23.88 | $ | 21.59 | $ | 18.91 | $ | 23.88 | |||||||||||||||
Investment Operations: | |||||||||||||||||||||||||||
Net investment income (1) | 0.03 | 0.11 | 0.16 | 0.29 | 0.39 | 0.18 | |||||||||||||||||||||
| Net realized and change in unrealized gain (loss) | 3.74 | 4.65 | 0.01 | 4.00 | 4.21 | (4.09 | ) | ||||||||||||||||||||
Total from investment operations | 3.77 | 4.76 | 0.17 | 4.29 | 4.60 | (3.91 | ) | ||||||||||||||||||||
| Dividends and Distributions to Common Shareholders from: | |||||||||||||||||||||||||||
Net investment income | (0.19 | ) | (0.42 | ) | (0.95 | ) | (0.44 | ) | (0.51 | ) | (0.62 | ) | |||||||||||||||
Net realized gains | (0.81 | ) | (1.58 | ) | (1.05 | ) | (1.56 | ) | (1.49 | ) | (0.55 | ) | |||||||||||||||
| Total dividends and distributions to common shareholders | (1.00 | ) | (2.00 | ) | (2.00 | ) | (2.00 | ) | (2.00 | ) | (1.17 | ) | |||||||||||||||
Common Share Transactions: | |||||||||||||||||||||||||||
| Offering costs charged to paid-in-capital in excess of par | – | – | – | – | – | (0.05 | ) | ||||||||||||||||||||
| Accretion to net asset value resulting from share repurchases | – | – | – | – | 0.08 | 0.16 | |||||||||||||||||||||
Net asset value, end of period | $ | 27.58 | $ | 24.81 | (2) | $ | 22.05 | $ | 23.88 | $ | 21.59 | $ | 18.91 | ||||||||||||||
Market price, end of period | $ | 25.42 | $ | 25.22 | $ | 21.29 | $ | 22.40 | $ | 19.49 | $ | 16.40 | |||||||||||||||
| Total Investment Return (3) | 5.52 | % | 29.04 | % | 3.89 | % | 26.13 | % | 32.56 | % | (30.12 | )% | |||||||||||||||
RATIOS/SUPPLEMENTAL DATA: | |||||||||||||||||||||||||||
Net assets, end of period (000s) | $ | 285,529 | $ | 256,724 | $ | 227,320 | $ | 245,382 | $ | 221,849 | $ | 201,644 | |||||||||||||||
| Ratio of expenses to average net assets, including interest expense (5)(6) | 3.08 | %(4) | 3.32 | % | 3.40 | %(7) | 3.36 | %(7) | 3.48 | %(7) | 3.26 | %(4) | |||||||||||||||
| Ratio of expenses to average net assets, excluding interest expense (5)(6) | 2.13 | %(4) | 2.14 | % | 2.20 | %(7) | 2.26 | %(7) | 2.34 | %(7) | 2.56 | %(4) | |||||||||||||||
| Ratio of net investment income to average net assets | 0.29 | %(4) | 0.47 | % | 0.72 | %(7) | 1.30 | %(7) | 1.90 | %(7) | 1.24 | %(4) | |||||||||||||||
| Mandatory redeemable preferred shares asset coverage per share | $ | 262 | $ | 238 | $ | 214 | $ | 229 | $ | 209 | $ | 193 | |||||||||||||||
Portfolio turnover rate | 80 | % | 120 | % | 105 | % | 154 | % | 196 | % | 149 | % | |||||||||||||||
^ A "–" may reflect actual amounts rounding to less than $0.01 or 0.01%.
* Commencement of operations.
(1) Calculated on average common shares outstanding during the period.
(2) Payment from affiliate increased the net asset value by less than $0.01.
(3) Total investment return is calculated assuming a purchase of a common share at the market price on the first day and a sale of a common share at the market price on the last day of each period reported. Dividends and distributions, if any, are assumed, for purposes of this calculation, to be reinvested at prices obtained under the Fund's dividend reinvestment plan. Total investment return does not reflect brokerage commissions or sales charges in connection with the purchase or sale of Fund shares. Total investment return for a period of less than one year is not annualized.
(4) Annualized.
(5) Interest expense relates to participation in Senior Secured Notes and Margin Loan Financing (See Note 7 and Note 8).
(6) Calculated on the basis of income and expenses applicable to both common and mandatory redeemable preferred shares relative to average net assets of common shareholders.
(7) Inclusive of excise tax expense of 0.06%, 0.07% and 0.01% for the years ended January 31, 2019, January 31, 2018 and January 31, 2017, respectively.
58 Semi-Annual Report | July 31, 2020 | See accompanying Notes to Financial Statements
Financial Highlights
AllianzGI Dividend, Interest & Premium Strategy Fund
For a share outstanding throughout each period^:
| Six Months ended July 31, 2020 | Year ended January 31, | ||||||||||||||||||||||||||
(unaudited) | 2020 | 2019 | 2018 | 2017 | 2016 | ||||||||||||||||||||||
Net asset value, beginning of period | $ | 14.34 | $ | 13.52 | $ | 15.32 | $ | 14.72 | $ | 13.59 | $ | 16.95 | |||||||||||||||
Investment Operations: | |||||||||||||||||||||||||||
Net investment income (1) | 0.08 | 0.24 | 0.27 | 0.30 | 0.35 | 0.38 | |||||||||||||||||||||
| Net realized and change in unrealized gain (loss) | (0.33 | ) | 1.48 | (1.17 | ) | 1.43 | 1.98 | (2.09 | ) | ||||||||||||||||||
Total from investment operations | (0.25 | ) | 1.72 | (0.90 | ) | 1.73 | 2.33 | (1.71 | ) | ||||||||||||||||||
| Dividends and Distributions to Shareholders from: | |||||||||||||||||||||||||||
Net investment income | (0.45 | ) | (0.26 | ) | (0.71 | ) | (0.30 | ) | (0.37 | ) | (0.39 | ) | |||||||||||||||
Net realized gains | – | (0.64 | ) | – | – | – | – | ||||||||||||||||||||
Return of capital | – | – | (0.19 | ) | (0.83 | ) | (0.83 | ) | (1.26 | ) | |||||||||||||||||
| Total dividends and distributions to shareholders | (0.45 | ) | (0.90 | ) | (0.90 | ) | (1.13 | ) | (1.20 | ) | (1.65 | ) | |||||||||||||||
Net asset value, end of period | $ | 13.64 | (2) | $ | 14.34 | $ | 13.52 | $ | 15.32 | $ | 14.72 | $ | 13.59 | ||||||||||||||
Market price, end of period | $ | 12.02 | $ | 13.09 | $ | 11.90 | $ | 13.52 | $ | 13.03 | $ | 11.50 | |||||||||||||||
| Total Investment Return (3) | (4.17 | )% | 18.17 | % | (5.42 | )% | 12.92 | % | 24.60 | % | (18.68 | )% | |||||||||||||||
RATIOS/SUPPLEMENTAL DATA: | |||||||||||||||||||||||||||
Net assets, end of period (000s) | $ | 1,292,902 | $ | 1,359,815 | $ | 1,281,712 | $ | 1,452,585 | $ | 1,395,116 | $ | 1,288,319 | |||||||||||||||
Ratio of expenses to average net assets | 0.96 | %(4) | 0.96 | % | 0.95 | % | 0.97 | % | 1.01 | % | 0.97 | % | |||||||||||||||
| Ratio of net investment income to average net assets | 1.31 | %(4) | 1.73 | % | 1.87 | % | 2.03 | % | 2.42 | % | 2.41 | % | |||||||||||||||
Portfolio turnover rate | 72 | % | 76 | % | 50 | % | 85 | % | 39 | % | 54 | % | |||||||||||||||
^ A "–" may reflect actual amounts rounding to less than $0.01 or 0.01%.
(1) Calculated on average shares outstanding during the period.
(2) Payments from affiliates increased the end of period net asset value by less than $0.01.
(3) Total investment return is calculated assuming a purchase of a share at the market price on the first day and a sale of a share at the market price on the last day of each period reported. Dividends and distributions, if any, are assumed, for purposes of this calculation, to be reinvested at prices obtained under the Fund's dividend reinvestment plan. Total investment return does not reflect brokerage commissions or sales charges in connection with the purchase or sale of Fund shares. Total investment return for a period of less than one year is not annualized.
(4) Annualized.
See accompanying Notes to Financial Statements | July 31, 2020 | Semi-Annual Report 59
Financial Highlights
AllianzGI Equity & Convertible Income Fund
For a share outstanding throughout each period^:
| Six Months ended July 31, 2020 | Year ended January 31, | ||||||||||||||||||||||||||
(unaudited) | 2020 | 2019 | 2018 | 2017 | 2016 | ||||||||||||||||||||||
Net asset value, beginning of period | $ | 24.89 | $ | 22.53 | $ | 24.51 | $ | 21.54 | $ | 19.90 | $ | 22.13 | |||||||||||||||
Investment Operations: | |||||||||||||||||||||||||||
Net investment income (1) | 0.05 | 0.18 | 0.19 | 0.40 | 0.41 | 0.47 | |||||||||||||||||||||
| Net realized and change in unrealized gain (loss) | 2.50 | 3.70 | (0.65 | ) | 4.09 | 2.75 | (1.18 | ) | |||||||||||||||||||
Total from investment operations | 2.55 | 3.88 | (0.46 | ) | 4.49 | 3.16 | (0.71 | ) | |||||||||||||||||||
| Dividends and Distributions to Shareholders from: | |||||||||||||||||||||||||||
Net investment income | – | (0.20 | ) | (0.93 | ) | (0.43 | ) | (0.54 | ) | (0.41 | ) | ||||||||||||||||
Net realized gains | (0.76 | ) | (1.32 | ) | (0.59 | ) | (1.09 | ) | (0.98 | ) | (1.11 | ) | |||||||||||||||
| Total dividends and distributions to shareholders | (0.76 | ) | (1.52 | ) | (1.52 | ) | (1.52 | ) | (1.52 | ) | (1.52 | ) | |||||||||||||||
Net asset value, end of period | $ | 26.68 | $ | 24.89 | (2) | $ | 22.53 | $ | 24.51 | $ | 21.54 | $ | 19.90 | ||||||||||||||
Market price, end of period | $ | 24.47 | $ | 23.14 | $ | 20.52 | $ | 22.08 | $ | 19.03 | $ | 16.97 | |||||||||||||||
| Total Investment Return (3) | 9.71 | % | 20.83 | % | (0.25 | )% | 24.96 | % | 21.69 | % | (8.01 | )% | |||||||||||||||
RATIOS/SUPPLEMENTAL DATA: | |||||||||||||||||||||||||||
Net assets, end of period (000s) | $ | 739,167 | $ | 689,650 | $ | 624,315 | $ | 679,241 | $ | 596,911 | $ | 551,378 | |||||||||||||||
Ratio of expenses to average net assets | 1.07 | %(4) | 1.07 | % | 1.13 | %(5) | 1.07 | % | 1.08 | % | 1.10 | %(5) | |||||||||||||||
| Ratio of net investment income to average net assets | 0.45 | %(4) | 0.74 | % | 0.83 | %(5) | 1.80 | % | 1.94 | % | 2.15 | %(5) | |||||||||||||||
Portfolio turnover rate | 51 | % | 50 | % | 81 | % | 99 | % | 90 | % | 110 | % | |||||||||||||||
^ A "–" may reflect actual amounts rounding to less than $0.01 or 0.01%.
(1) Calculated on average shares outstanding during the period.
(2) Payments from affiliates increased the end of period net asset value by less than $0.01.
(3) Total investment return is calculated assuming a purchase of a common share at the market price on the first day and a sale of a common share at the market price on the last day of each period reported. Dividends and distributions, if any, are assumed, for purposes of this calculation, to be reinvested at prices obtained under the Fund's dividend reinvestment plan. Total investment return does not reflect brokerage commissions or sales charges in connection with the purchase or sale of Fund shares. Total investment return for a period of less than one year is not annualized.
(4) Annualized.
(5) Inclusive of excise tax expense of 0.07% and 0.02% for the years ended January 31, 2019 and January 31, 2016, respectively.
60 Semi-Annual Report | July 31, 2020 | See accompanying Notes to Financial Statements
Notes to Financial Statements
AllianzGI Diversified Income & Convertible Fund
AllianzGI Dividend, Interest & Premium Strategy Fund
AllianzGI Equity & Convertible Income Fund
July 31, 2020 (unaudited)
1. Organization and Significant Accounting Policies
AllianzGI Diversified Income & Convertible Fund ("Diversified Income & Convertible"), AllianzGI Dividend, Interest & Premium Strategy Fund ("Dividend, Interest & Premium Strategy") (formerly known as AllianzGI NFJ Dividend, Interest & Premium Strategy Fund) and AllianzGI Equity & Convertible Income Fund ("Equity & Convertible Income") (each, a "Fund" and, together, the "Funds") were organized as Massachusetts business trusts on March 10, 2015, December 12, 2006 and August 20, 2003, respectively. The Funds follow the investment company accounting and reporting guidance of the Financial Accounting Standards Board ("FASB") Accounting Standards Codification Topic 946 Financial Services – Investment Companies. Prior to commencing operations on May 27, 2015, February 28, 2005, and, February 27, 2007, respectively, the Funds had no operations other than matters relating to their organization and registration as diversified, closed-end management investment companies registered under the Investment Company Act of 1940, as amended (the "1940 Act"), and the rules and regulations thereunder. Allianz Global Investors U.S. LLC ("AllianzGI U.S." or the "Investment Manager") serves as the Funds' investment manager. AllianzGI U.S. is an indirect, wholly-owned subsidiary of PFP Holdings, Inc. and is a member of Munich-based Allianz Group. Each Fund has authorized an unlimited amount of common shares with $0.00001 par value.
Diversified Income & Convertible's investment objective is to provide total return through a combination of current income and capital appreciation, while seeking to provide downside protection against capital loss. Under normal market conditions, the Fund will seek to achieve its investment objective by investing in a combination of convertible securities, debt and other income-producing instruments and common stocks and other equity securities. The Fund employs a strategy of writing (selling) covered call options on the stocks held in the equity portion of the portfolio.
Dividend, Interest & Premium Strategy's primary investment objective is to seek current income and gains, with a secondary objective of long-term capital appreciation. Under normal market conditions the Fund pursues its investment objectives by investing in a diversified portfolio of dividend-paying common stocks and income-producing convertible securities. The Fund also employs a strategy of writing (selling) call options on the equity securities held by the Fund in an attempt to generate gains from option premiums.
Dividend, Interest & Premium Strategy can invest up to 10% of its total assets in securities issued by master limited partnerships ("MLPs"), including, without limitation, common units, preferred units, convertible subordinated units or other equity or debt securities.
Equity & Convertible Income's investment objective is to seek total return comprised of capital appreciation, current income and
July 31, 2020 | Semi-Annual Report 61
Notes to Financial Statements
AllianzGI Diversified Income & Convertible Fund
AllianzGI Dividend, Interest & Premium Strategy Fund
AllianzGI Equity & Convertible Income Fund
July 31, 2020 (unaudited)
1. Organization and Significant Accounting Policies (continued)
gains. Under normal market conditions the Fund pursues its objective by investing in a diversified portfolio of equity securities and income-producing convertible securities. The Fund also employs a strategy of writing (selling) call options on the equity securities held by the Fund as well as on equity indexes.
There can be no assurance that the Funds will meet their stated objectives.
The preparation of the Funds' financial statements in accordance with accounting principles generally accepted in the United States of America ("U.S. GAAP") requires the Funds' management to make estimates and assumptions that affect the reported amounts and disclosures in each Fund's financial statements. Actual results could differ from those estimates.
Like many other companies, the Funds' organizational documents provide that its officers ("Officers") and the Board of Trustees of each Fund (together, the "Board") are indemnified against certain liabilities arising out of the performance of their duties to the Funds. In addition, both in some of its principal service contracts and in the normal course of its business, the Funds enter into contracts that provide indemnification to other parties for certain types of losses or liabilities. The Funds' maximum exposure under these arrangements is unknown as this could involve future claims against the Funds.
The following is a summary of significant accounting policies consistently followed by the Funds:
(a) Valuation of Investments
Portfolio securities and other financial instruments for which market quotations are readily available are valued at market value. Market values for various types of securities and other instruments are determined on the basis of closing prices or last sales prices on an exchange or other market, based on quotes or other market information obtained from quotation reporting systems, established market makers or independent pricing services. Investments in mutual funds are valued at the net asset value ("NAV") as reported on each business day, and under normal circumstances. Exchange-traded funds ("ETFs") are valued at their current market trading price. The Funds' investments are valued daily using prices supplied by an independent pricing service or broker/dealer quotations, or by using the last sale or settlement price on the exchange that is the primary market for such securities, or the mean between the last bid and ask quotations. The market value for NASDAQ Global Market and NASDAQ Capital Market securities may also be calculated using the NASDAQ Official Closing Price instead of the last reported sales price. Independent pricing services use information provided by market makers or estimates of market values obtained from yield data relating to investments or securities with similar characteristics.
62 Semi-Annual Report | July 31, 2020
Notes to Financial Statements
AllianzGI Diversified Income & Convertible Fund
AllianzGI Dividend, Interest & Premium Strategy Fund
AllianzGI Equity & Convertible Income Fund
July 31, 2020 (unaudited)
1. Organization and Significant Accounting Policies (continued)
The Board has adopted procedures for valuing portfolio securities and other financial derivative instruments in circumstances where market quotes are not readily available (including in cases where available market quotes are deemed to be unreliable), and has delegated primary responsibility for applying the valuation methods to the Investment Manager. The Funds' Valuation Committee was established by the Board to oversee the implementation of the Funds' valuation methods and to make fair value determinations on behalf of the Board, as instructed. The Investment Manager monitors the continued appropriateness of methods applied and identifies circumstances and events that may require fair valuation. The Investment Manager determines if adjustments should be made in light of market changes, events affecting the issuer, or other factors. If the Investment Manager determines that a valuation method may no longer be appropriate, another valuation method previously approved by the Funds' Valuation Committee may be selected, or the Funds' Valuation Committee will be convened to consider the matter and take any appropriate action in accordance with procedures set forth by the Board. The Board shall review and ratify the appropriateness of the valuation methods and these methods may be amended or supplemented from time to time by the Funds' Valuation Committee.
Short-term debt investments having a remaining maturity of 60 days or less are
valued at amortized cost unless the Board or its Valuation Committee determines that particular circumstances dictate otherwise.
Investments initially valued in currencies other than the U.S. dollar are converted to the U.S. dollar using exchange rates obtained from pricing services. As a result, the NAV of the Fund may be affected by changes in the value of currencies in relation to the U.S. dollar. The value of securities traded in markets outside the United States or denominated in currencies other than the U.S. dollar may be affected significantly on a day that the New York Stock Exchange ("NYSE") is closed.
The prices used by the Funds to value investments may differ from the value that would be realized if the investments were sold, and these differences could be material to the Funds' financial statements. Each Fund's NAV is normally determined as of the close of regular trading (normally, 4:00 p.m. Eastern Time) on the NYSE on each day the NYSE is open for business. In unusual circumstances, the Board or the Valuation Committee may in good faith determine the NAV as of 4:00 p.m., Eastern Time, notwithstanding an earlier, unscheduled close or halt of trading on the NYSE.
The prices of certain portfolio securities or financial instruments may be determined at a time prior to the close of regular trading on the NYSE. In considering whether fair value pricing is required and in determining fair values, the Funds may, among other things, consider significant events (which may be considered to include changes in the value of
July 31, 2020 | Semi-Annual Report 63
Notes to Financial Statements
AllianzGI Diversified Income & Convertible Fund
AllianzGI Dividend, Interest & Premium Strategy Fund
AllianzGI Equity & Convertible Income Fund
July 31, 2020 (unaudited)
1. Organization and Significant Accounting Policies (continued)
U.S. securities or securities indices) that occur after the close of the relevant market and before the time the NAV of the Funds is calculated. With respect to certain foreign securities, the Funds may fair value securities using modeling tools provided by third-party vendors, where appropriate. The Funds have retained a statistical research service to assist in determining the fair value of foreign securities. This service utilizes statistics and programs based on historical performance of markets and other economic data to assist in making fair value estimates. Fair value estimates used by the Funds for foreign securities may differ from the value realized from the sale of those securities and the difference could be material to the financial statements. Fair value pricing may require subjective determinations about the value of a security or other assets, and fair values used to determine the NAV of the Fund may differ from quoted or published prices, or from prices that are used by others, for the same investments. In addition, the use of fair value pricing may not always result in adjustments to the prices of securities or other assets held by a Fund.
(b) Fair Value Measurements
Fair value is defined as the price that would be received to sell an asset or paid to transfer a liability (i.e., the "exit price") in an orderly transaction between market participants. The three levels of the fair value hierarchy are described below:
n Level 1 – quoted prices in active markets for identical investments that the Funds have the ability to access
n Level 2 – valuations based on other significant observable inputs, which may include, but are not limited to, quoted prices for similar assets or liabilities, interest rates, yield curves, volatilities, prepayment speeds, loss severities, credit risks and default rates or other market corroborated inputs
n Level 3 – valuations based on significant unobservable inputs (including the Investment Manager's or Valuation Committee's own assumptions and securities whose price was determined by using a single broker's quote)
The valuation techniques used by the Funds to measure fair value during the six months ended July 31, 2020 were intended to maximize the use of observable inputs and to minimize the use of unobservable inputs.
An investment asset's or liability's level within the fair value hierarchy is based on the lowest level input, individually or in aggregate, that is significant to the fair value measurement. The objective of fair value measurement remains the same even when there is a significant decrease in the volume and level of activity for an asset or liability and regardless of the valuation techniques used.
The inputs or methodology used for valuing securities are not necessarily an indication of the risk associated with investing in those securities. The following are certain inputs and techniques that the Funds generally use to evaluate how to classify each major category of assets and liabilities within Level 2 and Level 3, in accordance with U.S. GAAP.
64 Semi-Annual Report | July 31, 2020
Notes to Financial Statements
AllianzGI Diversified Income & Convertible Fund
AllianzGI Dividend, Interest & Premium Strategy Fund
AllianzGI Equity & Convertible Income Fund
July 31, 2020 (unaudited)
1. Organization and Significant Accounting Policies (continued)
An asset or liability for which market values cannot be measured using the methodologies described above is valued by methods deemed reasonable in good faith by the Valuation Committee, following the procedures established by the Board, to represent fair value. Under these procedures, the Funds generally use a market-based approach which may use related or comparable assets or liabilities, recent transactions, market multiples, book values and other relevant information. Fair value determinations involve the consideration of a number of subjective factors, an analysis of applicable facts and circumstances and the exercise of judgment. As a result, it is possible that the fair value for a security determined in good faith in accordance with the Funds' valuation procedures may differ from valuations for the same security determined by other funds using their own valuation procedures. Although the Funds' valuation procedures are designed to value a security at the price the Funds may reasonably expect to receive upon the security's sale in an orderly transaction, there can be no assurance that any fair value determination thereunder would, in fact, approximate the amount that the Funds would actually realize upon the sale of the security or the price at which the security would trade if a reliable market price were readily available.
Equity Securities (Common and Preferred Stock and Warrants) – Equity securities traded in inactive markets are valued using inputs which include broker-dealer quotes,
recently executed transactions adjusted for changes in the benchmark index, or evaluated price quotes received from independent pricing services that take into account the integrity of the market sector and issuer, the individual characteristics of the security, and information received from broker-dealers and other market sources pertaining to the issuer or security. To the extent that these inputs are observable, the values of equity securities are categorized as Level 2. To the extent that these inputs are unobservable, the values are categorized as Level 3.
Convertible Bonds & Notes – Convertible bonds & notes are valued by independent pricing services based on various inputs and techniques, which include broker-dealer quotations from relevant market makers and recently executed transactions in securities of the issuer or comparable issuers. The broker-dealer quotations received are supported by credit analysis of the issuer that takes into consideration credit quality assessments, daily trading activity, and the activity of the underlying equities, listed bonds and sector-specific trends. To the extent that these inputs are observable, the values of convertible bonds & notes are categorized as Level 2. To the extent that these inputs are unobservable, the values are categorized as Level 3.
Corporate Bonds & Notes – Corporate bonds & notes are generally comprised of two main categories: investment grade bonds and high yield bonds. Investment grade bonds are valued by independent pricing services using various inputs and
July 31, 2020 | Semi-Annual Report 65
Notes to Financial Statements
AllianzGI Diversified Income & Convertible Fund
AllianzGI Dividend, Interest & Premium Strategy Fund
AllianzGI Equity & Convertible Income Fund
July 31, 2020 (unaudited)
1. Organization and Significant Accounting Policies (continued)
techniques, which include broker-dealer quotations, live trading levels, recently executed transactions in securities of the issuer or comparable issuers, and option adjusted spread models that include base curve and spread curve inputs. Adjustments to individual bonds can be applied to recognize trading differences compared to other bonds issued by the same issuer. High yield bonds are valued by independent pricing services based primarily on broker-dealer quotations from relevant market makers and recently executed transactions in securities of the issuer or comparable issuers. The broker-dealer quotations received are supported by credit analysis of the issuer that takes into consideration credit quality assessments, daily trading activity, and the activity of the underlying equities, listed bonds and sector-specific trends. To the extent that these inputs are observable, the values of corporate bonds & notes are categorized as Level 2. To the extent that these inputs are unobservable, the values are categorized as Level 3.
Option Contracts – Option contracts traded over-the-counter ("OTC") and FLexible EXchange ("FLEX") options are valued by independent pricing services based on pricing models that incorporate various inputs such as interest rates, credit spreads, currency exchange rates and volatility measurements for in-the-money, at-the-money, and out-of-the-money contracts based on a given strike price. To the extent that these inputs are observable, the values of
OTC and FLEX option contracts are categorized as Level 2. To the extent that these inputs are unobservable, the values are categorized as Level 3.
(c) Investment Transactions and Investment Income
Investment transactions are accounted for on the trade date. Realized gains and losses on investments are determined on an identified cost basis. Interest income adjusted for the accretion of discounts and amortization of premiums is recorded on an accrual basis. Discounts or premiums on debt securities purchased are accreted or amortized, respectively, to interest income. Conversion premium is not amortized. Dividend income is recorded on the ex-dividend date, except for certain dividends from foreign securities where the ex-dividend date may have passed, and then are recorded as soon after the ex-dividend date as the Funds, using reasonable diligence, become aware of such dividends. Consent fees relating to corporate actions and facility fees and other fees received after settlement date relating to senior loans and commitment fees received relating to unfunded purchase commitments are recorded as miscellaneous income upon receipt. Payments received from certain investments may be comprised of dividends, realized gains and return of capital. These payments may initially be recorded as dividend income and may subsequently be reclassified as realized gains and/or return of capital upon receipt of information from the issuer. Payments considered return of capital reduce the cost basis of the respective security. Distributions, if any, in excess of the
66 Semi-Annual Report | July 31, 2020
Notes to Financial Statements
AllianzGI Diversified Income & Convertible Fund
AllianzGI Dividend, Interest & Premium Strategy Fund
AllianzGI Equity & Convertible Income Fund
July 31, 2020 (unaudited)
1. Organization and Significant Accounting Policies (continued)
cost basis of a security are recognized as capital gains. Expenses are recorded on an accrual basis.
(d) Federal Income Taxes
The Funds intend to distribute all of their taxable income and to comply with the other requirements of Subchapter M of the U.S. Internal Revenue Code of 1986, as amended, applicable to regulated investment companies. Accordingly, no provision for U.S. federal income taxes is required. The Funds may be subject to excise tax based on distributions to shareholders.
Accounting for uncertainty in income taxes establishes for all entities, including pass-through entities such as the Funds, a minimum threshold for financial statement recognition of the benefit of positions taken in filing tax returns (including whether an entity is taxable in a particular jurisdiction), and requires certain expanded tax disclosures. In accordance with provisions set forth under U.S. GAAP, the Investment Manager has reviewed the Funds' tax positions for all open tax years. As of July 31, 2020, the Funds have recorded no liability for net unrecognized tax benefits relating to uncertain income tax positions they have taken. The Funds' U.S. federal income tax returns for the prior three years, as applicable, remain subject to examination by the Internal Revenue Service.
(e) Dividends and Distributions to Shareholders
Diversified Income & Convertible declares dividends and distributions on a monthly basis. Dividend, Interest & Premium Strategy and Equity & Convertible Income declare dividends and distributions on a quarterly basis. These dividends and distributions may be comprised in varying proportions of net investment income, gains from option premiums and the sale of portfolio securities and return of capital. The Funds record dividends and distributions on the ex-dividend date. The amount of dividends from net investment income and distributions from net realized capital gains or return of capital is determined in accordance with U.S. federal income tax regulations, which may differ from U.S. GAAP. These "book-tax" differences are considered either temporary or permanent in nature. To the extent these differences are permanent in nature, such amounts are reclassified within the capital accounts based on their U.S. federal income tax treatment. Temporary differences do not require reclassification. To the extent dividends and/or distributions exceed current and accumulated earnings and profits for U.S. federal income tax purposes, they are reported as dividends and/or distributions to shareholders from return of capital. As of July 31, 2020, it is anticipated that Dividend, Interest & Premium Strategy will have a return of capital at fiscal year-end.
(f) Convertible Securities
The Funds may invest a portion of their assets in convertible securities. Although convertible securities derive part of their value from that
July 31, 2020 | Semi-Annual Report 67
Notes to Financial Statements
AllianzGI Diversified Income & Convertible Fund
AllianzGI Dividend, Interest & Premium Strategy Fund
AllianzGI Equity & Convertible Income Fund
July 31, 2020 (unaudited)
1. Organization and Significant Accounting Policies (continued)
of the securities into which they are convertible, they are not considered derivative financial instruments. However, certain of the Funds' investments in convertible securities include features which render them sensitive to price changes in their underlying securities. The value of structured/synthetic convertible securities can be affected by interest rate changes and credit risks of the issuer. Such securities may be structured in ways that limit their potential for capital appreciation and the entire value of the security may be at risk of loss depending on the performance of the underlying equity security. Consequently, the Funds are exposed to greater downside risk than traditional convertible securities, but typically still less than that of the underlying stock.
(g) Payment In-Kind Securities
The Funds may invest in payment in-kind securities, which are debt or preferred stock securities that require or permit payment of interest in the form of additional securities. Payment in-kind securities allow the issuer to avoid or delay the need to generate cash to meet current interest payments and, as a result, may involve greater risk than securities that pay interest currently or in cash.
(h) Warrants
The Funds may receive warrants. Warrants are securities that are usually issued together with a debt security or preferred stock and that give the holder the right to buy a proportionate amount of common stock at a specified price. Warrants may be freely
transferable and are often traded on major exchanges. Warrants normally have a life that is measured in years and entitle the holder to buy common stock of a company at a price that is usually higher than the market price at the time the warrant is issued. Warrants may entail greater risks than certain other types of investments. Generally, warrants do not carry the right to receive dividends or exercise voting rights with respect to the underlying securities, and they do not represent any rights in the assets of the issuer. In addition, their value does not necessarily change with the value of the underlying securities, and they cease to have value if they are not exercised on or before their expiration date. If the market price of the underlying stock does not exceed the exercise price during the life of the warrant, the warrant will expire worthless. Warrants may increase the potential profit or loss to be realized from the investment as compared with investing the same amount in the underlying securities. Similarly, the percentage increase or decrease in the value of an equity security warrant may be greater than the percentage increase or decrease in the value of the underlying common stock. Warrants may relate to the purchase of equity or debt securities. Debt obligations with warrants attached to purchase equity securities have many characteristics of convertible securities and their prices may, to some degree, reflect the performance of the underlying stock. Debt obligations also may be issued with warrants attached to purchase additional debt securities at the same coupon rate. A decline in interest rates would permit a Fund to sell
68 Semi-Annual Report | July 31, 2020
Notes to Financial Statements
AllianzGI Diversified Income & Convertible Fund
AllianzGI Dividend, Interest & Premium Strategy Fund
AllianzGI Equity & Convertible Income Fund
July 31, 2020 (unaudited)
1. Organization and Significant Accounting Policies (continued)
such warrants at a profit. If interest rates rise, these warrants would generally expire with no value.
(i) Statement of Cash Flows
U.S. GAAP requires entities providing financial statements that report both financial position and results of operations to also provide a statement of cash flows for each period for which results of operations are provided, but exempts investment companies meeting certain conditions. One of the conditions is that the fund had little or no debt, based on the average debt outstanding during the period, in relation to average total assets. Diversified Income & Convertible's indebtedness has been determined to be at a level requiring a statement of cash flows. The Statement of Cash Flows has been prepared using the indirect method which required net change in net assets resulting from operations to be adjusted to reconcile to net cash flows from operating activities. Dividend, Interest & Premium Strategy and Equity & Convertible Income do not require a Statement of Cash Flows.
(j) Loan Interest Expense
Loan interest expense relates to the Diversified Income & Convertible's participation in debt financing transactions (See Note 7 and Note 8). Interest expense is recorded as it is incurred.
(k) Repurchase Agreements
The Funds are parties to Master Repurchase Agreements ("Master Repo Agreements") with select counterparties. The Master Repo
Agreements include provisions for the initiation of repurchase transactions, income payments, events of default, and maintenance of collateral.
The Funds enter into transactions, under the Master Repo Agreements, with their custodian bank or securities brokerage firms whereby they purchase securities under agreements (i.e., repurchase agreements) to resell such securities at an agreed upon price and date. The Funds, through their custodian, take possession of securities collateralizing the repurchase agreement. Such agreements are carried at the contract amount in the financial statements, which is considered to represent fair value. The collateral that is pledged (i.e. the securities received by the Funds), which consists primarily of U.S. government obligations and asset-backed securities, is held by the custodian bank for the benefit of the Funds until the maturity of the repurchase agreement. Provisions of the repurchase agreements and the procedures adopted by the Funds require that the market value of the collateral, including accrued interest thereon, be sufficient in the event of default by the counterparty. If the counterparty defaults under the Master Repo Agreements and the value of the collateral declines or if the counterparty enters an insolvency proceeding, realization of the collateral by the Funds may be delayed or limited. The gross values are included in the Funds' Schedules of Investments. As of July 31, 2020, the value of the related collateral exceeded the value of the repurchase agreements for each Fund.
July 31, 2020 | Semi-Annual Report 69
Notes to Financial Statements
AllianzGI Diversified Income & Convertible Fund
AllianzGI Dividend, Interest & Premium Strategy Fund
AllianzGI Equity & Convertible Income Fund
July 31, 2020 (unaudited)
1. Organization and Significant Accounting Policies (continued)
(l) Restricted Securities
The Funds are permitted to invest in securities that are subject to legal or contractual restrictions on resale. These securities generally may be resold in transactions exempt from registration or to the public if the securities are registered. Disposal of these securities may involve time-consuming negotiations and expenses, and prompt sale at an acceptable price may be difficult.
(m) New Accounting Pronouncements
In March 2020, the FASB issued Accounting Standards Update ("ASU") 2020-04, which provides optional expedients and exceptions for contracts, hedging relationships and other transactions affected by reference rate reform if certain criteria are met. The adoption of the ASU is elective. At this time, management is evaluating the implications of these changes on the financial statements.
2. Principal Risks
In the normal course of business, the Funds trade financial instruments and enter into financial transactions where risk of potential loss exists due to, among other things, changes in the market (market risk) or failure of the other party to a transaction to perform (counterparty risk). The Funds are also exposed to other risks such as, but not limited to, interest rate, credit and leverage risks.
Interest rate risk is the risk that fixed income securities' valuations will change because of changes in interest rates. During periods of rising nominal interest rates, the values of
fixed income instruments are generally expected to decline. Conversely, during periods of declining nominal interest rates, the values of fixed income instruments are generally expected to rise. To the extent that a Fund effectively has short positions with respect to fixed income instruments, the values of such short positions would generally be expected to rise when nominal interest rates rise and to decline when nominal interest rates decline. A nominal interest rate can be described as the sum of a real interest rate and an expected inflation rate. Fixed income securities with longer durations tend to be more sensitive to changes in interest rates, usually making them more volatile than securities with shorter durations. Duration is used primarily as a measure of the sensitivity of a fixed income security's market price to interest rate (i.e., yield) movements. Interest rate changes can be sudden and unpredictable, and the Funds may lose money as a result of movements in interest rates. High-yield or junk bonds are subject to greater levels of credit and liquidity risk, may be speculative and may decline in value due to increase in interest rates or an issuer's deterioration and/or default. The Funds may not be able to hedge against changes in interest rates or may choose not to do so for cost or other reasons. In addition, any hedges may not work as intended. The values of equity and other non-fixed income securities may also decline due to fluctuations in interest rates.
The Funds are exposed to credit risk, which is the risk of losing money if the issuer or guarantor of a fixed income security is unable
70 Semi-Annual Report | July 31, 2020
Notes to Financial Statements
AllianzGI Diversified Income & Convertible Fund
AllianzGI Dividend, Interest & Premium Strategy Fund
AllianzGI Equity & Convertible Income Fund
July 31, 2020 (unaudited)
2. Principal Risks (continued)
or unwilling, or is perceived (whether by market participants, rating agencies, pricing services or otherwise) as unable or unwilling, to make timely principal and/or interest payments, or to otherwise honor its obligations. Securities are subject to varying degrees of credit risk, which are often reflected in credit ratings.
The market values of securities may decline due to general market conditions (market risk) which are not specifically related to a particular company, such as real or perceived adverse economic conditions, changes in the general outlook for corporate earnings, changes in interest or currency rates, adverse changes to credit markets or adverse investor sentiment. They may also decline due to factors that affect a particular industry or industries, such as labor shortages or increased production costs and competitive conditions within an industry. Equity securities and equity-related investments generally have greater market price volatility than fixed income securities, although under certain market conditions fixed income securities may have comparable or greater price volatility. Credit ratings downgrades may also negatively affect securities held by the Funds. Even when markets perform well, there is no assurance that the investments held by the Funds will increase in value along with the broader market. In addition, market risk includes the risk that local, regional or global events, including geopolitical and other events may disrupt the economy on a national or global level. For example, events such as war, acts of terrorism, the spread of
infectious illness or other public health issues, recessions, or other events could have a significant impact on the economy or the markets for financial instruments and, as a result, could have a significant impact on a Fund and its investments. As a further example, an outbreak of respiratory disease caused by a novel coronavirus designated as COVID-19 was first detected in China in December 2019 and subsequently spread globally, being designated as a pandemic in early 2020. The transmission of COVID-19 and efforts to contain its spread have resulted in, among other things, border closings and other significant travel restrictions and disruptions; mandatory stay-at-home and work-from-home orders in numerous countries, including the United States; significant disruptions to business operations, supply chains and customer activity, as well as mandatory business closures; lower consumer demand for goods and services; event cancellations and restrictions; cancellations, reductions and other changes in services; significant challenges in healthcare service preparation and delivery; public gathering limitations and prolonged quarantines; and general concern and uncertainty. These effects have exacerbated the significant risks inherent in market investments, and the COVID-19 pandemic has already meaningfully disrupted the global economy and markets, causing market losses across a range of asset classes, as well as both heightened market volatility and increased illiquidity for trading. Although the long-term economic fallout of COVID-19 is difficult to predict, it has the potential to continue to
July 31, 2020 | Semi-Annual Report 71
Notes to Financial Statements
AllianzGI Diversified Income & Convertible Fund
AllianzGI Dividend, Interest & Premium Strategy Fund
AllianzGI Equity & Convertible Income Fund
July 31, 2020 (unaudited)
2. Principal Risks (continued)
have ongoing material adverse effects on the global economy, the economies of individual countries, and the financial performance of individual issuers, sectors, industries, asset classes, and markets in significant and unforeseen ways. Health crises caused by the outbreak of COVID-19 may also exacerbate other pre-existing political, social, economic, market and financial risks. The effects of the outbreak in developing or emerging market countries may be greater due to less established health care systems. The COVID-19 pandemic and its effects may be short term or may last for an extended period of time, and in either case could result in significant market volatility, exchange trading suspensions and closures, declines in global financial markets, higher default rates, and a substantial economic downturn or recession. Furthermore, the ability of the Investment Manager or its affiliates to operate effectively, including the ability of personnel to function, communicate and travel to the extent necessary to carry out each Fund's investment strategies and objectives, may be materially impaired. All of the foregoing could impair a Fund's ability to maintain operational standards (such as with respect to satisfying redemption requests), providers, adversely affect the value and liquidity of each Fund's investments, and negatively impact each Fund's performance and your investment in the respective Fund.
The Funds are exposed to counterparty risk, or the risk that an institution or other entity with which the Funds have unsettled or open transactions will default. The potential loss to
the Funds could exceed the value of the financial assets recorded in the Funds' financial statements. Financial assets, which potentially expose the Funds to counterparty risk, consist principally of cash due from counterparties and investments. The Investment Manager seeks to minimize the Funds' counterparty risk by performing reviews of each counterparty and by minimizing concentration of counterparty risk by undertaking transactions with multiple customers and counterparties on recognized and reputable exchanges. Delivery of securities sold is only made once the Funds have received payment. Payment is made on a purchase once the securities have been delivered by the counterparty. The trade will fail if either party fails to meet its obligation.
The Funds are exposed to risks associated with leverage. Leverage may cause the value of the Funds' shares to be more volatile than if the Funds did not use leverage. This is because leverage tends to exaggerate the effect of any increase or decrease in the value of the Funds' portfolio securities. The Funds may engage in transactions or purchase instruments that give rise to forms of leverage. In addition, to the extent the Funds employ leverage, dividend and interest costs on such leverage may not be recovered by any appreciation of the securities purchased with the leverage proceeds and could exceed the Funds' investment returns, resulting in greater losses. As discussed further in Note 12, the Funds have entered into a credit agreement. In connection with their use of leverage as well as their investment activities, the Funds may have exposure to the London
72 Semi-Annual Report | July 31, 2020
Notes to Financial Statements
AllianzGI Diversified Income & Convertible Fund
AllianzGI Dividend, Interest & Premium Strategy Fund
AllianzGI Equity & Convertible Income Fund
July 31, 2020 (unaudited)
2. Principal Risks (continued)
Interbank Offered Rate ("LIBOR"). LIBOR is an average interest rate, determined by the ICE Benchmark Administration, that banks charge one another for the use of short-term money. The United Kingdom's Financial Conduct Authority, which regulates LIBOR, has announced plans to phase out the use of LIBOR by the end of 2021. There remains uncertainty regarding the future utilization of LIBOR and the nature of any replacement rate, and any potential effects of the transition away from LIBOR on a Fund or on certain instruments in which a Fund invests are not known. As discussed further in Note 7 and Note 8, Diversified Income & Convertible has mandatory redeemable preferred shares and senior secured notes outstanding and entered into margin loan financing.
The Funds may hold defaulted securities that may involve special considerations including bankruptcy proceedings, other regulatory and legal restrictions affecting the Funds' ability to trade, and the availability of prices from independent pricing services or dealer quotations. Defaulted securities are often illiquid and may not be actively traded. Sale of securities in bankrupt companies at an acceptable price may be difficult and differences compared to the value of the securities used by the Funds could be material. A Fund may incur additional expenses to the extent it is required to seek recovery upon a portfolio security's default in the payment of principal or interest. In any bankruptcy proceeding relating to a defaulted investment, a Fund may lose its entire investment or may be required to
accept cash or securities with a value substantially less than its original investment.
Diversified Income & Convertible will terminate on the first business day following the fifteenth anniversary of the effective date of its registration statement, May 22, 2030, unless such term is extended by the Trustees and absent Trustee and shareholder approval to amend the limited term. Leading up to the Fund's dissolution date, the Fund may begin liquidating all or a portion of the Fund's portfolio, and the Fund may deviate from its investment strategy. As a result, during the wind-down period, the Fund's distributions may decrease, and such distributions may include a return of capital. The Fund does not seek to return $25.00 per common share (its initial offering price) upon termination. As the assets of the Fund will liquidate in connection with its termination, the Fund may be required to sell portfolio securities when it otherwise would not, including at times when market conditions are not favorable, which may cause the fund to lose money.
3. Financial Derivative Instruments
Disclosure about derivatives and hedging activities requires qualitative disclosure regarding objectives and strategies for using derivatives, quantitative disclosure about fair value amounts of gains and losses on derivatives, and disclosure about credit-risk-related contingent features in derivative agreements. The disclosure requirements distinguish between derivatives which are accounted for as "hedges", and those that do not qualify for such accounting. Although the Funds at times use derivatives for hedging
July 31, 2020 | Semi-Annual Report 73
Notes to Financial Statements
AllianzGI Diversified Income & Convertible Fund
AllianzGI Dividend, Interest & Premium Strategy Fund
AllianzGI Equity & Convertible Income Fund
July 31, 2020 (unaudited)
3. Financial Derivative Instruments (continued)
purposes, the Funds reflect derivatives at fair value and recognizes changes in fair value through the Funds' Statements of Operations, and such derivatives do not qualify for hedge accounting treatment.
Option Transactions
The Funds may write (sell) put and call options on securities and indices to earn premiums, for hedging purposes, risk management purposes or otherwise as part of their investment strategies. When an option is written, the premium received is recorded as an asset with an equal liability that is subsequently marked to market to reflect the market value of the option written. These liabilities, if any, are reflected as options written in the Funds' Statements of Assets and Liabilities. Premiums received from writing options which expire unexercised are recorded on the expiration date as a realized gain. The difference between the premium received and the amount paid on effecting a closing purchase transaction, including brokerage commissions, is also treated as a realized gain, or if the premium is less than the amount paid for the closing purchase transaction, as a realized loss. If a call option written is exercised, the premium is added to the proceeds from the sale of the underlying security in determining whether there has been a realized gain or loss. If a put option written is exercised, the premium reduces the cost basis of the security. In writing an option, the Funds bear the market risk of an unfavorable change in the price of the security underlying the written option.
Exercise of a written option could result in the Funds purchasing a security at a price different from its current market value.
There are several risks associated with option transactions on securities. For example, there are significant differences between the securities and options markets that could result in an imperfect correlation between these markets, causing a given transaction not to achieve its objective. The Funds' ability to use options successfully will depend on the Investment Manager's ability to predict pertinent market movements, which cannot be assured. As the writer of a covered call option, a Fund foregoes, during the option's life, the opportunity to profit from increases in the market value of the security covering the call option above the sum of the premium and the strike price of the call, but has retained the risk of loss should the price of the underlying security decline.
4. Investment Manager & Deferred Compensation
Investment Manager. Each Fund has an Investment Management Agreement (for the purpose of this section, each an "Agreement") with the Investment Manager. Subject to the supervision of the Funds' Board, the Investment Manager is responsible for managing, either directly or through others selected by it, the Funds' investment activities, business affairs and administrative matters. Pursuant to their Agreements, Diversified Income & Convertible and Equity & Convertible Income pay the Investment Manager an annual fee, payable monthly, at an annual rate of 1.00% of their
74 Semi-Annual Report | July 31, 2020
Notes to Financial Statements
AllianzGI Diversified Income & Convertible Fund
AllianzGI Dividend, Interest & Premium Strategy Fund
AllianzGI Equity & Convertible Income Fund
July 31, 2020 (unaudited)
4. Investment Manager & Deferred Compensation (continued)
average daily total managed assets. Pursuant to its Agreement, Dividend, Interest & Premium Strategy pays the Investment Manager an annual fee, payable monthly, at an annual rate of 0.90% of its average daily total managed assets. Diversified Income & Convertible's Agreement defines total managed assets as the total assets of the Fund (including assets attributable to any Preferred Shares, borrowings, issued debt securities or other forms of leverage that may be outstanding) minus accrued liabilities (other than liabilities representing leverage). The Agreements of each of Dividend, Interest & Premium Strategy and Equity & Convertible Income define total managed assets as the total assets of each Fund (including assets attributable to any borrowing that may be outstanding) minus accrued liabilities (other than liabilities representing borrowings).
Deferred Compensation. The Trustees do not currently receive any pension or retirement benefits from the Trust. In calendar year 2018 and certain prior periods, the Funds
maintained a deferred compensation plan pursuant to which each Independent Trustee had the opportunity to elect not to receive all or a portion of his or her fees from the Fund on a current basis, but instead to receive in a subsequent period chosen by the Trustee an amount equal to the value of such compensation if such compensation had been invested in one or more series of Allianz Funds or Allianz Funds Multi-Strategy Trust selected by the Trustees from and after the normal payment dates for such compensation. The deferred compensation program was closed to new deferrals effective January 1, 2019, and all Trustee fees earned with respect to service in calendar year 2019 and beyond have been or will be paid in cash, on a current basis, unless the Board of Trustees of the Allianz-Sponsored Funds reopens the program to new deferrals. Allianz Funds and Allianz Funds Multi-Strategy Trust still have obligations with respect to Trustee fees deferred in 2018 and in prior periods, and will continue to have such obligations until all deferred Trustee fees are paid out pursuant to the terms of the deferred compensation plan.
5. Investments in Securities
For the six months ended July 31, 2020, purchases and sales of investments, other than short-term securities were:
Purchases | Sales | ||||||||||
Diversified Income & Convertible | $ | 272,901,226 | $ | 269,457,709 | |||||||
Dividend, Income & Premium Strategy | 843,425,314 | 891,872,734 | |||||||||
Equity & Convertible Income | 333,469,330 | 364,884,518 | |||||||||
July 31, 2020 | Semi-Annual Report 75
Notes to Financial Statements
AllianzGI Diversified Income & Convertible Fund
AllianzGI Dividend, Interest & Premium Strategy Fund
AllianzGI Equity & Convertible Income Fund
July 31, 2020 (unaudited)
6. Income Tax Information
At July 31, 2020, the aggregate cost basis and the net unrealized appreciation (depreciation) of investments and other financial instruments for U.S. federal income tax purposes were:
| Federal Tax Cost Basis (1) | Unrealized Appreciation | Unrealized Depreciation | Net Unrealized Appreciation | ||||||||||||||||
| Diversified Income & Convertible | $ | 360,697,146 | $ | 48,852,110 | $ | 17,606,875 | $ | 31,245,235 | |||||||||||
| Dividend, Interest & Premium Strategy | 1,240,583,645 | 140,332,291 | 88,211,085 | 52,121,206 | |||||||||||||||
| Equity & Convertible Income | 673,209,462 | 100,615,790 | 34,792,493 | 65,823,297 | |||||||||||||||
(1) Differences between book and tax cost basis are primarily attributable to wash sale loss deferrals and differing treatment of bond premium amortization.
7. Long-Term Financing Arrangements
On October 2, 2015, Diversified Income & Convertible completed a private placement with a single institutional investor, consisting of $30,000,000 in Series A Mandatory Redeemable Preferred Shares ("MRPS") with a mandatory redemption date of October 2, 2025, and $50,000,000 in Senior Secured Notes ("Notes" and together with MRPS, "Long-Term Financing Arrangements") due November 22, 2029. Fitch Ratings ("Fitch")
assigned a rating of "AA" to the MRPS and "AAA" to the Notes. The Long-Term Financing Arrangements refinanced a portion of the Diversified Income & Convertible's short-term borrowings under the Margin Loan Financing described in Note 8. For a portion of its borrowings, Diversified Income & Convertible continues to maintain short-term borrowings under the Margin Loan Financing described in Note 8 at variable interest rates.
Mandatory Redeemable Preferred Shares
At July 31, 2020, Diversified Income & Convertible had 1,200,000 shares of MRPS outstanding with an aggregate liquidation preference of $30,000,000 ($25.00 per share). The following table summarizes the key terms of the MRPS at July 31, 2020:
| Mandatory Redemption Date | Annual Dividend Rate | Aggregate Liquidation Preference | Estimated Fair Value | ||||||||||||
| October 2, 2025 | 4.34 | % | $ | 30,000,000 | $ | 30,000,000 | |||||||||
Holders of MRPS are entitled to receive a quarterly dividend at an annual fixed dividend rate of 4.34%, subject to upward adjustment (by as much as 4.00%) during any period when the MRPS have a rating of below "A"
from Fitch, or the equivalent from another rating agency (with the rate increasing at lower rating levels). The MRPS will have a "default" interest rate of 5.00% whenever a past due amount is outstanding with respect
76 Semi-Annual Report | July 31, 2020
Notes to Financial Statements
AllianzGI Diversified Income & Convertible Fund
AllianzGI Dividend, Interest & Premium Strategy Fund
AllianzGI Equity & Convertible Income Fund
July 31, 2020 (unaudited)
7. Long-Term Financing Arrangements (continued)
to the MRPS. Dividends are accrued daily and paid quarterly and are presented in Diversified Income & Convertible's Statement of Assets & Liabilities as interest payable on dividends to mandatory redeemable preferred shareholders. For the six months ended July 31, 2020, Diversified Income & Convertible paid $651,000 in interest on dividends to mandatory redeemable preferred shareholders. The MRPS are senior, with priority in all respects, to Diversified Income & Convertible's outstanding common shares as to payments of dividends and as to distribution of assets upon dissolution, liquidation or winding up of the affairs of the Fund. The MRPS rank pari passu with any and all other preferred shares of the Fund, and rank junior to the Fund's indebtedness, including the Notes, the Margin Loan Financing and any other senior secured indebtedness. Diversified Income & Convertible may redeem all or any part of the MRPS at any time, subject to certain redemption premiums. With respect to the MRPS, the Fund is subject to periodic asset coverage testing, including a monthly 225% asset coverage test and a weekly asset coverage test that is tied to rating agency criteria, in each case subject to various terms and conditions. If the Fund's asset coverage is insufficient under either of these tests, it may be required to redeem some or all of the MRPS. No such mandatory redemption had been triggered as of the end of the most recent fiscal period.
Senior Secured Notes
At July 31, 2020, Diversified Income & Convertible had $50,000,000 in aggregate principal amount of Notes outstanding. The Notes rank pari passu with all other senior debt of Diversified Income & Convertible, including the Margin Loan Financing, and are secured by a lien on all assets of the Fund of every kind, including all securities and all other investment property, equal and ratable with the liens securing the Margin Loan Financing. The Notes are senior, with priority in all respects, to the MRPS and the outstanding common shares as to payments of dividends and as to distribution of assets upon dissolution, liquidation or winding up of the affairs of the Fund. Holders of the Notes are entitled to receive cash interest payments semi-annually until maturity. The Notes accrue interest at an annual fixed rate of 3.94%. The Notes will be subject to a penalty interest rate of an additional 2.00% while overdue payments are outstanding, and an additional 1.00% during any interest rate period when the Notes, at any time, have a rating of less than "A-" from Fitch or the equivalent from another agency. The Notes are prepayable in whole or in part at any time, subject to a prepayment premium, which may be adjusted under some circumstances based on asset coverage levels. Interest expense of $ 982,301 is included in the Diversified Income & Convertible's Statement of Operations.
July 31, 2020 | Semi-Annual Report 77
Notes to Financial Statements
AllianzGI Diversified Income & Convertible Fund
AllianzGI Dividend, Interest & Premium Strategy Fund
AllianzGI Equity & Convertible Income Fund
July 31, 2020 (unaudited)
7. Long-Term Financing Arrangements (continued)
The following table shows the maturity date, interest rate, notional/carrying amount and estimated fair value of the Notes outstanding at July 31, 2020:
| Maturity Date | Interest Rate | Notional/Carrying Amount | Estimated Fair Value | ||||||||||||
| November 22, 2029 | 3.94 | % | $ | 50,000,000 | $ | 50,000,000 | |||||||||
With respect to the Notes, the Fund is subject to monthly asset coverage tests that mirror those applicable to closed-end funds set forth in Section 18 of the 1940 Act, as well as a weekly asset coverage test that is tied to rating agency criteria, in each case subject to various terms and conditions. A breach of any of these tests, after the passage of a cure period, would constitute an event of default under the Notes. As of the end of the most recent fiscal period, no such breach had occurred. The agreements governing the MRPS and Notes impose certain additional customary covenants and restrictions on the Fund, including, among others, restrictions on distributions and a requirement that the Fund adhere to its stated investment policies.
8. Margin Loan Financing
Diversified Income & Convertible has entered into a margin loan financing agreement with BNP Paribas Prime Brokerage International, Ltd. ("BNP"). The margin loan is offered at a daily rate equal to the U.S. 3-month LIBOR rate plus 0.90%. At July 31, 2020, the Fund had a borrowing outstanding under the margin agreement totaling $25,000,000. The interest rates charged at July 31, 2020, was 1.150%. During the period ended July 31, 2020, the weighted average daily balance outstanding was $25,000,000 at the weighted average interest rate of 1.706%. With respect to the
margin loan financing, loan interest expense of $164,011 is included in the Diversified Income & Convertible's Statement of Operations. The Fund is required to fully collateralize its outstanding loan balance as determined by BNP. Pledged assets are held in a segregated account and are denoted in the Fund's Schedule of Investments.
9. Payments from Affiliates
During the year ended January 31, 2020, AllianzGI U.S. reimbursed Diversified Income & Convertible and Equity & Convertible Income $178 and $1,434, respectively, for realized losses resulting from trading errors.
During the period ended July 31, 2020, AllianzGI U.S. reimbursed Dividend, Interest & Premium Strategy $3,693, for realized losses resulting from trading errors.
10. Fund Events
Effective April 30, 2020, the AllianzGI NFJ Dividend, Interest & Premium Strategy Fund changed its name to AllianzGI Dividend, Interest & Premium Strategy Fund.
On July 7, 2020, AllianzGI U.S. and Virtus Investment Partners, Inc. ("Virtus") announced that they have entered into an agreement providing for a strategic alliance between the two parties. As part of this strategic alliance, wholly-owned subsidiaries
78 Semi-Annual Report | July 31, 2020
Notes to Financial Statements
AllianzGI Diversified Income & Convertible Fund
AllianzGI Dividend, Interest & Premium Strategy Fund
AllianzGI Equity & Convertible Income Fund
July 31, 2020 (unaudited)
10. Fund Events (continued)
of Virtus are expected to become the investment adviser and administrator for the Funds. With respect to all Funds other than the suite of value equity Funds, AllianzGI U.S. portfolio management teams are expected to continue to be responsible for the day-to-day management of the Funds, through AllianzGI U.S. serving as sub-adviser to AllianzGI U.S Funds. With respect to AllianzGI Diversified Income & Convertible Fund and AllianzGI Equity & Convertible Income Fund, AllianzGI U.S. portfolio management teams are expected to continue to be responsible for the day-to-day management of those Funds, through AllianzGI U.S. serving as sub-adviser. With respect to the AllianzGI Dividend, Interest & Premium Strategy Fund managed by AllianzGI U.S.' San Diego-based Income & Growth and Dallas-based Value Equity U.S. teams, members of the Income & Growth teams are expected to continue to be responsible for the day-to-day management of a portion of the Fund, through AllianzGI U.S. serving as sub-adviser, while members of the Value Equity U.S. team are expected to become employees of Virtus or an affiliate of Virtus and continue their day-to-day management of a portion of the Fund pursuant to a sub-advisory agreement, as applicable. Certain of the new arrangements, including the new management agreements and sub-advisory agreements, have been approved by the Funds' Board of Trustees and must be approved by Fund shareholders in order to take effect.
11. Subsequent Events
In preparing these financial statements, the Funds' management has evaluated events and transactions for potential recognition or disclosure through the date the financial statements were issued.
On August 3, 2020, a monthly distribution of $0.167 per share was declared to Diversified Income & Convertible common shareholders, payable September 1, 2020 to common shareholders of record on August 13, 2020.
On September 1, 2020, a monthly distribution of $0.167 per share was declared to Diversified Income & Convertible common shareholders, payable October 1, 2020 to common shareholders of record on September 11, 2020.
On September 4, 2020, the following quarterly distributions were declared to shareholders, payable September 25, 2020 to shareholders of record on September 14, 2020:
| Dividend, Interest & Premium Strategy | $ | 0.225 | per share | ||||
Equity & Convertible Income | $ | 0.380 | per share | ||||
There were no other subsequent events identified that require recognition or disclosure.
July 31, 2020 | Semi-Annual Report 79
Annual Shareholder Meeting Results (unaudited)
AllianzGI Diversified Income & Convertible Fund
AllianzGI Dividend, Interest & Premium Strategy Fund
AllianzGI Equity & Convertible Income Fund
The Funds held their annual meeting of shareholders on July 9, 2020. Shareholders voted as indicated below:
Diversified Income & Convertible:
Affirmative | Withheld Authority | ||||||||||
Election of F. Ford Drummond | 10,102,638 | 257,771 | |||||||||
Election of Thomas J. Fuccillo† | 10,194,710 | 165,700 | |||||||||
Election of James S. MacLeod | 10,112,515 | 247,893 | |||||||||
The other members of the Board of Trustees at the time of the meeting, namely, Mses. Sarah E. Cogan and Deborah A. DeCotis, and Messrs. Erick R. Holt†, James A. Jacobson, Hans W. Kertess, William B. Ogden, IV, Davey S. Scoon and Alan Rappaport continued to serve as Trustees of the Fund.
† Interested Trustee
Dividend, Interest & Premium Strategy:
Affirmative | Withheld Authority | ||||||||||
Election of Sarah E. Cogan | 75,068,666 | 12,618,694 | |||||||||
Election of F. Ford Drummond | 75,007,666 | 12,679,691 | |||||||||
Election of Alan Rappaport | 74,989,445 | 12,697,912 | |||||||||
Election of Davey S. Scoon | 74,969,819 | 12,717,538 | |||||||||
The other members of the Board of Trustees at the time of the meeting, namely, Ms. Deborah A. DeCotis and Messrs. Thomas J. Fuccillo†, Erick R. Holt†, James A. Jacobson, Hans W. Kertess, James S. MacLeod and William B. Ogden, IV continued to serve as Trustees of the Fund.
† Interested Trustee
Equity & Convertible Income:
Affirmative | Withheld Authority | ||||||||||
Election of Hans W. Kertess | 22,607,139 | 2,165,945 | |||||||||
Election of William B. Ogden, IV | 22,621,033 | 2,152,050 | |||||||||
Election of Alan Rappaport | 22,651,433 | 2,121,650 | |||||||||
Election of Davey S. Scoon | 22,703,576 | 2,069,508 | |||||||||
The other members of the Board of Trustees at the time of the meeting, namely, Mses. Sarah E. Cogan and Ms. Deborah A. DeCotis, and Messrs. F. Ford Drummond, Thomas J. Fuccillo†, Erick R. Holt†, James A. Jacobson, and James S. MacLeod continued to serve as Trustees of the Fund.
† Interested Trustee
80 Semi-Annual Report | July 31, 2020
Proxy Voting Policies & Procedures (unaudited)
AllianzGI Diversified Income & Convertible Fund
AllianzGI Dividend, Interest & Premium Strategy Fund
AllianzGI Equity & Convertible Income Fund
A description of the policies and procedures that the Funds have adopted to determine how to vote proxies relating to portfolio securities and information about how the Funds voted proxies relating to portfolio securities held during the most recent twelve month period ended June 30 is available (i) without charge, upon request, by calling the Funds' shareholder servicing agent at (800) 254-5197; (ii) on the Funds' website at us.allianzgi.com/closedendfunds; and (iii) on the Securities and Exchange Commission website at www.sec.gov.
July 31, 2020 | Semi-Annual Report 81
Matters Relating to the Trustees' Consideration of the Investment Management Agreements (unaudited)
AllianzGI Diversified Income & Convertible Fund
AllianzGI Dividend, Interest & Premium Strategy Fund
AllianzGI Equity & Convertible Income Fund
AllianzGI Diversified Income & Convertible Fund/AllianzGI Equity & Convertible Income Fund/AllianzGI Dividend, Interest & Premium Strategy Fund (formerly, AllianzGI NFJ Dividend, Interest & Premium Strategy Fund)
The Investment Company Act of 1940, as amended (the "1940 Act"), requires that both the full Board of Trustees (the "Board" or the "Trustees") and a majority of the Trustees who are not interested persons of AllianzGI Diversified Income & Convertible Fund ("ACV"), AllianzGI Equity & Convertible Income Fund ("NIE"), or AllianzGI Dividend, Interest & Premium Strategy Fund ("NFJ") (each a "Fund" and together, the "Funds") (the "Independent Trustees"), voting separately, annually approve the continuation of each Fund's Investment Management Agreement (the "Agreements" and, with respect to each Fund, the "Agreement") with Allianz Global Investors U.S. LLC (the "Investment Manager"). Throughout the process, the Independent Trustees received separate legal advice from independent legal counsel that is experienced in 1940 Act matters and that is independent of the Investment Manager ("Independent Counsel"), and with whom they met separately from the Investment Manager during the contract review meetings.
The contract review process consisted of multiple meetings that included the Independent Trustees and Independent Trustee Counsel leading up to the full Board's consideration of the Agreement (the "contract review meetings"). Representatives from fund management participated in portions of those meetings to, among other topics, review the comparative fee and expense information and comparative performance information prepared and provided by Broadridge Financial Solutions, Inc. ("Broadridge"), an independent third party, for each Fund using its respective Broadridge peer groups for performance and expense comparisons. The Board's review and approval process reflected developments through the first half of the calendar year 2020, but did not reflect subsequent events, including the strategic partnership announced on July 7, 2020, between the Investment Adviser and Virtus Investment Partners, Inc.
At their meeting held on June 25, 2020, the Board and the Independent Trustees unanimously approved the continuation of each Agreement through June 30, 2021 with respect to each Fund. The material factors and conclusions that formed the basis of this approval for each Fund are discussed below.(1)
(1) The Board, including a majority of the Independent Trustees, determined to rely on the relief granted by an exemptive order issued by the U.S. Securities and Exchange Commission (the "SEC") that permits investment company boards of directors to remotely approve advisory contracts rather than in-person in response to the impact of COVID-19 on investment advisers and funds. The Board determined that reliance on the exemptive order was necessary and appropriate due to circumstances related to current or potential effects of COVID-19. Prior to commencing the approval meeting, the Board confirmed that all Board members could hear each other simultaneously during the meeting. The Board noted that it would ratify any actions taken at this meeting pursuant to the SEC relief at its next in-person meeting.
82 Semi-Annual Report | July 31, 2020
Matters Relating to the Trustees' Consideration of the Investment Management Agreements (unaudited) (continued)
AllianzGI Diversified Income & Convertible Fund
AllianzGI Dividend, Interest & Premium Strategy Fund
AllianzGI Equity & Convertible Income Fund
In connection with their deliberations regarding the approval of each Agreement, the Board, including the Independent Trustees, considered such information and factors as they believed, in light of the legal advice furnished to them and their own business judgment, to be relevant. As described below, the Trustees considered the nature, quality and extent of the various investment management, administrative, and other services to be performed by the Investment Manager under the Agreements.
In evaluating the Agreement with respect to each Fund, the Trustees reviewed extensive materials provided by the Investment Manager in response to questions submitted by the Independent Trustees and Independent Counsel, and met with senior representatives of the Investment Manager regarding its personnel, operations, and financial condition as they relate to the Funds. The Board also considered the broad range of information relevant to the annual contract review that is provided to the Board (including its various standing committees) at meetings throughout the year, including reports on investment performance based on net asset value and common share market price and distribution yield, use of leverage, information regarding share price premiums and/or discounts, portfolio risk, and other portfolio information for each Fund, including the use of derivatives if used as part of the Fund's principal investment strategy, as well as periodic reports on, among other matters, pricing and valuation; quality and cost of portfolio trade execution; compliance; and shareholder and other services provided by
the Investment Manager and its affiliates. To assist with their review, the Board reviewed a summary for each Fund prepared by the Investment Manager that included, among other information, performance based on net asset value and market value (both absolute and comparisons between the Funds and their Broadridge Performance Universe (as defined below)), investment objective, total net assets, outstanding leverage, share price premium and/or discount information, annual fund operating expenses, portfolio managers, total expense ratio and management fee comparisons between each Fund and its Broadridge Expense Group (as defined below), and trends in the Investment Manager's profitability from its advisory relationship with each Fund. They also considered summaries assigning a quadrant placement to each Fund based on an average of certain measures of performance (including in relation to risk) and fees/expenses versus peer group medians. The Board also considered the risk profiles of the Funds.
The Trustees' conclusions as to the approval of each Agreement were based on a comprehensive consideration of all information provided to the Trustees and were not the result of any single factor. Individual Trustees may have evaluated the information presented differently from one another, attributing different weights to various factors. The Trustees recognized that the fee arrangements for the Funds are the result of review and discussion in the prior years between the Trustees and the Investment Manager, that certain aspects of
July 31, 2020 | Semi-Annual Report 83
Matters Relating to the Trustees' Consideration of the Investment Management Agreements (unaudited) (continued)
AllianzGI Diversified Income & Convertible Fund
AllianzGI Dividend, Interest & Premium Strategy Fund
AllianzGI Equity & Convertible Income Fund
such arrangements may receive greater scrutiny in some years than in others, and that the Trustees' conclusions may be based, in part, on their consideration of these same arrangements during the course of the year and in prior years. The Trustees evaluated information available to them on a Fund-by-Fund basis, and their determinations were made separately in respect of each Fund.
Performance Information
With respect to investment performance, the Trustees considered information regarding each Fund's short-, intermediate-, and long-term performance based on net asset value and market value, as applicable, net of the Fund's fees and expenses, both on an absolute basis and relative to an appropriate benchmark index that does not deduct the fees or expenses of investing. The Trustees also considered information provided by Broadridge for each Fund relative to the investment performance of a group of funds with investment classifications and/or objectives comparable to the Fund as identified by Broadridge (the "Broadridge Performance Universe"). The Independent Trustees recognized that the performance information, including the Broadridge performance information, was as of March 31, 2020, and, as such, included the period of extreme market volatility resulting from COVID-19. The Trustees also reviewed performance in relation to certain measures of the degree of investment risk undertaken by the portfolio managers, related share price premium and/or discount information, and each Fund's relative distribution yield as of March 31, 2020.
For Funds that underperformed, the Board considered the magnitude and duration of that underperformance relative to the Broadridge Performance Universe and/or the benchmark (e.g., the amount by which a Fund underperformed, including, for example, whether the Fund slightly underperformed or significantly underperformed). To the extent that the Trustees identified a Fund as having underperformed its benchmark indices and/or Broadridge Performance Universe to an extent, or over a period of time, that the Trustees felt warranted additional inquiry, the Trustees discussed with the Investment Manager the Fund's performance, potential reasons for the underperformance, and, if necessary, steps that the Investment Manager had taken, or intended to take, to improve performance. The Trustees also met with the portfolio managers of certain Funds during the 12 months prior to voting on the contract renewal and had the opportunity to discuss the Funds' performance, distribution levels, and use of leverage with the portfolio managers. The Trustees considered the Investment Manager's responsiveness with respect to the Funds that experienced lagging performance. The Trustees noted that performance, is only one of the factors that they deem relevant to their consideration of each Agreement and that, after considering all relevant factors, it may be appropriate to approve the continuation of the Agreement notwithstanding a Fund's relative performance.
Nature, Extent, and Quality of Services
As part of their review, the Trustees received and considered descriptions of various
84 Semi-Annual Report | July 31, 2020
Matters Relating to the Trustees' Consideration of the Investment Management Agreements (unaudited) (continued)
AllianzGI Diversified Income & Convertible Fund
AllianzGI Dividend, Interest & Premium Strategy Fund
AllianzGI Equity & Convertible Income Fund
functions performed by the Investment Manager for the Funds, such as portfolio management, compliance monitoring, portfolio trading practices and oversight of third party service providers. They also considered information regarding the overall organization and business functions of the Investment Manager, including, without limitation, information regarding senior management, portfolio managers and other personnel providing or proposed to provide investment management, administrative and other services, and corporate ownership and business operations unrelated to the Funds. They considered certain changes to the executive leadership and the organization of the governance structure, as well as the availability of research and other capabilities within the global organization. The Trustees examined the ability of the Investment Manager to provide high-quality investment management and other services to the Funds. Among other information, the Trustees considered the investment philosophy and research and decision-making processes of the Investment Manager, as well as the Investment Manager's broker selection process and trading operations; the experience of key advisory personnel of the Investment Manager and its affiliates, as applicable, responsible for portfolio management of the Funds; information regarding the Funds' use of leverage; the ability of the Investment Manager to attract and retain capable personnel; employee compensation philosophy; and the operational infrastructure, including technology and systems, of the Investment
Manager. The Independent Trustees also considered actions taken by the Investment Adviser to manage the impact on the Funds and their portfolio holdings of the market volatility resulting from COVID-19. In addition, the Board noted that the Investment Manager actively monitors any discount from net asset value per share at which each Fund's common stock trades and evaluates potential ways to reduce the discount and potential impacts on the discount, including the level of distributions that a Fund pays.
In addition, the Trustees noted the extensive range of services that the Investment Manager provides to the Funds beyond the investment management services. In this regard, the Trustees reviewed the extent and quality of the Investment Manager's services with respect to regulatory compliance and ability to comply with the investment policies of the Funds; the compliance programs and risk controls of the Investment Manager; the specific contractual obligations of the Investment Manager pursuant to the Agreements; the nature, extent and quality of certain administrative services the Investment Manager is responsible for providing to the Funds; the Investment Manager's risk management function; and conditions that might affect the ability of the Investment Manager to provide high quality services to the Funds in the future under the Agreements, including, but not limited to, the organization's financial condition and operational stability. The Trustees also considered that the Investment Manager assumes significant ongoing risks with respect to all Funds, including entrepreneurial and business risks the
July 31, 2020 | Semi-Annual Report 85
Matters Relating to the Trustees' Consideration of the Investment Management Agreements (unaudited) (continued)
AllianzGI Diversified Income & Convertible Fund
AllianzGI Dividend, Interest & Premium Strategy Fund
AllianzGI Equity & Convertible Income Fund
Investment Manager has undertaken in serving as Investment Manager and sponsor of the Funds, for which it is entitled to reasonable compensation. The Trustees also noted the Investment Manager's activities under its contractual obligation to oversee the Funds' various outside service providers, including its ongoing evaluation of the quality of the services provided, negotiation of certain service providers' fees and its evaluation of service providers' infrastructure, cybersecurity programs, compliance programs, and business continuity programs, among other matters. It also considered the Investment Manager's ongoing development of its own infrastructure and information technology to support the Funds through, among other things, cybersecurity, business continuity planning, and risk management. The Independent Trustees also noted the Investment Adviser's effective operation and implementation of its business continuity plan in response to COVID-19.
In addition, the Trustees considered that the Investment Manager has (i) developed a leverage structure for the Funds tailored to its investment strategy and needs, (ii) monitored the Fund's ongoing compliance with legal and other restrictions associated with leverage, (iii) monitored the Funds' leverage structure, as appropriate, in response to the recent market downturn in 2020 to meet asset coverage and other applicable restrictions and (iv) reviewed possible options for potential changes in the leverage arrangements for certain Funds in light of recent market developments and the cost of the Funds' current forms of leverage.
The Trustees considered that the Investment Manager provides the Funds with office space, administrative services and personnel to serve as Fund officers, and that the Investment Manager and its affiliates pay all of the compensation of the Funds' interested Trustees and officers (in their capacities as employees of the Investment Manager or such affiliates). Based on the foregoing, the Trustees concluded that the Investment Manager's investment processes, research capabilities and philosophy were well-suited to each Fund given its investment objective and policies, that the Investment Manager would be able to continue to meet any reasonably foreseeable obligations under the Agreement, and that the Investment Manager would otherwise be able to provide services to the Funds of sufficient extent and quality.
Fee and Expense Information and Comparisons
In assessing the reasonableness of the Funds' fees and expenses under the Agreement, the Trustees considered, among other information, each Fund's management fee and the Fund's total expense ratio as a percentage of average daily net assets attributable to common shares and as a percentage of average managed assets (including assets attributable to common shares and leverage outstanding combined) and information regarding the management fees and other expenses of comparable funds identified by Broadridge (the "Broadridge Expense Group"). Where a Fund's management fees or total expense ratios were higher than the Broadridge Expense
86 Semi-Annual Report | July 31, 2020
Matters Relating to the Trustees' Consideration of the Investment Management Agreements (unaudited) (continued)
AllianzGI Diversified Income & Convertible Fund
AllianzGI Dividend, Interest & Premium Strategy Fund
AllianzGI Equity & Convertible Income Fund
Group median, the Trustees considered whether specific factors, such as portfolio management, administration, or oversight needs contributed to the Fund's management fees or total expense ratios. The Trustees also considered, among other items, current Fund asset levels as compared to prior years.
The Trustees noted that while the Funds are not charged a separate administration fee (recognizing that their management fee includes a component for administrative services), it was not clear in all cases whether the peer funds in the Broadridge categories were separately charged such a fee by their investment managers, so that the total expense ratio (rather than any individual expense component) represented the most relevant comparison. For each Fund, the Board also considered that only leveraged closed-end funds were considered for inclusion in the Fund's peer group for comparison. The Board considered each Fund's contractual management fee on net assets attributable to common shares and on managed assets (generally consisting of net assets plus leverage proceeds), as well as the actual management fee on managed assets as a percentage of assets attributable to common shareholders as compared to each Fund's peer group. The Board was aware of the additional expenses borne by common shareholders as a result of each Fund's leveraged structure. The Trustees took into account that ACV has preferred shares and short-term loans outstanding to provide leverage, which increase the amount of management fees payable by the Fund under
the Agreements (because the Fund's fees are calculated based on average daily managed assets, including assets attributed to preferred shares or other forms of leverage outstanding). The Board took into account that the Investment Manager has a financial incentive for each Fund to continue to use leverage, which may create a conflict of interest. It also considered the Investment Manager's representation that the use of leverage continues to be appropriate and in the best interests of each Fund under current market conditions. The Trustees also considered the Investment Manager's representation that it will use leverage for each Fund solely as it determines to be in the best interests of each Fund from an investment perspective and without regard to the level of compensation the Investment Manager receives.
To the extent applicable, the Trustees considered information regarding the investment performance and fees for other funds and/or separately managed accounts, including institutional accounts, managed by the Investment Manager or its affiliates pursuing a similar investment strategy, if any ("similar accounts"). Specifically, the Trustees reviewed information showing the contractual management fees charged by the Investment Manager to the similar accounts. In comparing these fees, the Trustees considered information provided by the Investment Manager as to the generally broader and more extensive services provided to the Funds in comparison to institutional or separate accounts; the greater entrepreneurial, enterprise, and reputational
July 31, 2020 | Semi-Annual Report 87
Matters Relating to the Trustees' Consideration of the Investment Management Agreements (unaudited) (continued)
AllianzGI Diversified Income & Convertible Fund
AllianzGI Dividend, Interest & Premium Strategy Fund
AllianzGI Equity & Convertible Income Fund
risk in managing closed-end funds; and the impact on the Investment Manager and expenses associated with the more extensive regulatory regime to which the Funds are subject in comparison to institutional or separate accounts. The Board considered that, in comparison to certain other products managed by the Investment Manager, including open-end funds, there are additional portfolio management challenges in managing closed-end funds such as the Funds, including those associated with less liquid holdings and/or the use of leverage.
Economies of Scale and "Fall-Out" Benefits
The Trustees considered the extent to which the Investment Manager may realize economies of scale or other efficiencies in managing and supporting the Funds and noted that there is little expectation that closed-end funds will show significant economies of scale. The Trustees considered that, as closed-end investment companies, the Funds do not continually offer new shares to raise additional assets (as does a typical open-end investment company), but may experience asset growth through investment performance and/or the increased use of leverage. Accordingly, the Trustees did not consider potential economies of scale as a principal factor in assessing the fee rates payable under the Agreements. The Independent Trustees also considered that the Investment Manager shares the benefits of economies of scale with the Funds and their shareholders by adding and enhancing services to the Funds over time, including
expenditures in staff, technology, and infrastructure. Additionally, the Trustees considered so-called "fall-out benefits" to the Investment Manager and its affiliates, such as reputational value derived from serving as Investment Manager to the Funds and research.
Profitability
The Trustees considered the overall estimated profitability to the Investment Manager on a Fund-by-Fund basis for the twelve months ended December 31, 2019. They also reviewed the Investment Manager's aggregate profitability with respect to the Fund complex and the Investment Manager's overall profitability with respect to all products globally. As part of its considerations, the Board considered the cost allocation methodology that the Investment Manager used in developing its estimated profitability figures. In this connection, the Trustees considered that for certain Funds, profitability had increased as a result of expense reduction efforts or higher revenues from increased assets, although certain Funds' assets had declined over the last year. The Trustees recognized that it is difficult to make comparisons of profitability from mutual fund advisory and administration contracts because comparative information is not generally available and is affected by numerous factors, including the structure of the particular adviser, the types of funds it manages, its business mix, numerous assumptions about allocations and the adviser's capital structure and cost of capital. The Trustees recognized that the Investment
88 Semi-Annual Report | July 31, 2020
Matters Relating to the Trustees' Consideration of the Investment Management Agreements (unaudited) (continued)
AllianzGI Diversified Income & Convertible Fund
AllianzGI Dividend, Interest & Premium Strategy Fund
AllianzGI Equity & Convertible Income Fund
Manager and its affiliates should be entitled to earn a reasonable level of profits for services they provide to each Fund and, based on their review, concluded that pre-tax profitability for advisory services was not unreasonable, nor did it appear to be excessive.
Fund-by-Fund Analysis
With regard to the investment performance of each Fund and the fees charged to each Fund, the Trustees considered the following information. The comparative performance, fee, and expense information was prepared and provided by Broadridge and was not independently verified by the Trustees.
With respect to all Funds, the Trustees reviewed, among other information, comparative information showing the Funds' performance against their respective Broadridge Performance Universes for the one-year, three-year, five-year and ten-year periods (to the extent each such Fund had been in existence), each ended March 31, 2020. Fund performance relative to the median for each Fund's Broadridge Performance Universe is described below, and for those Funds with performance that ranked below the median for their respective Broadridge Performance Universes, the specific quintile rankings are also noted below with respect to the relevant periods of underperformance. With respect to performance quintile rankings for a Fund compared to its Broadridge Performance Universe, the first quintile represents the highest (best) performance and the fifth quintile represents the lowest performance.
The Trustees reviewed, among other information, information provided by Broadridge comparing each Fund's management fee and ratios of total expenses to net assets to the Funds' respective Broadridge Expense Groups for the most recently reported fiscal year. The Trustees noted that the Broadridge data takes into account any fee reductions or expense limitations that were in effect during a Fund's last fiscal year. The information provided to the Trustees by Broadridge compared each Fund's fees and expenses to the Fund's respective Broadridge Expense Group median; such comparison is noted below. For the purposes of Broadridge Expense Group quintile rankings, higher fees and expenses result in a lower quintile ranking, with the first quintile corresponding to low fees and expenses the fifth quintile corresponding to high fees and expenses.
• AllianzGI Diversified Income & Convertible Fund (ACV): As compared to its Broadridge Performance Universe (based on net asset value), the Fund's performance was above the median for the one- and three-year periods (in the second quintile for each period). The Fund's inception date was May 27, 2015, and accordingly does not have five- and ten-year performance periods reflected. As compared to its Broadridge Expense Group, the Fund's management fees and total expense ratios based on common share and leveraged assets combined as well as based on common share assets were each above the median (on a net basis).
July 31, 2020 | Semi-Annual Report 89
Matters Relating to the Trustees' Consideration of the Investment Management Agreements (unaudited) (continued)
AllianzGI Diversified Income & Convertible Fund
AllianzGI Dividend, Interest & Premium Strategy Fund
AllianzGI Equity & Convertible Income Fund
• AllianzGI Equity & Convertible Income Fund (NIE): As compared to its Broadridge Performance Universe (based on net asset value), the Fund's performance was above the median for the one-, three-, five- and ten-year periods (in the first quintile for each period). As compared to its Broadridge Expense Group, the Fund's management fees based on common share assets were at the median, and the Fund's total expense ratios based on common share assets were below the median (on a net basis). The Fund did not have leveraged assets for the period reviewed.
• AllianzGI Dividend, Interest & Premium Strategy Fund (NFJ): As compared to its Broadridge Performance Universe (based on net asset value), the Fund's performance was below the median for the one-, three-, five- and ten-year periods (in the fourth quintile for the one-, three- and ten-year periods and in the fifth quintile for the five-year period). As compared to its Broadridge Expense Group, the Fund's management fees and total expense ratios based on common share assets were both below the median (on a net basis). The Fund did not have leveraged assets for the period reviewed.
Conclusions
After reviewing these and other factors described herein, the Trustees concluded, with respect to each Fund, within the context of their overall conclusions regarding the Agreement and in their business judgment, that they were satisfied with the Investment Manager's responses and on-going efforts relating to the investment performance of the Funds, including efforts to improve performance for underperforming Funds. The Trustees also concluded that the fees payable under the Agreement represent reasonable compensation in light of the nature, extent and quality of services provided by the Investment Manager and should be continued. Based on their evaluation of factors that they deemed to be material, including, but not limited to, those factors described above, the Trustees unanimously concluded that the continuation of the Agreement with respect to the Funds was in the interests of the applicable Funds and their shareholders, and determined to approve the continuance of the Agreement.
90 Semi-Annual Report | July 31, 2020
Privacy Policy (unaudited)
AllianzGI Diversified Income & Convertible Fund
AllianzGI Dividend, Interest & Premium Strategy Fund
AllianzGI Equity & Convertible Income Fund
Privacy Policy
Please read this Policy carefully. It gives you important information about how Allianz Global Investors U.S. and its U.S. affiliates ("AllianzGI US," "we" or "us") handle non-public personal information ("Personal Information") that we may receive about you. It applies to all of the past, present and future clients and shareholders of AllianzGI US and the funds and accounts it manages, advises, administers or distributes, and will continue to apply when you are no longer a client or shareholder. As used throughout this Policy, "AllianzGI US" means Allianz Global Investors U.S. LLC, Allianz Global Investors Distributors LLC, and the family of registered and unregistered funds managed by one or more of these firms. AllianzGI US is part of a global investment management group, and the privacy policies of other Allianz Global Investors entities outside of the United States may have provisions in their policies that differ from this Privacy Policy. Please refer to the website of the specific non-US Allianz Global Investors entity for its policy on privacy.
We Care about Your Privacy
We consider your privacy to be a fundamental aspect of our relationship with you, and we strive to maintain the confidentiality, integrity and security of your Personal Information. To ensure your privacy, we have developed policies that are designed to protect your Personal Information while allowing your needs to be served.
Information We May Collect
In the course of providing you with products and services, we may obtain Personal Information about you, which may come
from sources such as account application and other forms, from other written, electronic, or verbal communications, from account transactions, from a brokerage or financial advisory firm, financial advisor or consultant, and/or from information you provide on our website.
You are not required to supply any of the Personal Information that we may request. However, failure to do so may result in us being unable to open and maintain your account, or to provide services to you.
How Your Information Is Shared
We do not disclose your Personal Information to anyone for marketing purposes. We disclose your Personal Information only to those service providers, affiliated and non-affiliated, who need the information for everyday business purposes, such as to respond to your inquiries, to perform services, and/or to service and maintain your account. This applies to all of the categories of Personal Information we collect about you. The affiliated and non-affiliated service providers who receive your Personal Information also may use it to process your transactions, provide you with materials (including preparing and mailing prospectuses and shareholder reports and gathering shareholder proxies), and provide you with account statements and other materials relating to your account. These service providers provide services at our direction, and under their agreements with us, are required to keep your Personal Information confidential and to use it only for providing the contractually required services. Our service providers may not use your Personal
July 31, 2020 | Semi-Annual Report 91
Privacy Policy (unaudited) (continued)
AllianzGI Diversified Income & Convertible Fund
AllianzGI Dividend, Interest & Premium Strategy Fund
AllianzGI Equity & Convertible Income Fund
Information to market products and services to you except in conformance with applicable laws and regulations. We also may provide your Personal Information to your respective brokerage or financial advisory firm, custodian, and/or to your financial advisor or consultant.
In addition, we reserve the right to disclose or report Personal Information to non-affiliated third parties, in limited circumstances, where we believe in good faith that disclosure is required under law, to cooperate with regulators or law enforcement authorities or pursuant to other legal process, or to protect our rights or property, including to enforce our Privacy Policy or other agreements with you. Personal Information collected by us may also be transferred as part of a corporate sale, restructuring, bankruptcy, or other transfer of assets.
Security of Your Information
We maintain your Personal Information for as long as necessary for legitimate business purposes or otherwise as required by law. In maintaining this information, we have implemented appropriate procedures that are designed to restrict access to your Personal Information only to those who need to know that information in order to provide products and/or services to you. In addition, we have implemented physical, electronic and procedural safeguards to help protect your Personal Information.
Privacy and the Internet
The Personal Information that you provide through our website, as applicable, is handled in the same way as the Personal Information that you provide by any other means, as
described above. This section of the Policy gives you additional information about the way in which Personal Information that is obtained online is handled.
• Online Enrollment, Account Access and Transactions: When you visit our website, you can visit pages that are open to the general public, or, where available, log into protected pages to enroll online, access information about your account, or conduct certain transactions. Access to these secure pages is permitted only after you have created a User ID and Password. The User ID and Password must be supplied each time you want to access your account information online. This information serves to verify your identity. When you enter Personal Information into our website to enroll or access your account online, you will log into secure pages. By using our website, you consent to this Privacy Policy and to the use of your Personal Information in accordance with the practices described in this Policy. If you provide Personal Information to effect transactions, a record of the transactions you have performed while on the site is retained by us. For additional terms and conditions governing your use of our website, please refer to the Investor Mutual Fund Access – Disclaimer which is incorporated herein by reference and is available on our website.
• Cookies and Similar Technologies: Cookies are small text files stored in your computer's hard drive when you visit certain web pages. Clear GIFs (also known as Web Beacons) are typically transparent very small graphic images (usually 1 pixel x 1 pixel) that are placed on a website that may be included
92 Semi-Annual Report | July 31, 2020
Privacy Policy (unaudited) (continued)
AllianzGI Diversified Income & Convertible Fund
AllianzGI Dividend, Interest & Premium Strategy Fund
AllianzGI Equity & Convertible Income Fund
on our services provided via our website and typically work in conjunction with cookies to identify our users and user behavior. We may use cookies and automatically collected information to: (i) personalize our website and the services provided via our website, such as remembering your information so that you will not have to re-enter it during your use of, or the next time you use, our website and the services provided via our website; (ii) provide customized advertisements, content, and information; (iii) monitor and analyze the effectiveness of our website and the services provided via our website and third-party marketing activities; (iv) monitor aggregate site usage metrics such as total number of visitors and pages viewed; and (v) track your entries, submissions, and status in any promotions or other activities offered through our website and the services provided via our website. Tracking technology also helps us manage and improve the usability of our website, (i) detecting whether there has been any contact between your computer and us in the past and (ii) to identify the most popular sections of our website. Because an industry-standard Do-Not-Track protocol is not yet established, our website will continue to operate as described in this Privacy Policy and will not be affected by any Do-Not-Track signals from any browser.
• Use of Social Media Plugins Our website uses the following Social Media Plugins ("Plugins"):
• Facebook Share Button operated by Facebook Inc., 1601 S. California Ave, Palo Alto, CA 94304, USA
• Tweet Button operated by Twitter Inc., 795 Folsom St., Suite 600, San Francisco, CA 94107, USA
• LinkedIn Share Button operated by LinkedIn Corporation, 2029 Stierlin Court, Mountain View, CA 94043, USA
All Plugins are marked with the brand of the respective operators Facebook, Twitter and LinkedIn ("Operators"). When you visit our website that contains a social plugin, your browser establishes a direct connection to the servers of the Operator. The Operator directly transfers the plugin content to your browser which embeds the latter into our website, enabling the Operator to receive information about you having accessed the respective page of our website. Thus, AllianzGI US has no influence on the data gathered by the plugin and we inform you according to our state of knowledge: The embedded plugins provide the Operator with the information that you have accessed the corresponding page of our website. If you do not wish to have such data transferred to the Operators, you need to log out of your respective account before visiting our website. Please see the Operators' data privacy statements in order to get further information about purpose and scope of the data collection and the processing and use:
• Facebook: https://de-de.facebook.com/about/privacy
• Twitter: https://twitter.com/privacy
• Linked In: https://www.linkedin.com/legal/privacy-policy
July 31, 2020 | Semi-Annual Report 93
Privacy Policy (unaudited) (continued)
AllianzGI Diversified Income & Convertible Fund
AllianzGI Dividend, Interest & Premium Strategy Fund
AllianzGI Equity & Convertible Income Fund
Changes to Our Privacy Policy
We may modify this Privacy Policy from time-to-time to reflect changes in related practices and procedures, or applicable laws and regulations. If we make changes, we will notify you on our website and the revised Policy will become effective immediately upon posting to our website. We also will provide account owners with a copy of our Privacy Policy, annually if required. We encourage you to visit our website
periodically to remain up to date on our Privacy Policy. You acknowledge that by using our website after we have posted changes to this Privacy Policy, you are agreeing to the terms of the Privacy Policy as modified.
Obtaining Additional Information
If you have any questions about this Privacy Policy or our privacy related practices in the United States, you may contact us via our dedicated email at PrivacyUS@allianzgi.com.
94 Semi-Annual Report | July 31, 2020
(This page intentionally left blank)
July 31, 2020 | Semi-Annual Report 95
(This page intentionally left blank)
96 Semi-Annual Report | July 31, 2020
(This page intentionally left blank)
July 31, 2020 | Semi-Annual Report 97
(This page intentionally left blank)
98 Semi-Annual Report | July 31, 2020
(This page intentionally left blank)
July 31, 2020 | Semi-Annual Report 99
(This page intentionally left blank)
100 Semi-Annual Report | July 31, 2020
Trustees
Alan Rappaport
Chairman of the Board of Trustees
Sarah E. Cogan
Deborah A. DeCotis
F. Ford Drummond
Thomas J. Fuccillo
Erick R. Holt
James A. Jacobson
Hans W. Kertess
James S. MacLeod
William B. Ogden, IV
Davey S. Scoon
Fund Officers
Thomas J. Fuccillo
President and Chief Executive Officer
Scott Whisten
Treasurer, Principal Financial & Accounting Officer
Angela Borreggine
Chief Legal Officer & Secretary
Thomas L. Harter
Chief Compliance Officer
Richard J. Cochran
Assistant Treasurer
Orhan Dzemaili
Assistant Treasurer
Debra Rubano
Assistant Secretary
Craig A. Ruckman
Assistant Secretary
Investment Manager
Allianz Global Investors U.S. LLC
1633 Broadway
New York, NY 10019
Custodian & Accounting Agent
State Street Bank and Trust Co.
801 Pennsylvania Avenue
Kansas City, MO 64105
Transfer Agent, Dividend Paying Agent
and Registrar
American Stock Transfer & Trust Company, LLC
6201 15th Avenue
Brooklyn, NY 11219
Independent Registered Public Accounting Firm
PricewaterhouseCoopers LLP
1100 Walnut Street, Suite 1300
Kansas City, MO 64105
Legal Counsel
Ropes & Gray LLP
Prudential Tower
800 Boylston Street
Boston, MA 02199
This report, including the financial information herein, is transmitted to the shareholders of AllianzGI Diversified Income & Convertible Fund, AllianzGI Dividend, Interest & Premium Strategy Fund and AllianzGI Equity & Convertible Income Fund, for their information. It is not a prospectus, circular or representation intended for use in the purchase of shares of the Funds or any securities mentioned in this report.
The financial information included herein is taken from the records of the Funds without examination by an independent registered public accounting firm, who did not express an opinion herein.
Notice is hereby given in accordance with Section 23(c) of the investment Company Act of 1940, as amended, that from time to time the Funds may purchase shares of their stock in the open market.
The Funds file their complete schedule of portfolio holdings with the SEC for the first and third quarters of their fiscal year on Form N-PORT. Each Fund's Form N-PORT is available on the SEC's website at www.sec.gov. The information on Form N-PORT is also available on the Funds' website at us.allianzgi.com/closedendfunds.
Information on the Funds is available at us.allianzgi.com/closedendfunds or by calling the Funds' shareholder servicing agent at (800) 254-5197.

Receive this report electronically and eliminate paper mailings.
To enroll, go to us.allianzgi.com/edelivery.
1291941
Allianz Global Investors Distributors LLC AZ601SA_073120
ITEM 2. CODE OF ETHICS
Not required in this filing.
ITEM 3. AUDIT COMMITTEE FINANCIAL EXPERT
Not required in this filing.
ITEM 4. PRINCIPAL ACCOUNTANT FEES AND SERVICES
Not required in this filing
ITEM 5. AUDIT COMMITTEE OF LISTED REGISTRANTS
Not required in this filing
ITEM 6. INVESTMENTS
(a) The registrant’s Schedule of Investments is included as part of the report to shareholders filed under Item 1 of this form.
(b) Not applicable.
ITEM 7. DISCLOSURE OF PROXY VOTING POLICIES AND PROCEDURES FOR CLOSED-END MANAGEMENT INVESTMENT COMPANIES
Not required in this filing
ITEM 8. PORTFOLIO MANAGERS OF CLOSED-END MANAGEMENT INVESTMENT COMPANIES
Not required in this filing
ITEM 9. PURCHASES OF EQUITY SECURITIES BY CLOSED-END MANAGEMENT INVESTMENT COMPANY AND AFFILIATED PURCHASERS
None
ITEM 10. SUBMISSION OF MATTERS TO A VOTE OF SECURITY HOLDERS
There have been no material changes to the procedures by which shareholders may recommend nominees to the Fund’s Board of Trustees since the Fund last provided disclosure in response to this item.
ITEM 11. CONTROLS AND PROCEDURES
(a) The registrant’s President and Chief Executive Officer and Treasurer, Principal Financial & Accounting Officer have concluded that the registrant’s disclosure controls and procedures (as defined in Rule 30a-3(c) under the Act (17 CFR 270.30a-3(c))), are effective based on their evaluation of these controls and procedures as of a date within 90 days of the filing date of this document.
(b) There were no significant changes in internal control over financial reporting (as defined in Rule 30a-3(d) under the Act (17 CFR 270.30a-3(d))) that occurred during the most recent semi-annual period covered by this report that has materially affected, or is reasonably likely to materially affect, the registrant’s internal control over financial reporting.
ITEM 12. DISCLOSURE OF SECURITIES LENDING ACTIVITIES FOR CLOSED-END MANAGEMENT INVESTMENT COMPANIES
(a) The Fund did not engage in any securities lending activity during the fiscal period ended July 31, 2020.
(b) The Fund did not engage in any securities lending activity and did not engage a securities lending agent during the fiscal period ended July 31, 2020.
ITEM 13. EXHIBITS
(a) (1) Not required in this filing.
(a) (3) Not Applicable
(a) (4) Not Applicable
(b) Exhibit 99.906 Cert. — Certification pursuant to Section 906 of the Sarbanes-Oxley Act of 2002
Signatures
Pursuant to the requirements of the Securities Exchange Act of 1934 and the Investment Company Act of 1940, the registrant has duly caused this report to be signed on its behalf by the undersigned, thereunto duly authorized.
AllianzGI Dividend, Interest & Premium Strategy Fund
| By: | /s/ Thomas J. Fuccillo | |
| Thomas J. Fuccillo | ||
| President & Chief Executive Officer | ||
| Date: October 5, 2020 | ||
| By: | /s/ Scott Whisten | |
| Scott Whisten | ||
| Treasurer, Principal Financial & Accounting Officer | ||
Date: October 5, 2020
Pursuant to the requirements of the Securities Exchange Act of 1934 and the Investment Company Act of 1940, this report has been signed below by the following persons on behalf of the registrant and in the capacities and on the dates indicated.
| By: | /s/ Thomas J. Fuccillo | |
| Thomas J. Fuccillo | ||
| President & Chief Executive Officer | ||
| Date: October 5, 2020 | ||
| By: | /s/ Scott Whisten | |
| Scott Whisten | ||
| Treasurer, Principal Financial & Accounting Officer | ||
Date: October 5, 2020