CNL Lifestyle Properties, Inc. Owning America’s Lifestyle ® Fourth Quarter 2013 Update March 31, 2014 Exhibit 99.2 |
2 Certain statements in this document may constitute forward-looking statements within the meaning of Section 27A of the Securities Act of 1933, as amended (the “Securities Act”) and of Section 21E of the Securities Exchange Act of 1934, as amended (the “Exchange Act”). CNL Lifestyle Properties, Inc. (herein also referred to as the “Company”) intends that all such forward-looking statements be covered by the safe-harbor provisions for forward-looking statements of Section 27A of the Securities Act and Section 21E of the Exchange Act, as applicable. All statements, other than statements that relate solely to historical facts, including, among others, statements regarding the Company’s future financial position, business strategy, projected levels of growth, projected costs and projected financing needs, are forward-looking statements. Those statements include statements regarding the intent, belief or current expectations of the management team, as well as the assumptions on which such statements are based, and generally are identified by the use of words such as “may,” “will,” “seeks,” “anticipates,” “believes,” “estimates,” “expects,” “plans,” “intends,” “should,” “continues,” “pro forma” or similar expressions. Forward-looking statements are not guarantees of future performance and actual results may differ materially from those contemplated by such forward-looking statements due to a variety of risks, uncertainties and other factors, including but not limited to, the factors detailed in our Annual Report on Form 10-K for the year ended December 31, 2013, and other documents filed from time to time with the Securities and Exchange Commission. Many of these factors are beyond the Company’s ability to control or predict. Such factors include, but are not limited to: changes in general economic conditions in the U.S. or globally (including financial market fluctuations); risks associated with our investment strategy; risks associated with the real estate markets in which the Company invests; risks of doing business internationally and global expansion, including unfamiliarity with new markets and currency risks; risks associated with the use of debt to finance the Company’s business activities, including refinancing and interest rate risk and the Company’s failure to comply with its debt covenants; the Company’s failure to obtain, renew or extend necessary financing or to access the debt or equity markets; competition for properties and/or tenants in the markets in which the Company engages in business; the impact of current and future environmental, zoning and other governmental regulations affecting the Company’s properties; the Company’s ability to make necessary improvements to properties on a timely or cost-efficient basis; risks related to development projects or acquired property value-add conversions, if applicable (including construction delays, cost overruns, the Company’s inability to obtain necessary permits and/or public opposition to these activities); defaults on or non-renewal of leases by tenants; failure to lease properties at all or on favorable terms; unknown liabilities in connection with acquired properties or liabilities caused by property managers or operators; the Company’s failure to successfully manage growth or integrate acquired properties and operations; material adverse actions or omissions by any joint venture partners; increases in operating costs and other expense items and costs, uninsured losses or losses in excess of the Company’s insurance coverage; the impact of outstanding or potential litigation; risks associated with the Company’s tax structuring; the Company’s failure to qualify and maintain its status as a real estate investment trust and the Company’s ability to protect its intellectual property and the value of its brand. Management believes these forward-looking statements are reasonable; however, such statements are necessarily dependent on assumptions, data or methods that may be incorrect or imprecise and the Company may not be able to realize them. Investors are cautioned not to place undue reliance on any forward-looking statements which are based on current expectations. All written and oral forward-looking statements attributable to the Company or persons acting on its behalf are qualified in their entirety by these cautionary statements. Further, forward-looking statements speak only as of the date they are made and the Company undertakes no obligation to update or revise forward-looking statements to reflect changed assumptions, the occurrence of unanticipated events or changes to future operating results over time unless otherwise required by law. Forward Looking Statements |
CNL Lifestyle Properties, Inc. Portfolio of 145 lifestyle-oriented properties and 7 loans as of 3/14/14 Diversified by asset type, geography and operator Iconic assets and industry- leading operators Ski & Mountain Golf Attractions Senior Housing Marinas Additional • 24 properties • 48 properties • 23 properties • 30 properties • 17 properties • 3 properties Summary REIT Information $2.7 billion Demographically Driven / Lifestyle-Oriented 37 states and 2 Canadian provinces Conservative Capital Structure Leasing and Preferred Return Structures Diversified Portfolio The Board will consider a listing, merger, sale or other liquidity opportunities on or before December 31, 2015 GAAP Total Assets Property Focus Geographic Diversification Established Assets Exit Strategy 3 |
Recent Highlights Completed valuation as of 12/31/2013 resulting in a NAV of $6.85 per share Distribution unchanged with yield of 6.20% (based on NAV of $6.85 per share) DRP shares will equal current NAV at the time of reinvestment rather than at a discount to NAV Engaged Jefferies LLC, a leading global investment banking and advisory firm, to assist in the evaluation of various strategic alternatives to provide liquidity to shareholders During Q4 2013, acquired 6 senior housing properties and 1 water park for a total of $161 million; Disposed of FEC in North Houston for a small gain Actively working to close remaining Pacifica senior housing portfolio properties and other potential senior housing assets for approximately $106 million Over $41 million of owner capital invested into various portfolio assets in 2013 Transitioned 11 marina properties to new operators in Q4 2013 and in process of transitioning 4 other marinas to new operator - expected to be completed in the first half of 2014 An impairment provision was recorded in Q4 2013 on the golf properties due to a decision to market and sell the golf portfolio Completed line of credit expansion to $160M in Q4 2013 4 |
Geographic Diversification 5 |
The portfolio is broadly diversified across asset classes to mitigate against seasonality and volatility Sector Diversification As of March 14, 2014 By Initial Purchase Price 6 |
Sector Performance 7 Ski & Mountain 24 properties Golf 48 properties Attractions 23 properties Additional Lifestyle 3 properties Senior Housing 30 properties Marinas 17 properties 145 properties as of March 14, 2014 Source: CNL Lifestyle Properties, Inc. 2013 Form 10-K Past performance is not indicative of future returns. - Higher ski visits and an increase in summer-based activities due to favorable weather and revenue- enhancing capital improvements. Poor snow conditions in the west for 2013/2014 ski season. - Golf rounds are down - consistent with the 4.9% industry decrease in overall rounds played as reported by Golf Datatech. EBITDA was up slightly due to continued operator focus. - The attractions portfolio outperformed the prior year despite our largest park experiencing significant weather challenges and falling short of expectations. - Occupancy and Revenue per Occupied Unit both up over the last year. Average occupancy for the entire portfolio was 91.3% as of 12/31/13 exceeding the industry average of 89.7%. - Revenue and EBITDA were down slightly compared to 2012 due to competition in the west and near term impact of operator transitions. Management has transitioned 11 leased marinas to new operators; 4 remaining marinas expected to transition in Q2 2014. - Steady performance at Dallas Market Center. Multi-family property under renovation during 2013. |
8 Same-Store Property Performance Twelve Months Ended December 31, 2013 Compared to Same Period 2012 Note: Includes results for comparable leased and managed properties owned for the entirety of 2013 and 2012. Source: CNL Lifestyle Properties, Inc. 2013 Form 10-K Past performance is not indicative of future returns. The increases in both revenue and EBITDA are primarily due to the performance of the ski and mountain lifestyle sector In the 2013/2014 season, our western ski resorts have struggled with unusually warm temperatures and severe drought conditions Senior housing Q4 2013 occupancy was 89.7% compared to 89.0% from a year ago Multi-family asset experienced decreases due to ongoing unit renovations 2013 lease coverage of 1.48x vs. 1.40x for 2012 - primarily due to improvements at our ski and marina assets # of Properties Revenue EBITDA Ski and Mountain Lifestyle 17 8.4% 21.5% Golf 48 -1.5% 4.8% Attractions 21 1.7% 6.0% Senior Housing 10 5.5% 4.7% Marinas 17 -1.5% -6.3% Additional Lifestyle 1 -9.3% -24.4% 114 4.3% 11.6% |
Full Year Financial Summary (in Millions) FFO Adjusted EBITDA 9 MFFO Source: CNL Lifestyle Properties 2012 & 2013 Form 10-K The Company believes that its presentation of historical non-GAAP financial measures provides useful supplementary information to and facilitates additional analysis by investors. These historical non-GAAP financial measures are in addition to, not a substitute for, or superior to, measures of financial performance prepared in accordance with U.S. Generally Accepted Accounting Principles. See reconciliation to GAAP net income (loss) contained in the Appendix. Past performance is not indicative of future returns. Continued growth due primarily to: Properties acquired in 2012 and 2013 offset by the impact of selling interests in 3 joint ventures that owned 42 senior housing communities Same-store rent growth in ski and growth of NOI in senior housing 2013 FFO impacted by non-cash, non-recurring impairment provision, $58.1 million of which has not been added back in deriving FFO |
Credit Metrics Interest Coverage (1) (1) Calculated as adjusted EBITDA divided by interest expense (2) Net debt is total debt less cash (3) Debt includes line of credit Net Debt / Adjusted EBITDA (2) 10 Debt / GAAP Total Assets (3) Source: CNL Lifestyle Properties, Inc. 2012 & 2013 Form 10-K The Company believes that its presentation of historical non-GAAP financial measures provides useful supplementary information to and facilitates additional analysis by investors. These historical non-GAAP financial measures are in addition to, not a substitute for, or superior to, measures of financial performance prepared in accordance with U.S. Generally Accepted Accounting Principles. See reconciliation to GAAP net income (loss) contained in the Appendix. Past performance is not indicative of future returns. Year Coverage 2011 2.4x 2012 2.5x 2013 2.6x Year Coverage 2011 5.5x 2012 6.3x 2013 6.1x Consolidated Leverage Including Share Year Coverage of Unconsolidated Entities 2011 32.0% 43.3% 2012 38.7% 45.3% 2013 44.6% 48.1% |
Key Credit Information 11 Weighted average interest rate is 5.73% (5.84% without JV debt) 75% fixed rate debt, 9% hedged and 16% variable rate debt No significant near-term maturities Note: Chart as of December 31, 2013. 2014 maturities are expected to be refinanced or retired with proceeds from asset sales. |
Management Initiatives Capital Deployment / Redeployment Retain “full investment” status – now focused on recycled capital Invest in improvements and enhancements to existing assets to further drive revenue and expense reduction Proactive Portfolio Management and Optimization Focused asset management to continue to drive performance and value Continue to dispose of non-core assets Streamline and rebalance portfolio Liquidity Options Study Work with Jefferies LLC to evaluate strategic alternatives to maximize value and provide liquidity to shareholders 12 |
Conclusion & Summary 13 Continued the positive momentum building upon successes in 2013, despite significant weather challenges at our largest attractions and western ski assets in late 2013 Began the process of selling certain non-core assets and recycling capital, which we expect will accelerate in 2014 Largely completed the restructuring activities within our key asset classes, with the transition of properties from our largest marina tenant to four new operators Strategically deploying excess cash into new acquisitions and/or debt repayment Continued to improve property performance in an effort to maximize income and value Now focused on the evaluation of strategic alternatives and pending liquidity to shareholders |
Contact Information For more information about CNL Lifestyle Properties, please contact CNL Client Services at 866-650-0650. 14 |
Appendix 15 Appendix |
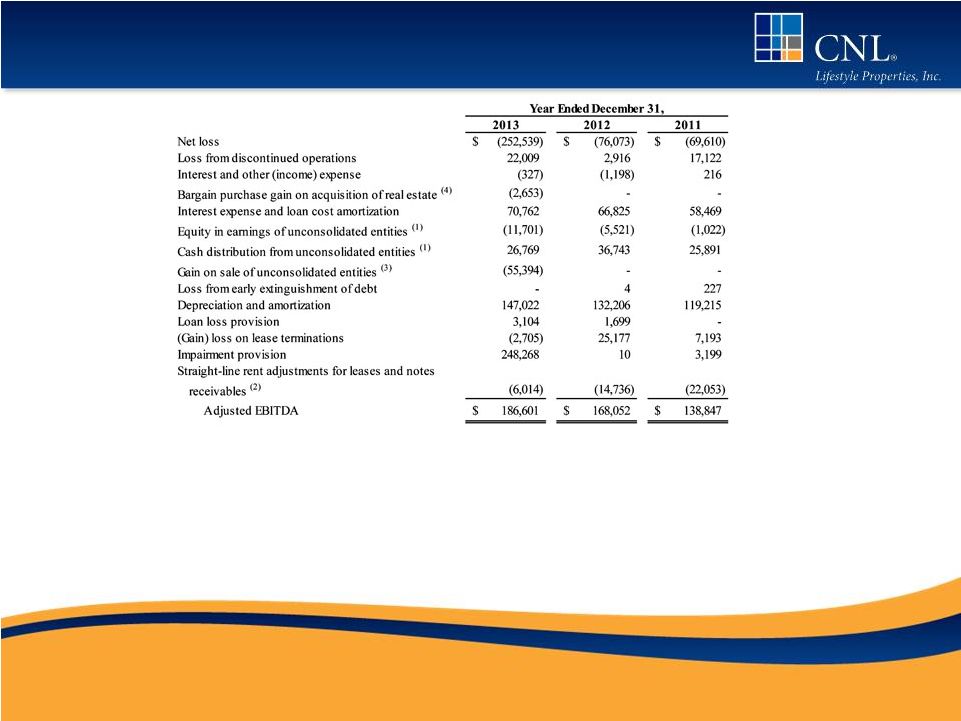
Reconciliation of FFO and MFFO to Net Loss 16 Source: CNL Lifestyle Properties 2013 Form 10-K The Company believes that its presentation of historical non-GAAP financial measures provides useful supplementary information to and facilitates additional analysis by investors. These historical non-GAAP financial measures are in addition to, not a substitute for, or superior to, measures of financial performance prepared in accordance with U.S. Generally Accepted Accounting Principles. Past performance is not indicative of future returns. (1) Includes amounts related to the properties that are classified as assets held for sale and for which the related results are classified as income (loss) from discontinued operations in the accompanying consolidated statements of operations. (2) This amount represents our share of the FFO or MFFO adjustments allowable under the NAREIT or IPA definitions, respectively, multiplied by the percentage of income or loss recognized under the HLBV method. (3) In evaluating investments in real estate, management differentiates the costs to acquire the investment from the operations derived from the investment. By adding back acquisition fees and expense relating to business combinations, management believes MFFO provides useful supplemental information of its operat ing performance and will also allow comparability between real estate entities regardless of their level of acquisition activities. Acquisition fees and expenses include payments to our advisor or third parties. Acquisition fees and expenses relating to business combinations under GAAP are considered operating expenses and as expenses included in the determination of net income (loss) and income (loss) from continuing operations, both of which are performance measures under GAAP. All paid and accrued acquisition fees and expenses will have negative effects on returns to investors, the potential for future distributions, and cash flows generated by us, unless earnings from operations or net sales proceeds from the disposition of properties are generated to cover the purchase price of the property. (4) Under GAAP, rental receipts are allocated to periods using various methodologies. This may result in income recognition that is significantly different than underlying contract terms. By adjusting for these items (to reflect such payments from a GAAP accrual basis to a cash basis of disclosing the rent and lease payments), MFFO provides useful supplemental information on the realized economic impact of lease terms and debt investments, providing insight on the contractual cash flows of such lease terms and debt investments, and aligns results with management’s analysis of operating performance. (5) (Gain) loss of extinguishment of debt includes legal fees incurred with the transaction, prepayment penalty fees and write-off of unamortized loan costs, as applicable. (6) Management believes that adjusting for gains or write-offs of, lease related assets is appropriate because they are non-recurring non-cash adjustments that may not be reflective of our ongoing operating performance. In 2013, we recorded an impairment provisions totaling $58.1 million for deferred rent from prior GAAP straight-lining adjustments and lease incentives which resulted from a change in our expected holding periods for those properties. (7) In July 2013, we completed the sale of our interests in 42 senior housing properties held through three unconsolidated joint ventures. (8) The add back for impairment of real estate assets to arrive at FFO does not include approximately $58.1 million in impairments of deferred rent from prior GAAP straight-lining adjustments and lease incentives described in Footnote (6) above. While impairment charges are excluded from the calculation of FFO, investors are cautioned that due to the fact that impairments are based on estimated future undiscounted cash flows and the relatively limited term of our operations, it could be difficult to recover any impairment charges. |
Reconciliation of Adjusted EBITDA to Net Income (Loss) 17 Source: CNL Lifestyle Properties 2013 Form 10-K The Company believes that its presentation of historical non-GAAP financial measures provides useful supplementary information to and facilitates additional analysis by investors. These historical non-GAAP financial measures are in addition to, not a substitute for, or superior to, measures of financial performance prepared in accordance with U.S. Generally Accepted Accounting Principles. Past performance is not indicative of future returns. (1) Investments in our unconsolidated joint ventures are accounted for under the HLBV method of accounting. Under this method, we recognize income or loss based on the change in liquidating proceeds we would receive from a hypothetical liquidation of our investments based on depreciated book value. We adjust EBITDA for equity in earnings (loss) of our unconsolidated entities because we believe this is not reflective of the joint ventures’ operating performance or cash flows available for distributions to us. We believe cash distributions from our unconsolidated entities, exclusive of any financing transactions, are reflective of their operating performance and its impact to us and have been added back to adjusted EBITDA above. For the year ended December 31, 2013, cash distributions from unconsolidated entities excludes approximately $5.3 million in return of capital. For the year ended December 31, 2012, cash distributions from unconsolidated entities excludes approximately $3.4 million in return of capital. (2) We believe that adjusting for straight-line adjustments for leased properties and mortgages and other notes receivable is appropriate because they are non-cash adjustments and reflect the actual cash receipts received by us from our tenants and borrowers. (3) In July 2013, we completed the sale of our interests in 42 senior housing properties held through three unconsolidated joint ventures. (4) In connection with an acquisition of an attraction property, we recorded a bargain purchase gain as a result of the fair value of the net assets acquired exceeding the consideration transferred. |