 Net Asset Valuation Presentation March 2015 Exhibit 99.1 |
 General Notices This is not an offer to sell nor a solicitation of an offer to buy shares of the REIT. The information herein does not supplement or revise any information in the REIT's public filings. To the extent information herein conflicts the REIT’s public filings, the information in the filings with the U.S. Securities and Exchange Commission govern. This piece is for general information purposes only and does not constitute legal, tax, investment or other professional advice on any subject matter. Information provided is not all-inclusive and should not be relied upon as being all-inclusive. This presentation includes forward-looking statements. Forward-looking statements are based on current expectations and may be identified by words such as “believes,” “expects,” “may,” “could,” “consider” and terms of similar substance, and speak only as of the date made. Actual results could differ materially from those expressed or implied in the REIT’s forward-looking statements. Important factors, among others, that could cause the REIT's actual results to differ materially from those in its forward-looking statements include those identified in the Risk Factors described below. Investors should not place undue reliance on forward-looking statements. The REIT is under no obligation to, and expressly disclaims any obligation to, update or alter its forward-looking statements, whether as a result of new information, subsequent events or otherwise, except as required by law. An investment in the REIT is subject to significant risks, some of which are summarized below in the “Risk Factors” section of this piece. See also, “Risk Factors” in the REIT’s public filings with the U.S. Securities and Exchange Commission for a more detailed description of the risks associated with an investment in the REIT. |
 Risk Factors Investing in a non-traded REIT is a higher-risk, longer term investment and is not suitable for all investors. Due to the risks involved in the ownership of real estate, there is no guarantee of any return on investment. The shares may lose value or investors could lose their entire investment. The shares are not FDIC- insured, nor bank guaranteed. Non-traded REITs are illiquid. There is no public trading market for the shares. The REIT has no obligation to list on any public securities market. If investors are able to sell their shares, it would likely be at a substantial loss of the amount invested. The REIT is obligated to pay substantial fees to its advisor and their respective affiliates based upon agreements which have not been negotiated at arm’s length, and some of which are payable based upon factors other than the quality of services. These fees could influence their advice and judgment in performing services. Currently, the REIT is incurring fees and expenses, some of which will need to be reimbursed to its advisor and affiliates. In addition, certain officers and directors of the advisor also serve as the REIT’s officers and directors, as well as officers and directors of competing programs, resulting in conflicts of interest. Those persons could take actions more favorable to other entities. To the extent the REIT pays cash distributions from such sources, other than from its cash flows or funds from operations, such as from borrowings it will lower investors’ overall return on investment. The REIT has not established a limit on the extent to which it may pay distributions from borrowings or other sources. |
 Risk Factors There is no assurance that the REIT’s current distribution rate will not change, or that it can be sustained at any level. The amount or basis of distributions will be determined by and at the discretion of the REIT’s board of directors and is dependent upon a number of factors, including but not limited, to expected and actual net cash flow from operations, funds from operations, the REIT’s financial condition, capital requirements, and strategic liquidity alternatives. If the REIT fails to maintain its qualification as a REIT for any taxable year, it will be subject to federal income tax on taxable income at regular corporate rates. In such event, net earnings available for distributions would be reduced. The REIT has used leverage to acquire assets which may hinder the REIT’s ability to pay distributions and/or decrease the value of stockholders’ investment in the event income from and/or the value of the property securing the debt declines. The REIT is currently invested primarily in lifestyle-related properties in the United States & Canada. An investment in the REIT’s shares is subject to greater risk to the extent that the REIT has limited diversification in its portfolio of investments. |
 Valuation Disclosures The REIT’s estimated net asset value per share is primarily based upon subjective judgments, assumptions and opinions, which may or may not turn out to be correct. Therefore, the REIT’s share price may not reflect the amount that might be paid for shareholders’ shares in a market transaction, or in a liquidity event. In determining the REIT’s estimated net asset value per share, the REIT primarily relied upon a valuation of the REIT’s portfolio of properties as of Dec. 31, 2014. Valuations and appraisals of the REIT’s properties are estimates of fair value and may not necessarily correspond to realizable value upon the sale of such properties. Therefore, the estimated present value of the REIT’s portfolio may not reflect the amount that would be realized upon a sale of each of the REIT’s properties. This valuation represents the estimated net asset value per share at a snapshot in time, will fluctuate and should not be relied upon a representative of the amount a shareholder could expect to receive now or in a future liquidation event.. The estimated net asset value per share is only an estimate and is based on a number of assumptions and estimates which may not be complete. CBRE Cap, the independent valuation firm that the board of directors of the REIT engaged to issue a valuation report, made numerous assumptions with respect to industry, business, economic and regulatory conditions, all of which are subject to changes beyond the control of CBRE Cap or the REIT. CBRE Cap is not responsible for the REIT’s estimated net asset value per share as of Dec. 31, 2014, and did not participate in the determination of the offering price of the REIT’s shares. Throughout the valuation process, the valuation committee, the REIT’s advisor and senior members of management reviewed, confirmed and approved the processes and methodologies and their consistency with real estate industry standards and best practices. |
 Non-listed REIT with total assets of $2.3 billion on a GAAP basis 105 lifestyle-oriented real estate assets 34 states and 2 Canadian provinces Diversified by asset type, geography and operator Iconic real estate assets and industry-leading operators The board of directors will endeavor to provide liquidity on or before Dec. 31, 2015 1 There is no assurance this timeframe will be met. Ski & Mountain Attractions Senior Housing Marinas Additional 1 Summary REIT Information |
 Board approval of: an estimated net asset value (NAV) per share of the REIT’s common stock of $5.20 as of Dec. 31, 2014 reduction of the quarterly cash distribution for the first quarter of 2015 to $0.05 per share 7 Overview |
 Sold entire golf portfolio for approximately $320 million Signed definitive purchase and sale agreement for $790 million with Senior Housing Properties Trust (NYSE: SNH) Signed definitive purchase and sale agreement to sell the REIT’s interest in Dallas Market Center for $140 million Ongoing evaluation of strategic alternatives with the REIT’s investment banking and advisory firm, Jefferies LLC, for the balance of the portfolio Since Prior Estimated NAV 8 |
 Based on IPA Valuation Methodology 1 Use of independent investment banking firm, CBRE Capital Advisors, Inc. Utilized discounted cash flow method Tested for reasonableness using direct capitalization approach Range provided by stressing key assumptions Discount rates, terminal capitalization rates Disclosure of methodology Individual MAI property appraisals Estimated Net Asset Value (NAV) 9 1 There is no assurance that all of the IPA guidelines were met or that the IPA Valuation Methodology is acceptable to the SEC, FINRA or under ERISA for compliance with reporting requirements. Utilized purchase prices based on market value indications as real estate asset value Net transaction fees and closing costs Provided estimate of value as of Dec. 31, 2014 |
 97 wholly owned and 8 partially owned properties CBRE’s appraisals utilized an unlevered 10-year discounted cash flow analysis for each operating asset For properties with third-party leases, the value represents the leased-fee value, with certain exceptions A valuation range was calculated by varying the discount rate and terminal cap rate One-time capital expenditures, where applicable applied to property values Cap rates and discount rates sourced from MAI appraisals and vary by location, asset quality and supply/demand metrics Methodology – Wholly and Partially Owned Assets 10 Utilized purchase prices based on market value indications as asset value Valuation assumed sale of partially owned portfolios and net proceeds derived after debt repayment to capture specific joint venture promote structures |
 Emergence of real-time, market-based values as the REIT has been marketing the assets and portfolio for sale Ski and mountain lifestyle and attractions assets perceived as less valuable by market participants Portfolio performance that did not meet budgeted expectations For example, Darien Lake, the REIT’s largest theme park, experienced significant weather and operational challenges last season and recorded EBITDA of $3.7 million in 2014 versus $5.6 million in 2013 Key Factors Impacting Change in NAV 11 Transactions fees and closing costs |
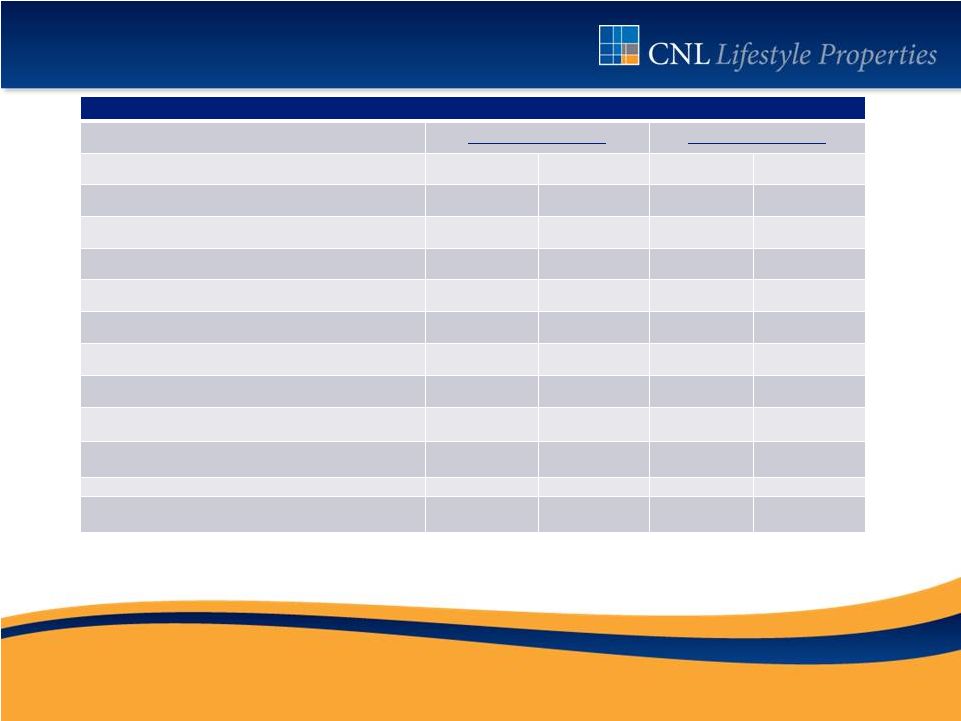 Estimated NAV Per Share Build-Up 12 Table of Value Estimates for Components of Net Asset Value as of Dec. 31, 2014 as of Dec. 31, 2013 Value ($ in 000’s) Per Share Value ($ in 000’s) Per Share Wholly Owned Operating Assets $2,376,942 $7.31 $2,950,265 $9.14 Partially Owned Operating Assets 1 196,723 0.60 240,798 0.75 Cash 136,985 0.42 71,601 0.22 Accounts Receivables and Other Assets 106,909 0.33 112,052 0.35 Mortgages and Other Notes Receivable 22,428 0.07 122,849 0.38 Fair Market Value of Debt 2 (1,032,704) (3.18) (1,213,382) (3.76) Accounts Payable and Other Liabilities (69,556) (0.21) (74,436) (0.23) Total $1,737,727 $5.34 $2,209,747 $6.85 Less: Estimated Transaction Fees/Closing Costs (46,500) (0.14) - - Net Asset Value 3 $1,691,227 $5.20 $2,209,747 $6.85 1 The REIT’s share of equity including promote structures in each venture. 2 Fair market value of debt. 3 The estimated NAV per share does not include any potential adjustment to value relating to the size or scale of components of the REIT’s portfolio of assets and is not necessarily indicative of the value the REIT would expect to realize from the portfolio as it pursues strategies to provide liquidity. |
 Re-pricing of Shares 13 1 The board of directors continues to evaluate the distribution rate on an ongoing basis. The amount of distributions declared is determined by the REIT’s board of directors and is dependent upon a number of factors, including projected level of MFFO, income and cash flows, REIT requirements, the desire to retain cash for growth, and avoiding distribution volatility, strategic alternatives initiatives, etc. To date, the REIT has experienced cumulative net losses. When the REIT has not generated sufficient operating cash flow or funds from operations sufficient to make distributions, it has and may continue to make cash distributions to shareholders from other sources, such as borrowings, which will lower overall return. The REIT has not established a limit on the extent to which it may pay cash distributions from other sources. For the years ended December 31, 2014, 2013, 2012, 2011 and 2010, distributions net of distributions reinvested were funded primarily from borrowings and also from cash from operating activities. Approximately 100%, 70.7%, 99.7%, 100.0%, and 100.0% respectively, were considered a return of capital to shareholders for federal income tax purposes. The REIT’s cash flows from operating activities will fluctuate due to the seasonality of certain properties. Distributions Quarterly cash distribution for the first quarter of 2015 reduced to $0.05 per share |
 Strategies for Looking Ahead Complete sale of senior housing portfolio, Dallas Market Center and other potential assets and portfolios Proceeds are expected to be used to retire debt, including repurchases of the REIT’s senior unsecured notes, and position the REIT to begin the process of providing liquidity to shareholders in the third quarter of 2015 Continue to work with Jefferies LLC to identify and execute strategic liquidity alternatives Ongoing waiver and reduction of all advisory fees by REIT’s sponsor and advisor, which include: Elimination of all acquisition, debt, disposition and performance fees Reduction of asset management fee 14 Forward-looking statements are based on current expectations and may be identified by words such as believes, anticipates, expects, may, will, continues, could and terms of similar substance, and speak only as of the date made. Actual results could differ materially due to risks and uncertainties that are beyond the REIT’s ability to control or accurately predict. The reader should not place undue reliance on forward-looking statements. |
 Investors To obtain additional information about CNL Lifestyle Properties, please consult your financial advisor or visit CNLLifestyleReit.com. Financial Professionals For more information about CNL Lifestyle Properties, please contact our managing dealer, CNL Securities, Member FINRA/SIPC, at 866- 650-0650 or CNLSecurities.com. For More Information 15 This is not an offer. Investments in non-traded real estate investment trusts (REITs) are subject to significant risks. These risks include reliance on the advisors, conflicts of interests, use of leverage, payment of substantial fees to the advisors and their affiliates, illiquidity and liquidations at less than the original amounts invested. © 2015 CNL Intellectual Properties, Inc. All Rights Reserved. CNL® and the Squares Within Squares design trademarks are used under license from CNL Intellectual Properties, Inc. |