EXHIBIT 99.3
| The Frontier Fund | GRAHAM SERIES – 1 | |
The Common Sense Investment Alternative | Trading Advisor: | |
| Graham Capital Management, L.P. |
Highlights of the Graham Series
| n | Managed by Graham Capital Management, LLC, one of the world’s largest commodity trading advisors (Trading Advisors) |
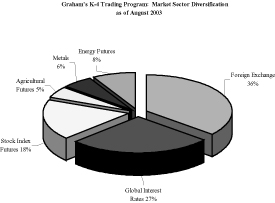
| n | Global diversification among all major futures and currency markets |
| n | Uses Graham’s K-4 Program, a managed futures trading program based on a mathematical model to identify favorable price patterns |
Trading Advisor – Graham Capital Management, L.P. (Stamford, CT)
| n | Established 1994 |
| n | Manages more than $4.0 billion of managed futures investments (as of August 31, 2003) |
| n | Actively trades worldwide on 24-hour basis across all major markets |
| n | Uses various systematic and discretionary global macro trading programs |
Additional information concerning this series and Trading Advisor is contained in the Prospectus of The Frontier Fund and the Graham Series Appendix.
Pro Forma Composite Performance1
Year | Annual Return | ||
2003 (Jan. – Aug.) | 11.91 | % | |
2002 | 39.04 | % | |
2001 | 30.39 | % | |
20002 | 6.58 | % | |
1999 (June – Dec.)3 | 8.80 | % |
| 1. | The actual trading composite results of Graham’s K4 Trading Program; pro forma for expenses of The Frontier Fund applicable to the Graham Series 1 Units as set forth in the Break Even Table below. |
| 2. | July-December 2000 based on standard leverage; the remaining months are at 1.5 times leverage. For the period from January through June of 2000, the actual pro-forma composite performance of Graham’s K-4 Program at 1.5 times leverage was a loss of 10.57%. |
| 3. | June 1, 1999 was the inception date of Graham’s K4 Trading Program. |
Summary Performance Comparison: June 1999 – August 2003
| Graham K4 Program | U.S. Stocks | U.S. Bonds | Managed Futures | |||||||||
Compound Annual Return1 | 22.31 | % | -4.49 | % | 7.36 | % | 5.96 | % | ||||
Worst Historical Loss | -17.49 | % | -44.73 | % | -3.55 | % | -13.69 | % |
PAST PERFORMANCE IS NOT NECESSARILY INDICATIVE OF FUTURE RESULTS.
Worst Historical Loss: measure of risk (also known as Maximum Drawdown) that illustrates the largest peak-to-valley decline, based on monthly rates of return, during a given time period. The time period of analysis is June 1999 – August 2003.
Stocks: S&P 500 Index (dividends reinvested). Source: PerTrac 2000, product of Strategic Financial Solutions, LLC.
Bonds: Lehman Brothers Aggregate Bond Market Index. Source: PerTrac 2000, product of Strategic Financial Solutions, LLC.
Managed Futures: CISDM Public Fund Index. Source: Managed Account Reports, Inc.
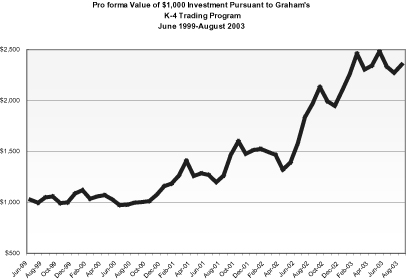
[note to VAMI chart – placement subject to design/layout] The actual trading composite results of Graham’s K4 Trading Program; pro forma for expenses of The Frontier Fund applicable to the Graham Series 1 Units as set forth in the Break Even Table below. July-December 2000 based on standard leverage; balance of periods at 1.5 times leverage. For the period from January through June the actual pro forma composite performance Graham’s K-4 Program at 1.5 times leverage was a loss of 10.57
Projected 12-Month Breakeven Analysis Graham Series – 1 | Expenses as a % of initial investment | |
Syndication and Selling Expenses | 0.00% | |
Trust Operating Expenses | 0.00% | |
Management Fee | 2.50% | |
Service Fee | 3.00% | |
Brokerage Commissions and Trading Fees | 1.06% | |
Incentive Fee | 0.75% | |
Less Interest Income | 0.00% | |
Amount of Trading Income Required for the Trust’s Net Asset Value per Unit (Redemption Value) at the End of One Year to Equal the Selling Price per Unit | 7.31% |
Features and Benefits of The Frontier Fund
| n | Access to multiple levels of diversification with one investment |
| n | Professional management at 3 levels – Managing Owner + Trading Advisor + Fund Administrator |
| n | Daily valuation, liquidity and switching among several separate funds without penalty |
| n | Reporting – monthly performance reports, annual financial and tax information |
| n | Cost efficiencies – low minimum investment and breakeven analysis |
| n | Limited liability |
Fund Summary
Minimum subscription | $1,000 (except for Benefit Plan Investors including IRAs who have no minimum) |
Eligible subscribers | At a minimum, you must have either (1) a net worth (exclusive of your home, home furnishings and automobiles) of at least $150,000 or (2) a net worth, similarly calculated, of at least $45,000 and an annual gross income of at least $45,000. A significant number of states impose substantially higher suitability standards on their residents than these minimums. See the Prospectus for additional information. |
Form of organization | Delaware Trust; Wilmington Trust Company, Trustee |
Investment manager | Equinox Fund Management, LLC |
Fund Administrator | The Bornhoft Group Corporation |
THE BROCHURE MUST BE ACCOMPANIED OR PRECEDED BY THE CURRENT PROSPECTUS OF THE FRONTIER FUND. THIS BROCHURE SHOULD BE READ IN CONJUNCTION WITH THE PROSPECTUS. AN INVESTMENT IN THE FRONTIER FUND IS SPECULATIVE AND INVOLVES A HIGH DEGREE OF RISK.
Please contact your financial advisor to discuss whether this investment is suitable for your overall financial objectives. Read the Prospectus carefully for a detailed description of the fund and inherent risk factors. All investors must submit a fully executed subscription agreement to us.
Equinox Fund Management, LLC
1660 Lincoln Street, Suite 100
Denver, Colorado 80264
(303) 837-0600
info@xxxxxxx.com[general email address needed]