UNITED STATES
SECURITIES AND EXCHANGE COMMISSION
WASHINGTON, DC 20549
FORM 10-Q
x QUARTERLY REPORT PURSUANT TO SECTION 13 OR 15(d) OF THE SECURITIES EXCHANGE ACT OF 1934
For the Period Ended March 31, 2007
OR
¨ TRANSITION REPORT PURSUANT TO SECTION 13 OR 15(d) OF THE SECURITIES EXCHANGE ACT OF 1934
Commission File Number 000-51274
THE FRONTIER FUND BALANCED SERIES; GRAHAM SERIES; WINTON SERIES; CAMPBELL/GRAHAM SERIES; CURRENCY SERIES; DUNN SERIES; LONG ONLY COMMODITY SERIES; LONG/SHORT COMMODITY SERIES;
MANAGED FUTURES INDEX SERIES
(Exact Name of Registrant as specified in its Charter)
| | |
| Delaware | | 36-6815533 |
| (State of Organization) | | (IRS Employer Identification No.) |
c/o Equinox Fund Management, LLC
1660 Lincoln Street, Suite 100,
Denver, Colorado 80264
(Address of Principal Executive Offices)
(303) 837-0600
(Registrant’s Telephone Number)
Securities to be registered pursuant to Section 12(b) of the Act: None
Securities registered pursuant to Section 12(g) of the Act:
Balanced Series Class 1, Class 2, Class 1a and Class 2a Units;
Winton Series Class 1 and Class 2 Units;
Campbell/Graham Series Class 1 and Class 2 Units;
Currency Series Class 1 and Class 2 Units;
Dunn Series Class 1 and Class 2 Units;
Graham Series Class 1 and Class 2 Units;
Long/Short Commodity Series Class 1 and Class 2 Units;
Long Only Commodity Series Class 1 and Class 2 Units; and
Managed Futures Index Series Class 1 and Class 2 Units
Indicate by check mark whether the registrant: (1) has filed all reports required to be filed by Section 13 or 15(d) of the Securities Exchange Act of 1934 during the preceding 12 months, and (2) has been subject to such filing requirements for the past 90 days. Yes x No ¨
Indicate by check mark whether the registrant is a large accelerated filer, an accelerated filer, or a non-accelerated filer. See definition of “accelerated filer and large accelerated filer” in Rule 12b-2 of the Exchange Act. (Check One):
Large Accelerated Filer ¨ Accelerated Filer ¨ Non –Accelerated Filer x
Indicate by check mark whether the registrant is a shell company (as defined in Rule 12b-2 of the Exchange Act). Yes ¨ No x
TABLE OF CONTENTS
Special Note About Forward-Looking Statements
THIS REPORT CONTAINS STATEMENTS WHICH CONSTITUTE FORWARD-LOOKING STATEMENTS WITHIN THE MEANING OF THE PRIVATE SECURITIES LITIGATION REFORM ACT OF 1995 AND OTHER FEDERAL SECURITIES LAWS. THESE FORWARD-LOOKING STATEMENTS REFLECT THE MANAGING OWNER’S CURRENT EXPECTATIONS ABOUT THE FUTURE RESULTS, PERFORMANCE, PROSPECTS AND OPPORTUNITIES OF THE TRUST. THE MANAGING OWNER HAS TRIED TO IDENTIFY THESE FORWARD-LOOKING STATEMENTS BY USING WORDS SUCH AS “MAY,” “WILL,” “EXPECT,” “ANTICIPATE,” “BELIEVE,” “INTEND,” “SHOULD,” “ESTIMATE” OR THE NEGATIVE OF THOSE TERMS OR SIMILAR EXPRESSIONS. THESE FORWARD-LOOKING STATEMENTS ARE BASED ON INFORMATION CURRENTLY AVAILABLE TO THE MANAGING OWNER AND ARE SUBJECT TO A NUMBER OF RISKS, UNCERTAINTIES AND OTHER FACTORS, BOTH KNOWN, SUCH AS THOSE DESCRIBED IN THE “RISK FACTORS” SECTION UNDER ITEM 1A AND ELSEWHERE IN THIS REPORT, AND UNKNOWN, THAT COULD CAUSE THE TRUST’S ACTUAL RESULTS, PERFORMANCE, PROSPECTS OR OPPORTUNITIES TO DIFFER MATERIALLY FROM THOSE EXPRESSED IN, OR IMPLIED BY, THESE FORWARD-LOOKING STATEMENTS.
YOU SHOULD NOT PLACE UNDUE RELIANCE ON ANY FORWARD-LOOKING STATEMENTS. EXCEPT AS EXPRESSLY REQUIRED BY THE FEDERAL SECURITIES LAWS, THE MANAGING OWNER UNDERTAKES NO OBLIGATION TO PUBLICLY UPDATE OR REVISE ANY FORWARD-LOOKING STATEMENTS OR THE RISKS,
2
UNCERTAINTIES OR OTHER FACTORS DESCRIBED HEREIN, AS A RESULT OF NEW INFORMATION, FUTURE EVENTS OR CHANGED CIRCUMSTANCES OR FOR ANY OTHER REASON AFTER THE DATE OF THIS REPORT.
UNLESS EXPRESSLY STATED OTHERWISE, ALL INFORMATION IN THIS REPORT IS AS OF MARCH 31, 2007, AND THE MANAGING OWNER UNDERTAKES NO OBLIGATION TO UPDATE THIS INFORMATION.
3
| PART I. | FINANCIAL INFORMATION |
| ITEM 1. | Financial Statements |
The Frontier Fund
Statements of Financial Condition
March 31, 2007 and December 31, 2006
| | | | | | | | | | | | | | | | | | |
| | | Balanced Series | | Winton Series (1) | | Campbell/Graham Series |
| | | 3/31/2007 | | 12/31/2006 | | 3/31/2007 | | 12/31/2006 | | 3/31/2007 | | 12/31/2006 |
| | | (Unaudited) | | | | (Unaudited) | | | | (Unaudited) | | |
ASSETS | | | | | | | | | | | | | | | | | | |
Cash and cash equivalents | | $ | 137,129,457 | | $ | 85,018,542 | | $ | 5,326,410 | | $ | 538,923 | | $ | 13,474,000 | | $ | 11,941,234 |
Short-term investments | | | 56,655,324 | | | 86,826,629 | | | 3,101,724 | | | — | | | 10,314,859 | | | 21,115,260 |
Cash held at futures commodity merchants | | | 53,550,187 | | | 72,480,538 | | | — | | | — | | | 8,563,075 | | | 13,938,010 |
Open trade equity | | | 2,801,925 | | | 11,391,371 | | | — | | | — | | | 413,364 | | | 1,576,367 |
Investments in unconsolidated trading companies | | | 1,212,650 | | | 78,056 | | | 867,253 | | | 355,763 | | | 30,301,035 | | | 50,785,796 |
Inter-series receivables | | | 49,276,899 | | | 65,035,889 | | | — | | | — | | | — | | | — |
Prepaid service fees - Class 1 | | | 1,055,912 | | | 1,316,314 | | | 71,464 | | | — | | | 235,717 | | | 283,158 |
Receivable from related parties | | | 2,760,274 | | | 1,170,502 | | | — | | | 34 | | | 168,742 | | | 6,539 |
Other assets | | | 80,424 | | | 120,468 | | | 177 | | | 1,342 | | | 134,124 | | | 179,558 |
| | | | | | | | | | | | | | | | | | |
Total Assets | | | 304,523,052 | | $ | 323,438,309 | | $ | 9,367,028 | | $ | 896,062 | | $ | 63,604,916 | | $ | 99,825,922 |
| | | | | | | | | | | | | | | | | | |
LIABILITIES & OWNERS’ CAPITAL | | | | | | | | | | | | | | | | | | |
| | | | | | |
LIABILITIES | | | | | | | | | | | | | | | | | | |
Inter-series payables | | | — | | $ | — | | $ | — | | $ | — | | $ | — | | $ | 26,972,529 |
Pending owner additions | | | 1,369,194 | | | 987,713 | | | 930,450 | | | 162,500 | | | 294,900 | | | 485,675 |
Owner redemptions payable | | | 464,430 | | | 754,023 | | | — | | | — | | | 10,449 | | | 65,762 |
Incentive fees payable to Managing Owner | | | — | | | — | | | — | | | 1,687 | | | — | | | 23,954 |
Management fees payable to Managing Owner | | | 105,676 | | | 96,056 | | | 8,278 | | | 619 | | | 107,841 | | | 115,910 |
Interest fees payable to Managing Owner | | | 378,403 | | | 324,385 | | | 9,716 | | | 775 | | | 86,752 | | | 116,626 |
Trading fees payable to Managing Owner | | | 111,038 | | | 100,164 | | | 2,073 | | | 155 | | | 28,317 | | | 33,018 |
Trailing service fees payable | | | 272,274 | | | 225,872 | | | 1,635 | | | 175 | | | 60,080 | | | 44,899 |
Payables to related parties | | | — | | | — | | | 193,574 | | | 82,260 | | | — | | | 100,959 |
Other liabilities | | | 81,279 | | | 53,819 | | | 1,503 | | | 246 | | | 156,727 | | | 158,732 |
| | | | | | | | | | | | | | | | | | |
Total Liabilities | | | 2,782,294 | | | 2,542,032 | | | 1,147,229 | | | 248,417 | | | 745,066 | | | 28,118,064 |
| | | | | | | | | | | | | | | | | | |
| | | | | | |
MINORITY INTERESTS | | | 27,126,528 | | | 42,889,305 | | | — | | | — | | | 8,976,439 | | | 15,514,377 |
| | | | | | |
OWNERS’ CAPITAL | | | | | | | | | | | | | | | | | | |
Managing Owner Units - Class 1 | | | 180 | | | 192 | | | 954 | | | 1,057 | | | — | | | — |
Managing Owner Units - Class 2 | | | 747,588 | | | 760,413 | | | 617,005 | | | 228,782 | | | 1,922,336 | | | 2,105,062 |
Limited Owner Units - Class 1 | | | 225,211,064 | | | 228,763,573 | | | 6,435,460 | | | 355,867 | | | 47,077,062 | | | 48,843,314 |
Limited Owner Units - Class 2 | | | 48,655,398 | | | 48,482,794 | | | 1,166,380 | | | 61,939 | | | 4,884,013 | | | 5,245,105 |
| | | | | | | | | | | | | | | | | | |
Total Owners’ Capital | | | 274,614,230 | | | 278,006,972 | | | 8,219,799 | | | 647,645 | | | 53,883,411 | | | 56,193,481 |
| | | | | | | | | | | | | | | | | | |
Total Liabilities, Minority Interests and Owners’ Capital | | | 304,523,052 | | $ | 323,438,309 | | $ | 9,367,028 | | $ | 896,062 | | $ | 63,604,916 | | $ | 99,825,922 |
| | | | | | | | | | | | | | | | | | |
| | | | | | |
Units Outstanding | | | | | | | | | | | | | | | | | | |
Class 1 | | | 2,206,124 | | | 2,105,455 | | | 67,491 | | | 3,378 | | | 539,503 | | | 507,344 |
Class 1a | | | 52,888 | | | 43,802 | | | N/A | | | N/A | | | N/A | | | N/A |
Class 2 | | | 447,896 | | | 425,239 | | | 18,359 | | | 2,722 | | | 73,173 | | | 72,160 |
Class 2a | | | 11,943 | | | 6,761 | | | N/A | | | N/A | | | N/A | | | N/A |
| | | | | | |
Net Asset Value per Unit | | | | | | | | | | | | | | | | | | |
Class 1 | | $ | 99.93 | | $ | 106.66 | | $ | 95.37 | | $ | 105.65 | | $ | 87.26 | | $ | 96.27 |
Class 1a | | $ | 89.85 | | $ | 95.97 | | | N/A | | | N/A | | | N/A | | | N/A |
Class 2 | | $ | 107.84 | | $ | 114.24 | | $ | 97.14 | | $ | 106.81 | | $ | 93.02 | | $ | 101.86 |
Class 2a | | $ | 92.26 | | $ | 97.88 | | | N/A | | | N/A | | | N/A | | | N/A |
| (1) | The Beach Series was renamed the Winton Series in May, 2006. (See Note 1) |
The accompanying notes are an integral part of these statements.
4
The Frontier Fund
Statements of Financial Condition
March 31, 2007 and December 31, 2006
| | | | | | | | | | | | | | | | | | |
| | | Currency Series | | Dunn Series | | Graham Series |
| | | 3/31/2007 | | 12/31/2006 | | 3/31/2007 | | 12/31/2006 | | 3/31/2007 | | 12/31/2006 |
| | | (Unaudited) | | | | (Unaudited) | | | | (Unaudited) | | |
ASSETS | | | | | | | | | | | | | | | | | | |
| | | | | | |
Cash and cash equivalents | | $ | 8,603,652 | | $ | 5,193,474 | | $ | 252,847 | | $ | 192,143 | | $ | 2,429,457 | | $ | 4,346,300 |
Short-term investments | | | 6,972,939 | | | 10,001,777 | | | 178,878 | | | 332,290 | | | 1,945,919 | | | 8,875,068 |
Cash held at futures commodity merchants | | | 2,414,780 | | | 2,970,911 | | | — | | | — | | | — | | | — |
Open trade equity | | | — | | | 41,615 | | | — | | | — | | | — | | | — |
Investments in unconsolidated trading companies | | | — | | | — | | | — | | | — | | | 2,636,458 | | | 7,226,062 |
Prepaid service fees - Class 1 | | | 29,778 | | | 39,059 | | | — | | | — | | | 9,175 | | | 13,971 |
Receivable from related parties | | | 351 | | | 850 | | | 29 | | | 19 | | | 419 | | | 937 |
Other assets | | | — | | | — | | | 83 | | | 226 | | | 12,934 | | | 31,060 |
| | | | | | | | | | | | | | | | | | |
Total Assets | | $ | 18,021,500 | | $ | 18,247,686 | | $ | 431,837 | | $ | 524,678 | | $ | 7,034,362 | | $ | 20,493,398 |
| | | | | | | | | | | | | | | | | | |
| | | | | | |
LIABILITIES & OWNERS’ CAPITAL | | | | | | | | | | | | | | | | | | |
| | | | | | |
LIABILITIES | | | | | | | | | | | | | | | | | | |
Liability to unconsolidated trading company | | $ | — | | $ | — | | $ | 127,079 | | $ | 120,051 | | $ | — | | $ | — |
Inter-series payables | | | 10,260,627 | | | 10,697,187 | | | — | | | — | | | — | | | 12,012,370 |
Open trade equity | | | 6,567 | | | | | | — | | | | | | — | | | |
Pending owner additions | | | 4,800 | | | 54,500 | | | — | | | — | | | — | | | — |
Owner redemptions payable | | | 5,586 | | | — | | | — | | | 75,653 | | | — | | | 6,473 |
Management fees payable to Managing Owner | | | 8,949 | | | 13,338 | | | — | | | — | | | 15,851 | | | 54,921 |
Interest fees payable to Managing Owner | | | 28,963 | | | 29,692 | | | 184 | | | 353 | | | 10,727 | | | 34,187 |
Trading fees payable to Managing Owner | | | 7,458 | | | 10,388 | | | — | | | 121 | | | 3,170 | | | 10,984 |
Trailing service fees payable | | | 2,371 | | | 1,043 | | | 249 | | | 311 | | | 7,802 | | | 8,832 |
Payables to related parties | | | 74,422 | | | 50,899 | | | 209,946 | | | 174,901 | | | 453,591 | | | 324,799 |
Other liabilities | | | 3,321 | | | 4,012 | | | 1,327 | | | 1,354 | | | — | | | — |
| | | | | | | | | | | | | | | | | | |
Total Liabilities | | | 10,403,064 | | | 10,861,059 | | | 338,785 | | | 372,744 | | | 491,141 | | | 12,452,566 |
| | | | | | | | | | | | | | | | | | |
| | | | | | |
MINORITY INTERESTS | | | — | | | — | | | — | | | — | | | — | | | — |
| | | | | | |
OWNERS’ CAPITAL | | | | | | | | | | | | | | | | | | |
Managing Owner Units - Class 2 | | | 16,312 | | | 16,689 | | | 673 | | | 823 | | | 351,219 | | | 389,915 |
Limited Owner Units - Class 1 | | | 7,114,985 | | | 6,891,891 | | | 88,827 | | | 123,164 | | | 4,743,880 | | | 5,991,337 |
Limited Owner Units - Class 2 | | | 487,139 | | | 478,047 | | | 3,552 | | | 27,947 | | | 1,448,122 | | | 1,659,580 |
| | | | | | | | | | | | | | | | | | |
Total Owners’ Capital | | | 7,618,436 | | | 7,386,627 | | | 93,052 | | | 151,934 | | | 6,543,221 | | | 8,040,832 |
| | | | | | | | | | | | | | | | | | |
Total Liabilities, Minority Interests and Owners’ Capital | | $ | 18,021,500 | | $ | 18,247,686 | | $ | 431,837 | | $ | 524,678 | | $ | 7,034,362 | | $ | 20,493,398 |
| | | | | | | | | | | | | | | | | | |
| | | | | | |
Units Outstanding | | | | | | | | | | | | | | | | | | |
Class 1 | | | 72,495 | | | 68,126 | | | 1,423 | | | 1,601 | | | 62,644 | | | 70,733 |
Class 2 | | | 4,759 | | | 4,571 | | | 63 | | | 350 | | | 22,134 | | | 22,709 |
| | | | | | |
Net Asset Value per Unit | | | | | | | | | | | | | | | | | | |
Class 1 | | $ | 98.14 | | $ | 101.16 | | $ | 62.44 | | $ | 76.91 | | $ | 75.73 | | $ | 84.70 |
Class 2 | | $ | 105.79 | | $ | 108.23 | | $ | 67.30 | | $ | 82.27 | | $ | 81.29 | | $ | 90.25 |
The accompanying notes are an integral part of these statements.
5
The Frontier Fund
Statements of Financial Condition
March 31, 2007 and December 31, 2006
| | | | | | | | | | | | | | | | | | | | |
| | | Long Only Commodity Series | | Long/Short Commodity Series | | | Managed Futures Index Series |
| | | 3/31/2007 | | 12/31/2006 | | 3/31/2007 | | | 12/31/2006 | | | 3/31/2007 | | 12/31/2006 |
| | | (Unaudited) | | | | (Unaudited) | | | | | | (Unaudited) | | |
ASSETS | | | | | | | | | | | | | | | | | | | | |
| | | | | | |
Cash and cash equivalents | | $ | 17,381,158 | | $ | 3,587,676 | | $ | 12,253,916 | | | $ | 6,411,775 | | | $ | 4,701,099 | | $ | 2,753,004 |
Short-term investments | | | 13,884,474 | | | 5,563,361 | | | 8,635,996 | | | | 10,792,589 | | | | 3,724,126 | | | 5,504,248 |
Cash held at futures commodity merchants | | | 4,785,663 | | | 1,412,416 | | | 2,841,426 | | | | 4,485,621 | | | | 1,344,756 | | | 1,729,868 |
Open trade equity | | | — | | | — | | | 1,022,944 | | | | 280,503 | | | | 72,946 | | | 428,995 |
Prepaid service fees - Class 1 | | | 43,887 | | | 50,792 | | | 121,736 | | | | 213,218 | | | | 3,998 | | | 5,074 |
Receivable from related parties | | | 19,182 | | | 2,228 | | | 32,093 | | | | 9,767 | | | | 324 | | | 65 |
Other assets | | | 1,220 | | | 1,880 | | | 17,360 | | | | 41,143 | | | | 3,431 | | | 3,723 |
| | | | | | | | | | | | | | | | | | | | |
Total Assets | | $ | 36,115,584 | | $ | 10,618,353 | | $ | 24,925,471 | | | $ | 22,234,616 | | | $ | 9,850,680 | | $ | 10,424,977 |
| | | | | | | | | | | | | | | | | | | | |
| | | | | | |
LIABILITIES & OWNERS’ CAPITAL | | | | | | | | | | | | | | | | | | | | |
| | | | | | |
LIABILITIES | | | | | | | | | | | | | | | | | | | | |
Inter-series payables | | $ | 29,518,423 | | $ | 5,522,034 | | $ | — | | | $ | — | | | $ | 9,197,849 | | $ | 9,831,769 |
Open trade equity | | | — | | | 605,943 | | | — | | | | — | | | | — | | | — |
Pending owner additions | | | — | | | 4,604 | | | 476,333 | | | | — | | | | — | | | — |
Owner redemptions payable | | | — | | | 15,000 | | | 15,606 | | | | 988 | | | | — | | | — |
Incentive fees payable to Managing Owner | | | — | | | — | | | 33,828 | | | | — | | | | — | | | — |
Management fees payable to Managing Owner | | | 24,108 | | | 10,389 | | | 65,374 | | | | 59,278 | | | | 16,395 | | | 17,252 |
Interest fees payable to Managing Owner | | | 19,451 | | | 7,622 | | | 20,165 | | | | 16,931 | | | | 8,196 | | | 7,781 |
Trading fees payable to Managing Owner | | | 9,653 | | | 4,162 | | | 9,339 | | | | 8,468 | | | | 4,099 | | | 4,313 |
Trailing service fees payable | | | 100 | | | 79 | | | 5,125 | | | | 3,041 | | | | 121 | | | 114 |
Payables to related parties | | | 1,658,632 | | | 9,732 | | | 19,613 | | | | 47,889 | | | | 24,010 | | | 11,019 |
Other liabilities | | | 1,914 | | | 1,923 | | | — | | | | — | | | | 117 | | | — |
| | | | | | | | | | | | | | | | | | | | |
Total Liabilities | | | 31,232,281 | | | 6,181,488 | | | 645,383 | | | | 136,595 | | | | 9,250,787 | | | 9,872,248 |
| | | | | | | | | | | | | | | | | | | | |
| | | | | | |
MINORITY INTERESTS | | | — | | | — | | | (1,212,650 | ) | | | (78,056 | ) | | | — | | | — |
| | | | | | |
OWNERS’ CAPITAL | | | | | | | | | | | | | | | | | | | | |
Managing Owner Units - Class 2 | | | 149,506 | | | 47,632 | | | 282,648 | | | | 249,285 | | | | 46,908 | | | 50,141 |
Limited Owner Units - Class 1 | | | 4,655,030 | | | 4,321,464 | | | 22,712,398 | | | | 19,478,595 | | | | 550,629 | | | 500,070 |
Limited Owner Units - Class 2 | | | 78,767 | | | 67,769 | | | 2,497,692 | | | | 2,448,197 | | | | 2,356 | | | 2,518 |
| | | | | | | | | | | | | | | | | | | | |
Total Owners’ Capital | | | 4,883,303 | | | 4,436,865 | | | 25,492,738 | | | | 22,176,077 | | | | 599,893 | | | 552,729 |
| | | | | | | | | | | | | | | | | | | | |
Total Liabilities, Minority Interests and Owners’ Capital | | $ | 36,115,584 | | $ | 10,618,353 | | $ | 24,925,471 | | | $ | 22,234,616 | | | $ | 9,850,680 | | $ | 10,424,977 |
| | | | | | | | | | | | | | | | | | | | |
| | | | | | |
Units Outstanding | | | | | | | | | | | | | | | | | | | | |
Class 1 | | | 47,084 | | | 45,276 | | | 224,808 | | | | 193,966 | | | | 6,114 | | | 5,169 |
Class 2 | | | 2,258 | | | 1,188 | | | 26,649 | | | | 26,206 | | | | 535 | | | 535 |
| | | | | | |
Net Asset Value per Unit | | | | | | | | | | | | | | | | | | | | |
Class 1 | | $ | 98.87 | | $ | 95.45 | | $ | 101.03 | | | $ | 100.42 | | | $ | 90.06 | | $ | 96.75 |
Class 2 | | $ | 101.11 | | $ | 97.13 | | $ | 104.33 | | | $ | 102.93 | | | $ | 92.08 | | $ | 98.43 |
The accompanying notes are an integral part of these statements.
6
The Frontier Fund
Statements of Operations
For the Three Months Ended March 31, 2007 and 2006
| | | | | | | | | | | | | | | | | | | | | | | | |
| | | Balanced Series (Unaudited) | | | Winton Series (1)
(Unaudited) | | | Campbell/Graham Series
(Unaudited) | |
| | | 3/31/2007 | | | 3/31/2006 | | | 3/31/2007 | | | 3/31/2006 | | | 3/31/2007 | | | 3/31/2006 | |
Investment Income: | | | | | | | | | | | | | | | | | | | | | | | | |
Interest - net | | $ | 1,721,854 | | | $ | 762,497 | | | $ | 25,333 | | | $ | 13,494 | | | $ | 437,970 | | | $ | 152,870 | |
| | | | | | | | | | | | | | | | | | | | | | | | |
| | | | | | |
Total Income | | | 1,721,854 | | | | 762,497 | | | | 25,333 | | | | 13,494 | | | | 437,970 | | | | 152,870 | |
| | | | | | | | | | | | | | | | | | | | | | | | |
| | | | | | |
Expenses: | | | | | | | | | | | | | | | | | | | | | | | | |
Incentive Fees | | | 1,490,934 | | | | 1,893,103 | | | | — | | | | 68,737 | | | | 33,094 | | | | 169,790 | |
Management Fees | | | 302,876 | | | | 158,136 | | | | 14,961 | | | | 12,168 | | | | 310,749 | | | | 180,696 | |
Service Fees - Class 1 | | | 1,725,781 | | | | 967,800 | | | | 19,692 | | | | 17,798 | | | | 364,229 | | | | 191,079 | |
Trading Fees | | | 321,101 | | | | 158,063 | | | | 3,738 | | | | 3,040 | | | | 92,866 | | | | 36,097 | |
| | | | | | | | | | | | | | | | | | | | | | | | |
| | | | | | |
Total Expenses | | | 3,840,692 | | | | 3,177,102 | | | | 38,391 | | | | 101,743 | | | | 800,938 | | | | 577,662 | |
| | | | | | | | | | | | | | | | | | | | | | | | |
| | | | | | |
Investment gain/(loss) - net | | | (2,118,838 | ) | | | (2,414,605 | ) | | | (13,058 | ) | | | (88,249 | ) | | | (362,968 | ) | | | (424,792 | ) |
| | | | | | | | | | | | | | | | | | | | | | | | |
| | | | | | |
Realized and unrealized gain (loss) on investments: | | | | | | | | | | | | | | | | | | | | | | | | |
Net realized gain/(loss) on investments | | | (11,212,270 | ) | | | 11,213,419 | | | | — | | | | — | | | | (311,330 | ) | | | 66,612 | |
Net change in open trade equity | | | (9,439,201 | ) | | | (819,954 | ) | | | — | | | | — | | | | (313,477 | ) | | | 576,009 | |
Trading commissions | | | (563,068 | ) | | | (414,926 | ) | | | — | | | | — | | | | (14,904 | ) | | | (48,217 | ) |
Net change in inter-series receivables | | | 476,249 | | | | 350,667 | | | | — | | | | — | | | | 325,800 | | | | — | |
Equity in earnings/(loss) from trading company | | | (1,113,763 | ) | | | 22,289 | | | | (591,344 | ) | | | 365,878 | | | | (5,370,129 | ) | | | 964,444 | |
| | | | | | | | | | | | | | | | | | | | | | | | |
| | | | | | |
Net gain/(loss) on investments | | | (21,852,053 | ) | | | 10,351,495 | | | | (591,344 | ) | | | 365,878 | | | | (5,684,040 | ) | | | 1,558,848 | |
| | | | | | | | | | | | | | | | | | | | | | | | |
| | | | | | |
Minority interests | | | 5,987,053 | | | | (1,328,372 | ) | | | — | | | | — | | | | 639,711 | | | | (193,857 | ) |
| | | | | | | | | | | | | | | | | | | | | | | | |
| | | | | | |
NET INCREASE/(DECREASE) IN OWNERS’ CAPITAL RESULTING FROM OPERATIONS | | $ | (17,983,838 | ) | | $ | 6,608,518 | | | $ | (604,402 | ) | | $ | 277,629 | | | $ | (5,407,297 | ) | | $ | 940,199 | |
| | | | | | | | | | | | | | | | | | | | | | | | |
| | | | | | |
NET INCOME/(LOSS) PER UNIT | | | | | | | | | | | | | | | | | | | | | | | | |
Class 1 | | $ | (6.73 | ) | | $ | 4.23 | | | $ | (10.28 | ) | | $ | 12.62 | | | $ | (9.01 | ) | | $ | 2.60 | |
Class 1a | | $ | (6.12 | ) | | | N/A | | | | N/A | | | | N/A | | | | N/A | | | | N/A | |
Class 2 | | $ | (6.40 | ) | | $ | 5.23 | | | $ | (9.67 | ) | | $ | 14.06 | | | $ | (8.84 | ) | | $ | 3.40 | |
Class 2a | | $ | (5.62 | ) | | | N/A | | | | N/A | | | | N/A | | | | N/A | | | | N/A | |
| (1) | The Beach Series was renamed the Winton Series in May, 2006. (See Note 1.) |
The accompanying notes are an integral part of these statements.
7
The Frontier Fund
Statements of Operations
For the Three Months Ended March 31, 2007 and 2006
| | | | | | | | | | | | | | | | | | | | | | | | |
| | | Currency Series (Unaudited) | | | Dunn Series (Unaudited) | | | Graham Series (Unaudited) | |
| | | 3/31/2007 | | | 3/31/2006 | | | 3/31/2007 | | | 3/31/2006 | | | 3/31/2007 | | | 3/31/2006 | |
Investment Income: | | | | | | | | | | | | | | | | | | | | | | | | |
Interest - net | | $ | 128,278 | | | $ | 43,423 | | | $ | 820 | | | $ | 1,589 | | | $ | 65,381 | | | $ | 39,720 | |
| | | | | | | | | | | | | | | | | | | | | | | | |
| | | | | | |
Total Income | | | 128,278 | | | | 43,423 | | | | 820 | | | | 1,589 | | | | 65,381 | | | | 39,720 | |
| | | | | | | | | | | | | | | | | | | | | | | | |
| | | | | | |
Expenses: | | | | | | | | | | | | | | | | | | | | | | | | |
Incentive Fees | | | — | | | | 7,393 | | | | — | | | | — | | | | — | | | | — | |
Management Fees | | | 29,418 | | | | 29,631 | | | | — | | | | — | | | | 73,055 | | | | 45,833 | |
Service Fees - Class 1 | | | 52,769 | | | | 6,430 | | | | 864 | | | | 1,336 | | | | 40,078 | | | | 43,094 | |
Trading Fees | | | 25,230 | | | | 11,467 | | | | 309 | | | | 368 | | | | 14,272 | | | | 9,170 | |
| | | | | | | | | | | | | | | | | | | | | | | | |
| | | | | | |
Total Expenses | | | 107,417 | | | | 54,921 | | | | 1,173 | | | | 1,704 | | | | 127,405 | | | | 98,097 | |
| | | | | | | | | | | | | | | | | | | | | | | | |
| | | | | | |
Investment gain/(loss) - net | | | 20,861 | | | | (11,498 | ) | | | (353 | ) | | | (115 | ) | | | (62,024 | ) | | | (58,377 | ) |
| | | | | | | | | | | | | | | | | | | | | | | | |
| | | | | | |
Realized and unrealized gain (loss) on investments: | | | | | | | | | | | | | | | | | | | | | | | | |
Net realized gain/(loss) on investments | | | (442,700 | ) | | | 126,637 | | | | — | | | | — | | | | — | | | | — | |
Net change in open trade equity | | | (39,426 | ) | | | (26,435 | ) | | | — | | | | — | | | | — | | | | — | |
Net change in inter-series payables | | | 236,560 | | | | (28,887 | ) | | | — | | | | — | | | | (76,140 | ) | | | — | |
Equity in earnings/(loss) from trading company | | | — | | | | — | | | | (25,580 | ) | | | (1,950 | ) | | | (639,711 | ) | | | 187,557 | |
| | | | | | | | | | | | | | | | | | | | | | | | |
| | | | | | |
Net gain/(loss) on investments | | | (245,566 | ) | | | 71,315 | | | | (25,580 | ) | | | (1,950 | ) | | | (715,851 | ) | | | 187,557 | |
| | | | | | | | | | | | | | | | | | | | | | | | |
| | | | | | |
Minority interests | | | — | | | | (22,289 | ) | | | — | | | | — | | | | — | | | | — | |
| | | | | | | | | | | | | | | | | | | | | | | | |
| | | | | | |
NET INCREASE/(DECREASE) IN OWNERS’ CAPITAL RESULTING FROM OPERATIONS | | $ | (224,705 | ) | | $ | 37,528 | | | $ | (25,933 | ) | | $ | (2,065 | ) | | $ | (777,875 | ) | | $ | 129,180 | |
| | | | | | | | | | | | | | | | | | | | | | | | |
| | | | | | |
NET INCOME/(LOSS) PER UNIT | | | | | | | | | | | | | | | | | | | | | | | | |
Class 1 | | $ | (3.02 | ) | | $ | 0.57 | | | $ | (14.47 | ) | | $ | (0.72 | ) | | $ | 8.97 | ) | | $ | 1.15 | |
Class 2 | | $ | (2.44 | ) | | $ | 1.35 | | | $ | (14.97 | ) | | $ | (0.08 | ) | | $ | (8.96 | ) | | $ | 1.83 | |
The accompanying notes are an integral part of these statements.
8
The Frontier Fund
Statements of Operations
For the Three Months Ended September 30, 2006 and 2005
| | | | | | | | | | | | | | | | | | | | | | | | |
| | | Long Only Commodity Series (Unaudited) | | | Long/Short Commodity Series (Unaudited) | | | Managed Futures Index Series (Unaudited) | |
| | | 3/31/2007 | | | 3/31/2006 | | | 3/31/2007 | | | 3/31/2006 | | | 3/31/2007 | | | 3/31/2006 | |
Investment Income: | | | | | | | | | | | | | | | | | | | | | | | | |
Interest - net | | $ | 131,455 | | | $ | 16,356 | | | $ | 212,997 | | | $ | 26,350 | | | $ | 95,406 | | | $ | 1,907 | |
| | | | | | | | | | | | | | | | | | | | | | | | |
| | | | | | |
Total Income | | | 131,455 | | | | 16,356 | | | | 212,997 | | | | 26,350 | | | | 95,406 | | | | 1,907 | |
| | | | | | | | | | | | | | | | | | | | | | | | |
| | | | | | |
Expenses: | | | | | | | | | | | | | | | | | | | | | | | | |
Incentive Fees | | | — | | | | — | | | | 111,809 | | | | 28,970 | | | | — | | | | — | |
Management Fees | | | 43,506 | | | | 5,212 | | | | 220,698 | | | | 24,138 | | | | 51,082 | | | | 1,122 | |
Service Fees - Class 1 | | | 22,247 | | | | 7 | | | | 149,345 | | | | 447 | | | | 2,594 | | | | 25 | |
Trading Fees | | | 17,296 | | | | 2,085 | | | | 24,784 | | | | 3,442 | | | | 12,634 | | | | 281 | |
| | | | | | | | | | | | | | | | | | | | | | | | |
| | | | | | |
Total Expenses | | | 83,049 | | | | 7,304 | | | | 506,636 | | | | 56,997 | | | | 66,310 | | | | 1,428 | |
| | | | | | | | | | | | | | | | | | | | | | | | |
| | | | | | |
Investment gain/(loss) - net | | | 48,406 | | | | 9,052 | | | | (293,639 | ) | | | (30,647 | ) | | | 29,096 | | | | 479 | |
| | | | | | | | | | | | | | | | | | | | | | | | |
| | | | | | |
Realized and unrealized gain (loss) on investments: | | | | | | | | | | | | | | | | | | | | | | | | |
Net realized gain/(loss) on investments | | | 1,430,851 | | | | — | | | | 772,228 | | | | (19,722 | ) | | | (331,200 | ) | | | — | |
Net change in open trade equity | | | — | | | | 195,185 | | | | (1,311,100 | ) | | | 180,598 | | | | (356,012 | ) | | | — | |
Trading commissions | | | — | | | | — | | | | (107,012 | ) | | | (5,141 | ) | | | (16,116 | ) | | | — | |
Net change in inter-series payables | | | (1,296,389 | ) | | | (203,947 | ) | | | — | | | | (117,341 | ) | | | 633,920 | | | | (492 | ) |
| | | | | | | | | | | | | | | | | | | | | | | | |
| | | | | | |
Net gain/(loss) on investments | | | 134,462 | | | | (8,762 | ) | | | (645,884 | ) | | | 38,394 | | | | (69,408 | ) | | | (492 | ) |
| | | | | | | | | | | | | | | | | | | | | | | | |
| | | | | | |
Minority interests | | | — | | | | — | | | | 1,113,763 | | | | — | | | | — | | | | — | |
| | | | | | | | | | | | | | | | | | | | | | | | |
| | | | | | |
NET INCREASE/(DECREASE) IN OWNERS’ CAPITAL RESULTING FROM OPERATIONS | | $ | 182,868 | | | $ | 290 | | | $ | 174,240 | | | $ | 7,747 | | | $ | (40,312 | ) | | $ | (13 | ) |
| | | | | | | | | | | | | | | | | | | | | | | | |
| | | | | | |
NET INCOME/(LOSS) PER UNIT | | | | | | | | | | | | | | | | | | | | | | | | |
Class 1 | | $ | 3.42 | | | $ | 3.82 | | | $ | 0.61 | | | $ | 0.94 | | | $ | (6.69 | ) | | $ | (0.11 | ) |
Class 2 | | $ | 3.98 | | | $ | 4.08 | | | $ | 1.40 | | | $ | 1.20 | | | $ | (6.35 | ) | | $ | 0.11 | |
The accompanying notes are an integral part of these statements.
9
The Frontier Fund
Statements of Changes in Owners’ Capital
For the Three Months Ended March 31, 2007 (Unaudited)
| | | | | | | | | | | | | | | | | | | | | | | | | | | | | | | |
| | | Balanced Series | |
| | | Class 1 | | | Class 1a | | | Class 2 | | | Class 2a | |
| | | Managing
Owner | | Limited
Owners | | | Managing
Owner | | | Limited
Owners | | | Managing
Owner | | | Limited
Owners | | | Managing
Owner | | | Limited
Owners | |
Owners’ Capital, January 1, 2007 | | $ | — | | $ | 224,559,900 | | | $ | 192 | | | $ | 4,203,673 | | | $ | 711,471 | | | $ | 47,869,930 | | | $ | 48,942 | | | $ | 612,864 | |
| | | | | | | | | | | | | | | | | | | | | | | | | | | | | | | |
| | | | | | | | |
Sale of Units | | | — | | | 18,470,547 | | | | — | | | | 1,198,422 | | | | — | | | | 4,076,749 | | | | 30,000 | | | | 463,000 | |
Redemption of Units | | | — | | | (7,863,599 | ) | | | — | | | | (347,304 | ) | | | — | | | | (1,436,719 | ) | | | — | | | | — | |
Net (decrease) in Owners’ Capital resulting from operations | | | — | | | (14,707,867 | ) | | | (12 | ) | | | (302,708 | ) | | | (39,887 | ) | | | (2,880,389 | ) | | | (2,938 | ) | | | (50,037 | ) |
| | | | | | | | | | | | | | | | | | | | | | | | | | | | | | | |
| | | | | | | | |
Owners’ Capital, March 31, 2007 | | $ | — | | $ | 220,458,981 | | | $ | 180 | | | $ | 4,752,083 | | | $ | 671,584 | | | $ | 47,629,571 | | | $ | 76,004 | | | $ | 1,025,827 | |
| | | | | | | | | | | | | | | | | | | | | | | | | | | | | | | |
| | | | | | | | |
Owners’ Capital - Units, January 1, 2007 | | | — | | | 2,105,455 | | | | 2 | | | | 43,800 | | | | 6,228 | | | | 419,011 | | | | 500 | | | | 6,261 | |
| | | | | | | | | | | | | | | | | | | | | | | | | | | | | | | |
| | | | | | | | |
Sale of Units | | | — | | | 176,318 | | | | — | | | | 12,677 | | | | — | | | | 35,642 | | | | 324 | | | | 4,858 | |
Redemption of Units | | | — | | | (75,649 | ) | | | — | | | | (3,591 | ) | | | — | | | | (12,985 | ) | | | — | | | | — | |
| | | | | | | | | | | | | | | | | | | | | | | | | | | | | | | |
| | | | | | | | |
Owners’ Capital - Units, March 31, 2007 | | | — | | | 2,206,124 | | | | 2 | | | | 52,886 | | | | 6,228 | | | | 441,668 | | | | 824 | | | | 11,119 | |
| | | | | | | | | | | | | | | | | | | | | | | | | | | | | | | |
| | | | | | | | |
Net asset value per unit at January 1, 2007 | | | | | $ | 106.66 | | | | | | | $ | 95.97 | | | | | | | $ | 114.24 | | | | | | | $ | 97.88 | |
| | | | | | | | |
Change in net asset value per unit for three months ended March 31, 2007 | | | | | | (6.73 | ) | | | | | | | (6.12 | ) | | | | | | | (6.40 | ) | | | | | | | (5.62 | ) |
| | | | | | | | | | | | | | | | | | | | | | | | | | | | | | | |
| | | | | | | | |
Net asset value per unit at March 31, 2007 | | | | | $ | 99.93 | | | | | | | $ | 89.85 | | | | | | | $ | 107.84 | | | | | | | $ | 92.26 | |
| | | | | | | | | | | | | | | | | | | | | | | | | | | | | | | |
The accompanying notes are an integral part of these statements.
10
The Frontier Fund
Statements of Changes in Owners’ Capital
For the Three Months Ended March 31, 2007 (Unaudited)
| | | | | | | | | | | | | | | | | | | | | | | | | | | | | | | |
| | | Winton Series | | | Campbell/Graham Series Campbell/Graham Series | |
| | | Class 1 | | | Class 2 | | | Class 1 | | | Class 2 | |
| | | Managing
Owner | | | Limited
Owners | | | Managing
Owner | | | Limited
Owners | | | Managing
Owner | | Limited
Owners | | | Managing
Owner | | | Limited
Owners | |
Owners’ Capital, January 1, 2007 | | $ | 1,057 | | | $ | 355,867 | | | $ | 228,782 | | | $ | 61,939 | | | $ | — | | $ | 48,843,314 | | | $ | 2,105,062 | | | $ | 5,245,105 | |
| | | | | | | | | | | | | | | | | | | | | | | | | | | | | | | |
| | | | | | | | |
Sale of Units | | | — | | | | 6,597,846 | | | | 410,000 | | | | 1,218,036 | | | | — | | | 4,348,954 | | | | — | | | | 316,813 | |
Redemption of Units | | | — | | | | (6,000 | ) | | | — | | | | (43,326 | ) | | | — | | | (1,355,482 | ) | | | — | | | | (213,058 | ) |
Net decrease in Owners’ Capital resulting from operations | | | (103 | ) | | | (512,253 | ) | | | (21,777 | ) | | | (70,269 | ) | | | — | | | (4,759,724 | ) | | | (182,726 | ) | | | (464,847 | ) |
| | | | | | | | | | | | | | | | | | | | | | | | | | | | | | | |
| | | | | | | | |
Owners’ Capital, March 31, 2007 | | $ | 954 | | | $ | 6,435,460 | | | $ | 617,005 | | | $ | 1,166,380 | | | $ | — | | $ | 47,077,062 | | | $ | 1,922,336 | | | $ | 4,884,013 | |
| | | | | | | | | | | | | | | | | | | | | | | | | | | | | | | |
| | | | | | | | |
Owners’ Capital - Units, January 1, 2007 | | | 10 | | | | 3,368 | | | | 2,142 | | | | 580 | | | | — | | | 507,344 | | | | 20,666 | | | | 51,494 | |
| | | | | | | | | | | | | | | | | | | | | | | | | | | | | | | |
| | | | | | | | |
Sale of Units | | | — | | | | 64,176 | | | | 4,210 | | | | 11,877 | | | | — | | | 46,904 | | | | — | | | | 3,276 | |
Redemption of Units | | | — | | | | (63 | ) | | | — | | | | (450 | ) | | | — | | | (14,745 | ) | | | — | | | | (2,263 | ) |
| | | | | | | | | | | | | | | | | | | | | | | | | | | | | | | |
| | | | | | | | |
Owners’ Capital - Units, March 31, 2007 | | | 10 | | | | 67,481 | | | | 6,352 | | | | 12,007 | | | | — | | | 539,503 | | | | 20,666 | | | | 52,507 | |
| | | | | | | | | | | | | | | | | | | | | | | | | | | | | | | |
| | | | | | | | |
Net asset value per unit at January 1, 2007 | | | | | | $ | 105.65 | | | | | | | $ | 106.81 | | | | | | $ | 96.27 | | | | | | | $ | 101.86 | |
| | | | | | | | |
Change in net asset value per unit for three months ended March 31, 2007 | | | | | | | (10.28 | ) | | | | | | | (9.67 | ) | | | | | | (9.01 | ) | | | | | | | (8.84 | ) |
| | | | | | | | | | | | | | | | | | | | | | | | | | | | | | | |
| | | | | | | | |
Net asset value per unit at March 31, 2007 | | | | | | $ | 95.37 | | | | | | | $ | 97.14 | | | | | | $ | 87.26 | | | | | | | $ | 93.02 | |
| | | | | | | | | | | | | | | | | | | | | | | | | | | | | | | |
The accompanying notes are an integral part of these statements.
11
The Frontier Fund
Statements of Changes in Owners’ Capital
For the Three Months Ended March 31, 2007 (Unaudited)
| | | | | | | | | | | | | | | | | | | | | | | | | | | | | | |
| | | Currency Series | | | Dunn Series | |
| | | Class 1 | | | Class 2 | | | Class 1 | | | Class 2 | |
| | | Managing
Owner | | Limited
Owners | | | Managing
Owner | | | Limited
Owners | | | Managing
Owner | | Limited
Owners | | | Managing
Owner | | | Limited
Owners | |
Owners’ Capital, January 1, 2007 | | $ | — | | $ | 6,891,891 | | | $ | 16,689 | | | $ | 478,047 | | | $ | — | | $ | 123,164 | | | $ | 823 | | | $ | 27,947 | |
| | | | | | | | | | | | | | | | | | | | | | | | | | | | | | |
| | | | | | | | |
Sale of Units | | | — | | | 500,047 | | | | — | | | | 36,500 | | | | — | | | — | | | | — | | | | — | |
Redemption of Units | | | — | | | (64,052 | ) | | | — | | | | (15,981 | ) | | | — | | | (11,825 | ) | | | — | | | | (21,124 | ) |
Net decrease in Owners’ Capital resulting from operations | | | — | | | (212,901 | ) | | | (377 | ) | | | (11,427 | ) | | | — | | | (22,512 | ) | | | (150 | ) | | | (3,271 | ) |
| | | | | | | | | | | | | | | | | | | | | | | | | | | | | | |
| | | | | | | | |
Owners’ Capital, March 31, 2007 | | $ | — | | $ | 7,114,985 | | | $ | 16,312 | | | $ | 487,139 | | | $ | — | | $ | 88,827 | | | $ | 673 | | | $ | 3,552 | |
| | | | | | | | | | | | | | | | | | | | | | | | | | | | | | |
| | | | | | | | |
Owner’s Capital - Units, January 1, 2007 | | | — | | | 68,126 | | | | 154 | | | | 4,417 | | | | — | | | 1,601 | | | | 10 | | | | 340 | |
| | | | | | | | |
Sale of Units | | | — | | | 5,003 | | | | — | | | | 335 | | | | — | | | — | | | | — | | | | — | |
Redemption of Units | | | — | | | (634 | ) | | | — | | | | (147 | ) | | | — | | | (178 | ) | | | — | | | | (287 | ) |
| | | | | | | | | | | | | | | | | | | | | | | | | | | | | | |
| | | | | | | | |
Owners’ Capital - Units, March 31, 2007 | | | — | | | 72,495 | | | | 154 | | | | 4,605 | | | | — | | | 1,423 | | | | 10 | | | | 53 | |
| | | | | | | | | | | | | | | | | | | | | | | | | | | | | | |
| | | | | | | | |
Net asset value per unit at January 1, 2007 | | | | | $ | 101.16 | | | | | | | $ | 108.23 | | | | | | $ | 76.91 | | | | | | | $ | 82.27 | |
| | | | | | | | |
Change in net asset value per unit for three months ended March 31, 2007 | | | | | | (3.02 | ) | | | | | | | (2.44 | ) | | | | | | (14.47 | ) | | | | | | | (14.97 | ) |
| | | | | | | | | | | | | | | | | | | | | | | | | | | | | | |
| | | | | | | | |
Net asset value per unit at March 31, 2007 | | | | | $ | 98.14 | | | | | | | $ | 105.79 | | | | | | $ | 62.44 | | | | | | | $ | 67.30 | |
The accompanying notes are an integral part of these statements.
12
The Frontier Fund
Statements of Changes in Owners’ Capital
For the Three Months Ended March 31, 2007 (Unaudited)
| | | | | | | | | | | | | | | | | | | | | | | | | | | | | |
| | | Graham Series | | | Long Only Commodity Series | |
| | | Class 1 | | | Class 2 | | | Class 1 | | | Class 2 | |
| | | Managing
Owner | | Limited
Owners | | | Managing
Owner | | | Limited
Owners | | | Managing
Owner | | Limited
Owners | | | Managing
Owner | | Limited
Owners | |
Owners’ Capital, January 1, 2007 | | $ | — | | $ | 5,991,337 | | | $ | 389,915 | | | $ | 1,659,580 | | | $ | — | | $ | 4,321,464 | | | $ | 47,632 | | $ | 67,769 | |
| | | | | | | | | | | | | | | | | | | | | | | | | | | | | |
| | | | | | | | |
Sale of Units | | | — | | | 97,572 | | | | — | | | | — | | | | — | | | 486,168 | | | | 100,000 | | | 21,253 | |
Redemption of Units | | | — | | | (768,017 | ) | | | — | | | | (49,291 | ) | | | — | | | (330,626 | ) | | | — | | | (13,225 | ) |
Net increase (decrease) in Owners’ Capital resulting from operations | | | — | | | (577,012 | ) | | | (38,696 | ) | | | (162,167 | ) | | | — | | | 178,024 | | | | 1,874 | | | 2,970 | |
| | | | | | | | | | | | | | | | | | | | | | | | | | | | | |
| | | | | | | | |
Owners’ Capital, March 31, 2007 | | $ | — | | $ | 4,743,880 | | | $ | 351,219 | | | $ | 1,448,122 | | | $ | — | | $ | 4,655,030 | | | $ | 149,506 | | $ | 78,767 | |
| | | | | | | | | | | | | | | | | | | | | | | | | | | | | |
| | | | | | | | |
Owners’ Capital - Units, January 1, 2007 | | | — | | | 70,733 | | | | 4,320 | | | | 18,389 | | | | — | | | 45,276 | | | | 490 | | | 698 | |
| | | | | | | | | | | | | | | | | | | | | | | | | | | | | |
| | | | | | | | |
Sale of Units | | | — | | | 1,219 | | | | — | | | | — | | | | — | | | 5,255 | | | | 989 | | | 212 | |
Redemption of Units | | | — | | | (9,308 | ) | | | — | | | | (575 | ) | | | — | | | (3,447 | ) | | | — | | | (131 | ) |
| | | | | | | | | | | | | | | | | | | | | | | | | | | | | |
| | | | | | | | |
Owners’ Capital - Units, March 31, 2007 | | | — | | | 62,644 | | | | 4,320 | | | | 17,814 | | | | — | | | 47,084 | | | | 1,479 | | | 779 | |
| | | | | | | | | | | | | | | | | | | | | | | | | | | | | |
| | | | | | | | |
Net asset value per unit at January 1, 2007 | | | | | $ | 84.70 | | | | | | | $ | 90.25 | | | | | | $ | 95.45 | | | | | | $ | 97.13 | |
| | | | | | | | |
Change in net asset value per unit for three months ended March 31, 2007 | | | | | | (8.97 | ) | | | | | | | (8.96 | ) | | | | | | 3.42 | | | | | | | 3.98 | |
| | | | | | | | | | | | | | | | | | | | | | | | | | | | | |
| | | | | | | | |
Net asset value per unit at March 31, 2007 | | | | | $ | 75.73 | | | | | | | $ | 81.29 | | | | | | $ | 98.87 | | | | | | $ | 101.11 | |
| | | | | | | | | | | | | | | | | | | | | | | | | | | | | |
The accompanying notes are an integral part of these statements.
13
The Frontier Fund
Statements of Changes in Owners’ Capital
For the Three Months Ended March 31, 2007 (Unaudited)
| | | | | | | | | | | | | | | | | | | | | | | | | | | | | |
| | | Long/Short Commodity Series | | | Managed Futures Index Series | |
| | | Class 1 | | | Class 2 | | | Class 1 | | | Class 2 | |
| | | Managing
Owner | | Limited
Owners | | | Managing
Owner | | Limited
Owners | | | Managing
Owner | | Limited
Owners | | | Managing
Owner | | | Limited
Owners | |
Owners’ Capital, January 1, 2007 | | $ | — | | $ | 19,478,595 | | | $ | 249,285 | | $ | 2,448,197 | | | $ | — | | $ | 500,070 | | | $ | 50,141 | | | $ | 2,518 | |
| | | | | | | | | | | | | | | | | | | | | | | | | | | | | |
| | | | | | | | |
Sale of Units | | | — | | | 3,774,775 | | | | 30,000 | | | 59,700 | | | | — | | | 150,788 | | | | — | | | | — | |
Redemption of Units | | | — | | | (678,841 | ) | | | — | | | (43,213 | ) | | | — | | | (63,312 | ) | | | — | | | | — | |
Net increase (decrease) in Owners’ Capital resulting from operations | | | — | | | 137,869 | | | | 3,363 | | | 33,008 | | | | — | | | (36,917 | ) | | | (3,233 | ) | | | (162 | ) |
| | | | | | | | | | | | | | | | | | | | | | | | | | | | | |
| | | | | | | | |
Owners’ Capital, March 31, 2007 | | $ | — | | $ | 22,712,398 | | | $ | 282,648 | | $ | 2,497,692 | | | $ | — | | $ | 550,629 | | | $ | 46,908 | | | $ | 2,356 | |
| | | | | | | | | | | | | | | | | | | | | | | | | | | | | |
| | | | | | | | |
Owners’ Capital - Units, January 1, 2007 | | | — | | | 193,966 | | | | 2,422 | | | 23,784 | | | | — | | | 5,169 | | | | 509 | | | | 26 | |
| | | | | | | | | | | | | | | | | | | | | | | | | | | | | |
| | | | | | | | |
Sale of Units | | | — | | | 37,605 | | | | 287 | | | 576 | | | | — | | | 1,654 | | | | — | | | | — | |
Redemption of Units | | | — | | | (6,763 | ) | | | — | | | (420 | ) | | | — | | | (709 | ) | | | — | | | | — | |
| | | | | | | | | | | | | | | | | | | | | | | | | | | | | |
| | | | | | | | |
Owners’ Capital - Units, March 31, 2007 | | | — | | | 224,808 | | | | 2,709 | | | 23,940 | | | | — | | | 6,114 | | | | 509 | | | | 26 | |
| | | | | | | | | | | | | | | | | | | | | | | | | | | | | |
| | | | | | | | |
Net asset value per unit at January 1, 2007 | | | | | $ | 100.42 | | | | | | $ | 102.93 | | | | | | $ | 96.75 | | | | | | | $ | 98.43 | |
| | | | | | | | |
Change in net asset value per unit for three months ended March 31, 2007 | | | | | | 0.61 | | | | | | | 1.40 | | | | | | | (6.69 | ) | | | | | | | (6.35 | ) |
| | | | | | | | | | | | | | | | | | | | | | | | | | | | | |
| | | | | | | | |
Net asset value per unit at March 31, 2007 | | | | | $ | 101.03 | | | | | | $ | 104.33 | | | | | | $ | 90.06 | | | | | | | $ | 92.08 | |
| | | | | | | | | | | | | | | | | | | | | | | | | | | | | |
The accompanying notes are an integral part of these statements.
14
The Frontier Fund
Notes to Financial Statements
As of March 31, 2007 (Unaudited)
1. Organization
The Frontier Fund, which is referred to in this report as the Trust, was formed on August 8, 2003, as a Delaware statutory trust. The Trust is a multi-advisor commodity pool, as described in Commodity Futures Trading Commission, or CFTC, Regulation § 4.10(d)(2). The Trust has authority to issue separate series or a Series of units of beneficial interest, or the Units, in segregated pools of assets of the Trust, pursuant to the requirements of the Delaware Statutory Trust Act, as amended, or the Trust Act. The assets of each Series are segregated from the assets of other Series. The Trust is not registered as an investment company under the Investment Company Act of 1940, as amended. It is managed by its Managing Owner, Equinox Fund Management, LLC.
Purchasers of Units are limited owners of the Trust, or Limited Owners. The Trust Act provides that, except as otherwise provided in the amended and restated declaration of trust and trust agreement of the Trust dated as of August 8, 2003, by and among the Managing Owner, Wilmington Trust Company as trustee and the unitholders from time to time, or the Trust Agreement, unitholders in a Delaware statutory trust will have the same limitation of liability as do stockholders of private corporations organized under the General Corporation Law of the State of Delaware. The Trust Agreement confers substantially the same limited liability, and contains the same limited exceptions thereto, as would a limited partnership agreement for a Delaware limited partnership engaged in like transactions as the Trust. In addition, pursuant to the Trust Agreement, the Managing Owner of the Trust is liable for obligations of a Series in excess of that Series’ assets. Limited Owners do not have any such liability.
As of March 31, 2007, the Trust had nine separate Series of Units issued and outstanding: Balanced Series, Winton Series (formerly Beach Series, as described below), Campbell/Graham Series, Currency Series, Dunn Series, Graham Series, Long Only Commodity Series, Long/Short Commodity Series and the Managed Futures Index Series. The Units of each Series are separated into two sub-classes of Units, except the Balanced Series which has four sub-classes of Units.
On September 24, 2004, the Trust commenced operations for Balanced Series, Winton Series (formerly Beach Series, as described below), Currency Series and Dunn Series. The Graham Series commenced operations as of November 19, 2004. The Campbell/Graham Series commenced operations on February 11, 2005. On February 24, 2006, the Trust commenced operations for the Long Only Commodity, Long/Short Commodity and the Managed Futures Index Series. On May 1, 2006, two new classes of the Balanced Series commenced operations: Balanced Series 1a, and Balanced Series 2a.
The Continuous Offering Period of the Dunn Series was terminated by the Managing Owner in February 2006.
Effective as of April 13, 2006, (i) the Advisory Agreement dated as of March 1, 2004, by and among the Trust, Frontier Trading Company II LLC (the “Trading Company II”), the Managing Owner and Beach Capital Management Limited (“Beach”), which set forth the terms and conditions upon which Beach would render and implement trading advisory services on behalf of the Trading Company II and the Trust with respect to the Beach Series of the Trust and (ii) the Advisory Agreement dated as of March 1, 2004, by and among the Trust, Frontier Trading Company I LLC (the “Trading Company I”), the Managing Owner and Beach, which set forth the terms and conditions upon which Beach would render and implement trading advisory services on behalf of the Trading Company I and the Trust with respect to the assets of the Balanced Series of the Trust allocated to Beach (collectively, the “Agreements”) were terminated. The Agreements were terminated because Beach informed the Managing Owner that Beach had ceased trading pursuant to its Discretionary Program, which was the trading program Beach utilized in providing the trading advisory services under the Agreements.
As a result of the termination of the Agreements, the Trust ceased accepting new subscriptions for the Units in the Beach Series, and, effective April 1, 2006, the Trust ceased assessing all fees on the Beach Series. Upon termination of the Agreements, the Managing Owner delivered written notice to the existing investors in the Beach Series informing them of their exchange and redemption rights as disclosed in the Trust’s prospectus (the “Prospectus”). In addition, the assets of the Balanced Series which had previously been allocated to Beach were reallocated to one or more of the other trading advisors pursuant to the Managing Owner’s asset allocation discretion as disclosed in the Prospectus. On July 31, 2006, all remaining investor accounts in the Beach Series were redeemed.
15
In May 2006, Beach Series was renamed as Winton Series. For purposes of this report, Beach Series is referred to as Winton Series, regardless of whether the applicable time period referred to is prior or subsequent to the name change, unless explicitly set forth otherwise.
2. Significant Accounting Policies
Basis of Presentation
The interim financial statements of the Series included herein have been prepared in accordance with accounting principles generally accepted in the United States of America (“U.S.”) for interim financial information and Rule 10-01 of Regulation S-X. Accordingly, they do not include all the information and footnotes required by generally accepted accounting principles for complete financial statements. These financial statements are unaudited and should be read in conjunction with the audited financial statements and notes thereto included in the Trust’s Annual Report on Form 10-K for the year ended December 31, 2006. The Series follow the same accounting policies in the preparation of interim reports as set forth in the annual report. In the opinion of management, the financial statements reflect all adjustments, which are of a normal recurring nature, necessary for a fair presentation of the financial position, results of operation and changes in owners’ capital for the interim periods presented and are not necessarily indicative of a full year’s results. Certain prior year numbers have been reclassified to conform to current year presentation with no impact to the Statements of Financial Condition, Statements of Operations or the Statements of Changes in Owners’ Capital.
The Series, through investing in subsidiary limited liability trading company or companies (“Trading Company”), place assets under management of certain Trading Advisors. The Trading Companies were organized by the Managing Owner for the purpose of investing in securities and derivative instruments, and have no operating income or expenses, except for trading income and expenses, all of which is allocated to the Series. Trading Companies in which a Series has a majority equity interest are consolidated by such Series. Investments in Trading Companies in which a Series does not have a controlling or majority interest are accounted for under the equity method and are carried in the statement of financial condition of such Series at fair value based on the interest of each Series in such Trading Company.
The consolidated financial statements of Balanced Series include the assets, liabilities and earnings of its wholly-owned and majority owned Trading Companies, Frontier Trading Company I, LLC, Frontier Trading Company II, LLC, Frontier Trading Company IV, LLC and Frontier Trading Company VI, LLC.
The consolidated financial statements of Currency Series include the assets, liabilities and earnings of its majority-owned trading company, Frontier Trading Company III, LLC.
The consolidated financial statements of Campbell/Graham Series include the assets, liabilities and earnings of its majority-owned trading company, Frontier Trading Company V, LLC.
The consolidated financial statements of Long/Short Commodity Series include the assets, liabilities and earnings of its majority-owned trading company, Frontier Trading Company VII, LLC.
The consolidated financial statements of Long Only Commodity Series include the assets, liabilities and earnings of its wholly-owned trading company, Frontier Trading Company VIII, LLC.
The consolidated financial statements of Managed Futures Index Series include the assets, liabilities and earnings of its wholly-owned trading company, Frontier Trading Company IX, LLC.
The Trust has elected not to provide statements of cash flows as permitted by Statement of Financial Accounting Standards No. 102,Statements of Cash Flows – Exemption of Certain Enterprises and Classification of Cash Flows from Certain Securities Acquired for Resale.
Transactions are recorded on a trade date basis and all investments are recorded at fair value in the financial statements, with changes in fair value reported as a component of Realized and Unrealized Gain / (Loss) on
16
Investments in the Statements of Operations. Generally, fair values will be based on quoted market prices; however, in certain circumstances, significant judgments and estimates may be required in determining fair value in the absence of an active market closing price.
The Managing Owner may make judgments that can frequently require estimates about matters that are inherently uncertain. The Managing Owner provides a good faith estimate of the daily net asset value (“NAV”) for each Series based on such uncertain information. The Managing Owner’s good faith estimates of each Series’ NAV is published daily by the Trust and is used for subscriptions, redemptions and exchanges of all Trust Units, and such Unit transactions are final and not subject to subsequent adjustment unless the estimate of NAV varies from the actual NAV by more than one percent (1.0%) of the actual NAV as described within the Prospectus.
The Balanced Series, in order to make investments in the Campbell/Graham Series, Currency Series, Graham Series, Long Only Commodity Series, Long/Short Commodity Series and Managed Futures Index Series, advances funds to such Series for the purpose of investing in the respective Trading Company or Trading Companies for such Series on behalf of the Balanced Series. The amount of the funds advanced by the Balanced Series to each of the Campbell/Graham Series, Currency Series, Graham Series, Long Only Commodity Series, Long/Short Commodity Series and Managed Futures Index Series participates on apari passu basis with the Class 2 Units of such investee Series. The Balanced Series reflects the change in value of these investments as “Net change in inter-series receivables” in the Statement of Operations. The Balanced Series is subject to the same allocations of income and fees as the Limited Owners of such Series. As a result of fees charged by the investee Series, fees are not charged by the Balanced Series on the capital allocated to investments in affiliated Series, and the Managing Owner monitors such allocations so that aggregate fees of the investee Series on the Balanced Series investments do not exceed the allowable fees of the Balanced Series as provided in the Trust’s Prospectus.
3. Investments in Unconsolidated Trading Companies
The following table summarizes the Balanced Series, Winton Series, Campbell/Graham Series, Dunn Series and Graham Series investments in unconsolidated trading companies as of March 31, 2007, and December 31, 2006. These investments represent cash and open trade equity invested in the trading companies by the Series and cumulative trading profits or losses allocated to the Series by the trading companies. Trading companies allocate trading profits or losses on the basis of the proportion of each Series’ capital allocated for trading to each respective trading company, including both cash and notional funds, which bears no relationship to the amount of cash invested by the Series in the trading company.
| | | | | | | | | | | | | | |
| | | As of March 31, 2007 | | | As of December 31, 2006 | |
Trading Company | | Percentage of
Net Assets | | | Fair Value | | | Percentage of
Net Assets | | | Fair Value | |
Balanced Series - | | | | | | | | | | | | | | |
Frontier Trading Company VII, LLC | | 0.40 | % | | $ | 1,212,650 | | | 0.02 | % | | $ | 78,056 | |
| | | | | | | | | | | | | | |
Winton Series - | | | | | | | | | | | | | | |
Frontier Trading Company II, LLC | | 10.55 | % | | $ | 867,253 | | | 54.93 | % | | $ | 355,763 | |
| | | | | | | | | | | | | | |
Campbell/Graham Series | | | | | | | | | | | | | | |
Frontier Trading Company VI, LLC | | 48.20 | % | | $ | 30,301,035 | | | 70.82 | % | | $ | 50,785,796 | |
| | | | | | | | | | | | | | |
Dunn Series - | | | | | | | | | | | | | | |
Frontier Trading Company IV, LLC | | N/M | (1) | | ($ | 127,079 | ) | | N/M | (1) | | ($ | 120,051 | ) |
| | | | | | | | | | | | | | |
Graham Series - | | | | | | | | | | | | | | |
Frontier Trading Company V, LLC | | 40.29 | % | | $ | 2,636,458 | | | 89.87 | % | | $ | 7,226,062 | |
| | | | | | | | | | | | | | |
17
The following tables summarize the Balanced Series, Winton Series, Campbell/Graham Series, Dunn Series and Graham Series equity in earnings from trading companies for the three months ended March 31, 2007, and 2006.
| | | | | | | | | | | | | | | | | | | | | | | | | | | | | | | | |
| | | Three Months Ended March 31, 2007 | | | Three Months Ended March 31, 2006 | |
Trading Company | | Trading
Commissions | | | Realized Gain
(Loss) | | | Change in
Unrealized
Gain (Loss) | | | Net Income
(Loss) | | | Trading
Commissions | | | Realized
Loss | | | Change in
Unrealized
Gain (Loss) | | | Net Income
(Loss) | |
Balanced Series – | | | | | | | | | | | | | | | | | | | | | | | | | | | | | | | | |
Frontier Trading | | | | | | | | | | | | | | | | | | | | | | | | | | | | | | | | |
Company III, LLC | | | — | | | | — | | | | — | | | | — | | | | — | | | $ | 24,411 | | | ($ | 2,122 | ) | | $ | 22,289 | |
Frontier Trading | | | | | | | | | | | | | | | | | | | | | | | | | | | | | | | | |
Company VII, LLC | | ($ | 64,326 | ) | | $ | 312,936 | | | ($ | 1,362,373 | ) | | ($ | 1,113,763 | ) | | | — | | | | — | | | | — | | | | — | |
| | | | | | | | | | | | | | | | | | | | | | | | | | | | | | | | |
| | ($ | 64,326 | ) | | $ | 312,936 | | | ($ | 1,362,373 | ) | | ($ | 1,113,763 | ) | | | | | | $ | 24,411 | | | ($ | 2,122 | ) | | $ | 22,289 | |
| | | | | | | | | | | | | | | | | | | | | | | | | | | | | | | | |
Winton Series - | | | | | | | | | | | | | | | | | | | | | | | | | | | | | | | | |
Frontier Trading | | | | | | | | | | | | | | | | | | | | | | | | | | | | | | | | |
Company II, LLC | | ($ | 8,763 | ) | | ($ | 405,642 | ) | | ($ | 176,939 | ) | | ($ | 591,344 | ) | | ($ | 16,141 | ) | | $ | 657,431 | | | ($ | 275,412 | ) | | $ | 365,878 | |
| | | | | | | | | | | | | | | | | | | | | | | | | | | | | | | | |
Campbell/Graham Series - | | | | | | | | | | | | | | | | | | | | | | | | | | | | | | | | |
Frontier Trading | | | | | | | | | | | | | | | | | | | | | | | | | | | | | | | | |
Company VI, LLC | | ($ | 64,297 | ) | | ($ | 3,037,201 | ) | | ($ | 2,268,631 | ) | | ($ | 5,370,129 | ) | | ($ | 9,679 | ) | | ($ | 169,035 | ) | | $ | 1,143,158 | | | $ | 964,444 | |
| | | | | | | | | | | | | | | | | | | | | | | | | | | | | | | | |
Dunn Series - | | | | | | | | | | | | | | | | | | | | | | | | | | | | | | | | |
Frontier Trading | | | | | | | | | | | | | | | | | | | | | | | | | | | | | | | | |
Company IV, LLC | | ($ | 313 | ) | | ($ | 15,314 | ) | | ($ | 9,953 | ) | | ($ | 25,580 | ) | | ($ | 611 | ) | | ($ | 20,500 | ) | | $ | 19,161 | | | ($ | 1,950 | ) |
| | | | | | | | | | | | | | | | | | | | | | | | | | | | | | | | |
Graham Series - | | | | | | | | | | | | | | | | | | | | | | | | | | | | | | | | |
Frontier Trading | | | | | | | | | | | | | | | | | | | | | | | | | | | | | | | | |
Company V, LLC | | ($ | 14,904 | ) | | ($ | 311,330 | ) | | ($ | 313,477 | ) | | ($ | 639,711 | ) | | ($ | 16,411 | ) | | $ | 22,074 | | | $ | 181,894 | | | $ | 187,557 | |
| | | | | | | | | | | | | | | | | | | | | | | | | | | | | | | | |
The statements of financial condition as of March 31, 2007, and December 31, 2006, for the unconsolidated trading companies are as follows:
| | | | | | | | | | | | |
Statements of Financial Condition – March 31, 2007 | | Frontier Trading
Company II, LLC | | Frontier Trading
Company IV, LLC | | Frontier Trading
Company V, LLC | | Frontier Trading
Company VI, LLC |
Cash held at futures commodities merchants | | $ | 5,023,659 | | $ | 1,232,003 | | $ | 8,563,075 | | $ | 30,452,533 |
Open trade equity | | | 1,127,512 | | | 9,868 | | | 413,364 | | | 1,477,383 |
| | | | | | | | | | | | |
Total Assets | | $ | 6,151,171 | | $ | 1,241,871 | | $ | 8,976,439 | | $ | 31,929,916 |
| | | | | | | | | | | | |
Members’ equity | | $ | 6,151,171 | | $ | 1,241,871 | | $ | 8,976,439 | | $ | 31,929,916 |
| | | | | | | | | | | | |
18
| | | | | | | | | | | | |
Statements of Financial Condition – December 31, 2006 | | Frontier Trading
Company II, LLC | | Frontier Trading
Company IV, LLC | | Frontier Trading Company V, LLC | | Frontier Trading Company VI, LLC |
Cash held at futures commodities merchants | | $ | 8,005,590 | | $ | 1,317,262 | | $ | 7,017,995 | | $ | 7,141,914 |
Open trade equity | | | 205,126 | | | 749,610 | | | 673,194 | | | 1,981,825 |
| | | | | | | | | | | | |
Total Assets | | $ | 8,210,716 | | $ | 2,066,872 | | $ | 7,691,189 | | $ | 9,123,739 |
| | | | | | | | | | | | |
Members’ equity | | $ | 8,210,716 | | $ | 20,66,872 | | $ | 7,691,189 | | $ | 9,123,739 |
| | | | | | | | | | | | |
The statements of income for the three months ended March 31, 2007, for the unconsolidated trading companies are as follows:
| | | | | | | | | | | | | | | | |
Statements of Income – For the Three Months Ended March 31, 2007 | | Frontier Trading
Company II, LLC | | | Frontier Trading
Company IV, LLC | | | Frontier Trading
Company V, LLC | | | Frontier Trading
Company VI, LLC | |
Interest income | | $ | 112,330 | | | $ | 18,907 | | | $ | 171,853 | | | $ | 220,337 | |
Net realized gain (loss) on investments, less commissions | | | (2,391,621 | ) | | | (757,685 | ) | | | (2,598,985 | ) | | | (2,302,521 | ) |
Change in open trade equity | | | (295,481 | ) | | | (225,356 | ) | | | (1,163,058 | ) | | | (3,405,367 | ) |
| | | | | | | | | | | | | | | | |
Net income (loss) | | ($ | 2,574,772 | ) | | ($ | 964,134 | ) | | ($ | 3,590,190 | ) | | ($ | 5,487,551 | ) |
| | | | | | | | | | | | | | | | |
| | | | |
Statements of Income – For the Three Months Ended March 31, 2006 | | Frontier Trading
Company II, LLC | | | Frontier Trading
Company IV, LLC | | | Frontier Trading
Company V, LLC | | | Frontier Trading
Company VI, LLC | |
Interest income | | $ | 75,028 | | | $ | 20,951 | | | $ | 58,946 | | | $ | 84,923 | |
Net realized gain (loss) on investments, less commissions | | | 6,800,489 | | | | (624,317 | ) | | | 18,396 | | | | (543,359 | ) |
Change in open trade equity | | | (3,322,514 | ) | | | 561,726 | | | | 576,009 | | | | 3,203,833 | |
| | | | | | | | | | | | | | | | |
Net income (loss) | | $ | 3,553,003 | | | ($ | 41,640 | ) | | $ | 653,351 | | | $ | 2,745,397 | |
| | | | | | | | | | | | | | | | |
4. Transactions with Affiliates
Equinox Fund Management LLC contributes funds to the Trust in order to have a 1% interest in the aggregate capital, profits and losses of all Series and in return will receive units designated as general units in the Series in which the Managing Owner invests such funds. The general units may only be purchased by the Managing Owner and may be subject to no advisory fees or advisory fees at reduced rates. Otherwise, the general units hold the same rights as the limited units. The Managing Owner is required to maintain at least a 1% interest (“Minimum Purchase Commitment”) in the aggregate capital, profits and losses of all Series so long as it is acting as the Managing Owner of the Trust. Such contribution was made by the Managing Owner before trading commenced for the Trust and will be maintained throughout the existence of the Trust, and the Managing Owner will make such purchases as are necessary to effect this requirement. Additionally, during 2006, the Managing Owner agreed with certain regulatory bodies to maintain a 1% interest specifically in the Balanced Series Class 1a Units and Balanced Series Class 2a Units, aggregated, and each of the Long Only Commodity Series, Long/Short Commodity Series and Managed Futures Index Series. The 1% interest in these specific Series is included in computing the Minimum Purchase Commitment in aggregate capital. In addition to the General Units the Managing Owner receives in respect of its Minimum Purchase Commitment, the Managing Owner may purchase Limited Units in any Series as a Limited Owner. All Units purchased by the Managing Owner are held for investment purposes only and not for resale.
19
On March 29, 2007, the Managing Owner invested $30,000 in the Balanced Series, Class 2a, $100,000 in the Long Only Commodity Series, Class 2, $30,000 in the Long/Short Commodity Series, Class 2 and $410,000 in the Winton Series, Class 2. The Managing Owner may make purchases or redemptions at any time on the same terms as any Limited Owner.
On March 29, 2007, Richard E. Bornhoft, Chairman and Chief Investment Officer of the Managing Owner, exchanged $12,658 from the Dunn Series, Class 2 and $2,594 from the Graham Series, Class 2 for the same class of units in the Long Only Commodity Series. Mr. Bornhoft may make purchases or redemptions at any time on the same terms as any Limited Owner. No other principal of the Managing Owner or affiliates own any beneficial interest in the Trust but are allowed to do so.
The Balanced Series, in order to make investments in the Campbell/Graham Series, Currency Series, Graham Series, Long Only Commodity Series, Long/Short Commodity Series and Managed Futures Index Series, advances funds to such Series, for the purpose of investing in the respective Trading Company or Trading Companies for such Series on behalf of the Balanced Series. The Balanced Series and investee Series reflect the changes in values of these investments as “Net change in inter-series receivables/payables” in the Statement of Operations. The Balanced Series is subject to the same allocations of income and fees as the Limited Owners of such Series. As a result of fees charged by the investee Series, fees are not charged by the Balanced Series on the capital allocated to investments in affiliated Series, and the Managing Owner monitors such allocations so that aggregate fees of the investee Series on the Balanced Series investments do not exceed the allowable fees of the Balanced Series as provided in the Trust’s Prospectus.
The following table summarizes the Balanced Series advances to and reductions from other Series of the Trust as of March 31, 2007.
| | | | | | | | | | | | | | | | | | | | | | | |
| | | Three Months Ending March 31, 2007 |
Name of Series | | Amount of
Investment
January 1, 2007 | | Additions
During Period | | Reductions
During Period | | Amount of
Investment
March 31, 2007 | | | Earnings in Investments in
Inter-Series Receivables
Net P/L for the Period | | | Amount of Dividends
or Interest | | Value
March 31, 2007 |
Campbell/Graham Series | | $ | 26,972,529 | | $ | 0 | | $ | 26,646,729 | | $ | 325,800 | | | ($ | 325,800 | ) | | $ | 0 | | $ | 0 |
| | | | | | | |
Currency Series | | $ | 10,697,187 | | $ | 0 | | $ | 200,000 | | $ | 10,497,187 | | | ($ | 236,560 | ) | | $ | 0 | | $ | 10,260,627 |
| | | | | | | |
Graham Series | | $ | 12,012,370 | | $ | 0 | | $ | 12,088,510 | | ($ | 76,140 | ) | | $ | 76,140 | | | $ | 0 | | $ | 0 |
| | | | | | | |
Long Only Commodity Series | | $ | 5,522,034 | | $ | 25,000,000 | | $ | 2,300,000 | | $ | 28,222,034 | | | $ | 1,296,389 | | | $ | 0 | | $ | 29,518,423 |
| | | | | | | |
Managed Futures Index Series | | $ | 9,831,769 | | $ | 0 | | $ | 0 | | $ | 9,831,769 | | | ($ | 633,920 | ) | | $ | 0 | | $ | 9,197,849 |
| | | | | | | | | | | | | | | | | | | | | | | |
| | | | | | | | | | | $ | 48,800,650 | | | $ | 176,249 | | | $ | 0 | | $ | 48,976,899 |
| | | | | | | | | | | | | | | | | | | | | | | |
Each Series of Units pays to the Managing Owner a monthly management fee equal to a certain percentage of such Series’ assets, calculated on a daily basis. The annual rate of the management fee is 0.5% for the Balanced Series, 2.0% for the Winton Series, Currency Series, Long Only Commodity Series and the Managed Futures Index Series, 2.5% for the Graham Series and Campbell/Graham Series, and 3.5% for the Long/Short Commodity Series. There is no management fee for the Dunn Series. The Managing Owner may pay all or a portion of such management fees to the Trading Advisor(s) for such Series.
Each Series pays to the Managing Owner a monthly trading fee (FCM Fee) equal to 1/12th of 0.50% of such Series’ Net Asset Value, calculated daily.
Some Series pay to the Managing Owner an incentive fee of a certain percentage of new net trading profits generated by such Series, monthly or quarterly. Because the Balanced Series and Long/Short Commodity Series each employ multiple Trading Advisors, these Series will pay the Managing Owner a monthly incentive fee calculated on a Trading Advisor by Trading Advisor basis. It is therefore possible that in any given period the Balanced Series or the Long/Short Commodity Series may pay incentive fees to the Managing Owner for one or more Trading Advisors while each of these Series as a whole experiences losses. The incentive fee is 25% for the Balanced and Dunn Series and 20% for the Winton, Currency, Graham, Campbell/Graham Series and Long/Short Commodity Series. There is no incentive fee for the Long Only Commodity Series or the Managed Futures Index Series. The Managing Owner may pay all or a portion of such incentive fees to the Trading Advisor(s) for such Series.
20
In addition, with respect to Class 1 of each Series, the Series pays monthly to the Managing Owner a service fee at an annualized rate of up to 3.0% (2% for the Long Only Commodity Series and Managed Futures Index Series), which the Managing Owner pays to selling agents of the Trust.
The following table summarizes fees incurred to the Managing Owner for the three months ended March 31, 2007
| | | | | | | | | | | | |
Series: | | Management Fee | | Trading (FCM) Fee | | Incentive Fee | | Service Fee |
Balanced | | $ | 302,876 | | $ | 321,101 | | $ | 1,490,934 | | $ | 1,725,781 |
Winton | | | 14,961 | | | 3,738 | | | — | | | 19,692 |
Campbell/Graham | | | 310,749 | | | 92,866 | | | 33,094 | | | 364,229 |
Currency | | | 29,418 | | | 25,230 | | | — | | | 52,769 |
Dunn | | | — | | | 309 | | | — | | | 864 |
Graham | | | 73,055 | | | 14,272 | | | — | | | 40,078 |
Long Only Commodity | | | 43,506 | | | 17,296 | | | — | | | 22,247 |
Long/Short Commodity | | | 220,698 | | | 24,784 | | | 111,809 | | | 149,345 |
Managed Futures Index | | | 51,082 | | | 12,634 | | | — | | | 2,594 |
The following table summarizes fees payable to the Managing Owner as of March 31, 2007
| | | | | | | | | | | | |
Series: | | Management Fee | | Trading (FCM) Fee | | Incentive Fee | | Service Fee |
Balanced | | $ | 105,676 | | $ | 111,038 | | $ | — | | $ | 272,274 |
Winton | | | 8,278 | | | 2,073 | | | — | | | 1,635 |
Campbell/Graham | | | 107,841 | | | 28,317 | | | — | | | 60,080 |
Currency | | | 8,949 | | | 7,458 | | | — | | | 2,371 |
Dunn | | | — | | | — | | | — | | | 249 |
Graham | | | 15,851 | | | 3,170 | | | | | | 7,802 |
Long Only Commodity | | | 24,108 | | | 9,653 | | | — | | | 100 |
Long/Short Commodity | | | 65,374 | | | 9,339 | | | 33,828 | | | 5,125 |
Managed Futures Index | | | 16,395 | | | 4,099 | | | — | | | 121 |
With respect to the service fees, the initial service fee (for the first 12 months) relating to a sale of the Units is prepaid to the Managing Owner by each Series, and paid to the selling agents by the Managing Owner in the month following sale. Since the Managing Owner is prepaying the initial service fee for the first year and is being reimbursed therefore by the Series monthly in arrears based upon a corresponding percentage of net asset value, it bears the risk and the upside potential of any difference between the amount of the initial service fee prepaid and the amount of the reimbursement thereof as a result of variations in net asset value. For the three months ended March 31, 2007, due to variations in net asset values, amounts received or receivable from the Managing Owner for the difference in monthly service fees from the prepaid initial service fees was $2,701 for Balanced Series, $4,931 for Long Only Commodity Series and $264 for Managed Futures Index Series. For the three months ended March 31, 2007, amounts paid or owing the Managing Owner for excess of monthly service fees over prepaid initial service fees were $2,004 for Currency Series, $11 for Dunn Series, $1,164 fro Graham Series, $525 for Campbell/Graham Series, $18,178 for Long/Short Commodity Series and $4,836 for the Winton Series.
Aggregate interest income from all sources, including assets held at clearing brokers, up to 2% (annualized) is paid to the Managing Owner by the Balanced Series (Class 1 and Class 2 only), Winton Series, Campbell/Graham Series, Currency Series, Dunn Series and Graham Series. For the Balanced Series (Class 1a and Class 2a only), Long Only Commodity Series, Long/Short Commodity Series and Managed Futures Index Series, 20% of the total interest allocated to each Series is paid to the Managing Owner. During the three months ended March 31, 2007, the Trust paid $1,645,555 of such interest income to the Managing Owner.
The Managing Owner pays to The Bornhoft Group Corporation, an affiliate of the Trust, a monthly fee of 0.25% (annualized) of the net asset value of the Trust, for services in connection with the daily valuation of each Series and
21
Class. The amount paid under this agreement was $236,189 for the three months ended March 31, 2007. Additionally, The Bornhoft Group Corporation provides office space to the Managing Owner, prorates office expenses, and advances certain direct expenses on behalf of the Managing Owner. Under this agreement, the Managing Owner reimbursed The Bornhoft Group Corporation $57,478 for the three months ended March 31, 2007.
Solon Capital, LLC, an affiliate of the Trust, serves as wholesaler of the Trust by marketing to broker/dealer organizations. For these services, the Managing Owner paid Solon Capital, LLC, $708,567 for the three months ended March 31, 2007.
5. Off-Balance Sheet Risk
The term “off-balance sheet risk” refers to an unrecorded potential liability that, even though it does not appear on the balance sheet, may result in future obligation or loss. Each Trading Company trades in futures, forward and swap contracts and is therefore a party to financial instruments with elements of off-balance sheet market and credit risk. In entering into these contracts there exists a market risk that such contracts may be significantly influenced by market conditions, such as interest rate volatility, resulting in such contracts being less valuable. If the markets should move against all of the futures interests positions held by a Trading Company in respect of any Series at the same time, and if the Trading Advisor(s) of such Trading Company are unable to offset such futures interests positions, such Trading Company could lose all of its assets and the holders of Units of such Series would realize a 100% loss. The Managing Owner seeks to minimize market risk through real-time monitoring of open positions and the level of diversification of each Trading Advisor’s portfolio. It is anticipated that any Trading Advisor’s margin-to-equity ratio will typically not exceed approximately 35% although the actual ratio could be higher or lower from time to time.
In addition to market risk, trading futures, forward and swap contracts entails credit risk in that a counterparty will not be able to meet its obligations to a Trading Company. The counterparty for futures contracts traded in the U.S. and on most foreign exchanges is the clearinghouse associated with such exchange. In general, clearinghouses are backed by the corporate members of the clearinghouse who are required to share any financial burden resulting from the non-performance by one of their members and, as such, should significantly reduce this credit risk. In cases where the clearinghouse is not backed by the clearing members, like some foreign exchanges, it is normally backed by a consortium of banks or other financial institutions. Some non-U.S. exchanges, in contrast to U.S. exchanges are principals’ markets in which performance is the responsibility only of the individual counterparty with whom the Trading Company has entered into the transaction with and not of the exchange or clearing corporation. In these kinds of markets, there is risk of bankruptcy or other failure or refusal to perform by the counterparty.
In the case of forward contracts traded on the interbank market and swaps, neither is traded on an exchange. The counterparty is generally a single bank or other financial institution, rather than a group of financial institutions; thus there may be a greater counterparty credit risk. The Managing Owner expects the Trading Advisors to trade only with those counterparties which it believes to be creditworthy. All positions of each Trading Company are valued each day on a mark-to-market basis. There can be no assurance that any clearing member, clearinghouse or other counterparty will be able to meet its obligations to any Trading Company. SeeItem 2, Management’s Discussion And Analysis of Financial Condition and Results of Operations, Off-Balance Sheet Risk.
6. Subsequent Events
The Balanced Series withdrew $3,750,000 it had previously advanced to the Currency Series on April 11, 2007. The Balanced Series is subject to the same allocations of income and fees as the Limited Owners of the investee Series. As a result of fees charged by the investee Series, fees are not charged by the Balanced Series on the capital allocated to Series to Series investments, and the Managing Owner monitors such allocations so that aggregate fees of the investee Series on the Balanced Series investments do not exceed the allowable fees of the Balanced Series as provided in the Trust’s prospectus.
22
| Item 2. | MANAGEMENT’S DISCUSSION AND ANALYSIS OF FINANCIAL CONDITION AND RESULTS OF OPERATIONS |
Introduction
The following discussion and tables should be read in conjunction with our consolidated financial statements and notes thereto included in this quarterly report and our 2006 Annual Report on Form 10-K for the year ended December 31, 2006.
The Frontier Fund, or the Trust, is a Delaware statutory trust formed August 8, 2003. The Trust is a multi-advisor commodity pool, as described in CFTC Regulation § 4.10(d)(2). The Trust is authorized to issue multiple Series of Units in segregated pools of assets of the Trust, pursuant to the requirements of the Trust Act. The assets of each Series are segregated from the assets of other Series. The Trust is managed by the Managing Owner, and its term will expire on December 31, 2053 (unless terminated earlier in certain circumstances).
As of March 31, 2007, the Trust had nine separate and distinct Series of Units issued and outstanding: Balanced Series, Winton Series, Campbell/Graham Series, Currency Series, Dunn Series, Graham Series, Long Only Commodity Series, Long/Short Commodity Series and the Managed Futures Index Series. Each Series of Units, except for the Balanced Series have two separate sub-classes issued and outstanding—Class 1 and Class 2. The Balanced Series has four separate sub-classes of Units issued and outstanding—Class 1, Class 1a, Class 2 and Class 2a. The Trust, with respect to each Series:
| | • | | engages in the speculative trading of a diversified portfolio of futures, forward (including interbank foreign currencies) and options contracts and other derivative instruments and may, from time to time, engage in cash and spot transactions; |
| | • | | allocates funds to a subsidiary limited liability Trading Company or Companies. Each Trading Company has one-year renewable contracts with its own independent commodity trading advisor(s), or each, a Trading Advisor, that will manage all or a portion of such Trading Company’s assets, make the trading decisions for the assets of each Series vested in such Trading Company, segregate its assets from any other Trading Company and maintain separate, distinct records for each Series, and account for its assets separately from the other Series and the other Trust assets; |
| | • | | calculates the net assets, or the Net Asset Value, of its Units separately from the other Series; |
| | • | | has an investment objective of increasing the value of the Units over the long term (capital appreciation), while controlling risk and volatility, and to offer exposure to the investment programs of individual Trading Advisors and to specific instruments (currencies); and |
| | • | | aggregates all cash and equivalents for purposes of maximizing returns at an equal rate for all Series. |
The assets of any particular Series include only those funds and other assets that are paid to, held by or distributed to the Trust on account of and for the benefit of that Series. Under the “Inter-Series Limitation on Liability” expressly provided for under Section 3804(a) of the Trust Act, strict segregation of the cash and equivalents, though pooled for maximizing returns, is maintained in the books and records of each Series.
The Balanced Series, in order to make investments in the Campbell/Graham Series, Currency Series, Graham Series, Long Only Commodity Series, Long/Short Commodity Series and Managed Futures Index Series, advances funds to such Series, for the purpose of investing in the respective Trading Company or Trading Companies for such Series on behalf of the Balanced Series.
The Initial Offering Period for the Balanced Series, Winton Series, Currency Series and Dunn Series closed in September 2004. The Initial Offering Period for the Graham Series closed in November 2004. The Initial Offering Period for the Campbell/Graham Series closed in February 2005. The Initial Offering Period for the Long Only Commodity Series, Long/Short Commodity Series and the Managed Futures Index Series closed in February 2006. Currently, Units in the Balanced Series, Campbell/Graham Series, Currency Series, Graham Series, Long Only Commodity Series, Long/Short Commodity Series and the Managed Futures Index Series are being offered as of each day of each week and will continue to be offered until the maximum amount of each such Series’ Units which are registered are sold. The Managing Owner may terminate the Continuous Offering Period, as defined in the Prospectus, of any Series at any time.
23
The Continuous Offering Period of the Dunn Series was terminated by the Managing Owner in February 2006.
Effective as of April 13, 2006, (i) the Advisory Agreement dated as of March 1, 2004, by and among the Trust, Frontier Trading Company II LLC (the “Trading Company II”), the “Managing Owner and Beach Capital Management Limited (“Beach”), which set forth the terms and conditions upon which Beach would render and implement trading advisory services on behalf of the Trading Company II and the Trust with respect to the Beach Series of the Trust and (ii) the Advisory Agreement dated as of March 1, 2004, by and among the Trust, Frontier Trading Company I LLC (the “Trading Company I”), the Managing Owner and Beach, which set forth the terms and conditions upon which Beach would render and implement trading advisory services on behalf of the Trading Company I and the Trust with respect to the assets of the Balanced Series of the Trust allocated to Beach (collectively, the “Agreements”) were terminated. The Agreements were terminated because Beach informed the Managing Owner that Beach had ceased trading pursuant to its Discretionary Program, which was the trading program Beach utilized in providing the trading advisory services under the Agreements.
As a result of the termination of the Agreements, the Trust ceased accepting new subscriptions for the Units in the Beach Series, and the Trust ceased assessing all fees on the Beach Series. Upon termination of the Agreements, the Managing Owner delivered written notice to the existing investors in the Beach Series informing them of their exchange and redemption rights as disclosed in the Trust’s prospectus (the “Prospectus”). In addition, the assets of the Balanced Series which had previously been allocated to Beach were reallocated to one or more of the other trading advisors pursuant to the Managing Owner’s asset allocation discretion as disclosed in the Prospectus. On July 31, 2006, all remaining investor accounts in the Beach Series were redeemed.
On January 26, 2007, the Trust filed a registration statement on Form S-1 (File No. 333-140240), which was declared effective on February 12, 2006. The Trust registered a total of 2,200,000 Units in such registration statement, including 1,000,000 Units in Balanced Series (Class 2), 1,000,000 Units in Long/Short Commodity Series (Class 1) and 200,000 Units in Long/Short Commodity Series (Class 2).
Liquidity and Capital Resources
The Trust will raise additional capital only through the sale of Units offered pursuant to the continuing offering, and does not intend to raise any capital through borrowing. Due to the nature of the Trust’s business, it makes no capital expenditures and has no capital assets which are not operating capital or assets.
The Managing Owner is responsible for the payment of all of the ordinary expenses associated with the organization of the Trust and the offering of each Series of Units, except for the initial and ongoing service fee, if any, and no Series will be required to reimburse these expenses. As a result, 100% of each Series’ offering proceeds are initially available for that Series’ trading activities.
A portion of each Trading Company’s assets is used as margin to maintain that Trading Company’s forward currency contract positions, and another portion is deposited in cash in segregated accounts in the name of each Trading Company maintained for each Trading Company at the futures commodity merchants in accordance with CFTC segregation requirements. At March 31, 2007, cash deposited at the clearing brokers was $53,550,187 for the Balanced Series, $8,563,075 for the Campbell/Graham Series, $2,414,780 for the Currency Series, $2,841,426 for the Long/Short Commodity Series, $4,785,663 for the Long Only Commodity Series and $1,344,756 for the Managed Futures Index Series. The clearing brokers are expected to credit each Trading Company with approximately 80%-100% of the interest earned on its average net assets on deposit with the clearing brokers each week. In an attempt to increase interest income earned, the Managing Owner also may invest the non-margin assets in U.S. government securities which include any security issued or guaranteed as to principal or interest by the U.S., or by a person controlled by or supervised by and acting as an instrumentality of the government of the U.S. pursuant to authority granted by Congress of the U.S. or any certificate of deposit for any of the foregoing, including U.S. treasury bonds, U.S. treasury bills and issues of agencies of the U.S. government, and certain cash items such as money market funds, certificates of deposit (under nine months) and time deposits. Aggregate interest income from all sources, including assets held at clearing brokers, up to 2% (annualized) is paid to the Managing Owner by the Balanced Series (Class 1 and Class 2 only), Winton Series, Campbell/Graham Series, Currency Series, Dunn
24
Series and Graham Series. For the Balanced Series (Class 1a and Class 2a only), Long Only Commodity Series, Long/Short Commodity Series and Managed Futures Index Series, 20% of the total interest allocated to each Series is paid to the Managing Owner.
Approximately 10% to 20% of the Trust’s assets are expected to be committed as required margin for futures contracts and forward and options trading and held by the respective broker, although the amount committed may vary significantly. Such assets are maintained in the form of cash or U.S. Treasury bills in segregated accounts with the futures broker pursuant to the Commodity Exchange Act and regulations thereunder. Approximately 2% to 6% of the Trust’s assets are expected to be deposited with over-the-counter counterparties in order to initiate and maintain forward and swap contracts. Such assets are not held in segregation or otherwise regulated under the Commodity Exchange Act, unless such over-the-counter counterparty is registered as a futures commission merchant. These assets may be held either in U.S. government securities or short-term time deposits with U.S.-regulated bank affiliates of the over-the-counter counterparties. The remaining approximately 74% to 88% of the Trust’s assets will normally be invested in cash equivalents and short term investments, such as money market funds, certificates of deposit (under nine months) and time deposits and held by the futures commodity merchants, the over-the-counter counterparties and by U.S. Federally chartered banks. As of March 31, 2007, such cash equivalents and short term investments included time deposits at Merrill Lynch Bank USA, and money market funds held at Merrill Lynch Investment Managers. Including cash held at US Bank, total cash and cash equivalents and short term investments held at these institutions were $193,784,781 for the Balanced Series, $8,428,134 for the Winton Series, $23,788,859 for the Campbell/Graham Series, $15,576,591 for the Currency Series, $431,725 for the Dunn Series, $4,375,376 for the Graham Series, $31,265,632 for the Long Only Commodity Series, $20,889,912 for the Long/Short Commodity Series and $8,425,225 for the Managed Futures Index Series.
25
Results of Operations
Three Months Ended March 31, 2007 Compared to Three Months Ended March 31, 2006
Market Conditions for Three Months Ended March 31, 2007
January 2007
Interest Rates
U.S. interest rate futures continued to slide in January and reached five-month lows by the end of the month. Strong economic data roiled the markets, extending a bearish move that began early in December. Although European interest rate futures also fell, data hinted at weaker-than-expected economic conditions and the possibility that the European Central Bank may act later rather than sooner in any additional rate increases. The result was that European futures at the short end of the curve declined more slowly than their American counterparts.
Currencies
The U.S. Dollar started the month strongly, but then fell into a narrow trading range for the remainder of January. The British Pound gained 0.3%, the Japanese Yen was down 1.3%, and the Euro decreased 1.3% against the U.S. Dollar. The Canadian Dollar fell by 1.0% against the U.S. Dollar and gained 0.3% against the Euro.
Stock Indices
Stock markets continued the upward trend that began last June. The S&P 500 finished the month up 1.4% and the NASDAQ Composite was higher by 2%. The blue-chip Dow Jones Industrial Index continued to set new all-time highs during January, culminating with an intraday high of 12,657.0 and finishing the month up 1.3% at 12,621.7. In Europe, futures on the German DAX finished the month up just over 3% while French CAC-40 futures were up 0.6%. Japanese Nikkei 225 futures finished the month higher by nearly 1%.
Energy
The petroleum markets went into a tailspin the first half of the month and finished lower despite a sharp recovery in the second half of January. After being down nearly 18% in the middle of the month, crude oil finished the month lower by 6.8% at $58.14. Heating oil was little changed, but gasoline blendstock lost 6.5%. Colder weather swept though much of the U.S., driving natural gas futures higher by 17.9%.
Metals
After a three-day rout to begin the month, April gold recovered and finished January at $657.90/oz, up 2.1%. March silver behaved similarly, up 4.9% by the end of the month. March copper fell by 7.7% in the first trading session before spending the rest of the month in a trading range, finishing lower by 9.6%.
Commodities
A bullish government report drove corn to lock limit up on the Friday before the long Martin Luther King weekend, but that was nearly all the bulls could muster and the market meandered downward for the rest of the month to finish with a gain of only 3.5%. Wheat was unaffected and finished the month down 6.7%. Sugar broke out of a three-month trading range and began another leg down, finishing the month lower by 9.8%.
February 2007
Interest Rates
Longer-term U.S. interest rate futures reversed course and moved haltingly upward through most of February. Everything changed on February 27th, as a sharp world-wide stock market decline drove futures strongly higher. A flight-to-quality and fears of an oncoming U.S. recession on that day combined to create an explosive move upward in shorter-term rate futures, further inverting the U.S. yield curve. Although European interest rate futures spent most of the month in a trading range, the events of the 27th affected markets around the world, including Europe, and futures of all maturities moved up in concert with the American markets.
Currencies
The U.S. Dollar moved steadily downward against most major currencies in February, with the sole exception being the British Pound, which was only slightly lower. The Japanese Yen was up 1.8% and the Euro increased 1.5% against the U.S. Dollar. The Canadian Dollar climbed 0.6% against the U.S Dollar and fell 0.9% against the Euro.
26
Stock Indices
The big story of the month was the world-wide stock sell-off on February 27th. After what appeared to be another up month in most of the global stock markets, the Chinese market sold off sharply amongst fears the government would move to curb rampant speculation. The near-panic selling continued in the European markets and then crossed the pond to the U.S. markets, with the Dow Jones Industrial Average finishing the day down 3.3% and the month off by 2.8%. The S&P 500 finished the month down 2.2% and the NASDAQ Composite was lower by 1.9%. In Europe, futures on the German DAX fell more than 5% on the 27th and finished the month down 1.8% while French CAC-40 futures were down 2.1%. Japanese Nikkei 225 futures finished the month higher by 0.4%.
Energy
With the exception of gasoline, the energy markets were relatively quiet in February, with crude oil finishing the month higher by 5% at $61.79/bbl. Heating oil was up 5.6%, but natural gas fell by 4.6%. Gasoline blendstock gained 10.7% with a powerful late-month upward thrust.
Metals
After moving upward throughout the month, April gold fell along with inflation expectations on February 27th and finished February at $672.50/oz, up 2.2%. May silver behaved similarly, up 3.9% by the end of the month. May copper reversed its three-month long downtrend, gaining 5.7% during February.
Commodities
Soybeans led the grains complex with a mid-month rise of nearly 10%, but then fell back to finish the month up 7.2%. Orange juice shook off the sharp drop of the month before and climbed steadily to a positive 9.1% performance.
March 2007
Interest Rates
While short-term U.S. interest rate futures remained range-bound and volatile throughout the month, the longer-term contracts reversed course and headed downward in March. European rate futures fell precipitously in the second half of the month, signaling an expectation of higher rates to come.
Currencies
The U.S. Dollar continued to fall in March, finishing down 0.8% as measured by the U.S. Dollar Index (a benchmark that measures the dollar’s value against a basket of foreign currencies). The Japanese Yen was up 0.6% and the Euro increased nearly 1% against the U.S. Dollar. The Canadian Dollar climbed 1.4% against the U.S. Dollar and 0.4% against the Euro.
Stock Indices
After testing the March 5th lows in the middle of the month, most of the world’s stock markets took off to the upside and recovered a significant portion of the heavy losses that were incurred in late February and early March. The S&P 500 finished the month up 1% and the NASDAQ Composite was higher by 0.2%. European markets were particularly strong, with futures on the German DAX finishing 2.7% while French CAC-40 futures climbed 2.1%. The Japanese Nikkei 225 finished the month slightly down.
Energy
After a lackluster first half of March, the energy complex rallied strongly on fears of increased Middle East instability when Iran took prisoner fifteen British sailors and Marines. Crude oil finished the month higher by 4.5% at $65.87/bbl. Heating oil was up 5.7% and gasoline blendstock continued an upward trend, gaining 9.0% by the end of March. While remaining range-bound, natural gas also went up, finishing the month higher by 4.4%.
Metals
June gold took a pounding along with stocks in the first few trading sessions of the month, but then recovered to finish down 1.4% at $669/oz. May silver fell even harder, down more than 10% early in the month and finishing March lower by 5.5%. Copper continued to streak upward, with the May contract up 14.3% at the end of the month.
27
Commodities
After moving steadily lower through the month, corn was hit hard and locked limit down in the last trading session of March to finish down 14%. Wheat moved down in sympathy, but soybeans remained range-bound and finished the month off 3.3%. In response to the housing slowdown in the U.S., lumber continued trending downward, losing 8% by the end of the month.
Balanced Series
2007
The Balanced Series – Class 1 Net Asset Value lost 6.3% for the three months ended March 31, 2007, net of fees and expenses; the Balanced Series – Class 1a Net Asset Value lost 6.4% for the three months ended March 31, 2007, net of fees and expenses; the Balanced Series – Class 2 Net Asset Value lost 5.6% for the three months ended March 31, 2007, net of fees and expenses; the Balanced Series – Class 2a Net Asset Value lost 5.7% for the three months ended March 31, 2007, net of fees and expenses.
For the three months ended March 31, 2007, the Balanced Series recorded net loss on investments of $21,852,053, net interest of $1,721,854, and total expenses of $3,840,692, resulting in a net decrease in Owners’ capital from operations of $17,983,838 after minority interests of $5,987,053. The Net Asset Value per Unit, Class 1, decreased from $106.66 at December 31, 2006, to $99.93 at March 31, 2007. For Class 1a, the Net Asset Value per Unit decreased from $95.97 at December 31, 2006, to $89.85 at March 31, 2007. The Net Asset Value per Unit, Class 2, decreased from $114.24 at December 31, 2006, to $107.84 at March 31, 2007. For Class 2a, the Net Asset Value per Unit decreased from $97.88 at December 31, 2006, to $92.26 at March 31, 2007. Total Class 1 subscriptions and redemptions for the three months were $18,470,547 and $7,863,599, respectively. Total Class 1a subscriptions and redemptions for the three month period were $1,198,422 and $347,304, respectively. Total Class 2 subscriptions and redemptions for the three months were $4,076,749 and $1,436,719, respectively. Total Class 2a subscriptions and redemptions for the three month period were $463,000 and $0, respectively. Ending capital at March 31, 2007, was $220,458,981 for Class 1, $4,752,263 for Class 1a, $48,301,155 for Class 2 and $1,101,831 for Class 2a. At December 31, 2006, ending capital was $224,559,900 for Class 1, $4,203,865 for Class 1a, $48,581,401 for Class 2 and $661,806 for Class 2a.
The Balanced Series may have both long and short exposure to the Interest Rates, Currencies, Stock Indices, Energies, Metals, and Commodities sectors. See comments above underMarket Conditions for Three Months Ended March 31, 2007,for additional information.
Sector Attribution for the Balanced Series
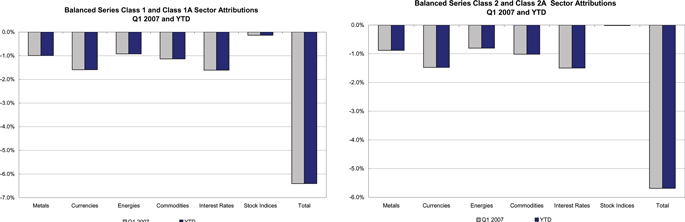
28
2006
The Balanced Series – Class 1 Net Asset Value gained 4.0% for the three months ended March 31, 2006, net of fees and expenses; the Balanced Series – Class 2 Net Asset Value gained 4.8% for the three months ended March 31, 2006, net of fees and expenses.
For the three months ended March 31, 2006, the Balanced Series recorded net gain on investments of $10,351,495, net interest of $762,497, and total expenses of $3,177,102, resulting in a net increase in Owners’ capital from operations of $6,608,518 after minority interests of $1,328,372. The Net Asset Value per Unit, Class 1, increased from $104.58 at December 31, 2005, to $108.81 at March 31, 2006. For Class 2, the Net Asset Value per Unit increased from $108.73 at December 31, 2005, to $113.96 at March 31, 2006. Total Class 1 subscriptions and redemptions for the three months were $33,935,272 and $2,567,558, respectively. Total Class 2 subscriptions and redemptions for the three month period were $7,031,574 and $309,083, respectively. Ending capital at March 31, 2006, was $151,541,245 for Class 1 and $29,123,706 for Class 2. At December 31, 2005, ending capital was $114,741,316 for Class 1 and $21,224,912 for Class 2.
Strong January and March performances outweighed February losses to give investors a positive first quarter of 2006. Metals continued to be the most profitable sector, followed by interest rates and stock indices. Copper continued to extend the uptrend that began November 2001, while the gold market took a breather and traded in a range of approximately $540 to $580 during the quarter. Worldwide bond prices continued to slide, and European and Japanese equity markets rallied, giving traders plenty of opportunity to profit.
Winton Series (Formerly the Beach Series)
2007
The Winton Series – Class 1 Net Asset Value lost 9.7% for the three months ended March 31, 2007, net of fees and expenses; the Winton Series – Class 2 Net Asset Value lost 9.1% for the three months ended March 31, 2007, net of fees and expenses.
For the three months ended March 31, 2007, the Winton Series recorded net loss on investments of $591,344, net interest of $24,323, and total expenses of $37,381, resulting in a net decrease in Owners’ capital from operations of $604,402. The Net Asset Value per Unit, Class 1, decreased from $105.65 at December 31, 2006, to $95.37 as of March 31, 2007. The Net Asset Value per Unit, Class 2, decreased from $106.81 at December 31, 2006, to $97.14 as of March 31, 2007. Total Class 1 subscriptions for the three months were $6,597,846 and redemptions were $6,000. Total Class 2 subscriptions and redemptions for the three month period were $1,628,036, and $43,326, respectively. Ending capital at March 31, 2007, was $6,436,414 for Class 1 and $1,783,385 for Class 2. Ending capital at December 31, 2006, was $356,924 for Class 1 and $290,721 for Class 2.
The Winton Series may have both long and short exposure to the Interest Rates, Currencies, Stock Indices, Energies, Metals, and Commodities sectors. See comments above underMarket Conditions for Three Months Ended March 31, 2007,for additional information.
29
Sector Attribution for the Winton Series
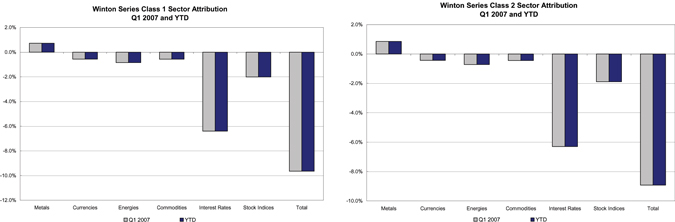
2006
On March 31, 2006, Beach Capital Management Ltd. (“Beach”) ceased trading its Discretionary Program, which was the trading program used by the Beach Series. David Beach made a decision to engage in other pursuits. Therefore, Beach is no longer engaged in trading for the Beach Series. The Beach Series was renamed the Winton Series in May 2006.
The Beach Series – Class 1 Net Asset Value gained 11.3% for the three months ended March 31, 2006, net of fees and expenses; the Beach Series – Class 2 Net Asset Value gained 12.1% for the three months ended March 31, 2006, net of fees and expenses.
For the three months ended March 31, 2006, the Beach Series recorded net gain on investments of $365,878, net interest of $13,494, and total expenses of $101,743, resulting in a net increase in Owners’ capital from operations of $277,629. The Net Asset Value per Unit, Class 1, increased from $111.93 at December 31, 2005, to $124.55 as of March 31, 2006. The Net Asset Value per Unit, Class 2, increased from $116.27 at December 31, 2005, to $130.33 as of March 31, 2006. Total Class 1 subscriptions for the three months were $730,201, and redemptions were $125,297. Total Class 2 subscriptions and redemptions for the three month period were $30,200, and $54,913, respectively. Ending capital at March 31, 2006, was $2,906,724 for Class 1 and $176,649 for Class 2. Ending capital at December 31, 2005, was $2,047,247 for Class 1 and $178,306 for Class 2.
January saw a positive start for the Beach Series. The upward trends in both the precious and base metals continued from the last quarter and the portfolio was well positioned to take advantage of these moves; making metals the best performing sector of the month. Currencies remain difficult to trade and after ending 2005, with a 12.6% rise, the U.S. Dollar index declined sharply in January. Market participants remained highly sensitive to relative economic data and the prospects for shifts in interest rate differentials, central bank policy and leadership changes and global political developments. Global equity markets continued to perform well with North American stock indices amongst the strongest performers. Energy had a mixed month with crude oil moving higher but natural gas fell sharply on the month. Sugar climbed to a 25 year high in January as Brazil, the world’s largest producer of cane sugar, diverted roughly 50% of cane to the production of ethanol on the back of high energy prices.
Some of the trends consolidated in February. While in Europe the stock indices continued to perform well, Japan was a slightly different story with the Topix and Nikkei indices falling nearly 3% on the month. The U.S. markets also ended the month in negative territory. The interest rate sector had a positive month as global interest rates continued to rise in February. The largest percentage yield increase took place in Japan where 2-year Japanese Government Bond’s went from 0.3% to 0.475% on the back of the Cabinet Office upgrading its economic assessment, characterizing the recovery as under way and broadening. The U.S. Dollar performed well, erasing most of its January decline. The Japanese Yen was the only major currency to appreciate versus the U.S. Dollar. A combination of warmer than normal temperatures and a continued restoration of hurricane damaged refining and distribution capacity saw a fall in energy prices. Both base, with the exception of zinc, and precious metals fell in February, giving back some of the gains of last month. Sugar, one of the best performing commodities this year, also gave back some of its recent gains.
30
Campbell Graham Series
2007
The Campbell/Graham Series – Class 1 Net Asset Value lost 9.4% for the three months ended March 31, 2007, net of fees and expenses; the Campbell/Graham Series – Class 2 Net Asset Value lost 8.7% for the three months ended March 31, 2007, net of fees and expenses.
For the three months ended March 31, 2007, the Campbell/Graham Series recorded net loss on investments of $5,684,040, net interest of $437,970, and total expenses of $800,938, resulting in a net decrease in Owners’ capital from operations of $5,407,297 after minority interests of $639,711. The Net Asset Value per Unit, Class 1, decreased from $96.27 at December 31, 2006, to $87.26 as of March 31, 2007. The Net Asset Value per Unit, Class 2, decreased from $101.86 at December 31, 2006, to $93.02 as of March 31, 2007. Total Class 1 subscriptions for the three months ended March 31, 2007, were $4,348,954 and redemptions were $1,355,482. Total Class 2 subscriptions and redemptions for the three months ended March 31, 2007, were $316,813, and $213,058, respectively. Ending capital at December 31, 2006, was $48,843,314 for Class 1 and $7,350,167 for Class 2.
The Campbell/Graham Series may have both long and short exposure to the Interest Rates, Currencies, Stock Indices, Energies, Metals, and Commodities sectors. See comments above underMarket Conditions for Three Months Ended March 31, 2007,for additional information.
Sector Attribution for the Campbell/Graham Series
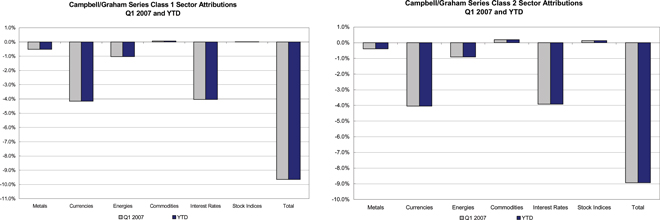
2006
The Campbell/Graham Series – Class 1 Net Asset Value gained 2.8% for the three months ended March 31, 2006, net of fees and expenses; the Campbell/Graham Series – Class 2 Net Asset Value gained 3.5% for the three months ended March 31, 2006, net of fees and expenses.
For the three months ended March 31, 2006, the Campbell/Graham Series recorded net gain on investments of $1,558,848, net interest of $152,870, and total expenses of $577,662, resulting in a net increase in Owners’ capital from operations of $940,199 after minority interests of $193,857. The Net Asset Value per Unit, Class 1, increased from $94.30 at December 31, 2005, to $96.90 as of March 31, 2006. The Net Asset Value per Unit, Class 2, increased from $96.83 at December 31, 2005, to $100.23 as of March 31, 2006. Total Class 1 subscriptions for the three months ended March 31, 2006, were $9,315,996, and redemptions were $286,238. Total Class 2 subscriptions and redemptions for the three months ended March 31, 2006, were $982,789, and $52,771, respectively. Ending capital at December 31, 2005, was $21,561,490 for Class 1 and $2,846,556 for Class 2.
2006 began on a positive note, as good performance in the energy and stock index sectors in January was the primary driver in a profitable month. The U.S. Dollar experienced significant volatility during the month and
31
moved sharply lower versus the major European currencies. The global bond markets also experienced short-term price volatility, as global bond prices declined sharply amid ongoing inflationary concerns. Global equity prices, however, continued to rally, as European and Japanese equity indices continued to trend higher despite significant mid-month price volatility resulting from a broad sell-off in Japan, a flurry of weak earnings reports, and higher energy prices.
Performance was negative in February, although returns remained slightly positive overall for 2006. Prices for crude oil and natural gas fell sharply in February as inventory build-ups weighed on the market in the midst of one of the mildest winters on record in the northeastern U.S. concern over geopolitical tensions also eased somewhat. While this brought welcome relief at the gas pumps, the trend reversal caused energy sector performance to suffer. Ben Bernanke’s first official appearances as Chairman of the U.S. Federal Reserve (the “Fed”) and the reintroduction of the U.S. 30 year bond were digested by the bond markets, as interest rate sector performance was slightly positive. February was a volatile month for U.S. equities, but European stocks enjoyed another strong month, and contributed solid gains to the portfolio. February’s returns highlighted the downside of trading in energy, which is one of the most volatile market sectors.
Strong performance from several sectors contributed to a strong March and a solid finish to the first quarter. The biggest gains in March were in the interest rate sector, as U.S. and European fixed income instruments had their worst quarter in several years, which benefited short futures positions. Energy prices rebounded profitably from February’s sell-off on renewed production and supply concerns, but this was not enough to restrain equity prices, and the equity indices sector also finished higher. Many of the base and precious metals again made new highs, and contributed positively to our returns.
Currency Series
2007
The Currency Series – Class 1 Net Asset Value lost 3.0% for the three months ended March 31, 2007, net of fees and expenses; the Currency Series – Class 2 Net Asset Value lost 2.3% for the three months ended March 31, 2007, net of fees and expenses.
For the three months ended March 31, 2007, the Currency Series recorded net loss on investments of $245,566, net interest of $126,578, and total expenses of $105,717, resulting in a net decrease in Owners’ capital from operations of $224,705. The Net Asset Value per Unit, Class 1, decreased from $101.16 at December 31, 2006, to $98.14 as of March 31, 2007. The Net Asset Value per Unit, Class 2, decreased from $108.23 at December 31, 2006, to $105.79 as of March 31, 2007. Total Class 1 subscriptions and redemptions for the three months ending March 31, 2007, were $500,047, and $64,052, respectively. Total Class 2 subscriptions and redemptions for the three months ending March 31, 2007, were $36,500 and $15,981, respectively. Ending capital at March 31, 2007, was $7,114,985 for Class 1 and $503,451 for Class 2. Ending capital at December 31, 2006, was $6,891,891 for Class 1 and $494,736 for Class 2.
The Currency Series may have both long and short exposure to the Currencies sector only. See comments above underMarket Conditions for Three Months Ended March 31, 2007,for additional information.
Because all returns are from the Currencies sector, there are no Sector Attribution charts for the Currency Series.
2006
The Currency Series – Class 1 Net Asset Value gained 0.6% for the three months ended March 31, 2006, net of fees and expenses; the C-View Currency Series – Class 2 Net Asset Value gained 1.3% for the three months ended March 31, 2006, net of fees and expenses.
For the three months ended March 31, 2006, the Currency Series recorded net gain on investments of $71,315, net interest of $43,423, and total expenses of $54,921, resulting in a net increase in Owners’ capital from operations of $37,528, after minority interests of ($22,289). The Net Asset Value per Unit, Class 1, increased from $97.66 at
32
December 31, 2005, to $98.23 as of March 31, 2006. The Net Asset Value per Unit, Class 2, increased from $101.42 at December 31, 2005, to $102.77 as of March 31, 2006. Total Class 1 subscriptions and redemptions for the three months ending March 31, 2006, were $2,867,033, and $0, respectively. Total Class 2 subscriptions and redemptions for the three months ending March 31, 2006, were $28,000 and $1,000,000, respectively. Ending capital at March 31, 2006, was $3,153,712 for Class 1 and $1,121,525 for Class 2. Ending capital at December 31, 2005, was $276,762 for Class 1 and $2,065,914 for Class 2.
The New Year saw a resurgence of old themes as the market moved once more in the direction of yield hunting, and interest rate differentials continued to dominate even short term trading within the foreign exchange markets. Traders remained preoccupied with the path of the Fed’s interest rate policy with the dollar experiencing a sizeable drop in the first few days of the year as the Fed minutes from December suggested that they were closer to the end of the tightening cycle. The U.S. unit weakened further towards the middle of the month to a four month low against the Euro on the further belief that the European Central Bank would tighten to combat inflationary pressures. Overall the signals from U.S. economic output remained mixed, and the surprising strength shown in fourth quarter of new home sales reversed the U.S. Dollar fortunes by prompting a strong dollar rally. Asian currencies continued to display resilience and gave up little ground despite U.S. Dollar strength elsewhere, and the Brazilian Real continued to attract buying interest as the appetite for yield continued.
Reversing its January weakness, the U.S. Dollar showed strength in the first half of February and held onto its gains, with the dollar index finishing the month up nearly 1.3%. The Euro was down approximately 2% against the U.S. Dollar, while the British pound fell by 1.4% and the Swiss Franc lost 2.6% during the month. The Japanese Yen rallied against the U.S. Dollar, gaining 1.2%. The Canadian Dollar gained nearly 2.2% against the Euro but lost 1% against the Yen.
Currency trading was more difficult in March, with the U.S. Dollar characterized by high volatility and little directional movement throughout the month. The Euro was up 1.7% during the month, the British Pound fell by 0.9%, and the Swiss Franc gained 0.6% against the U.S. Dollar. The Japanese Yen lost 1.7% against the U.S. Dollar in a volatile, range-bound month. The Canadian Dollar had a more difficult time of it, losing 2.7% against the U.S. Dollar and 4.3% against the Euro.
Dunn Series
2007
The Dunn Series – Class 1 Net Asset Value lost 18.8% for the three months ended March 31, 2007, net of fees and expenses; the Dunn Series – Class 2 Net Asset Value lost 18.2% for the three months ended March 31, 2007, net of fees and expenses.
For the three months ended March 31, 2007, the Dunn Series recorded net loss on investments of $25,580, net interest of $820, and total expenses of $1,173, resulting in a net decrease in Owners’ capital from operations of $25,933. The Net Asset Value per Unit, Class 1, decreased from $76.91 at December 31, 2006, to $62.44 as of March 31, 2007. The Net Asset Value per Unit, Class 2, decreased from $82.27 at December 31, 2006, to $67.30 as of March 31, 2007. There were no Class 1 subscriptions for the three months. Total Class 1 redemptions were $11,825 for the three month period. There were no Class 2 subscriptions for the three month period ending March 31, 2007. Class 2 redemptions were $21,124 for the three month period. Ending Capital at March 31, 2007, was $88,827 for Class 1 and $4,225 for Class 2. Ending capital at December 31, 2006, was $123,164 for Class 1 and $28,770 for Class 2.
The Dunn Series may have both long and short exposure to the Interest Rates, Currencies, Stock Indices, Energies, Metals, and Commodities sectors. See comments above underMarket Conditions for Three Months Ended March 31, 2007,for additional information.
33
Sector Attribution for the Dunn Series
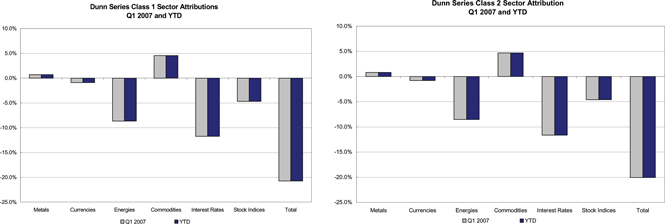
2006
The Dunn Series – Class 1 Net Asset Value lost 0.8% for the three months ended March 31, 2006, net of fees and expenses; the Dunn Series – Class 2 Net Asset Value lost 0.1% for the three months ended March 31, 2006, net of fees and expenses.
For the three months ended March 31, 2006, the Dunn Series recorded net loss on investments of $1,950, net interest of $1,589, and total expenses of $1,704, resulting in a net decrease in Owners’ capital from operations of $2,065. The Net Asset Value per Unit, Class 1, decreased from $86.83 at December 31, 2005, to $86.11 as of March 31, 2006. The Net Asset Value per Unit, Class 2, decreased from $90.15 at December 31, 2005, to $90.07 as of March 31, 2006. There were no Class 1 subscriptions for the three months. Total Class 2 redemptions were $3,845 for the three month period. There were no Class 2 subscriptions or redemptions for the three month period ending March 31, 2006. Ending Capital at March 31, 2006, was $187,644 for Class 1 and $135,887 for Class 2. Ending capital at December 31, 2005, was $193,425 for Class 1 and $136,016 for Class 2.
Dunn Series performance was negative in January. The strength in global bond markets subsided in January as economic strength and a resurgence in energy prices dampened demand for fixed income investments. Concern about instability in Nigeria and the escalation of nuclear tension in Iran drove energy prices higher in January. The Fed raised its Fed Funds rate to 4.5% at Chairman Alan Greenspan’s last Fed meeting. Subtle changes in its accompanying statement after the rate hike suggest that the Fed may not be finished raising rates, but will likely be reactive going forward.
Dunn Series performance was negative again in February. Global fixed income prices continued to move lower during February benefiting predominately short fixed income positions. Several Fed Governors cited continued strength in the U.S. economy, suggesting that the Fed will continue its tightening bias, with the goal of preemptively suppressing even the intimation of inflation. Short U.S Dollar positions suffered from expectations that still higher U.S. interest rates would strengthen the U.S. Dollar against most currencies.
Excellent performance in the interest rate sector in March led Dunn Series gains in March, as Central Bank interest rate increases were the driving force for fixed income markets. The European Central Bank, Bank of Canada, Swiss National Bank, Norges Bank (Norway) and the Fed all raised their respective overnight rates 25 basis points in March. Also, the Bank of Japan (BOJ) officially ended its quantitative easing program which has been in place since March of 2001. Since that time, the BOJ has altered its basic monetary approach by targeting the base of money supply instead of short term interest rates. Although this does not necessarily imply there will be higher interest rates in Japan, it removes a significant obstacle in the path toward them.
Graham Series
2007
The Graham Series – Class 1 Net Asset Value lost 10.6% for the three months ended March 31, 2007, net of fees and expenses; the Graham Series – Class 2 Net Asset Value lost 9.9% for the three months ended March 31, 2007, net of fees and expenses.
34
For the three months ended March 31, 2007, the Graham Series recorded net loss on investments of $715,851, net interest of $65,381, and total expenses of $127,405, resulting in a net decrease in Owners’ capital from operations of $777,875. The Net Asset Value per Unit, Class 1, decreased from $84.70 at December 31, 2006, to $75.73 as of March 31, 2007. The Net Asset Value per Unit, Class 2, decreased from $90.25 at December 31, 2006, to $81.29 as of March 31, 2007. Total Class 1 subscriptions and redemptions for the three months were $97,572 and $768,017, respectively. There were no Class 2 subscriptions for the three months ended March 31, 2007. Class 2 redemptions were $49,291 for the three month period. Ending capital at March 31, 2007, was $4,743,880 for Class 1 and $1,799,341 for Class 2. Ending capital at December 31, 2006, was $5,991,337 for Class 1 and $2,049,495 for Class 2.
The Graham Series may have both long and short exposure to the Interest Rates, Currencies, Stock Indices, Energies, Metals, and Commodities sectors. See comments above underMarket Conditions for Three Months Ended March 31, 2007,for additional information.
Sector Attribution for the Graham Series
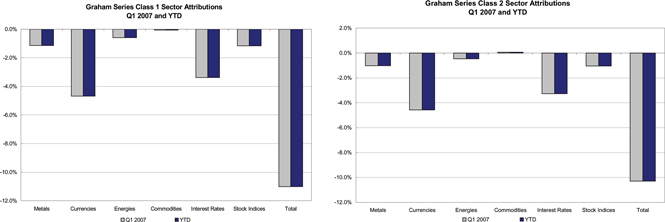
2006
The Graham Series – Class 1 Net Asset Value gained 1.4% for the three months ended March 31, 2006, net of fees and expenses; the Graham Series – Class 2 Net Asset Value gained 2.1% for the three months ended March 31, 2006, net of fees and expenses.
For the three months ended March 31, 2006, the Graham Series recorded net gain on investments of $187,557, net interest of $39,720, and total expenses of $98,097, resulting in a net increase in Owners’ capital from operations of $129,180. The Net Asset Value per Unit, Class 1, increased from $82.90 at December 31, 2005, to $84.05 as of March 31, 2006. The Net Asset Value per Unit, Class 2, increased from $85.73 at December 31, 2005, to $87.56 as of March 31, 2006. Total Class 1 subscriptions and redemptions for the three months were $697,281 and $220,923, respectively. Total Class 2 subscriptions and redemptions for the three months were $25,000 and $38,182, respectively. Ending capital at March 31, 2006, was $6,210,174 for Class 1 and $1,796,866 for Class 2. Ending capital at December 31, 2005, was $5,642,080 for Class 1 and $1,772,604 for Class 2.
2006 began on a positive note, as the Graham Series recorded gains during the month of January. The U.S. Dollar experienced significant volatility during the month and moved sharply lower versus the major European currencies. The U.S. Dollar fell to a 4-month low versus the Euro amid continuing speculation concerning the direction of interest rates in the U.S. The global bond markets also experienced short-term price volatility, as global bond prices declined sharply amid ongoing inflationary concerns. The decline in prices led to rising yields, as the German Bund and U.S. 10-Year Treasury note yields advanced 15 basis points and 12 basis points, respectively, during the month. Global equity prices continued to rally, as European and Japanese equity indices continued to trend higher despite significant mid-month price volatility resulting from a broad sell-off in Japan, a flurry of weak earnings reports, and
35
higher energy prices. Commodities prices, particularly those in the energy and metals sectors, continued to rally amid lingering supply concerns linked to severe weather disruptions, labor unrest, and renewed inflationary fears. Most notably, copper and zinc posted record highs, gold rallied to a 25-year high, and coffee and sugar prices rose 10% and 23%, respectively.
In February, global bond markets experienced short-term volatility as prices were marginally lower amid ongoing speculation concerning global interest rates. The modest decline in prices led to higher yields, as the Japanese 10-Year Government bond and U.S. 10-Year Treasury note yield advanced 7 basis points and 5 basis points, respectively, during the month. European equity indices continued to rally following the release of better-than-expected earnings reports, while Japanese equity indices generally declined amid speculation that the BOJ may soon shift away from a long standing policy of extreme accommodation. Major equity indices in the U.S. were mixed as questions remain concerning the direction of U.S. interest rates. The U.S. Dollar experienced significant volatility during the month amid continuing uncertainty with respect to U.S. interest rates. Ultimately, the U.S. Dollar rebounded from last month’s 4-month low to finish February at a 7-week high versus the euro. Energy prices declined sharply amid unseasonably warm weather in the U.S. and reports of ample inventories for the remainder of the winter season. Metals prices experienced significant volatility amid concerns that the bullish trends experienced in January may ultimately translate to increased supplies.
The first quarter of 2006 was positive for the Graham Series as strong gains in the interest rate sector led to a profitable March. Major global bond markets finished the month significantly lower amid ongoing speculation concerning higher global interest rates following the 15th consecutive rate increase by the U.S. Federal Open Market Committee (“FOMC”). The decline in global bond prices resulted in higher yields throughout Europe, Japan and the U.S. Major global equity indices in the U.S. and Europe finished the month higher as equity prices rallied following the release of positive economic data in the U.S. In Japan, the Nikkei index surged more than 5% amid renewed optimism concerning the pace of Japanese economic growth. The U.S. Dollar experienced significant volatility and moved in a trading range versus major global currencies amid lingering concerns regarding higher global interest rates. The U.S. Dollar finished the month gaining 1% to 2% versus the Japanese Yen and the British Sterling, while declining versus the Euro and the Swiss Franc. Energy prices finished the month higher amid weather-related concerns, declining inventories and continuing geopolitical unrest in the Middle East. Precious metals prices generally rallied as the price of gold approached $600 an ounce. Base metals also continued to rally as the price of zinc and copper again posted record highs, rising 13% and 11.5%, respectively.
Long Only Commodity Series
2007
The Long Only Commodity Series – Class 1 Net Asset Value gained 3.6% for the three months ended March 31, 2007, net of fees and expenses; the Long Only Commodity Series – Class 2 Net Asset Value gained 4.1% for the three months ended March 31, 2007, net of fees and expenses.
For the three months ended March 31, 2007, the Long Only Commodity Series recorded net gain on investments of $134,462, net interest of $131,455, and total expenses of $83,049, resulting in a net increase in Owners’ capital from operations of $182,868. The Net Asset Value per Unit, Class 1, increased from $95.45 at December 31, 2006 to $98.87 as of March 31, 2007. The Net Asset Value per Unit, Class 2, increased from $97.13 at December 31, 2006, to $101.11 as of March 31, 2007. Total Class 1 subscriptions and redemptions for the three months were $486,168 and $330,626, respectively. Total Class 2 subscriptions and redemptions for the three months were $121,253 and $13,225, respectively. Ending capital at March 31, 2007, was $4,655,030 for Class 1 and $228,273 for Class 2. Ending capital at December 31, 2006, was $4,321,464 for Class 1 and $115,401 for Class 2.
The Long Only Commodity Series may have long-only exposure in the Energies, Metals, and Commodities sectors. See comments above underMarket Conditions for Three Months Ended March 31, 2007,for additional information.
The Long Only Commodity Series invests approximately equally in the Jefferies Commodity Performance Index and the Reuters/Jefferies CRB Index. There are no Sector Attribution charts for the Long Only Commodity Series.
36
2006
The Long Only Commodity Series commenced operations on February 24, 2006. The Long Only Commodity Series – Class 1 Net Asset Value gained 3.8% from the start of operations through March 31, 2006, net of fees and expenses; the Long Only Commodity Series – Class 2 Net Asset Value gained 4.1% from the start of operations through March 31, 2006, net of fees and expenses.
For the three months ended March 31, 2006, the Long Only Commodity Series recorded net loss on investments of $8,762, net interest of $16,356, and total expenses of $7,304, resulting in a net increase in Owners’ capital from operations of $290. The Net Asset Value per Unit, Class 1, increased from $100.00 at the beginning of operations to $103.82 as of March 31, 2006. The Net Asset Value per Unit, Class 2, increased from $100.00 at the beginning of operations to $104.08 as of March 31, 2006. Total Class 1 subscriptions and redemptions for the three months were $114,439 and $0, respectively. Total Class 2 subscriptions and redemptions for the three months were $51,000 and $0, respectively. Ending capital at March 31, 2006, was $114,688 for Class 1 and $51,041 for Class 2.
Both the Jefferies RJ-CRB and JCPI indices were up strongly in March, leading to a positive month and first quarter for the Long-Only Series.
Long/Short Commodity Series
2007
The Long/Short Commodity Series – Class 1 Net Asset Value gained 0.6% for the three months ended March 31, 2007, net of fees and expenses; the Long/Short Commodity Series – Class 2 Net Asset Value gained 1.4% for the three months ended March 31, 2007, net of fees and expenses.
For the three months ended March 31, 2007, the Long/Short Commodity Series recorded net loss on investments of $645,884, net interest of $212,997, and total expenses of $506,636, resulting in a net increase in Owners’ capital from operations of $174,240 after minority interests of $1,113,763. The Net Asset Value per Unit, Class 1, increased from $100.42 at December 31, 2006, to $101.03 as of March 31, 2007. The Net Asset Value per Unit, Class 2, increased from $102.93 at December 31, 2006, to $104.33 as of March 31, 2007. Total Class 1 subscriptions and redemptions for the three months were $3,774,775 and $678,841, respectively. Total Class 2 subscriptions and redemptions for the three months were $89,700 and $43,213, respectively. Ending capital at March 31, 2007, was $22,712,398 for Class 1 and $2,780,340 for Class 2. Ending capital at December 31, 2006, was $19,478,595 for Class 1 and $2,697,482 for Class 2.
The Long/Short Commodity Series may have both long and short exposure to the Interest Rates, Currencies, Stock Indices, Energies, Metals, and Commodities sectors, although the majority of the exposure will typically be in the Energies, Metals, and Commodities sectors. See comments above underMarket Conditions for Three Months Ended March 31, 2007,for additional information.
37
Sector Attribution for the Long/Short Commodity Series
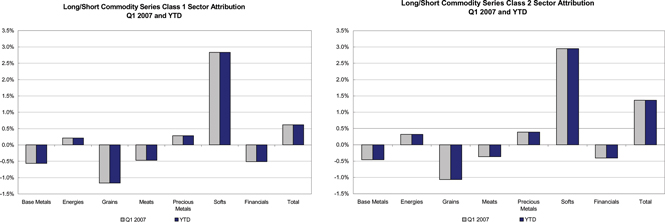
2006
The Long/Short Commodity Series commenced operations on February 24, 2006. The Long/Short Commodity Series – Class 1 Net Asset Value gained 0.9% from the start of operations through March 31, 2006, net of fees and expenses; the Long/Short Commodity Series – Class 2 Net Asset Value gained 1.2% from the start of operations through March 31, 2006, net of fees and expenses.
For the three months ended March 31, 2006, the Long/Short Commodity Series recorded net gain on investments of $38,394, net interest of $26,350, and total expenses of $56,997, resulting in a net increase in Owners’ capital from operations of $7,747. The Net Asset Value per Unit, Class 1, increased from $100.00 at the beginning of operations to $100.94 as of March 31, 2006. The Net Asset Value per Unit, Class 2, increased from $100.00 at the beginning of operations to $101.20 as of March 31, 2006. Total Class 1 subscriptions and redemptions for the three months were $824,796 and $0, respectively. Total Class 2 subscriptions and redemptions for the three months were $66,000 and $0, respectively. Ending capital at March 31, 2006, was $832,215 for Class 1 and $66,328 for Class 2.
The energy and commodities sectors led the way in March as the Long-Short Commodity Series got off to a strong start.
Managed Futures Index Series
2007
The Managed Futures Index Series – Class 1 Net Asset Value lost 6.9% for the three months ended March 31, 2007, net of fees and expenses; the Managed Futures Index Series – Class 2 Net Asset Value lost 6.5% for the three months ended March 31, 2007, net of fees and expenses.
For the three months ended September 30, 2006, the Managed Futures Index Series recorded a net loss on investments of $69,408, net interest of $95,406, and total expenses of $66,310, resulting in a net decrease in Owners’ capital from operations of $40,312. The Net Asset Value per Unit, Class 1, decreased from $96.75 at December 31, 2006, to $90.06 as of March 31, 2007. The Net Asset Value per Unit, Class 2, decreased from $98.43 at December 31, 2006, to $92.08 as of March 31, 2007. Total Class 1 subscriptions and redemptions for the three months were $150,788 and $63,312, respectively. There were no Class 2 subscriptions or redemptions for the three months ended March 31, 2007. Ending capital at March 31, 2007, was $550,629 for Class 1 and $49,264 for Class 2. Ending capital at December 31, 2006, was $500,070 for Class 1 and $52,659 for Class 2.
The Managed Futures Index Series may have both long and short exposure to the Interest Rates, Currencies, Stock Indices, Energies, Metals, and Commodities sectors. See comments above underMarket Conditions for Three Months Ended March 31, 2007,for additional information.
38
Sector Attribution for the Managed Futures Index Series
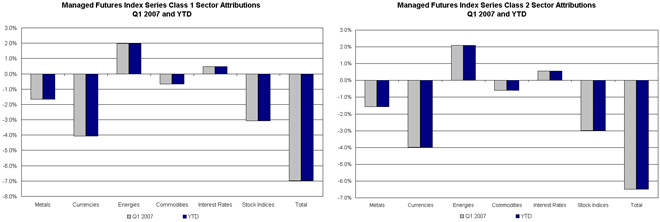
2006
The Managed Futures Index Series commenced operations on February 24, 2006. The Managed Futures Index Series – Class 1 Net Asset Value lost 0.1% from the start of operations through March 31, 2006, net of fees and expenses; the Managed Futures Index Series – Class 2 Net Asset Value gained 0.1% from the start of operations through March 31, 2006, net of fees and expenses.
For the three months ended March 31, 2006, the Managed Futures Index Series recorded a net loss on investments of $492, net interest of $1,907, and total expenses of $1,428, resulting in a net decrease in Owners’ capital from operations of $13. The Net Asset Value per Unit, Class 1, decreased from $100.00 at the beginning of operations to $99.89 as of March 31, 2006. The Net Asset Value per Unit, Class 2, increased from $100.00 at the beginning of operations to $100.11 as of March 31, 2006. Total Class 1 subscriptions and redemptions for the three months were $26,200 and $0, respectively. Total Class 2 subscriptions and redemptions for the three months were $51,000 and $0, respectively. Ending capital at March 31, 2006, was $26,186 for Class 1 and $51,001 for Class 2.
Trading activity in the Managed Futures Index Series did not begin until April 2006.
Critical Accounting Policies and Estimates
The preparation of financial statements in conformity with accounting principles generally accepted in the U.S. requires the Managing Owner to adopt accounting policies and make estimates and assumptions that affect amounts reported in the Trust’s financial statements. The Trust’s critical accounting policies and related estimates and judgments underlying the financial statements are as identified below.
Investment Transactions and Valuation—The Trust records investment transactions on a trade date basis and all investments are recorded at fair value in its financial statements, with changes in fair value reported as a component of Trading Profits (Losses) and unrealized equity in earnings on investments in affiliated Series in the Statements of Operations. Generally, fair values are based on quoted market prices; however, in certain circumstances, significant judgments and estimates may be required in determining fair value in the absence of an active market closing price.
Allocation of Trading Profits or Losses—Each Series of the Trust offers two sub-classes of Units – Class 1 and Class 2. All classes have identical voting, dividend, liquidation and other rights and the same terms and conditions, except that Class 1 Units of each Series bear certain expenses related to the servicing of such Units. Revenues, expenses (other than expenses attributable to a specific class), and realized and unrealized trading profits and losses of each Series are allocated daily to Class 1 and Class 2 Units based on each Class’ relative owners’ capital balance.
39
Each Series allocates funds to a subsidiary Trading Company, or Trading Companies, of the Trust. Each Trading Company allocates all of its daily trading profits or losses to the Series in proportion to each Series’ funds allocated to the Trading Company, adjusted on a daily basis. As of March 31, 2007, the value of all open contracts and cash held at clearing brokers is similarly allocated to the Series in proportion to each Series’ funds allocated to the Trading Company, or Companies.
Interest Income—Interest income from all sources, including assets held at clearing brokers and cash and cash equivalents held at banks, is aggregated and allocated across all Series in proportion to their daily NAV.
In applying these policies, the Managing Owner may make judgments that can frequently require estimates about matters that are inherently uncertain.
Off-Balance Sheet Risk
The term “off-balance sheet risk” refers to an unrecorded potential liability that, even though it does not appear on the balance sheet, may result in future obligation or loss. Each Trading Company trades in futures, forward and swap contracts and is therefore a party to financial instruments with elements of off-balance sheet market and credit risk. In entering into these contracts there exists a market risk that such contracts may be significantly influenced by market conditions, such as interest rate volatility, resulting in such contracts being less valuable. If the markets should move against all of the futures interests positions held by a Trading Company in respect of any Series at the same time, and if the Trading Advisor(s) of such Trading Company are unable to offset such futures interests positions, such Trading Company could lose all of its assets and the holders of Units of such Series would realize a 100% loss. The Managing Owner seeks to minimize market risk through real-time monitoring of open positions and the level of diversification of each Trading Advisor’s portfolio. It is anticipated that any Trading Advisor’s margin-to-equity ratio will typically not exceed approximately 35% although the actual ratio could be higher or lower from time to time.
In addition to market risk, trading futures, forward and swap contracts entails credit risk in that a counterparty will not be able to meet its obligations to a Trading Company. The counterparty for futures contracts traded in the U.S. and on most foreign exchanges is the clearinghouse associated with such exchange. In general, clearinghouses are backed by the corporate members of the clearinghouse who are required to share any financial burden resulting from the non-performance by one of their members and, as such, should significantly reduce this credit risk. In cases where the clearinghouse is not backed by the clearing members, like some foreign exchanges, it is normally backed by a consortium of banks or other financial institutions. Some non-U.S. exchanges, in contrast to U.S. exchanges are principals’ markets in which performance is the responsibility only of the individual counterparty with whom the Trading Company has entered into the transaction with and not of the exchange or clearing corporation. In these kinds of markets, there is risk of bankruptcy or other failure or refusal to perform by the counterparty.
In the case of forward contracts traded on the interbank market and swaps, neither are traded on exchanges. The counterparty is generally a single bank or other financial institution, rather than a group of financial institutions; thus there may be a greater counterparty credit risk. The Managing Owner expects the Trading Advisors to trade only with those counterparties which it believes to be creditworthy. All positions of each Trading Company are valued each day on a mark-to-market basis. There can be no assurance that any clearing member, clearinghouse or other counterparty will be able to meet its obligations to any Trading Company. See Part I, Item 1, Notes to Financial Statements as of March 31, 2007, Off-Balance Sheet Risk.
| ITEM 3. | QUANTITATIVE AND QUALITATIVE DISCLOSURES ABOUT MARKET RISK |
The Series are speculative commodity pools. The market sensitive instruments which are held by the Trading Companies in which the Series are invested are acquired for speculative trading purposes, and all or a substantial amount of the Series’ assets are subject to the risk of trading loss. Unlike an operating company, the risk of market sensitive instruments is integral, not incidental, to the Series’ main line of business.
Market movements result in frequent changes in the fair market value of each Trading Company’s open positions and, consequently, in each Series of the Trust’s earnings and cash flow. The Trading Companies’ and consequently the Series’ market risk is influenced by a wide variety of factors, including the level and volatility of exchange rates, interest rates, equity price levels, the market value of financial instruments and contracts, the diversification effects among the open positions and the liquidity of the markets in which trades are made.
40
Each Trading Company rapidly acquires and liquidates both long and short positions in a wide range of different markets. Consequently, it is not possible to predict how a particular future market scenario will affect performance, and the past performance for any Series is not necessarily indicative of the future results of such Series.
The Trading Companies’ and consequently the Series’ primary market risk exposures as well as the strategies used and to be used by the Trading Advisors for managing such exposures are subject to numerous uncertainties, contingencies and risks, any one of which could cause the actual results of the Trust’s and the Managing Owner’s risk controls to differ materially from the objectives of such strategies. Government interventions, defaults and expropriations, illiquid markets, the emergence of dominant fundamental factors, political upheavals, changes in historical price relationships, an influx of new market participants, increased regulation and many other factors could result in material losses as well as in material changes to the risk exposures and the risk management strategies of the Trading Companies and consequently the Trust. There can be no assurance that the Trading Companies’ current market exposure and/or risk management strategies will not change materially or that any such strategies will be effective in either the short- or long-term. Investors must be prepared to lose all or substantially all of their investment in a Series.
Quantitative Market Risk
Trading Risk
The Series’ approximate risk exposure in the various market sectors traded by its trading advisors is quantified below in terms of value at risk. Due to the Series’ mark-to-market accounting, any loss in the fair value of the Series’ (through the Trading Companies) open positions is directly reflected in the Series’ earnings, realized or unrealized.
Exchange maintenance margin requirements have been used by the Trust as the measure of its value at risk. Maintenance margin requirements are set by exchanges to equal or exceed the maximum losses reasonably expected to be incurred in the fair value of any given contract in 95% to 99% of any one-day interval. The maintenance margin levels are established by brokers, dealers and exchanges using historical price studies as well as an assessment of current market volatility and economic fundamentals to provide a probabilistic estimate of the maximum expected near-term one-day price fluctuation. Maintenance margin has been used rather than the more generally available initial margin, because initial margin includes a credit risk component that is not relevant to value at risk.
In the case of market sensitive instruments that are not exchange-traded, including currencies and some energy products and metals, the margin requirements for the equivalent futures positions have been used as value at risk. In those cases in which a futures-equivalent margin is not available, dealers’ margins have been used.
In the case of contracts denominated in foreign currencies, the value at risk figures include foreign currency margin amounts converted into U.S. Dollars with an incremental adjustment to reflect the exchange rate risk inherent to the Series, which is valued in U.S. Dollars, in expressing value at risk in a functional currency other than U.S. Dollars.
In quantifying each Series’ value at risk, 100% positive correlation in the different positions held in each market risk category has been assumed. Consequently, the margin requirements applicable to the open contracts have simply been aggregated to determine each trading category’s aggregate value at risk. The diversification effects resulting from the fact that the Series’ positions held through the Trading Companies are rarely, if ever, 100% positively correlated have not been reflected.
Value at Risk by Market Sectors
The following table presents the trading value at risk associated with the each Series’ exposure to open positions (as held by the Trading Companies) by market sector as of March 31, 2007. All open position trading risk exposures of the Series have been included in calculating the figures set forth below.
41
Balanced Series: (1)
| | | | | | |
MARKET SECTOR | | VALUE AT RISK | | % OF TOTAL
CAPITALIZATION | |
Interest Rates | | $ | 8,201,737 | | 3.0 | % |
| | |
Currencies | | $ | 9,523,585 | | 3.5 | % |
| | |
Stocks / Stock Indices | | $ | 10,350,384 | | 3.8 | % |
| | |
Metals | | $ | 3,223,179 | | 1.2 | % |
| | |
Agriculturals/Softs | | $ | 5,443,784 | | 2.0 | % |
| | |
Energy | | $ | 1,083,763 | | 0.4 | % |
| | |
Total: | | $ | 37,826,432 | | 13.9 | % |
Winton Series:
| | | | | | |
MARKET SECTOR | | VALUE AT RISK | | % OF TOTAL
CAPITALIZATION | |
Interest Rates | | $ | 113,040 | | 1.4 | % |
| | |
Currencies | | $ | 93,699 | | 1.1 | % |
| | |
Stocks / Stock Indices | | $ | 225,165 | | 2.7 | % |
| | |
Metals | | $ | 41,751 | | 0.5 | % |
| | |
Agriculturals/Softs | | $ | 66,626 | | 0.8 | % |
| | |
Energy | | $ | 17,738 | | 0.2 | % |
| | |
Total: | | $ | 558,019 | | 6.7 | % |
42
Currency Series:
| | | | | | |
MARKET SECTOR | �� | VALUE AT RISK | | % OF TOTAL
CAPITALIZATION | |
Interest Rates | | $ | 0 | | 0 | % |
| | |
Currencies | | $ | 1,386,483 | | 7.8 | % |
| | |
Stocks / Stock Indices | | $ | 0 | | 0 | % |
| | |
Metals | | $ | 0 | | 0 | % |
| | |
Agriculturals/Softs | | $ | 0 | | 0 | % |
| | |
Energy | | $ | 0 | | 0 | % |
| | |
Total: | | $ | 1,386,483 | | 7.8 | % |
Dunn Series:
| | | | | | |
MARKET SECTOR | | VALUE AT RISK | | % OF TOTAL
CAPITALIZATION | |
Interest Rates | | $ | 8,181 | | 8.8 | % |
| | |
Currencies | | $ | 3,049 | | 3.3 | % |
| | |
Stocks / Stock Indices | | $ | 2,319 | | 2.5 | % |
| | |
Metals | | $ | 906 | | 1.0 | % |
| | |
Agriculturals/Softs | | $ | 4,320 | | 4.6 | % |
| | |
Energy | | $ | 2,280 | | 2.5 | % |
| | |
Total: | | $ | 21,055 | | 22.7 | % |
Graham Series:
| | | | | | |
MARKET SECTOR | | VALUE AT RISK | | % OF TOTAL
CAPITALIZATION | |
Interest Rates | | $ | 128,761 | | 2.0 | % |
| | |
Currencies | | $ | 927,313 | | 14.2 | % |
| | |
Stocks / Stock Indices | | $ | 29,957 | | 0.5 | % |
| | |
Metals | | $ | 5,948 | | 0.1 | % |
| | |
Agriculturals/Softs | | $ | 15,485 | | 0.2 | % |
| | |
Energy | | $ | 33,588 | | 0.5 | % |
| | |
Total: | | $ | 1,141,052 | | 17.5 | % |
43
Campbell/Graham Series:
| | | | | | |
MARKET SECTOR | | VALUE AT RISK | | % OF TOTAL
CAPITALIZATION | |
Interest Rates | | $ | 712,706 | | 1.3 | % |
| | |
Currencies | | $ | 4,550,802 | | 8.4 | % |
| | |
Stocks / Stock Indices | | $ | 605,617 | | 1.1 | % |
| | |
Metals | | $ | 109,029 | | 0.2 | % |
| | |
Agriculturals/Softs | | $ | 51,251 | | 0.1 | % |
| | |
Energy | | $ | 144,762 | | 0.3 | % |
| | |
Total: | | $ | 6,174,167 | | 11.4 | % |
Long Only Commodity Series:
| | | | | | |
MARKET SECTOR | | VALUE AT RISK | | % OF TOTAL
CAPITALIZATION | |
Interest Rates | | $ | 0 | | 0.0 | % |
| | |
Currencies | | $ | 0 | | 0.0 | % |
| | |
Stocks / Stock Indices | | $ | 0 | | 0.0 | % |
| | |
Metals | | $ | 1,148,553 | | 3.3 | % |
| | |
Agriculturals/Softs | | $ | 1,627,116 | | 4.7 | % |
| | |
Energy | | $ | 2,009,967 | | 5.8 | % |
| | |
Total: | | $ | 4,785,636 | | 13.9 | % |
Long/Short Commodity Series:
| | | | | | |
MARKET SECTOR | | VALUE AT RISK | | % OF TOTAL
CAPITALIZATION | |
Interest Rates | | $ | 2,059 | | 0.0 | % |
| | |
Currencies | | $ | 53,173 | | 0.2 | % |
| | |
Stocks / Stock Indices | | $ | 22,057 | | 0.1 | % |
| | |
Metals | | $ | 155,594 | | 0.6 | % |
| | |
Agriculturals/Softs | | $ | 563,860 | | 2.2 | % |
| | |
Energy | | $ | 104,006 | | 0.4 | % |
| | |
Total: | | $ | 900,749 | | 3.5 | % |
44
Managed Futures Index Series:
| | | | | | |
MARKET SECTOR | | VALUE AT RISK | | % OF TOTAL
CAPITALIZATION | |
Interest Rates | | $ | 286,354 | | 2.9 | % |
| | |
Currencies | | $ | 454,114 | | 4.6 | % |
| | |
Stocks / Stock Indices | | $ | 101,008 | | 1.0 | % |
| | |
Metals | | $ | 55,794 | | 0.6 | % |
| | |
Agriculturals/Softs | | $ | 48,499 | | 0.5 | % |
| | |
Energy | | $ | 130,475 | | 1.3 | % |
| | |
Total: | | $ | 1,076,244 | | 10.9 | % |
(1) At March 31, 2007, the Balanced Series was invested in the Currency Series, Long Only Commodity Series and Managed Futures Index Series. The Balanced Series effective ownership in these Series as of March 31, 2007, was: 57.4% of the Currency Series, 85.8% of the Long Only Commodity Series and 93.9% of the Managed Futures Index Series. Including its investment in these other Series, total value at risk for the Balanced Series would be $44,193,766, or 16.1% of capitalization as of March 31, 2007.
Material Limitations on Value at Risk as an Assessment of Market Risk
The face value of the market sector instruments held on behalf of the Series is typically many times the applicable maintenance margin requirement, which generally ranges between approximately 1% and 10% of contract face value, as well as many times the capitalization of the Series. The magnitude of each Series’ open positions creates a risk of loss not typically found in most other investment vehicles. Because of the size of their positions, certain market conditions, although unusual, but historically recurring from time to time, could cause a Series to incur severe losses over a short period of time. The value at risk tables above, as well as the past performance of the Series, gives no indication of this risk of loss.
Non-Trading Risk
The Series have non-trading market risk on their foreign cash balances not needed for margin. However, these balances, as well as the market risk they represent, are immaterial. The Series also have non-trading market risk as a result of investing a portion of their available assets in time deposits. The market risk represented by these investments is also immaterial.
Qualitative Market Risk
The following are the primary trading risk exposures of the Series of the Trust as of March 31, 2007, by market sector.
Interest rates
Interest rate risk is one of the principal market exposures of each Series. Interest rate movements directly affect the price of interest rate futures positions held and indirectly the value of a Trading Company’s stock index and currency positions. Interest rate movements in one country as well as relative interest rate movements between countries materially impact profitability. The primary interest rate exposure is to interest rate fluctuations in the U.S. and the other G-8 countries. However, the Trading Companies also may take futures positions on the
45
government debt of smaller nations. The Managing Owner anticipates that G-8 interest rates will remain the primary market exposure of each Trading Company and accordingly each Series for the foreseeable future. The changes in interest rates which are expected to have the most effect on the Series are changes in long-term, as opposed to short-term rates. Most of the speculative positions to be held by the Trading Companies will be in medium- to long-term instruments. Consequently, even a material change in short-term rates is expected to have little effect on the Series if the medium- to long-term rates remain steady. The first two percent (2.0%) of interest income per annum earned by the Trust for the Balanced Series (Class 1 and Class 2 only), Winton Series, Campbell Graham Series, Currency Series, Dunn Series and Graham Series is paid to the Managing Owner. In addition, if interest rates fall below 0.75%, the Managing Owner is paid the difference between the Trust’s annualized income interest and 0.75%. Interest income above 2.0% per these Series is retained by the Series. Interest income earned by the Trust for the Balanced Series (Class 1a and 2a), Long Only Commodity Series, Long/Short Commodity Series and the Managed Futures Index Series is allocated twenty percent (20.0%) being paid to the Managing Owner and eighty percent (80.0%) retained by these Series.
Currencies
Exchange rate risk is a significant market exposure of each Series of the Trust in general and the Currency Series in particular. For each Series of the Trust in general and the Currency Series in particular currency exposure is to exchange rate fluctuations, primarily fluctuations that disrupt the historical pricing relationships between different currencies and currency pairs. These fluctuations are influenced by interest rate changes as well as political and general economic conditions. The Trading Advisors on behalf of a Series trade in a large number of currencies, including cross-rates, which are positions between two currencies other than the U.S. Dollar. The Managing Owner does not anticipate that the risk profile of the Series’ currency sector will change significantly in the future.
Stock Indices
For each Series (other than the Currency Series), its primary equity exposure is equity price risk in the G-8 countries as well as other smaller jurisdictions. Each Series of the Trust (other than the Currency Series) is primarily exposed to the risk of adverse price trends or static markets in the major U.S., European and Japanese indices.
Metals
For each Series (other than the Currency Series), its metals market exposure is fluctuations in the price of both precious metals, including gold and silver, as well as base metals including aluminum, copper, nickel and zinc. Some metals, such as gold, are used as surrogate stores of value, in place of hard currency, and thus have an associated currency or interest rate risk associated with them relative to their price in a specific currency. Other metals, such as silver, platinum, copper and steel, have substantial industrial applications, and may be subject to forces affecting industrial production and demand.
Agriculturals/Softs
Each Series (other than the Currency Series) may also invest in raw commodities and may thus have exposure to agricultural price movements, which are often directly affected by severe or unexpected weather conditions or by political events in countries that comprise significant sources of commodity supply.
Energy
For each Series (other than the Currency Series), its primary energy market exposure is in oil, gas and other energy product price movements, often resulting from political developments and ongoing conflicts in the Middle East. Oil and gas prices can be volatile and substantial profits and losses have been and are expected to continue to be experienced in this market.
Other Trading Risks
As a result of leverage, small changes in the price of a Trading Company’s positions may result in substantial losses for a Series. Futures, forwards and options are typically traded on margin. This means that a small amount of
46
capital can be used to invest in contracts of much greater total value. The resulting leverage means that a relatively small change in the market price of a contract can produce a substantial loss. Like other leveraged investments, any purchase or sale of a contract may result in losses in excess of the amount invested in that contract. The Trading Companies may lose more than their initial margin deposits on a trade.
The Trading Companies’ trading is subject to execution risks. Market conditions may make it impossible for the Trading Advisors to execute a buy or sell order at the desired price, or to close out an open position. Daily price fluctuation limits are established by the exchanges and approved by the Commodity Futures Trading Commission. When the market price of a contract reaches its daily price fluctuation limit, no trades can be executed at prices outside the limit. The holder of a contract may therefore be locked into an adverse price movement for several days or more and lose considerably more than the initial margin put up to establish the position. Thinly traded or illiquid markets also can make it difficult or impossible to execute trades.
The Trading Advisor’s positions are subject to speculative limits. The Commodity Futures Trading Commission and domestic exchanges have established speculative position limits on the maximum futures position which any person, or group of persons acting in concert, may hold or control in particular futures contracts or options on futures contracts traded on U.S. commodity exchanges. Under current regulations, other accounts of the Trading Advisors are combined with the positions held by them on behalf of the applicable Trading Company for position limit purposes. This trading could preclude additional trading in these commodities by the Trading Advisors for the accounts of the Series.
Systematic strategies do not consider fundamental types of data and do not have the benefit of discretionary decision making. The assets of the Series are allocated to Trading Advisors that rely on technical, systematic strategies that do not take into account factors external to the market itself (although certain of these strategies may have minor discretionary elements incorporated into their systematic strategy). The widespread use of technical trading systems frequently results in numerous trading advisors attempting to execute similar trades at or about the same time, altering trading patterns and affecting market liquidity. Furthermore, the profit potential of trend-following systems may be diminished by the changing character of the markets, which may make historical price data (on which technical programs are based) only marginally relevant to future market patterns. Systematic strategies are developed on the basis of a statistical analysis of market prices. Consequently, any factor external to the market itself that dominates prices that a discretionary decision maker may take into account may cause major losses for a systematic strategy. For example, a pending political or economic event may be very likely to cause a major price movement, but a systematic strategy may continue to maintain positions indicated by its trading method that might incur major losses if the event proved to be adverse.
However, because certain of the Trading Advisors’ strategies involve some discretionary aspects in addition to their technical factors, certain of the Trading Advisors may occasionally use discretion in investing the assets of a Series. For example, the Trading Advisors often use discretion in selecting contracts and markets to be followed. In exercising such discretion, such Trading Advisor may take positions opposite to those recommended by the Trading Advisor’s trading system or signals. Discretionary decision making may also result in a Trading Advisor failing to capitalize on certain price trends or making unprofitable trades in a situation where another trader relying solely on a systematic approach might not have done so. Furthermore, such use of discretion may not enable the relevant Series of the Trust to avoid losses, and in fact, such use of discretion may cause such Series to forego profits which it may have otherwise earned had such discretion not been used.
| ITEM 4. | CONTROLS AND PROCEDURES |
Evaluation of disclosure controls and procedures
Under the supervision and with the participation of the management of the Managing Owner, including its Chief Executive Officer and Chief Financial Officer, the Trust evaluated the effectiveness of the design and operation of our disclosure controls and procedures (as defined in Rule 13(a)-15(e) under the Securities Exchange Act of 1934) as of March 31, 2007 (the “Evaluation Date”). Any control system, no matter how well designed and operated, can provide only reasonable (not absolute) assurance that its objectives will be met. Furthermore, no evaluation of controls can provide absolute assurance that all control issues and instances of fraud, if any, have been detected. Based upon our evaluation, the Chief Executive Officer and Chief Financial Officer of the Managing Owner concluded that, as of the
47
Evaluation Date, our disclosure controls and procedures were effective to provide reasonable assurance that they are timely alerted to the material information relating to the Trust required to be included in the Trust’s periodic SEC filings.
Changes in Internal Control Over Financial Reporting
There were no changes made in our internal controls during the first quarter that have materially affected or are reasonably likely to materially affect the Trust’s internal controls or financial reporting.
48
PART II. OTHER INFORMATION
| ITEM 1. | LEGAL PROCEEDINGS. |
None
There have been no material changes to the risk factors relating to The Frontier Fund from those previously disclosed in the Trust’s Annual Report on Form 10-K for its fiscal year ended December 31, 2006, under the caption “Item 1A. Risk Factors.”
| ITEM 2. | UNREGISTERED SALES OF EQUITY SECURITIES AND USE OF PROCEEDS. |
None
| ITEM 3. | DEFAULTS UPON SENIOR SECURITIES. |
None
| ITEM 4. | SUBMISSION OF MATTERS TO A VOTE OF SECURITY HOLDERS. |
None
| ITEM 5. | OTHER INFORMATION. |
None
Exhibits (numbered in accordance with Item 601 of Regulation S-K)
| | |
| 1.1 | | Form of Selling Agent Agreement among the Registrant, Equinox Fund Management, LLC and the Selling Agents+ |
| |
| 1.2 | | Form of Amendment Agreement among the Registrant, Equinox Fund Management, LLC and the Selling Agents** |
| |
| 1.3 | | Form of Amendment Agreement among the Registrant, Equinox Fund Management, LLC and the Selling Agents*** |
| |
| 1.4 | | Form of Amendment Agreement among the Registrant, Equinox Fund Management, LLC and the Selling Agents*** |
| |
| 1.5 | | Form of Amendment Agreement among the Registrant, Equinox Fund Management, LLC and the Selling Agents+ |
| |
| 4.1 | | Declaration of Trust and Amended and Restated Trust Agreement of the Registrant (annexed to the Prospectus as Exhibit A)+ |
| |
| 4.2 | | Form of Subscription Agreement (annexed to the Prospectus as Exhibit B)+ |
| |
| 4.3 | | Form of Exchange Request (annexed to the Prospectus as Exhibit C)+ |
| |
| 4.4 | | Form of Request for Redemption (annexed to the Prospectus as Exhibit D)+ |
49
| | |
| 4.5 | | Form of Request for Additional Subscription (annexed to the Prospectus as Exhibit E)+ |
| |
| 4.6 | | Form of Application for Transfer of Ownership / Re-registration Form (annexed to the Prospectus as Exhibit F)+ |
| |
| 4.7 | | Form of Privacy Notice (annexed to the Prospectus as Exhibit G)+ |
| |
| 10.1 | | Form of Amended and Restated Escrow Agreement among the Registrant, Equinox Fund Management, LLC, Bornhoft Group Securities Corporation and the U.S. Bank National Association, Denver Colorado*** |
| |
| 10.2 | | Form of Brokerage Agreement between each Trading Company and UBS Securities, LLC* |
| |
| 10.21 | | Form of Brokerage Agreement between each Trading Company and Banc of America Futures Incorporated* |
| |
| 10.22 | | Form of Brokerage Agreement between the Managing Owner, acting as agent on behalf of certain Trading Companies, and Deutsche Bank AG London** |
| |
| 10.23 | | Form of Brokerage Agreement between each Trading Company and Man Financial Inc. *** |
| |
| 10.24 | | Form of Amendment Agreement between the Managing Owner, acting as agent on behalf of certain Trading Companies, and Deutsche Bank AG London*** |
| |
| 10.3 | | Form of Advisory Agreement among the Registrant, the Trading Company, Equinox Fund Management, LLC, and each Trading Advisor* |
| |
| 10.31 | | Form of International Swaps and Derivatives Association Master Agreement, including all Schedules thereto and the Credit Support Annex thereto entered into for the Long Only Commodity Series of the Registrant*** |
| |
| 10.32 | | Form of License Agreement among Jefferies Financial Products, LLC, Reuters America LLC, the Registrant and Equinox Fund Management, LLC*** |
| |
| 10.33 | | Form of License Agreement among Jefferies Financial Products, the Registrant and Equinox Fund Management, LLC*** |
| |
| 10.34 | | Form of Guaranty made by Jefferies Group, Inc. in favor of Frontier Trading Company VIII, LLC*** |
| |
| 10.35 | | Form of International Swaps and Derivatives Association Master Agreement, including all Schedules thereto and the Credit Support Annex thereto entered into for the Currency Series of the Registrant*** |
| |
| 10.36 | | Form of International Swaps and Derivatives Association Master Agreement, including all Schedules thereto and the Credit Support Annex thereto entered into for the Managed Futures Index Series of the Registrant*** |
| |
| 10.4 | | Form of Cash Management Agreement between Equinox Fund Management, LLC and Merrill Lynch** |
| |
| 10.41 | | Form of Cash Management Agreement between Equinox Fund Management, LLC and STW Fixed Income Management Ltd.*** |
| |
| 10.5 | | Form of single-member limited liability company operating agreement governing each Trading Company*** |
50
| | |
| 21.1 | | Subsidiaries of Registrant. (filed herewith) |
| |
| 31.1 | | Certification of Principal Executive Officer of the Managing Owner pursuant to Rules 13a-14(a) and 15d-14(a) of the Securities Exchange Act of 1934. (filed herewith) |
| |
| 31.2 | | Certification of Principal Executive Officer of the Managing Owner pursuant to Rules 13a-14(a) and 15d-14(a) of the Securities Exchange Act of 1934. (filed herewith) |
| |
| 31.3 | | Certification of Principal Executive Officer of the Managing Owner pursuant to Rules 13a-14(a) and 15d-14(a) of the Securities Exchange Act of 1934. (filed herewith) |
| |
| 31.4 | | Certification of Principal Executive Officer of the Managing Owner pursuant to Rules 13a-14(a) and 15d-14(a) of the Securities Exchange Act of 1934. (filed herewith) |
| |
| 31.5 | | Certification of Principal Executive Officer of the Managing Owner pursuant to Rules 13a-14(a) and 15d-14(a) of the Securities Exchange Act of 1934. (filed herewith) |
| |
| 31.6 | | Certification of Principal Executive Officer of the Managing Owner pursuant to Rules 13a-14(a) and 15d-14(a) of the Securities Exchange Act of 1934. (filed herewith) |
| |
| 31.7 | | Certification of Principal Executive Officer of the Managing Owner pursuant to Rules 13a-14(a) and 15d-14(a) of the Securities Exchange Act of 1934. (filed herewith) |
| |
| 31.8 | | Certification of Principal Executive Officer of the Managing Owner pursuant to Rules 13a-14(a) and 15d-14(a) of the Securities Exchange Act of 1934. (filed herewith) |
| |
| 31.9 | | Certification of Principal Executive Officer of the Managing Owner pursuant to Rules 13a-14(a) and 15d-14(a) of the Securities Exchange Act of 1934. (filed herewith) |
| |
| 31.10 | | Certification of Principal Executive Officer of the Managing Owner pursuant to Rules 13a-14(a) and 15d-14(a) of the Securities Exchange Act of 1934. (filed herewith) |
| |
| 31.11 | | Certification of Principal Financial Officer of the Managing Owner pursuant to Rules 13a-14(a) and 15d-14(a) of the Securities Exchange Act of 1934. (filed herewith) |
| |
| 31.12 | | Certification of Principal Financial Officer of the Managing Owner pursuant to Rules 13a-14(a) and 15d-14(a) of the Securities Exchange Act of 1934. (filed herewith) |
| |
| 31.13 | | Certification of Principal Financial Officer of the Managing Owner pursuant to Rules 13a-14(a) and 15d-14(a) of the Securities Exchange Act of 1934. (filed herewith) |
| |
| 31.14 | | Certification of Principal Financial Officer of the Managing Owner pursuant to Rules 13a-14(a) and 15d-14(a) of the Securities Exchange Act of 1934. (filed herewith) |
| |
| 31.15 | | Certification of Principal Financial Officer of the Managing Owner pursuant to Rules 13a-14(a) and 15d-14(a) of the Securities Exchange Act of 1934. (filed herewith) |
| |
| 31.16 | | Certification of Principal Financial Officer of the Managing Owner pursuant to Rules 13a-14(a) and 15d-14(a) of the Securities Exchange Act of 1934. (filed herewith) |
| |
| 31.17 | | Certification of Principal Financial Officer of the Managing Owner pursuant to Rules 13a-14(a) and 15d-14(a) of the Securities Exchange Act of 1934. (filed herewith) |
| |
| 31.18 | | Certification of Principal Financial Officer of the Managing Owner pursuant to Rules 13a-14(a) and 15d-14(a) of the Securities Exchange Act of 1934. (filed herewith) |
| |
| 31.19 | | Certification of Principal Financial Officer of the Managing Owner pursuant to Rules 13a-14(a) and 15d-14(a) of the Securities Exchange Act of 1934. (filed herewith) |
51
| | |
| 31.20 | | Certification of Principal Financial Officer of the Managing Owner pursuant to Rules 13a-14(a) and 15d-14(a) of the Securities Exchange Act of 1934. (filed herewith) |
| |
| 32.1 | | Certification pursuant to 18 U.S.C. Section 1350, as enacted by Section 906 of The Sarbanes- Oxley Act of 2002. (furnished herewith) |
| |
| 32.2 | | Certification pursuant to 18 U.S.C. Section 1350, as enacted by Section 906 of The Sarbanes- Oxley Act of 2002. (furnished herewith) |
| |
| 32.3 | | Certification pursuant to 18 U.S.C. Section 1350, as enacted by Section 906 of The Sarbanes- Oxley Act of 2002. (furnished herewith) |
| |
| 32.4 | | Certification pursuant to 18 U.S.C. Section 1350, as enacted by Section 906 of The Sarbanes- Oxley Act of 2002. (furnished herewith) |
| |
| 32.5 | | Certification pursuant to 18 U.S.C. Section 1350, as enacted by Section 906 of The Sarbanes- Oxley Act of 2002. (furnished herewith) |
| |
| 32.6 | | Certification pursuant to 18 U.S.C. Section 1350, as enacted by Section 906 of The Sarbanes- Oxley Act of 2002. (furnished herewith) |
| |
| 32.7 | | Certification pursuant to 18 U.S.C. Section 1350, as enacted by Section 906 of The Sarbanes- Oxley Act of 2002. (furnished herewith) |
| |
| 32.8 | | Certification pursuant to 18 U.S.C. Section 1350, as enacted by Section 906 of The Sarbanes- Oxley Act of 2002. (furnished herewith) |
| |
| 32.9 | | Certification pursuant to 18 U.S.C. Section 1350, as enacted by Section 906 of The Sarbanes- Oxley Act of 2002. (furnished herewith) |
| |
| 32.10 | | Certification pursuant to 18 U.S.C. Section 1350, as enacted by Section 906 of The Sarbanes- Oxley Act of 2002. (furnished herewith) |
| |
| * | | Previously filed as like-numbered exhibit to the initial filing or the first, second, third or fourth pre-effective amendment or the first or second post-effective amendment to Registration Statement No. 333-108397 and incorporated by reference herein. |
| |
| ** | | Previously filed as like-numbered exhibit to the initial filing or the first pre-effective amendment or the first or second post-effective amendment to Registration Statement No. 333-119596 and incorporated by reference herein. |
| |
| *** | | Previously filed as like-numbered exhibit to the initial filing or the first pre-effective amendment or the first post-effective amendment to Registration Statement No. 333-129701 and incorporated by reference herein. |
| |
| + | | Previously filed as like-numbered exhibit to the initial filing or the first pre-effective amendment to Registration Statement No. 333-140240 and incorporated by reference herein. |
52
SIGNATURES
Pursuant to the requirements of the Securities Exchange Act of 1934, the registrant has duly caused this report to be signed on its behalf by the undersigned thereunto duly authorized.
| | |
| | The Frontier Fund |
| | (Registrant) |
| |
| Date: May 10, 2007 | | /s/ Robert J. Enck |
| | Robert J. Enck |
| | President and Chief Executive Officer of Equinox Fund Management, LLC, the Managing Owner of The Frontier Fund |
53
Pursuant to the requirements of the Securities Exchange Act of 1934, the registrant has duly caused this report to be signed on its behalf by the undersigned thereunto duly authorized.
| | |
| | Balanced Series, a Series of The Frontier Fund |
| | (Registrant) |
| |
| Date: May 10, 2007 | | /s/ Robert J. Enck |
| | Robert J. Enck |
| | President and Chief Executive Officer of Equinox Fund Management, LLC, the Managing Owner of The Frontier Fund |
54
Pursuant to the requirements of the Securities Exchange Act of 1934, the registrant has duly caused this report to be signed on its behalf by the undersigned thereunto duly authorized.
| | |
| | Dunn Series, a Series of The Frontier Fund |
| | (Registrant) |
| |
| Date: May 10, 2007 | | /s/ Robert J. Enck |
| | Robert J. Enck |
| | President and Chief Executive Officer of Equinox Fund Management, LLC, the Managing Owner of The Frontier Fund |
55
Pursuant to the requirements of the Securities Exchange Act of 1934, the registrant has duly caused this report to be signed on its behalf by the undersigned thereunto duly authorized.
| | |
| | Graham Series, a Series of The Frontier Fund |
| | (Registrant) |
| |
| Date: May 10, 2007 | | /s/ Robert J. Enck |
| | Robert J. Enck |
| | President and Chief Executive Officer of Equinox Fund Management, LLC, the Managing Owner of The Frontier Fund |
56
Pursuant to the requirements of the Securities Exchange Act of 1934, the registrant has duly caused this report to be signed on its behalf by the undersigned thereunto duly authorized.
| | |
| | Winton Series, a Series of The Frontier Fund |
| | (Registrant) |
| |
| Date: May 10, 2007 | | /s/ Robert J. Enck |
| | Robert J. Enck |
| | President and Chief Executive Officer of Equinox Fund Management, LLC, the Managing Owner of The Frontier Fund |
57
Pursuant to the requirements of the Securities Exchange Act of 1934, the registrant has duly caused this report to be signed on its behalf by the undersigned thereunto duly authorized.
| | |
| | Campbell/Graham Series, a Series of The Frontier Fund |
| | (Registrant) |
| |
| Date: May 10, 2007 | | /s/ Robert J. Enck |
| | Robert J. Enck |
| | President and Chief Executive Officer of Equinox Fund Management, LLC, the Managing Owner of The Frontier Fund |
58
Pursuant to the requirements of the Securities Exchange Act of 1934, the registrant has duly caused this report to be signed on its behalf by the undersigned thereunto duly authorized.
| | |
| | Currency Series, a Series of The Frontier Fund |
| | (Registrant) |
| |
| Date: May 10, 2007 | | /s/ Robert J. Enck |
| | Robert J. Enck |
| | President and Chief Executive Officer of Equinox Fund Management, LLC, the Managing Owner of The Frontier Fund |
59
Pursuant to the requirements of the Securities Exchange Act of 1934, the registrant has duly caused this report to be signed on its behalf by the undersigned thereunto duly authorized.
| | |
| | Long Only Commodity Series, a Series of The Frontier Fund |
| | (Registrant)) |
| |
| Date: May 10, 2007 | | /s/ Robert J. Enck |
| | Robert J. Enck |
| | President and Chief Executive Officer of Equinox Fund Management, LLC, the Managing Owner of The Frontier Fund |
60
Pursuant to the requirements of the Securities Exchange Act of 1934, the registrant has duly caused this report to be signed on its behalf by the undersigned thereunto duly authorized.
| | |
| | Long/Short Commodity Series, a Series of The Frontier Fund |
| | (Registrant) |
| |
| Date: May 10, 2007 | | /s/ Robert J. Enck |
| | Robert J. Enck |
| | President and Chief Executive Officer of Equinox Fund Management, LLC, the Managing Owner of The Frontier Fund |
61
Pursuant to the requirements of the Securities Exchange Act of 1934, the registrant has duly caused this report to be signed on its behalf by the undersigned thereunto duly authorized.
| | |
| | Managed Futures Index Series, a Series of The Frontier Fund |
| | (Registrant) |
| |
| Date: May 10, 2007 | | /s/ Robert J. Enck |
| | Robert J. Enck |
| | President and Chief Executive Officer of Equinox Fund Management, LLC, the Managing Owner of The Frontier Fund |
62