Universal Technical Institute, Inc. Q4 2024 Investor Presentation

2 Forward-Looking Statements This presentation contains forward-looking statements within the meaning of the safe harbor from civil liability provided for such statements by the Private Securities Litigation Reform Act of 1995 (set forth in Section 27A of the Securities Act of 1933, as amended, and Section 21E of the Securities Exchange Act of 1934, as amended). Forward-looking statements may contain words such as "goal," "target," "future," "estimate," "expect," "anticipate," "intend," "plan," "believe," "seek," "project," "may," "should," "will," the negative form of these expressions or similar expressions. These statements are based on our management’s current beliefs, expectations and assumptions about future events, conditions and results and on information currently available to us. Although we believe that the expectations reflected in the forward-looking statements are reasonable, we cannot guarantee future results, levels of activity, performance, achievements or events and circumstances reflected in the forward-looking statements will occur. Discussions containing these forward-looking statements may be found, among other places, in the sections entitled “Business,” “Risk Factors” and “Management’s Discussion and Analysis of Financial Condition and Results of Operations” incorporated by reference from our most recent Annual Report on Form 10-K, in our subsequent Quarterly Reports on Form 10-Q and certain of our Current Reports on Form 8-K, as well as any amendments thereto, filed with the Securities and Exchange Commission (the “SEC”). In addition, statements that refer to projections of earnings, revenue, costs or other financial items in future periods; anticipated growth and trends in our business or key markets; cost synergies, growth opportunities and other potential financial and operating benefits; future growth and revenues; future economic conditions and performance; anticipated performance of curriculum; plans, objectives and strategies for future operations; and other characterizations of future events or circumstances, and all other statements that are not statements of historical fact are forward-looking statements. Such statements are based on currently available operating, financial and competitive information and are subject to various risks, uncertainties and assumptions that could cause actual results to differ materially from those anticipated or implied in our forward-looking statements due to a number of factors, including, but not limited to, those set forth under the section entitled “Risk Factors” in our filings with the SEC. Important factors that could affect our actual results include, among other things, failure of our schools to comply with the extensive regulatory requirements for school operations; our failure to maintain eligibility for federal student financial assistance funds; the effect of current and future Title IV Program regulations arising out of negotiated rulemakings, including any potential reductions in funding or restrictions on the use of funds received through Title IV Programs; the effect of future legislative or regulatory initiatives related to veterans’ benefit programs; continued Congressional examination of the for-profit education sector; our failure to maintain eligibility for or the ability to process federal student financial assistance; regulatory investigations of, or actions commenced against, us or other companies in our industry; changes in the state regulatory environment or budgetary constraints; failure to comply with private education loan requirements; the effect of "borrower defense to repayment" regulation; the effect of postsecondary education regulatory environment as a results of U.S. federal elections; our failure to execute on our growth and diversification strategy, including effectively identifying, establishing and operating additional schools, programs or campuses; our failure to realize the expected benefits of our acquisitions, or our failure to successfully integrate our acquisitions; our failure to improve underutilized capacity at certain of our campuses; enrollment declines or challenges in our students’ ability to find employment as a result of macroeconomic conditions; our failure to maintain and expand existing industry relationships and develop new industry relationships; our ability to update and expand the content of existing programs and develop and integrate new programs in a timely and cost-effective manner while maintaining positive student outcomes; a loss of our senior management or other key employees; failure to comply with the restrictive covenants and our ability to pay the amounts when due under the Credit Agreement; increased scrutiny and changing expectations regarding our environmental, social and governance practices; the effect of public health pandemics, epidemics or outbreak, including COVID-19, and other risks that are described from time to time in our public filings. Given these risks, uncertainties and other factors, many of which are beyond our control, you should not place undue reliance on these forward-looking statements. Neither we nor any other person makes any representation as to the accuracy or completeness of these forward-looking statements and, except as required by law, we assume no obligation to update these forward-looking statements publicly, or to revise any forward-looking statements, even if new information becomes available in the future. This presentation also contains estimates and other statistical data made by independent parties, and by us, relating to market size and growth and other data about our industry and our business. This data involves several assumptions and limitations, and you are cautioned not to give undue weight to such estimates. In addition, projections, assumptions and estimates of our future performance and the future performance of the markets in which we operate are necessarily subject to a high degree of uncertainty and risk.
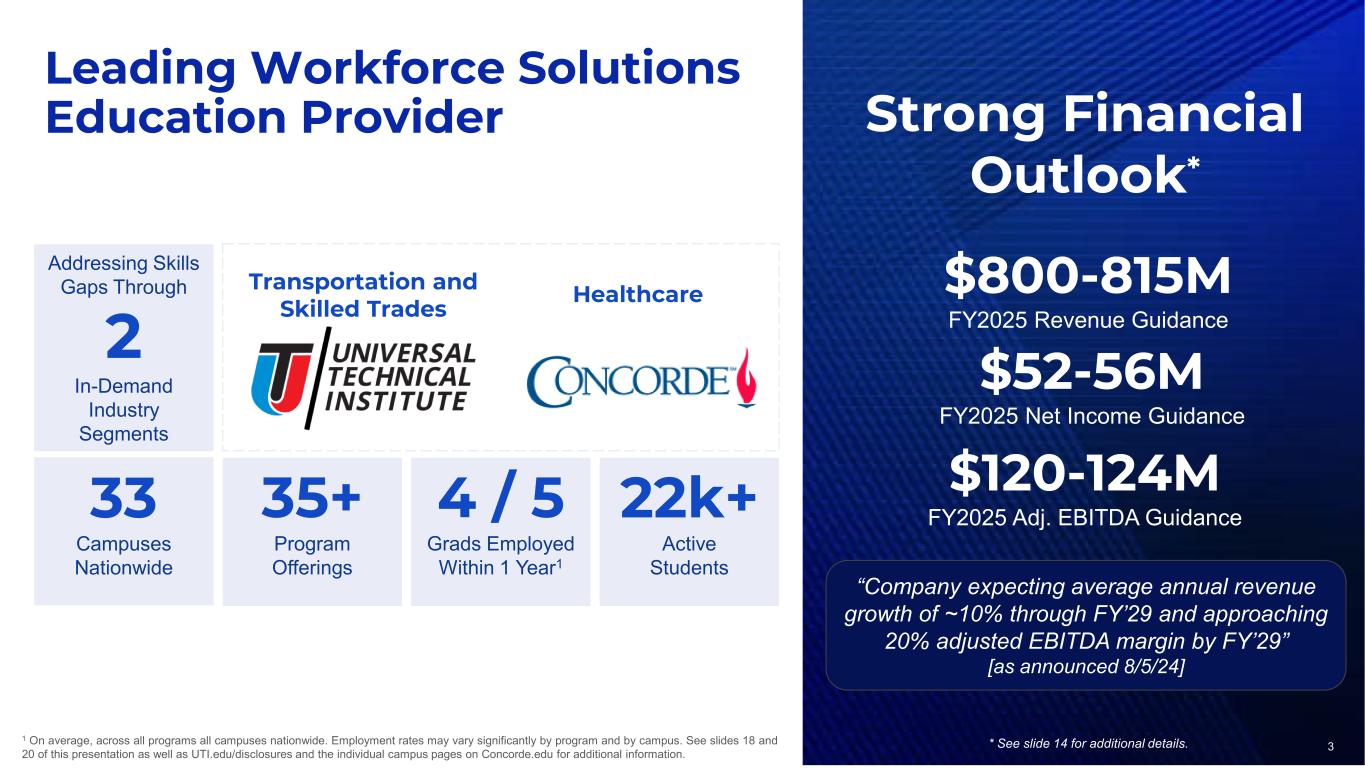
3 Leading Workforce Solutions Education Provider 22k+ Active Students 4 / 5 Grads Employed Within 1 Year1 35+ Program Offerings HealthcareTransportation and Skilled Trades $800-815M FY2025 Revenue Guidance $120-124M FY2025 Adj. EBITDA Guidance Addressing Skills Gaps Through 2 In-Demand Industry Segments 33 Campuses Nationwide Strong Financial Outlook* 1 On average, across all programs all campuses nationwide. Employment rates may vary significantly by program and by campus. See slides 18 and 20 of this presentation as well as UTI.edu/disclosures and the individual campus pages on Concorde.edu for additional information. * See slide 14 for additional details. $52-56M FY2025 Net Income Guidance “Company expecting average annual revenue growth of ~10% through FY’29 and approaching 20% adjusted EBITDA margin by FY’29” [as announced 8/5/24]
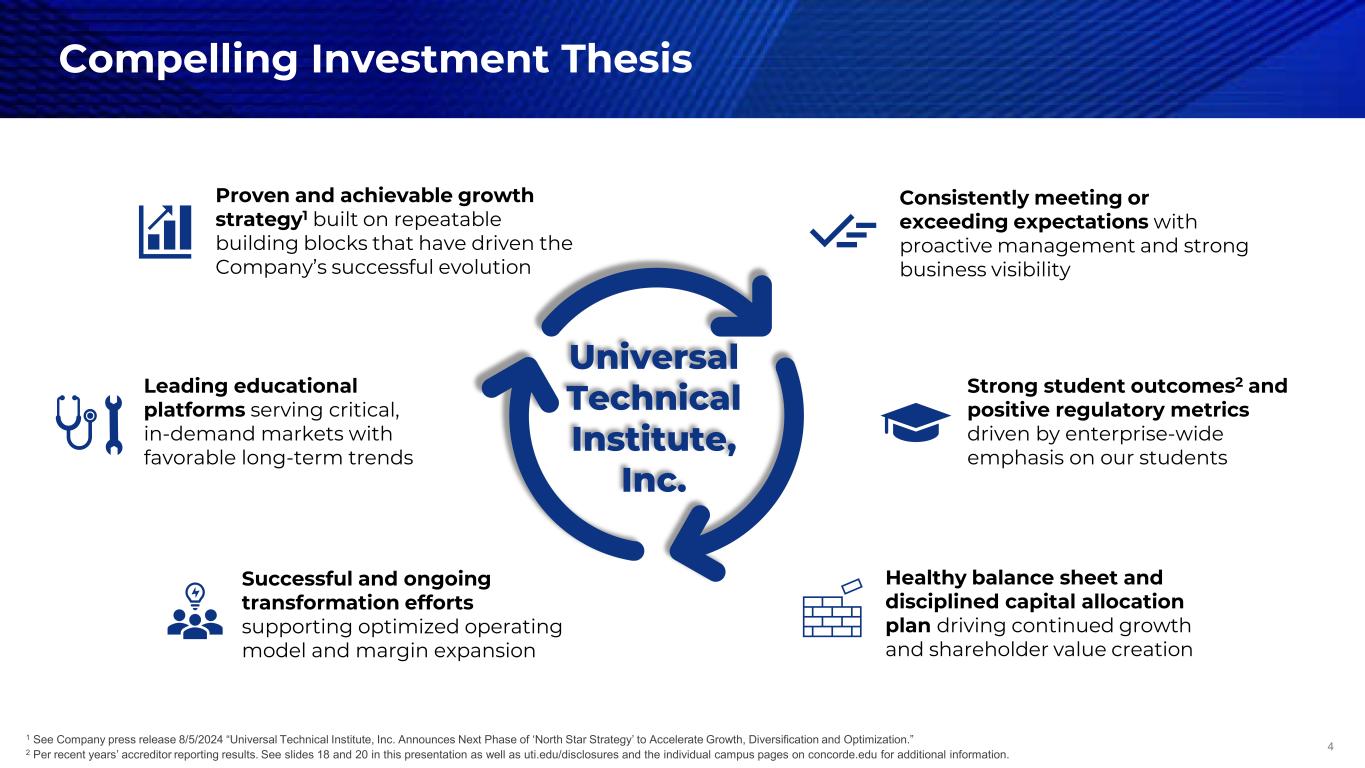
4 Compelling Investment Thesis 1 See Company press release 8/5/2024 “Universal Technical Institute, Inc. Announces Next Phase of ‘North Star Strategy’ to Accelerate Growth, Diversification and Optimization.” 2 Per recent years’ accreditor reporting results. See slides 18 and 20 in this presentation as well as uti.edu/disclosures and the individual campus pages on concorde.edu for additional information. Leading educational platforms serving critical, in-demand markets with favorable long-term trends Strong student outcomes2 and positive regulatory metrics driven by enterprise-wide emphasis on our students Consistently meeting or exceeding expectations with proactive management and strong business visibility Successful and ongoing transformation efforts supporting optimized operating model and margin expansion Healthy balance sheet and disciplined capital allocation plan driving continued growth and shareholder value creation Universal Technical Institute, Inc. Proven and achievable growth strategy1 built on repeatable building blocks that have driven the Company’s successful evolution

5 Diversified Platform of In-Demand Programs Practical/Vocational/Registered Nursing Dental Hygienist/Assistant Healthcare Administration Medical Assistant Physical and Occupational Therapy AssistantsRobotics and Automation Welding Auto/Diesel/Motorcycle/Marine Technician Aviation Maintenance, Airframe and Powerplant Energy Technology and Wind Power • $486M Revenue in FY2024 • ~14k Avg Students in FY2024 • 15+ programs across Transportation, Energy, & Skilled Trades • 16 Campuses in 9 States • In-person and Hybrid/Blended formats • $246M Revenue in FY2024 • ~8k Avg Students in FY2024 • 20+ programs in Dental, Allied Health, Nursing, Patient Care and Diagnostics • 17 Campuses in 8 States • In-person, Hybrid/Blended, and Fully Online formats Ex am pl e Pr og ra m s Ex am pl e Pr og ra m s Note: See appendix for more details by segment.

6 0% 5% 10% 15% 20% 25% 30% JO B G R O W TH 2 02 3- 20 33 ANNUAL JOB OPENINGS 2023-2033 Offerings Across Transportation, Skilled Trades, and Healthcare Address Labor Market Needs 60% Practical/Vocational/Registered Nursing Dental Hygienists & Assistants Physical and Occupational Therapy Assistants Healthcare Administration Medical Assistants Ex am pl e C on co rd e H ea lth ca re P ro gr am s Ex am pl e U TI T ra ns po rta tio n, En er gy , & Sk ille d Tr ad e Pr og ra m s Wind Turbine Service Technicians Aircraft Mechanics & Technicians Welding HVACR Mechanics & Installers Auto Body Repairers Auto/Diesel Technicians Note: Projections as per the Occupational Outlook Handbook published annually by the U.S. Bureau of Labor Statistics www.bls.gov, August 2024. Job openings include those due to net employment changes and net replacements.

7 High-quality, state-of-the-industry technical and healthcare training facilities supporting successful student outcomes

8 Acquisitions and Program Expansions MIAT (Closed FY2022), Concorde (Closed FY2023) Marketing and Admissions Optimization Increased focus on high school and local, as well as lead conversion Program and Curricula Additions Programs launched at existing campuses, New MSATs, On-Base Military Programs, EV Curriculum Real Estate Rationalization Run-rate EBITDA improvements realized; continued emphasis on capacity utilization Blended Learning Improving student experience and space and instructor efficiencies New Campuses Bloomfield, NJ 2018; Austin, TX 2022; Miramar, FL 2022; More to come beginning FY2026 Continuing a Multi-Year Transformation Journey Note: For detailed reconciliations of Non-GAAP measures see the Appendix. Net Income ($33) Adj EBITDA ($6) Net Income $52-$56 Adj EBITDA $120-$124
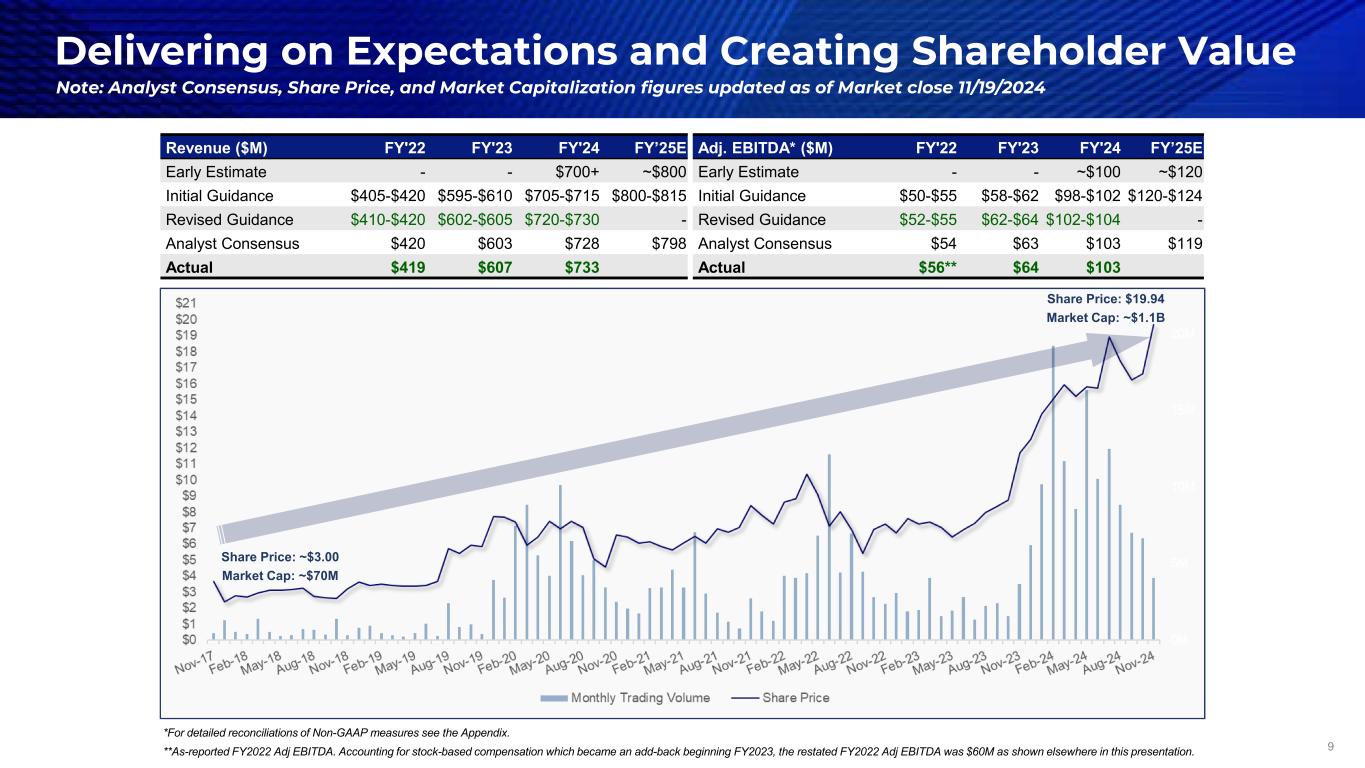
9 Delivering on Expectations and Creating Shareholder Value Share Price: ~$3.00 Market Cap: ~$70M Share Price: $19.94 Market Cap: ~$1.1B Note: Analyst Consensus, Share Price, and Market Capitalization figures updated as of Market close 11/19/2024 Revenue ($M) FY'22 FY'23 FY'24 FY’25E Early Estimate - - $700+ ~$800 Initial Guidance $405-$420 $595-$610 $705-$715 $800-$815 Revised Guidance $410-$420 $602-$605 $720-$730 - Analyst Consensus $420 $603 $728 $798 Actual $419 $607 $733 Adj. EBITDA* ($M) FY'22 FY'23 FY'24 FY’25E Early Estimate - - ~$100 ~$120 Initial Guidance $50-$55 $58-$62 $98-$102 $120-$124 Revised Guidance $52-$55 $62-$64 $102-$104 - Analyst Consensus $54 $63 $103 $119 Actual $56** $64 $103 *For detailed reconciliations of Non-GAAP measures see the Appendix. **As-reported FY2022 Adj EBITDA. Accounting for stock-based compensation which became an add-back beginning FY2023, the restated FY2022 Adj EBITDA was $60M as shown elsewhere in this presentation.

Executing Multifaceted Approach in Ongoing Expansion Efforts1 Optimize Add New Optimized Tailored Co-branded Program Expansions New Campuses Continue to add programs from our current portfolio to more existing campus locations Increase the capacity of current programs in current locations Launch new, in-demand program areas we do not currently offer Improved model for new campuses with more offerings for students and stronger financial profile for the company Geography-specific sites with a customized set of programs, for example skilled-trades-only2 locations for the UTI division in new markets, requiring less space and start-up costs 1. All initiatives contingent on requisite regulatory approvals. 2. Skilled-trades-only UTI campuses may include programs such as HVACR, Welding, Energy & Robotics but excludes Auto & Diesel, resulting in significant reductions to square footage and CapEx requirements. 3. See, for example, Company press release 8/1/2024 announcing a first-of-its-kind partnership to develop a co-branded campus with Heartland Dental. 10 Leverage deep industry relationships to partner in launching locations that will address the significant demand for our students in the workforce3

11 Robust Incremental Program and New Campus Opportunities UTI Campuses Concorde Campuses UTI & Concorde Campuses * Program not yet open at this location; some still pending regulatory approvals. † Phlebotomy only, no Sterile Processing program at this location. UTI Program Additions Programs & Locations Aviation Long Beach, CA Avondale, AZ Miramar, FL Austin, TX Long Beach, CA Avondale, AZ Mooresville, NC Bloomfield, NJ Sacramento, CA* Lisle, IL Rancho Cucamonga, CA Lisle, IL Mooresville, NC Exton, PA Rancho Cucamonga, CA Welding Sacramento, CA Lisle, IL Rancho Cucamonga, CA Concorde Program Additions Programs & Locations Cardiovascular Sonography Orlando, FL San Bernadino, CA Dental Hygiene Miramar, FL Jacksonville, FL Portland, OR Diagnostic Medical Sonography Orlando, FL Respiratory Therapy Online Option Short Programs Phlebotomy & Sterile Processing Technician Aurora, CO* Miramar, FL Dallas, TX North Hollywood, CA Garden Grove, CA Orlando, FL Grand Prarie, TX Portland, OR* Jacksonville, FL San Antonio, TX Kansas City, MO Southaven, MS† Memphis, TN Tampa, FL Industrial Maintenance Wind Power HVACR Robotics & Automation Note: New program additions began in FY2023 and to continue.

$733 $800-$815 $1,100+ FY24 FY25 FY29 North Star Strategy Expected to Drive Continued Growth 12 New Campuses Leverage new, optimized models and refined program mix formats to expand geographic footprint Program Expansions Continue additions of current programs to existing campuses & increasing capacity of current programs offered New Program Offerings Acquisitions and new program development efforts provide future opportunities Optimized for Growth and Scale Investments in centralized functions, systems and processes provide platform for continued scaling of the business Acquisitions Strategic and disciplined approach for evaluating new opportunities Note: FY26-FY29 initiatives as per Company’s strategic announcement 8/5/24. Organic Growth Program Expansion Initiatives New Campuses Net Income Margin 5.7% Adj EBITDA Margin 14.0% Adj EBITDA Margin Approaching 20% Net Income Margin ~7% Adj EBITDA Margin ~15%

13 Business Outlook Fiscal 2025 Guidance

14 Fiscal 2025 Guidance $ millions except EPS 1 Beginning in FY2023, Net Income and EPS impacted by a significant effective tax rate increase due to the valuation allowance reversal in FY2022, increased interest expense, and higher D&A. 2 Beginning in FY2023 Adj EBITDA excludes stock-based compensation; FY2022 updated for comparison. 3 Beginning in FY2025, growth investments for program expansion and new campus initiatives will no longer be included as add-backs in Adj EBITDA and Adj FCF calculations, affecting yoy comparability. Note: For detailed reconciliations of Non-GAAP measures see the Appendix.
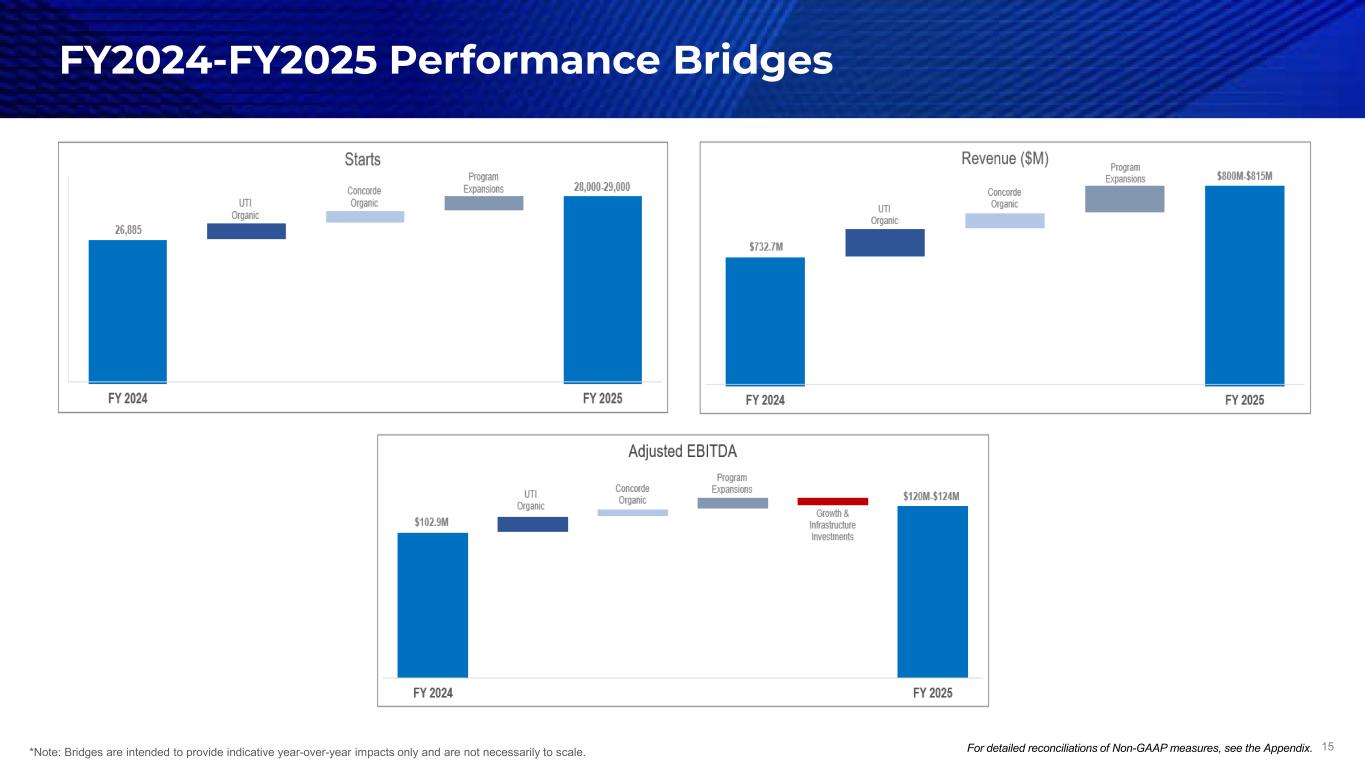
15 FY2024-FY2025 Performance Bridges *Note: Bridges are intended to provide indicative year-over-year impacts only and are not necessarily to scale. For detailed reconciliations of Non-GAAP measures, see the Appendix.

Growth Investments1 Given the projected ongoing nature of these strategic initiatives, effective fiscal 2025 the associated operating expense growth investments will no longer be reported as one-time adjustments in the Company’s non-GAAP adjusted EBITDA calculations nor will capital expenditure growth investments be added back in adjusted Free Cash Flow calculations as they have been previously.3 1 While the Company continually invests in growth & transformation across the organization, “growth investments” in this context are specifically those expenses associated with program expansion initiatives and new campuses. 2. See Company’s press release 8/5/2024; All growth initiatives contingent on requisite regulatory approvals as applicable. 3 For detailed reconciliations of Non-GAAP measures, see the Appendix. ($ thousands) FY2025 FY2024 FY2025 FY2024 Program Expansion & New Campus Growth Investments ~$8,000 - ~$29,000 - Growth Investments (Unadjusted) ~$8,000 - ~$29,000 - Program Expansion Growth Investments - $6,049 - $10,526 Non-GAAP Add-Backs (Adjustments) - $6,049 - $10,526 Total Growth Investments ~$8,000 $6,049 ~$29,000 $10,526 Operating Expenses Capital Expenses Universal Technical Institute, Inc. Announces Next Phase of "North Star Strategy" to Accelerate Growth, Diversification and Optimization2 Strategy expected to deliver approximately 10 percent revenue CAGR and expand Adjusted EBITDA margin to nearly 20 percent through fiscal 2029 PHOENIX, August 5, 2024 -- Universal Technical Institute, Inc., a leading workforce solutions provider, today announced the next phase of its "North Star Strategy" to accelerate the company's mission to close the skilled workforce gap in America …“we expect to launch a minimum of six programs annually at our existing campuses beginning in fiscal year 2025 and open at least two new campuses each year between fiscal years 2026 and 2029…” 16

17 Appendix

18 Business Overview • 15+ programs for in-demand fields across transportation and skilled trades • Program Mix (FY2024 Revenue): – Auto/Diesel 67%, Other Transportation 12%, Welding 8%, Other Skilled Trades 8%, and Industry Training 6% • Program additions and new campus launches remain part of the division’s growth roadmap Mission Statement To serve our students, partners, and communities by providing quality education and support services for in-demand careers. Universal Technical Institute Division Overview A leading provider of transportation, energy and skilled trades technical training, driven to change the world one life at a time by helping people achieve their dreams. 1 Fiscal 2024 2 Based on most recent reporting periods. Ratios represent averages across UTI’s 4 OPEIDs, though individual program results may vary significantly from the mean. Note that effective this fiscal year, the 90/10 ratio includes all federal funding, including VA. This change is the primary driver for the yoy increase; Further, due to the COVID-19 pandemic, ED paused all loan payments from March 13, 2020 through September 30, 2023, significantly decreasing default rates. 3 Aggregated rates based on reporting in the ACCSC 2024 annual reports. Each of the ACCSC program outcomes is evaluated individually. The ACCSC reports exclude graduates from the employment rate calculation who were not available for employment because of continuing education, military service, health, incarceration, death or international student status. See UTI.edu/disclosures for further information. Summary Statistics Founded 1965 Revenue1 $486M Operating Inc.1 (Margin) $78M (16.0%) Adj. EBITDA1 (Margin) $104M (21.4%) Locations 16 Campuses in 9 States Key Metrics Avg. Enrollment1 ~14k Students Cohort Default Rate2 0% 90/10 Ratio2 ~79% Graduation Rate3 ~70% Employment Rate3 ~82% Composite Score: Calculated and reported only at an enterprise level. Reported score for FYE 9/30/24 was 2.3. Note: For detailed reconciliations of Non-GAAP measures see the Appendix.

19 UTI Division Programs by Location MSAT = Manufacturer-Specific Advanced Training (offerings vary by location) Note some programs above have been announced but are not yet open at all locations shown. 1 UTI Avondale and Motorcycle Mechanics Institute Phoenix 2 UTI Houston and MIAT Houston 3 UTI Orlando and Orlando Motorcycle & Marine Mechanics Institutes Austin, Texas Avondale, Arizona1 Bloomfield, New Jersey Canton, Michigan Dallas, Texas Exton, Pennsylvania Houston, Texas2 Lisle, Illinois Long Beach, California Miramar, Florida Mooresville, North Carolina Orlando, Florida3 Rancho Cucamonga, California Sacramento, California Transportation Airframe & Powerplant Automotive Collision Diesel Marine Motorcycle MSAT NASCAR Tech Energy Energy Technology Wind Power Skilled Trades CNC Machining HVACR Industrial Maintenance Non-Destrictive Testing Robotics & Automation Welding
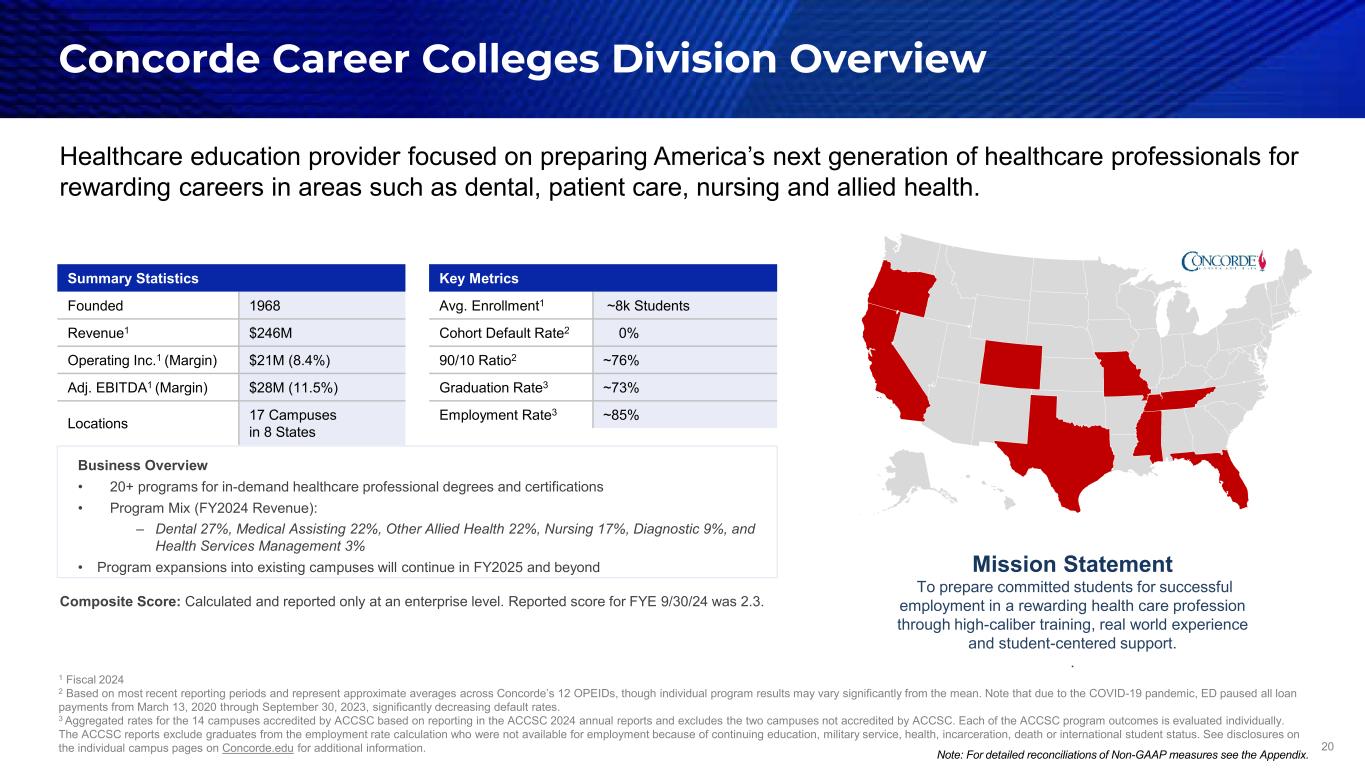
20 Business Overview • 20+ programs for in-demand healthcare professional degrees and certifications • Program Mix (FY2024 Revenue): – Dental 27%, Medical Assisting 22%, Other Allied Health 22%, Nursing 17%, Diagnostic 9%, and Health Services Management 3% • Program expansions into existing campuses will continue in FY2025 and beyond Healthcare education provider focused on preparing America’s next generation of healthcare professionals for rewarding careers in areas such as dental, patient care, nursing and allied health. 1 Fiscal 2024 2 Based on most recent reporting periods and represent approximate averages across Concorde’s 12 OPEIDs, though individual program results may vary significantly from the mean. Note that due to the COVID-19 pandemic, ED paused all loan payments from March 13, 2020 through September 30, 2023, significantly decreasing default rates. 3 Aggregated rates for the 14 campuses accredited by ACCSC based on reporting in the ACCSC 2024 annual reports and excludes the two campuses not accredited by ACCSC. Each of the ACCSC program outcomes is evaluated individually. The ACCSC reports exclude graduates from the employment rate calculation who were not available for employment because of continuing education, military service, health, incarceration, death or international student status. See disclosures on the individual campus pages on Concorde.edu for additional information. Mission Statement To prepare committed students for successful employment in a rewarding health care profession through high-caliber training, real world experience and student-centered support. . Summary Statistics Founded 1968 Revenue1 $246M Operating Inc.1 (Margin) $21M (8.4%) Adj. EBITDA1 (Margin) $28M (11.5%) Locations 17 Campuses in 8 States Key Metrics Avg. Enrollment1 ~8k Students Cohort Default Rate2 0% 90/10 Ratio2 ~76% Graduation Rate3 ~73% Employment Rate3 ~85% Concorde Career Colleges Division Overview © GeoNames, Microsoft, TomTom Powered by Bing Note: For detailed reconciliations of Non-GAAP measures see the Appendix. Composite Score: Calculated and reported only at an enterprise level. Reported score for FYE 9/30/24 was 2.3.
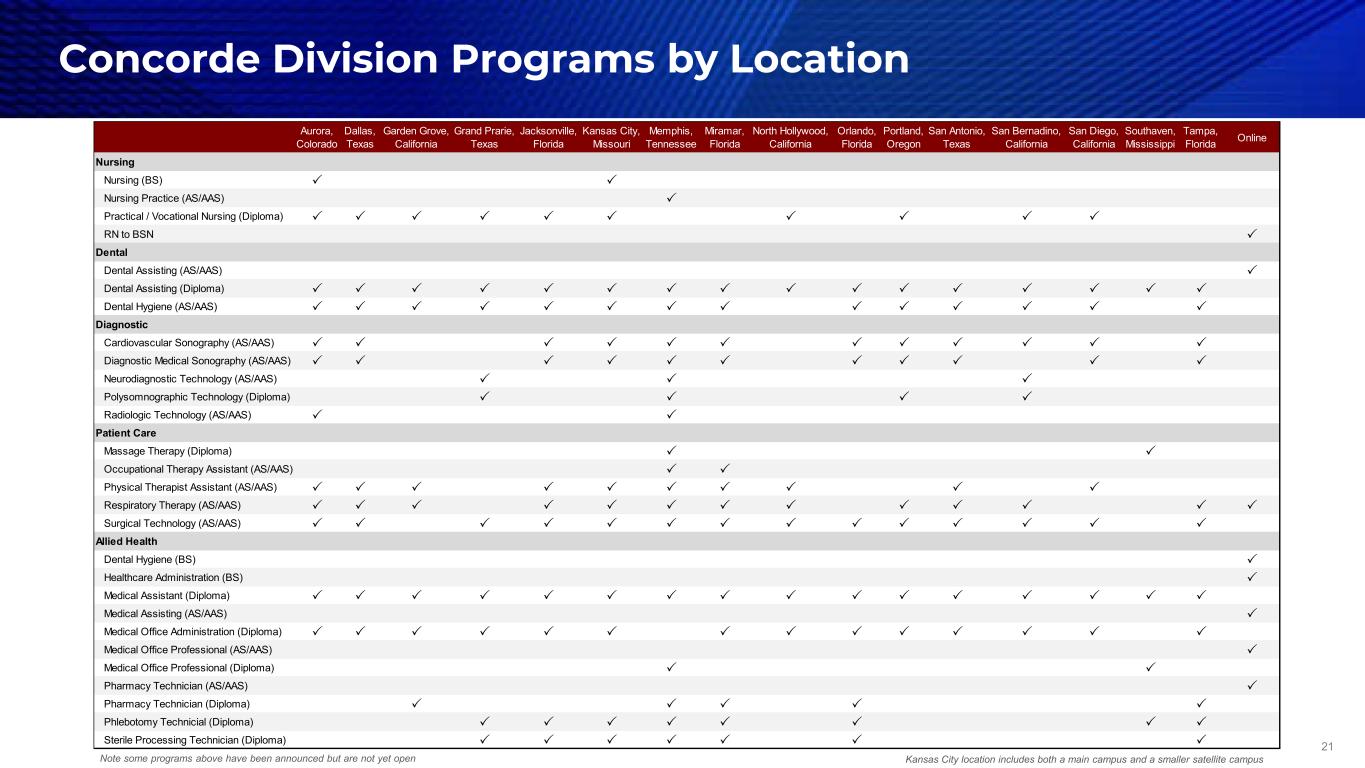
21 Concorde Division Programs by Location Note some programs above have been announced but are not yet open Kansas City location includes both a main campus and a smaller satellite campus Aurora, Colorado Dallas, Texas Garden Grove, California Grand Prarie, Texas Jacksonville, Florida Kansas City, Missouri Memphis, Tennessee Miramar, Florida North Hollywood, California Orlando, Florida Portland, Oregon San Antonio, Texas San Bernadino, California San Diego, California Southaven, Mississippi Tampa, Florida Online Nursing Nursing (BS) Nursing Practice (AS/AAS) Practical / Vocational Nursing (Diploma) RN to BSN Dental Dental Assisting (AS/AAS) Dental Assisting (Diploma) Dental Hygiene (AS/AAS) Diagnostic Cardiovascular Sonography (AS/AAS) Diagnostic Medical Sonography (AS/AAS) Neurodiagnostic Technology (AS/AAS) Polysomnographic Technology (Diploma) Radiologic Technology (AS/AAS) Patient Care Massage Therapy (Diploma) Occupational Therapy Assistant (AS/AAS) Physical Therapist Assistant (AS/AAS) Respiratory Therapy (AS/AAS) Surgical Technology (AS/AAS) Allied Health Dental Hygiene (BS) Healthcare Administration (BS) Medical Assistant (Diploma) Medical Assisting (AS/AAS) Medical Office Administration (Diploma) Medical Office Professional (AS/AAS) Medical Office Professional (Diploma) Pharmacy Technician (AS/AAS) Pharmacy Technician (Diploma) Phlebotomy Technicial (Diploma) Sterile Processing Technician (Diploma)

22 Illustrative Organic Growth Opportunities ($10) $0 $10 $20 $30 $40 Year 0/1 Year 2 Year 3 Year 4 Year 5 New Campus* ($0.5) $0.0 $0.5 $1.0 $1.5 $2.0 $2.5 Year 0/1 Year 2 Year 3 Year 4 Year 5 HVACR (UTI) ($1) $0 $1 $2 $3 $4 $5 Year 0/1 Year 2 Year 3 Year 4 Year 5 Dental Hygiene (Concorde) Note: Financial projections based on management’s current beliefs, expectations and assumptions about future events, conditions and results. Representative figures include startup expenses and are not fully burdened (i.e., exclude allocated corporate and marketing costs and working capital considerations). Growth strategy expected to include additional program expansions and new campuses. Below examples are for directional guidance on financial impact. HVACR Program Dental Hygiene Program UTI Division Concorde Division CapEx Requirement $8M-$25M ~$0.6M ~$2.3M IRR (10-year) 30%-40%+ 70%+ 30%+ Sq Footage Requirement 35,000-115,000 4,000 7,500 Avg Students 600-1,200 ~80 ~70 New Campus *Pro forma optimized campus projections shown. Actual financial profiles will vary by location and program mix. = UTI = Concorde
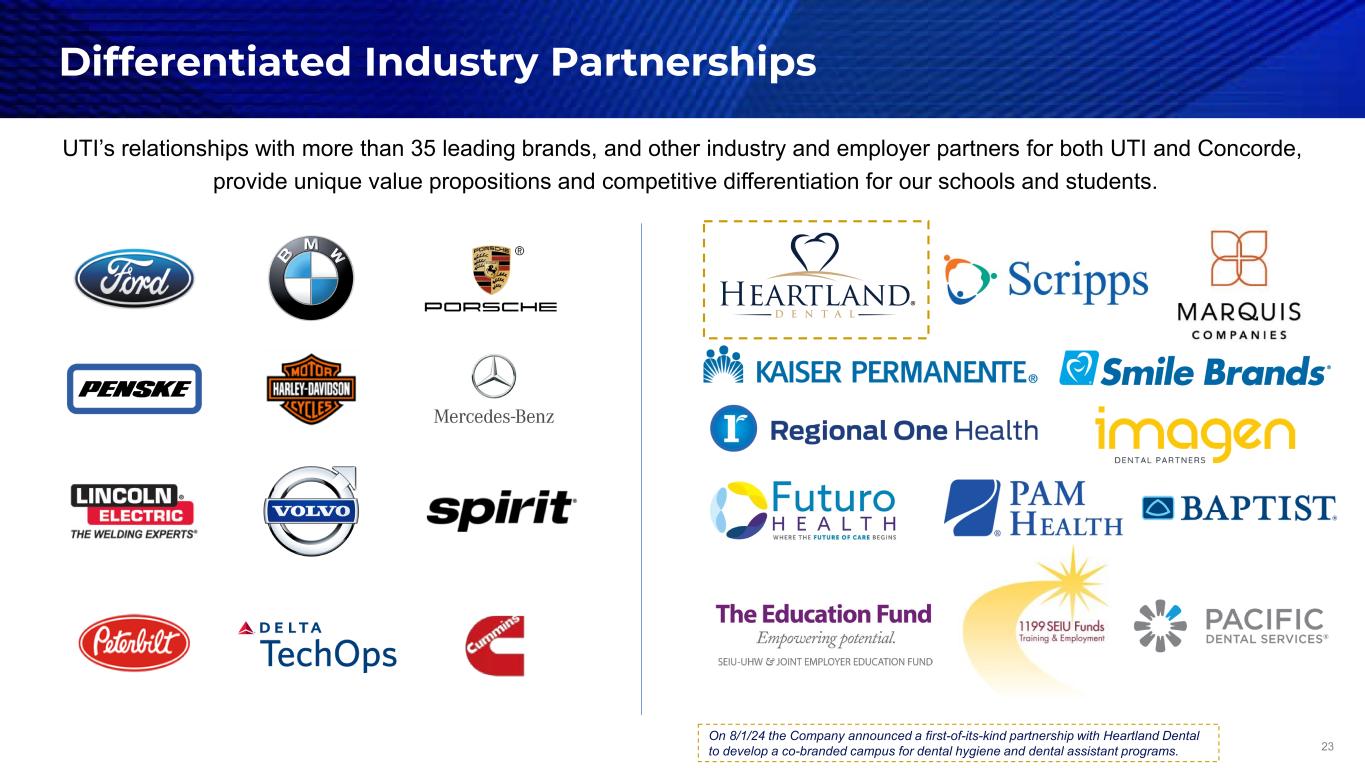
23 Differentiated Industry Partnerships UTI’s relationships with more than 35 leading brands, and other industry and employer partners for both UTI and Concorde, provide unique value propositions and competitive differentiation for our schools and students. On 8/1/24 the Company announced a first-of-its-kind partnership with Heartland Dental to develop a co-branded campus for dental hygiene and dental assistant programs.

24 • June 2016: Coliseum Holdings purchased 700,000 shares of Series A Convertible Preferred Stock for $70 million – Initial 700,000 shares were convertible into 21,021,021 shares of common stock (~30:1) – Subject to NYSE voting and conversion caps, and certain education regulatory approval limitations • February 2020: Stockholders approved removal of NYSE voting and conversion caps • September 2020: Coliseum distributed all 700,000 shares to affiliates (incl. Coliseum entities) and non-affiliates – Affiliates received 24.9% (from 39.2%) of outstanding shares on an as-converted basis > Education regulatory limitation remains; voting and conversion cap of 9.99% of outstanding shares – Non-Affiliates received remaining 14.3% of outstanding shares on an as-converted basis; no voting or conversion caps on an individual basis Background Dividends • 7.5% annual dividend: ~$5.1 million was paid in cash in semi-annual installments in March and September 2023, and a final cash payment of $1.1 million was made in December 2023 in conjunction with the conversion • By Preferred Holders: Convertible to common at any time at the option of the holder, subject to any caps – Coliseum & Affiliates subject to education regulatory approval cap of 9.99%, must request removal by UTI • By UTI, Inc*: When the daily VWAP of UTI common stock is ≥$8.33 for 20 consecutive trading days (excluding trading windows closed to insiders), UTI may require conversion of any/all outstanding preferred stock into common, subject to removal of any capsConversion Terms History of Preferred Stock All remaining preferred shares outstanding were converted to common on 12/18/2023 Note: Above is intended as a summary only and is subject in its entirety to the actual terms contained in our filings with the SEC. Additional details may be found in the Company’s public filings including its 10-Ks, 8-Ks, proxy statements and the 2016 Certificate of Designations. * On December 18, 2023, the Company satisfied the conditions necessary to allow it to convert all remaining Series A preferred shares into common shares. Immediately preceding the conversion, the Company repurchased ~33k preferred shares. Total outstanding common shares increased by ~19.3 million as a result of the conversion. Coliseum Capital owned 9.3 million shares, or 17.3% of outstanding common stock as of September 30, 2024.

25 Non-GAAP Information

26 In addition to disclosing financial results that are determined in accordance with U.S. generally accepted accounting principles ("GAAP"), the Company also discloses certain non-GAAP financial information. These financial measures are not recognized measures under GAAP and are not intended to be and should not be considered in isolation or as a substitute for, or superior to, the financial information prepared and presented in accordance with GAAP. The Company discloses these non-GAAP financial measures because it believes that they provide investors an additional analytical tool to clarify its results of operations and identify underlying trends. Additionally, the Company believes that these measures may also help investors compare its performance on a consistent basis across time periods. The Company defines adjusted EBITDA as net income (loss) before interest expense, interest income, income taxes, depreciation and amortization, adjusted for stock-based compensation expense and items not considered normal recurring operations. The Company defines adjusted free cash flow as net cash provided by (used in) operating activities less capital expenditures, adjusted for items not considered normal recurring operations. Management utilizes adjusted figures as performance measures internally for operating decisions, strategic planning, annual budgeting and forecasting. For the periods presented, our adjustments for items that management does not consider to be normal recurring operations include: • Acquisition-related costs: We have excluded costs associated with both potential and announced acquisitions to allow for comparable financial results to historical operations and forward-looking guidance. • Integration-related costs for completed acquisitions: We have excluded integration costs related to business structure realignment and new programs for recent acquisitions to allow for comparable financial results to historical operations and forward-looking guidance. In addition, the nature and amount of such charges vary significantly based on the size and timing of the programs. By excluding the referenced expenses from our non- GAAP financial measures, our management is able to further evaluate our ability to utilize existing assets and estimate their long-term value. Furthermore, our management believes that the adjustment of these items supplements the GAAP information with a measure that can be used to assess the sustainability of our operating performance. • One-time costs associated with new campus openings: During fiscal 2022, we opened new campus locations in Austin, Texas and Miramar, Florida. We continued to incur one-time costs during fiscal 2023 for the campus opening as we completed the build-out of the remaining programs in the new facilities. We disclose any campus adjustments as direct costs (net of any corporate allocations). Outfitting a new campus requires significant facility improvements and modifications, and the purchase of technical equipment and training aids necessary for teaching our programs, the combination of which requires a significant investment by the Company which would not be considered part of normal recurring operations. • Restructuring charges: In December 2023, we announced plans to consolidate the two Houston, Texas campus locations to align the curriculum, student facing systems, and support services to better serve students seeking careers in in-demand fields. As part of the transition, the MIAT-Houston campus, acquired in November 2021, began a phased teach-out in May 2024. This consolidated MIAT-Houston location will operate as part of the UTI-Houston campus, and MIAT-Houston students who have not completed their programs before their program’s teach-out date may enroll at UTI-Houston to complete their program. Both facilities will remain in use post-consolidation. • Facility lease accounting adjustments: During 2024, we recorded a lease accounting adjustment for a lease termination payment for the previous Concorde corporate offices. These adjustments are not considered part of normal recurring operations. • Costs related to the purchase of our campuses: We lease the majority of our campus locations. Over the past three years due to shifts within the real estate environment, we have been presented with the opportunity to purchase three of our campus locations. These purchases are significant capital expenditures and not considered part of normal recurring operations. To obtain a complete understanding of our performance, these measures should be examined in connection with net income (loss) and net cash provided by (used in) operating activities, determined in accordance with GAAP, as presented in the financial statements and notes thereto included in the annual and quarterly filings with the SEC. Because the items excluded from these non-GAAP measures are significant components in understanding and assessing our financial performance under GAAP, these measures should not be considered to be an alternative to net income (loss) or net cash provided by (used in) operating activities as a measure of our operating performance or liquidity. Exclusion of items in the non-GAAP presentation should not be construed as an inference that these items are unusual, infrequent or non-recurring. Other companies, including other companies in the education industry, may define and calculate non-GAAP financial measures differently than we do, limiting their usefulness as a comparative measure across similarly titled performance measures presented by other companies. A reconciliation of the historical non-GAAP financial measures to the most directly comparable GAAP measures is included in the following slides and investors are encouraged to review the reconciliations. Information reconciling forward-looking adjusted EBITDA and adjusted free cash flow to the most directly comparable GAAP financial measure is unavailable to the company without unreasonable effort. The company is not able to provide a quantitative reconciliation of forward-looking adjusted EBITDA or adjusted free cash flow to the most directly comparable GAAP financial measure because certain items required for such reconciliation are uncertain, outside of the company’s control and/or cannot be reasonably predicted, including but not limited to the provision for (benefit from) income taxes. Preparation of such reconciliation would require a forward-looking statement of income and statement of cash flows prepared in accordance with GAAP, and such forward-looking financial statements are unavailable to the company without unreasonable effort. Use of Non-GAAP Financial Information

27 Adjusted EBITDA Reconciliation ($ in thousands) 1. Costs related to both announced and potential acquisition targets; FY2025 projected spend is an estimate and is fully contingent on whether the Company pursues an acquisition this year. 2. Costs related to integrating the MIAT programs at the UTI campuses and launching Concorde programs that were previously approved by regulatory bodies prior to the acquisition are presented in “Integration-related costs for completed acquisitions.” In prior quarters, these costs were presented in a line labeled “Start-up costs for new campuses and program expansion.” As the nature of the spend and activity are more aligned to integration, we have updated our presentation and recast the prior year for comparability. 3. The Austin, TX and Miramar, FL campuses opened during FY2022. The adjustment reflects one-time opening costs incurred for both campuses. 4. In December 2023, the Company announced plans to consolidate its MIAT-Houston and UTI-Houston operations beginning in fiscal 2024 and completing in early fiscal 2025. 5. Facility lease accounting adjustments: During 2024, we recorded a lease accounting adjustment for a lease termination payment for the previous Concorde corporate offices. These adjustments are not considered part of normal recurring operations. Notes: The acquisition of Concorde closed on December 1, 2022 (FY2023), impacts comparability across periods; Expected adjustments outlined for FY2025 are illustrative only and may differ from what is realized, either in the amounts &/or the categories shown. Net income, as reported ~$54,000 $42,001 $12,322 Interest expense (income), net ~1,000 3,157 3,795 Income tax expense (benefit) ~20,000 14,229 5,765 Depreciation and amortization ~33,000 29,324 25,215 EBITDA ~$108,000 $88,711 $47,097 Stock-based compensation expense ~9,000 8,560 3,848 Acquisition-related costs(1) ~3,000 − 2,374 Integration-related costs for completed acquisitions(2) − 6,049 8,585 One-time costs associated with new campus openings(3) − − 2,341 Restructuring costs(4) ~2,000 185 − Facility lease accounting adjustments(5) − (650) − Adjusted EBITDA, non-GAAP ~$122,000 $102,855 $64,245 FY2025 Guidance Range $120,000-$124,000 Actual Fiscal 2024 Actual Fiscal 2023 Guidance Midpoint Fiscal 2025

28 Adjusted Free Cash Flow Reconciliation ($ in thousands) 1. In March 2023 we purchased the three primary buildings and related land at our Orlando, FL campus. 2. Costs related to both announced and potential acquisition targets; FY2025 projected spend is an estimate and is fully contingent on whether the Company pursues an acquisition this year. 3. Costs related to integrating the MIAT programs at the UTI campuses and launching Concorde programs that were previously approved by regulatory bodies prior to the acquisition are presented in “Cash outflow for integration-related costs for completed acquisition" and "Cash outflow for integration-related property and equipment." In prior quarters, these costs were presented in a line labeled “Cash outflow for start-up costs for new campuses and program expansion" and "Cash outflow for property and equipment for new campuses and program expansion." As the nature of the spend and activity are more aligned to integration, we have updated our presentation and recast the prior year for comparability. 4. The Austin, TX and Miramar, FL campuses opened during FY2022. The adjustment reflects one-time opening costs incurred for both campuses. 5. In December 2023, the Company announced plans to consolidate its MIAT-Houston and UTI-Houston operations beginning in fiscal 2024 and completing in early fiscal 2025. 6. Facility lease accounting adjustments: During 2024, we recorded a lease accounting adjustment for a lease termination payment for the previous Concorde corporate offices. These adjustments are not considered part of normal recurring operations. Note: Expected adjustments outlined for FY2025 are illustrative only and may differ from what is realized, either in the amounts &/or the categories shown. Guidance Midpoint Fiscal 2025 Actual Fiscal 2024 Actual Fiscal 2023 Cash flow provided by operating activities, as reported ~$110,000 $85,895 $49,148 Purchase of property and equipment ~(55,000) (24,298) (56,685) Free cash flow, non-GAAP ~55,000 $61,597 ($7,537) Adjustments Cash outflow to purchase campuses(1) − − 26,156 Cash outflow for acquisition-related costs(2) ~3,000 − 2,347 Cash outflow for integration-related costs for completed acquisitions(3) − 6,196 7,768 Cash outflow for integration-related PP&E(3) − 4,330 10,530 Cash outflow for one-time costs associated with new campus openings(4) − − 2,341 Cash outflow for PP&E associated with new campus openings(4) − − 7,484 Cash outflow for restructuring costs and PP&E(5) ~2,000 632 − Cash outflow for facility lease accounting adjustments(6) − 700 − Adjusted Free Cash Flow, non-GAAP ~$60,000 $73,455 $49,089 FY2025 Guidance Range $58,000-$62,000

29


