UNITED STATES
SECURITIES AND EXCHANGE COMMISSION
Washington, D.C. 20549
FORM 10-K
FOR ANNUAL AND TRANSITION REPORTS
PURSUANT TO SECTIONS 13 OR 15(d) OF THE
SECURITIES EXCHANGE ACT OF 1934
(Mark One)
| x | ANNUAL REPORT PURSUANT TO SECTION 13 OR 15(d) OF THE SECURITIES EXCHANGE ACT OF 1934 |
For the fiscal year ended December 31, 2006
OR
| ¨ | TRANSITION REPORT PURSUANT TO SECTION 13 OR 15(d) OF THE SECURITIES EXCHANGE ACT OF 1934 |
For the transition period from ______________ to ______________
Commission File Number: 000-50460
Tessera Technologies, Inc.
(Exact Name of Registrant as Specified in Its Charter)
| | |
| Delaware | | 16-1620029 |
| (State or Other Jurisdiction of Incorporation or Organization) | | (I.R.S. Employer Identification No.) |
| |
3099 Orchard Drive San Jose, California 95134 | | (408) 894-0700 |
| (Address of Principal Executive Offices) (Zip Code) | | (Registrant’s Telephone Number, Including Area Code) |
Securities registered pursuant to Section 12(b) of the Act:
| | |
| Title of each class: | | Name of each exchange on which registered: |
| Common stock, par value $0.001 per share | | The NASDAQ Stock Market LLC |
Securities registered pursuant to Section 12(g) of the Act: None
Indicate by check mark if the Registrant is a well-known seasoned issuer, as defined in Rule 405 of the Securities Act of 1933. Yesx No ¨
Indicate by check mark if the Registrant is not required to file reports pursuant to Section 13 or Section 15(d) of the Exchange Act. Yes ¨ No x
Indicate by check mark whether the Registrant: (1) has filed all reports required to be filed by Section 13 or 15(d) of the Securities Exchange Act of 1934 during the preceding 12 months (or for such shorter period that the Registrant was required to file such reports), and (2) has been subject to such filing requirements for the past 90 days. Yes x No ¨
Indicate by check mark if disclosure of delinquent filers pursuant to Item 405 of Regulation S-K is not contained herein, and will not be contained, to the best of registrant’s knowledge, in definitive proxy or information statements incorporated by reference in Part III of this Form 10-K or any amendment to this Form 10-K. ¨
Indicate by check mark whether the Registrant is a large accelerated filer, an accelerated filer, or a non-accelerated filer. See definition of “accelerated filer and large accelerated filer” in Rule 12b-2 of the Exchange Act (Check one).
Large accelerated filerx Accelerated filer¨ Non-accelerated filer¨
Indicate by check mark whether the Registrant is a shell company (as defined in Rule 12b-2 of the Exchange Act). Yes ¨ No x
The aggregate market value of the voting and non-voting common equity held by non-affiliates of the registrant, based upon the closing sale price of common stock as reported on the Nasdaq Global Market, on February 26, 2007 was $2,058,611,042.
As of February 26, 2007 47,488,144 shares of the registrant’s common stock were outstanding.
DOCUMENTS INCORPORATED BY REFERENCE:
Portions of the Definitive Proxy Statement for registrant’s 2007 Annual Meeting of Stockholders to be held May 17, 2007 will be filed with the Commission within 120 days after the close of the registrant’s fiscal year and are incorporated by reference in Part III.
ANNUAL REPORT ON FORM 10-K
FOR THE FISCAL YEAR ENDED DECEMBER 31, 2006
TABLE OF CONTENTS
PART I
Forward-Looking Statements
This Annual Report (including the following section regarding Management’s Discussion and Analysis of Financial Condition and Results of Operations) contains forward-looking statements regarding our business, financial condition, results of operations and prospects. Words such as “expects,” “anticipates,” “plans,” “believes,” “seeks,” “estimates” and similar expressions or variations of such words are intended to identify forward-looking statements, but are not the exclusive means of identifying forward-looking statements in this Annual Report. Additionally, statements concerning future matters such as the development of new products, enhancements or technologies, sales levels, expense levels and other statements regarding matters that are not historical are forward-looking statements.
Although forward-looking statements in this Annual Report reflect the good faith judgment of our management, such statements can only be based on facts and factors currently known by us. Consequently, forward-looking statements are inherently subject to risks and uncertainties and actual results and outcomes may differ materially from the results and outcomes discussed in or anticipated by the forward-looking statements. Factors that could cause or contribute to such differences in results and outcomes include without limitation those discussed under the heading “Risk Factors” below, as well as those discussed elsewhere in this Annual Report. Readers are urged not to place undue reliance on these forward-looking statements, which speak only as of the date of this Annual Report. We undertake no obligation to revise or update any forward-looking statements in order to reflect any event or circumstance that may arise after the date of this Annual Report. Readers are urged to carefully review and consider the various disclosures made in this Annual Report, which attempt to advise interested parties of the risks and factors that may affect our business, financial condition, results of operations and prospects.
Corporate Information
Our principal executive offices are located at 3099 Orchard Drive, San Jose, California 95134. We also have offices, research and development and manufacturing facilities in other locations as described below in Item 2—Properties. Our telephone number is (408) 894-0700. We maintain a website at www.tessera.com. The reference to our website address does not constitute incorporation by reference of the information contained on this website.
We own or have rights to trademarks and trade names that we use in conjunction with the operation of our business, including for example Tessera and Tessera Technologies. This annual report also includes trademarks and trade names of other parties.
In this annual report, the “Company,” “Tessera,” “we,” “us” and “our” refer to Tessera Technologies, Inc. and, for periods prior to our corporate restructuring in January 2003 or if the context otherwise requires, Tessera, Inc., which is our wholly-owned subsidiary.
Overview
Tessera is a developer and licensor of miniaturization technologies for the electronics industry. We enable improvements in the size, performance and cost of our customers’ products by applying our expertise in the electrical, thermal and mechanical properties of semiconductor materials, and in the design and manufacturing of micro-optics. Our intellectual property includes more than one thousand domestic and internationally issued patents and patent applications, covering a broad range of advanced semiconductor packaging, substrate, interconnect and micro-optics solutions. We license our chip packaging technology to our customers on a worldwide basis, enabling them to produce semiconductor chips that are smaller and faster, and incorporate more
1
features. These semiconductors are utilized in a broad range of electronics products, including digital audio players, digital cameras, personal computers, personal digital assistants (PDAs), video game consoles and mobile phones. In addition, by using our technology, we believe that our customers are also able to reduce the time to market, and the development costs of their semiconductors.
Our patented chip packaging technology enables our customers to assemble semiconductor chips into chip-scale packages (CSPs) that are almost as small as the chip itself. This technology also enables multiple chips to be stacked vertically in a single three-dimensional multi-chip package that occupies almost the same circuit board area as a CSP. Our technology allows several semiconductor chips and passive components to be densely combined in ultra-compact electronics modules. By reducing the size of the semiconductor package and shortening electrical connections between the chip and the circuit board, our technology allows further miniaturization and increases in performance and functionality for electronic products. We achieve these benefits without sacrificing reliability by allowing movement within the package, thus addressing critical problems associated with thermally-induced stress which can occur when packages decrease in size. Our technologies also enable our customers to package semiconductor chips and micro-devices at the wafer level (wafer level packaging or WLP) and to create high-density interconnections between electronic components using flexible substrate materials.
We have a significant consumer optics technology portfolio that includes image sensor packaging, wafer-level camera manufacturing technology, camera assembly technology and technology for auto focus and zoom. According to market research firm Prismark, the market for consumer electronic devices that contain cameras, including mobile phones, notebook computers, security systems and automotive electronics, will increase to approximately 1.7 billion units in 2010. We believe that we are well-positioned to take advantage of this expected significant growth in consumer optics. We have an ongoing effort to develop and license optical technologies for the mobile phone market. This market is growing rapidly, with over 1.0 billion cameras expected to be incorporated in mobile phones in 2010.
We derive license fees and royalties based upon our intellectual property, and generate fees for related services. Our semiconductor chip packaging technology has been widely adopted and is currently licensed to more than 60 companies, including Intel Corporation, Renesas Technology Co., Samsung Electronics Co., Ltd., Sharp Corporation, Texas Instruments, Inc. and Toshiba Corporation. We believe that more than 100 companies across the semiconductor supply chain have invested in the materials, equipment and assembly infrastructure needed to manufacture products that incorporate our packaging technology. As a result, our technology has been incorporated into more than 10.0 billion semiconductors worldwide. Based upon Gartner Dataquest, we anticipate that the market using Tessera CSP technology will grow to more than 16.4 billion units in 2008, from 8.1 billion units in 2005, representing a compound annual growth rate of 27%.
Industry Background
Packaged semiconductor chips, which we refer to as semiconductors, are essential components in a broad range of communications, computing and consumer electronic products. According to the Semiconductor Industry Association, worldwide semiconductor sales totaled $ 247.7 billion in 2006 and are expected to grow to $321.0 billion in 2009. Many electronic products require increasingly complex semiconductors that are smaller and higher-performing, integrate more features and functions and are less expensive to produce than previous generations of semiconductors. Satisfying the demand for these complex semiconductors requires advances in semiconductor design, manufacturing and packaging technologies.
The disaggregation of the semiconductor industry and the emergence of intellectual property companies
Historically, most semiconductor companies were vertically integrated. They designed, fabricated, packaged and tested their semiconductors using internally developed software design tools and manufacturing processes
2
and equipment. As the cost and skills required for designing and manufacturing complex semiconductors have increased, the semiconductor industry has become disaggregated, with companies concentrating on one or more individual stages of the semiconductor development and production process. This disaggregation has fueled the growth of fabless semiconductor companies, design tool vendors, semiconductor equipment manufacturers, third-party semiconductor manufacturers, or foundries, semiconductor assembly, package and test companies and intellectual property companies that develop and license technology to others.
While specialization has enabled greater development and manufacturing efficiency, it has also created an opportunity for intellectual property companies that develop and license technology to meet fundamental, industry-wide challenges. These intellectual property companies gain broad adoption of their technology throughout the industry by working with companies within the semiconductor supply chain to invest in the infrastructure needed to support their technology. This collaboration and investment benefit semiconductor companies by enabling them to bring new technology to market faster and more cost-effectively, without having to make the investment themselves.
Demand for system-level miniaturization and increased performance
Miniaturization of electronic products, or system-level miniaturization, is a significant challenge for manufacturers of electronic products and their suppliers, including semiconductor companies. Digital cameras, digital audio players, personal computers, PDA’s, video game consoles, mobile phones and other electronic products are being made smaller with improved performance and an increasing number of advanced features. Semiconductor companies have traditionally responded to these challenges by shrinking the size of the basic semiconductor building block, or transistor, allowing for more transistors to be integrated on a single chip. For decades, the consistent reduction in transistor size has resulted in higher-performance, lower-cost chips that require less silicon area. In addition, transistors have become small enough to make it economical to combine multiple functions, such as logic, memory and analog, on a single chip, in what is commonly referred to as a system-on-a-chip.
Importance of semiconductor packaging and interconnect
While the integration of increased functionality on a chip is critical to the miniaturization of electronic products, its impact has been limited by packaging and interconnect technology, which has not kept pace with the advancements achieved by chip integration. Semiconductor chips are typically assembled in packages that act as the physical and electrical interface between the chip and the printed wiring board. The package protects the chip from breakage, contamination and stress. In addition, the package enables a chip to be easily tested prior to its incorporation into a system, enabling high system yields and lowering the total system cost. Traditional semiconductor packages are much larger than the chip itself and occupy significant printed wiring board and system area. Traditional packaging technologies are less capable of accommodating faster semiconductor speeds due to longer electrical connections. Due to these limitations, traditional semiconductor packages are not well suited to meet the increasing demand for product miniaturization, functionality and performance. The miniaturization of packaged semiconductors often presents reliability problems because the shorter connections are more vulnerable to breakage due to thermally-induced stress and mechanical shock. Overcoming these problems has been one of the most significant technical challenges in shrinking semiconductor packages to the size of the chip itself. As a result, in addition to continuing advancements in chip integration, advanced packaging and interconnect technologies are required to achieve further miniaturization and higher performance cost-effectively.
Growth of consumer optics creating demand for lower cost production and simpler integration
The integration and use of optics in volume products has grown dramatically over the last two decades. Miniature cameras have proliferated in wireless consumer devices such as smart phones, PDAs, and notebook computers. According to market research firm Prismark, the market for consumer electronic devices that contain
3
cameras, including mobile phones, notebook computers, security systems and automotive electronics will increase to approximately 1.7 billion units in 2010. Recent trends to increase the functionality and decrease the size of such wireless consumer devices and penetrate additional markets such as the automotive and security markets present significant challenges to manufacturers of miniature cameras. In particular, the explosive growth of the mobile phone camera market has created a need for new techniques to provide a continued path to lowered costs. Consumers and manufacturers of mobile phones desire to continually reduce the size of and create thinner phones in order to free up space for additional functionality. Particularly in the case of camera modules, there is a significant need for lower cost and lower height. As the cost of electronic devices has dropped, optics and optics assembly have become a significant portion of the cost of mobile phone camera modules. In addition, newer image sensors require higher precision optics to get the benefit of increased resolutions. At the same time, the miniaturization of these devices is creating a need for new ways of integrating optics with electronics. Traditional approaches to optics manufacturing have limitations in their ability to reduce size and cost. Traditional approaches involve bulky and complex optical assemblies, expensive connectors and other components, and labor for assembly and testing, all of which tend to increase the final system package size and cost. Conventional approaches to volume optics production involve molding of plastic or glass, which are time-consuming and produce small numbers of optics at a time. Glass molding requires relatively long cycle times and consequently has a higher cost than plastic molding. As demand for optics in consumer applications grows, we believe the limitations of conventional approaches will become a barrier to further adoption. In addition, we believe there is a significant opportunity for technologies that eliminate moving parts, and provide size, cost, reliability and power advantages over existing mechanical technologies for focus and zoom.
Our Solution
We are a leading provider of intellectual property for chip-scale, multi-chip and wafer-level packaging, and of micro-optics solutions, all of which meet the increasing demand for miniaturization and high performance in electronic products. We license a substantial portion of our intellectual property on a worldwide basis under our Tessera Compliant Chip, or TCC, license. This license primarily covers our core chip-scale and multi-chip packaging patents. We also offer an intellectual property license on a worldwide basis under our wafer level technologies license, which covers our wafer level optical packaging patents. In addition, we offer an intellectual property license on a worldwide basis under our interconnect technologies license, which covers our advanced package substrate, flexible printed circuit and printed wiring board patents. We support the adoption of our technology by providing our customers with engineering services focused on addressing key issues related to the miniaturization and performance of electronics products. Our packaging and interconnect technologies provide the following benefits which are not provided by traditional packaging technologies:
Miniaturization. Our CSP technology and associated CSP substrate technology enables fully-packaged chips to be almost as small as the chip itself, which permits increased product miniaturization and functionality. Our multi-chip packaging, or MCP, technology and associated MCP substrate technology extends this benefit by enabling multiple semiconductors to be stacked vertically, while occupying about the same printed wiring board area as a CSP. For example, our technology is broadly used to produce Flash memory and static random access memory, or SRAM, devices stacked in a multi-chip package utilized in mobile phones. As a result, we believe our MCP technology enables electronic products to achieve new levels of miniaturization and functionality. In addition, our WLP technology enables chip packages in which the area of the package is exactly the same size as the area of the chip itself.
High performance. Our packaging and interconnect technology offers shorter electrical connections between the chip and printed wiring board and between adjacent chips. Shorter connections allow information to be more rapidly transferred between the semiconductors and the system, yielding better system performance. Our technology is used for high performance DRAM chip, such as Double-Data-Rate two, or DDR2 DRAM. Our CSP technology has been widely adopted for use in high-speed memory applications, such as high-performance personal computers, network switches and routers, set-top boxes, workstations and video game consoles, such as the Microsoft® Xbox and Xbox® 360® as well as Sony Playstation®2 and Playstation®3.
4
High reliability. Our CSP technology addresses the reliability problems of miniaturized semiconductor packages due to thermally-induced stress and mechanical shock by allowing movement within the package. In addition, our WLP technology provides the ability to protect an image sensor wafer from contamination at the wafer level early in the packaging process. As a result, our technology provides high reliability without the increased package size or cost of competing technologies for a broad range of applications that require miniaturization.
Cost effectiveness. The significant investment made by semiconductor chip makers, assemblers, and material and equipment providers in the manufacturing infrastructure that supports our technology enables high-volume production and broad availability of semiconductors and electronic products that incorporate our technology. This in turn has reduced the cost of manufacturing semiconductors and electronic products that incorporate our technology, allowing it to be used in cost-sensitive semiconductor applications such as dynamic random access memory, or DRAM, Flash memory, SRAM, digital signal processors and image sensors. This subsequently reduces the cost of electronic product applications such as mobile phones, digital still cameras, PDAs, memory modules and MP3 players. We believe that this broad adoption and high volume production of our technology will further increase its cost-effectiveness.
Miniaturization of consumer optics. Our micro-optics technology offers a fundamentally different approach to manufacturing optics, leveraging technologies and processes originally developed for the semiconductor industry. The resulting optics, known as wafer based optics, are created by forming small features on the surface of glass or other substrates. These optics are then used to shape or manipulate light and can be applied to many applications of optics including miniature cameras for mobile phones and automotive applications. Due to the fact that such optics are created at the wafer-scale, hundreds or thousands of optics can be manufactured simultaneously, with great precision and repeatability. In addition, wafers of optics can be stacked to create miniature optical systems. This approach also provides a convenient opportunity to align the optics system in parallel which we believe significantly improves upon the conventional process of one-at-a-time assembly. Wafer based optics provide advantages over conventional optics due to lower cost and lower profile, with the potential of rapidly increasing the capacity of optics available. We are investing in additional consumer optics technology and we also offer an intellectual property license under our wafer based optics technology license, which covers our wafer based optics patents.
Our Strategy
Our objective is to be the leading provider of miniaturization technologies for the electronics industry by developing and licensing technologies that meet the increasing demand for miniaturization, performance and costs in a broad range of communication, computing and consumer electronic products. The following are key elements of our strategy:
Expand the market penetration of our current CSP and MCP technologies. Our patented CSP and MCP technologies have been incorporated in over 10 billion semiconductors worldwide. As a result of the broad adoption of our technology and existing infrastructure that supports our technologies, we believe that we are well positioned to benefit from the substantial growth projected for the CSP and MCP markets. We intend to further increase our share of the CSP and MCP markets by:
| | • | | continuing to target and optimize our technology for large, growing product markets such as digital cameras, digital audio players, personal computers, PDAs, video game consoles and mobile phones; |
| | • | | making continued design, process and cost improvements that drive the incorporation of our technology in new semiconductor applications, such as application specific integrated circuits, or ASIC semiconductors, high-performance DRAM, and other logic applications; and |
| | • | | identifying and approaching companies whose current products potentially incorporate our technology, offering them licenses to our technology, and when necessary, enforcing our intellectual property rights to obtain compensation for the use of our technology consistent with our existing licensing program, |
5
Drive the market acceptance of our next generation CSP and MCP technologies. Our next generation CSP and MCP technologies are being developed to enable Tessera to continue to meet the industry’s demand for small form factor, higher functionality and higher reliability in the future. This technology is designed for products in which miniaturization and feature integration will continue to be critical, including digital cameras, digital audio players, PDAs and mobile phones. We intend to drive the adoption of ournext generation CSP and MCPtechnologies by:
| | • | | collaborating with our customers to develop chip-scale and multi-chip packages to meet their specific product requirements; |
| | • | | capitalizing on the existing materials, equipment and assembly infrastructure that supports our current CSP and MCP technology; and |
| | • | | continuing to reduce the cost of manufacturing semiconductors that incorporate our technology through internal development and collaboration with leading semiconductor materials and equipment companies. |
Accelerate the market acceptance of our wafer level packaging technology. Our WLP technology permits the routing of device contacts either to the front or back side of the package, thereby enabling reduction in the overall size of the finished packaged chip relative to non-WLP packages. In addition, our technology has the ability to protect the image sensor wafer from contamination early in the packaging process, at the wafer level. This technology is designed for products in which miniaturization and manufacturing yield are critical, including camera-equipped mobile phones, digital cameras and PDAs. We intend to accelerate the adoption of our WLP technology by:
| | • | | continuing to target and optimize our technology for large, growing product markets; |
| | • | | making continued design, process and cost improvements that drive the incorporation of our technology in new applications, such as microelectromechanical systems (MEMS); and |
| | • | | identifying and approaching companies which we believe could benefit from incorporating our technology, and offering them licenses to our technology. |
Accelerate the market acceptance of our consumer optics technology. Our technology is based on our expertise in the design, assembly and manufacturing of micro optics systems, which leverages the existing semiconductor manufacturing infrastructure and processes to enable highly miniaturized, lower cost optical systems. In addition, we are developing technology and acquiring best of class technology to complement core technology developed by Tessera. This technology is designed for products in which miniaturization, alignment, and cost are critical, including camera-equipped mobile phones, digital cameras, and PDAs. We intend to accelerate the adoption of our consumer optics technology by:
| | • | | continuing to target and optimize our technology for large, growing product markets; |
| | • | | making continued design, process and cost improvements that drive the incorporation of our technology in a broad range of camera module applications, such as VGA, 2MP and 3MP pixel cameras; |
| | • | | developing partnerships with significant customers in consumer optics fields to assist in defining defacto solutions for optics; and |
| | • | | identifying and approaching companies which we believe could benefit from incorporating our technology, and offering them licenses to our technology. |
Provide engineering services to develop and promote the adoption of our technology. We intend to continue to use our engineering services to accelerate the adoption of our technology, better understand our customers’ advanced packaging requirements, and develop and broaden our intellectual property portfolio. For example, we provide our customers with a broad range of services, such as product and package design and simulation, prototype manufacturing and reliability analysis, and product and package testing to help them develop products that incorporate our technology. This collaboration allows us to better understand our
customers’ future product and packaging technology requirements. We have generated a substantial portion of
6
our service revenues by providing our engineering services to various government agencies. These relationships contribute to the development of our next generation technologies such as three-dimensional multi-chip packaging, which we have offered to commercial customers.
Utilize and enhance the infrastructure supporting our technology. For more than a decade, we have collaborated with our infrastructure partners to help them develop and make widely available low-cost materials, equipment and assembly capacity to manufacture products that incorporate our technology. We design new technologies that are compatible with this existing infrastructure, which facilitates more rapid adoption of these new technologies. We plan to continue to work with our infrastructure partners to expand the adoption of our technology.
Broaden our intellectual property portfolio. We intend to continue to broaden our intellectual property portfolio through internal development, strategic relationships and acquisitions, to enhance the competitiveness and size of our current businesses and diversify into markets and technologies that complement our current businesses. For example, we extended our intellectual property portfolio in the area of WLP by purchasing certain assets of Shellcase, Ltd., and in the area of micro-optics through our acquisition of Digital Optics Corporation. We also intend to continue to utilize our core competency in aggregating and licensing intellectual property to grow and expand our business.
Create demand by collaborating with system manufacturers and electronic manufacturing service providers. We work with leading system manufacturers and electronic manufacturing service providers to increase demand for our technologies. Through these relationships, we align our research and development efforts to better meet their needs.
Our Technology and Services
We derive the majority of our revenues from license fees and royalties associated with our TCC license. Our TCC license grants a worldwide royalty-bearing right to develop, assemble, use and sell certain CSPs and multi- chip packages. The licensed technology primarily includes issued patents and pending patent applications during the term of the license. We also license components of our intellectual property portfolio outside of the TCC license, such as our wafer level packaging technology. In addition, we provide a broad range of engineering, assembly and infrastructure services to our customers.
Our Technology
Our packaging technology is incorporated into packaged semiconductors for use in a broad range of communication, computing and consumer electronics applications. These semiconductors include:
| | • | | Flash memory, SRAM and certain logic integrated circuits (Logic ICs) like digital signal processors (DSPs), ASIC and application specific standard products semiconductors (ASSPs), for use in wireless communication and digital consumer products, including digital cameras, digital audio players, PDAs and mobile phones. These markets are expected to enjoy strong growth. For example, based on Gartner Dataquest forecasts, we anticipate that the market for CSP packaged Logic ICs incorporating Tessera technology will grow from 3.4 billion units in 2005 to 6.2 billion units in 2008, representing a compound annual growth rate of 22%. |
| | • | | DRAM, for use in computing, networking and home entertainment applications, such as personal computers, servers, network switches and routers, set-top boxes and video game consoles. Based on Gartner Dataquest forecasts, we anticipate that the market for CSP packaged DRAM will grow from 2.7 billion units in 2005 to 8.0 billion units in 2008, a compound annual growth rate of 44%. |
| | • | | Image sensors for use in consumer electronic devices that contain cameras, including camera phones, notebooks, security systems and automotive electronics. Based on Techno Systems Research forecasts, we anticipate that the market for images sensors will grow from 0.5 billion units in 2006 to 1.0 billion units in 2008, a compound annual growth rate of 26%. |
7
We also offer packaging solutions for image sensors in electronic devices, including advanced stacked lenses, auto focus and zoom features.
Chip-Scale Package Technology Platforms
Although most of our licensees have developed their own proprietary packages incorporating our intellectual property, we have developed the following CSP platforms which are included in our TCC license:
Micro Ball Grid Array, or µBGA® Platform. Our µBGA® platform includes the lead-bonded µBGA® package and the µBGA®-W package, an alternative that uses wire-bonding as opposed to lead bonding as the package’s internal electrical interconnect. In the µBGA® platform the chip is oriented face-down in the package with its contacts facing the circuit board. We believe this CSP platform offers the best combination of features to meet the requirements of high-performance DRAM semiconductors.
µBGA®-F Platform. The µBGA®-F platform has the chip oriented face-up in the package, with its contacts facing away from the circuit board, and utilizes standard wire-bonding for the package’s internal electrical interconnect. The technology underlying this platform has been broadly adopted and incorporated into a large number of customer-developed proprietary packages for Flash memory, SRAM, DSP, ASIC and ASSP semiconductors used in wireless communication and consumer electronics products.
Multi-Chip Package Technology Platforms
Our technology is incorporated into a number of three-dimensional multi-chip packages used in wireless communication and digital consumer electronics products, such as digital cameras, digital audio players, PDAs and mobile phones. These packages include various combinations of ASIC, ASSP, DSP, Flash memory and SRAM semiconductors. In addition, we have developed a family of three-dimensional multi-chip platforms, which are collectively referred to as the µZ® Stack Package family, to extend this innovative technology into new applications to meet the growing demand for higher levels of integration in computing, communications and consumer electronics. We also develop and design solutions which incorporate analog and RF devices in three-dimensional platforms for a broad range of wireless handheld, computing and consumer electronic products.
We expect these platforms to build upon the existing CSP infrastructure and to enable further miniaturization and increased performance and functionality for a broad range of cost-sensitive, high volume applications. Each platform was developed to resolve complex, technical and business challenges inherent in the miniaturization of electronic products.
We offer the following multi-chip package platforms:
µZ® Chip Stack Platform. The µZ® Chip Stack platform consists of two or more chips, stacked vertically on top of each other and wire-bonded to the package substrate. This is a cost-effective, versatile platform that is used in a broad range of semiconductors and product applications. The technology underlying this platform has been broadly adopted and incorporated into a large number of customer-developed proprietary stacked multi-chip packages for Flash memory, SRAM, DSP, ASIC and ASSP semiconductors, that are used in wireless communication and consumer electronics products.
µZ® Fold-Over Stack Platform. We have introduced our µZ® Fold-Over Stack platform to solve an industry-wide problem associated with the integration of different types of functional blocks, such as processor, memory and various analog blocks, onto a single system-on-a-chip. For example, this package enables ASSP, ASIC and different memory semiconductors to be fully packaged, tested and then integrated, resulting in a high-yielding system-in-a-package. The µZ® Fold-Over Stack platform provides a cost-effective solution that meets mobile phone package height requirements and saves valuable circuit board space, enabling mobile products that are smaller and lighter with more functionality.
8
µZ®-Ball Stack Platform. We have also introduced our µZ®-Ball Stack platform as a multi-chip solution that enables the integration of high-performance DRAM while occupying 25% less circuit board area with 60% of the height of a traditional DRAM package. Because each DRAM chip can be individually tested prior to being assembled in the multi-chip package, common yield problems associated with competing technologies can be overcome. Our µZ®-Ball Stack platform can be used for cost-sensitive, high-volume applications, including DRAM modules for high-performance personal computers, workstations and network switches and routers.
Wafer Level Package Technology Platforms
Our WLP technologies are suitable for a variety of electronics products. The principal application to date is optical sensors-in particular complementary metal oxide semiconductor, or CMOS image sensors for camera-equipped mobile phones, charge-coupled device, or CCD area sensors and linear array image sensors. Our WLP technologies include the following platforms:
SHELLCASE® OP. The SHELLCASE® OP package utilizes an innovative glass-silicon-glass sandwich structure to enable image-sensing capabilities through the actual packaging structure. The end result is a true chip size package with horizontal and vertical dimensions identical to the original die size, and a total package thickness, that in most cases is similar to the original silicon thickness. The SHELLCASE® OP platform is offered in two configurations: “face up”, where the assembled die faces up towards the target image; or “face down” where the assembled die observes the target image through a port in the printed circuit board. SHELLCASE® OP packages offer significant advantages for CMOS and CCD linear and array image sensors, digital imaging and light detection applications. SHELLCASE® OP platforms have been in commercial production since 2000, and can be found in a wide variety of devices, including camera phones, digital cameras and medical devices.
SHELLCASE® OC. The SHELLCASE® OC package is a true chip size package that utilizes an innovative glass-silicon-glass sandwich to enable image-sensing capabilities through the actual packaging structure. SHELLCASE® OC provides an air cavity between the package and the die, making it the packaging solution of choice for image sensors with micro-lenses, such as those used in digital cameras and camera phones, fax machines and digital scanners and machine vision applications, among other portable electronics.
SHELLCASE® CF. The SHELLCASE® CF platform is suitable for image sensors, some types of MEMs, and other optical-based devices. SHELLCASE® CF protects these components from contamination from the initial stage of processing and is compatible with standard wire-bond assembly processes. SHELLCASE® CF provides significant improvement in yield over existing Chip-on-Board (COB) alternatives used to assemble these devices today. This yield improvement is realized through the protection of the sensor’s active area from contamination and the ability to perform wafer-level optical testing prior to module assembly, both of which improve camera module yield and reduce its overall cost.
SHELLCASE® RT. The SHELLCASE® RT platform utilizes an innovative glass-silicon structure to enable image-sensing capabilities through the actual packaging structure. In a SHELLCASE® RT package, the bottom glass layer has been replaced with a polymer layer. That structure provides a true die-sized package with horizontal and vertical dimensions identical to the original chip size, and a total package thickness smaller than the original silicon thickness. The SHELLCASE® RT platform is available in both cavity and non-cavity formats.
9
Wafer Based Optics Technology Platform
With our recent acquisition of Digital Optics Corporation, we acquired a wafer-based optics platform with three core areas of expertise.
Wafer-based diffractive optics. Diffractive optical elements are microscopic patterns that are formed in a substrate (for example, a sheet or wafer of glass or plastic) and are used to manipulate light. Tessera’s wafer-based diffractive optics may be etched in to the surface of glass or silicon wafers in 4 inch to 6 inch diameters, each containing up to several thousand diffractive die. These elements are made with a process similar to that used to make semiconductor microelectronics. These diffractive elements are then used in a variety of end-products such as semiconductor manufacturing equipment (e.g., lithographic steppers) and fiber-optic transceivers. Diffractive elements can also be used in imaging applications, such as camera modules for cell phones, in conjunction with refractive elements to reduce chromatic aberrations.
Wafer-based refractive optics. Refractive optical elements are lenses that bend light through refraction. Instead of conventional fabrication processes in which lenses are fabricated either through grinding individual elements or a molding process in which single or small numbers of elements with each cycle of a machine, Digital Optics Corporation’s wafer based refractive optics are made on 4 inch or 6 inch wafers where thousands of lenses are simultaneously formed on the surface. Refractive lenses are formed on both the front and back surface with submicron precision. Digital Optics Corporation has several methods of manufacturing including direct etch in to the substrate and replication of the lenses in to a polymer layer located on the wafer surface.
Wafer-based assembly and integration. Our wafer-based assembly platform is used to bond multiple wafers of optics together to form integrated miniature optical systems such as visible and IR camera systems. All elements needed to implement an optical system are mapped on to surfaces of wafers. Spacer elements, filters and apertures are also fabricated on wafers with the use of processes similar to those used in our refractive and diffractive optics technologies. The wafers are bonded together and then diced to form individual entire optical systems or sub-systems. In addition we are developing certain technologies that we recently acquired from Eyesquad GmbH in February 2007 related to auto focus and optical zoom capabilities. We continue to develop the Eyesquad GmbH technologies and believe when completed they will be licensable to manufacturers of miniature cameras, either directly or bundled with our wafer level optics technology platforms as they become available, such as a Wafer Level Camera (WLC).
The following table provides a summary of the key features and applications for each of our technologies and the related platforms that are available for licensing.
| | | | | | |
Chip-Scale Package Technology | | Technology Platform | | Key Features | | Semiconductor Applications |
| | µBGA® | | • Small • High performance • High reliability | | DRAM, Flash, SRAM |
| | µBGA®-W | | • Small • High performance • High reliability • Wire-bond | | DRAM, Baseband, µProcessor, RF |
| | µBGA®-F | | • Small • Design flexibility • Low cost • Wire-bond | | ASIC, ASSP, DSP, Flash, SRAM |
10
| | | | | | |
Multi-Chip Package Technology | | Technology Platform | | Key Features | | Semiconductor Applications |
| | µZ® Chip Stack | | • Vertical stack • Small • Wire-bond • Design flexibility | | Flash/SRAM/DRAM stack |
| | µZ® Fold-Over Stack | | • Pre-test • Stacked logic and memory • Enables system-in-a-package • Small • Low profile • 2-4 semiconductor stack • High reliability | | Numerous logic /memory configurations |
| | µZ®-Ball Stack | | • Pre-test • Stacked memory • Small • Low profile • 2-8 Semiconductor Stack • High reliability | | DRAM, Flash, numerous logic /memory configurations |
| | | | |
Wafer Level Package Technology | | SHELLCASE® OP | | • Wafer level | | Image sensors |
| | SHELLCASE® OC | | • Wafer level • Internal cavity | | Image sensors |
| | SHELLCASE® CF | | • Wafer level • Internal cavity • Thin • COB processing • Cleanliness Free | | Image sensors MEMS, Hermetic Packaging for DLP |
| | SHELLCASE® RT | | • Wafer level • Internal cavity • Thin | | Image sensors MEMS |
| | | | |
Wafer Based Optics Technology | | Diffractive Optics | | • Wafer level • Color Correction | | Image sensors |
| | Refractive Optics | | • Wafer level • Small Size • Spherical or Highly Aspheric | | Image sensors |
| | Assembly and Integration | | • Wafer level • Internal cavity • Thin | | Image sensors |
11
Our Services
We provide our customers and partners with engineering, assembly and infrastructure services that we believe accelerate the adoption of our technology for a broad range of cost-sensitive, high-volume applications. We provide engineering services to semiconductor makers and assemblers, system manufacturers, electronic manufacturing service companies and government agencies and their contractors to enable the development of new packaging technologies. Most of our service revenues are derived from government-related engineering services.
Engineering services. Our engineering services include customized product and package design, prototyping and testing, modeling, simulation, failure analysis and reliability testing and related training services. We provide these services to semiconductor makers and assemblers, system manufacturers, electronic manufacturing service companies and government agencies and their contractors. We believe that offering these services accelerates the incorporation of our intellectual property into our customers’ products and aids in our understanding of the electronic industry future packaging requirements.
Assembly services. We provide training and consulting services to assist semiconductor assemblers in designing, implementing, upgrading and maintaining their CSP and WLP assembly lines. We also offer services to help customers address process, equipment, materials and other manufacturing-related issues. This allows our assembly customers to bring their manufacturing lines incorporating our technology into production more rapidly and cost-effectively.
Infrastructure services. We offer evaluation, qualification, cost reduction and cost analysis services to companies that develop and manufacture equipment and materials to support the infrastructure needed to manufacture semiconductors that incorporate our technology. These services enable infrastructure customers to evaluate the impact of their specific materials and equipment on the manufacturability and reliability of our technology.
Optics design and manufacturing services. We offer custom design, simulation, prototyping and small-volume manufacturing of wafer optics. These products address high value-add applications in various industries including communications and semiconductor equipment. In addition, we provide these services as part of development programs targeted at our licensees in the consumer optics markets.
Operating Segments
Effective 2006 we organized our business units into three operating divisions: the Licensing Business, the Product Division and Emerging Markets and Technologies Group. These divisions are reported into, the Intellectual Property segment, which consists primarily of our Licensing Business, and Emerging Markets and Technologies Segment group and the Services segment, which consists primarily of the Product Division. The Product Division incorporates operational functions that are reported in both our Intellectual Property and Services segments.
Intellectual Property Segment:
Licensing Business. Our licensing business is focused on licensing technologies in our core markets, including DRAM, Flash, SRAM, DSP, ASIC, ASSP, micro-controllers, general purpose logic and analog devices and imaging and micro-optics solutions. Key functions of this group include licensing, intellectual property management and marketing.
Emerging Markets and Technologies Group. Our Emerging Markets and Technologies group is focused on expanding our technology portfolio into areas outside of our core markets that represent long-term growth opportunities through application of products and technologies, research and development of new technologies for high growth markets and applications such as packaging, imaging, interconnect and materials. The Emerging Markets and Technologies group also focuses on long-term growth opportunities through new partnerships, ventures and acquisitions of complementary technology.
12
Services Segment:
Product Division. Our Services segment is composed of our Product Division, which performs key research and development and drives our production development services revenues. This segment also addresses the challenges of electronic products miniaturization from a system perspective, through the dense interconnection of components, extensive use of three-dimensional packaging technologies, and the use of micro-optics technologies. This segment provides a vehicle for transitioning our research efforts into fully developed technologies both internally and externally with partners that can be licensed.
The Product Division incorporates operational functions that are reported in both the Intellectual Property and Services segments.
Our segments were determined based upon the manner in which our management views and evaluates our operations. Segment information below in Part II, Item 7—Management’s Discussion and Analysis of Financial Condition and Results of Operations and in Note 13 of the Notes to Financial Statements is presented in accordance with the Statement of Financial Accounting Standards No. 131 (SFAS No. 131), Disclosure about Segments of an Enterprise and Related Information. We do not present financial data to our management for each of our divisions and our management does not evaluate each division separately from our segments when measuring the operating performance of our business. For years prior to 2005, revenues were presented to management in the Intellectual Property and Services categories; however expenses were not allocated or presented to our management for these categories. It would be impractical to determine an allocation method for prior year expenses, therefore only revenues will be presented for these segments. In addition to our reportable segments, we also have a Corporate Overhead category that is not a reportable segment. This category includes certain operating expenses and credits that are not allocated to our business segments because these operating expenses and credits are not considered in evaluating the operating performance of our business segments.
Customers
Our technology is currently licensed to more than 60 companies. The following table sets forth sales to customers comprising of 10% or more of total revenues for the periods indicated:
| | | | | | | | | |
| | | Years Ended
December 31, | |
| | | 2006 | | | 2005 | | | 2004 | |
Intel Corporation | | * | | | * | | | 18 | % |
Micron Technology, Inc. | | 15 | % | | — | | | — | |
Qimonda, AG | | 21 | % | | — | | | — | |
Samsung Electronics, Ltd. | | * | | | 20 | % | | * | |
Texas Instruments, Inc | | * | | | 17 | % | | 20 | % |
| * | denotes customers comprising of less than 10% of total revenues. |
A significant portion of our revenues is derived from licensees headquartered outside of the United States, principally in Asia and Europe, and we expect these revenues will continue to account for a significant portion of total revenues in future periods. The table below lists the geographic regions of the headquarters of our customers and the percentage of revenues derived from each region for the periods indicated:
| | | | | | | | | |
| | | Years Ended
December 31, | |
| | | 2006 | | | 2005 | | | 2004 | |
Asia | | 17 | % | | 28 | % | | 11 | % |
Europe | | 32 | % | | 0 | % | | 0 | % |
Japan | | 15 | % | | 28 | % | | 31 | % |
Other | | — | | | 1 | % | | 1 | % |
USA | | 36 | % | | 43 | % | | 56 | % |
13
The international nature of our business exposes us to a number of risks, including but not limited to: laws and business practices favoring local companies; withholding tax obligations on license revenues that we may not be able to offset fully against our U.S. tax obligations, including the further risk that foreign tax authorities may re-characterize license fees or increase tax rates, which could result in increased tax withholdings and penalties; less effective protection of intellectual property than is afforded to us in the United States or other developed countries and international terrorism and anti-American sentiment, particularly in the emerging markets.
Most of our long-lived assets are located in the United States. In December 2005 we completed the acquisition of certain assets of Shellcase, Ltd., which included a research and development facility in Jerusalem, Israel and intellectual property that is owned by our subsidiary in Budapest, Hungary. In February 2007, we completed the acquisition of Eyesquad GmbH, which included intellectual property that is held in Germany and a research and development facility in Tel Aviv, Israel.
The following is a list of our current licensees and, where indicated, our current sublicensees.
| | | | |
Semiconductor Manufacturers | | Semiconductor Assemblers | | Semiconductor Material Suppliers |
| | |
Advanced Micro Devices Inc. Asahi Kasei Microsystems Co. Ltd. Cochlear Co. Fujitsu Limited Hitachi Limited. Hynix Semiconductor, Inc. Infineon Technologies AG Intel Corporation Matsushita Electric Industrial Co., Ltd Micron Technology, Inc. Mitsubishi Electric and Electronics, Inc. NEC Electronics Co. NXP BV Oki Electric Industry Co., Ltd. Qimonda AG Renesas Technology Co.* ROHM Co., Ltd Samsung Electronics Co., Ltd. Sanyo Electric Co., Ltd. Seiko Epson Co. Sharp Corporation Siemens AG Sony Co. STMicroelectronics, Inc. Texas Instruments, Inc. Toshiba Corporation | | Advanced Semiconductor Engineering, Inc. (ASE) Akita Elpida Memory, Inc. Amkor Technology, Inc. ChipMOS Technologies, Inc. ChipPAC, Ltd. (BVI) EEMS Italia, SpA Hitachi Cable, Ltd. Mitsui High-tec Inc. North Dakota State University Renesas Northern Japan Semiconductor, Inc.* Renesas Eastern Japan Semiconductor, Inc.* Renesas Kyushu Semiconductor Corporation Orient Semiconductor Electronics Ltd (OSE) Plexus Co. Powertech Technology Inc. (PTI) Shinko Electric Industries Co., Ltd Siliconware Precision Industries Co., Ltd. (SPIL) United Test and Assembly Center Ltd. (UTAC) United Test Center Inc. (UTC) University of Alaska Walton Advanced Electronics, Ltd. | | 3M Company Compeq Manufacturing Inc. Hitachi Cable, Ltd. Hitachi Limited. LG Electronics Inc. LG Micron Ltd. Mitsui Mining & Smelting Co., Ltd. Samsung Electro-Mechanics Co., Ltd. Samsung Techwin Co., Ltd. Shinko Electric Industries Co. Sunright Ltd. Original Equipment Manufacturers UTStarcom, Inc. Electronic Manufacturing Services Flextronics International, Ltd |
| * | denotes a TCC sublicense |
Most semiconductor material suppliers are licensed under our Tessera Compliant Mounting Tape (“TCMT”) license, which requires these licensees to pay us a license fee, but not royalties.
Sales and Marketing
Our sales activities focus primarily on developing strong, direct relationships at the technical, marketing and executive management levels with leading companies in the semiconductor and consumer optics industry to license our technologies and sell our services. We also sell our engineering services to system manufacturers and government agencies and their contractors. Marketing activities include identifying and promoting application-based technologies
14
that enable further advances in electronics miniaturization for the cell phone, portable electronics and computing markets, and identifying major business opportunities for current and future product development. Product marketing focuses on identifying the needs and product requirements of our customers. Product marketing also manages the development of all of our technology throughout the development cycle and creates the required marketing materials to assist with the adoption of the technology. Marketing communications focuses on advertising and communications that promote the adoption of our technology.
Research and Development
We believe that our success depends in part on our ability to achieve the following in a cost-effective and timely manner:
| | • | | develop new technologies that meet the changing needs of our customers and their markets; |
| | • | | improve our existing technologies to enable growth into new application areas; and |
| | • | | expand our intellectual property portfolio. |
Our research and development employees work closely with our sales and marketing employees, as well as our customers and partners, to bring new products incorporating our technology to market in a timely, high quality and cost-efficient manner. We also work closely with material and equipment infrastructure providers to identify new technologies and improve existing technologies for use in the assembly and manufacture of semiconductor packages that incorporate our technology. Research, development and other related costs were approximately $20.1 million in 2006, $7.5 million in 2005 and $7.2 million in 2004.
Our service contracts involve research and development for commercial entities and government agencies. For example, some of our development activities for the µZ® Fold-Over Stack package and µZ®-Ball Stack package technologies were partially funded through government and commercial service contracts, which provided for improvements and enhancements to our fundamental designs. Our government contracts include terms required by the government that are not customary in commercial contracts, including a right of the government to terminate the contract at any time for convenience of the government. See Item 1A below—Risk Factors for a description of other risks involving government contracts.
Our research and development efforts currently focus on four major areas:
Chip-scale and Multi-chip packaging. Our CSP and MCP efforts focus on developing specific technologies for incorporation of existing or new CSP and MCP technologies into new applications, developing prototypes and supporting customers or infrastructure providers with improvements to products for existing applications. We are developing next generation chip-scale and multi-chip packages that could offer higher off-chip wiring density, higher density, better signal performance and more functionality per electronic product.
Advanced packaging substrates. Our advanced packaging substrate efforts focus on working with customers to incorporate our technology into their products and applications as well as developing packaging prototypes that utilize and leverage the benefits of this substrate technology. We are working closely with infrastructure providers developing a manufacturing process capable of cost-effectively delivering high yield, high reliability and high performance.
Wafer level packaging. Our WLP efforts focus on developing specific technologies for packaging of image sensors and other devices at the wafer level, developing prototypes and supporting customers with improvements to designs and process technologies.
Consumer optics. Our consumer optics efforts include image sensor packaging, wafer level optics and related advanced optics functionality directed at low cost and small packaged image sensors in miniature camera
15
modules. These low-cost, small cameras are utilized primarily for the mobile handset market, but also have applications in the automotive and security markets. These efforts integrate and expand upon research and development programs and technologies initiated at each of our operating locations, including image sensor packaging from our operation in Jerusalem, Israel, wafer level optics and camera technology from our operation in Charlotte, North Carolina, image enhancement technology for digital auto focus and optical zoom from our operation in Tel Aviv, Israel, and microelectronics packaging and system integration from our operation in San Jose, California.
We have additional research and development efforts underway in a number of areas related to the miniaturization of electronic products, including areas relating to materials, equipment, packaging, interconnect, assembly and testing of semiconductors and three-dimensional modules.
Intellectual Property
Our future success and competitive advantage depend upon our continued ability to develop and protect our intellectual property. To protect our intellectual property, we rely on a combination of patents, trade secrets and trademarks. We also attempt to protect our trade secrets and other proprietary information through confidentiality agreements with licensees, customers and potential customers and partners, and through proprietary information agreements with employees and consultants.
Our patents address advanced single and multi-chip and wafer level packaging, micro-optical elements, integrated optical assemblies, image processing algorithms related processes, and complementary technologies. We have made and continue to make considerable investments in expanding and defending our patent portfolio. See Item 3 below—Legal Proceedings for a description of material legal proceedings in which we have recently been involved.
As of February 26, 2007, our intellectual property portfolio included 488 issued U.S. patents and 127 issued international patents. In 2006, 88 additional U.S. standard or provisional patent applications were filed, along with 23 additional international patent applications. In addition we have 230 domestic and 225 international patent applications. Our patents have expiration dates ranging from January 25, 2009 to December 29, 2024. We continually file new patent applications for new developments in our technology.
There are many countries in which we currently have no issued patents; however, products incorporating our technology that are sold in jurisdictions where patents have been issued must be licensed, or stem from a licensed source, in order to avoid infringing our intellectual property.
Competition
As a developer and licensor of semiconductor packaging and consumer optics technology, we compete with other technologies, as opposed to other companies selling products. These competing technologies come principally from the internal design groups of a number of semiconductor and package assembly companies. Many of these companies are licensees, or potential licensees, of ours. In fact, many of our licensees consider packaging research and development to be one of their core competencies.
Semiconductor companies that have their own package design and manufacturing capabilities include, but are not limited to, Texas Instruments, Inc., Intel Corporation and the semiconductor divisions of Sharp Corporation and Samsung Electronics Co., Ltd. Among the advanced packaging technologies developed by such companies are flip-chip and chip-on-board technologies that compete with our CSP, multi-chip and WLP technologies. Our technologies also compete with technologies developed by the internal design groups of package assembly companies, such as Advanced Semiconductor Engineering, Inc., Amkor Technology, Inc. and STATS ChipPAC, Inc.
16
We believe the principal competitive factors in the selection of semiconductor package technology by potential customers are:
| | • | | size and circuit board area; |
| | • | | available infrastructure. |
We believe that our CSP, multi-chip and WLP technologies compete favorably in each of these factors with other advanced packaging technology solutions.
For consumer optics, major semiconductor companies producing image sensors are also developing internal solutions that may compete with our technology offering. These semiconductor companies include, but are not limited to, Omnivision, Micron Technology, Inc., ST Microelectronics, Inc., Samsung Electronics Co, Ltd., and Toshiba Corporation. In addition to semiconductor companies, there are several other licensing and manufacturing companies, including Anteryon and Heptagon, which are developing consumer optics technology that may compete with ours.
Employees
As of February 26, 2007, we had 271 employees, with 27 in sales, marketing and licensing, 173 in research and development (including employees who perform engineering, assembly and infrastructure services under our service agreements with third parties) and 71 in finance and administration. We have never had a work stoppage among our employees and no personnel are represented under collective bargaining agreements other than certain ordinary course agreements of an employers’ collective which may bind our Israeli subsidiaries under Israel law. We consider our relations with our employees to be good.
Available Information
Our Internet address is www.tessera.com. There we make available, free of charge, our annual report on Form 10-K, quarterly reports on Form 10-Q, current reports on Form 8-K and any amendments to those reports, as soon as reasonably practicable after we electronically file such material with, or furnish it to, the Securities and Exchange Commission (SEC). Our SEC reports can be accessed through the investor relations section of our Web site. The information found on our Web site is not part of this or any other report we file with or furnish to the SEC.
The public may read and copy any materials that we file with the SEC at the SEC’s Public Reference Room located at 450 Fifth Street NW, Washington, DC 20549. The public may obtain information on the operation of the Public Reference Room by calling the SEC at 1-800-SEC-0330. The SEC also maintains electronic versions of our reports on its website at www.sec.gov.
Any invalidation or limitation of our key patents could significantly harm our business.
Our patent portfolio contains some patents that are particularly significant to our ongoing revenues and business. If any of these key patents are invalidated, or if a court or an administrative body such as the United States Patent and Trademark Office limits the scope of the claims in any of these key patents, the likelihood that companies will take new licenses and that current licensees will continue to agree to pay under their existing
17
licenses could be significantly reduced. The resulting loss in license fees and royalties could significantly harm our business. As discussed below and in Item 3—Legal Proceedings, we are currently involved in legal proceedings involving some of its key patents. Any adverse rulings relating to the infringement, validity or enforceability of these key patents could significantly harm our business.
We are currently in litigation involving some of our key patents.
On October 7, 2006, we filed a complaint for patent infringement against Advanced Micro Devices, Inc., or AMD, and Spansion LLC, or Spansion, in the United States District Court for the Northern District of California, alleging infringement of Tessera’s U.S. Patents 5,679,977, 5,852,326, 6,433,419 and 6,465,893 arising from AMD’s and Spansion’s respective manufacture, use, sale, offer to sell and/or importation of certain packaged semiconductor components and assemblies thereof. We seek to recover damages, up to treble the amount of actual damages, together with attorney’s fees, interest and costs. We also seek other relief, including enjoining AMD and Spansion from continuing to infringe these patents. We have amended our complaint to add as defendants Spansion Inc., Spansion Technology, Inc., Advanced Semiconductor Engineering, Inc. ASE (U.S.) Inc., ChipMOS Technologies, Inc., ChipMOS U.S.A., Inc., Siliconware Precision Industries Co. Ltd, Siliconware USA Inc., STMicroelectronics N.V., STMicroelectronics, Inc., STATS ChipPAC Ltd., STATS ChipPAC, Inc. and STATS ChipPAC Ltd. (BVI). The defendants in this action have asserted affirmative defenses to our patent infringement claims, and some of them have brought related counterclaims alleging that the Tessera patents at issue are not infringed, invalid and unenforceable and/or that Tessera is not the owner of the patents. We cannot predict the outcome of this proceeding. Discovery is ongoing, and trial is currently set for January 28, 2008. An adverse decision in this proceeding could significantly harm our business and financial condition.
On March 2, 2006, we issued a request for arbitration with Amkor Technology, Inc., or Amkor, regarding Amkor’s failure to pay royalties under its license agreement with Tessera. On November 1, 2006, the arbitration tribunal issued a provisional timetable specifying a seven-day tribunal hearing starting October 1, 2007. We cannot predict the outcome of this proceeding. An adverse decision in this proceeding could significantly harm our business and financial condition.
We are currently, and may in the future be involved in material litigation with our licensees, potential licensees or strategic partners, which could harm our business.
Our current legal actions, as described below inItem 3—Legal Proceedings, are examples of significant disputes and litigation that impact our business. Any similar dispute in the future could cause an existing licensee or strategic partner to cease making royalty or other payments to us and could substantially damage our relationship with the licensee or strategic partner on both business and technical levels. Any litigation stemming from such a dispute could be very expensive and may reduce or eliminate our profits. Litigation could also severely disrupt or shut down the business operations of our licensees or strategic partners, which in turn would significantly harm our ongoing relations with them and cause us to lose royalty revenues. Any such litigation could also harm our relationships with other licensees or our ability to gain new customers, who may postpone licensing decisions pending the outcome of the litigation. We are not able to predict the outcome of any of our legal actions and an adverse decision in any of our legal actions could significantly harm our business and financial condition. Moreover, even if we settle our legal actions, significant contingencies will exist to their final resolution, including our receipt of any payments owed and the dismissal of the legal action by the relevant court, none of which are completely within our control.
In addition, many semiconductor and package assembly companies maintain their own internal design groups and have their own package design and manufacturing capabilities. If we believe these groups have designed technologies that infringe upon our intellectual property, and if they fail to enter into a license agreement with us or pay for licensed technology, then we may be forced to commence legal proceedings against them.
18
If we fail to protect and enforce our intellectual property rights, our business will suffer.
We rely primarily on a combination of license, development and nondisclosure agreements and other contractual provisions and patent, trademark, trade secret and copyright laws to protect our intellectual property rights. If we fail to protect our intellectual property rights, our licensees and others may seek to use our technology without the payment of license fees and royalties, which could weaken our competitive position, reduce our operating results and increase the likelihood of costly litigation. The growth of our business depends in large part on our ability to convince third parties of the applicability of our intellectual property to their products, and our ability to enforce our intellectual property rights against them.
In certain instances, we attempt to obtain patent protection for portions of our intellectual property, and our license agreements typically include both issued patents and pending patent applications. If we fail to obtain patents or if the patents issued to us do not cover all of the claims included in our patent applications, others could use portions of our intellectual property without the payment of license fees and royalties. We also rely on trade secret laws rather than patent laws to protect other portions of our proprietary technology. However, trade secrets can be difficult to protect. We protect our proprietary technology and processes, in part, through confidentiality agreements with our employees, consultants and customers. We cannot be certain that these contracts have not been and will not be breached, that we will have adequate remedies for any breach or that our trade secrets will not otherwise become known or be independently discovered by competitors. If we fail to use these mechanisms to protect our intellectual property, or if a court fails to enforce our intellectual property rights, our business will suffer. We cannot be certain that these protection mechanisms can be successfully asserted in the future or will not be invalidated or challenged.
We may not be able to protect our confidential information, and this could adversely affect our business.
We generally enter into contractual relationships with our employees that protect our confidential information. The misappropriation of our trade secrets or other proprietary information could seriously harm our business. In addition, we may not be able to timely detect unauthorized use or transfer of our intellectual property and take appropriate steps to enforce our rights. In the event we are unable to enforce these contractual obligations and our intellectual property rights, our business could be adversely affected.
We may be required to continue to undertake costly legal proceedings to enforce or protect our intellectual property rights and this may harm our business.
In the past we have found it necessary to litigate to enforce our patents and other intellectual property rights, to protect our trade secrets, to determine the validity and scope of the proprietary rights of others or to defend against claims of infringement or invalidity. We currently are involved in litigation regarding our intellectual property rights, as described below in Item 3—Legal Proceedings, and we expect to be involved in similar litigation in the future. Litigation is inherently uncertain and any adverse decision could result in a loss of our proprietary rights, subject us to significant liabilities, require us to seek licenses from others, limit the value of our licensed technology or otherwise negatively impact our business. Whether or not determined in our favor or settled by us, litigation is costly and diverts our managerial, technical, legal and financial resources from our business operations.
The costs associated with the legal proceedings in which we are involved can be substantial and specific costs are unpredictable and not completely within our control, and unexpected increases in litigation costs could adversely affect our operating results.
As described below in Item 3—Legal Proceedings, we are currently involved in legal proceedings against a number of different companies. The costs associated with legal proceedings are typically high, relatively unpredictable and not completely within our control. While we do our best to forecast and control such costs, the costs may be materially more than expected, which could adversely affect our operating results. Moreover, we
19
may become involved in unexpected litigation with additional companies at any time, which would increase our aggregate litigation costs and could adversely affect our operating results.
Our revenues may suffer if we cannot continue to license or enforce our intellectual property rights or if third parties assert that we violate their intellectual property rights.
We rely upon patent, copyright, trademark and trade secret laws in the United States and similar laws in other countries, and agreements with our employees, customers, suppliers and other parties, to establish and maintain our intellectual property rights in our technology. However, any of our direct or indirect intellectual property rights could be challenged, invalidated or circumvented. Further, the laws of certain countries do not protect our proprietary rights to the same extent as do the laws of the United States. Therefore, in certain jurisdictions we may be unable to protect our technology adequately against unauthorized third-party use, which could adversely affect our business. Third parties also may claim that we or our customers are infringing upon their intellectual property rights. Even if we believe that the claims are without merit, the claims can be time-consuming and costly to defend and divert management’s attention and resources away from our business. Claims of intellectual property infringement also might require us to enter into costly settlement or license agreements or pay costly damage awards. Even if we have an agreement that provides for a third party to indemnify us against such costs, the indemnifying party may be unable to uphold its contractual obligations to us. If we cannot or do not license the infringed intellectual property at all or on reasonable terms, or substitute similar technology from another source, our business could suffer.
If the U.S. patent laws and regulations are changed, we could be adversely impacted.
Tessera relies on the uniform and historically consistent application of United States patent laws and regulations. Changes to these laws and regulations may occur as a result of decisions and actions of Congress, the U.S. Patent and Trademark Office, and the courts, including the U.S. Supreme Court. Some of these changes may not be advantageous for us, and may make it more difficult to obtain adequate patent protection or to enforce our patents against parties using them without a license or a payment of royalties. Any such changes could have a deleterious affect on our licensing program and, therefore, the royalties we receive.
We could experience losses due to product liability claims.
We sell products that may subject us to product liability claims in the future. Although we carry liability insurance in amounts that we believe are appropriate, product liability claims can be costly and any future product liability claim made against us may exceed the coverage limits of our insurance policies, be excluded form coverage under the terms of our policies or cause us to record a self-insured loss. A product liability claim in excess of our insurance policies could have a material adverse effect on our business, financial condition and results of operations. Even if a product liability loss is covered by our insurance policies, such policies contain substantial retentions and deductibles that we would be required to pay. Our existing insurance may not be renewed at a cost and level of coverage comparable to that presently in effect, or at all. The payment of retentions or deductibles for a significant amount of claims could have a material adverse effect on our business, financial condition and results of operations.
A significant amount of our royalty revenues comes from a few market segments and products, and our business could be harmed if these market segments or products decline.
A significant portion of our royalty revenues comes from the manufacture and sale of packaged semiconductor chips for DSP, ASSP, ASIC and memory. In addition, we derive substantial revenues from the incorporation of our technology into mobile phones. If demand for semiconductors in any one or a combination of these market segments or products declines, our royalty revenues may be reduced significantly and our business could be harmed. Moreover, were such a decline to occur, our business could become more cyclical in nature.
20
Our revenue is concentrated in a few customers and if we lose any of these customers our revenues may decrease substantially.
We receive a significant amount of our revenues from a limited number of customers. For the year ended December 31, 2006, revenues from Micron Technology, Inc. and Qimonda AG accounted for 15% and 21% of total revenues, respectively. For the year ended December 31, 2005 revenues from Samsung Electronics Co., Ltd., and Texas Instruments, Inc., accounted for 20% and 17% of total revenues, respectively. We expect that a significant portion of our revenues will continue to come from a limited number of customers for the foreseeable future. If we lose any of these customers or if our revenues from them decline, our revenues may decrease substantially.
Future changes in financial accounting standards or practices or existing taxation rules or practices may cause adverse unexpected revenue and expense fluctuations and affect our reported results of operations.
A change in accounting standards or practices or a change in existing taxation rules or practices can have a significant effect on our reported results and may even affect our reporting of transactions completed before the change is effective. New accounting pronouncements and taxation rules and varying interpretations of accounting pronouncements and taxation practice have occurred and may occur in the future. Changes to existing rules or the questioning current practices may adversely affect our reported financial results or the way we conduct our business.
We are subject to laws and regulations governing government contracts, and failure to address these laws and regulations or comply with government contracts could harm our business by leading to a reduction in revenue associated with these customers.
We have agreements relating to services provided to government entities and, as a result, we are subject to various statutes and regulations that apply to companies doing business with the government. The laws governing government contracts differ from the laws governing private contracts. For example, many government contracts contain pricing terms and conditions that are not applicable to private contracts. We are also subject to audits relating to compliance with the regulations governing government contracts. A failure to comply with these regulations might result in suspension of these contracts, debarment from future government contracts, or civil and criminal penalties. In addition, the government may acquire certain intellectual property rights in data produced or delivered under such contracts and inventions made under such contracts.
Our financial and operating results may vary which may cause the price of our common stock to decline.
We currently provide guidance on revenue, expenses and cash taxes on a quarterly and annual basis. Our quarterly operating results have fluctuated in the past and are likely to do so in the future. Because our operating results are difficult to predict, you should not rely on quarterly or annual comparisons of our results of operations as an indication of our future performance. Factors that could cause our operating results to fluctuate during any period include those listed in this “Risk Factors” section of this report and the following:
| | • | | the timing and compliance with license or service agreement and the terms and conditions for payment to us of license or service fees under these agreements; |
| | • | | changes in our royalties caused by changes in demand for products incorporating semiconductors that use our licensed technology; |
| | • | | the amount of our service revenues; |
| | • | | changes in the level of our operating expenses; |
| | • | | delays in our introduction of new technologies or market acceptance of these new technologies through new license agreements; |
| | • | | our failure to protect or enforce our intellectual property rights; |
21
| | • | | legal proceedings affecting our patents or patent applications; |
| | • | | the timing of the introduction by others of competing technologies; |
| | • | | changes in demand for semiconductor chips in the specific markets in which we concentrate—DSP, ASIC, ASSP semiconductors and memory; |
| | • | | changes in accounting principles or a requirement to treat stock option grants as an operating expense; and |
| | • | | cyclical fluctuations in semiconductor markets generally. |
It is difficult to predict when we will enter into license agreements. The time it takes to establish a new licensing arrangement can be lengthy. Delays or deferrals in the execution of license agreements may also increase as we develop new technologies. Because we generally recognize a significant portion of license fee revenues in the quarter that the license is signed, the timing of signing license agreements may significantly impact our quarterly or annual operating results. Under our typical license agreements, we also receive ongoing royalty payments, and these payments may fluctuate significantly from period to period based on manufacture or sales of products incorporating our licensed technology. We expect to continue to expand our business rapidly which will require us to increase our operating expenses. We may not be able to increase revenues in an amount sufficient to offset these increased expenditures, which may lead to a loss for a quarterly period.
Due to fluctuations in our quarterly operating results and other factors, the price at which our common stock will trade is likely to continue to be highly volatile. In future periods, if our revenues or operating results are below our estimates or the estimates or expectations of public market analysts and investors, our stock price could decline. In the past, securities class action litigation has often been brought against companies following a decline in the market price of their securities. Technology companies have experienced greater than average stock price volatility than companies in many other industries in recent years and, as a result, have, on average, been subject to a greater number of securities class action claims. If our stock price is volatile, we may become involved in this type of litigation in the future. Any litigation could result in substantial costs and a diversion of management’s attention and resources that are needed to successfully run our business.
Network outages could disrupt our internal operations, which could adversely affect our revenues, customers and stock price.
Despite our concerted effort to minimize risk to our corporate information systems and to reduce the effect of unscheduled interruptions to the Company through implementation of Business Continuity Plans, our Company may still be exposed to interruptions due to natural disasters, terrorism or acts of war which are beyond our control. Disruptions to these systems could also interrupt operational processes and adversely impact our ability to provide services and support to our customers and fulfill contractual obligations. As a result, our results of our operations, financial position, cash flows and stock price could be adversely affected.
We recently conducted our yearly evaluation of our internal controls systems in order to allow management to report on, and our independent registered public accounting firm to attest to, our internal controls, as required by Section 404 of the Sarbanes-Oxley Act of 2002, but we cannot ensure that these practices will satisfy future audits.
We have performed the system and process evaluation and testing required for compliance with the management certification and attestation requirements of Section 404 of the Sarbanes-Oxley Act of 2002. While we have implemented the requirements relating to internal controls and all other aspects of Section 404 in a timely fashion, we cannot be certain as to the timing of completion of our future evaluations or as to the results of the evaluations. Additionally, there are no assurances that we will be able to continue to comply with the requirements relating to internal controls and all other aspects of Section 404 in a timely fashion in any given period.
22
We have a royalty-based business model, which is inherently risky.
Our long-term success depends on future royalties paid to us by licensees. Royalty payments under our TCC licenses are primarily based upon the number of electrical connections to the semiconductor chip in a package covered by our licensed technology, although we do have royalty arrangements in which royalties are paid based upon a percent of the net sales price or in which royalties are paid on a per package basis. We are dependent upon our ability to structure, negotiate and enforce agreements for the determination and payment of royalties. We face risks inherent in a royalty-based business model, many of which are outside of our control, such as the following:
| | • | | the rate of adoption and incorporation of our technology by semiconductor manufacturers and assemblers; |
| | • | | the extent to which large equipment vendors and materials providers develop and supply tools and materials to enable manufacturing using our packaging technology; |
| | • | | the demand for products incorporating semiconductors that use our licensed technology; and |
| | • | | the cyclicality of supply and demand for products using our licensed technology. |
It is difficult for us to verify royalty amounts owed to us under our licensing agreements, and this may cause us to lose revenues.
The standard terms of our license agreements require our licensees to document the manufacture and sale of products that incorporate our technology and report this data to us on a quarterly basis. Although our standard license terms give us the right to audit books and records of our licensees to verify this information, audits can be expensive, time consuming, flawed and potentially detrimental to our ongoing business relationship with our licensees. Our license compliance program randomly audits licensees to independently verify the accuracy of the information contained in their royalty reports in an effort to decrease the likelihood that we will not receive the royalty revenues to which we are entitled to under the terms of our license agreements, but we cannot give assurances that the random audits will be effective to that end.
Failure by our licensees to introduce products using our technology could limit our royalty revenue growth.
Because we expect a significant portion of our future revenues to be derived from royalties on semiconductors that use our licensed technology, our future success depends upon our licensees developing and introducing commercially successful products. Any of the following factors could limit our licensees’ ability to introduce products that incorporate our technology:
| | • | | the willingness and ability of materials and equipment suppliers to produce materials and equipment that support our licensed technology, in a quantity sufficient to enable volume manufacturing; |
| | • | | the ability of our licensees to purchase such materials and equipment on a cost-effective and timely basis; |
| | • | | the willingness of our licensees and others to make investments in the manufacturing process that supports our licensed technology, and the amount and timing of those investments; and |
| | • | | our licensees’ ability to design and assemble packages incorporating our technology that are acceptable to their customers. |
Failure by the semiconductor industry to adopt next generation high performance DRAM chips that utilize our packaging technology would significantly harm our business.
To date, our packaging technology has been used by several companies for high performance DRAM chips. For example, packaging using our technology is used for DDR2 DRAM and we currently have licensees,
23
including Samsung Electronics, Co., Ltd., Qimonda AG, Hynix Semiconductor Inc. and Micron Technology, Inc., who are paying royalties for DRAM chips in advanced packages.
DRAM manufacturers are also currently developing next generation high performance DRAM chips, including next generation of DDR referred to as DDR3 and DDR4, to meet increasing speed and performance requirements of electronic products. We believe that these next generation, high performance DRAM chips will require advanced packaging technologies such as CSP.
We anticipate that royalties from shipments of these next generation, high performance DRAM chips packaged using our technology may account for a significant percentage of our future revenues. If semiconductor manufacturers do not continue to adopt next generation, high performance DRAM packages using our technology and find an alternate viable packaging technology for use with next generation high performance DRAM chips, or if we do not receive royalties from next generation, high performance DRAM chips that use our technology, our future revenues could be adversely affected.
Our technology may be too expensive for certain next generation high performance DRAM manufacturers, which could significantly reduce the adoption rate of our packaging technology in next generation high performance DRAM chips. Even if our package technology is selected for at least some of these next generation high performance DRAM chips, there could be delays in the introduction of products utilizing these chips that could materially affect the amount and timing of any royalty payments that we receive. Other factors that could affect adoption of our technology for next generation high performance DRAM products include delays or shortages of materials and equipment and the availability of testing services.
Failure by the semiconductor industry to adopt broadly WLP packaging technology could limit our royalty revenue growth.
To date, wafer level packaging technologies have been adopted for a limited number of semiconductor products. To date, our packaging technology has been used by several companies for CMOS image sensor chips principally for use in camera-equipped mobile phones. We believe that such WLP packages will be useful for image sensors in other applications such as personal digital assistants and digital cameras, and for other applications such as MEMS devices.
We anticipate that royalties from shipments of chips packaged using our WLP technology may account for a small but increasing percentage of our future revenues. If semiconductor manufacturers do not adopt our WLP technology as quickly as is currently being projected by industry sources or find an alternate viable packaging technology for use with their image sensor and MEMS chips, or if we do not receive royalties from image sensor and MEMS chips that use our technology, our future revenues could be adversely affected. In addition our technology may be too expensive for certain image sensor manufacturers, which could significantly reduce the adoption rate of our WLP packaging technology in image sensor applications. Other factors that could affect adoption of our WLP technology for image sensors and MEMS chips include delays or shortages of materials and equipment.
Competing technologies may harm our business.
We expect that our technologies will continue to compete with technologies of internal design groups of semiconductor manufacturers and assemblers. These internal design groups create their own packaging solutions, and have direct access to their company’s technical information and technology roadmaps, and have capacity, cost and technical advantages over us. If these internal design groups design around our patents, they may not need to license our technology. These groups may design package technology that is less expensive to implement than ours or provides products with higher performance or additional features. Many of these groups have substantially greater resources, financial or otherwise, than us and lower cost structures. As a result, they may be able to bring alternative package technologies solutions to market more easily and quickly. For instance, certain
24
flip chip technologies are being used by large semiconductor manufacturers and assemblers for a variety of semiconductors, including processors and memory. Another example of a competitive technology is the small format lead frame packages that are also gaining popularity. The companies using these technologies are utilizing their current lead frame infrastructure to achieve cost-effective results. Another example of a competitive technology is the chip-on-board technique to package image sensors.
In the future, our licensed technologies may also compete with other package technologies. These technologies may be less expensive than ours and provide higher or additional performance. Companies with these competing technologies may also have greater resources than us. Technological change could render our technologies obsolete, and new, competitive technologies could emerge that achieve broad adoption and adversely affect the use of our intellectual property.
If we do not create and implement new designs to expand our licensable technology portfolio, our competitive position could be harmed and our operating results adversely affected.
We derive a significant portion of our revenues from licenses and royalties from a relatively small number of key technologies. We plan to devote significant engineering resources in order to develop new packaging technologies to address the evolving needs of the semiconductor and the consumer and communication electronics industries. To remain competitive, we must introduce new technologies or designs in a timely manner and the market must adopt them. Developments in packaging technologies are inherently complex, and require long development cycles and a substantial investment before we can determine their commercial viability. We may not be able to develop and market new technologies in a timely or commercially acceptable fashion. Moreover, our currently issued U.S. patents expire at various times from January 25, 2009 through December 29, 2024. We need to develop and patent successful innovations before our current patents expire and our failure to do so could significantly harm our business.
If we do not successfully license the technologies we acquire, our competitive position could be harmed and our operating results adversely affected.
We also attempt to expand our licensable technology portfolio and technical expertise by acquiring technology or developing strategic relationships with others. These strategic relationships may include the right for us to sublicense technology to others. However, we may not be able to acquire or obtain rights to licensable technology in a timely manner or upon commercially reasonable terms. Even if we do acquire such rights, some of the technologies we invest in may be commercially unproven and may not be adopted or accepted by the industry. Moreover, our research and development efforts, and acquisitions and strategic relationships, may be futile if we do not accurately predict the future packaging needs of the semiconductor, consumer and communication electronics industries. Our failure to acquire new technologies that are commercially viable in the semiconductor, consumer and communication electronics industries could significantly harm our business.
Some of our license agreements have fixed terms and, in order to maintain our relationships with licensees under such agreements, we will need to renegotiate some of our existing license agreements in the future.
Some of our license agreements have fixed terms. We will need to renegotiate license agreements with fixed terms prior to the expiration of such license agreements and, based on various factors including the technology and business needs of our licensees, we may not be able to renegotiate such license agreements on similar terms, or at all. In order to maintain existing relationships with some of our licensees, we may be forced to renegotiate license agreements on terms that are more favorable to such licensees, which could harm our results of operations. If we fail to renegotiate our license agreements we would lose existing licensees and our business would be materially adversely affected.
25
Some of our license agreements convert to fully paid-up licenses at the expiration of their terms, and we may not receive royalties after that time.
Some of our license agreements convert to fully paid-up licenses at the expiration of their terms, either automatically or if the licensee exercises an option to extend the term for an additional royalty payment. We may not receive further royalties from licensees for any licensed technology under those agreements after they convert to fully paid-up licenses because such licensees will be entitled to continue using some, if not all, of our relevant intellectual property under the terms of the license agreements, even if relevant patents are still in effect. A significant conversion of our license agreements to fully paid-up licenses could materially harm our results of operations following such conversion.
Our licensing cycle is lengthy and costly and our marketing and sales efforts may be unsuccessful.
We generally incur significant marketing and sales expenses prior to entering into our license agreements, generating a license fee and establishing a royalty stream from each licensee. The length of time it takes to establish a new licensing relationship can range from six to 18 months or longer. As such, we may incur significant losses in any particular period before any associated revenues stream begins.
We employ intensive marketing and sales efforts to educate materials suppliers, equipment vendors, licensees, potential licensees and original equipment manufacturers about the benefits of our technologies. In addition, even if these companies adopt our technologies, they must devote significant resources to integrate fully our technologies into their operations. If our marketing and sales efforts are unsuccessful, then we will not be able to achieve widespread acceptance of our packaging technology. In addition ongoing litigation could impact our ability to gain new licensees.
Cyclicality in the semiconductor industry may affect our revenues, and as a result, our operating results could be adversely affected.
The semiconductor industry has historically been cyclical and is characterized by wide fluctuations in product supply and demand. From time to time, this industry has experienced significant downturns, often in connection with, or in anticipation of, maturing product and technology cycles, excess inventories and declines in general economic conditions. This cyclicality could cause our operating results to decline dramatically from one period to the next. Our business depends heavily upon the volume of production by our licensees, which, in turn, depends upon the current and anticipated market demand for semiconductors and products that use semiconductors. Similarly, our services business relies at least in part upon the outsourcing of design and engineering projects by the semiconductor industry. Semiconductor manufacturers and package assembly companies generally sharply curtail their spending during industry downturns and historically have lowered their spending more than the decline in their revenues. As a result, if we are unable to control our expenses adequately in response to lower revenues from our licensees and service customers, our operating results will suffer and we might experience operating losses.
The international nature of our business exposes us to financial and regulatory risks and we may have difficulty protecting our intellectual property in some foreign countries.
We derive a significant portion of our revenues from licensees headquartered outside of the United States, principally in Asia and Europe. For the year ended December 31, 2006, these revenues accounted for 64% of our total revenues. For the year ended December 31, 2005, these revenues accounted for 56% of our total revenues. International operations are subject to a number of risks, including the following:
| | • | | international terrorism and anti-American sentiment, particularly in the emerging markets; |
| | • | | laws and business practices favoring local companies; |
26
| | • | | withholding tax obligations on license revenues that we may not be able to offset fully against our U.S. tax obligations, including the further risk that foreign tax authorities may re-characterize license fees or increase tax rates, which could result in increased tax withholdings and penalties; and |
| | • | | less effective protection of intellectual property than is afforded to us in the United States or other developed countries. |
Our intellectual property is also used in a large number of foreign countries. There are many countries, such as China, in which we currently have no issued patents. In addition, effective intellectual property enforcement may be unavailable or limited in some foreign countries. It may be difficult for us to protect our intellectual property from misuse or infringement by other companies in these countries. We expect this to become a greater problem for us as our licensees increase their manufacturing in countries which provide less protection for intellectual property. Our inability to enforce our intellectual property rights in some countries may harm our business.
Our services business may subject us to specific costs and risks that we may fail to manage adequately which could harm our business.
We derive a portion of our revenues from engineering services. Among the engineering services that we offer are customized package design and prototyping, modeling, simulation, failure analysis and reliability testing and related training services. A number of factors, including, among others, the perceived value of our intellectual property portfolio, our ability to convince customers of the value of our engineering services and our reputation for performance under our service contracts, could cause our revenues from engineering services to decline, which would in turn harm our operating results.
Moreover, most of our service revenues are derived from engineering services we provide to government agencies and their contractors to enable the development of new packaging technologies. If demand for our services from government agencies declines, due to changes in government policies or otherwise, our service revenues will be adversely affected.
Under our services contracts we are required to perform certain services, including sometimes delivering designs and prototypes. If we fail to deliver as required under our service contracts, we could lose revenues and become subject to liability for breach of contract.
We provide certain services at below cost in an effort to increase the speed and breadth with which the semiconductor industry adopts our technologies. For example, we provide modeling, manufacturing process training, equipment and materials characterization and other services to assist licensees in designing, implementing, upgrading and maintaining their packaging assembly line. We frequently provide these services as a form of training to introduce new licensees to our technology and existing clients to new technologies, with the aim that these services will help us to generate revenues in the future. We need to monitor these services adequately in order to ensure that we do not incur significant expenses without generating corresponding revenues. Our failure to monitor these services or our design and prototype services adequately may harm our operating results.
Because our services sometimes involve the delivery of package designs and prototypes, we may be subject to claims that we infringed or induced the infringement of patents and other intellectual property rights belonging to others. If such a claim were made, we may have to take a license or stop manufacturing the accused packages, which could cause our services revenues to decrease. If we choose not to take a license, we may be sued for infringement, and may incur significant litigation costs in defending against the lawsuit. If we are found to infringe the intellectual property rights of others, we may have to pay damages and could be subject to an injunction preventing us from continuing to provide the services. Any of these outcomes could harm our business.
27
If our prototypes, manufactured packages or products based on our designs are used in defective products, we may be subject to product liability or other claims.
Under our service contracts, we may, at times, manufacture packages on a limited basis, deliver prototypes or designs or help to design prototypes or products. If these prototypes, packages or designs are used in defective or malfunctioning products, we could be sued for damages, especially if the defect or malfunction causes physical harm to people. The occurrence of a problem could result in product liability claims and/or a recall of, or safety alert or advisory notice relating to, the product. While we believe the amount of product liability insurance maintained by us combined with the indemnities that we have been granted under these service contracts are adequate, there can be no assurance that these will be adequate to satisfy claims made against us in the future or that we will be able to obtain insurance in the future at satisfactory rates or in adequate amounts. Product liability claims or product recalls in the future, regardless of their ultimate outcome, could have a material adverse effect on our business, financial condition and reputation, and on our ability to attract and retain licensees and customers.
We intend to continue to expand our operations which may strain our resources and increase our operating expenses.
We plan to continue the expansion of our operations, domestically and internationally, and may do so through both internal growth and acquisitions. We expect that this expansion will strain our systems and operational and financial controls. In addition, we are likely to incur higher operating costs. To manage our growth effectively, we must continue to improve and expand our systems and controls. If we do fail to do so, our growth would be limited. Our officers have limited experience in managing large or rapidly growing businesses through acquisitions. Further, our officers have limited experience managing companies through acquisitions and technological changes. In addition, our management has limited experience in managing a public company.
We have made and may continue to make acquisitions which could divert management’s attention, cause ownership dilution to our stockholders, be difficult to integrate and adversely affect our financial results.
We have made several acquisitions and it is our current plan to acquire companies and technologies that we believe are strategic to our future business. Integrating newly acquired businesses or technologies could put a strain on our resources, could be costly and time consuming, and might not be successful. Such acquisitions could divert our management’s attention from other business concerns. In addition, we might lose key employees while integrating new organizations. Acquisitions could also result in customer dissatisfaction, performance problems with an acquired company or technology, potentially dilutive issuances of equity securities or the incurrence of debt, the assumption or incurrence of contingent liabilities, possible impairment charges related to goodwill or other intangible assets or other unanticipated events or circumstances, any of which could harm our business. Our plans to integrate and expand upon research and development programs and technologies initiated at each of our operating locations, including image sensor packaging from our operation in Jerusalem, Israel, wafer level optics and camera technology from our operation in Charlotte, North Carolina, image enhancement technology for digital auto focus and optical zoom from our operation in Tel Aviv, Israel, and microelectronics packaging and system integration from our operation in San Jose, California, may result in products or technologies that are not adopted by the market. The market may adopt competitive solutions to our products or technologies. Consequently, we might not be successful in integrating any acquired businesses, products or technologies, and might not achieve anticipated revenues and cost benefits.
There are numerous risks with our recent acquisitions of Eyesquad GmbH, Digital Optics Corporation and of certain assets from Shellcase, Ltd.
In February 2007, we completed our acquisition of Eyesquad GmbH, a company based in Munich, Germany, and in July 2006, we completed our acquisition of Digital Optics Corporation, a company based in Charlotte, North Carolina. In December 2005, we completed our acquisition of certain equipment, intellectual
28
property and other intangible assets from Shellcase, Ltd., a company based in Israel. These acquisitions are subject to a number of risks, including the following:
| | • | | These acquisitions could fail to produce anticipated benefits, or could have other adverse effects that we currently do not foresee. As a result, either acquisition could result in a reduction of net income per share as compared to the net income per share we would have achieved if these acquisitions had not occurred. |
| | • | | Following completion of these acquisitions, we may uncover additional liabilities or unforeseen expenses not discovered during our diligence process. Any such additional liabilities or expenses could result in significant unanticipated costs not originally estimated and may harm our financial results. Impairment charges of acquired assets and goodwill. |
| | • | | The integration of Eyesquad GmbH, Digital Optics Corporation and of the Shellcase, Ltd., assets will be a time consuming and expensive process that may disrupt our operations if it is not completed in a timely and efficient manner. If our integration efforts are not successful, our results of operations could be harmed, employee morale could decline, key employees could leave, and customer relations could be damaged. In addition, we may not achieve anticipated synergies or other benefits from either acquisition. |
| | • | | We have incurred substantial direct transaction costs as a result of these acquisitions and anticipate incurring substantial additional costs to support the integration of Eyesquad GmbH, Digital Optics Corporation and the assets of Shellcase, Ltd. The total cost of the integration may exceed our expectations. |
The way we integrate acquired company technology into our products may not be accepted by consumers.
We have devoted, and expect to continue to devote, considerable time and resources to acquiring and integrating new technologies, such as the technologies acquired from Eyesquad GmbH, Digital Optics Corporation and Shellcase, Ltd., into our products. However, if consumers do not accept the way we have integrated this technology, they may adopt competing solutions. In addition, as we introduce new products, we cannot predict with certainty if and when our customers will transition to those new products. If consumers fail to accept new or upgraded products incorporating our technologies, our financial results could be adversely impacted.
The market for semiconductors and related products is highly concentrated, and we have limited opportunities to sell our products.
The semiconductor industry is highly concentrated in that a small number of semiconductor designers and manufacturers account for a substantial portion of the purchases of semiconductor products generally, including our products and products incorporating technologies that we may acquire. Consolidation in the semiconductor industry may increase this concentration. Accordingly, we expect that sales of our products, including sales of products and technologies that we acquire, will be concentrated with a limited number of customers for the foreseeable future. As we acquire new technologies and integrate them into our product line, we will need to establish new relationships to sell these products. Our financial results depend in significant part on our success in establishing and maintaining relationships with, and effecting substantial sales to, these customers. Even if we are successful in establishing and maintaining such relationships, our financial results will be dependent in large part on these customers’ sales and business results.
If we lose any of our key personnel or are unable to attract, train and retain qualified personnel, we may not be able to execute our business strategy effectively.
Our success depends, in large part, on the continued contributions of our key management, engineering, sales and marketing, legal and finance personnel, many of whom are highly skilled and would be difficult to replace. In particular, the services of Dr. McWilliams, our President, Chief Executive Officer and the Chairman
29
of our Board of Directors, who has led our company since May 1999 and has been the Chairman of our board of directors since February 2002, are very important to our business. None of our senior management, key technical personnel or key sales personnel are bound by written employment contracts to remain with us for a specified period. In addition, we do not currently maintain key person life insurance covering our key personnel. The loss of any of our senior management or other key personnel could harm our ability to implement our business strategy and respond to the rapidly changing market conditions in which we operate.
Moreover, some of the individuals on our management team have been in their current positions for a relatively short period of time. For example, our chief financial officer has been with us for less than 12 months. Our future success will depend to a significant extent on the ability of our management team to work together effectively.
In addition, the initial stock options that were granted to many of our senior management and key employees are fully vested. Therefore, these employees may not have sufficient financial incentive to stay with us, we may have to incur costs to replace key employees that leave, and our ability to execute our business model could be impaired if we cannot replace departing employees in a timely manner.
Many of our senior management personnel and other key employees have become, or will soon become, substantially vested in their initial stock options grants. While we often grant additional stock options to management personnel and other key employees after their hire dates to provide additional incentives to remain employed by us, their initial grants are usually much larger than follow-on grants. Employees may be more likely to leave us after their initial option grant fully vests, especially if the shares underlying the options have significantly appreciated in value relative to the option exercise price. If any members of our senior management team leave the company, our ability to successfully operate our business could be impaired. We also may have to incur significant costs in identifying, hiring, training and retaining replacements for departing employees.
Our success also depends on our ability to attract, train and retain highly skilled managerial, engineering, sales, marketing, legal and finance personnel and on the abilities of new personnel to function effectively, both individually and as a group. Competition for qualified senior employees can be intense. For example, we have experienced, and we expect to continue to experience, difficulty in hiring and retaining highly skilled engineers with appropriate qualifications to support our growth and expansion. Further, we must train our new personnel, especially our technical support personnel, to respond to and support our licensees and customers. If we fail to do this, it could lead to dissatisfaction among our licensees or customers, which could slow our growth or result in a loss of business.
Decreased effectiveness of share-based compensation could adversely affect our ability to attract and retain employees.
We have historically used stock options and other forms of stock-based compensation as key components of our employee compensation program in order to align employees’ interests with the interests of our stockholders, encourage employee retention and provide competitive compensation and benefit packages. In accordance with SFAS 123(R), “Share-Based Payment,” we began recording charges to earnings for stock-based payments on January 1, 2006. As a result, we have incurred increased compensation costs associated with our stock-based compensation programs. Moreover, difficulties relating to obtaining stockholder approval of equity compensation plans could make it harder or more expensive for us to grant stock- based payments to employees in the future. As a result, we may find it difficult to attract, retain and motivate employees, and any such difficulty could materially adversely affect our business.
Failure to comply with environmental regulations could harm our business.
We use hazardous substances in the manufacturing and testing of prototype products and in the development of our technologies in our research and development laboratories. We are subject to a variety of local, state,
30
federal and foreign governmental regulations relating to the storage, discharge, handling, emission, generation, manufacture and disposal of toxic or other hazardous substances. Our past, present or future failure to comply with environmental regulations could result in the imposition of substantial fines on us, suspension of production, and alteration of our manufacturing processes or cessation of operations. Compliance with such regulations could require us to acquire expensive remediation equipment or to incur other substantial expenses. Any failure by us to control the use, disposal, removal or storage of, or to adequately restrict the discharge of, or assist in the cleanup of, hazardous or toxic substances, could subject us to significant liabilities, including joint and several liability under certain statues. The imposition of such liabilities could significantly harm our business.
Our corporate headquarters are located in California and, as a result, we are subject to earthquakes and other disasters.
Our business operations depend on our ability to maintain and protect our facilities, computer systems and personnel, which are primarily located in or near our principal headquarters in San Jose, California. San Jose exists on or near a known earthquake fault zone. Should an earthquake or other catastrophes, such as fires, floods, power loss, communication failure or similar events disable our facilities, we do not have readily available alternative facilities from which we could conduct our business.
We have business operations located in North Carolina that are subject to natural disasters.
Our business operations depend on our ability to maintain and protect our facilities, computer systems and personnel, some of which are located in Charlotte, North Carolina. Should a hurricane or other catastrophes, such a fire, flood, power loss, communication failure or similar event disable our facilities, we do not have readily available alternative facilities from which we could conduct our business.
We have research and development facilities in Yokohama, Japan and in Jerusalem and Tel Aviv, Israel that subject us to risks that may negatively affect our results of operations and financial condition.
Our research and development facilities in Yokohama, Japan and in Jerusalem and TelAviv, Israel may be subject to risks that may limit our ability to design, develop, test or market certain technologies, which could in turn have an adverse effect on our results of operations and financial condition, including:
| | • | | security concerns, including crime, political instability, terrorist activity, armed conflict and civil or military unrest; |
| | • | | local business and cultural factors that differ from our normal standards and practices in the United States; |
| | • | | regulatory requirements and prohibitions that differ between jurisdictions; |
| | • | | differing employment practices and labor issues |
| | • | | limited infrastructure and disruptions, such as large-scale outages or interruptions of service from utilities or telecommunications providers; and |
Compliance with changing regulation of corporate governance and public disclosure may result in additional expenses.
Changing laws, regulations and standards relating to corporate governance and public disclosure, including the Sarbanes-Oxley Act of 2002, new SEC regulations and NASDAQ Stock Market rules, have created uncertainty for companies. These laws, regulations and standards are often subject to varying interpretations. As a result, their application in practice may evolve as new guidance is provided by regulatory and governing bodies, which could result in higher costs necessitated by ongoing revisions to disclosure and governance
31
practices. As a result of our efforts to comply with evolving laws, regulations and standards, we have increased and will likely continue to increase general and administrative expenses and a diversion of management time and attention from revenue-generating activities to compliance activities. While we believe that we currently have adequate internal control procedures in place, we are still exposed to potential risks from recent legislation requiring companies to evaluate controls under Section 404 of the Sarbanes-Oxley Act of 2002. Our efforts to comply with Section 404 and the related regulations regarding our required assessment of our internal controls over financial reporting and our external auditors’ audit of that assessment has required the commitment of significant financial and managerial resources. We expect these efforts to require the continued commitment of significant resources. Further, our Board members, Chief Executive Officer and Chief Financial Officer could face an increased risk of personal liability in connection with the performance of their duties. As a result, we may have difficulty attracting and retaining qualified board members and executive officers, which could harm our business.
| Item 1B. | Unresolved Staff Comments |
None.
The following table sets forth our locations worldwide.
| | | | |
Facility | | Location | | Approximate
Square
Footage |
Corporate Headquarters | | San Jose, California | | 51,000 |
Research and Development and Manufacturing | | Charlotte, North Carolina | | 100,000 |
Research and Development | | Jerusalem, Israel | | 2,400 |
Research and Development | | TelAviv, Israel | | 2,000 |
Research and Development | | Yokohama, Japan | | 10,500 |
Sales Representative Office | | Chupei, Hsinchu, Taiwan | | 1,000 |
Our principal corporate administrative, sales, marketing and research and development facilities occupy approximately 51,000 square feet in one building in San Jose, California, under a lease that expires on May 31, 2011. In July 2006, we acquired a research and development and manufacturing facility in Charlotte, North Carolina, which we own, that occupies approximately 100,000 square feet in one building on approximately 18 acres of land. We also have research and development facilities in Jerusalem, Israel, Tel Aviv, Israel and Yokohama, Japan that occupy approximately 2,400 square feet, 2,000 square feet and 10,500 square feet, respectively, under leases that expire on January 31, 2011, October 15, 2007 and October 31, 2009, respectively. In addition, we have a sales representative office in Chupei, Hsinchu, Taiwan that occupies approximately 1,000 square feet in one building under a lease that expires on January 15, 2009. We believe our existing facilities are adequate for our current needs.
Tessera, Inc. v. Advanced Micro Devices, Inc. et al., Civil Action No. 05-04063 (N.D. Cal),
As reported in previous SEC filings, including our Quarterly Report on Form 10-Q for the quarter ended September 30, 2006, on October 7, 2005, we filed a complaint for patent infringement against Advanced Micro Devices, Inc., or AMD, and Spansion LLC, or Spansion, in the United States District Court for the Northern District of California, alleging infringement of Tessera’s U.S. Patents 5,679,977, 5,852,326, 6,433,419 and 6,465,893 arising from AMD’s and Spansion’s respective manufacture, use, sale, offer to sell and/or importation of certain packaged semiconductor components and assemblies thereof. We seek to recover damages, up to treble the amount of actual damages, together with attorney’s fees, interest and costs. We also seek other relief, including enjoining AMD and Spansion from continuing to infringe these patents.
32
On December 16, 2005, we filed a first amended complaint to add Spansion Inc. and Spansion Technology, Inc. to the lawsuit. Spansion Inc. and Spansion Technology, Inc. are two new entities created by the initial public offering of Spansion in December 2005.
On January 31, 2006, we filed a second amended complaint to add claims of breach of contract and/or patent infringement against several new defendants, including Advanced Semiconductor Engineering, Inc. ASE (U.S.) Inc., ChipMOS Technologies, Inc., ChipMOS U.S.A., Inc., Siliconware Precision Industries Co. Ltd, Siliconware USA Inc., STMicroelectronics N.V., STMicroelectronics, Inc., STATS ChipPAC Ltd., STATS ChipPAC, Inc. and STATS ChipPAC Ltd. (BVI).
The defendants in this action have asserted affirmative defenses to our patent infringement claims, and some of them have brought related counterclaims alleging that the Tessera patents at issue are not infringed, invalid and unenforceable and/or that Tessera is not the owner of the patents. We cannot predict the outcome of this proceeding. Discovery is ongoing, and trial is currently set for January 28, 2008. An adverse decision in this proceeding could significantly harm our business and financial condition.
Tessera, Inc. v. Amkor Technology, Inc.
As reported in our previous SEC filings, including our Quarterly Report on Form 10-Q for the quarter ended September 30, 2006, on March 2, 2006, we issued a request for arbitration with Amkor Technology, Inc., or Amkor, regarding Amkor’s failure to pay royalties under its license agreement with Tessera. On November 1, 2006, the arbitration tribunal issued a provisional timetable specifying a seven-day tribunal hearing starting October 1, 2007. We cannot predict the outcome of this proceeding. An adverse decision in this proceeding could significantly harm our business and financial condition.
Tessera, Inc. v. Hynix Semiconductor Inc. et. al Case No. 106CV-076688
On December 18, 2006, we filed but did not serve a complaint against Hynix Semiconductor Inc. and Hynix Semiconductor America, Inc., (collectively, “Hynix”) in the Superior Court of the State of California, for the county of Santa Clara, alleging violations of California antitrust law and California common law based on Hynix’s alleged anticompetitive actions in markets related to synchronous DRAM. We also seek other relief, including enjoining Hynix from continuing their alleged anticompetitive actions. On February 7, 2007, we served the complaint on Hynix Semiconductor America, Inc. We have also initiated international service of process under the Hague Convention, which is in progress. This litigation is in its early stages, and we cannot predict the outcome of this proceeding. An adverse decision in this proceeding could significantly harm our business and financial condition.
Tessera, Inc. v. Micron Technology, Inc. et al, Civil Action No. 02-05cv-94 (E.D. Tex.)
As reported in our previous SEC filings, including our Quarterly Report on Form 10-Q for the quarter ended September 30, 2006, in July 2006, we entered into definitive agreements to settle our lawsuit against Micron Technology, Inc. and its subsidiaries (collectively “ Micron”) and against Infineon Technologies AG, or Infineon, and its subsidiaries including Qimonda AG, or Qimonda, in the U.S. District Court for the Eastern District of Texas. As initially filed on March 1, 2005, and subsequently amended, this lawsuit alleged Micron’s and Infineon’s infringement of Tessera’s U.S. Patents 5,852,326, 5,679,977, 6,433,419, 6,465,893 and 6,133,627; as well as Micron’s and Infineon’s violations of federal antitrust law, Texas antitrust law, and Texas common law. On July 20, 2006, Tessera and Micron entered into a Settlement Agreement and a TCC License Agreement that resolved all outstanding litigation between them. On July 31, 2006, Tessera, Infineon and Qimonda each entered into a Settlement Agreement and TCC License Agreements that resolved all outstanding litigation between them.
33
Micron Technology, Inc. et al. v. Tessera, Inc., Civil Action No. 02-05cv-319 (E.D. Tex.)
On July 20, 2006, Tessera and Micron entered into a Settlement Agreement and a TCC License Agreement that resolved all outstanding litigation between the companies, including this lawsuit, in which Micron alleged that Tessera infringed Micron’s U.S. Patent Nos. 5,739,585, 6,013,948, 6,268,649, 6,738,263, 5,107,328, 6,265,766, 4,992,849 and Re. 36,325.
| Item 4. | Submission of Matters to a Vote of Security Holders |
None.
34
PART II
| Item 5. | Market for Registrant’s Common Equity and Related Stockholder Matters |
Our common stock began trading publicly on the Nasdaq Stock Market on November 13, 2003 and is traded under the symbol “TSRA.” Prior to that date, there was no public market for our common stock. The following table sets forth the high and low closing sales prices of the common stock during the prior three fiscal years.
| | | | | | |
| | | High | | Low |
Fiscal Year Ended December 31, 2003 | | | | | | |
Fourth Quarter (beginning November 13, 2003) | | $ | 22.25 | | $ | 16.95 |
| | |
| | | High | | Low |
Fiscal Year Ended December 31, 2004 | | | | | | |
First Quarter (ended March 31, 2004) | | $ | 22.30 | | $ | 17.00 |
Second Quarter (ended June 30, 2004) | | $ | 19.90 | | $ | 16.41 |
Third Quarter (ended September 30, 2004) | | $ | 24.00 | | $ | 15.77 |
Fourth Quarter (ended December 31, 2004) | | $ | 39.45 | | $ | 22.59 |
| | |
| | | High | | Low |
Fiscal Year Ended December 31, 2005 | | | | | | |
First Quarter (ended March 31, 2005) | | $ | 45.03 | | $ | 33.63 |
Second Quarter (ended June 30, 2005) | | $ | 45.03 | | $ | 25.60 |
Third Quarter (ended September 30, 2005) | | $ | 36.00 | | $ | 28.96 |
Fourth Quarter (ended December 31, 2005) | | $ | 30.36 | | $ | 25.75 |
| | |
| | | High | | Low |
Fiscal Year Ended December 31, 2006 | | | | | | |
First Quarter (ended March 31, 2006) | | $ | 34.83 | | $ | 26.64 |
Second Quarter (ended June 30, 2006) | | $ | 34.95 | | $ | 25.83 |
Third Quarter (ended September 30, 2006) | | $ | 35.19 | | $ | 24.96 |
Fourth Quarter (ended December 31, 2006) | | $ | 41.27 | | $ | 33.36 |
As of December 31, 2006 there were outstanding 47,213,712 shares of common stock held by 49 stockholders of record, options to purchase 4,187,880 shares of common stock under our stock option plans and warrants to purchase 298 shares of common stock. We have not paid cash dividends on our common stock since our inception and we do not anticipate paying any in the foreseeable future.
35
PERFORMANCE GRAPH
The following graphic representation shows a comparison of total stockholder return for holders of our common stock from November 13, 2003, the date of our initial public offering, through December 31, 2006, compared with The Nasdaq Stock Market (U.S.) Index and the Philadelphia Stock Exchange Semiconductor Index. This graphic comparison is presented pursuant to the rules of the Securities and Exchange Commission.
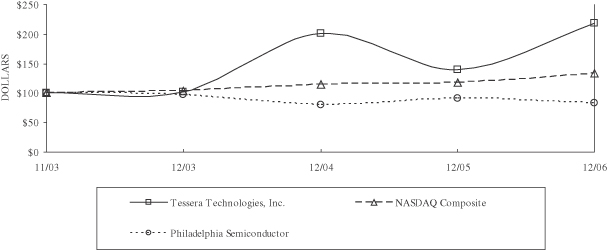
| | | | | | | | | | | | | | | |
| | | 11/03 | | 12/03 | | 12/04 | | 12/05 | | 12/06 |
Tessera Technologies, Inc. | | $ | 100.00 | | $ | 101.68 | | $ | 201.14 | | $ | 139.73 | | $ | 218.05 |
NASDAQ Composite | | $ | 100.00 | | $ | 104.45 | | $ | 114.09 | | $ | 117.43 | | $ | 133.53 |
Philadelphia Semiconductor | | $ | 100.00 | | $ | 98.25 | | $ | 79.60 | | $ | 90.49 | | $ | 83.92 |
| * | $100 invested on November 13, 2003 in our common stock, the Philadelphia Stock Exchange Semiconductor Index and the Nasdaq Stock Market, including reinvestment of dividends. Fiscal year ending December 31, 2006. |
This section is not “soliciting material,” is not deemed “filed” with the commission and is not to be incorporated by reference in any filing of Tessera under the Securities Act or the Exchange Act, whether made before or after the date hereof and irrespective of any general incorporation language in any such filing.
Initial Public Offering
Our initial public offering of 7,500,000 shares of common stock was effected through a Registration Statement on Form S-1 (File No. 333-108518) that was declared effective by the Securities and Exchange Commission on November 12, 2003.
All of the net proceeds from the initial public offering remain invested in short-term, money market funds pending application of the funds to general corporate purposes, as described in the Registration Statement on Form S-1.
36
| Item 6. | Selected Financial Data |
You should read the following selected consolidated financial data in conjunction with “Management’s Discussion and Analysis of Financial Condition and Results of Operations” and our consolidated financial statements and the related notes appearing elsewhere in this annual report.
The consolidated statement of operations data for the fiscal years ended December 31, 2006, December 31, 2005 and December 31, 2004 and the consolidated balance sheet data as of December 31, 2006 and December 31, 2005 are derived from our audited consolidated financial statements appearing elsewhere in this annual report. The consolidated statement of operations data for the fiscal years ended December 31, 2003 and December 31, 2002 and the consolidated balance sheet data as of December 31, 2004, December 31, 2003 and December 31, 2002 are derived from our audited consolidated financial statements that are not included in this annual report. The historical results are not necessarily indicative of the results to be expected in any future period. In the years prior to 2006, stock compensation expense was presented as a separate line item. For purposes of comparing the current year 2006 to prior years, we have included the revenue and expense of our completed acquisitions along with stock compensation expense in the appropriate operating revenue and expense lines.
| | | | | | | | | | | | | | | | | | | |
| | | Years Ended December 31, | |
| | | 2006 | | | 2005 | | | 2004 | | 2003 | | | 2002 | |
| | | (in thousands, except per share data) | |
Consolidated Statement of operations data | | | | | | | | | | | | | | | | | | | |
Revenues: | | | | | | | | | | | | | | | | | | | |
Royalty and license fees | | $ | 99,606 | | | $ | 56,930 | | | $ | 39,624 | | $ | 25,393 | | | $ | 17,925 | |
Past production payments (1) | | | 83,132 | | | | 21,269 | | | | 19,998 | | | 3,169 | | | | 5,715 | |
Production and service revenues | | | 25,988 | | | | 16,501 | | | | 13,114 | | | 8,759 | | | | 4,630 | |
| | | | | | | | | | | | | | | | | | | |
Total Revenues | | | 208,726 | | | | 94,700 | | | | 72,736 | | | 37,321 | | | | 28,270 | |
| | | | | | | | | | | | | | | | | | | |
Operating expenses: | | | | | | | | | | | | | | | | | | | |
Cost of revenues | | | 19,359 | | | | 13,313 | | | | 9,613 | | | 6,735 | | | | 4,267 | |
Research and development and other related costs | | | 20,063 | | | | 7,453 | | | | 7,163 | | | 8,058 | | | | 7,227 | |
Selling, general and administrative | | | 70,309 | | | | 28,361 | | | | 20,319 | | | 11,742 | | | | 8,964 | |
| | | | | | | | | | | | | | | | | | | |
Total operating expenses | | | 109,731 | | | | 49,127 | | | | 37,095 | | | 26,535 | | | | 20,458 | |
| | | | | | | | | | | | | | | | | | | |
Operating income | | | 98,995 | | | | 45,573 | | | | 35,641 | | | 10,786 | | | | 7,812 | |
Interest and other income, net | | | 6,499 | | | | 3,555 | | | | 828 | | | 195 | | | | 45 | |
| | | | | | | | | | | | | | | | | | | |
Income before taxes | | | 105,494 | | | | 49,128 | | | | 36,469 | | | 10,981 | | | | 7,857 | |
Benefit (provision) for income taxes | | | (44,143 | ) | | | (17,679 | ) | | | 22,594 | | | (1,626 | ) | | | (1,318 | ) |
| | | | | | | | | | | | | | | | | | | |
Net income | | $ | 61,351 | | | $ | 31,449 | | | $ | 59,063 | | $ | 9,355 | | | $ | 6,539 | |
Cumulative preferred stock dividends in arrears (2) | | $ | — | | | $ | — | | | $ | — | | $ | (6,187 | ) | | $ | (12,941 | ) |
| | | | | | | | | | | | | | | | | | | |
Net income (loss) attributable to common stockholders | | $ | 61,351 | | | $ | 31,449 | | | $ | 59,063 | | $ | 3,168 | | | $ | (6,402 | ) |
| | | | | | | | | | | | | | | | | | | |
Net income (loss) per common share; basic | | $ | 1.33 | | | $ | 0.71 | | | $ | 1.47 | | $ | 0.28 | | | $ | (0.94 | ) |
| | | | | | | | | | | | | | | | | | | |
Net income (loss) per common share; diluted | | $ | 1.27 | | | $ | 0.66 | | | $ | 1.27 | | $ | 0.22 | | | $ | (0.94 | ) |
| | | | | | | | | | | | | | | | | | | |
Weighted average number of shares used in per share calculation, basic (3) | | | 46,102 | | | | 44,003 | | | | 40,077 | | | 11,141 | | | | 6,784 | |
| | | | | | | | | | | | | | | | | | | |
| (1) | Past production payments consist of a portion of the payments received through license negotiations or the resolution of patent disputes, insofar as such payments include amounts for royalties related to previous periods, or resolution of royalties under payments discovered during compliance audits. |
| (2) | All outstanding shares of preferred stock were converted into shares of common stock in connection with our initial public offering. |
37
| (3) | See note 7 of Notes to Consolidated Financial Statements in this annual report for an explanation of the methods used to determine the number of shares used to compare per share amounts. |
| | | | | | | | | | | | | | | | | | | |
| | | Fiscal Year Ended December 31, | |
| | | 2006 | | 2005 | | | 2004 | | | 2003 | | | 2002 | |
| | | (in thousands) | |
Consolidated balance sheet data: | | | | | | | | | | | | | | | | | | | |
Cash, cash equivalents and short-term investments | | $ | 194,076 | | $ | 127,594 | | | $ | 108,339 | | | $ | 64,379 | | | $ | 20,170 | |
Total assets | | | 330,278 | | | 190,127 | | | | 139,682 | | | | 70,081 | | | | 24,170 | |
Redeemable convertible preferred stock | | | — | | | — | | | | — | | | | — | | | | 96,000 | |
Deferred stock-based compensation | | | — | | | (2,245 | ) | | | (414 | ) | | | (153 | ) | | | (620 | ) |
Total stockholders’ (deficit equity) | | | 305,855 | | | 179,958 | | | | 134,976 | | | | 65,989 | | | | (74,492 | ) |
| Item 7. | Management’s Discussion and Analysis of Financial Condition and Results of Operations |
Overview
Tessera is a developer and licensor of miniaturization technologies for the electronics industry. We enable improvements in the size, performance and cost of our customers’ products by applying our expertise in the electrical, thermal and mechanical properties of semiconductor materials, and in the design and manufacturing of micro-optics. Our intellectual property includes more than one thousand domestic and internationally issued patents and patent applications, covering a broad range of advanced semiconductor packaging, substrate, interconnect and micro-optics solutions. We license our chip packaging technology to our customers on a worldwide basis enabling them to produce semiconductor chips that are smaller and faster, and incorporate more features. These semiconductors are utilized in a broad range of electronics products, including digital audio players, digital cameras, personal computers, personal digital assistants, video game consoles and mobile phones. In addition, by using our technology, we believe that our customers are also able to reduce the time to market, and the development costs of their semiconductors.
Our patented chip packaging technology enables our customers to assemble semiconductor chips into CSPs, that are almost as small as the chip itself. This technology also enables multiple chips to be stacked vertically in a single three-dimensional multi-chip package that occupies almost the same circuit board area as a CSP. Our technology allows a plurality of semiconductor chips and passive components to be densely combined in ultra-compact electronics modules. By reducing the size of the semiconductor package and shortening electrical connections between the chip and the circuit board, our technology allows further miniaturization and increases in performance and functionality for electronic products. We achieve these benefits without sacrificing reliability by allowing movement within the package, thus addressing critical problems associated with thermally-induced stress which can occur when packages decrease in size. Our technologies also enable our customers to package semiconductor chips and micro-devices at the wafer level (called WLP) and to create high-density interconnections between electronic components using flexible substrate materials.
We have a significant consumer optics technology portfolio that includes image sensor packaging, wafer-level camera manufacturing technology, camera assembly technology and technology for auto focus and zoom. According to market research firm Prismark, the market for consumer electronic devices that contain cameras including mobile phones, notebook computers, security systems and automotive electronics, will increase to approximately 1.7 billion units in 2010. We believe that we are well-positioned to take advantage of this expected significant growth in consumer optics. We have an ongoing effort to develop and license optical technologies for the mobile phone market. This market is growing rapidly, with over 1 billion cameras expected to be incorporated in mobile phones in 2010.
We derive license fees and worldwide royalties based upon our intellectual property, and generate fees for related services. Our semiconductor chip packaging technology has been widely adopted and is currently licensed to more than 60 companies, including Intel Corporation, Renesas Technology Co., Samsung Electronics Co.,
38
Ltd., Sharp Corporation, Texas Instruments, Inc. and Toshiba Corporation. We believe that more than 100 companies across the semiconductor supply chain have invested in the materials, equipment and assembly infrastructure needed to manufacture products that incorporate our packaging technology. As a result, our technology has been incorporated into more than 10.0 billion semiconductors worldwide. Based upon Gartner Dataquest, we anticipate that the market using Tessera CSP technology will grow to more than 16.4 billion units in 2008, from 8.1 billion units in 2005, representing a compound annual growth rate of 27%.
We generate revenues from:
| | • | | royalties and license fees, which represent the majority of our revenues and consist of royalties on semiconductors shipped by our licensees that employ our patented technologies; and |
| | • | | products and services, which utilize or further develop our technology offerings. |
Our licensees pay a non-refundable license fee. Revenues from license fees are generally recognized once the license agreement has been executed by both parties. In some instances, we provide training to our licensees under the terms of the license agreement but the amount of training we provide is limited and is incidental to the licensed technology. Accordingly, in instances where training is provided under the terms of a license agreement, a portion of the license fee is deferred until the training has been provided. The amount of revenues deferred is based on the price we charge for similar services when they are sold separately.
Semiconductor manufacturers and assemblers pay on-going worldwide royalties on their production or shipment of semiconductors incorporating our intellectual property. Royalty payments are primarily based upon the number of electrical connections to the semiconductor chip in a package covered by our technology, although we do have arrangements in which royalties are paid based upon a percent of the net sales price. Our licensees report royalties quarterly, and most also pay on a quarterly basis. As there is no reliable basis on which to estimate our royalty revenues prior to obtaining these reports from our licensees, we recognize royalty revenues when we receive a royalty report from our customer. We receive these reports the quarter after the semiconductors that incorporate our technology have been produced or shipped.
From time to time, we receive payments through license negotiations or through the resolution of patent disputes. These license negotiations and dispute resolutions generally include amounts for royalties related to previous periods based on historical production volumes. These amounts are reported as “past production payments revenues” in the statement of operations. Past production payments revenues will vary significantly on a quarterly basis.
Product and service revenues include sales of wafer level and micro-optics products, and engineering product development services for purposes of servicing strategic customers and entering new markets, as well as engineering services, including related training services. Product revenue is generated principally from sales of wafer level and micro-optic products. We recognize revenue from product sales when fundamental criteria are met, such as title, risk and rewards of product ownership are transferred to the customer, price and terms are fixed and the collection of the resulting receivable is reasonably assured. Revenues from services are recognized on progress toward completion or completed contract method of accounting depending on the nature of the project. Under the percentage-of-completion method, revenues recognized are that portion of the total contract price equal to the ratio of costs expended to date to the anticipated final total costs based on current estimates of the total costs to complete the projects. If the total estimated costs to complete a project were to exceed the total contract amount, indicating a loss, the entire anticipated loss would be recognized immediately. Revenues under the completed contract method are recognized upon acceptance by the customer or in accordance with the contract specifications. Revenues from services related to training are recognized as the services are performed.
We derive a significant portion of our revenues from licensees headquartered outside of the United States, principally in Asia and Europe. For the year ended December 31, 2006, these revenues accounted for 64% of our
39
total revenues. For the year ended December 31, 2005, these revenues accounted for 56% of our total revenues. We expect that these revenues will continue to account for a significant portion of revenues in future periods. All of our revenues are denominated in U.S. dollars. For the year ended December 31, 2006, revenues from Micron Technology, Inc. and Qimonda AG. accounted for 15% and 21% of total revenues, respectively. For the year ended December 31, 2005 revenues from Samsung Electronics, Co., Ltd., and Texas Instruments, Inc., accounted for 20% and 17% of total revenues, respectively.
We license most of our CSP and multi-chip packaging technology under a license that we refer to as a TCC license. Our TCC license grants a worldwide royalty-bearing right under the licensed patent claims to assemble, use and sell certain CSPs and multi-chip packages. We generally license semiconductor material suppliers under our TCMT license. Our TCMT license calls for a one-time license fee and, unlike most of our other licenses, does not require ongoing royalty payments.
Effective 2006 we organized our business units into three operating divisions: the Licensing Business, the Product Division and Emerging Markets and Technologies Group. These divisions are reported into the Intellectual Property segment, which consists primarily of our Licensing Business, and Emerging Markets and Technologies group and the Services segment, which consists primarily of the Product Division. The Product Division incorporates operational functions that are reported in both our Intellectual Property and Services segments. The segments were determined based upon how our management views and evaluates our operations. Segment information in this Item 7—Management’s Discussion and Analysis of Financial Condition and Results of Operations and in Note 13 of the Notes to Consolidated Financial Statements included in this report are presented in accordance with SFAS No. 131, “Disclosure about Segments of an Enterprise and Related Information.” We do not present financial data to our management for each of our divisions and our management does not evaluate each division separately from our segments when measuring the operating performance of our business. In addition to our reportable segments, we also have a Corporate Overhead category that is not a reportable segment. This category includes certain operating expenses and credits that are not allocated to our business segments because these operating expenses and credits are not considered in evaluating the operating performance of our business segments.
Cost of revenues consists primarily of direct compensation, materials, patent amortization, supplies and equipment depreciation costs. Cost of revenues primarily relates to product and service revenues as the cost of revenues associated with intellectual property revenues is de minimis. Consequently, cost of revenues as a percentage of total revenues will vary based on the percentage of our revenues that is attributable to product and service revenues.
Research, development and other related costs consist primarily of compensation and related costs for personnel as well as costs related to patent applications and examinations, amortization of intangible assets, materials, supplies and equipment depreciation. Our research and development is conducted primarily in-house and targets CSP, multi-chip and WLP technology. All research, development and other related costs are expensed as incurred. We believe that a significant level of research, development and other related costs will be required for us to remain competitive in the future. We have increased research and development personnel to 149 at December 31, 2006 from 86 at December 31, 2005, and expect to continue to increase research and development personnel in the future.
Selling expenses consist primarily of compensation and related costs for sales and marketing personnel, marketing programs, public relations, promotional materials, travel and related trade show expenses. General and administrative expenses consist primarily of compensation and related costs for: general management, information technology, finance and accounting personnel; litigation expenses and related fees; facilities costs; and professional services. Our general and administrative expenses are not allocated to other expense line items. We anticipate that our selling, general and administrative expenses will increase as a result of our efforts to comply with Section 404 of the Sarbanes-Oxley Act of 2002, related regulations and ongoing revisions to disclosure and governance practices. Excluding litigation expenses, we expect that as a percentage of revenues,
40
these expenses will decrease over time. However, we expect that litigation expenses will continue to be a material portion of our general and administrative expenses in future periods, and may increase significantly in some periods, because of our ongoing litigation, as described above in Part I, Item 3—Legal Proceedings, and because we expect that we will become involved in other litigation from time to time in the future in order to enforce and protect our intellectual property rights.
In connection with the grant of stock options from 1996 through 2006, there was an aggregate of $53.2 million in deferred stock-based compensation due to the difference between the exercise price and the estimated fair value of common stock on the date of grant. Compensation expense is recorded over the vesting period of generally four years to five years. As of December 31, 2006, we had an aggregate of $20.2 million of deferred stock-based compensation after estimated forfeitures remaining that will be recorded as expenses through 2010.
Results of Operations
The following table presents our historical operating results for the periods indicated as a percentage of revenues:
| | | | | | | | | |
| | | Fiscal Year Ended
December 31, | |
| | | 2006 | | | 2005 | | | 2004 | |
Revenues: | | | | | | | | | |
Royalty and license fees | | 47.7 | % | | 60.1 | % | | 54.5 | % |
Past production payments | | 39.8 | | | 22.5 | | | 27.5 | |
Production and service revenues | | 12.5 | | | 17.4 | | | 18.0 | |
| | | | | | | | | |
Total Revenues | | 100.0 | | | 100.0 | | | 100.0 | |
| | | | | | | | | |
Operating expenses: | | | | | | | | | |
Cost of revenues | | 9.3 | | | 14.1 | | | 13.2 | |
Research and development and other related costs | | 9.6 | | | 7.9 | | | 9.8 | |
Selling, general and administrative | | 33.7 | | | 29.9 | | | 27.9 | |
| | | | | | | | | |
Total operating expenses | | 52.6 | | | 51.9 | | | 51.0 | |
| | | | | | | | | |
Operating income | | 47.4 | | | 48.1 | | | 49.0 | |
Interest and other income, net | | 3.1 | | | 3.8 | | | 1.1 | |
| | | | | | | | | |
Income before taxes | | 50.5 | | | 51.9 | | | 50.1 | |
Benefit (provision) for income taxes | | (21.1 | ) | | (18.7 | ) | | 31.1 | |
| | | | | | | | | |
Net income | | 29.4 | % | | 33.2 | % | | 81.2 | % |
| | | | | | | | | |
Fiscal Year 2006 and 2005
Revenues. Revenues for the year ended December 31, 2006 were $208.7 million, compared to $94.7 million for the year ended December 31, 2005, an increase of $114.0 million, or 120%. The increase was primarily due to a $42.7 million increase in royalties and license fees revenues, a $61.9 million increase in past production payments and a $9.5 million increase in product and service revenues.
Cost of Revenues. Cost of revenues primarily relates to product and service revenues as the cost of revenues associated with royalty and license fee revenues is de minimis. For the year ended December 31, 2006, cost of revenues represented 74.5% of product and service revenues. For the year ended December 31, 2005, cost of revenues represented 80.7% of product and service revenues. Cost of revenues as a percentage of total revenues varies based on the product and service revenues component of total revenues.
41
Cost of revenues for the year ended December 31, 2006 was $19.4 million, as compared to $13.3 million for the year ended December 31, 2005, an increase of $6.1 million, or 45.4%. The majority of the increase was attributable to increased materials, subcontracting costs, the allocation of more personnel to product and service- related projects, an increase in the number of these projects, an inventory adjustment of $1.6 million, patent amortization of approximately $704,000 and stock based compensation expense of $2.9 million. The inventory adjustment of $1.6 million was directly related to the purchase accounting treatment of inventory acquired in our acquisition of Digital Optics Corporation in which the acquired inventory was written up to fair value in purchase accounting and then amortized as the inventory was sold. Increased material and subcontracting costs related to product and service-related projects also accounted for part of the increase in cost of revenues. For the year ended December 31, 2006, materials and subcontractor costs totaled $5.2 million, as compared to $3.6 million, for the ended December 31, 2005, an increase of $1.6 million, or 44.4%.
Research, Development and Other Related Costs. Research, development and other related costs for year ended December 31, 2006 were $20.1 million, as compared to $7.5 million for the year ended December 31, 2005, an increase of $12.6 million or 169.2%. The increase was primarily due to an increase in headcount from a total of 86 at December 31, 2005 to 149 at December 31, 2006, and related compensation expenses, including stock based compensation expense of $1.0 million, amortization of intangible assets of $1.1 million and costs for our research and development center in Jerusalem of $5.9 million, for the year ended December 31, 2006.
We believe that a significant level of research and development expenses will be required for us to remain competitive in the future.
Selling, General and Administrative. Selling, general and administrative or SG&A expenses for the year ended December 31, 2006 were $70.3 million, as compared to $28.4 million for the year ended December 31, 2005, an increase of $41.9 million, or 147.9%. The increase was primarily attributable to litigation expense of $28.6 million and stock-based compensation of $11.4 million, as well as our 2006 internal reorganization of personnel and departments to better align our resources to accommodate the needs of our business and our recent acquisition of Digital Optics Corporation. In this effort we have also increased our SG&A headcount by 36 in business development, human resources, finance and legal. The related compensation expense is included in SG&A expenses. Total litigation expenses for the year ended December 31, 2005 were $8.0 million. The increase in litigation is due to our ongoing legal actions, described in Part I, Item 3 – Legal Proceedings, above. Stock-based compensation for the year ended December 31, 2005 was approximately $804,000. The overall increase stock-based compensation is primarily related to our adoption of SFAS No. 123(R), an increase in the number of equity award grants due to our increased headcount and an increase in the issuance of restricted stock.
Excluding litigation expenses, we expect that, as a percentage of revenues, our SG&A expenses will decrease over time as our revenues continue to grow. However, we expect that litigation expenses will continue to be a material portion of our general and administrative expenses in future periods, and may increase significantly in some periods, because of our ongoing litigation, as described in Part I, Item 3 – Legal Proceedings, above, and because we expect that we will become involved in other litigation from time to time in the future in order to enforce and protect our intellectual property rights.
Stock-based Compensation. On January 1, 2006, we adopted SFAS No. 123(R), under which the measurement and recognition of compensation expense for all stock-based payment awards made to employees and directors including employee stock options and employee stock purchases under our 2003 Employee Stock Purchase Plan, or ESPP based on estimated fair values was required. SFAS No. 123(R) supersedes our previous accounting under Accounting Principles Board Opinion No. 25 (APB No. 25), “Accounting for Stock Issued to Employees” for periods beginning in fiscal year 2006.
SFAS No. 123(R) requires companies to estimate the fair value of stock-based payment awards on the date of grant using an option-pricing model. The value of the portion of the award that is ultimately expected to vest is recognized as expense over the requisite service periods in our Consolidated Statement of Operations.
42
We have applied the provisions of the Securities and Exchange Commission’s Staff Accounting Bulletin No. 107 (SAB 107) Thus, we have adopted SFAS No. 123(R) using the modified prospective transition method, which requires the application of the accounting standard as of the first day of the company’s fiscal year 2006. In accordance with the modified prospective transition method, our Consolidated Financial Statements for prior periods have not been restated to reflect, and do not include, the impact of SFAS No. 123(R). The valuation provisions of SFAS No. 123(R) apply to new awards and to awards that are outstanding on the effective date and subsequently modified or cancelled. Historically, we accounted for stock-based awards to employees and directors using the intrinsic value method in accordance with APB No. 25 and only disclosed the impact of SFAS No. 123 within the footnote disclosures of our financial statements. Thus, previously under the rules of APB No. 25 stock-based compensation expense was only recognized and reported in our Consolidated Statement of Operations for grants that had an exercise price that was less than the stock price at the date of grant.
In connection with our acquisition of Digital Optics Corporation in July 2006, we assumed each outstanding unvested option under the Digital Optics Corporation Employee Stock Option Plan. Each of the assumed options was converted to options to purchase Tessera common stock at an exchange ratio of 0.353 shares of Tessera common stock for each Digital Optics Corporation option. The conversion resulted in the grant of 156,000 options for the purchase of Tessera common stock.
Stock-based compensation increased to $15.4 million for the year ended December 31, 2006 as compared to $1.2 million for the year ended December 31, 2005. The increase is primarily due to the application of SFAS No. 123(R), an increase in grants due to an increase in headcount, an increase in the issuance of restricted stock and an increase in expense related to the ESPP in 2006.
Interest and Other Income, Net. Interest and other income, net for the year ended December 31, 2006 was $6.5 million, as compared to $3.6 million, for the year ended December 31, 2005. The increase is primarily related to income earned on higher cash balances as a result of positive cash flow generated from operations. Our cash balance at December 31, 2006 was $194.1 million as compared to $127.6 million at December 31, 2005.
Benefit and Provision for Income Taxes. Income tax provision for the year ended December 31, 2006 was $44.1 million. Income tax provision is comprised of federal and state income tax and foreign withholding tax. Income tax provision for the year ended December 31, 2005 was $17.7 million. The 2005 income tax provision included domestic income tax and foreign withholding tax. The increase in the income tax provision for the year ended December 31, 2006 is primarily attributable to the increase in the pre-tax income.
On November 10, 2005, the Financial Accounting Standards Board (FASB) issued FASB Staff Position No. FAS 123(R)-3. which requires a company to calculate the pool of excess tax benefits available to absorb tax deficiencies recognized subsequent to adopting SFAS No. 123 (R) (termed the APIC Pool), as if the company had adopted SFAS No. 123(R) in 1995. There are two methods to calculate the company’s hypothetical APIC Pool: (1) the long form method as set forth in paragraph 81 of SFAS No. 123(R), and (2) the short form method as set forth in FASB Staff Position 123R-3.
We have elected to use the long form method under which we track each award grant on an employee-by-employee basis and grant-by-grant basis to determine if there is a tax benefit situation or tax deficiency situation for such award. We then compare the fair value expense to the tax deduction received for each grant and aggregate the benefits and deficiencies to determine whether there is a hypothetical APIC pool (net tax benefit situation).
For the year ended December 31, 2006 we recognized a tax benefit to APIC, of $37.8 million. We paid an alternative minimum tax of approximately $450,000 in state income tax and no federal income tax for the year ended December 31, 2006. For the year ended December 31, 2005 we paid no federal or state income tax.
43
Fiscal Year 2005 and 2004
Revenues. Revenues for the year ended December 31, 2005 were $94.7 million compared with $72.7 million for the year ended December 31, 2004, an increase of $22.0 million, or 30.2%. The increase was primarily due to a $17.3 million increase in royalties and license fees revenues, a $1.3 million increase in past production payments revenues and a $3.4 million increase in service revenues.
Cost of Revenues. Cost of revenues for the year ended December 31, 2005 increased to $13.3 million, or 14.1% of revenues, from $9.6 million, or 13.2% of revenues, for the year ended December 31, 2004 primarily due to increased costs associated with an increase in service revenues. Cost of revenues primarily relates to service revenues as the cost of revenues associated with royalties and license fees revenues is not material. For the year ended December 31, 2005 and 2004, cost of revenues represented 80.7% and 73.3% respectively, of service revenues for each associated year. Cost of revenues as a percentage of total revenues will vary based on the service revenues component of total revenues. The majority of this increase in the year of 2005 was attributable to the allocation of more personnel to service-related projects and an increase in the number of these projects. Increased materials and subcontractor costs related to service-related projects also accounted for part of the increase in cost of revenues. For the year ended December 31, 2005 and 2004 materials and subcontractors costs totaled $3.6 million and $2.1 million, respectively, an increase of $1.5 million or 71.4%.
Research, Development and Other Related Costs. Research, development and other related costs for year ended December 31, 2005 were $7.5 million, as compared to $7.2 million for the year ended December 31, 2004, an increase of approximately $300,000 or 4 %. The increase is primarily due to the increase in stock compensation expense.
Selling, General and Administrative. Selling, general and administrative or SG&A expenses for the year ended December 31, 2005 were $28.4 million, as compared to $20.3 million for the year ended December 31, 2004, an increase of $8.1 million, or 39.6%. The increase was primarily attributable to building an infrastructure to support our internal reorganization of personnel and departments to better align our resources to accommodate the needs of our business. Our headcount increased by 21 in the following areas: business development, legal, finance and administration. The related compensation expense is included in SG&A. Total litigation expenses were $8.0 million for the year ended December 31, 2005, as compared to $7.2 million for the year ended December 31, 2004. We expect to continue to incur litigation expenses in upcoming quarters due to our ongoing litigation described in Part I, Item 3 – Legal Proceedings, above.
Stock-based Compensation. Stock-based compensation increased to $1.2 million for the year ended December 31, 2005 as compared to $231,000 for the year ended December 31, 2004. The increase is primarily due to issuances of shares of restricted stock in 2005.
Interest and Other Income, Net. Interest and other income, net was $3.6 million for the year ended December 31, 2005 as compared to $828,000 for the year ended December 31, 2004. The increase is directly related to income earned on higher cash balances as a result of positive cash flow generated from operations. Our cash balance was $127.6 million at December 31, 2005, compared to $108.3 million at December 31, 2004.
Benefit and Provision for Income Taxes. Provision for income taxes was $17.7 million for the year ended December 31, 2005 of which $4.1 million was attributable to foreign withholding taxes. For the year ended December 31, 2004, we recorded a provision benefit of $22.6 million consisting of $343,000 of Alternative Minimum Tax (“AMT”), $1.7 million of foreign withholding taxes off-set by a benefit for the recognition of deferred tax assets of $24.7 million. The $24.7 million benefit is due to the reversal of the valuation allowance against our net operating losses (“NOL”). Due to historic and current income, prospects of future book income and the resolution of the litigation with Samsung Electronics Co., Ltd., management determined that a valuation allowance was no longer necessary; as it was more likely than not that the deferred tax assets would be fully realized. Foreign withholding taxes paid, relate to statutory withholding taxes on license and royalty revenues
44
earned in foreign jurisdictions. We paid no federal or state income taxes in the years ended December 31, 2005 and 2004 primarily due to our NOL and tax benefits that resulted from employees that exercised their fully-vested non-qualified stock options, which reduced our income taxes currently payable for federal and state purposes.
Segment Results
Effective 2006 we organized our business units into three operating divisions: the Licensing Business, the Product Division and Emerging Markets and Technologies Group. These divisions are reported into the Intellectual Property segment , which consists primarily of our Licensing Business, and Emerging Markets and Technologies group and the Services segment , which consists primarily of the Product Division. The Product Division incorporates operational functions that are reported in both our Intellectual Property and Services segments.
Intellectual Property Segment
Licensing Business. Our licensing business is focused on licensing technologies in our core markets, including DRAM, Flash, SRAM, DSP, ASIC, ASSP, micro-controllers, general purpose logic and analog devices and imaging and micro-optics solutions. Key functions of this group include licensing, intellectual property management and marketing.
Emerging Markets and Technologies Group. Our Emerging Markets and Technologies group is focused on expanding our technology portfolio into areas outside of our core markets that represent long-term growth opportunities through application of products and technologies, research and development of new technologies for high growth markets and applications such as packaging, imaging, interconnect and materials. The Emerging Markets and Technologies group also focuses on long-term growth opportunities through new partnerships, ventures and acquisitions of complementary technology.
Services Segment
Product Division. Our Services segment is composed of our Product Division, which performs key research and development and drives our production development services revenues. This segment also addresses the challenges of electronic products miniaturization from a system perspective, through the dense interconnection of components, extensive use of three-dimensional packaging technologies, and the use of micro-optics technologies. This segment provides a vehicle for transitioning our research efforts into fully developed technologies both internally and externally with partners that can be licensed.
The Product Division incorporates operational functions that are reported in both the Intellectual Property and Services segments.
Our segments were determined based upon the manner in which our management views and evaluates our operations. Segment information below and in Note 13 of the Notes to Financial Statements is presented in accordance with the Statement of Financial Accounting Standards No. 131 (SFAS 131), “Disclosure about Segments of an Enterprise and Related Information.” We do not present financial data to our management for each of our divisions and our management does not evaluate each division separately from our segments when measuring the operating performance of our business. For years prior to 2005, revenues were presented to management in the Intellectual Property and Services categories; however expenses were not allocated or presented to our management for these categories. It would be impractical to determine an allocation method for prior year expenses, therefore only revenues will be presented for these segments. In addition to our reportable segments, we also have a Corporate Overhead category that is not a reportable segment. This category includes certain operating expenses and credits that are not allocated to our business segments because these operating expenses and credits are not considered in evaluating the operating performance of our business segments.
45
The following table sets forth our segments revenues, operating expenses and operating income (loss) (in thousands):
| | | | | | | | | | | |
| | | Years Ended December 31, |
| | | 2006 | | | 2005 | | | 2004 |
Revenues: | | | | | | | | | | | |
Intellectual Property Segment | | $ | 182,763 | | | $ | 78,199 | | | $ | 59,622 |
Services Segment | | | 25,963 | | | | 16,501 | | | | 13,114 |
Corporate Overhead | | | — | | | | — | | | | — |
| | | | | | | | | | | |
Total revenues | | | 208,726 | | | | 94,700 | | | | 72,736 |
| | | | | | | | | | | |
Operating expenses: | | | | | | | | | | | |
Intellectual Property Segment | | | 52,427 | | | | 18,706 | | | | — |
Services Segment | | | 30,187 | | | | 14,710 | | | | — |
Corporate Overhead | | | 27,117 | | | | 15,711 | | | | — |
| | | | | | | | | | | |
Total operating expenses | | | 109,731 | | | | 49,127 | | | | — |
| | | | | | | | | | | |
Operating income (loss) | | | | | | | | | | | |
Intellectual Property Segment | | | 130,336 | | | | 59,493 | | | | — |
Services Segment | | | (4,224 | ) | | | 1,791 | | | | — |
Corporate Overhead | | | (27,117 | ) | | | (15,711 | ) | | | — |
| | | | | | | | | | | |
Total operating income | | $ | 98,995 | | | $ | 45,573 | | | $ | — |
| | | | | | | | | | | |
The revenues and operating income (loss) amounts in this section have been presented on a basis consistent with accounting principles generally accepted in the United States applied at the segment level. Corporate overhead expenses, which have been excluded, primarily include support services, human resources, legal, finance, IT, corporate development, procurement activities, insurance and board fees. For the year ended December 31, 2006, corporate overhead expenses were $27.1 million.
Intellectual Property Segment
Fiscal Year 2006 and 2005
Intellectual property revenues for year ended December 31, 2006 were $182.8 million as compared to $78.2 million for the year ended December 31, 2005, an increase of $104.6 million or 133.8 %. The increase of $104.6 million is primarily attributable to an increase in royalty and license fees of $42.7 million and an increase in past production payments of $61.9 million. The increase in royalty and license fees is attributable to an increase of $27.4 million from existing customers and $15.3 million from new customers. The increase in past production payments is due to resolution of negotiations with customers totaling $83.1 million in the year ended December 31, 2006 compared to resolution of negotiations with customers totaling $21.3 million for the year ended December 31, 2005.
Operating expenses for the year ended December 31, 2006 were $52.4 million. These expenses consisted of cost of revenues of $49,000, research, development and other related costs of $12.8 million and SG&A costs of $39.6 million. Included in the research, development and other related costs were $5.9 million in costs related to our research and development center in Jerusalem. SG&A costs included $3.3 million in stock-based compensation and $28.6 million in litigation expense. For the year ended December 31, 2005, operating expenses of $18.7 million consisted of $62,000 in cost of revenues, $6.7 million in research, development and other related costs and $11.4 million in SG&A. Included in the SG&A expenses for the year ended December 31, 2005 are litigation costs of $8.0 million. The overall increase of $33.7 million in the year ended December 31, 2006, over the year ended December 31, 2005, is primarily due to increased research, development and other related costs of $6.0 million and increased SG&A of $27.7 million. The increase in SG&A for the year ended December 31,
46
2006 was primarily attributable to the increase in litigation costs of $20.6 million. We expect that litigation costs will become a material portion of the Intellectual Property segment’s SG&A in future periods, and may increase significantly in some periods, because of our ongoing legal actions, as described in Part I, Item 3—Legal Proceedings, above, and because we expect that we will become involved in other litigation from time to time in the future in order to enforce and protect our intellectual property rights.
Operating income for the year ended December 31, 2006 was $130.3 million as compared to $59.5 million for the year ended December 31, 2005, an increase of $70.8 million or 119.0%.
Fiscal Year 2005 and 2004
Intellectual property revenues for the year ended December 31, 2005, were $78.2 million, as compared to $59.6 million for the year ended December 31, 2004, an increase of $18.6 million or 31.2%. The increase of $18.6 million consists of an increase in royalty and license fees revenues of $17.3 million and an increase in past production payments revenues of $1.3 million. For the year ended December 31, 2005, the $17.3 million increase was due to royalty and license fees revenues of $14.6 million from existing customers and $2.7 million from new customers. The increase of $1.3 million in past production payments revenues was primarily due to the resolution of license negotiations with new customers of $3.9 million and with existing customers of $17.4 million. The aggregate amount attributable to the resolution of license negotiations in the year ended December 31, 2005 was greater than the aggregate amount attributed to negotiations with new and existing customers in the year ended December 31, 2004, which totaled $20.0 million.
Operating expenses for the year ended December 31, 2005 were $18.7 million. These expenses consisted of $62,000 in cost of revenues, $6.7 million in research, development and other related costs, $11.4 million in SG&A and $540,000 in stock compensation costs. Included in the SG&A expenses for the year ended December 31, 2005 are litigation costs of $8.0 million. We expect that litigation costs will become a material portion of the Intellectual Property segment’s SG&A in future periods, and may increase significantly in some periods, because of our ongoing lawsuits as described in Part I, Item 3—Legal Proceedings, and because we expect that we will become involved in other litigation from time to time in the future in order to enforce and protect our intellectual property rights.
Operating income for the year ended December 31, 2005 was $59.5 million.
Services Segment
Fiscal Year 2006 and 2005
Product and service revenues for the year ended December 31, 2006 were $26.0 million, as compared to $16.5 million for the year ended December 31, 2005 an increase of $9.5 million or 57.3%. The overall increase in the year ended December 31, 2006 is primarily due to the increase in commercial related products and services of $10.3 million offset by a decrease in government related contracts of approximately $804,000.
Operating expenses for the year ended December 31, 2006 were $30.2 million as compared to $14.7 million, for the year ended December 31, 2005, an increase of $15.5 million, or 105.4%. For the year ended December 31, 2006, operating expenses consisted of cost of revenues of $19.3 million, research, development and other related costs of $7.3 million, and SG&A of $3.6 million. Included in these costs were $4.5 million in stock-based compensation costs for the year ended December 31, 2006, respectively. For the year ended December 31, 2005, operating expenses of $14.7 million consisted of $13.3 million in cost of revenues and $1.1 million in SG&A. Included in these costs was $215,000 in stock-based compensation costs.
Operating loss for the year ended December 31, 2006 was $4,2 million, as compared to operating income of $1.8 million, for the year ended December 31, 2005. The decrease of $6.0 million, in the year ended
47
December 31, 2006 is primarily due to the increase in stock-based compensation costs of $4.3 million and an inventory adjustment of $1.6 million. The inventory adjustment of $1.6 million was directly related to the purchase accounting treatment of inventory acquired in our recent acquisition of Digital Optics Corporation in which the inventory value was written up to fair value in purchase accounting and then amortized as the inventory was sold.
Fiscal Year 2005 and 2004
Service revenues for the year ended December 31, 2005 were $16.5 million as compared to $13.1 million for the year ended December 31, 2004, an increase of $3.4 million or 25.8%. The increase is due to the increase in service revenues from government related contracts. For the year ended December 31, 2005, total service revenues consisted of $15.8 million from government related contracts. For the year ended December 31, 2004, total service revenues of $13.1 million, consisted of $12.2 million from government related contracts.
Operating expenses for the year ended December 31, 2005 were $14.7 million. These expenses consisted of $13.3 million in cost of revenues, $178,000 in research, development and other related costs, $1.1 million in SG&A, and $215,000 in stock compensation cost.
Operating income for the year ended December 31, 2005 was $1.8 million.
48
Quarterly Results of Operations
The following table presents our unaudited quarterly results of operations for the eight quarters in the period ended December 31, 2006. You should read the following table in conjunction with the consolidated financial statements and related notes contained elsewhere in this annual report. We have prepared the unaudited information on the same basis as our audited consolidated financial statements. This table includes all adjustments, consisting only of normal recurring adjustments, that we consider necessary for fair statement of our financial position and operating results for the quarters presented. Operating results for any quarter are not necessarily indicative of results for any future quarters or for a full year.
| | | | | | | | | | | | | | | | | | | | | | | | | | | | | | | | |
| | | Three Months Ended | |
| | | Mar 31,
2005 | | | Jun 30,
2005 | | | Sep 30,
2005 | | | Dec 31,
2005 | | | Mar 31,
2006 | | | Jun 30,
2006 | | | Sep 30,
2006 | | | Dec 31,
2006 | |
| | | (in thousands) | |
Revenues: | | | | | | | | | | | | | | | | | | | | | | | | | | | | | | | | |
Royalty and license fees | | $ | 11,833 | | | $ | 13,292 | | | $ | 14,113 | | | $ | 17,692 | | | $ | 19,372 | | | $ | 19,529 | | | $ | 25,916 | | | $ | 34,789 | |
Past production payments | | | 12,310 | | | | 5,359 | | | | 1,161 | | | | 2,439 | | | | 223 | | | | 1,410 | | | | 76,000 | | | | 5,499 | |
Product and service revenues | | | 3,756 | | | | 3,810 | | | | 4,470 | | | | 4,465 | | | | 4,069 | | | | 3,320 | | | | 8,625 | | | | 9,974 | |
| | | | | | | | | | | | | | | | | | | | | | | | | | | | | | | | |
Total Revenues | | | 27,899 | | | | 22,461 | | | | 19,744 | | | | 24,596 | | | | 23,664 | | | | 24,259 | | | | 110,541 | | | | 50,262 | |
Operating expenses: | | | | | | | | | | | | | | | | | | | | | | | | | | | | | | | | |
Cost of revenues | | | 2,963 | | | | 3,287 | | | | 3,059 | | | | 4,004 | | | | 3,432 | | | | 3,990 | | | | 6,201 | | | | 5,736 | |
Research and development and other related costs | | | 1,529 | | | | 1,622 | | | | 2,074 | | | | 2,228 | | | | 3,876 | | | | 3,396 | | | | 5,317 | | | | 7,474 | |
Selling, general and administrative | | | 5,274 | | | | 6,360 | | | | 7,744 | | | | 8,983 | | | | 13,870 | | | | 20,105 | | | | 20,116 | | | | 16,218 | |
| | | | | | | | | | | | | | | | | | | | | | | | | | | | | | | | |
Total operating expenses | | | 9,766 | | | | 11,269 | | | | 12,877 | | | | 15,215 | | | | 21,178 | | | | 27,491 | | | | 31,634 | | | | 29,428 | |
| | | | | | | | | | | | | | | | | | | | | | | | | | | | | | | | |
Operating income (loss) | | | 18,133 | | | | 11,192 | | | | 6,867 | | | | 9,381 | | | | 2,486 | | | | (3,232 | ) | | | 78,907 | | | | 20,834 | |
Interest and other income, net | | | 587 | | | | 773 | | | | 1,067 | | | | 1,128 | | | | 1,205 | | | | 1,519 | | | | 1,677 | | | | 2,098 | |
| | | | | | | | | | | | | | | | | | | | | | | | | | | | | | | | |
Income (loss) before taxes | | | 18,720 | | | | 11,965 | | | | 7,934 | | | | 10,509 | | | | 3,691 | | | | (1,713 | ) | | | 80,584 | | | | 22,932 | |
Benefit (provision) for income taxes | | | (6,777 | ) | | | (4,240 | ) | | | (2,904 | ) | | | (3,758 | ) | | | (2,320 | ) | | | 501 | | | | (33,229 | ) | | | (9,095 | ) |
| | | | | | | | | | | | | | | | | | | | | | | | | | | | | | | | |
Net income (loss) | | | 11,943 | | | | 7,725 | | | | 5,030 | | | | 6,751 | | | | 1,371 | | | | (1,212 | ) | | | 47,355 | | | | 13,837 | |
| | | | | | | | | | | | | | | | | | | | | | | | | | | | | | | | |
Net income (loss) attributable to common stockholders | | $ | 11,943 | | | $ | 7,725 | | | $ | 5,030 | | | $ | 6,751 | | | $ | 1,371 | | | $ | (1,212 | ) | | $ | 47,355 | | | $ | 13,837 | |
| | | | | | | | | | | | | | | | | | | | | | | | | | | | | | | | |
Net income (loss) per common share; basic | | $ | 0.28 | | | $ | 0.18 | | | $ | 0.11 | | | $ | 0.15 | | | $ | 0.03 | | | $ | (0.03 | ) | | $ | 1.02 | | | $ | 0.30 | |
| | | | | | | | | | | | | | | | | | | | | | | | | | | | | | | | |
Net income (loss) per common share; diluted | | $ | 0.25 | | | $ | 0.16 | | | $ | 0.11 | | | $ | 0.14 | | | $ | 0.03 | | | $ | (0.03 | ) | | $ | 0.98 | | | $ | 0.28 | |
| | | | | | | | | | | | | | | | | | | | | | | | | | | | | | | | |
Weighted average number of shares used in per share calculation, basic | | | 42,873 | | | | 43,873 | | | | 44,452 | | | | 44,861 | | | | 45,432 | | | | 45,905 | | | | 46,252 | | | | 46,687 | |
| | | | | | | | | | | | | | | | | | | | | | | | | | | | | | | | |
Weighted average number of shares used in per share calculation, diluted | | | 47,689 | | | | 47,494 | | | | 47,632 | | | | 47,486 | | | | 47,345 | | | | 45,905 | | | | 48,422 | | | | 48,852 | |
| | | | | | | | | | | | | | | | | | | | | | | | | | | | | | | | |
49
The following table presents our historical results for the periods indicated as percentage of revenues.
| | | | | | | | | | | | | | | | | | | | | | | | |
| | | Three Months Ended | |
| | | Mar 31,
2005 | | | Jun 30,
2005 | | | Sep 30,
2005 | | | Dec 31,
2005 | | | Mar 31,
2006 | | | Jun 30,
2006 | | | Sep 30,
2006 | | | Dec 31,
2006 | |
Revenues: | | | | | | | | | | | | | | | | | | | | | | | | |
Royalty and license fees | | 42.4 | % | | 59.2 | % | | 71.5 | % | | 71.9 | % | | 81.9 | % | | 80.5 | % | | 23.4 | % | | 69.2 | % |
Past production payments | | 44.1 | | | 23.9 | | | 5.9 | | | 9.9 | | | 0.9 | | | 5.8 | | | 68.8 | | | 10.9 | |
Product and service revenues | | 13.5 | | | 17.0 | | | 22.6 | | | 18.2 | | | 17.2 | | | 13.7 | | | 7.8 | | | 19.9 | |
| | | | | | | | | | | | | | | | | | | | | | | | |
Total Revenues | | 100.0 | | | 100.0 | | | 100.0 | | | 100.0 | | | 100.0 | | | 100.0 | | | 100.0 | | | 100.0 | |
Operating expenses: | | | | | | | | | | | | | | | | | | | | | | | | |
Cost of revenues | | 10.6 | | | 14.6 | | | 15.5 | | | 16.3 | | | 14.5 | | | 16.4 | | | 5.6 | | | 11.4 | |
Research and development and other related costs | | 5.5 | | | 7.2 | | | 10.5 | | | 9.1 | | | 16.4 | | | 14.0 | | | 4.8 | | | 14.9 | |
Selling, general and administrative | | 18.9 | | | 28.3 | | | 39.2 | | | 36.4 | | | 58.6 | | | 82.9 | | | 18.2 | | | 32.2 | |
| | | | | | | | | | | | | | | | | | | | | | | | |
Total operating expenses | | 35.0 | | | 50.1 | | | 65.2 | | | 61.8 | | | 89.5 | | | 113.3 | | | 28.6 | | | 58.5 | |
| | | | | | | | | | | | | | | | | | | | | | | | |
Operating income (loss) | | 65.0 | | | 49.9 | | | 34.8 | | | 38.2 | | | 10.5 | | | (13.3 | ) | | 71.4 | | | 41.5 | |
Interest and other income, net | | 2.1 | | | 3.4 | | | 5.4 | | | 4.6 | | | 5.1 | | | 6.2 | | | 1.5 | | | 4.2 | |
| | | | | | | | | | | | | | | | | | | | | | | | |
Income (loss) before taxes | | 67.1 | | | 53.3 | | | 40.2 | | | 42.8 | | | 15.6 | | | (7.1 | ) | | 72.9 | | | 45.7 | |
Benefit (provision) for income taxes | | (24.3 | ) | | (18.9 | ) | | (14.7 | ) | | (15.3 | ) | | (9.8 | ) | | 2.1 | | | (30.1 | ) | | (18.1 | ) |
| | | | | | | | | | | | | | | | | | | | | | | | |
Net income (loss) | | 42.8 | | | 34.4 | | | 25.5 | | | 27.5 | | | 5.8 | | | (5.0 | ) | | 42.8 | | | 27.6 | |
| | | | | | | | | | | | | | | | | | | | | | | | |
Net income (loss) attributable to common stockholders | | 42.8 | % | | 34.4 | % | | 25.5 | % | | 27.5 | % | | 5.8 | % | | (5.0 | )% | | 42.8 | % | | 27.6 | % |
| | | | | | | | | | | | | | | | | | | | | | | | |
Our royalties and license fees revenues grew sequentially in each quarter of 2006 and 2005. The overall increases of $27.4 million from existing licensees and $15.3 million from new licensees are primarily due to increased reported royalties from five existing customers and new royalties reported from six new customers.
Past production payments revenues have been significantly impacted by revenues related to the resolution of license negotiations and patent disputes, particularly in the quarters ended September 30, 2006, December 31, 2006, March 31, 2005 and June 30, 2005 due to our resolution of negotiations with Infineon Technologies AG, Micron Technology, Inc., NXP BV, Qimonda, AG, Fujitsu Limited and Samsung Electronics Co., Ltd., respectively.
Cost of revenues has generally increased throughout 2006 and 2005, in line with the overall growth in service revenues. Our costs of revenues primarily relate to product and service revenues. Increases in the quarters ended September 31, 2006 and December 31, 2006 were primarily attributable to inventory adjustments of approximately $900,000 and $700,000, respectively, directly related to the purchase accounting treatment of inventory acquired in our acquisition of Digital Optics Corporation, in which the inventory value was written up to fair value. An overall increase in stock compensation expense of $2.9 million also contributed to the increased quarterly expenses.
Operating expenses generally increased throughout 2006 and 2005 primarily due to our 2006 and 2005 internal reorganization of personnel and departments, litigation expenses of $28.6 million related to the cases described above in “Legal Proceedings” and our ongoing efforts to comply with evolving laws, regulations and standards regarding corporate governance, financial and public disclosures. Amortization of intangible assets of $1.1 million and costs for our research and development center in Jerusalem of $5.9 million, along with increased stock compensation expenses of $14.1 million due to our adoption of SFAS No. 123(R) also contributed to our increase in operating expenses each quarter.
50
Net Operating Losses and Tax Credit Carryforwards
As of December 31, 2006, we had federal net operating loss carryforwards of approximately $52.1 million and state net operating loss carryforwards of approximately $23.4 million. All of the federal and state net operating loss carryforwards are related to stock option deductions. The principal difference between the federal and state net operating loss carryforwards is attributable to the capitalization of research and development costs for state purposes. These operating loss carryforwards begin to expire on various dates beginning in 2007, and will continue to expire through 2026. Under the provisions of the Internal Revenue Code, substantial changes in our ownership may limit the amount of net operating loss carryforwards that can be utilized annually in the future to offset taxable income. In addition, we had tax credit carryforwards of approximately $24.0 million for federal purposes and approximately $7.1 million for state purposes. When realized, the benefits of these tax attributes will be credit to Stockholders’ Equity.
Tax benefits from stock options
During the years ended December 31, 2006, 2005, and 2004, various employees exercised their fully-vested stock options. In 2006, the tax benefits from such employee stock option transactions reduced our income taxes payable for federal and state purposes. These benefits totaled $37.8 million, $0 and $0 and were reflected as a credit to additional paid-in capital. Exercises resulting in disqualified dispositions of incentive stock options and exercises of nonqualified stock options contributed to the tax benefits.
Liquidity and Capital Resources
Since our inception, we have financed our operations primarily through sales of equity securities and, more recently, through cash generated from operations. We have received a total of $93.7 million from private offerings of our equity securities and we generated $34.6 million of net proceeds from our initial public offering in November 2003. At December 31, 2006 we had $194.1 million in cash and cash equivalents.
Net cash provided by operating activities for the year ended December 31, 2006 was $111.6 million, as compared to $51.8 million for the year ended December 31, 2005. Operating cash flows in 2006 were generated from net income adjusted for non-cash items of depreciation, amortization, stock-based compensation and tax benefits from employee stock option plan of $7.2 million, $15.2 million and $37.8 million, respectively, a decrease in accounts receivable, inventory and deferred income tax, of $828,000, $1.3 million and $152,000, respectively, an increase in accounts payable, accrued legal, deferred revenue and income taxes payable of $287,000, $220,000, $316,000 and $17,000, respectively. This was partially off-set by an increase other assets of $12.7 million and a decrease in accrued liabilities of $711,000. The increase in depreciation and amortization of $5.6 million is primarily due to the amortization of certain intangible assets purchased in the prior year from North Corporation, amortization of certain tangible and intangible assets of Shellcase, Ltd., and Digital Optics Corporation. The increase of $14.1 million in stock-based compensation is attributable to the adoption of SFAS No. 123(R) on January 1, 2006. The decrease in inventory of $1.3 million is primarily attributable to an inventory adjustment directly related to the purchase accounting treatment of inventory acquired in our acquisition of Digital Optics Corporation in which the inventory value was written up to fair value and then amortized to cost of revenues as inventory was sold. The increase in accounts payable is attributable to the increase in materials and subcontractors costs for service related contracts. The increase in other assets is primarily attributable to an anticipated refund of foreign withholding tax for approximately $11.5 million. The increase in accrued legal is directly related to increased litigation related to the cases described above in “Legal Proceedings.” The decrease in accrued liabilities is primarily due to the timing of cash disbursements on vendor invoices.
Net cash provided by operating activities for the year ended December 31, 2005 was $51.8 million compared to $36.1 million for the year ended December 31, 2004. Operating cash flows in 2005 were generated from net income adjusted for non-cash expenses of $16.4 million and increases in accounts payable, accrued liabilities and deferred revenues of $2.1 million, $3.2 million and $217,000, respectively. This was partially
51
off-set by an increase in accounts receivable of $1.3 million and other assets of $169,000. The non-cash expenses consisted of $2.9 million in depreciation, amortization and stock compensation expenses and $13.5 million of utilization of our deferred tax asset against our federal and state income taxes for 2005. The increase in accounts payable is attributable to the increase in materials and subcontractors costs for service related contracts. The increase in accrued liabilities is directly related to increased litigation related to the cases described above in “Legal Proceeding.”
Net cash provided by operating activities for the year ended December 31, 2004 was $36.1 million. Operating cash flows in 2004 were generated from net income adjusted for non-cash expenses of $1.3 million and increases in accounts payable and accrued liabilities of $108,000 and $792,000, respectively, and decreases in deferred revenues of $95,000 and income taxes payable of $191,000. This was partially off-set by an increase in accounts receivable of $723,000 and other assets of $24.2 million. The increase in other assets was directly related to recording of our deferred tax assets of $24.7 million.
Net cash used in investing activities for the year ended December 31, 2006 was $56.7 million, consisting of $53.6 million net of cash for the acquisition of Digital Optics Corporation, $3.0 million of property and equipment purchases and $14,000 in proceeds from sale of fixed assets. In July 2006, we completed our acquisition of Digital Optics Corporation, in which we acquired $25.5 million and $28.1 million in tangible and intangible assets net of cash, respectively. Net cash used in investing activities for the year ended December 31, 2005 was $44.8 million, consisting of $40.7 million for the acquisition of certain assets from North Corporation and Shellcase, Ltd., and $4.1 million of property and equipment purchases. Net cash used in investing activities for the year ended December 31, 2004 was $1.8 million, consisting of $1.8 million of property and equipment purchases, off-set by $7,000 of proceeds from the sale of fixed assets.
Net cash provided by financing activities for the year ended December 31, 2006 of $11.5 million was primarily due to the net proceeds from the issuance of common stock under our stock option and employee stock purchase plans. For the year ended December 31, 2005, net cash flows provided by financing activities was $12.3 million, compared to $9.7 million for the year ended December 31, 2004. For both years ended December 31, 2005 and 2004, net cash flows provided by financing activities were directly related to net proceeds from exercise of stock options and warrants and from the proceeds of our employee stock purchase program.
We believe that based on current levels of operations and anticipated growth, our cash from operations, together with cash currently available, will be sufficient to fund our operations for at least the next twelve months. Poor financial results, unanticipated expenses, unanticipated acquisitions of technologies or businesses or unanticipated strategic investments could give rise to additional financing requirements sooner than we expect. There can be no assurance that equity or debt financing will be available when needed or, if available, that such financing will be on terms satisfactory to us and not dilutive to our then-current stockholders.
Contractual Cash Obligations
| | | | | | | | | |
| | | Payments Due by Period |
| | | Total | | 1-3
Years | | 4-5
Years |
| | | (In thousands) |
Operating Lease Obligations | | $ | 2,950 | | $ | 2,080 | | $ | 870 |
The amounts reflected in the table above for operating leases represent aggregate future minimum lease payments under non-cancellable facility leases.
52
For our facilities lease, rent expense charged to operations differs from rent paid because of scheduled rent increases. Rent expense is calculated by allocating total rental payments on a straight-line basis over the lease term. We recorded the difference between rent expense and rent paid as deferred rent, in accrued liabilities.
Critical Accounting Policies and Estimates
The preparation of financial statements in conformity with accounting principles generally accepted in the United States requires management to make estimates and assumptions that affect the reported amounts of assets and liabilities and disclosure of contingent assets and liabilities at the date of the financial statements and the reported amounts of revenues and expenses during the reporting period. By their nature, these estimates and judgments are subject to an inherent degree of uncertainty. On an ongoing basis we re-evaluate our judgments and estimates including those related to long-lived assets, income taxes, litigation and contingencies. We base our estimates and judgments on our historical experience, knowledge of current conditions and our beliefs of what could occur in the future considering available information. Actual results could differ from those estimates, and material effects on our operating results and financial position may result. Our estimates are guided by observing the following critical accounting policies:
Revenue Recognition. We recognize revenues in accordance with the SEC’s Staff Accounting Bulletin No. 104, “Revenue Recognition in Financial Statements,” (SAB 104). SAB 104 requires that four basic criteria must be met before revenues can be recognized: (1) persuasive evidence of an arrangement exists; (2) delivery has occurred or services have been rendered; (3) the fee is fixed and determinable; and (4) collectibility is reasonably assured.
In order to determine whether collection is probable, we assess a number of factors, including past transaction history with the customer and the credit-worthiness of the customer. If we determine that collection is not reasonably assured, we defer the recognition of revenue at the time until collection becomes reasonably assured, which is generally upon receipt of payment.
Royalty and license fees
Royalty and license fees revenues include revenues from license fees and from royalty payments. Licensees typically pay a non-refundable license fee. Revenues from license fees are generally recognized at the time the license agreement is executed by both parties. In some instances, we provide training to our licensees under the terms of the license agreement. The amount of training provided is limited and is incidental to the licensed technology. Accordingly, in instances where training is provided under the terms of a license agreement, a portion of the license fee is deferred until such training has been provided. The amount of revenues deferred is the estimated fair value of the services, which is based on the price we charge for similar engineering services when they are sold separately. These revenues are reported as service revenues. Semiconductor manufacturers and assemblers pay on-going royalties on their production or shipment of semiconductors incorporating our intellectual property. Royalties under our royalty-based technology licenses are generally based upon either unit volumes of semiconductors produced or shipped using our technology or a percent of the net sales price. Licensees generally report production or shipment information 30 to 60 days after the end of the quarter in which such activity takes place. As there is no reliable basis on which we can estimate royalty revenues prior to obtaining these reports from the licensees, we recognize royalty revenues on a one-quarter lag. In some cases, licensees pre-pay a portion of future royalty obligations. These amounts are deferred and recognized as future royalty obligations are reported by the licensee.
Past production payments
Past production payments revenues are royalty payments received through license negotiations or the resolution of patent disputes. Such negotiations arise when it comes to our attention that a third party is infringing on patents or a current licensee is not paying royalties that we are entitled to. Past production
53
payments revenues represent the portion of royalty payments received through such license negotiations or resolution of patent disputes that relates to previous periods and are based on historical production or shipment volumes.
Revenues are recognized upon execution of the agreement by both parties, provided that the amounts are fixed or determinable, there are no significant obligations and collection is reasonably assured. We do not recognize any revenues prior to execution of the agreement as there is no reliable basis on which we can estimate the amounts for royalties related to previous periods or assess collectibility.
Product and service revenues
We utilize the completed-contract and the progress toward completion methods of accounting for commercial and government contracts, dependent upon the type of the contract. The completed-contract method of accounting is used for fixed-fee contracts with relatively short delivery times. Revenues from fixed-fee contracts are recognized upon acceptance by the customer or in accordance to the contract specifications, assuming: title and risk of loss has transferred to the customer; prices are fixed and determinable; no significant obligations remain; and collection of the related receivable is reasonably assured.
We use the progress toward completion method of accounting for cost reimbursement-type contracts, which generally specify the reimbursable costs and a certain billable fee amount. Under the percentage-of-completion method, revenues recognized are that portion of the total contract price equal to the ratio of costs expended to date to the anticipated final total costs based on current estimates of the costs to complete the projects. If the total estimated costs to complete a project were to exceed the total contract amount, indicating a loss, the entire anticipated loss would be recognized immediately. Revenues, including estimated earned fees, under cost reimbursement-type contracts are recognized as costs are incurred, assuming that the fee is fixed or determinable and collection is reasonably assured.
Claims made for amounts in excess of the agreed contract price are recognized only if it is probable that the claim will result in additional revenues and the amount of additional revenues can be reliably estimated.
We generate product revenue principally from sales of micro-optic products. We recognize revenue from product sales when certain fundamental criteria are met, such as when the title and risk and awards of product ownership are transferred to the customer, price and terms are fixed and the collection of the resulting receivable is reasonably assured. Revenue from non-recurring engineering fees are recognized when the service is completed or upon certain milestones as provided for in the agreements.
Valuation of Long Lived Assets. We evaluate the recoverability of our long-lived assets whenever events or changes in circumstances indicate that the carrying amount of an asset might not be recoverable, in accordance with SFAS No. 144 “Accounting for the Impairment or Disposal of Long-Lived Assets.” Impairment evaluations involve management estimates of assets’ useful lives and future cash flows. When such an event occurs, we estimate the future cash flows expected to result from the use of the asset and its eventual disposition. If the undiscounted expected future cash flows are less than the carrying amount of the asset, an impairment loss is recognized. Actual useful lives and cash flows could be different from those estimated by our management. This could have a material effect on our operating results and financial position. To date, no impairment loss has been recognized. We assess the impairment in value to our long-lived assets whenever events or circumstances indicate that their carrying value may not be recoverable. Factors we consider important that could trigger an impairment review include the following:
| | • | | significant negative industry trends; |
| | • | | significant underutilization of the assets; and |
| | • | | significant changes in how we use the assets or our plans for their use. |
54
The Company evaluates the recoverability of goodwill recorded in connection with acquisitions on an annual basis in the quarter in which the anniversary date of the acquisition occurs, or more frequently whenever events or changes in circumstances indicate the carrying value of an asset may not be recoverable in accordance with SFAS No. 142, “Goodwill and Other Intangible Assets.” The impairment test is a two-step process. The first step requires comparing the fair value of each reporting unit with allocated goodwill to its net book value. The Company uses management estimates of future cash flows to perform the first step of the goodwill impairment test. These estimates include assumptions about future conditions such as future revenues, gross margins and operating expenses. Discounted Cash Flow and Market Multiple methodologies are used to obtain the fair value for each reporting unit. The second step is only performed if impairment is indicated after the first step is performed, as it involves measuring the actual impairment to goodwill. No goodwill impairment was recorded for the periods presented.
Stock-based compensation. On January 1, 2006, we adopted SFAS No. 123(R) under which the measurement and recognition of compensation expense for all stock-based payment awards made to employees and directors including employee stock options and employee stock purchases under our ESPP based on estimated fair values was required. SFAS No. 123(R) supersedes our previous accounting under APB No. 25, for periods beginning in fiscal year 2006. In March 2005, the Securities and Exchange Commission (SEC) issued SAB No. 107 relating to SFAS No. 123(R).
SFAS No. 123(R) requires companies to estimate the fair value of stock-based payment awards on the date of grant using an option-pricing model. The value of the portion of the award that is ultimately expected to vest is recognized as expense over the requisite service periods in our Consolidated Statement of Operations.
We have applied the provisions of SAB No. 107 in its adoption of SFAS No. 123(R). Thus, we have adopted SFAS No. 123(R) in accordance with the modified prospective transition method on January 1, 2006. In accordance with the modified prospective transition method, our Consolidated Financial Statements for prior periods have not been restated to reflect, and do not include the impact of SFAS No. 123(R). The valuation provisions of SFAS No. 123(R) apply to new awards and to awards that are outstanding on the effective date and subsequently modified or cancelled. Historically, we accounted for stock-based awards to employees and directors using the intrinsic value method in accordance with APB No. 25 and only disclosed the impact of SFAS No. 123 within the footnote disclosures of our financial statements. Thus, previously under the rules of APB No. 25 stock-based compensation expense was only recognized and reported in our Consolidated Statement of Operations for grants that had an exercise price that was less than the stock price at the date of grant.
In conjunction with the adoption of SFAS No. 123(R), we prospectively amended our method of attributing the value of stock-based compensation to expense. Historically, we utilized the provisions of FIN No. 28 to recognize the expense associated with equity awards. This method allows for accelerated amortization of stock based compensation expense over the vesting period of the award. As permitted by SFAS No. 123(R), we have elected the straight-line method of expensing all stock based compensation awarded subsequent to the adoption of SFAS No. 123(R). Thus, compensation expense for all stock-based payment awards granted on or prior to December 31, 2005 will continue to be recognized using the accelerated approach under FIN No. 28 while compensation expense for all stock-based payment awards granted on or after January 1, 2006 will be recognized using the straight-line method.
We will continue to use the Black-Scholes valuation model to determine the estimated fair value of stock-based awards since this model utilizes the following award attributes to determine the estimated fair value of stock-based awards: fair value at date of grant, exercise price, risk free interest rate, volatility, expected life of the award, forfeiture rate and dividend rate.
The risk-free interest rate assumption is based upon observed interest rates from the U.S. Government Securities—Treasury Constant Maturities for the term of our employee stock options, which is an average of four years. We currently do not pay out any dividends; therefore the dividend yield assumption is not applicable.
55
The expected life of employee stock options represents the weighted-average period the stock options are expected to remain outstanding. The expected life of any stock option cannot be less than the vesting period.
The volatility assumption is based on the blended volatility approach consisting of a combination of the Company’s historical volatility and the volatility of its industry peers, as the Company has insufficient historical data concerning the volatility if its common stock.
SFAS No. 123(R) guidelines also require that estimated forfeitures be excluded from the actual stock compensation expense. In consideration of that, we have estimated the forfeiture rate using historical turnover data as well as pre-vesting cancellations spread over the vesting periods related to an expected term of four years.
On November 10, 2005, the FASB issued FASB Staff Position No. FAS 123(R)-3, “Transition Election Related to Accounting for Tax Effects of Share-Based Payment Awards.” SFAS No. 123(R) requires a company to calculate the pool of excess tax benefits available to absorb tax deficiencies recognized subsequent to adopting SFAS No. 123(R) (termed the APIC Pool), as if the company had adopted SFAS No. 123 in 1995. There are two methods to calculate the company’s hypothetical APIC Pool: (1) the long form method as set forth in paragraph 81 of SFAS No. 123(R), and (2) the short form method as set forth in FASB Staff Position 123(R)-3.
We have elected to use the long form method under which we track each award grant on an employee-by-employee basis and on a grant-by-grant basis to determine whether there is a tax benefit situation or tax deficiency situation for such award. We then compare the fair value expense to the tax deduction received for each grant and aggregates the benefits and deficiencies to determine whether there is a hypothetical APIC Pool (net tax benefit situation).
Inventories. Inventories are stated at standard cost adjusted to approximate the lower of cost on average or first-in, first-out method or market. We evaluate inventory levels quarterly against sales forecasts on a product family basis to evaluate its overall inventory risk. Inventory is determined to be saleable based on a sales forecast within a specific time period, generally for a period not to exceed one year. Inventory in excess of saleable amounts is not valued and the remaining inventory is valued at the lower of cost or market.
Accounting for Income Taxes. We account for income taxes under the provisions of Statement of Financial Accounting Standards No. 109, “Accounting for Income Taxes.” Under this method, we determine deferred tax assets and liabilities based upon the difference between the income tax bases of assets and liabilities and their respective financial reporting amounts at enacted tax rates in effect for the periods in which the differences are expected to reverse. The tax consequences of most events recognized in the current year’s financial statements are included in determining income taxes currently payable. However, because tax laws and financial accounting standards differ in their recognition and measurement of assets, liabilities, equity, revenues, expenses, gains and losses, differences arise between the amount of taxable income and pretax financial income for a year and between the tax bases of assets or liabilities and their reported amounts in the financial statements. Because it is assumed that the reported amounts of assets and liabilities will be recovered and settled, respectively, a difference between the tax basis of an asset or a liability and its reported amount in the balance sheet will result in a taxable or a deductible amount in some future years when the related liabilities are settled or the reported amounts of assets are recovered, hence giving rise to a deferred tax liability or asset, respectively. We then assess the likelihood that our deferred tax assets will be recovered from future taxable income and to the extent we believe that recovery is not likely, we establish a valuation allowance.
As of December 31, 2006, we had deferred tax assets of $17.8 million, which had a tax valuation allowance of $482,000. During 2006, the deferred tax assets decreased by approximately $41.0 million to $17.8 million. The net deferred tax asset of approximately $17.3 million has been realized as a result of historic and current income, and prospects of future book income.
Litigation and Contingencies. From time to time, we have been subject to legal proceedings and claims with respect to such matters as patents and other actions arising out of the normal course of business, as well as other matters identified above in Part 1, Item 3—Legal Proceedings.
56
The results of any litigation are inherently uncertain, and any adverse decision could result in a loss of our proprietary rights, subject us to significant liabilities, require us to seek licenses from others, limit the value of our technologies and otherwise negatively impact over business. If we believe that it is probable for a certain proceeding to result in an adverse decision and that the loss is estimable, we would establish an appropriate accrual for the loss.
Recent accounting pronouncements
In June 2006, the FASB issued Interpretation No. 48, “Accounting for Uncertainty in Income Taxes—An Interpretation of SFAS No. 109 (FIN No. 48). FIN No. 48 contains two-step process. The first step is evaluating the tax position for recognition by determining whether it is more-likely-than-not a tax position will be sustained upon examination, including resolution of any related appeals or litigation processes, based on the technical merits of the position. The second step is to measure the tax benefit at the largest amount that is greater than 50% likely of being realized upon ultimate settlement. This Interpretation is effective for fiscal years beginning after December 15, 2006. The Company is currently in the process of assessing the adoption of this statement.
In September 2006, the SEC issued Staff Accounting Bulletin No. 108 (SAB No. 108) regarding the process of quantifying financial statement misstatements. SAB No. 108 states that registrants should use both a balance sheet approach and an income statement approach when quantifying and evaluating the materiality of a misstatement. The interpretations in SAB No. 108 contain guidance on correcting errors under the dual approach as well as provide transition guidance for correcting errors. This interpretation does not change the requirements within SFAS No. 154, “Accounting Changes and Error Corrections—a replacement of APB No. 20 and SFAS No. 3,” for the correction of an error on financial statements. SAB No. 108 is effective for annual financial statements covering the first fiscal year ending after November 15, 2006. The adoption of SAB No. 108 did not impact our financial statements.
In September 2006, the FASB issued Statement of Financial Accounting Standards No. 157, “Fair Value Measurements (SFAS No. 157). SFAS No. 157 defines fair value, establishes a framework for measuring fair value in accounting principles generally accepted in the United States of America, and expands disclosure about fair value measurements. This pronouncement applies under other accounting standards that require or permit fair value measurements. Accordingly, this statement does not require any new fair value measurement. This statement is effective for fiscal years beginning after November 15, 2007, and interim periods within those fiscal years. We will be required to adopt SFAS No. 157 in the first quarter of fiscal year 2008. We are currently evaluating the requirements of SFAS No. 157 and have not yet determined the impact it may have on our financial statements.
Off-Balance Sheet Arrangements
As of December 31, 2006, we did not have any off-balance sheet arrangements as defined in Item 303(a)(4)(ii) of SEC Regulation S-K.
| Item 7A. | Quantitative and Qualitative Disclosures About Market Risk |
The primary objective of our investment activities is to preserve principal while maximizing the income we receive from our investments without significantly increasing risk of loss. Some of the securities that we may invest in the future may be subject to market risk for changes in interest rates. To mitigate this risk, we plan to maintain a portfolio of cash equivalents and short-term investments in a variety of securities, which may include commercial paper, money market funds, government and non-government debt securities. Currently, we are exposed to minimal market risks. We manage the sensitivity of our results of operations to these risks by maintaining a conservative portfolio, which is comprised solely of highly-rated, short-term investments. We do not hold or issue derivative, derivative commodity instruments or other financial instruments for trading purposes.
57
The risk associated with fluctuating interest rates is limited to our investment portfolio. We do not believe that a 10% change in interest rates would have a significant impact on our results of operations or cash flows.
| Item 8. | Financial Statements and Supplementary Data |
Our consolidated financial statements at December 31, 2006 and 2005 and the Report of PricewaterhouseCoopers LLP, Independent Registered Public Accounting Firm, including their attestation report on management’s assessment of the effectiveness of the Company’s internal control over financial reporting are included in this Annual Report on Form 10-K on pages F-1 through F-29 and are incorporated by reference into this Item 8. Supplementary financial data for each quarter in the years ending December 31, 2006 and 2005 are incorporated above in Item 7.
| Item 9. | Changes in and Disagreements with Independent Registered Public Accounting Firm on Accounting and Financial Disclosure |
None.
| Item 9A. | Controls and Procedures |
Evaluation of Disclosure Controls and Procedures
Tessera maintains disclosure controls and procedures that are designed to ensure that information required to be disclosed in our reports filed pursuant to the Securities Exchange Act of 1934, as amended (the Exchange Act), is recorded, processed, summarized and reported within the time periods specified in the Securities and Exchange Commission’s (SEC’s) rules and forms and that such information is accumulated and communicated to our management, including our Chief Executive Officer and Chief Financial Officer, as appropriate, to allow for timely decisions regarding required disclosure. In designing and evaluating the disclosure controls and procedures, management recognizes that any controls and procedures, no matter how well designed and operated, can provide only reasonable assurance of achieving the desired control objectives, and management is required to apply its judgment in evaluating the cost-benefit relationship of possible controls and procedures.
Under the supervision and with the participation of our management, including our principal executive officer and principal financial officer, we conducted an evaluation of the effectiveness of the design and operation of our disclosure controls and procedures, as defined in Rules 13a-15(e) and 15d-15(e) under the Exchange Act as of the end of the period covered by this report (the evaluation date). Based on this evaluation, our principal executive officer and principal financial officer concluded as of the evaluation date that our disclosure controls and procedures were effective such that the information relating to Tessera, including our consolidated subsidiaries, required to be disclosed in our SEC reports (i) is recorded, processed, summarized and reported within the time periods specified in SEC rules and forms, and (ii) is accumulated and communicated to Tessera’s management, including our principal executive officer and principal financial officer, as appropriate to allow timely decisions regarding required disclosure.
Change in Internal Control over Financial Reporting
There has been no change in our internal controls over financial reporting during Tessera’s most recent fiscal quarter that has materially affected, or is reasonably likely to materially affect, our internal controls over financial reporting.
Management’s Report on Internal Control Over Financial Reporting
Our management is responsible for establishing and maintaining adequate internal control over financial reporting for Tessera. Our internal control over financial reporting is a process designed to provide reasonable assurance regarding the reliability of financial reporting and the preparation of financial statements for external purposes in accordance with U.S. generally accepted accounting principles. Tessera’s internal control over
58
financial reporting includes those policies and procedures that (i) pertain to the maintenance of records that, in reasonable detail, accurately and fairly reflect the transactions and dispositions of the assets of Tessera; (ii) provide reasonable assurance that transactions are recorded as necessary to permit preparation of financial statements in accordance with generally accepted accounting principles, and that receipts and expenditures of Tessera are being made only in accordance with authorizations of management and directors of Tessera; and (iii) provide reasonable assurance regarding prevention or timely detection of unauthorized acquisition, use, or disposition of Tessera’s assets that could have a material effect on the financial statements.
Tessera’s management assessed the effectiveness of our internal control over financial reporting as of December 31, 2006, utilizing the criteria set forth by the Committee of Sponsoring Organizations of the Treadway Commission (COSO) in Internal Control-Integrated Framework. Based on the assessment by Tessera’s management, we determined that Tessera’s internal control over financial reporting was effective as of December 31, 2006. Tessera management’s assessment of the effectiveness of Tessera’s internal control over financial reporting as of December 31, 2006 has been audited by PricewaterhouseCoopers LLP, Tessera’s independent registered public accounting firm, as stated in their report which appears on page F-1 of this Annual Report on Form 10-K.
Our evaluation of the effectiveness of its internal control over financial reporting as of December 31, 2006 did not include the internal controls of Digital Optics Corporation. We excluded Digital Optics Corporation from our assessment of internal control over financial reporting as of December 31, 2006 because Digital Optics Corporation was acquired in a purchase business combination in July 2006 (see Note 5). Digital Optics Corporation is a wholly owned subsidiary whose total assets and total revenues represent $43.6 million, or 13.2%, and $10.5 million, or 5.0%, respectively, of the related consolidated financial statement amounts as of and for the year ended December 31, 2006.
| | |
Bruce M. McWilliams President and Chief Executive Officer | | Charles A. Webster Executive Vice President and Chief Financial Officer |
| Item 9B. | Other Information |
None.
59
PART III
| Item 10. | Directors and Executive Officers of the Registrant |
The information required by this Item 10 is hereby incorporated by reference from the information under the captions “Executive Officers and Other Senior Management” and “Election of Directors” contained in the company’s definitive proxy statement to be filed with the Securities and Exchange Commission no later than 120 days from the end of the Company’s last fiscal year in connection with the solicitation of proxies for its Annual Meeting of Stockholders to be held on May 17, 2007, (the “Proxy Statement”).
The information required by Section 16(a) is hereby incorporated by reference from the information under the caption “Section 16(a) Beneficial Ownership Reporting Compliance” in the Proxy Statement.
We have adopted a written code of business conduct and ethics that applies to our principal executive officer, principal financial officer, principal accounting officer or controller, or persons serving similar functions. The text of our code of ethics has been posted on our website at http://www.tessera.com.
| Item 11. | Executive Compensation |
The information required by this Item 11 is incorporated by reference from the information under the captions “Election of Directors” and “Compensation of Executive Officers” in the Proxy Statement.
| Item 12. | Security Ownership of Certain Beneficial Owners and Management and Related Stockholder Matters |
The information required by this Item 12 is incorporated by reference from the information under the captions “Equity Compensation Plan Information” and “Security Ownership of Certain Beneficial Owners and Management” in the Proxy Statement.
| Item 13. | Certain Relationships and Related Transactions |
The information required by this Item 13 is incorporated by reference from the information under the caption “Certain Relationships and Related Transactions” in the Proxy Statement.
| Item 14. | Principal Accountant Fees and Services |
The information required by this Item 14 is incorporated by reference from the information under the caption “Ratification of Auditors” in the Proxy Statement.
60
PART IV
| Item 15. | Financial Statement Schedules, Exhibits and Reports on Form 8-K |
The following documents are filed as part of this report:
Financial statement schedules have been omitted because they are not applicable or are not required or the information required to be set forth therein is included in the consolidated financial statement or notes thereto.
(b) Exhibits:
The following documents are incorporated by reference or included in this report.
| | |
Exhibit Number | | Exhibit Title |
| 2.1 | | Asset Purchase Agreement, dated October 31, 2005, by and between registrant and Shellcase, Ltd., an Israeli company (filed as Exhibit 2.1 to registrant’s Current Report on Form 8-K, filed on November 1, 2005, and incorporated herein by reference) |
| |
| 2.2 | | Agreement and Plan of Merger, dated as of July 7, 2006, among Tessera Technologies, Inc., Dalton Acquisition Corp., Digital Optics Corporation and Carolinas Capital Corp. (filed as Exhibit 2.1 to registrant’s Current Report on Form 8-K, filed on July 10, 2006, and incorporated herein by reference) |
| |
| 2.3 | | Share Purchase Agreement, dated as of January 30, 2007, among Tessera Technologies Hungary Holding LLC, Eyesquad GmbH, each of the shareholders of Eyesquad GmbH and Sharon A. Amir (filed as Exhibit 2.1 to registrant’s Current Report on Form 8-K, filed on January 31, 2007, and incorporate herein by reference) |
| |
| 3.1* | | Restated Certificate of Incorporation |
| |
| 3.2* | | Restated Bylaws |
| |
| 4.1* | | Specimen Common Stock Certificate |
| |
| 4.2* | | Registration Rights Agreement, dated as of January 31, 2003, by and among registrant and the stockholders party thereto |
| |
| 4.3* | | Warrant to purchase 6,666 shares of Series E 10% Cumulative Convertible Preferred Stock, issued on December 15, 1999 to Transamerica Business Credit Corp. |
| |
| 4.4* | | Form of warrants to purchase an aggregate of 251,987 shares of Common Stock, issued on February 4, 2000 and July 1, 2000. |
| |
| 10.1* | | Form of Indemnification Agreement between registrant and each of its directors and executive officers |
61
| | |
Exhibit Number | | Exhibit Title |
| 10.2* | | 1991 Stock Option Plan |
| |
| 10.3* | | Amended and Restated 1996 Stock Plan |
| |
| 10.4* | | 1999 Stock Plan |
| |
| 10.5 | | Third Amended and Restated 2003 Equity Incentive Plan (filed as Exhibit 10.1 to registrant’s Current Report on Form 8-K, filed on May 23, 2006, and incorporated herein by reference) |
| |
| 10.6* | | 2003 Employee Stock Purchase Plan |
| |
| 10.7†* | | TCC Master License Agreement, dated as of July 7, 1994, by and between Tessera, Inc. and Hitachi Limited. |
| |
| 10.8†* | | Addendum to TCC Master License Agreement, dated as of January 31, 1997, by and between Tessera, Inc. and Hitachi Limited. |
| |
| 10.9†* | | Letter Amendment to TCC Master License Agreement, dated as of September 23, 2002, by and between Tessera, Inc. and Hitachi Limited. |
| |
| 10.10* | | Letter Amendment to TCC Master License Agreement, dated as of February 18, 2003, by and between Tessera, Inc. and Hitachi Limited. |
| |
| 10.11†* | | Limited TCC License Agreement, dated as of October 22, 1996, by and between Tessera, Inc. and Intel Corporation |
| |
| 10.12* | | First Amendment to Limited TCC License Agreement, dated as of October 1, 2000, by and between Tessera, Inc. and Intel Corporation |
| |
| 10.13†* | | Second Amendment to Limited TCC License Agreement, dated as of March 22, 2002, by and between Tessera, Inc. and Intel Corporation |
| |
| 10.14†* | | TCC License Agreement, dated as of May 17, 1997, by and between Tessera, Inc. and Samsung Electronics Co., Ltd. |
| |
| 10.15†* | | First Addendum to Limited TCC License Agreement, dated as of November 4, 1998, by and between Tessera, Inc. and Samsung Electronics Co., Ltd. |
| |
| 10.16* | | Second Addendum to TCC License Agreement, dated as of June 1, 2001, by and between Tessera, Inc. and Samsung Electronics Co., Ltd. |
| |
| 10.17†* | | TCC Patent License Agreement, dated as of January 22, 2003, by and between Tessera, Inc. and Seiko Epson Corporation |
| |
| 10.18†* | | Patent License Agreement, dated as of October 12, 1998, by and between Tessera, Inc. and Sharp Corporation |
| |
| 10.19†* | | Immunity Agreement, dated as of January 24, 2002, by and between Tessera, Inc., and Sharp Corporation |
| |
| 10.20†* | | License Agreement, dated as of January 1, 2002, by and between Tessera, Inc. and Texas Instruments, Inc. |
| |
| 10.21** | | Lease, dated as of April 1, 1995, by and between Tessera, Inc. and PNB Investors |
| |
| 10.22* | | Agreement to Exercise Option to Renew, dated as of April 1, 2000, by and between Tessera, Inc. and PNB Investors |
| |
| 10.23+* | | Change of Control Agreement, dated as of November 19, 2001, by and between Tessera, Inc. and Bruce M. McWilliams |
62
| | |
Exhibit Number | | Exhibit Title |
| 10.24+* | | Change of Control Agreement, dated as of November 19, 2001, by and between Tessera, Inc. and Nicholas J. Colella |
| |
| 10.25+* | | Change of Control Agreement, dated as of November 19, 2001, by and between Tessera, Inc. and Michael A. Forman |
| |
| 10.26+* | | Change of Control Agreement, dated as of November 19, 2001, by and between Tessera, Inc. and Christopher M. Pickett |
| |
| 10.27+* | | Employment Offer Letter, dated as of February 13, 2002, by and between Tessera, Inc. and Kirk E. Flatow |
| |
| 10.28†* | | Third Amendment to Limited TCC License Agreement, dated as of September 10, 2003, by and between Tessera, Inc. and Intel Corporation |
| |
| 10.29 | | First Amendment to Lease, dated as of May 28, 2004, by and between Tessera, Inc. and The Horton 1992 Living Trust Dated November 20, 1992 (filed as Exhibit 10.30 to registrant’s Annual Report on Form 10-K, filed on March 16, 2005, and incorporated herein by reference). |
| |
| 10.30+ | | Restricted Stock Award Agreement, dated as of December 13, 2004, by and between registrant and Robert Boehlke (filed as Exhibit 4.1 to registrant’s Current Report on Form 8-K, filed on December 16, 2004, and incorporated herein by reference) |
| |
| 10.31+ | | Employment Offer Letter, dated as of December 20, 2004, by and between registrant and Al Joseph (filed as Exhibit 10.1 to registrant’s Current Report on Form 8-K, filed on December 23, 2004, and incorporated herein by reference) |
| |
| 10.32+ | | Form of Restricted Stock Agreement (filed as Exhibit 10.1 to registrant’s Quarterly Report on Form 10-Q, filed on May 13, 2005 and incorporated herein by reference) |
| |
| 10.33 | | Restated TCC License Agreement, dated as of January 1, 2005, by and between registrant and Samsung Electronics Co., Ltd., (filed as Exhibit 10.3 to registrant’s Quarterly Report on Form 10-Q, filed on May 13, 2005 and incorporated herein by reference) |
| |
| 10.34+ | | Agreement, dated April 4, 2005, by and between registrant and D. James Guzy (filed as Exhibit 10.1 to registrant’s Current Report on Form 8-K, filed on April 5, 2005, and incorporated herein by reference) |
| |
| 10.35+ | | Employment Letter, dated January 25, 2005, by and between registrant and C. Liam Goudge (filed as Exhibit 10.1 to registrant’s Current Report on Form 8-K, filed on April 11, 2005, and incorporated herein by reference) |
| |
| 10.36+ | | Letter Agreement, dated February 1, 2006, by and between registrant and Michael Forman (filed as Exhibit 99.1 to registrant’s Current Report on Form 8-K, filed on February 1, 2006, and incorporated herein by reference) |
| |
| 10.37+ | | Employment Letter, dated February 2, 2006, by and between registrant and Michael Bereziuk (filed as Exhibit 10.1 to registrant’s Current Report on form 8-K, filed on March 3, 2006, and incorporated herein by reference) |
| |
| 10.38 | | TCC License Agreement, dated July 21, 2006, among Tessera Technologies, Inc, and certain of its affiliates and Micron Technology, Inc. and certain of its affiliates (filed as Exhibit 10.1 to registrant’s Current Report on Form 8-K, filed on July 21, 2006, and incorporated herein by reference) |
| |
| 10.39 | | TCC License Agreement, by and between Tessera Technologies, Inc. and Infineon Technologies AG, dated as of July 1, 2006 (filed as Exhibit 10.1 to registrant’s Current Report on Form 8-K/A, filed on August 7, 2006 and incorporated herein by reference) |
63
| | |
Exhibit Number | | Exhibit Title |
| 10.40 | | TCC License Agreement, by and between Tessera Technologies, Inc. and Qimonda AG, dated as of July 1, 2006 (filed as Exhibit 10.2 to registrant’s Current Report on Form 8-K/A, filed on August 7, 2006 and incorporated herein by reference) |
| |
| 10.41 | | Employment Letter, by and between Tessera, Inc. and Charles A. Webster, dated August 7, 2006 (filed as Exhibit 10.1 to registrant’s Current Report on Form 8-K, filed on August 29, 2006, and incorporated herein by reference) |
| |
| 21.1 | | List of subsidiaries |
| |
| 23.1 | | Consent of PricewaterhouseCoopers LLP, Independent Registered Public Accounting Firm |
| |
| 31.1 | | Section 302 Certification of the Chief Executive Officer |
| |
| 31.2 | | Section 302 Certification of the Chief Financial Officer |
| |
| 32.1 | | Section 906 Certification of the Chief Executive Officer and Chief Financial Officer |
| † | Confidential treatment has been granted as to certain portions of this agreement. |
| + | Indicates a management contract or compensatory plan or arrangement. |
| * | Filed as exhibits to Tessera’s Registration Statement on Form S-1 (SEC File No. 333-108518), effective November 12, 2003, and incorporated herein by reference. |
| ** | Filed as Exhibit 10.24 to Tessera, Inc.’s Registration Statement on Form S-1 (SEC File No. 333-45190), filed on September 5, 2000, and incorporated herein by reference. |
64
SIGNATURES
Pursuant to the requirements of Section 13 or 15(d) of the Securities Exchange Act of 1934, as amended, (the “Exchange Act”) the registrant has duly caused this report to be signed on its behalf by the undersigned, thereunto duly authorized.
Dated: March 1, 2007
| | |
| TESSERA TECHNOLOGIES, INC. |
| |
| By: | | /S/ BRUCE M. MCWILLIAMS |
| | Bruce M. McWilliams President and Chief Executive Officer |
Pursuant to the requirements of the Exchange Act, this report has been signed below by the following persons on behalf of the Registrant and in the capacities and on the dates indicated.
| | | | |
Signature | | Title | | Date |
| | |
/S/ BRUCE M. MCWILLIAMS Bruce M. McWilliams | | Chairman of the Board of Directors, President and Chief Executive Officer (Principal Executive Officer) | | March 1, 2007 |
| | |
/S/ CHARLES A. WEBSTER Charles A. Webster | | Executive Vice President and Chief Financial Officer (Principal Financial and Accounting Officer) | | March 1, 2007 |
| | |
/S/ ROBERT J. BOEHLKE Robert J. Boehlke | | Director | | March 1, 2007 |
| | |
/S/ JOHN B. GOODRICH John B. Goodrich | | Director | | March 1, 2007 |
| | |
/S/ DAVID NAGEL David Nagel | | Director | | March 1, 2007 |
| | |
/S/ AL S. JOSEPH Al S. Joseph | | Director | | March 1, 2007 |
| | |
/S/ HENRY R. NOTHHAFT Henry R. Nothhaft | | Director | | March 1, 2007 |
| | |
/S/ ROBERT A. YOUNG Robert A. Young | | Director | | March 1, 2007 |
65
Report of Independent Registered Public Accounting Firm
To the Board of Directors and Stockholders
of Tessera Technologies, Inc:
We have completed integrated audits of Tessera Technologies Inc’s consolidated financial statements and of its internal control over financial reporting as of December 31, 2006 in accordance with the standards of the Public Company Accounting Oversight Board (United States). Our opinions, based on our audits, are presented below.
Consolidated financial statements
In our opinion, the consolidated financial statements listed in the accompanying index present fairly, in all material respects, the financial position of Tessera Technologies, Inc and its subsidiaries at December 31, 2006 and December 31, 2005, and the results of their operations and their cash flows for each of the three years in the period ended December 31, 2006 in conformity with accounting principles generally accepted in the United States of America. These financial statements are the responsibility of the Company’s management. Our responsibility is to express an opinion on these financial statements based on our audits. We conducted our audits of these statements in accordance with the standards of the Public Company Accounting Oversight Board (United States). Those standards require that we plan and perform the audit to obtain reasonable assurance about whether the financial statements are free of material misstatement. An audit of financial statements includes examining, on a test basis, evidence supporting the amounts and disclosures in the financial statements, assessing the accounting principles used and significant estimates made by management, and evaluating the overall financial statement presentation. We believe that our audits provide a reasonable basis for our opinion.
As discussed in Note 8 to the consolidated financial statements, effective January 1, 2006 the Company changed its method of accounting for share-based payments.
Internal control over financial reporting
Also, in our opinion, management’s assessment, included inManagement’s Report on Internal Control Over Financial Reporting appearing under Item 9A, that the Company maintained effective internal control over financial reporting as of December 31, 2006 based on criteria established inInternal Control—Integrated Framework issued by the Committee of Sponsoring Organizations of the Treadway Commission (COSO), is fairly stated, in all material respects, based on those criteria. Furthermore, in our opinion, the Company maintained, in all material respects, effective internal control over financial reporting as of December 31, 2006, based on criteria established inInternal Control—Integrated Framework issued by the COSO. The Company’s management is responsible for maintaining effective internal control over financial reporting and for its assessment of the effectiveness of internal control over financial reporting. Our responsibility is to express opinions on management’s assessment and on the effectiveness of the Company’s internal control over financial reporting based on our audit. We conducted our audit of internal control over financial reporting in accordance with the standards of the Public Company Accounting Oversight Board (United States). Those standards require that we plan and perform the audit to obtain reasonable assurance about whether effective internal control over financial reporting was maintained in all material respects. An audit of internal control over financial reporting includes obtaining an understanding of internal control over financial reporting, evaluating management’s assessment, testing and evaluating the design and operating effectiveness of internal control, and performing such other procedures as we consider necessary in the circumstances. We believe that our audit provides a reasonable basis for our opinions.
A company’s internal control over financial reporting is a process designed to provide reasonable assurance regarding the reliability of financial reporting and the preparation of financial statements for external purposes in accordance with generally accepted accounting principles. A company’s internal control over financial reporting
F-1
includes those policies and procedures that (i) pertain to the maintenance of records that, in reasonable detail, accurately and fairly reflect the transactions and dispositions of the assets of the company; (ii) provide reasonable assurance that transactions are recorded as necessary to permit preparation of financial statements in accordance with generally accepted accounting principles, and that receipts and expenditures of the company are being made only in accordance with authorizations of management and directors of the company; and (iii) provide reasonable assurance regarding prevention or timely detection of unauthorized acquisition, use, or disposition of the company’s assets that could have a material effect on the financial statements.
Because of its inherent limitations, internal control over financial reporting may not prevent or detect misstatements. Also, projections of any evaluation of effectiveness to future periods are subject to the risk that controls may become inadequate because of changes in conditions, or that the degree of compliance with the policies or procedures may deteriorate.
As described in Management’s Report on Internal Control Over Financial Reporting , management has excluded Digital Optics Corporation (“Digital Optics”) from its assessment of internal control over financial reporting as of December 31, 2006 because it was acquired in a purchase business combination during 2006. We have also excluded Digital Optics from our audit of internal control over financial reporting. Digital Optics is a wholly owned subsidiary whose total assets and total revenues represent $43.6 million or 13% and $10.5 million or 5%, respectively, of the related consolidated financial statement amounts as of and for the year ended December 31, 2006.
/s/ PRICEWATERHOUSECOOPERS LLP
PricewaterhouseCoopers LLP
San Jose, California
March 1, 2007
F-2
TESSERA TECHNOLOGIES, INC.
CONSOLIDATED BALANCE SHEETS
(In Thousands, Except Per Share Amount)
| | | | | | | |
| | | December 31, | |
| | | 2006 | | 2005 | |
ASSETS | | | | | | | |
Current assets: | | | | | | | |
Cash and cash equivalents | | $ | 194,076 | | $ | 127,594 | |
Accounts receivable, net of allowance for doubtful accounts of $75 and $0 | | | 6,783 | | | 4,602 | |
Inventories | | | 1,548 | | | — | |
Short term deferred tax assets | | | 4,814 | | | 1,190 | |
Other current assets | | | 13,434 | | | 1,039 | |
| | | | | | | |
Total current assets | | | 220,655 | | | 134,425 | |
Property and equipment, net | | | 24,705 | | | 8,751 | |
Intangible assets, net | | | 27,529 | | | 12,757 | |
Goodwill | | | 35,425 | | | 24,154 | |
Long term deferred tax assets | | | 12,530 | | | 9,982 | |
Other assets | | | 444 | | | 58 | |
| | | | | | | |
Total assets | | $ | 321,288 | | $ | 190,127 | |
| | | | | | | |
LIABILITIES AND STOCKHOLDERS’ EQUITY | | | | | | | |
Current liabilities: | | | | | | | |
Accounts payable | | $ | 3,895 | | $ | 3,043 | |
Accrued legal fees | | | 3,166 | | | 2,946 | |
Accrued liabilities | | | 7,350 | | | 3,497 | |
Deferred revenue | | | 646 | | | 324 | |
Income tax payable | | | 376 | | | 359 | |
| | | | | | | |
Total current liabilities | | | 15,433 | | | 10,169 | |
| | |
Commitments and contingencies (Note 12) | | | | | | | |
Stockholders’ equity: | | | | | | | |
Common stock: $0.001 par value; 150,000 shares authorized;
47,214 and 45,125 shares issued and outstanding | | | 47 | | | 45 | |
Additional paid-in capital | | | 245,019 | | | 182,720 | |
Deferred stock-based compensation | | | — | | | (2,245 | ) |
Retained earnings (accumulated deficit) | | | 60,789 | | | (562 | ) |
| | | | | | | |
Total stockholders’ equity | | | 305,855 | | | 179,958 | |
| | | | | | | |
Total liabilities and stockholders’ equity | | $ | 321,288 | | $ | 190,127 | |
| | | | | | | |
The accompanying notes are an integral part of these consolidated financial statements.
F-3
TESSERA TECHNOLOGIES, INC.
CONSOLIDATED STATEMENTS OF OPERATIONS
(In Thousands, Except Per Share Amounts)
| | | | | | | | | | |
| | | Years Ended December 31, | |
| | | 2006 | | 2005 | | 2004 | |
Revenues: | | | | | | | | | | |
Royalty and license fees | | $ | 99,606 | | $ | 56,930 | | $ | 39,624 | |
Past production payments | | | 83,132 | | | 21,269 | | | 19,998 | |
Product and service revenues | | | 25,988 | | | 16,501 | | | 13,114 | |
| | | | | | | | | | |
Total revenues | | | 208,726 | | | 94,700 | | | 72,736 | |
| | | | | | | | | | |
Operating expenses: | | | | | | | | | | |
Cost of revenues | | | 19,359 | | | 13,313 | | | 9,613 | |
Research, development and other related costs | | | 20,063 | | | 7,453 | | | 7,163 | |
Selling, general and administrative | | | 70,309 | | | 28,361 | | | 20,319 | |
| | | | | | | | | | |
Total operating expenses | | | 109,731 | | | 49,127 | | | 37,095 | |
| | | | | | | | | | |
Operating income | | | 98,995 | | | 45,573 | | | 35,641 | |
Other income, net | | | 6,499 | | | 3,555 | | | 828 | |
| | | | | | | | | | |
Income before taxes | | | 105,494 | | | 49,128 | | | 36,469 | |
Provision (benefit) for income taxes | | | 44,143 | | | 17,679 | | | (22,594 | ) |
| | | | | | | | | | |
Net income | | $ | 61,351 | | $ | 31,449 | | $ | 59,063 | |
| | | | | | | | | | |
Basic and diluted net income per share: | | | | | | | | | | |
Net income per share; basic | | $ | 1.33 | | $ | 0.71 | | $ | 1.47 | |
| | | | | | | | | | |
Net income per share; diluted | | $ | 1.27 | | $ | 0.66 | | $ | 1.27 | |
| | | | | | | | | | |
Weighted average number of shares used in per share calculations; basic | | | 46,102 | | | 44,003 | | | 40,077 | |
| | | | | | | | | | |
Weighted average number of shares used in per share calculations; diluted | | | 48,385 | | | 47,733 | | | 46,622 | |
| | | | | | | | | | |
The accompanying notes are an integral part of these consolidated financial statements.
F-4
TESSERA TECHNOLOGIES, INC.
CONSOLIDATED STATEMENTS OF STOCKHOLDERS’ EQUITY
AND COMPREHENSIVE INCOME
(In Thousands)
| | | | | | | | | | | | | | | | | | | | | | | | | | |
| | | Common Stock | | Additional
Paid-In Capital | | | Deferred
Stock-based Compensation | | | Accumulated Deficit | | | Accumulated
Other
Comprehensive
Income (Loss) | | Total | | Comprehensive Income |
| | | Shares | | Amount | | | | | | |
Balance at December 31, 2003 | | 38,475 | | $ | 38 | | $ | 157,178 | | | $ | (153 | ) | | $ | (91,074 | ) | | $ | — | | $ | 65,989 | | | |
| | | | | | | | | | | | | | | | | | | | | | | | | | |
Issuance of common stock in connection with exercise of stock options and warrants | | 3,631 | | | 4 | | | 9,259 | | | | — | | | | — | | | | — | | | 9,263 | | | |
Issuance of common stock in connection with employee common stock purchase plan | | 29 | | | — | | | 430 | | | | — | | | | — | | | | — | | | 430 | | | |
Issuance of restricted stock | | 10 | | | — | | | 381 | | | | (381 | ) | | | — | | | | — | | | — | | | |
Amortization of deferred stock-based compensation, net of reversal | | — | | | — | | | — | | | | 120 | | | | — | | | | — | | | 120 | | | |
Issuance of stock options to consultants in exchange for services | | — | | | — | | | 111 | | | | — | | | | — | | | | — | | | 111 | | | |
Net income | | — | | | — | | | — | | | | — | | | | 59,063 | | | | — | | | 59,063 | | | 59,063 |
| | | | | | | | | | | | | | | | | | | | | | | | | | |
Balance at December 31, 2004 | | 42,145 | | $ | 42 | | $ | 167,359 | | | $ | (414 | ) | | $ | (32,011 | ) | | $ | — | | $ | 134,976 | | $ | 59,063 |
| | | | | | | | | | | | | | | | | | | | | | | | | | |
Issuance of common stock in connection with exercise of stock options and warrants | | 2,821 | | | 3 | | | 11,178 | | | | — | | | | — | | | | — | | | 11,181 | | | |
Issuance of common stock in connection with employee common stock purchase plan | | 72 | | | — | | | 1,108 | | | | — | | | | — | | | | — | | | 1,108 | | | |
Issuance of restricted stock | | 87 | | | — | | | 3,020 | | | | (3,020 | ) | | | — | | | | — | | | — | | | |
Amortization of deferred stock-based compensation, net of reversal | | — | | | — | | | — | | | | 1,189 | | | | — | | | | — | | | 1,189 | | | |
Issuance of stock options to consultants in exchange for services | | — | | | — | | | 55 | | | | — | | | | — | | | | — | | | 55 | | | |
Net income | | — | | | — | | | — | | | | — | | | | 31,449 | | | | — | | | 31,449 | | | 31,449 |
| | | | | | | | | | | | | | | | | | | | | | | | | | |
Balance at December 31, 2005 | | 45,125 | | $ | 45 | | $ | 182,720 | | | $ | (2,245 | ) | | $ | (562 | ) | | $ | — | | $ | 179,958 | | $ | 31,449 |
| | | | | | | | | | | | | | | | | | | | | | | | | | |
Elimination of deferred stock-based compensation upon adoption of SFAS No. 123(R) | | — | | | — | | | (2,245 | ) | | | 2,245 | | | | — | | | | — | | | — | | | |
Issuance of common stock in connection with exercise of stock options and warrants | | 1,685 | | | 2 | | | 10,152 | | | | — | | | | — | | | | — | | | 10,154 | | | |
Issuance of common stock in connection with employee common stock purchase plan | | 73 | | | — | | | 1,203 | | | | — | | | | — | | | | — | | | 1,203 | | | |
Issuance of restricted stock | | 331 | | | — | | | — | | | | — | | | | — | | | | — | | | — | | | |
Stock-based compensation | | — | | | — | | | 15,368 | | | | — | | | | — | | | | — | | | 15,368 | | | |
Tax benefits in connection with stock options | | — | | | — | | | 37,821 | | | | — | | | | — | | | | — | | | 37,821 | | | |
Net income | | — | | | — | | | — | | | | — | | | | 61,351 | | | | — | | | 61,351 | | | 61,351 |
| | | | | | | | | | | | | | | | | | | | | | | | | | |
Balance at December 31, 2006 | | 47,214 | | $ | 47 | | $ | 245,019 | | | $ | — | | | $ | 60,789 | | | $ | — | | $ | 305,855 | | $ | 61,351 |
| | | | | | | | | | | | | | | | | | | | | | | | | | |
The accompanying notes are an integral part of these consolidated financial statements.
F-5
TESSERA TECHNOLOGIES, INC.
CONSOLIDATED STATEMENTS OF CASH FLOWS
(In Thousands)
| | | | | | | | | | | | |
| | | Years Ended December 31, | |
| | | 2006 | | | 2005 | | | 2004 | |
Cash flows from operating activities: | | | | | | | | | | | | |
Net income | | $ | 61,351 | | | $ | 31,449 | | | $ | 59,063 | |
Adjustments to reconcile net income to net cash provided by operating activities: | | | | | | | | | | | | |
Depreciation and amortization | | | 7,249 | | | | 1,652 | | | | 962 | |
Loss (gain) of fixed assets | | | 228 | | | | (4 | ) | | | 72 | |
Stock-based compensation, net | | | 15,368 | | | | 1,244 | | | | 231 | |
Tax benefits from employee stock option plan | | | 37,821 | | | | — | | | | — | |
Gross tax windfall from stock-based compensation | | | (191 | ) | | | — | | | | — | |
Changes in operating assets and liabilities, net of acquisitions: | | | | | | | | | | | | |
Accounts receivable, net | | | 828 | | | | (1,339 | ) | | | (723 | ) |
Inventories | | | 1,337 | | | | — | | | | — | |
Deferred income tax, net | | | 152 | | | | 13,496 | | | | (24,668 | ) |
Other assets | | | (12,667 | ) | | | (169 | ) | | | 509 | |
Accounts payable | | | 287 | | | | 2,059 | | | | 108 | |
Accrued legal fees | | | 220 | | | | — | | | | — | |
Accrued liabilities | | | (711 | ) | | | 3,184 | | | | 792 | |
Deferred revenue | | | 316 | | | | 217 | | | | (95 | ) |
Income tax payable | | | 17 | | | | 3 | | | | (191 | ) |
| | | | | | | | | | | | |
Net cash provided by operating activities | | | 111,605 | | | | 51,792 | | | | 36,060 | |
| | | | | | | | | | | | |
Cash flows from investing activities: | | | | | | | | | | | | |
Purchases of property and equipment | | | (3,048 | ) | | | (4,100 | ) | | | (1,800 | ) |
Proceeds from sale of fixed assets | | | 14 | | | | 4 | | | | 7 | |
Acquisitions, net of cash acquired | | | (53,637 | ) | | | (40,730 | ) | | | — | |
| | | | | | | | | | | | |
Net cash used in investing activities | | | (56,671 | ) | | | (44,826 | ) | | | (1,793 | ) |
| | | | | | | | | | | | |
Cash flows from financing activities: | | | | | | | | | | | | |
Excess tax benefit from stock-based compensation | | | 191 | | | | — | | | | — | |
Proceeds from exercise of stock options and warrants, net | | | 10,154 | | | | 11,181 | | | | 9,262 | |
Proceeds from employee stock purchase program | | | 1,203 | | | | 1,108 | | | | 431 | |
| | | | | | | | | | | | |
Net cash provided by financing activities | | | 11,548 | | | | 12,289 | | | | 9,693 | |
| | | | | | | | | | | | |
Net increase in cash and cash equivalents | | | 66,482 | | | | 19,255 | | | | 43,960 | |
Cash and cash equivalents at beginning of period | | | 127,594 | | | | 108,339 | | | | 64,379 | |
| | | | | | | | | | | | |
Cash and cash equivalents at end of period | | $ | 194,076 | | | $ | 127,594 | | | $ | 108,339 | |
| | | | | | | | | | | | |
Supplemental disclosure of cash flow information: | | | | | | | | | | | | |
Deferred stock-based compensation | | $ | — | | | $ | 3,020 | | | $ | — | |
| | | | | | | | | | | | |
Income taxes paid | | $ | 5,008 | | | $ | 4,116 | | | $ | 1,731 | |
| | | | | | | | | | | | |
The accompanying notes are an integral part of these consolidated financial statements.
F-6
TESSERA TECHNOLOGIES, INC.
NOTES TO CONSOLIDATED FINANCIAL STATEMENTS
NOTE 1 – THE COMPANY AND BASIS OF PRESENTATION
Tessera Technologies, Inc. (together with its subsidiaries, herein referred to as “Tessera” or the “Company”), is a developer and licensor of miniaturization technologies for the electronics industry. The Company enables improvements in the size, performance and cost of its customers’ products by applying its expertise in the electrical, thermal and mechanical properties of semiconductor materials, and in the design and manufacturing of micro-optics. The Company’s intellectual property includes approximately 1,000 domestic and international issued patents and patent applications, covering a broad range of advanced semiconductor packaging, substrate, interconnect and micro-optics solutions. The Company licenses its chip packaging technology to its customers on a worldwide basis, enabling them to produce semiconductor chips that are smaller and faster, and incorporate more features. These semiconductors are utilized in a broad range of electronics products, including digital audio players, digital cameras, personal computers, PDAs, video game consoles and mobile phones.
The consolidated financial statements include the accounts of Tessera Technologies, Inc. and its wholly owned subsidiaries. All significant intercompany balances and transactions have been eliminated in consolidation.
The Company’s fiscal year ends on December 31. For quarterly reporting, the Company employs a 4-week, 4-week, 5-week reporting period.
NOTE 2 – SUMMARY OF SIGNIFICANT ACCOUNTING POLICIES
Use of estimates
The preparation of financial statements in conformity with accounting principles generally accepted in the United States requires management to make estimates and assumptions that affect the amounts reported in the financial statements and accompanying notes. The accounting estimates and assumptions that require management’s most significant, difficult, and subjective judgement include the recognition and measurement of current and deferred income tax assets and liabilities, the valuation of inventory, the assessment of recoverability of long-lived assets, and the valuation and recognition of stock-based compensation. Actual results experienced by the company may differ from management’s estimates.
Cash and cash equivalents
All highly liquid investments with original maturities of three months or less from the date of purchase are classified as cash and cash equivalents.
Fair value of financial instruments
The fair value of a financial instrument is the amount at which the instrument could be exchanged in a current transaction between willing parties. The carrying amounts for cash and cash equivalents, accounts receivable, prepaid expenses and other current assets, accounts payable and accrued liabilities approximate their respective fair values because of the short-term maturity of these items.
Concentration of credit risk
Financial instruments that potentially subject the Company to significant concentrations of credit risk consist principally of cash equivalents and accounts receivable. The Company invests primarily in money market funds and high quality commercial paper instruments. Cash equivalents are maintained with high quality institutions, the composition and maturities of which are regularly monitored by management. The Company
F-7
TESSERA TECHNOLOGIES, INC.
NOTES TO CONSOLIDATED FINANCIAL STATEMENTS
(Continued)
believes that the concentration of credit risk in its accounts receivables is substantially mitigated by the Company’s evaluation process, relatively short collection terms and the high level of credit worthiness of its customers. The Company performs ongoing credit evaluations of its customers’ financial condition and limits the amount of credit extended when deemed necessary but generally requires no collateral.
The Company’s accounts receivable were concentrated with three customers at December 31, 2006, representing 33%, 22% and 17% of aggregate gross trade receivables, respectively, and four customers at December 31, 2005, representing 31%, 25%, 15% and 15% of aggregate gross trade receivables, respectively.
Inventories
Inventories are stated at standard cost adjusted to approximate the lower of cost on average or first-in, first-out method or market. The Company evaluates inventory levels quarterly against sales forecasts on a product family basis to evaluate its overall inventory risk. Inventory is determined to be saleable based on a sales forecast within a specific time period, generally for a period not to exceed one year. Inventory in excess of saleable amounts is not valued and the remaining inventory is valued at the lower of cost or market.
Property and equipment
Property and equipment are recorded at cost and depreciated using the straight-line method over their estimated useful lives. Equipment held under capital lease is stated at the fair market value of the related asset and is amortized on a straight-line basis over the term of the lease. Repair and maintenance costs are charged to expense as incurred.
The depreciation and amortization periods for property and equipment are as follows:
| | |
Furniture and equipment | | One to five years |
Buildings | | Shorter of the estimated useful life which is generally 4 to 40 years or the remaining term of the lease |
When property and equipment are sold or disposed, the cost of the asset and the related accumulated depreciation or amortization are removed from the accounts and the resulting gain or loss on disposal is included in other income and expense.
Impairment of long-lived assets
The Company evaluates the recoverability of its long-lived assets in accordance with Statement of Financial Accounting Standards (“SFAS”) No. 144, “Accounting for the Impairment or Disposal of Long-Lived Assets.” When events or changes in circumstances indicate that the carrying amount of long-lived assets may not be recoverable, the Company recognizes impairment if the net book value of such assets exceeds the future undiscounted cash flows attributed to such assets. The Company assesses the impairment in value to its long-lived assets whenever events or circumstances indicate that their carrying value may not be recoverable. Factors the Company considers important that could trigger an impairment review include operating losses, significant negative industry trends, significant underutilization of the assets and significant changes in how it uses the assets or its plans for its use. No impairment losses were incurred in the periods presented.
Goodwill and identified intangible assets
Identified intangible assets consist of acquired patents, existing technology and trade name that are amortized on a straight-line basis over their estimated useful lives, ranging from 4 to 15 years.
F-8
TESSERA TECHNOLOGIES, INC.
NOTES TO CONSOLIDATED FINANCIAL STATEMENTS
(Continued)
The Company evaluates the recoverability of goodwill recorded in connection with acquisitions on an annual basis in the quarter in which the anniversary date of the acquisition occurs, or more frequently whenever events or changes in circumstances indicate the carrying value of an asset may not be recoverable in accordance with SFAS No. 142, “Goodwill and Other Intangible Assets.” The impairment test is a two-step process. The first step requires comparing the fair value of each reporting unit with allocated goodwill to its net book value. The Company uses management estimates of future cash flows to perform the first step of the goodwill impairment test. These estimates include assumptions about future conditions such as future revenues, gross margins and operating expenses. The Company uses discounted cash flow and market multiple methodologies to obtain the fair value for each reporting unit. The second step is only performed if impairment is indicated after the first step is performed, as it involves measuring the actual impairment to goodwill. No goodwill impairment was recorded for the periods presented.
Comprehensive income (loss)
Comprehensive income (loss) is defined as the change in equity of a business enterprise during a period from transactions and other events and circumstances from non-owner sources. Comprehensive income (loss) includes unrealized gains and losses on the Company’s short-term investments. Comprehensive income (loss) is disclosed in the Consolidated Statements of Stockholders’ Equity and Comprehensive Income.
Revenue recognition
The Company accounts for its revenues under the provisions of Staff Accounting Bulletin (“SAB”) No. 104, “Revenue Recognition in Financial Statements.” Under the provisions of SAB No. 104, the Company recognizes revenues when there is persuasive evidence of an arrangement, delivery has occurred, the fee is fixed and determinable, and collectibility of the resulting receivable is reasonably assured.
Royalty and license fees
Royalty and license fees revenues include revenues from license fees and from royalty payments. Licensees typically pay a non-refundable license fee and revenues from license fees are generally recognized at the time the license agreement is executed by both parties. In some instances, the Company provides training to its licensees under the terms of the license agreement. The amount of training provided is limited and is incidental to the licensed technology. Accordingly, in instances where training is provided under the terms of a license agreement, a portion of the license fee is deferred until such training has been provided. The amount of revenues deferred is the estimated fair value of the services, which is based on the price the Company charges for similar services when they are sold separately. These revenues are reported as service revenues. Semiconductor manufacturers and assemblers pay on-going royalties on their shipment of semiconductors incorporating the Company’s intellectual property. Royalties under the Company’s royalty-based technology licenses are generally based upon either unit volumes of semiconductors shipped using the Company’s technology or a percent of the net sales price. Licensees generally report shipment information 30 to 60 days after the end of the quarter in which such activity takes place. As there is no reliable basis on which the Company can estimate its royalty revenues prior to obtaining these reports from the licensees, the Company recognizes royalty revenues on a one-quarter lag.
Past production payments
Past production payments revenues are royalty payments received through license negotiations, the resolution of patent disputes or the results of the license compliance audit. Such negotiations and resolutions arise when it comes to the Company’s attention that a third party is infringing on patents or a current licensee is
F-9
TESSERA TECHNOLOGIES, INC.
NOTES TO CONSOLIDATED FINANCIAL STATEMENTS
(Continued)
not paying royalties to which the Company is entitled. The Company also completes compliance audits of licensees to independently verify the accuracy of the information contained in the licensees royalty reports. Past production payments revenues represent the portion of royalty payments received through such license negotiations, resolution of patent disputes or license compliance audit that relates to previous periods and are based on historical production volumes.
Revenues are recognized upon execution of the agreement by both parties, provided that the amounts are fixed or determinable, there are no significant Company obligations and collection is reasonably assured. The Company does not recognize any revenues prior to execution of the agreement as there is no reliable basis on which the Company can estimate the amounts for royalties related to previous periods or assess collectibility.
Product and service revenues
The Company utilizes the completed-contract and the percentage-of-completion methods of accounting for commercial and government contracts, dependent upon the type of the contract. The completed-contract method of accounting is used for fixed-fee contracts with relatively short delivery times. Revenues from fixed-fee and fixed-priced contracts are recognized upon acceptance of deliverables by the customer or in accordance to the contract specifications, assuming title and risk of loss has transferred to the customer, prices are fixed and determinable, no significant Company obligations remain, and collection of the related receivable is reasonably assured.
The Company uses the progress toward completion method of accounting for cost reimbursement-type contracts, which generally specify the reimbursable costs and a certain billable fee amount. Under the progress toward completion method, revenues recognized are that portion of the total contract price equal to the ratio of costs expended to date to the anticipated final total costs based on current estimates of the costs to complete the projects. If the total estimated costs to complete a project were to exceed the total contract amount, indicating a loss, the entire anticipated loss would be recognized immediately. Revenues, including estimated earned fees, under cost reimbursement-type contracts are recognized as costs are incurred, assuming that the fee is fixed or determinable and collection is reasonably assured.
Claims made for amounts in excess of the agreed contract price are recognized only if it is probable that the claim will result in additional revenue and the amount of additional revenue can be reliably estimated.
Product revenue is generated principally from sales of micro-optic products. The Company recognizes revenue from product sales upon acceptance by the customer or in accordance to the contract specifications, assuming the title and risk and awards of product ownership are transferred to the customer, price and terms are fixed and the collection of the resulting receivable is reasonably assured. Revenue from non-recurring engineering fees are recognized when the service is completed or upon certain milestones as provided for in the agreements.
F-10
TESSERA TECHNOLOGIES, INC.
NOTES TO CONSOLIDATED FINANCIAL STATEMENTS
(Continued)
The following table sets forth sales to customers comprising 10% or more of the Company’s total revenues for the periods indicated:
| | | | | | | | | |
| | | Years Ended
December 31, | |
| | | 2006 | | | 2005 | | | 2004 | |
Customer | | | | | | | | | |
Intel Corporation | | * | | | * | | | 18 | % |
Micron Technology, Inc. | | 15 | % | | — | | | — | |
Qimonda AG. | | 21 | % | | — | | | — | |
Samsung Electronics | | * | | | 20 | % | | * | |
Texas Instruments, Inc | | * | | | 17 | % | | 20 | % |
* Less than 10% | | | | | | | | | |
A significant portion of our revenues is derived from licensees headquartered outside of the United States, principally in Asia and Europe, and we expect these revenues will continue to account for a significant portion of total revenues in future periods. The table below lists the geographic regions of the headquarters of our customers and the percentage of revenues derived from each region for the periods indicated:
| | | | | | | | | |
| | | Years Ended
December 31, | |
| | | 2006 | | | 2005 | | | 2004 | |
Asia | | 17 | % | | 28 | % | | 11 | % |
Europe | | 32 | % | | 0 | % | | 0 | % |
Japan | | 15 | % | | 28 | % | | 31 | % |
Other | | — | | | 1 | % | | 2 | % |
USA | | 36 | % | | 43 | % | | 56 | % |
Indemnification
The Company does not have guarantees required to be disclosed under Financial Accounting Standards Board Interpretation (“FIN”) No. 45, “Guarantor’s Accounting and Disclosure Requirements for Guarantees, Including Indirect Guarantees of Indebtedness of Others.” However, the Company’s technology license agreements typically provide for indemnification of customers for intellectual property infringement claims. Also, the Company indemnifies its officers and directors under the terms of indemnity agreements entered into with them, as well as pursuant to its certificate of incorporation, bylaws, and applicable Delaware law. As of December 31, 2006, no such claims have been filed against the Company, and no liability has been accrued.
Research, development and other related costs
Research, development and other related costs consist primarily of compensation and related costs for personnel as well as costs related to patent prosecution, materials, supplies and equipment depreciation. All research, development and other related costs are expensed as incurred. Research and development costs, excluding costs related to patent prosecution for 2006, 2005 and 2004 were $17,834,000, $5,256,000 and $5,567,000, respectively.
Advertising
Cooperative marketing programs reimburse customers for promoting certain of the company’s products, subject to defined criteria. The expenses are accrued and recorded as selling, general and administrative expense in the same period as related revenue is recognized. All other advertising costs are expensed as incurred. The Company recognized advertising expenses for years ended 2006, 2005 and 2004 were $626,000, $21,000 and $0.
F-11
TESSERA TECHNOLOGIES, INC.
NOTES TO CONSOLIDATED FINANCIAL STATEMENTS
(Continued)
Stock-based Compensation
The Company has share-based payment awards to its employees and directors that are described fully in Notes 8 and 9. The stock-based compensation expenses are recorded in accordance with SFAS No. 123(R), “Share-Based Payment.
Income taxes
The Company accounts for income taxes under the provisions of SFAS No. 109, “Accounting for Income Taxes.” Under this method, the Company determines deferred tax assets and liabilities based upon the difference between the income tax bases of assets and liabilities and their respective financial reporting amounts at enacted tax rates in effect for the periods in which the differences are expected to reverse. The tax consequences of most events recognized in the current year’s financial statements are included in determining income taxes currently payable. However, because tax laws and financial accounting standards differ in their recognition and measurement of assets, liabilities, equity, revenues, expenses, gains and losses, differences arise between the amount of taxable income and pretax financial income for a year and between the tax bases of assets or liabilities and their reported amounts in the financial statements. Because it is assumed that the reported amounts of assets and liabilities will be recovered and settled, respectively, a difference between the tax basis of an asset or a liability and its reported amount in the balance sheet will result in a taxable or a deductible amount in some future years when the related liabilities are settled or the reported amounts of assets are recovered, hence giving rise to a deferred tax liability or asset, respectively. The Company then assess the likelihood that its deferred tax assets will be recovered from future taxable income and to the extent the Company believes that recovery is not likely, the Company establish a valuation allowance.
Litigation and Contingencies. From time to time, we have been subject to legal proceedings and claims with respect to such matters as patents and other actions arising out of the normal course of business, as well as other matters identified above in Part 1, Item 3—Legal Proceedings.
The results of any litigation are inherently uncertain, and any adverse decision could result in a loss of our proprietary rights, subject us to significant liabilities, require us to seek licenses from others, limit the value of our technologies and otherwise negatively impact over business. If we believe that it is probable for a certain proceeding to result in an adverse decision and that the loss is estimable, we would establish an appropriate accrual for the loss.
NOTE 3 – RECENT ACCOUNTING PRONOUNCEMENTS
In June 2006, the Financial Accounting Standards Board (“FASB”) issued FIN No. 48, “Accounting for Uncertainty in Income Taxes—An Interpretation of SFAS No. 109.” This Interpretation contains two-step process. The first step is evaluating the tax position for recognition by determining whether it is more-likely- than-not a tax position will be sustained upon examination, including resolution of any related appeals or litigation processes, based on the technical merits of the position. The second step is to measure the tax benefit at the largest amount that is greater than 50% likely of being realized upon ultimate settlement. This Interpretation is effective for fiscal years beginning after December 15, 2006. The Company is currently in the process of assessing the adoption of this statement.
In September 2006, the Securities and Exchange Commission (“SEC”) issued Staff Accounting Bulletin (“SAB”) No. 108 regarding the process of quantifying financial statement misstatements. SAB No. 108 states that registrants should use both a balance sheet approach and an income statement approach when quantifying and evaluating the materiality of a misstatement. The interpretations in SAB No. 108 contain guidance on correcting errors under the dual
F-12
TESSERA TECHNOLOGIES, INC.
NOTES TO CONSOLIDATED FINANCIAL STATEMENTS
(Continued)
approach as well as provide transition guidance for correcting errors. This interpretation does not change the requirements within SFAS No. 154, “Accounting Changes and Error Corrections – a replacement of Accounting Principles Board Opinion (“APB”) No. 20 and SFAS No. 3,” for the correction of an error on financial statements. SAB No. 108 is effective for annual financial statements covering the first fiscal year ending after November 15, 2006. The adoption of this statement does not have a material effect on the Company’s financial statements.
In September 2006, the FASB issued SFAS No. 157, “Fair Value Measurements.” This standard defines fair value, establishes a framework for measuring fair value in accounting principles generally accepted in the United States of America, and expands disclosure about fair value measurements. This pronouncement applies under other accounting standards that require or permit fair value measurements. Accordingly, this statement does not require any new fair value measurement. This statement is effective for fiscal years beginning after November 15, 2007, and interim periods within those fiscal years. The Company will be required to adopt SFAS No. 157 in the first quarter of fiscal year 2008. The Company is currently evaluating the requirements of SFAS No. 157 and has not yet determined the impact on its financial statements.
NOTE 4 – COMPOSITION OF CERTAIN FINANCIAL STATEMENT CAPTIONS
Cash and cash equivalents consists of the following (in thousands):
| | | | | | |
| | | December 31, |
| | | 2006 | | 2005 |
Cash | | $ | 44,030 | | $ | 16,143 |
Money market | | | 150,046 | | | 111,451 |
| | | | | | |
| | $ | 194,076 | | $ | 127,594 |
| | | | | | |
Accounts receivable consists of the following (in thousands):
| | | | | | | |
| | | December 31, |
| | | 2006 | | | 2005 |
Trade | | $ | 3,841 | | | $ | 1,629 |
Other | | | 3,017 | | | | 2,973 |
Allowance for doubtful accounts | | | (75 | ) | | | — |
| | | | | | | |
| | $ | 6,783 | | | $ | 4,602 |
| | | | | | | |
Inventories consist of the following (in thousands):
| | | | | | |
| | | December 31, |
| | | 2006 | | 2005 |
Raw materials | | $ | 247 | | $ | — |
Work in process | | | 407 | | | — |
Finished goods | | | 894 | | | — |
| | | | | | |
| | $ | 1,548 | | $ | — |
| | | | | | |
F-13
TESSERA TECHNOLOGIES, INC.
NOTES TO CONSOLIDATED FINANCIAL STATEMENTS
(Continued)
Other current assets consist of the following (in thousands):
| | | | | | |
| | | December 31, |
| | | 2006 | | 2005 |
Foreign taxes withholding refund | | $ | 11,556 | | $ | — |
Other | | | 1,878 | | | 1,039 |
| | | | | | |
| | $ | 13,434 | | $ | 1,039 |
| | | | | | |
Property and equipment consists of the following (in thousands):
| | | | | | | | |
| | | December 31, | |
| | | 2006 | | | 2005 | |
Furniture and equipment | | $ | 23,153 | | | $ | 17,434 | |
Land and buildings | | | 16,607 | | | | 1,886 | |
| | | | | | | | |
| | | 39,760 | | | | 19,320 | |
Less: Accumulated depreciation and amortization | | | (15,055 | ) | | | (10,569 | ) |
| | | | | | | | |
| | $ | 24,705 | | | $ | 8,751 | |
| | | | | | | | |
Depreciation and amortization expense for the years ended December 31, 2006, 2005 and 2004, amounted to $5,121,000, $1,416,000 and $962,000, respectively.
Accrued liabilities consist of the following (in thousands):
| | | | | | |
| | | December 31, |
| | | 2006 | | 2005 |
Employee compensation and benefits | | $ | 5,687 | | $ | 2,723 |
Professional services | | | 588 | | | 571 |
Other | | | 1,075 | | | 203 |
| | | | | | |
| | $ | 7,350 | | $ | 3,497 |
| | | | | | |
NOTE 5 – BUSINESS COMBINATIONS
North Corporation
In May 2005, Tessera entered into a number of new agreements with North Corporation (“North”), which included the acquisition of 100% ownership of all United States patents and patent applications filed by North, joint ownership of patents and applications filed in other jurisdictions and the right to sublicense certain other patents currently owned by North, for approximately $6,073,000. Tessera has recorded these patents and license rights as intangible assets, and is amortizing them over their respective estimated useful lives, currently estimated at 15 years.
Shellcase, Ltd.
In December 2005, Tessera completed its purchase of certain intellectual property and related assets of Shellcase, Ltd. (“Shellcase”), an Israeli company. Shellcase was engaged in developing, manufacturing and marketing advanced packaging technologies for microelectronic integrated circuits.
There is no acquired in-process research and development.
F-14
TESSERA TECHNOLOGIES, INC.
NOTES TO CONSOLIDATED FINANCIAL STATEMENTS
(Continued)
Purchase price allocation
In accordance to SFAS No. 141, “Business Combination,” the purchase price of the acquisition was $34,699,000, which has been determined as follows (in thousands):
| | | |
Cash | | $ | 33,590 |
Transaction costs | | | 1,109 |
| | | |
Total purchase price | | $ | 34,699 |
| | | |
The purchase price has been allocated as follows (in thousands):
| | | |
Property and equipment | | $ | 3,583 |
Identified intangible assets: | | | |
Existing technology | | | 6,700 |
Trade name | | | 220 |
Goodwill | | | 24,196 |
| | | |
Total purchase price | | $ | 34,699 |
| | | |
Approximately $6,900,000 of the purchase price has been allocated to amortizable intangible assets consisting of existing patented technology and trade names with estimated useful lives of 10 years. Goodwill recognized in the transaction totaled $24,200,000, none of which is deductible for tax purposes. Goodwill represents the excess of the purchase price over the fair value of the underlying net tangible and identifiable intangible assets. In accordance with SFAS No. 142, “Goodwill and Other Intangible Assets,” goodwill will not be amortized but instead will be tested for impairment at least annually (more frequently if certain indicators are present). In the event that management determined that the value of goodwill has become impaired, the Company will incur an accounting change for the amount of impairment during the fiscal quarter in which the determination is made.
Digital Optics Corporation
In July 2006, Tessera completed its acquisition of Digital Optics Corporation (“Digital Optics”), a Delaware corporation, whereby Digital Optics became a wholly owned subsidiary of Tessera in a transaction accounted for using the purchase accounting method. The preliminary purchase price of $59,810,000 includes cash of $58,644,000, for all outstanding shares of capital stock and vested stock options, and transaction costs of $1,166,000. Approximately $8,000,000 of the purchase consideration was held in escrow and is subject to forfeiture to satisfy the indemnification obligations, if any, of the former stockholders of Digital Optics and to serve to as security for the purchase price. During the year 2006, $900,000 of the escrow amount was returned to Tessera, and $1,100,000 was returned to former stockholders of Digital Optics. The remaining balance of $6.0 million will expire in January, 2008. All interest and other income earned from the escrow will be allocated and distributed to the former stockholders of Digital Optics.
There is no acquired in-process research and development.
Preliminary purchase price allocation
In accordance to SFAS No. 141, “Business Combinations,” the preliminary purchase price of the acquisition was approximately $59.8 million, which has been determined as follows (in thousands):
| | | |
Cash | | $ | 58,644 |
Transaction costs | | | 1,166 |
| | | |
Total preliminary purchase price | | $ | 59,810 |
| | | |
F-15
TESSERA TECHNOLOGIES, INC.
NOTES TO CONSOLIDATED FINANCIAL STATEMENTS
(Continued)
Under the purchase method of accounting, the total purchase price as shown in the table above is allocated to the tangible and identifiable intangible assets acquired and liabilities assumed based on their estimated fair values. Based upon the fair values acquired, the purchase price allocation is as follows (in thousands):
| | | | | | |
| | | Amount | | | Estimated Useful Life |
| | | | | | (Years) |
Net tangible assets: | | | | | | |
Current assets | | $ | 8,468 | | | |
Inventory, net | | | 2,885 | | | |
Property and equipment, net | | | 18,270 | | | |
Long term assets | | | 7,193 | | | |
Current liabilities | | | (5,123 | ) | | |
Long term debt | | | (12 | ) | | |
| | | | | | |
| | | 31,681 | | | |
Identified intangible assets: | | | | | | |
Existing technology | | | 6,700 | | | 5 - 7 |
Patents/core technology | | | 5,200 | | | 7 - 10 |
Customer contracts and related relationships | | | 1,900 | | | 4 |
Trade name/trademark | | | 3,100 | | | 10 |
Goodwill | | | 11,229 | | | N/A |
| | | | | | |
| | | 28,129 | | | |
| | | | | | |
Total preliminary purchase price | | $ | 59,810 | | | |
| | | | | | |
Approximately $31,681,000 of the purchase price has been allocated to acquire net tangible assets consisting of inventory, property and equipment and various assumed assets and liabilities. Approximately $16,900,000 has been allocated to amortizable intangible assets acquired. The depreciation and amortization related to the fair value adjustments to net tangible assets and the amortization related to the amortizable intangible assets are reflected as pro forma adjustments to the pro forma results.
For the year ended December 31, 2006, the inventory adjustment of $1,562,000 was directly related to the purchase accounting treatment of inventory acquired in the acquisition of Digital Optics Corporation in which the inventory was written up to fair value in purchase accounting and then amortized as the inventory was sold.
Identified intangible assets
Existing Technology — $6,700,000 has been allocated to Existing Technology which relates to Digital Optics’ products across all of their product lines which have reached technological feasibility. The fair value of these assets will be amortized on a straight line basis over estimated useful life ranging from 5 to 7 years.
Patents and core technology — $5,200,000 has been allocated to Patents/Core Technology which represents the combination of Digital Optics’ processes, patents and trade secrets developed through years of experience in design and development of their products. The fair value of these assets will be amortized on a straight line basis over estimated useful life ranging from 7 to 10 years.
Customer contracts and related relationships — $1,900,000 has been allocated to Customer Contacts and Related Relationships which represents existing contracts that relate primarily to underlying customer relationships. The fair value of these assets will be amortized on a straight-line basis over an estimated useful life of 4 years.
F-16
TESSERA TECHNOLOGIES, INC.
NOTES TO CONSOLIDATED FINANCIAL STATEMENTS
(Continued)
Trade name and trademark — $3,100,000 has been allocated to Trade Name/Trademark which relates to the Digital Optics trade name. The fair value of these assets will be amortized on a straight-line basis over an estimated useful life of 10 years.
Goodwill — Tessera acquired Digital Optics with the intent of furthering the company’s core manufactured business and of extending the company’s technology and intellectual property in building a larger technology-licensing business in micro-optics for the consumer electronics industry. These factors primarily contributed to a purchase price in excess of the fair value of the underlying net tangible and intangible assets. Goodwill recognized in this transaction totaled $11,229,000, which is anticipated to be fully deductible for tax purposes.
Pro forma results
The results of operations of the acquisitions have been included in the Company’s consolidated statement of operations since the completion of the acquisitions. The following unaudited pro forma information presents a summary of the results of operations of the Company assuming the acquisitions occurred at the beginning of the periods presented (in thousands, except for per share amounts):
| | | | | | |
| | | Years Ended
December 31, |
| | | 2006 | | 2005 |
Net revenues | | $ | 221,564 | | $ | 112,495 |
Net income | | $ | 63,538 | | $ | 25,985 |
Basic net income per share | | $ | 1.38 | | $ | 0.59 |
Diluted net income per share | | $ | 1.31 | | $ | 0.54 |
NOTE 6 – GOODWILL AND IDENTIFIABLE INTANGIBLE ASSETS
The allocation of goodwill to segments and the changes to the carrying value from January 1, 2006 through December 31, 2006 is reflected below (in thousands):
| | | | | | | | | |
| | | Intellectual
Property | | Services | | Total |
January 1, 2006 | | $ | 24,154 | | $ | — | | $ | 24,154 |
Goodwill acquired through the Digital Optics acquisition | | | — | | | 11,229 | | | 11,229 |
Goodwill adjustments (a) | | | 42 | | | — | | | 42 |
| | | | | | | | | |
December 31, 2006 | | $ | 24,196 | | $ | 11,229 | | $ | 35,425 |
| | | | | | | | | |
| (a) | During the year ended December 31, 2006, the Company adjusted the goodwill related to prior acquisitions for individually insignificant amount based on continued post-closing review. |
Identified intangible assets consists of the following (in thousands):
| | | | | | | | | | | | | | | | | | | | | | |
| | | Average Life | | December 31, |
| | | | 2006 | | 2005 |
| | | | Gross Assets | | Accumulated Amortization | | | Net | | Gross Assets | | Accumulated Amortization | | | Net |
| | | (Years) | | | | | | | | | | | | | | |
Acquired patents | | 7 - 15 | | $ | 11,273 | | $ | (888 | ) | | $ | 10,385 | | $ | 6,073 | | $ | (236 | ) | | $ | 5,837 |
Existing technology | | 5 - 10 | | | 13,400 | | | (1,127 | ) | | | 12,273 | | | 6,700 | | | — | | | | 6,700 |
Trade name | | 10 | | | 3,320 | | | (151 | ) | | | 3,169 | | | 220 | | | — | | | | 220 |
Customer contracts | | 4 | | | 1,900 | | | (198 | ) | | | 1,702 | | | — | | | — | | | | — |
| | | | | | | | | | | | | | | | | | | | | | |
| | | | $ | 29,893 | | $ | (2,364 | ) | | $ | 27,529 | | $ | 12,993 | | $ | (236 | ) | | $ | 12,757 |
| | | | | | | | | | | | | | | | | | | | | | |
F-17
TESSERA TECHNOLOGIES, INC.
NOTES TO CONSOLIDATED FINANCIAL STATEMENTS
(Continued)
Amortization expense for the years ended December 31, 2006, 2005 and 2004 amounted to $2,128,000, $236,000 and $0, respectively.
As of December 31, 2006, the estimated future amortization expense of purchased intangible assets is as follows (in thousands):
| | | |
2007 | | | 3,571 |
2008 | | | 3,571 |
2009 | | | 3,572 |
2010 | | | 3,374 |
2011 | | | 3,088 |
Thereafter | | | 10,353 |
| | | |
| | $ | 27,529 |
| | | |
NOTE 7 – NET INCOME PER SHARE
The Company reports both basic net income per share, which is based upon the weighted average number of common shares outstanding excluding returnable shares, and diluted net income per share, which is based on the weighted average number of common shares outstanding and dilutive potential common shares outstanding.
The following table sets forth the computation of basic and diluted net income per share (in thousands, except per share amounts):
| | | | | | | | | | | | |
| | | Years Ended December 31, | |
| | | 2006 | | | 2005 | | | 2004 | |
Numerator: | | | | | | | | | | | | |
Net income | | $ | 61,351 | | | $ | 31,449 | | | $ | 59,063 | |
Denominator: | | | | | | | | | | | | |
Weighted average common shares outstanding | | | 46,455 | | | | 44,020 | | | | 40,090 | |
Less: Unvested common shares subject to repurchase | | | (353 | ) | | | (17 | ) | | | (13 | ) |
| | | | | | | | | | | | |
Total shares; basic | | | 46,102 | | | | 44,003 | | | | 40,077 | |
Effect of dilutive securities | | | | | | | | | | | | |
Stock options and warrants | | | 1,930 | | | | 3,713 | | | | 6,532 | |
Weighted average unvested common shares subject to repurchase | | | 353 | | | | 17 | | | | 13 | |
| | | | | | | | | | | | |
Total shares; diluted | | | 48,385 | | | | 47,733 | | | | 46,622 | |
| | | | | | | | | | | | |
Net income per common share; basic | | $ | 1.33 | | | $ | 0.71 | | | $ | 1.47 | |
| | | | | | | | | | | | |
Net income per common share; diluted | | $ | 1.27 | | | $ | 0.66 | | | $ | 1.27 | |
| | | | | | | | | | | | |
For the years ended December 31, 2006, 2005 and 2004, a total of 1,757,000, 570,000, and 11,000 common stock options, respectively, were excluded from the computation of diluted net income per share as they were considered to have an antidilutive effect.
F-18
TESSERA TECHNOLOGIES, INC.
NOTES TO CONSOLIDATED FINANCIAL STATEMENTS
(Continued)
NOTE 8 – STOCK-BASED COMPENSATION
On January 1, 2006, the Company adopted SFAS No. 123(R) under which the measurement and recognition of compensation expense for all stock-based payment awards made to employees and directors including employee stock options, restricted stock awards and employee stock purchases under the Company’s Employee Stock Purchase Plan based on estimated fair values was required. SFAS No. 123(R) supersedes the Company’s previous accounting under APB No. 25, “Accounting for Stock Issued to Employees,” for periods beginning in fiscal year 2006. In March 2005, the SEC issued SAB No. 107 relating to SFAS No. 123(R).
SFAS No. 123(R) requires companies to estimate the fair value of stock-based payment awards on the date of grant using an option-pricing model. The value of the portion of the award that is ultimately expected to vest is recognized as expense over the requisite service periods in the Company’s Consolidated Statement of Operations.
The Company has applied the provisions of SAB No. 107 in its adoption of SFAS No. 123(R). Thus, the Company adopted SFAS No. 123(R) in accordance with the modified prospective transition method on January 1, 2006. In accordance with the modified prospective transition method, the Company’s Consolidated Financial Statements for prior periods have not been restated to reflect, and do not include the impact of SFAS No. 123(R). The valuation provisions of SFAS No. 123(R) apply to new awards and to awards that are outstanding on the effective date and subsequently modified or cancelled. Historically, the Company accounted for stock-based awards to employees and directors using the intrinsic value method in accordance with APB No. 25 and only disclosed the impact of SFAS No. 123 within the footnote disclosures of the Company’s financial statements. Thus, previously under the rules of APB No. 25, stock-based compensation expense was only recognized and reported in our Consolidated Statement of Operations for grants that had an exercise price that was less than the stock price at the date of grant.
In conjunction with the adoption of SFAS No. 123(R), the Company prospectively amended its method of attributing the value of stock-based compensation to expense. Historically, the Company utilized the provisions of FIN No. 28 to recognize the expense associated with equity awards. This method allows for accelerated amortization of stock based compensation expense over the vesting period of the award. As permitted by SFAS No. 123(R), the Company elected the straight-line method of expensing all stock based compensation awarded subsequent to the adoption of SFAS No. 123(R). Thus, compensation expense for all stock-based payment awards granted on or prior to December 31, 2005 will continue to be recognized using the accelerated approach under FIN No. 28, while compensation expense for all stock-based payment awards granted on or after January 1, 2006 will be recognized using the straight-line method.
The Company will continue to use the Black-Scholes valuation model to determine the estimated fair value of stock-based awards since this model utilizes the following award attributes to determine the estimated fair value of stock-based awards: fair value at date of grant, exercise price, risk free interest rate, volatility, expected life of the award, forfeiture rate and dividend rate.
F-19
TESSERA TECHNOLOGIES, INC.
NOTES TO CONSOLIDATED FINANCIAL STATEMENTS
(Continued)
The following table summarizes the expenses prior to the adoption of the SFAS No. 123(R) (in thousands, except per share amounts):
| | | | | | | | |
| | | Years Ended
December 31, | |
| | | 2005 | | | 2004 | |
Net income—as reported | | $ | 31,449 | | | $ | 59,063 | |
Plus: Stock-based employee compensation expense determined under APB Opinion No. 25, included in reported net income, net of tax | | | 21 | | | | 58 | |
Less: Stock-based employee compensation expense determined under fair value based method, net of tax | | | (15,048 | ) | | | (8,826 | ) |
| | | | | | | | |
Pro forma net income | | | 16,422 | | | | 50,295 | |
| | | | | | | | |
Basic net income per share: | | | | | | | | |
As reported | | $ | 0.71 | | | $ | 1.47 | |
As adjusted | | $ | 0.37 | | | $ | 1.26 | |
Diluted net income per share: | | | | | | | | |
As reported | | $ | 0.66 | | | $ | 1.27 | |
As adjusted | | $ | 0.34 | | | $ | 1.08 | |
Impact of the adoption of SFAS No. 123(R)
The Company elected to adopt the modified prospective application method as provided by SFAS No. 123(R). Accordingly, during the year ended December 31, 2006, the Company recorded stock-based compensation cost totaling the amount that would have been recognized had the fair value method been applied since the effective date of SFAS No. 123(R). Previously reported amounts have not been restated. The following table summarizes stock-based compensation expense related to various operating activities for the year ended December 31, 2006 (in thousands, except per share amounts):
| | | | |
| | | December 31,
2006 | |
Cost of revenues | | $ | 2,924 | |
Research, development & other related costs | | | 1,023 | |
Selling, general & administrative | | | 11,421 | |
| | | | |
Total stock-based compensation | | | 15,368 | |
Tax effect on stock-based compensation | | | (4,352 | ) |
| | | | |
Net effect on net income | | $ | 11,016 | |
Effect on earnings per share: | | | | |
Basic | | $ | 0.24 | |
Diluted | | $ | 0.23 | |
The stock-based compensation expense categorized by various equity components is summarized in the table below (in thousands):
| | | |
| | | Year Ended
December 31,
2006 |
Stock options | | $ | 12,022 |
Restricted stock awards | | | 2,468 |
Employee stock purchase plan | | | 878 |
| | | |
Total stock-based compensation | | $ | 15,368 |
| | | |
F-20
TESSERA TECHNOLOGIES, INC.
NOTES TO CONSOLIDATED FINANCIAL STATEMENTS
(Continued)
During the years ended December 31, 2006, 2005 and 2004, the Company granted 1,265,000, 1,112,000 and 1,855,000 stock options, respectively. The 2006, 2005 and 2004 estimated per share fair value of those grants is $15.75, $17.52 and $11.57, respectively, before estimated forfeitures. This includes the 156,000 options that were granted in connection with the Company’s acquisition of Digital Optics Corporation in July, 2006 which vest over an average of 2 years. As of December 31, 2006, the unrecorded deferred stock-based compensation costs related to stock options was $20,168,000 after estimated forfeitures and an additional $8,910,000 related to restricted stock awards to be recognized over an estimated weighted average amortization period of 4 years. The Company used the estimated forfeiture rate during the year 2006 and in accordance with SFAS No. 123(R) adjusted the stock-based compensation expense for actual forfeitures at the end of the year.
The following assumptions have been used to value the options granted:
| | | | | | | | | |
| | | Years Ended
December 31, | |
| | | 2006 | | | 2005 | | | 2004 | |
Expected life (years) | | 4.0 | | | 4.0 | | | 5.0 | |
Risk-free interest rate | | 4.9 | % | | 3.9 | % | | 3.4 | % |
Dividend yield | | 0.0 | % | | 0.0 | % | | 0.0 | % |
Expected volatility | | 53.0 | % | | 64.3 | % | | 69.0 | % |
Under the Employee Stock Purchase Plan (“ESPP”), for the years ended December 31, 2006, 2005 and 2004, the Company estimated a total purchase of 832,000, 696,000 and 647,000 shares, respectively, with a per share weighted average fair value of $8.19, $6.46 and $8.94, respectively. The following assumptions have been used to value the ESPP shares:
| | | | | | | | | |
| | | Years Ended
December 31, | |
| | | 2006 | | | 2005 | | | 2004 | |
Expected life (years) | | 2.0 | | | 2.0 | | | 2.0 | |
Risk-free interest rate | | 4.9 | % | | 3.9 | % | | 3.4 | % |
Dividend yield | | 0.0 | % | | 0.0 | % | | 0.0 | % |
Expected volatility | | 41.5 | % | | 38.3 | % | | 57.7 | % |
The Company uses third-party analyses to assist in developing the expected life assumption used in its Black-Scholes model. The Company, however, determines its assumptions regarding its volatility and risk-free interest rate. The volatility assumption is based on the blended volatility approach consisting of a combination of the Company’s historical volatility and the volatility of industry peers, as the Company has insufficient historical data concerning the volatility of its common stock, with the exception of ESPP. The fair value of each option grant is estimated on the date of grant using the Black-Scholes valuation model and the expense is recognized on a straight-line basis.
Tax benefits from stock options
During the years ended December 31, 2006, 2005, and 2004, various employees exercised their fully-vested stock options. In 2006, the tax benefits from such employee stock option transactions reduced our income taxes payable for federal and state purposes. These benefits totaled $37.8 million, $0 and $0 and were reflected as a credit to additional paid-in capital. Exercises resulting in disqualified dispositions of incentive stock options and exercises of nonqualified stock options contributed to the tax benefits.
F-21
TESSERA TECHNOLOGIES, INC.
NOTES TO CONSOLIDATED FINANCIAL STATEMENTS
(Continued)
NOTE 9 – STOCKHOLDERS’ EQUITY
Preferred stock
In August 2003, the Company’s stockholders approved an amendment and restatement of the Company’s Restated Certificate of Incorporation. Under the Restated Certificate of Incorporation, the Company authorizes 10,000,000 shares of $0.001 par value preferred stock. There were no shares of preferred stock issued as of December 31, 2006.
Preferred and common stock warrants
On May 5, 1999, the Company issued a warrant to purchase 21,588 shares of Series C Preferred Stock at an exercise price of $7.50 per share, in connection with an existing lease arrangement. The warrant expired the earlier of 2009 or 5 years following a qualified public offering. The fair value of this warrant was determined to be $63,000 based on the Black-Scholes option-pricing model. This amount has be included as part of other expenses. Upon completion of the initial public offering on November 13, 2003, this warrant has converted into common stock warrant. During the secondary public offering (“Secondary Offering”) in 2004, 21,290 shares were exercised. As of December 31, 2006, 298 shares were exercisable.
On February 4, 2000, in connection with the issuance of Series E preferred stock, the Company issued a warrant to a financial advisor to purchase 235,321 shares of common stock at an exercise price of $7.50 per share. The warrant expired the earlier of 2005 or 24 months following a qualified public offering. The warrant includes rights and provisions similar to those granted to the holders of Series E preferred stock. The Company determined the fair value of the warrant to be $876,000, based on the Black-Scholes option-pricing model and the amount has been recognized immediately as stock issuance costs. Upon completion of the IPO on November 13, 2003, this warrant has converted into common stock warrant. In 2004, the warrant was transferred to various individuals, and as of December 31, 2005, 233,400 shares were exercised and 1,921 shares were expired unexercised.
On February 17, 2000, the Company issued a warrant, in connection with an existing lease arrangement, to purchase 6,666 shares of Series E Preferred Stock at an exercise price of $7.50 per share. The fair value of this warrant was determined to be $50,000 based on the Black-Scholes option-pricing model. This amount has been included as part of other expenses. Upon completion of the IPO on November 13, 2003, this warrant has converted into a warrant to purchase shares of common stock. This warrant was fully exercised in 2005.
On July 1, 2000, the Company issued a warrant to purchase 16,666 shares of the Company’s common stock at an exercise price of $9.00 per share in connection with the issuance of Series E-1 preferred stock. The warrant expired the earlier of 2005 or 24 months following a qualified public offering. The warrant include rights and provisions similar to those granted to the holders of Series E preferred stock. The Company determined the fair value of the warrant to be $133,000 using the Black-Scholes option-pricing model and the amount has been recognized immediately as stock issuance costs. In 2004, the warrant was transferred to various individuals, and as of December 31, 2005, these warrants were fully exercised.
Stock Option Plans
The 1991 Plan
In November 1991, the Company adopted the 1991 Stock Option Plan (the “1991 Plan”). Under the 1991 Plan, incentive stock options may be granted to the Company’s employees at an exercise price of no less than 100% of the fair value on the date of grant, and nonstatutory stock options may be granted to the Company’s
F-22
TESSERA TECHNOLOGIES, INC.
NOTES TO CONSOLIDATED FINANCIAL STATEMENTS
(Continued)
employees, non-employee directors and consultants at an exercise price of no less than 85% of the fair value. In the case of incentive stock options, when the optionees own stock representing more than 10% of the voting power of all classes of stock of the Company, the exercise price shall be no less than 110% of the fair value on the date of grant. All options granted to date under the 1991 Plan have been granted at an exercise price equal to the fair value of the Company’s common stock on the date of grant. Options granted under the 1991 Plan generally have a term of ten years from the date of grant and vest over a four year period. After December 1996, no further options were granted from this plan, nor does the Company have any intention of issuing additional grants under this plan. As of December 31, 2006, there were no shares reserved for grant under this plan.
The 1996 Plan
In December 1996, the Company adopted the 1996 Stock Option Plan (the “1996 Plan”). Under the 1996 Plan, incentive stock options may be granted to the Company’s employees at an exercise price of no less than 100% of the fair value on the date of grant, and nonstatutory stock options may be granted to the Company’s employees, non-employee directors and consultants at an exercise price of no less than 85% of the fair value. In both cases, when the optionees own stock representing more than 10% of the voting power of all classes of stock of the Company, the exercise price shall be no less than 110% of the fair value on the date of grant. For options granted with an exercise price below fair market value, a stock-based compensation charge has been determined. Options granted under the 1996 Plan generally have a term of ten years from the date of grant and vest over a four-year period. Shares issued in connection with the exercise of unvested options are subject to repurchase by the Company until such options would have vested. After February 1999, no further options were granted from this plan, nor does the Company have any intention of issuing additional grants under this plan. As of December 31, 2006, there were no shares reserved for grant under this plan.
The 1999 Plan
In February 1999, the Company adopted the 1999 Stock Option Plan (“1999 Plan”), which was approved by the stockholders in May 1999. The terms of the 1999 Plan are similar to the terms of the 1996 Plan. After December 2002, no further options were granted under this plan, nor does the Company have any intention of issuing additional grants under this plan. As of December 31, 2006, there were no shares reserved for grant under this plan.
The 2003 Plan
In February 2003, the board of directors adopted, and the Company stockholders approved, the 2003 Equity Incentive Plan (the “2003 Plan”). The terms of the 2003 Plan are similar to the terms of the 1999 Plan. The 2003 Plan permits the granting of restricted stock either alone, in addition to, or in tandem with any options granted thereunder. As of December 31, 2006, there were 2,623,000 shares reserved for grant under this plan.
F-23
TESSERA TECHNOLOGIES, INC.
NOTES TO CONSOLIDATED FINANCIAL STATEMENTS
(Continued)
A summary of the activity is presented below (number of shares in thousands):
| | | | | | | | | |
| | | Shares
Available | | | Options Outstanding |
| | | | Number of
Shares | | | Weighted
Average
Exercise Price |
Balance at December 31, 2003 | | 2,460 | | | 8,387 | | | | 2.83 |
Additional shares authorized | | 1,000 | | | — | | | | — |
Restricted stocks granted | | (10 | ) | | — | | | | — |
Options granted | | (1,855 | ) | | 1,855 | | | | 19.40 |
Options exercised | | — | | | (3,474 | ) | | | 2.58 |
Option forfeited / expired | | 150 | | | (150 | ) | | | 7.30 |
| | | | | | | | | |
Balance at December 31, 2004 | | 1,745 | | | 6,618 | | | | 7.50 |
| | | | | | | | | |
Restricted stocks granted | | (87 | ) | | — | | | | — |
Options granted | | (1,112 | ) | | 1,112 | | | | 33.71 |
Options exercised | | — | | | (2,786 | ) | | | 4.01 |
Option forfeited / expired | | 164 | | | (164 | ) | | | 19.59 |
| | | | | | | | | |
Balance at December 31, 2005 | | 710 | | | 4,780 | | | $ | 15.22 |
| | | | | | | | | |
Additional shares authorized | | 3,300 | | | — | | | | — |
Restricted stocks granted | | (331 | ) | | — | | | | — |
Restricted stocks forfeited / expired | | 37 | | | — | | | | — |
Options granted | | (1,265 | ) | | 1,265 | | | | 26.57 |
Options exercised | | — | | | (1,685 | ) | | | 6.03 |
Option forfeited / expired | | 172 | | | (172 | ) | | | 17.77 |
| | | | | | | | | |
Balance at December 31, 2006 | | 2,623 | | | 4,188 | | | $ | 22.25 |
| | | | | | | | | |
As of December 31, 2006, only the cancellations under the 1999 Plan are recorded as available for grant. Based on a Board of Directors decision, cancellations under the 1991 and 1996 Plans are not considered available for grant.
The following table summarizes information about stock options outstanding and exercisable under all of the Company’s plans at December 31, 2006 (number of shares in thousands):
| | | | | | | | | | | | | | | | | | | | |
| | | Options Outstanding | | Options Vested and Exercisable |
Range of
exercise
prices: | | Number
of Shares | | Weighted
Average
Remaining
Contractual
Life (in years) | | Weighted
Average
Exercise
Price | | Aggregate
Intrinsic
Value
(in millions) | | Number
of Shares | | Weighted
Average
Remaining
Contractual
Life (in years) | | Weighted
Average
Exercise
Price | | Aggregate
Intrinsic
Value
(in millions) |
| $0.85-$6.00 | | 888 | | 5.13 | | $ | 2.60 | | $ | 33.51 | | 747 | | 4.65 | | $ | 2.78 | | $ | 28.04 |
| $7.00-$18.66 | | 1,045 | | 7.38 | | | 17.62 | | $ | 23.75 | | 335 | | 7.24 | | | 17.46 | | $ | 7.68 |
| $19.02-$30.60 | | 868 | | 9.16 | | | 27.98 | | $ | 10.73 | | 196 | | 8.80 | | | 28.02 | | $ | 2.41 |
| $31.51-$34.52 | | 1,001 | | 8.74 | | | 33.60 | | $ | 6.75 | | 255 | | 8.41 | | | 34.13 | | $ | 1.59 |
| $34.78-$40.19 | | 386 | | 8.47 | | | 37.62 | | $ | 1.05 | | 143 | | 8.11 | | | 38.28 | | $ | 0.30 |
| | | | | | | | | | | | | | | | | | | | |
| $0.85-$40.19 | | 4,188 | | 7.70 | | $ | 22.25 | | $ | 75.79 | | 1,676 | | 6.52 | | $ | 16.48 | | $ | 40.02 |
| | | | | | | | | | | | | | | | | | | | |
As of December 31, 2006, unvested options totaled 2,624,000.
F-24
TESSERA TECHNOLOGIES, INC.
NOTES TO CONSOLIDATED FINANCIAL STATEMENTS
(Continued)
Restricted Stock Awards
Information regarding Restricted Stock Awards as of December 31, 2006 is as follows:
| | | | | | |
| | | Number of
Shares | | | Weighted
average
grant-date
fair value |
Nonvested at December 31, 2005 | | 94 | | | $ | 35.47 |
Awards granted | | 331 | | | | 31.57 |
Awards vested | | (35 | ) | | | 32.33 |
Awards cancelled/forfeited | | (37 | ) | | | 32.20 |
| | | | | | |
Nonvested at December 31, 2006 | | 353 | | | $ | 32.46 |
| | | | | | |
Employee Stock Purchase Plan
In August 2003, the Company adopted the its 2003 ESPP and the Company’s stockholders approved the ESPP in September 2003. The ESPP is designed to allow eligible employees and the eligible employees of participating subsidiaries to purchase shares of common stock, at semi-annual intervals, with their accumulated payroll deductions.
The Company initially reserved 200,000 shares of our common stock for issuance under the ESPP. The reserve will automatically increase on the first day of each fiscal year during the term of the ESPP by an amount equal to the lesser of (1) 200,000 shares, (2) 1.0% of the Company’s outstanding shares on such date or (3) a lesser amount determined by the board of directors.
The ESPP will have a series of consecutive, overlapping 24-month offering periods. The first offering period commenced February 1, 2004, the effective date of the ESPP, as determined by the board of directors.
Individuals who own less than 5% of the Company’s voting stock and are scheduled to work more than 20 hours per week and whose customary employment is for more than five months in any calendar year may join an offering period on the first day of the offering period or the beginning of any semi-annual purchase period within that period. Individuals who become eligible employees after the start date of an offering period may join the ESPP at the beginning of any subsequent semi-annual purchase period.
Participants may contribute up to 20% of their cash earnings through payroll deductions, and the accumulated deductions will be applied to the purchase of shares on each semi-annual purchase date. The purchase price per share will be equal to 85% of the fair market value per share on the participant’s entry date into the offering period or, if lower, 85% of the fair market value per share on the semi-annual purchase date.
An eligible employee’s right to buy the Company’s common stock under the ESPP may not accrue at a rate in excess of $25,000 of the fair market value of such shares per calendar year for each calendar year of an offering period.
If the fair market value per share of the Company’s common stock on any purchase date is less than the fair market value per share on the start date of the two-year offering period, then that offering period will automatically terminate and a new 24-month offering period will begin on the next business day. All participants in the terminated offering will be transferred to the new offering period.
F-25
TESSERA TECHNOLOGIES, INC.
NOTES TO CONSOLIDATED FINANCIAL STATEMENTS
(Continued)
In the event of a proposed sale of all or substantially all of the Company’s assets, or merger with or into another company, the outstanding rights under the ESPP will be assumed or an equivalent right substituted by the successor company or its parent or subsidiary. If the successor company or its parent refuses to assume the outstanding rights or substitute an equivalent right, then all outstanding purchase rights will automatically be exercised prior to the effective date of the transaction. The purchase price will be equal to 85% of the market value per share on the participant’s entry date into the offering period in which an acquisition occurs or, if lower, 85% of the fair market value per share on the date the purchase rights are exercised.
The ESPP will terminate no later than the tenth anniversary of the ESPP’s initial adoption by the board of directors.
For the years ended December 31, 2006, 2005 and 2004, an aggregate of 73,000, 72,000 and 29,000 common shares, respectively, were purchased pursuant to the ESPP.
At December 31, 2006, there were 425,000 shares available for future issuance under the ESPP plan.
NOTE 10 – BENEFIT PLAN
In November 1995, the Company established a 401(k) Plan that allows voluntary contributions by all employees upon their hire date. Eligible employees may elect to contribute up to the maximum amount allowed under Internal Revenue Service regulations. The Company can make discretionary contribution under the 401(k) plan. During the years ended December 31, 2006, 2005 and 2004, the Company contributed approximately $273,000, $100,000 and $0, respectively, to the Plan. Related to the administration of the 401(k) plan, the Company recognized expenses of approximately $37,000, $35,000 and $35,000 during the years ended December 31, 2006, 2005 and 2004, respectively.
NOTE 11 – INCOME TAXES
The provision for (benefit from) taxes on earnings was as follows (in thousands):
| | | | | | | | | | |
| | | Years Ended December 31, | |
| | | 2006 | | 2005 | | 2004 | |
Federal: | | | | | | | | | | |
Current | | $ | 30,951 | | $ | — | | $ | 343 | |
Deferred | | | 652 | | | 11,694 | | | (19,119 | ) |
| | | | | | | | | | |
| | | 31,603 | | | 11,694 | | | (18,776 | ) |
State: | | | | | | | | | | |
Current | | | 7,337 | | | — | | | — | |
Deferred | | | 369 | | | 1,802 | | | (5,549 | ) |
| | | | | | | | | | |
| | | 7,706 | | | 1,802 | | | (5,549 | ) |
Foreign withholding tax | | | 4,557 | | | 4,116 | | | 1,731 | |
| | | | | | | | | | |
Total provision for (benefit from) income taxes | | $ | 43,866 | | $ | 17,612 | | $ | (22,594 | ) |
| | | | | | | | | | |
As of December 31, 2006, the Company had deferred tax assets of $17,826,000 which had a tax valuation allowance of $482,000. During 2006, the deferred tax assets decreased by approximately $40,958,000 to $17,826,000. The net deferred tax asset of $17,344,000 has been realized as a result of historic and current income, and prospects of future book income.
F-26
TESSERA TECHNOLOGIES, INC.
NOTES TO CONSOLIDATED FINANCIAL STATEMENTS
(Continued)
The provision for foreign taxes for the years ended December 31, 2006, 2005 and 2004 relate to foreign withholding taxes paid on royalty revenues earned in foreign jurisdictions. Also for the year ended December 31, 2006, 2005 and 2004, the Company accrued and paid $277,000, $67,000 and $0 of franchise taxes.
Deferred tax assets are related to the following (in thousands):
| | | | | | | | |
| | | December 31, | |
| | | 2006 | | | 2005 | |
Net operating loss carryforwards | | $ | 13,045 | | | $ | 46,516 | |
Credits | | | 623 | | | | 8,286 | |
Expenses not currently deductible | | | 3,734 | | | | 3,334 | |
Capitalized research and development costs | | | 424 | | | | 647 | |
| | | | | | | | |
Gross deferred tax assets | | | 17,826 | | | | 58,783 | |
Valuation allowance | | | (482 | ) | | | (47,611 | ) |
| | | | | | | | |
Net deferred tax assets | | $ | 17,344 | | | $ | 11,172 | |
| | | | | | | | |
A reconciliation of the statutory U.S. federal income tax rate to the Company’s effective rate is as follows:
| | | | | | | | | |
| | | December 31, | |
| | | 2006 | | | 2005 | | | 2004 | |
Tax at federal statutory rate | | 35.0 | % | | 35.0 | % | | 35.0 | % |
State, net of federal benefit | | 5.6 | % | | 5.8 | % | | 5.8 | % |
Stock-based compensation | | 1.6 | % | | 0.0 | % | | -18.3 | % |
True-up of prior year taxes and other | | 0.3 | % | | 0.3 | % | | 2.1 | % |
Foreign withholding tax | | 4.3 | % | | 8.4 | % | | 4.7 | % |
Credits | | -7.1 | % | | -1.36 | % | | -
4.3 |
% |
Foreign losses not benefited | | 1.9 | % | | 0.0 | % | | 0.0 | % |
Others | | -0.1 | % | | 0.0 | % | | -86.9 | % |
| | | | | | | | | |
Total | | 35.9 | % | | -62.0 | % | | 35.9 | % |
| | | | | | | | | |
As of December 31, 2006, the Company had federal net operating loss carryforwards of approximately $52,082,000 and state net operating loss carryforwards of approximately $23,442,000. All of the federal and state net operating loss carryforwards are related to stock option deductions. The principal difference between the federal and state net operating loss carryforwards is attributable to the capitalization of research and development costs for state purposes. These operating loss carryforwards begin to expire on various dates beginning in 2007, and will continue to expire through 2026. Under the provisions of the Internal Revenue Code, substantial changes in our ownership may limit the amount of net operating loss carryforwards that can be utilized annually in the future to offset taxable income.
In addition, the Company has tax credit carryforwards of approximately $24,026,000 for federal purposes and approximately $7,117,000 for state purposes. When realized, the benefit of these tax attributes will be a credit to additional paid in capital.
F-27
TESSERA TECHNOLOGIES, INC.
NOTES TO CONSOLIDATED FINANCIAL STATEMENTS
(Continued)
NOTE 12 – COMMITMENTS AND CONTINGENCIES
Lease Commitments
The Company leases its facility and office equipment under operating leases which expire through 2011. Rent expense for the years ended December 31, 2006, 2005 and 2004 amounted to $730,000, $368,000 and $437,000, respectively. As of December 31, 2006, future minimum lease payments are as follows (in thousands):
| | | |
2007 | | $ | 695 |
2008 | | | 693 |
2009 | | | 692 |
2010 | | | 690 |
2011 | | | 180 |
Thereafter | | | — |
| | | |
| | $ | 2,950 |
| | | |
Contingencies
Tessera, Inc. v. Advanced Micro Devices, Inc. et al., Civil Action No. 05-04063 (N.D. Cal),
On October 7, 2005, we filed a complaint for patent infringement against Advanced Micro Devices, Inc., or AMD, and Spansion LLC, or Spansion, in the United States District Court for the Northern District of California, alleging infringement of Tessera’s U.S. Patents 5,679,977, 5,852,326, 6,433,419 and 6,465,893 arising from AMD’s and Spansion’s respective manufacture, use, sale, offer to sell and/or importation of certain packaged semiconductor components and assemblies thereof. We seek to recover damages, up to treble the amount of actual damages, together with attorney’s fees, interest and costs. We also seek other relief, including enjoining AMD and Spansion from continuing to infringe these patents.
On December 16, 2005, we filed a first amended complaint to add Spansion Inc. and Spansion Technology, Inc. to the lawsuit. Spansion Inc. and Spansion Technology, Inc. are two new entities who were created by the initial public offering of Spansion in December 2005.
On January 31, 2006, we filed a second amended complaint to add claims of breach of contract and/or patent infringement against several new defendants, including Advanced Semiconductor Engineering, Inc. ASE (U.S.) Inc., ChipMOS Technologies, Inc., ChipMOS U.S.A., Inc., Siliconware Precision Industries Co. Ltd, Siliconware USA Inc., STMicroelectronics N.V., STMicroelectronics, Inc., STATS ChipPAC Ltd., STATS ChipPAC, Inc. and STATS ChipPAC Ltd. (BVI).
The defendants in this action have asserted affirmative defenses to our patent infringement claims, and some of them have brought related counterclaims alleging that the Tessera patents at issue are not infringed, invalid and unenforceable and/or that Tessera is not the owner of the patents. We cannot predict the outcome of this proceeding. Discovery is ongoing, and trial is currently set for January 28, 2008. An adverse decision in this proceeding could significantly harm our business and financial condition.
Tessera, Inc. v. Amkor Technology, Inc.
On March 2, 2006, we issued a request for arbitration with Amkor Technology, Inc., or Amkor, regarding Amkor’s failure to pay royalties under its license agreement with Tessera. On November 1, 2006, the arbitration tribunal issued a provisional timetable specifying a seven-day tribunal hearing starting October 1, 2007. We cannot predict the outcome of this proceeding. An adverse decision in this proceeding could significantly harm our business and financial condition.
F-28
TESSERA TECHNOLOGIES, INC.
NOTES TO CONSOLIDATED FINANCIAL STATEMENTS
(Continued)
Tessera, Inc. v. Hynix Semiconductor Inc. et. al, Case No. 106CV-076688
On December 18, 2006, we filed but did not serve a complaint against Hynix Semiconductor Inc. and Hynix Semiconductor America, Inc., (collectively, “Hynix”) in the Superior Court of the State of California, for the county of Santa Clara, alleging violations of California antitrust law and California common law based on Hynix’s alleged anticompetitive actions in markets related to synchronous DRAM. We also seek other relief, including enjoining Hynix from continuing their alleged anticompetitive actions. On February 7, 2007, we served the complaint on Hynix Semiconductor America, Inc. We have also initiated international service of process under the Hague Convention, which is in progress. This litigation is in its early stages, and we cannot predict the outcome of this proceeding. An adverse decision in this proceeding could significantly harm our business and financial condition.
Tessera, Inc. v. Micron Technology, Inc. et al, Civil Action No. 02-05cv-94 (E.D. Tex.)
In July 2006, the Company entered into definitive agreements to settle our lawsuit against Micron Technology, Inc. and its subsidiaries (collectively “Micron”) and against Infineon Technologies AG, or Infineon, and its subsidiaries including Qimonda AG, or Qimonda, in the U.S. District Court for the Eastern District of Texas. As initially filed on March 1, 2005, and subsequently amended, this lawsuit alleged Micron’s and Infineon’s infringement of Tessera’s U.S. Patents 5,852,326, 5,679,977, 6,433,419, 6,465,893 and 6,133,627; as well as Micron’s and Infineon’s violations of federal antitrust law, Texas antitrust law, and Texas common law. On July 20, 2006, Tessera and Micron entered into a Settlement Agreement and a TCC License Agreement that resolved all outstanding litigation between them. On July 31, 2006, Tessera, Infineon and Qimonda each entered into a Settlement Agreement and TCC License Agreements that resolved all outstanding litigation between them.
Micron Technology, Inc. et al. v. Tessera, Inc., Civil Action No. 02-05cv-319 (E.D. Tex.)
On July 20, 2006, Tessera and Micron entered into a Settlement Agreement and a TCC License Agreement that resolved all outstanding litigation between the companies, including this lawsuit, in which Micron alleged that Tessera infringed Micron’s U.S. Patent Nos. 5,739,585, 6,013,948, 6,268,649, 6,738,263, 5,107,328, 6,265,766, 4,992,849 and Re. 36,325.
Samsung Electronics Co. Ltd. v. Tessera, Inc., Civil Action No. 02-05837 CW (N.D. Cal.)
During the fiscal year ending December 31, 2004, the Company was involved in a lawsuit with Samsung Electronics Company and its subsidiaries (collectively “Samsung”) that was settled in November 2004 and finally dismissed in February 2005. This lawsuit involved several Samsung semiconductor chip packages and the Company’s U.S. Patent Nos 5,852,326, 5,679,977, 6,433,419, 6,465,893, 5,950,304 and 6,133,627. The terms of settlement, including a royalty-bearing license going forward, are set forth in a Settlement Agreement and a Restated License Agreement, both of which were executed on January 26, 2005.
NOTE 13 – SEGMENT AND GEOGRAPHIC INFORMATION
In 2006, the Company organized its business units into three operating divisions: the Licensing Business, the Product Division and Emerging Markets and the Technologies Group. These divisions are reported into segment, the Intellectual Property segment, which consists primarily of the Licensing Business and the Emerging Markets and Technologies groups, and the Services segment, which consists primarily of the Product Division. The Product Division incorporates operational functions that are reported in both Intellectual Property and Services segments. In addition to its reportable segments, Corporate Overhead, not a reportable segment,
F-29
TESSERA TECHNOLOGIES, INC.
NOTES TO CONSOLIDATED FINANCIAL STATEMENTS
(Continued)
includes certain operating expenses and credits that are not allocated to the operating segments because these operating expenses and credits are not considered in evaluating the operating performance of its business segments.
The Chief Operating Decision Maker (CODM), as defined by SFAS No. 131, “Disclosures About Segments of an Enterprise and Related Information (SFAS No. 131), is the Company’s President and Chief Executive Officer (CEO). The CODM assesses the performance of the operating segment using information about its revenue and operating income (loss) before other income and income taxes. The CODM is not presented financial information for each division and the CODM does not evaluate each division separately from the segments when evaluating the operating performance of the business.
For years prior to 2005, revenues were presented to management in the Intellectual Property and Services categories; however expenses were not allocated or presented to the CODM for these categories. It would be impractical to determine an allocation method for prior year expenses, therefore only revenues will be presented for these segments.
The Company does not identify or allocate assets by operating segment, nor does the CODM evaluate operating segments using discrete asset information. Operating segments do not record inter-segment revenue and accordingly there is none to report. The Company does not allocate other income and expense to operating segments. Although the CODM uses operating income to evaluate segments, operating costs included in one segment may benefit other segments.
The following table sets forth our segments revenue, operating expenses and operating income (loss) (in thousands):
| | | | | | | | | | | |
| | | Years Ended December 31, |
| | | 2006 | | | 2005 | | | 2004 |
Revenues: | | | | | | | | | | | |
Intellectual Property Segment | | $ | 182,763 | | | $ | 78,199 | | | $ | 59,622 |
Services Segment | | | 25,963 | | | | 16,501 | | | | 13,114 |
Corporate Overhead | | | — | | | | — | | | | — |
| | | | | | | | | | | |
Total revenues | | | 208,726 | | | | 94,700 | | | | 72,736 |
| | | | | | | | | | | |
Operating expenses: | | | | | | | | | | | |
Intellectual Property Segment | | | 52,427 | | | | 18,706 | | | | — |
Services Segment | | | 30,187 | | | | 14,710 | | | | — |
Corporate Overhead | | | 27,117 | | | | 15,711 | | | | — |
| | | | | | | | | | | |
Total operating expenses | | | 109,731 | | | | 49,127 | | | | — |
| | | | | | | | | | | |
Operating income (loss) | | | | | | | | | | | |
Intellectual Property Segment | | | 130,336 | | | | 59,493 | | | | — |
Services Segment | | | (4,224 | ) | | | 1,791 | | | | — |
Corporate Overhead | | | (27,117 | ) | | | (15,711 | ) | | | — |
| | | | | | | | | | | |
Total operating income | | $ | 98,995 | | | $ | 45,573 | | | $ | — |
| | | | | | | | | | | |
F-30
TESSERA TECHNOLOGIES, INC.
NOTES TO CONSOLIDATED FINANCIAL STATEMENTS
(Continued)
Geographic revenue information for the three years ended December 31, 2006, 2005 and 2004 is based upon the location of the headquarters of our customers (in thousands):
| | | | | | | | | |
| | | Year Ended December 31, |
| | | 2006 | | 2005 | | 2004 |
United States | | $ | 74,998 | | $ | 40,757 | | $ | 41,019 |
ASIA | | | 36,266 | | | 26,992 | | | 8,973 |
Europe | | | 66,332 | | | — | | | — |
Japan | | | 30,881 | | | 26,951 | | | 22,744 |
Other | | | 249 | | | — | | | — |
| | | | | | | | | |
| | $ | 208,726 | | $ | 94,700 | | $ | 72,736 |
| | | | | | | | | |
Revenues from unaffiliated customers outside the United Sates totaled $133,728 in 2006, $53,943 in 2005 and $31,717 in 2004.
Net property and equipment by country was as follows (in thousands):
| | | | | | | | | |
| | | December 31, |
| | | 2006 | | 2005 | | 2004 |
United States | | $ | 22,384 | | $ | 5,115 | | $ | 2,484 |
Israel | | | 2,321 | | | 3,636 | | | — |
| | | | | | | | | |
| | $ | 24,705 | | $ | 8,751 | | $ | 2,484 |
| | | | | | | | | |
NOTE 14 – RELATED PARTY TRANSACTIONS
On June 1, 1999, a member of the Board of Directors was engaged by the Company as a consultant, advising the Chief Executive Officer and other Company executives on business matters, for a period of three years for a monthly fee of $5,000. In connection with this contract, the Director was granted an option to purchase 226,666 and 82,000 shares of common stock in 1999 and 2001 with exercise prices of $1.50 and $2.10 per share, respectively. The Company has recognized $0, $0 and $48,000 of consulting expenses in 2006, 2005 and 2004, respectively. On May 19, 2004, the Director retired as a member of the Board of Directors.
On June 1, 2001, a member of the Company’s Board of Directors was engaged by the Company as a consultant to provide business development and strategic planning advice and assistance relating to government research and development contracts and semiconductor and wireless opportunities. In lieu of receiving any cash compensation for his consulting services, the Director was granted an option to purchase 324,000 shares of the Company’s common stock at an exercise price of $2.10 per share. These options vest over a period of three years. At each reporting date, the Company revalues the stock-based compensation expenses related to the unvested options using the Black-Scholes option-pricing model. At December 31, 2004, the option was fully vested. The Company has recognized $0, $0 and $93,000 of compensation expenses related to these options in 2006, 2005 and 2004, respectively.
F-31
TESSERA TECHNOLOGIES, INC.
NOTES TO CONSOLIDATED FINANCIAL STATEMENTS
(Continued)
In November 2005, the Company engaged an information technology consulting firm which is owned by one of the Company’s employees. For the years ended December 31, 2006 and 2005, the Company recognized $2,160,000 and $737,000 of consulting expenses, respectively, pursuant to this consulting arrangement. At December 31, 2006 and 2005, the Company had an outstanding payable balance of $45,000 and $119,000, respectively.
NOTE 15 – SUBSEQUENT EVENTS
In January 2007, Tessera Technologies Hungary Holding LLC, a wholly owned subsidiary of the Company entered into a Share Purchase Agreement with Eyesquad GmbH, a private limited liability company organized under the Laws of the Federal Republic of Germany (“Eyesquad”). The Purchase Agreement provides for the acquisition of all of the outstanding equity of Eyesquad for an aggregate purchase price of approximately $20 million, subject to certain adjustments. The purchased assets include approximately $2 million of cash existing on Eyesquad’s balance sheet, for a net enterprise value of approximately $18 million. This transaction closed in February 2007. The Share Purchase Agreement includes customary representations and warranties from Eyesquad regarding its business.
In January 2007, the Company entered into an Asset Purchase Agreement with North Corporation, a Japanese corporation, for approximately $2 million in cash for all assets. This transaction closed at the end of January 2007.
F-32