SECURITIES AND EXCHANGE COMMISSION
Washington, D.C. 20549
(Exact name of registrant as specified in charter)
(Address of principal executive offices) (Zip code)
(Name and address of agent for service)

INSTITUTIONAL CLASS (FARIX)
SUPER INSTITUTIONAL CLASS (FARYX)
SEMI ANNUAL REPORT TO SHAREHOLDERS
DECEMBER 31, 2019
Important Notice: The U.S. Securities and Exchange Commission will permit funds to make shareholder reports available electronically beginning January 1, 2021. Accordingly, paper copies will no longer be mailed. Instead, at that time, the Fulcrum Diversified Absolute Return Fund will send a notice, either by mail or e-mail, each time an updated report is available on the Fund’s website (www.fulcrumassetfunds.com). Investors enrolled in electronic delivery will receive the notices by e-mail, with links to the updated report and will not need to take any action. Investors who are not enrolled in electronic delivery by January 1, 2021 will receive the notices in the mail.
All investors who prefer to receive shareholder reports in a printed format may, at any time, choose that option free of charge. Contact your financial intermediary to make this election, or direct investors can call 1-855-538-5278.
TABLE OF CONTENTS
DISCUSSION OF FUND PERFORMANCE
FULCRUM DIVERSIFIED ABSOLUTE RETURN FUND
Market conditions/environment July 1st to December 31st 2019
The second half of 2019 was marked by weaker economic growth and ongoing global trade tensions, but strong asset class performance as central banks became increasingly dovish.
After markets began the year in a high state of anxiety about overly hawkish monetary policy, the US Federal Reserve quickly moved to a patient basis and then made their first interest rate cut of 0.25% at the end of July and followed with two more cuts by the end of the year. This dovish stance was reaffirmed in the last quarter with the central bank embracing a further tightening in the jobs market, implying a bias towards maintaining the easier policy even as growth picks up, inflation rises and unemployment falls. In Europe, the new head of European Central Bank (“ECB”) also reiterated similar arguments and called for greater fiscal stimulus. As a result, despite a softer growth outlook, global equities posted strong returns for the period (+9.54%)1, led by the US (+10.92%)2 posting its strongest year since 2013. In the final quarter, bonds gave back some of their gains from the powerful bond rally mid-way through the year, and still finished up (+2.9%)3 over the period.
Although markets were soothed by central banks’ action, uncertainties around US-China trade tension kept global manufacturing and investment under pressure. The conflict was heightened at the beginning of the period with Trump’s 10% tariffs threat on an additional $300B in Chinese goods, but de-escalated towards the end of the year with the phase one trade agreement.
Amidst the turbulent economic backdrop, geopolitical risks remained elevated through the last half of the year. The attack on Saudi Arabia’s oil and refining facilities, anti-government protests in South America and Hong Kong, and uncertainty around Brexit added volatility to markets. Whilst the UK election’s outcome at the end of the year cleared some of the fog surrounding Brexit and the economy, emerging market economies continued to face headwinds from political turbulences and destabilizing trade policies.
Fund Performance
From July 1, 2019 to December 31, 2019, Fulcrum Diversified Absolute Return Fund Institutional Class shares returned +2.89%. Gains were broad based across asset classes and strategies.
Within relative value strategies, fixed income had a challenging start to the period with the sharp reversal in major bond yields in September from their lows in August, but finished as a leading performer in the final quarter as inflation expectation rose and the yield curve steepened in the US. Commodities were also a strong contributor and especially precious metals, which form part of our defensive strategies theme. This theme seeks to identify bond-like assets with expected returns greater than bonds.
Elsewhere in relative value, currencies added to returns with strong gains from the UK pound as Brexit risks receded. Equity thematic strategies including Technology Disruption, Defensive and Global Financials also saw positive performance over the period.
Within macro directional equities, gains were driven by our allocation to Japan as well as North America thanks to positive signs for a phase one US-China trade deal, some of which were offset by losses from our Europe exposures – a key detractor to the period’s returns.
Other performance detractors were related to our idiosyncratic ideas, such as a stronger euro versus the US dollar and weaker US onshore oil and airline industries in our energy sector positions.
1: MSCI World Index measures the equity market performance of developed markets (Source: MSCI)
2: S&P 500 Index measures the US equity performance based on changes in the aggregate market value of 500 stocks representing all major industries (source: Bloomberg)
3: Barclays Global Aggregate Bond Index (USD Hedged): The Barclays Global Aggregate Index is a flagship measure of global investment grade debt from twenty-four local currency markets. This multi-currency benchmark includes treasury, government-related, corporate and securitized fixed-rate bonds from both developed and emerging markets issuers. (Source: Barclays)
Must be Preceded or Accompanied by a prospectus.
Opinions expressed are those of Fulcrum Asset Management and are subject to change, are not guaranteed and should not be considered investment advice.
Past performance does not guarantee future results. Investment performance reflects fee waivers in effect. In the absence of such waivers, total return would be reduced.
Mutual fund investing involves risk. Principal loss is possible. Absolute return strategies are not designed to outperform stocks and bonds during strong market rallies. Exposure to the commodities markets may subject the Fund to greater volatility than investments in traditional securities. The value of commodity-linked derivative investments may be affected by changes in overall market movements, commodity index volatility, changes in interest rates, or sectors affecting a particular industry or commodity, such as drought, floods, weather, embargoes, tariffs and international economic, political and regulatory developments. Derivatives involve special risks including correlation, counterparty, liquidity, operational, accounting and tax risks. These risks, in certain cases, may be greater than the risks presented by more traditional investments. The Fund may use leverage which may exaggerate the effect of any increase or decrease in the value of portfolio securities or the Net Asset Value of the Fund, and money borrowed will be subject to interest costs. The Fund invests in foreign securities which involve greater volatility and political, economic and currency risks and differences in accounting methods. These risks are greater in emerging markets. Investments in debt securities typically decrease in value when interest rates rise. This risk is usually greater for longer-term debt securities. Investment by the Fund in lower-rated and non-rated securities presents a greater risk of loss to principal and interest than higher-rated securities.
It is not possible to invest directly in an index.
Diversification does not assure a profit nor protect against loss in a declining market.
The Fulcrum Diversified Absolute Return Fund is distributed by Quasar Distributors, LLC.
Fulcrum Diversified Absolute Return Fund
December 31, 2019 (Unaudited)
As a shareholder of the Fund, you incur two types of costs: (1) transaction costs; and (2) ongoing costs, including management fees and other Fund expenses. This Example is intended to help you understand your ongoing costs (in dollars) of investing in the Fund and to compare these costs with the ongoing costs of investing in other mutual funds.
The Example is based on an investment of $1,000 invested at the beginning of the period and held for the entire period from July 1, 2019 to December 31, 2019 (the “period”).
Actual Expenses
The first line of the table below provides information about actual account values and actual expenses. You may use the information in this line, together with the amount you invested, to estimate the expenses you paid over the period. Simply divide your account value by $1,000 (for example, an $8,600 account value divided by $1,000 equals 8.6), then multiply the result by the number in the first line under the heading entitled “Expenses Paid During the Period” to estimate the expenses you paid on your account during the period.
Hypothetical Example for Comparison Purposes
The information in the table under the heading “Hypothetical Performance (5% return before expenses)” provides information about hypothetical account values and hypothetical expenses based on the Fund’s actual expense ratio and an assumed rate of return of 5% per year before expenses, which is not the Fund’s actual return. The hypothetical account values and expenses may not be used to estimate the actual ending account balance or expenses you paid for the period. You may use this information to compare the ongoing costs of investing in the Fund and other funds. To do so, compare this 5% hypothetical example with the 5% hypothetical examples that appear in the shareholder reports of the other funds.
Please note that the expenses shown in the table are meant to highlight your ongoing costs only and do not reflect any transaction costs, such as redemption fees. Therefore, the information under the heading “Hypothetical Performance (5% Return Before Expenses)” is useful in comparing ongoing costs only, and will not help you determine the relative total costs of owning different funds. In addition, if these transactional costs were included, your costs would have been higher.
Expenses Paid During the Period
| Beginning Account Value | Ending Account Value | Annualized Expense Ratio | Expenses Paid During the Period (1) | |
| Institutional Class | ||||
| Actual Fund Return | $1,000.00 | $1,028.90 | 1.12% | $5.73 |
| Hypothetical 5% Return | $1,000.00 | $1,019.49 | 1.12% | $5.70 |
| Super Institutional Class | ||||
| Actual Fund Return | $1,000.00 | $1,029.10 | 1.06% | $5.40 |
| Hypothetical 5% Return | $1,000.00 | $1,019.81 | 1.06% | $5.38 |
| (1) | Expenses are equal to the Fund’s annualized expense ratio as indicated, multiplied by the average account value over the period, multiplied by 184/366 (to reflect the “period”). |
Fulcrum Diversified Absolute Return Fund
Consolidated Allocation of Portfolio Holdings by Market Exposure of Cash settled instruments, Futures, and Options
December 31, 2019 (Unaudited)
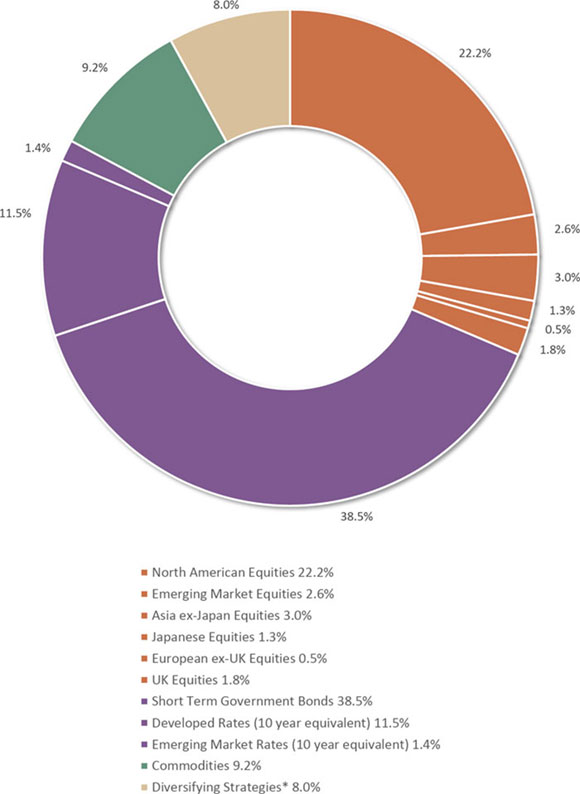
| * | Diversifying Strategies – are comprised of systematically implemented exposure using futures to various asset classes which are included for diversification purposes and could include equities, fixed income, currencies and commodities. |
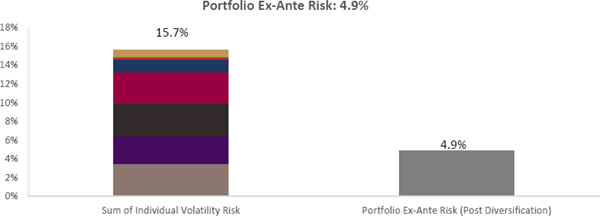
Fulcrum Diversified Absolute Return Fund
Consolidated Allocation of Portfolio Holdings by Risk Contribution
December 31, 2019 (Unaudited)
Individual Risk1 Exposure by Strategy
| Directional | 3.5 | % |
| Equities - North America | 2.2 | |
| Equities - Europe ex-UK | 0.5 | |
| Equities - Japan | 0.3 | |
| Equities - United Kingdom | 0.2 | |
| Real Asset | 0.2 | |
| Equities - Asia ex-Japan | 0.1 | |
| Relative Value - Currencies | 2.9 | % |
| UK Pound | 0.9 | |
| Euro | 0.8 | |
| CEEMEA Currencies | 0.3 | |
| Asian Currencies | 0.3 | |
| Scandinavian Currencies | 0.2 | |
| Canadian Dollar | 0.2 | |
| Australian Dollar | 0.2 | |
| LATAM Currencies | 0.2 | |
| Relative Value - Equities | 3.5 | % |
| Defensive | 1.0 | |
| Technology Disruption | 0.9 | |
| Idiosyncratic | 0.5 | |
| EM vs DM Equities | 0.5 | |
| Global Energy Sector | 0.3 | |
| Global Financials | 0.2 | |
| DM Equities Relative | 0.1 |
| Relative Value - Fixed Income | 3.3 | % |
| U.S. Inflation | 0.7 | |
| U.S. Curve Steepener | 0.5 | |
| U.K. Inflation | 0.5 | |
| Canada vs Europe 5 Year | 0.4 | |
| European Curve Flattener | 0.3 | |
| U.K. Curve Steepener | 0.2 | |
| China vs Australia 5 Year | 0.2 | |
| U.S. Rates | 0.2 | |
| Korea vs Australia 5 Year | 0.1 | |
| South African Rates | 0.1 | |
| Mexican Rates | 0.1 | |
| German Curve Steepener | 0.1 | |
| Commodities | 1.4 | % |
| Precious Metals | 1.0 | |
| Brent Oil Dec21 | 0.4 | |
| Volatility Strategies | 0.3 | % |
| Global Dispersion | 0.2 | |
| S&P Call Ratio | 0.1 | |
| Diversifying Strategies | 0.7 | % |
| Diversifying Strategies | 0.7 | |
| Sum of Individual Volatility Risk | 15.7 | %2 |
| 1 | Individual risk by asset class - is calculated by the current category weight in the portfolio multiplied by the standard deviation of portfolio holdings in that category. Data used is as of 12/31/2019. Standalone risk is measured for each category independently of other categories and does not take into account their potential offsetting effect. Therefore, the sum of standalone risk for all categories will exceed the risk of the entire portfolio. Standalone risk indicates to the investor the risk |
| 2 | Individual Risk percentages may not total to Sum of Individual Volatility Risk due to rounding. |
Fulcrum Diversified Absolute Return Fund
Consolidated Schedule of Investments
December 31, 2019 (Unaudited)
| FOREIGN GOVERNMENT NOTES/BONDS - 5.5% (1)(2) | Amount | Value | |||||||||||||||
| Italy Buoni Poliennali Del Tesoro | |||||||||||||||||
| 2.018%, 09/01/2049 | 4,790,000 | EUR | $ | 6,961,984 | |||||||||||||
| Republic of South Africa Government Bond | |||||||||||||||||
| 9.624%, 02/28/2035 | 48,680,000 | ZAR | 3,243,874 | ||||||||||||||
| TOTAL FOREIGN GOVERNMENT NOTES/BONDS (Cost $10,517,496) | 10,205,858 | ||||||||||||||||
| PURCHASED OPTIONS AND WARRANTS - 4.7% | Contracts | Notional | Value | ||||||||||||||
| Call Options Purchased - 0.2% | |||||||||||||||||
| Crude Oil Dec 21 Futures at $90, October 26, 2021 (3) | 30 | 1,743,300 | USD | 9,300 | |||||||||||||
| Crude Oil Dec 21 Futures at $100, October 26, 2021 (3) | 30 | 1,743,300 | USD | 4,200 | |||||||||||||
| E-mini S&P 500 at $3,260, January 31, 2020 | 85 | 13,731,750 | USD | 108,800 | |||||||||||||
| Nikkei 225 at 25,000, February 14, 2020 (1)(3) | 97 | 21,073,489 | JPY | 43,744 | |||||||||||||
| Silver Mar 20 Futures at $19.00, February 25, 2020 (3) | 123 | 11,021,415 | USD | 129,150 | |||||||||||||
| Total Call Options Purchased (Premiums Paid $419,454) | 295,194 | ||||||||||||||||
| Put Option Purchased - 0.1% | |||||||||||||||||
| CBOE Volatility Index (VIX) at $14, January 22, 2020 | 858 | 1,182,324 | USD | 81,510 | |||||||||||||
| E-mini S&P 500 at $3,050, January 17, 2020 | 82 | 13,247,100 | USD | 20,090 | |||||||||||||
| Nikkei 225 at 22,750, February 14, 2020 (1)(3) | 63 | 13,686,905 | JPY | 104,367 | |||||||||||||
| Total Put Option Purchased (Premiums Paid $346,469) | 205,967 | ||||||||||||||||
| Over-The-Counter Options Purchased - 0.2% | Counterparty a | ||||||||||||||||
| AUD Call / NZD Put at 1.080, Jaunary 7, 2020 | JPM | 23,420,000 | AUD | — | |||||||||||||
| CAD Put / NOK Call at 6.450, February 28, 2020 (4)(5) | JPM | 836,000 | CAD | 67,284 | |||||||||||||
| EUR Call / USD Put at 1.128, January 17, 2020 (5) | JPM | 477,000 | EUR | 174,608 | |||||||||||||
| EUR Put / USD Call at 1.050, February 28, 2020 (4)(5) | GS | 1,028,000 | EUR | 8,819 | |||||||||||||
| GBP/USD >= 1.330 and USD/ZAR >= 15.500, April 23, 2020 (6) | GS | 637,000 | USD | 22,629 | |||||||||||||
| GBP Call / USD Put at 1.345, January 24, 2020 | JPM | 24,317,000 | GBP | 94,635 | |||||||||||||
| GBP Call / USD Knock-in Put at 1.395, February 6, 2020 (5)(7) | JPM | 404,000 | GBP | 745 | |||||||||||||
| GBP Put / USD Call at 1.265, January 10, 2020 | JPM | 16,918,000 | GBP | 717 | |||||||||||||
| USD Call / ZAR Put at 15.1, January 6, 2020 | JPM | 8,468,000 | USD | 8 | |||||||||||||
| Total Over-The-Counter Options (Premiums Paid $889,247) | 369,445 | ||||||||||||||||
| Warrants - 4.2% | Counterparty a | Contracts | Notional | Value | |||||||||||||
| Euro STOXX 50 Index Dispersion Warrants (1)(8) | |||||||||||||||||
| Effective: 03/21/2019, Expiration: 03/20/2020, Strike: 16.05% | JPM | 7 | 700,000 | EUR | 830,670 | ||||||||||||
| Effective: 04/12/2019, Expiration: 12/18/2020, Strike: 16.41% | SG | 5,000 | 500,000 | EUR | 467,751 | ||||||||||||
| Effective: 10/10/2019, Expiration: 12/18/2020, Strike: 17.15% | CITI | 225 | 225,000 | EUR | 217,949 | ||||||||||||
| Effective: 10/02/2019, Expiration: 12/18/2020, Strike: 19.00% | HSBC | 350 | 350,000 | USD | 307,118 | ||||||||||||
| EURO STOXX Select Dividend 30 Index Warrant (1)(8) | |||||||||||||||||
| Effective: 07/10/2019, Expiration: 06/19/2020, Strike: 15.18% | UBS | 44 | 440,000 | EUR | 453,995 | ||||||||||||
| Multiple Markets Index Dispersion Warrants (9) | |||||||||||||||||
| Effective: 02/07/2019, Expiration: 03/19/2021 | BNP | 250 | 250,000 | USD | 247,555 | ||||||||||||
| Effective: 02/15/2019, Expiration: 12/18/2020 (1) | HSBC | 4,020 | 4,020,000 | EUR | 415,753 | ||||||||||||
| Effective: 03/06/2019, Expiration: 12/18/2020 | HSBC | 2,980 | 2,980,000 | USD | 262,955 | ||||||||||||
| Effective: 03/19/2019, Expiration: 03/19/2021 | BNP | 250 | 250,000 | USD | 248,923 | ||||||||||||
| NASDAQ 100 Stock Index Dispersion Warrants (8) | |||||||||||||||||
| Effective: 01/10/2019, Expiration: 01/17/2020, Strike: 22.64% | HSBC | 293 | 293,000 | USD | 284,190 | ||||||||||||
| Effective: 04/29/2019, Expiration: 06/19/2020, Strike: 18.10% | HSBC | 251 | 251,000 | USD | 210,059 | ||||||||||||
| S&P 500 Index Dispersion Warrants (8) | |||||||||||||||||
| Effective: 11/26/2018, Expiration: 01/17/2020, Strike: 18.86% | JPM | 9 | 900,000 | USD | 947,943 | ||||||||||||
| Effective: 12/13/2018, Expiration: 01/17/2020, Strike: 19.12% | JPM | 6 | 600,000 | USD | 616,990 | ||||||||||||
| Effective: 01/07/2019, Expiration: 01/17/2020, Strike: 19.05% | HSBC | 620 | 620,000 | USD | 634,756 | ||||||||||||
| Effective: 05/23/2019, Expiration: 06/19/2020, Strike: 16.94% | JPM | 8 | 800,000 | USD | 785,729 | ||||||||||||
| Effective: 08/20/2019, Expiration: 06/19/2020, Strike: 16.95% | JPM | 6 | 600,000 | USD | 549,770 | ||||||||||||
| Effective: 12/18/2019, Expiration: 01/15/2021, Strike: 17.31% | UBS | 27 | 270,000 | USD | 254,389 | ||||||||||||
| Total Warrants (Cost $8,024,054) | 7,736,495 | ||||||||||||||||
| TOTAL PURCHASED OPTIONS AND WARRANTS (Cost/Premiums Paid $9,679,224) | 8,607,101 | ||||||||||||||||
The accompanying notes are an integral part of these financial statements.
Fulcrum Diversified Absolute Return Fund
Consolidated Schedule of Investments
December 31, 2019 (Unaudited)
| SHORT-TERM INVESTMENTS - 44.2% | Principal Amount | Value | ||||||||
| United States Treasury Bills - 44.2% (2) | ||||||||||
| 1.860%, 02/13/2020 | 13,650,000 | USD | $ | 13,626,391 | ||||||
| 1.850%, 02/20/2020 | 13,800,000 | USD | 13,771,637 | |||||||
| 1.852%, 02/27/2020 | 15,000,000 | USD | 14,964,883 | |||||||
| 1.846%, 03/05/2020 | 13,000,000 | USD | 12,965,932 | |||||||
| 1.841%, 03/12/2020 | 13,400,000 | USD | 13,360,982 | |||||||
| 1.530%, 04/16/2020 | 12,750,000 | USD | 12,693,748 | |||||||
| Total United States Treasury Bills (Cost $81,343,551) | 81,383,573 | |||||||||
| TOTAL SHORT-TERM INVESTMENTS (Cost $81,343,551) | 81,383,573 | |||||||||
| UNITED STATES TREASURY BONDS - 15.8% | ||||||||||
| United States Treasury Inflation Indexed Bonds | ||||||||||
| 0.500%, 04/15/2024 | 23,019,547 | USD | 23,395,404 | |||||||
| 0.875%, 01/15/2029 | 5,269,161 | USD | 5,597,151 | |||||||
| TOTAL UNITED STATES TREASURY BONDS (Cost $28,811,942) | 28,992,555 | |||||||||
| Investments, at value (Cost $130,352,213) - 70.2% | 129,189,087 | |||||||||
| Other Assets in Excess of Liabilities - 29.8% | 54,913,067 | |||||||||
| TOTAL NET ASSETS - 100.0% | $ | 184,102,154 | ||||||||
| (1) | Foreign issued security. |
| (2) | Rate quoted is effective yield of position. |
| (3) | Position held in subsidiary. |
| (4) | One touch option - Option pays notional if spot rate meets strike at any point during the term of the option. |
| (5) | Binary option - Payoff is either notional amount or nothing. |
| (6) | Dual binary option - Option only pays if both terms are met at maturity. |
| (7) | Option includes a knock-in barrier at $1.305. The option can only be exercised if it trades at or below the level during market hours on or before expiration. |
| (8) | The payout of the dispersion warrants is calculated with the observed volatility of a weighted basket of component stocks of the respective Index relative to each stock’s assigned strike value in excess of the volatility of the respective Index relative to a strike volatility between the effective and expiration dates of |
| (9) | The payout of the Multiple Markets Dispersion Warrants is calculated with the observed volatility of a weighted basket of indices to an assigned strike volatility for each index during the observation period for the respective warrant. |
| a | Counterparty abbreviations |
BNP - BNP Paribas S.A.
CITI - Citigroup Global Markets
GS - Goldman Sachs
HSBC - HSBC Bank Plc
JPM - J.P. Morgan Investment Bank
MS - Morgan Stanley
SG - Societe Generale
UBS - UBS AG
The accompanying notes are an integral part of these financial statements.
Fulcrum Diversified Absolute Return Fund
Consolidated Schedule of Investments
December 31, 2019 (Unaudited)
| WRITTEN OPTIONS - (0.2%) | Contracts | Notional | Value | |||||||||||
| Call Option Written - (0.1%) | ||||||||||||||
| E-mini S&P 500 at $3,310, January 31, 2020 | (192 | ) | (31,017,600 | ) | USD | $ | (74,880 | ) | ||||||
| FTSE 100 Index at 7,800, February 21, 2020 (1)(2) | (215 | ) | (21,507,607 | ) | GBP | (79,741 | ) | |||||||
| Total Call Option Written (Premiums Received $171,378) | (154,621 | ) | ||||||||||||
| Put Option Written - (0.1%) | ||||||||||||||
| E-mini S&P 500 at $2,900, January 17, 2020 | (82 | ) | (13,247,100 | ) | USD | (7,380 | ) | |||||||
| CBOE Volatility Index (VIX) at $14, January 22, 2020 | (1,716 | ) | (2,364,648 | ) | USD | (51,480 | ) | |||||||
| FTSE 100 Index at 7,100, February 21, 2020 (1)(2) | (215 | ) | (21,507,607 | ) | GBP | (93,981 | ) | |||||||
| Total Put Option Written (Premiums Received $237,552) | (152,841 | ) | ||||||||||||
| TOTAL WRITTEN OPTIONS (Premiums Received $408,930) | $ | (307,462 | ) | |||||||||||
(1) Position held in subsidiary.
(2) Foreign issued security.
The accompanying notes are an integral part of these financial statements.
Fulcrum Diversified Absolute Return Fund
Consolidated Schedule of Investments
December 31, 2019 (Unaudited)
FORWARD CURRENCY CONTRACTS (1)
| Settlement Date | Currency Delivered | Pay Amount | USD Value December 31, 2019 | Currency Received | Receive Amount | USD Value December 31, 2019 | Unrealized Gain/(Loss) | |||||||||||
| 01/31/2020 | AUD | 3,146,000 | $ | 2,209,469 | USD | 2,167,199 | $ | 2,167,199 | $ | (42,270 | ) | |||||||
| 01/31/2020 | CAD | 8,472,273 | 6,525,479 | USD | 6,376,467 | 6,376,467 | (149,012 | ) | ||||||||||
| 01/31/2020 | EUR | 2,855,000 | 3,208,816 | GBP | 2,415,776 | 3,202,882 | (5,934 | ) | ||||||||||
| 01/31/2020 | EUR | 9,555,773 | 10,740,005 | NOK | 97,137,723 | 11,065,985 | 325,980 | |||||||||||
| 01/31/2020 | EUR | 9,718,929 | 10,923,380 | SEK | 102,261,126 | 10,934,837 | 11,457 | |||||||||||
| 01/31/2020 | EUR | 17,972,000 | 20,199,243 | USD | 20,041,549 | 20,041,549 | (157,694 | ) | ||||||||||
| 01/31/2020 | GBP | 16,498,000 | 21,873,360 | USD | 21,584,475 | 21,584,475 | (288,885 | ) | ||||||||||
| 01/31/2020 | JPY | 1,151,350,997 | 10,614,983 | USD | 10,591,667 | 10,591,667 | (23,316 | ) | ||||||||||
| 01/31/2020 | NOK | 29,079,281 | 3,312,728 | EUR | 2,851,000 | 3,204,320 | (108,408 | ) | ||||||||||
| 01/31/2020 | NOK | 23,932,185 | 2,726,368 | USD | 2,612,478 | 2,612,478 | (113,890 | ) | ||||||||||
| 01/31/2020 | NZD | 9,708,000 | 6,538,477 | USD | 6,375,396 | 6,375,396 | (163,081 | ) | ||||||||||
| 01/31/2020 | SEK | 102,650,281 | 10,976,450 | EUR | 9,718,929 | 10,923,381 | (53,069 | ) | ||||||||||
| 01/31/2020 | SEK | 14,517,391 | 1,552,353 | USD | 1,516,866 | 1,516,866 | (35,487 | ) | ||||||||||
| 01/31/2020 | USD | 8,456,763 | 8,456,763 | AUD | 12,332,000 | 8,660,894 | 204,131 | |||||||||||
| 01/31/2020 | USD | 18,635,075 | 18,635,075 | EUR | 16,772,345 | 18,850,916 | 215,841 | |||||||||||
| 01/31/2020 | USD | 34,355,617 | 34,355,617 | GBP | 26,178,000 | 34,707,287 | 351,670 | |||||||||||
| 01/31/2020 | USD | 10,598,414 | 10,598,414 | JPY | 1,151,350,997 | 10,614,983 | 16,569 | |||||||||||
| 01/31/2020 | USD | 820,000 | 820,000 | NOK | 7,304,304 | 832,110 | 12,110 | |||||||||||
| 01/31/2020 | USD | 2,130,000 | 2,130,000 | SEK | 20,081,504 | 2,147,326 | 17,326 | |||||||||||
| 03/18/2020 | BRL | 2,968,548 | 735,543 | USD | 705,067 | 705,067 | (30,476) | |||||||||||
| 03/18/2020 | CLP | 393,889,127 | 524,298 | USD | 503,703 | 503,703 | (20,595 | ) | ||||||||||
| 03/18/2020 | HUF | 620,694,164 | 2,111,882 | EUR | 1,870,976 | 2,109,000 | (2,882 | ) | ||||||||||
| 03/18/2020 | HUF | 629,062,510 | 2,140,354 | USD | 2,116,558 | 2,116,558 | (23,796 | ) | ||||||||||
| 03/18/2020 | IDR | 1,411,080,000 | 100,908 | USD | 100,000 | 100,000 | (908 | ) | ||||||||||
| 03/18/2020 | INR | 1,438,950 | 19,996 | USD | 20,000 | 20,000 | 4 | |||||||||||
| 03/18/2020 | KRW | 1,095,596,810 | 949,226 | USD | 921,760 | 921,760 | (27,466 | ) | ||||||||||
| 03/18/2020 | MXN | 41,078,486 | 2,147,448 | USD | 2,128,000 | 2,128,000 | (19,448 | ) | ||||||||||
| 03/18/2020 | PHP | 7,116,460 | 140,149 | USD | 140,000 | 140,000 | (149 | ) | ||||||||||
| 03/18/2020 | PLN | 192,933 | 50,863 | USD | 50,000 | 50,000 | (863 | ) | ||||||||||
| 03/18/2020 | RUB | 13,848,725 | 221,031 | USD | 220,000 | 220,000 | (1,031 | ) | ||||||||||
| 03/18/2020 | SGD | 108,723 | 80,900 | USD | 80,000 | 80,000 | (900 | ) | ||||||||||
| 03/18/2020 | THB | 288,249,321 | 9,641,010 | USD | 9,498,007 | 9,498,007 | (143,003 | ) | ||||||||||
| 03/18/2020 | TWD | 4,838,402 | 162,016 | USD | 160,000 | 160,000 | (2,016 | ) | ||||||||||
| 03/18/2020 | USD | 230,000 | 230,000 | BRL | 938,784 | 232,611 | 2,611 | |||||||||||
| 03/18/2020 | USD | 10,000 | 10,000 | CLP | 7,792,600 | 10,373 | 373 | |||||||||||
| 03/18/2020 | USD | 4,222,022 | 4,222,022 | CNH | 29,863,873 | 4,282,339 | 60,317 | |||||||||||
| 03/18/2020 | USD | 400,000 | 400,000 | HUF | 118,060,914 | 401,696 | 1,696 | |||||||||||
| 03/18/2020 | USD | 4,155,698 | 4,155,698 | IDR | 59,008,199,156 | 4,219,754 | 64,056 | |||||||||||
| 03/18/2020 | USD | 1,232,498 | 1,232,498 | INR | 88,916,776 | 1,235,587 | 3,089 | |||||||||||
| 03/18/2020 | USD | 390,000 | 390,000 | KRW | 454,543,401 | 393,817 | 3,817 | |||||||||||
| 03/18/2020 | USD | 5,314,055 | 5,314,055 | MXN | 104,502,084 | 5,463,024 | 148,969 | |||||||||||
| 03/18/2020 | USD | 4,164,541 | 4,164,541 | PHP | 212,878,514 | 4,192,337 | 27,796 | |||||||||||
| 03/18/2020 | USD | 1,296,263 | 1,296,263 | PLN | 4,979,080 | 1,312,649 | 16,386 | |||||||||||
| 03/18/2020 | USD | 1,218,950 | 1,218,950 | RUB | 78,968,679 | 1,260,373 | 41,423 | |||||||||||
| 03/18/2020 | USD | 1,730,993 | 1,730,993 | SGD | 2,348,318 | 1,747,369 | 16,376 | |||||||||||
| 03/18/2020 | USD | 5,039,064 | 5,039,064 | TWD | 152,224,329 | 5,097,286 | 58,222 | |||||||||||
| 03/18/2020 | USD | 340,000 | 340,000 | ZAR | 4,904,715 | 346,588 | 6,588 | |||||||||||
| 03/18/2020 | ZAR | 104,375,477 | 7,375,608 | USD | 7,050,667 | 7,050,667 | (324,941 | ) | ||||||||||
| $ | (132,713 | ) | ||||||||||||||||
(1) J.P. Morgan Securities, Inc. is the counterparty to all contracts
The accompanying notes are an integral part of these financial statements.
Fulcrum Diversified Absolute Return Fund
Consolidated Schedule of Investments
December 31, 2019 (Unaudited)
FUTURES CONTRACTS
| Description | Number of Contracts Long (Short) | Expiration Date | Notional Amount | Unrealized Gain/(Loss) | |||||||||
| Amsterdam Exchanges Index | 8 | January 2020 | 967,408 | EUR | $ | (4,713 | ) | ||||||
| Australia SPI 200 Index | 35 | March 2020 | 5,777,625 | AUD | (129,307 | ) | |||||||
| Australian 3 Year Government Bond | 46 | March 2020 | 5,290,629 | AUD | (19,893 | ) | |||||||
| Australian 10 Year Government Bond | 10 | March 2020 | 1,429,581 | AUD | (13,330 | ) | |||||||
| Australian Dollar | (17) | March 2020 | (1,196,460 | ) | USD | (21,588 | ) | ||||||
| * | Brent Crude | 3 | January 2020 | 198,000 | USD | 3,214 | |||||||
| * | Brent Crude | 74 | December 2021 | 4,300,140 | USD | (102,407 | ) | ||||||
| British Pound | 16 | March 2020 | 1,329,200 | USD | 7,349 | ||||||||
| CAC 40 Index | 36 | January 2020 | 2,149,200 | EUR | 1,946 | ||||||||
| Canadian 10 Year Government Bond | 7 | March 2020 | 962,360 | CAD | (13,784 | ) | |||||||
| Canadian Dollar | 12 | March 2020 | 925,020 | USD | 11,723 | ||||||||
| * | Canola | (73) | March 2020 | (698,026 | ) | CAD | (4,585 | ) | |||||
| CBOE Volatility Index | (3) | January 2020 | (43,875 | ) | USD | 388 | |||||||
| * | Cocoa | 13 | March 2020 | 330,200 | USD | (5,241 | ) | ||||||
| * | Coffee ‘C’ | 2 | March 2020 | 97,275 | USD | 519 | |||||||
| * | Copper | 1 | March 2020 | 69,925 | USD | (715 | ) | ||||||
| * | Corn | (17) | March 2020 | (329,588 | ) | USD | (6,244 | ) | |||||
| * | Cotton No. 2 | (14) | March 2020 | (483,350 | ) | USD | (23,901 | ) | |||||
| * | Crude Oil | 1 | February 2020 | 61,060 | USD | 948 | |||||||
| DAX Index | 5 | March 2020 | 1,655,813 | EUR | (7,248 | ) | |||||||
| E-mini Dow | 6 | March 2020 | 855,240 | USD | 5,269 | ||||||||
| E-mini Russell 2000 Index | 7 | March 2020 | 584,710 | USD | 3,599 | ||||||||
| E-mini S&P 500 | 161 | March 2020 | 26,010,355 | USD | 265,743 | ||||||||
| Euro FX Currency | (51) | March 2020 | (7,192,275 | ) | USD | (53,814 | ) | ||||||
| Euro STOXX 50 Index | (224) | March 2020 | (8,352,960 | ) | EUR | 20,016 | |||||||
| Euro STOXX 50 Volatility Index | (26) | January 2020 | (37,310 | ) | EUR | (2,534 | ) | ||||||
| Euro-BTP Italian Government Bond | (107) | March 2020 | (15,243,220 | ) | EUR | (87,741 | ) | ||||||
| Euro-Bund | (58) | March 2020 | (9,888,420 | ) | EUR | 29,879 | |||||||
| Euro-BUXL 30 Year Bond | (22) | March 2020 | (4,364,360 | ) | EUR | 151,764 | |||||||
| Euro-OAT | 6 | March 2020 | 976,620 | EUR | (10,035 | ) | |||||||
| * | European Emission Allowances | 6 | December 2020 | 147,840 | EUR | (1,351 | ) | ||||||
| * | Feeder Cattle | (3) | March 2020 | (216,338 | ) | USD | (1,937 | ) | |||||
| FTSE 100 Index | 32 | March 2020 | 2,399,680 | GBP | 10,189 | ||||||||
| FTSE 250 Index | 23 | March 2020 | 1,007,400 | GBP | 18,238 | ||||||||
| FTSE/JSE TOP 40 Index | (1) | March 2020 | (513,600 | ) | ZAR | 262 | |||||||
| FTSE/MIB Index | 6 | March 2020 | 702,300 | EUR | (5,740 | ) | |||||||
| * | Gold 100 oz | 19 | February 2020 | 2,893,890 | USD | 111,150 | |||||||
| Hang Seng China Enterprises Index | 51 | January 2020 | 28,588,050 | HKD | 41,165 | ||||||||
| Hang Seng Index | 4 | January 2020 | 5,654,000 | HKD | 7,217 | ||||||||
| * | Hard Red Winter Wheat | (1) | March 2020 | (24,300 | ) | USD | (2,792 | ) | |||||
| IBEX 35 Index | 9 | January 2020 | 857,547 | EUR | (4,831 | ) | |||||||
| Japanese Yen | (8) | March 2020 | (924,550 | ) | USD | (5,140 | ) | ||||||
| Korea Stock Exchange KOSPI 200 Index | 5 | March 2020 | 369,000,000 | KRW | 15,448 | ||||||||
| * | Lean Hogs | (11) | February 2020 | (314,270 | ) | USD | (168 | ) | |||||
| * | Live Cattle | 6 | February 2020 | 302,220 | USD | 2,212 | |||||||
| * | London Metal Exchange Copper | 1 | January 2020 | 153,963 | USD | 2,210 | |||||||
| * | London Metal Exchange Copper | (1) | January 2020 | (153,963 | ) | USD | (6,590 | ) | |||||
| * | London Metal Exchange Copper | 1 | February 2020 | 154,213 | USD | 1,441 | |||||||
| * | London Metal Exchange Copper | (1) | February 2020 | (154,213 | ) | USD | (2,265 | ) | |||||
| * | London Metal Exchange Lead | 4 | January 2020 | 191,700 | USD | (18,887 | ) | ||||||
| * | London Metal Exchange Lead | (4) | January 2020 | (191,700 | ) | USD | 5,901 | ||||||
| * | London Metal Exchange Lead | (4) | February 2020 | (192,575 | ) | USD | (2,224 | ) | |||||
The accompanying notes are an integral part of these financial statements.
Fulcrum Diversified Absolute Return Fund
Consolidated Schedule of Investments
December 31, 2019 (Unaudited)
FUTURES CONTRACTS (Continued)
| Description | Number of Contracts Long (Short) | Expiration Date | Notional Amount | Unrealized Gain/(Loss) | |||||||||
| * | London Metal Exchange Nickel | 2 | January 2020 | 167,616 | USD | $ | (20,490) | ||||||
| * | London Metal Exchange Nickel | (2) | January 2020 | (167,616) | USD | (10,416) | |||||||
| * | London Metal Exchange Nickel | 1 | February 2020 | 84,000 | USD | 5,241 | |||||||
| * | London Metal Exchange Nickel | (1) | February 2020 | (84,000) | USD | (1,353) | |||||||
| * | London Metal Exchange Primary Aluminum | 10 | January 2020 | 447,313 | USD | 11,177 | |||||||
| * | London Metal Exchange Primary Aluminum | (10) | January 2020 | (447,313) | USD | (1,336) | |||||||
| * | London Metal Exchange Primary Aluminum | 2 | February 2020 | 90,050 | USD | 375 | |||||||
| * | London Metal Exchange Primary Aluminum | (10) | February 2020 | (450,250) | USD | (12,811) | |||||||
| * | London Metal Exchange Tin | 4 | January 2020 | 343,960 | USD | (3,652) | |||||||
| * | London Metal Exchange Tin | (4) | January 2020 | (343,960) | USD | (14,167) | |||||||
| * | London Metal Exchange Tin | (4) | February 2020 | (343,760) | USD | 3,418 | |||||||
| * | London Metal Exchange Zinc | 4 | January 2020 | 228,100 | USD | 6,088 | |||||||
| * | London Metal Exchange Zinc | (4) | January 2020 | (228,100) | USD | 3,871 | |||||||
| * | London Metal Exchange Zinc | 1 | February 2020 | 56,944 | USD | (1,097) | |||||||
| * | London Metal Exchange Zinc | (6) | February 2020 | (341,663) | USD | (7,052) | |||||||
| Long Gilt | 5 | March 2020 | 656,900 | GBP | (14,578) | ||||||||
| * | Low Sulphur Gas Oil | 1 | February 2020 | 61,375 | USD | 173 | |||||||
| Mexican Peso | 54 | March 2020 | 1,414,530 | USD | 13,872 | ||||||||
| * | Milling Wheat No. 2 | 6 | March 2020 | 56,625 | EUR | 215 | |||||||
| MSCI Emerging Markets Index | 85 | March 2020 | 4,760,850 | USD | 59,725 | ||||||||
| MSCI Taiwan Stock Index | 9 | January 2020 | 413,640 | USD | (1,389) | ||||||||
| MSCI World Index | (42) | March 2020 | (2,908,500) | USD | (18,529) | ||||||||
| NASDAQ 100 E-mini | 1 | March 2020 | 175,045 | USD | 2,593 | ||||||||
| * | Natural Gas | (6) | February 2020 | (131,340) | USD | 4,743 | |||||||
| New Zealand Dollar | 9 | March 2020 | 607,500 | USD | 7,343 | ||||||||
| Nikkei 225 Mini | 44 | March 2020 | 514,250,000 | JPY | (2,164) | ||||||||
| * | NY Harbor ULSD | 1 | January 2020 | 84,958 | USD | (2) | |||||||
| OMX 30 Index | 46 | January 2020 | 8,133,950 | SEK | (11,353) | ||||||||
| * | Palladium | 1 | March 2020 | 190,930 | USD | 23,317 | |||||||
| * | Platinum | 74 | April 2020 | 3,617,860 | USD | 157,720 | |||||||
| * | RBOB Gasoline | 2 | February 2020 | 142,002 | USD | 1,010 | |||||||
| * | Red Spring Wheat | (6) | March 2020 | (168,300) | USD | (9,316) | |||||||
| * | Robusta Coffee | (12) | March 2020 | (165,840) | USD | 7,145 | |||||||
| S&P/Toronto Stock Exchange 60 Index | 18 | March 2020 | 3,644,640 | CAD | (7,868) | ||||||||
| SGX MSCI Singapore Index | 24 | January 2020 | 891,600 | SGD | (562) | ||||||||
| * | SGX TSI Iron Ore | 24 | February 2020 | 217,200 | USD | (1,067) | |||||||
| Short-Term Euro-BTP | 9 | March 2020 | 1,011,870 | EUR | 3,018 | ||||||||
| * | Silver | 51 | March 2020 | 4,569,855 | USD | 216,072 | |||||||
| * | Soybean | (6) | March 2020 | (286,650) | USD | (13,225) | |||||||
| * | Soybean Meal | (8) | March 2020 | (243,760) | USD | (2,273) | |||||||
| * | Soybean Oil | 8 | March 2020 | 166,896 | USD | 7,329 | |||||||
| * | Sugar No. 11 | 3 | March 2020 | 45,091 | USD | (278) | |||||||
| * | TTF Natural Gas | (10) | February 2020 | (83,875) | EUR | 16,151 | |||||||
| U.S. 5 Year Treasury Note | 353 | March 2020 | 41,869,109 | USD | (80,633) | ||||||||
| U.S. 10 Year Treasury Note | 4 | March 2020 | 562,813 | USD | (8,638) | ||||||||
| U.S. Treasury Long Bond | 3 | March 2020 | 467,719 | USD | (12,099) | ||||||||
| * | UK Natural Gas | (10) | February 2020 | (90,103) | GBP | 24,840 | |||||||
| Ultra T-Bond | 2 | March 2020 | 363,313 | USD | (14,441) | ||||||||
| * | Wheat | 2 | March 2020 | 55,875 | USD | 1,919 | |||||||
| * | White Sugar | 3 | March 2020 | 53,880 | USD | (216) | |||||||
| $ | 465,135 |
* Position held in Subsidiary
The accompanying notes are an integral part of these financial statements.
Fulcrum Diversified Absolute Return Fund
Consolidated Schedule of Investments
December 31, 2019 (Unaudited)
INTEREST RATE SWAPS *
| Rate paid 1 | Rate received 1 | Payment Frequency | Effective Date | Termination Date | Notional Amount | Value | Premium Paid (Received) | Unrealized Gain/(Loss) | ||||||||||||||
| 0.970% | AUD-BBR-BBSW 1.033% | 6 Month | 3/18/2020 | 3/18/2025 | 9,660,228 | AUD | $ | 77,076 | $ | (915) | $ | 77,991 | ||||||||||
| CAD-BA-CDOR 2.050% | 1.810% | 6 Month | 3/18/2020 | 3/18/2025 | 29,016,563 | CAD | (265,778) | 18,737 | (284,515) | |||||||||||||
| CNY-CNREPOFIX 2.987% | 3.010% | 3 Month | 3/18/2020 | 3/18/2025 | 120,863,800 | CNY | 38,487 | — | 38,487 | |||||||||||||
| GBP-LIBOR-BBA 0.880% | 0.900% | 6 Month | 6/26/2020 | 6/26/2025 | 49,535,864 | GBP | 77 | 369,261 | (369,184) | |||||||||||||
| 1.051% | GBP-LIBOR-BBA 0.880% | 6 Month | 6/26/2020 | 6/26/2030 | 25,668,139 | GBP | (44,291) | (172,719) | 128,428 | |||||||||||||
| HKD-HIBOR-HKAB 2.430% | 1.830% | 3 Month | 3/18/2020 | 3/18/2023 | 16,700,000 | HKD | (8,580) | 782 | (9,362) | |||||||||||||
| HUF-BUBOR-Reuters 0.210% | 0.480% | 6 Month | 3/18/2020 | 3/18/2023 | 1,535,600,000 | HUF | (101,009) | — | (101,009) | |||||||||||||
| HUF-BUBOR-Reuters 0.210% | 1.260% | 6 Month | 3/18/2020 | 3/18/2030 | 265,900,000 | HUF | (29,817) | — | (29,817) | |||||||||||||
| MXN-TIIE-Banxico 7.555% | 6.610% | Monthly | 3/18/2020 | 3/12/2025 | 241,400,000 | MXN | 16,896 | — | 16,896 | |||||||||||||
| 6.893% | MXN-TIIE-Banxico 7.555% | Monthly | 3/18/2020 | 3/6/2030 | 145,393,100 | MXN | (55,243) | (47,082) | (8,161) | |||||||||||||
| NZD-BBR-FRA 1.000% | 1.150% | 3 Month | 3/18/2020 | 3/18/2023 | 6,400,000 | NZD | (22,751) | 2,358 | (25,109) | |||||||||||||
| PLN-WIBOR-WIBO 1.690% | 1.660% | 6 Month | 3/18/2020 | 3/18/2023 | 24,200,000 | PLN | (17,152) | 1,041 | (18,193) | |||||||||||||
| PLN-WIBOR-WIBO 1.690% | 1.730% | 6 Month | 3/18/2020 | 3/18/2030 | 4,500,000 | PLN | (15,507) | 587 | (16,094) | |||||||||||||
| SGD-SOR-VWAP 1.489% | 1.390% | 6 Month | 3/18/2020 | 3/18/2023 | 9,400,000 | SGD | (6,506) | (2,665) | (3,841) | |||||||||||||
| SGD-SOR-VWAP 1.489% | 1.660% | 6 Month | 3/18/2020 | 3/18/2030 | 2,000,000 | SGD | (7,838) | — | (7,838) | |||||||||||||
| USD-LIBOR-BBA 1.908% | 1.510% | 3 Month | 3/18/2020 | 3/18/2023 | 2,700,000 | USD | (12,196) | 459 | (12,655) | |||||||||||||
| USD-LIBOR-BBA 1.908% | 1.530% | 3 Month | 3/18/2020 | 3/18/2025 | 64,472,700 | USD | (612,620) | (77,737) | (534,883) | |||||||||||||
| 1.660% | USD-LIBOR-BBA 1.908% | 3 Month | 8/27/2024 | 8/27/2029 | 48,942,300 | USD | 845,641 | 133,285 | 712,356 | |||||||||||||
| 1.927% | USD-LIBOR-BBA 1.908% | 3 Month | 12/10/2024 | 12/10/2029 | 24,550,700 | USD | 152,629 | 586 | 152,043 | |||||||||||||
| ZAR-JIBAR-SAFEX 6.800% | 6.810% | 3 Month | 3/18/2020 | 3/18/2022 | 400,433,100 | ZAR | 123,078 | 14,018 | 109,060 | |||||||||||||
| 7.270% | ZAR-JIBAR-SAFEX 6.800% | 3 Month | 3/18/2020 | 3/18/2025 | 169,159,400 | ZAR | (142,888) | (9,305) | (133,583) | |||||||||||||
| Total of Interest Rate Swaps | $ | (88,292) | $ | 230,691 | $ | (318,983) |
INFLATION SWAPS *
| Rate paid 1 | Rate received 1 | Payment Frequency | Effective Date | Termination Date | Notional Amount | Value | Premium Paid (Received) | Unrealized Gain/(Loss) | ||||||||||||||
| UK RPI | 3.470% | At maturity | 11/15/2018 | 11/15/2023 | 23,006,805 | GBP | 754,968 | (8,319) | 763,287 | |||||||||||||
| 1.980% | US CPI U | At maturity | 7/15/2019 | 7/15/2029 | 8,179,000 | USD | (14,730) | — | (14,730) | |||||||||||||
| 1.696% | US CPI U | At maturity | 8/8/2019 | 8/8/2024 | 15,804,270 | USD | 121,349 | (5,488) | 126,837 | |||||||||||||
| 1.802% | US CPI U | At maturity | 6/10/2019 | 6/10/2024 | 21,276,888 | USD | 69,478 | — | 69,478 | |||||||||||||
| UK RPI | 3.515% | At maturity | 4/15/2019 | 4/15/2024 | 3,899,300 | GBP | 91,781 | (45,705) | 137,486 | |||||||||||||
| US CPI U | 1.998% | At maturity | 3/26/2019 | 3/26/2024 | 10,254,932 | USD | (44,603) | (70,231) | 25,628 | |||||||||||||
| Total of Inflation Swaps | $ | 978,243 | $ | (129,743) | $ | 1,107,986 |
CREDIT DEFAULT SWAPS *
| Reference Entity | Buy/Sell Protection | Rate Paid/ (Received) by the | Termination Date | Notional Amount | Value | Premium Paid (Received) | Unrealized Gain/(Loss) | |||||||||||||
| Markit iTraxx Europe Crossover Index | Sell | 5.00% | 12/20/2024 | 800,000 | EUR | 123,744 | 109,844 | 13,900 | ||||||||||||
| Markit iTraxx Europe Index | Sell | 1.00% | 12/20/2024 | 3,200,000 | EUR | 100,878 | 80,299 | 20,579 | ||||||||||||
| Markit CDX North America High Yield Index | Sell | 5.00% | 12/20/2024 | 990,000 | USD | 96,094 | 69,010 | 27,084 | ||||||||||||
| Markit CDX Emerging Markets Index | Sell | 1.00% | 12/20/2024 | 1,300,000 | USD | (43,257) | (55,718) | 12,461 | ||||||||||||
| Markit CDX North American Investment Grade Index | Sell | 1.00% | 12/20/2024 | 3,400,000 | USD | 89,304 | 66,382 | 22,922 | ||||||||||||
| Total of Credit Default Swaps | $ | 366,763 | $ | 269,817 | $ | 96,946 |
The accompanying notes are an integral part of these financial statements.
Fulcrum Diversified Absolute Return Fund
Consolidated Schedule of Investments
December 31, 2019 (Unaudited)
* Counterparty is J.P. Morgan Investment Bank
1 Floating rate definitions
AUD-BBR-BBSW - Australian Bank Bill Swap Rate
CAD-BA-CDOR - Canada 3 Month Interbank Rate
CNY-CNREPOFIX - China Foreign Exchange Trade System 7 day Interbank Repo Fixing Rate
GBP-LIBOR-BBA - British Pound Sterling - London Inter-Bank Offered Rate
HKD-HIBOR-HKAB - Hong Kong Inter-Bank Offered Rate
HUF-BUBOR-Reuters - Budapest Inter-Bank Offered Rate
MXN-TIIE-Banxico - Mexico 28 Day Interbank Equilibrium Interest Rate (TIIE)
NZD-BBR-FRA - New Zealand Official Cash Rate
PLN-WIBOR-WIBO - Offered rate for deposits in Polish Zloty
SGD-SOR-VWAP - Singapore Dollar Swap Offer Rate Volume Weighted Average Price
UK RPI - United Kingdom Retail Price Index
US CPI U - U.S. Consumer Price Index for Urban Consumers
USD-LIBOR-BBA - U.S. Dollar - London Inter-Bank Offered Rate
ZAR-JIBAR-SAFEX - Johannesburg Interbank Average Rate
| AUD - Australian Dollar | KRW - South-Korean Won |
| BRL - Brazilian Real | MXN - Mexican Peso |
| CAD - Canadian Dollar | NOK - Norwegian Kroner |
| CHF - Swiss Franc | NZD - New Zealand Dollar |
| CLP - Chilean Peso | PHP - Philippine Peso |
| CNH/CNY - Chinese Yuan | PLN - Polish Zloty |
| EUR - Euro | RUB - Russian Ruble |
| GBP - British Pound | SEK - Swedish Krona |
| HKD - Hong Kong Dollar | SGD - Singapore Dollar |
| HUF - Hungarian Forint | THB - Thai Baht |
| IDR - Indonesian Rupiah | TWD - Taiwan Dollar |
| INR - Indian Rupee | USD - US Dollar |
| JPY - Japanese Yen | ZAR - South African Rand |
The accompanying notes are an integral part of these financial statements.
Fulcrum Diversified Absolute Return Fund
Consolidated Schedule of Investments
December 31, 2019 (Unaudited)
TOTAL RETURN SWAPS *
| Reference Entity | Counterparty a | Rate Paid/Received b | Payment Frequency | Termination Date | Notional Amount | Unrealized Gain/(Loss) | |||||||||
| 1 AS51BANX Index | GS | AUD BBSW 1M + 0.10% (0.970%) | monthly | 04/16/2020 | (1,658,029) | AUD | $ | 8,592 | |||||||
| 2 BCIISHAL Index | B | USD LIBOR 1M - 0.25% (1.513%) | monthly | 10/14/2020 | (857,704) | USD | (159,850) | ||||||||
| Cosan SA | MS | BRL CDI + 1.50% (5.900%) | monthly | 09/16/2021 | 135,332 | BRL | (57) | ||||||||
| 3 GSCBFABA Index | GS | AUD BBSW 3M + 0.10% (1.020%) | monthly | 10/07/2022 | (1,409,632) | AUD | 9,965 | ||||||||
| 4 GSCBFACT Index | GS | USD LIBOR 1M - 0.40% (1.363%) | monthly | 08/09/2022 | (1,520,311) | USD | (4,730) | ||||||||
| 5 GSCBFERU Index | GS | EURIBOR 1M - 0.36% (-0.798%) | monthly | 04/04/2022 | (1,591,764) | EUR | 10,577 | ||||||||
| 6 GSCBFGOR Index | GS | USD LIBOR 1M + 0.45% (2.213%) | monthly | 10/31/2022 | 2,048,345 | USD | 78,001 | ||||||||
| 7 GSCBFLPM Index | GS | USD LIBOR 1M - 0.20% (1.563%) | monthly | 06/27/2022 | (1,200,506) | USD | 5,635 | ||||||||
| 8 GSGLFEXC Index | GS | USD LIBOR 1M + 0.40% (2.163%) | monthly | 08/09/2022 | 1,105,046 | USD | 6,985 | ||||||||
| 9 GSGLFPAY Index | GS | USD LIBOR 1M + 0.40% (2.163%) | monthly | 06/21/2022 | 1,082,648 | USD | 5,362 | ||||||||
| 10 JPEBCSMI Index | JPM | CHF LIBOR 1M + 0.30% (-0.481%) | monthly | 07/23/2020 | 1,690,390 | CHF | (18,941) | ||||||||
| 11 JPFCITSV Index | JPM | USD LIBOR 1M - 0.35% (1.413%) | monthly | 06/10/2020 | (2,577,584) | USD | 5,020 | ||||||||
| 12 JPFUAIR Index | JPM | USD LIBOR 1M - 1.05% (0.713%) | monthly | 07/07/2020 | (3,012,390) | USD | (11,251) | ||||||||
| 13 JPFUEOIL Index | JPM | EURIBOR 1M + 0.30% (-0.138%) | monthly | 09/09/2020 | 2,628,870 | EUR | (3,682) | ||||||||
| 14 JPFUMEDA Index | JPM | USD LIBOR 1M + 0.40% (2.163%) | monthly | 08/13/2020 | 1,271,690 | USD | (1,781) | ||||||||
| 15 JPFUOMED Index | JPM | USD LIBOR 1M - 0.50% (1.263%) | monthly | 08/13/2020 | (2,192,168) | USD | — | ||||||||
| 16 JPFUREGU Index | JPM | USD LIBOR 1M - 0.40% (1.363%) | monthly | 07/30/2020 | (1,622,788) | USD | (44,260) | ||||||||
| 17 JPFUSHIP Index | JPM | USD LIBOR 1M + 0.60% (2.363%) | monthly | 07/30/2020 | 2,276,189 | USD | 44,877 | ||||||||
| 18 JPTAOBRL Index | JPM | BRL CDI + 0.50% (4.900%) | monthly | 12/15/2020 | 1,027,692 | BRL | 1,170 | ||||||||
| 19 KAAH0 | JPM | 0% | monthly | 03/19/2020 | 10,212,781,100 | KRW | (44,050) | ||||||||
| 20 KEH0 | JPM | 0% | monthly | 03/19/2020 | 5,629,121,300 | KRW | 7,280 | ||||||||
| Klabin SA | MS | BRL CDI + 1.50% (5.900%) | monthly | 09/16/2021 | 559,452 | BRL | (1,482) | ||||||||
| 21 MSFDRUS Index | MS | 0% | monthly | 07/01/2021 | 29,908,325 | USD | 149,735 | ||||||||
| 22 S5UTIL Index | JPM | USD LIBOR 1M + 0.15% (1.913%) | monthly | 03/30/2020 | 3,219,323 | USD | 38,604 | ||||||||
| Total of Total Return Swaps | $ | 81,719 |
| a Counterparty abbreviations | b Floating rate definitions |
| B - Barclays Bank PLC | BBSW - Australian Bank Bill Swap Rate |
| GS - Goldman Sachs | BRL CDI - Brazil Average One-Day Interbank Deposit |
| JPM - J.P. Morgan Investment Bank | EURIBOR - Euro Interbank Offered Rate. The Euribor rates are based on the interest rates at which a panel of European banks borrow funds from one another. |
| MS - Morgan Stanley | LIBOR - London Interbank Offered Rate |
The accompanying notes are an integral part of these financial statements.
Fulcrum Diversified Absolute Return Fund
Consolidated Schedule of Investments
December 31, 2019 (Unaudited)
| * | No Upfront premiums paid on the Total Return Swaps. |
| 1 | AS51BANX - a capitalization weighted index comprised of companies in the S&P/ASX 200 Stock Index. |
| 2 | BCIISHAL is a custom basket of oilfield products and services company stocks. |
| 3 | GSCBFABA is a custom basket of Australian bank stocks. |
| 4 | GSCBFACT is a custom basket of investment management company stocks. |
| 5 | GSCBFERU is a custom basket of European utility company stocks. |
| 6 | GSCBFGOR is a custom basket of precious metals mining company stocks. The components of the basket as of December 31, 2019 are shown on the following pages. |
| 7 | GSCBFLPM is a custom basket of financial services company stocks. |
| 8 | GSGLFEXC is a custom basket of financial services company stocks. |
| 9 | GSGLFPAY is a custom basket of financial services company stocks. |
| 10 | JPEBCSMI is a custom basket of Swiss stocks. |
| 11 | JPFCITSV is a custom basket of information technology company stocks. The components of the basket as of December 31, 2019 are shown on the following pages. |
| 12 | JPFUAIR is a custom basket of airline company stocks. The components of the basket as of December 31, 2019 are shown on the following pages. |
| 13 | JPFUEOIL is a custom basket of energy company stocks. The components of the basket as of December 31, 2019 are shown on the following pages. |
| 14 | JPFUMEDA is a custom basket of media company stocks. |
| 15 | JPFUOMED is a custom basket of media company stocks. The components of the basket as of December 31, 2019 are shown on the following pages. |
| 16 | JPFUREGU is a custom basket of U.S. real estate company stocks. |
| 17 | JPFUSHIP is a custom basket of transportation company stocks. The components of the basket as of December 31, 2019 are shown on the following pages. |
| 18 | JPTAOBRL is a custom basket of Brazilian stocks. |
| 19 | KAAH0 - Underlying asset is 10-year Korea Treasury Bond future with 5% coupon rate and semiannual coupon payment. |
| 20 | KEH0 - Underlying asset is 3-year Korea Treasury Bond future with 5% coupon rate and semiannual coupon payment. |
| 21 | MSFDRUS - The components of the basket as of December 31, 2019 are shown on the following pages. |
| 22 | S5UTIL - S&P 500 Utilities Sector Index. |
The accompanying notes are an integral part of these financial statements.
Fulcrum Diversified Absolute Return Fund
Consolidated Schedule of Investments
December 31, 2019 (Unaudited)
GSCBFGOR Index
| Name | Quantity | Value | Weight | ||||||||
| Franco-Nevada Corp | 56,994 | $ | 5,887,480 | 37.46% | |||||||
| Wheaton Precious Metals Corp | 151,345 | 4,502,514 | 28.65% | ||||||||
| Royal Gold Inc | 32,705 | 3,998,186 | 25.44% | ||||||||
| Osisko Gold Royalties Ltd | 136,667 | 1,327,037 | 8.45% | ||||||||
| $ | 15,715,217 | 100.00% | |||||||||
JPFCITSV Index
| Name | Quantity | Value | Weight | ||||||||
| Fujitsu Ltd | 10,401 | $ | 983,788 | 10.13% | |||||||
| NTT Data Corp | 56,903 | 768,803 | 7.92% | ||||||||
| Infosys Ltd | 67,663 | 698,278 | 7.19% | ||||||||
| Oracle Corp | 12,956 | 686,408 | 7.07% | ||||||||
| International Business Machines Corp | 4,634 | 621,109 | 6.40% | ||||||||
| Hewlett Packard Enterprise Co | 38,527 | 611,044 | 6.30% | ||||||||
| Capgemini SE | 4,936 | 603,651 | 6.22% | ||||||||
| Indra Sistemas SA | 41,853 | 478,423 | 4.93% | ||||||||
| Cognizant Technology Solutions Corp | 7,388 | 458,223 | 4.72% | ||||||||
| SYNNEX Corp | �� | 3,338 | 429,985 | 4.43% | |||||||
| Wipro Ltd | 105,171 | 394,390 | 4.06% | ||||||||
| Atos SE | 4,594 | 383,402 | 3.95% | ||||||||
| Temenos AG | 2,413 | 382,504 | 3.94% | ||||||||
| VMware Inc | 2,486 | 377,344 | 3.89% | ||||||||
| Citrix Systems Inc | 3,200 | 354,829 | 3.66% | ||||||||
| TietoEVRY Oyj | 10,298 | 320,534 | 3.30% | ||||||||
| Software AG | 8,790 | 306,979 | 3.16% | ||||||||
| Sykes Enterprises Inc | 8,241 | 304,835 | 3.14% | ||||||||
| DXC Technology Co | 3,761 | 141,391 | 1.46% | ||||||||
| Conduent Inc | 22,132 | 137,219 | 1.41% | ||||||||
| TTEC Holdings Inc | 3,382 | 133,980 | 1.38% | ||||||||
| Worldline SA/France | 1,838 | 130,311 | 1.34% | ||||||||
| $ | 9,707,430 | 100.00% | |||||||||
JPFUAIR Index
| Name | Quantity | Value | Weight | ||||||||
| easyJet PLC | 161,293 | $ | 3,047,317 | 5.13% | |||||||
| International Consolidated Airlines Grou | 358,455 | 2,971,376 | 5.00% | ||||||||
| Japan Airlines Co Ltd | 91,584 | 2,865,258 | 4.82% | ||||||||
| Ryanair Holdings PLC | 169,808 | 2,789,605 | 4.69% | ||||||||
| Turk Hava Yollari AO | 1,073,020 | 2,607,762 | 4.39% | ||||||||
| Air France-KLM | 228,934 | 2,551,169 | 4.29% | ||||||||
| Deutsche Lufthansa AG | 135,705 | 2,500,608 | 4.21% | ||||||||
| Copa Holdings SA | 22,529 | 2,434,931 | 4.10% | ||||||||
| Alaska Air Group Inc | 35,920 | 2,433,591 | 4.09% | ||||||||
| Southwest Airlines Co | 43,590 | 2,352,973 | 3.96% | ||||||||
| ANA Holdings Inc | 70,040 | 2,349,304 | 3.95% | ||||||||
| Air China Ltd | 2,303,203 | 2,338,903 | 3.93% | ||||||||
| Hawaiian Holdings Inc | 77,362 | 2,265,942 | 3.81% | ||||||||
| Cathay Pacific Airways Ltd | 1,520,312 | 2,248,541 | 3.78% | ||||||||
| Singapore Airlines Ltd | 333,048 | 2,239,150 | 3.77% | ||||||||
| Wizz Air Holdings Plc | 42,889 | 2,215,602 | 3.73% | ||||||||
| United Airlines Holdings Inc | 24,989 | 2,201,318 | 3.70% | ||||||||
| Delta Air Lines Inc | 37,291 | 2,180,775 | 3.67% | ||||||||
| Spirit Airlines Inc | 49,723 | 2,004,322 | 3.37% | ||||||||
| Korean Air Lines Co Ltd | 74,765 | 1,844,909 | 3.10% | ||||||||
| JetBlue Airways Corp | 96,546 | 1,807,346 | 3.04% | ||||||||
| China Southern Airlines Co Ltd | 2,463,964 | 1,657,509 | 2.79% | ||||||||
The accompanying notes are an integral part of these financial statements.
Fulcrum Diversified Absolute Return Fund
Consolidated Schedule of Investments
December 31, 2019 (Unaudited)
JPFUAIR Index (Continued)
| Name | Quantity | Value | Weight | ||||||||
| AirAsia Group Bhd | 3,249,428 | $ | 1,350,462 | 2.27% | |||||||
| SAS AB | 796,709 | 1,301,106 | 2.19% | ||||||||
| American Airlines Group Inc | 43,931 | 1,259,954 | 2.12% | ||||||||
| China Eastern Airlines Corp Ltd | 2,226,665 | 1,234,909 | 2.08% | ||||||||
| Eva Airways Corp | 1,952,232 | 897,441 | 1.51% | ||||||||
| China Airlines Ltd | 2,950,540 | 893,719 | 1.50% | ||||||||
| Finnair Oyj | 90,638 | 598,457 | 1.01% | ||||||||
| $ | 59,444,259 | 100.00% | |||||||||
JPFUEOIL Index
| Name | Quantity | Value | Weight | ||||||||
| Equinor ASA | 40,736 | $ | 814,211 | 10.33% | |||||||
| OMV AG | 14,407 | 810,175 | 10.28% | ||||||||
| TOTAL SA | 14,302 | 790,138 | 10.02% | ||||||||
| BP PLC | 124,058 | 775,958 | 9.85% | ||||||||
| Royal Dutch Shell PLC | 26,078 | 766,190 | 9.72% | ||||||||
| Galp Energia SGPS SA | 39,245 | 656,616 | 8.33% | ||||||||
| Eni SpA | 40,789 | 634,175 | 8.04% | ||||||||
| Repsol SA | 37,678 | 589,359 | 7.48% | ||||||||
| EOG Resources Inc | 6,677 | 559,266 | 7.09% | ||||||||
| Suncor Energy Inc | 11,568 | 379,361 | 4.81% | ||||||||
| Lundin Petroleum AB | 4,870 | 165,786 | 2.10% | ||||||||
| Kosmos Energy Ltd | 23,853 | 135,962 | 1.72% | ||||||||
| Aker ASA | 2,162 | 133,825 | 1.70% | ||||||||
| Talos Energy Inc | 4,250 | 128,137 | 1.62% | ||||||||
| DNO ASA | 92,051 | 121,296 | 1.54% | ||||||||
| Genel Energy Plc | 41,309 | 103,661 | 1.31% | ||||||||
| BW Offshore Ltd | 11,088 | 83,345 | 1.06% | ||||||||
| Energean Oil & Gas PLC | 6,544 | 80,718 | 1.02% | ||||||||
| Diversified Gas & Oil PLC | 55,375 | 78,217 | 0.99% | ||||||||
| Hurricane Energy PLC | 174,894 | 77,705 | 0.99% | ||||||||
| $ | 7,884,101 | 100.00% | |||||||||
JPFUOMED Index
| Name | Quantity | Value | Weight | ||||||||
| Cable One Inc | 432 | $ | 642,313 | 6.35% | |||||||
| Charter Communications Inc | 1,039 | 504,117 | 4.98% | ||||||||
| Nexstar Media Group Inc | 4,235 | 496,594 | 4.91% | ||||||||
| ViacomCBS Inc | 11,801 | 495,306 | 4.89% | ||||||||
| Discovery Inc | 12,786 | 418,600 | 4.14% | ||||||||
| Walt Disney Co/The | 2,805 | 405,727 | 4.01% | ||||||||
| Comcast Corp | 8,859 | 398,397 | 3.94% | ||||||||
| New York Times Co/The | 12,217 | 393,032 | 3.88% | ||||||||
| DISH Network Corp | 9,684 | 343,484 | 3.39% | ||||||||
| Sinclair Broadcast Group Inc | 10,049 | 335,024 | 3.31% | ||||||||
| ViaSat Inc | 4,480 | 327,882 | 3.24% | ||||||||
| Omnicom Group Inc | 3,892 | 315,350 | 3.12% | ||||||||
| TEGNA Inc | 18,641 | 311,126 | 3.07% | ||||||||
| Informa PLC | 26,318 | 299,138 | 2.96% | ||||||||
| Interpublic Group of Cos Inc/The | 12,446 | 287,504 | 2.84% | ||||||||
| Cinemark Holdings Inc | 8,362 | 283,043 | 2.80% | ||||||||
| News Corp | 18,209 | 257,479 | 2.54% | ||||||||
| ITV PLC | 124,838 | 250,012 | 2.47% | ||||||||
| WPP PLC | 17,581 | 248,689 | 2.46% | ||||||||
| Gray Television Inc | 11,156 | 239,190 | 2.36% | ||||||||
| Lagardere SCA | 10,261 | 223,868 | 2.21% | ||||||||
| Dentsu Group Inc | 5,913 | 205,588 | 2.03% | ||||||||
The accompanying notes are an integral part of these financial statements.
Fulcrum Diversified Absolute Return Fund
Consolidated Schedule of Investments
December 31, 2019 (Unaudited)
JPFUOMED Index (Continued)
| Name | Quantity | Value | Weight | ||||||||
| Pearson PLC | 23,741 | $ | 200,577 | 1.98% | |||||||
| SES SA | 14,237 | 199,833 | 1.97% | ||||||||
| Grupo Televisa SAB | 16,523 | 193,812 | 1.92% | ||||||||
| Publicis Groupe SA | 4,257 | 192,942 | 1.91% | ||||||||
| Meredith Corp | 5,882 | 191,002 | 1.89% | ||||||||
| ProSiebenSat.1 Media SE | 9,611 | 150,112 | 1.48% | ||||||||
| Eutelsat Communications SA | 8,571 | 139,458 | 1.38% | ||||||||
| IMAX Corp | 6,618 | 135,200 | 1.34% | ||||||||
| Mediaset SpA | 44,966 | 134,310 | 1.33% | ||||||||
| Toho Co Ltd/Tokyo | 2,927 | 122,538 | 1.21% | ||||||||
| Cineworld Group PLC | 41,358 | 120,182 | 1.19% | ||||||||
| AMC Entertainment Holdings Inc | 14,008 | 101,418 | 1.00% | ||||||||
| Nippon Television Holdings Inc | 6,134 | 82,590 | 0.82% | ||||||||
| RTL Group SA | 1,616 | 79,784 | 0.79% | ||||||||
| Lions Gate Entertainment Corp | 7,479 | 79,722 | 0.79% | ||||||||
| Mediaset Espana Comunicacion SA | 12,178 | 77,400 | 0.76% | ||||||||
| National CineMedia Inc | 7,425 | 54,126 | 0.53% | ||||||||
| Gannett Co Inc | 7,033 | 44,872 | 0.44% | ||||||||
| Houghton Mifflin Harcourt Co | 5,222 | 32,636 | 0.32% | ||||||||
| Technicolor SA | 38,278 | 29,420 | 0.29% | ||||||||
| Metropole Television SA | 1,200 | 22,604 | 0.22% | ||||||||
| Television Francaise 1 | 2,629 | 21,844 | 0.22% | ||||||||
| Atresmedia Corp de Medios de Comunicacio | 4,566 | 17,854 | 0.18% | ||||||||
| Television Broadcasts Ltd | 8,891 | 13,971 | 0.14% | ||||||||
| $ | 10,119,670 | 100.00% | |||||||||
JPFUSHIP Index
| Name | Quantity | Value | Weight | ||||||||
| DHT Holdings Inc | 587,660 | $ | 4,865,825 | 11.99% | |||||||
| Scorpio Tankers Inc | 100,237 | 3,943,324 | 9.72% | ||||||||
| Frontline Ltd/Bermuda | 207,600 | 2,669,736 | 6.58% | ||||||||
| BW LPG Ltd | 316,744 | 2,664,039 | 6.56% | ||||||||
| AP Moller - Maersk A/S | 1,792 | 2,587,391 | 6.38% | ||||||||
| Qatar Gas Transport Co Ltd | 3,800,000 | 2,482,160 | 6.12% | ||||||||
| Star Bulk Carriers Corp | 195,698 | 2,311,193 | 5.70% | ||||||||
| Euronav NV | 172,558 | 2,163,877 | 5.33% | ||||||||
| Frontline Ltd/Bermuda | 166,034 | 2,097,059 | 5.17% | ||||||||
| Dorian LPG Ltd | 116,790 | 1,807,909 | 4.46% | ||||||||
| International Seaways Inc | 54,910 | 1,634,122 | 4.03% | ||||||||
| Euronav NV | 131,441 | 1,620,589 | 3.99% | ||||||||
| D/S Norden A/S | 96,970 | 1,554,865 | 3.83% | ||||||||
| Teekay LNG Partners LP | 85,376 | 1,328,451 | 3.27% | ||||||||
| Golden Ocean Group Ltd | 228,789 | 1,327,571 | 3.27% | ||||||||
| SFL Corp Ltd | 89,027 | 1,294,453 | 3.19% | ||||||||
| GasLog Ltd | 102,608 | 1,004,532 | 2.48% | ||||||||
| TORM PLC | 61,703 | 690,802 | 1.70% | ||||||||
| Navigator Holdings Ltd | 45,952 | 618,973 | 1.52% | ||||||||
| Golden Ocean Group Ltd | 92,697 | 538,570 | 1.33% | ||||||||
| Ocean Yield ASA | 89,732 | 490,538 | 1.21% | ||||||||
| Stolt-Nielsen Ltd | 27,584 | 358,131 | 0.88% | ||||||||
| Diamond S Shipping Inc | 21,304 | 356,629 | 0.88% | ||||||||
| Wallenius Wilhelmsen ASA | 66,698 | 165,751 | 0.41% | ||||||||
| $ | 40,576,490 | 100.00% | |||||||||
The accompanying notes are an integral part of these financial statements.
Fulcrum Diversified Absolute Return Fund
Consolidated Schedule of Investments
December 31, 2019 (Unaudited)
MSFDRUS Index
| Name | Quantity ^ | Value | Weight | |||||||||
| USD Cash | 19,111,981 | $ | 19,111,981 | 33.41% | ||||||||
| EUR Cash | (1,969,967 | ) | (2,209,721 | ) | 3.86% | |||||||
| NOK Cash | (18,640,641 | ) | (2,123,249 | ) | 3.71% | |||||||
| SEK Cash | 12,919,181 | 1,379,319 | 2.41% | |||||||||
| Cf Industries Holdings Inc. | 18,295 | 873,403 | 1.53% | |||||||||
| Vonovia SE | 15,357 | 826,849 | 1.45% | |||||||||
| Svenska Handelsbanken AB | (76,461 | ) | (823,684 | ) | 1.44% | |||||||
| DNB ASA | 45,722 | 718,695 | 1.26% | |||||||||
| Dollar General Corporation | 3,387 | 528,304 | 0.92% | |||||||||
| Burlington Stores Inc. | 2,184 | 498,018 | 0.87% | |||||||||
| Mos Holdings Inc. | 21,865 | 473,159 | 0.83% | |||||||||
| Costco Wholesale Corporation | 1,595 | 468,802 | 0.82% | |||||||||
| Ross Stores Inc. | 3,922 | 456,599 | 0.80% | |||||||||
| Leg Immobilien AG | 3,751 | 444,103 | 0.78% | |||||||||
| American Homes 4 Rent | 16,715 | 438,100 | 0.77% | |||||||||
| Aroundtown SA | 48,613 | 435,145 | 0.76% | |||||||||
| Invitation Homes Inc. | 14,291 | 428,301 | 0.75% | |||||||||
| The Tjx Companies Inc. | 6,844 | 417,895 | 0.73% | |||||||||
| CAD Cash | (532,243 | ) | (409,875 | ) | 0.72% | |||||||
| Yara International ASA | 9,848 | 409,902 | 0.72% | |||||||||
| Persimmon Plc | 10,553 | 376,723 | 0.66% | |||||||||
| Dollar Tree Stores Inc. | 3,835 | 360,682 | 0.63% | |||||||||
| The Berkeley Group Plc | 5,340 | 343,697 | 0.60% | |||||||||
| Klepierre SA | (8,902 | ) | (338,006 | ) | 0.59% | |||||||
| Potash Corporation Of Saskatchewan Inc. | 7,062 | 338,340 | 0.59% | |||||||||
| Taylor Wimpey Plc | 127,128 | 325,002 | 0.57% | |||||||||
| Ollie'S Bargain Outlet Holdings Inc. | 4,651 | 303,757 | 0.53% | |||||||||
| Skandinaviska Enskilda Banken Corporation | (31,133 | ) | (292,771 | ) | 0.51% | |||||||
| Nordea Bank ABP | (35,382 | ) | (285,735 | ) | 0.50% | |||||||
| Mid-America Apartment Communities Inc. | 2,036 | 268,467 | 0.47% | |||||||||
| Tag Immobilien AG | 10,722 | 266,517 | 0.47% | |||||||||
| AUD Cash | 365,934 | 256,794 | 0.45% | |||||||||
| K+S Aktiengesellschaft | 19,857 | 247,683 | 0.43% | |||||||||
| Equity Residential | 3,019 | 244,297 | 0.43% | |||||||||
| Avalonbay Communities Inc. | 1,159 | 243,042 | 0.42% | |||||||||
| Unibail-Rodamco SE | (1,525 | ) | (240,596 | ) | 0.42% | |||||||
| Essex Property Trust Inc | 797 | 239,785 | 0.42% | |||||||||
| Bellway Plc | 4,745 | 239,280 | 0.42% | |||||||||
| Deutsche Euroshop AG | (7,611 | ) | (225,555 | ) | 0.39% | |||||||
| Stora Enso OYJ | 15,309 | 222,723 | 0.39% | |||||||||
| Salesforce.Com Inc. | 1,341 | 218,100 | 0.38% | |||||||||
| GBP Cash | (161,627 | ) | (214,092 | ) | 0.37% | |||||||
| Barratt Developments Plc | 21,504 | 212,778 | 0.37% | |||||||||
| Equity Lifestyle Properties Inc. | 3,008 | 211,733 | 0.37% | |||||||||
| Svenska Cellulosa AB | 20,255 | 205,440 | 0.36% | |||||||||
| UDR Inc. | 4,385 | 204,780 | 0.36% | |||||||||
| Weyerhaeuser Company | 6,659 | 201,102 | 0.35% | |||||||||
| Sun Communities Inc | 1,319 | 197,982 | 0.35% | |||||||||
| Next Plc | (2,015 | ) | (187,316 | ) | 0.33% | |||||||
| Sparebank 1 Nord-Norge | 20,953 | 187,351 | 0.33% | |||||||||
| Other Underlying Index Components * | 3,496,260 | 28.00% | ||||||||||
| $ | 29,970,290 | 100.00% | ||||||||||
^ Presented as percentage of absolute value.
* Largest 50 underlying components by market value at December 31, 2019 are listed.
The accompanying notes are an integral part of these financial statements.
Fulcrum Diversified Absolute Return Fund
Consolidated Statement of Assets and Liabilities
December 31, 2019 (Unaudited)
| Assets | ||||
| Investments, at value (cost $130,352,213) | $ | 129,189,087 | ||
| Cash | 6,890,076 | |||
| Cash collateral for derivative instruments | 18,330,000 | |||
| Deposits with brokers for derivative instruments | 24,662,266 | |||
| Foreign currency, at value (cost $2,410,015) | 2,439,918 | |||
| Premiums paid for swaps | 866,647 | |||
| Unrealized appreciation on swaps | 2,826,726 | |||
| Receivables: | ||||
| Investment securities sold | 34,055,810 | |||
| Interest receivable | 238,214 | |||
| Fund shares sold | 20,000 | |||
| Prepaid expenses | 15,295 | |||
| Total Assets | 219,534,039 | |||
| Liabilities | ||||
| Written options, at value (premiums received $408,930) | 307,462 | |||
| Premiums received from swaps | 495,882 | |||
| Unrealized depreciation on swaps | 1,859,058 | |||
| Unrealized depreciation on forward currency contracts | 132,713 | |||
| Payables: | ||||
| Investment securities purchased | 32,406,656 | |||
| Due to Investment Adviser | 124,262 | |||
| Accrued Distribution fees | 639 | |||
| Other accrued expenses | 105,213 | |||
| Total Liabilities | 35,431,885 | |||
| Net Assets | $ | 184,102,154 | ||
| COMPONENTS OF NET ASSETS | ||||
| Paid-in capital | $ | 187,340,681 | ||
| Total accumulated losses | (3,238,527 | ) | ||
| Net Assets | $ | 184,102,154 | ||
| Institutional Class: | ||||
| Net assets applicable to shares outstanding | $ | 1,438,273 | ||
| Shares outstanding (unlimited shares authorized with no par value) | 155,408 | |||
| Net Asset Value, Redemption Price and Offering Price Per Share | $ | 9.25 | ||
| Super Institutional Class: | ||||
| Net assets applicable to shares outstanding | $ | 182,663,881 | ||
| Shares outstanding (unlimited shares authorized with no par value) | 19,723,893 | |||
| Net Asset Value, Redemption Price and Offering Price Per Share | $ | 9.26 | ||
The accompanying notes are an integral part of these financial statements.
Fulcrum Diversified Absolute Return Fund
Consolidated Statement of Operations
For the Six Months Ended December 31, 2019 (Unaudited)
| Investment Income | ||||
| Dividends | $ | 1,958 | ||
| Interest | 1,651,236 | |||
| Total Investment Income | 1,653,194 | |||
| Expenses | ||||
| Management fees | 832,738 | |||
| Administration fees | 113,640 | |||
| Transfer agent fees | 33,400 | |||
| Legal fees | 19,360 | |||
| Audit fees | 16,405 | |||
| Registration fees | 12,496 | |||
| Custody fees | 9,612 | |||
| Compliance fees | 8,360 | |||
| Interest expense | 8,181 | |||
| Trustees fees | 5,784 | |||
| Reports to shareholders | 4,772 | |||
| Miscellaneous expenses | 4,468 | |||
| Insurance expense | 2,072 | |||
| Shareholder servicing fees | 822 | |||
| Total expenses | 1,072,110 | |||
| Less: Expense waived by the Adviser (Note 3) | (91,579 | ) | ||
| Net expenses | 980,531 | |||
| Net Investment Income | 672,663 | |||
| Realized and Unrealized Gain (Loss) | ||||
| Net realized gain (loss) on: | ||||
| Investments | 1,052,793 | |||
| Written options | 2,317,476 | |||
| Forward currency contracts | 2,825,612 | |||
| Futures contracts | 917,260 | |||
| Foreign currency | (88,714 | ) | ||
| Swap contracts | 152,696 | |||
| Net realized gain | 7,177,123 | |||
| Net change in unrealized appreciation/depreciation on: | ||||
| Investments | (4,279,359 | ) | ||
| Written options | 149,117 | |||
| Forward currency contracts | (792,469 | ) | ||
| Futures contracts | 1,237,433 | |||
| Foreign currency | 22,052 | |||
| Translation of assets and liabilities denominated in foreign currency | 27,106 | |||
| Swap contracts | 1,146,559 | |||
| Net change in appreciation/depreciation | (2,489,561 | ) | ||
| Net realized and unrealized gain on investments, written options, forward currency and futures contracts, foreign currency, and swap contracts | 4,687,562 | |||
| Net Increase in Net Assets from Operations | $ | 5,360,225 | ||
The accompanying notes are an integral part of these financial statements.
Fulcrum Diversified Absolute Return Fund
Consolidated Statements of Changes in Net Assets
| Operations | For the Six Months ended December 31, 2019 (Unaudited) | For the Year ended June 30, 2019 | |||||||
| Net investment income (loss) | $ | 672,663 | $ | (444,815 | ) | ||||
| Net realized gain (loss) on investments, written options, forward currency and futures contracts, foreign currency, and swap contracts | 7,177,123 | (2,102,662 | ) | ||||||
| Net change in unrealized appreciation/depreciation on investments, written options, forward currency and futures contracts, foreign currency, and swap contracts | (2,489,561 | ) | 4,747,752 | ||||||
| Net increase in net assets resulting from operations | 5,360,225 | 2,200,275 | |||||||
| DISTRIBUTIONS TO SHAREHOLDERS | |||||||||
| Net dividends and distributions to shareholders - Advisor Class | — | — | |||||||
| Net dividends and distributions to shareholders - Institutional Class | — | (239,681 | ) | ||||||
| Net dividends and distributions to shareholders - Super Institutional Class | (41,301 | ) | (14,278,182 | ) | |||||
| Net decrease in net assets resulting from distributions paid | (41,301 | ) | (14,517,863 | ) | |||||
| CAPITAL TRANSACTIONS | |||||||||
| Proceeds from shares sold | |||||||||
| Advisor Class | — | — | |||||||
| Institutional Class | 147,805 | 1,654,962 | * | ||||||
| Super Institutional Class | 6,016,652 | 15,141,090 | |||||||
| Proceeds from reinvestment of distributions | |||||||||
| Advisor Class | — | — | |||||||
| Institutional Class | — | 225,637 | |||||||
| Super Institutional Class | 41,167 | 14,224,939 | |||||||
| Cost of units redeemed | |||||||||
| Advisor Class | — | (102,475 | ) | * | |||||
| Institutional Class | (1,510,792 | ) | (339,265 | ) | |||||
| Super Institutional Class | (11,932,309 | ) | (12,587,889 | ) | |||||
| Net increase (decrease) in net assets from capital transactions | (7,237,477 | ) | 18,216,999 | ||||||
| Total increase (decrease) in net assets | (1,918,553 | ) | 5,899,411 | ||||||
| Net Assets | |||||||||
| Beginning of period | 186,020,707 | 180,121,296 | |||||||
| End of period | $ | 184,102,154 | $ | 186,020,707 | |||||
| CAPITAL SHARE TRANSACTIONS | |||||||||
| Advisor Class | |||||||||
| Shares sold | — | — | |||||||
| Shares reinvested | — | — | |||||||
| Shares redeemed | — | (10,848 | ) | * | |||||
| Net increase (decrease) in shares outstanding | — | (10,848 | ) | ||||||
| Institutional Class | |||||||||
| Shares sold | 168,642 | * | |||||||
| Shares reinvested | 16,409 | 26,329 | |||||||
| Shares redeemed | (166,058 | ) | (38,330 | ) | |||||
| Net increase (decrease) in shares outstanding | (149,649 | ) | 156,641 | ||||||
| Super Institutional Class | |||||||||
| Shares sold | 668,748 | 1,671,929 | |||||||
| Shares reinvested | 4,494 | 1,659,853 | |||||||
| Shares redeemed | (1,317,437 | ) | (1,385,294 | ) | |||||
| Net increase (decrease) in shares outstanding | (644,195 | ) | 1,946,488 | ||||||
| * | Includes exchange of all shares in Advisor Class to Institutional Class on 10/31/2018. 10,848 shares of Advisor class valued at $102,475 were exchanged for 10,804 shares of the Institutional Class. See Note 1. |
The accompanying notes are an integral part of these financial statements.
Fulcrum Diversified Absolute Return Fund
Consolidated Financial Highlights
Institutional Class
For a capital share outstanding throughout the periods presented
| For the Six Months ended December 31, 2019 (Unaudited) | For the Year ended June 30, 2019 | For the Year ended June 30, 2018 | For the Year ended June 30, 2017 | For the Period July 31, 2015* through June 30, 2016 | |||||||||||||||||
| Net asset value, beginning of period | $ | 8.99 | $ | 9.69 | $ | 9.73 | $ | 9.56 | $ | 10.00 | |||||||||||
| Income (loss) from investment operations: | |||||||||||||||||||||
| Net investment Income (loss) (1) | 0.03 | (0.03 | ) | (0.08 | ) | (0.08 | ) | (0.09 | ) | ||||||||||||
| Net realized and unrealized gain (loss) on investments | 0.23 | 0.10 | 0.36 | 0.29 | (0.35 | ) | |||||||||||||||
| Total from investment operations | 0.26 | 0.07 | 0.28 | 0.21 | (0.44 | ) | |||||||||||||||
| Less distributions: | |||||||||||||||||||||
| From net investment income | — | (0.77 | ) | (0.12 | ) | (0.04 | ) | — | |||||||||||||
| From net realized gain on investments | — | — | (0.20 | ) | — | — | |||||||||||||||
| Total distributions | — | (0.77 | ) | (0.32 | ) | (0.04 | ) | — | |||||||||||||
| Net asset value, end of period | $ | 9.25 | $ | 8.99 | $ | 9.69 | $ | 9.73 | $ | 9.56 | |||||||||||
| Total return | 2.89 | % | (2) | 1.09 | % | 2.96 | % | 2.18 | % | -4.40 | % | (2) | |||||||||
| SUPPLEMENTAL DATA AND RATIOS: | |||||||||||||||||||||
| Net assets, end of period (in thousands) | $ | 1,438 | $ | 2,743 | $ | 1,438 | $ | 1,048 | $ | 1,026 | |||||||||||
| Ratio of expenses to average net assets | |||||||||||||||||||||
| Before fees waived by the Adviser (4) | 1.22 | % | (3) | 1.24 | % | 1.19 | % | 1.19 | % | 1.55 | % | (3) | |||||||||
| After fees waived by the Adviser (4) | 1.12 | % | (3) | 1.13 | % | 1.06 | % | 1.09 | % | 1.16 | % | (3) | |||||||||
| Ratio of net investment loss to average net assets | |||||||||||||||||||||
| Before fees waived by the Adviser (5) | 0.59 | % | (3) | -0.46 | % | -0.97 | % | -0.97 | % | -1.44 | % | (3) | |||||||||
| After fees waived by the Adviser (5) | 0.69 | % | (3) | -0.35 | % | -0.84 | % | -0.87 | % | -1.05 | % | (3) | |||||||||
| Portfolio turnover rate (6) | 132 | % | (2) | 81 | % | 11 | % | 4 | % | 54 | % | (2) | |||||||||
| * | Inception date |
| (1) | Computed using the average shares method. |
| (2) | Not annualized |
| (3) | Annualized |
| (4) | The ratios of expenses to average net assets include interest and brokerage expenses. For the periods ended June 30, 2016, June 30, 2017, June 30, 2018, June 30, 2019 and December 31, 2019, excluding interest and brokerage expenses, the ratios of expenses to average net assets, before fees waived by the Adviser, were 1.54%, 1.18%, 1.18%, 1.23% and 1.21% , respectively. Excluding interest and brokerage expenses, the ratios of expenses to average net assets, after fees waived by the Adviser, were 1.15%, 1.07%, 1.05%, 1.12% and 1.11%, respectively. |
| (5) | The ratios of net investment loss to average net assets include interest and brokerage expenses. For the periods ended June 30, 2016, June 30, 2017, June 30, 2018, June 30, 2019 and December 31, 2019, excluding interest and brokerage expenses, the ratios of net investment loss to average net assets, before fees waived by the Adviser, were -1.43%, -0.96%, -0.96%, -0.45% and 0.60%, respectively. Excluding interest and brokerage expenses, the ratios of net investment loss to average net assets, after fees waived by the Adviser, were -1.04%, -0.85%, -0.83%, -0.34% and 0.70%, respectively. |
| (6) | Portfolio turnover is calculated on the basis of the Fund as a whole without distinguishing between the classes of shares issued. The ratio is calculated including cash and long-term derivative positions, as they represent a significant percentage of the Fund's holdings. |
The accompanying notes are an integral part of these financial statements.
Fulcrum Diversified Absolute Return Fund
Consolidated Financial Highlights
Super Institutional Class
For a capital share outstanding throughout the periods presented
| For the Six Months ended December 31, 2019 (Unaudited) | For the Year ended June 30, 2019 | For the Year ended June 30, 2018 | For the Year ended June 30, 2017 | For the Period July 31, 2015* through June 30, 2016 | |||||||||||||||||
| Net asset value, beginning of period | $ | 9.00 | $ | 9.69 | $ | 9.73 | $ | 9.56 | $ | 10.00 | |||||||||||
| Income (loss) from investment operations: | |||||||||||||||||||||
Net investment Income (loss) (1) | 0.03 | (0.02 | ) | (0.08 | ) | (0.08 | ) | (0.06 | ) | ||||||||||||
| Net realized and unrealized gain (loss) on investments | 0.23 | 0.10 | 0.36 | 0.29 | (0.38 | ) | |||||||||||||||
Total from investment operations | 0.26 | 0.08 | 0.28 | 0.21 | (0.44 | ) | |||||||||||||||
| Less distributions: | |||||||||||||||||||||
| From net investment income | (0.00 | )^ | (0.77 | ) | (0.12 | ) | (0.04 | ) | — | ||||||||||||
| From net realized gain on investments | — | — | (0.20 | ) | — | — | |||||||||||||||
Total distributions | (0.00 | ) | (0.77 | ) | (0.32 | ) | (0.04 | ) | — | ||||||||||||
| Net asset value, end of period | $ | 9.26 | $ | 9.00 | $ | 9.69 | $ | 9.73 | $ | 9.56 | |||||||||||
| Total return | 2.91 | % | (2) | 1.21 | % | 2.96 | % | 2.18 | % | -4.40 | % | (2) | |||||||||
| SUPPLEMENTAL DATA AND RATIOS: | |||||||||||||||||||||
| Net assets, end of period (in thousands) | $ | 182,664 | $ | 183,278 | $ | 178,578 | $ | 185,112 | $ | 159,304 | |||||||||||
| Ratio of expenses to average net assets | |||||||||||||||||||||
Before fees waived by the Adviser (4) | 1.16 | % | (3) | 1.17 | % | 1.19 | % | 1.17 | % | 1.45 | % | (3) | |||||||||
After fees waived by the Adviser (4) | 1.06 | % | (3) | 1.06 | % | 1.06 | % | 1.06 | % | 1.06 | % | (3) | |||||||||
| Ratio of net investment loss to average net assets | |||||||||||||||||||||
Before fees waived by the Adviser (5) | 0.63 | % | (3) | -0.35 | % | -0.97 | % | -0.95 | % | -1.05 | % | (3) | |||||||||
After fees waived by the Adviser (5) | 0.73 | % | (3) | -0.24 | % | -0.84 | % | -0.84 | % | -0.66 | % | (3) | |||||||||
| Portfolio turnover rate (6) | 132 | % | (2) | 81 | % | 11 | % | 4 | % | 54 | % | (2) | |||||||||
| ^ | Amount represents less than $0.01 per share. |
| * | Inception date |
| (1) | Computed using the average shares method. |
| (2) | Not annualized |
| (3) | Annualized |
| (4) | The ratios of expenses to average net assets include interest and brokerage expenses. For the periods ended June 30, 2016, June 30, 2017, June 30, 2018, June 30, 2019 and December 31, 2019, excluding interest and brokerage expenses, the ratios of expenses to average net assets, before fees waived by the Adviser, were 1.44%, 1.15%, 1.18%, 1.16% and 1.15%, respectively. Excluding interest and brokerage expenses, the ratios of expenses to average net assets, after fees waived by the Adviser, were 1.05%, 1.05%, 1.05%, 1.05% and 1.05%, respectively. |
| (5) | The ratios of net investment loss to average net assets include interest and brokerage expenses. For the periods ended June 30, 2016, June 30, 2017, June 30, 2018, June 30, 2019 and December 31, 2019, excluding interest and brokerage expenses, the ratios of net investment loss to average net assets, before fees waived by the Adviser, were -1.04%, -0.93%, -0.96%, -0.34% and 0.64% , respectively. Excluding interest and brokerage expenses, the ratios of net investment loss to average net assets, after fees waived by the Adviser, were -0.65%, -0.83%, -0.83%, -0.23% and 0.74%, respectively. |
| (6) | Portfolio turnover is calculated on the basis of the Fund as a whole without distinguishing between the classes of shares issued. The ratio is calculated including cash and long-term derivative positions, as they represent a significant percentage of the Fund's holdings. |
The accompanying notes are an integral part of these financial statements.
| Net investment gain | $ | 5,833 | ||
| Net realized gain | 1,365,153 | |||
| Net change in unrealized appreciation (depreciation) | 284,121 | |||
| Net increase in net assets resulting from Operations | $ | 1,655,107 |
| Level 1 | - Quoted prices in active markets for identical securities. An active market for a security is a market in which transactions occur with sufficient frequency and volume to provide pricing information on an ongoing basis. A quoted price in an active market provides the most reliable evidence of fair value. | |
| Level 2 | - Observable inputs other than quoted prices included in level 1 that are observable for the asset or liability either directly or indirectly. These inputs may include quoted prices for the identical instrument on an inactive market, prices for similar instruments, interest rates, prepayment speeds, credit risk, yield curves, default rates, and similar data. | |
| Level 3 | - Significant unobservable inputs, including the Fund’s own assumptions in determining fair value of investments |
| Description | Quoted Prices Level 1 | Other Significant Observable Inputs Level 2 | Significant Unobservable Inputs Level 3 | Total | ||||||||||||
| Investments | ||||||||||||||||
| Foreign Government Notes/Bonds | $ | — | $ | 10,205,858 | $ | — | $ | 10,205,858 | ||||||||
| Purchased Options and Warrants | 419,651 | 8,187,450 | — | 8,607,101 | ||||||||||||
| Short-Term Investments | — | 81,383,573 | — | 81,383,573 | ||||||||||||
| United States Treasury Bond | — | 28,992,555 | — | 28,992,555 | ||||||||||||
| Total Investments | $ | 419,651 | $ | 128,769,436 | $ | — | $ | 129,189,087 | ||||||||
| Description | Quoted Prices Level 1 | Other Significant Observable Inputs Level 2 | Significant Unobservable Inputs Level 3 | Total | ||||||||||||
| Other Financial Instruments | ||||||||||||||||
| Written Options | $ | (255,982 | ) | $ | (51,480 | ) | $ | — | $ | (307,462 | ) | |||||
| Forward Currency Contracts * | — | (132,713 | ) | — | (132,713 | ) | ||||||||||
| Futures Contracts * | 465,135 | — | — | 465,135 | ||||||||||||
| Interest Rate Swaps * | — | (318,983 | ) | — | (318,983 | ) | ||||||||||
| Inflation Swaps * | — | 1,107,986 | — | 1,107,986 | ||||||||||||
| Credit Default Swaps * | — | 96,946 | — | 96,946 | ||||||||||||
| Total Return Swaps * | — | 81,719 | — | 81,719 | ||||||||||||
| Total Other Financial Instruments | $ | 209,153 | $ | 783,475 | $ | — | $ | 992,628 | ||||||||
| Assets | ||||||||||||||||
| Risk Exposure Category | Investments (1) | Unrealized Appreciation on Forward Currency Contracts | Unrealized Appreciation on Swaps | Unrealized Appreciation on Futures (2) | ||||||||||||
Interest rate (3) | $ | — | $ | — | $ | 2,365,257 | $ | 184,661 | ||||||||
| Credit | — | — | 96,946 | — | ||||||||||||
| Currency | 369,445 | — | — | 40,287 | ||||||||||||
| Equity | 277,001 | — | 364,523 | 451,410 | ||||||||||||
| Commodity | 142,650 | — | — | 618,399 | ||||||||||||
| Volatility | 7,818,005 | — | — | 388 | ||||||||||||
| Total | $ | 8,607,101 | $ | — | $ | 2,826,726 | $ | 1,295,145 | ||||||||
| Liabilities | ||||||||||||||||
| Risk Exposure Category | Written Options | Unrealized Depreciation on Forward Currency Contracts | Unrealized Depreciation on Swaps | Unrealized Depreciation on Futures (2) | ||||||||||||
Interest rate (3) | $ | — | $ | — | $ | (1,613,024 | ) | $ | (275,172 | ) | ||||||
| Currency | — | (132,713 | ) | — | (80,542 | ) | ||||||||||
| Equity | (255,982 | ) | — | (246,034 | ) | (193,704 | ) | |||||||||
| Commodity | — | — | — | (278,058 | ) | |||||||||||
| Volatility | (51,480 | ) | — | — | (2,534 | ) | ||||||||||
| Total | $ | (307,462 | ) | $ | (132,713 | ) | $ | (1,859,058 | ) | $ | (830,010 | ) | ||||
| Amount of Realized Gain / (Loss) on Derivatives | ||||||||||||||||||||||||
| Risk Exposure Category | Investments (1) | Written Options | Forward Currency Contracts | Futures Contracts | Swap Contracts | Total | ||||||||||||||||||
Interest rate (2) | $ | 38,680 | $ | 250,715 | $ | — | $ | (2,404,025 | ) | $ | 244,822 | $ | (1,869,808 | ) | ||||||||||
| Commodity | (388,799 | ) | 571,804 | — | 911,034 | — | 1,094,039 | |||||||||||||||||
| Credit | — | — | — | — | 47,283 | 47,283 | ||||||||||||||||||
| Currency | (1,368,858 | ) | 655,166 | 2,825,612 | (5,666 | ) | — | 2,106,254 | ||||||||||||||||
| Equity | (1,488,003 | ) | 918,382 | — | 2,397,900 | (139,409 | ) | 1,688,870 | ||||||||||||||||
| Volatility | 660,481 | (78,591 | ) | — | 18,017 | — | 599,907 | |||||||||||||||||
| Total | $ | (2,546,499 | ) | $ | 2,317,476 | $ | 2,825,612 | $ | 917,260 | $ | 152,696 | $ | 3,666,545 | |||||||||||
| Change in Unrealized Gain / (Loss) on Derivatives | ||||||||||||||||||||||||
| Risk Exposure Category | Investments (1) | Written Options | Forward Currency Contracts | Futures Contracts | Swap Contracts | Total | ||||||||||||||||||
Interest rate (2) | $ | — | $ | — | $ | — | $ | 812,121 | $ | 821,940 | $ | 1,634,061 | ||||||||||||
| Credit | — | — | — | — | 96,946 | 96,946 | ||||||||||||||||||
| Currency | (276,838 | ) | 35,586 | (792,469 | ) | 21,026 | — | (1,012,695 | ) | |||||||||||||||
| Equity | (226,587 | ) | 89,522 | — | 121,811 | 227,673 | 212,419 | |||||||||||||||||
| Commodity | (94,413 | ) | 12,063 | — | 282,087 | — | 199,737 | |||||||||||||||||
| Volatility | (816,816 | ) | 11,946 | — | 388 | — | (804,482 | ) | ||||||||||||||||
| Total | $ | (1,414,654 | ) | $ | 149,117 | $ | (792,469 | ) | $ | 1,237,433 | $ | 1,146,559 | $ | 325,986 | ||||||||||
| Derivative Type | Unit of Measure | Average Quantity | |||
| Credit default swaps | Notional Amount | $ | 4,240,648 | ||
| Interest rate swaps * | Notional Amount | $ | 429,832,497 | ||
| Total return swaps – Long | Notional Amount | $ | 58,184,298 | ||
| Total return swaps – Short | Notional Amount | $ | (18,238,779 | ) | |
| Forward currency contracts | Notional Amount | $ | 258,053,989 | ||
| Futures – Long | Notional Amount | $ | (17,598 | ) | |
| Futures – Short | Notional Amount | $ | 10,336 | ||
| Purchased options and warrants | Contracts | 12,105 | |||
| Purchased currency options | Notional Amount | $ | 759,044 | ||
| Written options | Contracts | (1,163 | ) | ||
| Written currency options | Notional Amount | $ | (159,989 | ) | |
Fulcrum Diversified Absolute Return Fund
Notes to Consolidated Financial Statements
December 31, 2019 (Unaudited)
The following tables set forth the Funds’ net exposure for derivative instruments that are subject to enforceable master netting arrangements or similar agreements as of December 31, 2019:
Gross Amounts of Recognized Assets and (Liabilities) | Gross Amounts Offset in the Consolidated Statement of Assets & (Liabilities) | Net Amounts Presented in the Consolidated Statement of Assets & (Liabilities) | Gross Amounts not offset in the Consolidated Statement of Assets and Liabilities | |||||||||||||||
| Counterparty | Offsetting Derivative Position | Cash Collateral Pledged (Received)(1) | Net Amount | |||||||||||||||
| Assets: | ||||||||||||||||||
| Purchased Options and Warrants | ||||||||||||||||||
| BNP Paribas S.A. | $ | 496,478 | $ | — | $ | 496,478 | $ | — | $ | — | $ | 496,478 | ||||||
| Citigroup | 217,949 | — | 217,949 | — | — | 217,949 | ||||||||||||
| Goldman Sachs | 31,448 | — | 31,448 | — | — | 31,448 | ||||||||||||
| HSBC Bank Plc | 2,114,831 | — | 2,114,831 | — | — | 2,114,831 | ||||||||||||
| J.P. Morgan Chase | 4,069,099 | — | 4,069,099 | — | — | 4,069,099 | ||||||||||||
| Morgan Stanley | 501,161 | — | 501,161 | (307,462 | ) | — | 193,699 | |||||||||||
| Societe Generale | 467,751 | — | 467,751 | — | — | 467,751 | ||||||||||||
| UBS AG | 708,384 | — | 708,384 | — | — | 708,384 | ||||||||||||
| Futures Contracts (2) | ||||||||||||||||||
| J.P. Morgan Chase | 15,448 | — | 15,448 | — | — | 15,448 | ||||||||||||
| Morgan Stanley | 1,279,697 | (830,010 | ) | 449,687 | — | — | 449,687 | |||||||||||
| Forward Contracts | ||||||||||||||||||
| J.P. Morgan Chase | 1,606,807 | (1,606,807 | ) | — | — | — | — | |||||||||||
| Swaps Contracts | ||||||||||||||||||
| Goldman Sachs | 125,117 | — | 125,117 | (4,730 | ) | — | 120,387 | |||||||||||
| J.P. Morgan Chase | 2,551,874 | — | 2,551,874 | (1,692,939 | ) | — | 858,935 | |||||||||||
| Morgan Stanley | 149,735 | — | 149,735 | (1,539 | ) | — | 148,196 | |||||||||||
| $ | 14,335,779 | $ | (2,436,817 | ) | $ | 11,898,962 | $ | (2,006,670 | ) | $ | — | $ | 9,892,292 | |||||
| Liabilities: | ||||||||||||||||||
| Written Options | ||||||||||||||||||
| Morgan Stanley | $ | (307,462 | ) | $ | — | $ | (307,462 | ) | $ | 307,462 | $ | — | $ | — | ||||
| Futures Contracts (2) | ||||||||||||||||||
| Morgan Stanley | (830,010 | ) | 830,010 | — | — | — | — | |||||||||||
| Forward Contracts | ||||||||||||||||||
| J.P. Morgan Chase | (1,739,520 | ) | 1,606,807 | (132,713 | ) | — | 132,713 | — | ||||||||||
| Swaps Contracts | ||||||||||||||||||
| Barclays | (159,850 | ) | — | (159,850 | ) | — | 159,850 | — | ||||||||||
| Goldman Sachs | (4,730 | ) | — | (4,730 | ) | 4,730 | — | — | ||||||||||
| J.P. Morgan Chase | (1,692,939 | ) | — | (1,692,939 | ) | 1,692,939 | — | — | ||||||||||
| Morgan Stanley | (1,539 | ) | — | (1,539 | ) | 1,539 | — | — | ||||||||||
| $ | (4,736,050 | ) | $ | 2,436,817 | $ | (2,299,233 | ) | $ | 2,006,670 | $ | 292,563 | $ | — | |||||
| (1) | Any over-collateralization of total financial instruments or cash is not shown. |
| (2) | Reflects the cumulative unrealized appreciation (depreciation) of futures contracts as reported in the Fund’s Consolidated Schedule of Investments. |
Fulcrum Diversified Absolute Return Fund
Notes to Consolidated Financial Statements
December 31, 2019 (Unaudited)
(c) Use of Estimates
The preparation of financial statements in conformity with GAAP requires management to make estimates and assumptions that affect the reported amounts of assets and liabilities and disclosure of contingent assets and liabilities at the date of the financial statements and the reported amounts of revenues and expenses during the reporting period. Actual results could differ from those estimates.
(d) Security Transactions and Investment Income
The Fund records security transactions based on trade date. The Fund determines the gain or loss realized from investment transactions by comparing the original cost of the specifically identified security lot sold with the net sales proceeds. Dividend income is recognized on the ex-dividend date, and interest income is recognized on an accrual basis. Discounts and premiums on securities purchased are amortized over the lives of the respective securities using the effective yield method. Withholding taxes on foreign dividends have been provided for in accordance with the Fund’s understanding of the applicable country’s tax rules and rates.
(e) Foreign currency translation
Investment securities and other assets and liabilities in foreign currencies are translated into U.S. dollar amounts based upon prevailing exchange rates on the date of valuation. Purchases and sales of investment securities and income and expense items denominated in foreign currencies are translated into U.S. dollar amounts based upon prevailing exchange rates on the respective dates of such transactions.
The Fund does not isolate that portion of the results of operations resulting from fluctuations in foreign exchange rates on investments from the fluctuations arising from changes in market prices of securities held. Such fluctuations are included with the net realized and unrealized gain or loss on investments.
Net realized foreign exchange gains or losses arise from sales of foreign currencies, including gains and losses on forward foreign currency contracts, currency gains or losses realized between the trade and settlement dates on securities transactions, and the difference between the amounts of dividends, interest, and foreign withholding taxes recorded on the Fund’s books and the U.S. dollar equivalent of the amounts actually received or paid. Net unrealized foreign exchange gains and losses arise from changes in the values of assets and liabilities, other than investments in securities, on the date of valuation, resulting from changes in exchange rates.
Foreign security and currency transactions may involve certain considerations and risks not typically associated with those of U.S. dollar denominated transactions as a result of, among other factors, the possibility of lower levels of governmental supervision and regulation of foreign securities markets and the possibility of political or economic instability. As of December 31, 2019, the Fund held foreign currency.
Fulcrum Diversified Absolute Return Fund
Notes to Consolidated Financial Statements
December 31, 2019 (Unaudited)
(f) Distributions to Shareholders
The Fund records distributions to shareholders, which are determined in accordance with income tax regulations, on the ex-dividend date. Distributions of net investment income and net realized gains from investment transactions, if any, will be distributed to shareholders annually. The Fund may periodically make reclassifications among certain income and capital gains distributions determined in accordance with federal tax regulations, which may differ from GAAP. These reclassifications are due to differences in the recognition of income, expense and gain (loss) items for financial statement and tax purposes.
(g) Federal Income Taxes
The Fund has elected to be taxed as a Regulated Investment Companies (“RIC”) under the U.S. Internal Revenue Code of 1986, as amended, and intends to maintain this qualification and to distribute substantially all of the net taxable income to its shareholders. Therefore no provision is made for federal income taxes. Due to the timing of dividend distributions and the differences in accounting for income and realized gains and losses for financial statement and federal income tax purpose, the fiscal year in which amounts are distributed may differ from the year in which the income and realized gains and losses are recorded by the Fund.
Management of the Fund is required to analyze all open tax years, as defined by IRS statute of limitations for all major jurisdictions, including federal tax authorities and certain state authorities. As of and during the period ended December 31, 2019, the Fund did not have a liability for any unrecognized tax benefits. The Fund recognizes interest and penalties, if any, related to unrecognized tax benefits as interest expense and other expense for penalties in the Consolidated Statement of Operations. As of December 31, 2019, the tax years ended June 30, 2019, June 30, 2018, June 30, 2017 remain subject to examination. The Fund is not aware of any tax positions for which it is reasonably possible that the total amounts of unrecognized tax benefits will significantly change in the next twelve months.
(h) Restricted Cash & Deposits with Broker
At December 31, 2019, the Fund held restricted cash in connection with investments with certain derivative securities. Restricted cash is held in a segregated account with the Fund’s custodian and is reflected on the Consolidated Statement of Assets and Liabilities as cash collateral for derivative instruments. On December 31, 2019, the Fund had pledged the following amounts as collateral for open currency contracts, options, futures and swap contracts:
| Counterparty | Amount Pledged (1) | Deposits with Brokers | ||||
| Goldman Sachs | $ | 130,000 | $ | — | ||
| J.P. Morgan Chase | 9,150,000 | 5,629,118 | ||||
| Morgan Stanley | 9,050,000 | 19,033,148 | ||||
| Total | $ | 18,330,000 | $ | 24,662,266 | ||
| (1) | Excludes non-pledged cash or collateral held by broker. |
Fulcrum Diversified Absolute Return Fund
Notes to Consolidated Financial Statements
December 31, 2019 (Unaudited)
(i) Cash – Concentration in Uninsured Cash
For cash management purposes the Fund may concentrate cash with the Fund’s custodian. This typically results in cash balances exceeding the Federal Deposit Insurance Corporation (“FDIC”) insurance limits. As of December 31, 2019, the Fund held $6,640,076 as cash reserves at U.S. Bank, N.A. (“U.S. Bank”) and $5,379,118 as deposits with broker at J.P. Morgan Chase and $18,783,148 as deposits with broker at Morgan Stanley that exceeded the FDIC insurance limit.
Note 3 – Investment Management Agreement and Other Transactions with Affiliates
The Trust has an agreement with the Adviser to furnish investment advisory services to the Fund. Under the terms of this agreement, the Fund will pay the Adviser a monthly fee based on the Fund’s average daily net assets at an annual rate of 0.90%. Pursuant to a contractual fee waiver and reimbursement agreement, the Adviser will reimburse the Fund for expenses in excess of 1.05%, and 1.05% of average daily net assets for Institutional, and Super Institutional Class, respectively, excluding any shareholder servicing fees pursuant to a Shareholder Servicing Plan, any front-end or contingent deferred loads, taxes, leverage interest, brokerage commissions, acquired fund fees and expenses, expenses incurred in connection with any merger or reorganization, portfolio transaction expenses, interest expense and dividends paid on short sales or extraordinary expenses such as litigation.
The Adviser is permitted to recapture amounts waived and/or reimbursed to a class within three years if the class’s total annual operating expenses have fallen to a level below the expense limitation (“expense cap”) in effect at the time the fees were earned or the expenses incurred. In no case will the Adviser recapture any amount that would result, on any particular business day of the Fund, in the class’s total annual operating expenses exceeding the expense cap or any other lower limit then in effect.
At December 31, 2019, the amounts reimbursed by the Adviser and subject to potential recapture by year were as follows:
| Amount | Expiration | |||
| $ | 108,002 | June 30, 2020 | ||
| 230,181 | June 30, 2021 | |||
| 200,582 | June 30, 2022 | |||
| 91,579 | December 31, 2022 | |||
| $ | 630,344 | |||
Fulcrum Diversified Absolute Return Fund
Notes to Consolidated Financial Statements
December 31, 2019 (Unaudited)
U.S. Bancorp Fund Services, LLC, doing business as U.S. Bank Global Fund Services (“Fund Services”), serves as the Fund’s administrator and fund accountant and transfer agent. The officers of the Trust are employees of Fund Services. U.S. Bank serves as the Fund’s custodian and provides compliance services to the Funds. Quasar Distributors, LLC (“Quasar” or the “Distributor”), an affiliate of Fund Services, acts as the Fund’s distributor and principal underwriter. For the period ended December 31, 2019, the Fund incurred the following expenses for administration and fund accounting, custody, transfer agent and compliance fees:
| Administration | $ | 113,640 | ||
| Custody | $ | 9,612 | ||
| Transfer Agency | $ | 33,400 | ||
| Chief Compliance Officer | $ | 8,360 |
At December 31, 2019, the Fund had payables due to Fund Services and its affiliates for administration and fund accounting, custody, transfer agent and compliance fees to U.S. Bank in the following amounts:
| Administration | $ | 37,445 | ||
| Custody | $ | 4,529 | ||
| Transfer Agency | $ | 11,084 | ||
| Chief Compliance Officer | $ | 2,835 |
The above payable amounts are included in Accrued other expenses in the Statement of assets and liabilities.
The Independent Trustees were paid $5,784 for their services and reimbursement of travel expenses during the period ended December 31, 2019. The Fund pays no compensation to the Interested Trustee or officers of the Trust.
Note 4 – Distribution Plan
Third party distribution and servicing expenses may be paid directly by the Fund or through the Investment Adviser in its administrative role for purposes of facilitating and monitoring payments under the Plan.
Quasar Distributors, LLC (the “Distributor”), acts as the Fund’s principal underwriter in a continuous public offering of the Fund’s shares and is paid for its services by the Investment Adviser out of the fees received under the Plan and may be paid out of the Investment Adviser’s own resources. The Distributor is an affiliate of U.S. Bancorp Fund Services, LLC.
Note 5 – Portfolio Securities Transactions
The cost of purchases and proceeds from sales and maturities of long-term securities for the period ended December 31, 2019, were as follows:
| Purchases | $ | 91,131,649 | |||
| Sales | $ | 116,139,474 |
Fulcrum Diversified Absolute Return Fund
Notes to Consolidated Financial Statements
December 31, 2019 (Unaudited)
Note 6 – Federal Income Tax Information
At June 30, 2019, the components of accumulated earnings (losses) for income tax purposes were as follows:
| Investments | Written Options | Foreign Currencies | Forward Currency Contracts | Futures Contracts | Swap Contracts | Total | |||||||||||||||
| Tax cost of Investments | $ | 149,615,420 | $ | (253,640 | ) | $ | 2,271,722 | $ | 744,805 | $ | (991,205 | ) | $ | (178,891 | ) | $ | 151,208,211 | ||||
| Unrealized Appreciation | 3,745,545 | — | 9,118 | 126,232 | 279,771 | — | 4,160,666 | ||||||||||||||
| Unrealized Depreciation | (629,312 | ) | (47,649 | ) | (27,546 | ) | (211,281 | ) | (60,864 | ) | — | (976,652 | ) | ||||||||
| Net unrealized appreciation (depreciation) | 3,116,233 | (47,649 | ) | (18,428 | ) | (85,049 | ) | 218,907 | — | 3,184,014 | |||||||||||
| Undistributed Ordinary Income | — | — | — | — | — | — | — | ||||||||||||||
| Other accumulated gain/(loss) | (11,741,465 | ) | — | — | — | — | — | (11,741,465 | ) | ||||||||||||
| Total accumulated gain/(loss) | $ | (8,625,232 | ) | $ | (47,649 | ) | $ | (18,428 | ) | $ | (85,049 | ) | $ | 218,907 | $ | — | $ | (8,557,451 | ) | ||
The difference between book basis and tax basis unrealized appreciation/depreciation is attributable in part to the tax deferral of losses on wash sales.
GAAP requires that certain components of net assets be reclassified between financial and tax reporting. These reclassifications have no effect on net assets or net asset value per share. For the year ended June 30, 2019, permanent differences in book and tax accounting have been reclassified to capital, and accumulated losses as follows:
| Accumulated Losses | Paid In Capital |
| $ 726,167 | $ (726,167) |
Fulcrum Diversified Absolute Return Fund
Notes to Consolidated Financial Statements
December 31, 2019 (Unaudited)
The tax character of distributions paid during the six months ended December 31, 2019, and the year ended June 30, 2019 were as follows:
| Distributions Paid From: | Six Months ended December 31, 2019 | Year ended June 30, 2019 | ||||
| Ordinary Income | $ | 41,301 | $ | 14,517,863 | ||
| Long-Term Capital Gains | — | — | ||||
| Total Distributions Paid | $ | 41,301 | $ | 14,517,863 | ||
The Fund is required, in order to meet certain excise tax requirements, to measure and distribute annually, net capital gains realized during the twelve month period ending October 31. In connection with this requirement, the Fund is permitted, for tax purposes, to defer into its next fiscal year any net capital losses incurred from November 1 through the end of the fiscal year. Late year losses incurred after December 31 within the fiscal year are deemed to arise on the first business day of the following fiscal year for tax purposes. At June 30, 2019, the Fund deferred, on a tax basis, post-October losses of $4,798,437.
At June 30, 2019, the Fund had capital loss carryforwards, which reduce the Fund’s taxable income arising from future net realized gains on investments, if any, to the extent permitted by the Internal Revenue Code, and thus will reduce the amount of distributions to shareholders which would otherwise be necessary to relieve the Fund of any liability for federal tax. Pursuant to the Internal Revenue Code, the character of such capital loss carryforwards is as follows:
| Not Subject to Expiration | ||
| Short-Term | Long-Term | Total |
| $ 4,589,893 | $ 2,436,816 | $ 7,026,709 |
Note 7 – Commitments and Contingencies
In the normal course of business, each Fund enters into contracts that provide general indemnifications by each Fund to the counterparty to the contract. Each Fund’s maximum exposure under these arrangements is dependent on future claims that may be made against each Fund and, therefore, cannot be estimated; however, based on experience, the risk of loss from such claims is considered remote.
Note 8 – Subsequent Events
In preparing these financial statements, the Fund has evaluated events and transactions for potential recognition or disclosure through the date the financial statements were available to be issued.
On November 25, 2019, U.S. Bancorp, the parent company of Quasar Distributors, LLC, the Fund’s distributor, announced that it had signed a purchase agreement to sell Quasar to Foreside Financial Group, LLC such that Quasar will become a wholly-owned broker-dealer subsidiary of Foreside. The transaction is expected to close by the end of March 2020. Quasar will remain the Fund’s distributor at the close of the transaction, subject to Board approval.
Fulcrum Diversified Absolute Return Fund
Notes to Consolidated Financial Statements
December 31, 2019 (Unaudited)
Note 9 – New Accounting Pronouncement
In March 2017, the Financial Accounting Standards Board issued Accounting Standards Update No. 2017-08 (“ASU 2017-08”), “Receivables—Nonrefundable Fees and Other Costs (Subtopic 310-20): Premium Amortization on Purchased Callable Debt Securities.” ASU 2017-08 changed the amortization period for certain callable debt securities held at a premium. Specifically, it requires the premium to be amortized to the earliest call date. The Fund has adopted the provisions of ASU 2017-08 and has concluded that the change in accounting principle does not materially impact the financial statement amounts.
Fulcrum Diversified Absolute Return Fund
December 31, 2019 (Unaudited)
Form N-Q
The Fund files its complete schedule of portfolio holdings for the first and third quarters of each fiscal year with the Securities and Exchange Commission (SEC) on Form N-Q. The Fund’s Form N-Q is available without charge by visiting the SEC’s Web site at www.sec.gov and may be reviewed and copied at the SEC’s Public Reference Room in Washington D.C. You may obtain information on the operation of the Public Reference Room by calling 1-800-SEC-0330.
Proxy Voting
You may obtain a description of the Fund’s proxy voting policy and voting records, without charge, upon request by contacting the Fund directly at 1-855-538-5278 or on the EDGAR Database on the SEC’s website at ww.sec.gov. The Fund files its proxy voting records annually as of June 30, with the SEC on Form N-PX. The Fund’s Form N-PX is available without charge by visiting the SEC’s website at www.sec.gov and may be reviewed and copied at the SEC’s Public Reference Room in Washington D.C. You may obtain information on the operation of the Public Reference Room by calling 1-800-SEC-0330.
Approval of Investment Advisory Agreement
At a meeting held on August 13 and 14, 2019, the Board of Trustees (the “Board”) of Trust for Advised Portfolios (the “Trust”), including all Trustees who are not “interested persons” of the Trust, as that term is defined in the Investment Company Act of 1940, considered and approved the continuance of the investment advisory agreement (“Advisory Agreement”) with Fulcrum Asset Management, LLC (“Fulcrum” or the “Adviser”), for the Fulcrum Diversified Absolute Return Fund (the “Fund”). Ahead of the August meeting, the Board received and reviewed substantial information regarding the Fund, the Adviser and the services provided by the Adviser to the Fund under the Advisory Agreement. This information formed the primary (but not exclusive) basis for the Board’s determinations.
In considering the continuance of the Advisory Agreement, the Board considered the following factors and made the following determinations. In its deliberations, the Board did not identify any single factor or piece of information as all important, controlling, or determinative of its decision, and each Trustee may have attributed different weights to the various factors and information.
| ● | In considering the nature, extent and quality of the services provided by the Adviser, the Trustees considered the Adviser’s specific responsibilities in all aspects of the day-to-day management of the Fund, as well as the qualifications, experience and responsibilities of the portfolio managers and other key personnel involved in the day-to-day activities of the Fund. The Board also considered the resources and compliance structure of Fulcrum, including information regarding its compliance program, chief compliance officer and compliance record, and its disaster recovery/business continuity plan. The Board also considered the existing relationship between Fulcrum and the Trust, as well as the Board’s knowledge of the Adviser’s operations, and noted that during the course of the prior year it had met with the Adviser telephonically to discuss fund performance and investment outlook, as well as various marketing and compliance topics, including the Adviser’s risk management process. The Board concluded that Fulcrum had sufficient quality and depth of personnel, resources, investment methods and compliance policies and procedures essential to performing its duties under the Advisory Agreement and that, in the Board's view, the nature, overall quality, and extent of the management services provided were and would continue to be satisfactory and reliable. |
Fulcrum Diversified Absolute Return Fund
Additional Information
December 31, 2019 (Unaudited) (Continued)
| ● | In assessing the quality of the portfolio management delivered by the Adviser, the Board reviewed the performance of the Fund on both an absolute basis and in comparison to its peer group, relevant benchmark index, and a comparable account managed by the Adviser. The Board considered that the Fund had underperformed relative to its peer group median/average for the year-to-date, one-year, and three-year periods as of June 30, 2019, but had outperformed its benchmark index for the three-year period. The Board also considered that the Fund performed in line with or slightly lower than the Adviser’s composite fund with a similar strategy. The Board also considered that the Fund had achieved its first four years of performance since inception. The Board evaluated this information in the context of the Fund’s aim to achieve long-term absolute returns in all market conditions over rolling five-year periods. |
| ● | The Trustees also reviewed the cost of the Adviser’s services, and the structure and level of advisory fees payable by the Fund, including a comparison of those fees to fees charged by a peer group of funds. The Board noted that the Adviser had contractually agreed to maintain annual expense caps for each of the Fund’s classes. The Board noted that the Fund’s advisory fee and net expense ratio were lower than its peer group median and average. After reviewing the materials that were provided, the Trustees concluded that the fees to be received by Fulcrum were fair and reasonable. |
| ● | The Trustees considered Fulcrum’s assertion that, through a competitively priced advisory fee and Fulcrum’s commitment to limit Fund expenses, economies of scale, if and when achieved, will be shared with the Fund. The Trustees considered the asset levels of the Fund and concluded that they will have the opportunity to periodically reexamine whether economies of scale have been achieved and whether they are being shared with the Fund and its shareholders. |
| ● | The Trustees considered the profitability of Fulcrum from managing the Fund. In assessing Fulcrum’s profitability, the Trustees reviewed Fulcrum’s financial information that was provided in the materials and took into account both the direct and indirect benefits to Fulcrum from managing the Fund. The Trustees concluded that Fulcrum’s profits from managing the Fund were not excessive and, after a review of the relevant financial information, Fulcrum appeared to have adequate capitalization and/or would maintain adequate profit levels to support the Fund. |
The Fund collects non-public information about you from the following sources:
| ● | Information we receive about you on applications or other forms; |
| ● | Information you give us orally; and/or |
| ● | Information about your transactions with us or others. |
We do not disclose any non-public personal information about our customers or former customers without the customer’s authorization, except as permitted by law or in response to inquiries from governmental authorities. We may share information with affiliated and unaffiliated third parties with whom we have contracts for servicing the Fund. We will provide unaffiliated third parties with only the information necessary to carry out their assigned responsibilities. We maintain physical, electronic and procedural safeguards to guard your non-public personal information and require third parties to treat your personal information with the same high degree of confidentiality.
In the event that you hold shares of the Fund through a financial intermediary, including, but not limited to, a broker-dealer, bank, or trust company, the privacy policy of your financial intermediary would govern how your non-public personal information would be shared by those entities with unaffiliated third parties.
Investment Adviser
Fulcrum Asset Management LLP
Marble Arch House
66 Seymour Street
London W1H 5BT
United Kingdom
Distributor
Quasar Distributors, LLC
615 East Michigan Street
Milwaukee, Wisconsin 53202
Custodian
U.S. Bank National Association
Custody Operations
1555 North River Center Drive, Suite 302
Milwaukee, Wisconsin 53212
Transfer Agent, Fund Accountant and Fund Administrator
U.S. Bancorp Fund Services, LLC
615 East Michigan Street
Milwaukee, Wisconsin 53202
Independent Registered Public Accounting Firm
BBD, LLP
1835 Market Street, 3rd Floor
Philadelphia, PA 19103
Legal Counsel
Morgan, Lewis & Bockius LLP
1111 Pennsylvania Avenue, NW
Washington, DC 20004
This report has been prepared for shareholders and may be distributed to others only if preceded or accompanied by a current prospectus.
| (a) | The Registrant’s President and Treasurer have reviewed the Registrant's disclosure controls and procedures (as defined in Rule 30a-3(c) under the Investment Company Act of 1940 (the “Act”)) as of a date within 90 days of the filing of this report, as required by Rule 30a-3(b) under the Act and Rules 13a-15(b) or 15d‑15(b) under the Securities Exchange Act of 1934. Based on their review, such officers have concluded that the disclosure controls and procedures are effective in ensuring that information required to be disclosed in this report is appropriately recorded, processed, summarized and reported and made known to them by others within the Registrant and by the Registrant’s service provider. |
| (b) | There were no changes in the Registrant's internal control over financial reporting (as defined in Rule 30a-3(d) under the Act) that occurred during the second fiscal quarter of the period covered by this report that have materially affected, or are reasonably likely to materially affect, the Registrant's internal control over financial reporting |
| (a) | (1) Any code of ethics or amendment thereto, that is the subject of the disclosure required by Item 2, to the extent that the registrant intends to satisfy Item 2 requirements through filing an exhibit. Not applicable for semi-annual reports. |
| (b) | Certifications pursuant to Section 906 of the Sarbanes‑Oxley Act of 2002. Furnished herewith. |