
ZEVENBERGEN GROWTH FUND
INVESTOR CLASS (ZVNBX)
INSTITUTIONAL CLASS (ZVNIX)
ZEVENBERGEN GENEA FUND
INVESTOR CLASS (ZVGNX)
INSTITUTIONAL CLASS (ZVGIX)
ANNUAL REPORT TO SHAREHOLDERS
JUNE 30, 2023
TABLE OF CONTENTS

For the twelve months ending June 30, 2023 (Unaudited)
Dear Fellow Shareholders,
Wall Street strategists and economists have described economic conditions as resilient these past few months, a marked improvement from bearish proclamations issued in the second half of calendar 2022, when many industry observers believed markets would crumple under the weight of a recession and higher interest rates. Better-than-feared economic and company data have given investors courage to increase equity risk tolerance. Further, investors have grown increasingly comfortable with the potential of a pause or pivot in tightening policy in late calendar 2023 or early 2024 after the quickest Federal Reserve interest rate hiking cycle in 40 years.
From a financial perspective, investors rewarded profitable growth over the past twelve months, boosting shares of companies that increased operating margins and free cash flow generation through headcount reductions and spending cuts on non-core segments.
The Zevenbergen Funds each outperformed the benchmark for the 12 months ending June 30, 2023. The Zevenbergen Growth Fund Investor Share Class (ZVNBX) returned 43.1% and the Zevenbergen Genea Fund Investor Share Class (ZVGNX) increased 42.0%, both of which outperformed the Russell 3000® Growth Index, which rose 26.6%.
Zevenbergen Growth Fund:
Fund performance benefitted from investments in consumer discretionary (Latin America eCommerce), technology (semiconductors, commerce enablement), and health care. Performance detractors included financials (cryptocurrency) and consumer staples.
Contributors:
NVIDIA Corporation (NVDA):
Founder-led semiconductor company enabling advanced computing and digital transformation initiatives. Shares reflected broad excitement for artificial intelligence applications over the previous twelve months. The mainstream success of OpenAI's ChatGPT tool led NVIDIA CEO Jensen Huang to believe the AI industry has experienced its "iPhone moment," a monumental breakthrough that could result in more graphics processing chip sales over time. Further contributing to investor enthusiasm for the company's AI ambitions, NVIDIA announced a new cloud-based service for enterprise customers wanting to build and deploy AI technology themselves, helping analysts envision significant AI hardware and software revenue potential long term.
Shopify Inc. (SHOP):
Founder-led commerce platform company rebounded on the prospect of improving profitability and free cash flow generation, as management elected to divest most of its supply chain and logistics assets and reduce overhead costs. This reinvigorated financial discipline should bode well for future margin expansion and return Shopify to its “asset light” roots, whereby the company provides critical tools and software-based infrastructure that empower merchants’ ability to sell directly to consumers worldwide.
MercadoLibre, Inc. (MELI):
Founder-led, Latin America eCommerce and financial technology company reported strong fundamental execution while managing through continued turbulence in its core geographies. Fraud allegations at a large Brazilian competitor could serve to further extend MercadoLibre's leadership and trust in a country that still lags major developed countries in eCommerce penetration. A focus on innovation and reducing friction for customers has led to investments in areas like payments and credit that are now paying off, while initiatives around advertising strengthen overall profitability.
Detractors:
Silvergate Capital Corp. (SI):
The holding company for crypto-dedicated Silvergate Bank reported difficulty in attracting and retaining deposits, and direct exposure to failed crypto exchanges, including FTX, an unregulated broker dealer whose unexpected bankruptcy filing sparked industry contagion fears. The position was exited in December 2022 on significant fundamental concerns. Following ZCI’s decision to sell, the company announced its intent to terminate business operations and voluntarily liquidate its bank.
Xometry, Inc. (XMTR):
Online marketplace for custom manufacturing parts experienced volatile business conditions during the year, as suppliers accepted jobs at prices lower than what management anticipated, suggesting incremental slack in global manufacturing capacity. To navigate the challenging operating environment, management announced plans to reduce corporate costs and increase focus on serving its top vendors.
Okta, Inc. (OKTA):
Founder-led application security software company reported disappointing results, as Okta dealt with difficult sales conditions and organizational issues related to its integration of Auth0, Inc., an identity software peer acquired in 2021. Indicating a company in flux, management revealed plans for a major internal overhaul (including executive changes). Even though Okta’s subscription software model offers relatively clear near-term revenue visibility, macroeconomic softness and reorganization initiatives elevate medium-term execution risks. The position was sold for more compelling ideas.
Zevenbergen Genea Fund:
Fund performance benefitted from investments in consumer discretionary, technology, and health care. Performance detractors included financials (cryptocurrency) and consumer staples.
Contributors:
Please see Growth Fund commentary for discussions on NVIDIA Corp., MercadoLibre, Inc., and Shopify Inc.
Detractors:
Please see Growth Fund commentary for discussions on Silvergate Capital Corp. and Xometry, Inc.
Bumble Inc. (BMBL):
Founder-led mobile dating app company encountered weakness during the period on internal execution issues and macroeconomic concerns. The company cited new product delays, foreign currency headwinds, and general economic softness for failing to meet investor revenue expectations and its tepid financial outlook. Despite the temporary speedbumps, Bumble is well positioned to capture additional dollars spent on online dating applications globally.
Manager Perspective:
Risk tolerance toward emerging and high growth technology companies had swung overly negative in late 2022 with calendar 2023 performance bringing a welcome "mean reversion" dynamic toward more rational, fundamental focused market behavior. Providing short-term affirmation, Wall Street has revised earnings estimates higher for many Fund holdings, unsurprising given the constructive tone of many Corporate America executives since calendar year end 2022.
While the prospect of a low-growth environment remains possible, a slowdown in economic and policy rate of change should allow investors to refocus on fundamental business trends. We believe well-managed and capitalized companies with demonstrable execution in high growth markets will attract incremental capital amid tepid global expansion.
Underlying our portfolio management approach is the belief that change is the only constant in life and markets, and that this change can create significant opportunities for perceptive, open-minded, patient investors. ZCI applies fundamental analysis with the goal of identifying mis-priced stocks for which consensus expectations are too conservative on either degree of growth (too low) or duration of growth (too short) on a long-term basis. As we look toward the future, we believe many wealth-creation opportunities exist within high growth industries and other areas undergoing significant technological change.
In health and prosperity,
Zevenbergen Capital Investments Portfolio Management
Team
 |
| |
| Brooke de Boutray, CFA, CIC |
| |
 |
| |
| Joe Dennison, CFA |
| |
 |
| |
| Anthony Zackery, CFA |
| |
 |
| |
| Nancy Zevenbergen, CFA, CIC |
Past performance is no guarantee of future results.
Opinions expressed are subject to change at any time, are not guaranteed and should not be considered investment advice.
Fund holdings and sector allocations are subject to change and are not recommendations to buy or sell any security. Please refer to the Schedule of Investments in this report for a complete list of fund holdings.
Russell 3000® Growth Index: A market capitalization weighted index based on the Russell 3000® Index. The Russell 3000® Growth Index includes companies that display signs of above average growth. The Index is used to provide a gauge of the performance of growth stocks in the U.S. One cannot invest directly in an index.
Mutual fund investing involves risk, including the loss of principal. The Funds invest in foreign securities which involve greater volatility and political, economic and currency risks and differences in accounting methods. Non-diversified funds may hold a significant percentage of their assets in the securities of fewer companies and therefore events affecting those companies have a greater impact on the funds than on a diversified fund. If the Funds invest in a few sectors they may have increased exposure to price movements of those sectors. Small and medium capitalization companies tend to have limited liquidity and greater price volatility than large capitalization companies.
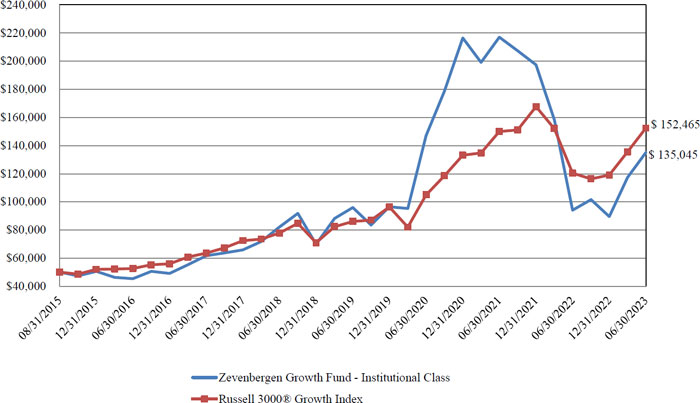
Zevenbergen Growth Fund
Performance Summary
June 30, 2023 (Unaudited)
Comparison of a Hypothetical $50,000 Investment
in the Zevenbergen Growth Fund - Institutional Class
and Russell 3000® Growth Index
Investment Returns
For the Periods Ended June 30, 2023
| | | One Year | | Three Year* | | Five Year* | | Since Inception* |
| Zevenbergen Growth Fund ** | | | | | | | | |
| Investor Class | | 43.13% | | -3.08% | | 10.12% | | 13.22% |
| Institutional Class | | 43.52% | | -2.80% | | 10.43% | | 13.52% |
| Russell 3000® Growth Index | | 26.60% | | 13.24% | | 14.39% | | 15.30% |
| ** | Inception date on August 31, 2015. |
Zevenbergen Genea Fund
Performance Summary
June 30, 2023 (Unaudited)
Comparison of a Hypothetical $50,000 Investment
in the Zevenbergen Genea Fund - Institutional Class
and Russell 3000® Growth Index

Investment Returns
For the Periods Ended June 30, 2023
| | | One Year | | Three Year* | | Five Year* | | Since Inception* |
| Zevenbergen Genea Fund ** | | | | | | | | |
| Investor Class | | 42.01%*** | | -0.16% | | 9.89% | | 16.59% |
| Institutional Class | | 42.45%*** | | 0.15% | | 10.18% | | 16.90% |
| Russell 3000® Growth Index | | 26.60% | | 13.24% | | 14.39% | | 15.30% |
| ** | Inception date on August 31, 2015. |
| *** | Returns are based on unadjusted net asset values and differ from returns shown in Financial Highlights which include adjustments in accordance with GAAP. |
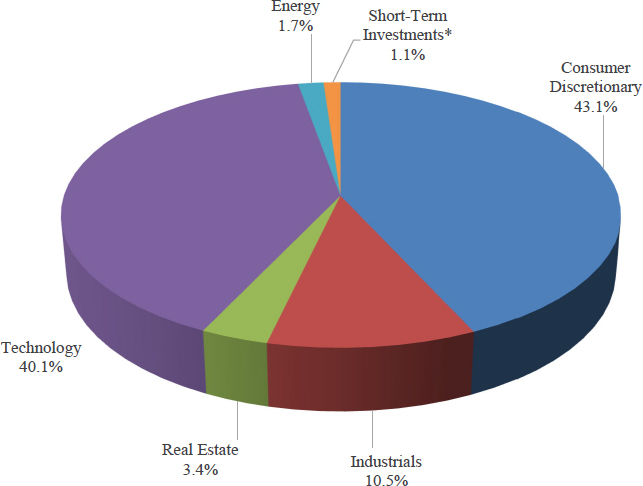
Zevenbergen Growth Fund
Allocation of Portfolio Holdings
(Calculated as a percentage of Total Investments)
June 30, 2023 (Unaudited)

| * | Short-Term Investments consist of amounts held in money market funds. The Fund strategy does not seek to hold large cash balances (more than 5% of total investments), and any significant cash holdings are typically due to trade settlement timing. |
Zevenbergen Growth Fund
Schedule of Investments
As of June 30, 2023
Number of
Shares | | | | | Value | |
| | | | | COMMON STOCKS ― 99.4% | | | | |
| | | | | CONSUMER DISCRETIONARY ― 38.4% | | | | |
| | 25,000 | | | Airbnb, Inc. (a) | | $ | 3,204,000 | |
| | 44,050 | | | Amazon.com, Inc. (a) | | | 5,742,358 | |
| | 5,300 | | | MercadoLibre, Inc. (a) | | | 6,278,380 | |
| | 6,400 | | | Netflix, Inc. (a) | | | 2,819,136 | |
| | 48,500 | | | On Holding AG ― ADR (a) | | | 1,600,500 | |
| | 34,950 | | | Tesla, Inc. (a) | | | 9,148,861 | |
| | 91,000 | | | The Trade Desk, Inc. (a) | | | 7,027,020 | |
| | 92,550 | | | Uber Technologies, Inc. (a) | | | 3,995,384 | |
| | 8,000 | | | Wingstop, Inc. | | | 1,601,280 | |
| | | | | | | | 41,416,919 | |
| | | | | ENERGY ― 4.2% | | | | |
| | 14,500 | | | Enphase Energy, Inc. (a) | | | 2,428,460 | |
| | 7,200 | | | First Solar, Inc. (a) | | | 1,368,648 | |
| | 30,000 | | | Shoals Technologies Group, Inc. (a) | | | 766,800 | |
| | | | | | | | 4,563,908 | |
| | | | | HEALTH CARE ― 10.0% | | | | |
| | 49,700 | | | Exact Sciences Corporation (a) | | | 4,666,830 | |
| | 20,210 | | | Natera, Inc. (a) | | | 983,419 | |
| | 5,115 | | | Repligen Corporation (a) | | | 723,568 | |
| | 10,250 | | | Seagen Inc. (a) | | | 1,972,715 | |
| | 12,250 | | | Veeva Systems Inc. (a) | | | 2,422,192 | |
| | | | | | | | 10,768,724 | |
| | | | | INDUSTRIALS ― 9.5% | | | | |
| | 17,700 | | | Axon Enterprise, Inc. (a) | | | 3,453,624 | |
| | 29,650 | | | Bill Holdings, Inc. (a) | | | 3,464,603 | |
| | 25,600 | | | Block, Inc. (a) | | | 1,704,192 | |
| | 8,700 | | | Paylocity Holding Corporation (a) | | | 1,605,411 | |
| | | | | | | | 10,227,830 | |
| | | | | REAL ESTATE ― 2.2% | | | | |
| | 48,000 | | | Zillow Group, Inc. Class C (a) | | | 2,412,480 | |
| | | | | | | | | |
| | | | | TECHNOLOGY ― 35.1% | | | | |
| | 28,400 | | | Advanced Micro Devices, Inc. (a) | | | 3,235,044 | |
| | 2,300 | | | ASML Holding N.V. ― ADR | | | 1,666,925 | |
| | 6,000 | | | Cadence Design Systems, Inc. (a) | | | 1,407,120 | |
| | 9,750 | | | CrowdStrike Holdings, Inc. (a) | | | 1,431,982 | |
| | 82,550 | | | DoubleVerify Holdings, Inc. (a) | | | 3,212,846 | |
| | 55,065 | | | Global-E Online Ltd. ― ADR (a) | | | 2,254,361 | |
The accompanying notes are an integral part of these financial statements.
Zevenbergen Growth Fund
Schedule of Investments (Continued)
As of June 30, 2023
Number of
Shares | | | | | Value | |
| | | | | TECHNOLOGY ― 35.1% (Continued) | | | | |
| | 5,650 | | | Meta Platforms, Inc. Class A (a) | | $ | 1,621,437 | |
| | 16,850 | | | NVIDIA Corporation | | | 7,127,887 | |
| | 9,445 | | | Palo Alto Networks, Inc. (a) | | | 2,413,292 | |
| | 5,100 | | | ServiceNow, Inc. (a) | | | 2,866,047 | |
| | 94,250 | | | Shopify Inc. ― ADR (a) | | | 6,088,550 | |
| | 21,450 | | | Snowflake Inc. (a) | | | 3,774,771 | |
| | 16,154 | | | Sprout Social, Inc. (a) | | | 745,669 | |
| | | | | | | | 37,845,931 | |
| | | | | TOTAL COMMON STOCKS | | | | |
| | | | | (Cost $70,329,073) | | $ | 107,235,792 | |
| | | | | | | | | |
| | | | | SHORT-TERM INVESTMENTS ― 0.5% | | | | |
| | 494,516 | | | First American U.S. Treasury Money Market Fund, Class Z, 4.91% (b) | | | 494,516 | |
| | | | | TOTAL SHORT-TERM INVESTMENTS (Cost $494,516) | | $ | 494,516 | |
| | | | | | | | | |
| | | | | TOTAL INVESTMENTS ― 99.9% (Cost $70,823,589) | | | 107,730,308 | |
| | | | | Other Assets in Excess of Liabilities ― 0.1% | | | 58,214 | |
| | | | | TOTAL NET ASSETS ― 100.0% | | $ | 107,788,522 | |
| ADR: | American Depositary Receipt. |
| (a): | Non Income Producing. |
| (b): | Variable rate security. The rate disclosed is the annualized seven-day effective yield as of June 30, 2023. |
The accompanying notes are an integral part of these financial statements.
Zevenbergen Growth Fund
Statement of Assets and Liabilities
June 30, 2023
| Assets | | | |
| Investments in securities, at value (cost $70,823,589) | | $ | 107,730,308 | |
| Dividend and interest receivable | | | 4,240 | |
| Receivable for fund shares sold | | | 57,370 | |
| Receivable for investments sold | | | 547,839 | |
| Prepaid expenses | | | 17,465 | |
| Total Assets | | | 108,357,222 | |
| | | | | |
| Liabilities | | | | |
| Payable for fund shares redeemed | | $ | 70,763 | |
| Payable for securities purchased | | | 273,739 | |
| Payable to Adviser | | | 135,433 | |
| Shareholder service fees | | | 22,973 | |
| Distribution fees - Investor Class | | | 3,077 | |
| Accrued other expenses and other liabilities | | | 62,715 | |
| Total Liabilities | | | 568,700 | |
| | | | | |
| Net Assets | | $ | 107,788,522 | |
| | | | | |
| Components of Net Assets | | | | |
| Paid-in capital | | $ | 88,611,940 | |
| Total distributable earnings | | | 19,176,582 | |
| Net Assets | | $ | 107,788,522 | |
| | | | | |
| Investor Class: | | | | |
| Net assets | | $ | 13,794,543 | |
| Shares outstanding (unlimited number of shares authorized, no par value) | | | 532,211 | |
| Net asset value, offering and redemption price per share * | | $ | 25.92 | |
| | | | | |
| Institutional Class: | | | | |
| Net assets | | $ | 93,993,979 | |
| Shares outstanding (unlimited number of shares authorized, no par value) | | | 3,549,182 | |
| Net asset value, offering and redemption price per share * | | $ | 26.48 | |
| * | Shares redeemed or exchanged within 90 days of purchase are charged a 1.00% redemption fee (Note 9). |
The accompanying notes are an integral part of these financial statements.
Zevenbergen Growth Fund
Statement of Operations
For the Year Ended June 30, 2023
| Investment Income | | | |
| Dividends income (net of foreign tax of $1,105) | | $ | 13,872 | |
| Interest income | | | 33,111 | |
| Total investment income | | | 46,983 | |
| | | | | |
| Expenses | | | | |
| Advisory fees (Note 3) | | | 690,070 | |
| Administration fees (Note 3) | | | 100,059 | |
| Shareholder servicing fees (Note 6) | | | 92,249 | |
| Transfer agent fees and expenses (Note 3) | | | 60,650 | |
| Registration fees | | | 40,411 | |
| Distribution fees - Investor Class (Note 7) | | | 29,951 | |
| Legal fees | | | 27,325 | |
| Audit fees | | | 17,800 | |
| Trustees' fees (Note 3) | | | 15,547 | |
| Compliance fees (Note 3) | | | 13,370 | |
| Custody fees (Note 3) | | | 10,072 | |
| Insurance fees | | | 7,868 | |
| Miscellaneous expenses | | | 6,965 | |
| Shareholder reporting fees | | | 5,135 | |
| Total expenses | | | 1,117,472 | |
| Expenses waived by the Adviser (Note 3) | | | (218,943 | ) |
| Net Expenses | | | 898,529 | |
| | | | | |
| Net Investment Loss | | | (851,546 | ) |
| | | | | |
| Realized and Unrealized Gain (Loss) on Investments | | | | |
| Net realized loss on investments | | | (14,092,410 | ) |
| Net change in unrealized appreciation on investments | | | 46,980,971 | |
| Net Realized and Unrealized Gain on Investments | | | 32,888,561 | |
| | | | | |
| Net Increase in Net Assets from Operations | | $ | 32,037,015 | |
The accompanying notes are an integral part of these financial statements.
Zevenbergen Growth Fund
Statements of Changes in Net Assets
| Operations | | For the Year
Ended
June 30, 2023 | | | For the Year
Ended
June 30, 2022 | |
| Net investment loss | | $ | (851,546 | ) | | $ | (1,013,819 | ) |
| Net realized loss on investments | | | (14,092,410 | ) | | | (3,552,743 | ) |
| Net change in unrealized appreciation (depreciation) on investments | | | 46,980,971 | | | | (59,482,326 | ) |
| Net Increase/(Decrease) in Net Assets from Operations | | | 32,037,015 | | | | (64,048,888 | ) |
| | | | | | | | | |
| Distributions to shareholders from | | | | | | | | |
| Net realized gain on investments | | | | | | | | |
| Investor Class | | | — | | | | (593,935 | ) |
| Institutional Class | | | — | | | | (1,367,646 | ) |
| Total Distributions to shareholders | | | — | | | | (1,961,581 | ) |
| | | | | | | | | |
| Capital Transactions | | | | | | | | |
| Proceeds from shares sold | | | | | | | | |
| Investor Class | | | 1,124,548 | | | | 4,141,777 | |
| Institutional Class | | | 20,100,773 | | | | 41,838,718 | |
| Proceeds from shares reinvested | | | | | | | | |
| Investor Class | | | — | | | | 591,218 | |
| Institutional Class | | | — | | | | 1,349,601 | |
| Cost of shares redeemed | | | | | | | | |
| Investor Class | | | (2,854,704 | ) | | | (16,000,404 | ) |
| Institutional Class | | | (10,772,298 | ) | | | (20,214,771 | ) |
| Redemption fees | | | | | | | | |
| Investor Class | | | 718 | | | | 8,402 | |
| Institutional Class | | | 4,580 | | | | 19,151 | |
| Net Increase in Net Assets from Capital Share Transactions | | | 7,603,617 | | | | 11,733,692 | |
| Total Increase/(Decrease) in Net Assets | | | 39,640,632 | | | | (54,276,777 | ) |
| | | | | | | | | |
| Net Assets | | | | | | | | |
| Beginning of year | | | 68,147,890 | | | | 122,424,667 | |
| End of year | | $ | 107,788,522 | | | $ | 68,147,890 | |
| | | | | | | | | |
| Capital Shares Transactions | | | | | | | | |
| Investor Class | | | | | | | | |
| Shares sold | | | 51,509 | | | | 115,542 | |
| Shares reinvested | | | — | | | | 15,690 | |
| Shares redeemed | | | (141,458 | ) | | | (455,982 | ) |
| Net decrease in shares outstanding | | | (89,949 | ) | | | (324,750 | ) |
| | | | | | | | | |
| Institutional Class | | | | | | | | |
| Shares sold | | | 964,887 | | | | 1,739,048 | |
| Shares reinvested | | | — | | | | 35,219 | |
| Shares redeemed | | | (498,864 | ) | | | (579,804 | ) |
| Net increase in shares outstanding | | | 466,023 | | | | 1,194,463 | |
The accompanying notes are an integral part of these financial statements.
Zevenbergen Growth Fund
Financial Highlights
Investor Class
For a Capital Share Outstanding Throughout Each Year Presented:
| | | For the Year
Ended
June 30, 2023 | | | For the Year
Ended
June 30, 2022 | | | For the Year
Ended
June 30, 2021 | | | For the Year
Ended
June 30, 2020 | | | For the Year
Ended
June 30, 2019 | |
| Net Asset Value, Beginning of Year | | $ | 18.11 | | | $ | 42.74 | | | $ | 29.05 | | | $ | 19.00 | | | $ | 16.33 | |
| | | | | | | | | | | | | | | | | | | | | |
| Income (Loss) from Investment Operations: | | | | | | | | | | | | | | | | | | | | |
| Net investment loss (1) | | | (0.26 | ) | | | (0.46 | ) | | | (0.49 | ) | | | (0.27 | ) | | | (0.20 | ) |
| Net realized and unrealized gain/(loss) on investments | | | 8.07 | | | | (23.44 | ) | | | 14.16 | | | | 10.30 | | | | 2.85 | |
| Total from Investment Operations | | | 7.81 | | | | (23.90 | ) | | | 13.67 | | | | 10.03 | | | | 2.65 | |
| | | | | | | | | | | | | | | | | | | | | |
| Less Distributions: | | | | | | | | | | | | | | | | | | | | |
| From net realilzed gain on investments | | | — | | | | (0.74 | ) | | | (0.03 | ) | | | — | | | | — | |
| | | | | | | | | | | | | | | | | | | | | |
| Redemption Fee Proceeds (1) | | | — | * | | | 0.01 | | | | 0.05 | | | | 0.02 | | | | 0.02 | |
| | | | | | | | | | | | | | | | | | | | | |
| Net Asset Value, End of Year | | $ | 25.92 | | | $ | 18.11 | | | $ | 42.74 | | | $ | 29.05 | | | $ | 19.00 | |
| | | | | | | | | | | | | | | | | | | | | |
| Total Return | | | 43.13 | % | | | -56.79 | % | | | 47.22 | % | | | 52.89 | % | | | 16.35 | % |
| | | | | | | | | | | | | | | | | | | | | |
| Supplemental Data and Ratios: | | | | | | | | | | | | | | | | | | | | |
| Net assets, end of year (in thousands) | | $ | 13,795 | | | $ | 11,268 | | | $ | 40,472 | | | $ | 18,492 | | | $ | 4,460 | |
| Ratio of expenses to average net assets | | | | | | | | | | | | | | | | | | | | |
| Before fees waived and reimbursed by the Adviser | | | 1.55 | % | | | 1.55 | % | | | 1.52 | % | | | 2.14 | % | | | 2.78 | % |
| After fees waived and reimbursed by the Adviser | | | 1.30 | % | | | 1.30 | % | | | 1.30 | % | | | 1.30 | % | | | 1.30 | % |
| Ratio of net investment loss to average net assets | | | | | | | | | | | | | | | | | | | | |
| Before fees waived and reimbursed by the Adviser | | | -1.50 | % | | | -1.54 | % | | | -1.47 | % | | | -2.12 | % | | | -2.69 | % |
| After fees waived and reimbursed by the Adviser | | | -1.25 | % | | | -1.29 | % | | | -1.25 | % | | | -1.28 | % | | | -1.21 | % |
| Portfolio turnover rate (2) | | | 21.85 | % | | | 55.60 | % | | | 43.12 | % | | | 38.74 | % | | | 28.68 | % |
| * | Less than $0.01 per share |
| (1) | Per share amounts have been calculated using the average shares method |
| (2) | Portfolio turnover rate is calculated for the Fund without distinguishing between classes. |
The accompanying notes are an integral part of these financial statements.
Zevenbergen Growth Fund
Financial Highlights
Institutional Class
For a Capital Share Outstanding Throughout Each Year Presented:
| | | For the Year
Ended
June 30, 2023 | | | For the Year
Ended
June 30, 2022 | | | For the Year
Ended
June 30, 2021 | | | For the Year
Ended
June 30, 2020 | | | For the Year
Ended
June 30, 2019 | |
| Net Asset Value, Beginning of Year | | $ | 18.45 | | | $ | 43.39 | | | $ | 29.40 | | | $ | 19.18 | | | $ | 16.45 | |
| | | | | | | | | | | | | | | | | | | | | |
| Income (Loss) from Investment Operations: | | | | | | | | | | | | | | | | | | | | |
| Net investment loss (1) | | | (0.20 | ) | | | (0.34 | ) | | | (0.37 | ) | | | (0.20 | ) | | | (0.15 | ) |
| Net realized and unrealized gain/(loss) on investments | | | 8.23 | | | | (23.87 | ) | | | 14.34 | | | | 10.40 | | | | 2.87 | |
| Total from Investment Operations | | | 8.03 | | | | (24.21 | ) | | | 13.97 | | | | 10.20 | | | | 2.72 | |
| | | | | | | | | | | | | | | | | | | | | |
| Less Distributions: | | | | | | | | | | | | | | | | | | | | |
| From net realilzed gain on investments | | | — | | | | (0.74 | ) | | | (0.03 | ) | | | — | | | | — | |
| | | | | | | | | | | | | | | | | | | | | |
| Redemption Fee Proceeds (1) | | | — | * | | | 0.01 | | | | 0.05 | | | | 0.02 | | | | 0.01 | |
| | | | | | | | | | | | | | | | | | | | | |
| Net Asset Value, End of Year | | $ | 26.48 | | | $ | 18.45 | | | $ | 43.39 | | | $ | 29.40 | | | $ | 19.18 | |
| | | | | | | | | | | | | | | | | | | | | |
| Total Return | | | 43.52 | % | | | -56.66 | % | | | 47.68 | % | | | 53.28 | % | | | 16.60 | % |
| | | | | | | | | | | | | | | | | | | | | |
| Supplemental Data and Ratios: | | | | | | | | | | | | | | | | | | | | |
| Net assets, end of year (in thousands) | | $ | 93,994 | | | $ | 56,880 | | | $ | 81,953 | | | $ | 37,302 | | | $ | 14,686 | |
| Ratio of expenses to average net assets | | | | | | | | | | | | | | | | | | | | |
| Before fees waived and reimbursed by the Adviser | | | 1.25 | % | | | 1.25 | % | | | 1.22 | % | | | 1.90 | % | | | 2.52 | % |
| After fees waived and reimbursed by the Adviser | | | 1.00 | % | | | 1.00 | % | | | 1.00 | % | | | 1.00 | % | | | 1.00 | % |
| Ratio of net investment loss to average net assets | | | | | | | | | | | | | | | | | | | | |
| Before fees waived and reimbursed by the Adviser | | | -1.19 | % | | | -1.24 | % | | | -1.17 | % | | | -1.88 | % | | | -2.43 | % |
| After fees waived and reimbursed by the Adviser | | | -0.95 | % | | | -0.99 | % | | | -0.95 | % | | | -0.98 | % | | | -0.91 | % |
| Portfolio turnover rate (2) | | | 21.85 | % | | | 55.60 | % | | | 43.12 | % | | | 38.74 | % | | | 28.68 | % |
| * | Less than $0.01 per share |
| (1) | Per share amounts have been calculated using the average shares method |
| (2) | Portfolio turnover rate is calculated for the Fund without distinguishing between classes. |
The accompanying notes are an integral part of these financial statements.
Zevenbergen Genea Fund
Allocation of Portfolio Holdings
(Calculated as a percentage of Total Investments)
June 30, 2023 (Unaudited)
| * | Short-Term Investments consist of amounts held in money market funds. The Fund strategy does not seek to hold large cash balances (more than 5% of total investments), and any significant cash holdings are typically due to trade settlement timing. |
Zevenbergen Genea Fund
Schedule of Investments
As of June 30, 2023
Number of
Shares | | | | | Value | |
| | | | COMMON STOCKS ― 98.8% | | | |
| | | | | CONSUMER DISCRETIONARY ― 43.1% | | | | |
| | 18,700 | | | Airbnb, Inc. (a) | | $ | 2,396,592 | |
| | 46,000 | | | Amazon.com, Inc. (a) | | | 5,996,560 | |
| | 3,585 | | | MercadoLibre, Inc. (a) | | | 4,246,791 | |
| | 6,750 | | | Netflix, Inc. (a) | | | 2,973,307 | |
| | 22,900 | | | Rivian Automotive, Inc. (a) | | | 381,514 | |
| | 37,400 | | | Tesla, Inc. (a) | | | 9,790,198 | |
| | 76,100 | | | The Trade Desk, Inc. (a) | | | 5,876,442 | |
| | 69,100 | | | Uber Technologies, Inc. (a) | | | 2,983,047 | |
| | | | | | | | 34,644,451 | |
| | | | | ENERGY ― 1.7% | | | | |
| | 4,100 | | | First Solar, Inc. (a) | | | 779,369 | |
| | 22,800 | | | Shoals Technologies Group, Inc. (a) | | | 582,768 | |
| | | | | | | | 1,362,137 | |
| | | | | INDUSTRIALS ― 10.5% | | | | |
| | 58,100 | | | Aspen Aerogels, Inc. (a) | | | 458,409 | |
| | 15,650 | | | Axon Enterprise, Inc. (a) | | | 3,053,628 | |
| | 25,900 | | | Bill Holdings, Inc. (a) | | | 3,026,415 | |
| | 28,900 | | | Block, Inc. (a) | | | 1,923,873 | |
| | | | | | | | 8,462,325 | |
| | | | | REAL ESTATE ― 3.4% | | | | |
| | 54,700 | | | Zillow Group, Inc. Class C (a) | | | 2,749,222 | |
| | | | | | | | | |
| | | | | TECHNOLOGY ― 40.1% | | | | |
| | 17,800 | | | Advanced Micro Devices, Inc. (a) | | | 2,027,598 | |
| | 2,100 | | | ASML Holding N.V. ― ADR | | | 1,521,975 | |
| | 33,800 | | | Bumble Inc. (a) | | | 567,164 | |
| | 8,100 | | | CrowdStrike Holdings, Inc. (a) | | | 1,189,647 | |
| | 23,000 | | | Datadog, Inc. (a) | | | 2,262,740 | |
| | 32,232 | | | DoubleVerify Holdings, Inc. (a) | | | 1,254,469 | |
| | 62,300 | | | Global-E Online Ltd. ― ADR (a) | | | 2,550,562 | |
| | 9,200 | | | MongoDB, Inc. (a) | | | 3,781,108 | |
| | 16,400 | | | NVIDIA Corporation | | | 6,937,528 | |
| | 13,000 | | | ON Semiconductor Corporation (a) | | | 1,229,540 | |
| | 62,850 | | | Shopify Inc. ― ADR (a) | | | 4,060,110 | |
| | 20,300 | | | Snowflake Inc. (a) | | | 3,572,394 | |
| | 16,300 | | | Sprout Social, Inc. (a) | | | 752,408 | |
| | 23,300 | | | Xometry, Inc. (a) | | | 493,494 | |
| | | | | | | | 32,200,737 | |
The accompanying notes are an integral part of these financial statements.
Zevenbergen Genea Fund
Schedule of Investments (Continued)
As of June 30, 2023
Number of
Shares | | | | | Value | |
| | | | | TOTAL COMMON STOCKS | | | | |
| | | | | (Cost $46,882,906) | | $ | 79,418,872 | |
| | | | | | | | | |
| | | | | SHORT-TERM INVESTMENTS ― 1.1% | | | | |
| | 898,223 | | | First American U.S. Treasury Money Market Fund, Class Z, 4.91% (b) | | | 898,223 | |
| | | | | TOTAL SHORT-TERM INVESTMENTS (Cost $898,223) | | | | |
| | | | | | | $ | 898,223 | |
| | | | | | | | | |
| | | | | TOTAL INVESTMENTS ― 99.9% (Cost $47,781,129) | | | 80,317,095 | |
| | | | | Other Assets in Excess of Liabilities ― 0.1% | | | 78,246 | |
| | | | | TOTAL NET ASSETS ― 100.0% | | $ | 80,395,341 | |
| | | | | | | | | |
| | ADR: | | | American Depositary Receipt. | | | | |
| | (a): | | | Non Income Producing. | | | | |
| | (b): | | | Variable rate security. The rate disclosed is the annualized seven-day effective yield as of June 30, 2023. | | | | |
The accompanying notes are an integral part of these financial statements.
Zevenbergen Genea Fund
Statement of Assets and Liabilities
June 30, 2023
| Assets | | | |
| Investments in securities, at value (cost $47,781,129) | | $ | 80,317,095 | |
| Receivable for fund shares sold | | | 58,810 | |
| Receivable for investments sold | | | 242,287 | |
| Dividends and interest receivable | | | 3,268 | |
| Prepaid expenses | | | 15,417 | |
| Total Assets | | | 80,636,877 | |
| | | | | |
| Liabilities | | | | |
| Payable for fund shares redeemed | | | 43,852 | |
| Payable for securities purchased | | | 49,189 | |
| Payable to Adviser | | | 59,129 | |
| Shareholder service fees | | | 6,628 | |
| Distribution fees - Investor class | | | 11,555 | |
| Accrued other expenses and other liabilities | | | 71,183 | |
| Total Liabilities | | | 241,536 | |
| | | | | |
| Net Assets | | $ | 80,395,341 | |
| | | | | |
| Components of Net Assets | | | | |
| Paid-in capital | | $ | 92,414,637 | |
| Total accumulated losses | | | (12,019,296 | ) |
| Net Assets | | $ | 80,395,341 | |
| | | | | |
| Investor Class: | | | | |
| Net assets | | $ | 40,716,224 | |
| Shares outstanding (unlimited number of shares authorized, no par value) | | | 1,227,759 | |
| Net asset value, offering and redemption price per share * | | $ | 33.16 | |
| | | | | |
| Institutional Class: | | | | |
| Net assets | | $ | 39,679,117 | |
| Shares outstanding (unlimited number of shares authorized, no par value) | | | 1,171,875 | |
| Net asset value, offering and redemption price per share * | | $ | 33.86 | |
| * | Shares redeemed or exchanged within 90 days of purchase are charged a 1.00% redemption fee (Note 9). |
The accompanying notes are an integral part of these financial statements.
Zevenbergen Genea Fund
Statement of Operations
For the Year Ended June 30, 2023
| Investment Income | | | |
| Dividends income (net of foreign tax of $1,005) | | $ | 8,989 | |
| Interest income | | | 11,548 | |
| Total investment income | | | 20,537 | |
| | | | | |
| Expenses | | | | |
| Advisory fees (Note 3) | | | 562,071 | |
| Administration fees (Note 3) | | | 108,369 | |
| Shareholder servicing fees (Note 6) | | | 87,282 | |
| Distribution fees - Investor Class (Note 7) | | | 85,116 | |
| Transfer agent fees and expenses (Note 3) | | | 66,160 | |
| Registration fees | | | 37,169 | |
| Legal fees | | | 26,395 | |
| Audit fees | | | 17,800 | |
| Custody fees (Note 3) | | | 15,551 | |
| Trustees' fees (Note 3) | | | 15,545 | |
| Compliance fees (Note 3) | | | 13,372 | |
| Miscellaneous expenses | | | 7,853 | |
| Insurance fees | | | 7,244 | |
| Shareholder reporting fees | | | 7,058 | |
| Total expenses | | | 1,056,985 | |
| Expenses waived by the Adviser (Note 3) | | | (252,257 | ) |
| | | | | |
| Net Expenses | | | 804,728 | |
| | | | | |
| Net Investment Loss | | | (784,191 | ) |
| | | | | |
| Realized and Unrealized Loss on Investments | | | | |
| Net realized loss on investments | | | (25,478,126 | ) |
| Net change in unrealized appreciation (depreciation) on investments | | | 50,417,555 | |
| Net Realized and Unrealized Gain on Investments | | | 24,939,429 | |
| | | | | |
| Net Increase in Net Assets from Operations | | $ | 24,155,238 | |
The accompanying notes are an integral part of these financial statements.
Zevenbergen Genea Fund
Statements of Changes in Net Assets
| Operations | | For the Year
Ended
June 30, 2023 | | | For the Year
Ended
June 30, 2022 | |
| Net investment loss | | $ | (784,191 | ) | | $ | (1,896,389 | ) |
| Net realized loss on investments | | | (25,478,126 | ) | | | (15,654,021 | ) |
| Net change in unrealized appreciation (depreciation) on investments | | | 50,417,555 | | | | (91,951,523 | ) |
| Net Increase/(Decrease) in Net Assets from Operations | | | 24,155,238 | | | | (109,501,933 | ) |
| | | | | | | | | |
| Capital Transactions | | | | | | | | |
| Proceeds from shares sold | | | | | | | | |
| Investor Class | | | 7,013,531 | | | | 11,385,801 | |
| Institutional Class | | | 3,499,824 | | | | 29,654,439 | |
| Cost of shares redeemed | | | | | | | | |
| Investor Class | | | (10,603,309 | ) | | | (46,468,920 | ) |
| Institutional Class | | | (14,400,204 | ) | | | (42,308,099 | ) |
| Redemption fees | | | | | | | | |
| Investor Class | | | 10,599 | | | | 24,844 | |
| Institutional Class | | | 10,616 | | | | 25,284 | |
| Net Decrease in Net Assets from Capital Share Transactions | | | (14,468,943 | ) | | | (47,686,651 | ) |
| | | | | | | | | |
| Total Increase/(Decrease) in Net Assets | | | 9,686,295 | | | | (157,188,584 | ) |
| | | | | | | | | |
| Net Assets | | | | | | | | |
| Beginning of year | | | 70,709,046 | | | | 227,897,630 | |
| End of year | | $ | 80,395,341 | | | $ | 70,709,046 | |
| | | | | | | | | |
| Capital Shares Transactions | | | | | | | | |
| Investor Class | | | | | | | | |
| Shares sold | | | 249,540 | | | | 232,676 | |
| Shares redeemed | | | (415,231 | ) | | | (979,558 | ) |
| Net decrease in shares outstanding | | | (165,691 | ) | | | (746,882 | ) |
| | | | | | | | | |
| Institutional Class | | | | | | | | |
| Shares sold | | | 127,748 | | | | 635,432 | |
| Shares redeemed | | | (562,599 | ) | | | (901,184 | ) |
| Net decrease in shares outstanding | | | (434,851 | ) | | | (265,752 | ) |
The accompanying notes are an integral part of these financial statements.
Zevenbergen Genea Fund
Financial Highlights
Investor Class
| For a Capital Share Outstanding Throughout Each Year Presented: |
| |
| | | For the Year
Ended
June 30, 2023 | | | For the Year
Ended
June 30, 2022 | | | For the Year
Ended
June 30, 2021 | | | For the Year
Ended
June 30, 2020 | | | For the Year
Ended
June 30, 2019 | |
| Net Asset Value, Beginning of Year | | $ | 23.34 | | | $ | 56.40 | | | $ | 33.34 | | | $ | 23.12 | | | $ | 20.77 | |
| | | | | | | | | | | | | | | | | | | | | |
| Income (Loss) from Investment Operations: | | | | | | | | | | | | | | | | | | | | |
| Net investment loss (1) | | | (0.34 | ) | | | (0.61 | ) | | | (0.69 | ) | | | (0.32 | ) | | | (0.29 | ) |
| Net realized and unrealized gain/(loss) on investments | | | 10.15 | | | | (32.46 | ) | | | 23.65 | | | | 10.53 | | | | 2.68 | |
| Total from Investment Operations | | | 9.81 | | | | (33.07 | ) | | | 22.96 | | | | 10.21 | | | | 2.39 | |
| | | | | | | | | | | | | | | | | | | | | |
| Less Distributions: | | | | | | | | | | | | | | | | | | | | |
| From net realized gain on investments | | | — | | | | — | | | | — | | | | — | | | | (0.06 | ) |
| | | | | | | | | | | | | | | | | | | | | |
| Redemption Fee Proceeds (1) | | | 0.01 | | | | 0.01 | | | | 0.10 | | | | 0.01 | | | | 0.02 | |
| | | | | | | | | | | | | | | | | | | | | |
| Net Asset Value, End of Year | | $ | 33.16 | | | $ | 23.34 | | | $ | 56.40 | | | $ | 33.34 | | | $ | 23.12 | |
| | | | | | | | | | | | | | | | | | | | | |
| Total Return | | | 42.07 | % | | | -58.62 | % | | | 69.17 | % | | | 44.20 | % | | | 11.72 | % |
| | | | | | | | | | | | | | | | | | | | | |
| Supplemental Data and Ratios: | | | | | | | | | | | | | | | | | | | | |
| Net assets, end of year (in thousands) | | $ | 40,716 | | | $ | 32,528 | | | $ | 120,716 | | | $ | 32,763 | | | $ | 28,986 | |
| Ratio of expenses to average net assets | | | | | | | | | | | | | | | | | | | | |
| Before fees waived and reimbursed by the Adviser | | | 1.66 | % | | | 1.49 | % | | | 1.48 | % | | | 1.98 | % | | | 2.09 | % |
| After fees waived and reimbursed by the Adviser | | | 1.30 | % | | | 1.30 | % | | | 1.37 | % | | | 1.40 | % | | | 1.40 | % |
| Ratio of net investment loss to average net assets | | | | | | | | | | | | | | | | | | | | |
| Before fees waived and reimbursed by the Adviser | | | -1.63 | % | | | -1.49 | % | | | -1.47 | % | | | -1.96 | % | | | -2.04 | % |
| After fees waived and reimbursed by the Adviser | | | -1.27 | % | | | -1.30 | % | | | -1.36 | % | | | -1.38 | % | | | -1.35 | % |
| Portfolio turnover rate (2) | | | 19.89 | % | | | 17.80 | % | | | 32.40 | % | | | 61.63 | % | | | 35.25 | % |
| (1) | Per share amounts have been calculated using the average shares method |
| (2) | Portfolio turnover rate is calculated for the Fund without distinguishing between classes. |
The accompanying notes are an integral part of these financial statements.
Zevenbergen Genea Fund
Financial Highlights
Institutional Class
| For a Capital Share Outstanding Throughout Each Year Presented: |
| |
| | | For the Year
Ended
June 30, 2023 | | | For the Year
Ended
June 30, 2022 | | | For the Year
Ended
June 30, 2021 | | | For the Year
Ended
June 30, 2020 | | | For the Year
Ended
June 30, 2019 | |
| Net Asset Value, Beginning of Year | | $ | 23.76 | | | $ | 57.24 | | | $ | 33.74 | | | $ | 23.33 | | | $ | 20.93 | |
| | | | | | | | | | | | | | | | | | | | | |
| Income (Loss) from Investment Operations: | | | | | | | | | | | | | | | | | | | | |
| Net investment loss (1) | | | (0.26 | ) | | | (0.47 | ) | | | (0.54 | ) | | | (0.25 | ) | | | (0.22 | ) |
| Net realized and unrealized gain/(loss) on investments | | | 10.35 | | | | (33.02 | ) | | | 23.94 | | | | 10.65 | | | | 2.66 | |
| Total from Investment Operations | | | 10.09 | | | | (33.49 | ) | | | 23.40 | | | | 10.40 | | | | 2.44 | |
| | | | | | | | | | | | | | | | | | | | | |
| Less Distributions: | | | | | | | | | | | | | | | | | | | | |
| From net realized gain on investments | | | — | | | | — | | | | — | | | | — | | | | (0.06 | ) |
| | | | | | | | | | | | | | | | | | | | | |
| Redemption Fee Proceeds (1) | | | 0.01 | | | | 0.01 | | | | 0.10 | | | | 0.01 | | | | 0.02 | |
| | | | | | | | | | | | | | | | | | | | | |
| Net Asset Value, End of Year | | $ | 33.86 | | | $ | 23.76 | | | $ | 57.24 | | | $ | 33.74 | | | $ | 23.33 | |
| | | | | | | | | | | | | | | | | | | | | |
| Total Return | | | 42.51 | % | | | -58.49 | % | | | 69.65 | % | | | 44.62 | % | | | 11.87 | % |
| | | | | | | | | | | | | | | | | | | | | |
| Supplemental Data and Ratios: | | | | | | | | | | | | | | | | | | | | |
| Net assets, end of year (in thousands) | | $ | 39,679 | | | $ | 38,181 | | | $ | 107,182 | | | $ | 25,179 | | | $ | 16,312 | |
| Ratio of expenses to average net assets | | | | | | | | | | | | | | | | | | | | |
| Before fees waived and reimbursed by the Adviser | | | 1.36 | % | | | 1.20 | % | | | 1.18 | % | | | 1.70 | % | | | 1.80 | % |
| After fees waived and reimbursed by the Adviser | | | 1.00 | % | | | 1.00 | % | | | 1.07 | % | | | 1.10 | % | | | 1.10 | % |
| Ratio of net investment loss to average net assets | | | | | | | | | | | | | | | | | | | | |
| Before fees waived and reimbursed by the Adviser | | | -1.33 | % | | | -1.20 | % | | | -1.17 | % | | | -1.68 | % | | | -1.75 | % |
| After fees waived and reimbursed by the Adviser | | | -0.97 | % | | | -1.00 | % | | | -1.06 | % | | | -1.08 | % | | | -1.05 | % |
| Portfolio turnover rate (2) | | | 19.89 | % | | | 17.80 | % | | | 32.40 | % | | | 61.63 | % | | | 35.25 | % |
| (1) | Per share amounts have been calculated using the average shares method |
| (2) | Portfolio turnover rate is calculated for the Fund without distinguishing between classes. |
The accompanying notes are an integral part of these financial statements.
Zevenbergen Funds
Notes to the Financial Statements
June 30, 2023
NOTE 1 – ORGANIZATION
Zevenbergen Growth Fund (the “Growth Fund”) and Zevenbergen Genea Fund (the “Genea Fund”; each a “Fund”, and collectively the “Funds”) are non-diversified series of Trust for Advised Portfolios (the “Trust”). The Trust, a Delaware Statutory Trust, is registered under the Investment Company Act of 1940, as amended (the “1940 Act”) as an open-end management investment company. Zevenbergen Capital Investments LLC (the “Adviser”) serves as the investment manager to the Funds. The inception date of the Funds was August 31, 2015. The Funds’ investment objective is long-term capital appreciation.
Growth Fund and Genea Fund, each, currently offer two classes of shares, Institutional Class and Investor Class. Each share class represents an equal interest in the Fund, except the difference of class specific expenses, which reflects the difference in the range of services provided to each class. Income, expenses (other than class specific), and realized and unrealized gains and losses on investments are allocated daily to each class based on relative net assets.
NOTE 2 – SIGNIFICANT ACCOUNTING POLICIES
The following is a summary of significant accounting policies consistently followed by the Funds in preparation of their financial statements. These policies are in conformity with accounting principles generally accepted in the United States of America (“U.S. GAAP”) for investment companies. Each Fund is considered an investment company under U.S. GAAP and follows the accounting and reporting guidance applicable to investment companies in the Financial Accounting Standards Board Accounting Standards Codification Topic 946. The presentation of financial statements in conformity with U.S. GAAP requires management to make estimates and assumptions that affect the reported amounts of assets and liabilities and disclosure of contingent assets and liabilities at the date of the financial statements and the reported amounts of income and expenses during the period. Actual results may differ from those estimates.
A. Securities Valuation
The Funds follow a fair value hierarchy that distinguishes between market data obtained from independent sources (observable inputs) and the Adviser’s own market assumptions (unobservable inputs). The inputs or methodology used in determining the value of each Fund’s investments are not necessarily an indication of the risk associated with investing in those securities.
Various inputs are used in determining the value of the Funds’ investments. These inputs are summarized into three broad categories as defined below:
| Level 1 - | Quoted prices in active markets for identical securities. An active market for a security is a market in which transactions occur with sufficient frequency and volume to provide pricing information on an ongoing basis. A quoted price in an active market provides the most reliable evidence of fair value. |
| Level 2 - | Observable inputs other than quoted prices included in Level 1 that are observable for the asset or liability either directly or indirectly. These inputs may include quoted prices for the identical instrument on an inactive market, prices for similar instruments, interest rates, prepayment speeds, credit risk, yield curves, default rates, and similar data. |
| Level 3 - | Significant unobservable inputs, including the Adviser’s assumptions in determining fair value of investments. |
Equity securities that are traded on a national securities exchange are stated at the last reported sales price on the day of valuation. To the extent these securities are actively traded and valuation adjustments are not applied, they are categorized as Level 1 of the fair value hierarchy. When reliable market quotations are not readily available or a pricing service does not provide a valuation (or provides a valuation that in the judgment of the Adviser does not represent the security’s fair value) or when, in the judgment of the Adviser, events have rendered the market value unreliable, a security is fair valued in good faith by the Adviser under procedures approved by the Board of Trustees of the Trust (the “Board”).
Zevenbergen Funds
Notes to the Financial Statements (Continued)
June 30, 2023
NOTE 2 – SIGNIFICANT ACCOUNTING POLICIES (Continued)
Short-term investments classified as money market instruments are valued at net asset value (“NAV”). These investments are categorized as Level 1 of the fair value hierarchy.
The inputs or methodology used for valuing securities are not necessarily an indication of the risk associated with investing in those securities. The following is a summary of the fair values of the Funds’ investments in each category investment type as of June 30, 2023:
Growth Fund
| Description | | Level 1 | | | Level 2 | | | Level 3 | | | Total | |
| Investments | | | | | | | | | | | | | | | | |
| Common Stocks | | $ | 107,235,792 | | | $ | — | | | $ | — | | | $ | 107,235,792 | |
| Short-Term Investments | | | 494,516 | | | | — | | | | — | | | | 494,516 | |
| Total Investments | | $ | 107,730,308 | | | $ | — | | | $ | — | | | $ | 107,730,308 | |
Genea Fund
| Description | | Level 1 | | | Level 2 | | | Level 3 | | | Total | |
| Investments | | | | | | | | | | | | | | | | |
| Common Stocks | | $ | 79,418,872 | | | $ | — | | | $ | — | | | $ | 79,418,872 | |
| Short-Term Investments | | | 898,223 | | | | — | | | | — | | | | 898,223 | |
| Total Investments | | $ | 80,317,095 | | | $ | — | | | $ | — | | | $ | 80,317,095 | |
Please refer to the Schedule of Investments for further classification.
B. Concentration and Sector Risks
To the extent the investment strategy invests more heavily in particular industries, groups of industries, or sectors of the economy, its performance will be especially sensitive to developments that significantly affect those industries, groups of industries, or sectors of the economy. As of June 30, 2023, over 25% of each Funds’ assets were invested in securities of both the consumer discretionary and technology sectors. Some relevant risks related to the sectors are described below:
Consumer Discretionary. Changes in the domestic and international economies, interest rates, competition, consumer confidence, disposable household income, and consumer spending may affect companies in this sector.
Technology. Changes in domestic and international competition, economic cycles, financial resources, personnel availability, rapid innovation and intellectual property issues may affect companies in this sector.
C. Security Transactions, Investment Income and Distributions
The Funds record security transactions based on trade date. Realized gains and losses on sales of securities are calculated by comparing the original cost of the specifically identified security lot sold with the net sales proceeds. Dividend income is recognized on the ex -dividend date, and interest income is recognized on an accrual basis. Withholding taxes on foreign dividends have been provided for in accordance with the Trust’s understanding of the applicable country’s tax rules and rates.
Zevenbergen Funds
Notes to the Financial Statements (Continued)
June 30, 2023
NOTE 2 – SIGNIFICANT ACCOUNTING POLICIES (Continued)
D. Federal Income Taxes
The Funds have elected to be taxed as Regulated Investment Companies (“RIC”) under the U.S. Internal Revenue Code of 1986, as amended, and intend to maintain this qualification and to distribute substantially all of their net taxable income to their shareholders. Therefore, no provision is made for federal income taxes. Due to the timing of dividend distributions (if any) and the differences in accounting for income and realized gains and losses for financial statement and federal income tax purposes, the fiscal year in which amounts are distributed may differ from the year in which the income and realized gains and losses are recorded by the Funds.
Management of the Funds is required to analyze all open tax years, as defined by IRS statute of limitations for all major jurisdictions, including federal tax authorities and certain state tax authorities. As of and during the period ended June 30, 2023, the Funds did not have a liability for any unrecognized tax benefits. Generally, tax authorities can examine tax returns filed for the preceding three years. The Funds are not aware of any tax positions for which it is reasonably possible that the total amounts of unrecognized tax benefits will significantly change in the next twelve months.
NOTE 3 – INVESTMENT MANAGEMENT AGREEMENT AND OTHER RELATED PARTY TRANSACTIONS
The Trust entered into an agreement for the Adviser to furnish investment advisory services to the Funds. Under the terms of this agreement, Growth Fund and Genea Fund will pay the Adviser a monthly fee based on each Fund’s average daily net assets at the annual rate of 0.80%.
The Adviser has contractually agreed to waive its management fee and/or reimburse each Fund’s operating expenses (excluding shareholder servicing fees, any front-end or contingent deferred loads, taxes, leverage interest, brokerage commissions, acquired fund fees and expenses, merger or reorganization-related expenses, portfolio transaction expenses, interest expense and dividends paid on short sales, and extraordinary expenses) to ensure they do not exceed, on an annual basis, the expense limitations, expressed as a percentage rate of the average daily net assets of each Fund, listed below. Waivers or reimbursements are calculated daily and settled monthly or quarterly in conjunction with each Fund's payment of advisory fees.
| Fund | Investor Class | Institutional Class |
| Growth Fund | 1.15% | 0.90% |
| Genea Fund | 1.15% | 0.90% |
See Note 6 – Shareholder Servicing Plan for shareholder servicing fees charged in addition to fees outlined in this table.
The Adviser is permitted to recapture amounts waived and/or reimbursed to a class within three years if the class’s total annual operating expenses have fallen to a level below the expense limitation (“expense cap”) in effect at the time the fees were earned or the expenses incurred. However, in no case will the Adviser recapture any amount that would result, on any particular business day of the Funds, in the class’s total annual operating expenses exceeding the expense cap or any other lower limit then in effect.
Zevenbergen Funds
Notes to the Financial Statements (Continued)
June 30, 2023
NOTE 3 – INVESTMENT MANAGEMENT AGREEMENT AND OTHER RELATED PARTY TRANSACTIONS (CONTINUED)
At June 30, 2023, the expenses reimbursed to the Funds and contractual fees waived by the Adviser and subject to potential recapture by period were as follows:
Fiscal Year
waived/reimbursed | | Growth Fund | | | Genea Fund | | | Expiration | |
| FYE June 30, 2021 | | | 222,372 | | | | 178,337 | | | June 30, 2024 | |
| FYE June 30, 2022 | | | 231,846 | | | | 324,918 | | | June 30, 2025 | |
| FYE June 30, 2023 | | | 218,943 | | | | 252,257 | | | June 30, 2026 | |
| | | $ | 673,161 | | | $ | 755,512 | | | | |
| | | | | | | | | | | | |
U.S. Bancorp Fund Services, LLC, doing business as U.S. Bank Global Fund Services (“Fund Services”), serves as the Funds’ administrator, fund accountant, transfer agent, and provides compliance services to the Funds. The officers of the Trust are employees of Fund Services. U.S. Bank serves as the Funds’ custodian and provides compliance services to the Funds. For the year ended June 30, 2023, the Funds incurred the following expenses for administration and fund accounting, custody, transfer agent and compliance fees:
| | | Growth Fund | | Genea Fund |
| Administration | | $ 100,059 | | | $ 108,369 | |
| Custody | | 10,072 | | | 15,551 | |
| Transfer Agency | | 60,650 | | | 66,160 | |
| Compliance | | 13,370 | | | 13,372 | |
At June 30, 2023, the Funds had payables due to Fund Services and its affiliates for administration and fund accounting, custody, transfer agent and compliance fees in the following amounts:
| | | Growth Fund | | Genea Fund |
| Administration | | $ 22,159 | | | $ 28,110 | |
| Custody | | 1,185 | | | 2,733 | |
| Transfer Agency | | 14,710 | | | 16,566 | |
| Compliance | | 3,207 | | | 3,209 | |
The above payable amounts are included in the Accrued other expenses and other liabilities line item in the Statement of Assets and Liabilities.
The Independent Trustees were paid $31,092 for their services to the Funds during the year ended June 30, 2023. No compensation is paid directly by the Funds to the Interested Trustee or officers of the Trust.
Zevenbergen Funds
Notes to the Financial Statements (Continued)
June 30, 2023
NOTE 4 – INVESTMENT TRANSACTIONS
Purchases and sales of investment securities (excluding short-term investments) for each Fund for the year ended June 30, 2023, were as follows:
| Growth Fund | | |
|
| |
| Purchases | | | $ | 27,312,876 | |
| Sales | | | $ | 18,622,621 | |
| | | | | | |
| Genea Fund | | |
|
| |
| Purchases | | | $ | 13,917,163 | |
| Sales | | | $ | 29,672,332 | |
NOTE 5 – FEDERAL INCOME TAX INFORMATION
At June 30, 2023, the components of distributable earnings for income tax purposes were as follows:
| | | Growth
Fund | | | Genea
Fund | |
| | | | | | | |
| Cost of investments | | $ | 71,017,713 | | | $ | 48,025,654 | |
| Gross unrealized appreciation | | | 41,927,915 | | | | 39,448,808 | |
| Gross unrealized depreciation | | | (5,215,320 | ) | | | (7,157,367 | ) |
| Net unrealized appreciation on investments | | | 36,712,595 | | | | 32,291,441 | |
| | | | | | | | | |
| Undistributed ordinary income | | | — | | | | — | |
| Undistributed long-term capital gains | | | — | | | | — | |
| Accumulated earnings | | | — | | | | — | |
| | | | | | | | | |
| Capital loss carryforwards | | | (17,471,750 | ) | | | (44,310,737 | ) |
| Other book/tax temporary differences | | | (64,263 | ) | | | — | |
| Total accumulated gains/losses | | $ | 19,176,582 | | | $ | (12,019,296 | ) |
The difference between book basis and tax basis unrealized appreciation/(depreciation) is attributable in part to the tax deferral of losses on wash sales.
GAAP requires that certain components of net assets be reclassified between financial and tax reporting. These reclassifications have no effect on net assets or net asset value per share. For the year ended June 30, 2023, permanent differences, due to net operating losses, in book and tax accounting have been reclassified to capital and distributable earnings as follows:
| | | | Distributable Earnings | | Paid In Capital |
| Growth Fund | | | $ | 1,168,561 | | | $ | (1,168,561 | ) |
| Genea Fund | | | $ | 1,433,886 | | | $ | (1,433,886 | ) |
Zevenbergen Funds
Notes to the Financial Statements (Continued)
June 30, 2023
NOTE 5 – FEDERAL INCOME TAX INFORMATION (CONTINUED)
The following table summarizes the characteristics of distributions paid during the year ended June 30, 2023:
| | | | Short-Term
Capital Gains | | Long-Term
Capital Gains | | Total
Distributions Paid |
| Growth Fund | | | $ | — | | | $ | — | | | $ | — | |
| Genea Fund | | | $ | — | | | $ | — | | | $ | — | |
The following table summarizes the characteristics of distributions paid during the year ended June 30, 2022:
| | | | Short-Term
Capital Gains | | Long-Term
Capital Gains | | Total
Distributions Paid |
| Growth Fund | | | $ | — | | | $ | 1,961,581 | | | $ | 1,961,581 | |
| Genea Fund | | | $ | — | | | $ | — | | | $ | — | |
The Funds are required, in order to meet certain excise tax requirements, to measure and distribute annually, net capital gains realized during the twelve month period ending October 31. In connection with this requirement, the Funds are permitted, for tax purposes, to defer into their next fiscal year any net capital losses incurred from November 1 through the end of the fiscal year. Late year losses incurred after December 31 within the fiscal year are deemed to arise on the first business day of the following fiscal year for tax purposes. At June 30, 2023, the Funds deferred the following losses on a tax basis:
| | | | Late Year Loss | | Post October Loss |
| Growth Fund | | | $ | 64,263 | | | $ | — | |
| Genea Fund | | | $ | — | | | $ | — | |
At June 30, 2023, the Funds had capital loss carryforwards, which reduce the Funds’ taxable income arising from future net realized gains on investments, if any, to the extent permitted by the Internal Revenue Code, and thus will reduce the amount of distributions to shareholders which would otherwise be necessary to relieve the Funds of any liability for federal tax. Pursuant to the Internal Revenue Code, the character of such capital loss carryforwards is as follows:
| | | | Capital Loss Carryforwards Not Subject to Expiration | |
| | | | Short-Term | | Long-Term | | Total |
| Growth Fund | | | $ | 17,471,750 | | | $ | — | | | $ | 17,471,750 | |
| Genea Fund | | | $ | 17,681,943 | | | $ | 26,628,794 | | | $ | 44,310,737 | |
Zevenbergen Funds
Notes to the Financial Statements (Continued)
June 30, 2023
NOTE 6 – SHAREHOLDER SERVICING PLAN
The Trust, on behalf of the Funds, has adopted a Shareholder Servicing Plan to pay a fee at an annual rate on average daily net assets as follows:
| Fund | Investor Class | Institutional Class |
| Growth Fund | 0.15% | 0.10% |
| Genea Fund | 0.15% | 0.10% |
The Shareholder Servicing Plan authorizes payment of a shareholder servicing fee to the financial intermediaries and other service providers who provide administrative and support services to Fund shareholders.
For the year ended June 30, 2023, class specific Shareholder Servicing fees were as follows:
| Fund | Investor Class | Institutional Class |
| Growth Fund | $ 17,970 | $ 74,279 |
| Genea Fund | 51,070 | 36,212 |
NOTE 7 – DISTRIBUTION PLAN
The Trust, on behalf of the Funds, has adopted a Distribution Plan (the “Plan”) pursuant to Rule 12b -1 under the 1940 Act that allows each Fund to pay distribution fees for the sale and distribution of its Investor Class shares. The Plan provides for the payment of distribution fees at the annual rate of up to 0.25% of average daily net assets of the Investor Class shares. For the year ended June 30, 2023, distribution fees incurred are disclosed on the Statement of Operations.
NOTE 8 – COMMITMENTS AND CONTINGENCIES
In the normal course of business, each Fund enters into contracts that provide general indemnifications by each Fund to the counterparty to the contract. Each Fund’s maximum exposure under these arrangements is dependent on future claims that may be made against each Fund and, therefore, cannot be estimated; however, based on experience, the risk of loss from such claims is considered remote.
NOTE 9 – REDEMPTION FEES
Each Fund charges a 1.00% redemption fee on the redemption of Investor Class and Institutional Class shares held for 90 days or less. This fee (which is paid into the Fund) is imposed in order to help offset the transaction costs and administrative expenses associated with the activities of short-term “market timers” that engage in the frequent purchase and sale of Fund shares. The fee is accounted for as an addition to paid-in capital. Each Fund reserves the right to modify the terms of or terminate the fee at any time. There are limited exceptions to the imposition of the redemption fee. Please refer to Statements of Changes in Net Assets for fees recognized.
NOTE 10 – CONTROL OWNERSHIP
The beneficial ownership, either directly or indirectly, of more than 25% of the voting securities of the funds create resumption of control of the funds under 2(a)(9) of the 1940 Act. As of June 30, 2023, Charles Schwab & Co. Inc. held approximately 50.25% and Pershing LLC held approximately 40.41%, in aggregate for the benefit of others, of the outstanding shares of the Growth Fund and Charles Schwab & Co. Inc. held approximately 65.55%, in aggregate for the benefit of others, of the outstanding shares of the Genea Fund.
Zevenbergen Funds
Notes to the Financial Statements (Continued)
June 30, 2023
NOTE 11 – SUBSEQUENT EVENTS
In preparing these financial statements, the Funds have evaluated events and transactions for potential recognition or disclosure through the date the financial statements were available to be issued.
The Board has approved the reorganization of the Funds into a newly created series of Advisor Managed Portfolios, a Delaware statutory trust (the “Acquiring Funds”). The Acquiring Funds have the same investment objective, investment strategies, and fundamental investment restrictions as the Funds, and the same investment adviser and portfolio managers as the Funds. The reorganization is expected to be a tax-free reorganization for federal income tax purposes and is expected to occur on or about November 3, 2023. The reorganization does not require shareholder approval.
NOTE 12 – CHANGE IN INDEPENDENT REGISTERED PUBLIC ACCOUNTING FIRM
BBD, LLP ("BBD") served as the independent registered public accounting firm for the Funds to audit the financial statements for the fiscal year ended June 30, 2022. On March 13, 2023, BBD sent a letter of cessation to the SEC indicating that BBD would no longer be serving as auditor. This letter was sent as a result of the Investment Management Group of BBD being acquired by Cohen & Company, Ltd (“Cohen”).
The Trust engaged Cohen on April 4, 2023, as the independent registered public accounting firm to audit the Funds’ financial statements for the fiscal year ending June 30, 2023.
The report of BBD on the financial statements of the Funds for the fiscal year ended June 30, 2022, contained no adverse opinion or disclaimer of opinion, and was not qualified or modified as to uncertainty, audit scope, or accounting principle.
In connection with the Funds’ audit for the fiscal period ended June 30, 2022, there have been no disagreements, if not resolved to the satisfaction of BBD, that would have caused them to make reference thereto in their report on the financial statements for such period.

REPORT OF INDEPENDENT REGISTERED PUBLIC ACCOUNTING FIRM
To the Shareholders of Zevenbergen Growth Fund and Zevenbergen Genea Fund and
Board of Trustees of Trust for Advised Portfolios
Opinion on the Financial Statements
We have audited the accompanying statements of assets and liabilities, including the schedules of investments, of Zevenbergen Growth Fund and Zevenbergen Genea Fund, each a series in Trust for Advised Portfolios (the “Funds”) as of June 30, 2023, and the related statements of operations and changes in net assets and the financial highlights for the year then ended, and the related notes, (collectively referred to as the “financial statements”). In our opinion, the financial statements present fairly, in all material respects, the financial position of the Funds as of June 30, 2023, and the results of their operations, changes in their net assets, and the financial highlights for the year then ended, in conformity with accounting principles generally accepted in the United States of America.
The Funds’ financial statements and financial highlights for the years ended June 30, 2022, and prior, were audited by other auditors whose report dated August 26, 2022, expressed an unqualified opinion on those financial statements and financial highlights.
Basis for Opinion
These financial statements are the responsibility of the Funds’ management. Our responsibility is to express an opinion on the Funds’ financial statements based on our audits. We are a public accounting firm registered with the Public Company Accounting Oversight Board (United States) (“PCAOB”) and are required to be independent with respect to the Funds in accordance with the U.S. federal securities laws and the applicable rules and regulations of the Securities and Exchange Commission and the PCAOB.
We conducted our audits in accordance with the standards of the PCAOB. Those standards require that we plan and perform the audit to obtain reasonable assurance about whether the financial statements are free of material misstatement whether due to error or fraud.
Our audits included performing procedures to assess the risks of material misstatement of the financial statements, whether due to error or fraud, and performing procedures that respond to those risks. Such procedures included examining, on a test basis, evidence regarding the amounts and disclosures in the financial statements. Our audits included confirmation of securities owned as of June 30, 2023, by correspondence with the custodian and brokers. Our audits also included evaluating the accounting principles used and significant estimates made by management, as well as evaluating the overall presentation of the financial statements. We believe that our audits provide a reasonable basis for our opinion.
We have served as the Funds’ auditor since 2023.

COHEN & COMPANY, LTD.
Philadelphia, Pennsylvania
August 29, 2023
COHEN & COMPANY, LTD.
800.229.1099 | 866.818.4538 fax | cohencpa.com
Registered with the Public Company Accounting Oversight Board
Zevenbergen Funds
Expense Example
June 30, 2023 (Unaudited)
As a shareholder of the Funds, you incur two types of costs: (1) transaction costs, including redemption fees; and (2) ongoing costs, including management fees and other Fund expenses. This Example is intended to help you understand your ongoing costs (in dollars) of investing in the Funds and to compare these costs with the ongoing costs of investing in other mutual funds.
The Example is based on an investment of $1,000 invested at the beginning of the six month period and held for the entire six month period from January 1, 2023 to June 30, 2023 (the “six month period”).
Actual Expenses
The “Actual Fund Return” lines in the table below provide information about actual account values and actual expenses. You may use the information in these lines, together with the amount you invested, to estimate the expenses you paid over the six month period. Simply divide your account value by $1,000 (for example, an $8,600 account value divided by $1,000 equals 8.6), then multiply the result by the number in the corresponding line under the heading entitled “Expenses Paid During the Six Month Period” to estimate the expenses you paid on your account during the six month period.
Hypothetical Example for Comparison Purposes
The information in the table with the lines titled “Hypothetical 5% Return” provides information about hypothetical account values and hypothetical expenses based on the Funds’ actual expense ratios and an assumed rate of return of 5% per year before expenses, which is not the Funds’ actual returns. The hypothetical account values and expenses may not be used to estimate the actual ending account balance or expenses you paid for the six month period. You may use this information to compare the ongoing costs of investing in the Funds and other funds. To do so, compare this 5% hypothetical example with the 5% hypothetical examples that appear in the shareholder reports of the other funds.
Please note that the expenses shown in the table are meant to highlight your ongoing costs only and do not reflect any transaction costs, such as redemption fees. Therefore, the information in the lines titled “Hypothetical 5% Return” is useful in comparing ongoing costs only, and will not help you determine the relative total costs of owning different funds. In addition, if transactional costs were included, your costs would have been higher.
Expenses Paid During the Six Month Period
| | Beginning
Account Value | Ending
Account Value | Annualized
Expense Ratio | Expenses Paid
During the Six
Month Period (1) |
| Growth Fund | | | | |
| Investor Class | | | | |
| Actual Fund Return | $1,000.00 | $1,506.10 | 1.30% | $8.08 |
| Hypothetical 5% Return | $1,000.00 | $1,018.35 | 1.30% | $6.51 |
| | | | | |
| Institutional Class | | | | |
| Actual Fund Return | $1,000.00 | $1,508.00 | 1.00% | $6.22 |
| Hypothetical 5% Return | $1,000.00 | $1,019.84 | 1.00% | $5.01 |
| | | | | |
| Genea Fund | | | | |
| Investor Class | | | | |
| Actual Fund Return | $1,000.00 | $1,551.70 | 1.30% | $8.22 |
| Hypothetical 5% Return | $1,000.00 | $1,018.35 | 1.30% | $6.51 |
| | | | | |
| Institutional Class | | | | |
| Actual Fund Return | $1,000.00 | $1,553.90 | 1.00% | $6.33 |
| Hypothetical 5% Return | $1,000.00 | $1,019.84 | 1.00% | $5.01 |
| (1) | Expenses are equal to each of the Funds’ annualized expense ratio as indicated, multiplied by the average account value over the six month period, multiplied by 181/365 (to reflect the “six month period”) |
Zevenbergen Funds
Additional Information
June 30, 2023 (Unaudited)
Quarterly Portfolio Schedule
The Funds file a complete schedule of portfolio holdings with the U.S. Securities and Exchange Commission (the “SEC”) for the first and third quarters of each fiscal year on Part F of Form N-PORT. The Funds’ Form Part F of Form N-PORT is available on the SEC’s website at www.sec.gov and may be reviewed and copied at the SEC’s Public Reference Room in Washington, D.C. Information on the operation of the Public Reference Room may be obtained by calling 1-800- SEC-0330.
The Funds also make this schedule of portfolio holdings available on the Funds’ website within sixty days of each quarter end noted at www.zci.com/funds/.
Proxy Voting
You may obtain a description of the Funds’ proxy voting policy and voting records, without charge, upon request by contacting the Funds directly at 1-844-986-2746 or on the EDGAR Database on the SEC’s website at www.sec.gov. The Funds file their proxy voting records annually as of June 30, with the SEC on Form N-PX. The Funds’ Form N-PX is available without charge by visiting the SEC’s website at www.sec.gov and may be reviewed and copied at the SEC’s Public Reference Room in Washington D.C. You may obtain information on the operation of the Public Reference Room by calling 1-800-SEC-0330.
Shareholder Tax Information
For the fiscal year ended June 30, 2023, certain dividends paid by the Funds may be taxable to Fund shareholders at a maximum tax rate of 23.8%, as provided for by the Jobs and Growth Tax Relief Reconciliation Act of 2003. The percentage of dividends declared from ordinary income designated as qualified dividend income was as follows:
| Growth Fund | 0.00% |
| Genea Fund | 0.00% |
For corporate shareholders, the percent of ordinary income distributions qualifying for the corporate dividends received deduction for the fiscal year ended June 30, 2023, was as follows:
| Growth Fund | 0.00% |
| Genea Fund | 0.00% |
The percentage of taxable ordinary income distributions that are designated as short-term capital gain distributions under Internal Revenue Section 871 (k)(2)(C) for each Fund were as follows:
| Growth Fund | 0.00% |
| Genea Fund | 0.00% |
Zevenbergen Funds
Additional Information (Continued)
June 30, 2023 (Unaudited)
Statement Regarding Liquidity Risk Management Program
Each Fund has adopted a liquidity risk management program. The Funds' Board has designated a Liquidity Risk Committee ("Committee") of the Adviser to serve as the administrator of the program. The Committee conducts the day-to-day operation of the program pursuant to policies and procedures administered by the Committee.
Under the program, the Committee manages each Fund's liquidity risk, which is the risk that a Fund could not meet shareholder redemption requests without significant dilution of remaining shareholders' interests in a Fund. This risk is managed by monitoring the degree of liquidity of each Fund's investments, limiting the amount of each Fund's illiquid investments, and utilizing various risk management tools and facilities available to each Fund for meeting shareholder redemptions, among other means.
The Funds' Board reviewed a report prepared by the Committee regarding the operation and effectiveness of the program for the period January 1, 2022 through December 31, 2022. No liquidity events impacting either of the Funds were noted in the report. In addition, the Committee provided its assessment that the program had been effective in managing each Fund's liquidity risk.
Zevenbergen Funds
Trustees and Officer Information (Unaudited)
Name, Address
and Age | Position(s)
Held with
Trust | Term of
Office(1)
and
Length of
Time
Served | Principal Occupation(s)
During Past 5 Years | Number of
Portfolios in
Fund
Complex(2)
Overseen by
Trustee | Other
Directorships(3) Held
During Past 5 Years
by Trustee |
| Independent Trustees(4) | | | | | |
Brian S. Ferrie
615 E. Michigan Street
Milwaukee, WI 53202
Year of birth: 1958 | Trustee | Since 2020 | Chief Compliance Officer, Treasurer, The Jensen Quality Growth Fund (2004 to 2020); Treasurer, Jensen Investment Management (2003 to 2020) | 2 | Trustee, Advisor Managed Portfolios (2 portfolios) (May 2023 to present) |
| | | | | | |
Wan-Chong Kung
615 E. Michigan Street
Milwaukee, WI 53202
Year of birth: 1960 | Trustee | Since 2020 | Senior Fund Manager, Nuveen Asset Management (FAF Advisors/First American Funds) (2011 to 2019) | 2 | Trustee, Advisor Managed Portfolios (2 portfolios) (May 2023 to present); Federal Home Loan Bank of Des Moines (February 2022 to present); Trustee, Securian Funds Trust (12 portfolios) (October 2022 to present) |
| Interested Trustee(5) | | | | | |
Christopher E. Kashmerick
615 E. Michigan Street
Milwaukee, WI 53202
Year of birth: 1974 | Trustee | Trustee since 2018 | Senior Vice President, U.S. Bancorp Fund Services, LLC (2011 to present) | 2 | Trustee, Advisor Managed Portfolios (2 portfolios) (February 2023 to present) |
Zevenbergen Funds
Trustees and Officer Information (Unaudited) (Continued)
| Name, Address and Age | Position(s) Held
with Trust | Term of Office(1) and
Length of Time
Served | Principal Occupation(s)
During Past 5 Years |
| Officers | | | |
Russell B. Simon
615 E. Michigan Street
Milwaukee, WI 53202
Year of birth:1980 | President and
Principal Executive
Officer | Since 2022 | Vice President, U.S. Bancorp Fund Services, LLC (2011 to present) |
Diane K. Miller
615 E. Michigan Street
Milwaukee, WI 53202
Year of birth:1972 | Chief Compliance
Officer and AML
Officer | Since January 2023 | Vice President, U.S. Bancorp Fund Services, LLC (since January 2023); Chief Compliance Officer, Christian Brothers Investment Services (2017 - 2022) |
Eric T. McCormick
615 E. Michigan Street
Milwaukee, WI 53202
Year of birth:1971 | Treasurer and
Principal Financial
Officer | Since 2022 | Vice President, U.S. Bancorp Fund Services, LLC (2005 to present) |
Scott A. Resnick
615 E. Michigan Street
Milwaukee, WI 53202
Year of birth:1972 | Secretary | Since 2019 | Assistant Vice President, U.S. Bancorp Fund Services, LLC (2018 to present); Associate, Legal & Compliance, PIMCO (2012 to 2018) |
| (1) | Each Trustee serves an indefinite term; however, under the terms of the Board’s retirement policy, a Trustee shall retire at the end of the calendar year in which he or she reaches the age of 75 (this policy does not apply to any Trustee serving at the time the policy was adopted). Each officer serves an indefinite term until the election of a successor. |
| (2) | The Trust is comprised of numerous series managed by unaffiliated investment advisers. The term “Fund Complex” applies only to the Funds. The Funds do not hold themselves out as related to any other series within the Trust for purposes of investment and investor services, nor do they share the same investment advisor with any other series. |
| (3) | “Other Directorships Held” includes only directorships of companies required to register or file reports with the SEC under the Securities Exchange Act of 1934, as amended, (that is, “public companies”) or other investment companies registered under the 1940 Act. |
| (4) | The Trustees of the Trust who are not “interested persons” of the Trust as defined under the 1940 Act (“Independent Trustees”). |
| (5) | Mr. Kashmerick is an “interested person” of the Trust as defined by the 1940 Act. Mr. Kashmerick is an interested Trustee of the Trust by virtue of the fact that he is an interested person of U.S. Bancorp Fund Services, LLC, the Funds’ administrator, fund accountant, and transfer agent. |
The Funds’ Statement of Additional Information (“SAI”) includes information about the Funds’ Trustees and is available without charge, upon request, by calling 1-844-986-2746.
PRIVACY NOTICE
The Funds collect non-public information about you from the following sources:
| • | Information we receive about you on applications or other forms; |
| • | Information you give us orally; and/or |
| • | Information about your transactions with us or others. |
We do not disclose any non-public personal information about our customers or former customers without the customer’s authorization, except as permitted by law or in response to inquiries from governmental authorities. We may share information with affiliated and unaffiliated third parties with whom we have contracts for servicing the Funds. We will provide unaffiliated third parties with only the information necessary to carry out their assigned responsibilities. We maintain physical, electronic and procedural safeguards to guard your non-public personal information and require third parties to treat your personal information with the same high degree of confidentiality.
In the event that you hold shares of the Funds through a financial intermediary, including, but not limited to, a broker-dealer, bank, or trust company, the privacy policy of your financial intermediary would govern how your non-public personal information would be shared by those entities with unaffiliated third parties.
Investment Adviser
Zevenbergen Capital Investments LLC
326 Admiral Way, Suite 200
Edmonds, Washington 98020
Distributor
Quasar Distributors, LLC
111 East Kilbourn Ave. Suite 2200
Milwaukee, Wisconsin 53202
Custodian
U.S. Bank National Association
Custody Operations
1555 North River Center Drive, Suite 302
Milwaukee, Wisconsin 53212
Transfer Agent, Fund Accountant and Fund Administrator
U.S. Bancorp Fund Services, LLC
615 East Michigan Street
Milwaukee, Wisconsin 53202
Independent Registered Public Accounting Firm
Cohen & Company, Ltd.
1835 Market Street, Suite 310
Philadelphia, Pennsylvania 19103
Legal Counsel
Morgan, Lewis & Bockius LLP
1111 Pennsylvania Avenue, NW
Washington, DC 20004
This report has been prepared for shareholders and may be distributed to others only if preceded or accompanied by a current prospectus.
The registrant has adopted a code of ethics that applies to the registrant’s principal executive officer and principal financial officer. The registrant has not made any substantive amendments to its code of ethics during the period covered by this report. The registrant has not granted any waivers from any provisions of the code of ethics during the period covered by this report.
The registrant’s Board of Trustees has determined that there is at least one audit committee financial expert serving on its audit committee. Harry E. Resis and Brian Ferrie are the “audit committee financial expert” and are considered to be “independent” as each term is defined in Item 3 of Form N‑CSR.
The registrant has engaged its principal accountant to perform audit services, audit-related services, tax services and other services during the past two fiscal years. “Audit services” refer to performing an audit of the registrant's annual financial statements or services that are normally provided by the accountant in connection with statutory and regulatory filings or engagements for those fiscal years. “Audit-related services” refer to the assurance and related services by the principal accountant that are reasonably related to the performance of the audit. “Tax services” refer to professional services rendered by the principal accountant for tax compliance, tax advice, and tax planning. There were no “Other services” provided by the principal accountant. The following table details the aggregate fees billed or expected to be billed for each of the last two fiscal years for audit fees, audit-related fees, tax fees and other fees by the principal accountant.
(e)(1) The audit committee has adopted pre-approval policies and procedures that require the audit committee to pre‑approve all audit and non‑audit services of the registrant, including services provided to any entity affiliated with the registrant.
(e)(2) The percentage of fees billed by principal accountant applicable to non-audit services pursuant to waiver of pre-approval requirement were as follows:
(h) The audit committee of the board of trustees/directors has considered whether the provision of non-audit services that were rendered to the registrant's investment adviser is compatible with maintaining the principal accountant's independence and has concluded that the provision of such non-audit services by the accountant has not compromised the accountant’s independence.
Not applicable to registrants who are not listed issuers (as defined in Rule 10A-3 under the Securities Exchange Act of 1934).
Not applicable to open-end investment companies.
Not applicable to open-end investment companies.
Not applicable to open-end investment companies.
There have been no material changes to the procedures by which shareholders may recommend nominees to the registrant’s board of trustees.
Not applicable to open-end investment companies.
Pursuant to the requirements of the Securities Exchange Act of 1934 and the Investment Company Act of 1940, the registrant has duly caused this report to be signed on its behalf by the undersigned, thereunto duly authorized.
Pursuant to the requirements of the Securities Exchange Act of 1934 and the Investment Company Act of 1940, this report has been signed below by the following persons on behalf of the registrant and in the capacities and on the dates indicated.