UNITED STATES
SECURITIES AND EXCHANGE COMMISSION
Washington, D.C. 20549
FORM N-CSR
CERTIFIED SHAREHOLDER REPORT OF REGISTERED
MANAGEMENT INVESTMENT COMPANIES
Investment Company Act file number | 811-21422 | |||||||
| ||||||||
Trust for Advised Portfolios | ||||||||
(Exact name of registrant as specified in charter) | ||||||||
| ||||||||
615 East Michigan Street Milwaukee, Wisconsin |
| 53202 | ||||||
(Address of principal executive offices) |
| (Zip code) | ||||||
| ||||||||
Christopher E. Kashmerick Trust for Advised Portfolios 2020 East Financial Way, Suite 100 Glendora, CA 91741 | ||||||||
(Name and address of agent for service) | ||||||||
| ||||||||
Registrant’s telephone number, including area code: | (626) 914-7385 |
| ||||||
| ||||||||
Date of fiscal year end: | December 31 |
| ||||||
| ||||||||
Date of reporting period: | December 31, 2020 |
| ||||||
Item 1. Reports to Stockholders.
(a)

Annual Report
December 31, 2020
Miller Opportunity Trust
Class A LGOAX
Class C LMOPX
Class FI LMOFX
Class R LMORX
Class I LMNOX
Class IS MVISX
Important Notice: The U.S. Securities and Exchange Commission will permit funds to make shareholder reports available electronically beginning January 1, 2021. Accordingly, paper copies will no longer be mailed. Instead, at that time, the Miller Opportunity Trust will send a notice, either by mail or e-mail, each time an updated report is available on the Fund's website (www.millervaluefunds.com). Investors enrolled in electronic delivery will receive the notices by e-mail, with links to the updated report and will not need to take any action. Investors who are not enrolled in electronic delivery by January 1, 2021 will receive the notices in the mail.
All investors who prefer to receive shareholder reports in a printed format may, at any time, choose that option free of charge. Contact your financial intermediary to make this election, or direct investors can call 1-888-593-5110.
Table of contents
Miller Opportunity Trust | |||||||
Manager commentary | 1 | ||||||
Fund at a glance | 13 | ||||||
Fund expenses | 14 | ||||||
Fund performance | 16 | ||||||
Schedule of investments | 17 | ||||||
Statement of assets and liabilities | 21 | ||||||
Statement of operations | 23 | ||||||
Statements of changes in net assets | 24 | ||||||
Financial highlights | 25 | ||||||
Notes to financial statements | 31 | ||||||
Report of independent registered public accounting firm | 44 | ||||||
Approval of investment advisory agreement | 46 | ||||||
Additional information | 49 | ||||||
Privacy notice | 52 | ||||||
Directory of Fund's service providers | Back Cover | ||||||
Miller Opportunity Trust 2020 Annual Report
Miller Opportunity Trust manager commentary (unaudited)
Miller Opportunity Trust ended the year on a strong note, notching a 35.85%1 gain in the quarter versus the S&P 500's 12.15%. This brought the 2020 annual return to 38.91%1, more than doubling the market's 18.40% return. The gains were driven by a strong market recovery from the COVID crash earlier in the year, along with good old fashion stock picking. Performance in the quarter benefited from a rebound in "value" more broadly. Over the year, we benefited from diversification between different types of values: longer-term, more growth-oriented compounders as well as classic value holdings.
Average Annual Total Returns and Expenses (%) as of 12/31/2020
Without Sales Charges | |||||||||||||||||||||||||||||||
YTD | 1 Yr | 3 Yr | 5 Yr | 10 Yr | Inception* | Inception Date | |||||||||||||||||||||||||
Class A | 38.61 | 38.61 | 18.75 | 16.04 | 13.78 | 19.47 | 2/3/2009 | ||||||||||||||||||||||||
Class C | 37.56 | 37.56 | 17.86 | 15.16 | 12.91 | 7.74 | 12/30/1999 | ||||||||||||||||||||||||
Class FI | 38.50 | 38.50 | 18.68 | 15.99 | 13.73 | 8.02 | 2/13/2004 | ||||||||||||||||||||||||
Class R | 38.22 | 38.22 | 18.42 | 15.70 | 13.37 | 6.98 | 12/28/2006 | ||||||||||||||||||||||||
Class I | 38.91 | 38.91 | 19.06 | 16.35 | 14.10 | 8.83 | 6/26/2000 | ||||||||||||||||||||||||
Class IS | 39.02 | — | — | — | — | 14.16 | 8/22/2018 | ||||||||||||||||||||||||
S&P 500 | 18.40 | 18.40 | 14.18 | 15.22 | 13.88 | 9.50 | — | ||||||||||||||||||||||||
With Max Sales Charges | |||||||||||||||||||||||||||||||
YTD | 1 Yr | 3 Yr | 5 Yr | 10 Yr | Inception | ||||||||||||||||||||||||||
Class A | 30.64 | 30.64 | 16.43 | 14.67 | 13.11 | 18.87 | 2/3/2009 | ||||||||||||||||||||||||
Class C | 36.56 | 36.56 | 17.86 | 15.16 | 12.91 | 7.74 | 12/30/1999 | ||||||||||||||||||||||||
* S&P 500 since inception return represented from 12/30/99, the Fund's oldest share class.
Gross (Net) Expenses (%): Class A 1.49 (1.49); Class C 2.23 (2.23); Class FI 1.55 (1.55); Class I 1.25 (1.22), Class R 1.77 (1.77) and Class IS 1.15 (1.15). Miller Value Partners, LLC (the "Adviser") has agreed to waive fees and/or reimburse operating expenses (other than front-end or contingent deferred loads, taxes, interest expense, brokerage commissions, acquired fund fees and expenses, expenses incurred in connection with any merger or reorganization, portfolio transaction expenses, dividends paid on short sales, extraordinary expenses such as litigation, Rule 12b-1 fees, intermediary servicing fees, or any other class-specific expenses) through April 30, 2021, so that such annual operating expenses will not exceed 0.88%. Separately, with respect to Class I only, the Adviser has agreed to waive fees and/or reimburse operating expenses such that the previously described annual operating expenses, plus intermediary servicing fees and other class-specific expenses, will not exceed 0.93%. Net expense ratios are current to the most recent prospectus dated 4/30/20 and are applicable to investors.
Performance shown represents past performance and is no guarantee of future results. Current performance may be higher or lower than the performance shown. Investment return and principal value will fluctuate so shares, when redeemed, may be worth more or less than the original cost. Class A shares have a maximum front-end sales charge of 5.75%. Class C shares have a one-year contingent deferred sales charge (CDSC) of 1.0%. If sales charges were included, performance shown would be lower. Total returns assume the reinvestment of all distributions at net asset value and the deduction of all Fund expenses. Total return figures are based on the NAV per share applied to shareholder subscriptions and redemptions, which may differ from the NAV per share disclosed in Fund shareholder reports. Performance would have been lower if fees had not been waived in various periods. YTD is calculated from January 1 of the reporting year. All classes of shares may not be available to all investors or through all distribution channels. For the most recent month-end information, please call 888-593-5110 or visit millervaluefunds.com.
1 Class I — LMNOX
Miller Opportunity Trust 2020 Annual Report
1
Miller Opportunity Trust manager commentary (unaudited) (cont'd)
The only bad news about such strong returns: they aren't sustainable. We just made in a quarter what we might expect to earn over numerous years. Huge market bursts can't endure forever. Many take this line of reasoning a step further, projecting a major pullback. We disagree. We think the market can continue to be stronger than many expect providing a window to earn strong returns. We estimate the portfolio currently has greater than 60%2 upside to our calculation of its intrinsic value offering strong return potential.
Market pullbacks happen frequently, and no one can consistently predict them accurately. We wouldn't be surprised by a modest one after such a strong move. However, we believe we are in a bull market and the market can continue to move higher driven by a continuing economic recovery, attractive equity valuations relative to bonds and over a decade of underinvestment in equities relative to bonds.
There are two key points we think aren't well understood. First, this economic hit is more akin to a natural disaster than endogenous economic malaise. This has important implications on many levels. First, the sudden dramatic nature of the pandemic caught everyone's attention garnering unprecedented resources and support. The Fed expanded its balance sheet by $3T over a few months. During the financial crisis, it took more than 5 years for a comparable dollar expansion. Likewise, we've seen two rounds of fiscal stimulus totaling just shy of $3T and with a Democratic-controlled Congress, more appears to be on the way. During the 2008-09 financial crisis, total stimulus was just over $1T, so a fraction of the size. In addition, corporations, universities, and the broad population have marshaled unprecedented levels of resources to combat the problem.
During and after a natural disaster, the economy behaves differently than a normal recession. The economic hit is sudden, dramatic, and extreme, but so is the ensuing recovery. After Hurricane Katrina, employment fell off a cliff but it had fully recovered a couple years later. It took nearly a decade after the financial crisis for unemployment to reach pre-crisis levels. So far, employment trends are tracking much closer to Katrina than the financial crisis.
The pandemic, lasting many months, is more prolonged than a typical disaster, but the natural disaster analogy implies a quicker and stronger recovery once we reach the other side. A combination of greater infection rates and vaccine distribution will help get us there over the coming months. This implies gains could continue to be faster and stronger than many expect.
2 As of 1/12/21. A proprietary calculation of the central tendency of value for the portfolio based on our assessment of the intrinsic value of individual holdings.
Miller Opportunity Trust 2020 Annual Report
2
Second, we are in a bull market. This definitely isn't news to anyone, but I think people underappreciate the importance of the point. My partner Bill Miller writes fantastic market letters. For roughly the past decade he's started with this statement. Why? It provides the broad context you need to know how to behave optimally.
The market's reaction function (how prices respond to news and events) differs completely in bull markets than in bear markets. How can the market mostly ignore protestors storming the capital and temporarily disrupting the smooth transition of power? A bull market can look through to economic implications, while a bear won't.
Investors often focus on the problem of losing money during pullbacks, but over the past decade investors' biggest mistake has been missing out on massive gains due to overwhelming risk aversion. Likewise, bubble fears caused many people to exit the market in 1998, years before the top. One of Bill's best all-time moves was his near-perfect timing when exiting technology stocks in 2000. He pulled this off partially by being a keen observer of the market environment.
Bull markets typically don't peak during a strong economic recovery with accommodative monetary and fiscal policy. We think it's optimal to play offense in a bull market driven by a recovering economy. If this changes, we can adjust accordingly.
Our favorite relevant quote from Sir John Templeton (which we repeat A LOT) is: "Bull markets are born on pessimism, grow on skepticism, mature on optimism and die on euphoria." Understanding sentiment in this way helps us frame the opportunity set along with the risks. Greater pessimism implies higher future returns, while the opposite is true of euphoria. The depths of panics, like March 2020, provide the best buying opportunities. When no one sees risks, run for the door. So where are we now?
It's hard to be precise but we're somewhere in the later stages of the bull market. While this implies we are closer to the end, it's important to note that the latest stages of bull markets typically generate some of the best returns. Lazlo Birinyi is a market strategist with an excellent long-term investing record. His team divides bull markets into four stages (similar to Templeton): reluctance, consolidation, acceptance and exuberance. The first (reversal off bear market lows) and last (euphoria kicks in) stages offer the best returns. They think we might be somewhere in the acceptance phase.
I like to joke with Bill about how he's usually right, just sometimes early. During the financial crisis, he shorted oil based on his view that it was economically sensitive and the world was falling apart so the price shouldn't be rising. He nailed it
Miller Opportunity Trust 2020 Annual Report
3
Miller Opportunity Trust manager commentary (unaudited) (cont'd)
fundamentally but that didn't stop the price from continuing its rapid ascent before falling apart. A few years ago, a client asked about risks. Bill replied bonds were expensive and if stocks rose to comparable levels, it would produce massive gains but then it would be difficult to make money anywhere. That scenario seems more likely now. If true, the good news is there's still a window to make nice returns. The bad news is that it might be followed by some ugly times. We will do our best to adapt as circumstances change.
In more growthy areas of the market, euphoria seems to abound. We aren't optimistic about the long-term return prospects for certain growth names where elevated prices make it increasingly difficult to meet market embedded expectations. We know from history that the very best companies drive the overall market's returns. When the rarefied company, like an Amazon or Apple, sustains high growth rates for extended periods of time, high multiples on current revenues and earnings are justified, while still offering attractive returns. But most companies priced to achieve this type of growth fail to do so. Currently, many growth companies trade at significant premiums to even Amazon's historical valuations, outside of the peak of the tech bubble.
The market is pricing more and more companies as if they will achieve Amazon or Apple type growth. We estimate current market expectations imply Apple-level growth for Peloton and Amazon-level growth for insurance company Lemonade. In the past few weeks alone, we've heard numerous companies pitch themselves as the Amazon of this or that area. There are far more Amazon aspirants than actual Amazons.
We recently exited Peloton because of heightened risk of falling short of elevated expectations, along with our belief that other names offered better opportunities. We bought Peloton in the low $20's right after the IPO believing it was a misunderstood disruptor with a powerful brand that could change the way large numbers of people exercise. We still see significant potential for Peloton to grow the business over the long term.
However, we estimate current market expectations imply Peloton will grow at a slightly greater rate than Apple did3 from a comparable level of revenue for the next 22 YEARS. Very few companies have a shot at this type of performance. Work by Michael Mauboussin4 shows companies' competitive advantage periods (the period over which it can earn excess returns) average 10-15 years. Alternatively, Peloton will need to grow topline 38% annually over the next 10 years to justify the current price, well ahead of Netflix's 28% topline growth from a comparable revenue level. Not a bet we want to make.
3 Apple grew 19% annually on average from a comparable revenue level
4 http://people.stern.nyu.edu/adamodar/pdfiles/eqnotes/cap.pdf
Miller Opportunity Trust 2020 Annual Report
4
Part of our initial bull case on Peloton compared the brand power to Apple's. But the analogy only goes so far. Most people can't put down their phones. On the other hand, most can't get off their duffs to exercise! Peloton is an amazing company, but we don't want to bet its Apple-level amazing, especially as extremely tough comps in the back half of 2021 could present near-term risk.
A couple points: not all growth companies have elevated expectations. Despite the significant moves up we still believe Farfetch, Amazon, Stitch Fix, along with the other high growth names we still own are undervalued. Our primary job is to do the company-by-company work of sifting through market expectations relative to our assessment of fundamentals. We make bets when we think those two sides of the equation are out of whack. We think through the opportunities relative to the risks. We believe our flexibility to migrate as the opportunity set dictates offers us a significant competitive advantage relative to investors forced to stay in a more restricted area.
Since we own some high growth names, we often get asked if we are truly a value manager. The answer: absolutely! We only purchase a name is if we think it's a good value. Likewise, we use valuations to make sell decisions (which has not helped us in this market where no valuation is too high for beloved companies!). We do believe this discipline will pay off over time.
Many people equate low accounting-based metrics (P/E, P/B, etc) with good value, but that's simply not the case. Low accounting metrics are markers of low expectations, but fundamentals must outperform those expectations for stocks to do well. The value of any investment is the present value of future free cash flows. Those may be difficult to forecast, but they will drive the value of any investment. We spend our time understanding business values in different scenarios and what historical precedents imply on the likelihood of outcomes. We want a favorable skew between returns in the base or best case scenario relative to the worst case.
As in everything with markets, value investing evolves over time. I recently read a post saying the founder of value investing, Ben Graham, would have been very uncomfortable with Warren Buffett's method of projecting earnings to derive a value. It's certainly true that the cone of uncertainty widens with time. Ben Graham himself spoke of this in The Intelligent Investor:
The better a company's record and prospects, the less relationship the price of shares will have to their book value. But the greater premium above book value, the less certain the basis of determining its intrinsic value — i.e., the more this "value" will depend on the changing moods and measurements of the stock market. Thus, we reach the final paradox, that the more successful the company, the greater are likely to be the fluctuations in the price of its
Miller Opportunity Trust 2020 Annual Report
5
Miller Opportunity Trust manager commentary (unaudited) (cont'd)
shares. This means in a very real sense, the better the quality of a common stock, the more speculative it is likely to be.
So relevant to our current environment! Innovation and growth have fueled returns, but that's led to valuations of those companies disconnecting dramatically from current revenue and earnings streams. As long as belief states about future growth prospects hold, it's not a problem. With disappointment comes great loss.
We can look back at the great Nifty Fifty growth stocks of the 70s to understand they actually weren't all that overpriced, but that didn't stop them from suffering a huge crash. Likewise, buying Amazon in 1999 was a great move long term but that didn't protect you from losing a ton of money over the next couple years. While we don't see near term risk to growth stocks broadly, we do think there's a good chance this euphoria won't end well. In the past, it's taken a recession to end these sorts of moves. A significant move up in rates is another threat to long duration assets.
We try to think through these risks carefully. We manage them in the portfolio through security selection and portfolio diversification. We also want to understand these darling companies well enough to take advantage of any opportunity that arises from price weakness.
The key behind all value approaches, though, is a strict reckoning between what you are paying and what you are getting. That's our lifeblood. Most sell-side analysts don't even run long term discounted cash flows, and I don't remember ever seeing a model that looks at numerous future scenarios. I love that because it means our approach isn't in high demand from those on the buy side either. This means it's a potential edge versus others.
We really love the current portfolio. It trades at a steep discount to the market (roughly 12x next 12 months earnings versus the SPX at 23x5). Even with our higher multiple growth names, we think the portfolio is very attractively valued even on near-term metrics. We constantly work to see if we can improve our risk-adjusted returns and we continue to find attractive investment opportunities. I will highlight a couple examples.
Desktop Metal is a name that made it into our top holdings at the end of year due to strong performance since our purchase. The company is a second generation industrial printing company led by a great team. It came public through a merger with a SPAC led by Leo Hindery, Jr. who we've known from his successful history at Telecommunications, Inc (TCI) where they excelled at capital allocation. One of the unique benefits of structure is that it helps us get access to unique opportunities.
5 Source FactSet as of 12/31/20
Miller Opportunity Trust 2020 Annual Report
6
Here, we were able to invest in the PIPE (private investment in public equity) to take the company public based on industry relationships.
Desktop Metal is early in its commercialization, but we think the company has great potential over the next five years with a stellar list of customer partners and potential applications. We bought on the deal at a $1.8B enterprise value or 6.7x the EBITDA management estimates it can earn in 5 years before any acquisitions. For a company capable of growing at such high rates (triple digits for next couple years), with a great business with high moats and a fantastic team, this was a great deal. It's doubled since the deal. This is a great example of an undervalued, long-term, growth-oriented opportunity that we were still able to source in this market.
In the squarely value camp, we bought Norwegian Cruise Lines in the quarter as well. The sector has obviously been one of the hardest hit by COVID with business shut down. It should be one of the biggest beneficiaries of a normalization due to vaccines and infections helping us reach herd immunity at some point. As we got clarity around vaccine efficiency and potential timelines for disbursement, it enabled us to analyze the ability of cruise lines to make it through and what the potential balance sheet and earnings power might look like on the other side. We think Norwegian is worth somewhere in the $40s with a good ability to withstand the crisis. We think the recovery in travel is more likely to beat current recovery expectations than it is to fall short, setting up a nice risk-reward.
We also bought Diamondback Energy. For the first time in decades, we find energy to be quite attractive. Companies are finally focusing on cash flow and returns. Diamondback is a low-cost shale producer that screened well on a number of metrics we pay attention to (dividend yield, free cash flow yield, discounted cash flow, and insider buying). They recently added Return on Invested Capital (ROIC) to their management incentive compensation. They plan to continue to pay down debt and maintain the dividend. The company is obviously levered to increasing oil prices.
Green Thumb, another new name, is a cannabis company that we have watched for a while. The company is the best capital allocator in the space with a focus on profitable growth in limited license states, while also building national brands. We believe there's a long growth runway due to state adoption driven by budgetary needs. We believe that GTBIF is undervalued based on their current licenses alone, while state expansion is virtually guaranteed.
Another name we're very excited about is WW (formerly known as Weight Watchers). We've followed it for awhile. CEO Mindy Grossman, joined in 2017, is excellent. While the company has looked cheap in the past, we think the digital transition has reached an important inflection the market is not reflecting. We
Miller Opportunity Trust 2020 Annual Report
7
Miller Opportunity Trust manager commentary (unaudited) (cont'd)
expect improving revenue growth and margin expansion and believe the stock can double.
Lastly, we added a small position to Netflix after the disappointment following 3Q results. Overall, it's getting more difficult to find investment opportunities in the very high growth areas that meet our standards for attractive value. On the other hand, we continue to find opportunities in more value-oriented areas of the market. We would expect the portfolio to migrate in this direction.
We appreciate your interest in the Fund. We continue to work hard to earn attractive returns for our investors and thank you for your support.
| Samantha McLemore, CFA January 15, 2021 | |||
Supplemental Questions:
What is the Fund's investment strategy?
The Fund seeks long-term growth of capital. The Fund normally invests in securities, derivatives, and other financial instruments that, in the portfolio managers' opinion, offer the opportunity for long-term growth of capital. The portfolio managers exercise a flexible strategy when selecting investments, not limited by investment style or asset class. The investment strategy typically involves identifying instances where the manager believes the capital markets have mispriced investment opportunities and exploiting price discrepancies and inefficiencies in the market. The Fund may invest in the common stock of U.S. and foreign securities, debt securities, derivatives and other financial instruments. The Fund may also engage to a substantial degree in short sales of securities and other instruments, and can borrow money for investment purposes in amounts up to 10% of its net assets, a practice known as "leveraging." Although the portfolio managers consider ratings in determining whether securities convertible into common stock or debt securities are appropriate investments for the Fund, such securities may include investments rated below investment grade, commonly known as "junk" bonds, and unrated securities.
What were the overall conditions during the Fund's reporting period?
All major indices and asset classes had a strong finish to 2020 despite how the year began. The Nasdaq Composite finished the year up 45.1% followed by the S&P500 gaining 18.4% and the Dow Jones Industrial Average closing out the year with a return of 9.7%. Eight out of the eleven sectors in the S&P 500 posted positive returns for the year, with Information Technology and Consumer Discretionary gaining the most with returns of 43.9% and 33.3%, respectively. On the other hand, Energy and Real Estate lost the most with returns of -33.7% and -2.2%, respectively. Large-caps continued to outperform Small-caps, which
Miller Opportunity Trust 2020 Annual Report
8
beat Mid-cap names. Specifically, the large-cap Russell 1000 Index gained 21.0%, ahead of the small-cap Russell 2000 Index's 19.9% return for the year followed by the Russell MidCap Index's 17.1% return. Growth stocks outperformed value stocks with the Russell 1000 Growth returning 38.5% compared with the Russell 1000 Value Index's gain of 2.8% over the year. Bonds lagged stocks, with the Barclays U.S. Aggregate underperforming all equity benchmarks with a 7.5% return. Long-dated US Treasuries performed better with the Barclays Long-Term Treasury Index gaining 18.1%. Commodities fell, with the Bloomberg Commodity Index declining 3.5% while the dollar lost 6.69% while gold gain 21.9% and Bitcoin took off to a new all-time-high returning 305.1%. Oil prices partially recovered from their declines earlier in the year ending the year down 20.5%. All major developed countries except for France, United Kingdom and Hong Kong ended the year up in local currency terms, with the US being the best market with a total return of 18.4% followed closely by Japan at 18.2%. Emerging market countries had a strong year helped by the dollar decline with India and Shanghai posting the largest gains in local currency terms, 16.6% and 16.6%, respectively.
How did we respond to these changing market conditions?
Short-term periods of high uncertainty, such as what we experienced in early 2020, often present buying opportunities for the Fund, as we aim to capitalize on favorable price dislocations relative to strong fundamentals. The Fund aims to monetize volatility in the market by paring back winners and adding to names where the market does not appropriately reflect the embedded intrinsic value. We also sold securities of companies we believed might be impaired by the COVID crisis to manage risk. Overall, our activity aimed to improve the risk-adjusted return potential of the portfolio. The Fund initiated 27 new positions and eliminated 20 in the year as we used the volatility opportunistically to improve the return potential of the portfolio.
Growth drove much of the market's returns in 2020, with the Russell 1000 Growth outperforming the Russell 1000 Value in 3 of the 4 quarters. The Fund, however, continues to invest in a mix of mispriced secular (long-term compounders) and cyclical (class value) companies, a positioning that enabled the Fund to respond favorably to the shifting market environment as we slowly recovered from the early 2020 disruption. The Fund trades attractively relative to the S&P 500 benchmark, with a forward Price-to-Earnings at 12.5x versus the S&P 500's 23.1x (as of 12/31/20).
What were the leading contributors to performance?
Farfetch Ltd. (FTCH), Amazon.com, Inc. (AMZN), and Peloton Interactive, Inc. (PTON) were the top contributors for the year based on contribution to total return.
Miller Opportunity Trust 2020 Annual Report
9
Miller Opportunity Trust manager commentary (unaudited) (cont'd)
What were the leading detractors from performance?
American Airlines Group Inc. (AAL), Delta Air Lines Inc. (DAL), and Flexion Therapeutics (FLXN) were the top detractors for the year based on contribution to total return.
Were there any significant changes to the Fund during the reporting period?
As discussed above, during the year we initiated 27 new positions while eliminating 20 holdings, bringing the Fund's total names to 47 as of December 31. The Fund's top 10 represent 41.8%% of total assets compared to 27.4% for the index, and maintained its meaningful active share of 94.3%. The manager provides a quarterly letter discussing portfolio changes at http://millervaluefunds.com.
The S&P 500 Index is a market capitalization-weighted index of 500 widely held common stocks. An investor cannot invest directly in an index. Unmanaged index returns do not reflect any fees, expenses or sales charges. The NASDAQ Composite Index is a market capitalization-weighted index that is designed to represent the performance of NASDAQ securities and it includes over 3,000 stocks. The Dow Jones Industrial Average (DJIA) is an unmanaged index composed of 30 blue-chip stocks, each with annual sales exceeding $7 billion. The DJIA is price-weighted, reflects large-cap companies representative of U.S. industry, and historically has moved in tandem with other major market indexes, such as the S&P 500. The Russell 1000® Index measures the performance of the 1,000 largest companies in the Russell 3000 Index, which represents approximately 92% of the total market capitalization of the Russell 3000 Index. The Russell Midcap Index, an unmanaged index, measures the performance of the 800 smallest companies in the Russell 1000 Index. The Russell 1000® Growth Index measures the performance of those Russell 1000 Index companies with higher price-to-book ratios and higher forecasted growth values. The Russell 1000® Value Index measures the performance of those Russell 1000 Index companies with lower price-to-book ratios and lower forecasted growth values. The Barclays U.S. Aggregate Bond Index tracks the daily price, coupon, pay-downs, and total return performance of fixed-rate, publicly placed, dollar-denominated, and nonconvertible investment grade debt issues with at least $250 million par amount outstanding and with at least one year to final maturity. The Barclays Long-Term Treasury Index includes publicly issued U.S. Treasury securities that have a remaining maturity of 10 or more years, are rated investment grade, and have $250 million or more of outstanding face value. An investor cannot invest directly in an index. Unmanaged index returns do not reflect any fees, expenses or sales charges. The Bloomberg Commodity Index is a highly liquid and diversified benchmark for commodity investments. Price-to-Earnings is the market price per share divided by earnings per share. The Russell 2000 index measures
Miller Opportunity Trust 2020 Annual Report
10
the performance of the 2,000 smallest-cap companies in the Russell 3000 Index. Free cash flow is earnings before depreciation, amortization, and non-cash charges minus maintenance capital expenditures. Book value is the value at which an asset is carried on a balance sheet. Duration is a measure of the sensitivity of a bond price or other debt instrument price to a change in interest rates. Dividend yield is the ratio of a company's annual dividend compared to its share price. Price-to-book ratio is used to compare a stock's market value to its book value. It is calculated by dividing the current closing price of the stock by the latest quarter's book value per share. Discounted cash flows is a valuation methodology used to estimate the value of an investment based on its expected future cash flows. Enterprise value (EV) is a measure of a company's total value. Return on invested capital (ROIC) is a ratio that is used to assess a company's efficiency at allocating the capital under its control to profitable investments. EBITDA is earnings before interest, taxes, depreciation and amortization and is a calculation of a company's financial health. SPX is the S&P 500 Index.
Must be preceded or accompanied by a current prospectus.
The views expressed are those of the portfolio managers as of the date indicated, are subject to change, and may differ from the views of other portfolio managers or the firm as a whole. These opinions are not intended to be a forecast of future events, a guarantee of future results, or investment advice. All data referenced are from sources deemed to be reliable but cannot be guaranteed.
Discussions of individual securities are intended to inform shareholders as to the basis (in whole or in part) for previously made decisions by a portfolio manager to buy, sell or hold a security in a portfolio. References to specific securities are not intended and should not be relied upon as the basis for anyone to buy, sell or hold any security. Portfolio holdings and sector allocations may not be representative of the portfolio manager's current or future investment and are subject to change at any time. Please refer to the schedule of investments in this report for complete holdings information.
Equity securities are subject to price fluctuation and possible loss of principal. Small- and mid-cap stocks involve greater risks and volatility than large-cap stocks. Real estate investment trusts (REITs) are closely linked to the performance of the real estate markets. REITs are subject to illiquidity, credit and interest rate risks, and risks associated with small and mid-cap investments. Asset-backed, mortgage-backed or mortgage-related securities are subject to prepayment and extension risks. Investments in MLP securities are subject to unique risks, including the risks of MLPs and the energy sector,
Miller Opportunity Trust 2020 Annual Report
11
Miller Opportunity Trust manager commentary (unaudited) (cont'd)
including the risks of declines in energy and commodity prices, decreases in energy demand, adverse weather conditions, natural or other disasters, changes in government regulation, and changes in tax laws. Short selling is a speculative strategy. Unlike the possible loss on a security that is purchased, there is no limit on the amount of loss on an appreciating security that is sold short. International investments are subject to special risks, including currency fluctuations and social, economic and political uncertainties, which could increase volatility. These risks are magnified in emerging markets. Fixed income securities involve interest rate, credit, inflation, and reinvestment risks; and possible loss of principal. As interest rates rise, the value of fixed-income securities falls. High yield bonds are subject to greater price volatility, illiquidity, and possibility of default. As a non-diversified Fund, it is permitted to invest a higher percentage of its assets in any one issuer than a diversified fund, which may magnify the Fund's losses from events affecting a particular issuer. Derivatives, such as options and futures, can be illiquid, may disproportionately increase losses, and have a potentially large impact on Fund performance.
Earnings growth is not representative of the Fund's future performance.
The Miller Value Funds are distributed by Quasar Distributors, LLC.
Miller Opportunity Trust 2020 Annual Report
12
Fund at a glance+ (unaudited)
Investment breakdown (%) as a percentage of total investments
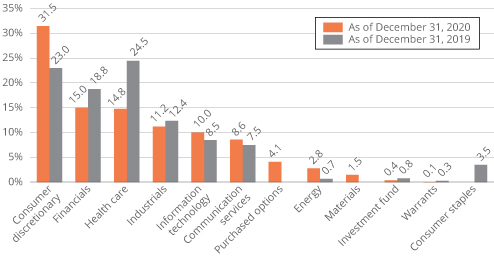
+ The bar graph above represents the composition of the Fund's investments as of December 31, 2020 and December 31, 2019. The Fund is actively managed. As a result, the composition of the Fund's investments is subject to change at any time.
Miller Opportunity Trust 2020 Annual Report
13
Fund expenses (unaudited)
As a shareholder of the Fund, you may incur two types of costs: (1) transaction costs, including front-end and back-end sales charges (loads) on purchase payments; and (2) ongoing costs, including management fees; service and/or distribution (12b-1) fees; and other Fund expenses. This example is intended to help you understand your ongoing costs (in dollars) of investing in the Fund and to compare these costs with the ongoing costs of investing in other mutual funds.
The example is based on an investment of $1,000 invested on July 1, 2020 and held for the six months ended December 31, 2020.
Actual Expenses
The table below titled "Based on total actual return" provides information about actual account values and actual expenses. You may use the information provided in this table, together with the amount you invested, to estimate the expenses that you paid over the period. To estimate the expenses you paid on your account, divide your ending account value by $1,000 (for example, an $8,600 ending account value divided by $1,000 = 8.6), then multiply the result by the number under the heading entitled "Expenses Paid During the Period".
Hypothetical Example for Comparison Purposes
The table below titled "Based on hypothetical actual return" provides information about hypothetical account values and hypothetical expenses based on the actual expense ratio and an assumed rate of return of 5.00% per year before expenses, which is not the Fund's actual return. The hypothetical account values and expenses may not be used to estimate the actual ending account balance or expenses you paid for the period. You may use this information provided in this table to compare the ongoing costs of investing in the Fund and other funds. To do so, compare the 5.00% hypothetical example relating to the Fund with the 5.00% hypothetical examples that appear in the shareholder reports of the other funds.
Please note that the expenses shown in the table below are meant to highlight your ongoing costs only and do not reflect any transactional costs, such as front-end or back-end sales charges (loads). Therefore, the table is useful in comparing ongoing costs only, and will not help you determine the relative total costs of owning different funds. In addition, if these transactional costs were included, your costs could have been higher.
Miller Opportunity Trust 2020 Annual Report
14
Based on total actual return1
| Actual Total Return Without Sales Charges2 | Beginning Account Value | Ending Account Value | Annualized Expense Ratio | Expenses Paid During the Period3 | |||||||||||||||||||
Class A | 53.99 | % | $ | 1,000.00 | $ | 1,539.90 | 1.24 | % | $ | 7.93 | |||||||||||||
Class C | 53.39 | 1,000.00 | 1,533.90 | 1.99 | 12.67 | ||||||||||||||||||
Class FI | 53.92 | 1,000.00 | 1,539.20 | 1.31 | 8.36 | ||||||||||||||||||
Class R | 53.75 | 1,000.00 | 1,537.50 | 1.48 | 9.44 | ||||||||||||||||||
Class I | 54.14 | 1,000.00 | 1,541.40 | 1.00 | 6.36 | ||||||||||||||||||
Class IS | 54.24 | 1,000.00 | 1,542.40 | 0.93 | 5.94 | ||||||||||||||||||
Based on hypothetical actual return1
| Hypothetical Annualized Total Return | Beginning Account Value | Ending Account Value | Annualized Expense Ratio | Expenses Paid During the Period3 | |||||||||||||||||||
Class A | 5.00 | % | $ | 1,000.00 | $ | 1,018.89 | 1.24 | % | $ | 6.30 | |||||||||||||
Class C | 5.00 | 1,000.00 | 1,015.13 | 1.99 | 10.08 | ||||||||||||||||||
Class FI | 5.00 | 1,000.00 | 1,018.55 | 1.31 | 6.65 | ||||||||||||||||||
Class R | 5.00 | 1,000.00 | 1,017.69 | 1.48 | 7.51 | ||||||||||||||||||
Class I | 5.00 | 1,000.00 | 1,020.13 | 1.00 | 5.06 | ||||||||||||||||||
Class IS | 5.00 | 1,000.00 | 1,020.46 | 0.93 | 4.72 | ||||||||||||||||||
1 For the six months ended December 31, 2020.
2 Assumes the reinvestment of all distributions, including returns of capital, if any, at net asset value or does not reflect the deduction of the applicable sales charge with respect to Class A shares or the applicable contingent deferred sales charge ("CSDC") with respect to Class C shares. Total return is not annualized, as it may not be representative of the total return for the year. Performance figures may reflect compensating balance arrangements, fee waivers and/or expense reimbursements. In the absence of compensating balance arrangements, fee waivers and/or expense reimbursements, the total return would have been lower. Past performance is no guarantee of future results.
3 Expenses (net of compensating balance arrangements, fee waivers and/or expense reimbursements) are equal to each class' respective annualized expense ratio multiplied by the average account value over the period, multiplied by the number of days in the most recent fiscal half-year (184), then divided by 366.
Miller Opportunity Trust 2020 Annual Report
15
Fund performance (unaudited)
Historical Performance
Value of $10,000 invested in
Class A Shares of Miller Opportunity Trust vs. S&P 500 Index† — December 2010 - December 2020
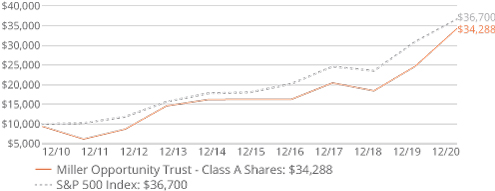
All figures represent past performance and are not a guarantee of future results. Investment return and principal value of an investment will fluctuate so that an investor's shares, when redeemed, may be worth more or less than their original cost. The returns shown do not reflect the deduction of taxes that a shareholder would pay on Fund distributions or the redemption of Fund shares. Performance figures may reflect compensating balance arrangements, fee waivers and/or expense reimbursements. In the absence of compensating balance arrangements, fee waivers and/or expense reimbursements, the total return would have been lower.
† Hypothetical illustration of $10,000 invested in Class A shares of Miller Opportunity Trust on December 31, 2010, assuming the maximum sales charge at purchase and reinvestment of all distributions, including returns of capital, if any, at net asset value through December 31, 2020. The hypothetical illustration also assumes a $10,000 investment in the S&P 500 Index. The S&P 500 Index is an unmanaged index of 500 stocks and is generally representative of the performance of larger companies in the U.S. The index is unmanaged and is not subject to the same management and trading expenses as a mutual fund. Please note that an investor cannot invest directly in an index. The performance of the Fund's other classes may be greater or less than the Class A shares' performance indicated on this chart, depending on whether greater or lesser sales charges and fees were incurred by shareholders investing in the other classes.
Miller Opportunity Trust 2020 Annual Report
16
Schedule of investments
December 31, 2020
Miller Opportunity Trust
Security | Shares | Value | |||||||||
Common Stocks — 101.2% | |||||||||||
Communication Services — 9.1% | |||||||||||
Entertainment — 1.2% | |||||||||||
Netflix Inc. * | 50,000 | $ | 27,036,500 | ||||||||
Interactive Media & Services — 6.2% | |||||||||||
Alphabet Inc. *(a) | 37,500 | 65,724,000 | |||||||||
Facebook Inc., Class A Shares *(a) | 270,000 | 73,753,200 | |||||||||
Total Interactive Media & Services | 139,477,200 | ||||||||||
Media — 1.7% | |||||||||||
Discovery Inc., Class A Shares * | 1,300,000 | 39,117,000 | |||||||||
Total Communication Services | 205,630,700 | ||||||||||
Consumer Discretionary — 33.4% | |||||||||||
Diversified Consumer Services — 2.2% | |||||||||||
WW International Inc. * | 2,000,000 | 48,800,000 | |||||||||
Hotels, Restaurants & Leisure — 2.3% | |||||||||||
Norwegian Cruise Line Holdings Ltd. * | 2,000,000 | 50,860,000 | |||||||||
Household Durables — 2.8% | |||||||||||
Taylor Morrison Home Corp. * | 2,450,000 | 62,842,500 | |||||||||
Internet & Direct Marketing Retail — 21.3% | |||||||||||
Alibaba Group Holding Ltd. — ADR * | 300,000 | 69,819,000 | |||||||||
Amazon.com Inc. *(a) | 30,000 | 97,707,900 | |||||||||
Farfetch Ltd. *(a) | 1,800,000 | 114,858,000 | |||||||||
Quotient Technology Inc. *(b) | 4,900,000 | 46,158,000 | |||||||||
RealReal Inc./The * | 2,900,000 | 56,666,000 | |||||||||
Stitch Fix Inc., Class A Shares * | 1,600,000 | 93,952,000 | |||||||||
Total Internet & Direct Marketing Retail | 479,160,900 | ||||||||||
Specialty Retail — 2.9% | |||||||||||
Vroom Inc. * | 1,600,000 | 65,552,000 | |||||||||
Textiles, Apparel & Luxury Goods — 1.9% | |||||||||||
Canada Goose Holdings Inc. *(a) | 1,450,000 | 43,166,500 | |||||||||
Total Consumer Discretionary | 750,381,900 | ||||||||||
Energy — 2.9% | |||||||||||
Oil, Gas & Consumable Fuels — 2.9% | |||||||||||
Diamondback Energy Inc. | 450,000 | 21,780,000 | |||||||||
Energy Transfer LP | 7,100,000 | 43,878,000 | |||||||||
Total Oil, Gas & Consumable Fuels | 65,658,000 | ||||||||||
Total Energy | 65,658,000 | ||||||||||
Financials — 15.9% | |||||||||||
Banks — 6.5% | |||||||||||
Bank of America Corp. | 1,700,000 | 51,527,000 | |||||||||
Citigroup Inc. (a) | 700,000 | 43,162,000 | |||||||||
JPMorgan Chase & Co. | 400,000 | 50,828,000 | |||||||||
Total Banks | 145,517,000 | ||||||||||
Miller Opportunity Trust 2020 Annual Report
17
Schedule of investments (cont'd)
December 31, 2020
Miller Opportunity Trust
Security | Shares | Value | |||||||||
Consumer Finance — 5.9% | |||||||||||
Capital One Financial Corp. | 525,000 | $ | 51,896,250 | ||||||||
OneMain Holdings Inc.(a) | 1,700,000 | 81,872,000 | |||||||||
Total Consumer Finance | 133,768,250 | ||||||||||
Insurance — 1.0% | |||||||||||
Genworth Financial Inc., Class A Shares *(a) | 6,000,000 | 22,680,000 | |||||||||
Thrifts & Mortgage Finance — 2.5% | |||||||||||
Rocket Cos Inc. * | 2,800,000 | 56,616,000 | |||||||||
Total Financials | 358,581,250 | ||||||||||
Health Care — 15.7% | |||||||||||
Biotechnology — 5.1% | |||||||||||
Flexion Therapeutics Inc. *(b) | 3,200,000 | 36,928,000 | |||||||||
Precigen Inc. * | 5,400,000 | 55,080,000 | |||||||||
ZIOPHARM Oncology Inc. *(b) | 9,400,000 | 23,688,000 | |||||||||
Total Biotechnology | 115,696,000 | ||||||||||
Health Care Providers & Services — 2.0% | |||||||||||
Tivity Health Inc. * | 2,300,000 | 45,057,000 | |||||||||
Life Sciences Tools & Services — 2.0% | |||||||||||
PureTech Health Plc * | 8,000,000 | 43,760,085 | |||||||||
Pharmaceuticals — 6.6% | |||||||||||
Bausch Health Cos Inc. *(a) | 2,600,000 | 54,080,000 | |||||||||
Green Thumb Industries Inc. * | 1,700,000 | 41,650,000 | |||||||||
Teva Pharmaceutical Industries Ltd. — ADR * | 5,400,000 | 52,110,000 | |||||||||
Total Pharmaceuticals | 147,840,000 | ||||||||||
Total Health Care | 352,353,085 | ||||||||||
Industrials — 11.9% | |||||||||||
Aerospace & Defense — 1.9% | |||||||||||
Boeing Co/The * | 200,000 | 42,812,000 | |||||||||
Airlines — 2.0% | |||||||||||
Delta Air Lines Inc. (a) | 1,100,000 | 44,231,000 | |||||||||
Commercial Services & Supplies — 3.3% | |||||||||||
ADT Inc. (a) | 9,500,000 | 74,575,000 | |||||||||
Electrical Equipment — 2.7% | |||||||||||
Acuity Brands Inc. | 500,000 | 60,545,000 | |||||||||
Road & Rail — 2.0% | |||||||||||
Uber Technologies Inc. * | 900,000 | 45,900,000 | |||||||||
Total Industrials | 268,063,000 | ||||||||||
Information Technology — 10.7% | |||||||||||
IT Services — 4.6% | |||||||||||
DXC Technology Co. (a) | 4,000,000 | 103,000,000 | |||||||||
Miller Opportunity Trust 2020 Annual Report
18
Miller Opportunity Trust
Security | Shares | Value | |||||||||||||||||||||
Software — 2.0% | |||||||||||||||||||||||
GTY Technology Holdings Inc. * | 1,500,000 | $ | 7,770,000 | ||||||||||||||||||||
Workday Inc. * | 150,000 | 35,941,500 | |||||||||||||||||||||
Total Software | 43,711,500 | ||||||||||||||||||||||
Technology Hardware, Storage & Peripherals — 4.1% | |||||||||||||||||||||||
Desktop Metal Inc. *(c)(d) | 6,000,000 | 92,880,000 | |||||||||||||||||||||
Total Information Technology | 239,591,500 | ||||||||||||||||||||||
Materials — 1.6% | |||||||||||||||||||||||
Chemicals — 1.6% | |||||||||||||||||||||||
Chemours Co/The | 1,400,000 | 34,706,000 | |||||||||||||||||||||
Total Materials | 34,706,000 | ||||||||||||||||||||||
| Total Common Stocks (Cost — $1,793,297,098) | 2,274,965,435 | ||||||||||||||||||||||
Investment Fund — 0.5% | |||||||||||||||||||||||
Pangaea One, LP (b)(c)(d) | 1 | 10,096,002 | |||||||||||||||||||||
| Total Investment Fund (Cost — $33,993,989) | 10,096,002 | ||||||||||||||||||||||
| Maturity Date | Strike Price | Contracts | Notional ($) | ||||||||||||||||||||
Purchased Options — 4.4% | |||||||||||||||||||||||
CVS Health Corp. | Jan. 20, 2023 | $ | 60.00 | 6,500 | 44,395,000 | 8,726,250 | |||||||||||||||||
Uber Technologies Inc. | Jan. 21, 2022 | 32.00 | 42,000 | 214,200,000 | 90,195,000 | ||||||||||||||||||
| Total Purchased Options (Cost — $40,066,752) | 98,921,250 | ||||||||||||||||||||||
| Expiration Date | Exercise Price | Shares | |||||||||||||||||||||
Warrants — 0.1% | |||||||||||||||||||||||
| GTY Technology Holdings Inc. * | Feb. 19, 2024 | $ | 11.50 | 482,500 | 168,875 | ||||||||||||||||||
| ZIOPHARM Oncology Inc. *(b)(c)(d) | Jul. 26, 2024 | 7.00 | 3,787,879 | 1,846,591 | |||||||||||||||||||
| Total Warrants (Cost — $1,678,957) | 2,015,466 | ||||||||||||||||||||||
| Total Investments — 106.2% (Cost — $1,869,036,796) | $ | 2,385,998,153 | |||||||||||||||||||||
Liabilities in Excess of Other Assets — (6.2)% | (139,017,765 | ) | |||||||||||||||||||||
Total Net Assets — 100.0% | $ | 2,246,980,388 | |||||||||||||||||||||
* Non-income producing security.
(a) All or a portion of this security is pledged as collateral pursuant to the loan agreement.
(b) In this instance, as defined in the Investment Company Act of 1940, an "Affiliated Company" represents Fund ownership of at least 5% of the outstanding voting securities of an issuer, or outstanding capital for Pangaea One, LP. At December 31, 2020, the total market value
Miller Opportunity Trust 2020 Annual Report
19
Schedule of investments (cont'd)
December 31, 2020
Miller Opportunity Trust
of investments in Affiliated Companies was $118,716,593 and the cost was $183,394,212. (See Note 8).
(c) Security is valued in good faith in accordance with procedures approved by the Board of Trustees (See Note 2).
(d) Restricted security (See Note 9).
The Global Industry Classification Standard (GICS®) was developed by and/or is the exclusive property of Morgan Stanley International, Inc. ("MSCI") and Standard & Poor's Financial Services LLC ("S&P"). GICS is a service mark of MSCI and S&P and has been licensed for use by U.S. Bancorp Fund Services, LLC.
The Accompanying Notes are an Integral Part of these Financial Statements.
Miller Opportunity Trust 2020 Annual Report
20
Statement of assets and liabilities
December 31, 2020
Assets: | |||||||
Investments in unaffiliated securities, at value (Cost $1,685,642,584) | $ | 2,267,281,560 | |||||
Investments in affiliated securities, at value (Cost $183,394,212) | 118,716,593 | ||||||
Cash | 4,724,361 | ||||||
Receivable for securities sold | 6,594,557 | ||||||
Receivable for Fund shares sold | 2,231,303 | ||||||
Dividends and interest receivable | 332,500 | ||||||
Prepaid expenses | 54,394 | ||||||
Total Assets | 2,399,935,268 | ||||||
Liabilities: | |||||||
Line of credit payable (Note 6) | 145,000,000 | ||||||
Payable for securities purchased | 2,453,945 | ||||||
Payable for Fund shares repurchased | 2,761,647 | ||||||
Investment management fee payable | 1,457,192 | ||||||
Distribution and service fees payable | 683,201 | ||||||
Interest payable | 102,944 | ||||||
Accrued other expenses | 495,951 | ||||||
Total Liabilities | 152,954,880 | ||||||
Total Net Assets | $ | 2,246,980,388 | |||||
Net Assets: | |||||||
Paid-in capital | $ | 1,704,635,371 | |||||
Total accumulated earnings | 542,345,017 | ||||||
Total Net Assets | $ | 2,246,980,388 | |||||
The Accompanying Notes are an Integral Part of these Financial Statements.
Miller Opportunity Trust 2020 Annual Report
21
Statement of assets and liabilities (cont'd)
December 31, 2020
Net Assets: | |||||||
Class A | $ | 941,941,856 | |||||
Class C | $ | 204,213,513 | |||||
Class FI | $ | 14,458,308 | |||||
Class R | $ | 8,194,811 | |||||
Class I | $ | 1,077,437,575 | |||||
Class IS | $ | 734,325 | |||||
Shares Outstanding: | |||||||
Class A | 23,556,910 | ||||||
Class C | 5,531,541 | ||||||
Class FI | 351,051 | ||||||
Class R | 205,778 | ||||||
Class I | 24,638,593 | ||||||
Class IS | 16,759 | ||||||
Net Asset Value: | |||||||
Class A (and redemption price) | $ | 39.99 | |||||
Class C (redemption price* and offering price per share) | $ | 36.92 | |||||
Class FI (redemption price and offering price per share) | $ | 41.19 | |||||
Class R (redemption price and offering price per share) | $ | 39.82 | |||||
Class I (redemption price and offering price per share) | $ | 43.73 | |||||
Class IS (redemption price and offering price per share) | $ | 43.82 | |||||
Maximum Public Offering Price Per Share: | |||||||
Class A (based on maximum initial sales charge of 5.75%) | $ | 42.43 | |||||
* Redemption price per share of Class C shares is NAV reduced by a 1.00% CDSC if shares are redeemed within one year of purchase (See Note 3).
The Accompanying Notes are an Integral Part of these Financial Statements.
Miller Opportunity Trust 2020 Annual Report
22
Statement of operations
For the Year Ended December 31, 2020
Investment Income: | |||||||
Dividends from unaffiliated investments (Net of foreign tax of $56,250) | $ | 19,355,449 | |||||
Dividends from affiliated investments | 393,306 | ||||||
Total Investment Income | 19,748,755 | ||||||
Expenses: | |||||||
Investment management fee (Note 3) | 12,221,941 | ||||||
Distribution fees (Note 5) | 3,446,535 | ||||||
Interest expense (Note 6) | 1,574,264 | ||||||
Shareholder servicing fee (Note 5) | 1,021,038 | ||||||
Administration and fund accounting fees (Note 3) | 839,797 | ||||||
Transfer agent expenses (Note 3) | 358,247 | ||||||
Registration fees | 113,659 | ||||||
Custody fees (Note 3) | 99,381 | ||||||
Shareholder reports | 96,392 | ||||||
Legal fees | 37,600 | ||||||
Audit and tax fees | 20,613 | ||||||
Insurance | 14,897 | ||||||
Trustees' fees (Note 3) | 14,326 | ||||||
Compliance fees (Note 3) | 13,279 | ||||||
Miscellaneous expenses | 78,635 | ||||||
Total Expenses | 19,950,604 | ||||||
Less: Fee waivers and/or expense reimbursement (Note 3) | (77,684 | ) | |||||
Net Expenses | 19,872,920 | ||||||
Net Investment loss | (124,165 | ) | |||||
Realized and Unrealized Gain (Loss) on Investments (Note 2): | |||||||
Net Realized Gain (Loss) From: | |||||||
Investments in unaffiliated securities | 136,627,305 | ||||||
Investments in affiliated securities | (5,118,375 | ) | |||||
Net Realized Gain | 131,508,930 | ||||||
Net Change in Unrealized Appreciation (Depreciation) From: | |||||||
Investments in unaffiliated securities | 535,782,567 | ||||||
Investments in affiliated securities | (50,938,179 | ) | |||||
Net Change in Unrealized Appreciation (Depreciation) | 484,844,388 | ||||||
Net Gain on Investments | 616,353,318 | ||||||
Increase in Net Assets from Operations | $ | 616,229,153 | |||||
The Accompanying Notes are an Integral Part of these Financial Statements.
Miller Opportunity Trust 2020 Annual Report
23
Statements of changes in net assets
For the Year Ended December 31, | 2020 | 2019 | |||||||||
Operations: | |||||||||||
Net investment loss | $ | (124,165 | ) | $ | (5,584,331 | ) | |||||
Net realized gain (loss) | 131,508,930 | (52,466,487 | ) | ||||||||
Change in unrealized appreciation | 484,844,388 | 491,729,797 | |||||||||
Increase in Net Assets from Operations | 616,229,153 | 433,678,979 | |||||||||
Fund Share Transactions (Note 7): | |||||||||||
Net proceeds from sale of shares | 386,734,000 | 611,530,990 | |||||||||
Cost of shares repurchased | (435,939,749 | ) | (683,295,174 | ) | |||||||
| (Decrease) in Net Assets from Fund Share Transactions | (49,205,749 | ) | (71,764,184 | ) | |||||||
Increase in Net Assets | 567,023,404 | 361,914,795 | |||||||||
Net Assets: | |||||||||||
Beginning of year | 1,679,956,984 | 1,318,042,189 | |||||||||
End of year | $ | 2,246,980,388 | $ | 1,679,956,984 | |||||||
The Accompanying Notes are an Integral Part of these Financial Statements.
Miller Opportunity Trust 2020 Annual Report
24
Financial highlights
For a share of beneficial interest outstanding throughout each year ended December 31:
Class A Shares | 2020 | 2019 | 2018 | 2017 | 2016 | ||||||||||||||||||
Net asset value, beginning of year | $ | 28.85 | $ | 21.54 | $ | 23.88 | $ | 18.96 | $ | 19.01 | |||||||||||||
Income (loss) from operations: | |||||||||||||||||||||||
Net investment income (loss)1 | (0.01 | ) | 0.002 | (0.13 | ) | (0.14 | ) | (0.09 | ) | ||||||||||||||
Net realized and unrealized gain (loss) | 11.15 | 7.31 | (2.21 | ) | 5.06 | 0.043 | |||||||||||||||||
| Total income (loss) from operations | 11.14 | 7.31 | (2.34 | ) | 4.92 | (0.05 | ) | ||||||||||||||||
Net asset value, end of year | $ | 39.99 | $ | 28.85 | $ | 21.54 | $ | 23.88 | $ | 18.96 | |||||||||||||
Total return4 | 38.61 | %5 | 33.94 | %5 | -9.80 | %5 | 25.95 | % | -0.26 | %5 | |||||||||||||
Net assets, end of year (000s) | $ | 941,942 | $ | 705,372 | $ | 221,842 | $ | 266,560 | $ | 216,974 | |||||||||||||
Ratios to average net assets: | |||||||||||||||||||||||
Gross expenses6 | 1.28 | % | 1.47 | % | 1.39 | % | 1.34 | % | 1.31 | % | |||||||||||||
Net expenses6 | 1.287 | 1.477 | 1.397 | 1.347 | 1.31 | ||||||||||||||||||
Net investment income (loss) | (0.04 | ) | 0.02 | (0.49 | ) | (0.64 | ) | (0.52 | ) | ||||||||||||||
Portfolio turnover rate | 64 | % | 35 | % | 30 | % | 120 | % | 85 | %8 | |||||||||||||
1 Per share amounts have been calculated using the average shares method.
2 Amount is less than $0.01 per share.
3 Calculation of the net gain per share (both realized and unrealized) does not correlate to the aggregate realized and unrealized losses presented in the Statement of Operations due to the timing of sales and repurchases of Fund shares in relation to fluctuating market values of the investments of the Fund.
4 Performance figures, exclusive of sales charges, may reflect fee waivers and/or expense reimbursements. In the absence of fee waivers and/or expense reimbursements, the total return would have been lower. Past performance is no guarantee of future results. Total returns for periods of less than one year are not annualized.
5 The total return includes gains from settlement of security litigations. Without these gains, the total return would have been 38.51%, 33.89%, -9.84% and -0.37% for the years ended December 31, 2020, 2019, 2018 and 2016, respectively.
6 Does not include fees and expenses of the Underlying Funds in which the Fund invests.
7 Effective April 30, 2020, the Adviser agreed to waive fees and/or reimburse operating expenses, (other than front-end or contingent deferred loads, taxes, interest expense, brokerage commissions, acquired fund fees and expenses, expenses incurred in connection with any merger or reorganization, portfolio transaction expenses, dividends paid on short sales, extraordinary expenses such as litigation, Rule 12b-1 fees, intermediary servicing fees, or any other class-specific expenses) through April 30, 2021, so that such annual operating expenses will not exceed 0.88%. Prior to April 30, 2020, the limit was 1.20% and established at the class level (inclusive of 12b-1 and shareholder servicing fees). Interest expenses were 0.10%, 0.28%, 0.21% and 0.16% for the years ended December 31, 2020, 2019, 2018 and 2017, respectively. Excluding interest, the expense ratios were 1.18%, 1.19%, 1.18% and 1.18% for the years ended December 31, 2020, 2019, 2018 and 2017, respectively (See Note 3).
8 Excludes securities delivered as a result of a redemption in-kind.
The Accompanying Notes are an Integral Part of these Financial Statements.
Miller Opportunity Trust 2020 Annual Report
25
Financial highlights (cont'd)
For a share of beneficial interest outstanding throughout each year ended December 31:
Class C Shares | 2020 | 2019 | 2018 | 2017 | 2016 | ||||||||||||||||||
Net asset value, beginning of year | $ | 26.84 | $ | 20.19 | $ | 22.55 | $ | 18.04 | $ | 18.23 | |||||||||||||
Income (loss) from operations: | |||||||||||||||||||||||
Net investment loss1 | (0.23 | ) | (0.29 | ) | (0.30 | ) | (0.29 | ) | (0.21 | ) | |||||||||||||
Net realized and unrealized gain (loss) | 10.31 | 6.94 | (2.06 | ) | 4.80 | 0.022 | |||||||||||||||||
| Total income (loss) from operations | 10.08 | 6.65 | (2.36 | ) | 4.51 | (0.19 | ) | ||||||||||||||||
Net asset value, end of year | $ | 36.92 | $ | 26.84 | $ | 20.19 | $ | 22.55 | $ | 18.04 | |||||||||||||
Total return3 | 37.56 | %4 | 32.94 | %4 | -10.47 | %4 | 25.00 | % | -1.04 | %4 | |||||||||||||
Net assets, end of year (000s) | $ | 204,214 | $ | 216,364 | $ | 559,251 | $ | 694,001 | $ | 657,038 | |||||||||||||
Ratios to average net assets: | |||||||||||||||||||||||
Gross expenses5 | 2.03 | % | 2.22 | % | 2.13 | % | 2.11 | % | 2.09 | % | |||||||||||||
Net expenses5 | 2.036 | 2.226 | 2.136 | 2.116 | 2.09 | ||||||||||||||||||
Net investment loss | (0.88 | ) | (1.25 | ) | (1.24 | ) | (1.42 | ) | (1.30 | ) | |||||||||||||
Portfolio turnover rate | 64 | % | 35 | % | 30 | % | 120 | % | 85 | %7 | |||||||||||||
1 Per share amounts have been calculated using the average shares method.
2 Calculation of the net gain per share (both realized and unrealized) does not correlate to the aggregate realized and unrealized losses presented in the Statement of Operations due to the timing of sales and repurchases of Fund shares in relation to fluctuating market values of the investments of the Fund.
3 Performance figures, exclusive of CDSC, may reflect fee waivers and/or expense reimbursements. In the absence of fee waivers and/or expense reimbursements, the total return would have been lower. Past performance is no guarantee of future results. Total returns for periods of less than one year are not annualized.
4 The total return includes gains from settlement of security litigations. Without these gains, the total return would have been 37.44%, 32.69%, -10.51% and -1.15% for the years ended December 31, 2020, 2019, 2018 and 2016, respectively.
5 Does not include fees and expenses of the Underlying Funds in which the Fund invests.
6 Effective April 30, 2020, the Adviser agreed to waive fees and/or reimburse operating expenses, (other than front-end or contingent deferred loads, taxes, interest expense, brokerage commissions, acquired fund fees and expenses, expenses incurred in connection with any merger or reorganization, portfolio transaction expenses, dividends paid on short sales, extraordinary expenses such as litigation, Rule 12b-1 fees, intermediary servicing fees, or any other class-specific expenses) through April 30, 2021, so that such annual operating expenses will not exceed 0.88%. Prior to April 30, 2020, the limit was 1.97% and established at the class level (inclusive of 12b-1 and shareholder servicing fees). Interest expenses were 0.10%, 0.28%, 0.21% and 0.16% for the years ended December 31, 2020, 2019, 2018 and 2017, respectively. Excluding interest, the expense ratios were 1.93%, 1.94%, 1.92% and 1.95% for the years ended December 31, 2020, 2019, 2018 and 2017, respectively (See Note 3).
7 Excludes securities delivered as a result of a redemption in-kind.
The Accompanying Notes are an Integral Part of these Financial Statements.
Miller Opportunity Trust 2020 Annual Report
26
For a share of beneficial interest outstanding throughout each year ended December 31:
Class FI Shares | 2020 | 2019 | 2018 | 2017 | 2016 | ||||||||||||||||||
Net asset value, beginning of year | $ | 29.74 | $ | 22.22 | $ | 24.64 | $ | 19.57 | $ | 19.62 | |||||||||||||
Income (loss) from operations: | |||||||||||||||||||||||
Net investment income (loss)1 | (0.05 | ) | (0.09 | ) | (0.14 | ) | (0.16 | ) | (0.10 | ) | |||||||||||||
Net realized and unrealized gain (loss) | 11.50 | 7.61 | (2.28 | ) | 5.23 | 0.052 | |||||||||||||||||
| Total income (loss) from operations | 11.45 | 7.52 | (2.42 | ) | 5.07 | (0.05 | ) | ||||||||||||||||
Net asset value, end of year | $ | 41.19 | $ | 29.74 | $ | 22.22 | $ | 24.64 | $ | 19.57 | |||||||||||||
Total return3 | 38.50 | %4 | 33.84 | %4 | -9.82 | %4 | 25.91 | % | -0.25 | %4 | |||||||||||||
Net assets, end of year (000s) | $ | 14,458 | $ | 14,026 | $ | 13,278 | $ | 24,394 | $ | 22,474 | |||||||||||||
Ratios to average net assets: | |||||||||||||||||||||||
Gross expenses5 | 1.35 | % | 1.53 | % | 1.41 | % | 1.39 | % | 1.35 | % | |||||||||||||
Net expenses5 | 1.356 | 1.536 | 1.416 | 1.396 | 1.35 | ||||||||||||||||||
Net investment loss | (0.19 | ) | (0.34 | ) | (0.53 | ) | (0.70 | ) | (0.56 | ) | |||||||||||||
Portfolio turnover rate | 64 | % | 35 | % | 30 | % | 120 | % | 85 | %7 | |||||||||||||
1 Per share amounts have been calculated using the average shares method.
2 Calculation of the net gain per share (both realized and unrealized) does not correlate to the aggregate realized and unrealized losses presented in the Statement of Operations due to the timing of sales and repurchases of Fund shares in relation to fluctuating market values of the investments of the Fund.
3 Performance figures may reflect fee waivers and/or expense reimbursements. In the absence of fee waivers and/or expense reimbursements, the total return would have been lower. Past performance is no guarantee of future results. Total returns for periods of less than one year are not annualized.
4 The total return includes gains from settlement of security litigations. Without these gains, the total return would have been 38.40%, 33.71%, -9.90% and -0.36% for the years ended December 31, 2020, 2019, 2018 and 2016, respectively.
5 Does not include fees and expenses of the Underlying Funds in which the Fund invests.
6 Effective April 30, 2020, the Adviser agreed to waive fees and/or reimburse operating expenses, (other than front-end or contingent deferred loads, taxes, interest expense, brokerage commissions, acquired fund fees and expenses, expenses incurred in connection with any merger or reorganization, portfolio transaction expenses, dividends paid on short sales, extraordinary expenses such as litigation, Rule 12b-1 fees, intermediary servicing fees, or any other class-specific expenses) through April 30, 2021, so that such annual operating expenses will not exceed 0.88%. Prior to April 30, 2020, the limit was 1.26% and established at the class level (inclusive of 12b-1 and shareholder servicing fees). Interest expenses were 0.10%, 0.28%, 0.21% and 0.16% for the years ended December 31, 2020, 2019, 2018 and 2017, respectively. Excluding interest, the expense ratios were 1.25%, 1.25%, 1.20% and 1.23% for the years ended December 31, 2020, 2019, 2018 and 2017, respectively (See Note 3).
7 Excludes securities delivered as a result of a redemption in-kind.
The Accompanying Notes are an Integral Part of these Financial Statements.
Miller Opportunity Trust 2020 Annual Report
27
Financial highlights (cont'd)
For a share of beneficial interest outstanding throughout each year ended December 31:
Class R Shares | 2020 | 2019 | 2018 | 2017 | 2016 | ||||||||||||||||||
Net asset value, beginning of year | $ | 28.81 | $ | 21.57 | $ | 23.98 | $ | 19.10 | $ | 19.21 | |||||||||||||
Income (loss) from operations: | |||||||||||||||||||||||
Net investment loss1 | (0.09 | ) | (0.14 | ) | (0.21 | ) | (0.21 | ) | (0.15 | ) | |||||||||||||
Net realized and unrealized gain (loss) | 11.10 | 7.38 | (2.20 | ) | 5.09 | 0.042 | |||||||||||||||||
| Total income (loss) from operations | 11.01 | 7.24 | (2.41 | ) | 4.88 | (0.11 | ) | ||||||||||||||||
Net asset value, end of year | $ | 39.82 | $ | 28.81 | $ | 21.57 | $ | 23.98 | $ | 19.10 | |||||||||||||
Total return3 | 38.22 | %4 | 33.57 | %4 | -10.05 | %4 | 25.55 | % | -0.57 | %4 | |||||||||||||
Net assets, end of year (000s) | $ | 8,195 | $ | 7,122 | $ | 5,778 | $ | 8,367 | $ | 7,708 | |||||||||||||
Ratios to average net assets: | |||||||||||||||||||||||
Gross expenses5 | 1.53 | % | 1.76 | % | 1.67 | % | 1.66 | % | 1.66 | % | |||||||||||||
Net expenses5 | 1.536 | 1.766 | 1.676 | 1.666 | 1.66 | ||||||||||||||||||
Net investment loss | (0.32 | ) | (0.54 | ) | (0.79 | ) | (0.97 | ) | (0.86 | ) | |||||||||||||
Portfolio turnover rate | 64 | % | 35 | % | 30 | % | 120 | % | 85 | %7 | |||||||||||||
1 Per share amounts have been calculated using the average shares method.
2 Calculation of the net gain per share (both realized and unrealized) does not correlate to the aggregate realized and unrealized losses presented in the Statement of Operations due to the timing of sales and repurchases of Fund shares in relation to fluctuating market values of the investments of the Fund.
3 Performance figures may reflect fee waivers and/or expense reimbursements. In the absence of fee waivers and/or expense reimbursements, the total return would have been lower. Past performance is no guarantee of future results. Total returns for periods of less than one year are not annualized.
4 The total return includes gains from settlement of security litigations. Without these gains, the total return would have been 38.11%, 33.43%, -10.13% and -0.68% for the years ended December 31, 2020, 2019, 2018 and 2016, respectively.
5 Does not include fees and expenses of the Underlying Funds in which the Fund invests.
6 Effective April 30, 2020, the Adviser agreed to waive fees and/or reimburse operating expenses, (other than front-end or contingent deferred loads, taxes, interest expense, brokerage commissions, acquired fund fees and expenses, expenses incurred in connection with any merger or reorganization, portfolio transaction expenses, dividends paid on short sales, extraordinary expenses such as litigation, Rule 12b-1 fees, intermediary servicing fees, or any other class-specific expenses) through April 30, 2021, so that such annual operating expenses will not exceed 0.88%. Prior to April 30, 2020, the limit was 1.55% and established at the class level (inclusive of 12b-1 and shareholder servicing fees). Interest expenses were 0.10%, 0.28%, 0.21% and 0.16% for the years ended December 31, 2020, 2019, 2018 and 2017, respectively. Excluding interest, the expense ratios were 1.43%, 1.48%, 1.46% and 1.50% for the years ended December 31, 2020, 2019, 2018 and 2017, respectively (See Note 3).
7 Excludes securities delivered as a result of a redemption in-kind.
The Accompanying Notes are an Integral Part of these Financial Statements.
Miller Opportunity Trust 2020 Annual Report
28
For a share of beneficial interest outstanding throughout each year ended December 31:
Class I Shares | 2020 | 2019 | 2018 | 2017 | 2016 | ||||||||||||||||||
Net asset value, beginning of year | $ | 31.48 | $ | 23.44 | $ | 25.91 | $ | 20.53 | $ | 20.51 | |||||||||||||
Income (loss) from operations: | |||||||||||||||||||||||
Net investment income (loss)1 | 0.07 | 0.01 | (0.07 | ) | (0.09 | ) | (0.06 | ) | |||||||||||||||
Net realized and unrealized gain (loss) | 12.18 | 8.03 | (2.40 | ) | 5.47 | 0.082 | |||||||||||||||||
| Total income (loss) from operations | 12.25 | 8.04 | (2.47 | ) | 5.38 | 0.02 | |||||||||||||||||
Net asset value, end of year | $ | 43.73 | $ | 31.48 | $ | 23.44 | $ | 25.91 | $ | 20.53 | |||||||||||||
Total return3 | 38.91 | %4 | 34.30 | %4 | -9.53 | %4 | 26.21 | % | 0.10 | %4 | |||||||||||||
Net assets, end of year (000s) | $ | 1,077,438 | $ | 736,467 | $ | 517,820 | $ | 480,451 | $ | 388,872 | |||||||||||||
Ratios to average net assets: | |||||||||||||||||||||||
Gross expenses5 | 1.04 | % | 1.23 | % | 1.15 | % | 1.12 | % | 1.05 | % | |||||||||||||
Net expenses5 | 1.036 | 1.216 | 1.146 | 1.096 | 1.05 | ||||||||||||||||||
Net investment income (loss) | 0.23 | 0.02 | (0.23 | ) | (0.39 | ) | (0.30 | ) | |||||||||||||||
Portfolio turnover rate | 64 | % | 35 | % | 30 | % | 120 | % | 85 | %7 | |||||||||||||
1 Per share amounts have been calculated using the average shares method.
2 Calculation of the net gain per share (both realized and unrealized) does not correlate to the aggregate realized and unrealized losses presented in the Statement of Operations due to the timing of sales and repurchases of Fund shares in relation to fluctuating market values of the investments of the Fund.
3 Performance figures may reflect fee waivers and/or expense reimbursements. In the absence of fee waivers and/or expense reimbursements, the total return would have been lower. Past performance is no guarantee of future results. Total returns for periods of less than one year are not annualized.
4 The total return includes gains from settlement of security litigations. Without these gains, the total return would have been 38.82%, 34.17%, -9.61% and -0.05% for the years ended December 31, 2020, 2019, 2018 and 2016, respectively.
5 Does not include fees and expenses of the Underlying Funds in which the Fund invests.
6 Effective April 30, 2020, the Adviser agreed to waive fees and/or reimburse operating expenses, (other than front-end or contingent deferred loads, taxes, interest expense, brokerage commissions, acquired fund fees and expenses, expenses incurred in connection with any merger or reorganization, portfolio transaction expenses, dividends paid on short sales, extraordinary expenses such as litigation, Rule 12b-1 fees, intermediary servicing fees, or any other class-specific expenses) through April 30, 2021, so that such annual operating expenses will not exceed 0.88%. Separately, the Adviser has agreed to waive fees and/or reimburse operating expenses such that the previously described annual operating expenses, plus intermediary servicing fees and other class-specific expenses, will not exceed 0.93% for Class I. Interest expenses were 0.10%, 0.28%, 0.21% and 0.16% for the years ended December 31, 2020, 2019, 2018 and 2017, respectively. Excluding interest, the net expense ratios were 0.93%, 0.93% for the years ended December 31, 2020, 2019, 2018 and 2017 (See Note 3).
7 Excludes securities delivered as a result of a redemption in-kind.
The Accompanying Notes are an Integral Part of these Financial Statements.
Miller Opportunity Trust 2020 Annual Report
29
Financial highlights (cont'd)
For a share of beneficial interest outstanding throughout each period ended December 31:
Class IS Shares | 2020 | 2019 | 2018** | ||||||||||||
Net asset value, beginning of period | $ | 31.52 | $ | 23.44 | $ | 32.06 | |||||||||
Income (loss) from operations: | |||||||||||||||
Net investment income1 | 0.08 | 0.23 | 0.01 | ||||||||||||
Net realized and unrealized gain (loss) | 12.22 | 7.85 | (8.63 | ) | |||||||||||
Total gain (loss) from operations | $ | 12.30 | $ | 8.08 | (8.62 | ) | |||||||||
Net asset value, end of period | $ | 43.82 | $ | 31.52 | $ | 23.44 | |||||||||
Total return2 | 39.02 | %7 | 34.47 | %7 | -26.89 | % | |||||||||
Net assets, end of period (000s) | $ | 734 | $ | 605 | $ | 73 | |||||||||
Ratios to average net assets: | |||||||||||||||
Gross expenses3 | 0.97 | % | 1.13 | % | 1.09 | %5 | |||||||||
Net expenses3 | 0.964 | 1.094 | 1.054,5 | ||||||||||||
Net investment income | 0.25 | 0.81 | 0.095 | ||||||||||||
Portfolio turnover rate | 64 | % | 35 | % | 30 | %6 | |||||||||
** Commenced operations on August 22, 2018.
1 Per share amounts have been calculated using the average shares method.
2 Performance figures may reflect fee waivers and/or expense reimbursements. In the absence of fee waivers and/or expense reimbursements, the total return would have been lower. Past performance is no guarantee of future results. Total returns for periods of less than one year are not annualized.
3 Does not include fees and expenses of the Underlying Funds in which the Fund invests.
4 Effective April 30, 2020, the Adviser agreed to waive fees and/or reimburse operating expenses, (other than front-end or contingent deferred loads, taxes, interest expense, brokerage commissions, acquired fund fees and expenses, expenses incurred in connection with any merger or reorganization, portfolio transaction expenses, dividends paid on short sales, extraordinary expenses such as litigation, Rule 12b-1 fees, intermediary servicing fees, or any other class-specific expenses) through April 30, 2021, so that such annual operating expenses will not exceed 0.88%. Prior to April 30, 2020, the limit was 0.83% and established at the class level (inclusive of 12b-1 and shareholder servicing fees). Interest expenses were 0.10% and 0.26% for the years ended December 31, 2020 and 2019, respectively, and 0.22% (annualized) for the period ended December 31, 2018. Excluding interest, the net expense ratios were 0.86% and 0.83% for the years ended December 31, 2020 and 2019, respectively, and 0.83% for period ended December 31, 2018 (see Note 3).
5 Annualized.
6 Portfolio turnover rate reported is for the fiscal year of the Fund.
7 The total return includes gains from settlement of security litigations. Without these gains, the total return would have been 38.93% and 34.39% for the years ended December 31, 2020 and 2019, respectively.
The Accompanying Notes are an Integral Part of these Financial Statements.
Miller Opportunity Trust 2020 Annual Report
30
Notes to financial statements
1. Organization
Miller Opportunity Trust (the "Fund") is a separate non-diversified investment series of the Trust for Advised Portfolios (the "Trust"), a Delaware Statutory Trust registered under the Investment Company Act of 1940, as amended (the "1940 Act"). The Fund converted to the Trust on February 24, 2017, and was previously organized in the Legg Mason Investment Trust as the Legg Mason Opportunity Trust (the "Predecessor Fund"). The Fund seeks to provide long-term growth of capital.
2. Significant accounting policies
The following is a summary of significant accounting policies consistently followed by the Fund in preparation of its financial statements. These policies are in conformity with U.S. generally accepted accounting principles ("U.S. GAAP") for investment companies. The Fund is considered an investment company under U.S. GAAP and follows the accounting and reporting guidance applicable to investment companies in the Financial Accounting Standards Board Accounting Standards Topic 946. The presentation of financial statement in conformity with U.S. GAAP requires management to make estimates and assumptions that affect the reported amounts of assets and liabilities and disclosure of contingent assets and liabilities at the date of the financial statements and the reported amounts of income and expenses. Actual results may differ from those estimates.
(a) Investment valuation. Investments in securities traded on a national securities exchange are valued at the last reported sales price on the exchange on which the security is principally traded. Securities traded on the NASDAQ exchanges are valued at the NASDAQ Official Closing Price ("NOCP"). Exchange-traded securities for which no sale was reported and NASDAQ securities for which there is no NOCP are valued at the mean of the most recent quoted bid and ask prices quoted. Exchange traded options are valued at the composite mean price, which calculates the mean of the highest bid price and lowest ask price across the exchanges where the option is principally traded. These investments are categorized as Level 1 of the fair value hierarchy. Pricing services may use various valuation methodologies, including matrix pricing and other analytical models as well as market transactions and dealer quotations. Long-term fixed income securities are valued using prices provided by an independent pricing service approved by the Board. Securities for which market quotations are not readily available are valued at their estimated fair value as determined in good faith by Miller Value Partners, LLC (the
Miller Opportunity Trust 2020 Annual Report
31
Notes to financial statements (cont'd)
"Adviser") under procedures established by and under the general supervision and responsibility of the Board.
Various inputs are used in determining the value of the Funds' investments. These inputs are summarized into three broad levels and described below:
• Level 1 — quoted prices in active markets for identical investments. An active market for a security is a market in which transactions occur with sufficient frequency and volume to provide pricing information on an ongoing basis. A quoted price in an active market provides the most reliable evidence of fair value.
• Level 2 — other significant observable inputs (including quoted prices for similar investments, interest rates, prepayment speeds, credit risk, etc.). Other inputs other than quoted prices included in level 1 that are observable for the asset or liability either directly or indirectly. These inputs may include quoted prices for the identical instrument on an inactive market, prices for similar instruments, interest rates, prepayment speeds, credit risk, yield curves, default rates, and similar data.
• Level 3 — significant unobservable inputs, including the Fund's own assumptions in determining fair value of investments.
The inputs or methodologies used for valuing securities are not necessarily an indication of the risk associated with investing in those securities. The following is a summary of the fair values of the Fund's consolidated investments in each category investment type as of December 31, 2020:
Description | Quoted Prices (Level 1) | Other Significant Observable Inputs (Level 2) | Significant Unobservable Inputs (Level 3) | Total | |||||||||||||||
Investments* | |||||||||||||||||||
Common Stocks | $ | 2,182,085,435 | $ | — | $ | 92,880,000 | $ | 2,274,965,435 | |||||||||||
Investment Fund | — | — | 10,096,002 | 10,096,002 | |||||||||||||||
Purchase Options | — | 98,921,250 | — | 98,921,250 | |||||||||||||||
Warrants | 168,875 | — | 1,846,591 | 2,015,466 | |||||||||||||||
Total Investments | $ | 2,182,254,310 | $ | 98,921,250 | $ | 104,822,593 | $ | 2,385,998,153 | |||||||||||
* See Schedule of Investments for additional detailed categorizations.
Miller Opportunity Trust 2020 Annual Report
32
The following is a reconciliation of investments in which significant unobservable inputs (Level 3) were used in determining fair value:
| Investments in Securities | Common Stock | Investment Fund2 | Warrant2 | ||||||||||||
Balance at December 31, 2019 | $ | — | $ | 14,104,024 | $ | 6,032,197 | |||||||||
Realized gain (loss) | — | 240,8101 | — | ||||||||||||
Purchases | 60,000,000 | — | — | ||||||||||||
Sales/Partnership distributions | — | (222,766 | ) | — | |||||||||||
Change in unrealized appreciation (depreciation) | 32,880,000 | (4,026,066 | ) | (4,185,606 | ) | ||||||||||
Balance at December 31, 2020 | $ | 92,880,000 | $ | 10,096,002 | $ | 1,846,591 | |||||||||
| Change in unrealized appreciation (depreciation) for Level 3 securities held at December 31, 2020 | $ | 32,880,000 | $ | (4,026,066 | ) | $ | (4,185,606 | ) | |||||||
1 This amount is included in net realized gain (loss) from investment transactions in affiliates in the accompanying Statement of Operations.
2 This amount is included in the change in net unrealized appreciation (depreciation) in affiliates in the accompanying Statement of Operations. Change in unrealized appreciation (depreciation) includes net unrealized appreciation (depreciation) resulting from changes in investment values during the reporting period and the reversal of previously recorded unrealized appreciation (depreciation) when gains or losses are realized.
The following table summarizes the valuation techniques and unobservable inputs used to determine the fair value of Level 3 investments:
| Value at December 31, 2020 | Valuation Technique(s) | Unobservable Input(s) | Range / Weighted Average | Impact to Valuation from an Increase in Input* | |||||||||||||||||||
| Common Stock | $ | 92,880,000 | Market | Liquidity Discount | 10 | % | Decrease | ||||||||||||||||
Limited Partnership Interests | $ | 10,096,002 | NAV of Limited Partnership Interest | Liquidity Discount | 21 | % | Decrease | ||||||||||||||||
| Warrant | $ | 1,846,591 | Black-Scholes Model | Liquidity Discount | 35 | % | Decrease | ||||||||||||||||
* This column represents the directional change in the fair value of the Level 3 investments that would result in an increase from the corresponding unobservable input. A decrease to the unobservable input would have the opposite effect. Significant increases and decreases in these unobservable inputs in isolation could result in significantly higher or lower fair value measurements.
(b) Purchased options. When the Fund purchases an option, an amount equal to the premium paid by the Fund is recorded as an investment on the Statement of Assets and Liabilities, the value of which is marked-to-market to reflect the current market value of the option purchased. If the purchased options expires, the Fund realizes a loss equal to the amount of premium paid. When an instrument is purchased
Miller Opportunity Trust 2020 Annual Report
33
Notes to financial statements (cont'd)
or sold through the exercise of an option, the related premium paid is added to the basis of the instrument acquired or deducted from the proceeds of the instrument sold. The risk associated with purchasing put and call options is limited to the premium paid.
(c) Security transactions and investment income. Security transactions are accounted for on a trade date basis. Interest income, adjusted for amortization of premium and accretion of discount, is recorded on the accrual basis. Dividend income is recorded on the ex-dividend date. Foreign dividend income is recorded on the ex-dividend date or as soon as practicable after the Fund determines the existence of a dividend declaration after exercising reasonable due diligence. The cost of investments sold is determined by use of the specific identification method.
(d) Distributions to shareholders. Distributions from net investment income and distributions of net realized gains, if any, are declared at least annually. Distributions to shareholders of the Fund are recorded on the ex-dividend date and are determined in accordance with income tax regulations, which may differ from U.S. GAAP.
(e) Share class accounting. Investment income, common expenses and realized/unrealized gains (losses) on investments are allocated to the various classes of the Fund on the basis of daily net assets of each class. Fees relating to a specific class are charged directly to that share class.
(f) Indemnifications. In the normal course of business, the Fund enters into contracts that contain a variety of representations, which provide general indemnifications. The Fund's maximum exposure under these arrangements is unknown as this would involve future claims that may be made against the Fund that have not yet occurred. However, based on experience, the Fund expects the risk of loss to be remote.
(g) Federal and other taxes. It is the Fund's policy to comply with the federal income and excise tax requirements of the Internal Revenue Code of 1986 (the "Code"), as amended, applicable to regulated investment companies. Accordingly, the Fund intends to distribute its taxable income and net realized gains, if any, to shareholders in accordance with timing requirements imposed by the Code. Therefore, no federal or state income tax provision is required in the Fund's financial statements.
Management has analyzed the Fund's tax positions taken on income tax returns for all open tax years and has concluded that as of December 31, 2020, no provision for income tax is required in the Fund's financial statements. The Fund's federal and state income and federal excise tax returns for tax years for which the applicable statutes of limitations have
Miller Opportunity Trust 2020 Annual Report
34
not expired are subject to examination by the Internal Revenue Service and state departments of revenue.
The Fund was notified in 2017 of a tax lien filed by the Internal Revenue Service related to a previous holding. No liability for the lien has been recorded as it is currently under appeal. If the appeal is unsuccessful, the Fund has also received indemnification from previous management for any tax, penalties, or interest related to the matter.
The Fund holds interests in certain securities that are treated as partnerships for Federal income tax purposes. These entities may be subject to audit by the Internal Revenue Service or other applicable tax authorities. The Fund's taxable income or tax liability for prior taxable years could be adjusted as a result of such an audit. The Fund may be required to pay a fund-level tax as a result of such an adjustment or may pay a "deficiency dividend" to its current shareholders in order to avoid a fund-level tax associated with the adjustment. The Fund could also be required to pay interest and penalties in connection with such an adjustment. Under the applicable foreign tax laws, a withholding tax may be imposed on interest, dividends, and capital gains at various rates.
3. Investment management agreement and other transactions with affiliates
The Trust has an agreement with the Adviser to furnish investment advisory services to the Fund.
Under the investment management agreement, the Fund pays an investment management fee, calculated daily and paid monthly, in accordance with the following breakpoint schedule:
Average Daily Net Assets | Annual Rate | ||||||
First $100.0 million | 1.000 | % | |||||
Next $2.5 billion | 0.750 | ||||||
Next $2.5 billion | 0.700 | ||||||
Next $2.5 billion | 0.675 | ||||||
Over $7.6 billion | 0.650 | ||||||
Effective April 30 2020, the Adviser has contractually agreed to reduce fees and pay expenses, (other than front-end or contingent deferred loads, taxes, interest expense, brokerage commissions, acquired fund fees and expenses, expenses incurred in connection with any merger or reorganization, portfolio transaction expenses, dividends paid on short sales, extraordinary expenses such as litigation, Rule 12b-1 fees, intermediary servicing fees, or any other class-specific expenses) through
Miller Opportunity Trust 2020 Annual Report
35
Notes to financial statements (cont'd)
April 30, 2021, so that such annual operating expenses will not exceed 0.88%. Separately, with respect to Class I only, the Adviser has agreed to waive fees and/or reimburse operating expenses such that the previously described annual operating expenses, plus intermediary servicing fees and other class-specific expenses, will not exceed 0.93%. These arrangements cannot be terminated prior to May 1, 2021 without the Board of Trustees' consent.
Prior to April 30, 2020, the limit on annual operating expenses was established at a class level and inclusive of 12b-1 fees and shareholder servicing fees and did not exceed the class levels set forth below. The Predecessor Fund did not have expense limitations.
| Class A | Class C | Class FI | Class R | Class I | Class IS | ||||||||||||||||||
| 1.20 | % | 1.97 | % | 1.26 | % | 1.55 | % | 0.93 | % | 0.83 | % | ||||||||||||
The Adviser is permitted to recapture amounts waived and/or reimbursed to a class within 36 months of the reimbursement date if the class's total annual operating expenses have fallen to a level below the expense limitation ("expense cap") in effect at the time the fees were earned or the expenses incurred. In no case will the Adviser recapture any amount that would result, on any particular business day of the Fund, in the class's total annual operating expenses exceeding the expense cap or any other lower limit then in effect.
Pursuant to these arrangements, at December 31, 2020, the Fund had remaining fee waivers and/or expense reimbursements subject to recapture by the Adviser and respective dates of expiration as follows:
Class I | Class IS | ||||||||||
Expires December 31, 2021 | $ | 60,942 | $ | 14 | |||||||
Expires December 31, 2022 | 150,152 | 73 | |||||||||
Expires December 31, 2023 | 77,601 | 83 | |||||||||
Total | $ | 288,695 | $ | 170 | |||||||
U.S. Bancorp Fund Services, LLC, doing business as U.S. Bank Global Fund Services ("Fund Services") serves as the Fund's administrator & fund accountant and transfer agent. The officers of the Trust are employees of Fund Services. U.S Bank, N.A. serves as the Fund's custodian. Quasar Distributors, LLC ("Quasar"), serves as the Fund's distributor and principal underwriter. For the year ended December 31, 2020, the Fund incurred
Miller Opportunity Trust 2020 Annual Report
36
the following expenses for administration & fund accounting, transfer agent, custody and compliance fees:
Administration & fund accounting | $ | 839,797 | |||||
Transfer agent | $ | 358,247 | |||||
Custody | $ | 99,381 | |||||
Compliance | $ | 13,279 | |||||
At December 31, 2020, the Fund had payables due to Fund Services for administration & fund accounting, transfer agent, custody and compliance fees in the following amounts:
Administration & fund accounting | $ | 165,475 | |||||
Transfer agent | $ | 63,000 | |||||
Custody | $ | 18,600 | |||||
Compliance | $ | 2,219 | |||||
The above payable amounts are included in Accrued other expenses in the Statement of assets and liabilities.
The Independent Trustees were paid $14,326 for their services and reimbursement of travel expenses during the year ended December 31, 2020. The Fund pays no compensation to the Interested Trustee or officers of the Trust.
There is a maximum initial sales charge of 5.75% for Class A shares. There is a contingent deferred sales charge ("CDSC") of 1.00% on Class C shares, which applies if redemption occurs within 12 months from purchase payment. In certain cases, the Fund's Class A shares have a 1.00% CDSC, which applies if redemption occurs within 18 months from purchase payment. This CDSC only applied to those purchases of Class A shares in excess of $1,000,000 and the initial sales charge is waived. These purchases do not incur an initial sales charge.
For the year ended December 31, 2020, Quasar did not retain sales charges on sales of Class A shares. In addition, for the year ended December 31, 2020, CDSCs paid to Quasar for Class C shares totaled $4,008.
4. Investments
During the year ended December 31, 2020, the aggregate cost of purchases and proceeds from sales of investments (excluding short-term investments) were as follows:
Purchases | $ | 1,099,612,142 | |||||
Sales | $ | 1,103,671,858 | |||||
Miller Opportunity Trust 2020 Annual Report
37
Notes to financial statements (cont'd)
5. Class specific expenses
The Fund has adopted a Rule 12b-1 shareholder services and distribution plan and under that plan the Fund pays service and/or distribution fees with respect to its Class A, Class C, Class FI and Class R shares calculated at the annual rate of 0.25%, 1.00%, 0.25% and 0.50% of the average daily net assets of each class, respectively.
The Fund also has arrangements with various parties to provide ongoing sub-transfer agent services for each share class. Service and/or distribution fees and sub-transfer agent fees are accrued daily and paid monthly or quarterly.
For the year ended December 31, 2020, class specific expenses were as follows:
Distribution Fees | Shareholder Servicing Fees | ||||||||||
Class A | $ | 1,675,165 | $ | 394,060 | |||||||
Class C | 1,712,636 | 99,625 | |||||||||
Class FI | 28,626 | 14,625 | |||||||||
Class R | 30,108 | 3,735 | |||||||||
Class I | — | 508,993 | |||||||||
Class IS | — | — | |||||||||
Total | $ | 3,446,535 | $ | 1,021,038 | |||||||
6. Lines of Credit
The Fund may borrow for investment purposes, also known as "leveraging" from a $150,000,000 line of credit ("Leveraging Credit Agreement") with the Bank of Nova Scotia. This Leveraging Credit Agreement renews daily for a 180-day term unless notice to the contrary is given to the Fund. Leverage is the ability to earn a return on a capital base that is larger than the Fund's net assets. Use of leverage can magnify the effects of changes in the value of the Fund's investments and makes such investments more volatile. Leveraging could cause investors to lose more money in adverse environments. The Fund pays a monthly commitment fee at an annual rate of 0.10% on the unutilized portion of the Leveraging Credit Agreement. However, the commitment fee will be waived when 50% of the line of credit is drawn. The interest on the borrowings under this Leveraging Credit Agreement is calculated at variable rates based on the prevailing LIBOR rate plus a spread. To the extent of the borrowing outstanding, the Fund is required to maintain collateral in a special custody account at the Fund's custodian on behalf of the Bank of Nova Scotia. The Fund's Leveraging Credit Agreement
Miller Opportunity Trust 2020 Annual Report
38
contains customary covenants that, among other things, may limit the Fund's ability to pay distributions in certain circumstances, incur additional debt, change its fundamental investment policies and engage in certain transactions, including mergers and consolidations, and require asset coverage ratios in addition to those required by the 1940 Act. In addition, the Leveraging Credit Agreement may be subject to early termination under certain events and may contain other provisions that could limit the Fund's ability to utilize borrowing under the agreement.
The Fund also has access to a $50 million unsecured line of credit through an agreement with U.S. Bank. The Fund may temporarily draw on the line of credit to satisfy redemption requests or settle investment transactions. Interest is charged to the Fund based on its borrowings at a rate per annum equal to the Prime Rate, to be paid monthly.
Bank of Nova Scotia | U.S. Bank | ||||||||||
Maximum available credit | $ | 150,000,000 | $ | 50,000,000 | |||||||
Largest amount outstanding on an individual day | 145,000,000 | 1,392,000 | |||||||||
Average daily loan outstanding | 125,969,945 | 521,615 | |||||||||
Interest expense | 1,573,622 | 642 | |||||||||
Loan outstanding as of December 31, 2020 | 145,000,000 | — | |||||||||
Average Interest rate | 1.27 | % | 3.37 | % | |||||||
7. Shares of beneficial interest
At December 31, 2020, the Trust had an unlimited number of shares of beneficial interest authorized with no par value. The Fund has the ability to issue multiple classes of shares. Each class of shares represents an identical interest and has the same rights, except that each class bears certain direct expenses, including those specifically related to the distribution of its shares.
Transactions in shares of each class were as follows:
| Year Ended December 31, 2020 | Year Ended December 31, 2019 | ||||||||||||||||||
Shares | Amount | Shares | Amount | ||||||||||||||||
Class A | |||||||||||||||||||
Shares sold | 3,813,317 | $ | 105,467,811 | 17,488,313 | $ | 435,867,039 | |||||||||||||
Shares repurchased* | (4,702,412 | ) | (125,423,899 | ) | (3,339,847 | ) | (83,813,697 | ) | |||||||||||
Net increase (decrease) | (889,095 | ) | $ | (19,956,088 | ) | 14,148,466 | $ | 352,053,342 | |||||||||||
Class C | |||||||||||||||||||
Shares sold | 559,503 | $ | 12,941,403 | 624,133 | $ | 14,592,677 | |||||||||||||
Shares repurchased* | (3,088,945 | ) | (78,218,908 | ) | (20,260,857 | ) | (470,840,420 | ) | |||||||||||
Net decrease | (2,529,442 | ) | $ | (65,277,505 | ) | (19,636,724 | ) | $ | (456,247,743 | ) | |||||||||
Miller Opportunity Trust 2020 Annual Report
39
Notes to financial statements (cont'd)
| Year Ended December 31, 2020 | Year Ended December 31, 2019 | ||||||||||||||||||
Shares | Amount | Shares | Amount | ||||||||||||||||
Class FI | |||||||||||||||||||
Shares sold | 60,653 | $ | 1,567,236 | 51,032 | $ | 1,326,535 | |||||||||||||
Shares repurchased | (181,223 | ) | (4,641,015 | ) | (177,083 | ) | (4,504,944 | ) | |||||||||||
Net decrease | (120,570 | ) | $ | (3,073,779 | ) | (126,051 | ) | $ | (3,178,409 | ) | |||||||||
Class R | |||||||||||||||||||
Shares sold | 14,013 | $ | 374,872 | 28,287 | $ | 714,716 | |||||||||||||
Shares repurchased | (55,410 | ) | (1,412,639 | ) | (48,976 | ) | (1,240,576 | ) | |||||||||||
Net decrease | (41,397 | ) | $ | (1,037,767 | ) | (20,689 | ) | $ | (525,860 | ) | |||||||||
Class I | |||||||||||||||||||
Shares sold | 9,624,375 | $ | 266,382,678 | 5,843,587 | $ | 158,562,138 | |||||||||||||
Shares repurchased | (8,383,264 | ) | (226,169,089 | ) | (4,539,695 | ) | (122,895,537 | ) | |||||||||||
Net increase | 1,241,111 | $ | 40,213,589 | 1,303,892 | $ | 35,666,601 | |||||||||||||
Class IS | |||||||||||||||||||
Shares sold | — | $ | — | 16,086 | $ | 467,885 | |||||||||||||
Shares repurchased | (2,446 | ) | (74,199 | ) | — | — | |||||||||||||
Net increase (decrease) | (2,446 | ) | $ | (74,199 | ) | 16,086 | $ | 467,885 | |||||||||||
Total decrease | (2,341,839 | ) | $ | (49,205,749 | ) | (4,315,020 | ) | $ | (71,764,184 | ) | |||||||||
* 142,093 Class C shares converted into 131,924 Class A shares, amounting to $3,642,012, during the year ended December 31, 2020. 15,917,032 Class C shares converted into 14,851,182 Class A shares, amounting to .$367,433,871, during the year ended December 31, 2019. Class C shares of the Fund automatically convert to Class A shares after they have been held for 10 years.
8. Transactions with affiliated companies
An "Affiliated Company", as defined in the 1940 Act, includes a company in which the Fund owns 5% or more of the company's outstanding voting securities or partnership interests at any time during the period. The following transactions were effected in shares of such companies for the year ended December 31, 2020:
| Flexion Therapeutics Inc. | Pangaea One, LP | Quotient Technology Inc. | Tivity Health Inc.1 | ZIOPHARM Oncology Inc. | Total | ||||||||||||||||||||||
| Value at December 31, 2019 | $ | 60,030,000 | $ | 14,104,024 | $ | 49,300,000 | $ | 50,862,500 | $ | 53,232,197 | $ | 227,528,721 | |||||||||||||||
Purchases | 4,875,000 | — | — | 3,578,090 | — | 8,453,090 | |||||||||||||||||||||
| Sales / Partnership Distributions | (4,085,603 | ) | (222,766 | ) | (727,574 | ) | (9,195,163 | ) | (1,732,131 | ) | (15,963,237 | ) | |||||||||||||||
| Change in Unrealized Gain (Loss) | (22,828,833 | ) | (4,026,066 | ) | (1,635,673 | ) | 2,671,281 | (22,447,607 | ) | (48,266,898 | ) | ||||||||||||||||
| Realized Gain (Loss) on Sales / Distributions | (1,062,564 | ) | 240,810 | (778,753 | ) | (2,859,708 | ) | (3,517,868 | ) | (7,978,083 | ) | ||||||||||||||||
| Value at December 31, 2020 | $ | 36,928,000 | $ | 10,096,002 | $ | 46,158,000 | $ | 45,057,000 | $ | 25,534,591 | $ | 163,773,593 | |||||||||||||||
| Amortization, Dividend, Interest Income | $ | — | $ | 393,306 | $ | — | $ | — | $ | — | $ | 393,306 | |||||||||||||||
1 Tivity Health Inc. was an affiliated company at December 31, 2019 and was no longer an affiliated company at December 31, 2020.
Miller Opportunity Trust 2020 Annual Report
40
9. Restricted securities
The following Fund investments are restricted as to resale and, in the absence of readily ascertainable market values, are valued in good faith in accordance with procedures approved by the Board of Trustees.
| Security | Cost | Value at December 31, 2020 | Percent of Net Assets | Open Commitments | |||||||||||||||
Desktop Metal Inc.1 | $ | 60,000,000 | $ | 92,880,000 | 4.1 | % | N/A | ||||||||||||
Pangaea One, LP2 | $ | 33,993,989 | $ | 10,096,002 | 0.5 | % | $ | 729,3653 | |||||||||||
| Ziopharm Oncology Inc. (Warrant)4 | $ | 1,177,758 | $ | 1,846,591 | 0.1 | % | N/A | ||||||||||||
1 Acquisition date was 12/20.
2 Acquisition dates were 5/08, 8/08, 10/08, 12/08, 2/09, 5/09, 8/09, 11/09, 3/10, 7/10, 1/11, 2/11, 4/11, 8/11, 10/11, 1/12,4/12, 5/12, 6/12, 8/12, 12/12, 5/13, 6/13, 9/13, 3/14, 8/14 and 10/14.
3 In the normal course of operations, the Fund makes commitments to invest in businesses. At December 31, 2020, the Fund had open commitments of $729,365.
4 Acquisition date was 7/19.
10. Income tax information and distributions to shareholders
The Fund did not make any distributions during the year ended December 31, 2020 and year ended December 31, 2019.
At December 31, 2020, the components of accumulated earnings for income tax purposes were as follows:
Tax cost of investments | $ | 1,867,629,302 | |||||
Unrealized appreciation | 731,904,286 | ||||||
Unrealized depreciation | (213,535,435 | ) | |||||
Net unrealized appreciation | $ | 518,368,851 | |||||
Other accumulated gain/(loss) | (154,435 | ) | |||||
Undistributed other income | 24,130,601 | ||||||
Total accumulated gain | $ | 542,345,017 | |||||
(a) Other book/tax temporary differences are attributable to book/tax differences in the timing of the deductibility of various expenses.
GAAP requires that certain components of net assets be reclassified to reflect permanent differences between financial and tax reporting. These reclassifications have no effect on net assets or net asset value per share.
Miller Opportunity Trust 2020 Annual Report
41
Notes to financial statements (cont'd)
For the year ended December 31, 2020, the following reclassifications have been made:
| Total Accumulated Earnings (Loss) | Paid-in Capital | ||||||||||
(a) | $ | (1,214,406 | ) | $ | 1,214,406 | ||||||
(a) Reclassifications are due to the book/tax differences in the treatment of net operating losses and partnership investments.
At December 31, 2020, the Fund had no capital loss carryforwards, which reduce the Fund's taxable income arising from future net realized gains on investments, if any, to the extent permitted by the Internal Revenue Code, and thus will reduce the amount of distributions to shareholders which would otherwise be necessary to relieve the Fund of any liability for federal tax.
11. Subsequent Events
Management has evaluated events and transactions that occurred subsequent to December 31, 2020 through the date the financial statements have been issued and has determined that there were no significant subsequent events that would require adjustment to or additional disclosure in these financial statements.
12. COVID-19 Risk
The global outbreak of COVID-19 (commonly referred to as "coronavirus") has disrupted economic markets and the prolonged economic impact is uncertain. The ultimate economic fallout from the pandemic, and the long-term impact on economies, markets, industries and individual issuers, are not known. The operational and financial performance of the issuers of securities in which the Fund invests depends on future developments, including the duration and spread of the outbreak, and such uncertainty may in turn adversely affect the value and liquidity of the Fund's investments, impair the Fund's ability to satisfy redemption requests, and negatively impact the Fund's performance.
13. New Accounting Pronouncements
In March 2020, FASB issued ASU 2020-04, Reference Rate Reform: Facilitation of the Effects of Reference Rate Reform on Financial Reporting. The main objective of the new guidance is to provide relief to companies that will be impacted by the expected change in benchmark interest rates at the end of 2021, when participating banks will no longer be required to submit London Interbank Offered Rate ("LIBOR") quotes by the UK Financial Conduct Authority. The new guidance allows companies
Miller Opportunity Trust 2020 Annual Report
42
to, provided the only change to existing contracts are a change to an approved benchmark interest rate, account for modifications as a continuance of the existing contract without additional analysis. In addition, derivative contracts that qualified for hedge accounting prior to modification, will be allowed to continue to receive such treatment, even if critical terms change due to a change in the benchmark interest rate. For new and existing contracts, the Fund may elect to apply the amendments as of March 12, 2020 through December 31, 2022. Management is currently assessing the impact of the ASU's adoption to the Funds' financial statements and various filings.
Miller Opportunity Trust 2020 Annual Report
43
Report of independent registered public accounting firm
To the Board of Trustees of Trust for Advised Portfolios
and the Shareholders of Miller Opportunity Trust
Opinion on the Financial Statements
We have audited the accompanying statement of assets and liabilities of Miller Opportunity Trust, a series of shares of beneficial interest in Trust for Advised Portfolios (the "Fund"), including the schedule of investments, as of December 31, 2020, and the related statement of operations for the year then ended, the statements of changes in net assets for each of the years in the two-year period then ended, and the financial highlights for each of the years or period noted in the table below, and the related notes (collectively referred to as the "financial statements"). In our opinion, the financial statements present fairly, in all material respects, the financial position of the Fund as of December 31, 2020, and the results of its operations for the year then ended, the changes in its net assets for each of the years in the two-year period then ended, and its financial highlights for each of the years or period as noted in the table below, in conformity with accounting principles generally accepted in the United States of America. The financial highlights for the year ended December 31, 2016 were audited by other auditors whose report dated February 17, 2017, expressed an unqualified opinion on such financial highlights.
Class | Financial Highlights Presented | ||||||
Class A, Class C, Class FI, Class R, Class I | The financial highlights for each of the years in the four-year period ended December 31, 2020. | ||||||
Class IS | The financial highlights for each of the years in the two-year period ended December 31, 2020 and for the period August 22, 2018 (commencement of operations) to December 31, 2018. | ||||||
Basis for Opinion
These financial statements are the responsibility of the Fund's management. Our responsibility is to express an opinion on the Fund's financial statements based on our audits. We are a public accounting firm registered with the Public Company Accounting Oversight Board (United States) ("PCAOB") and are required to be independent with respect to the Fund in accordance with the U.S. federal securities law and the applicable rules and regulations of the Securities and Exchange Commission and the PCAOB.
Miller Opportunity Trust 2020 Annual Report
44
We conducted our audits in accordance with the standards of the PCAOB. Those standards require that we plan and perform the audits to obtain reasonable assurance about whether the financial statements are free of material misstatement, whether due to error or fraud. The Fund is not required to have, nor were we engaged to perform, an audit of its internal control over financial reporting. As part of our audits we are required to obtain an understanding of internal control over financial reporting but not for the purpose of expressing an opinion on the effectiveness of the Fund's internal control over financial reporting. Accordingly, we express no such opinion.
Our audits included performing procedures to assess the risk of material misstatement of the financial statements, whether due to error or fraud, and performing procedures that respond to those risks. Such procedures included examining, on a test basis, evidence regarding the amounts and disclosures in the financial statements. Our procedures included confirmation of securities owned as of December 31, 2020 by correspondence with the custodian, other appropriate parties, and brokers. Our audits also included evaluating the accounting principles used and significant estimates made by management, as well as evaluating the overall presentation of the financial statements. We believe that our audits provide a reasonable basis for our opinion.

BBD, LLP
We have served as the auditor of one or more of the Funds in the Trust for Advised Portfolios since 2010.
Philadelphia, Pennsylvania
March 1, 2021
Miller Opportunity Trust 2020 Annual Report
45
Approval of investment advisory agreement for Miller Opportunity Trust (unaudited)
At a meeting held on August 13 and 14, 2020, the Board of Trustees (the "Board") of Trust for Advised Portfolios (the "Trust"), including all Trustees who are not "interested persons" of the Trust ("Independent Trustees"), as that term is defined in the Investment Company Act of 1940, considered and approved the continuance of the investment advisory agreement ("Advisory Agreement") with Miller Value Partners, LLC ("Miller" or the "Adviser"), for the Miller Opportunity Trust (the "Fund").
Ahead of the August meeting, the Board received and reviewed substantial information regarding the Fund, the Adviser and the services provided by the Adviser to the Fund under the Advisory Agreement. This information formed the primary (but not exclusive) basis for the Board's determinations. The information prepared specifically for the annual review of the Advisory Agreement supplemented the information provided to the Board and its committees throughout the year. The Board and its committees met regularly during the year and the information provided and topics discussed at such meetings were relevant to the review of the Advisory Agreement. Some of these reports and other data included, among other things, materials that outlined the investment performance of the Fund; compliance, regulatory, and risk management matters; the trading practices of the Adviser; valuation of investments; fund expenses; and overall market and regulatory developments. The Board considered the review of the Agreements to be an ongoing process and employed the accumulated information, knowledge, and experience they had gained during their tenure on the Board governing the Fund and working with the Adviser in their review of the Agreement. The Independent Trustees were advised by independent legal counsel during the annual review process as well as throughout the year, including meeting in executive sessions with such counsel without representatives from the Adviser present. In connection with their annual review, the Independent Trustees also received a memorandum from independent legal counsel outlining their fiduciary duties and legal standards in reviewing the Advisory Agreement.
In considering the continuance of the Advisory Agreement, the Board considered the following factors and made the following determinations. In its deliberations, the Board did not identify any single factor or piece of information as all important, controlling, or determinative of its decision, and each Trustee may have attributed different weights to the various factors and information.
Miller Opportunity Trust 2020 Annual Report
46
• In considering the nature, extent and quality of the services provided by the Adviser, the Trustees considered the Adviser's specific responsibilities in all aspects of the day-to-day management of the Fund, as well as the qualifications, experience and responsibilities of the portfolio managers and other key personnel who are involved in the day-to-day activities of the Fund. The Board also considered the resources and compliance structure of Miller, including information regarding its compliance program, chief compliance officer, and compliance record and its disaster recovery/business continuity plan, including how the Adviser has operated through the novel coronavirus pandemic. The Board also considered the existing relationship between Miller and the Trust, as well as the Board's knowledge of the Adviser's operations, and noted that during the course of the year it had met with the Adviser in person to discuss fund performance and investment outlook, as well as various marketing and compliance topics, including the Adviser's risk management process. The Board concluded that Miller had sufficient quality and depth of personnel, resources, investment methods and compliance policies and procedures essential to performing its duties under the Advisory Agreement and that, in the Board's view, the nature, overall quality, and extent of the management services provided were and would continue to be satisfactory and reliable.
• In assessing the quality of the portfolio management delivered by the Adviser, the Board reviewed the performance of the Fund on both an absolute basis and in comparison to its peer group, relevant benchmark index, and a comparable composite of accounts managed by the Adviser. The Board considered that the Fund had outperformed relative to its peer group median/average and relative to its benchmark index as of June 30, 2020 for the one-, three-, five- and ten-year periods. The Board noted that the Fund had achieved more than ten calendar years of performance results.
• The Trustees also reviewed the cost of the Adviser's services, and the structure and level of advisory fees payable by the Fund, including a comparison of those fees to fees charged by a peer group of funds. The Board noted that the Adviser had contractually agreed to maintain annual expense caps for each of the Fund's classes. The Board noted that, although the Fund's advisory fee and net expense ratio were higher than the peer group median and average, both were well within
Miller Opportunity Trust 2020 Annual Report
47
Approval of investment advisory agreement for Miller Opportunity Trust (unaudited) (cont'd)
the peer group range. After reviewing the materials that were provided, the Trustees noted that the fees to be received by Miller were within the range of advisory fees charged to comparable funds and concluded that such fees were fair and reasonable.
• The Trustees considered that, in addition to Miller's commitment to maintain its cap on the Fund's expense ratio, Miller's advisory fee schedule includes breakpoints, which allow for economies of scale to be shared through reductions in the advisory fee as Fund assets grow.
• The Trustees considered the profitability of Miller from managing the Fund. In assessing Miller's profitability, the Trustees reviewed Miller's financial information that was provided in the materials and took into account both the direct and indirect benefits to Miller from managing the Fund. The Trustees concluded that Miller's profits from managing the Fund were not excessive and, after a review of the relevant financial information, Miller appeared to have adequate capitalization and/or would maintain adequate profit levels to support the Fund.
Miller Opportunity Trust 2020 Annual Report
48
Additional information (unaudited)
December 31, 2020
Proxy Voting Policies and Procedures
You may obtain a description of the Fund's proxy voting policy and voting records, without charge, upon request by contacting the Funds directly at 1-888-593-5110 or on the EDGAR Database on the SEC's website at www.sec.gov. The Fund files its proxy voting records annually as of June 30, with the SEC on Form N-PX. The Fund's Form N-PX is available without charge by visiting the SEC's website at www.sec.gov and may be reviewed and copied at the SEC's Public Reference Room in Washington D.C. You may obtain information on the operation of the Public Reference Room by calling 1-800-SEC-0330.
Quarterly Portfolio Schedule
The Fund files its complete schedule of portfolio holdings for the first and third quarters of each fiscal year with the SEC as an exhibit to its reports on Form N-PORT. The Fund's Form N-PORT reports are available without charge by visiting the SEC's website at www.sec.gov and may be reviewed and copied at the SEC's Public Reference Room in Washington D.C. You may obtain information on the operation of the Public Reference Room by calling (800) SEC-0330.
Qualified Dividend Income/Dividends Received Reduction
For the year ended December 31, 2020, certain dividends paid by the Fund may be reported as qualified dividend income (QDI) and are eligible for taxation at capital gains rates.
The percentage of dividends declared from ordinary income designated as qualified dividend income was 0%.
For corporate shareholders, the percent of ordinary income distributions qualifying for the corporate dividends received deduction for the fiscal year ended December 31, 2020, was 0%.
Miller Opportunity Trust 2020 Annual Report
49
Additional information (unaudited)
Information about Trustees and Officers
| Name, Address and Age | Position(s) Held with Trust | Term of Office(1) and Length of Time Served | Principal Occupation(s) During Past 5 Years | Number of Portfolios in Fund Complex(2) Overseen by Trustee | Other Directorships(3) Held During Past 5 Years by Trustee | ||||||||||||||||||
Independent Trustees(4) | |||||||||||||||||||||||
| John Chrystal 615 E. Michigan Street Milwaukee, WI 53202 Year of birth: 1958 | Trustee | Since 2011 | Insurance Acquisition Corp., Director (February 2019 — present); Founder and Managing Partner of Bent Gate Advisors, LLC, a consulting firm that provided strategic advice and assistance to financial institutions (2009 — 2012) | 1 | The Bancorp, Inc. (2013 to present), Javelin Mortgage Investments, Inc. (2012 — 2016) | ||||||||||||||||||
| Albert J. DiUlio, S.J. 615 E. Michigan Street Milwaukee, WI 53202 Year of birth: 1943 | Trustee | Since 2011 | Treasurer, Midwest Province and Wisconsin Province of The Society of Jesus (2014 to present); President, Vatican Observatory Foundation (2011 — 2014). | 1 | None | ||||||||||||||||||
| Harry E. Resis 615 E. Michigan Street Milwaukee, WI 53202 Year of birth: 1945 | Trustee | Since 2012 | Private investor. Previously served as Director of US Fixed Income for Henderson Global Investors | 1 | None | ||||||||||||||||||
| Brian S. Ferrie 615 E. Michigan Street Milwaukee, WI 53202 Year of birth: 1958 | Trustee | Since 2020 | Chief Compliance Officer, Treasurer, The Jensen Quality Growth Fund (2004 to 2020); Treasurer, Jensen Investment Management (2003 to 2020) | 1 | None | ||||||||||||||||||
| Wan-Chong Kung 615 E. Michigan Street Milwaukee, WI 53202 Year of birth: 1960 | Trustee | Since 2020 | Senior Fund Manager, Nuveen Asset Management (FAF Advisors/First American Funds) (2011 to 2019) | 1 | None | ||||||||||||||||||
Interested Trustee(5) | |||||||||||||||||||||||
| Christopher E. Kashmerick 615 E. Michigan Street Milwaukee, WI 53202 Year of birth: 1974 | Trustee, Chairman, President and Principal Executive Officer | Trustee since 2018, Chairman, President and Principal Executive Officer since 2014 | Senior Vice President, U.S. Bancorp Fund Services, LLC (2011 to present) | 1 | None | ||||||||||||||||||
Miller Opportunity Trust 2020 Annual Report
50
Name, Address and Age | Position(s) Held with Trust | Term of Office(1) and Length of Time Served | Principal Occupation(s) During Past 5 Years | ||||||||||||
Officers | |||||||||||||||
| Steven J. Jensen 615 E. Michigan Street Milwaukee, WI 53202 Year of birth: 1957 | Vice President, Chief Compliance Officer and AML Officer | Since 2014 | Senior Vice President, U.S. Bancorp Fund Services, LLC (2011 to present) | ||||||||||||
| Russell B. Simon 615 E. Michigan Street Milwaukee, WI 53202 Year of birth:1980 | Treasurer and Principal Financial Officer | Since 2014 | Vice President, U.S. Bancorp Fund Services, LLC (2011 to present) | ||||||||||||
| Scott A. Resnick 615 E. Michigan Street Milwaukee, WI 53202 Year of birth: 1983 | Secretary | Since 2019 | Assistant Vice President, U.S. Bancorp Fund Services, LLC (2018 — present); Associate, Legal & Compliance, PIMCO (2012 — 2018) | ||||||||||||
(1) Each Trustee serves an indefinite term; however, under the terms of the Board's retirement policy, a Trustee shall retire at the end of the calendar year in which he or she reaches the age of 75 (this policy does not apply to any Trustee serving at the time the policy was adopted). Each officer serves an indefinite term until the election of a successor.
(2) The Trust is comprised of numerous series managed by unaffiliated investment advisers. The term "Fund Complex" applies only to the Fund. The Fund does not hold itself out as related to any other series within the Trust for purposes of investment and investor services, nor do they share the same investment advisor with any other series.
(3) "Other Directorships Held" includes only directorships of companies required to register or file reports with the SEC under the Securities Exchange Act of 1934, as amended, (that is, "public companies") or other investment companies registered under the 1940 Act.
(4) The Trustees of the Trust who are not "interested persons" of the Trust as defined under the 1940 Act ("Independent Trustees").
(5) Mr. Kashmerick is an "interested person" of the Trust as defined by the 1940 Act. Mr. Kashmerick is an interested Trustee of the Trust by virtue of the fact that, until March 31, 2020, he was an interested person of Quasar Distributors, LLC, the Trust's distributor.
The Fund's Statement of Additional Information ("SAI") includes information about the Fund's Trustees and is available without charge, upon request, by calling (888) 593-5110.
Miller Opportunity Trust 2020 Annual Report
51
Privacy notice
The Fund collects non-public information about you from the following sources:
• Information we receive about you on applications or other forms;
• Information you give us orally; and/or
• Information about your transactions with us or others.
We do not disclose any non-public personal information about our customers or former customers without the customer's authorization, except as permitted by law or in response to inquiries from governmental authorities. We may share information with affiliated and unaffiliated third parties with whom we have contracts for servicing the Fund. We will provide unaffiliated third parties with only the information necessary to carry out their assigned responsibilities. We maintain physical, electronic and procedural safeguards to guard your non-public personal information and require third parties to treat your personal information with the same high degree of confidentiality.
In the event that you hold shares of the Fund through a financial intermediary, including, but not limited to, a broker-dealer, bank, or trust company, the privacy policy of your financial intermediary would govern how your non-public personal information would be shared by those entities with unaffiliated third parties.
Miller Opportunity Trust 2020 Annual Report
52
Investment Adviser
Miller Value Partners, LLC
One South Street
Suite 2550
Baltimore, MD 21202
Distributor
Quasar Distributors, LLC
111 East Kilbourn Ave.
Suite 2200
Milwaukee, Wisconsin 53202
Custodian
U.S. Bank National Association
Custody Operations
1555 North River Center Drive, Suite 302
Milwaukee, Wisconsin 53212
Transfer Agent
U.S. Bancorp Fund Services, LLC
615 East Michigan Street
Milwaukee, Wisconsin 53202
Independent Registered Public Accounting Firm
BBD, LLP
1835 Market Street,
3rd Floor
Philadelphia, PA 19103
Legal Counsel
Morgan, Lewis & Bockius, LLP
1111 Pennsylvania Avenue, NW
Washington, DC 20004
This report has been prepared for shareholders and may be distributed to others only if preceded or accompanied by a current prospectus.

(b) Not Applicable
Item 2. Code of Ethics.
The registrant has adopted a code of ethics that applies to the registrant’s principal executive officer and principal financial officer. The registrant has not made any substantive amendments to its code of ethics during the period covered by this report. The registrant has not granted any waivers from any provisions of the code of ethics during the period covered by this report.
A copy of the registrant’s Code of Ethics is filed herewith.
Item 3. Audit Committee Financial Expert.
The registrant’s Board of Trustees has determined that there is at least one audit committee financial expert serving on its audit committee. John Chrystal, Albert J. DiUlio, Harry E. Resis, Brian S. Ferrie and Wan-Chong Kung are the “audit committee financial experts” and are considered to be “independent” as each term is defined in Item 3 of Form N-CSR.
Item 4. Principal Accountant Fees and Services.
The registrant has engaged its principal accountant to perform audit services, audit-related services, tax services and other services during the past two fiscal year. “Audit services” refer to performing an audit of the registrant’s annual financial statements or services that are normally provided by the accountant in connection with statutory and regulatory filings or engagements for those fiscal years. “Audit-related services” refer to the assurance and related services by the principal accountant that are reasonably related to the performance of the audit. “Tax services” refer to professional services rendered by the principal accountant for tax compliance, tax advice, and tax planning. There were no “other services” provided by the principal accountant. The following table details the aggregate fees billed or expected to be billed for each of the last two fiscal years for audit fees, audit-related fees, tax fees and other fees by the principal accountant.
Miller Opportunity Trust
|
| BBD, LLP |
| BBD, LLP |
| ||
|
| FYE 12/31/2020 |
| FYE 12/31/2019 |
| ||
Audit Fees |
| $ | 17,500 |
| $ | 17,500 |
|
Audit-Related Fees |
| N/A |
| N/A |
| ||
Tax Fees |
| $ | 3,100 |
| $ | 3,100 |
|
All Other Fees |
| N/A |
| N/A |
| ||
The audit committee has adopted pre-approval policies and procedures that require the audit committee to pre-approve all audit and non-audit services of the registrant, including services provided to any entity affiliated with the registrant.
The percentage of fees billed by the principal accountant applicable to non-audit services pursuant to waiver of pre-approval requirement were as follows:
Miller Opportunity Trust
|
| BBD, LLP |
| BBD, LLP |
|
|
| FYE 12/31/2020 |
| FYE 12/31/2019 |
|
Audit-Related Fees |
| 0 | % | 0 | % |
Tax Fees |
| 0 | % | 0 | % |
All Other Fees |
| 0 | % | 0 | % |
All of the principal accountant’s hours spent on auditing the registrant’s financial statements were attributed to work performed by full-time permanent employees of the principal accountant.
The following table indicates the non-audit fees billed or expected to be billed by the registrant’s accountant for services to the registrant and to the registrant’s investment adviser (and any other controlling entity, etc.—not sub-adviser) for the last two years. The audit committee of the board of trustees/directors has considered whether the provision of non-audit services that were rendered to the registrant’s investment adviser is compatible with maintaining the principal accountant’s independence and has concluded that the provision of such non-audit services by the accountant has not compromised the accountant’s independence.
Miller Opportunity Trust
|
| BBD, LLP |
| BBD, LLP |
| ||
Non-Audit Related Fees |
| FYE 12/31/2020 |
| FYE 12/31/2019 |
| ||
Registrant |
| $ | 3,100 |
| $ | 3,100 |
|
Registrant’s Investment Adviser |
| N/A |
| N/A |
| ||
Item 5. Audit Committee of Listed Registrants.
Not applicable to registrants who are not listed issuers (as defined in Rule 10A-3 under the Securities Exchange Act of 1934).
Item 6. Investments.
Schedule of Investments is included as part of the report to shareholders filed under Item 1 of this Form
Item 7. Disclosure of Proxy Voting Policies and Procedures for Closed-End Management Investment Companies.
Not applicable to open-end investment companies.
Item 8. Portfolio Managers of Closed-End Management Investment Companies.
Not applicable to open-end investment companies.
Item 9. Purchases of Equity Securities by Closed-End Management Investment Company and Affiliated Purchasers.
Not applicable to open-end investment companies.
Item 10. Submission of Matters to a Vote of Security Holders.
There have been no material changes to the procedures by which shareholders may recommend nominees to the registrant’s Board of Trustees.
Item 11. Controls and Procedures.
(a) The Registrant’s President and Treasurer have reviewed the Registrant’s disclosure controls and procedures (as defined in Rule 30a-3(c) under the Investment Company Act of 1940 (the “Act”)) as of a date within 90 days of the filing of this report, as required by Rule 30a-3(b) under the Act and Rules 13a-15(b) or 15d-15(b) under the Securities Exchange Act of 1934. Based on their review, such officers have concluded that the disclosure controls and procedures are effective in ensuring that information required to be disclosed in this report is appropriately recorded, processed, summarized and reported and made known to them by others within the Registrant and by the Registrant’s service provider.
(b) There were no changes in the Registrant’s internal control over financial reporting (as defined in Rule 30a-3(d) under the Act) that occurred during the period covered by this report that has materially affected, or is reasonably likely to materially affect, the Registrant’s internal control over financial reporting.
Item 12. Disclosure of Securities Lending Activities for Closed-End Management Investment Companies
Not applicable to open-end investment companies.
Item 13. Exhibits.
(3) Any written solicitation to purchase securities under Rule 23c-1 under the Act sent or given during the period covered by the report by or on behalf of the registrant to 10 or more persons. Not applicable to open-end investment companies.
(4) Change in the registrant’s independent public accountant. There was no change in the registrant’s independent public accountant for the period covered by this report.
(b) Certifications pursuant to Section 906 of the Sarbanes-Oxley Act of 2002. Furnished herewith.
SIGNATURES
Pursuant to the requirements of the Securities Exchange Act of 1934 and the Investment Company Act of 1940, the registrant has duly caused this report to be signed on its behalf by the undersigned, thereunto duly authorized.
Trust for Advised Portfolios |
| ||
|
| ||
|
|
| |
By | /s/ Christopher E. Kashmerick |
| |
| Christopher E. Kashmerick, President |
| |
|
| ||
Date | 3/10/2021 |
| |
Pursuant to the requirements of the Securities Exchange Act of 1934 and the Investment Company Act of 1940, this report has been signed below by the following persons on behalf of the registrant and in the capacities and on the dates indicated.
By | /s/ Christopher E. Kashmerick |
| |
| Christopher E. Kashmerick, President |
| |
|
| ||
Date | 3/10/2021 |
| |
By | /s/ Russell B. Simon |
| |
| Russell B. Simon, Treasurer |
| |
|
| ||
Date | 3/10/2021 |
| |