UNITED STATES
SECURITIES AND EXCHANGE COMMISSION
Washington, D.C. 20549
FORM N-CSR
CERTIFIED SHAREHOLDER REPORT OF REGISTERED
MANAGEMENT INVESTMENT COMPANIES
Investment Company Act file number 811-21422
Trust for Advised Portfolios
(Exact name of registrant as specified in charter)
615 East Michigan Street
Milwaukee, Wisconsin 53202
(Address of principal executive offices) (Zip code)
Christopher E. Kashmerick
Trust for Advised Portfolios
2020 East Financial Way, Suite 100
Glendora, CA 91741
(Name and address of agent for service)
(626) 914-7385
Registrant's telephone number, including area code
Date of fiscal year end: December 31
Date of reporting period: June 30, 2021
Item 1. Reports to Stockholders.
Semi-Annual Report
June 30, 2021

1919 FINANCIAL SERVICES FUND
1919 MARYLAND TAX-FREE INCOME FUND
1919 SOCIALLY RESPONSIVE BALANCED FUND
Table of Contents
1919 Financial Services Fund | |||||||
Letter to shareholders | 1 | ||||||
Fund performance | 4 | ||||||
Fund expenses | 5 | ||||||
Fund at a glance | 6 | ||||||
Schedule of investments | 7 | ||||||
Statement of assets and liabilities | 10 | ||||||
Statement of operations | 11 | ||||||
Statements of changes in net assets | 12 | ||||||
Financial highlights | 13 | ||||||
1919 Maryland Tax-Free Income Fund | |||||||
Letter to shareholders | 16 | ||||||
Fund performance | 19 | ||||||
Fund expenses | 20 | ||||||
Fund at a glance | 21 | ||||||
Schedule of investments | 22 | ||||||
Statement of assets and liabilities | 26 | ||||||
Statement of operations | 27 | ||||||
Statements of changes in net assets | 28 | ||||||
Financial highlights | 29 | ||||||
1919 Socially Responsive Balanced Fund | |||||||
Letter to shareholders | 32 | ||||||
Fund performance | 35 | ||||||
Fund expenses | 36 | ||||||
Fund at a glance | 37 | ||||||
Schedule of investments | 38 | ||||||
Statement of assets and liabilities | 46 | ||||||
Statement of operations | 47 | ||||||
Statements of changes in net assets | 48 | ||||||
Financial highlights | 49 | ||||||
Notes to financial statements | 52 | ||||||
Other information | 65 | ||||||
Privacy notice | 66 | ||||||
Directory of Funds' service providers | Back Cover | ||||||
1919 Funds 2021 Semi-Annual Report
1919 Financial Services Fund
Letter to Shareholders
Dear Shareholder,
For the first six months of 2021, as the U.S. was emerging from the worst of the pandemic, the S&P 500 Index finished up 15%. The economic recovery resulting from the reopening has been robust and the progress from the vaccine rollout in the U.S. is encouraging. Still there are emerging risks including COVID-19 variants, a constrained labor landscape, rising inflation and potential changes in tax policy.
The strongest sectors in the first half of 2021 were Energy up 45.6% and Financials up 25.7%, while the weakest were Utilities up 2.4% and Consumer Staples up 5.0%. Small cap stocks as measured by the Russell 2000 also had a strong showing, increasing 17.5%.
Financial Services has seen significant traction year-to-date and has benefited from being attractively valued in a rapidly-recovering American economy. Many banks have seen a boost in earnings due to the release of loan loss reserves, as credit quality indicators remain healthy. For example, total commercial and consumer loans in forbearance or deferral declined to an average of 1% by the end of the second quarter of 2021, compared to a peak of 10-12% of total loans last year.
Looking forward, bank loan growth is expected to accelerate as stimulus funds are depleted and companies re-stock inventories while consumers gain increased confidence in the economic outlook, which is positive for bank earnings. The Property and Casualty Insurance markets also have seen strong demand and have experienced the highest level of price increases since 2003. Many fintech companies should also continue to see accelerating revenue as consumers spend more on travel, restaurants and other reopening pursuits.
For the six months ended June 30, 2021, the 1919 Financial Services Fund returned 21.74%. The Fund's unmanaged benchmarks, the S&P 500 Index and S&P 500 Financials Index returned 15.25% and 25.69% respectively for the same period.
How did we respond to these changing market conditions?
During the first six months of 2021, the Fund added to a number of high quality bank and property casualty insurance
1919 Funds 2021 Semi-Annual Report
1
1919 Financial Services Fund
Letter to shareholders (unaudited) (cont'd)
positions, as well as select fintech opportunities, which we believe are well positioned to capitalize as domestic and international economies continue to re-open. It is also added to market exchange positions that are beneficiaries of increased market volatility across financial markets. The Fund trimmed a number of bank and real estate-related positions due to valuation.
What were the leading contributors to performance?
Collectively, our niche growth banks and acquired banks contributed the most to performance. The top five performing stocks were Silvergate Capital Corp., Class A, Western Alliance Bancorp, SVB Financial Group, Altabancorp, and American Financial Group Inc.
What were the leading detractors to performance?
The five stocks that performed the worst were Global Payments Inc., Visa Inc., Class A, Fiserv Inc., i3 Verticals Inc., Class A, and Black Knight Inc. We attribute some of this underperformance to weaker near-term earnings outlooks due to the pandemic.
Thank you for your investment in 1919 Financial Services Fund. As always we appreciate that you have chosen us to manage your assets and we remain focused on achieving the Fund's investment goals.
Sincerely,

Christopher J. Perry, CFA
Portfolio Manager
1919 Investment Counsel, LLC

Mel Casey, CFA
Portfolio Manager
1919 Investment Counsel, LLC

Charlie King, CFA
Portfolio Manager
1919 Investment Counsel, LLC
Russell 2000 Index — The Russell 2000® Index measures the performance of the small-cap segment of the US equity universe. The Russell 2000® Index is a subset of the Russell 3000® Index representing approximately 10% of the total market capitalization of that index. It includes approximately 2,000 of the smallest securities based on a combination of their market cap and current index membership. The Russell 2000® is constructed to provide a comprehensive and unbiased small-cap barometer and is completely reconstituted annually to ensure larger stocks do not distort the performance and characteristics of the true small-cap opportunity set.
S&P 500 Index — The S&P 500 Index is a broad based unmanaged index of 500
1919 Funds 2021 Semi-Annual Report
2
stocks, which is widely recognized as representative of the equity market in general.
S&P 500 Financials Index — The S&P 500 Financials Index comprises those companies included in the S&P 500 that are classified as members of the Global Industry Classification Standard financials sector.
Past performance is not a guarantee of future results.
Earnings growth is not representative of the Fund's future performance.
Opinions expressed herein are as of 6/30/21 and are subject to change at any time, are not a guaranteed and should not be considered investment advice.
Fund holdings and sector allocations are subject to change and are not a recommendation to buy or sell any security. Please refer to the Schedule of Investments for a complete list of Fund holdings.
This report has been prepared for shareholders and may be distributed to other if preceded or accompanied by a current prospectus.
Mutual fund investing involves risk. Principal loss is possible. The Fund may invest in small and medium-capitalization companies which tend to have limited liquidity and greater price volatility than larger-capitalization companies. The Fund may invest in foreign and emerging market securities which will involve greater volatility and political, economic and currency risks and differences in accounting methods. The risks are particularly significant for funds that invest in emerging markets. The Fund may make short
sales of securities, which involves the risk that losses may exceed the original amount invested.
1919 Funds are distributed by Quasar Distributors, LLC
1919 Funds 2021 Semi-Annual Report
3
Fund performance (unaudited)
Total Returns* as of June 30, 2021
6 Months | |||||||
1919 Financial Services Fund Class A | |||||||
With Sales Charges† | |||||||
Class A | 14.63 | % | |||||
Class C | 20.12 | ||||||
Without Sales Charges | |||||||
Class A | 21.62 | ||||||
Class C | 21.12 | ||||||
Class I | 21.74 | ||||||
S&P 500 Index(i) | 15.25 | ||||||
S&P Financials Index(ii) | 25.69 | ||||||
† Class A Shares have a maximum initial sales charge of 5.75% and Class C Shares have a contingent deferred sales charge (CDSC) of 1.00% for shares redeemed within one year of purchase.
As of the Fund's current prospectus dated April 30, 2021, the total annual operating expense ratios for Class A, Class C and Class I were 1.46%, 2.16% and 1.17% respectively. Actual expenses may be higher. For example, expenses may be higher than those shown if average net assets decrease. Net assets are more likely to decrease, and Fund expense ratios are more likely to increase when markets are volatile.
All figures represent past performance and are not a guarantee of future results. Investment return and principal value of an investment will fluctuate so that an investor's shares, when redeemed, may be worth more or less than their original cost. Fund returns assume the reinvestment of all distributions, at net asset value and the deduction of all Fund expenses. Total returns do not reflect the deduction of taxes that a shareholder would pay on Fund distributions or the redemption of Fund shares. Performance figures may reflect fee waivers and/or expense reimbursements. In the absence of fee waivers and/or expense reimbursements, the total return would have been lower. Current performance of the Fund may be lower or higher than the performance quoted. Performance data current to the most recent month end may be obtained by calling 1-844-828-1919.
(i) The S&P 500 Index is an unmanaged index of 500 stocks and is generally representative of the performance of larger companies in the U.S.
(ii) The S&P 500 Financials Index is a capitalization-weighted index representing nine financial groups and fifty-three financial companies, calculated monthly with dividends reinvested at month-end.
The Indices are unmanaged and are not subject to the same management and trading expenses as a mutual fund. Please note that an investor cannot invest directly in an index.
1919 Funds 2021 Semi-Annual Report
4
Fund expenses (unaudited)
Example
As a shareholder of the Fund, you may incur two types of costs: (1) transaction costs, including front-end and back-end sales charges (loads) on purchase payments; and (2) ongoing costs, including management fees; service and/or distribution (12b-1) fees; and other Fund expenses. This example is intended to help you understand your ongoing costs (in dollars) of investing in the Fund and to compare these costs with the ongoing costs of investing in other mutual funds.
This example is based on an investment of $1,000 invested on January 1, 2021 and held for the six months ended June 30, 2021.
Actual expenses
The table below titled "Based on Actual Total Return" provides information about actual account values and actual expenses. You may use the information provided in this table, together with the amount you invested, to estimate the expenses that you paid over the period. To estimate the expenses you paid on your account, divide your ending account value by $1,000 (for example, an $8,600 ending account value divided by $1,000 = 8.6), then multiply the result by the number under the heading entitled "Expenses Paid During the Period".
Hypothetical example for comparison purposes
The table below titled "Based on Hypothetical Total Return" provides information about hypothetical account values and hypothetical expenses based on the actual expense ratio and an assumed rate of return of 5.00% per year before expenses, which is not the Fund's actual return. The hypothetical account values and expenses may not be used to estimate the actual ending account balance or expenses you paid for the period. You may use the information provided in this table to compare the ongoing costs of investing in the Fund and other funds. To do so, compare the 5.00% hypothetical example relating to the Fund with the 5.00% hypothetical examples that appear in the shareholder reports of the other funds.
Please note that the expenses shown in the table below are meant to highlight your ongoing costs only and do not reflect any transactional costs. Therefore, the table is useful in comparing ongoing costs only, and will not help you determine the relative total costs of owning different funds. In addition, if these transaction costs were included, your costs would have been higher.
Based on actual total return1
| Actual Total Return2 | Beginning Account Value | Ending Account Value | Annualized Expense Ratio | Expenses Paid During the Period3 | |||||||||||||||||||
Class A | 21.62 | % | $ | 1,000.00 | $ | 1,216.20 | 1.36 | % | $ | 7.47 | |||||||||||||
Class C | 21.12 | 1,000.00 | 1,211.20 | 2.08 | 11.40 | ||||||||||||||||||
Class I | 21.74 | 1,000.00 | 1,217.40 | 1.09 | 5.99 | ||||||||||||||||||
Based on hypothetical total return1
| Hypothetical Annualized Total Return | Beginning Account Value | Ending Account Value | Annualized Expense Ratio | Expenses Paid During the Period3 | |||||||||||||||||||
Class A | 2.48 | % | $ | 1,000.00 | $ | 1,018.05 | 1.36 | % | $ | 6.80 | |||||||||||||
Class C | 2.48 | 1,000.00 | 1,014.48 | 2.08 | 10.39 | ||||||||||||||||||
Class I | 2.48 | 1,000.00 | 1,019.39 | 1.09 | 5.46 | ||||||||||||||||||
1 For the six months ended June 30, 2021.
2 Assumes the reinvestment of all distributions at net asset value and does not reflect the deduction of the applicable sales charge with respect to Class A shares or the applicable contingent deferred sales charge ("CDSC") with respect to Class C shares. Total return is not annualized, as it may not be representative of the total return for the year. Performance figures may reflect fee waivers and/or expense reimbursements. In the absence of fee waivers and/or expense reimbursements, the total return would have been lower.
3 Expenses (net of fee waivers and/or expense reimbursements) are equal to each class' annualized expense ratio multiplied by the average account value over the period, multiplied by the number of days in the most recent fiscal half-year (181), then divided by 365.
1919 Funds 2021 Semi-Annual Report
5
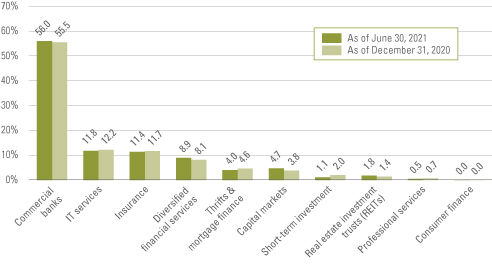
Fund at a glance (unaudited)
Investment breakdown (%) as a percent of total investments
1919 Funds 2021 Semi-Annual Report
6
Schedule of investments
June 30, 2021 (Unaudited)
1919 Financial Services Fund
Security | Shares | Value | |||||||||
Common Stocks — 99.2% | |||||||||||
Capital Markets — 4.7% | |||||||||||
Ameriprise Financial Inc. | 18,425 | $ | 4,585,614 | ||||||||
CME Group Inc. | 25,500 | 5,423,340 | |||||||||
Total Capital Markets | 10,008,954 | ||||||||||
Commercial Banks — 56.1% | |||||||||||
Altabancorp | 85,000 | 3,681,350 | |||||||||
Bank of America Corp. | 271,000 | 11,173,330 | |||||||||
Banner Corp. | 80,142 | 4,344,498 | |||||||||
BOK Financial Corp. | 8,314 | 719,992 | |||||||||
Bryn Mawr Bank Corp. | 55,000 | 2,320,450 | |||||||||
Coastal Financial Corp/WA* | 75,000 | 2,142,000 | |||||||||
Columbia Banking System Inc. | 68,805 | 2,653,121 | |||||||||
Comerica Inc. | 12,000 | 856,080 | |||||||||
Farmers & Merchants Bank of Long Beach | 200 | 1,640,000 | |||||||||
Fifth Third Bancorp | 94,400 | 3,608,912 | |||||||||
First Financial Bancorp | 57,000 | 1,346,910 | |||||||||
First Foundation Inc. | 133,000 | 2,993,830 | |||||||||
First Republic Bank/CA | 22,000 | 4,117,740 | |||||||||
First Western Financial Inc.* | 77,000 | 1,993,530 | |||||||||
HBT Financial Inc. | 60,000 | 1,044,600 | |||||||||
Heritage Financial Corp. | 128,000 | 3,202,560 | |||||||||
Huntington Bancshares Inc/OH | 86,024 | 1,227,562 | |||||||||
JPMorgan Chase & Co. | 69,310 | 10,780,477 | |||||||||
Level One Bancorp Inc. | 37,000 | 1,010,100 | |||||||||
Pacific Premier Bancorp Inc. | 96,263 | 4,070,962 | |||||||||
PNC Financial Services Group Inc. | 18,000 | 3,433,680 | |||||||||
QCR Holdings Inc. | 100,300 | 4,823,427 | |||||||||
Silvergate Capital Corp.* | 28,000 | 3,172,960 | |||||||||
SmartFinancial Inc. | 61,000 | 1,464,610 | |||||||||
South State Corp. | 47,309 | 3,867,984 | |||||||||
Sterling Bancorp | 180,200 | 4,467,158 | |||||||||
Stock Yards Bancorp Inc. | 70,000 | 3,562,300 | |||||||||
SVB Financial Group* | 15,300 | 8,513,379 | |||||||||
Truist Financial Corp. | 96,905 | 5,378,228 | |||||||||
U.S. Bancorp | 94,000 | 5,355,180 | |||||||||
Univest Corp. of Pennsylvania | 55,126 | 1,453,673 | |||||||||
Webster Financial Corp. | 57,895 | 3,088,119 | |||||||||
Western Alliance Bancorp | 61,000 | 5,663,850 | |||||||||
Total Commercial Banks | 119,172,552 | ||||||||||
1919 Funds 2021 Semi-Annual Report
7
Schedule of investments (cont'd)
June 30, 2021 (Unaudited)
1919 Financial Services Fund
Security | Shares | Value | |||||||||
Diversified Financial Services — 8.9% | |||||||||||
Alerus Financial Corp. | 65,000 | $ | 1,885,650 | ||||||||
Charles Schwab Corp. | 116,000 | 8,445,960 | |||||||||
Intercontinental Exchange Inc. | 41,000 | 4,866,700 | |||||||||
Voya Financial Inc. | 60,000 | 3,690,000 | |||||||||
Total Diversified Financial Services | 18,888,310 | ||||||||||
Insurance — 11.4% | |||||||||||
American Financial Group Inc. | 22,650 | 2,824,908 | |||||||||
Brown & Brown Inc. | 64,000 | 3,400,960 | |||||||||
Chubb Limited | 48,500 | 7,708,590 | |||||||||
Hanover Insurance Group Inc. | 32,000 | 4,340,480 | |||||||||
Marsh & McLennan Cos Inc. | 29,500 | 4,150,060 | |||||||||
RenaissanceRe Holdings Ltd | 12,000 | 1,785,840 | |||||||||
Total Insurance | 24,210,838 | ||||||||||
IT Services — 11.8% | |||||||||||
Black Knight Inc.* | 32,000 | 2,495,360 | |||||||||
Fidelity National Information Services Inc. | 24,787 | 3,511,574 | |||||||||
Fiserv Inc.* | 34,680 | 3,706,945 | |||||||||
Global Payments Inc. | 24,199 | 4,538,281 | |||||||||
I3 Verticals Inc., Class A Shares* | 82,480 | 2,492,546 | |||||||||
Visa Inc., Class A Shares | 36,000 | 8,417,520 | |||||||||
Total IT Services | 25,162,226 | ||||||||||
Professional Services — 0.5% | |||||||||||
Verisk Analytics Inc., Class A Shares | 5,500 | 960,960 | |||||||||
Total Professional Services | 960,960 | ||||||||||
Real Estate Investment Trusts (REITs) — 1.8% | |||||||||||
Crown Castle International Corp. | 8,000 | 1,560,800 | |||||||||
Prologis Inc. | 18,500 | 2,211,305 | |||||||||
Total Real Estate Investment Trusts (REITs) | 3,772,105 | ||||||||||
Thrifts & Mortgage Finance — 4.0% | |||||||||||
Bridgewater Bancshares Inc.* | 143,000 | 2,309,450 | |||||||||
FS Bancorp Inc. | 17,000 | 1,211,590 | |||||||||
Riverview Bancorp Inc. | 90,000 | 638,100 | |||||||||
Territorial Bancorp Inc. | 53,000 | 1,376,410 | |||||||||
WSFS Financial Corp. | 62,803 | 2,925,992 | |||||||||
Total Thrifts & Mortgage Finance | 8,461,542 | ||||||||||
Total Common Stocks (Cost — $108,015,584) | 210,637,487 | ||||||||||
1919 Funds 2021 Semi-Annual Report
8
1919 Financial Services Fund
Security | Shares | Value | |||||||||
Short-Term Investment — 1.1% | |||||||||||
| Fidelity Investments Money Market — Government Portfolio — Class I — 0.01% (a) | 2,355,768 | $ | 2,355,768 | ||||||||
Total Short-Term Investment (Cost — $2,355,768) | 2,355,768 | ||||||||||
Total Investments — 100.3% (Cost — $110,371,352) | 212,993,255 | ||||||||||
Liabilities in Excess of Other Assets — (0.3)% | (585,966 | ) | |||||||||
Total Net Assets — 100.0% | $ | 212,407,289 | |||||||||
Notes:
* Non-income producing security
(a) The rate reported is the annualized seven-day yield at period end.
The Accompanying Notes are an Integral Part of these Financial Statements.
1919 Funds 2021 Semi-Annual Report
9
1919 Financial Services Fund
Statement of assets and liabilities
June 30, 2021 (Unaudited)
Assets: | |||||||
Investments in securities at value (cost $110,371,352) | $ | 212,993,255 | |||||
Foreign currency at value (cost $18,177) | 18,823 | ||||||
Receivable for securities sold | 640,024 | ||||||
Receivable for Fund shares sold | 326,361 | ||||||
Dividends and interest receivable | 162,406 | ||||||
Prepaid expenses | 33,460 | ||||||
Total Assets | 214,174,329 | ||||||
Liabilities: | |||||||
Payable for Fund shares repurchased | 1,350,739 | ||||||
Advisory fees payable | 145,698 | ||||||
Distribution fees payable | 132,201 | ||||||
Accrued other expenses | 138,402 | ||||||
Total Liabilities | 1,767,040 | ||||||
Net Assets | $ | 212,407,289 | |||||
Components of Net Assets: | |||||||
Paid-in capital | $ | 104,322,122 | |||||
Total distributable earnings | 108,085,167 | ||||||
Net Assets | $ | 212,407,289 | |||||
Class A: | |||||||
Net Assets | $ | 81,721,624 | |||||
Shares Issued and Outstanding (unlimited shares authorized, no par value) | 2,500,964 | ||||||
Net Asset Value and Redemption Price | $ | 32.68 | |||||
Maximum Public Offering Price (based on maximum initial sales charge of 5.75%) | $ | 34.67 | |||||
Class C: | |||||||
Net Assets | $ | 33,571,075 | |||||
Shares Issued and Outstanding (unlimited shares authorized, no par value) | 1,132,216 | ||||||
Net Asset Value, Redemption Price* and Offering Price Per Share | $ | 29.65 | |||||
Class I: | |||||||
Net Assets | $ | 97,114,590 | |||||
Shares Issued and Outstanding (unlimited shares authorized, no par value) | 2,935,254 | ||||||
Net Asset Value, Redemption Price and Offering Price Per Share | $ | 33.09 | |||||
* Redemption price per share of Class C shares is NAV reduced by a 1.00% CDSC if shares are redeemed within one year of purchase. (See Note 3).
The Accompanying Notes are an Integral Part of these Financial Statements.
1919 Funds 2021 Semi-Annual Report
10
1919 Financial Services Fund
Statement of operations
For the Six Months Ended June 30, 2021 (Unaudited)
Investment Income: | |||||||
Dividend income | $ | 1,963,017 | |||||
Investment interest income | 236 | ||||||
Total Investment Income | 1,963,253 | ||||||
Expenses: | |||||||
Advisory fees (Note 3) | 799,130 | ||||||
Distribution fees (Note 6) | 255,554 | ||||||
Transfer agent fees and expenses (Note 3 & Note 6) | 146,397 | ||||||
Administration and fund accounting fees (Note 3) | 63,404 | ||||||
Registration fees | 25,068 | ||||||
Shareholder reporting fees | 16,418 | ||||||
Legal fees | 10,645 | ||||||
Custody fees (Note 3) | 9,664 | ||||||
Trustees' fees (Note 3) | 8,423 | ||||||
Audit fees | 7,687 | ||||||
Compliance fees (Note 3) | 3,008 | ||||||
Insurance fees | 2,043 | ||||||
Miscellaneous | 5,809 | ||||||
Total Expenses | 1,353,250 | ||||||
Net Investment Income | 610,003 | ||||||
Realized and Unrealized Gain on Investments and Foreign Currency | |||||||
Net realized gain on investments | 3,236,131 | ||||||
Net change in unrealized appreciation/depreciation on: | |||||||
Investments | 31,692,571 | ||||||
Foreign currency | 492 | ||||||
Net Change in Unrealized Appreciation/Depreciation | 31,693,063 | ||||||
Net Realized and Unrealized Gain on Investments | 34,929,194 | ||||||
Net Increase in Net Assets Resulting From Operations | $ | 35,539,197 | |||||
The Accompanying Notes are an Integral Part of these Financial Statements.
1919 Funds 2021 Semi-Annual Report
11
1919 Financial Services Fund
Statements of changes in net assets
| For the Six Months Ended June 30, 2021 (Unaudited) and the Year Ended December 31, | 2021 | 2020 | |||||||||
Increase (Decrease) in Net Assets from: | |||||||||||
Operations: | |||||||||||
Net investment income | $ | 610,003 | $ | 1,296,263 | |||||||
Net realized gain | 3,236,131 | 7,237,122 | |||||||||
Net change in unrealized appreciation/depreciation | 31,693,063 | (22,489,958 | ) | ||||||||
| Net Increase (Decrease) in Net Assets Resulting From Operations | 35,539,197 | (13,956,573 | ) | ||||||||
Distributions to Shareholders: | |||||||||||
Class A | — | (3,361,622 | ) | ||||||||
Class C | — | (1,214,056 | ) | ||||||||
Class I | — | (3,288,635 | ) | ||||||||
Total Distributions to Shareholders | — | (7,864,313 | ) | ||||||||
Capital Transactions: | |||||||||||
Net proceeds from shares sold | 41,250,034 | 31,173,827 | |||||||||
Reinvestment of distributions | — | 7,298,860 | |||||||||
Cost of shares repurchased | (25,178,754 | ) | (73,071,488 | ) | |||||||
Net Increase (Decrease) in Net Assets From Capital Transactions | 16,071,280 | (34,598,801 | ) | ||||||||
Total Increase (Decrease) in Net Assets | 51,610,477 | (56,419,687 | ) | ||||||||
Net Assets: | |||||||||||
Beginning of period | 160,796,812 | 217,216,499 | |||||||||
End of period | $ | 212,407,289 | $ | 160,796,812 | |||||||
The Accompanying Notes are an Integral Part of these Financial Statements.
1919 Funds 2021 Semi-Annual Report
12
1919 Financial Services Fund
Financial highlights
For a share of beneficial interest outstanding through each year presented:
Class A Shares | 2021* | 2020 | 2019 | 2018 | 2017 | 2016 | |||||||||||||||||||||
Net asset value, beginning of year | $ | 26.87 | $ | 28.27 | $ | 22.77 | $ | 27.16 | $ | 23.69 | $ | 19.28 | |||||||||||||||
Income from investment operations: | |||||||||||||||||||||||||||
Net investment income1 | 0.09 | 0.20 | 0.17 | 0.05 | 0.04 | 0.08 | |||||||||||||||||||||
Net realized and unrealized gain (loss) on investments | 5.72 | (0.23 | ) | 6.42 | (4.08 | ) | 3.43 | 5.02 | |||||||||||||||||||
| Total income (loss) from investment operations | 5.81 | (0.03 | ) | 6.59 | (4.03 | ) | 3.47 | 5.10 | |||||||||||||||||||
Less distributions: | |||||||||||||||||||||||||||
From net investment income | — | (0.25 | ) | (0.17 | ) | (0.01 | ) | — | (0.06 | ) | |||||||||||||||||
From net realized gain on investments | — | (1.12 | ) | (0.92 | ) | (0.35 | ) | — | (0.63 | ) | |||||||||||||||||
Total distributions | — | (1.37 | ) | (1.09 | ) | (0.36 | ) | — | (0.69 | ) | |||||||||||||||||
Net asset value, end of year | $ | 32.68 | $ | 26.87 | $ | 28.27 | $ | 22.77 | $ | 27.16 | $ | 23.69 | |||||||||||||||
Total return2 | 21.62 | % | 50.05 | % | 29.10 | % | -14.93 | % | 14.65 | % | 26.46 | % | |||||||||||||||
Supplemental data and ratios: | |||||||||||||||||||||||||||
Net assets, end of year (in thousands) | $ | 81,722 | $ | 67,047 | $ | 78,401 | $ | 71,082 | $ | 118,310 | $ | 92,948 | |||||||||||||||
Ratios to average net assets | |||||||||||||||||||||||||||
Gross expenses | 1.36 | %6 | 1.46 | % | 1.37 | % | 1.33 | % | 1.37 | % | 1.46 | % | |||||||||||||||
Net Expenses3 | 1.366 | 1.46 | 1.37 | 1.33 | 1.37 | 1.464 | |||||||||||||||||||||
Net investment income | 0.596 | 0.86 | 0.64 | 0.19 | 0.16 | 0.43 | |||||||||||||||||||||
Portfolio turnover rate | 3 | %5 | 2 | % | 8 | % | 18 | % | 4 | % | 8 | % | |||||||||||||||
* For the six months ended June 30, 2021 (unaudited).
1 Per share amounts have been calculated using the average shares method.
2 Performance figures, exclusive of sales charges, may reflect fee waivers and/or expense reimbursements. In the absence of fee waivers and/or expense reimbursements, the total return would have been lower. Past performance is no guarantee of future results.
3 Effective April 30, 2017, the advisor agreed to limit the ratio of expenses, other than brokerage, interest, taxes, extraordinary expenses and acquired fund fees and expenses, to 1.50% of the average net assets of Class A shares. This expense limitation arrangement cannot be terminated prior to April 30, 2022 without the Board of Trustees' consent. Prior to April 30, 2017, this limitation was 1.46%. See Note 3.
4 Reflects fee waivers and/or expense reimbursements.
5 Not annualized.
6 Annualized.
The Accompanying Notes are an Integral Part of these Financial Statements.
1919 Funds 2021 Semi-Annual Report
13
1919 Financial Services Fund
Financial highlights (cont'd)
For a share of beneficial interest outstanding through each year presented:
Class C Shares | 2021* | 2020 | 2019 | 2018 | 2017 | 2016 | |||||||||||||||||||||
Net asset value, beginning of year | $ | 24.48 | $ | 25.82 | $ | 20.88 | $ | 25.12 | $ | 22.07 | $ | 18.06 | |||||||||||||||
Income from investment operations: | |||||||||||||||||||||||||||
Net investment income (loss)1 | (0.02 | ) | 0.03 | (0.02 | ) | (0.13 | ) | (0.13 | ) | (0.04 | ) | ||||||||||||||||
Net realized and unrealized gain (loss) on investments | 5.19 | (0.23 | ) | 5.88 | (3.76 | ) | 3.18 | 4.68 | |||||||||||||||||||
| Total income (loss) from investment operations | 5.17 | (0.20 | ) | 5.86 | (3.89 | ) | 3.05 | 4.64 | |||||||||||||||||||
Less distributions: | |||||||||||||||||||||||||||
From net investment income | — | (0.02 | ) | — | — | — | — | ||||||||||||||||||||
From net realized gain on investments | — | (1.12 | ) | (0.92 | ) | (0.35 | ) | — | (0.63 | ) | |||||||||||||||||
Total distributions | — | (1.14 | ) | (0.92 | ) | (0.35 | ) | — | (0.63 | ) | |||||||||||||||||
Net asset value, end of year | $ | 29.65 | $ | 24.48 | $ | 25.82 | $ | 20.88 | $ | 25.12 | $ | 22.07 | |||||||||||||||
Total return2 | 21.12 | %5 | -0.64 | % | 28.21 | % | -15.57 | % | 13.82 | % | 25.67 | % | |||||||||||||||
Supplemental data and ratios: | |||||||||||||||||||||||||||
Net assets, end of year (in thousands) | $ | 33,571 | $ | 26,404 | $ | 40,880 | $ | 46,763 | $ | 53,667 | $ | 37,271 | |||||||||||||||
Ratios to average net assets | |||||||||||||||||||||||||||
Gross expenses | 2.08 | %6 | 2.16 | % | 2.09 | % | 2.05 | % | 2.08 | % | 2.19 | % | |||||||||||||||
Net Expenses3 | 2.086 | 2.16 | 2.09 | 2.05 | 2.08 | 2.134 | |||||||||||||||||||||
Net investment income (loss) | (0.12 | )6 | 0.15 | (0.09 | ) | (0.52 | ) | (0.55 | ) | (0.24 | ) | ||||||||||||||||
Portfolio turnover rate | 3 | %5 | 2 | % | 8 | % | 18 | % | 4 | % | 8 | % | |||||||||||||||
* For the six months ended June 30, 2021 (unaudited).
1 Per share amounts have been calculated using the average shares method.
2 Performance figures, exclusive of CDSC, may reflect fee waivers and/or expense reimbursements. In the absence of fee waivers and/or expense reimbursements, the total return would have been lower. Past performance is no guarantee of future results.
3 Effective April 30, 2017, the advisor agreed to limit the ratio of expenses, other than brokerage, interest, taxes, extraordinary expenses and acquired fund fees and expenses, to 2.25% of the average net assets of Class C shares. This expense limitation arrangement cannot be terminated prior to April 30, 2022 without the Board of Trustees' consent. Prior to April 30, 2017, this limitation was 2.13%. See Note 3.
4 Reflects fee waivers and/or expense reimbursements.
5 Not annualized.
6 Annualized.
The Accompanying Notes are an Integral Part of these Financial Statements.
1919 Funds 2021 Semi-Annual Report
14
For a share of beneficial interest outstanding through each year presented:
Class I Shares | 2021* | 2020 | 2019 | 2018 | 2017 | 2016 | |||||||||||||||||||||
Net asset value, beginning of year | $ | 27.18 | $ | 28.56 | $ | 22.98 | $ | 27.41 | $ | 23.90 | $ | 19.42 | |||||||||||||||
Income from investment operations: | |||||||||||||||||||||||||||
Net investment income1 | 0.14 | 0.27 | 0.24 | 0.13 | 0.11 | 0.17 | |||||||||||||||||||||
Net realized and unrealized gain (loss) on investments | 5.77 | (0.22 | ) | 6.50 | (4.13 | ) | 3.45 | 5.08 | |||||||||||||||||||
| Total income (loss) from investment operations | 5.91 | 0.05 | 6.74 | (4.00 | ) | 3.56 | 5.25 | ||||||||||||||||||||
Less distributions: | |||||||||||||||||||||||||||
From net investment income | — | (0.31 | ) | (0.24 | ) | (0.08 | ) | (0.05 | ) | (0.14 | ) | ||||||||||||||||
From net realized gain on investments | — | (1.12 | ) | (0.92 | ) | (0.35 | ) | — | (0.63 | ) | |||||||||||||||||
Total distributions | — | (1.43 | ) | (1.16 | ) | (0.43 | ) | (0.05 | ) | (0.77 | ) | ||||||||||||||||
Net asset value, end of year | $ | 33.09 | $ | 27.18 | $ | 28.56 | $ | 22.98 | $ | 27.41 | $ | 23.90 | |||||||||||||||
Total return2 | 21.74 | %6 | 0.35 | % | 29.49 | % | -14.72 | % | 14.95 | %3 | 27.01 | % | |||||||||||||||
Supplemental data and ratios: | |||||||||||||||||||||||||||
Net assets, end of year (in thousands) | $ | 97,115 | $ | 67,346 | $ | 97,936 | $ | 104,664 | $ | 80,979 | $ | 42,003 | |||||||||||||||
Ratios to average net assets | |||||||||||||||||||||||||||
Gross expenses | 1.09 | %7 | 1.17 | % | 1.09 | % | 1.06 | % | 1.11 | % | 1.18 | % | |||||||||||||||
Net Expenses4 | 1.097 | 1.17 | 1.09 | 1.06 | 1.105 | 1.055 | |||||||||||||||||||||
Net investment income | 0.887 | 1.14 | 0.92 | 0.49 | 0.44 | 0.84 | |||||||||||||||||||||
Portfolio turnover rate | 3 | %6 | 2 | % | 8 | % | 18 | % | 4 | % | 8 | % | |||||||||||||||
* For the six months ended June 30, 2021 (unaudited).
1 Per share amounts have been calculated using the average shares method.
2 Performance figures may reflect fee waivers and/or expense reimbursements. In the absence of fee waivers and/or expense reimbursements, the total return would have been lower. Past performance is no guarantee of future results.
3 Total return reflects adjustments to conform to generally accounting principles.
4 Effective April 30, 2017, the advisor agreed to limit the ratio of expenses, other than brokerage, interest, taxes, extraordinary expenses and acquired fund fees and expenses, to 1.25% of the average net assets of Class I shares. See Note 3. This expense limitation arrangement cannot be terminated prior to April 30, 2022 without the Board of Trustees' consent. Prior to April 30, 2017, this limitation was 1.05%.
5 Reflects fee waivers and/or expense reimbursements.
6 Not annualized.
7 Annualized.
The Accompanying Notes are an Integral Part of these Financial Statements.
1919 Funds 2021 Semi-Annual Report
15
1919 Maryland Tax-Free Income Fund
Letter to Shareholders
Dear Shareholder,
Tax-free bonds posted positive, albeit modest, returns in the first half of 2021, outperforming all other investment grade fixed income sectors which generally suffered wide-spread losses. For the six month period ended June 30, the 1919 Maryland Tax-Free Bond Fund returned 0.59% (I-shares). Due to our conservative positioning in anticipation of higher interest rates, the Fund underperformed its primary benchmark, the Bloomberg Barclay's Municipal Bond Index, by 0.47%. While yields did grind meaningfully higher for taxable fixed income securities (as evidenced by the 1.60% loss for the Bloomberg Barclay's Aggregate Bond index), municipals benefited from a unique technical backdrop which kept yields low. For example, the yield on AAA-rated munis maturing in ten-years rose 0.28% to a still historically low 0.99% over the period, and peaked at 1.47% in March. In comparison, the yield on the benchmark ten-year Treasury note surged 0.56% year-to-date to 1.47%, and touched a high of 1.74% in March. The result is historically rich relative valuations in a setting of low absolute interest rates.
The extreme valuations and seemingly unattractive interest rate environment are surprising to us in the context of eye-popping inflation data and surging GDP growth as we emerge from the pandemic. Despite what normally would be headwinds to the sector, the municipal bond market instead has attracted persistently strong inflows in 2021. Concerns about rising taxes, a search for relative yield, and the idea that states and municipalities will benefit from the Biden administration's infrastructure bill all fueled investor interest in municipal obligations. Meanwhile, credit quality concerns abated as the generous aid to local governments poured in despite tax revenues surprising on the upside, primarily due to a hot housing market which bolsters property taxes. A strong equity market generating capital gain receipts also underpinned revenues as other revenue sources from sales and use taxes recover from reopening. As a result, buying was relentless and seemingly price-indiscriminate, and municipal mutual funds ended the month of June with 18 straight weeks of net inflows.
Unfortunately, the supply of new issues is not keeping up with the new money coming into the market. In fact, even excluding money freshly allocated to munis, supply remains persistently
1919 Funds 2021 Semi-Annual Report
16
behind the amount of reinvestment required from coupons and maturing securities. While low interest rates create a constructive backdrop for borrowers, we are not surprised at the tepid pace of new issue volume. The volume of bond sales has suffered since the 2017 Tax Cuts and Jobs Act, which eliminated the popular practice of issuing new bonds to advance refund previously issued, higher yielding debt. The pandemic response further aggravated the situation, as few municipalities were eager to borrow in the middle of a deep recession with federal support being uncertain for much of the election cycle. More recently, the ongoing debate of the form, size and timing of the infrastructure bill is keeping projects on the shelf, since federal funds may diminish the borrowing needs for coming capital projects.
With greater clarity on the last two obstacles, we expect volume to increase accordingly. Also, despite Treasury yields surprisingly moving down of late, we expect investors will eventually pull back from fixed income securities given current yields net of inflation are sharply negative. While we believe inflation will come off the boil as supply chain disruptions resolve, we still expect elevated levels versus recent experience to force the Federal Reserve to trim its $120 billion of monthly bond purchases, which will allow yields to move higher unless the Delta variant forces shutdowns this fall. Specific to tax-free bonds, valuations are such that buying Treasury bonds and paying taxes often generate a similar after-tax returns versus munis with less risk, even assuming higher tax rates in the future. Clearly our defensive, short-maturity
positioning hindered the Fund's relative returns in the most recent reporting period. Regardless, we still believe the risks favor a focus on capital preservation as we look for better entry points in what we expect will be a challenging, albeit higher yielding, environment for the balance of the year.
Sincerely,

R. Scott Pierce, CFA
Portfolio Manager
1919 Investment Counsel, LLC

Lauren K. Webb, CFA
Portfolio Manager
1919 Investment Counsel, LLC
Past performance is not a guarantee of future results.
Opinions expressed herein are as of 6/30/21 and are subject to change at any time, are not a guaranteed and should not be considered investment advice.
Fund holdings and sector allocations are subject to change and are not a recommendation to buy or sell any security. Please refer to the Schedule of Investments for a complete list of Fund holdings.
This report has been prepared for shareholders and may be distributed to others if preceded or accompanied by a current prospectus.
Mutual fund investing involves risk; Principal loss is possible. Bonds are
1919 Funds 2021 Semi-Annual Report
17
1919 Maryland Tax-Free Income Fund
Letter to shareholders (cont'd)
subject to a variety of risks, including interest rate, credit and inflation risks. As interest rates rise, bond prices fall, reducing the value of a fixed-income investment. Municipal securities purchased by the Fund may be adversely affected by changes in the financial condition of municipal issuers and insurers, regulatory and political developments, uncertainties and public perceptions, and other factors. The Fund is non-diversified, meaning it concentrates its assets in fewer individual holdings than a diversified fund, specifically in the State of Maryland issues. The Fund is susceptible to adverse economic, political, tax, or regulatory changes specific to Maryland, which may magnify other risks and make the Fund more volatile than a municipal bond fund that invests in more than one state. Income from tax-exempt funds may become subject to state and local taxes and a portion of income may be subject to the Federal Alternative minimum tax for certain investors. Please see the Fund's prospectus for a more complete discussion of these and other risks, and the Fund's investment strategies.
Nothing contained in this communication constitutes tax or investment advice.
Investors must consult their tax advisor for advice and information concerning their particular situation.
1919 Funds are distributed by Quasar Distributors, LLC.
Bloomberg Barclays Municipal Bond Index is an unmanaged index that is considered representative of the broad market for investment grade, tax-exempt bonds with a
maturity of at least one year. One cannot invest in an index.
Investment grade is a rating that indicates that a municipal or corporate bond has a relatively low risk of default.
1919 Funds 2021 Semi-Annual Report
18
Fund performance (unaudited)
Total Returns* as of June 30, 2021
6 Months | |||||||
1919 Maryland Tax-Free Income Fund | |||||||
With Sales Charges† | |||||||
Class A | -3.82 | % | |||||
Class C | -0.82 | ||||||
Without Sales Charges | |||||||
Class A | 0.45 | ||||||
Class C | 0.18 | ||||||
Class I | 0.59 | ||||||
Bloomberg Barclays Municipal Bond Index(i) | 1.06 | ||||||
† Class A Shares have a maximum initial sales charge of 4.25% and Class C Shares have a contingent deferred sales charge (CDSC) of 1.00% for shares redeemed within one year of purchase.
As of the Fund's current prospectus dated April 30, 2021, the total gross annual operating expense ratios for Class A, Class C and Class I were 1.09%, 1.62% and 0.96%, respectively. The total net annual operating expense ratios for Class A, Class C and Class I were 0.75%(ii), 1.30%(ii) and 0.60%(ii), respectively. Actual expenses may be higher. For example, expenses may be higher than those shown if average net assets decrease. Net assets are more likely to decrease and Fund expense ratios are more likely to increase when markets are volatile.
All figures represent past performance and are not a guarantee of future results. Investment return and principal value of an investment will fluctuate so that an investor's shares, when redeemed, may be worth more or less than their original cost. Fund returns assume the reinvestment of all distributions, at net asset value and the deduction of all Fund expenses. Total returns do not reflect the deduction of taxes that a shareholder would pay on Fund distributions or the redemption of Fund shares. Performance figures may reflect fee waivers and/or expense reimbursements. In the absence of fee waivers and/or expense reimbursements, the total return would have been lower. Current performance of the Fund may be lower or higher than the performance quoted. Performance data current to the most recent month end may be obtained by calling 1-844-828-1919.
(i) The Bloomberg Barclays Municipal Bond Index is a market value weighted index of investment grade municipal bonds with maturities of one year or more. The Index was previously named the Barclays Municipal Bond Index.
(ii) The Adviser has contractually agreed to waive fees and reimburse operating expenses through April 30, 2022.
The Indices are unmanaged and are not subject to the same management and trading expenses as a mutual fund. Please note that an investor cannot invest directly in an index.
1919 Funds 2021 Semi-Annual Report
19
Fund expenses (unaudited)
Example
As a shareholder of the Fund, you may incur two types of costs: (1) transaction costs, including front-end and back-end sales charges (loads) on purchase payments; and (2) ongoing costs, including management fees; service and/or distribution (12b-1) fees; and other Fund expenses. This example is intended to help you understand your ongoing costs (in dollars) of investing in the Fund and to compare these costs with the ongoing costs of investing in other mutual funds.
This example is based on an investment of $1,000 invested on January 1, 2021 and held for the six months ended June 30, 2021.
Actual expenses
The table below titled "Based on Actual Total Return" provides information about actual account values and actual expenses. You may use the information provided in this table, together with the amount you invested, to estimate the expenses that you paid over the period. To estimate the expenses you paid on your account, divide your ending account value by $1,000 (for example, an $8,600 ending account value divided by $1,000 = 8.6), then multiply the result by the number under the heading entitled "Expenses Paid During the Period".
Hypothetical example for comparison purposes
The table below titled "Based on Hypothetical Total Return" provides information about hypothetical account values and hypothetical expenses based on the actual expense ratio and an assumed rate of return of 5.00% per year before expenses, which is not the Fund's actual return. The hypothetical account values and expenses may not be used to estimate the actual ending account balance or expenses you paid for the period. You may use the information provided in this table to compare the ongoing costs of investing in the Fund and other funds. To do so, compare the 5.00% hypothetical example relating to the Fund with the 5.00% hypothetical examples that appear in the shareholder reports of the other funds.
Please note that the expenses shown in the table below are meant to highlight your ongoing costs only and do not reflect any transactional costs. Therefore, the table is useful in comparing ongoing costs only, and will not help you determine the relative total costs of owning different funds. In addition, if these transaction costs were included, your costs would have been higher.
Based on actual total return1
| Actual Total Return2 | Beginning Account Value | Ending Account Value | Annualized Expense Ratio | Expenses Paid During the Period3 | |||||||||||||||||||
Class A | 0.45 | % | $ | 1,000.00 | $ | 1,004.50 | 0.75 | % | $ | 3.73 | |||||||||||||
Class C | 0.18 | 1,000.00 | 1,001.80 | 1.30 | 6.45 | ||||||||||||||||||
Class I | 0.59 | 1,000.00 | 1,005.90 | 0.60 | 2.98 | ||||||||||||||||||
Based on hypothetical total return1
| Hypothetical Annualized Total Return | Beginning Account Value | Ending Account Value | Annualized Expense Ratio | Expenses Paid During the Period3 | |||||||||||||||||||
Class A | 2.48 | % | $ | 1,000.00 | $ | 1,021.08 | 0.75 | % | $ | 3.76 | |||||||||||||
Class C | 2.48 | 1,000.00 | 1,018.35 | 1.30 | 6.51 | ||||||||||||||||||
Class I | 2.48 | 1,000.00 | 1,021.82 | 0.60 | 3.01 | ||||||||||||||||||
1 The six months ended June 30, 2021.
2 Assumes the reinvestment of all distributions at net asset value and does not reflect the deduction of the applicable sales charge with respect to Class A shares or the applicable contingent deferred sales charge ("CDSC") with respect to Class C shares. Total return is not annualized, as it may not be representative of the total return for the year. Performance figures may reflect compensating balance arrangements, fee waivers and/or expense reimbursements. In the absence of fee waivers and/or expense reimbursements, the total return would have been lower.
3 Expenses (net of fee waivers and/or expense reimbursements) are equal to each class' annualized expense ratio multiplied by the average account value over the period, multiplied by the number of days in the most recent fiscal half-year (181), then divided by 365.
1919 Funds 2021 Semi-Annual Report
20
Fund at a glance (unaudited)
Investment breakdown (%) as a percent of total investments

1919 Funds 2021 Semi-Annual Report
21
Schedule of investments
June 30, 2021 (Unaudited)
1919 Maryland Tax-Free Income Fund
Rate | Maturity Date | Face Amount | Value | ||||||||||||||||
Municipal Bonds — 93.0% | |||||||||||||||||||
Education — 15.7% | |||||||||||||||||||
Maryland Stadium Authority | 5.000 | % | 5/1/42 | $ | 2,000,000 | $ | 2,482,798.00 | ||||||||||||
Maryland State EDC, Student Housing Revenue Bonds: | |||||||||||||||||||
Maryland Economic Development Corp. | 5.000 | % | 7/1/36 | 250,000 | 276,534 | ||||||||||||||
Salisbury University Project | 5.000 | % | 6/1/27 | 455,000 | 486,985 | ||||||||||||||
Senior Morgan State University Project | 5.000 | % | 7/1/27 | 1,870,000 | 1,954,755 | ||||||||||||||
University of Maryland, College Park Projects | 5.000 | % | 7/1/31 | 500,000 | 552,282 | ||||||||||||||
Maryland State Health & Higher EFA Revenue Bonds: | |||||||||||||||||||
College of Notre Dame of Maryland | 4.000 | % | 10/1/25 | 1,645,000 | 1,647,549 | ||||||||||||||
Good Samaritan Hospital of Maryland (a) | 0.020 | % | 4/1/35 | 2,400,000 | 2,400,000 | ||||||||||||||
Good Samaritan Hospital of Maryland (a) | 0.030 | % | 4/1/35 | 1,600,000 | 1,600,000 | ||||||||||||||
Johns Hopkins University | 5.000 | % | 7/1/21 | 2,000,000 | 2,000,000 | ||||||||||||||
Maryland Institute College of Art | 4.000 | % | 6/1/42 | 250,000 | 273,710 | ||||||||||||||
Stevenson University | 4.000 | % | 6/1/34 | 500,000 | 586,807 | ||||||||||||||
Total Education | 14,261,420 | ||||||||||||||||||
Health Care — 31.8% | |||||||||||||||||||
County of Baltimore, Maryland | |||||||||||||||||||
Oak Crest Village Inc. | 5.000 | % | 1/1/30 | 495,000 | 574,235 | ||||||||||||||
Oak Crest Village Inc. | 4.000 | % | 1/1/40 | 500,000 | 566,411 | ||||||||||||||
Riderwood Village Obligated Group | 4.000 | % | 1/1/45 | 1,000,000 | 1,116,741 | ||||||||||||||
County of Prince George's, MD, COPS | 3.000 | % | 10/1/31 | 2,500,000 | 2,764,894 | ||||||||||||||
Maryland State EDC, Howard Hughes Medical Institute (a) | 0.030 | % | 2/15/43 | 3,100,000 | 3,100,000 | ||||||||||||||
Maryland State Health & Higher EFA Revenue Bonds: | |||||||||||||||||||
Adventist Rehabilitation Hospital | 5.500 | % | 1/1/27 | 1,250,000 | 1,533,833 | ||||||||||||||
Broadmead Inc. | 4.250 | % | 7/1/40 | 1,150,000 | 1,291,268 | ||||||||||||||
Carroll Hospital Center Inc. | 5.000 | % | 7/1/21 | 1,005,000 | 1,005,000 | ||||||||||||||
Greater Baltimore Medical Center Inc. (a) | 0.150 | % | 7/1/25 | 600,000 | 600,000 | ||||||||||||||
Helix Health Issue, AMBAC | 5.250 | % | 8/15/38 | 3,000,000 | 4,094,319 | ||||||||||||||
James Lawrence Kernan Hospital (a) | 0.020 | % | 7/1/41 | 4,520,000 | 4,520,000 | ||||||||||||||
Luminis Health Obligated Group (a) | 0.030 | % | 7/1/43 | 1,000,000 | 1,000,000 | ||||||||||||||
MedStar Health Obligated Group | 5.000 | % | 5/15/42 | 2,000,000 | 2,449,094 | ||||||||||||||
Refunding, Mercy Ridge | 4.750 | % | 7/1/34 | 3,200,000 | 3,205,002 | ||||||||||||||
UPMC Obligated Group | 4.000 | % | 4/15/45 | 1,000,000 | 1,173,019 | ||||||||||||||
Total Health Care | 28,993,816 | ||||||||||||||||||
Housing — 6.4% | |||||||||||||||||||
| Maryland Community Development Administration Local Government Infrastructure | 4.000 | % | 6/1/47 | 1,000,000 | 1,127,172 | ||||||||||||||
| Maryland State Community Development Administration, Department of Housing and Community Development: | |||||||||||||||||||
Bolton North LP | 3.350 | % | 9/15/34 | 1,000,000 | 1,079,622 | ||||||||||||||
Kirkwood House Preservation LP (a) | 0.030 | % | 12/1/38 | 1,800,000 | 1,800,000 | ||||||||||||||
1919 Funds 2021 Semi-Annual Report
22
1919 Maryland Tax-Free Income Fund
Rate | Maturity Date | Face Amount | Value | ||||||||||||||||
Housing — continued | |||||||||||||||||||
Montgomery County Housing Opportunites Commission | 3.050 | % | 7/1/44 | $ | 1,000,000 | $ | 1,070,829 | ||||||||||||
Montgomery County Housing Opportunities Commission (a) | 0.050 | % | 1/1/49 | 750,000 | 750,000 | ||||||||||||||
Total Housing | 5,827,623 | ||||||||||||||||||
Industrial Revenue — 0.5% | |||||||||||||||||||
| Maryland EDC, EDR, Lutheran World Relief Inc. and Immigration and Refugee Service | 5.250 | % | 4/1/29 | 480,000 | 481,542 | ||||||||||||||
Total Industrial Revenue | 481,542 | ||||||||||||||||||
Leasing — 1.1% | |||||||||||||||||||
| Montgomery County, MD, Lease Revenue, Metrorail Garage Project | 5.000 | % | 6/1/24 | 1,000,000 | 1,002,396 | ||||||||||||||
Total Leasing | 1,002,396 | ||||||||||||||||||
Local General Obligation — 13.7% | |||||||||||||||||||
| Anne Arundel County, Maryland, GO Bonds, Water & Sewer | 4.000 | % | 4/1/27 | 1,150,000 | 1,222,505.00 | ||||||||||||||
County of Baltimore, Maryland | 5.000 | % | 3/1/30 | 1,000,000 | 1,231,493 | ||||||||||||||
County of Howard, Maryland | 4.000 | % | 8/15/45 | 2,000,000 | 2,398,926 | ||||||||||||||
County of Montgomery, Maryland (a) | 0.030 | % | �� | 11/1/37 | 3,625,000 | 3,625,000 | |||||||||||||
County of Prince George's, Maryland | 5.000 | % | 7/15/40 | 1,750,000 | 2,197,515 | ||||||||||||||
State of Maryland | 4.000 | % | 8/1/29 | 500,000 | 536,202 | ||||||||||||||
State of Maryland | 5.000 | % | 3/15/31 | 1,000,000 | 1,238,931 | ||||||||||||||
Total Local General Obligation | 12,450,572 | ||||||||||||||||||
Pre-Refunded/Escrowed to Maturity (b) — 8.0% | |||||||||||||||||||
| City of Baltimore, Maryland, Mayor and City Council of Baltimore, Project and Refunding Revenue Bonds, Water Projects | 5.000 | % | 7/1/24 | 3,800,000 | 4,106,561 | ||||||||||||||
| Howard County, Maryland, GO Bonds, Consolidated Public Improvement Project and Refunding Bonds | 3.000 | % | 2/15/29 | 3,000,000 | 3,136,241 | ||||||||||||||
Total Pre-Refunded/Escrowed to Maturity | 7,242,802 | ||||||||||||||||||
Public Services — 0.2% | |||||||||||||||||||
| Maryland State Stadium Authority Sports Facilities Lease Revenue (a) | 0.020 | % | 3/1/26 | 200,000 | 200,000 | ||||||||||||||
Total Leasing | 200,000 | ||||||||||||||||||
Transporatation — 8.6% | |||||||||||||||||||
| Maryland Economic Development Corp., Air Cargo Obligated Group | 4.000 | % | 7/1/44 | 1,795,000 | 2,073,895 | ||||||||||||||
| Maryland State Department of Transportation, Consolidated Transportation Revenue Bonds | 4.000 | % | 5/1/30 | 3,000,000 | 3,586,692 | ||||||||||||||
| Maryland State Transportation Authority Transportation Facilities Project Revenue | 3.000 | % | 7/1/31 | 2,000,000 | 2,201,216 | ||||||||||||||
Total Transporatation | 7,861,803 | ||||||||||||||||||
1919 Funds 2021 Semi-Annual Report
23
Schedule of investments (cont'd)
June 30, 2021 (Unaudited)
1919 Maryland Tax-Free Income Fund
Rate | Maturity Date | Face Amount | Value | ||||||||||||||||
Water & Sewer — 7.0% | |||||||||||||||||||
| City of Baltimore, Maryland, Mayor and City Council of Baltimore, Project and Refunding Revenue Bonds: | |||||||||||||||||||
Wastewater Projects, FGIC | 5.000 | % | 7/1/22 | $ | 615,000 | $ | 630,236 | ||||||||||||
Water Projects, FGIC | 5.000 | % | 7/1/24 | 615,000 | 629,758 | ||||||||||||||
| Washington Suburban Sanitary District, Maryland, Montgomery and Prince George's Counties, Water Supply Refunding Bonds (a) | 0.020 | % | 6/1/23 | 3,950,000 | 3,950,000 | ||||||||||||||
| Washington Suburban Sanitary District, Maryland, Montgomery and Prince George's Counties, Water Supply Refunding Bonds | 5.000 | % | 6/1/37 | 1,000,000 | 1,210,187 | ||||||||||||||
Total Water & Sewer | 6,420,181 | ||||||||||||||||||
Total Municipal Bonds (Cost $78,843,476) | 84,742,155 | ||||||||||||||||||
| Investments in Securities at Value — 93.0% (Cost — $78,843,476) | 84,742,155 | ||||||||||||||||||
Other Assets in Excess of Liabilities — 7.0% | 6,409,716 | ||||||||||||||||||
Total Net Assets — 100.0% | $ | 91,151,871 | |||||||||||||||||
(a) Variable rate security. Rate is determined on a periodic basis by Remarketing Agents to make a market for the bonds. Interest rate disclosed is rate at period end.
(b) Pre-Refunded bonds are escrowed with U.S. government obligations and/or U.S. government agency securities and are considered by the manager to be triple-A rated even if issuer has not applied for new ratings.
Abbreviations used in this schedule:
AMBAC — American Municipal Bond Assurance Corporation — Insured Bonds
COPS — Community Oriented Policing Services
EDC — Economic Development Corporation
EDR — Economic Development Revenue
EFA — Educational Facilities Authority
FGIC — Financial Guaranty Insurance Company — Insured Bonds
GO — General Obligation
LP — Limited Partnership
1919 Funds 2021 Semi-Annual Report
24
1919 Maryland Tax-Free Income Fund
Ratings table*
Standard & Poor's/Moody's/Fitch** | |||||||
AAA/Aaa | 36.2 | % | |||||
AA/Aa | 33.2 | ||||||
A | 17.4 | ||||||
BBB/Baa | 12.2 | ||||||
BB/Bb | 1.0 | ||||||
100.0 | % | ||||||
* As a percentage of total investments.
** The ratings shown are based on each portfolio security's rating as determined by Standard & Poor's, Moody's or Fitch, each a Nationally Recognized Statistical Rating Organization ("NRSRO"). These ratings are the opinions of the NRSRO and are not measures of quality or guarantees of performance. Securities may be rated by other NRSROs, and these ratings may be higher or lower. In the event that a security is rated by multiple NRSROs and receives different ratings, the Fund will treat the security as being rated in the highest rating category received from a NRSRO.
The Accompanying Notes are an Integral Part of these Financial Statements.
1919 Funds 2021 Semi-Annual Report
25
1919 Maryland Tax-Free Income Fund
Statement of assets and liabilities
June 30, 2021 (Unaudited)
Assets: | |||||||
Investments in securities at value (cost $78,843,476) | $ | 84,742,155 | |||||
Cash | 5,830,243 | ||||||
Receivable for Fund shares sold | 149,219 | ||||||
Interest receivable | 864,371 | ||||||
Prepaid expenses | 21,587 | ||||||
Total Assets | 91,607,575 | ||||||
Liabilities: | |||||||
Investments payable | 250,000 | ||||||
Payable for Fund shares repurchased | 75,745 | ||||||
Distributions to shareholders | 13,236 | ||||||
Advisory fees payable | 12,121 | ||||||
Distribution fees payable | 13,420 | ||||||
Accrued other expenses | 91,182 | ||||||
Total Liabilities | 455,704 | ||||||
Net Assets | $ | 91,151,871 | |||||
Components of Net Assets: | |||||||
Paid-in capital | $ | 87,841,364 | |||||
Total distributable earnings | 3,310,507 | ||||||
Net Assets | $ | 91,151,871 | |||||
Class A: | |||||||
Net Assets | $ | 57,784,636 | |||||
Shares Issued and Outstanding (unlimited shares authorized, no par value) | 3,647,353 | ||||||
Net Asset Value and Redemption Price | $ | 15.84 | |||||
Maximum Public Offering Price (based on maximum initial sales charge of 4.25%) | $ | 16.55 | |||||
Class C: | |||||||
Net Assets | $ | 5,978,204 | |||||
Shares Issued and Outstanding (unlimited shares authorized, no par value) | 377,331 | ||||||
Net Asset Value, Redemption Price* and Offering Price Per Share | $ | 15.84 | |||||
Class I: | |||||||
Net Assets | $ | 27,389,031 | |||||
Shares Issued and Outstanding (unlimited shares authorized, no par value) | 1,728,021 | ||||||
Net Asset Value, Redemption Price and Offering Price Per Share | $ | 15.85 | |||||
* Redemption price per share of Class C shares is NAV reduced by a 1.00% CDSC if shares are redeemed within one year of purchase (See Note 3).
The Accompanying Notes are an Integral Part of these Financial Statements.
1919 Funds 2021 Semi-Annual Report
26
1919 Maryland Tax-Free Income Fund
Statement of operations
For the Six Months Ended June 30, 2021
Investment Income: | |||||||
Interest Income | $ | 1,048,963 | |||||
Expenses: | |||||||
Advisory fees (Note 3) | 238,150 | ||||||
Distribution fees (Note 6) | 63,667 | ||||||
Administration and fund accounting fees (Note 3) | 57,444 | ||||||
Transfer agent fees and expenses (Note 3 & Note 6) | 53,610 | ||||||
Registration fees | 19,651 | ||||||
Legal fees | 11,623 | ||||||
Audit fees | 10,216 | ||||||
Trustees' fees (Note 3) | 7,752 | ||||||
Shareholder reporting fees | 5,605 | ||||||
Compliance fees (Note 3) | 3,080 | ||||||
Custody fees (Note 3) | 2,334 | ||||||
Insurance fees | 1,631 | ||||||
Miscellaneous | 5,495 | ||||||
Total Expenses | 480,258 | ||||||
Expenses waived by the Adviser (Note 3) | (156,792 | ) | |||||
Net Expenses | 323,466 | ||||||
Net Investment Income | 725,497 | ||||||
Realized and Unrealized Gain on Investments | |||||||
Net realized loss | (24,820 | ) | |||||
Net change in unrealized appreciation/depreciation | (266,983 | ) | |||||
Net Realized and Unrealized Loss on Investments | (291,803 | ) | |||||
Net Increase in Net Assets Resulting from Operations | $ | 433,694 | |||||
The Accompanying Notes are an Integral Part of these Financial Statements.
1919 Funds 2021 Semi-Annual Report
27
1919 Maryland Tax-Free Income Fund
Statements of changes in net assets
| For the Six Months Ended June 30, 2021 and the year ended December 31, | 2021 | 2020 | |||||||||
Increase in Net Assets From: | |||||||||||
Operations: | |||||||||||
Net investment income | $ | 725,497 | $ | 1,892,705 | |||||||
Net realized gain (loss) on investments | (24,820 | ) | 16,885 | ||||||||
Net change in unrealized appreciation/depreciation on investments | (266,983 | ) | 1,146,136 | ||||||||
Net Increase in Net Assets Resulting from Operations | 433,694 | 3,055,726 | |||||||||
Distributions to Shareholders: | |||||||||||
Class A | (456,067 | ) | (1,247,401 | ) | |||||||
Class C | (36,567 | ) | (124,987 | ) | |||||||
Class I | (232,861 | ) | (520,317 | ) | |||||||
Total Distributions to Shareholders | (725,495 | ) | (1,892,705 | ) | |||||||
Capital Transactions: | |||||||||||
Net proceeds from shares sold | 10,140,603 | 14,557,238 | |||||||||
Reinvestment of distributions | 643,829 | 1,654,461 | |||||||||
Cost of shares repurchased | (6,906,955 | ) | (13,960,344 | ) | |||||||
Net Increase in Net Assets from Capital Transactions | 3,877,477 | 2,251,355 | |||||||||
Total Increase in Net Assets | 3,585,676 | 3,414,376 | |||||||||
Net Assets: | |||||||||||
Beginning of period | 87,566,195 | 84,151,819 | |||||||||
End of period | $ | 91,151,871 | $ | 87,566,195 | |||||||
The Accompanying Notes are an Integral Part of these Financial Statements.
1919 Funds 2021 Semi-Annual Report
28
1919 Maryland Tax-Free Income Fund
Financial highlights
For a share of beneficial interest outstanding through each year presented.
Class A Shares | 2021* | 2020 | 2019 | 2018 | 2017 | 2016 | |||||||||||||||||||||
Net asset value, beginning of year | $ | 15.90 | $ | 15.68 | $ | 15.34 | $ | 15.63 | $ | 15.86 | $ | 16.15 | |||||||||||||||
Income (loss) from investment operations: | |||||||||||||||||||||||||||
Net investment income1 | 0.13 | 0.35 | 0.40 | 0.45 | 0.44 | 0.55 | |||||||||||||||||||||
Net realized and unrealized gain (loss) on investments | (0.05 | ) | 0.22 | 0.34 | (0.29 | ) | (0.23 | ) | (0.29 | ) | |||||||||||||||||
Total income from investment operations | 0.08 | 0.57 | 0.74 | 0.16 | 0.21 | 0.26 | |||||||||||||||||||||
Less distributions: | |||||||||||||||||||||||||||
From net investment income | (0.14 | ) | (0.35 | ) | (0.40 | ) | (0.45 | ) | (0.44 | ) | (0.55 | ) | |||||||||||||||
Total distributions | (0.14 | ) | (0.35 | ) | (0.40 | ) | (0.45 | ) | (0.44 | ) | (0.55 | ) | |||||||||||||||
Net asset value, end of year | $ | 15.84 | $ | 15.90 | $ | 15.68 | $ | 15.34 | $ | 15.63 | $ | 15.86 | |||||||||||||||
Total return2 | 0.45 | %4 | 3.70 | % | 4.87 | % | 1.04 | % | 1.34 | % | 1.59 | % | |||||||||||||||
Supplemental data and ratios: | |||||||||||||||||||||||||||
Net assets, end of year (in thousands) | $ | 57,785 | $ | 55,439 | $ | 57,000 | $ | 55,710 | $ | 69,068 | $ | 88,823 | |||||||||||||||
Ratios to average net assets | |||||||||||||||||||||||||||
Gross expenses | 1.11 | %5 | 1.09 | % | 1.07 | % | 1.04 | % | 0.97 | % | 0.95 | % | |||||||||||||||
Net expenses3 | 0.755 | 0.75 | 0.754 | 0.75 | 0.75 | 0.75 | |||||||||||||||||||||
Net investment income | 1.675 | 2.24 | 2.57 | 2.92 | 2.80 | 3.39 | |||||||||||||||||||||
Portfolio turnover rate | 12 | %4 | 27 | % | 21 | % | 43 | % | 23 | % | 25 | % | |||||||||||||||
* For the six months ended June, 2021 (unaudited)
1 Per share amounts have been calculated using the average shares method.
2 Performance figures, exclusive of sales charges, may reflect fee waivers and/or expense reimbursements. In the absence of fee waivers and/or expense reimbursements, the total return would have been lower. Past performance is no guarantee of future results.
3 The Adviser agreed to limit the ratio of expenses, other than brokerage, interest, taxes, extraordinary expenses and acquired fund fees and expenses, to 0.75% of the average net assets of Class A shares. This expense limitation arrangement cannot be terminated prior to April 30, 2022 without the Board of Trustees' consent. See Note 3.
4 Not Annualized.
5 Annualized.
The Accompanying Notes are an Integral Part of these Financial Statements.
1919 Funds 2021 Semi-Annual Report
29
1919 Maryland Tax-Free Income Fund
Financial highlights (cont'd)
For a share of beneficial interest outstanding through each year presented.
Class C Shares | 2021* | 2020 | 2019 | 2018 | 2017 | 2016 | |||||||||||||||||||||
Net asset value, beginning of year | $ | 15.90 | $ | 15.68 | $ | 15.34 | $ | 15.63 | $ | 15.86 | $ | 16.15 | |||||||||||||||
Income (loss) from investment operations: | |||||||||||||||||||||||||||
Net investment income1 | 0.08 | 0.27 | 0.32 | 0.36 | 0.35 | 0.46 | |||||||||||||||||||||
Net realized and unrealized gain (loss) on investments | (0.04 | ) | 0.22 | 0.34 | (0.29 | ) | (0.23 | ) | (0.29 | ) | |||||||||||||||||
Total income from investment operations | 0.04 | 0.49 | 0.66 | 0.07 | 0.12 | 0.17 | |||||||||||||||||||||
Less distributions: | |||||||||||||||||||||||||||
From net investment income | (0.10 | ) | (0.27 | ) | (0.32 | ) | (0.36 | ) | (0.35 | ) | (0.46 | ) | |||||||||||||||
Total distributions | (0.10 | ) | (0.27 | ) | (0.32 | ) | (0.36 | ) | (0.35 | ) | (0.46 | ) | |||||||||||||||
Net asset value, end of year | $ | 15.84 | $ | 15.90 | $ | 15.68 | $ | 15.34 | $ | 15.63 | $ | 15.86 | |||||||||||||||
Total return2 | 0.18 | %4 | 3.13 | % | 4.29 | % | 0.49 | % | 0.78 | % | 1.03 | % | |||||||||||||||
Supplemental data and ratios: | |||||||||||||||||||||||||||
Net assets, end of year (in thousands) | $ | 5,978 | $ | 7,436 | $ | 7,875 | $ | 14,421 | $ | 17,562 | $ | 21,243 | |||||||||||||||
Ratios to average net assets | |||||||||||||||||||||||||||
Gross expenses | 1.64 | %5 | 1.62 | % | 1.61 | % | 1.59 | % | 1.54 | % | 1.52 | % | |||||||||||||||
Net expenses3 | 1.305 | 1.30 | 1.304 | 1.30 | 1.30 | 1.30 | |||||||||||||||||||||
Net investment income | 1.125 | 1.70 | 2.07 | 2.37 | 2.25 | 2.84 | |||||||||||||||||||||
Portfolio turnover rate | 12 | %4 | 27 | % | 21 | % | 43 | % | 23 | % | 25 | % | |||||||||||||||
* For the six months ended June, 2021 (unaudited).
1 Per share amounts have been calculated using the average shares method.
2 Performance figures, exclusive of sales charges, may reflect fee waivers and/or expense reimbursements. In the absence of fee waivers and/or expense reimbursements, the total return would have been lower. Past performance is no guarantee of future results.
3 The Adviser agreed to limit the ratio of expenses, other than brokerage, interest, taxes, extraordinary expenses and acquired fund fees and expenses, to 1.30% of the average net assets of Class C shares. This expense limitation arrangement cannot be terminated prior to April 30, 2022 without the Board of Trustees' consent. See Note 3.
4 Not Annualized.
5 Annualized.
The Accompanying Notes are an Integral Part of these Financial Statements.
1919 Funds 2021 Semi-Annual Report
30
For a share of beneficial interest outstanding through each year presented.
Class I Shares | 2021* | 2020 | 2019 | 2018 | 2017 | 2016 | |||||||||||||||||||||
Net asset value, beginning of year | $ | 15.90 | $ | 15.69 | $ | 15.35 | $ | 15.63 | $ | 15.87 | $ | 16.16 | |||||||||||||||
Income (loss) from investment operations: | |||||||||||||||||||||||||||
Net investment income1 | 0.17 | 0.38 | 0.42 | 0.47 | 0.46 | 0.57 | |||||||||||||||||||||
Net realized and unrealized gain (loss) on investments | (0.06 | ) | 0.21 | 0.34 | (0.28 | ) | (0.24 | ) | (0.29 | ) | |||||||||||||||||
Total income from investment operations | 0.11 | 0.59 | 0.76 | 0.19 | 0.22 | 0.28 | |||||||||||||||||||||
Less distributions: | |||||||||||||||||||||||||||
From net investment income | (0.16 | ) | (0.38 | ) | (0.42 | ) | (0.47 | ) | (0.46 | ) | (0.57 | ) | |||||||||||||||
Total distributions | (0.16 | ) | (0.38 | ) | (0.42 | ) | (0.47 | ) | (0.46 | ) | (0.57 | ) | |||||||||||||||
Net asset value, end of year | $ | 15.85 | $ | 15.90 | $ | 15.69 | $ | 15.35 | $ | 15.63 | $ | 15.87 | |||||||||||||||
Total return2 | 0.59 | %4 | 3.79 | % | 5.02 | % | 1.26 | % | 1.43 | % | 1.74 | % | |||||||||||||||
Supplemental data and ratios: | |||||||||||||||||||||||||||
Net assets, end of year (in thousands) | $ | 27,389 | $ | 24,691 | $ | 19,277 | $ | 14,256 | $ | 15,411 | $ | 15,849 | |||||||||||||||
Ratios to average net assets | |||||||||||||||||||||||||||
Gross expenses | 0.97 | %5 | 0.96 | % | 0.93 | % | 0.90 | % | 0.88 | % | 0.89 | % | |||||||||||||||
Net expenses3 | 0.605 | 0.60 | 0.604 | 0.60 | 0.60 | 0.60 | |||||||||||||||||||||
Net investment income | 1.825 | 2.38 | 2.69 | 3.06 | 2.94 | 3.54 | |||||||||||||||||||||
Portfolio turnover rate | 12 | %4 | 27 | % | 21 | % | 43 | % | 23 | % | 25 | % | |||||||||||||||
* For the six months ended June, 2021 (unaudited).
1 Per share amounts have been calculated using the average shares method.
2 Performance figures, exclusive of sales charges, may reflect fee waivers and/or expense reimbursements. In the absence of fee waivers and/or expense reimbursements, the total return would have been lower. Past performance is no guarantee of future results.
3 The Adviser agreed to limit the ratio of expenses, other than brokerage, interest, taxes, extraordinary expenses and acquired fund fees and expenses, to 0.60% of the average net assets of Class I shares. This expense limitation arrangement cannot be terminated prior to April 30, 2022 without the Board of Trustees' consent. See Note 3.
4 Not Annualized.
5 Annualized.
The Accompanying Notes are an Integral Part of these Financial Statements.
1919 Funds 2021 Semi-Annual Report
31
1919 Socially Responsive Balanced Fund
Letter to Shareholders
Dear Shareholder,
We are pleased to bring you the annual report on the 1919 Socially Responsive Balanced Fund ("the Fund") through June 30, 2021.
Throughout the first half of 2021, the Fund took a variety of measures to respond to changing market conditions. During the first half of the year we increased exposure to the Consumer Discretionary, Consumer Staples, Financials and Materials sectors and decreased exposure to the Information Technology sector.
The Fund is managed using socially responsible investment guidelines. An element of these guidelines is that the fund is invested using a "fossil free" approach whereby we do not invest in companies with a large carbon footprint and we seek to invest in companies that address the challenges of climate change. So far this year we have maintained overweight positions in the Consumer Discretionary, Consumer Staples, Health Care, Industrials, and Information Technology sectors and underweight positions in the Communication Services, Energy, Financials, Materials, and Utilities sectors.
During the first half of the year, the 10-year Treasury yield surged from 0.92% to 1.47% dragging bond returns into negative territory. The 10-year/2-year Treasury curve steepened by 42 basis points with the 10-year Treasury yield increase outpacing the 2-year Treasury yield rise. In the fixed-income portion of the Fund, we participated in several new deals with maturities ranging from 3- to 30-years with more of a focus in the 5-10 year area. The Fund continued to add green, social impact and sustainability bonds to further build out that segment of the portfolio. We maintained the overweight to corporate bonds based on solid credit fundamentals, the still low absolute level of Treasury yields and the Fed's unwavering support to the economy and employment.
In the equity portion of the Fund, our stock selection in the Information Technology, Consumer Staples, Health Care, and Utilities sectors contributed to relative performance in the year through June 30th. In terms of sector positioning, our overweighting in the Financials sector also enhanced results. On an individual stock basis, the largest contributors to performance
1919 Funds 2021 Semi-Annual Report
32
were Apple Inc., Alphabet Inc., Microsoft Corp., NVIDIA Corp., and Charles Schwab Corp.
In the fixed-income portion of the Fund, the leading contributor to performance was the underweight to Treasuries. On an individual security basis, the largest contributors to return were Mastercard Inc. 1.9% 3/15/31, Host Hotels & Resorts LP 3.375% 12/15/29, DTE Electric Co. 1.9% 4/1/28, US Treasury 2% 11/15/26 and Bank of America Corp. FRN 9/15/25.
In the equity portion of the Fund, our stock selection in the Industrials and Consumer Discretionary sectors detracted from relative results for the year to date. In terms of sector positioning, our underweighting of the Energy sector detracted from performance. On an individual stock basis, the largest detractors from performance were Clarivate PLC, Teleflex Inc., Beyond Meat Inc., Verisk Analytics Inc., and Steel Dynamics Inc.
In the fixed-income portion of the Fund, the leading detractor was the underweight to longer-dated corporates. On an individual security basis, the leading detractors to performance were Federal National Mortgage Association 0.875% 08/05/30, DTE Electric Co. 4.05% 05/15/48, Johnson Controls International PLC 1.75% 9/15/30, Union Electric Co. 2.625% 3/15/51 and Prologis Inc. 1.25% 10/15/30.
Thank you for your investment in the 1919 Socially Responsive Balanced Fund. As always, we appreciate that you have chosen us to manage your assets and we remain focused on achieving the Fund's investment and social goals.
Sincerely,

Ronald T. Bates
Portfolio Manager (Equity Portion)
1919 Investment Counsel, LLC

Aimee M. Eudy
Portfolio Manager (Fixed-Income Portion)
1919 Investment Counsel, LLC

Robert Huesman, CFA
Portfolio Manager (Equity Portion)
1919 Investment Counsel, LLC

Alison Bevilacqua
Portfolio Manager (Head of Social Research)
1919 Investment Counsel, LLC
Past performance is not a guarantee of future results.
Opinions expressed herein are as of 6/30/21 and are subject to change at any time, are not a guaranteed and should not be considered investment advice.
Fund holdings and sector allocations are subject to change and are not a recommendation to buy or sell any security. Please
1919 Funds 2021 Semi-Annual Report
33
1919 Socially Responsive Balanced Fund
Letter to shareholders (cont'd)
refer to the Schedule of Investments for a complete list of Fund holdings.
This report has been prepared for shareholders and may be distributed to other if preceded or accompanied by a current prospectus.
Mutual fund investing involves risk. Principal loss is possible. The Fund's social policy may cause it to make or avoid investments for social reasons when it is otherwise disadvantageous to do so. The Fund may invest in foreign and emerging market securities which will involve greater volatility and political, economic and currency risks and differences in accounting methods. The risks are particularly significant for funds that invest in emerging markets. The Fund may make short sales of securities, which involves the risk that losses may exceed the original amount invested. Fixed income securities involve interest rate, credit, inflation and reinvestment risks; and possible loss of principal. As interest rates rise, the value of fixed income securities falls. The Fund may focus its investments in certain regions or industries, increasing its vulnerability to market volatility. The manager's investment style may become out of favor and/or the manager's selection process may prove incorrect; which may have a negative impact on the Fund's performance.
1919 Funds are distributed by Quasar Distributors, LLC.
1919 Funds 2021 Semi-Annual Report
34
Fund performance (unaudited)
Total Returns* as of June 30, 2021
6 Months | |||||||
1919 Socially Responsive Balanced Fund | |||||||
With Sales Charges† | |||||||
Class A | 1.81 | % | |||||
Class C | 6.64 | ||||||
Without Sales Charges | |||||||
Class A | 8.02 | ||||||
Class C | 7.64 | ||||||
Class I | 8.18 | ||||||
S&P 500 Index(i) | 15.25 | ||||||
Bloomberg Barclays U.S. Aggregate Index(ii) | -1.60 | ||||||
| Blended S&P 500 Index (70%) and Bloomberg Barclays U.S. Aggregate Index (30%)(iii) | 9.99 | ||||||
† Class A Shares have a maximum initial sales charge of 5.75%. Class C Shares have a CDSC of 1.00% for shares redeemed within one year of purchase.
As of the Fund's current prospectus dated April 30, 2021, the total annual operating expense ratios for Class A, Class C and Class I were 1.16%, 1.82% and 0.83%, respectively. Actual expenses may be higher. For example, expenses may be higher than those shown if average net assets decrease. Net assets are more likely to decrease and Fund expense ratios are more likely to increase when markets are volatile.
All figures represent past performance and are not a guarantee of future results. Investment return and principal value of an investment will fluctuate so that an investor's shares, when redeemed, may be worth more or less than their original cost. Fund returns assume the reinvestment of all distributions, at net asset value and the deduction of all Fund expenses. Total returns do not reflect the deduction of taxes that a shareholder would pay on Fund distributions or the redemption of Fund shares. Performance figures may reflect fee waivers and/or expense reimbursements. In the absence of fee waivers and/or expense reimbursements, the total return would have been lower. Current performance of the Fund may be lower or higher than the performance quoted. Performance data current to the most recent month end may be obtained by calling 1-844-828-1919.
(i) The S&P 500 Index is an unmanaged index of 500 stocks and is generally representative of the performance of larger companies in the U.S.
(ii) The Bloomberg Barclays U.S. Aggregate Bond Index is a broad-based bond index comprised of government, corporate, mortgage and asset-backed issues, rated investment grade or higher, and having at least one year to maturity. The Index was previously named the Barclays Aggregate Bond Index.
(iii) The Blended S&P 500 Index (70%) and Bloomberg Barclays U.S. Aggregate Index (30%) has been prepared to parallel the targeted allocation of investments between equity and fixed-income securities. It consists of 70% of the performance of the S&P 500 Index and 30% of the Bloomberg Barclays U.S. Aggregate Index.
The Indices are unmanaged and are not subject to the same management and trading expenses as a mutual fund. Please note that an investor cannot invest directly in an index.
1919 Funds 2021 Semi-Annual Report
35
Fund expenses (unaudited)
Example
As a shareholder of the Fund, you may incur two types of costs: (1) transaction costs, including front-end and back-end sales charges (loads) on purchase payments; and (2) ongoing costs, including management fees; service and/or distribution (12b-1) fees; and other Fund expenses. This example is intended to help you understand your ongoing costs (in dollars) of investing in the Fund and to compare these costs with the ongoing costs of investing in other mutual funds.
This example is based on an investment of $1,000 invested on January 1, 2021 and held for the six months ended June 30, 2021.
Actual expenses
The table below titled "Based on Actual Total Return" provides information about actual account values and actual expenses. You may use the information provided in this table, together with the amount you invested, to estimate the expenses that you paid over the period. To estimate the expenses you paid on your account, divide your ending account value by $1,000 (for example, an $8,600 ending account value divided by $1,000 = 8.6), then multiply the result by the number under the heading entitled "Expenses Paid During the Period".
Hypothetical example for comparison purposes
The table below titled "Based on Hypothetical Total Return" provides information about hypothetical account values and hypothetical expenses based on the actual expense ratio and an assumed rate of return of 5.00% per year before expenses, which is not the Fund's actual return. The hypothetical account values and expenses may not be used to estimate the actual ending account balance or expenses you paid for the period. You may use the information provided in this table to compare the ongoing costs of investing in the Fund and other funds. To do so, compare the 5.00% hypothetical example relating to the Fund with the 5.00% hypothetical examples that appear in the shareholder reports of the other funds.
Please note that the expenses shown in the table below are meant to highlight your ongoing costs only and do not reflect any transactional costs. Therefore, the table is useful in comparing ongoing costs only, and will not help you determine the relative total costs of owning different funds. In addition, if these transaction costs were included, your costs would have been higher.
Based on actual total return1
| Actual Total Return2 | Beginning Account Value | Ending Account Value | Annualized Expense Ratio | Expenses Paid During the Period3 | |||||||||||||||||||
Class A | 8.02 | % | $ | 1,000.00 | $ | 1,080.20 | 0.98 | % | $ | 5.05 | |||||||||||||
Class C | 7.64 | 1,000.00 | 1,076.40 | 1.69 | 8.70 | ||||||||||||||||||
Class I | 8.18 | 1,000.00 | 1,081.80 | 0.71 | 3.66 | ||||||||||||||||||
Based on hypothetical total return1
| Hypothetical Annualized Total Return | Beginning Account Value | Ending Account Value | Annualized Expense Ratio | Expenses Paid During the Period3 | |||||||||||||||||||
Class A | 2.48 | % | $ | 1,000.00 | $ | 1,019.93 | 0.98 | % | $ | 4.91 | |||||||||||||
Class C | 2.48 | 1,000.00 | 1,016.34 | 1.69 | 8.45 | ||||||||||||||||||
Class I | 2.48 | 1,000.00 | 1,021.24 | 0.71 | 3.56 | ||||||||||||||||||
1 For the six months ended June 30, 2021.
2 Assumes the reinvestment of all distributions at net asset value and does not reflect the deduction of the applicable sales charge with respect to Class A shares or the applicable contingent deferred sales charge ("CDSC") with respect to Class C shares. Total return is not annualized, as it may not be representative of the total return for the year. Performance figures may reflect fee waivers and/or expense reimbursements. In the absence of fee waivers and/or expense reimbursements, the total return would have been lower.
3 Expenses (net of compensating balance arrangements, fee waivers and/or expense reimbursements) are equal to each class' annualized expense ratio multiplied by the average account value over the period, multiplied by the number of days in the most recent fiscal half-year (181), then divided by 365.
1919 Funds 2021 Semi-Annual Report
36
Fund at a glance (unaudited)
Investment breakdown (%) as a percent of total investments
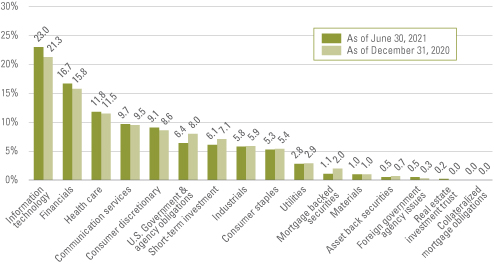
1919 Funds 2021 Semi-Annual Report
37
Schedule of investments
June 30, 2021 (unaudited)
1919 Socially Responsive Balanced Fund
Security | Shares | Value | |||||||||
Common Stocks — 67.2% | |||||||||||
Communication Services — 7.3% | |||||||||||
Alphabet Inc., Class A Shares * | 8,746 | $ | 21,355,895 | ||||||||
Facebook Inc., Class A * | 33,143 | 11,524,152 | |||||||||
Netflix Inc. * | 16,118 | 8,513,689 | |||||||||
Walt Disney Co/The * | 61,905 | 10,881,042 | |||||||||
Total Communication Services | 52,274,778 | ||||||||||
Consumer Discretionary — 6.9% | |||||||||||
Amazon.com Inc. * | 5,986 | 20,592,798 | |||||||||
Chipotle Mexican Grill Inc. * | 2,993 | 4,640,168 | |||||||||
Home Depot Inc/The | 32,918 | 10,497,221 | |||||||||
National Vision Holdings Inc. * | 95,978 | 4,907,355 | |||||||||
TJX Cos Inc. | 129,205 | 8,711,001 | |||||||||
Total Consumer Discretionary | 49,348,543 | ||||||||||
Consumer Staples — 5.1% | |||||||||||
Beyond Meat Inc. * | 23,013 | 3,624,317 | |||||||||
Costco Wholesale Corp. | 24,170 | 9,563,344 | |||||||||
Darling Ingredients Inc. * | 69,700 | 4,704,750 | |||||||||
Estee Lauder Cos. Inc., Class A Shares | 33,830 | 10,760,646 | |||||||||
PepsiCo Inc. | 54,573 | 8,086,082 | |||||||||
Total Consumer Staples | 36,739,139 | ||||||||||
Financials — 8.9% | |||||||||||
Bank of America Corp. | 398,623 | 16,435,226 | |||||||||
Charles Schwab Corp/The | 164,599 | 11,984,453 | |||||||||
Chubb Limited | 49,955 | 7,939,848 | |||||||||
CME Group Inc. | 37,983 | 8,078,225 | |||||||||
Hannon Armstrong Sustainable Infrastructure Capital Inc. | 112,962 | 6,342,816 | |||||||||
Truist Financial Corp. | 233,304 | 12,948,372 | |||||||||
Total Financials | 63,728,940 | ||||||||||
Health Care — 10.0% | |||||||||||
Boston Scientific Corp. * | 236,687 | 10,120,736 | |||||||||
Danaher Corp. | 46,738 | 12,542,610 | |||||||||
Genmab A/S * | 151,707 | 6,194,197 | |||||||||
IQVIA Holdings Inc. * | 42,589 | 10,320,167 | |||||||||
Teleflex Inc. | 25,323 | 10,174,528 | |||||||||
Thermo Fisher Scientific Inc. | 22,341 | 11,270,364 | |||||||||
UnitedHealth Group Inc. | 27,846 | 11,150,652 | |||||||||
Total Health Care | 71,773,254 | ||||||||||
1919 Funds 2021 Semi-Annual Report
38
1919 Socially Responsive Balanced Fund
Security | Shares | Value | |||||||||||||||||
Industrials — 4.9% | |||||||||||||||||||
Cintas Corp. | 26,474 | $ | 10,113,068 | ||||||||||||||||
Eaton Corp. PLC | 64,438 | 9,548,423 | |||||||||||||||||
Illinois Tool Works Inc. | 17,494 | 3,910,959 | |||||||||||||||||
Union Pacific Corp. | 36,136 | 7,947,390 | |||||||||||||||||
Verisk Analytics Inc., Class A | 23,001 | 4,018,735 | |||||||||||||||||
Total Industrials | 35,538,575 | ||||||||||||||||||
Information Technology — 20.8% | |||||||||||||||||||
Adobe Systems Inc. * | 14,499 | 8,491,194 | |||||||||||||||||
Apple Inc. | 167,819 | 22,984,490 | |||||||||||||||||
Autodesk Inc. * | 26,698 | 7,793,146 | |||||||||||||||||
Broadcom Inc. | 13,813 | 6,586,591 | |||||||||||||||||
Clarivate PLC * | 164,076 | 4,517,012 | |||||||||||||||||
Intuit Inc. | 16,346 | 8,012,319 | |||||||||||||||||
Microsoft Corp. | 96,457 | 26,130,201 | |||||||||||||||||
NVIDIA Corp. | 18,416 | 14,734,642 | |||||||||||||||||
Palo Alto Networks Inc. * | 17,044 | 6,324,176 | |||||||||||||||||
PayPal Holdings Inc. * | 41,008 | 11,953,012 | |||||||||||||||||
QUALCOMM Inc. | 40,292 | 5,758,936 | |||||||||||||||||
Salesforce.com Inc. * | 37,535 | 9,168,674 | |||||||||||||||||
SolarEdge Technologies Inc * | 26,624 | 7,358,075 | |||||||||||||||||
Visa Inc., Class A Shares | 39,829 | 9,312,817 | |||||||||||||||||
Total Information Technology | 149,125,285 | ||||||||||||||||||
Materials — 1.2% | |||||||||||||||||||
Steel Dynamics Inc. | 30,257 | 1,803,317 | |||||||||||||||||
Trex Co Inc. * | 66,497 | 6,796,658 | |||||||||||||||||
Total Materials | 8,599,975 | ||||||||||||||||||
Real Estate Investment Trusts (REITS) — 1.0% | |||||||||||||||||||
Prologis Inc. | 63,328 | 7,569,596 | |||||||||||||||||
Total Real Estate Investment Trusts (REITS) | 7,569,596 | ||||||||||||||||||
Utilities — 1.1% | |||||||||||||||||||
American Water Works Co. Inc. | 52,731 | 8,127,429 | |||||||||||||||||
Total Utilities | 8,127,429 | ||||||||||||||||||
Total Common Stocks (Cost — $313,470,917) | 482,825,514 | ||||||||||||||||||
Rate | Maturity Date | Face Amount | |||||||||||||||||
Asset Backed Securities — 0.5% | |||||||||||||||||||
World Omni Auto Receivables Trust 2021-B, A-3 | 0.420 | % | 6/15/26 | $ | 3,800,000 | 3,794,178 | |||||||||||||
Total Asset Backed Securities (Cost — $3,799,479) | 3,794,178 | ||||||||||||||||||
1919 Funds 2021 Semi-Annual Report
39
Schedule of investments (cont'd)
June 30, 2021 (unaudited)
1919 Socially Responsive Balanced Fund
Security | Rate | Maturity Date | Face Amount | Value | |||||||||||||||
Collateralized Mortgage Obligations — 0.0% | |||||||||||||||||||
| Federal National Mortgage Association (FNMA), 2001-53 CY | 4.000 | % | 6/25/41 | $ | 35,406 | $ | 39,008 | ||||||||||||
| Total Collateralized Mortgage Obligations (Cost — $35,886) | 39,008 | ||||||||||||||||||
Corporate Bonds — 18.1% | |||||||||||||||||||
Communication Services — 2.4% | |||||||||||||||||||
Alphabet Inc. | 0.450 | % | 8/15/25 | 1,500,000 | 1,486,602 | ||||||||||||||
AT&T Inc. | 0.900 | % | 3/25/24 | 2,730,000 | 2,736,271 | ||||||||||||||
AT&T Inc. | 4.450 | % | 4/1/24 | 425,000 | 464,373 | ||||||||||||||
AT&T Inc. | 2.300 | % | 6/1/27 | 1,350,000 | 1,398,890 | ||||||||||||||
AT&T Inc. | 4.350 | % | 3/1/29 | 465,000 | 539,224 | ||||||||||||||
AT&T Inc. | 2.750 | % | 6/1/31 | 1,250,000 | 1,301,520 | ||||||||||||||
Comcast Corp. | 3.375 | % | 2/15/25 | 210,000 | 228,157 | ||||||||||||||
Comcast Corp. | 5.650 | % | 6/15/35 | 600,000 | 813,801 | ||||||||||||||
Verizon Communications Inc. | 4.329 | % | 9/21/28 | 777,000 | 903,799 | ||||||||||||||
Verizon Communications Inc. | 3.875 | % | 2/8/29 | 410,000 | 466,718 | ||||||||||||||
Verizon Communications Inc. | 1.750 | % | 1/20/31 | 1,325,000 | 1,272,238 | ||||||||||||||
Verizon Communications Inc. | 4.500 | % | 8/10/33 | 350,000 | 419,194 | ||||||||||||||
Verizon Communications Inc. | 5.250 | % | 3/16/37 | 335,000 | 441,242 | ||||||||||||||
Walt Disney Co/The | 1.750 | % | 1/13/26 | 1,550,000 | 1,596,077 | ||||||||||||||
Walt Disney Co/The | 2.200 | % | 1/13/28 | 3,215,000 | 3,337,710 | ||||||||||||||
Total Communication Services | 17,405,816 | ||||||||||||||||||
Consumer Discretionary — 2.2% | |||||||||||||||||||
Amazon.com Inc. | 0.250 | % | 5/12/23 | 3,650,000 | 3,647,158 | ||||||||||||||
California Endowment/The | 2.498 | % | 4/1/51 | 1,700,000 | 1,646,820 | ||||||||||||||
Cintas Corp No 2 | 2.900 | % | 4/1/22 | 325,000 | 330,852 | ||||||||||||||
Ford Foundation/The | 2.415 | % | 6/1/50 | 1,000,000 | 965,559 | ||||||||||||||
Lowe's Cos Inc. | 1.300 | % | 4/15/28 | 2,100,000 | 2,047,169 | ||||||||||||||
Starbucks Corp. | 2.450 | % | 6/15/26 | 250,000 | 264,435 | ||||||||||||||
Starbucks Corp. | 2.250 | % | 3/12/30 | 1,255,000 | 1,272,963 | ||||||||||||||
Toyota Motor Credit Corp. | 0.450 | % | 7/22/22 | 2,115,000 | 2,121,345 | ||||||||||||||
Toyota Motor Credit Corp. | 1.350 | % | 8/25/23 | 740,000 | 755,044 | ||||||||||||||
Toyota Motor Credit Corp. | 1.125 | % | 6/18/26 | 965,000 | 963,522 | ||||||||||||||
Whirlpool Corp. | 2.400 | % | 5/15/31 | 1,775,000 | 1,793,571 | ||||||||||||||
Total Consumer Discretionary | 15,808,438 | ||||||||||||||||||
Consumer Staples — 0.2% | |||||||||||||||||||
PepsiCo Inc. | 3.100 | % | 7/17/22 | 390,000 | 399,824 | ||||||||||||||
PepsiCo Inc. | 3.500 | % | 3/19/40 | 575,000 | 659,181 | ||||||||||||||
Total Consumer Staples | 1,059,005 | ||||||||||||||||||
1919 Funds 2021 Semi-Annual Report
40
1919 Socially Responsive Balanced Fund
Security | Rate | Maturity Date | Face Amount | Value | |||||||||||||||
Financials — 6.1% | |||||||||||||||||||
Affiliated Managers Group Inc. | 3.300 | % | 6/15/30 | $ | 755,000 | $ | 816,928 | ||||||||||||
Allstate Corp/The | 1.450 | % | 12/15/30 | 1,345,000 | 1,285,418 | ||||||||||||||
Ares Capital Corp. | 3.875 | % | 1/15/26 | 1,825,000 | 1,957,315 | ||||||||||||||
| Bank of America Corp.(effective 9/25/2024, US SOFR + 0.91) (a) | 0.981 | % | 9/25/25 | 1,650,000 | 1,649,837 | ||||||||||||||
| Bank of America Corp. (effective 1/23/2025, 3M US LIBOR + 0.81%) (a) | 3.366 | % | 1/23/26 | 550,000 | 593,408 | ||||||||||||||
Bank of America Corp. (3M US LIBOR + 0.76%) (b) | 0.879 | % | 9/15/26 | 1,602,000 | 1,593,595 | ||||||||||||||
Bank of America Corp. | 4.183 | % | 11/25/27 | 525,000 | 588,783 | ||||||||||||||
Bank of Montreal | 1.850 | % | 5/1/25 | 1,000,000 | 1,034,917 | ||||||||||||||
Bank of New York Mellon Corp/The | 1.600 | % | 4/24/25 | 415,000 | 426,491 | ||||||||||||||
BlackRock Inc. | 3.250 | % | 4/30/29 | 455,000 | 509,423 | ||||||||||||||
BlackRock Inc. | 2.400 | % | 4/30/30 | 710,000 | 744,572 | ||||||||||||||
Boston Properties LP | 4.500 | % | 12/1/28 | 1,335,000 | 1,559,406 | ||||||||||||||
Citigroup Inc. | 4.500 | % | 1/14/22 | 592,000 | 605,522 | ||||||||||||||
Citigroup Inc. (effective 10/30/2023, US SOFR + 0.686) (a) | 0.776 | % | 10/30/24 | 2,200,000 | 2,205,918 | ||||||||||||||
Citigroup Inc. | 5.500 | % | 9/13/25 | 325,000 | 378,947 | ||||||||||||||
Citigroup Inc. (effective 6/3/2030, US SOFR + 2.107) (a) | 2.572 | % | 6/3/31 | 1,500,000 | 1,545,210 | ||||||||||||||
Crown Castle International Corp. | 1.050 | % | 7/15/26 | 2,050,000 | 2,005,011 | ||||||||||||||
Goldman Sachs Group Inc. | 0.481 | % | 1/27/23 | 2,750,000 | 2,751,645 | ||||||||||||||
Goldman Sachs Group Inc. | 3.500 | % | 11/16/26 | 1,830,000 | 1,992,329 | ||||||||||||||
Goldman Sachs Group Inc. | 2.600 | % | 2/7/30 | 1,250,000 | 1,299,186 | ||||||||||||||
Host Hotels & Resorts LP | 3.375 | % | 12/15/29 | 1,600,000 | 1,681,286 | ||||||||||||||
Intercontinental Exchange Inc. | 3.750 | % | 12/1/25 | 500,000 | 554,971 | ||||||||||||||
| JPMorgan Chase & Co. (effective 9/16/2023, US SOFR + 0.60) (a) | 0.653 | % | 9/16/24 | 2,000,000 | 2,001,826 | ||||||||||||||
MetLife Inc. | 4.550 | % | 3/23/30 | 660,000 | 792,809 | ||||||||||||||
PNC Financial Services Group Inc. | 2.200 | % | 11/1/24 | 975,000 | 1,023,722 | ||||||||||||||
Prudential Financial Inc. | 1.500 | % | 3/10/26 | 1,570,000 | 1,595,988 | ||||||||||||||
Simon Property Group LP | 3.375 | % | 12/1/27 | 510,000 | 556,523 | ||||||||||||||
State Street Corp. | 3.700 | % | 11/20/23 | 370,000 | 399,630 | ||||||||||||||
State Street Corp. | 3.550 | % | 8/18/25 | 360,000 | 398,848 | ||||||||||||||
| State Street Corp. (effective 11/1/2029, US SOFR + 1.49) (a) | 3.031 | % | 11/1/34 | 1,000,000 | 1,067,782 | ||||||||||||||
TD Ameritrade Holding Corp. | 2.950 | % | 4/1/22 | 975,000 | 990,670 | ||||||||||||||
Toronto-Dominion Bank | 1.150 | % | 6/12/25 | 1,175,000 | 1,184,536 | ||||||||||||||
| Truist Financial Corp. (effective 3/2/2026, US SOFR + 0.609) (a) | 1.267 | % | 3/2/27 | 2,675,000 | 2,674,587 | ||||||||||||||
| Wells Fargo & Co. (effective 5/19/2024, US SOFR + 0.51) (a) | 0.805 | % | 5/19/25 | 3,300,000 | 3,295,974 | ||||||||||||||
Total Financials | 43,763,013 | ||||||||||||||||||
1919 Funds 2021 Semi-Annual Report
41
Schedule of investments (cont'd)
June 30, 2021 (unaudited)
1919 Socially Responsive Balanced Fund
Security | Rate | Maturity Date | Face Amount | Value | |||||||||||||||
Health Care — 1.8% | |||||||||||||||||||
AbbVie Inc. | 4.250 | % | 11/14/28 | $ | 600,000 | $ | 696,188 | ||||||||||||
AbbVie Inc. | 4.400 | % | 11/6/42 | 1,120,000 | 1,362,090 | ||||||||||||||
Anthem Inc. | 2.875 | % | 9/15/29 | 1,530,000 | 1,629,782 | ||||||||||||||
Bristol-Myers Squibb Co. | 3.900 | % | 2/20/28 | 365,000 | 417,949 | ||||||||||||||
Bristol-Myers Squibb Co. | 3.400 | % | 7/26/29 | 725,000 | 812,875 | ||||||||||||||
Bristol-Myers Squibb Co. | 1.450 | % | 11/13/30 | 1,580,000 | 1,530,546 | ||||||||||||||
CVS Health Corp. | 3.875 | % | 7/20/25 | 910,000 | 1,005,449 | ||||||||||||||
CVS Health Corp. | 4.780 | % | 3/25/38 | 345,000 | 424,421 | ||||||||||||||
Evernorth Health Inc. | 3.050 | % | 11/30/22 | 600,000 | 619,112 | ||||||||||||||
Gilead Sciences Inc. | 1.650 | % | 10/1/30 | 1,700,000 | 1,646,623 | ||||||||||||||
Gilead Sciences Inc. | 4.600 | % | 9/1/35 | 320,000 | 392,694 | ||||||||||||||
UnitedHealth Group Inc. | 2.000 | % | 5/15/30 | 1,600,000 | 1,615,310 | ||||||||||||||
UnitedHealth Group Inc. | 3.500 | % | 8/15/39 | 515,000 | 577,215 | ||||||||||||||
Total Health Care | 12,730,254 | ||||||||||||||||||
Industrials — 0.5% | |||||||||||||||||||
Johnson Controls International PLC | 1.750 | % | 9/15/30 | 2,225,000 | 2,148,600 | ||||||||||||||
Xylem Inc/NY | 1.950 | % | 1/30/28 | 1,785,000 | 1,806,232 | ||||||||||||||
Total Industrials | 3,954,832 | ||||||||||||||||||
Information Technology — 2.2% | |||||||||||||||||||
Adobe Systems Inc. | 2.150 | % | 2/1/27 | 850,000 | 890,772 | ||||||||||||||
Apple Inc. | 2.850 | % | 2/23/23 | 575,000 | 597,293 | ||||||||||||||
Fortinet Inc. | 1.000 | % | 3/15/26 | 2,185,000 | 2,167,008 | ||||||||||||||
Mastercard Inc. | 3.300 | % | 3/26/27 | 1,350,000 | 1,494,978 | ||||||||||||||
Mastercard Inc. | 1.900 | % | 3/15/31 | 4,000,000 | 4,051,011 | ||||||||||||||
Microsoft Corp. | 4.200 | % | 11/3/35 | 565,000 | 699,549 | ||||||||||||||
NVIDIA Corp. | 0.584 | % | 6/14/24 | 3,115,000 | 3,117,463 | ||||||||||||||
QUALCOMM Inc. (3M US LIBOR + 0.73%) (b) | 0.916 | % | 1/30/23 | 340,000 | 343,695 | ||||||||||||||
QUALCOMM Inc. | 3.450 | % | 5/20/25 | 500,000 | 549,519 | ||||||||||||||
Salesforce.com Inc. | 1.500 | % | 7/15/28 | 2,135,000 | 2,139,851 | ||||||||||||||
Total Information Technology | 16,051,139 | ||||||||||||||||||
Materials — 0.1% | |||||||||||||||||||
Nutrien Ltd. | 4.200 | % | 4/1/29 | 425,000 | 489,558 | ||||||||||||||
Total Materials | 489,558 | ||||||||||||||||||
Real Estate Investment Trusts (REITS) — 0.9% | |||||||||||||||||||
Prologis LP | 2.250 | % | 4/15/30 | 1,620,000 | 1,658,175 | ||||||||||||||
Prologis LP | 1.250 | % | 10/15/30 | 3,000,000 | 2,830,621 | ||||||||||||||
Welltower Inc. | 2.700 | % | 2/15/27 | 1,600,000 | 1,701,282 | ||||||||||||||
Total Real Estate Investment Trust (REITS) | 6,190,078 | ||||||||||||||||||
1919 Funds 2021 Semi-Annual Report
42
1919 Socially Responsive Balanced Fund
Security | Rate | Maturity Date | Face Amount | Value | |||||||||||||||
Utilities — 1.7% | |||||||||||||||||||
Avangrid Inc. | 3.800 | % | 6/1/29 | $ | 650,000 | $ | 735,009 | ||||||||||||
DTE Electric Co. | 1.900 | % | 4/1/28 | 2,145,000 | 2,181,548 | ||||||||||||||
DTE Electric Co. | 4.050 | % | 5/15/48 | 1,480,000 | 1,805,352 | ||||||||||||||
Duke Energy Carolinas LLC | 3.350 | % | 5/15/22 | 955,000 | 981,773 | ||||||||||||||
Georgia Power Co. | 3.250 | % | 4/1/26 | 345,000 | 373,467 | ||||||||||||||
MidAmerican Energy Co. | 3.650 | % | 4/15/29 | 1,375,000 | 1,557,422 | ||||||||||||||
NextEra Energy Capital Holdings Inc. | 1.900 | % | 6/15/28 | 2,720,000 | 2,748,783 | ||||||||||||||
Public Service Co of Colorado | 3.200 | % | 3/1/50 | 520,000 | 564,573 | ||||||||||||||
Union Electric Co. | 2.625 | % | 3/15/51 | 1,280,000 | 1,229,026 | ||||||||||||||
Total Utilities | 12,176,953 | ||||||||||||||||||
Total Corporate Bonds (Cost — $127,089,877) | 129,629,086 | ||||||||||||||||||
Foreign Government Agency Issues — 0.5% | |||||||||||||||||||
International Bank for Reconstruction & Development | 0.625 | % | 4/22/25 | 1,620,000 | 1,615,374 | ||||||||||||||
International Bank for Reconstruction & Development | 3.125 | % | 11/20/25 | 930,000 | 1,023,792 | ||||||||||||||
International Finance Corp. | 2.000 | % | 10/24/22 | 785,000 | 803,316 | ||||||||||||||
| Total Foreign Government Agency Issues (Cost — $3,325,904) | 3,442,482 | ||||||||||||||||||
Mortgage Backed Securities — 1.1% | |||||||||||||||||||
Federal Home Loan Mortgage Corporation (FHLMC) | |||||||||||||||||||
Gold Pool J04311 | 6.000 | % | 2/1/22 | 1,348 | 1,358 | ||||||||||||||
Gold Pool C91417 | 3.500 | % | 1/1/32 | 67,531 | 72,068 | ||||||||||||||
Gold Pool A35826 | 5.000 | % | 7/1/35 | 25,255 | 27,770 | ||||||||||||||
Gold Pool G08112 | 6.000 | % | 2/1/36 | 52,758 | 62,736 | ||||||||||||||
Gold Pool G02564 | 6.500 | % | 1/1/37 | 26,590 | 30,100 | ||||||||||||||
Gold Pool G08179 | 5.500 | % | 2/1/37 | 18,446 | 21,479 | ||||||||||||||
Gold Pool A65694 | 6.000 | % | 9/1/37 | 20,319 | 23,220 | ||||||||||||||
Federal National Mortgage Association (FNMA) | |||||||||||||||||||
Pool 490446 | 6.500 | % | 3/1/29 | 10 | 11 | ||||||||||||||
Pool 808156 | 4.500 | % | 2/1/35 | 8,099 | 8,724 | ||||||||||||||
Pool 891596 | 5.500 | % | 6/1/36 | 649 | 748 | ||||||||||||||
Pool 190375 | 5.500 | % | 11/1/36 | 3,108 | 3,603 | ||||||||||||||
Pool 916386 | 6.000 | % | 5/1/37 | 21,797 | 25,823 | ||||||||||||||
Pool 946594 | 6.000 | % | 9/1/37 | 20,633 | 24,425 | ||||||||||||||
General National Mortgage Association (GNMA) | |||||||||||||||||||
Gold Pool MA6310 | 3.000 | % | 12/20/34 | 374,561 | 394,423 | ||||||||||||||
Gold Pool MA6572 | 3.000 | % | 4/20/35 | 763,815 | 804,311 | ||||||||||||||
Gold Pool MA6740 | 2.500 | % | 8/20/35 | 1,219,493 | 1,285,261 | ||||||||||||||
Gold Pool 550763X | 5.000 | % | 12/15/35 | 85,643 | 99,241 | ||||||||||||||
Gold Pool 003922M | 7.000 | % | 11/20/36 | 12,453 | 14,962 | ||||||||||||||
Gold Pool MA3873 | 3.000 | % | 8/20/46 | 1,474,316 | 1,555,241 | ||||||||||||||
1919 Funds 2021 Semi-Annual Report
43
Schedule of investments (cont'd)
June 30, 2021 (unaudited)
1919 Socially Responsive Balanced Fund
Security | Rate | Maturity Date | Face Amount | Value | |||||||||||||||
Mortgage Backed Securities — continued | |||||||||||||||||||
Gold Pool MA6409 | 3.000 | % | 1/20/50 | $ | 964,121 | $ | 1,011,416 | ||||||||||||
Gold Pool 2020-194 | 1.000 | % | 6/16/62 | 2,273,177 | 2,216,539 | ||||||||||||||
| Total Mortgage Backed Securities (Cost — $7,619,312) | 7,683,459 | ||||||||||||||||||
U.S. Government & Agency Obligations — 6.4% | |||||||||||||||||||
Federal Home Loan Banks (FHLB) | 3.250 | % | 11/16/28 | 2,125,000 | 2,417,257 | ||||||||||||||
Federal Home Loan Banks (FHLB) | 5.500 | % | 7/15/36 | 125,000 | 185,227 | ||||||||||||||
Federal Home Loan Mortgage Corp (FHLMC) | 6.750 | % | 9/15/29 | 115,000 | 166,243 | ||||||||||||||
Federal Home Loan Mortgage Corp (FHLMC) | 6.250 | % | 7/15/32 | 380,000 | 559,355 | ||||||||||||||
Federal National Mortgage Association (FNMA) | 0.500 | % | 11/7/25 | 2,200,000 | 2,177,018 | ||||||||||||||
Federal National Mortgage Association (FNMA) | 0.750 | % | 10/8/27 | 2,270,000 | 2,216,468 | ||||||||||||||
Federal National Mortgage Association (FNMA) | 6.250 | % | 5/15/29 | 985,000 | 1,343,355 | ||||||||||||||
Federal National Mortgage Association (FNMA) | 0.875 | % | 8/5/30 | 8,670,000 | 8,225,673 | ||||||||||||||
Federal National Mortgage Association (FNMA) | 6.625 | % | 11/15/30 | 303,000 | 439,137 | ||||||||||||||
United States Treasury Bonds | 8.000 | % | 11/15/21 | 250,000 | 257,388 | ||||||||||||||
United States Treasury Bonds | 7.250 | % | 8/15/22 | 780,000 | 842,156 | ||||||||||||||
United States Treasury Bonds | 7.625 | % | 11/15/22 | 850,000 | 936,660 | ||||||||||||||
United States Treasury Bonds | 7.125 | % | 2/15/23 | 325,000 | 361,537 | ||||||||||||||
United States Treasury Bonds | 6.250 | % | 8/15/23 | 550,000 | 619,781 | ||||||||||||||
United States Treasury Bonds | 7.500 | % | 11/15/24 | 1,105,000 | 1,364,416 | ||||||||||||||
United States Treasury Bonds | 7.625 | % | 2/15/25 | 390,000 | 488,765 | ||||||||||||||
United States Treasury Bonds | 6.875 | % | 8/15/25 | 100,000 | 125,141 | ||||||||||||||
United States Treasury Bonds | 6.750 | % | 8/15/26 | 90,000 | 116,483 | ||||||||||||||
United States Treasury Bonds | 6.500 | % | 11/15/26 | 135,000 | 174,503 | ||||||||||||||
United States Treasury Bonds | 6.125 | % | 11/15/27 | 675,000 | 885,094 | ||||||||||||||
United States Treasury Bonds | 5.500 | % | 8/15/28 | 335,000 | 433,904 | ||||||||||||||
United States Treasury Bonds | 3.500 | % | 2/15/39 | 573,000 | 717,302 | ||||||||||||||
United States Treasury Bonds | 4.375 | % | 11/15/39 | 204,000 | 283,983 | ||||||||||||||
United States Treasury Notes | 2.125 | % | 11/30/24 | 2,000,000 | 2,107,187 | ||||||||||||||
United States Treasury Notes | 3.000 | % | 10/31/25 | 905,000 | 991,929 | ||||||||||||||
United States Treasury Notes | 2.625 | % | 1/31/26 | 1,625,000 | 1,758,809 | ||||||||||||||
United States Treasury Notes | 2.000 | % | 11/15/26 | 3,375,000 | 3,564,185 | ||||||||||||||
United States Treasury Notes | 2.750 | % | 2/15/28 | 1,630,000 | 1,797,521 | ||||||||||||||
United States Treasury Notes | 2.875 | % | 5/15/28 | 3,500,000 | 3,891,426 | ||||||||||||||
United States Treasury Notes | 3.125 | % | 11/15/28 | 1,455,000 | 1,647,390 | ||||||||||||||
United States Treasury Notes | 1.500 | % | 2/15/30 | 4,670,000 | 4,720,348 | ||||||||||||||
| Total U.S. Government & Agency Obligations (Cost — $44,875,465) | 45,815,641 | ||||||||||||||||||
1919 Funds 2021 Semi-Annual Report
44
1919 Socially Responsive Balanced Fund
Security | Rate | Maturity Date | Face Amount | Value | |||||||||||||||
Short-Term Investment — 6.0% | |||||||||||||||||||
| Fidelity Investments Money Market — Government Portfolio — Class I (c) | 0.010 | % | $ | 43,438,749 | $ | 43,438,749 | |||||||||||||
Total Short-Term Investment (Cost — $43,438,749) | 43,438,749 | ||||||||||||||||||
Total Investments — 99.8% (Cost — $543,655,589) | 716,668,117 | ||||||||||||||||||
Other Assets in Excess of Liabilities — 0.2% | 1,441,312 | ||||||||||||||||||
Total Net Assets — 100.0% | $ | 718,109,429 | |||||||||||||||||
Notes:
* Non-income producing security.
(a) Fixed to floating rate. Effective date of change and formula disclosed.
(b) Variable rate security. Reference rate and spread are included in the description.
(c) The rate is the annualized seven-day yield at period end.
Abbreviations used in this schedule:
LIBOR — London Inter-Bank Offered Rate
LLC — Limited Liability Corporation
PLC — Public Limited Company
SOFR — Secured Overnight Financing Rate
The Global Industry Classification Standard (GICS®) was developed by and/or is the exclusive property of Morgan Stanley Capital International, Inc. ("MSCI") and Standard & Poor's Financial Services LLC ("S&P"). GICS is a service mark of MSCI & S&P and has been licensed for use by U.S. Bancorp Fund Services, LLC.
The Accompanying Notes are an Integral Part of these Financial Statements.
1919 Funds 2021 Semi-Annual Report
45
1919 Socially Responsive Balanced Fund
Statement of assets and liabilities
June 30, 2021 (Unaudited)
Assets: | |||||||
Investments in securities at value (cost $543,655,589) | $ | 716,668,117 | |||||
Receivable for Fund shares sold | 3,426,611 | ||||||
Dividends and interest receivable | 1,014,462 | ||||||
Prepaid expenses | 65,343 | ||||||
Total Assets | 721,174,533 | ||||||
Liabilities: | |||||||
Investments payable | 2,123,983 | ||||||
Payable for Fund shares repurchased | 254,800 | ||||||
Distribution to shareholders | 15,720 | ||||||
Advisory fees payable | 294,665 | ||||||
Distribution fees payable | 189,622 | ||||||
Accrued other expenses | 186,314 | ||||||
Total Liabilities | 3,065,104 | ||||||
Net Assets | $ | 718,109,429 | |||||
Components of Net Assets: | |||||||
Paid-in capital | $ | 545,133,973 | |||||
Total distributable earnings | 172,975,456 | ||||||
Net Assets | $ | 718,109,429 | |||||
Class A: | |||||||
Net Assets | $ | 223,167,939 | |||||
Issued and Outstanding (unlimited shares authorized, no par value) | 8,371,085 | ||||||
Net Asset Value, Redemption Price and Offering Price Per Share | $ | 26.66 | |||||
Maximum Public Offering Price (based on maximum initial sales charge of 5.75%) | $ | 28.29 | |||||
Class C: | |||||||
Net Assets | $ | 99,485,334 | |||||
Issued and Outstanding (unlimited shares authorized, no par value) | 3,736,939 | ||||||
Net Asset Value, Redemption Price* and Offering Price Per Share | $ | 26.62 | |||||
Class I: | |||||||
Net Assets | $ | 395,456,156 | |||||
Issued and Outstanding (unlimited shares authorized, no par value) | 14,826,531 | ||||||
Net Asset Value, Redemption Price and Offering Price Per Share | $ | 26.67 | |||||
* Redemption price per share is NAV of Class C shares reduced by a CDSC of up to 1.00%, contingent upon timing of redemption (See Note 3).
The Accompanying Notes are an Integral Part of these Financial Statements.
1919 Funds 2021 Semi-Annual Report
46
1919 Socially Responsive Balanced Fund
Statement of operations
For the Six Months Ended June 30, 2021 (Unaudited)
Investment Income: | |||||||
Dividend income | $ | 1,767,263 | |||||
Interest income | 1,341,744 | ||||||
Total Investment Income | 3,109,007 | ||||||
Expenses: | |||||||
Advisory fees (Note 3) | 1,608,001 | ||||||
Distribution fees (Note 6) | 646,822 | ||||||
Administration and fund accounting fees (Note 3) | 177,721 | ||||||
Transfer agent fees and expenses (Note 3 & Note 6) | 294,700 | ||||||
Registration fees | 43,057 | ||||||
Custody fees (Note 3) | 20,491 | ||||||
Shareholder reporting fees | 11,929 | ||||||
Legal fees | 10,081 | ||||||
Audit fees | 8,677 | ||||||
Trustees' fees (Note 3) | 7,296 | ||||||
Compliance fees (Note 3) | 3,008 | ||||||
Insurance fees | 2,235 | ||||||
Miscellaneous fees | 5,359 | ||||||
Total Expenses | 2,839,377 | ||||||
Net Investment Income | 269,630 | ||||||
Realized and Unrealized Gain on Investments | |||||||
Net Realized Gain | 3,290,680 | ||||||
Net Change in Unrealized Appreciation/Depreciation | 46,828,048 | ||||||
Net Realized and Unrealized Gain on Investments | 50,118,728 | ||||||
Net Increase in Net Assets Resulting from Operations | $ | 50,388,358 | |||||
The Accompanying Notes are an Integral Part of these Financial Statements.
1919 Funds 2021 Semi-Annual Report
47
1919 Socially Responsive Balanced Fund
Statements of changes in net assets
| For the Six Months Ended June 30, 2021 (Unaudited) and for the Year Ended December 31, | 2021 | 2020 | |||||||||
Increase in Net Assets from: | |||||||||||
Operations: | |||||||||||
Net investment income | $ | 269,630 | $ | 952,025 | |||||||
Net realized gain (loss) on investments | 3,290,680 | (3,071,891 | ) | ||||||||
Net change in unrealized appreciation/depreciation on investments | 46,828,048 | 67,707,888 | |||||||||
Net Increase in Net Assets Resulting from Operations | 50,388,358 | 65,588,022 | |||||||||
Distributions to shareholders: | |||||||||||
Class A | (81,591 | ) | (463,129 | ) | |||||||
Class C | — | (26,896 | ) | ||||||||
Class I | (526,885 | ) | (638,952 | ) | |||||||
Total Distributions to Shareholders | (608,476 | ) | (1,128,977 | ) | |||||||
Capital Transactions: | |||||||||||
Net proceeds from shares sold | 230,241,331 | 244,717,135 | |||||||||
Reinvestment of distributions | 559,360 | 1,054,257 | |||||||||
Cost of shares repurchased | (52,751,962 | ) | (49,017,411 | ) | |||||||
Net Increase in Net Assets from Capital Transactions | 178,048,729 | 196,753,981 | |||||||||
Total Increase in Net Assets | 227,828,611 | 261,213,026 | |||||||||
Net Assets: | |||||||||||
Beginning of period | 490,280,818 | 229,067,792 | |||||||||
End of Period | $ | 718,109,429 | $ | 490,280,818 | |||||||
The Accompanying Notes are an Integral Part of these Financial Statements.
1919 Funds 2021 Semi-Annual Report
48
1919 Socially Responsive Balanced Fund
Financial highlights
For a share of beneficial interest outstanding through each year presented.
Class A Shares | 2021* | 2020 | 2019 | 2018 | 2017 | 2016 | |||||||||||||||||||||
Net asset value, beginning of year | $ | 24.69 | $ | 20.55 | $ | 16.59 | $ | 17.94 | $ | 16.39 | $ | 16.65 | |||||||||||||||
Income (loss) from investment operations: | |||||||||||||||||||||||||||
Net investment income1 | 0.006 | 0.05 | 0.12 | 0.10 | 0.11 | 0.11 | |||||||||||||||||||||
| Net realized and unrealized gain (loss) on investments | 1.98 | 4.15 | 3.97 | (0.28 | ) | 2.55 | 0.85 | ||||||||||||||||||||
| Total income (loss) from investment operations | 1.98 | 4.20 | 4.09 | (0.18 | ) | 2.66 | 0.96 | ||||||||||||||||||||
Less distributions: | |||||||||||||||||||||||||||
From net investment income | (0.01 | ) | (0.06 | ) | (0.10 | ) | (0.10 | ) | (0.10 | ) | (0.11 | ) | |||||||||||||||
From net realized gain on investments | — | — | (0.03 | ) | (1.07 | ) | (1.01 | ) | (1.11 | ) | |||||||||||||||||
Total distributions | (0.01 | ) | (0.06 | ) | (0.13 | ) | (1.17 | ) | (1.11 | ) | (1.22 | ) | |||||||||||||||
Net asset value, end of year | $ | 26.66 | $ | 24.69 | $ | 20.55 | $ | 16.59 | $ | 17.94 | $ | 16.39 | |||||||||||||||
Total return2 | 8.02 | %5 | 20.57 | % | 24.69 | % | -1.31 | % | 16.36 | % | 5.76 | % | |||||||||||||||
Supplemental data and ratios: | |||||||||||||||||||||||||||
Net assets, end of year (in thousands) | $ | 223,168 | $ | 190,180 | $ | 137,213 | $ | 100,584 | $ | 106,418 | $ | 97,110 | |||||||||||||||
| Ratios to average net assets Gross expenses | 0.98 | %4 | 1.16 | % | 1.25 | % | 1.28 | % | 1.32 | % | 1.36 | % | |||||||||||||||
Net Expenses3 | 0.984 | 1.16 | 1.25 | 1.25 | 1.26 | 1.27 | |||||||||||||||||||||
Net investment income | 0.024 | 0.25 | 0.62 | 0.55 | 0.62 | 0.66 | |||||||||||||||||||||
Portfolio turnover rate | 5 | %5 | 16 | % | 11 | % | 13 | % | 30 | % | 32 | % | |||||||||||||||
* For the six months ended June 30, 2021 (unaudited).
1 Per share amounts have been calculated using the average shares method.
2 Performance figures, exclusive of sales charges, may reflect fee waivers and/or expense reimbursements. In the absence of fee waivers and/or expense reimbursements, the total return would have been lower. Past performance is no guarantee of future results.
3 Effective April 30, 2017, the advisor agreed to limit the ratio of expenses, other than brokerage, interest, taxes, extraordinary expenses and acquired fund fees and expenses, to 1.25% of the average net assets of Class A shares. This expense limitation arrangement cannot be terminated prior to April 30, 2022 without the Board of Trustees' consent. Prior to April 30, 2017, this limitation was 1.27%. See Note 3.
4 Not annualized.
5 Annualized.
6 Amount is less than $0.01 per share.
The Accompanying Notes are an Integral Part of these Financial Statements.
1919 Funds 2021 Semi-Annual Report
49
1919 Socially Responsive Balanced Fund
Financial highlights (cont'd)
For a share of beneficial interest outstanding through each year presented.
Class C Shares | 2021* | 2020 | 2019 | 2018 | 2017 | 2016 | |||||||||||||||||||||
Net asset value, beginning of year | $ | 24.73 | $ | 20.67 | $ | 16.73 | $ | 18.11 | $ | 16.57 | $ | 16.83 | |||||||||||||||
Income (loss) from investment operations: | |||||||||||||||||||||||||||
Net investment loss1 | (0.09 | ) | (0.09 | ) | (0.01 | ) | (0.03 | ) | (0.02 | ) | (0.01 | ) | |||||||||||||||
| Net realized and unrealized gain (loss) on investments | 1.98 | 4.17 | 3.99 | (0.28 | ) | 2.58 | 0.86 | ||||||||||||||||||||
| Total income (loss) from investment operations | 1.89 | 4.08 | 3.98 | (0.31 | ) | 2.56 | 0.85 | ||||||||||||||||||||
Less distributions: | |||||||||||||||||||||||||||
From net investment income | — | (0.02 | ) | (0.01 | ) | — | (0.01 | ) | — | ||||||||||||||||||
From net realized gain on investments | — | — | (0.03 | ) | (1.07 | ) | (1.01 | ) | (1.11 | ) | |||||||||||||||||
Total distributions | 0.00 | (0.02 | ) | (0.04 | ) | (1.07 | ) | (1.02 | ) | (1.11 | ) | ||||||||||||||||
Net asset value, end of year | $ | 26.62 | $ | 24.73 | $ | 20.67 | $ | 16.73 | $ | 18.11 | $ | 16.57 | |||||||||||||||
Total return2 | 7.64 | %5 | 19.77 | % | 23.78 | % | -1.95 | % | 15.47 | % | 5.02 | % | |||||||||||||||
Supplemental data and ratios: | |||||||||||||||||||||||||||
Net assets, end of year (in thousands) | $ | 99,485 | $ | 59,784 | $ | 19,006 | $ | 12,732 | $ | 11,982 | $ | 12,359 | |||||||||||||||
| Ratios to average net assets Gross expenses | 1.69 | %4 | 1.82 | % | 1.93 | % | 1.97 | % | 2.01 | % | 2.04 | % | |||||||||||||||
Net Expenses3 | 1.694 | 1.82 | 1.93 | 1.97 | 1.99 | 1.98 | |||||||||||||||||||||
Net investment loss | (0.68 | )4 | (0.40 | ) | (0.07 | ) | (0.17 | ) | (0.12 | ) | (0.05 | ) | |||||||||||||||
Portfolio turnover rate | 5 | %5 | 16 | % | 11 | % | 13 | % | 30 | % | 32 | % | |||||||||||||||
* For the six months ended June 30, 2021 (unaudited).
1 Per share amounts have been calculated using the average shares method.
2 Performance figures, exclusive of CDSC, may reflect fee waivers and/or expense reimbursements. In the absence of fee waivers and/or expense reimbursements, the total return would have been lower. Past performance is no guarantee of future results.
3 Effective April 30, 2017, the advisor agreed to limit the ratio of expenses, other than brokerage, interest, taxes, extraordinary expenses and acquired fund fees and expenses, to 2.00% of the average net assets of Class C shares. This expense limitation arrangement cannot be terminated prior to April 30, 2022 without the Board of Trustees' consent. Prior to April 30, 2017, this limitation was 1.98%. See Note 3.
4 Not annualized.
5 Annualized.
The Accompanying Notes are an Integral Part of these Financial Statements.
1919 Funds 2021 Semi-Annual Report
50
For a share of beneficial interest outstanding through each year presented.
Class I Shares | 2021* | 2020 | 2019 | 2018 | 2017 | 2016 | |||||||||||||||||||||
Net asset value, beginning of year | $ | 24.70 | $ | 20.54 | $ | 16.57 | $ | 17.91 | $ | 16.36 | $ | 16.63 | |||||||||||||||
Income (loss) from investment operations: | |||||||||||||||||||||||||||
Net investment income1 | 0.04 | 0.13 | 0.19 | 0.16 | 0.15 | 0.16 | |||||||||||||||||||||
| Net realized and unrealized gain (loss) on investments | 2.08 | 4.15 | 3.96 | (0.29 | ) | 2.56 | 0.84 | ||||||||||||||||||||
| Total income (loss) from investment operations | 2.12 | 4.28 | 4.15 | (0.13 | ) | 2.71 | 1.00 | ||||||||||||||||||||
Less distributions: | |||||||||||||||||||||||||||
From net investment income | (0.15 | ) | (0.12 | ) | (0.15 | ) | (0.14 | ) | (0.15 | ) | (0.16 | ) | |||||||||||||||
From net realized gain on investments | — | — | (0.03 | ) | (1.07 | ) | (1.01 | ) | (1.11 | ) | |||||||||||||||||
Total distributions | (0.15 | ) | (0.12 | ) | (0.18 | ) | (1.21 | ) | (1.16 | ) | (1.27 | ) | |||||||||||||||
Net asset value, end of year | $ | 26.67 | $ | 24.70 | $ | 20.54 | $ | 16.57 | $ | 17.91 | $ | 16.36 | |||||||||||||||
Total return2 | 8.18 | %5 | 20.93 | % | 25.10 | % | -1.00 | % | 16.71 | % | 6.02 | % | |||||||||||||||
Supplemental data and ratios: | |||||||||||||||||||||||||||
Net assets, end of year (in thousands) | $ | 395,456 | $ | 240,316 | $ | 72,849 | $ | 18,027 | $ | 8,965 | $ | 5,961 | |||||||||||||||
| Ratios to average net assets Gross expenses | 0.71 | %4 | 0.83 | % | 0.91 | % | 0.96 | % | 1.01 | % | 1.06 | % | |||||||||||||||
Net Expenses3 | 0.714 | 0.83 | 0.91 | 0.96 | 1.00 | 1.00 | |||||||||||||||||||||
Net investment income | 0.314 | 0.59 | 0.98 | 0.89 | 0.86 | 1.00 | |||||||||||||||||||||
Portfolio turnover rate | 5 | %5 | 16 | % | 11 | % | 13 | % | 30 | % | 32 | % | |||||||||||||||
* For the six months ended June 30, 2021 (unaudited).
1 Per share amounts have been calculated using the average shares method.
2 Performance figures may reflect fee waivers and/or expense reimbursements. In the absence of fee waivers and/or expense reimbursements, the total return would have been lower. Past performance is no guarantee of future results.
3 Effective April 30, 2017, the advisor agreed to limit the ratio of expenses, other than brokerage, interest, taxes, extraordinary expenses and acquired fund fees and expenses, to 1.00% of the average net assets of Class I shares. This expense limitation arrangement cannot be terminated prior to April 30, 2022 without the Board of Trustees' consent. See Note 3.
4 Not annualized.
5 Annualized.
The Accompanying Notes are an Integral Part of these Financial Statements.
1919 Funds 2021 Semi-Annual Report
51
Notes to financial statements
Note 1. Organization
The 1919 Financial Services Fund (the "Financial Services Fund"), 1919 Maryland Tax-Free Income Fund (the "Maryland Fund") and 1919 Socially Responsive Balanced Fund (the "Socially Responsive Fund", each a Fund and together, the "Funds") are separate series of the Trust for Advised Portfolios (the "Trust"), a Delaware Statutory Trust registered under the Investment Company Act of 1940, as amended (the "1940 Act") as an open-end investment management company. The Financial Services Fund and Socially Responsive Fund are registered as a diversified series; the Maryland Fund is registered as non-diversified investment series.
The Financial Services Fund seeks long-term capital appreciation by investing primarily in common stocks. The Maryland Fund seeks a high level of current income exempt from federal and Maryland state and local income taxes, consistent with prudent investment risk and preservation of capital. The Socially Responsive Fund seeks to provide high total return consisting of capital appreciation and current income.
Note 2. Significant accounting policies
The following is a summary of significant accounting policies consistently followed by the Funds in the preparation of their financial statements. These policies are in conformity with accounting principles generally accepted in the United States of America ("GAAP") for investment companies. The Funds are each considered an investment company under GAAP and follow the accounting and reporting guidance applicable to investment companies in the Financial Accounting Standards Board Accounting Standards Codification Topic 946. The presentation of financial statements in conformity with GAAP requires management to make estimates and assumptions that affect the reported amounts of assets and liabilities and disclosure of contingent assets and liabilities at the date of the financial statements and the reported amounts of income and expenses. Actual results may differ from those estimates.
(a) Securities valuation. Investments in securities traded on a national securities exchange are valued at the last reported sales price on the exchange on which the security is principally traded. Securities traded on the NASDAQ exchanges are valued at the NASDAQ Official Closing Price ("NOCP"). Exchange-traded securities for which no sale was reported and NASDAQ securities for which there is no NOCP are valued at the mean of the most recent quoted bid and ask prices. Unlisted securities held by the Funds are valued at the last sale price in the over-the-counter ("OTC") market. If there is no trading on a particular day, the mean between the last quoted bid and ask price is used.
Long-term fixed income securities are valued using prices provided by an independent pricing service approved by the Board. Pricing services may use various valuation methodologies, including matrix pricing and other analytical models as well as market transactions and dealer quotations. Securities for which market quotations are not readily available are valued at their estimated fair value as determined in good faith by 1919 Investment Counsel, LLC (the "Adviser") under procedures established by and under the general supervision and responsibility of the Trust's Board of Trustees.
1919 Funds 2021 Semi-Annual Report
52
Various inputs are used in determining the value of the Funds' investments. These inputs are summarized into three broad levels and described below:
• Level 1 — quoted prices in active markets for identical investments
• Level 2 — other significant observable inputs (including quoted prices for similar investments, interest rates, prepayment speeds, credit risk, etc.).
• Level 3 — significant unobservable inputs, including the Fund's own assumptions in determining the fair value of investments.
The inputs or methodologies used for valuing securities are not necessarily an indication of the risk associated with investing in those securities. The following is a summary of the inputs used in valuing the Funds' assets carried at value:
FINANCIAL SERVICES FUND
Description | Level 1 | Level 2 | Level 3 | Total | |||||||||||||||
Long-term investments*: | |||||||||||||||||||
Common Stocks | $ | 210,637,487 | $ | — | $ | — | $ | 210,637,487 | |||||||||||
Total long-term investments | 210,637,487 | — | — | 210,637,487 | |||||||||||||||
Short-term investment | 2,355,768 | — | — | 2,355,768 | |||||||||||||||
Total investments | $ | 212,993,255 | $ | — | $ | — | $ | 212,993,255 | |||||||||||
MARYLAND FUND
Description | Level 1 | Level 2 | Level 3 | Total | |||||||||||||||
Long-term investments*: | |||||||||||||||||||
Municipal Bonds | $ | 84,742,155 | $ | — | $ | — | $ | 84,742,155 | |||||||||||
Total investments | $ | 84,742,155 | $ | — | $ | — | $ | 84,742,155 | |||||||||||
SOCIALLY RESPONSIVE FUND
Description | Level 1 | Level 2 | Level 3 | Total | |||||||||||||||
Long-term investments*: | |||||||||||||||||||
Common Stocks | $ | 482,825,514 | $ | — | $ | — | $ | 482,825,514 | |||||||||||
Asset Backed Securities | — | 3,794,178 | — | 3,794,178 | |||||||||||||||
Collateralized Mortgage Obligations | — | 39,008 | — | 39,008 | |||||||||||||||
Corporate Bonds | — | 129,629,086 | — | 129,629,086 | |||||||||||||||
Foreign Government Agency Issues | — | 3,442,482 | — | 3,442,482 | |||||||||||||||
Mortgage Backed Securities | — | 7,683,459 | — | 7,683,459 | |||||||||||||||
U.S. Government & Agency Obligations | — | 45,815,641 | — | 45,815,641 | |||||||||||||||
Total long-term investments | 482,825,514 | 190,403,854 | — | 673,229,368 | |||||||||||||||
Short-term investment | 43,438,749 | — | — | 43,438,749 | |||||||||||||||
Total investments | $ | 526,264,263 | $ | 190,403,854 | $ | — | $ | 716,668,117 | |||||||||||
* See Schedule of investments for additional detailed categorizations.
(b) Foreign currency translation. Investment securities and other assets and liabilities in foreign currencies are translated into U.S. dollar amounts based upon prevailing exchange rates on the date of valuation. Purchases and sales of investment securities and income and expense items denominated in foreign currencies are translated into U.S. dollar amounts based upon prevailing exchange rates on the respective dates of such transactions.
1919 Funds 2021 Semi-Annual Report
53
Notes to financial statements (cont'd)
The Funds do not isolate the portion of the results of operations resulting from fluctuations in foreign exchange rates on investments from the fluctuations arising from changes in market prices of securities held. Such fluctuations are included with the net realized and unrealized gain or loss on investments.
Net realized foreign exchange gains or losses arise from sales of foreign currencies, including gains and losses on forward foreign currency contracts, currency gains or losses realized between the trade and settlement dates on securities transactions, and the difference between the amounts of dividends, interest, and foreign withholding taxes recorded on the Funds' books and the U.S. dollar equivalent of the amounts actually received or paid. Net unrealized foreign exchange gains and losses arise from changes in the values of assets and liabilities, other than investments in securities, on the date of valuation, resulting from changes in exchange rates.
Foreign security and currency transactions may involve certain considerations and risks not typically associated with those of U.S. dollar denominated transactions as a result of, among other factors, the possibility of lower levels of governmental supervision and regulation of foreign securities markets and the possibility of political or economic instability. As of June 30, 2021 the Financial Services Fund held foreign currency.
(c) REIT distribution. The character of distributions received from Real Estate Investment Trusts (''REITs'') held by the Financial Services Fund and Socially Responsive Fund are generally comprised of net investment income, capital gains, and return of capital. It is the policy of the Funds to estimate the character of distributions received from underlying REITs based on historical data provided by the REITs. After each calendar year end, REITs report the actual tax character of these distributions. Differences between the estimated and actual amounts reported by the REITs are reflected in the Funds' records in the year in which they are reported by the REITs by adjusting related investment cost basis, capital gains and income, as necessary.
(d) Concentration risk. The Financial Services Fund normally invests at least 80% of its assets in financial services related investments. As a result of this investment policy, an investment in the Fund may be subject to greater risk and market fluctuation than an investment in a fund that invests in securities representing a broader range of investment alternatives.
The Maryland Fund invests substantially all of its assets in securities issued by or on behalf of the State of Maryland, its political subdivisions, municipalities, agencies, instrumentalities, and public authorities. Changes in economic conditions in, or governmental policies of, the State of Maryland could have a significant impact on the performance of the Fund.
The Maryland Fund may focus a significant amount of its investments in a single sector of the municipal securities market. In doing so, the Fund is more susceptible to factors adversely affecting that sector than a fund not following that practice.
1919 Funds 2021 Semi-Annual Report
54
The Maryland Fund may invest a significant portion of assets in securities issued by local governments or public authorities that are rated according to their particular creditworthiness, which may vary significantly from the state's general obligations. The value of the Fund's shares will be more susceptible to being materially impacted by a single economic, political or regulatory event affecting those issuers or their securities than shares of a diversified fund.
(e) Foreign investment risk. The Financial Services Fund's investments in foreign securities may involve risks not present in domestic investments. Since securities may be denominated in foreign currencies, may require settlement in foreign currencies or pay interest or dividends in foreign currencies, changes in the relationship of these foreign currencies to the U.S. dollar can significantly affect the value of the investments and earnings of the Fund. Foreign investments may also subject the Fund to foreign government exchange restrictions, expropriation, taxation or other political, social or economic developments, all of which affect the market and/or credit risk of the investments.
(f) Security transactions and investment income. Security transactions are accounted for on a trade date basis. Interest income, adjusted for amortization of premium and accretion of discount, is recorded on the accrual basis. Dividend income is recorded on the ex-dividend date. The cost of investments sold is determined by use of the specific identification method. To the extent any issuer defaults or a credit event occurs that impacts the issuer, the Maryland Fund and Socially Responsive Fund may halt any additional interest income accruals and consider the realizability of interest accrued up to the date of default or credit event.
(g) Distribution to shareholders. The Financial Services Fund makes distributions from net investment income, if any, at least annually. The Maryland Fund declares income distributions each business day to shareholders of record, which are paid monthly. The Maryland Fund intends to satisfy conditions that will enable interest from municipal securities, which is exempt from federal and certain state income taxes, to retain such tax-exempt status when distributed to the shareholders of the Fund. The Socially Responsive Fund makes distributions from net investment income on a quarterly basis. Distributions of net realized gains, if any, are declared at least annually for each of the Funds (these are taxable for shareholders of the Maryland Fund). Distributions to shareholders of the Funds are recorded on the ex-dividend date and are determined in accordance with income tax regulations, which may differ from GAAP.
(h) Indemnifications. In the normal course of business, the Funds enter into contracts that contain a variety of representations, which provide general indemnifications. The Funds' maximum exposure under these arrangements are unknown as this would involve future claims that may be made against the Funds that have not yet occurred. However, based on experience, the Funds expect the risk of loss to be remote.
1919 Funds 2021 Semi-Annual Report
55
Notes to financial statements (cont'd)
(i) Share class accounting. Investment income, common expenses and realized/unrealized gains (losses) on investments are allocated to the various classes of the Funds on the basis of daily net assets of each class. Fees relating to a specific class are charged directly to that share class.
(j) Federal and other taxes. It is the Funds' policy to comply with the federal income and excise tax requirements of the Internal Revenue Code of 1986 (the "Code"), as amended, applicable to regulated investment companies. Accordingly, the Funds intend to distribute their taxable income and net realized gains, if any, to shareholders in accordance with timing requirements imposed by the Code. Therefore, no federal or state income tax provision is required in the Funds' financial statements.
Management has analyzed the Funds' tax positions taken on income tax returns for all open tax years (prior three fiscal years) and has concluded that as of June 30, 2021, no provision for income tax is required in the Funds' financial statements. The Funds' federal and state income and federal excise tax returns for tax years for which the applicable statutes of limitations have not expired are subject to examination by the Internal Revenue Service and state departments of revenue. The Funds have no examination in progress and are not aware of any tax positions for which it is reasonably possible that the total amounts of unrecognized tax benefits will significantly change in the next twelve months.
Under the applicable foreign tax laws, a withholding tax may be imposed on interest, dividends and capital gains at various rates.
Note 3. Investment management agreement and other transactions with affiliates
The Trust has an agreement with the Adviser to furnish investment advisory services to the Funds.
Under the terms of this agreement, the Funds pay an investment management fee, calculated daily and paid monthly for each Fund as follows:
Fund | Annual Rate | ||||||
Financial Services Fund | 0.80% on average net assets | ||||||
Maryland Fund | 0.55% on average net assets | ||||||
| Socially Responsive Fund | 0.65% on average net assets up to $100 million 0.61% on next $100 million 0.51% on next $100 million 0.46% thereafter | ||||||
Effective April 30, 2017, the Adviser has contractually agreed to reduce fees and pay expenses (other than shareholder servicing fees pursuant to a Shareholder Servicing Plan, any front-end or contingent deferred loads, taxes, leverage interest, brokerage commissions, acquired fund fees and expenses, expenses incurred in connection with any merger or reorganization, portfolio transaction expenses, interest expense and dividends paid on
1919 Funds 2021 Semi-Annual Report
56
short sales or extraordinary expenses such as litigation) so that total annual operating expenses do not exceed the levels set forth below.
Fund | Class A | Class C | Class I | ||||||||||||
Financial Services Fund | 1.50 | % | 2.25 | % | 1.25 | % | |||||||||
Maryland Fund | 0.75 | % | 1.30 | % | 0.60 | % | |||||||||
Socially Responsive Fund | 1.25 | % | 2.00 | % | 1.00 | % | |||||||||
The arrangements are in place until April 30, 2022, but may be terminated or amended at any time by the Board upon 60 days' notice to the Adviser or by the Adviser with consent of the Board. These arrangements, however, may be modified by the Adviser to decrease total annual operating expenses at any time. From November 10, 2014 to April 29, 2017, a similar agreement was in place with limits as follows:
Fund | Class A | Class C | Class I | ||||||||||||
Financial Services Fund | 1.46 | % | 2.13 | % | 1.05 | % | |||||||||
Maryland Fund | 0.75 | % | 1.30 | % | 0.60 | % | |||||||||
Socially Responsive Fund | 1.27 | % | 1.98 | % | 1.00 | % | |||||||||
The Adviser is permitted to recapture amounts waived and/or reimbursed to a class within a rolling 36 month period from the month the Adviser earned the fee or incurred the expense if the class' total annual operating expenses have fallen to a level below the limits described above. The amounts waived are detailed on each Fund's Statement of operations.
During the period ended June 30, 2021, Stifel Nicolaus, an affiliate of the Adviser and the Funds was paid for distribution and transfer agent fees of $72,956 and $13,626, respectively.
At June 30, 2021, the amounts waived by the Adviser and the eligible recapture periods are as follows:
December 31, | Maryland Fund | ||||||
| 2021: | $121,395 | ||||||
| 2022: | 267,268 | ||||||
| 2023: | 293,780 | ||||||
| 2024* | 156,792 | ||||||
| Total | 839,235 | ||||||
* Eligible for recapture through June 30, 2024.
U.S. Bancorp Fund Services, LLC, doing business as U.S. Bank Global Fund Services ("Fund Services"), serves as the Funds' administrator & fund accountant and transfer agent. The officers of the Trust are employees of Fund Services. U.S. Bank, N.A. serves as the Funds' custodian and provides compliance services to the Funds. Quasar Distributors, LLC ("Quasar"), serves as the Funds' distributor and principal underwriter. For the period
1919 Funds 2021 Semi-Annual Report
57
Notes to financial statements (cont'd)
ended, June 30, 2021, the Funds incurred the following expenses for administration & fund accounting, custody, transfer agent and compliance fees:
| 1919 Financial Services | 1919 Maryland Tax-Free Income Fund | 1919 Socially Responsive Balanced Fund | |||||||||||||
Administration & fund accounting | $ | 63,404 | $ | 57,444 | $ | 177,721 | |||||||||
Custody | 9,664 | 2,334 | 20,491 | ||||||||||||
Transfer agent* | 60,766 | 31,058 | 89,198 | ||||||||||||
Compliance | 3,008 | 3,080 | 3,008 | ||||||||||||
* Statements of operations include combined service fees paid to various intermediaries as detailed on Note 6.
At June 30, 2021, the Funds had payables for administration & fund accounting, custody, transfer agent and compliance fees in the following amounts:
| 1919 Financial Services | 1919 Maryland Tax-Free Income Fund | 1919 Socially Responsive Balanced Fund | |||||||||||||
Administration & fund accounting | $ | 21,296 | $ | 26,472 | $ | 61,310 | |||||||||
Custody | 2,575 | 705 | 5,715 | ||||||||||||
Transfer agent | 18,405 | 10,665 | 22,906 | ||||||||||||
Compliance | 984 | 1,008 | 984 | ||||||||||||
The above payable amounts are included in Accrued other expenses in each Fund's Statement of assets and liabilities.
The Independent Trustees were paid $23,471 for their services and reimbursement of travel expenses during the year ended June 30, 2021. The Funds pay no compensation to the Interested Trustee or officers of the Trust.
There is a maximum initial sales charge of 5.75% for Class A shares of the Financial Services Fund and Socially Responsive Fund; the maximum initial sales charge for Class A shares of the Maryland Fund is 4.25%. There is a contingent deferred sales charge ("CDSC") of 1.00% on Class C shares for the Funds, which applies if redemption occurs within 12 months from purchase. In certain cases, Class A shares have a 1.00% CDSC, which applies if redemption occurs within 18 months from purchase. This CDSC only applies to those purchases of Class A shares, which, when combined with other purchases in the Funds, equal or exceed $1,000,000 in the aggregate. These purchases do not incur an initial sales charge.
For Class A shares sold by the Distributor, the Distributor will receive the sales charge imposed on purchases of Class A shares (or any contingent deferred sales charge paid on redemptions) and will retain the full amount of such sales charge.
1919 Funds 2021 Semi-Annual Report
58
For the period ended June 30, 2021, Quasar, did not retain sales charges on sales of the Class A shares of the Financial Services Fund, Maryland Fund, and Socially Responsive Fund. In addition, for the period ended June 30, 2021, CDSCs paid to Quasar were:
CDSCs | Class A | Class C | |||||||||
Financial Services Fund | N/A | $ | 540 | ||||||||
Maryland Fund | N/A | $ | 518 | ||||||||
Socially Responsive Fund | N/A | $ | 3,887 | ||||||||
Note 4. Investments transactions
During the period ended June 30, 2021 the aggregate cost of purchases and proceeds from sales of investments (excluding short-term investments) and U.S Government & Agency Obligations were as follow:
FINANCIAL SERVICES FUND
Investments | U.S. Government & Agency Obligations | ||||||||||
Purchases | $ | 24,755,350 | — | ||||||||
Sales | $ | 6,722,213 | — | ||||||||
MARYLAND FUND
Investments | U.S. Government & Agency Obligations | ||||||||||
Purchases | $ | 9,795,895 | — | ||||||||
Sales | $ | 11,020,180 | — | ||||||||
SOCIALLY RESPONSIVE FUND
Investments | U.S. Government & Agency Obligations | ||||||||||
Purchases | $ | 191,627,818 | $ | 18,972,632 | |||||||
Sales | $ | 28,448,405 | $ | 3,402,334 | |||||||
Note 5. Income tax information and distributions to shareholders
At December 31, 2020, the components of distributable earnings for federal income tax purposes were as follows:
| Financial Services Fund | Maryland Fund | Socially Responsive Fund | |||||||||||||
Cost of Investments for tax purposes | $ | 89,969,100 | $ | 80,280,234 | $ | 363,610,251 | |||||||||
Gross tax unrealized appreciation | 72,906,690 | 6,209,103 | 127,057,960 | ||||||||||||
Gross tax unrealized depreciation | (2,028,253 | ) | (43,441 | ) | (984,097 | ) | |||||||||
Net tax unrealized appreciation on investment | 70,878,437 | 6,165,662 | 126,073,863 | ||||||||||||
Undistributed ordinary income | 165,963 | — | 118,857 | ||||||||||||
Undistributed tax-exempt income | — | 104,979 | — | ||||||||||||
Undistributed long-term capital gains | 1,552,500 | — | — | ||||||||||||
Capital loss carryforwards | — | (2,587,909 | ) | (2,958,487 | ) | ||||||||||
Other book/tax temporary differences* | (50,930 | ) | (80,424 | ) | (38,659 | ) | |||||||||
Total distributable earnings | $ | 72,545,970 | $ | 3,602,308 | $ | 123,195,574 | |||||||||
* Other book/tax differences are attributable primarily to the timing of the deductibility of various expenses.
1919 Funds 2021 Semi-Annual Report
59
Notes to financial statements (cont'd)
The tax character of distributions paid during the six months ended June 30, 2021 and the fiscal year ended December 31, 2020, for each Fund was as follows:
FINANCIAL SERVICES FUND
| Six Months Ended June 30, 2021 | Year Ended December 31, 2020 | ||||||||||
Distribution Paid From: | |||||||||||
Ordinary Income | $ | — | $ | 1,350,059 | |||||||
Net Long Term Capital Gains | — | 6,514,254 | |||||||||
Total | $ | — | $ | 7,864,313 | |||||||
MARYLAND FUND
| Six Months Ended June 30, 2021 | Year Ended December 31, 2020 | ||||||||||
Distribution Paid From: | |||||||||||
Tax Exempt Income | $ | 725,495 | $ | 1,855,022 | |||||||
Ordinary Income | — | 37,683 | |||||||||
Total | $ | 725,495 | $ | 1,892,705 | |||||||
SOCIALLY RESPONSIVE FUND
| Six Months Ended June 30, 2021 | Year Ended December 31, 2020 | ||||||||||
Distribution Paid From: | |||||||||||
Ordinary Income | $ | 608,476 | $ | 1,047,116 | |||||||
Net Long Term Capital Gains | — | 81,861 | |||||||||
Total | $ | 608,476 | $ | 1,128,977 | |||||||
GAAP require that certain components of net assets relating to permanent differences be reclassified between financial and tax reporting. These differences are primarily related reclassifications of foreign currency gains and losses and amortization adjustments made for reporting purposes. These classifications have no effect on net assets or net asset value per share. For the year ended December 31, 2020, the following table shows the reclassifications made:
| Accumulated Earnings (Loss) | Paid-in Capital | ||||||||||
Financial Services Fund | $ | — | $ | — | |||||||
Maryland Fund | — | — | |||||||||
Socially Responsive Fund | (11,802 | ) | 11,802 | ||||||||
As of December 31, 2020, the Funds have capital loss carry forward amounts ("CLCFs") as summarized in the following table. Under the provision of the Regulated Investment Company Modernization Act of 2010, CLCFs can be carried forward indefinitely, and applied to offset future capital gains. CLCFs are applied consistent with the character in which they originated as a new loss on the first day of the immediately succeeding tax year.
1919 Funds 2021 Semi-Annual Report
60
The Funds are required, in order to meet certain excise tax requirements, to measure and distribute annually, net capital gains realized during the twelve month period ending October 31. In connection with this requirement, the Funds are permitted, for tax purposes, to defer in to their next fiscal year any net capital losses incurred from November 1 through the end of the fiscal year. As of December 31, 2020, the Funds deferred, on a tax basis, post-October losses as shown in the table below:
| Financial Services Fund | Maryland Fund | Socially Responsive Fund | |||||||||||||
Capital Loss Carryovers — Short-Term | — | $ | 121,361 | $ | 888,271 | ||||||||||
Capital Loss Carryovers — Long-Term | — | 2,466,548 | 2,070,216 | ||||||||||||
Total | — | 2,587,909 | 2,958,487 | ||||||||||||
Note 6. Class specific expenses
The Funds have each adopted a Rule 12b-1 distribution plan, under which the Funds pay a service fee with respect to their Class A and Class C shares as reflected in the table below. The Funds pay a distribution fee with respect to Class C shares as reflected in the table below. Service and distribution fees are accrued daily and paid monthly.
Fund | Class A | Class C Service | Class C Distribution | ||||||||||||
Financial Services Fund | 0.25 | % | 0.25 | % | 0.75 | % | |||||||||
Maryland Fund | 0.15 | % | 0.25 | % | 0.45 | % | |||||||||
Socially Responsive Fund | 0.25 | % | 0.25 | % | 0.75 | % | |||||||||
For the six months ended June 30, 2021, class specific expenses were as follows:
FINANCIAL SERVICES FUND
June 30, 2021 | |||||||||||
Distribution Fees | Transfer Agent Fees | ||||||||||
Class A | $ | 97,378 | $ | 38,262 | |||||||
Class C | 158,176 | 10,908 | |||||||||
Class I | — | 36,461 | |||||||||
Total | $ | 255,554 | $ | 85,631 | |||||||
MARYLAND FUND
June 30, 2021 | |||||||||||
Distribution Fees | Transfer Agent Fees | ||||||||||
Class A | $ | 40,888 | $ | 13,629 | |||||||
Class C | 22,779 | 1,057 | |||||||||
Class I | — | 7,866 | |||||||||
Total | $ | 63,667 | $ | 22,552 | |||||||
1919 Funds 2021 Semi-Annual Report
61
Notes to financial statements (cont'd)
SOCIALLY RESPONSIVE FUND
June 30, 2021 | |||||||||||
Distribution Fees | Transfer Agent Fees | ||||||||||
Class A | $ | 253,732 | $ | 82,008 | |||||||
Class C | 393,090 | 18,590 | |||||||||
Class I | — | 104,904 | |||||||||
Total | $ | 646,822 | $ | 205,502 | |||||||
Note 7. Shares of beneficial interest
The Funds have an unlimited number of shares of beneficial interest authorized with no par value per share. The Funds have the ability to issue multiple classes of shares. Each class of shares represents an identical interest and has the same rights, except that each class bears certain direct expenses, including those specifically related to the distribution of its shares. Transactions in shares of each class were as follows:
1919 FINANCIAL SERVICES FUND
| Six Months Ended June 30, 2021 | Year Ended December 31, 2020 | ||||||||||||||||||
Shares | Amount | Shares | Amount | ||||||||||||||||
Class A | |||||||||||||||||||
Shares sold | 252,953 | $ | 7,996,319 | 365,845 | $ | 8,303,743 | |||||||||||||
Shares issued on reinvestment | — | — | 119,692 | 3,110,791 | |||||||||||||||
Shares repurchased | (246,849 | ) | (7,683,639 | ) | (764,227 | ) | (17,468,870 | ) | |||||||||||
Net Increase (decrease) | 6,104 | $ | 312,680 | (278,690 | ) | $ | (6,054,336 | ) | |||||||||||
Class C | |||||||||||||||||||
Shares sold | 153,716 | $ | 4,309,663 | 101,329 | $ | 2,219,974 | |||||||||||||
Shares issued on reinvestment | — | — | 48,662 | 1,152,324 | |||||||||||||||
Shares repurchased | (100,221 | ) | (2,795,303 | ) | (654,720 | ) | (13,309,933 | ) | |||||||||||
Net Increase (decrease) | 53,495 | $ | 1,514,360 | (504,729 | ) | $ | (9,937,635 | ) | |||||||||||
Class I | |||||||||||||||||||
Shares sold | 911,821 | $ | 28,944,052 | 868,499 | $ | 20,650,110 | |||||||||||||
Shares issued on reinvestment | — | — | 115,559 | 3,035,745 | |||||||||||||||
Shares repurchased | (454,648 | ) | (14,699,812 | ) | (1,935,675 | ) | (42,292,685 | ) | |||||||||||
Net Increase (decrease) | 457,173 | $ | 14,244,240 | (951,617 | ) | $ | (18,606,830 | ) | |||||||||||
1919 Funds 2021 Semi-Annual Report
62
1919 MARYLAND TAX-FREE INCOME FUND
| Six Months Ended June 30, 2021 | Year Ended December 31, 2020 | ||||||||||||||||||
Shares | Amount | Shares | Amount | ||||||||||||||||
Class A | |||||||||||||||||||
Shares sold | 293,131 | $ | 4,642,844 | 254,239 | $ | 4,008,864 | |||||||||||||
Shares issued on reinvestment | 25,775 | 407381 | 69,485 | 1,093,764 | |||||||||||||||
Shares repurchased | (159,106 | ) | (2,518,001 | ) | (470,563 | ) | (7,425,072 | ) | |||||||||||
Net increase (decrease) | 159,800 | $ | 2,532,224 | (146,839 | ) | $ | (2,322,444 | ) | |||||||||||
Class C | |||||||||||||||||||
Shares sold | 16,113 | $ | 255,595 | 131,715 | $ | 2,077,894 | |||||||||||||
Shares issued on reinvestment | 2,097 | 33,139 | 6,766 | 106,492 | |||||||||||||||
Shares repurchased | (108,610 | ) | (1,723,192 | ) | (172,836 | ) | (2,720,602 | ) | |||||||||||
Net increase (decrease) | (90,400 | ) | $ | (1,434,458 | ) | (34,355 | ) | $ | (536,216 | ) | |||||||||
Class I | |||||||||||||||||||
Shares sold | 331,003 | $ | 5,242,164 | 537,705 | $ | 8,470,480 | |||||||||||||
Shares issued on reinvestment | 12,858 | 203,309 | 28,838 | 454,205 | |||||||||||||||
Shares repurchased | (168,380 | ) | (2,665,762 | ) | (242,491 | ) | (3,814,670 | ) | |||||||||||
Net increase | 175,481 | $ | 2,779,711 | 324,052 | $ | 5,110,015 | |||||||||||||
1919 SOCIALLY RESPONSIVE BALANCED FUND
| Six Months Ended June 30, 2021 | Year Ended December 31, 2020 | ||||||||||||||||||
Shares | Amount | Shares | Amount | ||||||||||||||||
Class A | |||||||||||||||||||
Shares sold | 1,062,750 | $ | 26,893,695 | 1,786,293 | $ | 39,565,648 | |||||||||||||
Shares issued on reinvestment | 3,092 | 76,835 | 22,553 | 433,524 | |||||||||||||||
Shares repurchased | (397,449 | ) | (10,079,313 | ) | (782,815 | ) | (16,808,216 | ) | |||||||||||
Net increase | 668,393 | $ | 16,891,217 | 1,026,031 | $ | 23,190,956 | |||||||||||||
Class C | |||||||||||||||||||
Shares sold | 1,449,578 | $ | 36,674,334 | 531,201 | $ | 37,323,612 | |||||||||||||
Shares issued on reinvestment | — | — | 891 | 25,433 | |||||||||||||||
Shares repurchased | (129,818 | ) | (3,302,672 | ) | (109,604 | ) | (3,441,314 | ) | |||||||||||
Net increase | 1,319,760 | $ | 33,371,662 | 422,488 | $ | 33,907,731 | |||||||||||||
Class I | |||||||||||||||||||
Shares sold | 6,628,612 | $ | 166,673,302 | 2,270,761 | $ | 167,827,875 | |||||||||||||
Shares issued on reinvestment | 18,953 | 482,525 | 16,347 | 595,300 | |||||||||||||||
Shares repurchased | (1,552,309 | ) | (39,369,977 | ) | (938,302 | ) | (28,767,881 | ) | |||||||||||
Net increase | 5,095,256 | $ | 127,785,850 | 1,348,806 | $ | 139,655,294 | |||||||||||||
Note 8. Control Ownership
The beneficial ownership, either directly or indirectly, of more than 25% of the voting securities of a fund creates presumption of control of the fund under 2(a)(9) of the 1940 Act. As of June 30, 2021, Morgan Stanley, LLC. held approximately 43%, in aggregate for the benefit of others, of the outstanding shares of the Maryland Fund.
1919 Funds 2021 Semi-Annual Report
63
Notes to financial statements (cont'd)
Note 9. COVID-19 Risk
The global outbreak of COVID-19 (commonly referred to as "coronavirus") has disrupted economic markets and the prolonged economic impact is uncertain. The ultimate economic fallout from the pandemic, and the long-term impact on economies, markets, industries and individual issuers, are not known. The operational and financial performance of the issuers of securities in which the Fund invest depends on future developments, including the duration and spread of the outbreak, and such uncertainty may in turn adversely affect the value and liquidity of the Fund's investments, impair the Fund's ability to satisfy redemption requests, and negatively impact the Fund's performance.
Note 10. Subsequent events
In preparing these financial statements, the Funds have evaluated events and transactions for potential recognition or disclosure through the date the financial statements were available to be issued. Subsequent to the year end, the Maryland Fund has made the following distributions per share:
Record Date | Payable Date | Class A | Class C | Class I | |||||||||||||||
Daily | 7/31/2021 | $ | 0.13135 | $ | 0.08800 | $ | 0.14320 | ||||||||||||
On July 7, 2021, Foreside Financial Group, LLC ("Foreside"), the parent company of Quasar Distributors, LLC ("Quasar"), the Fund's distributor, announced that it had entered into a definitive purchase and sale agreement with Genstar Capital ("Genstar") such that Genstar would acquire a majority stake in Foreside. The transaction is expected to close at the end of the third quarter of 2021. Quasar will remain the (Fund's) distributor at the close of the transaction.
1919 Funds 2021 Semi-Annual Report
64
1919 Funds
Other information (unaudited)
June 30, 2021
Proxy Voting
The Funds' proxy voting guidelines and a record of the Funds' proxy votes for the 12 months ended June 30, 2021 are available without charge, upon request, by calling 1-844-828-1919 and on the Securities and Exchange Commission's website at www.sec.gov.
Quarterly Portfolio Schedule
The Funds file its complete schedule of portfolio holdings for the first and third quarters of each fiscal year with the SEC as an exhibit to its reports on Form N-PORT. The Funds' Form N-PORT reports are available without charge by visiting the SEC's website at www.sec.gov and may be reviewed and copied at the SEC's Public Reference Room in Washington D.C. You may obtain information on the operation of the Public Reference Room by calling (800) SEC-0330.
Statement Regarding Liquidity Risk Management Program
Each Fund has adopted a liquidity risk management program. The Funds' Board has designated a committee of the Adviser to serve as the administrator of the program. Personnel of the Adviser conducts the day-to-day operation of the program pursuant to policies and procedures administered by the committee.
Under the program, the committee manages each Fund's liquidity risk, which is the risk that the Fund could not meet shareholder redemption requests without significant dilution of remaining shareholders' interests in the Fund. This risk is managed by monitoring the degree of liquidity of each Fund's investments, limiting the amount of each Fund's illiquid investments, and utilizing various risk management tools and facilities available to each Fund for meeting shareholder redemptions, among other means. The committee's process of determining the degree of liquidity of each Fund's investments is supported by one or more third-party liquidity assessment vendors.
The Funds' Board reviewed a report prepared by the committee regarding the operation and effectiveness of the program for the period June 1, 2020 through December 31, 2020. No liquidity events impacting any of the Funds were noted in the report. In addition, the committee provided its assessment that the program had been effective in managing each Fund's liquidity risk.
1919 Funds 2021 Semi-Annual Report
65
Privacy notice
The 1919 Funds collect non-public information about you from the following sources:
Information we receive about you on applications or other forms;
Information you give us orally; and/or
Information about your transactions with us or others
We do not disclose any non-public personal information about our customers or former customers without the customer's authorization, except as permitted by law or in response to inquiries from governmental authorities. We may share information with affiliated and unaffiliated third parties with whom we have contracts for servicing a Fund. We will provide unaffiliated third parties with only the information necessary to carry out their assigned responsibilities. We maintain physical, electronic and procedural safeguards to guard your personal information and require third parties to treat your personal information with the same high degree of confidentiality.
In the event that you hold shares of a Fund through a financial intermediary, including, but not limited to, a broker-dealer, bank, or trust company, the privacy policy of your financial intermediary would govern how your non-public personal information would be shared with unaffiliated third parties.
1919 Funds 2021 Semi-Annual Report
66
Investment adviser
1919 Investment Counsel, LLC
One South Street, Suite 2500
Baltimore, MD 21202
Distributor
Quasar Distributors, LLC
111 East Kilbourn Ave.
Suite 2200
Milwaukee, Wisconsin 53202
Custodian
U.S. Bank National Association
Custody Operations
1555 North River Center Drive, Suite 302
Milwaukee, Wisconsin 53212
Transfer agent, fund accountant and fund administrator
U.S. Bancorp Fund Services, LLC
615 East Michigan Street
Milwaukee, Wisconsin 53202
Independent registered public accounting firm
BBD, LLP
1835 Market Street, 3rd Floor
Philadelphia, PA 19103
Legal counsel
Morgan, Lewis & Bockius LLP
1111 Pennsylvania Ave, NW
Washington, DC 20004
This report has been prepared for shareholders and may be distributed to others only if preceded or accompanied by a current prospectus.
Semi-Annual Report
June 30, 2021

1919 VARIABLE SOCIALLY RESPONSIVE BALANCED FUND
Table of Contents | |||||||
Letter to Shareholders | II | ||||||
Fund performance | 1 | ||||||
Fund expenses | 2 | ||||||
Fund at a glance | 3 | ||||||
Schedule of investments | 4 | ||||||
| Statement of assets and liabilities | 10 | ||||||
Statement of operations | 11 | ||||||
| Statements of changes in net assets | 12 | ||||||
Financial highlights | 13 | ||||||
| Notes to financial statements | 14 | ||||||
Other information | 21 | ||||||
Privacy notice | 22 | ||||||
| Directory of Fund's service providers | Back Cover | ||||||
Letter to Shareholders
Dear Shareholder,
We are pleased to bring you the semi-annual report on the 1919 Variable Socially Responsive Balanced Fund ("the Fund") through June 30, 2021.
Throughout the first half of 2021, the Fund took a variety of measures to respond to changing market conditions. During the first half of the year we increased exposure to the Consumer Discretionary, Consumer Staples, Financials and Materials sectors and decreased exposure to the Information Technology sector.
The fund is managed using socially responsible investment guidelines. An element of these guidelines is that the fund is invested using a "fossil free" approach whereby we do not invest in companies with a large carbon footprint and we seek to invest in companies that address the challenges of climate change. So far this year we have maintained overweight positions in the Consumer Discretionary, Consumer Staples, Health Care, Industrials, and Information Technology sectors and underweight positions in the Communication Services, Energy, Financials, Materials, and Utilities sectors.
During the first half of the year, the 10-year Treasury yield surged from 0.92% to 1.47% dragging bond returns into negative territory. The 10-year/2-year Treasury curve steepened by 42 basis points with the 10-year Treasury yield increase outpacing the 2-year Treasury yield rise. In the fixed-income portion of the Fund, we participated in several new deals with maturities ranging from 3- to 30-years with more of a focus in the 5-10 year area. The Fund continued to add green, social impact and sustainability bonds to further build out that segment of the portfolio. We maintained the overweight to corporate bonds based on solid credit fundamentals, the still low absolute level of Treasury yields and the Fed's unwavering support to the economy and employment.
In the equity portion of the Fund, our stock selection in the Information Technology, Consumer Staples, Health Care, and Utilities sectors contributed to relative performance in the year through June 30th. In terms of sector positioning, our overweighting in the Financials sector also enhanced results. On an individual stock basis, the largest contributors to performance were Apple Inc., Alphabet Inc., Microsoft Corp., NVIDIA Corp., and Charles Schwab Corp.
1919 Variable Socially Responsive Balanced Fund 2021 Semi-Annual Report
II
In the fixed-income portion of the Fund, the leading contributor to performance was the underweight to Treasuries. On an individual security basis, the largest contributors to return were Mastercard Inc. 1.9% 3/15/31, Host Hotels & Resorts LP 3.375% 12/15/29, DTE Electric Co. 1.9% 4/1/28, US Treasury 2% 11/15/26 and Bank of America Corp. FRN 9/15/25.
In the equity portion of the Fund, our stock selection in the Industrials and Consumer Discretionary sectors detracted from relative results for the year to date. In terms of sector positioning, our underweighting of the Energy sector detracted from performance. On an individual stock basis, the largest detractors from performance were Clarivate PLC, Teleflex Inc., Beyond Meat Inc., Verisk Analytics Inc., and Steel Dynamics Inc.
In the fixed-income portion of the Fund, the leading detractor was the underweight to longer-dated corporates. On an individual security basis, the leading detractors to performance were Federal National Mortgage Association 0.875% 08/05/30, DTE Electric Co. 4.05% 05/15/48, Johnson Controls International PLC 1.75% 9/15/30, Union Electric Co. 2.625% 3/15/51 and Prologis Inc. 1.25% 10/15/30.
Thank you for your investment in the 1919 Variable Socially Responsive Balanced Fund. As always, we appreciate that you have chosen us to manage your assets and we remain focused on achieving the Fund's investment and social goals.
Sincerely,

Ronald T. Bates
Portfolio Manager (Equity Portion)
1919 Investment Counsel, LLC

Aimee M. Eudy
Portfolio Manager (Fixed Income Portion)
1919 Investment Counsel, LLC

Robert Huesman, CFA
Portfolio Manager (Equity Portion)
1919 Investment Counsel, LLC

Alison Bevilacqua
Portfolio Manager (Head of Social Research) 1919 Investment Counsel, LLC
Past performance is not a guarantee of future results.
Opinions expressed herein are as of 6/30/21 and are subject to change at any time, are not a guaranteed and should not be considered investment advice.
Fund holdings and sector allocations are subject to change and are not a recommendation to buy or sell any security. Please refer to the Schedule of Investments for a complete list of Fund holdings.
1919 Variable Socially Responsive Balanced Fund 2021 Semi-Annual Report
III
Letter to Shareholders (cont'd)
This report has been prepared for shareholders and may be distributed to other if preceded or accompanied by a current prospectus.
Mutual fund investing involves risk. Principal loss is possible. The Fund's social policy may cause it to make or avoid investments for social reasons when it is otherwise disadvantageous to do so. The Fund may invest in foreign and emerging market securities which will involve greater volatility and political, economic and currency risks and differences in accounting methods. The risks are particularly significant for funds that invest in emerging markets. The Fund may make short sales of securities, which involves the risk that losses may exceed the original amount invested. Fixed income securities involve interest rate, credit, inflation and reinvestment risks; and possible loss of principal. As interest rates rise, the value of fixed income securities falls. The Fund may focus its investments in certain regions or industries, increasing its vulnerability to market volatility. The manager's investment style may become out of favor and/or the manager's selection process may prove incorrect; which may have a negative impact on the Fund's performance.
1919 Funds are distributed by Quasar Distributors, LLC.
1919 Variable Socially Responsive Balanced Fund 2021 Semi-Annual Report
IV
Fund performance (unaudited)
Total Returns as of June 30, 2021
6 Months | |||||||
1919 Variable Socially Responsive Balanced Fund | 8.81 | % | |||||
S&P 500 Index(i) | 15.25 | ||||||
Bloomberg Barclays U.S. Aggregate Index(ii) | -1.60 | ||||||
Blended S&P 500 Index (70%) and Barclays U.S. Aggregate Index (30%)(iii) | 9.99 | ||||||
As of the Fund's current prospectus dated April 30, 2021, the gross total and net annual operating expense ratios were 1.38% and 0.89%(iv), respectively. Actual expenses may be higher. For example, expenses may be higher than those shown if average net assets decrease. Net assets are more likely to decrease and Fund expense ratios are more likely to increase when markets are volatile.
All figures represent past performance and are not a guarantee of future results. Investment return and principal value of an investment will fluctuate so that an investor's shares, when redeemed, may be worth more or less than their original cost. Fund returns assume the reinvestment of all distributions, at net asset value and the deduction of all Fund expenses. The returns shown do not reflect expenses associated with separate accounts such as administrative fees, account charges and surrender charges, which, if reflected, would reduce the total returns. Performance figures may reflect compensating balance arrangements, fee waivers and/or expense reimbursements. In the absence of compensating balance arrangements, fee waivers and/or expense reimbursements, the total return would have been lower. Current performance of the Fund may be lower or higher than the performance quoted. Performance data current to the most recent month end may be obtained by calling 1-844-828-1919.
Fund holdings and sector allocations are subject to change at any time and should not be considered a recommendation to buy or sell any security. Please refer to the Schedule of investments in this report for a complete list of Fund holdings.
(i) The S&P 500 Index is an unmanaged index of 500 stocks and is generally representative of the performance of larger companies in the U.S.
(ii) The Bloomberg Barclays U.S. Aggregate Index is a broad-based bond index comprised of government, corporate, mortgage and asset-backed issues, rated investment grade or higher, and having at least one year to maturity.
(iii) The Blended S&P 500 Index (70%) and Bloomberg Barclays U.S. Aggregate Index (30%) has been prepared to parallel the targeted allocation of investments between equity and fixed-income securities. It consists of 70% of the performance of the S&P 500 Index and 30% of the Bloomberg Barclays U.S. Aggregate Index.
(iv) The Adviser has contractually agreed to waive fees and reimburse operating expenses through April 30, 2022.
The Indices are unmanaged and are not subject to the same management and trading expenses as a mutual fund. Please note that an investor cannot invest directly in an index.
1919 Variable Socially Responsive Balanced Fund 2021 Semi-Annual Report
1
Fund expenses (unaudited)
Example
As a shareholder of the Fund, you may incur two types of costs: (1) transaction costs, and (2) ongoing costs, including management fees; and other Fund expenses. This example is intended to help you understand your ongoing costs (in dollars) of investing in the Fund and to compare these costs with the ongoing costs of investing in other mutual funds.
This example is based on an investment of $1,000 invested on January 1, 2021 and held for the six months ended June 30, 2021.
Actual expenses
The table below titled "Based on Actual Total Return" provides information about actual account values and actual expenses. You may use the information provided in this table, together with the amount you invested, to estimate the expenses that you paid over the period. To estimate the expenses you paid on your account, divide your ending account value by $1,000 (for example, an $8,600 ending account value divided by $1,000 = 8.6), then multiply the result by the number under the heading entitled "Expenses Paid During the Period".
Hypothetical example for comparison purposes
The table below titled "Based on Hypothetical Total Return" provides information about hypothetical account values and hypothetical expenses based on the actual expense ratio and an assumed rate of return of 5.00% per year before expenses, which is not the Fund's actual return. The hypothetical account values and expenses may not be used to estimate the actual ending account balance or expenses you paid for the period. You may use the information provided in this table to compare the ongoing costs of investing in the Fund and other funds. To do so, compare the 5.00% hypothetical example relating to the Fund with the 5.00% hypothetical examples that appear in the shareholder reports of the other funds.
Please note that the expenses shown in the table below are meant to highlight your ongoing costs only and do not reflect any transactional costs. Therefore, the table is useful in comparing ongoing costs only, and will not help you determine the relative total costs of owning different funds. In addition, if these transaction costs were included, your costs would have been higher.
Based on actual total return1
| Actual Total Return2 | Beginning Account Value | Ending Account Value | Annualized Expense Ratio | Expenses Paid During the Period3 | |||||||||||||||
| 8.81 | % | $ | 1,000.00 | $ | 1,088.10 | 0.89 | % | $ | 5.40 | ||||||||||
Based on hypothetical total return1
| Hypothetical Annualized Total Return | Beginning Account Value | Ending Account Value | Annualized Expense Ratio | Expenses Paid During the Period3 | |||||||||||||||
| 2.90 | % | $ | 1,000.00 | $ | 1,023.87 | 0.89 | % | $ | 5.23 | ||||||||||
1 For the six months ended June 30, 2021.
2 Assumes the reinvestment of all distributions, including returns of capital, if any, at net asset value. Total return is not annualized, as it may not be representative of the total return for the year. Total returns do not reflect expenses associated with separate accounts such as administrative fees, account charges and surrender charges, which, if reflected, would reduce the total returns. Performance figures may reflect compensating balance arrangements, fee waivers and/or expense reimbursements. In the absence of compensating balance arrangements, fee waivers and/or expense reimbursements, the total return would have been lower. Past performance is no guarantee of future results.
3 Expenses (net of compensating balance arrangements, fee waivers and/or expense reimbursements) are equal to the Fund's annualized expense ratio multiplied by the average account value over the period, multiplied by the number of days in the most recent fiscal half-year (181), then divided by 365.
1919 Variable Socially Responsive Balanced Fund 2021 Semi-Annual Report
2
Fund at a glance† (unaudited)
Investment breakdown (%) as a percent of total investments
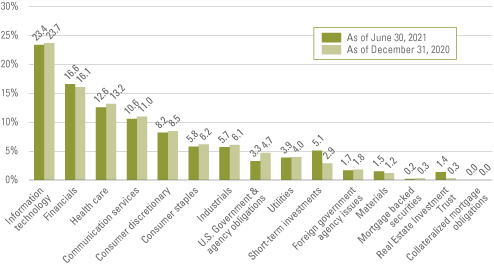
† The bar graph above represents the composition of the Fund's investments as of June 30, 2021 and December 31, 2020. The Fund is actively managed. As a result, the composition of the Fund's investments is subject to change at any time.
1919 Variable Socially Responsive Balanced Fund 2021 Semi-Annual Report
3
Schedule of investments
June 30, 2021 (unaudited)
1919 Variable Socially Responsive Balanced Fund
Security | Shares | Value | |||||||||
Common Stocks — 70.0% | |||||||||||
Communication Services — 7.6% | |||||||||||
Alphabet Inc.* | 563 | $ | 1,374,728 | ||||||||
Facebook Inc.* | 2,134 | 742,013 | |||||||||
Netflix Inc.* | 1,037 | 547,754 | |||||||||
Walt Disney Co/The* | 3,983 | 700,092 | |||||||||
Total Communication Services | 3,364,587 | ||||||||||
Consumer Discretionary — 7.2% | |||||||||||
Amazon.com Inc.* | 385 | 1,324,462 | |||||||||
Chipotle Mexican Grill Inc.* | 192 | 297,665 | |||||||||
Home Depot Inc/The | 2,118 | 675,409 | |||||||||
National Vision Holdings Inc.* | 6,178 | 315,881 | |||||||||
TJX Cos Inc. | 8,309 | 560,193 | |||||||||
Total Consumer Discretionary | 3,173,610 | ||||||||||
Consumer Staples — 5.3% | |||||||||||
Beyond Meat Inc.* | 1,479 | 232,928 | |||||||||
Costco Wholesale Corp. | 1,555 | 615,267 | |||||||||
Darling International Inc.* | 4,488 | 302,940 | |||||||||
Estee Lauder Cos. Inc. | 2,176 | 692,142 | |||||||||
PepsiCo Inc. | 3,509 | 519,928 | |||||||||
Total Consumer Staples | 2,363,205 | ||||||||||
Financials — 10.4% | |||||||||||
Bank of America Corp. | 25,652 | 1,057,632 | |||||||||
Charles Schwab Corp/The | 10,598 | 771,640 | |||||||||
Chubb Limited | 3,214 | 510,833 | |||||||||
CME Group Inc. | 2,445 | 520,003 | |||||||||
Hannon Armstrong Sustainable Infrastructure Capital Inc. | 7,259 | 407,593 | |||||||||
Truist Financial Corp. | 15,015 | 833,333 | |||||||||
Total Financials | 4,101,034 | ||||||||||
Health Care — 10.4% | |||||||||||
Boston Scientific Corp.* | 15,224 | 650,978 | |||||||||
Danaher Corp. | 3,006 | 806,690 | |||||||||
Genmab A/S* | 9,761 | 398,542 | |||||||||
IQVIA Holdings Inc.* | 2,742 | 664,441 | |||||||||
Teleflex Inc. | 1,629 | 654,516 | |||||||||
Thermo Fisher Scientific Inc. | 1,438 | 725,428 | |||||||||
UnitedHealth Group Inc. | 1,791 | 717,188 | |||||||||
Total Health Care | 4,617,783 | ||||||||||
1919 Variable Socially Responsive Balanced Fund 2021 Semi-Annual Report
4
1919 Variable Socially Responsive Balanced Fund
Security | Shares | Value | |||||||||||||||||
Industrials — 5.2% | |||||||||||||||||||
Cintas Corp. | 1,702 | $ | 650,164 | ||||||||||||||||
Eaton Corp. PLC | 4,146 | 614,354 | |||||||||||||||||
Illinois Tool Works Inc. | 1,126 | 251,729 | |||||||||||||||||
Union Pacific Corp. | 2,325 | 511,337 | |||||||||||||||||
Verisk Analytics Inc. | 1,481 | 258,760 | |||||||||||||||||
Total Industrials | 2,286,344 | ||||||||||||||||||
Information Technology — 21.5% | |||||||||||||||||||
Adobe Systems Inc.* | 909 | 532,347 | |||||||||||||||||
Apple Inc. | 10,565 | 1,446,982 | |||||||||||||||||
Autodesk Inc.* | 1,697 | 495,354 | |||||||||||||||||
Broadcom Inc. | 889 | 423,911 | |||||||||||||||||
Clarivate PLC* | 10,559 | 290,689 | |||||||||||||||||
Intuit Inc. | 1,051 | 515,169 | |||||||||||||||||
Microsoft Corp. | 6,204 | 1,680,664 | |||||||||||||||||
NVIDIA Corp. | 1,184 | 947,318 | |||||||||||||||||
Palo Alto Networks Inc.* | 1,071 | 397,394 | |||||||||||||||||
PayPal Holdings Inc.* | 2,636 | 768,341 | |||||||||||||||||
QUALCOMM Inc. | 2,592 | 370,475 | |||||||||||||||||
Salesforce.com Inc.* | 2,370 | 578,920 | |||||||||||||||||
SolarEdge Technologies Inc.* | 1,784 | 493,044 | |||||||||||||||||
Visa Inc. | 2,562 | 599,047 | |||||||||||||||||
Total Information Technology | 9,539,655 | ||||||||||||||||||
Materials — 1.2% | |||||||||||||||||||
Steel Dynamics Inc. | 1,886 | 112,406 | |||||||||||||||||
Trex Co Inc.* | 4,280 | 437,459 | |||||||||||||||||
Total Materials | 549,865 | ||||||||||||||||||
Real Estate Investment Trusts (REITS) — 1.1% | |||||||||||||||||||
Prologis Inc. | 4,074 | 486,965 | |||||||||||||||||
Total Real Estate Investment Trusts (REITS) | 486,965 | ||||||||||||||||||
Utilities — 1.2% | |||||||||||||||||||
American Water Works Co. Inc. | 3,394 | 523,117 | |||||||||||||||||
Total Utilities | 523,117 | ||||||||||||||||||
Total Common Stocks (Cost — $12,493,705) | 31,006,165 | ||||||||||||||||||
Rate | Maturity Date | Face Amount | |||||||||||||||||
Collateralized Mortgage Obligations — 0.0% | |||||||||||||||||||
| Federal National Mortgage Association (FNMA), 2011-53 CY | 4.000 | % | 6/25/41 | $ | 4,868 | 5,363 | |||||||||||||
| Total Collateralized Mortgage Obligations (Cost — $4,927) | 5,363 | ||||||||||||||||||
1919 Variable Socially Responsive Balanced Fund 2021 Semi-Annual Report
5
Schedule of investments (cont'd)
June 30, 2021 (unaudited)
1919 Variable Socially Responsive Balanced Fund
Security | Rate | Maturity Date | Face Amount | Value | |||||||||||||||
Corporate Bonds — 20.2% | |||||||||||||||||||
Communication Services — 3.1% | |||||||||||||||||||
Alphabet Inc. | 0.450 | % | 8/15/25 | $ | 130,000 | $ | 128,839 | ||||||||||||
AT&T Inc. | 4.450 | % | 4/1/24 | 150,000 | 163,896 | ||||||||||||||
AT&T Inc. | 4.350 | % | 3/1/29 | 115,000 | 133,356 | ||||||||||||||
Comcast Corp. | 3.375 | % | 2/15/25 | 70,000 | 76,052 | ||||||||||||||
Comcast Corp. | 5.650 | % | 6/15/35 | 200,000 | 271,267 | ||||||||||||||
Verizon Communications Inc. | 4.329 | % | 9/21/28 | 104,000 | 120,972 | ||||||||||||||
Verizon Communications Inc. | 3.875 | % | 2/8/29 | 100,000 | 113,834 | ||||||||||||||
Verizon Communications Inc. | 4.500 | % | 8/10/33 | 110,000 | 131,747 | ||||||||||||||
Verizon Communications Inc. | 5.250 | % | 3/16/37 | 105,000 | 138,300 | ||||||||||||||
Walt Disney Co/The | 2.200 | % | 1/13/28 | 90,000 | 93,435 | ||||||||||||||
Total Communication Services | 1,371,698 | ||||||||||||||||||
Consumer Discretionary — 1.1% | |||||||||||||||||||
Amazon.com Inc. | 0.250 | % | 5/12/23 | 115,000 | 114,910 | ||||||||||||||
Ford Foundation/The | 2.415 | % | 6/1/50 | 60,000 | 57,934 | ||||||||||||||
Lowe's Cos Inc. | 1.300 | % | 4/15/28 | 115,000 | 112,107 | ||||||||||||||
Toyota Motor Credit Corp. | 0.450 | % | 7/22/22 | 200,000 | 200,600 | ||||||||||||||
Total Consumer Discretionary | 485,551 | ||||||||||||||||||
Consumer Staples — 0.5% | |||||||||||||||||||
PepsiCo Inc. | 3.100 | % | 7/17/22 | 135,000 | 138,401 | ||||||||||||||
PepsiCo Inc. | 3.500 | % | 3/19/40 | 65,000 | 74,516 | ||||||||||||||
Total Consumer Staples | 212,917 | ||||||||||||||||||
Financials — 6.9% | |||||||||||||||||||
Affiliated Managers Group Inc. | 3.300 | % | 6/15/30 | 65,000 | 70,331 | ||||||||||||||
Ares Capital Corp. | 3.875 | % | 1/15/26 | 175,000 | 187,688 | ||||||||||||||
| Bank of America Corp. (effective 9/25/2024, US SOFR + 0.91)(a) | 0.981 | % | 9/25/25 | 125,000 | 124,988 | ||||||||||||||
Bank of America Corp. | 4.183 | % | 11/25/27 | 165,000 | 185,046 | ||||||||||||||
Bank of Montreal | 1.850 | % | 5/1/25 | 120,000 | 124,190 | ||||||||||||||
BlackRock Inc. | 3.250 | % | 4/30/29 | 105,000 | 117,559 | ||||||||||||||
Boston Properties LP | 4.500 | % | 12/1/28 | 155,000 | 181,055 | ||||||||||||||
| Citigroup Inc. (effective 10/30/2023, US SOFR + 0.686%)(a) | 0.776 | % | 10/30/24 | 175,000 | 175,471 | ||||||||||||||
Citigroup Inc. | 5.500 | % | 9/13/25 | 110,000 | 128,259 | ||||||||||||||
Goldman Sachs Group Inc. | 0.481 | % | 1/27/23 | 250,000 | 250,150 | ||||||||||||||
Host Hotels & Resorts LP | 3.375 | % | 12/15/29 | 225,000 | 236,431 | ||||||||||||||
Intercontinental Exchange Inc. | 3.750 | % | 12/1/25 | 75,000 | 83,246 | ||||||||||||||
| JPMorgan Chase & Co. (effective 9/16/2023, US SOFR + 0.60)(a) | 0.653 | % | 9/16/24 | 140,000 | 140,128 | ||||||||||||||
MetLife Inc. | 4.550 | % | 3/23/30 | 55,000 | 66,067 | ||||||||||||||
1919 Variable Socially Responsive Balanced Fund 2021 Semi-Annual Report
6
1919 Variable Socially Responsive Balanced Fund
Security | Rate | Maturity Date | Face Amount | Value | |||||||||||||||
Financials — continued | |||||||||||||||||||
PNC Financial Services Group Inc. | 2.200 | % | 11/1/24 | $ | 110,000 | $ | 115,497 | ||||||||||||
Prudential Financial Inc. | 1.500 | % | 3/10/26 | 170,000 | 172,814 | ||||||||||||||
Simon Property Group LP | 3.375 | % | 12/1/27 | 155,000 | 169,139 | ||||||||||||||
| State Street Corp. (effective 11/1/2029, US SOFR + 1.49)(a) | 3.031 | % | 11/1/34 | 85,000 | 90,761 | ||||||||||||||
TD Ameritrade Holding Corp. | 2.950 | % | 4/1/22 | 125,000 | 127,009 | ||||||||||||||
Toronto-Dominion Bank | 1.150 | % | 6/12/25 | 55,000 | 55,446 | ||||||||||||||
| Truist Financial Corp. (effective 3/2/2026, US SOFR + 0.609)(a) | 1.267 | % | 3/2/27 | 115,000 | 114,982 | ||||||||||||||
| Wells Fargo & Co. (effective 5/19/2024, US SOFR + 0.51)(a) | 0.805 | % | 5/19/25 | 145,000 | 144,823 | ||||||||||||||
Total Financials | 3,061,080 | ||||||||||||||||||
Health Care — 2.2% | |||||||||||||||||||
AbbVie Inc. | 4.400 | % | 11/6/42 | 150,000 | 182,423 | ||||||||||||||
Bristol-Myers Squibb Co. | 3.900 | % | 2/20/28 | 105,000 | 120,232 | ||||||||||||||
Bristol-Myers Squibb Co. | 3.400 | % | 7/26/29 | 125,000 | 140,151 | ||||||||||||||
CVS Health Corp. | 4.780 | % | 3/25/38 | 105,000 | 129,171 | ||||||||||||||
Evernorth Health Inc. | 3.050 | % | 11/30/22 | 185,000 | 190,893 | ||||||||||||||
Gilead Sciences Inc. | 4.600 | % | 9/1/35 | 100,000 | 122,717 | ||||||||||||||
UnitedHealth Group Inc. | 3.500 | % | 8/15/39 | 95,000 | 106,477 | ||||||||||||||
Total Health Care | 992,064 | ||||||||||||||||||
Industrials — 0.6% | |||||||||||||||||||
Johnson Controls International PLC | 1.750 | % | 9/15/30 | 150,000 | 144,849 | ||||||||||||||
Xylem Inc/NY | 1.950 | % | 1/30/28 | 115,000 | 116,368 | ||||||||||||||
Total Industrials | 261,217 | ||||||||||||||||||
Information Technology — 2.0% | |||||||||||||||||||
Apple Inc. | 2.850 | % | 2/23/23 | 185,000 | 192,172 | ||||||||||||||
Mastercard Inc. | 1.900 | % | 3/15/31 | 155,000 | 156,977 | ||||||||||||||
Microsoft Corp. | 4.200 | % | 11/3/35 | 175,000 | 216,674 | ||||||||||||||
QUALCOMM Inc. | 3.450 | % | 5/20/25 | 175,000 | 192,332 | ||||||||||||||
Salesforce.com Inc. | 1.500 | % | 7/15/28 | 120,000 | 120,273 | ||||||||||||||
Total Information Technology | 878,428 | ||||||||||||||||||
Materials — 0.3% | |||||||||||||||||||
Nutrien Ltd. | 4.200 | % | 4/1/29 | 110,000 | 126,709 | ||||||||||||||
Total Materials | 126,709 | ||||||||||||||||||
Real Estate Investment Trusts (REITS) — 0.8% | |||||||||||||||||||
Prologis LP | 2.250 | % | 4/15/30 | 115,000 | 117,710 | ||||||||||||||
Prologis LP | 1.250 | % | 10/15/30 | 115,000 | 108,507 | ||||||||||||||
Welltower Inc. | 2.700 | % | 2/15/27 | 125,000 | 132,913 | ||||||||||||||
Total Real Estate Investment Trusts (REITS) | 359,130 | ||||||||||||||||||
1919 Variable Socially Responsive Balanced Fund 2021 Semi-Annual Report
7
Schedule of investments (cont'd)
June 30, 2021 (unaudited)
1919 Variable Socially Responsive Balanced Fund
Security | Rate | Maturity Date | Face Amount | Value | |||||||||||||||
Utilities — 2.7% | |||||||||||||||||||
Avangrid Inc. | 3.800 | % | 6/1/29 | $ | 125,000 | $ | 141,348 | ||||||||||||
DTE Electric Co. | 1.900 | % | 4/1/28 | 125,000 | 127,130 | ||||||||||||||
DTE Electric Co. | 4.050 | % | 5/15/48 | 120,000 | 146,380 | ||||||||||||||
Duke Energy Carolinas LLC | 3.350 | % | 5/15/22 | 275,000 | 282,709 | ||||||||||||||
Georgia Power Co. | 3.250 | % | 4/1/26 | 100,000 | 108,251 | ||||||||||||||
MidAmerican Energy Co. | 3.650 | % | 4/15/29 | 90,000 | 101,940 | ||||||||||||||
NextEra Energy Capital Holdings Inc. | 1.900 | % | 6/15/28 | 120,000 | 121,270 | ||||||||||||||
Public Service Co of Colorado | 3.200 | % | 3/1/50 | 55,000 | 59,715 | ||||||||||||||
Union Electric Co. | 2.625 | % | 3/15/51 | 115,000 | 110,420 | ||||||||||||||
Total Utilities | 1,199,163 | ||||||||||||||||||
Total Corporate Bonds (Cost — $8,301,567) | 8,947,957 | ||||||||||||||||||
Foreign Government Agency Issues — 1.7% | |||||||||||||||||||
International Bank for Reconstruction & Development | 0.625 | % | 4/22/25 | 175,000 | 174,500 | ||||||||||||||
International Bank for Reconstruction & Development | 3.125 | % | 11/20/25 | 270,000 | 297,230 | ||||||||||||||
International Finance Corp. | 2.000 | % | 10/24/22 | 255,000 | 260,950 | ||||||||||||||
| Total Foreign Government Agency Issues (Cost — $698,201) | 732,680 | ||||||||||||||||||
Mortgage Backed Securities — 0.2% | |||||||||||||||||||
Federal Home Loan Mortgage Corporation (FHLMC) | |||||||||||||||||||
Gold Pool C91417 | 3.500 | % | 1/1/32 | 23,834 | 25,436 | ||||||||||||||
Gold Pool A35826 | 5.000 | % | 7/1/35 | 11,004 | 12,099 | ||||||||||||||
Gold Pool A49479 | 5.000 | % | 6/1/36 | 10,475 | 11,614 | ||||||||||||||
Gold Pool A65694 | 6.000 | % | 9/1/37 | 13,717 | 15,676 | ||||||||||||||
Federal National Mortgage Association (FNMA) | |||||||||||||||||||
Pool 896885 | 6.000 | % | 6/1/22 | 106 | 107 | ||||||||||||||
Pool 995262 | 5.500 | % | 1/1/24 | 3,585 | 3,713 | ||||||||||||||
Pool 891596 | 5.500 | % | 6/1/36 | 16,234 | 18,715 | ||||||||||||||
Pool 900936 | 6.500 | % | 2/1/37 | 2,596 | 2,910 | ||||||||||||||
Pool 946594 | 6.000 | % | 9/1/37 | 12,643 | 14,967 | ||||||||||||||
| Total Mortgage Backed Securities (Cost — $94,060) | 105,237 | ||||||||||||||||||
U.S. Government & Agency Obligations — 3.3% | |||||||||||||||||||
Federal Home Loan Mortgage Corp (FHLMC) | 6.250 | % | 7/15/32 | 70,000 | 103,039 | ||||||||||||||
Federal National Mortgage Association (FNMA) | 6.250 | % | 5/15/29 | 110,000 | 150,020 | ||||||||||||||
Federal National Mortgage Association (FNMA) | 6.625 | % | 11/15/30 | 365,000 | 528,994 | ||||||||||||||
United States Treasury Bonds | 7.625 | % | 11/15/22 | 250,000 | 275,488 | ||||||||||||||
United States Treasury Bonds | 3.500 | % | 2/15/39 | 131,000 | 163,991 | ||||||||||||||
United States Treasury Bonds | 4.375 | % | 11/15/39 | 177,000 | 246,396 | ||||||||||||||
| Total U.S. Government & Agency Obligations (Cost — $1,177,402) | 1,467,928 | ||||||||||||||||||
1919 Variable Socially Responsive Balanced Fund 2021 Semi-Annual Report
8
1919 Variable Socially Responsive Balanced Fund
Security | Rate | Shares | Value | ||||||||||||
Short-Term Investment — 5.1% | |||||||||||||||
| Fidelity Investments Money Market - Government Portfolio - Class I (b) | 0.010 | % | 2,246,924 | $ | 2,246,924 | ||||||||||
Total Short-Term Investment (Cost — $2,246,924) | 2,246,924 | ||||||||||||||
Total Investments — 100.5% (Cost — $25,016,786) | 44,512,254 | ||||||||||||||
Liabilities in Excess of Other Assets — (0.5)% | (219,000 | ) | |||||||||||||
Total Net Assets — 100.0% | $ | 44,293,255 | |||||||||||||
Notes:
* Non-income producing security.
(a) Fixed to floating rate. Effective date of change and formula disclosed.
(b) The rate is the annualized seven-day yield at period end.
Abbreviations used in this schedule:
LIBOR — London Inter-Bank Offered Rate
LLC — Limited Liability Corporation
PLC — Public Limited Company
SOFR — Secured Overnight Financing Rate
The Global Industry Classification Standard (GICS®) was developed by and/or is the exclusive property of Morgan Stanley Capital International, Inc. ("MSCI") and Standard & Poor's Financial Services LLC ("S&P"). GICS is a service mark of MSCI & S&P and has been licensed for use by U.S. Bancorp Fund Services, LLC.
The Accompanying Notes are an Integral Part of these Financial Statements.
1919 Variable Socially Responsive Balanced Fund 2021 Semi-Annual Report
9
Statement of assets and liabilities
June 30, 2021 (Unaudited)
Assets: | |||||||
Investments in securities at value (cost $25,016,786) | $ | 44,512,254 | |||||
Dividends and interest receivable | 75,774 | ||||||
Prepaid expenses | 1,353 | ||||||
Total Assets | 44,589,381 | ||||||
Liabilities: | |||||||
Payable for Fund shares repurchased | 86,905 | ||||||
Payable for securities purchased | 119,381 | ||||||
Advisory fees payable | 8,965 | ||||||
Accrued other expenses | 80,875 | ||||||
Total Liabilities | 296,126 | ||||||
Net Assets | $ | 44,293,255 | |||||
Components of Net Assets: | |||||||
Paid-in capital | $ | 21,828,028 | |||||
Total distributable earnings | 22,465,227 | ||||||
Net Assets | $ | 44,293,255 | |||||
Total Fund: | |||||||
Net Assets | $ | 44,293,255 | |||||
Shares Issued and Outstanding (unlimited shares authorized, no par value) | 1,172,209 | ||||||
Net Asset Value, Redemption Price and Offering Price Per Share | $ | 37.79 | |||||
The Accompanying Notes are an Integral Part of these Financial Statements.
1919 Variable Socially Responsive Balanced Fund 2021 Semi-Annual Report
10
Statement of operations
For the Six Months Ended June 30, 2021 (Unaudited)
Investment Income: | |||||||
Dividend income (Net of foreign tax of $354) | $ | 125,149 | |||||
Interest income | 151,324 | ||||||
Total Investment Income | 276,473 | ||||||
Expenses: | |||||||
Advisory fees (Note 3) | 137,568 | ||||||
Transfer agent fees and expenses (Note 3) | 47,731 | ||||||
Administration and fund accounting fees (Note 3) | 43,981 | ||||||
Legal fees | 11,901 | ||||||
Audit fees | 8,679 | ||||||
Shareholder reporting fees | 8,562 | ||||||
Trustees' fees (Note 3) | 7,741 | ||||||
Compliance fees (Note 3) | 3,012 | ||||||
Custody fees (Note 3) | 2,451 | ||||||
Insurance fees | 1,421 | ||||||
Miscellaneous fees | 3,983 | ||||||
Total Expenses | 277,030 | ||||||
Expenses waived by the Adviser (Note 3) | (88,667 | ) | |||||
Net Expenses | 188,363 | ||||||
Net Investment Income | 88,110 | ||||||
Realized and Unrealized Gain on Investments | |||||||
Net realized gain on investments | 2,039,473 | ||||||
Net change in unrealized appreciation/depreciation on investments | 1,502,074 | ||||||
Net Realized and Unrealized Gain on Investments | 3,541,547 | ||||||
Net Increase in Net Assets Resulting from Operations | $ | 3,629,657 | |||||
The Accompanying Notes are an Integral Part of these Financial Statements.
1919 Variable Socially Responsive Balanced Fund 2021 Semi-Annual Report
11
Statements of changes in net assets
| For the Six Months Ended June 30, 2021 (Unaudited) and the Year Ended December 31, 2020 | 2021 | 2020 | |||||||||
Increase in Net Assets From: | |||||||||||
Operations: | |||||||||||
Net investment income | $ | 88,110 | $ | 278,515 | |||||||
Net realized gain on investments | 2,039,473 | 2,708,185 | |||||||||
Net change in unrealized appreciation/depreciation on investments | 1,502,074 | 5,019,660 | |||||||||
Net Increase in Net Assets Resulting from Operations | 3,629,657 | 8,006,360 | |||||||||
Distributions to Shareholders | — | (2,717,567) | |||||||||
Capital Transactions: | |||||||||||
Net proceeds from shares sold | 299,521 | 865,196 | |||||||||
Reinvestment of distributions | — | 2,717,567 | |||||||||
Cost of shares repurchased | (1,810,506 | ) | (3,690,475 | ) | |||||||
Net Decrease in Net Assets from Capital Transactions | (1,510,985 | ) | (107,712 | ) | |||||||
Total Increase in Net Assets | 2,118,672 | 5,181,081 | |||||||||
Net Assets: | |||||||||||
Beginning of period | 42,174,583 | 36,993,502 | |||||||||
End of period | $ | 44,293,255 | $ | 42,174,583 | |||||||
Capital Share Transactions: | |||||||||||
Shares sold | 8,414 | 26,021 | |||||||||
Shares reinvested | — | 80,235 | |||||||||
Shares repurchased | (50,693 | ) | (115,222 | ) | |||||||
Net Decrease in Shares Outstanding | (42,279 | ) | (177,632 | ) | |||||||
The Accompanying Notes are an Integral Part of these Financial Statements.
1919 Variable Socially Responsive Balanced Fund 2021 Semi-Annual Report
12
Financial highlights
For a share of beneficial interest outstanding throughout each year ended December 31,
2021* | 2020 | 2019 | 2018 | 2017 | 2016 | ||||||||||||||||||||||
Net asset value, beginning of year | $ | 34.73 | $ | 30.24 | $ | 25.06 | $ | 27.88 | $ | 25.93 | $ | 26.29 | |||||||||||||||
Income (loss) from investment operations: | |||||||||||||||||||||||||||
Net investment income1 | 0.07 | 0.24 | 0.29 | 0.28 | 0.29 | 0.28 | |||||||||||||||||||||
Net realized and unrealized gain (loss) on investments | 2.99 | 6.63 | 6.36 | (0.42 | ) | 4.03 | 1.36 | ||||||||||||||||||||
| Total income (loss) from investment operations | 3.06 | 6.87 | 6.65 | (0.14 | ) | 4.32 | 1.64 | ||||||||||||||||||||
Less distributions: | |||||||||||||||||||||||||||
From net investment income | — | (0.25 | ) | (0.28 | ) | (0.30 | ) | (0.30 | ) | (0.26 | ) | ||||||||||||||||
From net realized gain on investments | — | (2.13 | ) | (1.19 | ) | (2.38 | ) | (2.07 | ) | (1.74 | ) | ||||||||||||||||
Total distributions | — | (2.38 | ) | (1.47 | ) | (2.68 | ) | (2.37 | ) | (2.00 | ) | ||||||||||||||||
Net asset value, end of year | $ | 37.79 | $ | 34.73 | $ | 30.24 | $ | 25.06 | $ | 27.88 | $ | 25.93 | |||||||||||||||
Total return2 | 8.81 | %6 | 22.93 | % | 26.70 | % | -0.94 | % | 16.74 | % | 6.23 | % | |||||||||||||||
Supplemental data and ratios: | |||||||||||||||||||||||||||
Net assets, end of year (in thousands) | $ | 44,293 | $ | 42,175 | $ | 36,994 | $ | 35,111 | $ | 39,356 | $ | 37,887 | |||||||||||||||
| Ratios to average net assets Gross expenses | 1.31 | %7 | 1.38 | % | 1.34 | % | 1.30 | % | 1.29 | % | 1.28 | % | |||||||||||||||
Net expenses3,4 | 0.897 | 0.89 | 0.895 | 0.89 | 0.89 | 0.89 | |||||||||||||||||||||
Net investment income | 0.427 | 0.71 | 1.00 | 0.96 | 1.04 | 1.04 | |||||||||||||||||||||
Portfolio turnover rate | 6 | %6 | 22 | % | 12 | % | 19 | % | 26 | % | 31 | % | |||||||||||||||
* For the six months ended June 30, 2021 (unaudited).
1 Per share amounts have been calculated using the average shares method.
2 Total returns do not reflect expenses associated with separate accounts such as administrative fees, account charges and surrender charges which, if reflected, would reduce the total return for all periods shown. Past performance is no guarantee of future results.
3 The Adviser has agreed to limit expenses, other than brokerage, interest, taxes, extraordinary expenses and acquired fund fees and expenses, to no more than 0.89% of the Fund's average net assets. This expense limitation arrangement cannot be terminated prior to April 30, 2022 without the Board of Trustees' consent.
4 Reflects fee waivers and/or expense reimbursements.
5 Interest expense was less than 0.01% for the year ended December 31, 2019.
6 Not annualized.
7 Annualized.
The Accompanying Notes are an Integral Part of these Financial Statements.
1919 Variable Socially Responsive Balanced Fund 2021 Semi-Annual Report
13
Notes to financial statements
Note 1. Organization
1919 Variable Socially Responsive Balanced Fund (the "Fund") is a diversified series of Trust for Advised Portfolios (the "Trust"). The Trust, a Delaware Statutory Trust, is registered under the Investment Company Act of 1940, as amended (the "1940 Act") as an open-end investment management company.
Shares of the Fund may only be purchased or redeemed through variable annuity contracts and variable life insurance policies offered by the separate accounts of participating insurance companies or through eligible pension or other qualified plans.
The Fund seeks capital appreciation and retention of net investment income.
Note 2. Significant accounting policies
The following is a summary of significant accounting policies consistently followed by the Fund in the preparation of its financial statements. These policies are in conformity with accounting principles generally accepted in the United States of America ("GAAP") for investment companies. The Fund is considered an investment company under GAAP and follows the accounting and reporting guidance applicable to investment companies in the Financial Accounting Standards Board Accounting Standards Codification Topic 946. The presentation of financial statements in conformity with GAAP requires management to make estimates and assumptions that affect the reported amounts of assets and liabilities and disclosure of contingent assets and liabilities at the date of the financial statements and the reported amounts of income and expenses during the period. Actual results may differ from those estimates.
(a) Securities valuation. Investments in securities traded on a national securities exchange are valued at the last reported sales price on the exchange on which the security is principally traded. Securities traded on the NASDAQ exchanges are valued at the NASDAQ Official Closing Price ("NOCP"). Exchange-traded securities for which no sale was reported and NASDAQ securities for which there is no NOCP are valued at the mean of the most recent quoted bid and ask prices. Unlisted securities held by the Fund are valued at the last sale price in the over-the-counter ("OTC") market. If there is no trading on a particular day, the mean between the last quoted bid and ask price is used.
Long-term fixed income securities are valued using prices provided by an independent pricing service approved by the Board of Trustees. Pricing services may use various valuation methodologies, including matrix pricing and other analytical models as well as market transactions and dealer quotations. Securities for which market quotations are not readily available are valued at their estimated fair value as determined in good faith by 1919 Investment Counsel, LLC (the "Adviser" or "1919") under procedures established by and under the general supervision and responsibility of the Trust's Board of Trustees.
1919 Variable Socially Responsive Balanced Fund 2021 Semi-Annual Report
14
Various inputs are used in determining the value of the Fund's investments. These inputs are summarized into three broad levels and described below:
• Level 1 — quoted prices in active markets for identical investments
• Level 2 — other significant observable inputs (including quoted prices for similar investments, interest rates, prepayment speeds, credit risk, etc.).
• Level 3 — significant unobservable inputs, including the Fund's own assumptions in determining the fair value of investments.
The inputs or methodologies used for valuing securities are not necessarily an indication of the risk associated with investing in those securities. The following is a summary of the inputs used in valuing the Fund's assets carried at value:
ASSETS
Description | Quoted Prices (Level 1) | Other Significant Observable Inputs (Level 2) | Significant Unobservable Inputs (Level 3) | Total | |||||||||||||||
Long-term investments* | |||||||||||||||||||
Common Stocks | $ | 31,006,165 | $ | — | $ | — | $ | 31,006,165 | |||||||||||
Collateralized Mortgage Obligations | — | 5,363 | — | 5,363 | |||||||||||||||
Corporate Bonds | — | 8,947,957 | — | 8,947,957 | |||||||||||||||
Foreign Government Agency Issues | — | 732,680 | — | 732,680 | |||||||||||||||
Mortgage Backed Securities | — | 105,237 | — | 105,237 | |||||||||||||||
U.S. Government & Agency Obligations | — | 1,467,928 | — | 1,467,928 | |||||||||||||||
Total long-term investments | $ | 31,006,165 | $ | 11,259,165 | $ | — | $ | 42,265,330 | |||||||||||
Short-term investment | $ | 2,246,924 | $ | — | $ | — | $ | 2,246,924 | |||||||||||
Total investments | $ | 33,253,089 | $ | 11,259,165 | $ | — | $ | 44,512,254 | |||||||||||
* See Schedule of investments for additional detailed categorizations.
(b) Foreign currency translation. Investment securities and other assets and liabilities denominated in foreign currencies are translated into U.S. dollar amounts based upon prevailing exchange rates on the date of valuation. Purchases and sales of investment securities and income and expense items denominated in foreign currencies are translated into U.S. dollar amounts based upon prevailing exchange rates on the respective dates of such transactions.
The Fund does not isolate that portion of the results of operations resulting from fluctuations in foreign exchange rates on investments from the fluctuations arising from changes in market prices of securities held. Such fluctuations are included with the net realized and unrealized gain or loss on investments.
Net realized foreign exchange gains or losses arise from sales of foreign currencies, including gains and losses on forward foreign currency contracts, currency gains or losses realized between the trade and settlement dates on securities transactions, and the difference between the amounts of dividends, interest, and foreign withholding taxes recorded
1919 Variable Socially Responsive Balanced Fund 2021 Semi-Annual Report
15
Notes to financial statements (cont'd)
on the Fund's books and the U.S. dollar equivalent of the amounts actually received or paid. Net unrealized foreign exchange gains and losses arise from changes in the values of assets and liabilities, other than investments in securities, on the date of valuation, resulting from changes in exchange rates.
Foreign security and currency transactions may involve certain considerations and risks not typically associated with those of U.S. dollar denominated transactions as a result of, among other factors, the possibility of lower levels of governmental supervision and regulation of foreign securities markets and the possibility of political or economic instability.
(c) Foreign investment risk. The Fund's investments in foreign securities may involve risks not present in domestic investments. Since securities may be denominated in foreign currencies, may require settlement in foreign currencies or pay interest or dividends in foreign currencies, changes in the relationship of these foreign currencies to the U.S. dollar can significantly affect the value of the investments and earnings of the Fund. Foreign investments may also subject the Fund to foreign government exchange restrictions, expropriation, taxation or other political, social or economic developments, all of which affect the market and/or credit risk of the investments.
(d) Credit and market risk. Investments in securities that are collateralized by residential real estate mortgages are subject to certain credit and liquidity risks. When market conditions result in an increase in default rates of the underlying mortgages and the foreclosure values of underlying real estate properties are materially below the outstanding amount of these underlying mortgages, collection of the full amount of accrued interest and principal on these investments may be doubtful. Such market conditions may significantly impair the value and liquidity of these investments and may result in a lack of correlation between their credit ratings and values.
(e) Security transactions and investment income. Security transactions are accounted for on a trade date basis. Interest income, adjusted for amortization of premium and accretion of discount, is recorded on the accrual basis. Dividend income is recorded on the ex-dividend date. Foreign dividend income is recorded on the ex-dividend date or as soon as practicable after the Fund determines the existence of a dividend declaration after exercising reasonable due diligence. The cost of investments sold is determined by use of the specific identification method. To the extent any issuer defaults or a credit event occurs that impacts the issuer, the Fund may halt any additional interest income accruals and consider the realizability of interest accrued up to the date of default or credit event.
(f) Distribution to shareholders. Distributions from net investment income and distributions of net realized gains, if any, are declared at least annually. Distributions to shareholders of the Fund are recorded on the ex-dividend date and are determined in accordance with income tax regulations, which may differ from GAAP.
1919 Variable Socially Responsive Balanced Fund 2021 Semi-Annual Report
16
(g) REIT distributions. The character of distributions received from Real Estate Investment Trusts (''REITs'') held by the Fund is generally comprised of net investment income, capital gains, and return of capital. It is the policy of the Fund to estimate the character of distributions received from underlying REITs based on historical data provided by the REITs. After each calendar year end, REITs report the actual tax character of these distributions. Differences between the estimated and actual amounts reported by the REITs are reflected in the Fund's records in the year in which they are reported by the REITs by adjusting related investment cost basis, capital gains and income, as necessary.
(h) Federal and other taxes. It is the Fund's policy to comply with the federal income and excise tax requirements of the Internal Revenue Code of 1986 (the "Code"), as amended, applicable to regulated investment companies. Accordingly, the Fund intends to distribute its taxable income and net realized gains, if any, to shareholders in accordance with timing requirements imposed by the Code. Therefore, no federal or state income tax provision is required in the Fund's financial statements.
Management has analyzed the Fund's tax positions taken on income tax returns for all open tax years (prior three fiscal years) and has concluded that as of June 30, 2021, no provision for income tax is required in the Fund's financial statements. The Fund's federal and state income and federal excise tax returns for tax years for which the applicable statutes of limitations have not expired are subject to examination by the Internal Revenue Service and state departments of revenue. The Fund has no examination in progress and is not aware of any tax position for which it is reasonably possible that the total amount of unrecognized tax benefits will significantly change in the next twelve months.
Under the applicable foreign tax laws, a withholding tax may be imposed on interest, dividends and capital gains at various rates.
Note 3. Investment management agreement and other transactions with affiliates
The Trust has an agreement with the Adviser to furnish investment advisory services to the Fund. Under the terms of this agreement, the Fund pays an investment management fee, calculated daily and paid monthly, in accordance with the following breakpoint schedule:
Average Daily Net Assets | Annual Rate | ||||||
First $100 million | 0.65 | % | |||||
Next $100 million | 0.61 | ||||||
Next $100 million | 0.51 | ||||||
Over $300 million | 0.46 | ||||||
The Adviser has agreed to waive fees and reimburse operating expenses (other than shareholder servicing fees pursuant to a Shareholder Servicing Plan, any front-end or contingent deferred loads, taxes, leverage interest, brokerage commissions, acquired fund fees and expenses, expenses incurred in connection with any merger or reorganization, portfolio transaction expenses, interest expense and dividends paid on short sales or
1919 Variable Socially Responsive Balanced Fund 2021 Semi-Annual Report
17
Notes to financial statements (cont'd)
extraordinary expenses such as litigation) so that total annual operating expenses do not exceed 0.89% (the "expense cap"). This expense limitation arrangement cannot be terminated prior to April 30, 2022, without the Board of Trustees' consent.
Effective April 30, 2017, the Adviser is permitted to recapture amounts waived or reimbursed to the Fund over a rolling three year period, provided that the total operating expenses of the Fund, including the recoupment, do not exceed the lesser of the established cap on expenses for that year or the cap in place when the waiver is incurred.
At June 30, 2021, the amounts waived by the Adviser and the eligible recapture periods are as follows:
December 31, | |||||||
| 2021: | $ | 81,752 | |||||
| 2022: | 157,757 | ||||||
| 2023: | 185,711 | ||||||
| 2024*: | 88,667 | ||||||
Total | 513,887 | ||||||
* Eligible for recapture through June 30, 2024.
U.S. Bancorp Fund Services, LLC doing business as U.S. Bank Global Fund Services ("Fund Services") serves as the Fund's administrator, fund accountant and transfer agent. The officers of the Trust are employees of Fund Services. U.S. Bank, N.A. serves as the Fund's custodian. Quasar Distributors, LLC ("Quasar"), an affiliate to Fund Services, acts as the Fund's distributor and principal underwriter. For the period ended, June 30, 2021, the Fund incurred the following expenses for administration & fund accounting, transfer agent, compliance and custody fees:
Administration & fund accounting | $ | 43,981 | |||||
Transfer agent* | $ | 20,060 | |||||
Compliance | $ | 3,012 | |||||
Custody | $ | 2,451 | |||||
* Statement of operations includes service fees paid to participating insurance companies.
At June 30, 2021, the Fund had payables for administration & fund accounting, transfer agent, compliance and custody fees in the following amounts:
Administration & fund accounting | $ | 15,130 | |||||
Transfer agent | $ | 7,400 | |||||
Compliance | $ | 988 | |||||
Custody | $ | 1,140 | |||||
The above payable amounts are included in Accrued other expenses in the Statement of assets and liabilities.
1919 Variable Socially Responsive Balanced Fund 2021 Semi-Annual Report
18
The Independent Trustees were paid $7,741 for their services and reimbursement of travel expenses during the period ended June 30, 2021. The Fund pays no compensation to the Interested Trustee or officers of the Trust.
Note 4. Investment transactions
During the period ended June 30, 2021, the aggregate cost of purchases and proceeds from sales of investments (excluding short-term investments) and U.S. Government & Agency Obligations were as follow:
Investments | U.S. Government & Agency Obligations | ||||||||||
Purchases | $ | 2,596,846 | $ | — | |||||||
Sales | 4,134,053 | 415,000 | |||||||||
Note 5. Income tax information and distributions to shareholders
At December 31, 2020, the components of distributable accumulated earnings (deficit) on a tax basis were as follows:
Cost of Investments for tax purposes | $ | 23,928,205 | |||||
Gross tax unrealized appreciation | 18,070,224 | ||||||
Gross tax unrealized depreciation | (76,830 | ) | |||||
Net tax unrealized appreciation on investments | 17,993,394 | ||||||
Undistributed ordinary income | 117,523 | ||||||
Undistributed long-term capital gains | 757,183 | ||||||
Other accumulated earnings (loss) | (32,530 | ) | |||||
Total distributable earnings | $ | 18,835,570 | |||||
GAAP require that certain components of net assets relating to permanent differences be reclassified between financial and tax reporting. These difference are related to the treatment of paydown losses from mortgage backed securities. These classifications have no effect on net assets or net asset value per share. For the year ended December 31, 2020, the following table show the reclassifications made:
| Undistributed Net Investment Income/(Loss) | Accumulated Net Realized Gain/(Loss) | ||||||
| (483 | ) | 483 | |||||
As of December 31, 2020, the Fund has no capital loss carryforward balance.
1919 Variable Socially Responsive Balanced Fund 2021 Semi-Annual Report
19
Notes to financial statements (cont'd)
The tax character of distributions paid during the six months ended June 30, 2021 and the fiscal year ended December 31, 2020, was as follows:
| Six Months Ended June 30, 2021 | Year Ended December 31, 2020 | ||||||||||
Distribution Paid From: | |||||||||||
Ordinary Income | $ | — | $ | 421,846 | |||||||
Net Long Term Capital Gains | — | 2,295,721 | |||||||||
Total | $ | — | $ | 2,717,567 | |||||||
Note 6. Subsequent events
In preparing these financial statements, the Fund has evaluated events and transactions for potential recognition or disclosure through the date the financial statements were available to be issued.
On July 7, 2021, Foreside Financial Group, LLC ("Foreside"), the parent company of Quasar Distributors, LLC ("Quasar"), the Fund's distributor, announced that it had entered into a definitive purchase and sale agreement with Genstar Capital ("Genstar") such that Genstar would acquire a majority stake in Foreside. The transaction is expected to close at the end of the third quarter of 2021. Quasar will remain the Fund's distributor at the close of the transaction.
Note 7. COVID-19 Risk
The global outbreak of COVID-19 (commonly referred to as "coronavirus") has disrupted economic markets and the prolonged economic impact is uncertain. The ultimate economic fallout from the pandemic, and the long-term impact on economies, markets, industries and individual issuers, are not known. The operational and financial performance of the issuers of securities in which the Fund invests depends on future developments, including the duration and spread of the outbreak, and such uncertainty may in turn adversely affect the value and liquidity of the Fund's investments, impair the Fund's ability to satisfy redemption requests, and negatively impact the Fund's performance.
1919 Variable Socially Responsive Balanced Fund 2021 Semi-Annual Report
20
Other information (unaudited)
June 30, 2021
Proxy Voting
The Fund's proxy voting guidelines and a record of the Fund's proxy votes for the 12 months ended June 30, 2021 are available without charge, upon request, by calling 1-844-828-1919 and on the Securities and Exchange Commission's website at www.sec.gov.
Quarterly Portfolio Schedule
The Fund files its complete schedule of portfolio holdings for the first and third quarters of each fiscal year with the SEC as an exhibit to its reports on Form N-PORT. The Fund's Form N-PORT reports are available without charge by visiting the SEC's website at www.sec.gov and may be reviewed and copied at the SEC's Public Reference Room in Washington D.C. You may obtain information on the operation of the Public Reference Room by calling (800) SEC-0330.
1919 Variable Socially Responsive Balanced Fund 2021 Semi-Annual Report
21
Privacy notice
The 1919 Funds collect non-public information about you from the following sources:
Information we receive about you on applications or other forms;
Information you give us orally; and/or
Information about your transactions with us or others
We do not disclose any non-public personal information about our customers or former customers without the customer's authorization, except as permitted by law or in response to inquiries from governmental authorities. We may share information with affiliated and unaffiliated third parties with whom we have contracts for servicing a Fund. We will provide unaffiliated third parties with only the information necessary to carry out their assigned responsibilities. We maintain physical, electronic and procedural safeguards to guard your personal information and require third parties to treat your personal information with the same high degree of confidentiality.
In the event that you hold shares of a Fund through a financial intermediary, including, but not limited to, a broker-dealer, bank, or trust company, the privacy policy of your financial intermediary would govern how your non-public personal information would be shared with unaffiliated third parties.
1919 Variable Socially Responsive Balanced Fund 2021 Semi-Annual Report
22
1919
Variable Socially Responsive Balanced Fund
Investment adviser
1919 Investment Counsel, LLC
One South Street, Suite 2500
Baltimore, MD 21202
Distributor
Quasar Distributors, LLC
111 East Kilbourn Ave.
Suite 2200
Milwaukee, Wisconsin 53202
Custodian
U.S. Bank National Association
Custody Operations
1555 North River Center Drive, Suite 302
Milwaukee, Wisconsin 53212
Transfer agent, fund accountant and fund administrator
U.S. Bancorp Fund Services, LLC
615 East Michigan Street
Milwaukee, Wisconsin 53202
Independent registered public accounting firm
BBD, LLP
1835 Market Street, 3rd Floor
Philadelphia, PA 19103
Legal counsel
Morgan, Lewis & Bockius LLP
1111 Pennsylvania Ave. NW
Washington, DC 20004
This report has been prepared for shareholders and may be distributed to others only if preceded or accompanied by a current prospectus.
Item 2. Code of Ethics.
Not applicable for semi-annual reports.
Item 3. Audit Committee Financial Expert.
Not applicable for semi-annual reports.
Item 4. Principal Accountant Fees and Services.
Not applicable for semi-annual reports.
Item 5. Audit Committee of Listed Registrants.
Not applicable to registrants who are not listed issuers (as defined in Rule 10A-3 under the Securities Exchange Act of 1934).
Item 6. Investments.
Schedule of Investments is included as part of the report to shareholders filed under Item 1 of this Form.
Item 7. Disclosure of Proxy Voting Policies and Procedures for Closed-End Management Investment Companies.
Not applicable to open-end investment companies.
Item 8. Portfolio Managers of Closed-End Management Investment Companies.
Not applicable to open-end investment companies.
Item 9. Purchases of Equity Securities by Closed-End Management Investment Company and Affiliated Purchasers.
Not applicable to open-end investment companies.
Item 10. Submission of Matters to a Vote of Security Holders.
There have been no material changes to the procedures by which shareholders may recommend nominees to the registrant’s Board of Trustees.
Item 11. Controls and Procedures.
| (a) | The Registrant’s [President/Principal Executive Officer] and [Treasurer/Principal Financial Officer] have reviewed the Registrant's disclosure controls and procedures (as defined in Rule 30a-3(c) under the Investment Company Act of 1940 (the “Act”)) as of a date within 90 days of the filing of this report, as required by Rule 30a-3(b) under the Act and Rules 13a-15(b) or 15d-15(b) under the Securities Exchange Act of 1934. Based on their review, such officers have concluded that the disclosure controls and procedures are effective in ensuring that information required to be disclosed in this report is appropriately recorded, processed, summarized and reported and made known to them by others within the Registrant and by the Registrant’s service provider. |
| (b) | There were no changes in the Registrant's internal control over financial reporting (as defined in Rule 30a-3(d) under the Act) that occurred during the second fiscal quarter of the period covered by this report that have materially affected, or are reasonably likely to materially affect, the Registrant's internal control over financial reporting. |
Item 12. Disclosure of Securities Lending Activities for Closed-End Management Investment Companies
Not applicable to open-end investment companies.
Item 13. Exhibits.
| (a) | (1) Any code of ethics or amendment thereto, that is the subject of the disclosure required by Item 2, to the extent that the registrant intends to satisfy Item 2 requirements through filing an exhibit. Not applicable for semi-annual reports. |
(3) Any written solicitation to purchase securities under Rule 23c-1 under the Act sent or given during the period covered by the report by or on behalf of the registrant to 10 or more persons. Not applicable to open-end investment companies.
(4) Change in the registrant’s independent public accountant. There was no change in the registrant’s independent public accountant for the period covered by this report.
| (b) | Certifications pursuant to Section 906 of the Sarbanes-Oxley Act of 2002. Furnished herewith. |
SIGNATURES
Pursuant to the requirements of the Securities Exchange Act of 1934 and the Investment Company Act of 1940, the registrant has duly caused this report to be signed on its behalf by the undersigned, thereunto duly authorized.
| Trust for Advised Portfolios |
| By | /s/ Christopher E. Kashmerick | ||
| Christopher E. Kashmerick, President |
| Date | 9/7/2021 |
Pursuant to the requirements of the Securities Exchange Act of 1934 and the Investment Company Act of 1940, this report has been signed below by the following persons on behalf of the registrant and in the capacities and on the dates indicated.
| By | /s/ Christopher E. Kashmerick | ||
| Christopher E. Kashmerick, President |
| Date | 9/7/2021 |
| By | /s/ Russell B. Simon | ||
| Russell B. Simon, Treasurer |
| Date | 9/7/2021 |