UNITED STATES
SECURITIES AND EXCHANGE COMMISSION
Washington, D.C. 20549
FORM N-CSR
CERTIFIED SHAREHOLDER REPORT OF REGISTERED
MANAGEMENT INVESTMENT COMPANIES
Investment Company Act file number 811-21422
Trust for Advised Portfolios
(Exact name of registrant as specified in charter)
615 East Michigan Street
Milwaukee, Wisconsin 53202
(Address of principal executive offices) (Zip code)
Christopher E. Kashmerick
Trust for Advised Portfolios
2020 East Financial Way, Suite 100
Glendora, CA 91741
(Name and address of agent for service)
(626) 914-7385
Registrant's telephone number, including area code
Date of fiscal year end: September 30
Date of reporting period: March 31, 2021
Item 1. Reports to Stockholders.
(a)

FRC Founders Index FundSM
FNDRX
SEMI-ANNUAL REPORT TO SHAREHOLDERS
MARCH 31, 2021
TABLE OF CONTENTS
Expense Example | 1 |
Allocation of Portfolio Holdings | 2 |
Schedule of Investments | 3 |
Statement of Assets and Liabilities | 13 |
Statement of Operations | 14 |
Statements of Changes in Net Assets | 15 |
Financial Highlights | 16 |
Notes to Financial Statements | 17 |
Additional Information | 23 |
Privacy Notice | 24 |
FRC Founders Index FundSM Expense Example (Unaudited) March 31, 2021 |
As a shareholder of the Fund, you may incur two types of costs: (1) transaction costs, including redemption fees; and (2) ongoing costs, including management fees, shareholder servicing fees, and other Fund expenses. This Example is intended to help you understand your ongoing costs (in dollars) of investing in the Fund and to compare these costs with the ongoing costs of investing in other mutual funds.
The Example is based on an investment of $1,000 invested at the beginning of the period and held for the entire period from October 1, 2020 to March 31, 2021 (the “period”).
Actual Expenses
The first line of the table below provides information about actual account values and actual expenses. You may use the information in this line, together with the amount you invested, to estimate the expenses you paid over the period. Simply divide your account value by $1,000 (for example, an $8,600 account value divided by $1,000 equals 8.6), then multiply the result by the number in the first line under the heading entitled “Expenses Paid During the Period” to estimate the expenses you paid on your account during the period.
Hypothetical Example for Comparison Purposes
The second line of the table below provides information about hypothetical account values and hypothetical expenses based on the Fund’s actual expense ratio and an assumed rate of return of 5% per year before expenses, which is not the Fund’s actual return. The hypothetical account values and expenses may not be used to estimate the actual ending account balance or expenses you paid for the period. You may use this information to compare the ongoing costs of investing in the Fund and other funds. To do so, compare this 5% hypothetical example with the 5% hypothetical examples that appear in the shareholder reports of other funds.
Please note that the expenses shown in the table are meant to highlight your ongoing costs only and do not reflect any transactional costs such as sales charges (loads). Therefore, the second line of the table is useful in comparing the ongoing costs only, and will not help you determine the relative total costs of owning different funds. In addition, if these transactional costs were included, your costs could have been higher.
Expenses Paid During the Period
| Beginning | Ending | Expenses |
Actual Fund Return | $ 1,000.00 | $ 1,371.90 | $ 2.96 |
Hypothetical 5% Return | 1,000.00 | 1,022.44 | 2.52 |
(1) | Expenses are equal to the Fund’s annualized expense ratio of 0.50%, multiplied by the average account value over the period, multiplied by 182/365. The expense ratios reflect an expense waiver. Assumes all dividends and distributions were reinvested. |
1
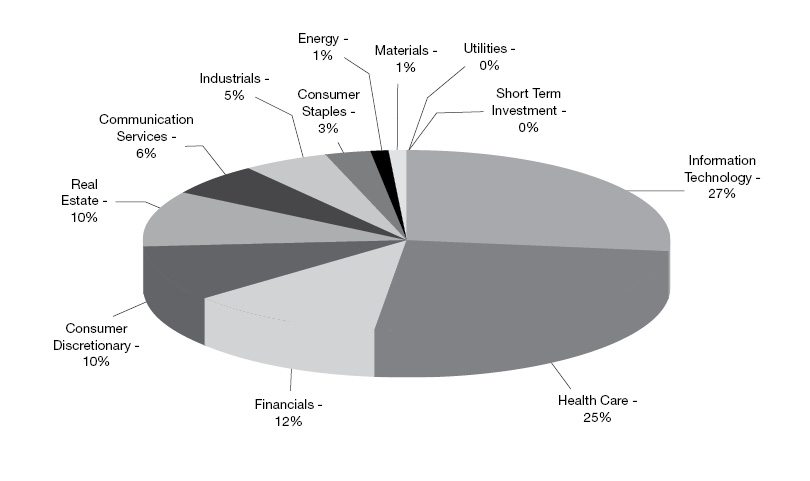
FRC Founders Index FundSM Allocation of Portfolio Holdings (Unaudited) March 31, 2021 |
(Calculated as a percentage of Total Investments) |
2
FRC Founders Index FundSM Schedule of Investments (Unaudited) March 31, 2021 |
Security Description | Shares | Value | ||||||
Common Stocks — 99.9% | ||||||||
Communication Services — 6.3% | ||||||||
Alphabet, Inc. - Class A* | 127 | $ | 261,940 | |||||
Alphabet, Inc. - Class C* | 126 | 260,647 | ||||||
Bandwidth, Inc. - Class A* | 1,351 | 171,226 | ||||||
Cardlytics, Inc.* | 1,897 | 208,101 | ||||||
Cargurus, Inc.* | 6,867 | 163,641 | ||||||
Cars.com, Inc.* | 17,608 | 228,200 | ||||||
Cinemark Holdings, Inc. | 11,462 | 233,940 | ||||||
Cogent Communications Holdings, Inc. | 3,679 | 252,968 | ||||||
DISH Network Corp. - Class A* | 6,614 | 239,427 | ||||||
EverQuote, Inc. - Class A* | 5,739 | 208,268 | ||||||
Facebook, Inc. - Class A* | 871 | 256,536 | ||||||
Netflix, Inc.* | 440 | 229,530 | ||||||
Nexstar Media Group, Inc. - Class A | 1,967 | 276,226 | ||||||
Pinterest, Inc. - Class A* | 3,140 | 232,454 | ||||||
Roku, Inc.* | 536 | 174,613 | ||||||
Spotify Technology SA* | 685 | 183,546 | ||||||
TechTarget, Inc.* | 3,196 | 221,962 | ||||||
TripAdvisor, Inc.* | 6,552 | 352,432 | ||||||
Twitter, Inc.* | 4,848 | 308,478 | ||||||
United States Cellular Corp.* | 6,746 | 246,094 | ||||||
Vonage Holdings Corp.* | 16,359 | 193,363 | ||||||
World Wrestling Entertainment, Inc. - Class A | 4,309 | 233,806 | ||||||
Yelp, Inc.* | 6,974 | 271,986 | ||||||
Zillow Group, Inc. - Class A* | 1,522 | 199,960 | ||||||
Zillow Group, Inc. - Class C* | 1,593 | 206,517 | ||||||
Zynga, Inc. - Class A* | 22,652 | 231,277 | ||||||
Total Communication Services | 6,047,138 | |||||||
Consumer Discretionary — 9.9% | ||||||||
1-800-Flowers.com, Inc. - Class A* | 7,425 | 205,004 | ||||||
Accel Entertainment, Inc.* | 21,062 | 230,208 | ||||||
Amazon.com, Inc.* | 71 | 219,680 | ||||||
Boyd Gaming Corp. * | 4,531 | 267,148 | ||||||
Bright Horizons Family Solutions, Inc.* | 1,383 | 237,115 | ||||||
CarMax, Inc.* | 2,058 | 273,014 | ||||||
Carvana Co.* | 762 | 199,949 | ||||||
Century Communities, Inc.* | 4,959 | 299,127 | ||||||
Cheesecake Factory Inc/The | 5,314 | 310,922 | ||||||
Dorman Products, Inc.* | 2,241 | 230,016 | ||||||
DR Horton, Inc. | 3,158 | 281,441 | ||||||
Five Below, Inc.* | 1,154 | 220,172 | ||||||
G-III Apparel Group Ltd.* | 7,951 | 239,643 | ||||||
Grubhub, Inc.* | 3,083 | 184,980 | ||||||
iRobot Corp.* | 2,455 | 299,952 | ||||||
Las Vegas Sands Corp. | 4,099 | 249,055 | ||||||
LGI Homes, Inc.* | 2,171 | 324,152 | ||||||
Lithia Motors, Inc. - Class A | 707 | 275,794 | ||||||
The accompanying notes are an integral part of these financial statements.
3
FRC Founders Index FundSM Schedule of Investments (Unaudited) (Continued) March 31, 2021 |
Security Description | Shares | Value | ||||||
Consumer Discretionary — 9.9% (Continued) | ||||||||
MDC Holdings, Inc. | 4,927 | $ | 292,664 | |||||
Meritage Homes Corp. * | 2,670 | 245,426 | ||||||
Oxford Industries, Inc. | 3,068 | 268,205 | ||||||
Peloton Interactive, Inc. - Class A* | 1,388 | 156,067 | ||||||
Quotient Technology, Inc.* | 22,193 | 362,634 | ||||||
Ralph Lauren Corp. | 1,990 | 245,088 | ||||||
RealReal Inc/The* | 8,037 | 181,877 | ||||||
Shake Shack, Inc. - Class A* | 1,969 | 222,044 | ||||||
Shutterstock, Inc. | 3,131 | 278,784 | ||||||
Skechers USA, Inc. - Class A* | 5,975 | 249,217 | ||||||
Smith & Wesson Brands, Inc. | 10,347 | 180,555 | ||||||
Sonic Automotive, Inc. - Class A | 4,563 | 226,188 | ||||||
Stitch Fix, Inc. - Class A* | 2,965 | 146,886 | ||||||
Tempur Sealy International, Inc. | 7,630 | 278,953 | ||||||
Tesla, Inc.* | 265 | 177,001 | ||||||
Texas Roadhouse, Inc. * | 2,717 | 260,669 | ||||||
Under Armour, Inc. - Class A* | 12,109 | 268,335 | ||||||
Under Armour, Inc. - Class C* | 14,050 | 259,363 | ||||||
Urban Outfitters, Inc.* | 7,787 | 289,599 | ||||||
Wayfair, Inc. - Class A* | 730 | 229,768 | ||||||
Zumiez, Inc.* | 4,868 | 208,837 | ||||||
Total Consumer Discretionary | 9,575,532 | |||||||
Consumer Staples — 3.2% | ||||||||
Beyond Meat, Inc.* | 1,563 | 203,378 | ||||||
Boston Beer Co Inc/The - Class A* | 241 | 290,713 | ||||||
Central Garden & Pet Co.* | 5,345 | 310,063 | ||||||
Central Garden & Pet Co. - Class A* | 5,795 | 300,703 | ||||||
Freshpet, Inc.* | 1,515 | 240,597 | ||||||
Inter Parfums, Inc. | 3,594 | 254,922 | ||||||
J & J Snack Foods Corp. | 1,451 | 227,851 | ||||||
National Beverage Corp.* | 4,941 | 241,664 | ||||||
Nu Skin Enterprises, Inc. - Class A | 3,933 | 208,016 | ||||||
PriceSmart, Inc. | 2,281 | 220,687 | ||||||
United Natural Foods, Inc.* | 9,867 | 325,019 | ||||||
USANA Health Sciences, Inc.* | 2,761 | 269,474 | ||||||
Total Consumer Staples | 3,093,087 | |||||||
Energy — 1.5% | ||||||||
Continental Resources, Inc./OK | 11,320 | 292,848 | ||||||
Kinder Morgan, Inc. | 14,141 | 235,448 | ||||||
Matador Resources Co. | 13,690 | 321,031 | ||||||
Scorpio Tankers, Inc. | 15,896 | 293,440 | ||||||
Talos Energy, Inc.* | 21,992 | 264,784 | ||||||
Total Energy | 1,407,551 | |||||||
Financials — 11.8% | ||||||||
Aflac, Inc. | 4,713 | 241,211 | ||||||
American Financial Group, Inc./OH | 2,498 | 285,022 | ||||||
The accompanying notes are an integral part of these financial statements.
4
FRC Founders Index FundSM Schedule of Investments (Unaudited) (Continued) March 31, 2021 |
Security Description | Shares | Value | ||||||
Financials — 11.8% (Continued) | ||||||||
AMERISAFE, Inc. | 3,777 | $ | 241,728 | |||||
Apollo Global Management, Inc. | 4,568 | 214,742 | ||||||
Ares Management Corp. - Class A | 4,853 | 271,913 | ||||||
Athene Holding Ltd. - Class A* | 4,937 | 248,825 | ||||||
BankUnited, Inc. | 5,641 | 247,922 | ||||||
BlackRock, Inc. | 301 | 226,942 | ||||||
Capital One Financial Corp. | 1,947 | 247,717 | ||||||
Carlyle Group Inc/The | 6,500 | 238,940 | ||||||
Charles Schwab Corp/The | 3,728 | 242,991 | ||||||
Cohen & Steers, Inc. | 2,975 | 194,357 | ||||||
Enstar Group Ltd.* | 1,017 | 250,924 | ||||||
Essent Group Ltd. | 4,554 | 216,269 | ||||||
Evercore, Inc. - Class A | 1,844 | 242,928 | ||||||
Fidelity National Financial, Inc. | 5,569 | 226,435 | ||||||
First Foundation, Inc. | 10,260 | 240,700 | ||||||
Focus Financial Partners, Inc. - Class A* | 4,406 | 183,378 | ||||||
Goosehead Insurance, Inc. - Class A* | 1,604 | 171,917 | ||||||
Home BancShares, Inc./AR | 10,376 | 280,671 | ||||||
Independent Bank Group, Inc. | 3,228 | 233,191 | ||||||
Interactive Brokers Group, Inc. - Class A | 3,174 | 231,829 | ||||||
Intercontinental Exchange, Inc. | 1,902 | 212,415 | ||||||
Kinsale Capital Group, Inc. | 1,105 | 182,104 | ||||||
KKR & Co, Inc. | 5,379 | 262,764 | ||||||
Ladder Capital Corp. | 21,433 | 252,909 | ||||||
LendingTree, Inc.* | 723 | 153,999 | ||||||
MarketAxess Holdings, Inc. | 419 | 208,628 | ||||||
Mercury General Corp. | 4,154 | 252,605 | ||||||
Moelis & Co. - Class A | 3,969 | 217,819 | ||||||
Morningstar, Inc. | 986 | 221,889 | ||||||
Nelnet, Inc. - Class A | 3,033 | 220,620 | ||||||
Palomar Holdings, Inc.* | 2,234 | 149,767 | ||||||
PennyMac Financial Services, Inc. | 3,875 | 259,121 | ||||||
PennyMac Mortgage Investment Trust | 12,720 | 249,312 | ||||||
Pinnacle Financial Partners, Inc. | 3,130 | 277,506 | ||||||
PRA Group, Inc.* | 6,139 | 227,573 | ||||||
Preferred Bank/Los Angeles CA | 4,234 | 269,621 | ||||||
Redwood Trust, Inc. | 25,323 | 263,613 | ||||||
SEI Investments Co. | 3,671 | 223,674 | ||||||
ServisFirst Bancshares, Inc. | 5,217 | 319,959 | ||||||
Signature Bank/New York NY | 1,419 | 320,836 | ||||||
Tradeweb Markets, Inc. - Class A | 3,390 | 250,860 | ||||||
Trupanion, Inc.* | 1,865 | 142,132 | ||||||
Veritex Holdings, Inc. | 7,619 | 249,294 | ||||||
Virtu Financial, Inc. - Class A | 8,955 | 278,053 | ||||||
W R Berkley Corp. | 3,312 | 249,559 | ||||||
Wintrust Financial Corp. | 3,232 | 244,986 | ||||||
Total Financials | 11,342,170 | |||||||
The accompanying notes are an integral part of these financial statements.
5
FRC Founders Index FundSM Schedule of Investments (Unaudited) (Continued) March 31, 2021 |
Security Description | Shares | Value | ||||||
Health Care — 25.2% | ||||||||
10X Genomics, Inc. - Class A* | 1,219 | $ | 220,639 | |||||
Adaptive Biotechnologies Corp.* | 3,365 | 135,475 | ||||||
Aerie Pharmaceuticals, Inc.* | 15,702 | 280,595 | ||||||
Akero Therapeutics, Inc.* | 7,491 | 217,314 | ||||||
Alector, Inc.* | 12,984 | 261,498 | ||||||
Allogene Therapeutics, Inc.* | 6,763 | 238,734 | ||||||
Alnylam Pharmaceuticals, Inc.* | 1,317 | 185,947 | ||||||
Amicus Therapeutics, Inc.* | 10,032 | 99,116 | ||||||
Amphastar Pharmaceuticals, Inc.* | 11,720 | 214,710 | ||||||
Apellis Pharmaceuticals, Inc.* | 4,180 | 179,364 | ||||||
Applied Therapeutics, Inc.* | 10,007 | 187,681 | ||||||
Arcus Biosciences, Inc.* | 5,923 | 166,318 | ||||||
Arcutis Biotherapeutics, Inc.* | 7,651 | 221,343 | ||||||
Axonics Modulation Technologies, Inc.* | 4,237 | 253,754 | ||||||
Axsome Therapeutics, Inc.* | 2,854 | 161,593 | ||||||
Bioxcel Therapeutics, Inc.* | 4,254 | 183,603 | ||||||
Black Diamond Therapeutics, Inc.* | 8,131 | 197,258 | ||||||
Blueprint Medicines Corp.* | 2,169 | 210,892 | ||||||
Bridgebio Pharma, Inc.* | 3,193 | 196,689 | ||||||
Cara Therapeutics, Inc.* | 11,802 | 256,221 | ||||||
Castle Biosciences, Inc.* | 2,954 | 202,231 | ||||||
Cerus Corp.* | 30,213 | 181,580 | ||||||
ChemoCentryx, Inc.* | 3,532 | 180,980 | ||||||
Coherus Biosciences, Inc.* | 12,354 | 180,492 | ||||||
Corcept Therapeutics, Inc.* | 7,784 | 185,181 | ||||||
Cortexyme, Inc.* | 6,717 | 242,014 | ||||||
CorVel Corp.* | 2,076 | 212,977 | ||||||
Cue Biopharma, Inc.* | 17,371 | 211,926 | ||||||
Danaher Corp. | 925 | 208,199 | ||||||
Deciphera Pharmaceuticals, Inc.* | 4,375 | 196,175 | ||||||
Denali Therapeutics, Inc.* | 2,999 | 171,243 | ||||||
Dicerna Pharmaceuticals, Inc.* | 9,293 | 237,622 | ||||||
Eagle Pharmaceuticals, Inc./DE* | 4,323 | 180,442 | ||||||
Emergent BioSolutions, Inc.* | 2,061 | 191,488 | ||||||
Ensign Group, Inc./The | 2,586 | 242,670 | ||||||
Exelixis, Inc.* | 9,233 | 208,573 | ||||||
Fate Therapeutics, Inc.* | 1,928 | 158,964 | ||||||
Frequency Therapeutics, Inc.* | 6,110 | 58,045 | ||||||
Globus Medical, Inc. - Class A* | 3,442 | 212,268 | ||||||
Gossamer Bio, Inc.* | 21,287 | 196,905 | ||||||
Guardant Health, Inc.* | 1,375 | 209,894 | ||||||
HealthStream, Inc.* | 8,744 | 195,341 | ||||||
Hologic, Inc.* | 2,878 | 214,066 | ||||||
ImmunityBio, Inc.* | 12,698 | 301,451 | ||||||
Inogen, Inc.* | 4,982 | 261,655 | ||||||
Inspire Medical Systems, Inc.* | 1,044 | 216,098 | ||||||
Intra-Cellular Therapies, Inc.* | 6,484 | 220,002 | ||||||
Invitae Corp.* | 4,165 | 159,145 | ||||||
Ionis Pharmaceuticals, Inc.* | 3,574 | 160,687 | ||||||
The accompanying notes are an integral part of these financial statements.
6
FRC Founders Index FundSM Schedule of Investments (Unaudited) (Continued) March 31, 2021 |
Security Description | Shares | Value | ||||||
Health Care — 25.2% (Continued) | ||||||||
Jazz Pharmaceuticals Plc* | 1,306 | $ | 214,667 | |||||
Karuna Therapeutics, Inc.* | 2,213 | 266,069 | ||||||
Karyopharm Therapeutics, Inc.* | 14,662 | 154,244 | ||||||
Kiniksa Pharmaceuticals Ltd. - Class A* | 11,035 | 204,258 | ||||||
Kodiak Sciences, Inc.* | 1,382 | 156,705 | ||||||
Krystal Biotech, Inc.* | 3,228 | 248,685 | ||||||
Kura Oncology, Inc.* | 6,425 | 181,635 | ||||||
LHC Group, Inc.* | 1,040 | 198,858 | ||||||
MacroGenics, Inc.* | 10,638 | 338,820 | ||||||
Madrigal Pharmaceuticals, Inc.* | 2,009 | 234,993 | ||||||
Masimo Corp.* | 838 | 192,455 | ||||||
MEDNAX, Inc.* | 9,282 | 236,413 | ||||||
Medpace Holdings, Inc.* | 1,549 | 254,113 | ||||||
Merit Medical Systems, Inc.* | 3,931 | 235,388 | ||||||
Moderna, Inc.* | 1,690 | 221,305 | ||||||
Morphic Holding, Inc.* | 7,256 | 459,160 | ||||||
Natera, Inc.* | 1,823 | 185,107 | ||||||
National Research Corp. | 4,699 | 220,054 | ||||||
Neoleukin Therapeutics, Inc.* | 16,359 | 201,379 | ||||||
Neurocrine Biosciences, Inc.* | 2,034 | 197,807 | ||||||
NextGen Healthcare, Inc. * | 10,344 | 187,226 | ||||||
NGM Biopharmaceuticals, Inc.* | 8,029 | 233,403 | ||||||
Omeros Corp.* | 12,129 | 215,896 | ||||||
Omnicell, Inc.* | 1,815 | 235,714 | ||||||
ORIC Pharmaceuticals, Inc.* | 6,069 | 148,691 | ||||||
Passage Bio, Inc.* | 7,757 | 135,592 | ||||||
Penumbra, Inc.* | 959 | 259,486 | ||||||
PetIQ, Inc.* | 5,852 | 206,342 | ||||||
Phathom Pharmaceuticals, Inc.* | 5,833 | 219,087 | ||||||
Phreesia, Inc.* | 3,479 | 181,256 | ||||||
Provention Bio, Inc.* | 14,603 | 153,258 | ||||||
PTC Therapeutics, Inc.* | 3,198 | 151,425 | ||||||
QIAGEN NV* | 4,117 | 200,457 | ||||||
Quanterix Corp.* | 2,945 | 172,194 | ||||||
RadNet, Inc.* | 10,649 | 231,616 | ||||||
Reata Pharmaceuticals, Inc. - Class A* | 1,957 | 195,113 | ||||||
Regeneron Pharmaceuticals, Inc.* | 423 | 200,138 | ||||||
REGENXBIO, Inc.* | 4,531 | 154,552 | ||||||
Replimune Group, Inc.* | 5,067 | 154,594 | ||||||
ResMed, Inc. | 1,035 | 200,811 | ||||||
REVOLUTION Medicines, Inc.* | 5,373 | 246,513 | ||||||
Rubius Therapeutics, Inc.* | 23,106 | 612,309 | ||||||
Sage Therapeutics, Inc.* | 2,397 | 179,415 | ||||||
Seagen, Inc.* | 1,179 | 163,716 | ||||||
Select Medical Holdings Corp. * | 7,680 | 261,888 | ||||||
Silk Road Medical, Inc.* | 3,662 | 185,480 | ||||||
Simulations Plus, Inc. | 3,077 | 194,589 | ||||||
Sorrento Therapeutics, Inc.* | 23,057 | 190,681 | ||||||
Stoke Therapeutics, Inc.* | 3,290 | 127,784 | ||||||
The accompanying notes are an integral part of these financial statements.
7
FRC Founders Index FundSM Schedule of Investments (Unaudited) (Continued) March 31, 2021 |
Security Description | Shares | Value | ||||||
Health Care — 25.2% (Continued) | ||||||||
Supernus Pharmaceuticals, Inc.* | 7,496 | $ | 196,245 | |||||
Tabula Rasa HealthCare, Inc.* | 4,235 | 195,022 | ||||||
TG Therapeutics, Inc.* | 4,414 | 212,755 | ||||||
Translate Bio, Inc.* | 9,389 | 154,825 | ||||||
Tricida, Inc.* | 31,159 | 164,831 | ||||||
Twist Bioscience Corp.* | 1,208 | 149,623 | ||||||
Ultragenyx Pharmaceutical, Inc.* | 1,588 | 180,810 | ||||||
United Therapeutics Corp.* | 1,267 | 211,931 | ||||||
UnitedHealth Group, Inc. | 624 | 232,172 | ||||||
Universal Health Services, Inc. - Class B | 1,653 | 220,494 | ||||||
Vaxart, Inc.* | 30,508 | 184,573 | ||||||
Veeva Systems, Inc. - Class A* | 808 | 211,082 | ||||||
Veracyte, Inc.* | 4,313 | 231,824 | ||||||
Vir Biotechnology, Inc.* | 5,572 | 285,676 | ||||||
Xencor, Inc.* | 4,520 | 194,631 | ||||||
Y-mAbs Therapeutics, Inc.* | 4,607 | 139,316 | ||||||
Zentalis Pharmaceuticals, Inc.* | 4,458 | 193,433 | ||||||
Zogenix, Inc.* | 11,751 | 229,380 | ||||||
Zynex, Inc.* | 13,259 | 202,465 | ||||||
Total Health Care | 24,259,487 | |||||||
Industrials — 4.7% | ||||||||
AAON, Inc. | 3,110 | 217,731 | ||||||
Air Lease Corp. | 5,061 | 247,989 | ||||||
Ameresco, Inc. - Class A* | 4,054 | 197,146 | ||||||
API Group Corp.* | 12,446 | 257,383 | ||||||
Axon Enterprise, Inc.* | 1,453 | 206,936 | ||||||
Bloom Energy Corp. - Class A* | 6,006 | 162,462 | ||||||
Cimpress Plc* | 2,335 | 233,804 | ||||||
Clean Harbors, Inc.* | 2,681 | 225,365 | ||||||
Colfax Corp.* | 5,656 | 247,789 | ||||||
Copart, Inc.* | 1,892 | 205,490 | ||||||
CoStar Group, Inc.* | 257 | 211,226 | ||||||
FedEx Corp. | 867 | 246,263 | ||||||
Insperity, Inc. | 2,580 | 216,049 | ||||||
Lyft, Inc. - Class A* | 4,575 | 289,049 | ||||||
MasTec, Inc.* | 2,697 | 252,709 | ||||||
PGT Innovations, Inc.* | 9,675 | 244,294 | ||||||
Plug Power, Inc.* | 3,642 | 130,529 | ||||||
Sunrun, Inc.* | 2,600 | 157,248 | ||||||
TransDigm Group, Inc.* | 374 | 219,882 | ||||||
TriNet Group, Inc.* | 2,725 | 212,441 | ||||||
Vicor Corp. * | 2,247 | 191,062 | ||||||
Total Industrials | 4,572,847 | |||||||
Information Technology — 26.6% | ||||||||
2U, Inc.* | 5,136 | 196,349 | ||||||
3D Systems Corp.* | 7,754 | 212,770 | ||||||
Adobe, Inc. * | 478 | 227,227 | ||||||
The accompanying notes are an integral part of these financial statements.
8
FRC Founders Index FundSM Schedule of Investments (Unaudited) (Continued) March 31, 2021 |
Security Description | Shares | Value | ||||||
Information Technology — 26.6% (Continued) | ||||||||
Akamai Technologies, Inc.* | 2,058 | $ | 209,710 | |||||
Alarm.com Holdings, Inc.* | 2,244 | 193,837 | ||||||
Altair Engineering, Inc. - Class A* | 3,657 | 228,819 | ||||||
Alteryx, Inc. - Class A* | 1,816 | 150,655 | ||||||
Ambarella, Inc.* | 2,099 | 210,719 | ||||||
Analog Devices, Inc. | 1,389 | 215,406 | ||||||
Appfolio, Inc. - Class A* | 1,432 | 202,499 | ||||||
Appian Corp.* | 1,291 | 171,638 | ||||||
Arista Networks, Inc.* | 691 | 208,606 | ||||||
Atlassian Corp Plc - Class A* | 983 | 207,177 | ||||||
Avalara, Inc.* | 1,394 | 186,001 | ||||||
Bill.com Holdings, Inc.* | 1,715 | 249,533 | ||||||
Blackline, Inc.* | 1,742 | 188,833 | ||||||
Box, Inc. - Class A* | 12,169 | 279,400 | ||||||
Cadence Design Systems, Inc.* | 1,627 | 222,883 | ||||||
Calix, Inc.* | 6,684 | 231,667 | ||||||
CEVA, Inc.* | 4,062 | 228,081 | ||||||
Ciena Corp.* | 4,109 | 224,845 | ||||||
Cloudflare, Inc. - Class A* | 2,814 | 197,712 | ||||||
CMC Materials, Inc. | 1,330 | 235,131 | ||||||
Cognex Corp. | 2,606 | 216,272 | ||||||
Cornerstone OnDemand, Inc.* | 5,046 | 219,905 | ||||||
Crowdstrike Holdings, Inc. - Class A* | 998 | 182,145 | ||||||
Datadog, Inc. - Class A* | 2,194 | 182,848 | ||||||
Dell Technologies, Inc. - Class C* | 2,950 | 260,043 | ||||||
Domo, Inc. - Class B* | 3,128 | 176,075 | ||||||
Dropbox, Inc. - Class A* | 9,920 | 264,467 | ||||||
Dynatrace, Inc.* | 5,059 | 244,046 | ||||||
EchoStar Corp. - Class A* | 9,165 | 219,960 | ||||||
Elastic NV* | 1,344 | 149,453 | ||||||
Enphase Energy, Inc.* | 1,149 | 186,322 | ||||||
Envestnet, Inc.* | 2,571 | 185,703 | ||||||
EPAM Systems, Inc.* | 629 | 249,518 | ||||||
Euronet Worldwide, Inc.* | 1,580 | 218,514 | ||||||
Evo Payments, Inc. - Class A* | 7,968 | 219,279 | ||||||
ExlService Holdings, Inc.* | 2,581 | 232,703 | ||||||
Fabrinet * | 2,653 | 239,805 | ||||||
Fastly, Inc. - Class A* | 2,483 | 167,056 | ||||||
First Solar, Inc.* | 2,268 | 197,996 | ||||||
FleetCor Technologies, Inc.* | 826 | 221,888 | ||||||
Fortinet, Inc.* | 1,495 | 275,708 | ||||||
Globant SA* | 1,049 | 217,783 | ||||||
Guidewire Software, Inc.* | 1,752 | 178,056 | ||||||
HubSpot, Inc.* | 570 | 258,900 | ||||||
Insight Enterprises, Inc.* | 2,769 | 264,218 | ||||||
Intuit, Inc. | 590 | 226,005 | ||||||
IPG Photonics Corp.* | 898 | 189,424 | ||||||
Juniper Networks, Inc. | 8,963 | 227,033 | ||||||
LivePerson, Inc.* | 3,337 | 175,993 | ||||||
The accompanying notes are an integral part of these financial statements.
9
FRC Founders Index FundSM Schedule of Investments (Unaudited) (Continued) March 31, 2021 |
Security Description | Shares | Value | ||||||
Information Technology — 26.6% (Continued) | ||||||||
Manhattan Associates, Inc.* | 1,917 | $ | 225,018 | |||||
MaxLinear, Inc.* | 6,115 | 208,399 | ||||||
Medallia, Inc.* | 5,543 | 154,594 | ||||||
MicroStrategy, Inc. - Class A* | 379 | 257,265 | ||||||
Mimecast Ltd.* | 4,949 | 198,999 | ||||||
Monolithic Power Systems, Inc. | 578 | 204,155 | ||||||
NETGEAR, Inc.* | 5,695 | 234,065 | ||||||
NetScout Systems, Inc.* | 7,287 | 205,202 | ||||||
New Relic, Inc.* | 2,887 | 177,493 | ||||||
NIC, Inc. | 7,980 | 270,761 | ||||||
nLight, Inc.* | 6,418 | 207,943 | ||||||
NVIDIA Corp. | 426 | 227,454 | ||||||
Okta, Inc.* | 866 | 190,892 | ||||||
Oracle Corp. | 3,546 | 248,823 | ||||||
OSI Systems, Inc.* | 2,340 | 224,874 | ||||||
PagerDuty, Inc.* | 4,808 | 193,426 | ||||||
Palo Alto Networks, Inc.* | 600 | 193,236 | ||||||
Paychex, Inc. | 2,479 | 242,992 | ||||||
Paycom Software, Inc.* | 549 | 203,163 | ||||||
Paylocity Holding Corp.* | 1,157 | 208,063 | ||||||
PC Connection, Inc.* | 4,269 | 198,039 | ||||||
PDF Solutions, Inc.* | 9,697 | 172,413 | ||||||
Pegasystems, Inc. | 1,633 | 186,717 | ||||||
Photronics, Inc.* | 18,322 | 235,621 | ||||||
Ping Identity Holding Corp.* | 7,375 | 161,734 | ||||||
Pluralsight, Inc. - Class A* | 10,362 | 231,487 | ||||||
Power Integrations, Inc. | 2,380 | 193,922 | ||||||
PROS Holdings, Inc.* | 4,835 | 205,488 | ||||||
Pure Storage, Inc. - Class A* | 9,582 | 206,396 | ||||||
Q2 Holdings, Inc.* | 1,697 | 170,039 | ||||||
QAD, Inc. - Class A | 3,303 | 219,914 | ||||||
Qualys, Inc.* | 1,826 | 191,328 | ||||||
Rapid7, Inc.* | 2,509 | 187,197 | ||||||
RealPage, Inc.* | 2,517 | 219,482 | ||||||
Repay Holdings Corp.* | 9,063 | 212,799 | ||||||
RingCentral, Inc. - Class A* | 587 | 174,856 | ||||||
Sailpoint Technologies Holdings, Inc.* | 3,890 | 196,990 | ||||||
salesforce.com, Inc.* | 1,028 | 217,802 | ||||||
Sanmina Corp.* | 6,394 | 264,584 | ||||||
ServiceNow, Inc.* | 426 | 213,047 | ||||||
Silicon Laboratories, Inc.* | 1,610 | 227,123 | ||||||
SiTime Corp.* | 1,605 | 158,253 | ||||||
Slack Technologies, Inc. - Class A* | 5,240 | 212,901 | ||||||
SolarEdge Technologies, Inc.* | 776 | 223,053 | ||||||
Sprout Social, Inc. - Class A* | 3,916 | 226,188 | ||||||
Square, Inc. - Class A* | 962 | 218,422 | ||||||
SS&C Technologies Holdings, Inc. | 3,299 | 230,501 | ||||||
StoneCo Ltd. - Class A* | 2,800 | 171,416 | ||||||
Super Micro Computer, Inc.* | 6,771 | 264,475 | ||||||
The accompanying notes are an integral part of these financial statements.
10
FRC Founders Index FundSM Schedule of Investments (Unaudited) (Continued) March 31, 2021 |
Security Description | Shares | Value | ||||||
Information Technology — 26.6% (Continued) | ||||||||
SVMK, Inc.* | 8,668 | $ | 158,798 | |||||
Switch, Inc. - Class A | 13,243 | 215,331 | ||||||
Synopsys, Inc.* | 846 | 209,622 | ||||||
Tenable Holdings, Inc.* | 4,074 | 147,418 | ||||||
Trade Desk, Inc./The - Class A* | 279 | 181,813 | ||||||
TTEC Holdings, Inc. | 2,969 | 298,236 | ||||||
Twilio, Inc. - Class A* | 564 | 192,189 | ||||||
Ubiquiti, Inc. | 886 | 264,294 | ||||||
Universal Display Corp. | 874 | 206,937 | ||||||
Upland Software, Inc.* | 4,808 | 226,890 | ||||||
Varonis Systems, Inc.* | 3,802 | 195,195 | ||||||
VeriSign, Inc.* | 1,122 | 223,009 | ||||||
ViaSat, Inc.* | 5,662 | 272,172 | ||||||
Workday, Inc. - Class A* | 984 | 244,455 | ||||||
Workiva, Inc.* | 2,256 | 199,115 | ||||||
Yext, Inc.* | 13,513 | 195,668 | ||||||
Zendesk, Inc.* | 1,528 | 202,643 | ||||||
Zoom Video Communications, Inc. - Class A* | 570 | 183,135 | ||||||
Zscaler, Inc.* | 1,038 | 178,193 | ||||||
Zuora, Inc. - Class A* | 16,334 | 241,743 | ||||||
Total Information Technology | 25,632,476 | |||||||
Materials — 0.5% | ||||||||
Element Solutions, Inc. | 11,898 | 217,614 | ||||||
Steel Dynamics, Inc. | 5,588 | 283,647 | ||||||
Total Materials | 501,261 | |||||||
Utilities — 0.2% | ||||||||
Sunnova Energy International, Inc.* | 4,613 | 188,303 | ||||||
Total Utilities | 188,303 | |||||||
Real Estate Investment Trusts (REITs) — 10.0% | ||||||||
Acadia Realty Trust | 13,925 | 264,157 | ||||||
Agree Realty Corp. | 3,432 | 231,008 | ||||||
Alexandria Real Estate Equities, Inc. | 1,301 | 213,754 | ||||||
American Campus Communities, Inc. | 5,092 | 219,822 | ||||||
American Finance Trust, Inc. | 28,119 | 276,129 | ||||||
Apple Hospitality REIT, Inc. | 17,060 | 248,564 | ||||||
Brandywine Realty Trust | 18,407 | 237,634 | ||||||
Camden Property Trust | 2,178 | 239,384 | ||||||
Community Healthcare Trust, Inc. | 4,564 | 210,492 | ||||||
Crown Castle International Corp. | 1,393 | 239,777 | ||||||
DiamondRock Hospitality Co. * | 25,034 | 257,850 | ||||||
EPR Properties | 5,922 | 275,906 | ||||||
Equity Residential | 3,556 | 254,716 | ||||||
Essex Property Trust, Inc. | 911 | 247,646 | ||||||
eXp World Holdings, Inc.* | 5,619 | 255,946 | ||||||
Extra Space Storage, Inc. | 1,953 | 258,870 | ||||||
First Industrial Realty Trust, Inc. | 5,343 | 244,656 | ||||||
The accompanying notes are an integral part of these financial statements.
11
FRC Founders Index FundSM Schedule of Investments (Unaudited) (Continued) March 31, 2021 |
Security Description | Shares | Value | ||||||
Real Estate Investment Trusts (REITs) — 10.0% (Continued) | ||||||||
GEO Group Inc/The | 23,706 | $ | 183,959 | |||||
Getty Realty Corp. | 8,310 | 235,339 | ||||||
Gladstone Commercial Corp. | 11,815 | 231,102 | ||||||
Healthcare Trust of America, Inc. - Class A | 7,662 | 211,318 | ||||||
Hudson Pacific Properties, Inc. | 8,661 | 234,973 | ||||||
Innovative Industrial Properties, Inc. | 1,157 | 208,445 | ||||||
Invitation Homes, Inc. | 7,403 | 236,822 | ||||||
iStar, Inc. | 14,652 | 260,513 | ||||||
Kimco Realty Corp. | 13,300 | 249,375 | ||||||
Life Storage, Inc. | 2,673 | 229,744 | ||||||
Macerich Co/The | 16,130 | 188,721 | ||||||
Marcus & Millichap, Inc.* | 5,792 | 195,190 | ||||||
Medical Properties Trust, Inc. | 10,337 | 219,971 | ||||||
Monmouth Real Estate Investment Corp. | 12,453 | 220,294 | ||||||
National Health Investors, Inc. | 3,228 | 233,320 | ||||||
National Storage Affiliates Trust | 5,943 | 237,304 | ||||||
Pebblebrook Hotel Trust | 10,649 | 258,664 | ||||||
RLJ Lodging Trust | 15,065 | 233,206 | ||||||
SBA Communications Corp. | 814 | 225,926 | ||||||
SL Green Realty Corp. | 3,424 | 239,646 | ||||||
STAG Industrial, Inc. | 7,158 | 240,580 | ||||||
STORE Capital Corp. | 7,098 | 237,783 | ||||||
Terreno Realty Corp. | 3,907 | 225,707 | ||||||
Vornado Realty Trust | 5,681 | 257,861 | ||||||
Total Real Estate Investment Trusts (REITs) | 9,672,074 | |||||||
Total Common Stocks (Cost — $77,706,853) | $ | 96,291,926 | ||||||
Exchange Traded Fund — 0.1% | ||||||||
Invesco Russell 1000 Equal Weight ETF | 1,950 | $ | 83,772 | |||||
Total Exchange Traded Fund (Cost — $83,701) | $ | 83,772 | ||||||
Short Term Investment — 0.0% | ||||||||
First American Government Obligations Fund - Class X - 0.04% (a) | 40,197 | $ | 40,197 | |||||
Total Short Term Investment (Cost — $40,197) | $ | 40,197 | ||||||
Total Investments — 100.0% (Cost — $77,830,751) | 96,415,895 | |||||||
Other Assets in Excess of Liabilities — 0.0% | 23,733 | |||||||
Total Net Assets — 100.0% | $ | 96,439,628 | ||||||
* | Non-income producing security. |
(a) | The rate reported is the annualized seven-day yield at period end. |
The Global Industry Classification Standard (GICS®) was developed by and/or is the exclusive property of Morgan Stanley Capital International, Inc. (“MSCI”) and Standard & Poor’s Financial Services LLC (“S&P”). GICS is a service mark of MSCI & S&P and has been licensed for use by First Republic Investment Management, Inc.
The accompanying notes are an integral part of these financial statements.
12
FRC Founders Index FundSM Statement of Assets and Liabilities (Unaudited) March 31, 2021 |
Assets: | ||||
Investments in securities at value (cost $77,830,751) | $ | 96,415,895 | ||
Receivables: | ||||
Fund shares sold | 120,000 | |||
Dividends and interest | 41,782 | |||
Due from Adviser | 2,454 | |||
Prepaid expenses | 20,984 | |||
Total assets | 96,601,115 | |||
Liabilities: | ||||
Payables: | ||||
Investment securities purchased | 40,841 | |||
Fund shares redeemed | 44,970 | |||
Due to Trustees | 4,248 | |||
Accrued other expenses and other liabilities | 71,428 | |||
Total liabilities | 161,487 | |||
Net Assets | $ | 96,439,628 | ||
Components of Net Assets: | ||||
Paid-in capital | $ | 74,728,679 | ||
Total distributable earnings | 21,710,949 | |||
Net Assets | $ | 96,439,628 | ||
Net Assets | $ | 96,439,628 | ||
Shares Outstanding (unlimited number of shares authorized, no par value) | 4,550,525 | |||
Net asset value, offering and redemption price per share * | $ | 21.19 | ||
Maximum Public Offering Price (based on maximum initial sales charge of 1.00%) | $ | 21.40 |
* | Shares redeemed or exchanged within 90 days of purchase are charged a 1.00% redemption fee. |
The accompanying notes are an integral part of these financial statements.
13
FRC Founders Index FundSM Statement of Operations (Unaudited) For the Six Months Ended March 31, 2021 |
Investment Income: | ||||
Dividend income | $ | 466,719 | ||
Total investment income | 466,719 | |||
Expenses: | ||||
Advisory fees | 95,515 | |||
Administration and fund accounting fees (Note 3) | 70,027 | |||
Custody fees (Note 3) | 49,400 | |||
Transfer agent fees and expenses (Note 3) | 21,577 | |||
Registration fees | 18,470 | |||
Audit fees | 7,826 | |||
Trustees’ fees (Note 3) | 7,680 | |||
Compliance fees (Note 3) | 7,508 | |||
Legal fees | 5,239 | |||
Shareholder reporting fees | 4,004 | |||
Miscellaneous expenses | 3,944 | |||
Service fees | 3,184 | |||
Insurance expenses | 96 | |||
Interest expenses | 7 | |||
Total expenses | 294,477 | |||
Less: Expenses waived or reimbursed by the Adviser (Note 3) | (103,440 | ) | ||
Net expenses | 191,037 | |||
Net investment income | 275,682 | |||
Realized and Unrealized Gain on Investments | ||||
Net realized gain on investments | 4,368,530 | |||
Net change in unrealized appreciation/depreciation on investments | 16,326,448 | |||
Net realized and unrealized gain on investments | 20,694,978 | |||
Net increase in Net Assets Resulting from Operations | $ | 20,970,660 |
The accompanying notes are an integral part of these financial statements.
14
FRC Founders Index FundSM Statements of Changes in Net Assets |
For the | For the | |||||||
Operations: | ||||||||
Net investment income | $ | 275,682 | $ | 26,606 | ||||
Net realized gain on investments | 4,368,530 | 1,320 | ||||||
Net change in unrealized appreciation/depreciation on investments | 16,326,448 | 2,258,696 | ||||||
Net increase in net assets resulting from operations | 20,970,660 | 2,286,622 | ||||||
Net Distributions to shareholders | (1,546,333 | ) | — | |||||
Capital Transactions: | ||||||||
Proceeds from shares sold | 27,817,916 | 50,555,824 | ||||||
Reinvestment of distributions | 482,679 | — | ||||||
Cost of shares repurchased | (3,616,271 | ) | (520,140 | ) | ||||
Redemption fees | 3,470 | 5,201 | ||||||
Net increase in net assets from capital transactions | 24,687,794 | 50,040,885 | ||||||
Total Increase in Net Assets | 44,112,121 | 52,327,507 | ||||||
Net Assets: | ||||||||
Beginning of period | 52,327,507 | — | ||||||
End of period | $ | 96,439,628 | $ | 52,327,507 | ||||
Capital Share Transactions: | ||||||||
Shares sold | 1,408,165 | 3,351,854 | ||||||
Shares reinvested | 24,501 | — | ||||||
Shares repurchased | (200,002 | ) | (33,993 | ) | ||||
Net increase in shares outstanding | 1,232,664 | 3,317,861 | ||||||
* | Commencement of operations on July 28, 2020 |
The accompanying notes are an integral part of these financial statements.
15
FRC Founders Index FundSM Financial Highlights |
For a capital share outstanding throughout the period: |
For the | For the | |||||||
Net Asset Value, Beginning of Period | $ | 15.77 | $ | 15.00 | ||||
Income from Investment Operations: | ||||||||
Net investment income (1) | 0.14 | 0.01 | ||||||
Net realized and unrealized gain on investments | 5.69 | 0.76 | ||||||
Total Income from Investment Operations | 5.83 | 0.77 | ||||||
Redemption Fee Proceeds (1) | 0.00 | (2) | 0.00 | (2) | ||||
Less Distributions: | ||||||||
Net investment income | (0.07 | ) | — | |||||
Net realized gain on investments | (0.34 | ) | — | |||||
Total Distributions | (0.41 | ) | 0.00 | |||||
Net Asset Value, End of Period | $ | 21.19 | $ | 15.77 | ||||
Total Return | 37.19 | %(3) | 5.13 | %(3) | ||||
Supplemental Data and Ratios: | ||||||||
Net assets, end of period (in thousands) | $ | 96,440 | $ | 52,328 | ||||
Ratio of expenses to average net assets | ||||||||
Before fees waived or reimbursed by the Adviser | 0.77 | %(4) | 1.10 | %(4) | ||||
After fees waived or reimbursed by the Adviser | 0.50 | %(4) | 0.50 | %(4) | ||||
Ratio of net investment income (loss) to average net assets | ||||||||
Before fees waived or reimbursed by the Adviser | 0.45 | %(4) | -0.30 | %(4) | ||||
After fees waived or reimbursed by the Adviser | 0.72 | %(4) | 0.30 | %(4) | ||||
Portfolio turnover rate | 34 | %(3) | 0 | %(3)(5) | ||||
* | Commencement of operations on July 28, 2020. |
(1) | Per share amounts have been calculated using average shares method. |
(2) | Amount represents less than $0.01 per share. |
(3) | Not Annualized. |
(4) | Annualized. |
(5) | Amount represents less than 1%. |
The accompanying notes are an integral part of these financial statements.
16
FRC Founders Index FundSM Notes to Financial Statements (Unaudited) March 31, 2021 |
Note 1 – Organization
FRC Founders Index Fund (the “Fund”) is a diversified series of Trust for Advised Portfolios (the “Trust”). The Trust, a Delaware Statutory Trust, is registered under the Investment Company Act of 1940, as amended (the “1940 Act”) as an open-end investment management company. First Republic Investment Management, Inc. (the “Adviser”) serves as the investment manager to the Fund. The inception date of the Fund was July 28, 2020. The investment objective of the Fund seeks to provide investment results that track the total return performance, before fees and expenses, of the First Republic Founders IndexSM (the “Index”).
Note 2 – Significant Accounting Policies
The following is a summary of significant accounting policies consistently followed by the Fund in the preparation of its financial statements. These policies are in conformity with accounting principles generally accepted in the United States of America (“GAAP”) for investment companies. The Fund is considered an investment company under GAAP and follows the accounting and reporting guidance applicable to investment companies in the Financial Accounting Standards Board Accounting Standards Codification Topic 946. The presentation of financial statements in conformity with GAAP requires management to make estimates and assumptions that affect the reported amounts of assets and liabilities and disclosure of contingent assets and liabilities at the date of the financial statements and the reported amounts of income and expenses during the period reported. Actual results may differ from those estimates.
(a) Securities Valuation – Investments in securities traded on a national securities exchange are valued at the last reported sales price on the exchange on which the security is principally traded. Securities traded on the NASDAQ exchanges are valued at the NASDAQ Official Closing Price (“NOCP”). Exchange-traded securities for which no sale was reported and NASDAQ securities for which there is no NOCP are valued at the mean of the most recent quoted bid and ask prices. Unlisted securities held by the Fund are valued at the last sale price in the over-the-counter (“OTC”) market. If there is no trading on a particular day, the mean between the last quoted bid and ask price is used.
Equity securities that are traded on a national securities exchange are stated at the last reported sales price on the day of valuation. To the extent these securities are actively traded and valuation adjustments are not applied, they are categorized as Level 1 of the fair value hierarchy.
Short-term investments classified as money market instruments are valued at NAV. These investments are categorized as Level 1 of the fair value hierarchy.
Various inputs are used in determining the value of the Fund’s investments. These inputs are summarized into three broad levels and described below:
Level 1 - | quoted prices in active markets for identical securities. An active market for the security is a market in which transactions occur with sufficient frequency and volume to provide pricing information on an ongoing basis. A quoted price in an active market provides the most reliable evidence of fair value. |
17
FRC Founders Index FundSM Notes to Financial Statements (Unaudited) (Continued) March 31, 2021 |
Level 2 - | observable inputs other than quoted prices included in level 1 that are observable for the asset or liability either directly or indirectly. These inputs may include quoted prices for the identical instrument on an inactive market, prices for similar instruments, interest rates, prepayment speeds, credit risk, yield curves, default rates, and similar data. |
Level 3 - | significant unobservable inputs, including the Fund’s own assumptions in determining the fair value of investments. |
The inputs or methodology used for valuing securities are not necessarily an indication of the risk associated with investing in those securities. The following is a summary of the inputs used to fair value the Fund’s investments in each category investment type as of March 31, 2021:
Description | Level 1 | Level 2 | Level 3 | Total | ||||||||||||
Assets | ||||||||||||||||
Common Stocks | $ | 96,291,926 | $ | — | $ | — | $ | 96,291,926 | ||||||||
Exchange-Traded Fund | 83,772 | 83,772 | ||||||||||||||
Short-Term Investment | 40,197 | — | — | 40,197 | ||||||||||||
Total | $ | 96,415,895 | $ | — | $ | — | $ | 96,415,895 | ||||||||
See the Schedule of Investments for further detail of investment classifications.
(b) Securities Transactions, Investment Income and Distributions – The Fund records security transactions based on trade date. Realized gains and losses on sales of securities are reported based on identified cost of securities delivered. Dividend income and expense are recognized on the ex-dividend date, and interest income and expense are recognized on an accrual basis. Withholding taxes on foreign dividends have been provided for in accordance with the Trust’s understanding of the applicable country’s tax rules and rates. Trust-level expenses are allocated across the series of the Trust.
(c) Distributions to shareholders – Distributions from net investment income and distributions of net realized gains, if any, are declared at least annually. Distributions to shareholders of the Fund are recorded on the ex-dividend date and are determined in accordance with income tax regulations, which may differ from GAAP.
(d) Federal Income Taxes – The Fund has elected to be taxed as a Regulated Investment Company (“RIC”) under the U.S. Internal Revenue Code of 1986, as amended, and intends to maintain this qualification and to distribute substantially all net taxable income to its shareholders. Therefore, no provision is made for federal income taxes. Due to the timing of dividend distributions and the differences in accounting for income and realized gains and losses for financial statement and federal income tax purpose, the fiscal year in which amounts are distributed may differ from the year in which the income and realized gains and losses is recorded by the Fund.
As of and during the period ended March 31, 2021, the Fund did not have a liability for any unrecognized tax benefits. The Fund recognizes interest and penalties, if any, related to unrecognized tax benefits as interest expense and other expense for penalties in the statement of operations. During the period, the Fund did not incur any interest or tax penalties. The Fund has not currently filed any tax returns; generally, tax authorities can examine tax returns filed for the preceding three years.
18
FRC Founders Index FundSM Notes to Financial Statements (Unaudited) (Continued) March 31, 2021 |
(e) REIT distributions – The character of distributions received from Real Estate Investment Trusts (‘’REITs’’) held by the Fund is generally comprised of net investment income, capital gains, and return of capital. It is the policy of the Fund to estimate the character of distributions received from underlying REITs based on historical data provided by the REITs. After each calendar year end, REITs report the actual tax character of these distributions. Differences between the estimated and actual amounts reported by the REITs are reflected in the Fund’s records in the year in which they are reported by the REITs by adjusting related investment cost basis, capital gains and income, as necessary.
Note 3 – Investment Management Agreement and Other Related Party Transactions
The Trust has an agreement with the Adviser to furnish investment advisory services to the Fund. Under the terms of this agreement, the Fund will pay the Adviser a monthly fee based on the Fund’s average daily net assets at annual rate of 0.25%. The Adviser has voluntarily waived the advisory fee until at least January 2022. Additionally, the Adviser has contractually agreed to waive a portion or all of its management fees and pay Fund expenses excluding taxes, leverage interest, brokerage commissions, acquired fund fees and expenses, portfolio transaction expenses, interest expense and dividends paid on short sales or extraordinary expenses in order to limit the Total Annual Fund Operating Expenses to 0.50% of average daily net assets of the Fund shares.
The Adviser is permitted to recapture amounts waived under the contractual expense limitation and/or reimbursed to a Fund within three years if the Fund’s total annual operating expenses have fallen to a level below the expense limitation (“expense cap”) in effect at the time the fees were earned or the expenses incurred. In no case will the Adviser recapture any amount that would result, on any particular business day of the Fund, in the Fund’s total annual operating expenses exceeding the expense cap or any other lower limit then in effect. The Adviser has recaptured $5,826 of previously waived expenses as economies of scale were realized during the six months ended March 31, 2021.
At March 31, 2021, the amount reimbursed by the Adviser and subject to potential recapture by years were as follows:
Amount | Expiration | |||
| $ | 24,931 | September 30, 2023 | ||
| 13,751 | March 31, 2024 | |||
| $ | 38,682 | |||
U.S. Bancorp Fund Services, LLC, doing business as U.S. Bank Global Fund Services (“Fund Services”), serves as the Fund’s administrator and fund accountant and transfer agent. The officers of the Trust are employees of Fund Services. U.S. Bank serves as the Fund’s custodian and provides compliance services to the Fund. Quasar Distributors, LLC (“Quasar” or the “Distributor”) acts as the
19
FRC Founders Index FundSM Notes to Financial Statements (Unaudited) (Continued) March 31, 2021 |
Fund’s distributor and principal underwriter. For the period ended March 31, 2021, the Fund incurred the following expenses for administration and fund accounting, compliance, custody and transfer agency fees:
Administration and fund accounting | $ | 70,027 | ||
Compliance Services | 15,740 | |||
Custody | 7,508 | |||
Transfer Agency | 21,577 |
At March 31, 2021, the Fund had payables due to Fund Services for administration and fund accounting, compliance, custody and transfer agency fees to U.S. Bank in the following amounts:
Administration and fund accounting | $ | 17,307 | ||
Compliance Services | 2,470 | |||
Custody | 33,337 | |||
Transfer Agency | 5,217 |
The above payable amounts are included in Accrued other expenses and other liabilities in the Statement of Assets and Liabilities.
There is a maximum initial sales charge of 1.00% for the Fund. The sales charge imposed on purchases will not be charged to investors who have opened an account directly with the Adviser.
The Independent Trustees were paid $7,680 for their services and reimbursement of travel expenses during the period ended March 31, 2021. The Fund pays no compensation to the Interested Trustee or officers of the Trust.
Note 4 – Control Ownership
The beneficial ownership, either directly or indirectly, of more than 25% of the voting securities of a fund creates presumption of control of the fund under 2(a)(9) of the 1940 Act. As of March 31, 2021, Pershing LLC held approximately 100%, in aggregate for the benefit of others, of the outstanding shares of the Fund.
Note 5 – Investment Transactions
Purchases and sales of investment securities (excluding short-term securities and U.S. government obligations) for the period ended March 31, 2021, were as follows:
Purchases | $ | 46,923,784 | ||
Sales | $ | 23,437,491 |
20
FRC Founders Index FundSM Notes to Financial Statements (Unaudited) (Continued) March 31, 2021 |
Note 6 – Federal Income Tax Information
At September 30, 2020, gross unrealized appreciation and depreciation on investments, based on cost for federal income tax purposes, and the distributable earnings were as follows:
Tax Cost of Investments | $ | 49,982,941 | ||
Unrealized Appreciation | 4,596,123 | |||
Unrealized Depreciation | (2,337,429 | ) | ||
Net Unrealized Appreciation on Investments | 2,258,694 | |||
Undistributed ordinary income | 26,606 | |||
Undistributed long-term gain | 1,322 | |||
Total Distributable Earnings | $ | 2,286,622 |
The difference between book basis and tax basis unrealized appreciation/(depreciation) is attributable in part to the tax deferral of losses on wash sales.
The tax character of distributions paid during the six months ended March 31, 2021 and the period ended September 30, 2020 were as follows:
| Six Months | Period Ended | ||||||
Distributions Paid From: | ||||||||
Ordinary Income | $ | 1,544,650 | $ | — | ||||
Long-Term Capital Gains | 1,683 | — | ||||||
Total Distributions Paid | $ | 1,546,333 | $ | — | ||||
The Fund is required, in order to meet certain excise tax requirements, to measure and distribute annually, net capital gains realized during the twelve-month period ending October 31. In connection with this requirement, the Fund is permitted, for tax purposes, to defer into its next fiscal year any net capital losses incurred from November 1 through the end of the fiscal year. Late year losses incurred after December 31 within the fiscal year are deemed to arise on the first business day of the following fiscal year for tax purposes. As of September 30, 2020, the Fund had no late-year or post-October losses.
At September 30, 2020, the Fund had no capital loss carryforwards, which reduce the Fund’s taxable income arising from future net realized gains on investments, if any, to the extent permitted by the Internal Revenue Code, and thus will reduce the amount of distributions to shareholders which would otherwise be necessary to relieve the Fund of any liability for federal tax.
21
FRC Founders Index FundSM Notes to Financial Statements (Unaudited) (Continued) March 31, 2021 |
Note 7 – Commitments and Contingencies
In the normal course of business, the Fund enters into contracts that provide general indemnifications by the Fund to the counterparty to the contract. The Fund’s maximum exposure under these arrangements is dependent on future claims that may be made against the Fund and, therefore, cannot be estimated; however, based on experience, the risk of loss from such claims is considered remote.
Note 8 – Redemption Fees
The Fund charges a 1.00% redemption fee on the redemption of shares held for 90 days or less. This fee (which is paid into the Fund) is imposed in order to help offset the transaction costs and administrative expenses associated with the activities of short-term “market timers” that engage in the frequent purchase and sale of Fund shares. The fee is accounted for as an addition to paid-in capital. The Fund reserves the right to modify the terms of or terminate the fee at any time. There are limited exceptions to the imposition of the redemption fee. Please refer to the Statement of Changes in Net Assets for fees recognized.
Note 9 – Line of Credit
The Fund has access to a $10 million unsecured line of credit through an agreement with U.S. Bank. The Fund may temporarily draw on the line of credit to satisfy redemption requests or to settle investment transactions. Interest is charged to the Fund based on its borrowings at a rate per annum equal to the Prime Rate, to be paid monthly. Loan activity for the period ended March 31, 2021, was as follows:
Maximum Available Credit | $ | 10,000,000 | ||
Largest Amount Outstanding on an Individual Day | 50,000 | |||
Average Daily Loan Outstanding | 24,667 | |||
Interest Expense – 3 days | 7 | |||
Loan Outstanding as of March 31, 2021 | — | |||
Average Interest Rate | 3.25 | % |
Note 10 – Subsequent Events
Management has evaluated events and transactions that occurred subsequent to March 31, 2021 through the date the financial statements have been issued and has determined that there were no significant subsequent events that would require adjustment to or additional disclosure in these financial statements.
Note 11 – COVID-19 Risk
The global outbreak of COVID-19 (commonly referred to as “coronavirus”) has disrupted economic markets and the prolonged economic impact is uncertain. The ultimate economic fallout from the pandemic, and the long-term impact on economies, markets, industries and individual issuers, are not known. The operational and financial performance of the issuers of securities in which the Fund invest depends on future developments, including the duration and spread of the outbreak, and such uncertainty may in turn adversely affect the value and liquidity of the Fund’s investments, impair the Fund’s ability to satisfy redemption requests, and negatively impact the Fund’s performance.
22
FRC Founders Index FundSM Additional Information (Unaudited) March 31, 2021 |
Quarterly Portfolio Schedule
The Fund files its complete schedule of portfolio holdings for the first and third quarters of each fiscal year with the Securities and Exchange Commission (SEC) on Part F of Form N-PORT. The Fund’s Form N-PORT is available without charge by visiting the SEC’s Web site at www.sec.gov and may be reviewed and copied at the SEC’s Public Reference Room in Washington D.C. You may obtain information on the operation of the Public Reference Room by calling 1-800-SEC-0330.
Proxy Voting
You may obtain a description of the Fund’s proxy voting policy and voting records, without charge, upon request by contacting the Fund directly at 1-888-928-0298 or on the EDGAR Database on the SEC’s website at ww.sec.gov. The Fund files its proxy voting records annually as of June 30, with the SEC on Form N-PX. The Fund’s Form N-PX is available without charge by visiting the SEC’s website at www.sec.gov and may be reviewed and copied at the SEC’s Public Reference Room in Washington D.C. You may obtain information on the operation of the Public Reference Room by calling 1-800-SEC-0330.
23
FRC Founders Index FundSM Privacy Notice
|
The Fund collects non-public information about you from the following sources:
● | Information we receive about you on applications or other forms; |
● | Information you give us orally; and/or |
● | Information about your transactions with us or others. |
We do not disclose any non-public personal information about our customers or former customers without the customer’s authorization, except as permitted by law or in response to inquiries from governmental authorities. We may share information with affiliated and unaffiliated third parties with whom we have contracts for servicing the Fund. We will provide unaffiliated third parties with only the information necessary to carry out their assigned responsibilities. We maintain physical, electronic and procedural safeguards to guard your non-public personal information and require third parties to treat your personal information with the same high degree of confidentiality.
In the event that you hold shares of the Fund through a financial intermediary, including, but not limited to, a broker-dealer, bank, or trust company, the privacy policy of your financial intermediary would govern how your non-public personal information would be shared by those entities with unaffiliated third parties.
24
(This Page Intentionally Left Blank.)
Investment Adviser
First Republic Investment Management, Inc.
111 Pine Street
San Francisco, California 94111
Distributor
Quasar Distributors, LLC
111 East Kilbourn Avenue, Suite 2200
Milwaukee, Wisconsin 53202
Custodian
U.S. Bank National Association
Custody Operations
1555 North River Center Drive, Suite 302
Milwaukee, Wisconsin 53212
Transfer Agent, Fund Accountant and Fund Administrator
U.S. Bancorp Fund Services, LLC
615 East Michigan Street
Milwaukee, Wisconsin 53202
Independent Registered Public Accounting Firm
BBD, LLP
1835 Market Street, 3rd Floor
Philadelphia, PA 19103
Legal Counsel
Morgan, Lewis & Bockius LLP
1111 Pennsylvania Avenue, NW
Washington, DC 20004
This report has been prepared for shareholders and may be distributed to others only if preceded or accompanied by a current prospectus.
| (b) | Not applicable. |
Item 2. Code of Ethics.
Not applicable for semi-annual reports.
Item 3. Audit Committee Financial Expert.
Not applicable for semi-annual reports.
Item 4. Principal Accountant Fees and Services.
Not applicable for semi-annual reports.
Item 5. Audit Committee of Listed Registrants.
Not applicable to registrants who are not listed issuers (as defined in Rule 10A-3 under the Securities Exchange Act of 1934).
Item 6. Investments.
| (a) | Schedule of Investments is included as part of the report to shareholders filed under Item 1 of this Form. |
| (b) | Not Applicable |
Item 7. Disclosure of Proxy Voting Policies and Procedures for Closed-End Management Investment Companies.
Not applicable to open-end investment companies.
Item 8. Portfolio Managers of Closed-End Management Investment Companies.
Not applicable to open-end investment companies.
Item 9. Purchases of Equity Securities by Closed-End Management Investment Company and Affiliated Purchasers.
Not applicable to open-end investment companies.
Item 10. Submission of Matters to a Vote of Security Holders.
There have been no material changes to the procedures by which shareholders may recommend nominees to the registrant’s board of trustees.
Item 11. Controls and Procedures.
| (a) | The Registrant’s President and Treasurer have reviewed the Registrant's disclosure controls and procedures (as defined in Rule 30a-3(c) under the Investment Company Act of 1940 (the “Act”)) as of a date within 90 days of the filing of this report, as required by Rule 30a-3(b) under the Act and Rules 13a-15(b) or 15d-15(b) under the Securities Exchange Act of 1934. Based on their review, such officers have concluded that the disclosure controls and procedures are effective in ensuring that information required to be disclosed in this report is appropriately recorded, processed, summarized and reported and made known to them by others within the Registrant and by the Registrant’s service provider. |
| (b) | There were no changes in the Registrant's internal control over financial reporting (as defined in Rule 30a-3(d) under the Act) that occurred during the second fiscal quarter of the period covered by this report that has materially affected, or is reasonably likely to materially affect, the Registrant's internal control over financial reporting. |
Item 12. Disclosure of Securities Lending Activities for Closed-End Management Investment Companies
Not applicable to open-end investment companies.
Item 13. Exhibits.
| (a) | (1) Any code of ethics or amendment thereto, that is the subject of the disclosure required by Item 2, to the extent that the registrant intends to satisfy Item 2 requirements through filing an exhibit. Not applicable for semi-annual reports. |
(3) Any written solicitation to purchase securities under Rule 23c-1 under the Act sent or given during the period covered by the report by or on behalf of the registrant to 10 or more persons. Not applicable to open-end investment companies.
(4) Change in the registrant’s independent public accountant. There was no change in the registrant’s independent public accountant for the period covered by this report.
| (b) | Certifications pursuant to Section 906 of the Sarbanes-Oxley Act of 2002. Furnished herewith. |
SIGNATURES
Pursuant to the requirements of the Securities Exchange Act of 1934 and the Investment Company Act of 1940, the registrant has duly caused this report to be signed on its behalf by the undersigned, thereunto duly authorized.
| Trust for Advised Portfolios | ||
| By | /s/ Christopher E. Kashmerick | |
| Christopher E. Kashmerick, President | ||
| Date | 6/8/2021 | |
Pursuant to the requirements of the Securities Exchange Act of 1934 and the Investment Company Act of 1940, this report has been signed below by the following persons on behalf of the registrant and in the capacities and on the dates indicated.
| By | /s/ Christopher E. Kashmerick | |
| Christopher E. Kashmerick, President | ||
| Date | 6/8/2021 | |
| By | /s/ Russell B. Simon | |
| Russell B. Simon, Treasurer | ||
| Date | 6/8/2021 |