UNITED STATES
SECURITIES AND EXCHANGE COMMISSION
Washington, DC 20549
Form 10-K
FOR ANNUAL AND TRANSITION REPORTS
PURSUANT TO SECTIONS 13 OR 15(d) OF THE
SECURITIES EXCHANGE ACT OF 1934
(Mark One)
ý ANNUAL REPORT PURSUANT TO SECTION 13 OR 15(d) OF THE SECURITIES EXCHANGE ACT OF 1934
For the fiscal year ended: June 30, 2005
OR
¨ TRANSITION REPORT PURSUANT TO SECTION 13 OR 15(d) OF THE SECURITIES EXCHANGE ACT OF 1934
For the transition period from to
Commission file number: 001-31825
THE FIRST MARBLEHEAD CORPORATION
(Exact name of registrant as specified in its charter)
Delaware | 04-3295311 |
(State or other jurisdiction of | (I.R.S. Employer |
incorporation or organization) | Identification No.) |
The Prudential Tower | |
800 Boylston Street, 34th Floor | |
Boston, Massachusetts | 02199-8157 |
(Address of principal executive offices) | (Zip Code) |
Registrant’s telephone number, including area code: (617) 638-2000
Securities registered pursuant to Section 12(b) of the Act:
Common Stock, $.01 par value | New York Stock Exchange |
(Title of each class) | (Name of each exchange on which registered) |
Securities registered pursuant to Section 12(g) of the Act: None
Indicate by check mark whether the registrant: (1) has filed all reports required to be filed by Section 13 or 15(d) of the Securities Exchange Act of 1934 during the preceding 12 months (or for such shorter period that the registrant was required to file such reports), and (2) has been subject to such filing requirements for the past 90 days. Yes x No o
Indicate by check mark if disclosure of delinquent filers pursuant to Item 405 of Regulation S-K is not contained herein, and will not be contained, to the best of registrant’s knowledge, in definitive proxy or information statements incorporated by reference in Part III of this Form 10-K or any amendment to this Form 10-K. o
Indicate by check mark whether the registrant is a shell company (as defined in Rule 12b-2 of the Exchange Act). Yes o No x
Indicate by check mark whether the registrant is an accelerated filer (as defined in Exchange Act Rule 12b-2). Yes x No o
The aggregate market value of the voting and non-voting common equity held by non-affiliates of the registrant (without admitting that any person whose shares are not included in the calculation is an affiliate) was approximately $1,604,000,000 based on the last reported sale price of the common stock on the New York Stock Exchange on December 31, 2004.
Number of shares of the registrant’s class of common stock outstanding as of July 29, 2005: 64,911,244
DOCUMENTS INCORPORATED BY REFERENCE
Information set forth in items 10, 11, 12, 13 and 14 of Part III (except for information required with respect to our executive officers, which is set forth under “Executive Officers” in Item 1A of Part I of this report, and our Code of Ethics, which is set forth under “Code of Ethics” in Item 1B of Part I of this report) have been omitted from this report and are incorporated by reference to the definitive proxy statement to be filed with the Securities and Exchange Commission relating to the registrant’s 2005 annual meeting of stockholders.
THE FIRST MARBLEHEAD CORPORATION
ANNUAL REPORT ON FORM 10-K
For the Fiscal Year Ended June 30, 2005
TABLE OF CONTENTS
PART I
Item 1. Business
We use the term “First Marblehead,” the “Company,” “we,” “us” and “our” in this Annual Report on Form 10-K to refer to the business of The First Marblehead Corporation and its subsidiaries.
Overview
The First Marblehead Corporation provides outsourcing services for private education lending in the United States. We help meet the growing demand for private education loans by providing national and regional financial institutions and educational institutions, as well as businesses and other enterprises, with an integrated suite of design, implementation and securitization services for student loan programs tailored to meet the needs of their respective customers, students, employees and members. In providing our services, we do not serve as a lender, guarantor or loan servicer, but instead receive fees for the services we provide in connection with processing and facilitating the securitization of our clients’ loans. We focus primarily on loan programs for undergraduate, graduate and professional education, and, to a lesser degree, on the primary and secondary school market. Private education loans are not guaranteed by the U.S. government and are funded by private sector lenders. During fiscal 2005, we facilitated approximately $2.7 billion in loan disbursements for students at over 5,300 schools compared to $1.8 billion in loan disbursements for students at over 4,800 schools in fiscal 2004 and $1.0 billion in loan disbursements for students at over 3,900 schools in fiscal 2003.
We enable our clients to offer student and parent borrowers competitive loan products, while managing the complexities and risks of these products. We provide our clients with a continuum of services, from the initial phases of program design through application processing and support to the ultimate disposition of the loans through securitization transactions that we structure and administer. We have developed loan processing and support systems that are designed to accommodate new clients, additional loan products and incremental loan volume. We also own a proprietary database of more than 19 years of historical information on private student loan performance, which helps us to facilitate the structuring and pricing of our clients’ loan programs and to supervise the servicing and default management processes for the securitized loans. In addition, our proprietary database increases the efficiency of the securitizations of our clients’ loans by enabling us to provide to participants in the securitization process historical payment, default and recovery data on which to base estimates as to credit losses and reserves. We processed over 876,000 loan applications in fiscal 2005 compared to 560,000 loan applications in fiscal 2004 and 252,000 loan applications in fiscal 2003.
We have provided structural, advisory and other services for 27 securitization transactions since our formation in 1991. We facilitated five securitizations in fiscal 2005 and three securitizations in each of fiscal 2004 and 2003. In fiscal 2005, we facilitated student loan securitizations of $2.26 billion compared to $1.25 billion in fiscal 2004 and $560 million in fiscal 2003.
Private Student Lending Overview
The lifecycle of a private student loan, which can be over 20 years long, consists of a series of processes and involves many distinct parties. Because the activities of these parties are largely uncoordinated but heavily regulated, the processes associated with designing, implementing, financing and administering student loan programs are complex, resource intensive and costly.
1
Set forth below is a chart outlining the series of processes in the private student loan lifecycle:
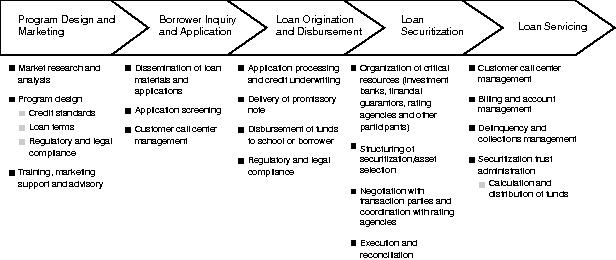
Program Design and Marketing
Lenders, education loan marketers and educational institutions face an array of choices in attempting to satisfy their strategic and financial goals, as well as the needs of student borrowers. If it decides to initiate a loan program, an organization typically needs to make significant investments in staffing and infrastructure in order to support the program. In designing loan programs, the factors that these organizations generally consider include:
· borrower eligibility criteria, including enrollment status, academic progress and citizenship or residency;
· borrower creditworthiness criteria, including acceptable credit scores, credit bureau ratings and co-signor requirements, as well as factors such as employment and income history and any past derogatory credit events;
· loan limits, including minimum and maximum loan amounts on both an annual and aggregate basis;
· interest rates, including the frequency and method of adjustment;
· amount of fees charged to the borrower, including origination, guarantee and late fees;
· repayment terms, including maximum repayment term, minimum monthly payment amounts, deferment and forbearance options, rate reduction incentive programs and prepayment penalties;
· loan guarantee arrangements to ensure repayment of defaulted principal and interest payments;
· loan servicing, default management and collection arrangements;
· asset financing or loan disposition alternatives; and
· legal compliance with numerous federal laws and regulations, including but not limited to the Truth-in-Lending Act, the Fair Credit Reporting Act, the Equal Credit Opportunity Act, the Federal Trade Commission Act, or the FTC, the FTC Telemarketing Sales Rule, and numerous state laws that replicate and expand upon the requirements of federal laws.
In creating their loan marketing programs, institutions face choices in the channels and media available to them to reach potential student borrowers, including financial aid administrators, online
2
advertising, direct mail campaigns, handouts, email campaigns, telemarketing and print, outdoor, radio and television advertising.
Borrower Inquiry and Application
Prospective and current students and their families confront a complicated process in applying for financial aid. Because private student loans are often used to bridge the gap between school costs and available funds, including family resources and federal and state loans and grants, many borrowers must navigate multiple application processes. In order to respond to questions about these processes from student borrowers, lenders and educational institutions must invest in an appropriate infrastructure, including a staff of customer service personnel who have a thorough understanding of both the terms and competitive advantages of their private loan program and the financial aid process as a whole. In addition to a customer service function, these institutions must respond to requests for loan materials and loan applications.
Loan Origination and Disbursement
Once a loan provider has received a loan application and determined that it is complete, it must then evaluate the information provided by the applicant against the eligibility and creditworthiness criteria of the loan program. This underwriting process, which is subject to a variety of state and federal regulations, typically involves communication with credit bureaus in order to generate a credit score for the applicant and either a denial or approval of the loan.
If the applicant satisfies the loan program criteria, the loan provider then prepares a legal instrument, known as a promissory note, reflecting the terms and conditions under which the loan will be made. If the borrower signs and returns the promissory note, the loan provider either contacts the school to confirm the student’s enrollment status and financial need and then disburses funds either to the borrower or, more commonly, directly to the school, or receives evidence of the borrower’s enrollment directly from the student, and disburses funds to the borrower.
Loan Securitization
Although some lenders originate loans and then hold them for the life of the loan, many lenders originate and then seek to dispose of the loans, either through a sale of whole loans or by means of a securitization. Whole loans are typically purchased by other financial institutions, which add them to an existing portfolio, or by entities that serve to warehouse the loans for some period of time, pending eventual securitization. Securitization provides several benefits to lenders and has developed into a diverse, flexible funding mechanism, well-suited to the financing of student loan pools. According to industry sources, in 2004, the new issuance volume of student loan-backed securities totaled approximately $60.0 billion, which included both federally guaranteed and private student loans. Securitization enables lenders to sell potentially otherwise illiquid assets in both the public and private securities markets, and can help lenders manage concentration risk and meet applicable regulatory capital adequacy requirements.
In a typical student loan securitization, the loans are purchased, pooled and deposited in a special purpose, bankruptcy remote entity. The special purpose entity issues and sells to investors securities collateralized by the student loans. Following the sale of these asset backed securities, a trustee, or a servicer on behalf of a trustee, collects the payments of principal and interest generated by the underlying loans and makes disbursements to the asset backed investors and service providers according to the terms of the documents governing the transaction.
Securitization enables the reallocation or transfer of risk through the use of derivative products such as interest rate swaps or caps, a senior-subordinated liability securities structure, financial guarantee insurance for the securities issued, loan guarantees from third party debt guarantors, the tiering of
3
securities maturities, and the issuance of several different types of securities matching projected pool repayment characteristics. Although this flexibility adds to the complexity of the funding process, it also enables the securitizer to reduce the cost of financing, thereby improving the economics of the loan program and/or improving loan terms by passing incremental savings back to the borrower.
Securitizations require a high level of specialized knowledge and experience regarding both the capital markets generally, and the repayment characteristics and defaults on the part of student borrowers specifically. The process of issuing asset backed securities requires compliance with state and federal securities laws, as well as coordination among originating lenders, attorneys, securities dealers, loan guarantors, structural advisors, trust management providers, auditors and securities rating agencies.
Loan Servicing
While student loans are outstanding, lenders or special purpose entities must provide administrative services relating to the loans, even if their terms permit borrowers to defer payments of principal and interest while enrolled in school. These administrative services include processing deferment and forbearance requests, sending out account statements and accrual notices, responding to borrower inquiries, and collecting and crediting payments received from borrowers. Many lenders, and all special purpose entities, outsource their servicing responsibilities to third party providers. In addition to administrative duties, servicers also play an active role, in conjunction with the guarantor, in default prevention activities. Servicers generally rely on collection agencies to establish and maintain contact with defaulted borrowers, manage loans that are delinquent and collect defaulted loans. Loans are ultimately extinguished through scheduled repayment, prepayment or default. Once the borrower makes the final loan payment, the servicer sends a notice to the borrower and the credit bureaus confirming that the loan has been repaid in full and returns the original promissory note to the borrower.
The First Marblehead Approach
We offer our clients—national and regional financial institutions and educational institutions, as well as businesses and other organizations—a fully integrated suite of outsourcing services in connection with their private student loan programs. In providing our services, we do not serve as a lender, guarantor or loan servicer, but instead receive fees for the services we provide in connection with processing and securitizing our clients’ loans. Using our services, our clients can offer student borrowers access to customized, competitive student loan products while enhancing their fees but minimizing their resource commitment and exposure to credit risk.
Our Service Offerings
We offer prospective clients the opportunity to outsource all of the key components of their loan programs by providing a full complement of services, including program design, application processing, underwriting, loan documentation and disbursement, technical support and customer support. This approach enables our clients to focus their efforts on the initial marketing of their programs.
We offer services in connection with two primary loan products:
· Private label programs that:
· are marketed directly to prospective student borrowers and their families (direct to consumer) by:
· lenders;
· third parties who are not themselves lenders; loans under these programs are made by referral lenders; and
· businesses, unions, affinity groups and other organizations.
4
· are marketed directly to educational institutions (school channel) by:
· lenders; and
· third parties who are not themselves lenders; loans under these programs are made by referral lenders.
· Guaranteed Access to Education, or GATE, programs that educational institutions offer directly to their students.
The following table presents, by marketing channel, the total principal amount of loans we processed during our fiscal years ended June 30, 2005, 2004 and 2003:
| | Fiscal year ended
June 30, | |
Marketing Channel | | | | 2005 | | 2004 | | 2003 | |
| | (in millions) | |
Private label loans | | | | | | | |
Direct to consumer | | $1,651 | | $1,038 | | $545 | |
School channel | | 906 | | 667 | | 420 | |
Total private label loans | | 2,557 | | 1,705 | | 965 | |
GATE loans | | 105 | | 96 | | 76 | |
Total | | $ | 2,662 | | $ | 1,801 | | $ | 1,041 | |
| | | | | | | | | | | | |
In fiscal 2005, we processed approximately $742 million of loans for JP Morgan Chase Bank, N.A., successor by merger to Bank One, N.A., $632 million of loans for Bank of America, N.A. and $603 million of loans for Charter One Bank, N.A. In fiscal 2004, we processed approximately $642 million of loans for JP Morgan Chase Bank, $394 million of loans for Bank of America and $312 million of loans for Charter One Bank. In fiscal 2003, we processed approximately $428 million of loans for JP Morgan Chase Bank, $218 million of loans for Bank of America and $41 million of loans for Charter One Bank.
Although we offer our clients a fully integrated suite of outsourcing services, we do not charge separate fees for many of these services, including program design and marketing and, except with respect to The Education Resources Institute, or TERI, borrower inquiry and application and loan origination and disbursement. While we receive fees for providing loan processing services to TERI in connection with TERI-guaranteed loans, these fees represent reimbursement of the direct expenses we incur. Accordingly, we do not earn a profit on these fees. Although we provide these various services without charging a separate fee, or at “cost” in the case of TERI-guaranteed loans, we generally enter into agreements with the private label lenders giving us the exclusive right to securitize the loans that they do not intend to hold, and we receive structural advisory fees and residuals for facilitating securitizations of these loans. We also have the exclusive right to securitize loans originated by Bank of America in connection with our GATE offerings. Our level of profitability depends on our structural advisory fees and residuals. We may in the future enter into arrangements with private label lenders under which we provide outsourcing services but do not have the exclusive right to securitize the loans that they originate. We also receive fees as the administrator of the trusts that have purchased the private label and GATE loans, and in this capacity monitor the performance of the loan servicers. See “Management’s Discussion and Analysis of Financial Condition and Results of Operations.”
The primary driver of our results of operations and financial condition is the volume of loans for which we provide outsourcing services from loan origination through securitization. The volume of loans for which we structured securitizations increased to approximately $2.26 billion in fiscal 2005 from approximately $69 million in fiscal 2001.
5
Program Design and Marketing
We help our clients design their private loan programs. Our loan program design approach begins with a standard set of pricing options, legal agreements and third party relationships that we then carefully customize for our clients in order to satisfy their particular needs.
Private Label Programs
In our private label programs, we have developed strong relationships with lenders and other organizations through active marketing by our field sales force and experienced business development executives. Our private label clients are typically lenders or educational loan marketers that desire to supplement their existing federal loan programs with a private loan offering. Increasingly, these lenders are required by competitive pressures to offer private loan programs. They are attracted to an opportunity potentially to extend their existing brand in the federal loan marketplace to the private loan marketplace.
Beyond federal student loan lenders, our approach is flexible enough to facilitate private student loan programs for a range of clients, who, in turn, serve a variety of consumers. We believe a private label opportunity exists with any business, union, affinity group or other organization that has employees, customers, members or other constituencies who are concerned about education costs. We assist such organizations in partnering with a lender and in designing a program that provides tangible benefits to their constituencies, while simultaneously generating additional revenue. Regardless of whether the client is a commercial bank, marketing company, affinity organization or a large corporation, we contribute our specialized knowledge, experience and capabilities to assist these entities in the development of a private loan program to meet their needs, while minimizing their resource commitment and exposure to credit risk.
One of the key components of our private label programs is the opportunity for our clients to mitigate their credit risk through a loan repayment guarantee by TERI. TERI guarantees repayment of the student borrowers’ loan principal, together with capitalized and/or accrued interest on defaulted loans. For additional information on TERI, see “Strategic Relationship with The Education Resources Institute.” If the lender disposes of the loan in a securitization, this guarantee remains in place and serves to enhance the terms on which asset backed securities are offered to investors.
Private label clients fall into two categories:
· Make and sell. In this category, lenders select credit criteria and loan terms tailored to meet their needs and then outsource to us all operating aspects of loan origination and customer support, and typically hold the loans on their balance sheets for some limited period of time. Lenders that wish to have their loans guaranteed by TERI are required to meet TERI’s underwriting criteria. In the case of clients that do not desire, or do not have the ability, to fund the loans initially, we arrange for a referral lender that will fund the loans on their behalf. In both cases, after the holding period, we will facilitate a securitization to enable lenders to dispose of the loans, from which we generate structural advisory fees and residuals. See “ —Securitization.”
· Make and hold. In this category, clients outsource all operating aspects of loan origination and customer support, but finance the loans on their balance sheets and generally continue to hold the loans through the scheduled repayment, prepayment or default. Clients retain the ability to securitize the loans through us, even if they elect not to do so initially. Unless clients securitize their make and hold loans through us, the revenues we generate on these loans are limited to the processing fees that we receive from TERI, which represent reimbursement of the direct expenses we incur in originating the loans.
6
| | Year ended June 30, | |
| | 2005 | | 2004 | | 2003 | |
Aggregate principal amount of private label loans facilitated | | | $ | 2.6 billion | | | $ | 1.7 billion | | $ | 965 million | |
Aggregate principal amount of “make and sell” private label loans facilitated above that were also available to us for securitization | | | $ | 2.1 billion | | | $ | 1.3 billion | | $ | 593 million | |
Aggregate principal amount of “make and hold” private label loans facilitated above that were not available to us for securitization | | | $ | 486 million | | | $ | 423 million | | $ | 372 million | |
GATE Programs
In our two GATE programs, GATE Student and GATE Universal, we work with schools to design their private loan programs and make the educational experience affordable and accessible to students. We believe that one of the most significant benefits provided by GATE programs is the ability for a participating school to enhance the financial aid packages it offers to prospective students. During fiscal 2005, GATE programs had a borrower approval rate of approximately 89%. With the knowledge that most applicants will be approved, schools can award GATE loans proactively to meet more need and avoid financing gaps in aid packages.
Our GATE business development team collaborates directly with each educational institution client and Bank of America, the exclusive lender for the programs, to evaluate, design and implement the most appropriate GATE program, or series of programs, for the particular school. This analysis takes into account enrollment, financial aid and finance strategies of the school and results in recommended eligibility criteria, rate and fee combinations and underwriting criteria to enhance those strategies. GATE programs are designed so as to facilitate our ability to aggregate and securitize the student loans from all participating schools.
We customize GATE programs within certain pricing parameters and structure the programs to enable a participating school to make loans broadly available to its students. The approval rate of approximately 89% is made possible by having the participating schools provide credit support for the loans to their students. This credit support may be in the form of either a cash reserve or, subject to creditworthiness requirements, a school’s unfunded financial pledge. Our most recent GATE program offering, GATE Universal, stratifies student borrowers according to credit risk in order to minimize either the cash reserve or financial pledge that a school is required to provide in connection with the loan program.
We also monitor each school’s program on an ongoing basis and provide the participating school with periodic updates on its students’ credit performance. We offer assistance in modifying the program over time if the school’s program experience is different than originally anticipated.
For our GATE programs in fiscal 2005, we processed approximately $105 million of loans and structured a securitization for approximately $104 million of loans. In fiscal 2004, we processed approximately $96 million of GATE student loans and structured a securitization of approximately $98 million of GATE student loans. In fiscal 2003, we processed approximately $76 million of GATE student loans and structured a securitization of approximately $73 million of GATE student loans. We have the exclusive right to securitize loans originated by Bank of America in connection with our GATE offerings, and we generate revenue from our GATE programs primarily by receiving structural advisory fees and residuals for facilitating securitizations of these loans.
7
Borrower Inquiry and Application
Private Label Programs
We have developed proprietary processing platforms, applications and infrastructure, supplemented by customized vendor solutions, which we use to provide loan application services for our private label programs. We enable borrowers to submit applications by telephone, facsimile or mail. We also have a proprietary web application process that permits prospective borrowers to submit loan applications online. As a result of increased Internet use and focused marketing efforts, in recent years the proportion of online applications has risen substantially. In fiscal 2005, we received via the Internet approximately 64% of the approximately 849,000 private label loan applications that we processed. In fiscal 2004, we received via the Internet approximately 67% of the approximately 540,000 private label loan applications that we processed. In fiscal 2003, we received via the Internet approximately 56% of the approximately 234,000 private label loan applications that we processed. We intend to continue driving application traffic online, as it represents an opportunity for cost savings by reducing personnel costs associated with call centers and data entry. We have designed our online systems to be E-sign compliant for delivery of consumer disclosures, and we are developing electronic signature capabilities for future implementation.
Once a potential borrower submits an application for processing, our system automatically generates and sends a confirmation email to the applicant. Within minutes, the customized third party credit decision software that we use analyzes the submitted application. Application data is automatically sent to credit bureaus, which generate and return a credit report. The credit decision software then applies the credit report data and all scoring parameters associated with the loan type, and a credit decision is generated. This automated underwriting process allows us to deliver a loan application decision with respect to a significant majority of applications. The remaining applications with either incomplete information or with scores close to cut-off are sent to a credit analyst for review. At this point in the process, we communicate the initial determination to the applicant, primarily through email, informing him or her whether the application is conditionally approved, rejected or in review. The applicant receives instructions as to next steps and is provided a website navigation link to check his or her loan status. Simultaneously, our customer service platforms, including our automated voice response unit, online status and customer service applications, are updated.
To help applicants through the loan application process, we have an internal customer service department comprised of 159 full-time employees, 1 part-time employee and 9 seasonal employees as of June 30, 2005. We augment our internal department with outsourced customer service representatives during peak loan application periods. Our internal customer service department is divided into four areas:
· Inbound and Outbound Customer Service; providing end-to-end service and support for borrower inquiries throughout the application process.
· Lender and Marketer Services; providing dedicated account representatives trained to support our lender and marketer clients.
· Priority Services; providing specially trained representatives to support schools.
· Telesales; providing inbound application-capture services.
The performance of each customer service area is monitored closely and detailed performance metrics such as abandonment rates and service levels are tracked daily.
8
GATE Programs
For our GATE clients, we employ the Pennsylvania Higher Education Assistance Agency, or PHEAA, and a software vendor, V-Tek Systems Corporation, or V-Tek, in a variety of roles to effect application processing and loan origination. Our GATE programs allow schools and students to use the Internet to submit applications. Key steps in the application process allow for:
· certification of borrower loan information, program eligibility and financial need by the schools;
· promissory note preparation and loan disbursement by PHEAA; and
· credit underwriting by Bank of America, the exclusive program lender.
In connection with our GATE programs, PHEAA interfaces directly with participating schools’ financial aid systems by using proprietary software that V-Tek designed for us. This software program supports several electronic delivery formats for schools and student borrowers to submit loan data, resulting in the generation of combined application/promissory notes by PHEAA and credit underwriting by Bank of America. During fiscal 2005, 2004 and 2003, PHEAA received approximately 27,000, 23,000 and 18,000 GATE applications, respectively. Substantially all of these applications were processed via the Internet.
Loan Origination and Disbursement
For our private label loan programs, once a loan application is approved, we generate a promissory note, a legal contract between the borrower and lender which contains the terms and conditions of the loan, for the borrower based on one of over 680 lender and product specific templates. For those lenders and borrowers that prefer electronic document delivery, an automated email is sent to the borrower, which contains a navigation link to prompt the borrower to access a secure website to retrieve the note and required regulatory disclosures. The note can be viewed, downloaded and printed by the borrower and faxed or mailed back to us. For those lenders that do not participate in our electronic delivery system, or for those borrowers that prefer paper documentation, we print and mail a pre-filled promissory note to the borrower for him or her to sign and return to us by mail. During fiscal 2005, 2004 and 2003, approximately 72%, 65% and 52%, respectively, of approved applicants requested on their application that the promissory notes we generated be made available electronically.
We assist the lenders in our loan programs in selecting the underwriting criteria used in deciding whether a student loan will be made to an applicant. However, each lender has ultimate control over the selection of these criteria, and in providing our services, we are obligated by contract to observe them. Lenders that wish to have their loans guaranteed by TERI are required to meet TERI’s underwriting criteria.
Together with TERI, we collaborate with our private label clients to comply with applicable laws and regulations in loan documentation, disclosure and processing. TERI assumes, and delegates to us, responsibility for compliance with federal and Massachusetts law regarding loan documentation and disclosure. We, in turn, work with lenders to prepare lender specific note templates. We maintain and utilize these templates, which reflect applicable legal requirements and lender preferences. We also deliver each lender’s privacy policy and prepare and deliver truth-in-lending and various state law disclosures to borrowers.
We monitor developments in state and federal requirements for loan processing and implement changes to our systems and processes based on our analysis and input we receive from lenders and industry groups. For example, we designed and made available to lenders a customer identification program in connection with our private label loans. This program was designed to meet USA Patriot Act requirements that lenders gather identifying data, verify applicant identity, and maintain records of the process. The requirements present a challenge for lenders whose borrowers apply for loans using an Internet based
9
system, telephone or mail. We have also completed similar process improvements in the area of secure access to pending loan information, in order to comply with federal privacy and state identity theft laws. Contractual liability for identification of state law process requirements rests with the lenders, unless TERI or we undertake to comply with a particular requirement.
For our private label loan programs, once we obtain all applicant data, including the signed note, evidence of enrollment and any income verification, we disburse the loan funds on behalf of TERI, with funds made available to TERI by the lenders. Depending on the loan program and type of disbursement, funds are either sent to the borrower, directly to the school or to a central disbursing agent such as New York Higher Education Services Corporation or ELM Resources, who then pass the funds along to the school. We receive fees from TERI, which consist of reimbursement of expenses that we incur relating to loan processing services that we perform on behalf of TERI. These fees are recognized as services are performed.
PHEAA provides loan origination and disbursement services for our GATE loan programs under our supervision.
Securitization
In addition to providing loan program design, application and origination services, we also serve as an intermediary between our clients and the capital markets. We form bankruptcy remote, qualified special purpose statutory trusts to purchase private label and GATE loans from the originating lenders. The proceeds from bonds issued by the trusts are used to purchase student loans, which are used as security for repayment of the bonds. The securitizations that we structure and administer provide our clients with the ability to limit or eliminate credit and interest rate risk, and generate liquidity for their private student loans. In addition to structural advisory and administrative fees, we are entitled to a residual interest in the securitization trusts as part of our compensation in connection with the securitizations.
We have been a leader in facilitating the securitization of private student loans, having structured and facilitated 27 securitizations consisting entirely of private student loans, more than any other entity. Our capital markets group has a history of innovation, having been the first to employ several of the structures and risk-reducing techniques in this sector that are in use today. We have securitized loan pools using various financing structures, including both public offerings registered with the Securities and Exchange Commission, or SEC, and private placements, and have utilized various asset backed securities, including commercial paper, London Interbank Offered Rate, or LIBOR, floating rate notes, auction-rate debt and senior-subordinated and third party credit enhanced debt. In connection with our “make and sell” private label and GATE programs, we generally enter into agreements with the originating lenders giving us the exclusive right to securitize their program loans.
The extensive database provided by our GATE loan repayment statistics dating back to 1994 and private label repayment statistics dating back to 1986 is another key to optimizing the financing of the student loan pools our clients generate. We use this data to estimate the default, recovery and prepayment characteristics of the different types of loans that constitute a loan pool. We believe the historical data and our wide use of standard consumer credit score based risk assessment give added comfort to the rating agencies, insurance providers, underwriters, and securities investors, resulting in a more cost-effective securitization.
We receive several types of fees in connection with our securitization services:
· Structural advisory fees. We charge structural advisory fees that are paid in two portions:
· Up-front. We receive a portion of the structural advisory fees when the securitization trust purchases the loans, or shortly thereafter; and
10
· Additional. We receive a portion of the structural advisory fees over time, based on the amount of loans outstanding in the trust from time to time over the life of the loans.
For these structural advisory fees, we structure the securities sold in the securitization, coordinate the attorneys, accountants, trustees, loan servicers, loan originators and other transaction parties and prepare cash flow modeling for the rating agencies.
· Residuals. We also have the right to receive a portion of the residual interests that these trusts create. This interest is junior in priority to the rights of the holders of the debt sold in the securitizations.
Our residual interest is derived almost exclusively from the services we have performed in connection with each securitization rather than from a direct cash contribution to the securitization trust.
We also receive administrative fees from the trusts as further described below under “—Loan Servicing.”
For a discussion of our revenue recognition policies and the assumptions we use, see “Management’s Discussion and Analysis of Financial Condition and Results of Operations—Executive Summary—Recognition and Valuation of Service Revenue” and “Management’s Discussion and Analysis of Financial Condition and Results of Operations—Application of Critical Accounting Policies and Estimates—Service Revenue.”
In recent years, we have derived a significant portion of our revenue and substantially all of our income from structuring securitizations on behalf of qualified special purpose entities. Revenues from new securitizations involving private label loan trusts represented 76%, 78% and 73% of our total service revenue in fiscal 2005, 2004 and 2003, respectively. In addition, we structure and support private student loan programs for our commercial bank clients, including JP Morgan Chase Bank, Bank of America and Charter One Bank, although we do not receive fees directly from these clients. During fiscal 2005, Charter One Bank was the lender for loans marketed by 26 educational loan marketers. Structural advisory fees and residuals from securitizations of JP Morgan Chase Bank, Bank of America and Charter One private label loans are included in securitization related revenue and represented approximately 30%, 18% and 22%, respectively, of our total service revenue in fiscal 2005, approximately 43%, 9% and 17%, respectively, of our total service revenue in fiscal 2004 and approximately 59%, 4%, and 2%, respectively, of our total service revenue in fiscal 2003.
Loan Servicing
There are currently nine loan servicers for newly originated TERI guaranteed loans, with three of these servicers servicing a majority of the loans we facilitate. Most of our clients enter into a servicing agreement with PHEAA that governs the servicing of their loans prior to securitization. The remaining clients opt either to outsource servicing of their loans to organizations with which they have existing relationships or service their loans using affiliated servicers. For securitized loans, these servicing agreements, which typically extend over the life of the loan pool, are assigned to the purchasing trust.
As administrator of the trusts that have purchased private label and GATE loans, we monitor the performance of the loan servicers. In this capacity, we confirm compliance with servicing guidelines and review default prevention and collection activities. We receive administrative fees from the trusts ranging from 5 to 20 basis points per year of the student loan balance in the trust for daily management of the trusts and for the services we provide in obtaining information from the loan servicer and reporting this and other information to the parties related to the securitization.
During the first 90 days of delinquency, the servicer performs collection activities in accordance with contractual requirements outlined in the servicing guidelines of the loan program. These guidelines
11
establish certain required collection activities, such as attempted telephone contacts to borrowers and co-borrowers within prescribed delinquency intervals, as well as requirements for the mailing of delinquency notices and skip trace activities for borrowers whose addresses have changed.
Once the loan has been delinquent for 90 days, we provide pre-claims assistance. We assign delinquent accounts to one of several external collection agencies, which work to cure the account by bringing it current. During this period, the servicer remains responsible for invoicing and posting payments. We monitor these external collection agencies that perform pre-claims default prevention activities and share their performance with their peers. Our strategy is to award the highest percentage of new accounts to the agency whose performance has been strongest in the prior period. In addition to this incentive, we provide performance bonuses to agencies performing above established performance expectations for cure rates. If a delinquent loan becomes less than 75 days past due, collection efforts are returned to the servicer for routine processing.
Loans are ultimately extinguished through scheduled repayment, prepayment or default. Once the borrower makes the final loan payment, the servicer sends a notice to the borrower and the credit bureaus confirming that the loan has been repaid in full and returns the original promissory note to the borrower.
Strategic Relationship with The Education Resources Institute
TERI is the nation’s oldest and largest guarantor of private student loans. As a not-for-profit corporation, TERI’s main operating purpose is to provide students with access to educational opportunities through educational finance and counseling services. To help accomplish this, TERI offers guarantee products for student loan programs pursuant to which TERI agrees to reimburse lenders for all unpaid principal and interest on their defaulted student loans, in exchange for a fee based on the loan type and risk profile of the borrower. Because TERI is a not-for-profit organization, defaults on TERI-guaranteed student loans have been held to be non-dischargeable in bankruptcy proceedings. Since its inception in 1985, TERI has guaranteed approximately $9.5 billion of private education loans for students at more than 6,800 schools nationally and internationally.
In 2001, we entered into a strategic relationship with TERI, intended to significantly enhance our risk management and loan processing capabilities. We acquired TERI’s historical database and loan processing operations, but not its investment assets or guarantee liabilities. In addition, 161 members of TERI’s staff became our employees. TERI remains, however, an independent, private not-for-profit organization with its own management and board of directors. We issued promissory notes totaling $7.9 million and paid approximately $1.0 million in cash to TERI in connection with the transaction. Under the terms of a master loan guaranty agreement that we entered into with TERI in 2001, we also agreed to provide a beneficial interest for TERI of 25% of the residual value of TERI-guaranteed loans owned by the securitization trusts that purchase the loans, and a right of first refusal to guarantee our private label clients’ existing and future loan programs.
In connection with the transaction, we also entered into a series of agreements with respect to loan processing services, database updates and the securitization of TERI-guaranteed loans. These include a master servicing agreement and a database purchase and supplementation agreement with TERI. Pursuant to the master servicing agreement, TERI engages us to provide loan origination, pre-claims, claims and default management services. Under TERI’s agreements with lenders, lenders delegate their loan origination functions to TERI, and TERI has the right to subcontract these functions. Pursuant to the database purchase and supplementation agreement, TERI provides updated information to us about the performance of the student loans it has guaranteed, so that we can continue to supplement and enhance our database.
We also entered into a master loan guaranty agreement, under which we have granted to TERI a right of first refusal to guarantee our private label clients’ existing and future loan programs. We also agreed to
12
create a market for our private label clients to sell TERI-guaranteed loans through securitizations that we facilitate. Under our agreement, we must use our best efforts to cause a securitization of a limited category of TERI-guaranteed loans at least twice per year, subject to the lender having a specified minimum loan volume at the semi-annual purchase date. In October 2004, we renewed our master servicing agreement, master loan guaranty agreement and certain additional agreements with TERI, in each case for an additional term through June 2011. In addition, we entered into a supplement to the master loan guaranty agreement, under which we granted to TERI a right to elect once each fiscal year to increase the amount of its administration fees by 25 basis points, with a corresponding reduction from 25% to 20% in TERI’s ownership of the residual value of the TERI-guaranteed loans purchased during that year by the securitization trusts and a resulting increase from 75% to 80% in our residual ownership. TERI made such an election for the fiscal year ended June 30, 2005. We currently pay TERI a monthly fee of approximately $62,000 pursuant to the database purchase and supplementation agreement. Beginning in July 2007, monthly payments pursuant to the database sale and supplementation agreement will be reduced to approximately $21,000. TERI also maintains a perpetual right to access the data we own solely for use in its guarantee business.
The master loan guaranty agreement was intended in part to create a framework for structuring future relationships among lenders, TERI and us. The master loan guaranty agreement contemplates several ancillary documents that set forth the various obligations among the parties, including:
· program guidelines for each prospective lender establishing acceptable terms for the origination, underwriting and servicing of program loans, including the borrower eligibility criteria, credit requirements, loan limits, deferral options and repayment terms, as well as the lender’s forms of application and promissory note;
· a form of guaranty agreement between TERI and a prospective lender providing for a full and unconditional guarantee of principal and accrued interest when a program loan becomes more than 180 days delinquent, the borrower dies or the borrower seeks discharge of the loan in a bankruptcy proceeding;
· a form of loan origination agreement between TERI and a prospective lender pursuant to which the lender delegates its loan origination functions to TERI, and TERI agrees to receive loan applications, perform underwriting according to the standards in the program guidelines and approve and deny applications. TERI has agreed to subcontract these loan origination functions to us pursuant to the master servicing agreement described above;
· a form of note purchase agreement between us and a prospective lender setting forth the terms and conditions under which a special purpose entity, such as a securitization trust, that we establish purchases program loans from the lender; and
· a form of deposit and security agreement, or a security agreement alone, providing for the payment of a portion of the guarantee fee under the guaranty agreement between TERI and a prospective lender to an account at a national bank and subject to a security interest to pay guarantee claims.
As contemplated by the master loan guaranty agreement, prospective lenders agree to provide initial loan funding and own the loans until they are purchased in a securitization transaction that we facilitate. The lender provides representations and warranties that support the loan for the securitization pursuant to the requirements of the rating agencies.
During fiscal 2005, 2004 and 2003, processing fees from TERI represented approximately 19%, 18% and 23%, respectively, of our total service revenue.
13
Competition
The private student loan industry is highly competitive with dozens of active participants. Although we are not a lender and therefore do not directly compete with lenders for loan originations, we derive a substantial portion of our revenue from providing to lenders outsourced services for their private student loan programs. Private student loan originators include large financial institutions and their affiliates, such as JP Morgan Chase Bank, Citigroup, Charter One Bank, Bank of America, Wells Fargo & Company and KeyCorp, as well as specialized educational finance providers including SLM Corporation, which is also known as Sallie Mae, and Access Group, Inc. Some of these loan originators are currently our clients.
To the extent that lenders possess or choose now or in the future to develop an internal capability to provide any of the services that we currently provide, they would compete directly with us. For example, a loan originator or education loan marketer could establish a program to securitize the student loans it originates, rather than engage us to structure and facilitate the securitization. Collegiate Funding Services, Inc. recently announced plans to retain and service some of the private student loans that it markets as a move towards expanding the services it provides for the private student loan market. In addition, lenders in the education loan market historically have primarily focused their lending activities on federal loans because of the relative size of the federal loan market and because the federal government guarantees repayment of these loans. The demand for our services could decline if lenders place additional emphasis on the private education loan market and offer the services we provide. We believe the most significant competitive factors in terms of developing private student loans are technical and legal competence, cost, knowledge of the performance of student loans, reliability, quality and speed of service.
We coordinate a range of services in connection with private loan programs, including program design, application processing, credit underwriting, customer service, loan documentation, disbursement, technical support, legal and compliance support and advisory services in connection with loan financing. We differentiate ourselves from other service providers as a result of the range of services we can provide our clients. We are aware of two principal competitors, Sallie Mae, and Servus Financial Corporation, which is an affiliate of Wells Fargo & Company, that offer a similar range of services to other lenders. Our business could be adversely affected if Sallie Mae’s program to market private student loans directly to consumers becomes successful or if Sallie Mae seeks to market more aggressively to third parties the full range of services for private loan programs that we provide. In addition, our clients retain PHEAA as the loan servicer for a significant portion of the loans that serve as collateral in the securitization transactions that we facilitate. If PHEAA expands its service offerings to cover some or all of the services that we facilitate, it could become our competitor.
Many of our current and potential competitors have longer operating histories and significantly greater financial, marketing, technical or other competitive resources, as well as greater name recognition, than we do. As a result, our competitors may be able to adapt more quickly to new or emerging technologies and changes in customer requirements or may be able to devote greater resources to the promotion and sale of their services. In addition, competitors may be able to adopt more aggressive pricing policies in order to attract potential clients. We cannot assure you that we will be able to compete successfully with new or existing competitors. To remain competitive, we will need to continue to invest in information technology, sales and marketing and legal compliance.
Proprietary Systems and Processes
In addition to our proprietary database that tracks historical student loan performance, we maintain advanced proprietary information processing systems. We use these information systems to analyze loan applications efficiently, expedite loan processing and enhance our loan securitization and default management services.
14
Key benefits of our information processing systems include:
· the ability to analyze and assess loan applications based on a variety of underwriting and program factors, including flexibility to adapt to different program parameters required in customized client implementations;
· a transaction/application processing system that includes automated updating of a borrower’s loan status that a borrower can access online or telephonically;
· automated preparation and secure electronic delivery of loan documents, including promissory notes and legal disclosures;
· online certification tools enabling financial aid offices to speed loan disbursement by quickly confirming student borrowers’ enrollment status and financial need;
· online reporting tools enabling our management, lender clients and financial aid offices to track and sort information about student borrowers, including application status and disbursement dates;
· custom built data transmission techniques designed to ensure that data are compiled, integrated and properly migrated both across our enterprise and to external third parties such as servicers, collection and placement agencies and other third party vendors; and
· interface with internal accounting systems intended to ensure proper booking and tracking of loan information for our clients, as well as support our capital markets group in its securitization activities.
We use a number of leading commercial products to secure, protect, manage and back-up these data, including products that provide backup of data and server recovery plans.
Trademarks
First Marblehead owns the following federally registered trademarks: GATE, GATE FAMILY LOAN, GATE Guaranteed Access to Education, prepGATE, and National Collegiate Trust. The federal registrations for our registered trademarks expire at various times between 2007 and 2011, but the registrations may be renewed for additional 10-year terms provided that First Marblehead continues to use the trademarks. First Marblehead also owns the following common law trademarks: FIRST MARBLEHEAD, FIRST MARBLEHEAD (and “diamond” design), “Diamond” design and ASTRIVE (and design). Federal trademark applications to register these common law trademarks are pending with the U.S. Patent and Trademark Office.
Student Loan Market Seasonality
Origination of student loans is generally subject to seasonal trends, with the volume of loan applications increasing with the approach of tuition payment dates. In general, we process the greatest application volume during the summer months, as students and their families seek to borrow money in order to pay tuition costs for the fall semester or the entire school year. We also tend to process increased volume of loan applications during December and January, as students and their families seek to borrow money to pay tuition costs for the spring semester.
Government Regulation
We provide services in connection with the creation, management and disposition of education loans, a form of consumer loan asset. This business is highly regulated at both the state and federal level, through statutes and regulations that focus upon:
· licensure and examination of industry participants;
15
· regulation and disclosure of consumer loan terms;
· regulation of loan origination processing; and
· regulation of loan collection and servicing.
Failure to conform to any of these statutes or regulations may result in civil and/or criminal fines, and may affect the enforceability of the underlying consumer loan assets.
Although we are subject to certain state and federal consumer protection laws, we believe our operations currently do not require us to be licensed or registered with any regulatory body. While we believe that our prior consultations with national and local counsel identified all material licensing, registration and other regulatory requirements then applicable to us, we are conducting a nationwide review of state licensing, registration and other regulatory requirements that may be applicable to us now, based upon the expansion of the scope of the services we provide and the time that has elapsed since our prior review. As a result of this current review, we may determine that licensing or registration is required in jurisdictions where we are not currently licensed or registered.
All of our operations relating to consumer loan processing are located in Massachusetts. In 2001, we received determination letters from the Massachusetts Division of Banks confirming that our business of providing consumer loan origination and underwriting under contract to TERI was exempt from licensing under the Massachusetts Small Loan Act. Our GATE business does not involve our processing loans directly with consumers. The Small Loan Act requires any person that is engaged, for compensation, in the business of making small loans, or in aiding or assisting the borrower or the lender in procuring or making such loans, to obtain a license. Under the statute, the business of making small loans includes the making of loans of $6,000 or less with interest rates and expenses of more than 12% per year. The Massachusetts Division of Banks ruled that our business with TERI is not subject to licensure because, as a provider of loan origination outsourcing services, we do not conduct a lending business with consumers in our own name and our processing centers are not generally open to the public.
We believe our operations in support of the GATE programs are exempt from Massachusetts Small Loan Act licensing for similar reasons. We do not solicit or assist borrowers directly, but rather work with schools and Bank of America in establishing a program operated by them. In addition, the GATE programs do not involve compensation payable to us in connection with the making of loans or in connection with aiding or assisting the borrower or the lender in procuring or making such loans. We derive all of our revenue in connection with the GATE programs from the securitization of loans. Finally, the Small Loan Act is only triggered if rates exceed 12%, which is not presently the case.
We could become subject to the Massachusetts Small Loan Act in the future if, for example, interest rates on the loans that we process exceed 12% and either the Massachusetts legislature modifies the statutory requirements or the Massachusetts Division of Banks revokes its previous determination that our operations are exempt. We could also become subject to licensing laws in Massachusetts and other states if we engage in licensable activities in the future, or if our operations became sufficiently localized in other states to trigger licensing.
However, even if we are not physically present in a state, its regulators may take the position that licensing or registration is required because we provide services by mail, telephone, the Internet or other remote means. If we identify any states in which licensing or registration is required, we intend to proceed with licensing or registration in the affected state. If any state asserts jurisdiction over our business, we will consider whether to challenge the assertion or proceed with licensing or registration in the affected state. Compliance with such requirements could involve additional costs, which could have a material adverse effect on our business. Our failure to comply with these laws could lead to, among other things: (a) curtailment of our ability to continue to conduct business in the relevant jurisdiction, pending processing of our license application or registration, (b) administrative enforcement actions, (c) class
16
action lawsuits, (d) the assertion of legal defenses delaying or otherwise affecting the enforcement of loans and (e) criminal as well as civil liability. This could have a material adverse effect on our business.
While our licensing requirements are currently limited, the consumer assets in which we deal are subject to the full panoply of state and federal regulation, and a defect in such assets could affect our business. Similarly, the growing complexity of regulation of loan origination and collection may affect the cost and efficiency of our operations. We have sought to minimize the risk created by consumer loan regulation in a number of ways. The securitizations that we facilitate currently involve sales solely by FDIC-insured financial institutions which represent and warrant that the assets in question have been originated in compliance with all applicable law and are valid, binding and enforceable in accordance with their terms. Similarly, the securitization trusts benefit from an assignment of representations and warranties made by the lender and by the applicable loan servicer regarding compliance with law in the origination and servicing of loan assets. Thus, our residual interest in securitizations is buffered from regulatory risk to the extent that lenders, TERI and servicing providers stand behind the legal compliance of their activities. TERI may nonetheless have recourse to us to the extent that a regulatory failure in loan origination by us breaches the standards of care under the master servicing agreement between TERI and us.
In addition, in delivering services, we must cause our operations to conform to consumer loan regulation that applies to TERI and the lenders. This regulation includes compliance with the federal Truth-in-Lending Act, the Fair Credit Reporting Act, the USA PATRIOT Act, the Equal Credit Opportunity Act, the Gramm Leach Bliley Act, the Federal Trade Commission Act, the Fair Debt Collection Practices Act, and numerous state laws that replicate and expand upon the requirements of federal law. In addition, there is increasing regulation of the type of electronic loan application processing that we conduct, as well as regulation of access to and use of consumer information databases. A growing number of states are imposing disparate and costly requirements on our operations, including protections against identity theft, privacy protection and data security protection. In addition, the Fair and Accurate Credit Transactions Act of 2003 imposes significant new federal law requirements on loan application processors, including requirements with respect to resolving address inconsistencies, responding to “red flags” of potential identity theft and processing identity theft notices and other requirements that will require both changes to automated loan processing and the creation of manual exception systems. These new requirements will strain systems and personnel that are already undergoing rapid change due to loan volume growth. Failure to comply with these requirements will violate our obligations to the lenders we serve and could subject them to regulatory action and result in termination of our processing contracts.
17
Employees
At June 30, 2005, we had 842 full-time employees, 11 part-time employees and 36 seasonal employees, as follows:
Department | | | | Full-time | | Part-time | | Seasonal | |
Customer service | | | 159 | | | | 1 | | | | 9 | | |
Operations | | | 174 | | | | 3 | | | | 15 | | |
Loan facilitation | | | 129 | | | | 1 | | | | 4 | | |
Information technology | | | 154 | | | | 0 | | | | 2 | | |
Finance and administration | | | 110 | | | | 5 | | | | 2 | | |
Business development | | | 28 | | | | 0 | | | | 1 | | |
Collections and default management | | | 23 | | | | 1 | | | | 0 | | |
Capital markets | | | 13 | | | | 0 | | | | 1 | | |
Marketing | | | 17 | | | | 0 | | | | 0 | | |
Trust administration | | | 18 | | | | 0 | | | | 0 | | |
Executive | | | 17 | | | | 0 | | | | 2 | | |
Total | | | 842 | | | | 11 | | | | 36 | | |
We are not subject to any collective bargaining agreements, and we believe our relationships with our employees are good.
Our Corporate Information
We were formed as a limited partnership in 1991 and were incorporated in Delaware in August 1994. Our principal executive offices are located at The Prudential Tower, 800 Boylston Street, 34th Floor, Boston, Massachusetts 02199. The telephone number of our principal executive offices is (617) 638-2000.
Available Information
Our Internet address is http://www.firstmarblehead.com. The contents of our website are not part of this Annual Report on Form 10-K, and our Internet address is included in this document as an inactive textual reference only. We make our annual reports on Form 10-K, quarterly reports on Form 10-Q, current reports on Form 8-K and all amendments to those reports available free of charge on our website as soon as reasonably practicable after we file such reports with, or furnish such reports to, the SEC.
18
Item 1A. Executive Officers
The following table sets forth information regarding our executive officers, including their ages as of June 30, 2005.
Name | | | | Age | | Position | | |
Daniel Maxwell Meyers | | 42 | | Chairman of the Board of Directors, President and Chief Executive Officer |
Stephen E. Anbinder | | 67 | | Vice Chairman of the Board of Directors |
Anne P. Bowen | | 53 | | Executive Vice President, Corporate Planning |
Thomas Cesso | | 46 | | Executive Vice President, Chief Information Officer |
Andrew J. Hawley | | 41 | | Executive Vice President, President of First Marblehead Education Resources, Inc. |
John A. Hupalo | | 45 | | Executive Vice President and Group Head, Capital Markets |
Larry A. Lutz | | 48 | | Executive Vice President, Business Development |
John C. Niles | | 42 | | Executive Vice President, International Group |
Donald R. Peck | | 47 | | Executive Vice President, Chief Financial Officer, Treasurer and Secretary |
Set forth below is certain information regarding the business experience of each of the above-named persons.
Daniel Maxwell Meyers co-founded First Marblehead and served as its Managing Partner from 1991 to 1994. Mr. Meyers has served as our Chief Executive Officer and Chairman of the board of directors since our incorporation in 1994 and as our President from November 2004 to September 2005. From 1980 to 1991, Mr. Meyers was involved in arbitrage and derivatives trading at EF Hutton, Prudential Bache Securities, LF Rothschild Unterberg Towbin and Commodities Corporation. He began working on asset backed securities financings in 1986. He currently serves as the Chair of the Board of the Curry School of Education at the University of Virginia. He is also currently a member of the International Institute for Strategic Studies and serves on the Board of the Forum for the Future of Higher Education. Mr. Meyers received an A.B. in Economics from Brandeis University and completed the Owner President Management Program at the Harvard Graduate School of Business Administration.
Stephen E. Anbinder is a co-founder of First Marblehead and has served as Vice Chairman of the board of directors since May 2002. Mr. Anbinder previously served as our President, from December 1995 to May 2002, and Treasurer, from May 2002 to June 2003. From 1980 to 1981 and from 1962 to 1969, Mr. Anbinder held positions with Scudder Stevens & Clark, an investment counseling firm, serving most recently as a Vice President and member of its investment policy committee. From 1970 to 1979, Mr. Anbinder served as a Managing Director of Dillon Read & Company, a securities brokerage firm, where he headed the fixed income capital markets group and was a member of the board of directors. Mr. Anbinder received a B.A. in Literature from Cornell University and an M.B.A. from the Harvard Graduate School of Business Administration.
Anne P. Bowen has served as our Executive Vice President, Corporate Planning since April 2004. From August 2002 to July 2003, Ms. Bowen was a Senior Vice President for State Street Corporation, a financial services firm, where she was responsible for acquisition integration. From October 1999 to July 2002, she served as a Senior Vice President of eBusiness at State Street. From December 1994 to September 1999, Ms. Bowen served as a Senior Vice President of Global Financial Technical Services at State Street. Ms. Bowen served as a Director with Coopers & Lybrand Consulting, Inc. from 1992 to 1994, specializing in the banking practice. From 1978 to 1992, Ms. Bowen served as a Director of Bank of Boston, managing the Corporate Credit, Real Estate and Corporate Audit functions. Ms. Bowen received a B.S. from Boston University and an M.B.A. from Simmons College.
19
Thomas Cesso has been our Executive Vice President, Chief Information Officer since January 2005. During 2004, Mr. Cesso served as Executive Vice President and Chief Executive Officer for Telerate, a global market data firm serving the capital markets, trading and banking communities. Mr. Cesso served as Managing Director and Global Head of Technology of Citigroup Asset Management, an asset management firm, from 2001 to 2004. From 1996 to 2001, Mr. Cesso held positions with Fidelity Investments Systems Company, a provider of technology solutions to the various business units of Fidelity Investments, serving most recently as Vice President of IT Architecture. From 1986 to 1996, Mr. Cesso provided information technology and process development improvement consulting services to Fortune 1000 companies while working at Coopers & Lybrand, Ernst & Young, and Pittiglio, Rabin, Todd & McGrath. Mr. Cesso received a B.S., Masters in Engineering and MBA in Management from Boston University.
Andrew J. Hawley has served as Executive Vice President, President of First Marblehead Education Resources, Inc. since May 2004. From 1994 to April 2004, Mr. Hawley was a Lead Director with Pittiglio, Rabin, Todd & McGrath, a management consulting firm, where he consulted with U.S. companies on operations improvements, growth strategies and organized restructuring. From 1989 to 1992, Mr. Hawley held several positions with Cambridge Strategic Management Group, a strategic consulting firm, with a focus on growth strategies for international companies in Asia, Latin America and Europe. Mr. Hawley received an A.B. from Harvard College and an M.B.A. from Boston College.
John A. Hupalo has served as our Executive Vice President and Group Head, Capital Markets since March 2003. From March 1999 to March 2003, Mr. Hupalo served as a Managing Director in the Education Loan Group of UBS Paine Webber, a diversified financial institution. From 1991 to 1999, Mr. Hupalo served as a Director in the Education Loan Group of Salomon Smith Barney, an investment bank. From 1987 to 1991, Mr. Hupalo served in a similar group at Manufacturers Hanover Securities Corporation. Prior to entering the field of investment banking, Mr. Hupalo worked for a Member of the U.S. Congress and the National Association of Manufacturers. Mr. Hupalo received a B.A. in Political Science from Boston University and an M.B.A. in Finance from New York University’s Stern School of Business.
Larry A. Lutz has served as our Executive Vice President, Business Development since April 2004. Mr. Lutz previously served as our Senior Vice President and Group Head, Business Development, from August 2003 to April 2004, and Senior Business Development Officer, from February 2002 to August 2003. From December 1999 to January 2002, Mr. Lutz served as President and Chief Executive Officer of Career College Loan Company, L.L.C., an education loan development and marketing company. From 1995 to 1999, Mr. Lutz served in various capacities, including Senior Vice President and Chief Business Development Officer with Educaid, the student loan division of Wachovia Bank, N.A. and a national education loan provider. From 1989 to 1995, Mr. Lutz served as Senior Vice President, Chief Marketing Officer with Student Loan Funding Corporation, a regional student loan secondary marketer. Prior to entering the education finance business, Mr. Lutz served in various business development positions in the investment management industry. Mr. Lutz received a B.A. from The Colorado College.
John C. Niles has been our Executive Vice President, International Group, since November 2005. Previously, Mr. Niles served as Executive Vice President, Office of the Chief Operating Officer from August 2003 to November 2005 and served as Senior Vice President and Managing Director, Business Development and Vice President, Operations from April 1996 to August 2003. From 1991 to 1996, Mr. Niles served as Vice President, Operations of LittlePoint Corporation, a biotech/consumer products company. From 1988 to 1991, Mr. Niles served as a Commercial Lending Officer at the Bank of Boston. Mr. Niles received a B.A. in History from St. Lawrence University and completed the Advanced Management Program at the Harvard Graduate School of Business Administration.
20
Donald R. Peck has been our Executive Vice President and Chief Financial Officer since April 2003, Treasurer since July 2003 and Secretary since November 2004. From June 2002 to April 2003, Mr. Peck served as President of Lenox Partners, a finance and legal advisory firm. From July 2001 to May 2002, Mr. Peck served as Chief Financial Officer and General Counsel of Zeborg, Inc., a sourcing solutions firm. From May 2000 to July 2001, Mr. Peck served as Chief Financial Officer and General Counsel of Marketmax, Inc., a retail software firm. From September 1996 to September 1999, Mr. Peck served as Treasurer and General Counsel to Centennial Technologies, Inc., a PCMCIA card manufacturer. From 1997 to 1999, Mr. Peck also served as Secretary of Centennial Technologies. From 1986 to 1996, Mr. Peck was an attorney with the law firm of Nutter, McClennen & Fish LLP. Prior to practicing as an attorney, Mr. Peck held positions with Arthur Andersen LLP, serving most recently as a senior auditor. Mr. Peck serves as Vice Chair of the Board of Overseers of the New England Conservatory of Music. Mr. Peck received a B.S. in Business Administration from the University of Rhode Island and a J.D. from Cornell Law School.
Peter B. Tarr has served as our General Counsel since July 11, 2005 and Vice Chairman of the Board of Directors since August 9, 2005. Jack L. Kopnisky has served as our President and Chief Operating Officer since September 6, 2005.
Item 1B. Code of Ethics
We have adopted a code of conduct which applies to our employees and officers, including our principal executive officer, principal financial officer, principal accounting officer or controller, or persons serving similar functions and a statement of business ethics which applies to our directors. We will provide to any person without charge, upon written request to our corporate secretary, a copy of our code of conduct and statement of business ethics for our board of directors. Our code of conduct and statement of business ethics for our board of directors, as well as our corporate governance guidelines and the charters of the standing committees of our board of directors are posted on our website at www.firstmarblehead.com, and each of these documents is available in print to any stockholder who submits a written request to our corporate secretary. If we amend our code of conduct or grant a waiver under our code of conduct to an officer or anyone functioning as our controller, we intend to post information about such amendment or waiver on our website.
Item 2. Properties
Our headquarters are located in Boston, Massachusetts, and we have additional offices in Marblehead, Massachusetts, Medford, Massachusetts and New York, New York.
We lease buildings for our executive offices and operations. The following table summarizes information with respect to the principal facilities that we lease:
Location | | | | Principal activities | | Area (sq. feet) | | Lease expiration date | |
Marblehead, MA | | Corporate offices | | | 8,000 | | | | 2007 | | |
Boston, MA (Boylston Street) | | Headquarters | | | 51,972 | | | | 2014 | | |
Boston, MA (St. James Avenue) | | Loan processing | | | 123,537 | | | | 2014 | | |
| | | | | 3,364 | | | | 2006 | | |
Medford, MA | | Loan processing | | | 136,496 | | | | 2011 | | |
New York, NY | | Trust administration | | | 500 | | | | Month-to-month | | |
We do not anticipate significant difficulty in obtaining lease renewals or alternate space as needed.
21
Item 3. Legal Proceedings
In the normal course of our business, we may be a party to legal proceedings. We are not currently a party to any material legal proceedings.
Item 4. Submission of Matters to a Vote of Security Holders
No matters were submitted to a vote of our security holders through solicitation of proxies or otherwise, during the fourth quarter of the fiscal year ended June 30, 2005.
22
PART II
Item 5. Market for Registrant’s Common Equity, Related Stockholder Matters and Issuer Purchases of Equity Securities
Market Information and Holders
Our common stock has been listed on the New York Stock Exchange under the trading symbol FMD since our initial public offering, or IPO, on October 31, 2003. Prior to that time, there was no public market for our common stock. The following table sets forth the high and low closing sales prices of our common stock, as reported by the New York Stock Exchange, for each of the periods listed.
| | High | | Low | |
Fiscal 2004 | | | | | |
Second Quarter (commencing October 31, 2003) | | $ | 25.06 | | $ | 20.30 | |
Third Quarter | | 32.50 | | 22.45 | |
Fourth Quarter | | 41.05 | | 29.00 | |
Fiscal 2005 | | | | | |
First Quarter | | $ | 49.97 | | $ | 37.76 | |
Second Quarter | | 57.88 | | 47.86 | |
Third Quarter | | 73.05 | | 54.16 | |
Fourth Quarter | | 59.80 | | 33.05 | |
EquiServe Trust Company, N.A. is the transfer agent and registrar for our common stock. As of the close of business on July 29, 2005, we had 31 holders of record of our common stock.
Dividends
We have never declared or paid any cash dividends on our capital stock. Our board of directors has discretion in determining whether to declare or pay dividends, which will depend upon our financial condition, results of operations, capital requirements and such other factors as the board of directors deems relevant.
Use of Proceeds from Sale of Registered Securities
In our IPO, we sold 7,906,250 shares of common stock, including an over-allotment option of 1,031,750 shares, pursuant to a registration statement on Form S-1 (File No. 333-108531) that was declared effective by the SEC on October 30, 2003. We received aggregate net proceeds of approximately $115.1 million, after deducting underwriting discounts and commissions of approximately $8.9 million and expenses of the offering of approximately $2.5 million. From the effective date of the registration statement through June 30, 2005, we have not spent any of the net proceeds of the IPO, which have been invested in cash and cash equivalents. Accordingly, none of the net proceeds of the IPO has been paid by us, directly or indirectly, to any director, officer or general partner of us, or any of their associates, or to any person owning ten percent or more of any class of our equity securities, or any of our affiliates.
In June 2004, we completed a follow-on public offering of 7,406,312 shares of our common stock, including an over-allotment option of 966,041 shares, pursuant to a registration statement on Form S-1 (File No. 333-116142) that was declared effective by the SEC on June 22, 2004. All of these shares were offered by selling stockholders, and we did not receive any proceeds from the offering.
In January 2005, we completed a follow-on public offering of 3,933,605 shares of our common stock, including an over-allotment option of 513,078 shares, pursuant to a registration statement on form S-3
23
(File No. 333-120740) that was declared effective by the SEC on January 12, 2005. All of these shares were offered by selling stockholders, and we did not receive any proceeds from the offering.
Issuer Purchases of Equity Securities
Period | | | | Total number of
shares purchased(1) | | Average price paid
per share(2) | | Total number of
shares purchased as
part of publicly
announced plan or
programs(3) | | Maximum number
of shares that may
yet be purchased
under the plans or
programs(3) | |
April 1, 2005 to April 30, 2005 | | | 136,000 | | | | $ | 40.13 | | | | 136,000 | | | | 864,000 | | |
May 1, 2005 to May 31, 2005 | | | 793,400 | | | | 39.59 | | | | 793,400 | | | | 70,600 | | |
June 1, 2005 to June 30, 2005 | | | 539,600 | | | | 34.75 | | | | 539,600 | | | | 31,000 | | |
(1) We repurchased an aggregate of 1,469,000 shares of our common stock pursuant to the repurchase program that we publicly announced on April 29, 2005 and June 2, 2005 (the “Program”).
(2) Average price paid per share excludes commissions that we paid to the brokers that affected these repurchases.
(3) Our board of directors approved the repurchase by us of up to an aggregate of 1,000,000 shares of our common stock on April 29, 2005 and approved the repurchase by us of up to an additional aggregate of 500,000 shares of our common stock on June 2, 2005 pursuant to the Program. The Program does not have a fixed expiration date. We completed the repurchase of all 1,500,000 shares in August 2005.
24
Item 6. Selected Financial Data
The following selected consolidated financial data should be read in conjunction with our consolidated financial statements and related notes and “Management’s Discussion and Analysis of Financial Condition and Results of Operations” appearing elsewhere in this filing. We have derived the data from consolidated financial statements, which were audited by KPMG LLP, independent registered public accounting firm. The historical results presented here are not necessarily indicative of future results.
| | Fiscal year ended June 30, | |
| | 2005 | | 2004 | | 2003 | | 2002 | | 2001 | |
| | (in thousands, except per share data) | |
Consolidated Statements of Income Data: | | | | | | | | | | | |
Service revenues: | | | | | | | | | | | |
Up-front structural advisory fees | | $ | 168,166 | | $ | 83,896 | | $ | 33,312 | | $ | 11,547 | | $ | 3,434 | |
Additional structural advisory fees | | 29,287 | | 13,299 | | 6,025 | | 3,213 | | 1,822 | |
Residuals | | 138,780 | | 64,895 | | 30,027 | | 11,832 | | 1,136 | |
Processing fees from TERI | | 78,200 | | 35,056 | | 20,577 | | 14,192 | | — | |
Administrative and other fees | | 3,544 | | 2,114 | | 1,415 | | 475 | | 360 | |
Total service revenues | | 417,977 | | 199,260 | | 91,356 | | 41,259 | | 6,752 | |
Operating expenses: | | | | | | | | | | | |
Compensation and benefits | | 67,608 | | 34,839 | | 19,816 | | 11,488 | | 2,794 | |
General and administrative expenses | | 76,568 | | 35,693 | | 16,071 | | 10,521 | | 1,943 | |
Total operating expenses | | 144,176 | | 70,532 | | 35,887 | | 22,009 | | 4,737 | |
Income from operations | | 273,801 | | 128,728 | | 55,469 | | 19,250 | | 2,015 | |
Other income (expense): | | | | | | | | | | | |
Interest expense | | (585 | ) | (708 | ) | (1,561 | ) | (1,805 | ) | — | |
Interest income | | 3,873 | | 781 | | 105 | | 91 | | 53 | |
Net interest income (expense) | | 3,288 | | 73 | | (1,456 | ) | (1,714 | ) | 53 | |
Income before income tax expense | | 277,089 | | 128,801 | | 54,013 | | 17,536 | | 2,068 | |
Income tax expense | | 117,424 | | 53,530 | | 22,514 | | 5,307 | | 14 | |
Net income | | $ | 159,665 | | $ | 75,271 | | $ | 31,499 | | $ | 12,229 | | $ | 2,054 | |
Income Per Share Data: | | | | | | | | | | | |
Net income per common share: | | | | | | | | | | | |
Basic | | $ | 2.46 | | $ | 1.27 | | $ | 0.59 | | $ | 0.24 | | $ | 0.04 | |
Diluted | | 2.39 | | 1.19 | | 0.55 | | 0.23 | | 0.04 | |
Weighted average common shares outstanding: | | | | | | | | | | | |
Basic | | 65,033 | | 59,048 | | 53,099 | | 51,122 | | 51,122 | |
Diluted | | 66,804 | | 63,516 | | 56,831 | | 54,074 | | 51,985 | |
| | June 30, | |
| | 2005 | | 2004 | | 2003 | | 2002 | | 2001 | |
| | (in thousands) | |
Consolidated Balance Sheets Data: | | | | | | | | | | | |
Cash and cash equivalents | | $ | 193,796 | | $ | 168,712 | | $ | 18,327 | | $ | 7,316 | | $ | 6,775 | |
Service receivables | | 309,590 | | 148,881 | | 56,905 | | 20,393 | | 3,288 | |
Working capital | | 172,071 | | 173,706 | | 7,237 | | 5,778 | | 5,871 | |
Total assets | | 558,193 | | 360,056 | | 87,053 | | 39,016 | | 19,746 | |
Total liabilities | | 136,627 | | 81,920 | | 34,629 | | 20,381 | | 14,007 | |
Total stockholders’ equity | | 421,566 | | 278,136 | | 52,424 | | 18,635 | | 5,740 | |
| | | | | | | | | | | | | | | | |
25
Item 7. Management’s Discussion and Analysis of Financial Condition and Results of Operations
You should read the following discussion and analysis of our financial condition and results of operations together with our “Selected Consolidated Financial Data” and consolidated financial statements and accompanying notes included elsewhere in this document. In addition to the historical information, the discussion contains certain forward-looking statements that involve risks and uncertainties. Our actual results could differ materially from those expressed or implied by the forward-looking statements due to the applications of our critical accounting policies and factors including, but not limited to, those set forth under “Factors That May Affect Future Results” below.
Executive Summary
Overview
We provide outsourcing services for private education lending in the United States. We provide services in connection with each of the five typical phases of the student loan lifecycle, offering our clients a single point of interface for:
· program design and marketing;
· borrower inquiry and application;
· loan origination and disbursement;
· loan securitization; and
· loan servicing.
We receive fees for the services we provide in connection with both processing our clients’ private student loans and structuring and administering securitizations of those loans. Securitization refers to the technique of pooling loans and selling them to a special purpose, bankruptcy remote entity, typically a trust, which issues securities to investors backed by those loans.
We do not take a direct ownership interest in the loans our clients generate, nor do we serve as a lender or guarantor with respect to any loan programs that we facilitate. We assist the lenders in our loan programs in selecting the underwriting criteria used in deciding whether a student loan will be made to an applicant. However, each lender has ultimate control over the selection of these criteria, and in providing our services, we are obligated by contract to observe them. Lenders that wish to have their loans guaranteed by The Education Resources Institute, or TERI, are required to meet TERI’s underwriting criteria. Although we oversee loan servicing as a component of our administrative duties, we do not act as a loan servicer.
We currently focus on facilitating private student loans for undergraduate, graduate and professional education, although we also provide service offerings for continuing education programs, primary and secondary schools, career training and study abroad programs. During fiscal 2005, we processed over 876,000 loan applications and facilitated approximately $2.7 billion in loans at over 5,300 schools. During fiscal 2004, we processed over 560,000 loan applications and facilitated approximately $1.8 billion in loans at over 4,800 schools. We have provided structural, advisory and other services for 27 securitization transactions since our formation in 1991.
We offer services in connection with two primary loan products:
· Private label programs that:
· are marketed directly to prospective student borrowers and their families (direct to consumer) by:
· lenders;
26
· third parties who are not themselves lenders; loans under these programs are made by referral lenders; and
· businesses, unions, affinity groups and other organizations.
· are marketed directly to educational institutions (school channel) by:
· lenders; and
· third parties who are not themselves lenders; loans under these programs are made by referral lenders.
· Guaranteed Access to Education, or GATE, programs that educational institutions offer directly to their students.
During fiscal 2005 and 2004, we securitized both private label loans and GATE loans. Our private label programs, including processing fees from TERI, contributed $405.1 million or 97% of our total service revenue in fiscal 2005, while our GATE programs contributed $12.8 million, or 3% of our total service revenue in fiscal 2005. During fiscal 2004, our private label programs, including the processing fees from TERI, contributed $191.1 million, or 96%, of our total service revenue, while our GATE programs contributed $8.2 million, or 4%, of our total service revenue.
In June 2001, we significantly enhanced our risk management and loan processing capabilities through a strategic relationship with TERI, the nation’s oldest and largest guarantor of private student loans. We acquired TERI’s loan processing operations, including its historical database, but not its investment assets or guarantee liabilities. In connection with this acquisition, 161 members of TERI’s staff became our employees. In addition, we entered into a master servicing agreement pursuant to which TERI engages us to provide loan origination and processing services with respect to the loans generated through the private label programs we facilitate, as well as other TERI-guaranteed loans. TERI reimburses us for the expenses we incur in providing these services. Under the terms of a master loan guaranty agreement that we entered into with TERI in 2001, we also agreed to provide a beneficial interest for TERI of 25% of the residual value of TERI-guaranteed loans owned by the securitization trusts that purchase the loans, and a right of first refusal to guarantee our private label clients’ existing and future loan programs. In October 2004, we renewed our master servicing agreement, master loan guaranty agreement and certain additional agreements with TERI, in each case for an additional term through June 2011. In addition, we entered into a supplement to the master loan guaranty agreement, under which we granted to TERI a right to elect once each fiscal year to increase the amount of its administration fees by 25 basis points, with a corresponding reduction from 25% to 20% in TERI’s ownership of the residual value of the TERI-guaranteed loans purchased during that year by the securitization trusts and a resulting increase from 75% to 80% in our residual ownership. TERI made such an election for the fiscal year ended June 30, 2005.
The primary driver of our results of operations and financial condition is the volume of loans for which we provide outsourcing services from loan origination through securitization. The following table shows the volume of loans facilitated during fiscal 2005 and 2004:
| | Year ended June 30, | |
| | 2005 | | 2004 | |
Amount of loans for which we facilitated securitization | | $ | 2.26 billion | | $ | 1.25 billion | |
Approximate number of loans facilitated | | 300,000 | | 200,000 | |
Aggregate principal amount of loans facilitated | | $ | 2.7 billion | | $ | 1.8 billion | |
Aggregate principal amount of loans facilitated above that were also available to us for securitization | | $ | 2.2 billion | | $ | 1.4 billion | |
27
The dollar volume of the loans that we facilitated in fiscal 2005 increased 48% as compared to 2004. The loans that we facilitated that were available to us for securitization increased 58% in fiscal 2005 as compared to fiscal 2004.
Although we offer our clients a fully integrated suite of outsourcing services, we do not charge separate fees for many of these services. Moreover, although we receive fees for providing loan processing services to TERI in connection with TERI-guaranteed loans, these fees represent reimbursement of the direct expenses we incur. Accordingly, we do not earn a profit on these fees. Although we provide these various services without charging a separate fee, or at “cost” in the case of TERI-guaranteed loans, we generally enter into agreements with the private label lenders, and Bank of America in the case of GATE programs, giving us the exclusive right to securitize the loans that they do not intend to hold, and we receive structural advisory fees and residuals for facilitating securitizations of these loans. Our level of profitability depends on these structural advisory fees and residuals. We discuss the manner in which we recognize them as revenue in greater detail below. We may in the future enter into arrangements with private label lenders under which we provide outsourcing services, but do not have the exclusive right to securitize the loans that they originate.
Changes in any of the following factors can materially affect our financial results:
· the demand for private education financing;
· the competition for providing private education financing;
· the education financing preferences of students and their families;
· applicable laws and regulations, which may affect the terms upon which our clients agree to make private student loans and the cost and complexity of our loan facilitation operations;
· the private student loan securitization market, including the costs or availability of financing;
· the general interest rate environment, including its effect on our discount rates;
· our critical accounting policies and estimates;
· borrower default rates and our ability to recover principal and interest from such borrowers; and
· prepayment rates on private student loans, including prepayments through loan consolidation.
Securitizations and Related Revenue
We structure and facilitate securitization transactions for our clients through a series of bankruptcy remote, qualified special purpose statutory trusts. The trusts purchase private student loans from the originating lenders, which relinquish to the trust their ownership interest in the loans. The debt instruments that the trusts issue to finance the purchase of these student loans are obligations of the trusts, rather than our obligations or those of originating lenders. As of June 30, 2005, we have utilized six special purpose entities for the securitization of TERI-guaranteed private label loans. We refer to these trusts as private label loan trusts. In addition, National Collegiate Trust, or NCT, was formed in fiscal 1993 and has established separate securitization trusts, which we refer to as the NCT trusts, that have purchased primarily GATE loans and a limited number of TERI-guaranteed and other loans. In the future, we may securitize private label or GATE loans using new trust vehicles.
Under the terms of some of our contracts with key lender clients, we have an obligation to securitize periodically, typically twice per year, the private student loans that these clients originate, and we may agree with other lenders to securitize more frequently in the future. If we do not honor our obligations to these lenders, we may be required to pay liquidated damages, generally not exceeding an amount equal to 1% of the face amount of the loans available for securitization.
28
We receive several types of fees in connection with our securitization services:
· Structural advisory fees. We charge structural advisory fees that are paid in two portions:
· Up-front. We receive a portion of the structural advisory fees at the time the securitization trust purchases the loans, or soon thereafter. In exchange for these fees, we structure the securities sold in the securitization, coordinate the attorneys, accountants, trustees, loan servicers, loan originators and other transaction participants and prepare the cash flow modeling for rating agencies and financial guarantee insurers, as needed. In securitizations we facilitated in fiscal 2005 and 2004, these fees have ranged from 1.6% to 8.5% of the principal and capitalized interest of the loans securitized; and
· Additional. We receive a portion of the structural advisory fees over time, based on the amount of loans outstanding in the trust from time to time over the life of the trust. This portion accumulates monthly from the date of a securitization transaction at a rate of 15 to 30 basis points per year. We begin to receive this additional portion, plus interest, once the ratio of trust assets to trust liabilities, which we refer to as the “parity ratio,” reaches a stipulated level, which ranges from 103.0% to 105.0%. The level applicable to a particular trust is determined at the time of securitization. We currently expect to receive the additional fees beginning five to seven years after the date of a particular securitization transaction.
· Residual. We also have the right to receive a portion of the residual interests that these trusts create. This interest is junior in priority to the rights of the holders of the debt sold in the securitizations and entitles us to receive:
· in connection with the securitizations of exclusively private label loans, 75% to 80% of the residual cash flows once a parity ratio of 103.0% to 103.5%, depending on the particular trust, is reached and maintained;
· in connection with securitizations in the NCT trusts, our share of residual cash flows once all of the debt-holders of the securitization trust have been repaid, plus, in the case of GATE loans securitized in fiscal years prior to fiscal 2005, an additional 10% of the residual cash flows. We are entitled to receive 100% of the residual cash flows for GATE loans securitized in fiscal 2005.
Our residual interest derives almost exclusively from the services we perform in connection with each securitization rather than from a direct cash contribution to the securitization trust. In connection with the securitization of GATE loans in the NCT trusts in fiscal 2004 and 2003, in order to accommodate a limited number of schools, we invested in the aggregate approximately one-third of our GATE-related up-front structural advisory fees to eliminate the risk exposure of those schools. These investments, which reduced our up-front structural advisory fees that would have been recognized in these periods, totaled $1.3 million and $2.0 million in fiscal 2004 and 2003, respectively. In exchange for these investments, we received the rights to the residual interest that these schools would otherwise hold in the trust. We account for these rights as residuals, consistent with the manner in which we account for our other residuals, and the value of these residual interests is primarily affected by the loan performance at each school. In fiscal 2005, we changed the structure of the trust used to securitize GATE loans. Under this new structure, schools are no longer jointly liable for all loans in the trust, and instead schools participating in the securitization are required to guarantee only the repayment of the loans made to their students. Recoveries from defaulted loans are remitted to the school that guaranteed the repayment of the loan rather than to the securitization trust. This structure eliminated the need for an insurance vendor to provide credit enhancement to the trust. As a result of these and other changes, we did not invest any portion of our up-front structural advisory fee in the trust in fiscal 2005, nor did we make a cash surety deposit
29
on behalf of any schools participating in the securitization. In connection with the securitization of GATE loans in fiscal 2004, we provided a surety deposit in the amount of $1.8 million on behalf of six schools. See “Financial Condition, Liquidity and Capital Resources—Other Assets.”
In the case of securitizations of exclusively private label loans, we currently expect to receive the residuals beginning approximately five to six years after the date of a particular securitization. In the case of securitizations in the NCT trusts that occurred prior to fiscal 2005, we expect to receive the residuals beginning 12 to 15 years after the date of each securitization. In the case of securitization in the NCT trusts that occurred in fiscal 2005, we currently expect to receive residuals beginning five to six years after the date of securitization.
· Administrative and other fees. Our administrative and other fees represent primarily the administrative fees we receive from the trusts for their daily management and services we provide in obtaining information from the loan servicers and reporting this and other information to the parties related to the securitization. We receive fees ranging from five to 20 basis points per year of the student loan balance in the trust. In addition, in connection with some securitizations, we receive other fees from originating lenders when their loans are purchased by the securitization trust, although these fees have not been material and we do not expect them to be material in the future. We also record as administrative and other fees the reimbursement we receive for certain call center costs.
Processing Fees from TERI
We provide outsourcing services to TERI, including loan origination, customer service, default prevention, default processing and administrative services under a master servicing agreement between TERI and us. We recognize as revenue the monthly reimbursement that TERI provides us for the expenses we incur in providing these services.
Recognition and Valuation of Service Revenue
We recognize up-front structural advisory fees as revenue at the time the securitization trust purchases the loans. In order for the securitization trust to purchase the loans, all of the applicable services must be performed, rating agencies must deliver their ratings letters, transaction counsel must deliver the required legal opinions and the underwriters must receive the debt securities created by the securitization trust. These events indicate that the securitization transaction has been properly structured and loans have been properly sold to the securitization trust.
As required under accounting principles generally accepted in the United States, or GAAP, we also recognize additional structural advisory fees and residuals as revenue at that time, as they are deemed to be earned at the time of the securitization but before we actually receive payment. These amounts are deemed earned because evidence of an arrangement exists, we have provided the services, the fee is fixed and determinable based upon a discounted cash flow analysis, there are no future contingencies or obligations and collection is reasonably assured.
Under GAAP, we are required to estimate the present value of the additional structural advisory fees and residuals as if they are investments in debt securities classified as available-for-sale or trading, similar to retained interests in securitizations. Accordingly, we record additional structural advisory fees and residuals receivables on our balance sheet at fair value using a discounted cash flow model. We estimate the fair value both initially and at each subsequent quarter and reflect the change in the value in earnings that period.
Because there are no quoted market prices for our additional structural advisory fees and residuals receivables, we use certain key assumptions to estimate their values. See “—Application of Critical Accounting Policies and Estimates—Service Revenue.”
30
We recognize administrative and other fees, as well as processing fees from TERI, as revenue at the time that we perform the underlying services.
Quarterly Fluctuations
Our quarterly revenue, operating results and profitability have varied and are expected to continue to vary on a quarterly basis primarily because of the timing of the securitizations that we structure. In fiscal 2005, we facilitated one securitization in the second quarter, one securitization in the third quarter and three securitizations in the fourth quarter, but none in the first quarter. In fiscal 2004, we facilitated one securitization in the second quarter and two securitizations in the fourth quarter, but none in the first or third quarters. The following tables set forth our quarterly service revenue and net income (loss) for each of the quarters of fiscal 2005 and 2004:
| | 2005 fiscal quarters | |
| | First | | Second | | Third | | Fourth | |
| | (in thousands) | |
Service revenue | | $ | 22,404 | | $ | 155,837 | | $ | 119,534 | | $ | 120,201 | |
Net income (loss) | | (5,352 | ) | 74,530 | | 47,438 | | 43,048 | |
| | | | | | | | | | | | | |
| | 2004 fiscal quarters | |
| | First | | Second | | Third | | Fourth | |
| | (in thousands) | |
Service revenue | | $ | 9,469 | | $ | 77,523 | | $ | 11,127 | | $ | 101,141 | |
Net income (loss) | | (3,077 | ) | 36,639 | | (3,566 | ) | 45,276 | |
| | | | | | | | | | | | | |
Application of Critical Accounting Policies and Estimates
Our consolidated financial statements have been prepared in accordance with GAAP. The preparation of these financial statements requires us to make estimates, assumptions and judgments that affect the reported amounts of assets and liabilities and the reported amounts of income and expenses during the reporting periods. We base our estimates, assumptions and judgments on historical experience and on various other factors that we believe are reasonable under the circumstances. Actual results may differ from these estimates under varying assumptions or conditions.
Our significant accounting policies are more fully described in Note 2 of the notes to the audited consolidated financial statements for the fiscal year ended June 30, 2005, which are included in this document. On an ongoing basis, we evaluate our estimates and judgments, particularly as they relate to accounting policies that we believe are most important to the portrayal of our financial condition and results of operations. We regard an accounting estimate or assumption underlying our financial statements to be a “critical accounting estimate” where:
· the nature of the estimate or assumption is material due to the level of subjectivity and judgment necessary to account for highly uncertain matters or the susceptibility of such matters to change; and
· the impact of the estimates and assumptions on our financial condition or operating performance is material.
We have discussed our accounting policies with the audit committee of our board of directors, and we believe that our estimates relating to the recognition and valuation of our securitization-related revenue, as described below, fit the definition of critical accounting estimates. We also consider our policy with respect to the determination of whether or not to consolidate the securitization trusts that we facilitate to be a critical accounting policy.
31
Service Revenue
For a discussion of our revenue recognition policies, see “—Overview—Recognition and Valuation of Service Revenue.”
Because there are no quoted market prices for our additional structural advisory fees and residuals receivables, we use the following key assumptions to estimate their values:
· the discount rate, which we use to calculate the present value of our additional structural advisory fees and residuals;
· the annual compound rate of student loan prepayments, which we refer to as the constant prepayment rate, or CPR;
· the trend of interest rates over the life of the loan pool, including the forward LIBOR and the spread between LIBOR and auction rates; and
· expected defaults, net of recoveries.
We base these estimates on our proprietary historical data, third-party data and our industry experience, adjusting for specific program and borrower characteristics such as loan type and borrower creditworthiness. We analyze creditworthiness in several tiers, and select appropriate loan performance assumptions based on these tiers. We also monitor trends in loan performance over time and make adjustments we believe are necessary to value properly our receivables balances. We recognize the revenue associated with our processing fees from TERI and our administrative and other fees as we perform these services.
The following table shows the approximate weighted average loan performance assumptions for the life of the securitization trusts at June 30, 2005:
| | | | Percentage rate | | Percentage discount rate | |
Trust | | | | Loan type | | Default | | Recovery | | CPR | | Structural
advisory fees | | Residuals | |
Private label loan trusts | | Private label | | | 8.66 | % | | | 40 | % | | | 7 | % | | | 5.96 | % | | | 12 | % | |
NCT trusts | | Private label | | | 7.11 | | | | 46 | | | | 7 | | | | 5.96 | | | | 12 | | |
NCT trusts | | GATE | | | 21.00 | | | | 47 | | | | 4 | | | | 5.96 | | | | 12 | | |
| | | | | | | | | | | | | | | | | | | | | | | | | |
Our private label loan programs, under which approximately 80% of the borrowers have creditworthy co-borrowers, typically a family member, have an extensive credit underwriting process. In fiscal 2003, some of our private label clients introduced a new product line which includes co-signed loans for which the co-signer has a Fair, Isaac and Company, or FICO, credit score that is lower than the FICO score required for our other tiered products. We have worked in consultation with TERI and our bank clients to structure and price this loan product to reflect its increased default risk, and we have taken the increased default risk and the loan mix into account in estimating our private label loan performance assumptions. GATE programs had a borrower approval rate of approximately 89% in fiscal 2005 as a result of the credit support provided by the participating schools. Accordingly, we believe that borrowers in our private label programs will prepay at a higher rate and default at a lower rate than borrowers in our GATE programs.
At June 30, 2005, we used a 5.96 % discount rate for valuing additional structural advisory fees, as compared to a 6.58% discount rate at June 30, 2004. Based on the priority payment status of additional structural advisory fees in the flow of funds out of the securitization trust, we believe these fees are comparable to 10 year spreads on triple-B rated structured finance and corporate debt securities. Based on market quotes on such securities, we believe a spread over comparable maturity U.S. Treasury Notes of 200 basis points is an appropriate discount rate in valuing these projected cash flows.
32
To our knowledge, there have been no market transactions involving residuals generated by a pool of securitized student loans. In determining an appropriate discount rate for valuing our residuals, we review the rates used by student loan securitizers as well as rates used in the much broader asset-backed securities, or ABS, market. We believe that the 12% discount rate we use is appropriate given the maximum 24-year life of the trust assets and residuals.
Two private label loan trusts have issued senior auction rate notes to finance the purchase of student loans. Interest rates for the auction rate notes are determined from time to time at auction. At June 30, 2005, we used a 10 basis point spread over LIBOR to project the future cost of funding of the senior auction rate notes in the trusts. Since inception of the first trust, the average spread over LIBOR for the senior auction rate notes of that trust has been 8.5 basis points. Since the inception of the second trust, the average spread over LIBOR for the senior auction rate notes of that trust has been 10.2 basis points.
Other than the change in the discount rate to be applied to additional structural advisory fees, we did not change any loan performance assumptions regarding default rates, recovery rates, CPR rates or discount rates in valuing these projected cash flows during fiscal 2005.
Sensitivity analysis
Increases in our estimates of defaults, prepayments and discount rates, increases in the spread between LIBOR and auction rates, as well as decreases in default recovery rates and the multi-year forward estimates of LIBOR would have a negative effect on the value of our additional structural advisory fees and residuals. Student loan prepayments include either full or partial payments by a borrower in advance of the maturity schedule specified in the note, including payments as a result of loan consolidation activity. Because essentially all credit defaults are reimbursable by third parties, increases in defaults generally have the same effect as increases in prepayments. If defaults increase beyond the level of expected third party reimbursement, then these changes will have an additional negative effect on the value of our additional structural advisory fees and residuals. For purposes of this sensitivity analysis, we have assumed no amounts in excess of the pledge fund established at the time of each securitization of private label loans are available to reimburse the trust for defaults. Also, in the case of securitizations of GATE loans in which we have invested a portion of our up-front structural advisory fees, increases in estimates of defaults would reduce the value of our residual interests because amounts that we would otherwise receive as residual interests would be applied to the defaults. LIBOR is the reference rate for the loan assets and, we believe, a reasonable index for borrowings of the trusts. Because the trusts’ student loan assets earn interest based on LIBOR and some trusts have outstanding securities that pay interest based on the results of auction rates, changes in the spread between LIBOR and the auction rate can affect the performance of the trust.
33
The following tables show the estimated change in our structural advisory fees and residuals receivables balances at June 30, 2005 based on changes in these loan performance assumptions:
| | Percentage change in
assumptions | | Receivables | | Percentage change in
assumptions | |
Structural advisory fees | | | | Down 20% | | Down 10% | | balance | | Up 10% | | Up 20% | |
| | (dollars in thousands) | |
Default rate: | | | | | | | | | | | | | | | | | |
Private label loan trusts | | | $ | 47,304 | | | | $ | 47,132 | | | | $ | 46,960 | | | $ | 46,788 | | $ | 46,610 | |
GATE loan trusts(1) | | | 6,621 | | | | 6,515 | | | | 6,411 | | | 6,307 | | 6,201 | |
Total | | | $ | 53,925 | | | | $ | 53,647 | | | | $ | 53,371 | | | $ | 53,095 | | $ | 52,811 | |
Change in receivables balance | | | 1.04 | % | | | 0.52 | % | | | | | | (0.52 | )% | (1.05 | )% |
Default recovery rate: | | | | | | | | | | | | | | | | | |
Private label loan trusts | | | $ | 46,958 | | | | $ | 46,958 | | | | $ | 46,960 | | | $ | 46,958 | | $ | 46,958 | |
GATE loan trusts(1) | | | 6,245 | | | | 6,245 | | | | 6,411 | | | 6,411 | | 6,592 | |
Total | | | $ | 53,203 | | | | $ | 53,203 | | | | $ | 53,371 | | | $ | 53,369 | | $ | 53,550 | |
Change in receivables balance | | | (0.32 | )% | | | (0.32 | )% | | | | | | (0.00 | )% | 0.34 | % |
Annual constant prepayment rate (CPR): | | | | | | | | | | | | | | | | | |
Private label loan trusts | | | $ | 49,637 | | | | $ | 48,260 | | | | $ | 46,960 | | | $ | 45,724 | | $ | 44,558 | |
GATE loan trusts(1) | | | 6,678 | | | | 6,544 | | | | 6,411 | | | 6,282 | | 6,157 | |
Total | | | $ | 56,315 | | | | $ | 54,804 | | | | $ | 53,371 | | | $ | 52,006 | | $ | 50,715 | |
Change in receivables balance | | | 5.52 | % | | | 2.68 | % | | | | | | (2.56 | )% | (4.98 | )% |
Discount rate: | | | | | | | | | | | | | | | | | |
Private label loan trusts | | | $ | 50,461 | | | | $ | 48,682 | | | | $ | 46,960 | | | $ | 45,315 | | $ | 43,775 | |
GATE loan trusts(1) | | | 6,908 | | | | 6,653 | | | | 6,411 | | | 6,179 | | 5,952 | |
Total | | | $ | 57,369 | | | | $ | 55,335 | | | | $ | 53,371 | | | $ | 51,494 | | $ | 49,727 | |
Change in receivables balance | | | 7.49 | % | | | 3.68 | % | | | | | | (3.52 | )% | (6.83 | )% |
| | | | | | | | | | | | | | | | | | | | | | | | |
| | Change in assumption | | | | Change in assumption | |
| | Down 200 | | Down 100 | | Receivables | | Up 100 | | Up 200 | |
Structural advisory fees | | | | basis points | | basis points | | balance | | basis points | | basis points | |
| | (dollars in thousands) | |
Forward LIBOR rates: | | | | | | | | | | | | | | | | | | | | | |
Private label loan trusts | | | $ | 43,858 | | | | $ | 45,399 | | | | $ | 46,960 | | | | $ | 48,538 | | | | $ | 50,142 | | |
GATE loan trusts(1) | | | 5,996 | | | | 6,157 | | | | 6,411 | | | | 6,503 | | | | 6,770 | | |
Total | | | $ | 49,854 | | | | $ | 51,556 | | | | $ | 53,371 | | | | $ | 55,041 | | | | $ | 56,912 | | |
Change in receivables balance | | | (6.59 | )% | | | (3.40 | )% | | | | | | | 3.13 | % | | | 6.64 | % | |
| | | | | | | | | | | | | | | | | | | | | | | | | | | | |
(1) GATE loan trusts include approximately $362.3 million of GATE loans and $39.4 million of TERI-guaranteed loans.
34
| | Percentage change in
assumptions | | Receivables | | Percentage change in
assumptions | |
Residuals | | | | Down 20% | | Down 10% | | balance | | Up 10% | | Up 20% | |
| | (dollars in thousands) | |
Default rate: | | | | | | | | | | | | | |
Private label loan trusts | | $ | 241,152 | | $ | 239,540 | | | $ | 237,702 | | | $ | 234,983 | | $ | 231,057 | |
GATE loan trusts(1) | | 8,819 | | 9,207 | | | 9,573 | | | 9,937 | | 9,772 | |
Total | | $ | 249,971 | | $ | 248,747 | | | $ | 247,275 | | | $ | 244,920 | | $ | 240,829 | |
Change in receivables balance | | 1.09 | % | 0.60 | % | | | | | (0.95 | )% | (2.61 | )% |
Default recovery rate: | | | | | | | | | | | | | |
Private label loan trusts | | $ | 236,858 | | $ | 237,404 | | | $ | 237,702 | | | $ | 237,852 | | $ | 237,952 | |
GATE loan trusts(1) | | 8,129 | | 8,835 | | | 9,573 | | | 10,319 | | 10,425 | |
Total | | $ | 244,987 | | $ | 246,239 | | | $ | 247,275 | | | $ | 248,171 | | $ | 248,377 | |
Change in receivables balance | | (0.93 | )% | (0.42 | )% | | | | | 0.36 | % | 0.45 | % |
Annual constant prepayment rate (CPR): | | | | | | | | | | | | | |
Private label loan trusts | | $ | 261,740 | | $ | 249,440 | | | $ | 237,702 | | | $ | 226,514 | | $ | 215,824 | |
GATE loan trusts(1) | | 9,982 | | 9,775 | | | 9,573 | | | 9,371 | | 9,178 | |
Total | | $ | 271,722 | | $ | 259,215 | | | $ | 247,275 | | | $ | 235,885 | | $ | 225,002 | |
Change in receivables balance | | 9.89 | % | 4.83 | % | | | | | (4.61 | )% | (9.01 | )% |
Discount rate: | | | | | | | | | | | | | |
Private label loan trusts | | $ | 286,792 | | $ | 260,858 | | | $ | 237,702 | | | $ | 216,980 | | $ | 198,392 | |
GATE loan trusts(1) | | 12,864 | | 11,091 | | | 9,573 | | | 8,198 | | 7,150 | |
Total | | $ | 299,656 | | $ | 271,949 | | | $ | 247,275 | | | $ | 225,178 | | $ | 205,542 | |
Change in receivables balance | | 21.18 | % | 9.98 | % | | | | | (8.94 | )% | (16.88 | )% |
| | | | | | | | | | | | | | | | | | | | |
| | Change in assumption | | | | Change in assumption | |
| | Down 200 | | Down 100 | | Receivables | | Up 100 | | Up 200 | |
Residuals | | | | basis points | | basis points | | balance | | basis points | | basis points | |
| | (dollars in thousands) | |
Forward LIBOR rates: | | | | | | | | | | | | | | | | | | | | | |
Private label loan trusts | | | $ | 218,089 | | | | $ | 227,934 | | | | $ | 237,702 | | | | $ | 247,390 | | | | $ | 256,965 | | |
GATE loan trusts(1) | | | 8,710 | | | | 9,074 | | | | 9,573 | | | | 10,024 | | | | 10,311 | | |
Total | | | $ | 226,799 | | | | $ | 237,008 | | | | $ | 247,275 | | | | $ | 257,414 | | | | $ | 267,276 | | |
Change in receivables balance | | | (8.28 | )% | | | (4.15 | )% | | | | | | | 4.10 | % | | | 8.09 | % | |
| | | | | | | | | | | | | | | | | | | | | | | | | | | | |
| | Percentage change in
assumptions | | | | Percentage change in
assumptions | |
| | Tighten 10 | | Tighten 5 | | Receivables | | Widen 5 | | Widen 10 | |
Residuals | | | | basis points | | basis points | | balance | | basis points | | basis points | |
| | (dollars in thousands) | |
Change in assumed spread between LIBOR and auction rates: | | | | | | | | | | | | | | | | | | | | | |
Private label loan trusts | | | $ | 241,767 | | | | $ | 239,732 | | | | $ | 237,702 | | | | $ | 235,671 | | | | $ | 233,643 | | |
GATE loan trusts(1) | | | 9,573 | | | | 9,573 | | | | 9,573 | | | | 9,573 | | | | 9,573 | | |
Total | | | $ | 251,340 | | | | $ | 249,305 | | | | $ | 247,275 | | | | $ | 245,244 | | | | $ | 243,216 | | |
Change in receivables balance | | | 1.64 | % | | | 0.82 | % | | | | | | | (0.82 | )% | | | (1.64 | )% | |
| | | | | | | | | | | | | | | | | | | | | | | | | | | | |
(1) GATE loan trusts include approximately $362.3 million of GATE loans and $39.4 million of TERI-guaranteed loans.
35
These sensitivities are hypothetical and should be used with caution. The effect of each change in assumption must be calculated independently, holding all other assumptions constant. Because the key assumptions may not in fact be independent, the net effect of simultaneous adverse changes in key assumptions may differ from the sum of the individual effects above.
Consolidation
Our consolidated financial statements include the accounts of First Marblehead and its subsidiaries, after eliminating inter-company accounts and transactions. We have not consolidated the securitization trusts. Prior to July 1, 2003, this accounting treatment was in accordance with various Emerging Issues Task Force issues and related interpretations. We considered, among other things, the following factors in assessing consolidation of the securitization trusts:
· we did not have unilateral decision-making abilities related to significant matters affecting the securitization trusts, such as asset acquisition, prepayment of debt, placement of debt obligations and modification of trust documents;
· we did not have substantially all the risks and rewards of ownership, as TERI and the respective colleges provide substantially all of the student loan guarantees;
· we were a facilitator of securitization transactions, for which we receive market-based fees, and we were not the transferor of assets to the securitization trusts; and
· our continuing involvement in the trusts is limited to a passive residual interest and our role as an administrator for the trust for which we receive market-based fees.
Beginning July 1, 2003, and for securitization trusts created after January 31, 2003, we applied Financial Accounting Standards Board, or FASB, Interpretation FIN No. 46, “Consolidation of Variable Interest Entities, an interpretation of ARB No. 51,” or FIN 46, in assessing consolidation. FIN No. 46 provided a new framework for identifying variable interest entities and determining when a company should include the assets, liabilities, non-controlling interests and results of activities of a variable interest entity in its consolidated financial statements.
On December 24, 2003, the FASB issued FIN No. 46 (revised December 2003), “Consolidation of Variable Interest Entities,” or FIN No. 46R, which addressed how a business enterprise should evaluate whether it has a controlling interest in an entity through means other than voting rights and accordingly should consolidate the entity. FIN No. 46R has replaced FIN No. 46. At June 30, 2005, the securitization trusts created after January 31, 2003 have either met the criteria to be a qualified special-purpose entity, or QSPE, as defined in paragraph 35 of FASB Statement No. 140, “Accounting for the Transfers and Servicing of Financial Assets and Extinguishments of Liabilities,” or the Company has determined that it is not the primary beneficiary of the securitization trusts, as defined by FIN No. 46R. Accordingly, the Company did not consolidate these existing securitization trusts in these financial statements. In addition, the securitization trusts created prior to January 31, 2003 have been amended in order for them to be considered QSPEs. The adoption of FIN No. 46R, which the Company began to apply in December 2003, did not have a material impact on the Company’s consolidated financial condition, results of operations, earnings per share or cash flows.
The FASB has issued exposure drafts that would amend FASB Statement No. 140. The proposed amendments would, among other things, change the requirements that an entity must meet to be considered a QSPE. The FASB has announced that it expects to issue final guidance in the first calendar quarter of 2006. We are monitoring the status of the exposure drafts to assess their impact, if any, on our financial statements.
36
Results of Operations
Years ended June 30, 2005, June 30, 2004 and June 30, 2003
Revenue Related to Securitization Transactions
The following table sets forth for each of the past three fiscal years (by dollar amount and as a percentage of the total volume of loans securitized):
· the total volume of loans securitized by loan type and the securitization-related service revenue components, other than administrative and other fees; and
· updates to reflect any fair market value adjustment to additional structural advisory fees and residuals for prior trusts.
Fiscal year: | | Total
volume
of loans
securitized(1) | | Up-front
structural
advisory fees | | Additional
structural
advisory fees | | Total
structural
advisory
fees | | Residuals | |
| | (dollars in thousands) | |
2005 | | | | | | | | | | | | | | | | | | | | | | | | | | | |
Private label loans | | | $ | 2,158,085 | | | | $ | 161,184 | | | | 7.5 | % | | | $ | 26,374 | | | | 1.2 | % | | $ | 187,558 | | $ | 116,618 | | 5.4 | % |
GATE loans | | | 104,408 | | | | 5,975 | | | | 5.7 | | | | 1,146 | | | | 1.1 | | | 7,121 | | 4,569 | | 4.4 | |
Trust updates (2) | | | — | | | | — | | | | | | | | 1,767 | | | | | | | 1,767 | | 17,593 | | | |
Other (3) | | | — | | | | 1,007 | | | | | | | | — | | | | | | | 1,007 | | — | | | |
Total | | | $ | 2,262,493 | | | | $ | 168,166 | | | | | | | | $ | 29,287 | | | | | | | $ | 197,453 | | $ | 138,780 | | | |
2004 | | | | | | | | | | | | | | | | | | | | | | | | | | | |
Private label loans | | | $ | 1,146,893 | | | | $ | 78,446 | | | | 6.8 | % | | | $ | 12,620 | | | | 1.1 | % | | $ | 91,066 | | $ | 57,205 | | 5.0 | % |
GATE loans | | | 98,127 | | | | 5,450 | | | | 5.6 | | | | 1,030 | | | | 1.1 | | | 6,480 | | 730 | | 0.7 | |
Trust updates (2) | | | — | | | | — | | | | | | | | (351 | ) | | | | | | (351 | ) | 6,960 | | | |
Total | | | $ | 1,245,020 | | | | $ | 83,896 | | | | | | | | $ | 13,299 | | | | | | | $ | 97,195 | | $ | 64,895 | | | |
2003 | | | | | | | | | | | | | | | | | | | | | | | | | | | |
Private label loans | | | $ | 487,586 | | | | $ | 29,919 | | | | 6.1 | % | | | $ | 4,588 | | | | 0.9 | % | | $ | 34,507 | | $ | 26,756 | | 5.5 | % |
GATE loans | | | 72,688 | | | | 3,393 | | | | 4.7 | | | | 864 | | | | 1.2 | | | 4,257 | | 742 | | 1.0 | |
Trust updates (2) | | | — | | | | — | | | | | | | | 573 | | | | | | | 573 | | 2,529 | | | |
Total | | | $ | 560,274 | | | | $ | 33,312 | | | | | | | | $ | 6,025 | | | | | | | $ | 39,337 | | $ | 30,027 | | | |
(1) Represents total principal and accrued interest.
(2) Trust updates reflect changes resulting from the passage of time, which results in accretion of the discounting inherent in the present value estimates of additional structural advisory fees and residuals, as well as changes in the assumptions, if any, underlying our estimates of the fair value of these service revenue components.
(3) Represents the receipt of funds from the cost of issuance accounts of various trusts once it is determined that the trust no longer needs such cost of issuance funds.
37
Our private label loan products are marketed through two marketing channels: direct to consumer, which generally refers to programs that lenders, businesses, unions, affinity groups or other organizations market directly to prospective borrowers, and school channel, which refers to programs that lenders or third parties market directly to educational institutions. Our estimates of the allocation by marketing channel of our securitization revenues for fiscal 2005 and 2004, expressed as a percentage of the student loan balances securitized in each channel, are as follows:
| | | | | | Percentage yield | | | | | |
Month and year | | | | Volume | | Up-front | | Additional | | | | | |
of private | | Marketing | | of loans | | structural | | structural | | | | | |
label securitization | | | | channel | | securitized(1) | | advisory fees | | advisory fees | | Residuals | | Total | |
Fiscal 2005 | | | | | | | | | | | | | | | | | | | | | | | |
June 2005 | | Direct to consumer | | | $ | 388 | | | | 9.3 | % | | | 1.1 | % | | | 6.5 | % | | | | | |
| | School channel | | | 74 | | | | 4.5 | | | | 1.1 | | | | 2.6 | | | | | | |
| | Total | | | $ | 462 | | | | | | | | | | | | | | | | | | |
| | Blended yield(2) | | | | | | | 8.5 | | | | 1.1 | | | | 5.9 | | | | 15.5 | % | |
June 2005 | | School channel | | | $ | 174 | | | | 1.6 | | | | 1.9 | | | | 0.6 | | | | 4.1 | | |
February 2005 | | Direct to consumer | | | $ | 445 | | | | 9.6 | | | | 1.1 | | | | 6.1 | | | | | | |
| | School channel | | | 270 | | | | 4.4 | | | | 1.1 | | | | 1.4 | | | | | | |
| | Total | | | $ | 715 | | | | | | | | | | | | | | | | | | |
| | Blended yield(2) | | | | | | | 7.6 | | | | 1.1 | | | | 4.4 | | | | 13.1 | | |
October 2004 | | Direct to consumer | | | $ | 744 | | | | 8.4 | | | | 1.2 | | | | 7.5 | | | | | | |
| | School channel | | | 63 | | | | 4.3 | | | | 1.0 | | | | 2.2 | | | | | | |
| | Total | | | $ | 807 | | | | | | | | | | | | | | | | | | |
| | Blended yield(2) | | | | | | | 8.1 | | | | 1.2 | | | | 7.1 | | | | 16.4 | | |
Total fiscal 2005 | | | | | $ | 2,158 | | | | | | | | | | | | | | | | | | |
| | Blended yield(2) | | | | | | | 7.5 | | | | 1.2 | | | | 5.4 | | | | 14.1 | | |
Fiscal 2004 | | | | | | | | | | | | | | | | | | | | | | | |
June 2004 | | Direct to consumer | | | $ | 441 | | | | 8.2 | | | | 1.1 | | | | 5.3 | | | | | | |
| | School channel | | | 179 | | | | 4.2 | | | | 1.0 | | | | 2.5 | | | | | | |
| | Total | | | $ | 620 | | | | | | | | | | | | | | | | | | |
| | Blended yield(2) | | | | | | | 7.0 | | | | 1.1 | | | | 4.4 | | | | 12.5 | | |
December 2003 | | Direct to consumer | | | $ | 483 | | | | 6.4 | | | | 1.1 | | | | 5.8 | | | | | | |
| | School channel | | | 44 | | | | 3.8 | | | | 0.9 | | | | 3.3 | | | | | | |
| | Total | | | $ | 527 | | | | | | | | | | | | | | | | | | |
| | Blended yield(2) | | | | | | | 6.2 | | | | 1.1 | | | | 5.6 | | | | 12.9 | | |
Total fiscal 2004 | | | | | $ | 1,147 | | | | | | | | | | | | | | | | | | |
| | Blended yield(2) | | | | | | | 6.8 | | | | 1.1 | | | | 5.0 | | | | 12.9 | | |
| | | | | | | | | | | | | | | | | | | | | | | | | | |
(1) Dollars in millions.
(2) Blended yield represents securitization revenues as a percentage of the total principal and accrued interest of loans securitized from all marketing channels.
These yields by marketing channel represent an allocation of revenues based on various estimates and assumptions regarding the relative profitability of these loans, and should be read with caution. Furthermore, these yields are dependent on a number of factors, including the mix of loans between marketing channels that are included in a particular securitization as well as the average life of loans, which can be impacted by the time of year that loans are securitized and the relative mix of loans from students with various expected terms until graduation, along with a number of other factors. Readers are
38
cautioned that the blended yields and yields by marketing channel above may not be indicative of yields that we may be able to achieve in future securitizations.
The principal balance of loans facilitated and available to us for later securitization at June 30, 2005, 2004 and 2003 totaled $385.8 million, $276.1 million and $160.4 million respectively.
Structural advisory fees
Structural advisory fees increased to $197.5 million in fiscal 2005 from $97.2 million in fiscal 2004 and $39.3 million in fiscal 2003. The increases in structural advisory fees were primarily a result of increases in securitization volume, as well as increases in average blended advisory fee yields.
Up-front structural advisory fees
The up-front component of structural advisory fees increased to $168.2 million in fiscal 2005 from $83.9 million in fiscal 2004 and $33.3 million in fiscal 2003. The increases in up-front structural advisory fees between periods were primarily a result of increases in loan facilitation volume, which enabled us to securitize a greater amount of loans. An increase in up-front structural advisory fees as a percentage of the loan volume securitized, or up-front structural advisory fee yield, also contributed to the increases in our revenue. We believe that these increases in the up-front structural advisory fee yield are due in part to more efficient securitization transactions as the balance of student loans securitized increased, a change in the mix of student loans securitized and the introduction of new securitization structures. We do not currently expect further significant improvement in the up-front structural advisory fee yield we are able to earn on future securitization transactions.
The following table reflects the increases in up-front structural advisory fees attributable to the increases in securitization volume and changes in the fee yield and loan mix:
| | Up-front structural advisory fees | |
Fiscal year | | | | Total volume of
loans securitized | | Change attributable
to increased
securitization volume | | Change attributable
to change in fee
yield and loan mix | | Total increase | |
| | (in thousands) | |
2005 | | | $ | 2,262,493 | | | | $ | 68,563 | | | | $ | 15,707 | | | | $ | 84,270 | | |
2004 | | | $ | 1,245,020 | | | | $ | 41,032 | | | | $ | 9,552 | | | | $ | 50,584 | | |
| | | | | | | | | | | | | | | | | | | | | | | |
Additional structural advisory fees
The additional component of structural advisory fees increased to $29.3 million in fiscal 2005 from $13.3 million in fiscal 2004 and $6.0 million in fiscal 2003. The increases in additional structural advisory fees between periods were primarily a result of increases in securitization volume.
39
The following table summarizes the changes in the fair value of the structural advisory fees receivable for the years ended June 30, 2005 and 2004:
| | 2005 | | 2004 | |
| | (in thousands) | |
Fair value at beginning of period | | $ | 24,084 | (1) | $ | 10,785 | |
Revenue recognized during period | | | | | |
Additions from structuring new securitizations | | 27,520 | | 13,650 | |
Fair value adjustments | | 1,767 | | (351 | ) |
Total additional structural advisory fees recognized | | 29,287 | | 13,299 | |
Fair value at end of period | | $ | 53,371 | | $ | 24,084 | (1) |
(1) Excludes the $10.25 million structural advisory fee receivable from our December 2003 securitization that we collected in July 2004.
During fiscal 2005, the fair value adjustments of our additional structural advisory fees resulted in an increase of approximately $1.8 million. This increase was primarily due to the accretion of the discounting inherent in the present value estimates. During fiscal 2004, the fair value adjustments of our additional structural advisory fees resulted in a decrease of approximately $0.4 million, as the accretion of the discounting inherent in the present value estimates was more than offset by the impact of the movement in the implied forward LIBOR curve and the effect of the increase in the discount rate during the period. During fiscal 2003, the fair market value adjustments of our additional structural advisory fees resulted in an increase of approximately $0.6 million, as both the accretion of the discounting inherent in these present value estimates and a decrease in the discount rate contributed to an increase in the value of these receivables.
On a quarterly basis, we update our estimate of the present value of our additional structural advisory fees, which we expect to begin to receive approximately five to seven years after the date of a particular securitization transaction. In doing so, we give effect to the passage of time, which results in the accretion of the discounting inherent in the present value estimates, and we also adjust for any change in the discount rate that we use in estimating the present value of these receivables. For a discussion of the assumptions we make in estimating our additional structural advisory fees, see “—Application of Critical Accounting Policies and Estimates—Service Revenue.”
We base the discount rate that we use to calculate the present value of our additional structural advisory fees on the 10-year U.S. Treasury note rate plus 200 basis points. We applied a discount rate of 5.96% at June 30, 2005, 6.58% at June 30, 2004 and 5.33% at June 30, 2003. A decrease in the 10-year U.S. Treasury note rate has the effect of increasing the estimated fair value of our structural advisory fees receivable, while an increase in the rate has the opposite effect on our estimate of their fair value.
On an ongoing basis, we monitor the performance of trust assets, including default, recovery, prepayment and forward LIBOR rates experience, which we also consider in our estimates. We use an implied forward LIBOR curve to estimate trust cash flows. During fiscal 2005, the implied forward LIBOR curve flattened. This flattening increased the estimated fair value of additional structural advisory fees receivable during the period. During fiscal 2004, the rates along the implied forward LIBOR curve increased. These increases in rates resulted in an increase in the average life of the underlying trust assets, thereby increasing the estimated fair value of the structural advisory fees receivable during the period. The impact of changing LIBOR rates during fiscal 2003 did not have a material impact on the fair market value of additional structural advisory fees receivable during that period. For a discussion of the assumptions we make in estimating our additional structural advisory fees receivable, see “—Application of Critical Accounting Policies and Estimates—Service Revenue.”
40
We made no changes in our assumptions regarding default rates, prepayment rates and recovery rates during fiscal 2005, 2004, or 2003.
Residuals
Residuals increased to $138.8 million in fiscal 2005 from $64.9 million in fiscal 2004 and $30.0 million in fiscal 2003. The increase in residuals was primarily a result of an increase in securitization volume and change in loan mix. We used a discount rate of 12% throughout fiscal 2005, 2004 and 2003.
The following table reflects the increases in residuals attributable to the increase in securitization volume and the change attributable to updates to prior trusts:
| | | | Residuals | |
Fiscal year | | | | Total volume of
loans securitized | | Change attributable
to increased
securitization volume
and change in loan mix | | Change attributable
to trust updates(1) | | Total increase | |
| | (in thousands) | |
2005 | | | $ | 2,262,493 | | | | $ | 63,252 | | | | $ | 10,633 | | | | $ | 73,885 | | |
2004 | | | 1,245,020 | | | | 30,437 | | | | 4,431 | | | | 34,868 | | |
| | | | | | | | | | | | | | | | | | | | | | | |
(1) The change attributable to trust updates in fiscal 2005 and 2004 was primarily the result of the passage of time and the resulting accretion of the discounting inherent in these present value estimates of residuals, rather than changes in our assumptions.
The following table summarizes the changes in the fair value of the residuals receivable for the years ended June 30, 2005 and 2004:
| | 2005 | | 2004 | |
| | (in thousands) | |
Fair value at beginning of period | | $ | 108,495 | | $ | 43,600 | |
Revenue recognized during period | | | | | |
Additions from structuring new securitizations | | 121,187 | | 57,935 | |
Fair value adjustments | | 17,593 | | 6,960 | |
Total residuals fees recognized | | 138,780 | | 64,895 | |
Fair value at end of period | | $ | 247,275 | | $ | 108,495 | |
During fiscal 2005, 2004 and 2003, the fair value adjustments of our residuals receivable resulted in an increase of approximately $17.6 million, $7.0 million and $2.5 million, respectively, due primarily to the passage of time and the impact of movement in the implied forward LIBOR curve. The amount of the fair value adjustments also increased between periods as the underlying receivables balances increased. As we conduct more securitization transactions, we expect that adjustments for the passage of time will continue to increase and thereby add to the residual revenues that we discount to present value.
As we do with our additional structural advisory fees, on a quarterly basis, we update our estimate of the present value of our residuals. In doing so, we give effect for the passage of time, which results in the accretion of the discounting inherent in these present value estimates, and we also adjust for the change, if any, in the discount rate that we use in estimating the present value of these receivables. We used a 12% discount rate throughout during fiscal 2005, 2004 and 2003. We also monitor the performance of trust assets, including default, recovery, prepayment and forward LIBOR rates experience, which we also consider in our estimates. We use an implied forward LIBOR curve to estimate trust cash flows. During fiscal 2005, the implied forward LIBOR curve flattened. The flattening of the curve improved the net excess spread between the trust assets and liabilities, resulting in an increase in the estimated fair value of residuals receivable during the period. In addition, actual LIBOR rates in effect during a period can differ
41
from those implied by forward LIBOR rates at the beginning of a period. These differences can affect the net excess spread between trusts assets and liabilities experienced during the period. During fiscal 2005, actual LIBOR rates increased generally at a faster rate than those implied by the forward LIBOR curve at the beginning of the year. This had a negative impact on the net excess spread between trust assets and liabilities during the year, and thereby reduced the value of the residuals. During fiscal 2004, the rates along the implied forward LIBOR curve increased. These increases in rates resulted in an increase in the average life of the underlying trust assets, thereby increasing the estimated fair value of the residuals receivable during the period. During fiscal 2003, the movement in LIBOR rates did not have a material impact on the fair value of the residuals. For a discussion of the assumptions we make in estimating our residuals, see “—Application of Critical Accounting Policies and Estimates—Service Revenue.”
In determining an appropriate discount rate for valuing residuals, we review the rates used by student loan securitizers, as well as rates used in the much broader ABS market. We believe that the 12% discount rate we use is appropriate given the maximum 24-year life of the trust assets and residuals.
For a discussion of the assumptions we make in estimating our residuals, see “—Application of Critical Accounting Policies and Estimates—Service Revenue.”
Processing fees from TERI
Processing fees from TERI increased to $78.2 million in fiscal 2005 from $35.1 million in fiscal 2004 and $20.6 million in fiscal 2003. The increases were primarily due to increased reimbursed expenses required to process the increasing volume of private label loans that we facilitated during these periods. The volume of private label loans we facilitated increased to $2.6 billion in fiscal 2005 from $1.7 billion in fiscal 2004 and $965 million in fiscal 2003. During fiscal 2005, the increase was also due to the expansion of our loan processing facilities which was partially reimbursed by TERI.
Administrative and other fees
Administrative and other fees increased to $3.5 million in fiscal 2005 from $2.1 in fiscal 2004 and $1.4 million in fiscal 2003. The increases were due primarily to increasing student loan balances in the securitization trusts. We expect that our administrative and other fees will continue to increase as the student loan balances in the securitization trusts continue to increase. We also record as administrative and other fees the reimbursement we receive for certain call center costs. These fees were approximately $0.6 million and $0.3 million for fiscal 2005 and 2004, respectively. The increase in these fees is primarily due to the increase in loan facilitations.
Operating Expenses
Total operating expenses increased to $144.2 million in fiscal 2005 from $70.5 million in fiscal 2004 and $35.9 million in fiscal 2003. Compensation and benefits increased to $67.6 million in fiscal 2005 from $34.8 million in fiscal 2004 and $19.8 million in fiscal 2003. General and administrative expenses increased to $76.6 million in fiscal 2005 from $35.7 million in fiscal 2004 and $16.1 million in fiscal 2003.
Compensation and benefits and general and administrative expenses increased in each of fiscal 2005, 2004 and 2003 primarily as a result of increases in personnel. We hired additional personnel to meet the operating requirements from our growing loan processing and securitization activities. As our financial performance improves, we anticipate awarding higher performance-based compensation to our employees.
42
General and administrative expenses also increased in fiscal 2005 as compared to fiscal 2004 and fiscal 2003 as a result of increases in consulting fees, professional fees, external call center costs, temporary employment services costs, occupancy costs, depreciation expense and advertising expense. Consulting fees increased to $16.1 million in fiscal 2005 from $6.1 million in fiscal 2004 and $2.0 million in fiscal 2003, primarily as a result of the hiring of consultants to assist us in our redesign efforts for our loan origination systems. Professional fees increased to $8.6 million in fiscal 2005 from $4.2 million in fiscal 2004 and $1.8 million in fiscal 2003. These expenses increased primarily as a result of increased legal, audit and investor relations expenses associated with being a public company, including costs related to our compliance with the Sarbanes-Oxley Act of 2002. External call center costs increased to $6.2 million in fiscal 2005 from $2.8 million in fiscal 2004 and $1.4 million in fiscal 2003. Temporary employment services costs increased to $3.8 million in fiscal 2005 from $0.7 million in fiscal 2004 and $0.3 million in fiscal 2003. The increases in external call center costs and temporary employment services costs were primarily due to increases in the volume of loans facilitated during the 2005 period. Occupancy expenses increased to $11.6 million in fiscal 2005 from $4.4 million in fiscal 2004 and $2.7 million in fiscal 2003. Depreciation and amortization expense related to fixed assets and leasehold improvements increased to $5.9 million in fiscal 2005 from $2.8 million in fiscal 2004 and $2.5 million in fiscal 2003. The increase in occupancy, depreciation and amortization expenses is due to the expansion of our loan processing operations and corporate headquarters which resulted in increased office space under lease and additional purchases of fixed assets. Advertising expenses increased to $4.2 million in fiscal 2005 from $0.7 million in fiscal 2004 and $0.2 million in fiscal 2003 as a result of our additional efforts to increase loan facilitation volumes.
We expect that our operating expenses will continue to increase as we devote additional resources to the expected increasing loan volumes facilitated for our existing and new clients and as a result of increased space under lease.
The following table summarizes the components of operating expenses, both those reimbursed and not reimbursed by TERI under our Master Servicing Agreement.
| | Operating expenses | |
| | Expenses reimbursed by TERI | | Expenses not reimbursed by TERI | |
| | | | General and | | Subtotal | | | | General and | | Subtotal | | Total | |
| | Compensation | | administrative | | operating | | Compensation | | administrative | | operating | | operating | |
Fiscal year | | | | and benefits | | expenses | | expenses | | and benefits | | expenses | | expenses | | expenses | |
| | (in thousands) | |
2005 | | | $ | 40,016 | | | | $ | 37,945 | | | | $ | 77,961 | | | | $ | 27,592 | | | | $ | 38,623 | | | | $ | 66,215 | | | $ | 144,176 | |
2004 | | | 18,314 | | | | 16,709 | | | | 35,023 | | | | 16,525 | | | | 18,984 | | | | 35,509 | | | 70,532 | |
2003 | | | 11,205 | | | | 9,363 | | | | 20,568 | | | | 8,611 | | | | 6,708 | | | | 15,319 | | | 35,887 | |
| | | | | | | | | | | | | | | | | | | | | | | | | | | | | | | | | | | | |
Other Income (Expense)
Interest income
Net interest income increased to $3.3 million in fiscal 2005 from net interest income of $0.1 million in fiscal 2004 and net interest expense of $1.5 million in fiscal 2003. The increases in interest income between periods resulted from increases in cash and cash equivalents as a result of the receipt of cash from our IPO in October 2003 and securitization transactions in February 2005, October 2004, June 2004, December 2003, June 2003 and December 2002. During fiscal 2005, the increase in interest income is also due to an increase in the yield on investments. Interest expense for all periods was primarily attributable to $7.9 million of notes issued in June 2001 to TERI as a part of the purchase price for TERI’s loan processing operations as described below in “—Financial Condition, Liquidity and Capital Resources” and for capital lease obligations in fiscal 2005. We had approximately $12.1 million of outstanding capital lease obligations at June 30, 2005.
43
Income Tax Expense
Income tax expense increased to $117.4 million in fiscal 2005 from $53.5 million in fiscal 2004 and $22.5 million in fiscal 2003. The increase in income tax expense was primarily the result of an increase in the amount of income before income tax expense between periods.
Financial Condition, Liquidity and Capital Resources
Our liquidity requirements have historically consisted, and we expect that they will continue to consist, of capital expenditures, working capital, business development expenses, general corporate expenses and potential acquisitions.
On November 5, 2003, we completed an initial public offering of our common stock at a price to the public of $16.00 per share, in which we sold 7,906,250 shares and selling shareholders sold 6,468,750 shares. Net proceeds of the initial public offering to us were approximately $115.1 million. We did not receive any of the proceeds of the sale of the shares sold by the selling stockholders. In June 2004, selling stockholders sold an aggregate of 7,406,312 shares of our common stock in a follow-on public offering at a price of $36.50 per share. In January 2005, selling stockholders sold an aggregate of 3,933,605 shares of our common stock in a follow-on public offering at a price of $57.40 per share. We did not sell any shares in the June 2004 and January 2005 offerings and therefore did not receive any proceeds from the sale of stock. We did, however, receive approximately $3.0 million in connection with the June 2004 offering, and approximately $1.9 million in connection with the January 2005 offering, from certain selling stockholders who exercised options and then sold the resulting shares in the offerings.
In the fourth quarter of fiscal 2005, we announced that our Board of Directors had authorized the repurchase of up to 1,500,000 shares of our common stock from time to time on the open market or in privately negotiated transactions. We engaged Goldman, Sachs & Co. to administer this repurchase program, which is funded using our working capital. As of June 30, 2005, we had purchased 1,469,000 shares pursuant to these repurchases at an average share price excluding commissions of $37.86. We completed the repurchase of all 1,500,000 shares in August 2005.
Short-term Funding Requirements
We expect to fund our short-term liquidity requirements through cash flow from operations and the proceeds of our initial public offering. We believe, based on our current operating plan and the proceeds of our initial public offering, that our current cash and cash equivalents will be sufficient to fund our operations through at least fiscal 2006.
Long-term Funding Requirements
We expect to fund the growth of our business through cash flow from operations and through issuances of common stock, promissory notes or other securities. We expect to assess our financing alternatives periodically and access the capital markets opportunistically. If our existing resources are insufficient to satisfy our liquidity requirements, or if we enter into an acquisition or strategic arrangement with another company, or if we otherwise believe that raising additional capital would be in our best interests and the best interests of our stockholders, we may sell additional equity or debt securities. Any sale of additional equity or debt securities may result in additional dilution to our stockholders, such as incurring additional debt, making capital expenditures or paying dividends. We cannot be certain that additional public or private financing will be available in amounts or on terms acceptable to us, if at all. If we are unable to obtain this additional financing, we may be required to delay, reduce the scope of, or eliminate one or more aspects of our business development activities, which could harm the growth of our business.
44
From our inception, we have raised approximately $147.4 million from the sale of common stock and promissory notes, including approximately $115.1 million in net proceeds from our initial public offering.
Our actual liquidity and capital funding requirements may depend on numerous factors, including:
· our facilities expansion needs;
· the extent to which our services gain increased market acceptance and remain competitive;
· the timing, size and composition of the loan pools of the securitization transactions that we structure; and
· the costs and timing of acquisitions of complementary businesses.
If we are not able to obtain adequate funding when needed, we may have to delay further expansion of our business.
Cash and Cash Equivalents
At June 30, 2005, we had $193.8 million in cash and cash equivalents, and at June 30, 2004, we had $168.7 million in cash and cash equivalents. The increase resulted primarily from our receipt of up-front structural advisory fees in connection with our June 2005, February 2005 and October 2004 securitization transactions offset in part by cash used to repurchase our common stock and purchases of property and equipment. Cash and cash equivalents include primarily funds deposited in a money market fund that invests in short-term obligations of the U.S. Treasury and repurchase agreements fully collateralized by obligations of the U.S. Treasury.
Service Receivables
Our service receivables increased to $309.6 million at June 30, 2005 from $148.9 million at June 30, 2004, primarily as a result of the structural advisory fees and residuals generated from the June 2005, February 2005 and October 2004 securitization transactions. The increase in structural advisory fees and residuals receivables was partially offset by the receipt of $10.25 million in structural advisory fees in July 2004. In the December 2003 securitization of private label loans, we collected $24.5 million of the up-front structural advisory fee in December 2003, at the time the securitization transaction closed, and we received a second payment of $10.25 million in July 2004 from this December 2003 securitization transaction (of which $7.25 million was used to repay an outstanding note payable). The $10.25 million second payment was recorded as a structural advisory fee receivable at June 30, 2004.
Property and Equipment, Net
In fiscal 2005, our net property and equipment increased by $28.3 million, as we spent $22.6 million on the expansion of our processing facilities and corporate headquarters, which was partially offset by $5.9 million of depreciation expense recorded during the period. Included in capital additions in fiscal 2005 are capitalized software development costs of $8.4 million which are primarily related to the improvement of our loan processing systems. In fiscal 2005, we financed the acquisition of $11.6 million in property and equipment through capital leases.
Prepaid Income Taxes
We had prepaid income taxes of $2.6 million at June 30, 2005 and $20.3 million at June 30, 2004. At June 30, 2005, this balance was primarily derived from a tax benefit of $34.3 million from employee stock option exercises, principally in connection with a stock option exercise at the time of our follow-on offering in January 2005. At June 30, 2004, this balance was primarily derived from a tax benefit of $29.9 million from employee stock option exercises, principally in connection with stock option exercises at the time of
45
our follow-on offering in June 2004. The timing of these benefits and our estimated tax payments, after offsetting accrued income taxes, resulted in the net prepaid income taxes balance at each year end.
Other Prepaid Expenses
We had other prepaid expenses of $4.2 million at June 30, 2005 and $2.8 million at June 30, 2004. The increase in other prepaid expenses was due to capitalized advertising costs, an increase in prepaid insurance, and the timing of the prepayment of services.
Other Assets
We had other assets of $3.2 million at June 30, 2005 and $2.2 million at June 30, 2004. The increase in other assets is primarily due to an increase in prepaid fees to be reimbursed to us from trusts created in future securitization transactions of $0.2 million and a deposit of $0.5 million related to a maintenance agreement we recently executed.
In connection with our facilitation of the securitization of GATE loans in June 2004, six schools participating in our GATE program faced limits on the amount of surety coverage that the GATE program’s current surety provider was willing to provide to the NCT trust on their behalf. We provided the NCT trust with an additional aggregate cash surety deposit of approximately $1.8 million on behalf of these six schools. This deposit is included in other assets at June 30, 2005 and 2004. The surety coverage and our cash deposit provides the NCT trust bondholders with assurance that the pledge commitment that these school clients make to reimburse the NCT trusts for defaults by their student borrowers will be fulfilled.
Our cash deposit with the NCT trust on behalf of these schools will earn interest at the prevailing short-term interest rates. We will also earn a surety fee equal to 150 basis points of the initial notional amount of the pledge commitment which our cash deposit supports. As schools reimburse the NCT trusts for student defaults, the amount of their pledge commitment is reduced. We are entitled to withdraw amounts in the surety reserve account, including earned interest and surety fees, to the extent the balance in the surety reserve account exceeds the pledge commitment. Once the NCT trust bondholders have been paid in full, we will receive the entire amount remaining in the surety reserve account.
Accounts Payable and Accrued Expenses
We had accounts payable and accrued expenses of $33.3 million at June 30, 2005 and $26.3 million at June 30, 2004. Accrued bonuses were approximately $7.6 million higher at June 30, 2005 as compared to June 30, 2004, primarily due to an increase in the number of our employees and the adoption of our executive incentive compensation plan by our stockholders in November 2004. Accrued payroll costs were approximately $0.9 million higher at June 30, 2005 as compared to June 30, 2004, primarily due to the timing of our year end relative to the date some of our employees are paid. Accrued call center costs and accrued temporary employment costs were approximately $1.3 million higher at June 30, 2005 as compared to June 30, 2004, primarily due to the timing of the payment of invoices. Accrued professional fees were approximately $1.6 million higher at June 30, 2005 as compared to June 30, 2004, primarily due to increased audit and legal costs. Our general accruals were approximately $3.0 million higher at June 30, 2005 as compared to June 30, 2004, primarily due to increased accruals related to advertising and miscellaneous consulting costs. At June 30, 2005, we had accrued an additional $1.2 million as compared to June 30, 2004 in consulting costs related to the improvement of our loan processing operations. These increases were offset by a decrease in accruals related to tax withholdings. In July 2004, we paid approximately $8.2 million of withholding taxes that we had collected from employees related to their exercise of non-qualified stock options in our follow-on offering in June 2004.
46
Net Deferred Income Tax Liability
We had a net deferred income tax liability of $84.2 million at June 30, 2005 and $40.1 million at June 30, 2004. We have a net deferred income tax liability because, under GAAP, we recognize residuals in book income earlier than they are recognized for tax purposes. Our deferred income tax liability increased primarily as a result of the increase in residual revenue recognized in fiscal 2005. This increase was partially offset by the recognition of our share of taxable income from the securitization trusts.
Notes Payable
We had notes payable and capital lease obligations of $12.1 million at June 30, 2005 and $9.2 million at June 30, 2004. During the second quarter of fiscal 2004, we received $7.0 million upon the issuance of a $7.25 million note to the lead underwriter of our December 2003 securitization. We repaid this note with the first $7.25 million of the second up-front structural advisory fee that we received in July 2004 in connection with the December 2003 securitization. This decrease in notes payable was offset by an increase in capital lease obligations of $11.6 million during fiscal 2005 as we financed the acquisition of property and equipment, primarily for our expanded loan processing operations. We had notes payable to TERI of $5.3 million at June 30, 2005 and $6.0 million at June 30, 2004. This balance relates to two acquisition notes in an aggregate original principal amount of $7.9 million that we issued to acquire TERI’s loan processing operations in 2001.
Deferred Compensation
We had deferred compensation of $3.1 million at June 30, 2005 as we granted restricted stock units in 2005 to certain senior managers and executive officers. The deferred compensation recorded represents the value of these units on the date of grant net of amortization expense recognized. Deferred compensation is amortized ratably into expense over the respective service period related to each grant.
Contractual Obligations
In addition to our notes payable and the agreement with TERI to purchase updates to the student loan database, we have future cash obligations under various types of contracts. We lease office space, a corporate aircraft and office equipment under long-term operating and capital leases. The table below summarizes the dollar amounts of our contractual obligations as of June 30, 2005 for the periods specified:
| | Contractual obligations | |
Fiscal year | | | | Long-term
debt | | Database
purchases | | Operating
lease obligations | | Capital
lease obligations | | Total | |
| | (in thousands) | |
2006 | | | $ | 755 | | | | $ | 748 | | | | $ | 12,080 | | | | $ | 4,702 | | | $ | 18,285 | |
2007 | | | 802 | | | | 248 | | | | 12,952 | | | | 3,800 | | | 17,802 | |
2008 | | | 852 | | | | 248 | | | | 12,256 | | | | 2,952 | | | 16,308 | |
2009 | | | 904 | | | | 248 | | | | 9,945 | | | | 978 | | | 12,075 | |
2010 | | | 960 | | | | 248 | | | | 9,728 | | | | 712 | | | 11,648 | |
Thereafter | | | 1,019 | | | | 248 | | | | 28,145 | | | | — | | | 29,412 | |
Total | | | $ | 5,292 | | | | $ | 1,988 | | | | $ | 85,106 | | | | $ | 13,144 | | | $ | 105,530 | |
| | | | | | | | | | | | | | | | | | | | | | | | | | |
Cash Flows
Our net cash provided by operating activities increased to $108.4 million for fiscal 2005, compared to cash provided by operating activities of $33.4 million for fiscal 2004. Cash provided by operations resulted primarily from net income of $159.7 million, deferred income tax expense of $44.3 million and the tax benefit from employee stock options of $34.3 million, partially offset by an increase in residuals of $138.8 million and an increase in structural advisory fees of $19.0 million.
47
We used $23.3 million of net cash in investing activities during fiscal 2005. The principal use of net cash was capital expenditures related to the expansion of our loan processing facilities and corporate headquarters and, to a lesser extent, payments for loan database updates from TERI.
We used net cash of $60.0 million in financing activities in fiscal 2005. Cash used in financing activities primarily related to the repurchase of $55.7 million of our common stock in open-market transactions and the repayment of the $7.25 million note that we issued to the lead underwriter of our December 2003 securitization, offset in part by the exercise of employee stock options.
We expect that our capital expenditure requirements for fiscal 2006 will be approximately $22.6 million. We plan to utilize our equipment line of credit to finance a portion of these costs. We expect to use these funds primarily for the expansion of our loan processing operations and the purchase of computer and office equipment. We currently have capital expenditure commitments over the next 12 months of approximately $3.1 million.
Borrowings
In June 2001, we issued two acquisition notes to TERI totaling $7.9 million to acquire TERI’s loan processing operations. Principal and interest at an annual rate of 6% is payable on these notes in 120 monthly payments of an aggregate of $87,706 commencing on July 20, 2001 and ending on June 20, 2011. At June 30, 2005, outstanding principal on these notes totaled $5.3 million as compared to $6.0 million at June 30, 2004.
In August 2003, we entered into a $10 million revolving credit facility with Fleet National Bank. Fleet National Bank was subsequently acquired by Bank of America, and our agreement related to this facility has been assigned to Bank of America. The revolving credit facility matured on August 28, 2005, and we do not intend to extend it. The revolving credit line contained financial covenants, including:
· minimum trailing 12-month up-front structural advisory fees of not less than $25 to $30 million;
· minimum tangible net worth of not less than the sum of 100% of consolidated tangible net worth with respect to the fiscal year most recently ended plus 85% of consolidated net income for the fiscal year most recently ended;
· maximum liabilities to net worth ratio of not greater than 1.15 to 1.00; and
· minimum cash flow to debt service ratio of not less than 1.50 to 1.00, as well as certain financial reporting covenants.
We met these financial and reporting requirements during the term of the revolving credit facility. This agreement restricted our ability to pay cash dividends in the event we are in default. As of June 30, 2005, we had no balance outstanding under the revolving credit facility. The maximum annual commitment fee was $25,000. Bank of America had issued on our behalf a letter of credit in the amount of $0.5 million in lieu of security deposits for the lease of office space, which reduced the amount that we could borrow under the revolving credit facility. Third party beneficiaries had not drawn upon this letter of credit.
In December 2003, we issued a $7.25 million note to the lead underwriter of our December 2003 securitization to monetize a substantial portion of the second up-front structural advisory fee payment which we received in July 2004. We repaid the note in full with the first $7.25 million of that payment.
In January 2005, we entered into an equipment financing lease agreement which we will use to finance the purchases of furniture and equipment. The agreement allows us to finance up to $20.0 million worth of furniture and equipment purchased before December 30, 2005. We expect to repay amounts drawn down on the lease in terms ranging from three to five years. As of June 30, 2005, we had drawn $10.5 million from this line of credit.
48
In December 2004, we entered into an operating lease for the use of a corporate aircraft for basic annual rent of approximately $1.4 million through 2009. This operating lease was structured as a capital lease for tax purposes.
Off-Balance Sheet Transactions
We structure and facilitate the securitization of loans for our clients through a series of bankruptcy remote, qualified special purpose trusts. We do not utilize these trusts as a means to transfer assets or liabilities from our balance sheet to those of the trusts because we are not the originator of the securitized student loans or the issuer of the related debt. We do not serve as lender, guarantor or loan servicer. Specifically, these trusts purchase such student loans from third-party financial institutions, the financing of which is provided through the issuance of asset-backed securities.
The principal uses of these trusts are to:
· generate sources of liquidity for our clients’ assets sold into such trusts and to reduce their credit risk;
· make available more funds to students and colleges; and
· leverage the capital markets to reduce borrowing costs to students.
See “Application of Critical Accounting Policies and Estimates—Consolidation” for a discussion of our determination to not consolidate these securitization trusts.
Recent Accounting Pronouncements
On December 16, 2004, the FASB issued FASB Statement No. 123 (revised 2004), “Share-Based Payment” (Statement 123R), which is a revision of FASB Statement No. 123, “Accounting for Stock-Based Compensation.” Statement 123R supersedes APB Opinion No. 25, “Accounting for Stock Issued to Employees,” and amends FASB Statement No. 95, “Statement of Cash Flows.” Statement 123R requires an entity to measure the cost of employee services received in exchange for an award of equity instruments, including stock options and restricted stock units, based on the grant-date fair value of the award, with limited exceptions. That cost will be recognized over the period during which the employee is required to provide service in exchange for the award, which is typically the vesting period. Statement 123R eliminates the alternative to use Opinion 25’s intrinsic value method of accounting for stock options that was provided in Statement 123 as originally issued.
We adopted Statement 123R on July 1, 2005 using the modified prospective method discussed below. Statement 123R permits public companies to adopt its requirements using one of two methods:
1. A “modified prospective” method in which compensation cost is recognized beginning with the effective date (a) based on the requirements of Statement 123R for all share-based payments granted after the effective date and (b) based on the requirements of Statement 123 for all awards granted to employees prior to the effective date of Statement 123R that remain unvested on the effective date.
2. A “modified retrospective” method which includes the requirements of the modified prospective method described above, but also permits entities to restate their previously issued financial statements to include in their income statements previously recognized under Statement 123 for purposes of pro forma disclosures for either (a) all prior periods or (b) prior interim periods of the year of adoption.
49
As permitted by Statement 123, we accounted for share-based payments to employees using Opinion 25’s intrinsic value method through June 30, 2005, and, as such, generally recognized no compensation cost for employee stock options. The adoption of Statement 123R’s fair-value method will impact our results of operations, although the impact of adoption of Statement 123R cannot be predicted at this time because it will depend on levels of share-based payments granted in the future. However, had we adopted Statement 123R in prior periods, the impact of that standard would have had approximately the same impact as Statement 123, as described in the disclosure of pro forma net income and earnings per share in Note 2 to these financial statements. Statement 123R also requires that the benefits of tax deductions in excess of recognized compensation cost be reported as a financing cash flow, rather than as an operating cash flow as previously required under EITF Issue No. 00-15 “Classification in the Statement of Cash Flows of the Income Tax Benefit Received by a Company upon Exercise of a Nonqualified Employee Stock Option.” This requirement will reduce net operating cash flows and increase net financing cash flows in periods after adoption. While we cannot estimate what the impact on the cash flow statement will be in the future (because they depend on, among other things, when employees exercise stock options and the amount of expense recognized related to the value of stock options), the amount of operating cash flows recognized in prior periods for such excess tax deductions were $34.3 million during fiscal 2005 and $29.9 million during fiscal 2004. We recognized no operating cash flows for such excess tax deductions in fiscal 2003.
Inflation
Inflation was not a material factor in either revenue or operating expenses during the periods presented.
Factors That May Affect Future Results
This annual report on Form 10-K includes forward-looking statements within the meaning of Section 21E of the Securities Exchange Act of 1934, as amended, or the Exchange Act. For this purpose, any statements contained herein regarding our strategy, future operations, financial position, future revenues, projected costs, prospects, plans and objectives of management, other than statements of historical facts, are forward-looking statements. The words “anticipates,” “believes,” “estimates,” “expects,” “intends,” “may,” “plans,” “projects,” “will,” “would” and similar expressions are intended to identify forward-looking statements, although not all forward-looking statements contain these identifying words. We cannot guarantee that we actually will achieve the plans, intentions or expectations expressed or implied in our forward-looking statements. There are a number of important factors that could cause actual results, levels of activity, performance or events to differ materially from those expressed or implied in the forward-looking statements we make. These important factors include our “critical accounting estimates” and the risk factors set forth below. Although we may elect to update forward-looking statements in the future, we specifically disclaim any obligation to do so, even if our estimates change, and readers should not rely on those forward-looking statements as representing our views as of any date subsequent to the date of this annual report.
50
Risk Factors
We derive a significant portion of our revenue and substantially all of our income from structuring securitization transactions; our financial results and future growth would be adversely affected if we are unable to structure securitizations.
Securitization refers to the technique of pooling loans and selling them to a special purpose, bankruptcy remote entity, typically a trust, which issues securities to investors backed by those loans. As of the date of this Annual Report, we have provided structural advisory and other services for 27 loan securitizations since our formation in 1991, and we receive fees for these services. In connection with securitizations, we receive compensation in the form of structural advisory fees, residuals and administrative fees for management of the trusts. The amount and timing of the fees we recognize are affected, in part, by the size and composition of loan pools to be securitized, the return expectations of investors and assumptions we make regarding loan portfolio performance, including defaults, recoveries, prepayments and the cost of funding. Revenue from new securitizations constituted 76% of our total service revenue for fiscal 2005, 78% of our total service revenue for fiscal 2004 and 73% of our total service revenue for fiscal 2003. Substantially all of our net income in those fiscal periods was attributable to securitization-related revenue.
The timing of our securitization activities will greatly affect our quarterly financial results.
Our quarterly revenue, operating results and profitability have varied and are expected to continue to vary significantly on a quarterly basis. In fiscal 2005, we recognized 5%, 37%, 29% and 29% of our total service revenue in the respective fiscal quarters of fiscal 2005. In fiscal 2004, we recognized 5%, 39%, 5% and 51% of our total service revenue in the respective fiscal quarters of 2004. Our quarterly revenue varies primarily because of the timing of the securitizations that we structure. In fiscal 2004, we facilitated one securitization in the second quarter and two securitizations in the fourth quarter, but none in the first or third quarters. In fiscal 2005, we facilitated one securitization in the second quarter, one securitization in the third quarter, and three securitizations in the fourth quarter, but none in the first quarter. The timing of our securitization activities is affected to some degree by the seasonality of student loan applications and loan originations. Origination of student loans is generally subject to seasonal trends, with the volume of loan applications increasing with the approach of tuition payment dates. In fiscal 2005, we processed 39% of our total loan facilitation volume in the first quarter ended September 30, 2004, and 21%, 24%, and 17% of our total loan facilitation volume in the respective successive quarters. In fiscal 2004, we processed 34% of our total loan facilitation volume in the first quarter ended September 30, 2003, and 20%, 27% and 19% of our total loan facilitation volume in the respective successive quarters.
A number of factors, some of which are beyond our control, may adversely affect our securitization activities and thereby adversely affect our results of operations.
Our financial performance and future growth depend in part on our continued success in structuring securitizations. Several factors may affect both our ability to structure securitizations and the revenue we generate for providing our structural advisory and other services, including the following:
· degradation of the credit quality and performance in the loan portfolios of the trusts we structure could reduce or eliminate investor demand for securitizations that we facilitate in the future;
· prolonged volatility in the capital markets generally or in the student loan sector specifically, which could restrict or delay our access to the capital markets;
· unwillingness of financial guarantee providers to offer credit insurance in the securitizations that we structure or in student loan-backed securitizations generally;
51
· adverse performance of, or other problems with, student loan-backed securitizations that other parties facilitate could impact pricing or demand for our securitizations; and
· any material downgrading or withdrawal of ratings given to securities previously issued in securitizations that we structured could reduce demand for additional securitizations that we structure.
A portion of the securities issued since 1998 in securitization transactions that we structured were sold to asset-backed commercial paper conduits. If these or similar asset-backed conduits cease to purchase securities in the securitizations that we structure, we may experience a delay in the timing of our securitizations as we seek to find alternate channels of distribution.
Under the terms of some of our contracts with key lender clients, we have an obligation to securitize loans originated by those lenders periodically, typically twice per year. We may agree with other lenders to securitize more frequently in the future. If we do not honor these obligations, we may be required to pay liquidated or other damages, which could adversely affect our results of operations.
In connection with our recognition of revenue from securitization transactions, if the estimates we make, and the assumptions on which we rely, in preparing our financial statements prove inaccurate, our actual results may vary from those reflected in our financial statements.
We receive structural advisory fees for our services in connection with securitization transactions. We receive an up-front portion of these structural advisory fees when the securitization trust purchases the loans or soon thereafter. We receive an additional portion of these structural advisory fees over time, based on the amount of loans outstanding in the trust from time to time over the life of the trust. We also have the right to receive a portion of the residual interests that the trust creates. As required under GAAP, we recognize as revenue the present value of the additional portion of the structural advisory fees and residuals at the time the securitization trust purchases the loans because they are deemed to be earned before they are actually paid to us. We record additional structural advisory fees and residuals as receivables on our balance sheet at fair value. Accounting rules require that these receivables be marked-to-market. We estimate the fair value both initially and in each subsequent quarter and reflect the change in value in earnings for that period. Our key assumptions to estimate the value include prepayment and discount rates, interest rate trends, the spread between LIBOR and the auction rates on our senior auction rate notes, the expected credit losses from the underlying securitized loan portfolio, net of recoveries, and the expected timing of cash flows from the trusts’ underlying student loan assets. If our assumptions are wrong, the additional structural advisory fees and residuals that we receive from the trusts could be significantly less than reflected in our current financial statements, and we may incur a material negative adjustment to our earnings in the period in which our assumptions change. For a discussion of the sensitivity of the additional structural advisory fees and residuals to variations in our assumptions and estimates, see “Management’s Discussion and Analysis of Financial Condition and Results of Operations—Executive Summary—Application of Critical Accounting Policies and Estimates—Service Revenue—Sensitivity Analysis.”
Our residuals in each securitization we have facilitated are subordinate to securities issued to investors in such securitizations and may fail to generate any revenue for us if the securitized assets only generate enough revenue to pay the investors.
Our financial results could be adversely affected if we were required to consolidate the financial results of the entities that we use for securitizations that we facilitate.
We provide structural advisory and other services for loan securitizations undertaken through Delaware statutory trusts. We do not consolidate the financial results of the trusts with our own financial results. For a discussion of our decision not to consolidate, see “Management’s Discussion and Analysis of
52
Financial Condition and Results of Operations—Executive Summary—Application of Critical Accounting Policies and Estimates—Consolidation” included in this Annual Report. Some of the relevant accounting rules are in the process of being amended. If we were required to consolidate the financial results of one or more trusts with our own financial results as a result of amendments or changes in accounting rules, or if the SEC or other accounting authorities do not agree with our current approach, our financial results could be adversely affected, particularly in the early years of a trust when the trust typically experiences losses.
In structuring and facilitating securitizations of our clients’ loans and as holders of rights to receive residual cash flows in those trusts, we may incur liabilities to investors in the asset-backed securities those trusts issue.
We have facilitated and structured a number of different special purpose trusts that have been used in securitizations to finance student loans that our clients originate. Under applicable state and federal securities laws, if investors incur losses as a result of purchasing asset-backed securities that those trusts issue, we could be deemed responsible and could be liable to those investors for damages. If we failed to cause the trusts to disclose adequately all material information regarding an investment in the asset-backed securities or if the trust made statements that were misleading in any material respect in information delivered to investors, it is possible that we could be held responsible for that information or omission. In addition, under various agreements entered into with underwriters or financial guarantee insurers of those asset-backed securities, we are contractually bound to indemnify those persons if investors are successful in seeking to recover losses from those parties and the trusts are found to have made materially misleading statements or to have omitted material information.
We do not maintain reserves or insurance against this potential liability. If we are liable for losses investors incur in any of the securitizations that we facilitate or structure, our profitability or financial position could be materially adversely affected.
If our relationships with key clients terminate, our revenue and results of operations would be adversely affected.
We structure and support private student loan programs for commercial banks, including JPMorgan Chase Bank and Bank of America. We also structure and support private student loan programs for marketing partners that refer their borrowers to a particular lending source, such as Charter One Bank. We refer to these lenders as referral lenders. Structural advisory fees and residuals from securitization of JPMorgan Chase Bank private label loans represented approximately 30% of our total service revenue for fiscal 2005 and approximately 43% of our total service revenue for fiscal 2004. Structural advisory fees and residuals from securitization of Bank of America private label loans represented approximately 18% of total service revenue for fiscal 2005 and approximately 9% of total service revenue for fiscal 2004. In addition, Bank of America is the exclusive lender for our GATE program clients. Our GATE programs contributed 3% of our total service revenue in fiscal 2005 and 4% of our total service revenue in fiscal 2004. Structural advisory fees and residuals from securitization of private label loans funded by Charter One Bank represented approximately 22% of our total service revenue for fiscal 2005 and approximately 17% of our total service revenue in fiscal 2004.
We have agreements with these commercial banks that govern the purchase of loans for securitization. Our agreement with JPMorgan Chase Bank is scheduled to terminate in April 2007. Our agreement with Charter One Bank is scheduled to terminate in May 2006, except with respect to loans marketed by Collegiate Funding Services, L.L.C. and funded by Charter One Bank, in which case our agreement has a term through July 2007. Our agreement with Bank of America governing the purchase of school channel loans can be terminated at any time upon 180 days notice. Of our two agreements with Bank of America that govern the purchase of GATE loans, one may terminate at any time upon 120 days notice and the other may terminate as early as May 2006. Our agreement with Bank of America governing the purchase of direct-to-consumer loans may terminate as early as May 2006. Each client above has the right to
53
terminate their agreement on short notice, generally 30 days or less, if we materially breach our agreement, including our failure to perform at service levels specified in those contracts. In addition, under the terms of our lender clients’ guaranty agreements with TERI, both the lender and TERI may propose modifications to loan program guidelines during the first calendar quarter of each year. If the parties are unable to agree on a proposed modification, such as an adjustment of the guarantee fees, the party proposing the modification has the option of terminating the guaranty agreement, effective as of May 1 of that calendar year. Under its master loan guaranty agreement with us, TERI may not propose a change to program guidelines without our consent. Similarly, under our agreements with lenders that have multi-year terms, the lender cannot change the program guidelines without our consent, which we cannot unreasonably withhold.
A significant decline in services to JP Morgan Chase, Bank of America or Charter One Bank, or the termination of guaranty agreements between those lenders and TERI, could reduce the overall volume of loans we facilitate, which could be difficult to replace through arrangements with other lenders. Our revenue, business and financial results could suffer as a result.
If our relationship with TERI terminates, our business could be adversely affected.
In June 2001, we purchased the loan processing operations of TERI and entered into a series of agreements to govern future securitizations of TERI-guaranteed loans. TERI continues to provide private student loan guarantee, education information and counseling services for students, and is the exclusive third party provider of borrower default guarantees for our clients’ private label loans. We have entered into an agreement to provide various services for TERI and received fees from TERI for services performed of $78.2 million, or 19% of total service revenue, for fiscal 2005, $35.1million, or 18% of total service revenue, for fiscal 2004 and $20.6 million, or 23% of total service revenue, for fiscal 2003. In addition, we have agreed to undertake on a best-efforts basis to arrange or facilitate securitizations for a limited category of TERI-guaranteed loans and have the right to receive structural advisory and other fees in connection with these securitizations. We also have entered into an agreement to receive from TERI updated information about the performance of the student loans it has guaranteed to allow us to supplement our database. Each of these agreements with TERI had an initial term through June 2006. In October 2004, we exercised our option to renew each agreement for an additional five-year term, through June 2011. If our agreements with TERI terminate for any reason, or if TERI fails to comply with its obligations, our business would be adversely affected and the value of our intangible assets could be impaired for the following reasons:
· we may not be able to offer our clients guarantee services from another guarantor and, accordingly, our access to loans and our opportunities to structure securitization transactions may diminish significantly;
· we may not be successful in establishing an arrangement with a third party to provide the warranties that TERI currently provides to lenders related to origination services. In such case, we may be required to provide such warranties; and
· if TERI is unable to provide guarantee services, the financial guarantee insurance coverage we obtain in securitization transactions could be more costly, if it is available at all.
In such events, demand for our services, including opportunities to structure and facilitate securitization transactions, could decline, which would adversely affect our business. In addition, the value of the loan pools in the securitization transactions we facilitate could decline and the value of our residuals could be reduced.
54
Our business could be adversely affected if TERI’s ratings are downgraded, if TERI fails to maintain its not-for-profit status or if TERI’s not-for-profit status ceased to be a competitive advantage.
In its role as guarantor in the private education lending market, TERI agrees to reimburse lenders for unpaid principal and interest on defaulted loans. TERI is the exclusive provider of borrower default guarantees for our clients’ private student loans. As of June 30, 2005, TERI had a Baa3 counterparty rating from Moody’s Investors Service, which is the lowest investment grade rating, and an insurer financial strength rating of A+ from Fitch Ratings. If these ratings are lowered, our clients may not wish to enter into guarantee arrangements with TERI. In addition, we may receive lower structural advisory fees because the costs of obtaining financial guarantee insurance for the asset-backed securitizations that we structure could increase. In such case, our business would be adversely affected.
TERI is a not-for-profit organization and, as a result, borrowers have been deemed unable to discharge in bankruptcy proceedings loans that TERI guarantees. If TERI loses its not-for-profit status, and TERI-guaranteed student loans become dischargeable in bankruptcy, recovery rates on these loans could decline. In such event, our business could be adversely affected for the following reasons:
· our residuals in the securitization trusts could decline because of increased default rates and collection costs; and
· the securitization transactions that we structure could be on less favorable terms because investors and financial guarantee insurers could become more concerned with default and recovery rates.
Assuming that TERI retains its not-for-profit status, TERI’s position as the leading provider of private education loan guarantees may be adversely affected by recent amendments to the U.S. federal bankruptcy laws. As a result of these amendments:
· lenders who currently seek a guarantee from a not-for-profit entity such as TERI in order for their private student loans for higher education expenses to become non-dischargeable in bankruptcy may cease to do so; and accordingly
· TERI may cease to have a competitive advantage over potential for-profit providers of guarantees of private student loans for higher education expenses.
As a result, lenders may be less inclined to utilize the TERI-guaranteed private label loan programs, which could, in turn, harm our business and results of operations.
Our business could be adversely affected if PHEAA fails to provide adequate or timely services or if our relationship with PHEAA terminates.
As of June 30, 2005, PHEAA serviced a majority of loans whose origination we facilitate. This arrangement allows us to increase the volume of loans in our clients’ loan programs without incurring the overhead investment in servicing operations. As with any external service provider, there are risks associated with inadequate or untimely services. We regularly monitor the servicing portfolio reports, including delinquencies and defaults. A substantial increase in the delinquency rate could adversely affect our ability to access profitably the securitization markets for our clients’ loans. In addition, if our relationship with PHEAA terminates, we would either need to expand or develop a relationship with another TERI-approved loan servicer, which could be time consuming and costly. In such event, our business could be adversely affected. Although we periodically review the costs associated with establishing servicing operations to service loans, we have no plans to establish and perform servicing operations at this time.
55
The outsourcing services market for education lending is highly competitive and if we are not able to compete effectively, our revenue and results of operations may be adversely affected.
We assist national and regional financial institutions and educational institutions, as well as businesses and other enterprises, in structuring and supporting their private education loan programs. In providing our services, we receive fees for services we provide primarily in connection with the securitization of our clients’ loans. The outsourcing services market in which we operate includes a large number of service providers, some of which have greater financial, technical and marketing resources, larger customer bases, greater name recognition and more established relationships with their clients than we have. Larger competitors with greater financial resources may be better able to respond to the need for technological changes, compete for skilled professionals, build upon efficiencies based on a larger volume of loan transactions, fund internal growth and compete for market share generally. We may face competition from our clients if they choose to provide directly the services that we currently provide, and from third parties who decide to expand their services to include the suite of services that we provide. We are aware of two principal competitors, SLM Corporation, or Sallie Mae, and Servus Financial Corporation, an affiliate of Wells Fargo Company, that offer a similar range of services to lenders. Our business could also be adversely affected if Sallie Mae’s recently announced program to market private student loans directly to consumers becomes successful or if Sallie Mae seeks to market more aggressively to third parties the full range of services for private loan programs that we provide. If we are not able to compete effectively, our revenue and results of operations may be adversely affected. In addition, if third parties choose to provide the range of services that we provide, pricing for our services may become more competitive, which could lower our profitability.
In addition, there has been significant consolidation within the banking industry. For example, Charter One Financial, Inc., the publicly traded parent company of Charter One Bank was acquired by Citizens Financial Group, Inc., and Bank One Corporation recently merged with J.P. Morgan Chase & Co. In addition, Sallie Mae recently acquired our client, Southwest Student Services Corporation, resulting in termination of our relationship with that client. Further consolidation could result in a loss of business if one or more of our clients were acquired by a competitor or a lender that is not our client.
Historically, lenders in the education loan market have focused their lending activities on federal loans because of the relative size of the federal loan market and because the federal government guarantees repayment of these loans, thereby significantly limiting the lenders’ credit risk. The demand for our services could decline if lenders place additional emphasis on the private education loan market and offer the services we provide.
The growth of our business could be adversely affected if annual and aggregate limitations under federal student loan programs increase.
We focus our business exclusively on the market for private education loans, and more than 90% of our business is concentrated in loan programs for post-secondary education. The availability of loans that the federal government originates or guarantees affects the demand for private student loans because students and their families often rely on private loans to bridge the gap between available funds, including family savings, grants and federal and state loans, and the costs of post-secondary education. The federal government currently places both annual and aggregate limitations on the amount of federal loans that any student can receive, and these limitations are adjusted in connection with funding authorizations from the United States Congress for programs under the Higher Education Act. The limitations on federal student loans have not been adjusted since 1992, and Congress is currently considering proposals that could increase the limitations in the future. If Congress materially increases either the annual or aggregate loan limitations, or otherwise increases the funding available under federal student loan programs, demand for private student loans could weaken, which could adversely affect the volume of private loans and the securitization transactions that we facilitate and structure and, as a result, the growth of our business.
56
Access to alternative means of financing the costs of education may reduce demand for private student loans.
The demand for private student loans could weaken if student borrowers use other vehicles to bridge the gap between available funds and costs of post-secondary education. These vehicles include, among others:
· home equity loans, under which families borrow money based on the value of their real estate;
· pre-paid tuition plans, which allow students to pay tuition at today’s rates to cover tuition costs in the future;
· 529 plans, which are state-sponsored investment plans that allow a family to save funds for education expenses; and
· education IRAs, now known as Coverdell Education Savings Accounts, under which a holder can make annual contributions for education savings.
If demand for private student loans weakens, we would experience reduced demand for our services, which would seriously harm our financial results.
If competitors acquire or develop a student loan database or advanced loan information processing systems, our business could be adversely affected.
We own a proprietary database of historical information on private student loan performance that we use to help us establish the pricing provisions of new loan programs, determine the terms of securitization transactions and establish the present value of the structural advisory fees and residuals that we recognize as revenue. We also have developed a proprietary loan information processing system to enhance our application processing and loan origination capabilities. Our student loan database and loan information processing system provide us with a competitive advantage in offering our services. Third parties could create or acquire databases and systems such as ours. For example, as lenders and other organizations in the student loan market originate or service loans, they compile over time information for their own student loan performance database. If a third party creates or acquires a student loan database or develops a loan information processing system, our competitive positioning, ability to attract new clients and business could be adversely affected.
If our clients do not successfully market and sell student loans, our business will be adversely affected.
We provide outsourcing services to lenders, marketing partners and educational institutions, as well as businesses and other organizations, in structuring and supporting their private education loan programs. We rely on our clients to market and sell education loans to student borrowers. If they do not devote sufficient time and resources to their marketing efforts, or if they are otherwise not successful in these efforts, then we may experience a reduction in the volume of loans that we process and securitize, and our business will be adversely affected.
Changes in interest rates could affect the value of our additional structural advisory fees and residuals receivables, as well as demand for private student loans and our services.
Student loans typically carry floating interest rates. Higher interest rates would increase the cost of the loan to the borrower, which in turn, could lessen demand for our services and cause an increase in prepayment and default rates for outstanding student loans. If this occurs, we may experience a decline in the value of our additional structural advisory fees and residuals receivables in connection with the securitizations that we facilitate. In addition, most of the student loans that our clients originate carry floating rates of interest tied to prevailing short-term interest rates. An increase in interest rates could reduce borrowing for education generally, which, in turn, could cause the overall demand for our services to decline.
57
If we are unable to protect the confidentiality of our proprietary database and information systems and processes, the value of our services and technology will be adversely affected.
We rely on trade secret laws and restrictions on disclosure to protect our proprietary database and information systems and processes. We have entered into confidentiality agreements with third parties and with some of our employees to maintain the confidentiality of our trade secrets and proprietary information. These methods may neither effectively prevent disclosure of our confidential information nor provide meaningful protection for our confidential information if there is unauthorized use or disclosure.
We own no patents and have filed no patent applications with respect to our proprietary database or loan information processing systems. Accordingly, our technology is not covered by patents that would preclude or inhibit competitors from entering our market. Monitoring unauthorized use of the systems and processes that we developed is difficult, and we cannot be certain that the steps that we have taken will prevent unauthorized use of our technology. Furthermore, others may independently develop substantially equivalent proprietary information and techniques or otherwise gain access to our proprietary information. If we are unable to protect the confidentiality of our proprietary information and know-how, the value of our technology and services will be adversely affected.
An interruption in or breach of our information systems may result in lost business.
We rely heavily upon communications and information systems to conduct our business. As we implement our growth strategy and increase our volume of business, that reliance will increase. Any failure or interruption, or breach in security, of our information systems or the third party information systems on which we rely could cause underwriting or other delays and could result in fewer loan applications being received, slower processing of applications and reduced efficiency in loan processing. A failure, interruption or breach in security could also result in an obligation to notify clients in states such as California that require such notification, with possible civil liability resulting from such failure, interruption or breach. We cannot assure you that such failures, interruptions or breaches will not occur, or if they do occur that we or the third parties on whom we rely will adequately address them. We have implemented precautionary measures to avoid systems outages and to minimize the effects of any data or telephone systems interruptions, but we have not instituted redundancy for key systems. The occurrence of any failure, interruption or breach could significantly harm our business.
If we experience a data security breach and confidential customer information is disclosed, we may be subject to penalties imposed by regulators, civil actions for damages and negative publicity, which could affect our customer relationships and have a material adverse effect on our business. In addition, current state and federal legislative proposals, if enacted, may impose additional requirements on us to safeguard confidential customer information, which may result in increased compliance costs.
Recently, data security breaches suffered by well-known companies and institutions have attracted a substantial amount of media attention, prompting state and federal legislative proposals addressing data privacy and security. If some of the current proposals are adopted, we may be subject to more extensive requirements to protect the borrower information that we process in connection with the loans. Implementation of systems and procedures to address these requirements would increase our compliance costs. If we were to experience a large-scale data security breach, such breach could generate negative publicity about us and could adversely affect our relationships with our clients, including the lenders and educational institutions with which we do business. This could have a material adverse effect on our business. In addition, pending legislative proposals, if adopted, likely would result in substantial penalties for unauthorized disclosure of confidential consumer information.
58
The loan origination process is becoming increasingly dependent upon technological advancement, and we could lose clients and market share if we are not able to keep pace with rapid changes in technology.
Our ability to handle an increasing volume of transactions is based in large part on the advanced systems and processes we have implemented and developed. The loan origination process is becoming increasingly dependent upon technological advancement such as the ability to process loans over the Internet, accept electronic signatures and provide process updates instantly. Our future success depends in part on our ability to develop and implement technology solutions that anticipate and keep pace with these and other continuing changes in technology, industry standards and client preferences. We may not be successful in anticipating or responding to these developments on a timely basis. If competitors introduce products, services, systems and processes that are better than ours or that gain greater market acceptance, those that we offer or use may become obsolete or noncompetitive. Any one of these circumstances could have a material adverse effect on our ability to obtain and retain key clients.
We may be required to expend significant funds to develop or acquire new technologies. If we cannot offer new technologies as quickly as our competitors, we could lose clients and market share. We also could lose market share if our competitors develop more cost effective technologies than those we offer or develop.
We have expanded our operations rapidly in recent years, and if we fail to manage effectively our growth, our financial results could be adversely affected.
The number of our employees increased to 853 regular employees and 36 seasonal employees as of June 30, 2005 from 474 regular employees and 236 seasonal employees as of June 30, 2004. Many of these employees have very limited experience with us and a limited understanding of our systems and controls. From our inception to June 30, 2005, our assets have grown to $558.2 million. Our revenue increased to $418.0 million for fiscal 2005 from $199.3 million in fiscal 2004 and $91.4 million in fiscal 2003. Our growth may place a strain on our management, systems and resources. We must continue to refine and expand our business development capabilities, our systems and processes and our access to financing sources. As we grow, we must continue to hire, train, supervise and manage new employees.
We cannot assure you that we will be able to:
· expand our systems effectively;
· allocate our human resources optimally;
· identify and hire qualified employees; or
· incorporate effectively the components of any business that we may acquire in our effort to achieve growth.
If we are unable to manage our growth, our operations and our financial results could be adversely affected.
We may be subject to state registration or licensing requirements in jurisdictions where we are not currently registered or licensed. If we determine that we are subject to the registration or licensing requirements of any jurisdiction, our compliance costs could increase significantly and other adverse consequences may result.
Based on the advice of counsel and, in some states, additional informal advice from state regulators, we have been operating on the basis that no registrations or licenses for loan brokers and loan arrangers are required of us. Although we believe that our prior consultations with national and local counsel identified all material registration, licensing and other regulatory requirements then applicable, we are conducting a nationwide review of state registration and licensing requirements that may be applicable to us now, based on the expansion of the scope of the services we provide and the time that has elapsed since
59
our prior review. As a result of this current review, we may determine that registration or licensing is required in jurisdictions where we are not currently registered or licensed. Even if we are not physically present in a state, its regulators may take the position that registration or licensing is required because we provide services by mail, telephone, the Internet or other remote means. If we identify any states in which registration or licensing is required, we will proceed with registration or licensing in the affected state. If any state asserts jurisdiction over our business, we will consider whether to challenge the assertion or proceed with registration or licensing in the affected state. Compliance with such requirements could involve additional costs, which could have a material adverse effect on our business. Our failure to comply with these laws could lead to, among other things: (a) curtailment of our ability to continue to conduct business in the relevant jurisdiction, pending processing of registration or a license application, (b) administrative enforcement actions, (c) class action lawsuits, (d) the assertion of legal defenses delaying or otherwise affecting the enforcement of loans, and (e) criminal as well as civil liability. This could have a material adverse effect on our business.
If the regulatory exemptions or rulings that allow us to conduct our business without registration or licensing are modified or revoked, or the statutory and regulatory requirements change in the future, our compliance costs could increase substantially.
The Massachusetts Division of Banks ruled that our business with TERI is not subject to licensing because, as a provider of loan origination outsourcing services, we do not conduct a lending business with consumers in our own name and our processing centers are not generally open to the public. The Massachusetts Small Loan Act requires any person that is engaged, for compensation, in the business of making small loans, or in aiding or assisting the borrower or the lender in procuring or making such loans, to obtain a license. Under the statute, the business of making small loans includes the making of loans of $6,000 or less with interest rates and expenses of more than 12% per year. The TERI-guaranteed loans that we facilitate include amounts as small as $1,000, and a small portion of those loans have combined interest rates and fees exceeding 12%. We could therefore become subject to the Small Loan Act with respect to these loans if the Massachusetts Division of Banks revokes its previous determination that our operations are exempt or determines that our activities exceed the scope of the determination.
We could also become subject to registration or licensing requirements due to changes in existing federal and state laws and regulations. The Massachusetts legislature could, for example, modify the statutory requirements under the Small Loan Act. If the Massachusetts legislature, or any other state or federal regulatory authority, changes existing laws and rules, or enacts new laws or rules, we could be forced to make changes in our relationships with lenders, educational institutions, guarantors, servicers or the trusts involved in the securitizations that we facilitate. Specifically, changes in existing laws and rules could also require us to implement additional or different programs and information technology systems and could impose licensing, capital and reserve requirements and additional costs, including administrative, compliance and third-party service costs.
We may be exposed to liability for failures of third parties with which we do business to comply with the registration, licensing and other requirements that apply to them.
Third parties with which we do business, including federal and state chartered financial institutions as well as TERI, are subject to registration, licensing and extensive governmental regulations, including Truth-in-Lending laws and other consumer protection laws and regulations. As a result of the activities that we conduct for our clients, it may be asserted that we have some responsibility for their compliance with the laws and regulations applicable to them, whether on contractual or other grounds. If it is determined that we have failed to comply with our obligations with respect to these third parties, we could be subject to civil or criminal liability.
60
We could also become subject to registration or licensing and other regulatory requirements in Massachusetts and other states by expanding the scope or extent of our services.
We are in the process of expanding the scope of the services we provide on behalf of lenders to include certain advertising and marketing functions. As a result of this expansion of our services, or if we expand our services in the future to include, among others, loan guarantees, our current exemption from the Massachusetts Small Loan Act could be invalidated, and consequently, we may need to obtain a license from the Massachusetts Division of Banks. In addition, we may become subject to the laws and regulations of other states governing such expanded services. We may also become subject to state regulatory requirements if the extent of the activities that we conduct in a particular state expands. Compliance with such requirements could involve additional costs, which could have a material adverse effect on our business.
Failure to comply with consumer protection laws could subject us to civil and criminal penalties and have a material adverse effect on our business.
The federal government and state governments regulate extensively the financial institutions and other entities that originate loans in the student loan market. These regulations include bankruptcy, tax, usury, disclosure, credit reporting, identity theft, privacy, fraud and abuse and other laws to protect borrowers. Changes in consumer protection laws or related regulations, or in the prevailing interpretations thereof, may expose us to litigation, adversely affect the collection of balances due on the loan assets held by securitization trusts or otherwise adversely affect our business. Moreover, changes in the consumer protection laws and related regulations, or in the prevailing interpretations thereof, could invalidate or call into question the legality of certain of our services and business practices. Recent or future changes in federal and state bankruptcy and debtor relief laws may increase credit losses on the loans held by securitization trusts and related administrative expenses. Violations of the laws or regulations governing our operations, or the operations of TERI or our other clients, could result in the imposition of civil or criminal penalties, the cancellation of our contracts to provide services or our exclusion from participating in education loan programs. These penalties or exclusions, were they to occur, would negatively impair our ability to operate our business. In addition, the loan assets held by securitization trusts that we have structured could be adversely impacted by violation of tax or consumer protection laws. In such event, the value of our residual interests could also be adversely impacted. In some cases, such violations may render the loan assets unenforceable.
Recent litigation has sought to re-characterize “payday loan” and other originators as lenders; if litigation on similar theories were successful against us or any third party marketer, the loans that we securitize would be subject to individual state consumer protection laws.
We provide financial and educational institutions, as well as other organizations, with an integrated suite of services in support of private student loan programs. The lenders with which we work are federally-insured banks and, therefore, are not subject to many state consumer protection laws, including limitations on interest rates, fees and other charges. In providing our services, we do not act as a lender, guarantor or loan servicer, and the terms of the loans that we securitize are regulated in accordance with the laws and regulations applicable to the lenders.
The association between loan marketers and out-of-state national banks has come under recent scrutiny, specifically in the context of high-interest “payday loans”. Recent litigation asserts that payday loan marketers use out-of-state lenders in order to evade the usury and interest rate caps, and other consumer protection laws, imposed by the states where they do business. Such litigation has sought, successfully in some instances, to re-characterize the loan marketer as the lender for purposes of state consumer protection law restrictions. Similar civil actions have been brought in the context of gift cards.
61
We believe that our activities, and the activities of third parties whose marketing on behalf of lenders is coordinated by us, are distinguishable from the activities involved in these cases.
Although we do not make, guarantee or service the loans and our activities are done in the name of and under the control and supervision of lenders, additional state consumer protection laws would be applicable to the loans if we, or any third party loan marketer whose activities we coordinate, were re-characterized as a lender, and the loans (or the provisions governing interest rates, fees and other charges) could be unenforceable. In addition, we could be subject to claims by consumers, as well as enforcement actions by regulators. Even if we were not required to cease doing business with residents of certain states or to change our business practices to comply with applicable laws and regulations, we could be required to register or obtain licenses or regulatory approvals that could impose a substantial cost on us. To date, there have been no actions taken or threatened against us on the theory that we have engaged in unauthorized lending. However, such actions could have a material adverse effect on our business.
The price of our common stock may be volatile.
The trading price of our common stock may fluctuate substantially, depending on many factors, some of which are beyond our control and may not be related to our operating performance. These fluctuations could cause you to lose part or all of your investment in our shares of common stock. Those factors that could cause fluctuations include, but are not limited to, the following:
· difficulties we may encounter in the securitizations that we structure or the loss of opportunities to structure securitization transactions;
· price and volume fluctuations in the overall stock market from time to time;
· significant volatility in the market price and trading volume of financial services and process outsourcing companies;
· actual or anticipated changes in our earnings or fluctuations in our operating results or in the expectations of securities analysts;
· general economic conditions and trends;
· negative publicity about the student loan market generally or us specifically;
· major catastrophic events;
· loss of a significant client or clients;
· sales of large blocks of our stock; or
· departures of key personnel.
In the past, following periods of volatility in the market price of a company’s securities, securities class action litigation has often been brought against that company. Due to the potential volatility of our stock price, we may therefore be the target of securities litigation in the future. Securities litigation could result in substantial costs and divert management’s attention and resources from our business.
If a substantial number of shares become available for sale and are sold in a short period of time, the market price of our common stock could decline.
We have only been a public company since October 2003. For the twelve month period ended June 30, 2005, the average daily trading volume of our common stock on the New York Stock Exchange was approximately 570,000 shares. As a result, future sales of a substantial number of shares of our common stock in the public market, or the perception that such sales may occur, could adversely affect the then-prevailing market price of our common stock.
62
As of July 29, 2005, we had 64,911,244 shares of common stock outstanding. Subject to limitations under federal securities laws, including in some cases the holding period requirements and volume limitations of Rule 144, these shares are eligible for sale in the public market. The market price of shares of our common stock may drop significantly if our existing stockholders sell a substantial number of shares that had previously been subject to lock-up agreements. A decline in the price of shares of our common stock might impede our ability to raise capital through the issuance of additional shares of our common stock or other equity securities.
Insiders have substantial control over us and could limit your ability to influence the outcome of key transactions, including a change of control.
Our directors and executive officers, and entities affiliated with them, beneficially own approximately 52% of the outstanding shares of our common stock. As a result, these stockholders, if acting together, would be able to influence or control matters requiring approval by our stockholders, including the election of directors and the approval of mergers or other extraordinary transactions. They may also have interests that differ from yours and may vote in a way with which you disagree and which may be adverse to your interests. The concentration of ownership may have the effect of delaying, preventing or deterring a change of control of our company, could deprive our stockholders of an opportunity to receive a premium for their common stock as part of a sale of our company and might ultimately affect the market price of our common stock.
Some provisions in our certificate of incorporation and by-laws may deter third parties from acquiring us.
Our certificate of incorporation and by-laws contain provisions that may make the acquisition of our company more difficult without the approval of our board of directors, including the following:
· only our board of directors, the chairman of our board of directors or our president may call special meetings of our stockholders;
· our stockholders may take action only at a meeting of our stockholders and not by written consent;
· we have authorized undesignated preferred stock, the terms of which may be established and shares of which may be issued without stockholder approval;
· our directors may be removed only for cause by the affirmative vote of a majority of the directors present at a meeting duly held at which a quorum is present, or the holders of 75% of the votes that all stockholders would be entitled to cast in the election of directors; and
· we impose advance notice requirements for stockholder proposals.
These anti-takeover defenses could discourage, delay or prevent a transaction involving a change in control of our company. These provisions could also discourage proxy contests and make it more difficult for you and other stockholders to elect directors of your choosing and cause us to take other corporate actions you desire.
Section 203 of the Delaware General Corporation Law may delay, defer or prevent a change in control that our stockholders might consider to be in their best interests.
We are subject to Section 203 of the Delaware General Corporation Law which, subject to certain exceptions, prohibits “business combinations” between a Delaware corporation and an “interested stockholder,” which is generally defined as a stockholder who becomes a beneficial owner of 15% or more of a Delaware corporation’s voting stock, for a three-year period following the date that such stockholder became an interested stockholder. Section 203 could have the effect of delaying, deferring or preventing a change in control that our stockholders might consider to be in their best interests.
63
Item 7A. Quantitative and Qualitative Disclosure about Market Risk
General
Market risk is the risk of change in fair value of a financial instrument due to changes in interest rates, equity prices, creditworthiness, foreign exchange rates or other factors. We manage our market risk through a conservative investment policy, the primary objective of which is preservation of capital. At June 30, 2005, cash and cash equivalents consisted primarily of balances in money market funds. As a result, we do not believe a change in interest rate would have a material impact on the fair value of cash and cash equivalents.
Risks Related to Structural Advisory Fees and Residuals
Because there are no quoted market prices for our additional structural advisory fees and residuals receivables, we use assumptions to estimate their values. We base these estimates on our proprietary historical data, third party data and our industry experience, adjusting for specific program and borrower characteristics such as loan type and borrower creditworthiness. Increases in our estimates of defaults, prepayments and discount rates, increases in the spread between LIBOR and auction rate indices as well as decreases in default recovery rates and the multi-year forward estimates of the LIBOR rate, which is the reference rate for the loan assets and borrowings of the securitization trusts, would have a negative effect on the value of our additional structural advisory fees and residuals. For an analysis of the estimated change in our structural advisory fees and residuals receivables balance at June 30, 2005 based on changes in these loan performance assumptions, see “Management’s Discussion and Analysis of Financial Conditions and Results of Operations—Application of Critical Accounting Policies and Estimates—Service Revenue—Sensitivity Analysis.”
Item 8. Financial Statements and Supplementary Data
All financial statements and schedules required to be filed hereunder are filed as Appendix A hereto and are listed under Item 15(a).
Item 9. Changes In and Disagreements With Accountants on Accounting and Financial Disclosure
None.
Item 9A. Controls and Procedures
Our management, with the participation of our chief executive officer and chief financial officer, evaluated the effectiveness of our disclosure controls and procedures as of June 30, 2005. The term “disclosure controls and procedures,” as defined in Rules 13a-15(e) and 15d-15(e) under the Exchange Act, means controls and other procedures of a company that are designed to ensure that information required to be disclosed by us in the reports that we file or submit under the Exchange Act is recorded, processed, summarized and reported, within the time periods specified in the SEC’s rules and forms. Disclosure controls and procedures include, without limitation, controls and procedures designed to ensure that information required to be disclosed by a company in the reports that it files or submits under the Exchange Act is accumulated and communicated to the company’s management, including its principal executive and principal financial officers, as appropriate to allow timely decisions regarding required disclosure. Management recognizes that any controls and procedures, no matter how well designed and operated, can provide only reasonable assurance of achieving their objectives and management necessarily applies its judgment in evaluating the cost-benefit relationship of possible controls and procedures. Based on the evaluation of our disclosure controls and procedures as of June 30, 2005, our chief executive officer and chief financial officer concluded that, as of such date, our disclosure controls and procedures were effective at the reasonable assurance level.
64
Management’s report on our internal control over financial reporting (as defined in Rules 13a-15(f) and 15d-15(f) under the Exchange Act) and the independent registered public accounting firm’s related audit report are included in Appendix A and are listed under Item 15(a) of this Form 10-K.
No change in our internal control over financial reporting occurred during the fiscal quarter ended June 30, 2005 that has materially affected, or is reasonably likely to materially affect, our internal control over financial reporting.
Item 9B. Other Information
On July 11, 2005, we entered into a restricted stock unit agreement with Peter B. Tarr, our General Counsel and Vice Chairman of the Board of Directors. The restricted stock unit agreement evidences a grant by us of 146,584 restricted stock units, or RSUs, to Mr. Tarr under our 2003 stock incentive plan.
Each RSU represents the right to receive in the future one share of our common stock, subject to the terms and conditions of the restricted stock unit agreement. The RSUs will vest as to 20% of the original number of RSUs on the first anniversary of the grant date and as to an additional 20% of the original number of RSUs on each succeeding anniversary of the grant date until the fifth anniversary of the grant date. If Mr. Tarr’s employment with us is terminated for a reason other than cause, as defined in the offer letter entered into with Mr. Tarr on June 10, 2005, then all of the RSUs will vest immediately. In the event that the Mr. Tarr’s employment with the Corporation is terminated by reason of death or disability, the RSUs will fully vest.
Mr. Tarr has agreed not to engage in a competitive action, as defined in the restricted stock unit agreement, from the date of other restricted stock unit agreement through the first anniversary of the date of termination of employment with us. If Mr. Tarr engages in or enters into an agreement to engage in a competitive action on or prior to the settlement date, as defined in the restricted stock unit agreement, all RSUs and all shares issuable upon the vesting of all RSUs will be forfeited. If Mr. Tarr engages in or enters into an agreement to engage in a competitive action after the last settlement date but on or prior to the first anniversary of the termination of employment with us, Mr. Tarr must pay to us, at our request, an amount equal to the value, as of each settlement date, of the shares delivered to Mr. Tarr represented by RSUs on such settlement date and the value of any dividends paid to Mr. Tarr in respect of the delivered shares on such settlement date.
Upon the occurrence of a reorganization event, as defined in the restricted stock unit agreement, the RSU will represent a right to receive the cash, securities or other property that one share of our common stock was converted into, or exchanged for, pursuant to such reorganization event. In addition, the RSU will fully vest if, on or prior to the second anniversary of the date of the consummation of the reorganization event, Mr. Tarr’s employment with us or our successor is terminated for good reason, as defined in the restricted stock unit agreement, by Mr. Tarr or is terminated without cause, as defined in the restricted stock unit agreement, by us or our successor.
The form of restricted stock unit agreement has been attached as Exhibit 10.34.4 to this Annual Report on Form 10-K, which is incorporated by reference herein, and the foregoing summary is qualified in its entirety by reference thereto.
65
PART III
Items 10, 11, 12, 13 and 14 of Part III (except for information required with respect to our executive officers, which is set forth under “Executive Officers” in Item 1A of Part I of this report, and our code of ethics, which is set forth under “Code of Ethics” in Item 1B of Part I of this report) have been omitted from this report. We expect to file with the SEC, not later than 120 days after our fiscal year end, a definitive proxy statement in connection with our 2005 annual meeting of stockholders. The information required by Items 10, 11, 12, 13 and 14 of this report, which will appear in the definitive proxy statement, is incorporated herein by reference.
66
PART IV
Item 15. Exhibits and Financial Statement Schedules
(a) Documents filed as part of this annual report:
(1) Financial Statements.
The consolidated financial statements are included as Appendix A hereto and are filed as part of this annual report. The consolidated financial statements include:
(2) Financial Statement Schedule
None.
(3) Exhibits.
The exhibits set forth on the Exhibit Index following Appendix A to this annual report are filed as part of this annual report. This list of exhibits identifies each management contract or compensatory plan or arrangement required to be filed as an exhibit to this annual report.
67
SIGNATURES
Pursuant to the requirements of Section 13 or 15(d) of the Securities Exchange Act of 1934, the registrant has duly caused this report to be signed on its behalf by the undersigned, thereunto duly authorized, on September 7, 2005.
| THE FIRST MARBLEHEAD CORPORATION |
| By: | /s/ DANIEL MAXWELL MEYERS |
| | Daniel Maxwell Meyers |
| | Chief Executive Officer and Chairman of the Board of Directors |
Pursuant to the requirements of the Securities Exchange Act of 1934, this report has been signed below by the following persons on behalf of the registrant and in the capacities indicated on September 7, 2005:
| Signature | | | | Title(s) | |
/s/ DANIEL MAXWELL MEYERS | | Chief Executive Officer and Chairman of the Board of |
Daniel Maxwell Meyers | | Directors (Principal Executive Officer) |
/s/ DONALD R. PECK | | Executive Vice President, Chief Financial Officer, Treasurer |
Donald R. Peck | | and Secretary (Principal Financial and Accounting Officer) |
/s/ LESLIE L. ALEXANDER | | Director |
Leslie L. Alexander | | |
/s/ STEPHEN E. ANBINDER | | Director |
Stephen E. Anbinder | | |
/s/ WILLIAM R. BERKLEY | | Director |
William R. Berkley | | |
/s/ DORT A. CAMERON III | | Director |
Dort A. Cameron III | | |
/s/ GEORGE G. DALY | | Director |
George G. Daly | | |
68
/s/ PETER S. DROTCH | | Director |
Peter S. Drotch | | |
/s/ WILLIAM D. HANSEN | | Director |
William D. Hansen | | |
/s/ PETER B. TARR | | Director |
Peter B. Tarr | | |
69
APPENDIX A
INDEX TO CONSOLIDATED FINANCIAL STATEMENTS
F-1
MANAGEMENT’S REPORT ON INTERNAL CONTROL OVER FINANCIAL REPORTING
The management of The First Marblehead Corporation (the “Company”) is responsible for establishing and maintaining adequate internal control over financial reporting. Internal control over financial reporting is defined in Rule 13a-15(f) or 15d-15(f) promulgated under the Securities Exchange Act of 1934 as a process designed by, or under the supervision of, the company’s principal executive and principal financial officers and effected by the company’s board of directors, management and other personnel, to provide reasonable assurance regarding the reliability of financial reporting and the preparation of financial statements for external purposes in accordance with generally accepted accounting principles and includes those policies and procedures that:
· Pertain to the maintenance of records that in reasonable detail accurately and fairly reflect the transactions and dispositions of the assets of the Company;
· Provide reasonable assurance that transactions are recorded as necessary to permit preparation of financial statements in accordance with generally accepted accounting principles, and that receipts and expenditures of the Company are being made only in accordance with authorizations of management and directors of the Company; and
· Provide reasonable assurance regarding prevention or timely detection of unauthorized acquisition, use or disposition of the Company’s assets that could have a material effect on the financial statements.
Because of its inherent limitations, internal control over financial reporting may not prevent or detect misstatements. Projections of any evaluation of effectiveness to future periods are subject to the risk that controls may become inadequate because of changes in conditions, or that the degree of compliance with the policies or procedures may deteriorate.
The Company’s management assessed the effectiveness of the Company’s internal control over financial reporting as of June 30, 2005. In making this assessment, the Company’s management used the criteria set forth by the Committee of Sponsoring Organizations of the Treadway Commission (COSO) in Internal Control-Integrated Framework.
Based on our assessment, management concluded that, as of June 30, 2005, the Company’s internal control over financial reporting is effective based on those criteria.
The Company’s independent registered public accounting firm has issued an audit report on our assessment of the Company’s internal control over financial reporting. This report appears on page F-3.
/s/ DANIEL MAXWELL MEYERS | |
Chief Executive Officer and Chairman of the Board of Directors | |
/s/ DONALD R. PECK | |
Executive Vice President, Chief Financial Officer, Treasurer and Secretary | |
F-2
REPORT OF INDEPENDENT REGISTERED PUBLIC ACCOUNTING FIRM
ON INTERNAL CONTROL OVER FINANCIAL REPORTING
The Board of Directors and Stockholders
The First Marblehead Corporation:
We have audited management’s assessment, included in the accompanying Management’s Report on Internal Control Over Financial Reporting, that The First Marblehead Corporation and subsidiaries (the “Company”) maintained effective internal control over financial reporting as of June 30, 2005, based on criteria established in Internal Control—Integrated Framework issued by the Committee of Sponsoring Organizations of the Treadway Commission (COSO). The Company’s management is responsible for maintaining effective internal control over financial reporting and for its assessment of the effectiveness of internal control over financial reporting. Our responsibility is to express an opinion on management’s assessment and an opinion on the effectiveness of the Company’s internal control over financial reporting based on our audit.
We conducted our audit in accordance with the standards of the Public Company Accounting Oversight Board (United States). Those standards require that we plan and perform the audit to obtain reasonable assurance about whether effective internal control over financial reporting was maintained in all material respects. Our audit included obtaining an understanding of internal control over financial reporting, evaluating management’s assessment, testing and evaluating the design and operating effectiveness of internal control, and performing such other procedures as we considered necessary in the circumstances. We believe that our audit provides a reasonable basis for our opinion.
A company’s internal control over financial reporting is a process designed to provide reasonable assurance regarding the reliability of financial reporting and the preparation of financial statements for external purposes in accordance with generally accepted accounting principles. A company’s internal control over financial reporting includes those policies and procedures that (1) pertain to the maintenance of records that, in reasonable detail, accurately and fairly reflect the transactions and dispositions of the assets of the company; (2) provide reasonable assurance that transactions are recorded as necessary to permit preparation of financial statements in accordance with generally accepted accounting principles, and that receipts and expenditures of the company are being made only in accordance with authorizations of management and directors of the company; and (3) provide reasonable assurance regarding prevention or timely detection of unauthorized acquisition, use, or disposition of the company’s assets that could have a material effect on the financial statements.
Because of its inherent limitations, internal control over financial reporting may not prevent or detect misstatements. Also, projections of any evaluation of effectiveness to future periods are subject to the risk that controls may become inadequate because of changes in conditions, or that the degree of compliance with the policies or procedures may deteriorate.
In our opinion, management’s assessment that the Company maintained effective internal control over financial reporting as of June 30, 2005, is fairly stated, in all material respects, based on criteria established in Internal Control—Integrated Framework issued by the Committee of Sponsoring Organizations of the Treadway Commission (COSO). Also, in our opinion, the Company maintained, in all material respects, effective internal control over financial reporting as of June 30, 2005, based on criteria established in Internal Control—Integrated Framework issued by the Committee of Sponsoring Organizations of the Treadway Commission (COSO).
We also have audited, in accordance with the standards of the Public Company Accounting Oversight Board (United States), the consolidated balance sheets of the Company as of June 30, 2005 and 2004, and the related consolidated statements of income, changes in stockholders’ equity, and cash flows for each of the years in the three-year period ended June 30, 2005, and our report dated September 6, 2005 expressed an unqualified opinion on those consolidated financial statements.
/s/ KPMG LLP
Boston, Massachusetts
September 6, 2005
F-3
REPORT OF INDEPENDENT REGISTERED PUBLIC ACCOUNTING FIRM
ON CONSOLIDATED FINANCIAL STATEMENTS
The Board of Directors and Stockholders
The First Marblehead Corporation:
We have audited the accompanying consolidated balance sheets of The First Marblehead Corporation and subsidiaries (the “Company”) as of June 30, 2005 and 2004, and the related consolidated statements of income, changes in stockholders’ equity, and cash flows for each of the years in the three-year period ended June 30, 2005. These consolidated financial statements are the responsibility of the Company’s management. Our responsibility is to express an opinion on these consolidated financial statements based on our audits.
We conducted our audits in accordance with the standards of the Public Company Accounting Oversight Board (United States). Those standards require that we plan and perform the audit to obtain reasonable assurance about whether the financial statements are free of material misstatement. An audit includes examining, on a test basis, evidence supporting the amounts and disclosures in the financial statements. An audit also includes assessing the accounting principles used and significant estimates made by management, as well as evaluating the overall financial statement presentation. We believe that our audits provide a reasonable basis for our opinion.
In our opinion, the consolidated financial statements referred to above present fairly, in all material respects, the financial position of The First Marblehead Corporation and subsidiaries as of June 30, 2005 and 2004, and the results of their operations and their cash flows for each of the years in the three-year period ended June 30, 2005, in conformity with U.S. generally accepted accounting principles.
We also have audited, in accordance with the standards of the Public Company Accounting Oversight Board (United States), the effectiveness of the Company’s internal control over financial reporting as of June 30, 2005, based on criteria established in Internal Control—Integrated Framework issued by the Committee of Sponsoring Organizations of the Treadway Commission (COSO), and our report dated September 6, 2005 expressed an unqualified opinion on management’s assessment of, and the effective operation of, internal control over financial reporting.
/s/ KPMG LLP
Boston, Massachusetts
September 6, 2005
F-4
THE FIRST MARBLEHEAD CORPORATION AND SUBSIDIARIES
CONSOLIDATED BALANCE SHEETS
June 30, 2005 and 2004
(in thousands, except share and per share amounts)
| | 2005 | | 2004 | |
ASSETS | | | | | |
Cash and cash equivalents | | $ | 193,796 | | $ | 168,712 | |
Service receivables: | | | | | |
Structural advisory fees | | 53,371 | | 34,334 | |
Residuals | | 247,275 | | 108,495 | |
Processing fees from The Education Resources Institute (TERI) | | 8,944 | | 6,052 | |
| | 309,590 | | 148,881 | |
Property and equipment | | 49,269 | | 15,146 | |
Less accumulated depreciation and amortization | | (10,174 | ) | (4,315 | ) |
Property and equipment, net | | 39,095 | | 10,831 | |
Goodwill | | 3,176 | | 3,176 | |
Intangible assets, net | | 2,620 | | 3,180 | |
Prepaid income taxes | | 2,594 | | 20,267 | |
Other prepaid expenses | | 4,163 | | 2,763 | |
Other assets | | 3,159 | | 2,246 | |
Total assets | | $ | 558,193 | | $ | 360,056 | |
LIABILITIES AND STOCKHOLDERS’ EQUITY | | | | | |
Liabilities: | | | | | |
Accounts payable and accrued expenses | | $ | 33,318 | | $ | 26,285 | |
Net deferred income tax liability | | 84,208 | | 40,138 | |
Notes payable and capital lease obligations | | 12,118 | | 9,179 | |
Notes payable to TERI | | 5,292 | | 6,004 | |
Other liabilities | | 1,691 | | 314 | |
Total liabilities | | 136,627 | | 81,920 | |
Commitments and contingencies | | | | | |
Stockholders’ equity: | | | | | |
Preferred stock, par value $0.01 per share; 20,000,000 shares authorized; no shares issued or outstanding | | — | | — | |
Common stock, par value $0.01 per share; 150,000,000 and 100,000,000 shares authorized at June 30, 2005 and 2004, respectively; 66,368,824 and 63,975,000 shares issued at June 30, 2005 and 2004, respectively; 64,899,824 and 63,975,000 shares outstanding at June 30, 2005 and 2004, respectively | | 664 | | 640 | |
Additional paid-in capital | | 206,452 | | 163,572 | |
Retained earnings | | 273,589 | | 113,924 | |
Deferred compensation | | (3,131 | ) | — | |
Treasury stock, 1,469,000 shares held at June 30, 2005, at cost | | (55,665 | ) | — | |
Accumulated other comprehensive loss | | (343 | ) | — | |
Total stockholders’ equity | | 421,566 | | 278,136 | |
Total liabilities and stockholders’ equity | | $ | 558,193 | | $ | 360,056 | |
See accompanying notes to consolidated financial statements.
F-5
THE FIRST MARBLEHEAD CORPORATION AND SUBSIDIARIES
CONSOLIDATED STATEMENTS OF INCOME
Years ended June 30, 2005, 2004 and 2003
(in thousands, except per share amounts)
| | 2005 | | 2004 | | 2003 | |
Service revenues: | | | | | | | |
Up-front structural advisory fees | | $ | 168,166 | | $ | 83,896 | | $ | 33,312 | |
Additional structural advisory fees | | 29,287 | | 13,299 | | 6,025 | |
Residuals | | 138,780 | | 64,895 | | 30,027 | |
Processing fees from TERI | | 78,200 | | 35,056 | | 20,577 | |
Administrative and other fees | | 3,544 | | 2,114 | | 1,415 | |
Total service revenues | | 417,977 | | 199,260 | | 91,356 | |
Operating expenses: | | | | | | | |
Compensation and benefits | | 67,608 | | 34,839 | | 19,816 | |
General and administrative expenses | | 76,568 | | 35,693 | | 16,071 | |
Total operating expenses | | 144,176 | | 70,532 | | 35,887 | |
Income from operations | | 273,801 | | 128,728 | | 55,469 | |
Other income (expense): | | | | | | | |
Interest expense | | (585 | ) | (708 | ) | (1,561 | ) |
Interest income | | 3,873 | | 781 | | 105 | |
Net interest income (expense) | | 3,288 | | 73 | | (1,456 | ) |
Income before income tax expense | | 277,089 | | 128,801 | | 54,013 | |
Income tax expense | | 117,424 | | 53,530 | | 22,514 | |
Net income | | $ | 159,665 | | $ | 75,271 | | $ | 31,499 | |
Net income per share, basic | | $ | 2.46 | | $ | 1.27 | | $ | 0.59 | |
Net income per share, diluted | | 2.39 | | 1.19 | | 0.55 | |
Weighted average shares outstanding, basic | | 65,033 | | 59,048 | | 53,099 | |
Weighted average shares outstanding, diluted | | 66,804 | | 63,516 | | 56,831 | |
See accompanying notes to consolidated financial statements.
F-6
THE FIRST MARBLEHEAD CORPORATION AND SUBSIDIARIES
CONSOLIDATED STATEMENTS OF CHANGES IN STOCKHOLDERS’ EQUITY
Years ended June 30, 2005, 2004 and 2003
(in thousands)
| | | | | | | | | | | | | | | | Accumulated | | | |
| | Common stock | | Additional | | | | | | other | | Total | |
| | Issued | | In treasury | | paid-in | | Retained | | Deferred | | comprehensive | | stockholders’ | |
| | Shares | | Amount | | Shares | | Amount | | capital | | earnings | | compensation | | loss, net of tax | | equity | |
Balance at June 30, 2002 | | 51,122 | | | $ | 511 | | | — | | $ | — | | $ | 10,970 | | $ | 7,154 | | | $ | — | | | | $ | — | | | | $ | 18,635 | | |
Net income | | — | | | — | | | — | | — | | — | | 31,499 | | | — | | | | — | | | | 31,499 | | |
Warrants exercised | | 2,000 | | | 20 | | | — | | — | | 1,314 | | — | | | — | | | | — | | | | 1,334 | | |
Options exercised | | 64 | | | 1 | | | — | | — | | 56 | | — | | | — | | | | — | | | | 57 | | |
Non cash compensation | | — | | | — | | | — | | — | | 900 | | — | | | — | | | | — | | | | 900 | | |
Balance at June 30, 2003 | | 53,186 | | | 532 | | | — | | — | | 13,240 | | 38,653 | | | — | | | | — | | | | 52,425 | | |
Net income | | — | | | — | | | — | | — | | — | | 75,271 | | | — | | | | — | | | | 75,271 | | |
Options exercised | | 2,883 | | | 29 | | | — | | — | | 3,804 | | — | | | — | | | | — | | | | 3,833 | | |
Non cash compensation | | — | | | — | | | — | | — | | 1,642 | | — | | | — | | | | — | | | | 1,642 | | |
Stock issued in initial public offering | | 7,906 | | | 79 | | | — | | — | | 126,421 | | — | | | — | | | | — | | | | 126,500 | | |
Costs related to initial public offering | | — | | | — | | | — | | — | | (11,393 | ) | — | | | — | | | | — | | | | (11,393 | ) | |
Tax benefit from employee stock options | | — | | | — | | | — | | — | | 29,858 | | — | | | — | | | | — | | | | 29,858 | | |
Balance at June 30, 2004 | | 63,975 | | | 640 | | | — | | — | | 163,572 | | 113,924 | | | — | | | | — | | | | 278,136 | | |
Comprehensive income (loss) | | | | | | | | | | | | | | | | | | | | | | | | | | | |
Net income | | — | | | — | | | — | | — | | — | | 159,665 | | | — | | | | — | | | | 159,665 | | |
Accumulated other comprehensive loss, net of tax | | — | | | — | | | — | | — | | — | | — | | | — | | | | (343 | ) | | | (343 | ) | |
Total comprehensive income | | — | | | — | | | — | | — | | — | | — | | | — | | | | — | | | | 159,322 | | |
Options exercised | | 2,343 | | | 23 | | | — | | — | | 4,058 | | — | | | — | | | | — | | | | 4,081 | | |
Stock purchases through employee stock purchase plan | | 50 | | | 1 | | | — | | — | | 898 | | — | | | — | | | | — | | | | 899 | | |
Repurchase of common stock | | — | | | — | | | (1,469 | ) | (55,665 | ) | — | | — | | | — | | | | — | | | | (55,665 | ) | |
Tax benefit from employee stock options | | — | | | — | | | — | | — | | 34,322 | | — | | | — | | | | — | | | | 34,322 | | |
Grants of restricted stock units | | — | | | — | | | — | | — | | 3,602 | | — | | | (3,602 | ) | | | — | | | | — | | |
Amortization of deferred compensation | | — | | | — | | | — | | — | | — | | — | | | 471 | | | | — | | | | 471 | | |
Balance at June 30, 2005 | | 66,368 | | | $ | 664 | | | (1,469 | ) | $ | (55,665 | ) | $ | 206,452 | | $ | 273,589 | | | $ | (3,131 | ) | | | $ | (343 | ) | | | $ | 421,566 | | |
See accompanying notes to consolidated financial statements.
THE FIRST MARBLEHEAD CORPORATION AND SUBSIDIARIES
CONSOLIDATED STATEMENTS OF CASH FLOWS
Years ended June 30, 2005, 2004 and 2003
(in thousands)
| | 2005 | | 2004 | | 2003 | |
Cash flows from operating activities: | | | | | | | |
Net income | | $ | 159,665 | | $ | 75,271 | | $ | 31,499 | |
Adjustments to reconcile net income to net cash provided by operating activities: | | | | | | | |
Depreciation and amortization | | 7,167 | | 3,935 | | 2,453 | |
Deferred income tax expense | | 44,308 | | 25,742 | | 9,131 | |
Tax benefit from employee stock options | | 34,322 | | 29,858 | | — | |
Stock-based compensation | | 471 | | 1,642 | | 900 | |
Change in assets/liabilities: | | | | | | | |
Increase in structural advisory fees | | (19,037 | ) | (23,549 | ) | (6,025 | ) |
Increase in residuals | | (138,780 | ) | (64,895 | ) | (30,027 | ) |
Increase in processing fees from TERI | | (2,892 | ) | (3,828 | ) | (254 | ) |
Decrease (increase) in prepaid income taxes | | 17,673 | | (20,267 | ) | — | |
Increase in other prepaid expenses | | (1,400 | ) | (2,286 | ) | (138 | ) |
Increase in other assets | | (913 | ) | (1,808 | ) | — | |
Increase in accounts payable, accrued expenses, and other liabilities | | 7,829 | | 13,575 | | 10,038 | |
Net cash provided by operating activities | | 108,413 | | 33,390 | | 17,577 | |
Cash flows from investing activities: | | | | | | | |
Purchases of property and equipment | | (22,564 | ) | (7,371 | ) | (1,938 | ) |
Payments to TERI for loan database updates | | (748 | ) | (748 | ) | (748 | ) |
Net cash used in investing activities | | (23,312 | ) | (8,119 | ) | (2,686 | ) |
Cash flows from financing activities: | | | | | | | |
Repayment of notes payable and capital lease obligations | | (8,620 | ) | (156 | ) | (4,639 | ) |
Repayment of notes payable due to TERI | | (712 | ) | (670 | ) | (631 | ) |
Proceeds from notes payable | | — | | 7,000 | | — | |
Proceeds from initial public offering | | — | | 115,107 | | — | |
Issuances of common stock for benefit plans | | 4,980 | | 3,833 | | 1,390 | |
Repurchases of common stock | | (55,665 | ) | — | | — | |
Net cash (used in) provided by financing activities | | (60,017 | ) | 125,114 | | (3,880 | ) |
Net increase in cash and cash equivalents | | 25,084 | | 150,385 | | 11,011 | |
Cash and cash equivalents, beginning of year | | 168,712 | | 18,327 | | 7,316 | |
Cash and cash equivalents, end of year | | $ | 193,796 | | $ | 168,712 | | $ | 18,327 | |
Supplemental disclosures of cash flow information: | | | | | | | |
Interest paid | | $ | 835 | | $ | 458 | | $ | 1,561 | |
Income taxes paid, net of refunds | | $ | 21,115 | | $ | 24,409 | | $ | 7,100 | |
Supplemental disclosure of non-cash activities: | | | | | | | |
Acquisition of property and equipment through capital leases | | $ | 11,568 | | $ | 1,801 | | $ | 349 | |
See accompanying notes to consolidated financial statements.
F-8
THE FIRST MARBLEHEAD CORPORATION AND SUBSIDIARIES
NOTES TO CONSOLIDATED FINANCIAL STATEMENTS
June 30, 2005, 2004 and 2003
(dollars in thousands, except share and per share amounts)
(1) Nature of Business
The First Marblehead Corporation (FMC, and together with its subsidiaries, the Company), which was incorporated under the laws of the State of Delaware on August 13, 1994, provides outsourcing services for private education lending in the United States. The Company helps meet the growing demand for private education loans by providing national and regional financial institutions and educational institutions, as well as businesses and other enterprises, with an integrated suite of services for designing and implementing student loan programs for their respective customers, students, employees and members. The Company focuses primarily on loan programs for undergraduate, graduate and professional education, and, to a lesser degree, on the primary and secondary school market. The Company is entitled to receive structural advisory fees and residuals for its services in connection with securitizations of loans generated by the loan programs that it facilitates. The Company also receives reimbursement from The Education Resources Institute, Inc. (TERI) for outsourced services it performs on their behalf and receives fees for administrative services that it provides to the discrete trust vehicles that the Company forms for securitizations it facilitates.
The Company offers services in connection with two primary loan products, private label and Guaranteed Access to Education, or GATE. To date, the Company has used discrete trust vehicles, depending on the loan product, for the securitizations that it facilitates. Private label loans guaranteed by TERI, a not-for-profit organization that functions as a guarantor of student loans, have generally been purchased by private label loan trusts. GATE loans, and a limited number of TERI-guaranteed and other loans, have been purchased by the separate securitization trusts (NCT trusts) established by the National Collegiate Trust (NCT).
FMC has seven direct or indirect subsidiaries:
· First Marblehead Data Services, Inc. (FMDS), which was incorporated as a wholly-owned subsidiary of FMC under the laws of the Commonwealth of Massachusetts on April 1, 1996, provides administrative services to the private label loan trusts and the NCT trusts that own the student loans once securitized;
· First Marblehead Education Resources, Inc. (FMER), which was incorporated as a wholly-owned subsidiary of FMC under the laws of the State of Delaware on March 8, 2001, provides outsourced loan origination, customer service, default prevention, default processing and administrative services to TERI;
· GATE Holdings, Inc. (Gate Holdings), which was incorporated as a wholly-owned subsidiary of FMC under the laws of the State of Delaware on October 29, 1996, holds FMC’s title to residual interests in the private label loan trusts and the NCT trusts. Gate Holdings has a residual interest ranging between 75% and 80% of the funds available for distribution from the private label loan trusts, and a residual interest ranging between 10% and 100% of the funds available for distribution from the NCT trusts;
· TERI Marketing Services, Inc. (TMSI), which was incorporated as a wholly-owned subsidiary of FMER under the laws of the State of Delaware on May 14, 2001, provides marketing services to TERI;
F-9
THE FIRST MARBLEHEAD CORPORATION AND SUBSIDIARIES
NOTES TO CONSOLIDATED FINANCIAL STATEMENTS (Continued)
June 30, 2005, 2004 and 2003
(dollars in thousands, except share and per share amounts)
(1) Nature of Business (Continued)
· First Marblehead Securities Corporation and First Marblehead Securities Corporation II, which were established as securities corporations on March 30, 2004 and June 29, 2005, respectively, under the laws of the Commonwealth of Massachusetts, were formed to hold, buy and sell securities on its own behalf; and
· The National Collegiate Funding LLC, which was established as a limited liability company under the laws of the State of Delaware on March 13, 2003 as a wholly-owned subsidiary of GATE Holdings, Inc., is a depositor used in the formation of the private label loan trusts.
On June 20, 2001, FMC and TERI completed a purchase and sale agreement that provided for FMC to acquire TERI’s loan processing operations, including its historical database and workforce-in-place. FMER provides to TERI, under a Master Servicing Agreement, outsourced services including loan origination, customer service, default prevention, default processing and administrative services. TERI reimburses FMER on a monthly basis for expenses incurred relating to the service being performed on TERI’s behalf based on the terms of the Master Servicing Agreement (see Note 11).
(2) Summary of Significant Accounting Policies
(a) Cash and Cash Equivalents
Cash and cash equivalents represent cash held in money market funds or bank accounts. Cash and cash equivalents at June 30, 2005 included primarily $162,733 held in a money market fund that invests in short-term obligations of the U.S. Treasury and repurchase agreements fully collateralized by obligations of the U.S. Treasury. See Note 5 for information related to the investment advisor to this money market fund. Also included in cash and cash equivalents are compensating balances held in other money market funds of $23,309 and $10,021 at June 30, 2005 and 2004, respectively, supporting various financing arrangements.
(b) Property and Equipment
The Company provides for depreciation by the straight-line or accelerated methods at rates adequate to depreciate the appropriate assets over their estimated useful lives. Leasehold improvements are amortized over the shorter of the lease terms or the estimated useful lives of the improvements. Software under development includes amounts capitalized in accordance with statement of Position 98-1, “Accounting for the Costs of Computer Software Developed or Obtained for Internal Use” (SOP 98-1). Once certain criteria are met, SOP 98-1 requires the Company to capitalize certain payroll-related costs of employees directly associated with developing software, in addition to consulting costs incurred from third parties. Computer software costs that are incurred in the preliminary project stage are expensed as incurred. Once certain capitalization criteria have been met during the other stages of the software’s development, directly attributable costs are capitalized.
F-10
THE FIRST MARBLEHEAD CORPORATION AND SUBSIDIARIES
NOTES TO CONSOLIDATED FINANCIAL STATEMENTS (Continued)
June 30, 2005, 2004 and 2003
(dollars in thousands, except share and per share amounts)
(2) Summary of Significant Accounting Policies (Continued)
| | 2005 | | 2004 | | Useful life | |
Equipment | | $ | 11,729 | | $ | 7,345 | | 3 - 5 years | |
Software | | 4,835 | | 2,148 | | 3 years | |
Software under development | | 8,437 | | — | | 3 years | |
Leasehold improvements | | 7,924 | | 2,436 | | lesser of 5 years or lease term | |
Capital leases (equipment, furniture and fixtures) | | 13,750 | | 2,205 | | lease term | |
Furniture and fixtures | | 2,594 | | 1,012 | | 5 - 7 years | |
| | 49,269 | | 15,146 | | | |
Less accumulated depreciation and amortization | | (10,174 | ) | (4,315 | ) | | |
Total property and equipment, net | | $ | 39,095 | | $ | 10,831 | | | |
(c) Use of Estimates
The preparation of financial statements in accordance with U.S. generally accepted accounting principles requires management to make estimates and assumptions (including the determination of the present value of expected future cash flows) that affect the reported amounts of assets and liabilities and the disclosure of contingent assets and liabilities at the date of the financial statements, and the reported amounts of revenues and expenses during the reporting period. Actual results could differ from those estimates. Material estimates that are particularly susceptible to change relate to the recognition and valuation of structural advisory fees and residuals. The Company considers the methods by which it makes these estimates and assumptions, as well as its policy with respect to the determination of whether or not to consolidate the securitization vehicles that it facilitates, to be critical accounting policies.
(d) Revenue Recognition
Structural Advisory Fees—General
Structural advisory fees are paid to the Company from the private label loan trusts and the NCT trusts for structuring and facilitating the securitization of the student loans and are recognized in service revenue when the loans are securitized. A portion of such fees is paid to the Company upon securitization or soon thereafter and is based upon a percentage of the loan balance in the loan pool securitized. The Company receives the up-front structural advisory fees at the time of securitization. The Company collects additional structural advisory fees over the life of the student loan once the assets of a securitization trust exceed its liabilities by amounts stipulated in the related indenture agreement, which excess ranges from 3.0% to 5.0%. For the securitizations conducted in fiscal 2005, 2004 and 2003, this fee ranged between 0.15% and 0.30% of the student loan balances outstanding in the trusts from time to time over the life of the student loans securitized.
Residuals—General
The Company is entitled to receive over the life of the trust either 75% or 80% of the residuals in private label loan trusts once the balance of the loans in each trust exceeds the balance of the debt issued by the trust by a fixed percentage ranging from 3.0% to 3.5%. The Company is also entitled to receive from
F-11
THE FIRST MARBLEHEAD CORPORATION AND SUBSIDIARIES
NOTES TO CONSOLIDATED FINANCIAL STATEMENTS (Continued)
June 30, 2005, 2004 and 2003
(dollars in thousands, except share and per share amounts)
(2) Summary of Significant Accounting Policies (Continued)
the NCT trusts created in fiscal 2004 and 2003, a fee of 10% of the residuals of GATE loans plus a share of the residuals (primarily determined by the percentage of securitized loans related to the Company’s investment) based on its beneficial interests in the securitizations in each NCT trust after all bondholders have been repaid. The Company’s investment in the NCT trusts in fiscal 2004 and 2003 was made in order to mitigate the default risk exposure of a limited number of schools. In exchange, the Company received the rights to residual interests that these schools would otherwise hold in the trust. The value of this residual is primarily affected by the loan performance at these schools. During fiscal 2005, the structure of the NCT trust used to securitize GATE loans was changed and, as a result, the Company is entitled to 100% of the residuals from the NCT trust created in fiscal 2005. The Company did not make an investment in the fiscal 2005 NCT trust.
Structural Advisory Fees and Residuals—Policy
The estimated present value of the additional structural advisory fees and residuals, net of prepayment, default and recovery assumptions, is deemed earned at the time a securitization transaction is completed because evidence of an arrangement exists, services have been provided, the fee is fixed and determinable based on discounted cash flow analyses, there are no future contingencies or obligations and collectibility is reasonably assured.
Structural advisory fees and residuals receivables are carried on the balance sheet at fair value and are evaluated on a periodic basis based on the present value of expected future cash flows, using management’s best estimates. These estimates are based on historical and third-party data, and the Company’s industry experience with the assumptions for default, prepayments, recoveries and discount rates commensurate with the risk involved, considering current outstanding student loan balances and current outstanding balances of borrowings in the securitization trusts.
Processing Fees from TERI
Processing fees from TERI consist of reimbursement of expenses incurred by FMER relating to services performed on behalf of TERI under the terms of the Master Servicing Agreement. Processing fees from TERI are recognized as services are performed.
Administrative and Other Fees
Administrative fees are paid from private label loan trusts and the NCT trusts to FMDS as of each trust payment date for the daily management of the securitization trusts and for the services the Company provides in obtaining information from the loan servicers and reporting this and other information to the parties related to the securitization. The fee is based upon a percentage of the outstanding principal balance of the debt of each of the private label loan trusts and the NCT trust. The fee varies with each separate securitization and can range from 5 basis points to 20 basis points. The Company recognizes such fees in service revenue when earned, as administrative services are provided.
Other fees are based upon a fixed dollar amount per loan and/or a percentage of the loan balance and are recognized in service revenue upon origination by the third-party financial institution.
F-12
THE FIRST MARBLEHEAD CORPORATION AND SUBSIDIARIES
NOTES TO CONSOLIDATED FINANCIAL STATEMENTS (Continued)
June 30, 2005, 2004 and 2003
(dollars in thousands, except share and per share amounts)
(2) Summary of Significant Accounting Policies (Continued)
(e) Goodwill and Intangible Assets
Goodwill
Goodwill has been recorded as the excess of the purchase price paid to acquire TERI’s loan processing operations over the fair value of net assets of the business acquired. The goodwill consists of the fair value of workforce-in-place as well as certain direct acquisition costs and a fair value adjustment for liabilities assumed. The fair value of the workforce-in-place was based upon an appraisal obtained from an independent third-party.
Goodwill is not amortized but is evaluated for impairment at least annually, and the Company has concluded that goodwill was not impaired as of June 30, 2005. The Company early-adopted Statement of Financial Accounting Standards (SFAS) No. 142, “Goodwill and Other Intangible Assets,” during fiscal 2001. The Company considers the following factors in assessing goodwill for impairment: increases in private label loan volume facilitated and securitized, the number of private label clients and revenues and profitability related to private label loans. Impairment, if any, would be determined based upon a discounted cash flow analysis, using a discount rate commensurate with the risks involved.
Intangible Assets
Intangible assets were also recorded in connection with the TERI acquisition and consist of the fair value of the acquired loan database. This database tracks information such as borrower credit characteristics, borrowing practices, interest rates, fees and default rates and provides several significant competitive advantages. The data allow the Company to analyze risk trends and the amount of risk specific to the loans that become part of the securitizations that it structures. Additionally, the data assist in the Company’s default prevention efforts by providing a basis by which it monitors borrower default experiences. The Company also utilizes the database information to monitor and analyze student loan information in order to customize loan products for the Company’s third-party lender clients and to assist them in the risk-based pricing of the loan products.
This loan database was valued based upon an appraisal obtained from an independent third party. Intangible assets are amortized over their estimated useful life of five years, using the straight-line method. Capitalized costs paid to TERI for monthly database updates are amortized over five years from the date of capitalization. Intangible assets are reviewed for impairment whenever events or changes in circumstances indicate that the carrying amount may not be recoverable.
As of June 30, 2005, the Company had approximately $6,990 in gross identifiable intangible assets. During the year ended June 30, 2005, $748 of additional intangible assets was recognized relating to updates which add significant value and extend the useful life of the loan database purchased.
F-13
THE FIRST MARBLEHEAD CORPORATION AND SUBSIDIARIES
NOTES TO CONSOLIDATED FINANCIAL STATEMENTS (Continued)
June 30, 2005, 2004 and 2003
(dollars in thousands, except share and per share amounts)
(2) Summary of Significant Accounting Policies (Continued)
Total amortization expense associated with these intangible assets in fiscal 2005, 2004 and 2003 was $1,317, $1,167 and $1,018, respectively. Estimated future amortization expense for these assets during the next five fiscal years is as follows:
2006 | | $ | 1,467 | |
2007 | | 702 | |
2008 | | 602 | |
2009 | | 502 | |
2010 | | 402 | |
(f) Other Assets
In connection with the Company’s facilitation of the securitization of GATE loans in June 2004, six schools participating in the Company’s GATE program faced limits on the amount of surety coverage that the GATE program’s current surety provider was willing to provide to the NCT trust on their behalf. The Company provided the NCT trust with an additional cash surety deposit of approximately $1,769 on behalf of these six schools. The surety coverage and the Company’s cash deposit provides the NCT trust bondholders with assurance that the pledge commitment that these school clients make to reimburse the NCT trust for defaults by their student borrowers will be fulfilled.
The Company’s cash deposit with the NCT trust on behalf of these schools will earn interest at the prevailing short-term interest rates. The Company will also earn a surety fee equal to 150 basis points of the initial notional amount of the pledge commitment which its cash deposit supports. As schools reimburse the NCT trusts for student defaults, the amount of their pledge commitment is reduced. The Company is entitled to withdraw amounts in the surety reserve account, including earned interest and surety fees, to the extent the balance in the surety reserve account exceeds the pledge commitment. Once NCT trust bondholders have been paid in full, the Company will receive the entire amount remaining in the surety reserve account. We recorded this cash deposit in “Other Assets” on our consolidated balance sheet.
(g) Consolidation
The consolidated financial statements include the accounts of FMC and its subsidiaries, after eliminating inter-company accounts and transactions. Prior to July 1, 2003, excluding securitization trusts created after January 31, 2003, in accordance with various Emerging Issues Task Force (EITF) issues and related interpretations, the Company did not consolidate the private label loan trusts or the NCT trusts created for securitization purposes. The Company considered, among other things, the following factors in assessing consolidation of the securitization trusts:
· The Company did not have unilateral decision-making abilities related to significant matters affecting the securitization trusts, such as asset acquisition, prepayment of debt, placement of debt obligations and modification of trust documents;
F-14
THE FIRST MARBLEHEAD CORPORATION AND SUBSIDIARIES
NOTES TO CONSOLIDATED FINANCIAL STATEMENTS (Continued)
June 30, 2005, 2004 and 2003
(dollars in thousands, except share and per share amounts)
(2) Summary of Significant Accounting Policies (Continued)
· The Company did not have substantially all the risks and rewards of ownership, as TERI and the respective colleges provide substantially all of the student loan guarantees;
· The Company was a facilitator for which it receives market-based fees and was not the transferor of assets to the securitization trusts; and
· The Company’s continuing involvement in the securitization trusts is limited to a passive residual interest and its role as an administrator for the trusts for which it receives market-based fees.
Beginning July 1, 2003, and for securitization trusts created after January 31, 2003, the Company applied FASB Interpretation (FIN) No. 46, “Consolidation of Variable Interest Entities, an interpretation of ARB No. 51,” in assessing consolidation. FIN No. 46 provided a new framework for identifying variable interest entities and determining when a company should include the assets, liabilities, non-controlling interests and results of activities of a variable interest entity in its consolidated financial statements. At June 30, 2005, the existing securitization trusts created after January 31, 2003 have either met the criteria to be a qualified special-purpose entity (QSPE), as defined in paragraph 35 of SFAS No. 140, “Accounting for the Transfers and Servicing of Financial Assets and Extinguishments of Liabilities,” or the Company has determined that it is not the primary beneficiary of the securitization trusts, as defined by FIN No. 46. Accordingly, the Company did not consolidate these existing securitization trusts in these financial statements. In addition, the securitization trusts created prior to January 31, 2003 have been amended in order for them to be considered QSPEs.
On December 24, 2003, the Financial Accounting Standards Board (FASB) issued FIN No. 46 (revised December 2003), “Consolidation of Variable Interest Entities” (FIN No. 46R), which addresses how a business enterprise should evaluate whether it has a controlling interest in an entity through means other than voting rights and, accordingly, should consolidate the entity. FIN No. 46R has replaced FIN No. 46. Public companies must have applied either FIN No. 46 or FIN No. 46R immediately to entities created after January 31, 2003 and no later than the end of the first reporting period that ends after December 15, 2003 to entities considered to be special-purpose entities. The adoption of FIN No. 46R, which we began to apply in December 2003, did not have a material impact on our consolidated financial condition, results of operations, earnings per share or cash flows.
The FASB has issued exposure drafts that would amend FASB Statement No. 140. The proposed amendments would, among other things, change the requirements that an entity must meet to be considered a QSPE. The FASB has announced that it expects to issue final guidance in the first calendar quarter of 2006. The Company is monitoring the status of the exposure drafts to assess their impact, if any, on its financial statements.
(h) Income Taxes
The Company uses the asset and liability method of accounting for income taxes. Under the asset and liability method of FASB Statement No. 109, deferred tax assets and liabilities are recognized for the future tax consequences attributable to differences between the financial statement carrying amounts of existing assets and liabilities and their respective tax bases. Deferred tax assets and liabilities are measured
F-15
THE FIRST MARBLEHEAD CORPORATION AND SUBSIDIARIES
NOTES TO CONSOLIDATED FINANCIAL STATEMENTS (Continued)
June 30, 2005, 2004 and 2003
(dollars in thousands, except share and per share amounts)
(2) Summary of Significant Accounting Policies (Continued)
using enacted tax rates expected to apply to taxable income in the years in which those temporary differences are expected to be recovered or settled. Under FASB Statement No. 109, the effect on deferred tax assets and liabilities of a change in tax rates is recognized as income in the period that includes the enactment date.
(i) Pension
Effective January 1, 2002, FMER has a non-contributory defined benefit pension plan, funded through group annuities, that covers substantially all FMER employees. The pension plan benefit obligation for FMER employees accrued under the TERI plan was transferred to the FMER plan. Plan costs are charged to expense and funded annually. The expense relating to the pension plan is reimbursed by TERI under the terms of the Master Servicing Agreement. FMER uses a June 30 measurement date to determine its pension expense and related financial statement disclosure information. During the second quarter of fiscal 2005, the benefits under the plan were frozen (see Note 8(b)).
(j) Stock Options
The Company applies SFAS No. 123, “Accounting for Stock-Based Compensation,” which permits entities to recognize as expense over the vesting period the fair value of stock-based awards on the date of grant. For employee stock-based awards, SFAS No. 123 allows entities to continue to apply the provisions of APB Opinion No. 25 and provide pro forma net earnings disclosures as if the fair value-based method defined in SFAS No. 123 had been applied. The Company has elected to apply the provisions of APB No. 25 and provide the pro forma disclosures of SFAS No. 123.
For purposes of pro forma disclosures, the estimated fair value of the stock options is amortized to expense over the vesting period of the options. The Company’s consolidated pro forma net income and net income per share for the years ended June 30, 2005, 2004 and 2003, if the Company had elected to recognize compensation expense for the granting of options under SFAS No. 123 using the Black-Scholes option pricing model, are as follows:
| | 2005 | | 2004 | | 2003 | |
Net income—as reported | | $ | 159,665 | | $ | 75,271 | | $ | 31,499 | |
Add: Total stock-based employee compensation expense included in reported net income, net of tax | | 276 | | 962 | | 527 | |
Less: Total stock-based employee compensation expense determined under fair value based methods for all awards, net of tax | | (2,640 | ) | (1,717 | ) | (1,223 | ) |
Net income—pro forma | | 157,301 | | $ | 74,516 | | $ | 30,803 | |
Net income per share—basic—as reported | | $ | 2.46 | | $ | 1.27 | | $ | 0.59 | |
Net income per share—basic—pro forma | | 2.42 | | 1.26 | | 0.58 | |
Net income per share—diluted—as reported | | 2.39 | | 1.19 | | 0.55 | |
Net income per share—diluted—pro forma | | 2.35 | | 1.17 | | 0.54 | |
F-16
THE FIRST MARBLEHEAD CORPORATION AND SUBSIDIARIES
NOTES TO CONSOLIDATED FINANCIAL STATEMENTS (Continued)
June 30, 2005, 2004 and 2003
(dollars in thousands, except share and per share amounts)
(2) Summary of Significant Accounting Policies (Continued)
The fair value of the options was estimated at the date of grant using the Black-Scholes option pricing model with the following weighted-average assumptions for the fiscal years ended June 30, 2005, 2004 and 2003:
Assumption | | | | 2005 | | 2004 | | 2003 | |
Expected risk-free interest rate | | 4.18 | % | 3.98 | % | 3.91 | % |
Expected dividend yield | | n/a | | n/a | | n/a | |
Expected average life in years | | 5 | | 7 | | 7 | |
Volatility | | 32 | % | n/a | | n/a | |
The weighted average grant date fair market value of stock options granted during fiscal 2005, 2004 and 2003 was $4.39, $2.95 and $1.14, respectively.
(k) Net Income Per Share
Basic net income per share is computed by dividing net income by the basic weighted-average number of shares outstanding for the periods presented. Diluted net income per share is computed by dividing net income by the diluted weighted average shares outstanding and common equivalent shares outstanding during the period. The weighted average shares outstanding and common equivalent shares outstanding have been determined in accordance with the treasury stock method. Common stock equivalents consist of stock issuable upon the exercise of outstanding stock options, unvested restricted stock unit grants and options to purchase stock under the Company’s employee stock purchase plan.
(l) Comprehensive Loss
Accumulated other comprehensive loss is comprised of a minimum pension liability adjustment (see Note 8(b)). Total comprehensive loss for fiscal 2005 was $581. The Company recorded no comprehensive income or loss in fiscal 2004 or 2003. Accumulated other comprehensive loss within stockholders’ equity is presented net of a tax benefit of $238.
(m) New Accounting Pronouncements
On December 16, 2004, the FASB issued FASB Statement No. 123 (revised 2004), “Share-Based Payment” (Statement 123R), which is a revision of FASB Statement No. 123, “Accounting for Stock-Based Compensation.” Statement 123R supersedes APB Opinion No. 25, “Accounting for Stock Issued to Employees,” and amends FASB Statement No. 95, “Statement of Cash Flows.” Statement 123R requires an entity to measure the cost of employee services received in exchange for an award of equity instruments, including stock options and restricted stock units, based on the grant-date fair value of the award, with limited exceptions. That cost will be recognized over the period during which the employee is required to provide service in exchange for the award, which is typically the vesting period. Statement 123R eliminates the alternative to use Opinion 25’s intrinsic value method of accounting for stock options that was provided in Statement 123 as originally issued.
F-17
THE FIRST MARBLEHEAD CORPORATION AND SUBSIDIARIES
NOTES TO CONSOLIDATED FINANCIAL STATEMENTS (Continued)
June 30, 2005, 2004 and 2003
(dollars in thousands, except share and per share amounts)
(2) Summary of Significant Accounting Policies (Continued)
The Company adopted Statement 123R on July 1, 2005 using the modified prospective method discussed below. Statement 123R permits public companies to adopt its requirements using one of two methods:
1. A “modified prospective” method in which compensation cost is recognized beginning with the effective date (a) based on the requirements of Statement 123R for all share-based payments granted after the effective date and (b) based on the requirements of Statement 123 for all awards granted to employees prior to the effective date of Statement 123R that remain unvested on the effective date.
2. A “modified retrospective” method which includes the requirements of the modified prospective method described above, but also permits entities to restate their previously issued financial statements to include in their income statements previously recognized under Statement 123 for purposes of pro forma disclosures for either (a) all prior periods or (b) prior interim periods of the year of adoption.
As permitted by Statement 123, the Company accounted for share-based payments to employees using Opinion 25’s intrinsic value method through June 30, 2005, and, as such, generally recognized no compensation cost for employee stock options. The adoption of Statement 123R’s fair-value method will impact the Company’s results of operations, although the impact of adoption of Statement 123R cannot be predicted at this time because it will depend on levels of share-based payments granted in the future. However, had the Company adopted Statement 123R in prior periods, the impact of that standard would have had approximately the same impact as Statement 123, as described in the disclosure of pro forma net income and earnings per share in Note 2 to these financial statements. Statement 123R also requires that the benefits of tax deductions in excess of recognized compensation cost be reported as a financing cash flow, rather than as an operating cash flow as previously required under EITF Issue No. 00-15 “Classification in the Statement of Cash Flows of the Income Tax Benefit Received by a Company upon Exercise of a Nonqualified Employee Stock Option.” This requirement will reduce net operating cash flows and increase net financing cash flows in periods after adoption. While the Company cannot estimate what the impact on the cash flow statement will be in the future (because they depend on, among other things, when employees exercise stock options and the amount of expense recognized related to the value of stock options), the amount of operating cash flows recognized in prior periods for such excess tax deductions were $34,322 during fiscal 2005 and $29,858 during fiscal 2004. The Company recognized no operating cash flows for such excess tax deductions in fiscal 2003.
(n) Reclassification
Certain amounts in prior years have been reclassified to conform to the fiscal 2005 consolidated financial statement presentation.
F-18
THE FIRST MARBLEHEAD CORPORATION AND SUBSIDIARIES
NOTES TO CONSOLIDATED FINANCIAL STATEMENTS (Continued)
June 30, 2005, 2004 and 2003
(dollars in thousands, except share and per share amounts)
(3) Industry Segment Information
The Company’s activities are considered to be in a single industry segment for financial reporting purposes. The Company is engaged in the business of private education finance services and related activities. Substantially all income is derived from these activities.
(4) Service Receivables
Balance Sheet Data
Structural advisory fees and residuals receivables represent the present value of additional structural advisory fees and residuals expected to be collected over the life of the student loans, net of prepayment, default and recovery estimates. The fees are paid from the various NCT trusts and private label loan trusts to the Company. Processing fees receivable from TERI represents amounts due from TERI for expenses incurred by FMER on TERI’s behalf.
The following table summarizes the changes in the fair value of the structural advisory fees receivable for the fiscal years ended June 30, 2005 and 2004:
| | 2005 | | 2004 | |
Fair value at beginning of year | | $ | 24,084 | (1) | $ | 10,785 | |
Additions from structuring new securitizations | | 27,520 | | 13,650 | |
Fair market value adjustments | | 1,767 | | (351 | ) |
Fair value at end of year | | $ | 53,371 | | $ | 24,084 | (1) |
(1) Excludes the $10,250 structural advisory fee receivable from the December 2003 securitization that we collected in July 2004. See Note 6(b) for additional information.
The following table summarizes the changes in the fair value of the residuals receivable for the fiscal years ended June 30, 2005 and 2004, respectively:
| | 2005 | | 2004 | |
Fair value at beginning of year | | $ | 108,495 | | $ | 43,600 | |
Additions from structuring new securitizations | | 121,187 | | 57,935 | |
Fair market value adjustments | | 17,593 | | 6,960 | |
Fair value at end of year | | $ | 247,275 | | $ | 108,495 | |
F-19
THE FIRST MARBLEHEAD CORPORATION AND SUBSIDIARIES
NOTES TO CONSOLIDATED FINANCIAL STATEMENTS (Continued)
June 30, 2005, 2004 and 2003
(dollars in thousands, except share and per share amounts)
(4) Service Receivables (Continued)
The Company estimated cash flows from structural advisory fees receivable, which are based on scheduled securitization trust cash flows, using a discount rate equal to the 10-year Treasury rate at June 30, 2005, 2004 and 2003 plus 2.0%. The Company used the following loan performance assumptions during fiscal 2005, 2004 and 2003:
| | | | Percentage rate | | Discount rate | |
Fiscal Year | | | | Loan type | | Default | | Recovery | | CPR | | Structural
advisory fees | | Residuals | |
2005 | | Private label | | | 8.7 | % | | | 40 | % | | | 7 | % | | | 5.96 | % | | | 12 | % | |
| | GATE | | | 17.1 | | | | 47 | | | | 4 | | | | 5.96 | | | | 12 | | |
2004 | | Private label | | | 8.9 | | | | 40 | | | | 7 | | | | 6.58 | | | | 12 | | |
| | GATE | | | 22.4 | | | | 47 | | | | 4 | | | | 6.58 | | | | 12 | | |
2003 | | Private label | | | 8.1 | | | | 40 | | | | 7 | | | | 5.33 | | | | 12 | | |
| | GATE | | | 25 | | | | 50 | | | | 4 | | | | 5.33 | | | | 12 | | |
| | | | | | | | | | | | | | | | | | | | | | | | | |
In order to accommodate a limited number of schools, the Company invested approximately $1,253 and $1,983 of the Company’s up-front structural advisory fees in the NCT trusts in connection with the securitization of GATE loans in fiscal 2004 and 2003, respectively. These investments entitle the Company to additional interest in the residuals of the NCT trusts and are included in residuals receivable on the consolidated balance sheets. As a result of changes in the structure of the NCT trust used to securitize GATE loans in fiscal 2005, the Company did not invest any of its up-front structural advisory fees in the NCT trust created in fiscal 2005.
The above receivables are anticipated to be collected over the estimated lives of the securitization trusts. For the fiscal 2005 securitizations, the cash flows of the securitization trusts are expected to be collected over approximately 17 to 22 years and, based on the assumptions used, the structural advisory fees and residuals receivables are anticipated to be collected beginning in fiscal 2009. For the fiscal 2004 securitizations, the cash flows of the securitization trusts are expected to be collected over approximately 17 to 24 years and, based on the assumptions used, the structural advisory fees and residuals receivables are anticipated to be collected beginning in fiscal 2009. For the fiscal 2003 securitizations, the cash flows of the securitization trusts are expected to be collected over approximately 20 to 24 years and, based on the assumptions used, the structural advisory fees and residuals receivables are anticipated to be collected beginning in fiscal 2008. As the receivables are determined using various assumptions and factors, actual results may differ from these estimates.
F-20
THE FIRST MARBLEHEAD CORPORATION AND SUBSIDIARIES
NOTES TO CONSOLIDATED FINANCIAL STATEMENTS (Continued)
June 30, 2005, 2004 and 2003
(dollars in thousands, except share and per share amounts)
(4) Service Receivables (Continued)
The effect on the fair value of the structural advisory fees and residuals receivables based on variations of 10% or 20%, except for the forward LIBOR rates, which are based on variations of 1% and 2% from the forward LIBOR rates at June 30, 2005, and changes in the assumed spread between LIBOR rates and auction rates, which are based on .05% and .10% changes from the assumed levels for each key assumption is as follows:
| | Percentage change
in assumptions | | Receivables | | Percentage change
in assumptions | |
Structural advisory fees | | | | Down 20% | | Down 10% | | balance | | Up 10% | | Up 20% | |
| | (dollars in thousands) | |
Default rate: | | | | | | | | | | | | | | | | | | | |
Private label loan trusts | | | $ | 47,304 | | | | $ | 47,132 | | | | $ | 46,960 | | | | $ | 46,788 | | | $ | 46, 610 | |
GATE loan trusts | | | 6,621 | | | | 6,515 | | | | 6,411 | | | | 6,307 | | | 6,201 | |
Total | | | $ | 53,925 | | | | $ | 53,647 | | | | $ | 53,371 | | | | $ | 53,095 | | | $ | 52,811 | |
Change in receivables balance | | | 1.04 | % | | | 0.52 | % | | | | | | | (0.52 | )% | | (1.05 | )% |
Default recovery rate: | | | | | | | | | | | | | | | | | | | |
Private label loan trusts | | | $ | 46,958 | | | | $ | 46,958 | | | | $ | 46,960 | | | | $ | 46,958 | | | $ | 46,958 | |
GATE loan trusts | | | 6,245 | | | | 6,245 | | | | 6,411 | | | | 6,411 | | | 6,592 | |
Total | | | $ | 53,203 | | | | $ | 53,203 | | | | $ | 53,371 | | | | $ | 53,369 | | | $ | 53,550 | |
Change in receivables balance | | | (0.32 | )% | | | (0.32 | )% | | | | | | | (0.00 | )% | | 0.34 | % |
Annual constant prepayment rate (CPR): | | | | | | | | | | | | | | | | | | | |
Private label loan trusts | | | $ | 49,637 | | | | $ | 48,260 | | | | $ | 46,960 | | | | $ | 45,724 | | | $ | 44,558 | |
GATE loan trusts | | | 6,678 | | | | 6,544 | | | | 6,411 | | | | 6,282 | | | 6,157 | |
Total | | | $ | 56,315 | | | | $ | 54,804 | | | | $ | 53,371 | | | | $ | 52,006 | | | $ | 50,715 | |
Change in receivables balance | | | 5.52 | % | | | 2.68 | % | | | | | | | (2.56 | )% | | (4.98 | )% |
Discount rate: | | | | | | | | | | | | | | | | | | | |
Private label loan trusts | | | $ | 50,461 | | | | $ | 48,682 | | | | $ | 46,960 | | | | $ | 45,315 | | | $ | 43,775 | |
GATE loan trusts | | | 6,908 | | | | 6,653 | | | | 6,411 | | | | 6,179 | | | 5,952 | |
Total | | | $ | 57,369 | | | | $ | 55,335 | | | | $ | 53,371 | | | | $ | 51,494 | | | $ | 49,727 | |
Change in receivables balance | | | 7.49 | % | | | 3.68 | % | | | | | | | (3.52 | )% | | (6.83 | )% |
| | | | | | | | | | | | | | | | | | | | | | | | | | |
| | Change in assumption | | | | Change in assumption | |
Structural advisory fees | | | | Down 200
basis points | | Down 100
basis points | | Receivables
balance | | Up 100
basis points | | Up 200
basis points | |
| | (dollars in thousands) | |
Forward LIBOR rates: | | | | | | | | | | | | | | | | | | | | | |
Private label loan trusts | | | $ | 43,858 | | | | $ | 45,399 | | | | $ | 46,960 | | | | $ | 48,538 | | | | $ | 50,142 | | |
GATE loan trusts | | | 5,996 | | | | 6,157 | | | | 6,411 | | | | 6,503 | | | | 6,770 | | |
Total | | | $ | 49,854 | | | | $ | 51,556 | | | | $ | 53,371 | | | | $ | 55,041 | | | | $ | 56,912 | | |
Change in receivables balance | | | (6.59 | )% | | | (3.40 | )% | | | | | | | 3.13 | % | | | 6.64 | % | |
| | | | | | | | | | | | | | | | | | | | | | | | | | | | |
F-21
THE FIRST MARBLEHEAD CORPORATION AND SUBSIDIARIES
NOTES TO CONSOLIDATED FINANCIAL STATEMENTS (Continued)
June 30, 2005, 2004 and 2003
(dollars in thousands, except share and per share amounts)
(4) Service Receivables (Continued)
| | Percentage change
in assumptions | | Receivables | | Percentage change
in assumptions | |
Residuals | | | | Down 20% | | Down 10% | | balance | | Up 10% | | Up 20% | |
| | (dollars in thousands) | |
Default rate: | | | | | | | | | | | |
Private label loan trusts | | $ | 241,152 | | $ | 239,540 | | $ | 237,702 | | $ | 234,983 | | $ | 231,057 | |
GATE loan trusts | | 8,819 | | 9,207 | | 9,573 | | 9,937 | | 9,772 | |
Total | | $ | 249,971 | | $ | 248,747 | | $ | 247,275 | | $ | 244,920 | | $ | 240,829 | |
Change in receivables balance | | 1.09 | % | 0.60 | % | | | (0.95 | )% | (2.61 | )% |
Default recovery rate: | | | | | | | | | | | |
Private label loan trusts | | $ | 236,858 | | $ | 237,404 | | $ | 237,702 | | $ | 237,852 | | $ | 237,952 | |
GATE loan trusts | | 8,129 | | 8,835 | | 9,573 | | 10,319 | | 10,425 | |
Total | | $ | 244,987 | | $ | 246,239 | | $ | 247,275 | | $ | 248,171 | | $ | 248,377 | |
Change in receivables balance | | (0.93 | )% | (0.42 | )% | | | 0.36 | % | 0.45 | % |
Annual constant prepayment rate (CPR): | | | | | | | | | | | |
Private label loan trusts | | $ | 261,740 | | $ | 249,440 | | $ | 237,702 | | $ | 226,514 | | $ | 215,824 | |
GATE loan trusts | | 9,982 | | 9,775 | | 9,573 | | 9,371 | | 9,178 | |
Total | | $ | 271,722 | | $ | 259,215 | | $ | 247,275 | | $ | 235,885 | | $ | 225,002 | |
Change in receivables balance | | 9.89 | % | 4.83 | % | | | (4.61 | )% | (9.01 | )% |
Discount rate: | | | | | | | | | | | |
Private label loan trusts | | $ | 286,792 | | $ | 260,858 | | $ | 237,702 | | $ | 216,980 | | $ | 198,392 | |
GATE loan trusts | | 12,864 | | 11,091 | | 9,573 | | 8,198 | | 7,150 | |
Total | | $ | 299,656 | | $ | 271,949 | | $ | 247,275 | | $ | 225,178 | | $ | 205,542 | |
Change in receivables balance | | 21.18 | % | 9.98 | % | | | (8.94 | )% | (16.88 | )% |
| | | | | | | | | | | | | | | | | | |
| | Change in assumption | | | | Change in assumption | |
Residuals | | | | Down 200
basis points | | Down 100
basis points | | Receivables
balance | | Up 100
basis points | | Up 200
basis points | |
| | (dollars in thousands) | |
Forward LIBOR rates: | | | | | | | | | | | | | | | | | | | | | |
Private label loan trusts | | | $ | 218,089 | | | | $ | 227,934 | | | | $ | 237,702 | | | | $ | 247,390 | | | | $ | 256,965 | | |
GATE loan trusts | | | 8,710 | | | | 9,074 | | | | 9,573 | | | | 10,024 | | | | 10,311 | | |
Total | | | $ | 226,799 | | | | $ | 237,008 | | | | $ | 247,275 | | | | $ | 257,414 | | | | $ | 267,276 | | |
Change in receivables balance | | | (8.28 | )% | | | (4.15 | )% | | | | | | | 4.10 | % | | | 8.09 | % | |
| | | | | | | | | | | | | | | | | | | | | | | | | | | | |
F-22
THE FIRST MARBLEHEAD CORPORATION AND SUBSIDIARIES
NOTES TO CONSOLIDATED FINANCIAL STATEMENTS (Continued)
June 30, 2005, 2004 and 2003
(dollars in thousands, except share and per share amounts)
(4) Service Receivables (Continued)
| | Percentage change
in assumptions | | | | Percentage change
in assumptions | |
Residuals | | | | Tighten 10
basis points | | Tighten 5
basis points | | Receivables
balance | | Widen 5
basis points | | Widen 10
basis points | |
| | (dollars in thousands) | |
Change in assumed spread between LIBOR and auction rates: | | | | | | | | | | | | | | | | | | | | | |
Private label loan trusts | | | $ | 241,767 | | | | $ | 239,732 | | | | $ | 237,702 | | | | $ | 235,671 | | | | $ | 233,643 | | |
GATE loan trusts | | | 9,573 | | | | 9,573 | | | | 9,573 | | | | 9,573 | | | | 9,573 | | |
Total | | | $ | 251,340 | | | | $ | 249,305 | | | | $ | 247,275 | | | | $ | 245,244 | | | | $ | 243,216 | | |
Change in receivables balance | | | 1.64 | % | | | 0.82 | % | | | | | | | (0.82 | )% | | | (1.64 | )% | |
| | | | | | | | | | | | | | | | | | | | | | | | | | | | |
These sensitivities are hypothetical and should be used with caution. The effect of each change in assumption must be calculated independently, holding all other assumptions constant. Because the key assumptions may not in fact be independent, the net effect of simultaneous adverse changes in key assumptions may differ from the sum of the individual effects above.
(5) Related Party Transaction
At June 30, 2005, the Company had invested approximately $162,733 of cash and cash equivalents in a money market fund. The investment advisor for this fund is Milestone Capital Management, LLC (MCM), an institutional money management firm. Members of the immediate family of one of the Company’s directors indirectly own approximately 65% of MCM’s outstanding equity.
(6) Other Borrowings
(a) Revolving Line of Credit
On August 28, 2003, the Company entered into an agreement with Fleet National Bank to establish a revolving line of credit in the amount of $10,000, which included a sub-limit for letters of credit. Fleet National Bank was acquired by Bank of America, and the Company’s agreement related to this facility was assigned to Bank of America. The revolving credit facility matured on August 28, 2005, with interest currently payable, at the Company’s option, at the bank’s prime rate or the LIBOR plus 2%. The revolving credit line contained financial covenants, including minimum trailing 12-month up-front structural advisory fees, minimum tangible net worth, maximum liabilities to net worth ratios and minimum cash flow to debt service ratios, as well as certain financial reporting covenants. This agreement restricted the Company’s ability to pay cash dividends in the event it is in default. No amounts were outstanding under this revolving line of credit at June 30, 2005. The proceeds, if any, were to be used for working capital and general corporate purposes. Bank of America had issued on our behalf a letter of credit in the amount of $500 in lieu of security deposits for the lease of certain office space, which reduced the amount that we could borrow under the revolving credit facility. Third party beneficiaries had not drawn upon this letter of credit.
F-23
THE FIRST MARBLEHEAD CORPORATION AND SUBSIDIARIES
NOTES TO CONSOLIDATED FINANCIAL STATEMENTS (Continued)
June 30, 2005, 2004 and 2003
(dollars in thousands, except share and per share amounts)
(6) Other Borrowings (Continued)
(b) Note Payable Related to December 2003 Securitization
In December 2003, the Company received $7,000 upon the issuance of a $7,250 note to the lead underwriter of the Company’s December 2003 securitization. The Company agreed to repay this note with the first $7,250 of the $10,250 up-front structural advisory fee that it received in July 2004 in connection with the December 2003 securitization. This note was further collateralized by the first $6,300 of residual cash flow from the December 2003 securitization as well as $700 of restricted cash. The note was paid in full in July 2004.
(c) Equipment Line of Credit
In January 2005, the Company entered into an equipment financing lease agreement which it will use to finance the purchases of furniture and equipment. The agreement allows the Company to finance up to $20,000 worth of furniture and equipment purchased before December 30, 2005. The Company expects to repay amounts drawn down on the lease in terms ranging from three to five years. As of June 30, 2005, we had drawn $10,513 under this line of credit.
(7) Borrowings from Related Parties
In connection with the acquisition of TERI’s loan processing operations, the Company entered into a Note Payable Agreement with TERI on June 20, 2001, amounting to $3,900, $2,000 of which relates to the acquisition of TERI’s software and network assets and $1,900 of which relates to the workforce-in-place. Principal and interest at an annual rate of 6% are payable in 120 monthly installments of $43 commencing on July 20, 2001 and ending on June 20, 2011. The note payable is secured by the software and network assets intangible assets. The outstanding balance of this note payable at June 30, 2005 amounted to $2,613.
The Company also entered into a second note payable, amounting to $4,000, with TERI on June 20, 2001 to fund the acquisition of TERI’s loan database. Principal and interest at an annual rate of 6% are payable in 120 monthly installments of $44 commencing on July 20, 2001 and ending on June 20, 2011. The note payable is secured by the loan database. The outstanding balance of this note payable at June 30, 2005 amounted to $2,680.
Principal payments due on notes payable to TERI in each of the five fiscal years and thereafter subsequent to June 30, 2005 are as follows:
2006 | | $ | 755 | |
2007 | | 802 | |
2008 | | 852 | |
2009 | | 904 | |
2010 | | 960 | |
Thereafter | | 1,019 | |
| | $ | 5,292 | |
F-24
THE FIRST MARBLEHEAD CORPORATION AND SUBSIDIARIES
NOTES TO CONSOLIDATED FINANCIAL STATEMENTS (Continued)
June 30, 2005, 2004 and 2003
(dollars in thousands, except share and per share amounts)
(8) Retirement Plans
(a) Defined Contribution Plans—401(k)
On January 1, 2005, FMC and FMER merged their independent 401(k) retirement plans into one plan covering all employees. Eligible employees can join the combined plan after three months of employment. Employee and employer contributions vest immediately.
Prior to January 1, 2005, FMC offered all its employees, age 21 and older, the opportunity to participate in a contributory 401(k) retirement plan. Employee and employer contributions vested immediately. FMC, at its option, could contribute to the plan for the benefit of its employees. FMC made contributions to the 401(k) plans of $240 during fiscal 2005. FMC made no contributions during fiscal 2004 or 2003.
Prior to January 1, 2005, FMER had a defined contribution plan which was funded through group fixed and variable annuity contracts and covered substantially all employees. FMER offered eligible employees the opportunity to participate in the defined contribution plan which was intended to qualify under Section 401(k) of the Internal Revenue Code. Employees were eligible to be participants in the plan after one month of service and were eligible for employer contributions after one year of service and 1,000 hours of service. Employer contributions were fully vested after five years. FMER made discretionary contributions to the plans of $906, $304 and $244 for the years ended June 30, 2005, 2004 and 2003, respectively. This expense was reimbursed by TERI under the terms of the Master Servicing Agreement.
(b) Pension Plan
FMER has a non-contributory defined benefit pension plan, funded through group annuities, that covers substantially all FMER employees. Plan costs are charged to expense and funded annually. FMER uses a June 30 measurement date to determine its pension expense and related financial statement disclosure information. During the second quarter of fiscal 2005, the Company recorded a net curtailment gain of $655 as the benefits under the plan were frozen.
The current pension plan investment policy is to seek conservative growth in assets by utilizing a blend of equities and fixed income instruments through participation in large well diversified funds. Annually, 75% of new deposits are deposited into a “balanced fund” that on average is invested 65% in equities and 35% in fixed income instruments. The remaining 25% of new deposits are deposited into a fixed income fund that is diversified. Preservation of capital and the generation of investment earnings to reduce corporate contributions are the main objectives of this strategy.
F-25
THE FIRST MARBLEHEAD CORPORATION AND SUBSIDIARIES
NOTES TO CONSOLIDATED FINANCIAL STATEMENTS (Continued)
June 30, 2005, 2004 and 2003
(dollars in thousands, except share and per share amounts)
(8) Retirement Plans (Continued)
The following table sets forth the amounts recognized related to FMER’s defined benefit pension plan in the Company’s consolidated financial statements for the fiscal years ended June 30, 2005 and 2004:
| | 2005 | | 2004 | |
Change in benefit obligation: | | | | | |
Benefit obligation at beginning of year | | $ | 3,705 | | $ | 3,116 | |
Benefits paid | | (14 | ) | (21 | ) |
Service cost | | 315 | | 596 | |
Plan amendments | | (3,121 | ) | n/a | |
Interest on projected benefit obligations | | 203 | | 210 | |
Actuarial (gain) loss | | 2,254 | | (196 | ) |
Benefit obligation at end of year | | $ | 3,342 | | $ | 3,705 | |
Change in plan assets: | | | | | |
Fair value of plan assets at beginning of year | | $ | 1,807 | | $ | 1,381 | |
Employer contributions | | 437 | | 328 | |
Expenses and benefits paid | | (33 | ) | (37 | ) |
Actual return on plan assets | | 138 | | 135 | |
Fair value of plan assets at end of year | | $ | 2,349 | | $ | 1,807 | |
Funded status: | | | | | |
Unrecognized net actuarial loss | | $ | 581 | | $ | 746 | |
Accrued benefit cost | | 412 | | 1,152 | |
| | $ | 993 | | $ | 1,898 | |
Additional year-end information for pension plans with accumulated benefit obligations in excess of plan assets: | | | | | |
Projected benefit obligation | | $ | 3,342 | | n/a | |
Accumulated benefit obligation | | 3,342 | | n/a | |
Fair value of plan assets | | $ | 2,349 | | n/a | |
Components of net periodic pension cost: | | | | | |
Service cost | | $ | 315 | | $ | 596 | |
Interest on projected benefit obligations | | 203 | | 210 | |
Expected return on plan assets | | (184 | ) | (137 | ) |
Amortization of loss | | 18 | | 70 | |
Net periodic pension cost | | $ | 352 | | $ | 739 | |
Change in accrued pension cost: | | | | | |
Accrued pension cost at beginning of year | | $ | 1,152 | | $ | 741 | |
Curtailment | | (655 | ) | n/a | |
Net pension cost | | 352 | | 739 | |
Employer contributions | | (437 | ) | (328 | ) |
Accrued pension cost at end of year | | $ | 412 | | $ | 1,152 | |
Amounts recognized in the consolidated balance sheets: | | | | | |
Accrued pension cost | | $ | 412 | | $ | 1,152 | |
Accumulated other comprehensive loss | | 581 | | — | |
Net amount recognized | | $ | 993 | | $ | 1,152 | |
Other comprehensive loss attributable to change in additional minimum liability recognition | | $ | 581 | | $ | — | |
F-26
THE FIRST MARBLEHEAD CORPORATION AND SUBSIDIARIES
NOTES TO CONSOLIDATED FINANCIAL STATEMENTS (Continued)
June 30, 2005, 2004 and 2003
(dollars in thousands, except share and per share amounts)
(8) Retirement Plans (Continued)
The gain or loss in excess of the greater of 10% of the benefit obligation or the market-related value of assets is amortized on a straight line basis over the average remaining service period of active participants.
Weighted-average assumptions used in determining the actuarial present value of the projected benefit obligation as of June 30, 2005 and 2004 were as follows:
| | 2005 | | 2004 | |
Discount rate | | 5.25 | % | 6.50 | % |
Salary increase | | n/a | | 5.50 | |
Covered compensation increase | | n/a | | 3.50 | |
Statutory compensation and benefit limit increase | | n/a | | 3.50 | |
Weighted-average assumptions used to determine net periodic benefit cost at June 30, 2005 and 2004 are as follows:
| | 2005 | | 2004 | |
Discount rate | | 6.50 | % | 5.85 | % |
Salary increase | | 5.50 | | 5.50 | |
Long-term rate of return | | 8.50 | | 8.50 | |
To develop the expected long-term rate of return on assets assumption, the company considered the historical returns and the future expectations for returns for each asset class. This resulted in the selection of the 8.50% long-term rate of return on assets assumption.
Plan Assets
The Company’s weighted-average asset allocations at June 30, 2005 and 2004, by asset category are as follows:
| | Plan assets at
June 30, | |
| | 2005 | | 2004 | |
Asset Category | | | | | | | | | |
Equities | | | 39 | % | | | 37 | % | |
Fixed Income | | | 60 | | | | 63 | | |
Other | | | 1 | | | | — | | |
Total | | | 100 | % | | | 100 | % | |
Contributions
The Company expects to contribute $250 to the Pension Plan in the fiscal year ending June 30, 2006.
F-27
THE FIRST MARBLEHEAD CORPORATION AND SUBSIDIARIES
NOTES TO CONSOLIDATED FINANCIAL STATEMENTS (Continued)
June 30, 2005, 2004 and 2003
(dollars in thousands, except share and per share amounts)
(8) Retirement Plans (Continued)
Estimated Future Benefit Payments
The following benefit payments, which reflect expected future service, as appropriate, are expected to be paid:
Fiscal year ending June 30, | | | | Pension
benefits | |
2006 | | | $ | 20 | | |
2007 | | | 20 | | |
2008 | | | 20 | | |
2009 | | | 20 | | |
2010 | | | 21 | | |
Years 2011 to 2015 | | | 178 | | |
(9) 2003 Employee Stock Purchase Plan
In October 2003, the Board of Directors and stockholders approved a 2003 Employee Stock Purchase Plan (Stock Purchase Plan). A total of 400,000 shares of common stock are authorized for issuance under this plan. The Stock Purchase Plan permits eligible employees to purchase shares of common stock at the lower of 85% of the fair market value of the common stock at the beginning or at the end of each offering period. Employees who own 5% or more of the Company’s common stock are not eligible to participate in the Stock Purchase Plan. Participation is voluntary. Prior to June 30, 2004, no shares had been issued under this plan. Under the Stock Purchase Plan, 11,420, 10,050 and 40,499 shares were issued July 2005, January 2005 and July 2004, respectively.
(10) Commitments and Contingencies
Leases
The Company leases office space, a corporate aircraft and equipment under non-cancelable operating leases expiring at various times through April 2014. Rent expense pursuant to these operating leases for the periods ended June 30, 2005, 2004 and 2003 was approximately $8,169, $2,445 and $1,556, respectively. Rent expense is net of sublease revenue of $443, $113 and $87 for the years ended June 30, 2005, 2004 and 2003, respectively.
Furniture and equipment included on the balance sheet as of June 30, 2005 at a cost of $13,750 and accumulated depreciation of $1,878 was financed through non-cancelable capital leases.
F-28
THE FIRST MARBLEHEAD CORPORATION AND SUBSIDIARIES
NOTES TO CONSOLIDATED FINANCIAL STATEMENTS (Continued)
June 30, 2005, 2004 and 2003
(dollars in thousands, except share and per share amounts)
(10) Commitments and Contingencies (Continued)
The future minimum lease payments required under these leases for each of the five fiscal years subsequent to June 30, 2005 and thereafter are as follows:
Fiscal year ending June 30, | | | | Capital
leases | | Operating
leases | |
2006 | | $ | 4,702 | | | $ | 12,080 | | |
2007 | | 3,800 | | | 12,952 | | |
2008 | | 2,952 | | | 12,256 | | |
2009 | | 978 | | | 9,945 | | |
2010 | | 712 | | | 9,728 | | |
Thereafter | | — | | | 28,145 | | |
Total minimum lease payments | | 13,144 | | | $ | 85,106 | | |
Less amounts representing interest | | (1,026 | ) | | | | |
Present value of future minimum lease payments | | 12,118 | | | | | |
Less current portion | | (4,204 | ) | | | | |
Long-term portion | | $ | 7,914 | | | | | |
The amounts the Company will receive under non-cancelable subleases of office space for each of the five fiscal years subsequent to June 30, 2005 and thereafter are as follows:
Fiscal year ending June 30, | | | | Sublease
payments | |
2006 | | | $ | 542 | | |
2007 | | | 540 | | |
2008 | | | 509 | | |
2009 | | | 524 | | |
2010 | | | 596 | | |
Thereafter | | | 596 | | |
Total | | | $ | 3,307 | | |
Loan Database
Under the terms of the Database Purchase and Supplementation Agreement between the Company and TERI, the Company pays a monthly purchase fee of $62. The payments commenced on July 20, 2001 and will be paid as consideration for the right to receive updates and queries to the loan database acquired in June 2001 for a term of five years. In October 2004, this agreement was renewed for an additional five-year term with reduced monthly payments of $21 commencing July 2007.
Legal Proceedings
The Company is involved in routine legal proceedings occurring in the ordinary course of business. In the opinion of management, final disposition of these proceedings will not have a material adverse effect on the financial condition or results of operations of the Company.
F-29
THE FIRST MARBLEHEAD CORPORATION AND SUBSIDIARIES
NOTES TO CONSOLIDATED FINANCIAL STATEMENTS (Continued)
June 30, 2005, 2004 and 2003
(dollars in thousands, except share and per share amounts)
(10) Commitments and Contingencies (Continued)
Agreements with Lenders
Under the terms of some of FMC’s contracts with key lender clients, FMC has an obligation to securitize loans originated by those lenders periodically, typically twice per year. FMC may agree with certain lenders to securitize more frequently in the future. If FMC does not honor these obligations, FMC may be required to pay liquidated damages, generally not to exceed 1% of the face amount of the loans available for securitization. FMC has complied with the terms of these contracts and, accordingly, no liability has been accrued.
Capital Expenditures
The Company has capital expenditure commitments for fiscal 2006 of approximately $3,141. Such expenditures are expected to relate to the improvement of the Company’s loan processing and information technology infrastructures.
(11) Concentrations
TERI
TERI is a private, non-profit Massachusetts organization as described under section 501(c)(3) of the Internal Revenue Code. Incorporated in 1985, TERI is the oldest and largest guarantor of alternative, or private, student loans. In its role as guarantor in the private education lending market, TERI agrees to reimburse lenders or the securitization trusts for unpaid principal and interest on defaulted loans. TERI is the exclusive third-party provider of borrower default guarantees for the Company’s clients’ private student loans. As of June 30, 2005, TERI has a Baa3 counterparty rating from Moody’s Investors Service, which is the lowest investment grade rating, and an insurer financial strength rating of A+ from Fitch Ratings. If these ratings are lowered, FMC’s clients may not wish to enter into guarantee arrangements with TERI. In addition, FMC may receive lower structural advisory fees because the costs of obtaining financial guarantee insurance for the asset-backed securitizations that FMC structures could increase.
On February 2, 2001, FMC and TERI entered into a two-year Master Loan Guaranty Agreement which grants TERI a right of first refusal to guarantee existing and future FMC private label loan programs, as well as new, jointly created loan programs during the term of the Agreement. In June 2001, as a result of the closing of the Company’s acquisition of TERI’s loan processing operations, the Master Loan Guaranty Agreement was automatically extended to a five-year term from the date of the acquisition closing. The loans guaranteed pursuant to the Master Loan Guaranty Agreement comprise only a portion of TERI’s guarantee business, and the Master Loan Guaranty Agreement does not preclude TERI from continuing to provide its guarantees to loan originators not associated with FMC. Under the terms of a master loan guaranty agreement that FMC entered into with TERI in 2001, FMC also agreed to provide a beneficial interest for TERI of 25% of the residual value of TERI-guaranteed loans owned by the securitization trusts that purchase the loans, and a right of first refusal to guarantee FMC’s private label clients’ existing and future loan programs. In October 2004, FMC renewed its Master Servicing Agreement, Master Loan Guaranty Agreement and certain additional agreements with TERI, in each case for an additional term through June 2011. In addition, FMC entered into a supplement to the Master Loan
F-30
THE FIRST MARBLEHEAD CORPORATION AND SUBSIDIARIES
NOTES TO CONSOLIDATED FINANCIAL STATEMENTS (Continued)
June 30, 2005, 2004 and 2003
(dollars in thousands, except share and per share amounts)
(11) Concentrations (Continued)
Guaranty Agreement, under which FMC granted to TERI a right to elect once each fiscal year to increase the amount of its administration fees by 25 basis points, with a corresponding reduction from 25% to 20% in TERI’s ownership of the residual value of the TERI-guaranteed loans purchased during that year by the securitization trusts and a resulting increase from 75% to 80% in FMC residual ownership. TERI has made such an election for fiscal 2005.
FMER provides to TERI, under a Master Servicing Agreement, underwriting, documentation and other origination services, technical support, disbursements, customer service, collections, accounting services, guarantee claims management and administrative services, in support of TERI’s loan guarantee function. FMC guarantees the full and timely performance by FMER of its obligations pursuant to this Master Servicing Agreement. FMC also benefits from use of the acquired TERI assets, including historical loan data, to support the design and implementation of future FMC loan programs and new jointly created loan programs. In addition, TERI has the right to designate one of three representatives to serve on the board of directors of FMER.
PHEAA
As of June 30, 2005, there were nine TERI-approved loan servicers. Servicers provide administrative services relating to loans, including processing deferment and forbearance requests, sending out account statements and accrual notices, responding to borrower inquiries, and collecting and crediting payments received from borrowers. The Company currently utilizes four of these servicers. As of June 30, 2005, Pennsylvania Higher Education Assistance Agency (PHEAA) services a majority of the loans for which the Company facilitates origination. This arrangement allows the Company to increase the volume of loans in the Company’s clients’ loan programs without incurring the overhead investment in servicing operations. As with any external service provider, there are risks associated with inadequate or untimely services. In addition, if the Company’s relationship with PHEAA terminates, the Company would either need to expand or develop a relationship with another TERI-approved loan servicer, which could be time-consuming and costly.
Significant Customers
Processing fees from TERI represented approximately 19%, 18% and 23% of total service revenue during fiscal 2005, 2004 and 2003, respectively. Securitization-related fees from three private label loan trusts represented approximately 71% of total service revenue in fiscal 2005. Securitization-related fees from two private label loan trusts represented approximately 75% of total service revenue in fiscal 2004. Securitization-related fees from one private label loan trust represented approximately 71% of total service revenue in fiscal 2003. These securitization trusts purchased private student loans from several lenders including JPMorgan Chase Bank, N.A., successor by merger to Bank One, N.A., Bank of America, N.A. and Charter One Bank, N.A. The Company did not recognize more than 10% of total service revenue from any other customer.
F-31
THE FIRST MARBLEHEAD CORPORATION AND SUBSIDIARIES
NOTES TO CONSOLIDATED FINANCIAL STATEMENTS (Continued)
June 30, 2005, 2004 and 2003
(dollars in thousands, except share and per share amounts)
(12) Income Taxes
Components of income tax expense attributable to income from operations for the years ended June 30, 2005, 2004 and 2003 were as follows:
| | 2005 | | 2004 | | 2003 | |
Current: | | | | | | | |
Federal | | $ | 56,649 | | $ | 21,023 | | $ | 10,937 | |
State | | 16,467 | | 6,564 | | 2,446 | |
Total current tax expense | | 73,116 | | 27,587 | | 13,383 | |
Deferred: | | | | | | | |
Federal | | 33,228 | | 19,983 | | 6,815 | |
State | | 11,080 | | 5,960 | | 2,316 | |
Total deferred income tax expense | | 44,308 | | 25,943 | | 9,131 | |
Income tax expense | | $ | 117,424 | | $ | 53,530 | | $ | 22,514 | |
The following table reconciles the expected federal income tax expense (computed by applying the federal statutory tax rate to income before taxes) to recorded income tax expense for the years ended June 30, 2005, 2004 and 2003:
| | 2005 | | 2004 | | 2003 | |
Computed federal tax expense | | $ | 96,981 | | $ | 45,080 | | $ | 18,905 | |
State tax, net of federal benefits | | 17,906 | | 8,141 | | 3,095 | |
Other | | 2,537 | | 309 | | 514 | |
Income tax expense | | $ | 117,424 | | $ | 53,530 | | $ | 22,514 | |
The tax effects of temporary differences between financial statement carrying amounts of existing assets and liabilities and their respective tax bases that give rise to significant deferred tax assets and deferred tax liabilities at June 30, 2005 and 2004 were as follows:
| | 2005 | | 2004 | |
Deferred tax assets: | | | | | |
Deferred compensation | | $ | 2,100 | | $ | 1,107 | |
Other | | — | | 201 | |
Total net deferred tax asset | | $ | 2,100 | | $ | 1,308 | |
Deferred tax liability: | | | | | |
Residual fees, net | | (81,703 | ) | (41,010 | ) |
Depreciation | | (4,605 | ) | (436 | ) |
Total deferred tax liability | | (86,308 | ) | (41,446 | ) |
Net deferred tax liability | | $ | (84,208 | ) | $ | (40,138 | ) |
The Company has determined that a valuation allowance is not required for any of its deferred tax assets since it is more likely than not that these assets will be realized by offsetting future taxable income.
F-32
THE FIRST MARBLEHEAD CORPORATION AND SUBSIDIARIES
NOTES TO CONSOLIDATED FINANCIAL STATEMENTS (Continued)
June 30, 2005, 2004 and 2003
(dollars in thousands, except share and per share amounts)
(13) Stockholders’ Equity and Stock Options
Equity Transactions
On August 10, 2004, the Board of Directors approved, and on November 18, 2004, the Company’s stockholders approved, an increase in the total number of authorized shares of common stock from 100,000,000 to 150,000,000.
A former executive officer of the Company had an agreement with two principal stockholders of the Company relating to shares of common stock of the Company owned by these stockholders. Pursuant to this agreement, the former executive officer earned non-cash compensation of $900 through June 30, 2003. On September 30, 2003, the agreement was terminated in exchange for vested options issued by these two principal stockholders. During the year ended June 30, 2004, the former executive officer earned non-cash compensation of $1,642.
Initial Public Offering
In November 2003, an aggregate of 14,375,000 shares of the Company’s common stock were sold in an initial public offering at a price of $16.00 per share, including:
· 7,906,250 shares sold by the Company;
· 6,468,750 shares sold by the Company’s selling stockholders;
Net proceeds of the initial public offering to the Company, after underwriting discounts and offering expenses, were approximately $115,028. The Company did not receive any of the proceeds of the sale of the shares sold by the selling stockholders.
Follow-on Offerings
In June 2004, an aggregate of 7,406,312 shares of the Company’s common stock were sold in a follow-on offering at a price of $36.50 per share. The Company did not sell any shares in this offering and, therefore, did not receive any proceeds from the sale of stock. Immediately prior to the offering, employees exercised options to purchase 2,044,390 shares of common stock. All shares of stock obtained from these exercises were sold in the follow-on offering. The Company received approximately $3,000 from the exercise of these options. The Company incurred approximately $732 in offering costs related to this offering, which were recorded as general and administrative expense during the fiscal year ended June 30, 2004.
In January 2005, an aggregate of 3,933,605 shares of the Company’s common stock were sold in a follow-on public offering at a price of $57.40 per share. The Company did not sell any shares in this offering and, therefore, did not receive any proceeds from the sale of stock. Immediately prior to the follow-on offering, an employee participating in the offering exercised an option to purchase 1,012,980 shares of common stock which were then sold in the offering. The Company received approximately $1,930 in payment of the exercise price for this option. The Company incurred approximately $296 in offering costs related to this offering, which were recorded as general and administrative expenses during the second and third quarters of fiscal 2005.
F-33
THE FIRST MARBLEHEAD CORPORATION AND SUBSIDIARIES
NOTES TO CONSOLIDATED FINANCIAL STATEMENTS (Continued)
June 30, 2005, 2004 and 2003
(dollars in thousands, except share and per share amounts)
(13) Stockholders’ Equity and Stock Options (Continued)
Stock Options
Under the 1996 Stock Option Plan (1996 Plan), the Company may grant either incentive stock options (pursuant to Section 422 of the Internal Revenue Code) or non-statutory stock options to its officers and employees, and non-statutory stock options to consultants, for up to 7,000,000 shares of common stock. Options granted under the 1996 Plan generally vest ratably over four years in five equal installments beginning on the date of grant, and the term of each incentive stock option granted under the 1996 Plan cannot exceed a period of ten years from the date of its grant. The 1996 Plan stipulates that the exercise price with respect to incentive stock options shall not be less than the fair market value of the stock on the day of grant as determined in good faith by the Committee. The Company does not intend to grant additional stock options under the 1996 Plan. The Company intends to grant options in the future under the 2003 Stock Incentive Plan.
Under the 2002 Director Stock Plan, the Company may grant Non-statutory Stock Options to non-employee members of its Board of Directors for up to 200,000 shares of common stock. Under the terms of the 2002 Director Stock Plan, each non-employee director is granted an option to purchase 4,000 shares of common stock (i) as of the date of his or her initial election to the Board of Directors and (ii) annually on each September 20 (beginning September 20, 2003) if on that date the non-employee director shall have served on the Board of Directors for at least 180 days. The term of the option is ten years, and it is immediately exercisable. The exercise price is set at the closing price of the Company’s common stock on the New York Stock Exchange on the last trading day immediately preceding the date of grant.
In September 2003, the Board of Directors and stockholders approved the 2003 Stock Incentive Plan (2003 Plan) and reserved 1,200,000 shares of common stock for issuance under this plan. Under the 2003 Plan, the Board of Directors, or a sub-committee of the Board, may grant options or other stock based awards to employees, directors, consultants or advisors. Prior to June 30, 2004, no options or awards had been issued under this plan. During fiscal 2005, the Company granted 83,000 restricted stock units to certain employees, of which 11,500 were canceled prior to June 30, 2005 as a result of voluntary terminations prior to vesting. In addition, the Company granted 800,000 stock options under this plan during fiscal 2005. At June 30, 2005, 328,500 shares were available for future grant under the 2003 Plan.
The following table summarizes information about stock options outstanding at June 30, 2005:
Range of exercise prices | | | | Number
outstanding | | Weighted-
average
remaining
contractual
life | | Weighted-
average
exercise
price | | Number
exercisable | | Weighted-
average
exercise
price | |
$0.80 | | | 87,750 | | | | 3.88 | | | | $ | 0.80 | | | 87,750 | | | $ | .80 | | |
$1.00 | | | 132,000 | | | | 5.00 | | | | 1.00 | | | 132,000 | | | 1.00 | | |
$1.88 | | | 118,750 | | | | 6.33 | | | | 1.88 | | | 54,750 | | | 1.88 | | |
$5.00 to 7.00 | | | 570,515 | | | | 7.34 | | | | 5.89 | | | 212,115 | | | 5.71 | | |
$12.00 to 15.00 | | | 24,000 | | | | 8.21 | | | | 12.63 | | | 24,000 | | | 12.63 | | |
$49.45 to 75.00 | | | 824,000 | | | | 9.98 | | | | 74.26 | | | 824,000 | | | 74.26 | | |
| | | 1,757,015 | | | | | | | | | | | 1,334,615 | | | | | |
F-34
THE FIRST MARBLEHEAD CORPORATION AND SUBSIDIARIES
NOTES TO CONSOLIDATED FINANCIAL STATEMENTS (Continued)
June 30, 2005, 2004 and 2003
(dollars in thousands, except share and per share amounts)
(13) Stockholders’ Equity and Stock Options (Continued)
The following table presents stock option activity for the years ended June 30, 2005, 2004 and 2003:
| | Number
of options | | Weighted-
average
exercise price
Per share | |
Outstanding options at June 30, 2002 | | 5,510,000 | | | 1.11 | | |
Granted | | 1,008,000 | | | 5.89 | | |
Exercised | | (64,000 | ) | | 0.89 | | |
Canceled | | (36,000 | ) | | 1.00 | | |
Outstanding options at June 30, 2003 | | 6,418,000 | | | 1.86 | | |
Granted | | 64,000 | | | 12.33 | | |
Exercised | | (2,883,310 | ) | | 1.33 | | |
Canceled | | (12,000 | ) | | 5.00 | | |
Outstanding options at June 30, 2004 | | 3,586,690 | | | 2.47 | | |
Granted | | 824,000 | | | 74.26 | | |
Exercised | | (2,343,275 | ) | | 1.74 | | |
Canceled | | (310,400 | ) | | 2.19 | | |
Outstanding options at June 30, 2005 | | 1,757,015 | | | 37.15 | | |
(14) Fair Value of Financial Instruments
The estimated fair value amounts below have been determined by using available quoted market information or other appropriate methodologies. The aggregate fair value amounts presented do not represent the underlying value of the Company taken as a whole.
The fair value estimates provided are made at a specific point in time, based on relevant market information and the characteristics of the financial instrument. The estimates do not provide for any premiums or discounts that could result from the concentrations of ownership of a financial instrument. Because no active market exists for some of the Company’s financial instruments, certain fair value estimates are based on subjective judgments regarding current economic conditions, risk characteristics of the financial instruments, future expected loss experience, prepayment assumptions, and other factors. The resulting estimates involve uncertainties and, therefore, cannot be determined with precision. Changes made to any of the underlying assumptions could significantly affect the estimates. The book values and fair values for the Company’s financial instruments at June 30, 2005 and 2004 are as follows:
| | 2005 | | 2004 | |
| | Book value | | Fair value | | Book value | | Fair value | |
Assets: | | | | | | | | | | | | | |
Cash and cash equivalents | | | $ | 193,796 | | | $ | 193,796 | | | $ | 168,712 | | | $ | 168,712 | |
Service receivables | | | 309,509 | | | 309,509 | | | 148,882 | | | 148,882 | |
Liabilities: | | | | | | | | | | | | | |
Debt—TERI | | | 5,292 | | | 5,446 | | | 6,004 | | | 5,955 | |
Debt—other | | | 12,118 | | | 12,998 | | | 9,179 | | | 9,167 | |
| | | | | | | | | | | | | | | | | |
F-35
THE FIRST MARBLEHEAD CORPORATION AND SUBSIDIARIES
NOTES TO CONSOLIDATED FINANCIAL STATEMENTS (Continued)
June 30, 2005, 2004 and 2003
(dollars in thousands, except share and per share amounts)
(14) Fair Value of Financial Instruments (Continued)
Cash and cash equivalents
The carrying values reported on the balance sheet for cash and cash equivalents approximate their fair values because of the short-term nature of these instruments.
Service receivables
The carrying values reported on the balance sheet for service receivables equal their fair value.
Debt
The fair value reported for debt is estimated based on the discounted value of contractual cash flows. The discount rate used is based on the Company’s estimated current incremental borrowing rate for similar borrowings of similar maturities.
(15) Net Income per Share
The following table sets forth our computation of basic and diluted net income per share of the Company’s common stock:
| | Year ended June 30 | |
| | 2005 | | 2004 | | 2003 | |
| | (in thousands, except per share amount) | |
Net income | | $ | 159,665 | | $ | 75,271 | | $ | 31,499 | |
Shares used in computing net income per common share—basic | | 65,033 | | 59,048 | | 53,099 | |
Effect of dilutive securities: | | | | | | | |
Stock options | | 1,767 | | 4,468 | | 3,732 | |
Restricted stock units | | 4 | | — | | — | |
Dilutive potential common shares | | 1,771 | | 4,468 | | 3,732 | |
Shares used in computing net income per common share—diluted | | 66,804 | | 63,516 | | 56,831 | |
Net income per common share: | | | | | | | |
Basic | | $ | 2.46 | | $ | 1.27 | | $ | .59 | |
Diluted | | $ | 2.39 | | $ | 1.19 | | $ | .55 | |
F-36
THE FIRST MARBLEHEAD CORPORATION AND SUBSIDIARIES
NOTES TO CONSOLIDATED FINANCIAL STATEMENTS (Continued)
June 30, 2005, 2004 and 2003
(dollars in thousands, except share and per share amounts)
(16) Unaudited Quarterly Information
The table below summarizes unaudited quarterly information for each of the three months in the years ended June 30, 2005 and 2004:
| | Three months ended | |
| | September 30,
2004 | | December 31,
2004 | | March 31,
2005 | | June 30,
2005 | |
| | (in thousands, except per share data) | |
Service revenue | | | $ | 22,404 | | | | $ | 155,837 | | | $ | 119,534 | | $ | 120,201 | |
Operating expenses | | | 31,839 | | | | 29,673 | | | 37,713 | | 44,951 | |
Other income, net | | | 363 | | | | 758 | | | 1,046 | | 1,122 | |
Income tax expense (benefit) | | | (3,720 | ) | | | 52,392 | | | 35,429 | | 33,324 | |
Net income (loss) | | | $ | (5,352 | ) | | | $ | 74,530 | | | $ | 47,438 | | $ | 43,048 | |
Net income (loss) per share: | | | | | | | | | | | | | |
Basic | | | $ | (.08 | ) | | | $ | 1.15 | | | $ | .72 | | $ | .66 | |
Diluted | | | (.08 | ) | | | 1.12 | | | .71 | | .65 | |
| | Three months ended | |
| | September 30,
2003 | | December 31,
2003 | | March 31,
2004 | | June 30,
2004 | |
| | (in thousands, except per share data) | |
Service revenue | | | $ | 9,469 | | | | $ | 77,523 | | | | $ | 11,127 | | | $ | 101,141 | |
Operating expenses | | | 15,211 | | | | 15,466 | | | | 17,249 | | | 22,607 | |
Other (expense) income, net | | | (99 | ) | | | 43 | | | | 78 | | | 53 | |
Income tax expense (benefit) | | | (2,764 | ) | | | 25,461 | | | | (2,478 | ) | | 33,311 | |
Net income (loss) | | | $ | (3,077 | ) | | | $ | 36,639 | | | | $ | (3,566 | ) | | $ | 45,276 | |
Net income (loss) per share: | | | | | | | | | | | | | | | |
Basic | | | $ | (.06 | ) | | | $ | .62 | | | | $ | (.06 | ) | | $ | .73 | |
Diluted | | | (.06 | ) | | | .58 | | | | (.06 | ) | | .68 | |
The Company’s quarterly revenue, operating results and profitability have varied and are expected to continue to vary on a quarterly basis primarily because of the timing of the securitizations that it structures. In fiscal 2004, the Company facilitated one securitization in the second quarter and two securitizations in the fourth quarter, but none in the first or third quarters. In fiscal 2005, the Company facilitated one securitization in the second quarter, one securitization in the third quarter, and three securitizations in the fourth quarter, but none in the first quarter.
F-37
EXHIBIT INDEX
Number | | Description |
3.1(1) | | Restated Certificate of Incorporation of the Registrant |
3.2(2) | | Amended and Restated By-laws of the Registrant |
10.1(2)† | | Bank of America GATE Education Loan Program Umbrella Agreement (B of A) between the Registrant and Bank of America, N.A., dated April 30, 2001 |
10.2(2)† | | Note Purchase Agreement Bank of America GATE Loan Program between Bank of America, N.A. and the Registrant, dated April 30, 2001 |
10.3(2)† | | First Amendment to Program Agreements (BAGEL) among The Education Resources Institute, Inc., Bank of America, N.A. and the Registrant, dated March 1, 2002 |
10.4(2)† | | Amendment to First Amendment to Program Agreements (BAGEL) among Bank of America, National Association, the Registrant and The Education Resources Institute, Inc., dated as of March 1, 2002 |
10.5(2)† | | Second Amendment to Program Agreements (BAGEL) by and among Bank of America, National Association, the Registrant, The Education Resources Institute, Inc. and State Street Bank and Trust Company, dated January 10, 2003 |
10.6(2)† | | Third Amendment to Program Agreements by and among Bank of America, National Association, the Registrant, The Education Resources Institute, Inc. and U.S. Bank, N.A. (f/k/a State Street Bank and Trust Company), dated January 15, 2003 |
10.7(2) | | Fourth Amendment to Program Agreements by and among Bank of America, National Association, the Registrant, The Education Resources Institute, Inc. and U.S. Bank, N.A. (f/k/a State Street Bank and Trust Company), dated July 1, 2003 |
10.8(2)† | | Extension Agreement for CEDU prepGATE Loans between Bank of America, N.A. and the Registrant, dated May 1, 2001 |
10.8.1(3)†† | | Amendment to Note Purchase Agreement, dated as of January 31, 2005, by and between The First Marblehead Corporation and Bank of America, N.A. |
10.9(2) | | Amendment to Guaranty, Loan Origination Agreement and Deposit and Security Agreement Bank of America GATE Education Loan Program among The Education Resources Institute, Bank of America, N.A., the Registrant and State Street Bank and Trust Company, dated May 1, 2001 |
10.10(2)† | | GATE Universal Loan Program Umbrella Agreement (Bank of America, N.A., among The National Collegiate Trust, the Registrant and Bank of America, N.A., dated March 7, 2003 |
10.11(2)† | | GATE Student Loan Program Umbrella Agreement (Bank of America NA) among the National Collegiate Trust, the Registrant and Bank of America NA, dated June 1, 1996, as amended |
10.12(2)† | | Note Purchase Agreement between Bank of America, N.A. and the Registrant, dated June 30, 2003 |
10.13(2) | | Bank of America Direct to Consumer Loan Program: Umbrella Agreement between the Registrant and Bank of America, N.A., dated June 30, 2003 |
10.14(2)† | | Amended and Restated Note Purchase Agreement Education One Loan Program between Bank One, National Association and the Registrant, dated May 1, 2002, as amended |
10.15(2)† | | Amendment to Program Agreements Bank One, N.A. (Education One Loan Program) among Bank One, N.A., the Registrant and The Education Resources Institute, Inc., dated April 1, 2003 |
10.16(2)† | | Amendment to Program Agreements (Bank One’s Corporate Advantage Loan Programs) among Bank One, National Association, the Registrant, The Education Resources Institute and U.S. Bank, N.A. |
10.16.1(4)†† | | Sixth Amendment to Program Agreements (Bank One Campus Loan Program) by and among Bank One, TERI, U.S. Bank National Association and the Registrant dated as of November 12, 2004 |
10.17(5)†† | | Note Purchase Agreement between Charter One Bank, N.A. and the Registrant, dated May 15, 2002, as amended |
10.18(5)†† | | Marketing Agreement among Charter One Bank, N.A., Collegiate Funding Services LLC and the Registrant, dated May 15, 2002 |
10.18.1(6)†† | | Third Amendment, dated February 1, 2005, to the Referral Marketing Agreement, dated May 15, 2002, as amended, by and among Charter One Bank, N.A., Collegiate Funding Services, LLC and the Registrant |
10.19(2)† | | Alternative Servicing Agreement between Pennsylvania Higher Education Assistance Agency and the Registrant, dated October 16, 2001, as amended |
10.20(2)† | | Master Loan Guaranty Agreement between The Education Resources Institute, Inc. and the Registrant, dated February 9, 2001 |
10.20.1(7) | | Fourth Supplement, dated as of October 1, 2004, to Master Loan Guaranty Agreement, dated February 2, 2001, by and between The Education Resources Institute, Inc. and the Registrant |
10.21(2)† | | Master Servicing Agreement between The Education Resources Institute, Inc. and First Marblehead Education Resources, Inc., dated July 1, 2001. The Registrant joins in the agreement for the limited purposes set forth therein |
10.22(2)† | | Marketing Services Agreement between The Education Resources Institute, Inc. and TERI Marketing Services, Inc., dated July 1, 2001 |
10.23(8) | | Assignment and Assumption Agreement among The Education Resources Institute, Inc., TERI Marketing Services, Inc. and First Marblehead Education Resources, Inc., dated as of January 1, 2004. |
10.24(2)† | | Database Sale and Supplementation Agreement among The Education Resources Institute, Inc. and First Marblehead Education Resources, Inc., dated June 20, 2001. The Registrant joins in the Agreement for the limited purposes set forth therein |
10.25(2)† | | Software Development Agreement by and between V-Tek Systems Corporation and the Registrant, dated July 1, 2003 |
10.26(2) | | Assignment Agreement between V-Tek Systems Corporation and the Registrant, dated July 8, 2003 |
10.27(2)† | | Origination Services Agreement by and between V-Tek Systems Corporation and the Registrant, dated July 1, 2003 |
10.28(2) | | Origination Services Agreement by and between Bank of America, N.A. and the Registrant, dated July 1, 2003 |
10.29(2)# | | 1996 Stock Option Plan, as amended to date |
10.30(2)# | | 2002 Director Stock Plan |
10.31(8)# | | Form of Non-statutory Stock Option Agreement evidencing grants under the 2002 Director Stock Plan |
10.32(2)# | | 2003 Employee Stock Purchase Plan |
10.33(2)# | | 2003 Stock Incentive Plan |
10.34# | | Forms of Incentive Stock Option Agreement and Non-statutory Stock Option Agreement evidencing grants under the 2003 Stock Incentive Plan |
10.34.1# | | Form of Restricted Stock Unit Agreement evidencing grants under the 2003 Stock Incentive Plan |
10.34.2(9)# | | Restricted Stock Unit Agreement, dated October 26, 2004, between Andrew J. Hawley and the Registrant |
10.34.3(9)# | | Restricted Stock Unit Agreement, dated October 26, 2004, between Anne P. Bowen and the Registrant |
10.34.4# | | Restricted Stock Unit Agreement, dated July 11, 2005, between Peter B. Tarr and the Registrant |
10.34.5# | | Executive Incentive Compensation Plan |
10.35(2) | | Commercial Lease between Little Harbor Realty Limited Partnership and the Registrant for 30 Little Harbor, 2nd Floor, Marblehead, MA, dated November 29, 2000 |
10.36(2) | | Commercial Lease between Little Harbor Realty Limited Partnership and the Registrant for 30 Little Harbor, 1st Floor, Marblehead, MA, dated November 29, 2000 |
10.37(2) | | Commercial Lease between Little Harbor Realty Limited Partnership and the Registrant for 30 Little Harbor, 1st Floor, Marblehead, MA, effective as of February 1, 2002 |
10.38(6) | | Amended and Restated Standard Form Commercial Lease between OMV Associates Limited Partnership and the Registrant for 31 St. James Avenue, Boston, MA, dated February 18, 2004 |
10.38.1(10) | | Second Amendment, dated as of September 30, 2004, to Amended and Restated Standard Form Commercial Lease between OMV Associates Limited Partnership and the Company dated February 18, 2004 |
10.39(2) | | Indenture of Lease between BP. Prucenter Acquisition LLC and the Registrant, dated September 5, 2003 |
10.39.1(11) | | First Amendment, dated October 7, 2004, to Indenture of Lease between BP Prucenter Acquisition LLC and the Registrant, dated September 5, 2003 |
10.40(8) | | Commercial Lease between Cabot Road Partners, LLC and the Registrant for One Cabot Road, Medford, MA dated August 13, 2004 |
10.41(12) | | Termination Agreement, dated as of November 3, 2004, among the Holders, as defined therein |
10.41.1(12) | | Registration Rights Agreement, dated as of November 3, 2004, among the Holders and the Registrant |
10.42(2)# | | Letter Agreement between the Registrant and John Hupalo, dated February 24, 2003 |
10.43(2)# | | Letter Agreement between the Registrant and Donald Peck, dated April 10, 2003 |
10.43.1# | | Letter Agreement between the Registrant and Peter B. Tarr, dated June 10, 2005 |
10.43.2# | | Letter Agreement between the Registrant and Jack L. Kopnisky, dated August 16, 2005 |
10.44(2)# | | Letter Agreement among Messrs. Ralph James, Stephen Anbinder and Daniel Maxwell Meyers |
10.45(2)# | | Option Agreement among the Registrant, Stephen E. Anbinder and Ralph M. James, dated September 30, 2003 |
10.46(2)# | | Option Agreement among the Registrant, Daniel Maxwell Meyers and Ralph M. James, dated September 30, 2003 |
10.47(13)# | | Summary of Director Compensation |
10.48(13)# | | Summary of Bonus Eligibility Under Executive Incentive Compensation Plan |
21.1 | | List of Subsidiaries |
23.1 | | Consent of KPMG LLP |
31.1 | | Chief Executive Officer—Certification pursuant to Rule 13a-14(a) of the Securities Exchange Act of 1934, as adopted pursuant to Section 302 of the Sarbanes-Oxley Act of 2002 |
31.2 | | Chief Financial Officer—Certification pursuant to Rule 13a-14(a) of the Securities Exchange Act of 1934, as adopted pursuant to Section 302 of the Sarbanes-Oxley Act of 2002 |
32.1 | | Chief Executive Officer—Certification pursuant to Rule 13a-14(a) of the Securities Exchange Act of 1934 and 18 U.S.C. Section 1350, as adopted pursuant to Section 906 of the Sarbanes-Oxley Act of 2002 |
32.2 | | Chief Financial Officer—Certification pursuant to Rule 13a-14(a) of the Securities Exchange Act of 1934 and 18 U.S.C. Section 1350, as adopted pursuant to Section 906 of the Sarbanes-Oxley Act of 2002 |
(1) Incorporated by reference to the exhibits to the Registrant’s registration statement on Form S-3 (File No. 333-120740).
(2) Incorporated by reference to the exhibits to the Registrant’s registration statement on Form S-1 (File No. 333-108531).
(3) Incorporated by reference to the exhibits to the Registrant’s current report on Form 8-K with the SEC on January 31, 2005.
(4) Incorporated by reference to the exhibits to the Registrant’s current report on Form 8-K filed with the SEC on December 14, 2004.
(5) Incorporated by reference to the exhibits to the Registrant’s quarterly report on Form 10-Q filed with the SEC on May 14, 2004.
(6) Incorporated by reference to the exhibit to the Registrant’s current report on Form 8-K filed with the SEC on February 7, 2005.
(7) Incorporated by reference to the exhibit to the Registrant’s current report on Form 8-K filed with the SEC on October 28, 2004.
(8) Incorporated by reference to the exhibits to the Registrant’s annual report on Form 10-K filed with the SEC on September 15, 2004.
(9) Incorporated by reference to the exhibits to the Registrant’s current report on Form 8-K/A filed with the SEC on November 23, 2004.
(10) Incorporated by reference to the exhibits to the Registrant’s quarterly report on Form 10-Q filed with the SEC on November 12, 2004.
(11) Incorporated by reference to the exhibit to the Registrant’s current report on Form 8-K filed with the SEC on October 8, 2004.
(12) Incorporated by reference to the exhibits to the Registrant’s current report on Form 8-K filed with the SEC on November 12, 2004.
(13) Incorporated by reference to the Registrant’s current report on Form 8-K filed with the SEC on August 15, 2005.
† Confidential treatment has been granted for certain provisions of this Exhibit pursuant to Rule 406 promulgated under the Securities Act of 1933.
†† Confidential treatment has been granted for certain provisions of this Exhibit pursuant to Rule 24b-2 promulgated under the Securities Exchange Act of 1934.
# This Exhibit is a management contract or compensatory plan.