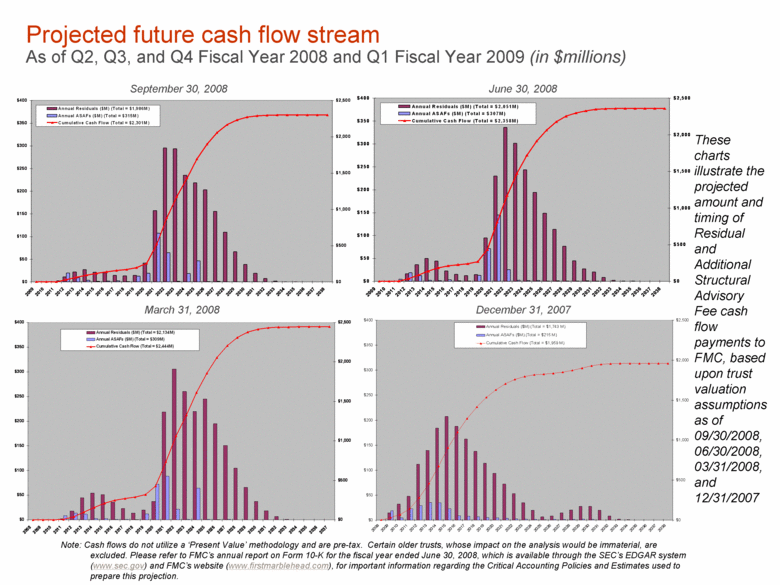
| $ 0 $5 0 $100 $150 $200 $250 $300 $350 $400 2009 2010 2011 2012 2013 2014 2015 2016 2017 2018 2019 2020 2021 2022 2023 2024 2025 2026 2027 2028 2029 2030 2031 2032 2033 2034 2035 2036 2037 2038 $0 $500 $1,000 $1,500 $2,000 $2,500 Annua l Residuals ($M) (Total = $1,986M) Annual ASAFs ($M) (Tota l = $315M) Cumulat ive Cash Flow (Tot al = $2,301M) $0 $50 $100 $150 $200 $250 $300 $350 $400 2009 2010 2011 2012 2013 2014 2015 2016 2017 2018 2019 2020 2021 2022 2023 2024 2025 2026 2027 2028 2029 2030 2031 2032 2033 2034 2035 2036 2037 2038 $0 $500 $1,000 $1,500 $2,000 $2,500 Annual Residuals ($M ) (Total = $2,051M) Annual ASAFs ($M) (Total = $307M) Cumulat ive Cash Flow (Total = $2,358M) Projected future cash flow stream As of Q2, Q3, and Q4 Fiscal Year 2008 and Q1 Fiscal Year 2009 (in $millions) $0 $50 $100 $150 $200 $250 $300 $350 $400 2008 2009 2010 2011 2012 2013 2014 2015 2016 2017 2018 2019 2020 2021 2022 2023 2024 2025 2026 2027 2028 2029 2030 2031 2032 2033 2034 2035 2036 2037 2038 $0 $500 $1,000 $1,500 $2,000 $2,500 Annual Residuals ($M) (Total = $1,743 M) Annual ASAFs ($M) (Total = $215M) Cumulative Cash Flow (Total = $1,959M) $0 $50 $ 100 $ 150 $ 200 $250 $300 $350 $400 2008 2009 2010 2011 2012 2013 2014 2015 2016 2017 2018 2019 2020 2021 2022 2023 2024 202 5 2026 2027 2028 2029 2030 2031 2032 2033 2034 2035 2036 2037 $0 $500 $1,000 $1,500 $2,000 $2,500 Annual Residuals ($M) (Total = $2,134M) Annual ASAFs ($M) (Total = $309M) Cumulative Cash Flow (Total = $2,444 M) Note: Cash flows do not utilize a ‘Present Value’ methodology and are pre-tax. Certain older trusts, whose impact on the analysis would be immaterial, are excluded. Please refer FMC’s annual report on Form 10-K for the fiscal year ended June 30, 2008, which is available through the SEC’s EDGAR system (www.sec.gov) and FMC’s website (www.firstmarblehead.com), for important information regarding the Critical Accounting Policies and Estimates used to prepare this projection. These charts illustrate the projected amount and timing of Residual and Additional Structural Advisory Fee cash flow payments to FMC, based upon trust valuation assumptions as of 09/30/2008, 06/30/2008, 03/31/2008, and 12/31/2007 December 31, 2007 March 31, 2008 June 30, 2008 September 30, 2008 |
