 | ||
| July 29, 2008 | ||
| By Electronic Submission | ||
| U.S. Securities and Exchange Commission | ||
| Financial Services Group | ||
| 100 F Street, NE | ||
| Washington, DC 20549 | ||
| Attention: Christian Windsor, Esq. | ||
Michael R. Clampitt, Esq. | ||
Re: The First Marblehead Corporation | ||
Form 10-Q (q/e March 31, 2008) | ||
Filed May 12, 2008 | ||
File No. 001-31825 | ||
| Ladies and Gentlemen: | ||
| The following are responses of The First Marblehead Corporation (the “Corporation”) to comments contained in the letter dated June 6, 2008 (the “Letter”) from Mr. Christian Windsor, Special Counsel to the Financial Services Group of the Securities and Exchange Commission (the “SEC”), to Mr. Jack L. Kopnisky, Chief Executive Officer, President and Chief Operating Officer of the Corporation. | ||
| For your convenience in review, the following responses are keyed to the numbering of the comments in the Letter and to the headings used in the Letter. | ||
| Form 10-Q for the Quarter Ended March 31, 2008 | ||
| Management’s Discussion and Analysis | ||
| Application of Critical Accounting Policies and Procedures | ||
| Service Revenue and Receivables | ||
1. We have reviewed your response and the supplemental material filed with the Form 10-Q, and note the following items. As to the actual default rates, gross and net, we note on page 11 of the static pool information a line indicating “Cumulative Default Rate Net of | ||
The First Marblehead Corporation
800 Boylston Street, 34th Floor
Boston, MA 02199
Phone 800.895.4283
www.firstmarblehead.com
Creating Solutions for Education Finance
U.S. Securities and Exchange Commission
July 29, 2008
Page 2
Claims Cancelled”. Please advise us as to how these amounts relate to the gross or net default rates underlying your assumptions on page 11 of your Form 10-Q, e.g., are they the equivalent of “net default rates”. In addition, we note your statement in the last paragraph on page 11 that the Company maintained its weighted average net default rate assumptions at 7.68% for the portfolio. In this regard, and noting what appears to be significant increases in the “Cumulative Net Default Rates” from 12/31 to 3/31 in the static pool disclosures, supplementally provide the staff, the actual gross and net default rates, by pool and in the aggregate, at March 31, 2008, and, the growth in such rates from December 31, 2007, or indicate where such information is disclosed by the Company. | ||
Response: | ||
The Corporation provides data in various forms for the differing purposes of debt and equity investors. The “Cumulative Default Rate Net of Claims Cancelled” presented in the static pool information (the “Static Pool Default Rate”) is not equivalent to the weighted average net default rate underlying the Corporation’s accounting assumptions (the “Net Default Rate”) and is intended to serve a different purpose. | ||
In the context of a registered offering of asset-backed securities (“ABS”), Item 1105 of Regulation AB requires static pool information, to the extent material, regarding delinquencies, cumulative losses and prepayments for prior securitized pools of the sponsor of that asset type. The Static Pool Default Rate is included under the caption “Cumulative Loss Data” in the static pool disclosures and is intended primarily to provide investors in the ABS issued by securitization trusts facilitated by the Corporation (each a “Trust” and collectively, the “Trusts”) with the actual amounts withdrawn, as of the report date, from the segregated reserve that secures the default guaranty obligations of The Education Resources Institute, Inc. (“TERI”) with regard to loans held by that Trust. The Static Pool Default Rate details actual amounts at a specific point in time. | ||
The Net Default Rate, on the other hand, is primarily intended to provide equity investors in the Corporation with the assumption used in estimating the fair value of the Corporation’s aggregate residuals and additional structural advisory fees receivables, as required by U.S. generally accepted accounting principles, after giving effect to the expected aggregate gross default and recovery rates. The Net Default Rate is a projection over the future life of the portfolio of securitized loans held by the Trusts. | ||
The Static Pool Default Rate is calculated as: | ||
• the cumulative principal balance of student loans, including capitalized interest, for which a guaranty claim has been submitted to TERI, minus any claim cancellations that occur after a guaranty claim has been submitted to TERI but before it is paid prior to the respective period end; divided by | ||
U.S. Securities and Exchange Commission
July 29, 2008
Page 3
• the principal balance of loans held by the Trust that have entered repayment status, plus cumulative principal payments received by the Trust from borrowers prior to the respective period end. | ||
A claim cancellation occurs if a borrower cures a default prior to payment of the guaranty claim by TERI. The Static Pool Default Rate may vary period-to-period due to a variety of factors, including the number of loans in repayment status, which is affected by seasonality of student loan originations. The Corporation therefore believes that comparisons of the Static Pool Default Rate of various Trusts at similar points in the Trusts’ lives may be more meaningful to investors than either period-to-period comparisons of a Trust’s Static Pool Default Rate or comparisons of a Trust’s Static Pool Default Rate against the Net Default Rate. For example, the Static Pool Default Rate was 0.65% six months after the NCSLT 2006-3 and the NCSLT 2007-3 securitizations, which closed in September 2006 and September 2007, respectively. | ||
The Net Default Rate is calculated as the weighted average for all of the Trusts of: | ||
• the estimated cumulative principal balance, including capitalized interest, of defaulted student loans over the life of a Trust (the “Endpoint Defaults”), minus the estimated cumulative amount of recoveries on defaulted loans1 over the life of the Trust; divided by | ||
• the original principal balance, including capitalized interest, of loans held by the Trust. | ||
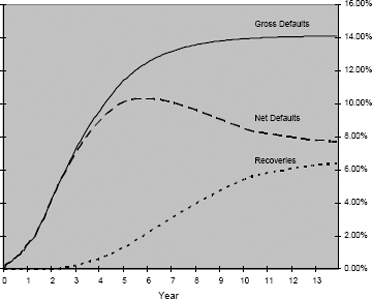
A Trust may have a life of over twenty-four years, based on a lifecycle for student loans that includes borrowers’ in-school deferment, grace, repayment and forbearance periods. Higher levels of loan defaults are generally expected to occur in the early years of a Trust, as loans begin to enter repayment. Recoveries on defaulted loans are expected to lag defaults by months or years, with cumulative recoveries increasing gradually over an extended period of time later in the life of a Trust. As a result, at a single point in time, particularly early in the life of a Trust, a Trust may experience | ||
| 1 | The cumulative amount of recoveries is calculated as the gross recovery amount minus the cost of fees assessed by collection agencies in connection with the recovery. |
U.S. Securities and Exchange Commission
July 29, 2008
Page 4
an actual net default rate that is higher than the estimated endpoint net default rate for that Trust. For the same reason, the Corporation assesses each quarter the actual current net default rates against an expected default timing curve, which reflects the expected speed of defaults over the life of a Trust (the “Default Curve”). The shape of the Default Curve is based in part on the Corporation’s proprietary database of more than 20 years of loan performance information, reflecting data through a variety of economic cycles, and influences the estimated Endpoint Defaults, which in turn influence the Net Default Rate. | ||
For illustrative purposes, the foregoing concepts are shown in the figure below. As shown, the recovery curve tends to lag the gross default curve substantially. As a result, for certain years, the net default rate is actually higher than its endpoint value. | ||
| ||
As discussed on its earnings conference call and in its quarterly report on Form 10-Q for the quarter ended March 31, 2008 (the “Q3 Form 10-Q”), the Corporation maintained its weighted average Net Default Rate at March 31, 2008 for the overall portfolio at 7.68%. The Corporation explained, however, that for Trusts facilitated prior to January 1, 2006, the Corporation adjusted the relevant Default Curves to reflect higher-than-expected default activity at this point in the lives of those Trusts. The adjustment to the Default Curves resulted in a slight increase in the net default rate assumptions for those Trusts. For Trusts facilitated after January 1, 2006, the Corporation decreased its net default rate assumptions to reflect recent collections strategies implemented by the Corporation and an expectation of a better economic cycle as borrowers in the future | ||
U.S. Securities and Exchange Commission
July 29, 2008
Page 5
enter repayment. The effects of the adjustments generally offset one another, with the weighted average Net Default Rate increasing slightly, from 7.6752% to 7.6804%. | ||
Although the weighted average Net Default Rate did not change materially, the net effect of the adjustments resulted in a decrease of approximately $6.1 million in the estimated fair value of the Corporation’s residuals receivable and a decrease of approximately $200,000 in the estimated fair value of the Corporation’s additional structural advisory fees receivable. | ||
To avoid confusion regarding the Static Pool Default Rate, the Corporation will add a footnote to the static pool disclosures included in future filings to indicate the calculation methodology for such rate. | ||
In response to the Staff’s request, the Corporation has supplementally provided the actual gross and net default rates, by Trust and in the aggregate, at March 31, 2008, and the changes in such rates from December 31, 2007. The Corporation delivered such materials pursuant to 17 C.F.R. § 200.83 (“Rule 83”) under separate transmittal letter, respectfully requesting that such materials be treated as confidential information. | ||
2. Noting from the static pool “rolling prepayment rates” table what appear to be significant increases in prepayments rates from the previous measurement date, and your statement in the Form 10-Q on page 12 that you did not change your assumptions regarding assumed average prepayment rates over the life of the trust during the third quarter, supplementally provide the staff with actual prepayment rates at the end of the last 2 quarters (or measurement dates) and the percentage increase between the periods. | ||
Response: | ||
The “Six Month Rolling Prepayment Rates” included in the supplemental presentation filed as exhibit 99.2 to the Q3 Form 10-Q (the “Rolling Prepayment Rate”) is not equivalent to the assumed average annual rate of prepayment underlying the Corporation’s accounting assumptions (the “Prepayment Rate”). The key conceptual difference is that the Rolling Prepayment Rate is a snapshot of prepayments experienced over the preceding six-month period, while the Prepayment Rate is an average over the life of the Trusts. | ||
For purposes of both calculations, however, the prepayment amount for each loan is computed as the difference between the total amount of payments, both principal and interest, received from or on behalf of a borrower and the amount of principal and interest billed to the | ||
U.S. Securities and Exchange Commission
July 29, 2008
Page 6
borrower during the same period. To convert this dollar amount into a rate, we follow the standard practice in the field of dividing these amounts by the dollar amounts that could possibly have been repaid during that period and annualizing the result. This approach results in a rate that is expressed as a “conditional prepayment rate” or “CPR.” The CPR is essentially an estimate of the likelihood that a loan will be prepaid during a period, given that it has not previously defaulted or been prepaid. | ||
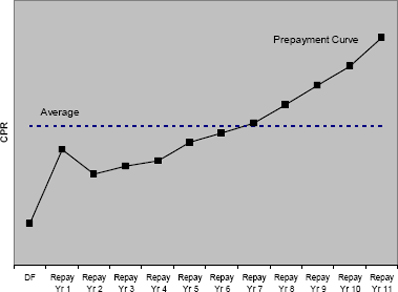
The Rolling Prepayment Rate and the Prepayment Rate can be significantly different at different points in time over the life of a Trust, or any pool of loans, because the prepayment rate for a given cohort of loans will vary with their seasoning. The Corporation disclosed an illustrative prepayment curve in the presentation furnished as exhibit 99.2 to the Corporation’s current report on Form 8-K filed with the SEC on January 31, 2008. | ||
The prepayment curve, reflecting the weighted-average prepayment rate of 8.4%, is shown below. | ||
| ||
The prepayment curve above shows that a loan in deferment is expected to have a low likelihood of being prepaid. A loan is expected to have a higher likelihood of being repaid during the first, compared to the second, year of repayment. However, after the second year, as a loan becomes more seasoned, the likelihood of a prepayment is expected to increase further, as borrowers increase their earnings power and their ability to partially or fully prepay their loans, or as they establish better credit and are offered more opportunities to consolidate their student loan. | ||
U.S. Securities and Exchange Commission
July 29, 2008
Page 7
When this seasoning-based behavior assumption is applied to a cohort of loans whose seasoning is increasing in time, the cohort Rolling Prepayment Rate would be expected to be very low while all the loans were in deferment. As the cohort seasons, however, the Rolling Prepayment Rate would be expected to increase. The Corporation’s assessment of the Trusts’ actual prepayment experience has confirmed its expectations, with the additional complication that each Trust may be viewed as having multiple cohorts of loans (with different seasoning) in the single trust. | ||
As disclosed in the Q3 Form 10-Q, the Corporation did not make adjustments to either the average annual prepayment rate expected over the life of the Trusts of 8.4% or the shape of the prepayment curve. The Corporation’s analysis showed that average annual prepayment rates may exceed 8.4% in the later years of certain Trusts, although the rolling six-month prepayment rates generally decreased in six out of the nine months ended March 31, 2008, making it difficult to discern a trend. In addition, a prepayment that occurs at the end of a Trust’s life has less effect on the Trust’s cash flows than a prepayment that occurs in the early years of a Trust. | ||
The Corporation believes that comparisons of the Rolling Prepayment Rate of various Trusts at similar points in the Trusts’ lives may be more meaningful to investors than either period-to-period comparisons of a Trust’s Rolling Prepayment Rate or comparisons of a Trust’s Rolling Prepayment Rate against the Prepayment Rate. The Corporation presented the Rolling Prepayment Rate table, and the comparative graph, to assist investors in their comparison of Trusts at similar points in their respective lives. The Rolling Prepayment Rate is intended to provide investors with data that eliminates “noise” that may be observed in monthly or quarterly periods but provides more timely indications of performance trends than would be observed over an annual period. | ||
To avoid confusion regarding the Rolling Prepayment Rate, the Corporation will add a footnote to the supplemental disclosures included in future filings to indicate the calculation methodology for such rate. | ||
In response to the Staff’s request, the Corporation has supplementally provided the prepayment rates as of December 31, 2007 and March 31, 2008. The Corporation delivered such materials pursuant to Rule 83 under separate transmittal letter, respectfully requesting that such materials be treated as confidential information. | ||
U.S. Securities and Exchange Commission
July 29, 2008
Page 8
| Financial Statements | ||
| Unaudited Condensed Consolidated Balance Sheets, page 1 | ||
| Goodwill | ||
3. Please provide us a comprehensive discussion (timing, description of reporting units, etc.) of your most recent goodwill impairment tests and consider the guidance in paragraphs 16-35 of SFAS 142 as your formulate your response. In your response, please: | ||
• Provide detailed information on how you determined the fair value of each of your reporting units including a summary schedule of your SFAS 142, step 1 test results and an analysis of the results; | ||
• Tell us how you considered the relationship between your quoted common stock price and your reported book value and net tangible asset value as of year-end and latest interim period and whether or not there is an “implied” impairment of assets; | ||
• Tell us how you considered whether you were required to test for goodwill impairment in 2008 due to current market conditions, the decrease in your stock price, published media reports detailing the financial condition of major customers, third party borrower default guarantors and any other applicable factor(s) in paragraph 28 of SFAS 142; | ||
• Tell us whether you have had any discussions with third parties regarding offers to purchase any particular group of assets and how any discussions may have influenced your decision as to retest goodwill or recognize an impairment at any particular balance sheet date; | ||
• Tell us what other information would have been required for you to conclude that an impairment loss was probable and reasonable estimatable at year-end and the latest interim period if you conclude that an impairment does not currently exist; | ||
• Discuss what involvement your independent auditors have had regarding comments we have raised on this issue, including any consultation at the national office level. | ||
Response: | ||
Background | ||
On June 20, 2001, the Corporation and The Education Resources Institute (“TERI”) entered into a purchase and sale agreement that provided for the Corporation to acquire TERI’s loan processing | ||
U.S. Securities and Exchange Commission
July 29, 2008
Page 9
operations, including its historical database and workforce in place. By acquiring these assets, the Corporation significantly expanded its loan operations, risk management capabilities and technology infrastructures, and acquired the workforce necessary to originate private student loans on behalf of its lender clients. Goodwill was recorded as the excess of the purchase price paid over the fair market value of net assets acquired. The fair value of the workforce-in-place was based upon an appraisal obtained from an independent third-party. The Corporation recognized goodwill of approximately $3.2 million. | ||
On November 30, 2006, the Corporation acquired Union Federal Savings Bank (“UFSB”), a federally chartered savings bank with a single branch in North Providence, Rhode Island. The Corporation acquired UFSB for strategic reasons, including the ability to originate its own proprietary private student loans, and ultimately, to expand the available product offerings to borrowers and their parents beyond private student loans. Goodwill was recorded as the excess of the purchase price paid over the fair market value of net assets acquired. The Corporation recognized goodwill of approximately $1.7 million. | ||
June 30, 2007 Impairment Analysis | ||
The Corporation considers UFSB a reporting unit separate from the Corporation for purposes of conducting its periodic reviews of goodwill impairment. At June 30, 2007, the Corporation determined that there was no impairment of goodwill with regard to either the Corporation or UFSB. | ||
At June 30, 2007, the market capitalization of the Corporation was approximately $3.55 billion, compared to a consolidated book value of $842 million. The Corporation’s net income for the fiscal year ended June 30, 2007 totaled $371 million, representing a 44% return on ending equity, and the Corporation’s operating margins were a robust 71% for the fiscal year. In addition, the securitization markets continued to provide the liquidity necessary to support transactions by issuers. As a result, the Corporation concluded that there was no impairment of the Corporation’s goodwill as of June 30, 2007. | ||
With regard to the UFSB reporting unit, stockholder’s equity was $11.3 million at June 30, 2007, and the acquisition had closed only seven months earlier. Although UFSB’s profitability had been approximately breakeven for the first seven months following the acquisition, originations of private student loans had not yet begun in earnest as the summer lending peak season had not yet started. The performance of UFSB had not deviated from the projections of performance anticipated at the time of purchase. At June 30, 2007, | ||
U.S. Securities and Exchange Commission
July 29, 2008
Page 10
UFSB had approximately $24 million of education loans on its balance sheet and, in fact, had sold approximately $9 million of loans in a securitization that closed in June 2007. UFSB received fees totaling approximately $452,000 as a result of the securitization. As a result, the Corporation determined that no adjustment was necessary to UFSB’s goodwill as of June 30, 2007. | ||||||
March 31, 2008 Impairment Assessment | ||||||
In light of the continued deterioration of the debt capital markets and Corporation’s inability to access the securitization markets since September 2007, the Corporation performed an evaluation of the potential impairment of goodwill as of March 31, 2008. | ||||||
The overall approach applied to the Step 1 goodwill impairment test was based on the Corporation’s market capitalization. The price per share of the Corporation’s common stock (the “Common Stock”) ranged from $7.41 to $12.15, and averaged $9.11 per share, over the month of March 2008. The closing price per share of the Common Stock was $7.46 at March 31, 2008. The Corporation’s market capitalization, based on the closing price per share of Common Stock and the number of shares of Common Stock outstanding, was approximately $737.6 million at March 31, 2008. | ||||||
Given the interdependency of the reporting units and the recorded amount of goodwill, the Corporation believed a reasonable approach to determine the fair value of the reporting units was to allocate the overall market capitalization determined above based on the relative net carrying value of each reporting unit as follows: | ||||||
| FMC Reporting Unit | UFSB Reporting Unit | |||||||
Carrying value | $ | 583,660 | $ | 110,001 | ||||
Allocated market capitalization | 620,631 | 116,969 | ||||||
At March 31, 2008, the Corporation’s consolidated book value was $693.6 million. Based on the results above, no implied goodwill impairment was noted at the completion of Step 1 testing and, therefore, no further impairment analysis was necessary for the interim period ended March 31, 2008. | ||||||
Impairment Factors to Consider at Year End | ||||||
Although the Corporation concluded that no goodwill impairment adjustment was required at the end of the third fiscal quarter, the Corporation will consider the following factors, among others, in determining what, if any, adjustment may be required for the fiscal year ended June 30, 2008: | ||||||
• The price of the Common Stock has fallen below $3.00 per share as of June 30, 2008, which reduced the Corporation’s market capitalization to less than $300 million; | ||||||
U.S. Securities and Exchange Commission
July 29, 2008
Page 11
• TERI, which had been the third-party guarantor of student loan programs facilitated by the Corporation, filed a petition for reorganization in bankruptcy on April 7, 2008. TERI’s bankruptcy has resulted in termination of a significant number of client agreements. In addition, the “master” agreements between the Corporation and TERI were terminated in June 2008, including a master services agreement pursuant to which the Corporation received processing fees from TERI. The Corporation estimates that it will receive approximately $125 million of processing fees from TERI in fiscal 2008, compared to $134.8 million in fiscal 2007; | ||||
• The securitization market for private student loans continues to be impaired, and the Corporation is aware of only one private student loan transaction in the securitization marketplace since the Corporation’s last transaction in September 2007; and | ||||
• The Corporation has significantly reduced its cost structure, including a 60% reduction in the Corporation’s workforce over the past six months. | ||||
Other Points Requiring a Response | ||||
The Corporation continually evaluates opportunities to monetize its assets. It is not expected that these opportunities, if consummated, would have an impact on the impairment analysis of goodwill. | ||||
KPMG LLP, the Corporation’s external auditors, have received a copy of your comment letter as well as this response. They have advised the Corporation that they have not shared your letter or our response with their national office at this point in time. | ||||
| If you require additional information, please do not hesitate to contact Greg Woods of the Corporation at (617) 638-2176, or the undersigned at (617) 638-2052. | ||||
| Very truly yours, | ||||
/s/ John A. Hupalo | ||||
| John A. Hupalo | ||||
| Senior Executive Vice President and Chief Financial Officer | ||||
U.S. Securities and Exchange Commission
July 29, 2008
Page 12
cc: Jack L. Kopnisky | ||||
Peter B. Tarr, Esq. | ||||
Gregory M. Woods, Esq. |