UNITED STATES
SECURITIES AND EXCHANGE COMMISSION
Washington, DC 20549
Form 10-K
(Mark One)
| | x | ANNUAL REPORT PURSUANT TO SECTION 13 OR 15(d) OF THE SECURITIES EXCHANGE ACT OF 1934 |
For the fiscal year ended June 30, 2013
OR
| | ¨ | TRANSITION REPORT PURSUANT TO SECTION 13 OR 15(d) OF THE SECURITIES EXCHANGE ACT OF 1934 |
For the transition period from to
Commission file number: 001-31825
THE FIRST MARBLEHEAD CORPORATION
(Exact name of registrant as specified in its charter)
| | |
Delaware (State or other jurisdiction of
incorporation or organization) | | 04-3295311 (I.R.S. Employer
Identification No.) |
| |
The Prudential Tower 800 Boylston Street, 34th Floor Boston, Massachusetts (Address of principal executive offices) | | 02199-8157 (Zip Code) |
Registrant’s telephone number, including area code:(800) 895-4283
Securities registered pursuant to Section 12(b) of the Act:
| | |
Title of each class | | Name of each exchange on which registered |
| Common Stock, $0.01 par value | | New York Stock Exchange |
Securities registered pursuant to Section 12(g) of the Act:None
Indicate by check mark if the registrant is a well-known seasoned issuer, as defined in Rule 405 of the Securities Act. Yes¨ Nox
Indicate by check mark if the registrant is not required to file reports pursuant to Section 13 or Section 15(d) of the Act. Yes¨ Nox
Indicate by check mark whether the registrant (1) has filed all reports required to be filed by Section 13 or 15(d) of the Securities Exchange Act of 1934 during the preceding 12 months (or for such shorter period that the registrant was required to file such reports), and (2) has been subject to such filing requirements for the past 90 days. Yes x No ¨
Indicate by check mark whether the registrant has submitted electronically and posted on its corporate Web site, if any, every Interactive Data File required to be submitted and posted pursuant to Rule 405 of Regulation S-T (§232.405 of this chapter) during the preceding 12 months (or for such shorter period that the registrant was required to submit and post such files). Yes x No ¨
Indicate by check mark if disclosure of delinquent filers pursuant to Item 405 of Regulation S-K (§229.405) of this chapter is not contained herein, and will not be contained, to the best of registrant’s knowledge, in definitive proxy or information statements incorporated by reference in Part III of this Form 10-K or any amendment to this Form 10-K.x
Indicate by check mark whether the registrant is a large accelerated filer, an accelerated filer, a non-accelerated filer or a smaller reporting company. See the definitions of “large accelerated filer,” “accelerated filer” and “smaller reporting company” in Rule 12b-2 of the Exchange Act.
| | | | | | |
| Large accelerated filer ¨ | | Accelerated filer x | | Non-accelerated filer ¨ (Do not check if a
smaller reporting company) | | Smaller reporting company ¨ |
Indicate by check mark whether the registrant is a shell company (as defined in Rule 12b-2 of the Act). Yes ¨ No x
The aggregate market value of the voting and non-voting common equity held on December 31, 2012 by non-affiliates of the registrant (without admitting that any person whose shares are not included in the calculation is an affiliate) was approximately $64,673,019 based on the last reported sale price of the common stock on the New York Stock Exchange on December 31, 2012. For the purposes of the immediately preceding sentence, the term “affiliate” refers to each director, executive officer and greater than 10% stockholder of the registrant as of December 31, 2012 and ownership excludes shares issuable upon vesting of restricted stock units and exercise of outstanding stock options.
Number of shares of the registrant’s common stock outstanding as of September 11, 2013: 112,748,663.
DOCUMENTS INCORPORATED BY REFERENCE
The registrant intends to file a proxy statement pursuant to Regulation 14A within 120 days of the end of the fiscal year ended June 30, 2013. Pursuant to Paragraph G(3) of the General Instructions to Form 10-K, information required by Items 10, 11, 12, 13 and 14 of Part III have been omitted from this report (except for information required with respect to our executive officers and code of ethics, which is set forth under “Executive Officers of the Registrant” and “Code of Ethics” in Part I of this annual report, respectively) and are incorporated by reference to the definitive proxy statement to be filed with the Securities and Exchange Commission.
THE FIRST MARBLEHEAD CORPORATION
ANNUAL REPORT ON FORM 10-K
For the Fiscal Year Ended June 30, 2013
TABLE OF CONTENTS
FIRSTMARBLEHEAD and MONOGRAM are registered service marks and PREPGATE is a service mark of The First Marblehead Corporation. BORROWSMART is a registered service mark of Tuition Management Systems LLC. UNION FEDERAL is a registered service mark of Union Federal Savings Bank. VOLTA is a service mark of Cology LLC. All other trademarks, service marks or trade names appearing in this annual report are the property of their respective owners.
In addition to historical information, this annual report includes forward-looking statements within the meaning of Section 21E of the Securities Exchange Act of 1934, as amended, or the Exchange Act, and Section 27A of the Securities Act of 1933, as amended, or the Securities Act. For this purpose, any statements contained herein regarding our strategy, future operations and products, financial performance and liquidity, future funding transactions, projected costs, projected loan portfolio performance, future market position, prospects, plans and outlook of management, and proceedings related to our federal and state income tax returns, including any challenge to the tax refunds previously received as a result of the audit being conducted by the Internal Revenue Service, other than statements of historical facts, are forward-looking statements. The words “anticipates,” “believes,” “estimates,” “expects,” “intends,” “may,” “observe,” “plans,” “projects,” “would,” and similar expressions are intended to identify forward-looking statements, although not all forward-looking statements contain these identifying words. We cannot guaranty that we actually will achieve the plans,
intentions or expectations expressed or implied in our forward-looking statements, which involve risks, assumptions and uncertainties. There are a number of important factors that could cause actual results, timing of events, levels of activity or performance to differ materially from those expressed or implied in the forward-looking statements we make. These important factors include our “critical accounting estimates” described in Item 7 of this annual report, and factors including, but not limited to, those set forth under the caption “Risk Factors” in Item 1A of this annual report. Although we may elect to update forward-looking statements in the future, we specifically disclaim any obligation to do so, even if our estimates change, and readers should not rely on those forward-looking statements as representing our views as of any date subsequent to September 13, 2013.
PART I
Unless otherwise indicated, or unless the context of the discussion requires otherwise, we use the terms “we,” “us,” “our” and similar references to refer to The First Marblehead Corporation and its subsidiaries, on a consolidated basis. We use the terms “First Marblehead” and “FMD” to refer to The First Marblehead Corporation on a stand-alone basis. We use the term “education loan” to refer to private education loans that are not guaranteed by the federal government. Our fiscal year ends on June 30, and we identify our fiscal years by the calendar years in which they end. For example, we refer to the fiscal year ended June 30, 2013 as “fiscal 2013.”
Overview
We are a specialty finance company focused on the education financing marketplace in the United States. We provide loan programs on behalf of our lender clients for K-12, undergraduate and graduate students and for college graduates seeking to refinance private education loan obligations, as well as tuition planning, tuition billing, refund management and payment technology services. We offer a fully integrated suite of services through our Monogram® loan product service platform, which we refer to as our Monogram platform, as well as certain services on a stand-alone, fee-for-service basis. We partner with lenders to design and administer education loan programs through our Monogram platform, which are typically school-certified. They are designed to be marketed through educational institutions or to prospective borrowers and their families directly and to generate portfolios intended to be held by the originating lender or financed in the capital markets. We also offer a number of other services on a stand-alone, fee-for-service basis in support of our clients, including retail banking, loan origination, portfolio management and securitization services.
On October 19, 2012, we acquired a substantial portion of the operating assets, and assumed certain liabilities, of Cology, Inc. and its affiliates. We refer to Cology, Inc. and its affiliates as the Cology Sellers. We refer to the FMD subsidiary that acquired a substantial portion of the operating assets of the Cology Sellers as Cology LLC. Through Cology LLC, we provide loan processing services to approximately 270 credit union and other lender clients. Our consolidated financial statements for fiscal 2013 reflect revenues and expenses of Cology LLC since the date of acquisition.
Our product and service offerings are part of a change in our revenue model that we have been implementing since fiscal 2009 with a focus on fee-based revenues. Our long-term success depends on the continued development of our four principal revenue lines:
| | • | | Partnered lending—We provide customized Monogram-based education loan programs for lenders who wish to hold originated portfolios to maturity. We may provide credit enhancements by funding participation interest accounts, which we refer to as participation accounts, or, in the case of FMD’s subsidiary Union Federal Savings Bank, which we refer to as Union Federal®, deposit accounts, to serve as a first loss reserve for defaulted program loans. In consideration for funding participation accounts, we are entitled to receive a share of the interest income generated on the loans. We are paid for our origination and marketing services at the time approved education loans are disbursed and receive monthly payments for portfolio management services, credit enhancement and administrative services throughout the life of the loan. |
| | • | | Banking services—Union Federal offers traditional retail banking products, including residential and commercial mortgages, time deposits and money market demand accounts, on a stand-alone basis. In addition, Union Federal generates additional revenues by originating Monogram-based education loan portfolios, subject to regulatory conditions, with the intent of holding them to maturity. |
| | • | | Capital markets—Our capital markets experience coupled with our loan performance database and risk analytics provide specialized insight into funding options available to our lender clients. We have a right of first refusal should one of our partner lenders wish to sell some or all of its education loan portfolio |
1
| | prior to maturity. In addition to traditional asset-backed securitizations, funding options may also include whole loan sales or other financing alternatives. We can also earn net interest income by retaining a portion of the equity in any of these transactions. |
| | • | | Fee-for-service—Loan origination, portfolio management, analytical and structuring services, tuition billing and payment processing and refund management services are each available on a stand-alone, fee-for-service basis. We offer outsourced tuition planning, tuition billing, refund management and payment technology services for universities, colleges and secondary schools through FMD’s subsidiary Tuition Management Systems LLC, which we refer to as TMS. TMS provides such services on behalf of over 700 educational institutions. Through Cology LLC, we earn fees for the processing of education loans on behalf of its approximately 270 credit union and other lender clients. |
Education loans are funded by private sector lenders and are not guaranteed by the federal government. They are intended to be used by borrowers who have first utilized other sources of education funding, including family savings, scholarships, grants and federal and state loans. For the 2011-2012 academic year, we believe that there was a “funding gap” in post-secondary education in the United States of approximately $141 billion between the costs of attendance and these sources of education funding, based on information from the National Center for Education Statistics and The College Board. We believe that enrollment in post-secondary education institutions will continue to increase over the next several years, as will costs of attendance. We also believe that education loan products will continue to be necessary for students and their families after applying family savings and exhausting all available scholarships, grants and federal and state loans.
The lifecycle of an education loan, which can be over 20 years long, consists of a series of processes, many of which are highly regulated, and involves many distinct parties. As a result, the activities associated with designing, implementing, financing and administering education loan programs are complex, resource intensive and costly. We offer specialized knowledge, experience and capabilities to assist clients in participating in the education loan market. Our service offerings are intended to serve a range of potential client needs throughout the life-cycle of an education loan. For example, we can assist clients in developing all aspects of an education loan program based on our Monogram platform, or we can provide tailored loan origination, portfolio management and other services to meet their specific needs. In addition, through TMS, we provide students and their families with the opportunity to structure tuition payment plans that meet their financial needs while providing a broad array of tuition payment options.
Our clients in the past have typically been lenders that desired to supplement their existing federal education loan or other consumer lending programs with a private education loan offering. In response to legislative changes that eliminated the Federal Family Education Loan Program, or FFELP, as of July 2010, many lenders have re-evaluated their business strategies related to education lending. We believe that these legislative changes as well as general economic conditions, capital markets disruptions and the declining credit performance of consumer-related loans, including education loans, have contributed to an overall reluctance by many lenders to focus on their education lending business segments. As a result, we believe that there is significant unmet demand for education loans and generally less competition than previously in addressing that demand. As market conditions for other consumer finance segments improve, we believe that more lenders will focus on education lending and consider education loans as part of an array of consumer lending products offered to their customers. One of our primary goals is to educate national and regional lenders on the opportunity to provide education loans in a manner that meets their desired risk control and return objectives. A related challenge, although growth in our partnered lending activities is not contingent upon it, is to successfully finance education loans generated through our Monogram platform through capital market transactions.
Our near-term financial performance and future growth depend, in large part, on growing our client base by successfully marketing our Monogram platform, TMS services and Cology LLC services while transitioning from our prior business model (see “—Prior Business Model” below) to one that is based on fee revenues.
2
Current Business Model
Since the beginning of fiscal 2009, we have significantly refined our service offerings and added fee-for-service offerings. During fiscal 2010, we completed the development of our Monogram platform, including an enhanced application interface, an expanded credit decisioning model and additional reporting capabilities. We continue to incorporate refinements to our Monogram platform. During fiscal 2011, we began providing services for two lender clients related to school-certified education loan programs, including originating education loans, based on our Monogram platform and began offering tuition planning, tuition billing and payment technology services through TMS. During fiscal 2012, we began performing services for Union Federal related to school-certified education loan programs based on our Monogram platform, including a K-12 loan program, and we began offering refund management services to education institutions and students through TMS. In June 2012, we launched a Monogram-based loan program with a new lender client and in August 2012, we launched a Monogram-based loan consolidation program with an existing client. In October 2012, we began providing loan processing services to credit union and other lender clients through Cology LLC.
Monogram Platform
Our Monogram platform integrates our program design, marketing support, loan origination and portfolio management service offerings. It enables lenders to offer consumers education loans with competitive terms and clear pricing alternatives, with product options based on the credit profiles of qualified applicants. Specifically, a lender can customize the range of loan terms offered to their qualified applicants, such as repayment options, repayment terms and borrower pricing.
The product can be structured to offer lenders and other financial institutions a “make and hold” or “make and sell” loan program. In “make and hold” loan programs, lenders finance the education loans on their balance sheet and generally intend to hold the loans through scheduled repayment, prepayment or default. In “make and sell” loan programs, lenders intend to hold the education loans on their balance sheet for some limited period of time before disposing of the loans in a capital market transaction or whole loan sale. We believe that the education loans generated through our Monogram platform will generally have shorter repayment periods, an increased percentage of borrowers making payments while in school, higher cosigner participation rates, an overall better credit profile and lower estimated default rates in each case when compared to loan products we previously facilitated.
We designed our Monogram platform to generate recurring revenue with less dependence on the securitization market and third-party credit enhancements. In connection with our Monogram platform, we have invested, and may continue to invest, specified amounts of capital as a credit enhancement feature to various lenders’ loan programs. The amount of any contribution offered to a particular lender would be determined by the anticipated size of the lender’s program, the underwriting guidelines of the program and the particular terms of our business relationship with the lender. We believe this approach provides assurances to lenders that we are committed to the quality of our new proprietary scoring models and risk mitigation and pricing strategies. In connection with certain of our lender clients’ Monogram-based loan programs, we have provided credit enhancement by funding participation accounts or, in the case of Union Federal, deposit accounts, to serve as a first-loss reserve for defaulted program loans. We have made initial deposits toward our credit enhancement arrangements and agreed to provide periodic supplemental deposits, up to specified limits, during the disbursement periods under our loan program agreements based on the credit mix and volume of disbursed program loans and adjustments to default projections, if any, for program loans. To the extent that outstanding loan volume decreases as a result of repayment, or if actual loan volumes or default experience are less than reflected in our funded amounts, we are eligible to receive periodic releases of funds. The timing and amount of releases, if any, from the participation accounts are uncertain and vary among the loan programs. In consideration for funding participation accounts, we are entitled to receive a share of the interest income generated on the loans.
As part of our Monogram platform, we monitor the performance of loan accounts after origination and tailor risk mitigation strategies according to the performance patterns of those accounts. We have built a flexible infrastructure to support our portfolio management strategy, which requires extensive operational and data
3
integration among the loan servicer, multiple default prevention and recovery agencies and us. Finally, we provide extensive customer service to each client, including ongoing analysis and comprehensive reporting of loan performance data.
We offer the following fully integrated suite of services through our Monogram platform or as stand-alone services tailored for our clients’ specific needs:
Program Design
Education loans are a complex asset class that requires sophisticated analytical capabilities combining effective, quantitative underwriting, responsible marketing and dynamic portfolio management. At the core of our Monogram platform resides over 20 years of education loan performance data that we have used to create a suite of proprietary risk models, including proprietary underwriting, fraud and collectability scorecards. We believe that these risk models can be used throughout the lifecycle of an education loan to manage risk, optimize performance and potentially improve profitability.
Lenders face an array of choices in attempting to satisfy their strategic and financial goals, as well as the needs of their borrowers. In designing education loan programs, the factors that lenders generally consider include:
| | • | | Borrower creditworthiness and eligibility criteria; |
| | • | | Loan limits, including minimum and maximum loan amounts on both an annual and aggregate basis; |
| | • | | Interest rates, including the frequency and method of adjustment; |
| | • | | Amount of fees charged to the borrower, including origination, guaranty and late fees; |
| | • | | Repayment terms, including maximum repayment term, minimum monthly payment amounts, rate reduction incentive programs and deferment and forbearance options; |
| | • | | Appropriate credit enhancement levels to ensure repayment of defaulted principal and interest payments; |
| | • | | Loan servicing, default management and collection arrangements; |
| | • | | Asset financing or loan disposition alternatives; and |
| | • | | Legal compliance with numerous federal laws and regulations as well as numerous state laws that replicate and, in some cases, expand upon, the requirements of federal laws. |
We help lender clients design their education loan programs and customize each program for our lender clients in order to satisfy their particular needs. Although we assist lenders in selecting the underwriting criteria to be used in their loan programs, each lender has ultimate control over, and responsibility for, the selection of their underwriting criteria, and we are obligated to comply with the lender’s criteria.
Marketing Support
While creating their loan marketing programs, lenders face choices in the channels and media available to them to reach potential borrowers, including financial aid offices, online advertising, direct mail campaigns,e-mail campaigns and print advertising. As part of our Monogram platform, we can provide marketing support services for a fee based on loan volume disbursed, depending on the level of services provided to each client. With our focus on school-certified loan programs, we also believe that financial aid offices and other school contacts are, and will continue to be, an important distribution channel. In both fiscal 2012 and fiscal 2011, we expanded our national sales team to provide sales and school relationship management in support of loan programs based on our Monogram platform, and we believe that TMS’ relationships with educational institutions and potential borrowers will otherwise complement our distribution strategy. We also believe that there is an opportunity to cross-sell aspects of our Monogram platform on a stand-alone basis to Cology LLC’s credit union clients.
4
Loan Origination
As part of our Monogram platform, we offer loan origination services for a fee based on either loan volume disbursed or applications processed, depending on the particular terms of the lender client’s contract. We have developed proprietary processing platforms, applications and infrastructure, supplemented by customized vendor solutions, for use in providing loan processing services.
Prospective and current students and their families confront a complicated process when applying for financial aid. We provide online resources and a staff of customer service personnel who understand the terms of our clients’ education loan programs and the financial aid process as a whole. In addition to a customer service function, we can provide personnel to respond to requests for loan materials and loan applications.
Once an applicant submits an application for processing, our customized credit decision software applies parameters that have been configured for each lender client’s specific program and analyzes, often within seconds, the submitted application. This analysis results in a credit decision and also generates specific loan terms offered by the lender client, aligning product options made available to qualified applicants with their credit risk. Once a loan application is complete, we communicate an initial determination to the applicant(s), informing him or her whether the application has passed the credit analysis, been rejected or is in review. Once a loan application passes the credit analysis, and the applicant has selected his or her loan terms from the available options, we generate a credit agreement, which is a legal contract between the applicant, cosigner, if any, and lender that contains the terms and conditions of the loan for the applicant based on lender-specific templates.
Once we have obtained all applicant data, including the signed credit agreement, required certifications from the school or applicant, and any required income or employment verification, we approve the application. We refer to the education loan at this point in the process as having been “facilitated.” Once we disburse loan funds on behalf of the lender, we refer to the loan as fully or partially “disbursed.”
In performing our loan origination services, we are required to comply with applicable laws and regulations relating to loan documentation, disclosure and processing, including consumer protection disclosures. The lenders with which we work generally assume responsibility for compliance with federal and state laws regarding the forms of loan documentation and disclosure, and we are generally responsible for populating such forms in accordance with the program guidelines. We are also responsible for maintaining processes and systems that properly execute the lenders’ origination requirements and administer their credit agreement templates and required disclosures. In addition, we may deliver each lender’s privacy policy, and prepare and deliver disclosures required by the Truth-in-Lending Act, or TILA, as well as various state law disclosures, to borrowers.
We also monitor developments in state and federal requirements for loan processing and implement changes to our systems and processes based on our analysis and input we receive from clients and industry groups.
Portfolio Management
Once loans are disbursed, holders of the loans may outsource the management of such loans to third-party service providers, such as us. In our role as portfolio manager, we monitor the performance of portfolio vendors, including both loan servicers and collection agencies. For portfolio management services, we charge a fee generally based on the aggregate principal balance of education loans under management for the client.
We use a multi-faceted approach to portfolio management. To maximize the performance of each portfolio, we receive updated credit bureau data on each borrower and each cosigner each quarter and use it in combination with monthly performance data and experiential data to re-evaluate the risk profile of the portfolio. We use our proprietary risk models to develop portfolio management strategies and determine the level of resources we apply to each account, including when the account is outsourced to a collection agency and which agency is used in that process. For example, certain collection agencies may specialize in early-stage delinquencies while others may specialize in the collection of defaulted loans. This process requires a highly integrated infrastructure among the loan servicers, collection agencies and us and involves extensive data analysis on each account as it moves through its repayment lifecycle. We believe this approach allows us to manage and control losses over time.
5
We work with a network of vendors to manage education loans on behalf of our clients. The Pennsylvania Higher Education Assistance Agency, also known as AES and which we refer to as PHEAA, provides servicing of a majority of the loans we facilitate. Generally, loan servicers establish and maintain contact with borrowers whose loans are current and collection agencies establish and maintain contact with borrowers whose loans are delinquent or defaulted. Duties of the portfolio management vendors include, for example, preparing repayment invoices, payment collection, maintaining borrower payment records, responding to borrower inquiries and reporting information to the loan owner. In addition, portfolio vendors may perform skip-tracing services, make collections calls and conduct other collections activities, and report borrower delinquencies or defaults to credit bureaus.
Loan Securitization
Although some lenders originate loans and then hold them for the life of the loan, other lenders originate and then seek to dispose of the loans, either through a sale of whole loans or by means of a securitization. Whole loans can be purchased by other financial institutions or by entities that serve to warehouse the loans for some period of time, pending permanent financing, including loan securitization. In the typical securitization process, a special purpose entity obtains education loans from the originating lenders or their assignees, which relinquish to the special purpose entity their ownership interest in the loans. The debt instruments issued by the special purpose entity to finance the purchase of these education loans are obligations of the special purpose entity, not the originating lenders or their assignees. Through both the structure of those asset-backed securities, or ABS, as well as the composition of the underlying portfolio, risk can be distributed in a manner which may appeal to potential ABS investors.
Securitizations have historically provided several benefits to lenders and developed into a diverse, flexible funding mechanism for the financing of private education loan pools. Among other things, securitization enabled lender clients to sell potentially otherwise illiquid assets in both the public and private securities markets, and to limit credit and interest rate risk. Although this flexibility added to the complexity of the funding process, it also enabled the originating lender to reduce the cost of financing and recycle capital, thereby improving the economics of the loan program and improving loan terms by passing incremental savings back to the borrower.
Structuring securitizations requires a high level of specialized knowledge and experience regarding both the capital markets generally, and the borrower repayment and default characteristics specifically. The process of issuing ABS in a securitization requires compliance with state and federal securities laws, as well as coordination among originating lenders, servicers, securities rating agencies, attorneys, securities dealers, structural advisors, trust management providers and auditors.
We have structured and facilitated 38 securitizations, consisting entirely of education loans, involving debt issuances in the aggregate original principal amount of $17.5 billion. We have securitized loan pools using various financing structures, including both public offerings registered with the Securities and Exchange Commission, or SEC, and private placements, and have utilized various ABS, including borrowings from commercial paper conduits, London Interbank Offered Rate, or LIBOR, floating rate notes, auction-rate debt and senior-subordinate and third-party credit enhanced debt.
We believe that our capital markets experience gives us specialized insight into funding options available to our lender clients. In addition, the extensive database provided by our education loan repayment statistics dating back to 1986 has helped us in the past to optimize the financing of the education loan pools our clients generated. We have used this data to estimate the default, recovery and prepayment characteristics of the different types of loans that constitute a loan pool. We believe that our experience and historical data will assist us in future discussions with rating agencies, insurance providers, underwriters and securities investors relating to financing structures and terms.
We believe that conditions in the capital markets generally improved in fiscal 2013 and fiscal 2012 compared to recent years. In particular, investors in ABS demonstrated increased interest in ABS backed by private education loans, resulting in a reduction in credit spreads applicable to these securities. Additionally, during the third quarter of fiscal 2013, a private education loan ABS issuance by a third party included a
6
subordinate bond, the first such bond to be included in a new issuance since 2007. The inclusion of this subordinate bond served to increase the advance rate, or amount of funds raised as a percentage of the collateral in the issuance. We believe that these trends during fiscal 2013 indicate that the economics of private education loan ABS are starting to become more attractive to issuers in the private education loan securitization marketplace. However, we have not completed a securitization transaction since fiscal 2008 and if we execute a financing transaction in the capital markets, the structure and economics of any such transaction may be materially different from prior transactions that we have sponsored. Such differences may include lower revenues as a result of comparatively wider credit spreads and lower advance rates.
TMS
TMS offers outsourced tuition planning, tuition billing, refund management and payment technology services for universities, colleges and secondary schools. TMS provides such services on behalf of over 700 educational institutions. Through BorrowSmart®, TMS helps students and their families manage education costs by developing sustainable, low cost tuition payment strategies. In addition, TMS provides solutions to schools for the collection and processing of tuition payments and data. These diverse product and service offerings are marketed as the “TMS Campus Advantage.” These services include:
| | • | | Early affordability planning and counseling delivered through multiple channels, which allows students and their families to review and consider a series of education payment options that minimize borrowing through the utilization of payment plans and school specified loan products; |
| | • | | Flexible payment plans, which aggregate school payments into a single reporting and disbursement interface for schools; |
| | • | | Comprehensive tuition billing and presentment (paper-based and electronic), which maximize the effectiveness of paper and electronic bills for the student and the school; |
| | • | | Payment processing, which allows schools to provide choices to their students and their families through multiple channels and methods; |
| | • | | Student account management through the TMS Student Account Center, a web-based portal that reflects school branding, supports multi-channel access to TMS’ product suite and is tightly integrated with the school’s student information system, allowing schools to outsource billing and payment processing services to TMS while remaining the “system of record;” and |
| | • | | Refund management services, which facilitate for schools the process of disbursing student account credit balances that occur when payments, loan proceeds and/or financial aid credits exceed charges to the student account. The services allow schools to offer three refund choices: prepaid cards, ACH direct deposit and checks, allowing the schools to streamline their refund operations while reducing their overall disbursement expenses and enhancing the customer experience. |
TMS earns enrollment and transaction-based fees from students and families that participate in its various payment plans. Enrollment fee revenue is recognized over the period in which services are provided to customers. Transaction-based fees are recognized in the period the transaction takes place. TMS also earns fees from schools for various billing, payment processing, refund management, implementation and subscription fees. These fees are recognized over the period in which the services are provided. We believe that the size and quality of TMS’ customer base provides an opportunity to expand our school relationships and offer diversified products and services that complement our education finance and loan processing capabilities, including K-12 loan programs, as well as serving as a source of significant recurring revenue.
Cology LLC
Cology LLC is a leading supplier of outsourced loan origination, servicing and technology solutions to education loan providers, including credit unions, community, regional and national banks and educational institutions. Through its services, Cology LLC provides easy market entry options for existing and new
7
providers, targeted growth strategies to help organizations expand their student lending businesses and customized portfolio management services to help optimize the quality and performance of their education loan assets. These services include:
| | • | | Custom program design consultation—helping lenders and providers develop programs that meet the specific needs of their customers and members; |
| | • | | Implementation and product launch services—providing quality and speed to market; |
| | • | | Outsourced back-office services, including application intake, underwriting, document collection, disbursement and repayment servicing—providing the people and processes needed to support lender programs without the need for significant infrastructure; and |
| | • | | Outsourced and remote-access technology solutions—offering the flexibility to manage and administer the programs on a versatile, customizable technology platform. |
Cology LLC supports over 600 education loan programs and provides education loan solutions to approximately 270 credit unions, banks and schools nationwide.
We believe that our acquisition of a substantial portion of the operating assets of the Cology Sellers is well aligned with our business model. Cology LLC provides education loan processing and disbursement services as well as offering life-of-loan servicing. We also believe that there is an opportunity to cross-sell aspects of our Monogram platform on a stand-alone basis to Cology LLC’s credit union clients.
Union Federal Banking Services
In addition to originating education loans, Union Federal offers traditional banking services such as residential and commercial mortgage loans and retail savings, money market and time deposit products.
Prior Business Model
Prior to fiscal 2009, we did not charge separate fees for many of our services, but generally entered into agreements with clients giving us the exclusive right to securitize the education loans that they did not intend to hold. We historically recognized substantially all of our income from structuring securitization transactions. As such, the driver of our results of operations and financial condition was the volume of education loans for which we provided outsourcing services from loan origination through securitization.
Historically, asset-backed securitizations were our sole source of permanent financing for clients’ education loan programs. Conditions of the debt capital markets generally, and ABS market specifically, rapidly deteriorated during the second quarter of fiscal 2008. The ability to finance education loans through securitization continued to be constrained through fiscal 2009 and, to a lesser extent, from fiscal 2010 through fiscal 2013. Our business has been and continues to be materially adversely impacted by these market dynamics, as we have not completed a securitization transaction since fiscal 2008.
Our lender clients previously had the opportunity to mitigate their credit risk through a loan repayment guaranty by The Education Resources Institute, Inc., or TERI. The education loans purchased by certain of the securitization trusts, which we refer to as the Trusts, were initially subject to a default repayment guaranty by TERI, while the education loans purchased by other securitization trusts, which we refer to as the NCT Trusts, were, with limited exceptions, not TERI-guaranteed. TERI guaranteed the education loans held by the Trusts, and we historically received reimbursement from TERI for outsourced loan processing services we performed on TERI’s behalf. In April 2008, TERI filed a voluntary petition for relief under Chapter 11 of the U.S. Bankruptcy Code, which we refer to as the TERI Reorganization. Under TERI’s confirmed plan of reorganization, which became effective in the second quarter of fiscal 2011, TERI rejected its guaranty agreements and settled claims with the Trusts, including contingent guaranty claims based on future loan defaults.
As a result of capital markets disruptions and the TERI Reorganization, many clients elected to terminate some or all of their agreements with us, which resulted in a significant reduction in our facilitated loan volumes during fiscal 2009, fiscal 2010 and fiscal 2011 compared to prior fiscal years. In addition, our financial results for
8
fiscal 2009, fiscal 2010 and fiscal 2011 were negatively affected by significant write-downs of the estimated fair value of our service revenue receivables and, in fiscal 2009 and fiscal 2010, the portfolio of education loans held-for-sale.
General Developments
We have summarized below certain developments affecting our business since the beginning of fiscal 2013:
| | • | | On August 2, 2012, we announced a new private education loan consolidation program with SunTrust Bank based on our Monogram platform, the SunTrust Bank Private Student Loan Consolidation Program. This program provides borrowers the opportunity to refinance their existing education loans into one new loan with a single payment and potentially reduce their current monthly payment and/or interest rate. Approved borrowers are offered the choice of a fixed or variable interest rate, as well as multiple repayment terms. |
| | • | | Effective September 30, 2012, First Marblehead Education Resources, Inc., or FMER, ceased serving as the special servicer for the NCT Trusts. In addition, pursuant to the terms of FMER’s resignation during fiscal 2012 as special servicer of the Trusts, the transition period during which FMER assisted the new special servicer of the Trusts terminated on November 30, 2012. |
| | • | | On October 19, 2012, FMD’s subsidiary Cology LLC acquired a substantial portion of the operating assets, and assumed certain liabilities, of the Cology Sellers. Through Cology LLC, we provide loan processing services to approximately 270 credit union and other lender clients. |
| | • | | On November 12, 2011, we received notice that the Massachusetts Appellate Tax Board, or ATB, had issued an order, which we refer to as the ATB Order, in cases related to the Massachusetts tax treatment of GATE Holdings, Inc., which we refer to as GATE, a former subsidiary of FMD, for fiscal 2004 through fiscal 2006. On April 17, 2013, the ATB issued its opinion confirming the rulings and findings included in the ATB Order, which we refer to as the ATB Opinion. On July 22, 2013, we filed an appeal of certain of the ATB’s findings in the Massachusetts Appeals Court. If we are unsuccessful in an appeal of the ATB Order, we could be required to make additional tax payments, including interest, for GATE’s taxable years ended June 30, 2008 and 2009, which could materially adversely affect our liquidity position. See Note 16, “Commitments and Contingencies—Income Tax Matters,” in the notes to our consolidated financial statements included in Item 8 of this annual report for additional information. |
| | • | | Our loss from continuing operations, before income taxes, for fiscal 2013 improved $3.6 million, or 7%, as compared to fiscal 2012. The fiscal 2012 results included a $9.5 million gain from the deconsolidation of certain of the NCT Trusts that we had previously consolidated. Loss from continuing operations, before income taxes, is the most directly comparable generally accepted accounting principle, or GAAP, financial measure to “net operating cash usage,” a non-GAAP financial metric, which we use to approximate the cash required to fund our operations. During fiscal 2013, we reduced our “net operating cash usage” financial metric by $10.6 million, or 20%, from $53.1 million for fiscal 2012 to $42.5 million for fiscal 2013. See “Management’s Discussion and Analysis of Financial Condition and Results of Operations–Liquidity and Capital Resources–Non-GAAP Measure: Net Operating Cash Usage” included in Item 7 of this annual report for additional information. |
| | • | | For fiscal 2013, total facilitated loan volumes were $298.2 million. Monogram-based facilitated loan volumes for fiscal 2013 were $133.7 million, an increase of 110% as compared to fiscal 2012. Total facilitated loan volume for fiscal 2013 included $164.5 million from Cology LLC since the date of acquisition. Loan disbursements for fiscal 2013 totaled $442.8 million, including $131.9 million of Monogram-based loans and $310.9 million from Cology LLC. Monogram-based loan disbursements for fiscal 2013 were up 129% as compared to fiscal 2012. The disparity between facilitated and disbursed loan volumes was the result of disbursements by Cology LLC following the asset acquisition with respect to loans that were facilitated by the Cology Sellers prior to the asset acquisition. |
| | • | | Our federal income tax returns have been under audit by the Internal Revenue Service, or IRS, in connection with the sale of the trust certificate to NC Residual Owners Trust, which we refer to as the |
9
| | Trust Certificate. In connection with the sale of the Trust Certificate, FMD entered into an asset services agreement, which we refer to as the Asset Services Agreement, pursuant to which FMD provided various consulting and advisory services to the purchaser of the Trust Certificate. We announced on August 15, 2013 that, as part of that audit process, we expected to receive a Notice of Proposed Adjustment, or NOPA, from the IRS. On September 10, 2013 we received two NOPAs from the IRS that contain the proposed adjustments that we announced on August 15, 2013. In the NOPAs, the IRS asserts that our sale of the Trust Certificate should not be recognized for federal income tax purposes primarily because we retained the economic benefits and burdens of the Trust Certificate, including, among other things, retaining certain repurchase rights and data rights. The IRS further concludes that the transaction should be characterized as a financing instead of a sale and asserts that the sale of the Trust Certificate and the execution of the Asset Services Agreement had the impact of converting taxable income to the owner from an accrual basis to a cash basis. As a result, the NOPAs propose to disallow the loss that generated the tax refunds that we previously received as well as require us to include income from the Trust Certificate from the March 31, 2009 sale date through June 30, 2011 in our taxable income for such years. If the IRS’ positions are successful, the disallowance of the loss, coupled with the additional taxable income after the sale date through June 30, 2011, would create federal income tax adjustments that we estimate to be approximately $300.0 million plus interest, with the interest continuing to accrue until the matter is resolved. The NOPAs do not address tax years beyond June 30, 2011. The NOPAs are only initial IRS positions and not final determinations and, as a result, do not require any tax payment at this time. We did not record an accrual for this matter in our consolidated financial statements at June 30, 2013 or when we received the NOPAs. We plan to vigorously contest the proposed adjustments and we believe we have a strong position as it relates to this matter. See “Management’s Discussion and Analysis of Financial Condition and Results of Operations—Results of Operations—Fiscal Years ended June 30, 2013, June 30, 2012 and June 30, 2011—Overall Results—Continuing Operations—Internal Revenue Service Audit” included in Item 7 of this annual report for additional information. |
Outlook
Our long-term success depends on our ability to attract additional lender clients, or otherwise obtain additional sources of interim or permanent financing, such as securitizations or alternative financing transactions. This is particularly true as the level of loan originations for the Union Federal Private Student Loan Program is subject to regulatory limits that are based upon the overall size of Union Federal’s balance sheet and Union Federal’s capital levels, as determined by FMD. To date, we have entered into education loan program agreements based on our Monogram platform with four lender clients, including FMD’s subsidiary Union Federal. While we have demonstrated market demand for Monogram-based education loans, we are uncertain as to the degree of market acceptance that our Monogram platform will achieve, particularly in the current economic environment where lenders continue to evaluate their education lending business models. Additionally, as one of our four partnered lending clients provides the majority of our Monogram-based loan program fees, we are subject to concentration risk as it relates to this revenue stream until we are able to attract additional lender clients. We believe, however, that the credit quality characteristics and interest rates of the loan portfolios originated in the 2011-2012 and the 2012-2013 academic years will be attractive to additional potential lender clients, as well as capital markets participants. We also believe that the ability to permanently finance private education loan portfolios through the capital markets would make our products and services more attractive to lenders and would accelerate improvement in our long-term financial results.
We are uncertain of the volume of education loans to be generated by the Monogram-based loan programs of our four lender clients, or any additional lender clients, including clients acquired through our acquisition of a substantial portion of the operating assets of the Cology Sellers in October 2012. It is our view that returning to profitability will be dependent on a number of factors, including our loan capacity and related volumes, expense management and growth at TMS, Cology LLC and Union Federal and the availability of financing alternatives, including our ability to successfully re-enter the securitization market. In particular, we need to generate loan volumes substantially greater than those that we have generated to date, as well as to develop funding capacity for Monogram-based loan programs at loan volume levels greater than those of our four lender clients with lower
10
credit enhancement levels and higher capital markets advance rates than those available today. We must also continue to achieve efficiencies in attracting applicants, through loan serialization or otherwise, in order to reduce our overall cost of acquisition. In the case of Cology LLC, we expect to continue to provide loan processing services to the former customers of the Cology Sellers similar to the services provided to them by the Cology Sellers prior to the asset acquisition. In addition, we expect to provide various Monogram-based products and services to these customers to assist them in education loan product design, pricing, marketing, reporting and analysis, as well as education loan portfolio management services.
Competition
Based on the range of services that we offer, we believe that SLM Corporation, also known as Sallie Mae, is our principal competitor. Our business could be adversely affected if Sallie Mae’s private education loan program continues to grow, or if Sallie Mae seeks to market more aggressively to third parties the full range of services that we offer. Other education loan competitors include Wells Fargo & Company and Discover Financial Services. In addition, LendKey Technologies, Inc. and Campus Door Holdings, Inc. compete directly with Cology LLC. Nelnet Business Solutions, TouchNet Information Systems, Inc. and Higher One Holdings, Inc. compete directly with TMS.
To the extent that loan originators, including our clients or former clients, develop an internal capability to provide any of the services that we currently offer, demand for our services would decline. For example, a loan originator that has, or decides to develop, a portfolio management or capital markets function may not engage us for our services. Demand for our services could also be affected by developments with regard to federal loan programs. Historically, lenders in the education loan market have focused their lending activities on federal loans because of the relative size of the federal loan market and because the federal government guarantees repayment of those loans, thereby significantly limiting the lenders’ credit risk. Following the elimination of FFELP as of July 2010, many lenders have re-evaluated their business strategies related to education lending and exited the marketplace altogether. Education lenders are more focused on private education loans and some may seek to develop an internal capability to conduct the services we provide, which could result in a decline in the potential demand for our service offerings. We believe the most significant competitive factors in terms of developing education loan products are technical and legal competence, including in connection with the process of originating education loans, cost, data relating to the performance of education loans, risk analytics capabilities, capital markets experience and reliability, quality and speed of service. We differentiate ourselves from other service providers by the range of services we can provide our clients, in a “turn-key” manner.
Several of our current and potential competitors have longer operating histories and significantly greater financial, marketing, technical or other competitive resources than we or our clients have, including funding capacity. As a result, our competitors or potential competitors may be better able to overcome capital markets dislocations, adapt more quickly to new or emerging technologies and changes in customer preferences or compete for skilled professionals, or may be able to devote greater resources to the promotion and sale of their products and services. In particular, competitors with larger customer bases, greater name or brand recognition or more established customer relationships than those of our clients have an advantage in attracting loan applicants and making education loans on a recurring, or “serialized,” basis. These disadvantages for us are particularly acute as we have only been operating Monogram-based loan programs since fiscal 2011. In addition, competitors may be able to adopt more aggressive pricing policies in order to attract potential clients or borrowers, as applicable. We cannot assure you that we will be able to compete successfully with new or existing competitors. To remain competitive, we need to continue to invest in information technology, sales and marketing, legal, compliance and product development resources.
Proprietary Systems and Processes
Monogram Platform and VoltaSMPlatform
In addition to our database that tracks historical education loan performance, we maintain advanced proprietary information processing systems, including our Monogram platform and Cology LLC’s Volta
11
platform. We use these information systems to analyze loan applications efficiently, expedite loan processing and enhance our other services.
Key benefits of our information processing systems include:
| | • | | The ability to analyze and assess loan applications based on a variety of underwriting and product factors, including flexibility to adapt to different product parameters required in customized client implementations; |
| | • | | A transaction/application processing system that includes automated updating of an applicant’s loan status that a borrower can access online or by telephone; |
| | • | | Automated preparation and secure electronic delivery of loan documents, including credit agreements and certain legal disclosures; |
| | • | | Online certification tools enabling financial aid offices to speed loan disbursement by quickly confirming student applicants’ enrollment status and financial need; |
| | • | | Reporting tools enabling clients to track and sort information about student applicants and borrowers, including application status and disbursement dates; |
| | • | | Custom built data transmission techniques designed to ensure that data are compiled, integrated and properly migrated both across our enterprise and to external third parties such as servicers, collection and placement agencies and other third-party vendors; and |
| | • | | Interfaces with internal accounting systems intended to ensure proper booking and tracking of loan information for our clients, as well as support for our capital markets group in its financing activities. |
We use a number of leading commercial products to secure, protect, manage and back-up data.
TMS
TMS maintains advanced proprietary systems in connection with the delivery of independent, integrated education payment and refund solutions to schools and students and their families.
Key benefits of TMS’ systems include:
| | • | | Algorithms that use “affordability” parameters provided by the students or their families to create a series of education payment options that minimize borrowing through the utilization of payment plans and school specific loan products; |
| | • | | Billing solutions that deliver enterprise resource planning integration, regulatory compliance, bill presentment, online document management, online marketing tools and payment channel integration; |
| | • | | Aggregation of school payments across all channels and methods into a single reporting and disbursement interface, allowing a school to deliver choice to its students and families while reducing its workload burden; |
| | • | | Refund disbursement solutions that enable student choice of refund method and provide school administrators a single reporting and disbursement interface, allowing a school to deliver choice to its students and families while reducing its workload burden; |
| | • | | Real-time integration solutions for all major student information systems packages, which allows schools to outsource their billing and payment processing services to TMS without compromising information currency and timeliness; and |
| | • | | Counseling services delivered through “Voice over Internet Protocol” contact management technology that allows integration between TMS’ contact management system and supporting system to create an efficient personalized customer experience with reliable capture of data. |
TMS uses a number of leading commercial products to secure, protect, manage and back-up data.
12
Intellectual Property
FIRSTMARBLEHEAD, the checkered logo, MONOGRAM, MONTICELLO STUDENT LOANS and NATIONAL COLLEGIATE TRUST are registered service marks and GATE, GATE GUARANTEED ACCESS TO EDUCATION and PREPGATE are service marks of FMD. BORROWSMART, HELPING FAMILIES AFFORD EDUCATION, the partial apple logo, RISK REPORTING, THE PROVEN PATH TO PAID STUDENTS IN YOUR CLASSROOMS, TUITION MANAGEMENT SYSTEMS, INC. and TUITIONCHARGE are registered service marks of TMS. UNION FEDERAL is a registered service mark of Union Federal. COLOGY, SABERTOOTH, VOLTA and COLOGY LOAN SERVICING are service marks of Cology LLC. The federal registrations for these registered service marks expire at various times between 2015 and 2020, but the registrations may be renewed for additional 10-year terms provided that we continue to use the trademarks.
Education Loan Market Seasonality
Origination of education loans is generally subject to seasonal trends, with the volume of loan applications increasing during the summer and early fall months with the approach of tuition payment dates. Historically, we have also tended to process an increased volume of loan applications during November, December and January, as students and their families seek to borrow money to pay tuition costs for the spring semester. Historically, this seasonality of loan originations has impacted the amount of processing fees that we earned in a particular quarter and the level of expenses incurred to generate loan application volume and process the higher origination activity, and with respect to fiscal years prior to fiscal 2009, the timing and size of securitization transactions. In addition, TMS’ financial and operational results are also subject to seasonal trends, with plan enrollment activity and expenses generally increasing from March to July as TMS hires temporary staff to meet higher demand for enrollment in tuition payment plans for the succeeding school year.
Union Federal Regulatory Matters
In November 2006, we acquired Union Federal, a community savings bank located in North Providence, Rhode Island. Union Federal is a federally-chartered thrift that is regulated by the Office of the Comptroller of the Currency, or OCC. As a result of our ownership of Union Federal, FMD is a savings and loan holding company subject to regulation, supervision and examination by the Board of Governors of the Federal Reserve System, or the Federal Reserve. See “—Government Regulation” below, “Risk Factors—Risks Related to Regulatory Matters” included in Item 1A of this annual report and Note 25, “Union Federal Regulatory Matters,” in the notes to our consolidated financial statements included in Item 8 of this annual report for additional information.
In March 2010, the FMD Board of Directors adopted resolutions required by the U.S. Office of Thrift Supervision, or OTS, Union Federal’s regulator at that time, undertaking to support the implementation by Union Federal of its business plan, so long as Union Federal is owned or controlled by FMD, and to notify the OTS (and now the OCC effective in fiscal 2012) in advance of any distribution to our stockholders in excess of $1.0 million per fiscal quarter and any incurrence or guarantee of debt in excess of $5.0 million. These resolutions continue to be applied by the Federal Reserve. Distributions to our stockholders may be further restricted by the Federal Reserve’s required approval in those instances when such distributions exceed the net earnings of the prior12-month period.
Government Regulation
We provide financial services in connection with the creation, management and disposition of education loans, retail banking, such as mortgages and deposits, and education payment processing. Our business is highly regulated at both the state and federal level, through statutes and regulations that focus upon:
| | • | | Safety and soundness of FMD and Union Federal; |
| | • | | Licensure and examination of industry participants; |
13
| | • | | Regulation and disclosure of consumer loan and deposit terms; |
| | • | | Regulation of loan origination processing; and |
| | • | | Licensure and general regulation of loan collection and servicing. |
Failure to conform to any of these statutes or regulations may result in civil and/or criminal fines, and may affect the enforceability of the underlying consumer loan assets.
Many states have statutes and regulations that require the licensure of small loan lenders, loan brokers, credit services organizations, loan arrangers and collection agencies. Some of these statutes are drafted or interpreted to cover a broad scope of activities. While we believe we have satisfied all material licensing, registration and other regulatory requirements that could be applicable to us based on current laws and the manner in which we currently conduct business, we may determine that we need to submit additional license applications, and we may otherwise become subject to additional state licensing, registration and other regulatory requirements in the future. In particular, certain state licenses or registrations may be required if we change our operations, if regulators reconsider their prior guidance or if federal or state laws or regulations are changed. Even if we are not physically present in a state, its regulators may take the position that registration or licensing is required because we provide services to borrowers located in the state by mail, telephone, the Internet or other remote means.
To the extent that our services are conducted through Union Federal, state requirements for licensure are inapplicable. However, as a result of the enactment of the Dodd-Frank Wall Street Reform and Consumer Protection Act, which we refer to as the Dodd-Frank Act, and the reduced preemption enjoyed by federal savings banks resulting from the Dodd-Frank Act, we may now be subject to state consumer protection laws in each state where we do business and those laws may be interpreted and enforced differently in different states. The Dodd-Frank Act changed the legal standard for federal savings association preemption of state laws so that state laws are now preempted only if those laws stand in conflict with federal laws. This “conflict” preemption standard is consistent with the standard for national bank preemption of state laws.
The Dodd-Frank Act also restructured the regulation of depository institutions. Under the Dodd-Frank Act, the OTS, which historically was the primary federal regulator for FMD and Union Federal, transferred its authority to the Federal Reserve and the OCC on July 21, 2011. On that date, the OCC, the primary federal regulator for national banks, became the primary federal regulator for federal thrifts, including Union Federal, and the Federal Reserve became the primary federal regulator for all savings and loan holding companies that were formerly regulated by the OTS, including FMD. Although the OCC and Federal Reserve are directed to implement existing OTS regulations, orders, resolutions, determinations and agreements for thrifts and their holding companies under the Home Owners’ Loan Act, or HOLA, the transition of supervisory functions from the OTS to the OCC (with respect to Union Federal) and the Federal Reserve (with respect to FMD) are expected, over time, to alter the supervisory approach for Union Federal and FMD. This could, in turn, affect the operations of FMD and Union Federal. The Dodd-Frank Act also will impose consolidated capital requirements on savings and loan holding companies, but they are not effective until five years after enactment.
The Dodd-Frank Act also established the Consumer Financial Protection Bureau, or CFPB, as an independent agency within the Federal Reserve. The CFPB has been given broad powers, including the power to:
| | • | | Supervise non-depository institutions, including those that offer or provide education loans; |
| | • | | Supervise depository institutions with assets of $10 billion or more for compliance with consumer protection laws, as well as the service providers to such institutions; |
| | • | | Regulate consumer financial products, including education loans, and services offered primarily for personal, family or household purposes; |
| | • | | Promulgate rules pursuant to, as well as with respect to, unfair, deceptive or abusive practices; and |
| | • | | Take enforcement action against institutions under its supervision. |
14
The CFPB may institute regulatory measures that directly impact our business operations. The CFPB has initiated an examination program of non-depository institutions (which could include service providers such as FMD’s subsidiary FMER). The Federal Trade Commission, or FTC, maintains parallel authority to enforce Section 5 of the Federal Trade Commission Act prohibiting unfair or deceptive acts or practices against non-depository financial providers, such as FMER, TMS and Cology LLC. The OCC maintains parallel authority to enforce Section 5 of the Federal Trade Commission Act against federal savings associations, such as Union Federal, as well as authority to examine and supervise federal savings associations with assets of less than $10 billion, such as Union Federal, for compliance with consumer protection laws.
The CFPB has significant rulemaking and enforcement powers and the potential reach of the CFPB’s broad new rulemaking powers and enforcement authority on the operations of financial institutions offering consumer financial products or services, including FMD, is currently unknown. In addition, the Dodd-Frank Act established a Student Loan Ombudsman within the CFPB, who, among other things, receives, reviews and attempts to resolve informally complaints from education loan borrowers. To date, the Student Loan Ombudsman has only issued its first Annual Report, which we refer to as the Report. The Report focused on issues relating to private education loan servicing. The Report noted that many private education loans do not have certain borrower protections that are common in federal education loans, such as income-based repayment plans, discharges upon death or military deferments. The Report compared education loan servicing to mortgage loan servicing, noting that, like mortgage borrowers, private education loan borrowers make their payments and inquiries to loan servicers, which are often different than the lender itself. The Report noted that of the approximately 2,900 complaints that the CFPB has received regarding education loans, only 5% concerned borrower issues relating to obtaining the loan, the aspect of the process in which we operate. However, many of the servicing issues noted by the Report could have consequences for us, as they may indicate areas in which the CFPB will seek to create further consumer disclosures or take other actions that relate to the origination process. Especially in light of the concerns noted in the Report that private education loan borrowers may not have fully understood all the terms and conditions of their different loans, we expect private education loan marketing practices to be carefully scrutinized.
As required by the Dodd-Frank Act, the CFPB and the Secretary of Education submitted a report in July 2012, addressing certain aspects of the private education loan market. In this report, the CFPB recommended that the U.S. Congress consider:
| | • | | Mandating school certification of borrowed amounts; |
| | • | | Making private education loans dischargeable in bankruptcy; |
| | • | | Clarifying the definition of private education loans under TILA to cover products that may serve as economic substitutes (such as credit lines for post-secondary expenses); |
| | • | | Creating a mechanism to help borrowers better understand their total debt obligations (such as a centralized mechanism similar to the National Student Loan Data System); and |
| | • | | Whether additional data should be required to enhance consumer decision-making and lender underwriting. |
At the same time that it issued the July 2012 report, the CFPB issued revised draft model disclosures for its “Know Before You Owe” campaign designed to provide additional information to consumers. The CFPB also has an Office of Students intended to provide students with tools to facilitate decision making regarding various credit products, including education loans. These initiatives, and similar efforts with respect to other credit and retail banking products, could increase our costs and the complexity of our operations.
The Department of Education issued substantially similar recommendations in the July 2012 report, including that the U.S. Congress consider:
| | • | | Both mandating school certification of borrowed amounts and ensuring that students have exhausted federal financial aid before obtaining a private education loan; |
15
| | • | | Making private education loans dischargeable in bankruptcy, taking into account the tradeoffs between increasing options for financial relief to distressed borrowers and the potential for higher costs and decreased availability of private education loans; |
| | • | | Excluding from the definition of private education loans all types of federal education loans, and potentially excluding certain private education loans made by non-profit lenders; and |
| | • | | Creating a centralized mechanism to help borrowers better understand their total student debt obligations. |
The Dodd-Frank Act also includes several provisions that could affect our future portfolio funding transactions, if any, including potential risk retention requirements applicable to any entity that organizes and initiates an ABS transaction, new disclosure and reporting requirements for each tranche of ABS, including new loan-level data requirements, and new disclosure requirements relating to the representations, warranties and enforcement mechanisms available to ABS investors.
We will continue to review state registration and licensing requirements, and we intend to pursue registration or licensing in applicable jurisdictions where we are not currently registered or licensed if we elect to operate through an entity that does not enjoy federal preemption of such registration or licensing requirements. We cannot assure you that we will be successful in obtaining additional state licenses or registrations in a timely manner, or at all. If we determine that additional state registrations or licenses are necessary, we may be required to delay or restructure our activities in a manner that will not subject us to such licensing or registration requirements. Compliance with state licensing requirements could involve additional costs or delays, which could have a material adverse effect on our business. Our failure to comply with these laws could lead to, among other things:
| | • | | Curtailment of our ability to continue to conduct business in the relevant jurisdiction, pending a return to compliance or processing of registration or a license application; |
| | • | | Administrative enforcement actions; |
| | • | | The assertion of legal defenses delaying or otherwise affecting the enforcement of loans; and |
| | • | | Criminal as well as civil liability. |
Any of the foregoing could have a material adverse effect on our business.
The consumer assets with which we deal are subject to the full panoply of state and federal regulation, and a defect in such assets could affect our business. Similarly, the growing complexity of regulation of loan origination and collection may affect the cost and efficiency of our operations. We have sought to minimize the risk created by consumer loan regulation in a number of ways. The securitizations that we facilitated have involved sales by financial institutions regulated by the Federal Deposit Insurance Corporation, or FDIC, and other parties which represented and warranted that the assets in question were originated in compliance with all applicable law and were valid, binding and enforceable in accordance with their terms. Similarly, the securitization trusts have benefited from an assignment of representations and warranties made by the lender and by the applicable loan servicer regarding compliance with law in the origination and servicing of loan assets.
In delivering services, our operations must conform to consumer loan regulations that apply to lenders. These regulations include, but are not limited to, compliance with the Consumer Financial Protection Act, TILA, the Higher Education Opportunity Act, the Fair Credit Reporting Act, the USA PATRIOT Act, the Equal Credit Opportunity Act, the Gramm Leach Bliley Act, the Federal Trade Commission Act, the Fair Debt Collection Practices Act and numerous state laws that replicate and expand upon the requirements of federal law. In addition, there is increasing regulation of the type of electronic loan application processing that we conduct, as well as regulation of access to and use of consumer information databases. A growing number of states are imposing disparate and costly requirements on our operations, including protections against identity theft, privacy protection and data security protection. The Fair and Accurate Credit Transactions Act of 2003 imposed significant federal law requirements on loan application processors, including requirements with respect to
16
resolving address inconsistencies, responding to “red flags” of potential identity theft and identity theft notices, producing notices of adverse credit decisions based on credit scoring and other requirements affecting both automated loan processing and manual exception systems. These requirements strained, and future legislation or regulation may also strain, our systems. Failure to comply with these requirements would interfere with our ability to develop and market our business model for processing services.
Employees
We had 302 employees at June 30, 2013, compared to 306 employees as of June 30, 2012. The slight decrease in employees in fiscal 2013 was due to cost reduction efforts implemented throughout fiscal 2013, largely offset by our hiring of 43 employees from the Cology Sellers in connection with our acquisition of a substantial portion of the operating assets of the Cology Sellers.
We are not subject to any collective bargaining agreements, and we believe our relationships with our employees are good.
Our Corporate Information
We were formed as a limited partnership in 1991 and were incorporated in Delaware in August 1994. Our principal executive offices are located at The Prudential Tower, 800 Boylston Street, 34th Floor, Boston, Massachusetts 02199. The telephone number of our principal executive offices is (800) 895-4283.
Available Information
Our Internet address iswww.firstmarblehead.com. The contents of our website are not part of this annual report on Form 10-K, and our Internet address is included in this document as an inactive textual reference only. We make our annual reports on Form 10-K, quarterly reports on Form 10-Q, current reports on Form 8-K and all amendments to those reports available free of charge on our website as soon as reasonably practicable after we file such reports with, or furnish such reports to, the SEC. Alternatively, reports filed with or furnished to the SEC are available from the SEC on its website,www.sec.gov, by request from the Public Reference Room at 100 F Street, NE, Washington, D.C. 20549 or by phone at (800) SEC-0330.
Executive Officers of the Registrant
The following table sets forth information regarding our executive officers as of September 13, 2013, including their ages as of such date:
| | | | | | |
Name | | Age | | | Position |
Daniel Meyers | | | 50 | | | Chief Executive Officer and Chairman of the Board of Directors |
Seth Gelber | | | 34 | | | Managing Director, President and Chief Operating Officer |
Kenneth Klipper | | | 54 | | | Managing Director and Chief Financial Officer |
William Baumer | | | 52 | | | Managing Director and Chief Risk Officer |
Barry Heneghan | | | 39 | | | Managing Director, Business Development and Product Strategy |
Suzanne Murray | | | 39 | | | Managing Director, General Counsel and Secretary |
Set forth below is certain information regarding the business experience of each of the above-named persons.
Daniel Meyers is a co-founder of First Marblehead. He has served as FMD’s Chief Executive Officer and as a Director since September 2008, and as Chairman of the Board of Directors since May 2010. From September 2008 to August 2013, he served as FMD’s President. Mr. Meyers also served as FMD’s Chief Executive Officer and Chairman of the Board of Directors from FMD’s incorporation in 1994 to September 2005 and as President from November 2004 to September 2005. Since October 2006, Mr. Meyers has served as the sole member, Chairman and Chief Executive Officer of Sextant Holdings, LLC, a private investment firm. From 1980 to 1991, Mr. Meyers was involved in arbitrage and derivatives trading at EF Hutton, Prudential Bache Securities, LF
17
Rothschild Unterberg Towbin and Commodities Corporation, each of which were financial services firms. He began working on ABS financings in 1986. He currently serves as the Chair Emeritus of the Board of the Curry School of Education Foundation, as well as a consulting member of the finance committee of the Board of Visitors at the University of Virginia. Additionally, he is the Chairman of the Board of Steward Medical Group, a unit of Steward Healthcare System, a system of 11 hospitals headquartered in Boston, Massachusetts. He also serves on the Board of the Forum for the Future of Higher Education and is a member of the Education Funding Committee of the Consumer Bankers Association. Mr. Meyers received an A.B. in Economics from Brandeis University and completed the Owner President Management Program at the Harvard Graduate School of Business Administration.
Seth Gelber has served as FMD’s President since August 2013, Chief Operating Officer since August 2012 and as a Managing Director since September 2008. He served as FMD’s Chief Administrative Officer from March 2010 to August 2012 and as FMD’s Senior Vice President, Corporate Development from August 2008 to September 2008. From 2001 to 2006, Mr. Gelber held various positions at FMD in the Capital Markets and Product Strategy groups. Since October 2006, Mr. Gelber has served as President of Sextant Holdings, LLC, a private investment firm, the sole member of which is Mr. Meyers. From 1998 to 2001, Mr. Gelber served as a Legislative Assistant to Congressman Jack Quinn (N.Y.), primarily focused on education, telecommunication and banking legislation. Mr. Gelber received a B.A. from The George Washington University.
Kenneth Klipper has served as FMD’s Chief Financial Officer and as a Managing Director since September 2008 and served as Treasurer and Chief Accounting Officer from November 2006 to April 2011. Mr. Klipper served as FMD’s Senior Vice President, Finance from March 2005 to September 2008. From April 2003 to March 2005, Mr. Klipper served as the Chief Executive Officer of Brown Co., an online brokerage firm owned, at the time, by JPMorgan. He served as the Chief Financial Officer of Brown Co. from January 2003 to April 2003. From May 2002 to January 2003, Mr. Klipper served as the Chief Financial Officer and Chief Operating Officer of Park Street Capital, a fund of funds private equity firm. From January 2000 to April 2002, Mr. Klipper served as the Chief Financial Officer of Tucker Anthony Sutro, Inc., a publicly traded securities brokerage firm. Prior to joining Tucker Anthony, Mr. Klipper served for five years as both the Chief Financial Officer and Controller for the securities brokerage unit of Fidelity Investments, and he held positions with KPMG LLP, a registered public accounting firm, for 11 years. Mr. Klipper received a B.S. from the University of Richmond and is a Certified Public Accountant.
William Baumer has served as FMD’s Chief Risk Officer since September 2007, as a Managing Director since September 2008 and as the Chief Executive Officer of Union Federal Savings Bank since July 2010. Mr. Baumer served as FMD’s Senior Vice President, Compliance from July 2004 to September 2007. From 2003 to June 2004, Mr. Baumer served as the Compliance Manager for the nationwide mortgage operations at Bank of America, N.A. From 2000 to 2003, Mr. Baumer was the Compliance Director-Core Banking for Fleet Boston Financial Corporation, a bank that was acquired by Bank of America, and was responsible for regulatory compliance programs in Fleet’s consumer, commercial and administrative staff units. He joined Fleet in 1984 and held various leadership positions in the Compliance, Audit, Credit and Retail Banking business units. Mr. Baumer received a B.S. from Franklin Pierce College and has earned Certified Regulatory Compliance Manager, Certified Internal Auditor and Certified Anti-Money Laundering Specialist certifications.
Barry Heneghanhas served as FMD’s Managing Director, Business Development and Product Strategy since January 2011. From August 2008 to December 2010, he served as a consultant to FMD. Since February 2006, Mr. Heneghan has served as the Chief Executive Officer and President of Think Financial, a student loan marketing company that ceased active operations in August 2008. From 1996 to January 2006, Mr. Heneghan held various positions at FMD in the Business Development, Corporate Development and Product Strategy groups. From 1993 to 1996, Mr. Heneghan served as a Legislative Assistant to Congressman Jack Quinn (N.Y.). Mr. Heneghan received a B.A. from The George Washington University and an M.A. from Pennsylvania State University and attended the London School of Economics.
Suzanne Murray has served as FMD’s General Counsel since August 2012 and as a Managing Director and FMD’s Secretary since May 2012. Ms. Murray served as FMD’s Acting General Counsel from May 2012 to
18
August 2012 and as FMD’s Senior Counsel, Corporate Law from March 2010 to April 2012. From October 2007 to February 2010, Ms. Murray was a Partner at Goodwin Procter LLP, a law firm, and from October 2000 to September 2007, Ms. Murray was an associate at Goodwin Procter. While at Goodwin Procter, Ms. Murray practiced general corporate and securities law, with an emphasis on mergers and acquisitions, SEC compliance and corporate governance matters. Ms. Murray received a B.A. from Boston College and a J.D. from Boston College Law School.
Code of Ethics
We have adopted a code of conduct that applies to our employees and officers, including our principal executive officer, principal financial officer, principal accounting officer or controller or persons serving similar functions. We have also adopted a statement of business ethics that applies to our directors. We will provide a copy of our code of conduct and statement of business ethics for our directors to any person without charge, upon written request to: Corporate Secretary, The First Marblehead Corporation, The Prudential Tower, 800 Boylston Street, 34th Floor, Boston, Massachusetts 02199. Our code of conduct and statement of business ethics for our directors, as well as our corporate governance guidelines and the charters of the standing committees of the FMD Board of Directors, are posted on our website atwww.firstmarblehead.com under the heading “For Investors—Corporate Information—Governance Documents,” and each of these documents is available in print to any stockholder who submits a written request to our corporate secretary. If we amend our code of conduct in the future or grant a waiver under our code of conduct to any of our directors or executive officers, including our principal executive officer, principal financial officer, principal accounting officer or controller or anyone performing similar functions, we intend to post information about such amendment or waiver on our website.
Investing in our common stock involves a high degree of risk. You should carefully consider the risks and uncertainties described below in addition to the other information included in this annual report. If any of the following risks actually occurs, our business, financial condition or results of operations could be adversely affected, which, in turn, could have a negative impact on the price of our common stock. Although we have grouped risk factors by category, the categories are not mutually exclusive. Risks described under one category may also apply to another category, and you should carefully read the entire risk factors section, not just any one category of risk factors.
Risks Related to Our Industry, Business and Operations
Challenges exist in implementing revisions to our business model.
Since the beginning of fiscal 2009, we have taken several measures to adjust our business in response to economic conditions. Most significantly, we refined our service offerings and added fee-for-service offerings such as loan origination services and portfolio management. During fiscal 2010, we completed the development of our Monogram platform, including an enhanced application interface, an expanded credit decisioning model and additional reporting capabilities. We continue to incorporate refinements to our Monogram platform. During fiscal 2011, we began originating Monogram-based education loans under loan program agreements and began offering outsourced tuition planning, tuition billing and payment technology services for educational institutions through TMS. In fiscal 2012, we began offering refund management services to education institutions and students through TMS. In October 2012, we began providing education loan processing and disbursement services to credit unions, banks and schools in the United States, as well as offering life-of-loan servicing, through Cology LLC. Successful sales of our service offerings, particularly our Monogram platform, TMS offerings and Cology LLC offerings, will be critical to stemming our losses and growing and diversifying our revenues and client base in the future.
We are uncertain as to the degree of market acceptance that our Monogram platform will achieve, particularly in the current economic environment where there has been reluctance by many lenders to focus on education lending opportunities. Through September 13, 2013, we have entered into loan program agreements
19
with four lender clients for Monogram-based loan programs, including FMD’s subsidiary Union Federal. The process of negotiating loan program agreements can be lengthy and complicated. Both the timing and success of contractual negotiations are unpredictable and partially outside of our control, and we cannot assure you that we will successfully identify potential clients or ultimately reach acceptable terms with any particular party with which we begin negotiations.
Moreover, we are uncertain of the extent to which borrowers will choose Monogram-based loans offered by our lender clients, which depends, in part, on competitive factors such as brand and pricing. Several of our current and potential competitors have longer operating histories and significantly greater financial, marketing, technical or other competitive resources than we or our clients have, including funding capacity. As a result, our competitors or potential competitors may be better able to overcome capital markets dislocations, adapt more quickly to new or emerging technologies and changes in customer preferences or compete for skilled professionals, or may be able to devote greater resources to the promotion and sale of their products and services. In particular, competitors with larger customer bases, greater name or brand recognition or more established customer relationships than those of our clients have an advantage in attracting loan applicants and making education loans on a recurring, or “serialized,” basis. We are uncertain of the total application volume for fiscal 2014 and beyond, the extent to which application volume will ultimately result in disbursed loans and the overall characteristics of the disbursed loan portfolio.
Commercial banks have historically served as the initial funding sources for the education loans we facilitate and have been our principal clients. Since the first quarter of fiscal 2008, we have not facilitated securitization transactions to support the long-term funding of education loans, and commercial banks may be facing liquidity and credit challenges from other sources, in particular mortgage, auto loan and credit card lending losses. In addition, the synergies that previously existed between federal and private education loan marketing have been eliminated by legislation that eliminated FFELP. As a result, many lenders have re-evaluated their business strategies related to education lending. In light of legislative and regulatory changes, general economic conditions, capital markets disruptions and the overall credit performance of consumer-related loans, the education loan business may be less attractive to commercial banks than in the past. Demand for our services may not increase unless additional lenders enter or re-enter the marketplace, which could depend in part on capital markets conditions and improved market conditions for other consumer financing segments.
Some of our former clients and competitors have exited the education loan market completely. To the extent that commercial banks exit the education loan market, the number of our prospective clients diminishes. One of our primary challenges is to convince national and regional lenders that they can address this market opportunity in a manner that meets their desired risk control and return objectives. A related challenge is to successfully finance education loans generated through our Monogram platform through capital market transactions. We cannot assure you that we will be successful in either the short-term or the long-term in meeting these challenges.
Our business model depends on our ability to facilitate Monogram-based education loan volumes substantially in excess of those that we have originated to date and those contemplated by our four lender clients’ Monogram-based loan programs. We have been required to expend capital to support loan volume under our Monogram platform. Specifically, a portion of the loan volume to date under our Monogram platform has been originated by FMD’s subsidiary Union Federal and we have been further required to provide credit enhancements for Monogram-based loans originated by certain of our lender clients by funding participation accounts or, in the case of Union Federal, deposit accounts, to serve as a first-loss reserve for defaulted program loans. While we believe that we have sufficient capital resources to continue to provide such support to our Monogram platform under our business model, our ability to return to profitability while maintaining appropriate levels of liquidity will be predicated, in part, on our ability to fund participation accounts at levels lower than we are today, as well as the availability of higher capital markets advance rates, including the continued re-emergence of subordinate bonds in the private education loan securitization market, than are available today.
We will need to facilitate substantial loan volume, achieve market acceptance of our Monogram platform and TMS’ offerings, cross-sell our Monogram platform to Cology LLC clients and continue to manage our expenses, among other things, in order to return to profitability.
20
Our ability to achieve and sustain profitability is dependent on many factors. Primarily, we believe that the following must occur in order for us to return to profitability:
| | • | | We need to facilitate loan volumes substantially in excess of those that we have originated to date, and substantially in excess of those contemplated by our four lender clients’ Monogram-based loan programs. Because the revenues that we expect to generate for Monogram-based loan programs will depend in part on the size, credit mix and actual performance of our lender clients’ loan portfolios, it is difficult for us to forecast the level or timing of our revenues or cash flows with respect to our Monogram platform generally or a specific lender client’s Monogram-based loan program. |
| | • | | We need to attract additional lender clients, or otherwise obtain additional sources of interim or permanent financing, such as securitizations or alternative financing transactions, particularly given that one of our four partnered lending clients provides the majority of our Monogram-based loan program fees, which subjects us to concentration risk as it relates to this revenue stream. Additionally, the level of loan originations for the Union Federal Private Student Loan Program is subject to regulatory limits that are based upon the overall size of Union Federal’s balance sheet and Union Federal’s capital levels, as determined by FMD. As a result, Union Federal’s business plan includes a limit on the amount of education loans to be held on its balance sheet, and any material change to Union Federal’s business plan would be subject to regulatory conditions as well as prior regulatory approval for any interim or permanent financing of education loan portfolios held by Union Federal, including future securitization transactions. Consequently, we cannot assure you that Union Federal will be able to serve as a meaningful funding lender in the future for Monogram-based loan programs. |
| | • | | Deployment of our Monogram platform, and disbursed loan volume under our lender clients’ Monogram-based loan programs, has been limited, and we will need to gain widespread market acceptance of our Monogram platform among lenders, and of our lender clients’ Monogram-based loan programs among borrowers, in order to improve our long-term financial condition, results of operations and cash flow. If we do not succeed in doing so, we may need to re-evaluate our business plans and operations. |
| | • | | Deployment of TMS’ refund management services and its Student Account Center product has been limited, and we will need to gain widespread market acceptance of our refund management services and Student Account Center product among TMS’ existing clients as well as new clients, in order to improve our long-term financial condition, results of operations and cash flow. |
| | • | | We need to cross-sell aspects of our Monogram platform on a stand-alone basis to Cology LLC’s credit union clients. We cannot assure you that we will be able to achieve widespread market acceptance by these credit union clients of these additional services. Successful sales of our Monogram platform offerings to Cology LLC’s clients will be an important factor in realizing the benefits of the asset acquisition and in diversifying our revenues. |
| | • | | We need to continue to actively manage our expenses in the current economic environment to better align costs with our current business. In the past we have engaged in cost reduction initiatives and we may need to engage in similar cost reduction initiatives in the future. Despite our efforts to structure our business to operate in a cost-effective manner, some cost reduction measures could have unexpected negative consequences. If we are unable to successfully manage our expenses and run our business in a cost-effective manner, our results of operations would be harmed and it may impact our return to profitability. |
We have incurred net losses since fiscal 2008 and could incur losses in the future.
We have generated significant net losses since fiscal 2008, and may continue to incur losses. There can be no assurance that we will report net income in any future period. We must develop new lender client relationships and substantially increase our revenues derived from our Monogram platform, TMS offerings and Cology LLC offerings. We are actively managing our expenses in the current economic environment and in light of the status of our business. To the extent that we are not able to increase our revenues and continue to manage our operating expenses, we will continue to experience net losses.
21
We have provided credit enhancements in connection with Monogram-based loan programs for certain of our lender clients and may enter into similar arrangements in connection with future loan programs. As a result, we have capital at risk in connection with our lender clients’ loan programs. We may lose some or all of the capital we have provided and our financial results could be adversely affected.
In connection with certain of our lender clients’ Monogram-based loan programs, we have provided credit enhancements by funding participation accounts or, in the case of Union Federal, deposit accounts, to serve as a first-loss reserve for defaulted program loans. We have limited amounts of cash available to offer to prospective clients, and there is a risk that lenders will not enter into loan program agreements with us unless we offer credit enhancement. We expect that the amount of any such credit enhancement arrangement offered to a particular lender would be determined based on the particular terms of the lender’s loan program, including the anticipated size of the lender’s program and the underwriting guidelines of the program, as well as the particular terms of our business relationship with the lender. Should additional lenders require credit enhancement from us as a condition to entering into a loan program agreement, our growth may be constrained by the level of capital available to us. In addition, growth of Union Federal’s Monogram-based loan programs may be constrained by the amount of capital we are able to provide.
We have made deposits pursuant to our credit enhancement arrangements and agreed to provide periodic supplemental deposits, up to specified limits, during the disbursement periods under our loan program agreements based on the credit mix and volume of disbursed program loans and adjustments to default projections for program loans. To the extent that outstanding loan volume decreases as a result of repayments, or if actual loan volumes or default experience are less than our funded amounts, we are eligible to receive periodic releases of funds. The timing and amount of releases, if any, from the participation accounts are uncertain and vary among the loan programs. As of June 30, 2013, the fair value of our funded credit enhancements was $13.1 million. We could lose some or all of the amounts that we have deposited, or will deposit in the future, in the participation accounts, depending on the performance of the portfolio of program loans. Such losses would erode our liquidity position and could damage business prospects for our Monogram platform.
Our Monogram platform is based on proprietary scoring models and risk mitigation and pricing strategies that we have developed. We have limited experience with the actual performance of loan portfolios generated by lenders based on our Monogram platform, and we may need to adjust marketing, pricing or other strategies from time to time based on the distribution of loan volume among credit tiers or competitive considerations. We must closely monitor the characteristics and performance of each lender’s loan portfolio in order to suggest adjustments to the lenders’ programs and tailor our default prevention and collection management strategies. The infrastructure that we have built for such monitoring requires extensive operational and data integration among the loan servicer, multiple default prevention and recovery collection agencies and us. To the extent that our infrastructure is inadequate or we are otherwise unsuccessful in identifying portfolio performance characteristics and trends, or to the extent that lenders are unwilling to adjust their loan programs, our risk of losing amounts deposited in the participation accounts or, in the case of Union Federal, deposit accounts, may increase.
The outsourcing services market for education financing is competitive and if we are not able to compete effectively, our revenues and results of operations may be adversely affected.
We offer our clients and prospective clients, national and regional financial and educational institutions, services in structuring and supporting their education loan programs and tuition payment processing plans. The outsourcing services market in which we operate is competitive with a number of active participants, some of which have longer operating histories and significantly greater financial, marketing, technical or other competitive resources than we or our clients have, including funding capacity. As a result, our competitors or potential competitors may be better able to overcome capital markets dislocations, adapt more quickly to new or emerging technologies and changes in customer preferences or compete for skilled professionals, build upon efficiencies based on a larger volume of loan transactions, fund internal growth and compete for market share, than we are. In particular, competitors with larger customer bases, greater name or brand recognition or more established customer relationships than those of our clients have an advantage in attracting loan applicants at a lower acquisition cost than us. These disadvantages are particularly acute for us because we have only been operating Monogram-based loan programs since fiscal 2011.
22
Based on the range of services that we offer, we believe that Sallie Mae is our principal competitor. Our business could be adversely affected if Sallie Mae’s private education loan program continues to grow, or if Sallie Mae seeks to market more aggressively to third parties the full range of services that we offer. Other education loan competitors include Wells Fargo & Company and Discover Financial Services. In addition, LendKey Technologies, Inc. and Campus Door Holdings Inc. compete directly with Cology LLC. Nelnet Business Solutions, TouchNet Information Systems, Inc. and Higher One Holdings, Inc. compete directly with TMS.
We may face competition from loan originators, including our clients or former clients, if they choose to develop an internal capability to provide any of the services that we currently offer. For example, a loan originator that has developed, or decides to develop, a portfolio management or capital markets function may not choose to engage us for our services. Historically, lenders in the education loan market have focused their lending activities on federal loans because of the relative size of the federal loan market and because the federal government guarantees repayment of those loans, thereby significantly limiting the lenders’ credit risk. Following the elimination of FFELP, lenders are more focused on private education loans and some may seek to develop an internal capacity to conduct the services that we provide, which could result in a decline in the potential market for our services.
We cannot assure you that we will be able to compete successfully with new or existing competitors. If we are not able to compete effectively, our results of operations may be adversely affected.
The growth of our business could be adversely affected by changes in government education loan programs or expansions in the population of students eligible for loans under government education loan programs.
We focus our business on the market for private education loans, and the majority of our business is concentrated in products for post-secondary education. The availability and terms of loans that the government originates or guarantees affects the demand for private education loans because students and their families often rely on private education loans to bridge a gap between available funds, including family savings, scholarships, grants and federal and state loans, and the costs of post-secondary education. The federal government currently places both annual and aggregate limitations on the amount of federal loans that any student can receive and determines the criteria for student eligibility. These guidelines are generally adjusted in connection with funding authorizations from the U.S. Congress for programs under the Higher Education Act of 1965. Recent federal legislation expanded federal grant and loan assistance, which could weaken the demand for private education loans. The creation of similar federal or state programs that make additional government loan funds available could decrease the demand for private education loans.
Access to alternative means of financing the costs of education may reduce demand for private education loans.
The demand for private education loans could weaken if student borrowers use other vehicles to bridge the gap between available funds and costs of post-secondary education. These vehicles include, among others:
| | • | | Home equity loans or other borrowings available to families to finance their education costs; |
| | • | | Pre-paid tuition plans, which allow students to pay tuition at today’s rates to cover tuition costs in the future; |
| | • | | Section 529 plans, which include both pre-paid tuition plans and college savings plans, that allow a family to save funds on a tax-advantaged basis; |
| | • | | Education IRAs, now known as Coverdell Education Savings Accounts, under which a holder can make annual contributions for education savings; |
| | • | | Government education loan programs, generally, and interest rates on the loans under these programs, specifically; and |
| | • | | Direct loans from colleges and universities. |
23
If demand for private education loans weakens, we would experience reduced demand for our services, which could have a material adverse effect on our results of operations.
Continuation of the current economic conditions could adversely affect the education loan industry.
High unemployment rates and the unsteady financial sector have adversely affected many consumers, loan applicants and borrowers throughout the country. Loan applicants that have experienced trouble repaying credit obligations may not be able to meet the credit standards of our lender clients’ Monogram-based loan programs, which could limit our lending market or have a negative effect on the rate at which loan applications convert into disbursed loans. In addition, current borrowers may experience more trouble in repaying credit obligations, which could increase loan delinquencies, defaults and forbearance, or otherwise negatively affect loan portfolio performance and the estimated fair value of our service revenue receivables and our participation accounts. Forbearance programs may have the effect of delaying default emergence, and alternative payment plans may reduce the utilization of basic forbearance. In addition, some consumers may find that higher education is an unnecessary investment during turbulent economic times and defer enrollment in educational institutions until the economy improves or turn to less costly forms of secondary education, thus decreasing education loan application and funding volumes. Finally, many lending institutions have been reluctant to lend and have significantly tightened their underwriting standards, and several clients and potential clients have exited the education loan business and may not seek our services as the economy improves. If the adverse economic environment continues, our financial condition may deteriorate for any one of the foregoing reasons.
If our clients do not actively or successfully market and fund education loans, our business will be adversely affected.
We have in the past relied, and will continue to rely in part, on our clients to market and fund education loans to borrowers. If our clients do not devote sufficient time, emphasis or resources to marketing their Monogram-based loan programs or are not successful in these efforts, then we may not reach the full potential of our capacity for disbursed loan volume and our business will be adversely affected. In addition, our lender clients’ Monogram-based loan programs, and related marketing efforts, may not necessarily extend nationwide and, in fact, may focus on a limited geographic footprint.
In addition, if education loans were or are marketed by our clients in a manner that is found to be unfair, deceptive or abusive, or if the marketing, origination or servicing violated or violates any applicable law, federal or state unfair and deceptive practices acts could impose liability or, even in limited circumstances, create defenses to the enforceability of the loan. Investigations by state Attorneys General, the CFPB, the U.S. Congress or others could have a negative impact on lenders’ desire to originate and market education loans. The Higher Education Opportunity Act creates significant additional restrictions on the marketing of education loans.
If we fail to manage our cost reductions effectively, our business could be disrupted and our financial results could be adversely affected.
We have engaged in cost reduction initiatives in the past and we may engage in cost reduction initiatives in the future. These types of cost reduction activities are complex. Even if we carry out these strategies in the manner we expect, we may not be able to achieve the efficiencies or savings we anticipate, or on the timetable we anticipate, and any expected efficiencies and benefits might be delayed or not realized, and our operations and business could be disrupted. Furthermore, we continue to experience negative net operating cash flows. Our continued use of cash to fund operations may necessitate further significant changes to our cost structure if we are unable to grow our revenue base to the level necessary to fund our ongoing operations.
In addition, cost reduction initiatives have placed and will continue to place a burden on our management, systems and resources, generally increasing our dependence on key persons and reducing functional back-ups. We must retain, train, supervise and manage our employees effectively during this period of change in our business and our ability to respond in a timely and effective fashion to unanticipated exigencies of our business model could be negatively affected during this transition. Furthermore, we believe that retaining our employees
24
may become more difficult as we face an increasingly competitive landscape with respect to talented employees as the economy continues to re-emerge from the financial crisis. We are particularly dependent on the continuing members of our management team and the loss of any of these key employees could adversely affect our business.
As part of our previous cost reduction initiatives we have terminated employees, including members of senior management. Although we believe that our capital resources as of June 30, 2013, which include proceeds of tax refunds under audit, are sufficient to satisfy our operating needs for the succeeding 12 months, we cannot assure you that they will be sufficient, particularly in light of ongoing income tax audits. See “Management’s Discussion and Analysis of Financial Condition and Results of Operations—Results of Operations—Fiscal Years ended June 30, 2013, June 30, 2012 and June 30, 2011—Overall Results—Continuing Operations—Internal Revenue Service Audit” included in Item 7 of this annual report for additional information. Insufficient funds could require us to, among other things, terminate additional employees, which could, in turn, place additional strain on any remaining employees and could further disrupt our business, including our ability to grow and expand our business.
We may outsource some borrower or client service functions in an effort to reduce costs, take advantage of technologies and effectively manage the seasonality associated with education loan volume and tuition payment processing. We rely on our vendors to provide high levels of service and support. Our reliance on external vendors subjects us to risks associated with inadequate or untimely service and could result in problems with service or support that we would not experience if we performed the service functions in-house.
If we are unable to manage our cost reductions, or if we lose key employees or are unable to attract and properly train new employees, our operations and our financial results could be adversely affected.
If competitors or potential competitors acquire or develop an education loan database or advanced loan information processing systems, our business could be adversely affected.
We own a database of historical information on education loan performance that we use to help us enhance our proprietary origination risk score model, determine the terms of portfolio funding transactions and derive the estimates and assumptions we make in preparing our consolidated financial statements and cash flow models. We have also developed a proprietary loan information processing system to enhance our application processing and loan origination capabilities. We believe that our education loan database and loan information processing system provide us with a competitive advantage in offering our services. A third party could create or acquire databases and systems such as ours, especially in light of the transition of our special servicing to third parties. As lenders and other organizations in the education loan market originate or service loans, they compile over time information for their own education loan performance database. Our competitors and potential competitors may have originated or serviced a greater volume of education loans than we have over the past several years, which may have provided them with comparatively greater borrower or loan data, particularly during the most recent economic cycle. If a third party creates or acquires an education loan database or develops a loan information processing system, our competitive positioning, ability to attract new clients and business could be adversely affected.
If we are unable to protect the confidentiality of our proprietary information and processes, the value of our services and technology could be adversely affected.
We rely on trade secret laws and restrictions on disclosure to protect our proprietary information and processes. We have entered into confidentiality agreements with third parties and with most of our employees to maintain the confidentiality of our trade secrets and proprietary information. These methods may neither effectively prevent use or disclosure of our confidential or proprietary information nor provide meaningful protection for our confidential or proprietary information if there is unauthorized use or disclosure.
We own no material patents. Accordingly, our technology, including our loan information processing systems, is not covered by patents that would preclude or inhibit competitors from entering our market. Monitoring unauthorized use of the systems and processes that we have developed is difficult, and we cannot be
25
certain that the steps that we have taken will prevent unauthorized use of our technology. Furthermore, others may independently develop substantially equivalent proprietary information and techniques or otherwise gain access to our proprietary information. If we are unable to protect the confidentiality of our proprietary information and know-how, the value of our technology and services could be adversely affected.
Our business processes are becoming increasingly dependent upon technological advancement, and we could lose clients and market share if we are not able to keep pace with rapid changes in technology.
Our future success depends, in part, on our ability to process loan applications and tuition-related payments in an automated manner with high-quality service standards. The volume of loan originations and tuition-related payments that we are able to process is based, in large part, on the systems and processes we have implemented and developed. These systems and processes are becoming increasingly dependent upon technological advancement, such as the ability to review applications and process loans and payments over the Internet, accept electronic signatures and provide initial decisions instantly. Our future success also depends, in part, on our ability to develop and implement technology solutions that anticipate and keep pace with continuing changes in technology, industry standards and client preferences. We may not be successful in anticipating or responding to these developments on a timely basis. In addition, the industry in which TMS competes has undergone rapid technological change over the past several years. We have made, and need to continue to make, investments in our technology platform in order to provide competitive products and services to our clients. If competitors in any business line introduce products, services, systems and processes that are better than ours or that gain greater market acceptance, those that we offer or use may become obsolete or noncompetitive. In addition, if we fail to execute our lender clients’ origination requirements or properly administer our clients’ credit agreement templates or required disclosures, if TMS fails to properly administer its tuition payment plans or other services or if Cology LLC fails to properly provide its education loan processing and disbursement services, we could be subject to breach of contract claims and related damages. Any one of these circumstances could have a material adverse effect on our business reputation and ability to obtain and retain clients.
We may be required to expend significant funds to develop or acquire new technologies. If we cannot offer new technologies as quickly as our competitors, we could lose clients and market share. We also could lose market share if our competitors develop more cost effective technologies than those we offer or develop.
Our business could be adversely affected if PHEAA fails to provide adequate, proper or timely services or if our relationship with PHEAA terminates.
As of June 30, 2013, PHEAA served as the sole loan servicer for our Monogram-based loan programs. Our arrangements with PHEAA allow us to avoid the overhead investment in servicing operations, but require us to rely on PHEAA to adequately service the education loans, including collecting payments, responding to borrower inquiries, effectively implementing servicing guidelines applicable to loans and communicating with borrowers whose loans have become delinquent. Reliance on PHEAA and other third parties to perform education loan servicing or collections subjects us to risks associated with inadequate, improper or untimely services. In the case of PHEAA, these risks include the failure to properly administer servicing guidelines, including forbearance programs, and failure to provide notice of developments in prepayments, delinquencies and defaults, and usage rates for forbearance programs, including alternative payment plans. In the case of third party collection agencies, these risks include failure to properly administer collections guidelines and compliance with federal and state laws and regulations relating to interactions with debtors. If our relationship with PHEAA terminates, we would either need to expand our operations or develop a relationship with another loan servicer, which could be time consuming and costly. In such event, our business could be adversely affected.
An interruption in or breach of our information systems, or those of a third party on which we rely, may result in lost business.
We rely heavily upon communications and information systems to conduct our business. Our systems and operations are potentially vulnerable to damage or interruption from network failure, hardware failure, software failure, power or telecommunications failures, computer viruses and worms, penetration of our network by
26
hackers or other unauthorized users and natural disasters. Any failure, interruption or breach in security of our information systems or the third-party information systems on which we rely could cause underwriting or other delays and could result in fewer loan applications being received, slower processing of applications or tuition-related payments and reduced efficiency in loan processing or our other services, including TMS’ and Cology LLC’s offerings. A failure, interruption or breach in security could also result in an obligation to notify clients in a number of states that require such notification, with possible civil liability and potentially large fines and penalties resulting from such failure, interruption or breach. Although we maintain and periodically test a business continuity and disaster recovery plan, the majority of our infrastructure and employees are concentrated in the Boston, Massachusetts, Providence, Rhode Island and Sacramento, California metropolitan areas. An interruption in services for any reason could adversely affect our ability to activate our contingency plan if we are unable to communicate among locations or employees.
We cannot assure you that systems failures, interruptions or breaches will not occur, or if they do occur that we or the third parties on whom we rely will adequately address them. The precautionary measures that we have implemented to avoid systems outages and to minimize the effects of any data or communication systems interruptions may not be adequate, and we may not have anticipated or addressed all of the potential events that could threaten or undermine our information systems. The occurrence of any systems failure, interruption or breach could significantly impair the reputation of our brand, diminish the attractiveness of our services and harm our business.
If we or one of our third party service providers experience a data security breach and confidential customer information is disclosed, we may be subject to penalties imposed by regulators, civil actions for damages and negative publicity, which could be costly, affect our customer relationships and have a material adverse effect on our business. In addition, state and federal legislative proposals, if enacted, may impose additional requirements on us to safeguard confidential customer information, which may result in increased compliance costs.
Data security breaches suffered by well-known companies and institutions have attracted a substantial amount of media attention, prompting state and federal legislation, legislative proposals and regulatory rule-making to address data privacy and security. Consequently, we may be subject to rapidly changing and increasingly extensive requirements intended to protect the consumer information that we process in connection with education loans and tuition payment plans. Implementation of systems and procedures to address these requirements has increased our compliance costs, and these costs may increase further as new requirements emerge. If we or one of our third party service providers were to experience a data security breach, or if we were to otherwise improperly disclose confidential customer or consumer information, such breach or other disclosure could be costly, generate negative publicity about us and adversely affect our relationships with our clients, including the lenders and educational institutions with which we do business, any of which could have a material adverse effect on our business. In addition, such pending legislative proposals and regulations, if adopted, likely would result in substantial penalties for unauthorized disclosure of confidential consumer information. Failure to comply with those requirements could result in regulatory sanctions imposed on our lender clients and loss of business for us.
We may be unable to integrate our business successfully and realize all of the anticipated benefits of our acquisition of a substantial portion of the operating assets of the Cology Sellers.
Our acquisition of a substantial portion of the operating assets of the Cology Sellers is an important transaction for us. We have made several assumptions regarding cost and revenue synergies in connection with the acquisition, many of which are dependent upon how successful we are in integrating the business of Cology LLC. The difficulties of integrating Cology LLC’s operations include, among other things:
| | • | | Consolidating corporate and administrative functions; |
| | • | | Coordinating sales and marketing functions; |
27
| | • | | Selling Monogram-based products and services to Cology LLC clients; |
| | • | | Persuading employees that the First Marblehead and Cology LLC business cultures are compatible, maintaining morale and retaining key employees; and |
| | • | | Integrating Cology LLC’s accounting, financial reporting, management, information, human resource and other administrative systems to permit effective management, and the lack of control if such integration is delayed or not implemented. |
The process of integrating operations could cause an interruption of, or loss of momentum in, the activities of each company’s business and the loss of key personnel. The diversion of management’s attention and any delays or difficulties encountered in connection with the acquisition and the integration of Cology LLC’s operations could harm our business, results of operations, financial condition or prospects and impair the value of goodwill or intangible assets.
We may face risks related to litigation that could result in significant legal expenses and settlement or damage awards.
From time to time, we are subject to claims and litigation, which could seriously harm our business and require us to incur significant costs. In the past, we have been named as a defendant in securities class action lawsuits, and on August 28, 2013, a purported class action was filed in the United States District Court for the District of Massachusetts against FMD and certain of our officers. We are generally obliged, to the extent permitted by law, to indemnify our current and former directors and officers who are named as defendants in these lawsuits. Defending against litigation may require significant attention and resources of management. Regardless of the outcome, such litigation could result in significant legal expenses.
We may also be subject to employment claims in connection with employee terminations. In addition, companies in our industry whose employees accept positions with us may claim that we have engaged in unfair hiring practices. These claims may result in material litigation. We could incur substantial costs defending ourselves or our employees against those claims, regardless of their merits. In addition, defending ourselves from those types of claims could divert our management’s attention from our operations.
If we are a party to material litigation and if the defenses we claim are ultimately unsuccessful, or if we are unable to achieve a favorable settlement, we could be liable for large damage awards that could have a material adverse effect on our business and consolidated financial statements.
Risks Related to Our Financial Reporting and Liquidity
Our liquidity could be adversely affected if the sale of the Trust Certificate does not result in the tax consequences that we expect or if we are unable to successfully resolve the pending state tax matters.
Effective March 31, 2009, we completed the sale of the Trust Certificate. In connection with the sale of the Trust Certificate, FMD entered into the Asset Services Agreement pursuant to which FMD provided various consulting and advisory services to the purchaser of the Trust Certificate. The sale generated a cash refund of federal and state income taxes previously paid of $189.3 million. The federal and state income tax consequences of the sale of the Trust Certificate, however, are complex and uncertain. The IRS has been conducting an audit of our tax returns for fiscal 2007 through fiscal 2010, including a review of the tax treatment of the sale of the Trust Certificate, as well as the $45.1 million income tax refund that we received in October 2010. We announced on August 15, 2013 that, as part of the audit process, we expected to receive a NOPA from the IRS. On September 10, 2013 we received two NOPAs from the IRS that contain the proposed adjustments that we announced on August 15, 2013. In the NOPAs, the IRS asserts that our sale of the Trust Certificate should not be recognized for federal income tax purposes primarily because we retained the economic benefits and burdens of the Trust Certificate, including, among other things, retaining certain repurchase rights and data rights. The IRS further concludes that the transaction should be characterized as a financing instead of a sale and asserts that the sale of the Trust Certificate and the execution of the Asset Services Agreement had the impact of converting
28
taxable income to the owner from an accrual basis to a cash basis. As a result, the NOPAs propose to disallow the loss that generated the tax refunds that we previously received as well as require us to include income from the Trust Certificate from the March 31, 2009 sale date through June 30, 2011 in our taxable income for such years. If the IRS’ positions are successful, the disallowance of the loss, coupled with the additional taxable income after the sale date through June 30, 2011, would create federal income tax adjustments that we estimate to be approximately $300.0 million plus interest, with the interest continuing to accrue until the matter is resolved. The NOPAs do not address tax years beyond June 30, 2011. While we did not record an accrual for this matter in our consolidated financial statements at June 30, 2013 or when we received the NOPAs, such an accrual, if it becomes necessary, could be significant and material. The determination of whether or not to accrue a liability, if any, requires a significant amount of judgment and entails, by necessity, the need to incorporate estimates.
The ongoing IRS audit or any other investigation, audit, appeals proceeding or suit relating to the sale of the Trust Certificate could result in substantial costs. A state taxing authority could also challenge our tax position in connection with the transactions, notwithstanding our receipt of any income tax refund.
In addition, we are involved in several matters relating to the Massachusetts tax treatment of GATE. We took the position in the ATB proceedings that GATE was properly taxable as a financial institution and not as a business corporation and was entitled to apportion its income under applicable provisions of Massachusetts tax law. The Massachusetts Commissioner of Revenue, or the Commissioner, took alternative positions: that GATE was properly taxable as a business corporation, or that GATE was taxable as a financial institution, but was not entitled to apportionment or was subject to 100% Massachusetts apportionment. In December 2009, the Commissioner made additional assessments of taxes, along with accrued interest, of approximately $11.9 million for GATE’s taxable years ended June 30, 2004, 2005 and 2006, and approximately $8.1 million for our taxable years ended June 30, 2005 and 2006. On November 9, 2011, the ATB issued the ATB Order which concurred with our position that GATE was a financial institution but disagreed with our methodology utilized to apportion income. In the third quarter of fiscal 2012, we made a $5.1 million payment that satisfied our obligation to the Massachusetts Department of Revenue for GATE’s taxable years ended June 30, 2004, 2005 and 2006. On April 17, 2013, the ATB issued the ATB Opinion. On July 22, 2013, we filed an appeal of certain of the ATB’s findings in the Massachusetts Appeals Court. The appeal of the ATB’s findings includes a refund claim with respect to the $5.1 million payment made in the third quarter of fiscal 2012. The Commissioner has decided not to appeal the ATB’s other findings. If we are unsuccessful in an appeal of the ATB Order, we could be required to make additional tax payments for GATE’s taxable years ended June 30, 2008 and 2009, which could materially adversely affect our liquidity position. We have accrued a total income tax liability of $25.2 million, including interest, as of June 30, 2013 related to the 2008 and 2009 tax returns for GATE, which amount was included in income taxes payable on our consolidated balance sheet. On June 29, 2013, the Massachusetts Department of Revenue delivered a notice of intent to assess for our taxable years ended June 30, 2008 and June 30, 2009. This assessment included approximately $822 thousand of additional tax liability and an assessment for penalties of $4.1 million. We have accrued for the additional tax liability, including interest, as of June 30, 2013 but have not accrued for the penalties as we believe that it is more likely than not that the penalties will ultimately be abated, which is consistent with the treatment of our taxable years ended June 30, 2004, 2005 and 2006. We cannot predict the outcome of this matter or the timing of such payments, if any, at this time.
See “Management’s Discussion and Analysis of Financial Condition and Results of Operations—Results of Operations—Fiscal Years ended June 30, 2013, June 30, 2012 and June 30, 2011—Overall Results—Continuing Operations—Internal Revenue Service Audit” included in Item 7 of this annual report, Item 3, “Legal Proceedings,” and Note 16, “Commitments and Contingencies—Income Tax Matters,” in the notes to our consolidated financial statements included in Item 8 of this annual report for additional information on these matters.
If the estimates we make, or the assumptions on which we rely, in preparing our consolidated financial statements prove inaccurate, our actual results may vary materially from those reflected in our consolidated financial statements.
Our consolidated financial statements include a number of estimates, which reflect management’s judgments. Some of our estimates also rely on certain assumptions. The most significant estimates we make
29
include the determination of which securitization trusts to consolidate, income taxes relating to uncertain tax positions under Accounting Standards Codification, or ASC, 740,Income Taxes, or ASC 740, the valuation of our service revenue receivables and deposits for participation accounts and our determination of goodwill and intangible asset impairment.
In our determination of the fair value of our service revenue receivables and deposits for participation accounts, we use discounted cash flow modeling techniques and certain assumptions to estimate fair value because there are no quoted market prices.
Our key assumptions to estimate fair value include, as applicable:
| | • | | Discount rates, which we use to estimate the present value of our future cash flows; |
| | • | | The annual rate and timing of education loan prepayments; |
| | • | | The trend of interest rates over the life of the loan pool, including the forward LIBOR curve, which is a projection of future LIBOR rates over time; |
| | • | | The expected annual rate and timing of education loan defaults, including the effects of various risk mitigation strategies, such as basic forbearance and alternative payment plans and school and lender guarantees; |
| | • | | The expected amount and timing of recoveries on defaulted education loans; and |
| | • | | The fees and expenses of the securitization trusts. |
Because our estimates rely on quantitative and qualitative factors, including our historical experience, to predict default, recovery and prepayment rates, management’s ability to determine which factors should be more heavily weighted in our estimates, and to accurately incorporate those factors into our loan performance assumptions, are subjective and can have a material effect on valuations.
If the actual performance of the education loan portfolios held by us or our clients who hold Monogram-based loans were to vary appreciably from the assumptions we use, we might need to adjust our key assumptions. Such an adjustment could materially affect our earnings in the period in which our assumptions change. In addition, our actual service revenue receivables or releases from participation accounts could be significantly less than reflected in our current consolidated financial statements. In particular, economic, regulatory, competitive and other factors affecting the key assumptions used in the cash flow model could cause or contribute to differences between actual performance of the portfolios and our other key assumptions.
We have guaranteed the performance of Union Federal’s obligations under a loan purchase and sale agreement and have agreed to provide an indemnity for third-party claims on behalf of Union Federal under an indenture. We may incur substantial costs if we have to perform obligations of Union Federal or indemnify third parties, which could have a material adverse effect on our liquidity or financial condition.
In connection with Union Federal’s sale of an education loan portfolio in October 2009, FMD delivered a performance guaranty to the purchaser of the loan portfolio. See Note 16, “Commitments and Contingencies—Performance Guaranty,” in the notes to our consolidated financial statements included in Item 8 of this annual report for additional information. If Union Federal were to default in the performance of any of its obligations or agreements under the loan purchase and sale agreement, including its indemnification or loan repurchase obligations, FMD would be required to perform such obligations. As a result, we could incur substantial costs pursuant to the performance guaranty if Union Federal were unable to perform its obligations.
In April 2010, FMD and certain of its subsidiaries entered into agreements relating to the restructuring of the education loan warehouse facility of FMD’s indirect subsidiary UFSB Private Loan SPV, LLC, or UFSB-SPV. In connection with the restructuring, FMD agreed, among other things, to provide a separate indemnity for third-party claims by or on behalf of borrowers against the third-party conduit lender under the facility based on loan origination errors under the facility. See Note 16, “Commitments and Contingencies—Indemnifications—Union Federal,” in the notes to our consolidated financial statements included in Item 8 of this annual report for
30
additional information. As a result, we may incur substantial costs in the event of a claim for damages related to the facility, which could have a material adverse effect on our liquidity or financial condition.
Changes in macro-economic conditions, including interest rates, could affect the value of our additional structural advisory fees, residual receivables, participation accounts and investments available-for-sale, as well as demand for education loans and our services.
Education loans held by us and the securitization trusts facilitated by us typically carry floating interest rates tied to prevailing short-term interest rates. Changes in interest rates could have the following effects on us:
| | • | | Higher interest rates would increase the cost of the loan to the borrower, which, in turn, could cause an increase in delinquency and default rates for outstanding education loans, as well as increased use of forbearance programs; |
| | • | | Higher interest rates, or the perception that interest rates could increase in the future, could cause an increase in full or partial prepayments; or |
| | • | | Higher interest rates could reduce borrowing for education generally, which, in turn, could cause the overall demand for our services to decline. |
In addition to higher interest rates, other factors, such as challenging economic times, including high unemployment rates, can also lead to an increase in delinquency and default rates. If the prepayment or default rates increase for the education loans held by us or our Monogram platform clients, we may experience a decline in the value of service revenue receivables and our participation accounts, as well as a decline in fees related to Monogram-based loan programs in the future, which could cause a decline in the price of our common stock and could also prevent, or make more challenging, any future portfolio funding transactions.
Economic conditions and interest rate risk could also adversely impact the fair value and the ultimate collectability of our investments available-for-sale. Changes in the fair value of investments available-for-sale are recorded as unrealized gains and losses through other comprehensive income, a component of stockholders’ equity. Should an investment be deemed “other than temporarily impaired,” we would be required to write down the carrying value of the investment through earnings. Such write down(s) may have a material adverse effect on our financial condition and results of operations.
If sufficient funds to finance our business and meet our obligations are not available to us when needed or on acceptable terms, we may be required to delay, scale back, otherwise alter our strategy or cease operations.
We have generated significant net losses since fiscal 2008, and we cannot predict at this time when or if we will return to profitability. Furthermore, while we have made progress towards reducing our overall cash needs, we continue to utilize significant levels of cash to fund the many priorities required of a diverse business such as ours. We may require additional funds for our products, operating expenses, including expenditures relating to TMS and Cology LLC, capital in connection with credit enhancement arrangements for Monogram-based loan programs or capital markets financings, the pursuit of regulatory approvals, acquisition opportunities and the expansion of our capabilities. Historically, we have satisfied our funding needs primarily through fees earned from education loan asset-backed securitizations. We have not accessed the securitization market since fiscal 2008, and the securitization market may not be accessible to us in the future or, if available, not on terms that are acceptable to us. We have also satisfied our funding needs through equity financings. We cannot be certain that additional public or private financing would be available in amounts or on terms acceptable to us, if at all.
Although we believe that our capital resources as of June 30, 2013, which include proceeds of tax refunds under audit, are sufficient to satisfy our operating needs for the succeeding 12 months, we cannot assure you that they will be sufficient, particularly in light of ongoing federal and state income tax audits. In particular, as we announced on August 15, 2013, as part of the audit process, we expected to receive a NOPA from the IRS. On September 10, 2013 we received two NOPAs from the IRS that contain the proposed adjustments that we announced on August 15, 2013. The NOPAs propose to disallow the loss that generated the tax refunds that we
31
previously received as well as require us to include income from the Trust Certificate from the March 31, 2009 sale date through June 30, 2011 in our taxable income for such years. If the IRS’ positions are successful, the disallowance of the loss, coupled with the additional taxable income after the sale date through June 30, 2011, would create federal income tax adjustments that we estimate to be approximately $300.0 million plus interest, with the interest continuing to accrue until the matter is resolved. The NOPAs do not address tax years beyond June 30, 2011. See “Management’s Discussion and Analysis of Financial Condition and Results of Operations—Results of Operations—Fiscal Years ended June 30, 2013, June 30, 2012 and June 30, 2011—Overall Results—Continuing Operations—Internal Revenue Service Audit” included in Item 7 of this annual report for additional information.
Insufficient funds could require us to delay, scale back or eliminate certain of our products, eliminate our ability to provide credit enhancement commitments to prospective clients relating to Monogram-based loan programs, curtail, delay or terminate plans for TMS or Cology LLC, terminate personnel, further scale back our expenses or cease operations. In addition, our short-term financing needs are subject to regulatory capital requirements related to Union Federal. See Note 25, “Union Federal Regulatory Matters,” in the notes to our consolidated financial statements included in Item 8 of this annual report for additional information.
A significant portion of the purchase price for our acquisition of TMS and our acquisition of a substantial portion of the operating assets of the Cology Sellers is allocated to goodwill and intangible assets that are subject to periodic impairment evaluations. An impairment loss could have a material adverse impact on our financial condition and results of operations.
At June 30, 2013, we had $20.1 million of goodwill and $24.1 million of intangible assets related to our acquisition of TMS and our acquisition of a substantial portion of the operating assets of the Cology Sellers. As required by current accounting standards, we review intangible assets for impairment either annually or whenever changes in circumstances indicate that the carrying value may not be recoverable.
The risk of impairment to goodwill is higher during the early years following an acquisition. This is because the fair values of these assets align very closely with what we paid to acquire the reporting units to which these assets are assigned. As a result, the difference between the carrying value of the reporting unit and its fair value (typically referred to as “headroom”) is smaller at the time of acquisition. Until this headroom grows over time, due to business growth or lower carrying value of the reporting unit, a relatively small decrease in reporting unit fair value can trigger impairment charges. When impairment charges are triggered, they tend to be material due to the size of the assets involved. TMS’ business would be adversely affected, and impairment of goodwill could be triggered, if any of the following were to occur: higher attrition rates than planned as a result of the competitive environment or our inability to provide products and services that are competitive in the marketplace, lower-than-planned adoption rates of refund management and Student Account Center products, higher-than-expected expense levels to provide services to TMS clients, a lower interest rate environment than depicted by the LIBOR curve, shorter hold periods or lower cash balances than contemplated, which would reduce overall net interest income opportunity for cash that is held by us on behalf of TMS’ school clients, increases in equity returns required by investors and changes in our business model that may impact one or more of these variables. Cology LLC’s business would be adversely affected, and impairment of goodwill could be triggered, if any of the following were to occur: higher attrition rates than planned, a lack of acceptance of Monogram products and services by its credit union clients, higher-than-expected expense levels to provide services to Cology LLC clients and changes in our business model that may impact one or more of these variables.
We may be required to consolidate and deconsolidate VIEs in the future, which would result in significant changes to the presentation of our consolidated financial statements and may result in increased volatility in our reported financial condition and results of operations.
Effective July 1, 2010, we adopted Accounting Standards Update, or ASU, 2009-16,Transfers and Servicing (Topic 860)—Accounting for Transfers of Financial Assets, or ASU2009-16, and ASU 2009-17,Consolidation (Topic 810)—Improvement to Financial Reporting by Enterprises Involved With Variable Interest Entities,or ASU 2009-17, which amended the accounting for consolidation of variable interest entities, or VIEs.
32
We are required to continually reassess our involvement with each VIE in which we have an interest, both on- and off-balance sheet, and our determination of whether consolidation or deconsolidation of a VIE is appropriate.
ASU 2009-17 requires us to make additional judgments that are subject to change based on new facts and circumstances, and evolving interpretations and practices. Under ASU 2009-17, the determination of whether to consolidate a VIE is based on whether the company is considered to be the primary beneficiary. Such determination is based on both the power to direct the activities of the entity that most significantly impact the entity’s economic performance, and the obligation to absorb losses or the right to receive benefits that could be significant to the entity. The nature of these determinations, made on an entity-by-entity basis, requires a high level of subjectivity and judgment. As a result, determinations that we make from time to time will be susceptible to change.
The accounting for these matters is complex. Changes in circumstances or technical interpretations of ASU 2009-17 could result in additional consolidation or deconsolidation of VIEs, which could materially affect our consolidated financial statements and make analysis of our financial standing difficult. As we continue to execute our business model, we may be required to consolidate future financing transactions in accordance with ASU 2009-17.
We continue to monitor our involvement with nine off-balance sheet VIEs for which we have determined that we are not the primary beneficiary due to the sole, unilateral rights of other parties to terminate us in our role as service provider or due to a lack of obligation on our part to absorb benefits or losses of the VIE that would be significant to that VIE. A significant change to the pertinent rights of other parties or us, or a significant change to the range of possible financial performance outcomes used in our assessment of the variability of cash flows due to us, could cause us to change our determination of whether or not a VIE should be consolidated in future periods. Given the size of each of our VIEs, any decision to consolidate or deconsolidate a VIE could result in significant changes to our reported assets and liabilities and results of operations during the fiscal quarter in which the change occurs and could make comparisons of our financial performance between periods challenging to investors. For example, in fiscal 2011, we consolidated certain securitization trusts that were subsequently deconsolidated in fiscal 2012. See Note 3, “Discontinued Operations,” in the notes to our consolidated financial statements included in Item 8 of this annual report for additional information.
Risks Related to Asset-Backed Securitizations and Other Funding Sources
Our financial results and future growth may continue to be adversely affected if we are unable to structure securitizations or alternative financings.
Although our Monogram platform has been designed to generate recurring revenues with less dependence on the securitization market and third-party credit enhancement than our prior business model, a return to profitability is dependent on a number of factors, including the facilitation of loan volumes substantially in excess of those that we have originated to date, and substantially in excess of those contemplated by our four lender clients’ Monogram-based loan programs or other financing alternatives, expense management and growth at TMS, Cology LLC and Union Federal. Accordingly, our future financial results and growth may continue to be affected by our inability to structure securitizations or alternative financing transactions involving education loans on terms acceptable to us. In particular, such transactions may enable us to generate fee revenues or access and recycle capital previously deployed as credit enhancement for interim financing facilities. If we are able to facilitate securitizations in the near-term, we expect the structure and economics of the transactions to be substantially different from our past transactions, including lower revenues and lower advance rates.
If our inability to access the ABS market on acceptable terms continues, our revenues may continue to be adversely impacted, and we may continue to generate net losses, which would further erode our liquidity position.
A number of factors, some of which are beyond our control, have adversely affected or may adversely affect our portfolio funding activities and thereby adversely affect our results of operations.
33
The success of our business may depend on our ability to structure securitizations or other funding transactions for our clients’ loan portfolios. Several factors have had, or may have, a material adverse effect on both our ability to structure funding transactions and the revenue we may generate for providing our structural advisory and other services, including the following:
| | • | | Volatility in the capital markets generally or in the education loan ABS sector specifically, which could restrict or delay our access to the capital markets; |
| | • | | The timing and size of education loan asset-backed securitizations that other parties facilitate, or the adverse performance of, or other problems with, such securitizations, which could impact pricing or demand for our future securitizations, if any; |
| | • | | Challenges to the enforceability of education loans based on violations of federal or state consumer protection or licensing laws and related regulations, or imposition of penalties or liabilities on assignees of education loans for violation of such laws and regulations; |
| | • | | Our inability to structure and gain market acceptance for new products or services to meet new demands of ABS investors, rating agencies or credit facility providers; and |
| | • | | Changes to bankruptcy laws that change the current non-dischargeable status of private education loans, which could materially adversely affect the profitability of the loan portfolios if applied to loans originated prior to the date of the change. |
Recent legislation will affect the terms of future securitization transactions.
The SEC has proposed new rules governing ABS issuance that, due to the requirements for risk retention, may affect the desirability of issuing ABS as a funding strategy. In addition, the Dodd-Frank Act grants federal banking regulators substantial discretion in developing specific risk retention requirements for all types of consumer credit products and requires the SEC to establish new data requirements for all issuers, including standards for data format, asset-level or loan-level data, the nature and extent of the compensation of the broker or originator and the amount of risk retention required by loan securitizers.
The Dodd-Frank Act and its implementing regulations, once adopted, will affect the terms of future securitization transactions, if any, that we facilitate and may result in greater risk retention and less flexibility for us in structuring such transactions.
In structuring and facilitating securitizations of our clients’ education loans, administering securitization trusts or providing portfolio management, we may incur liabilities to transaction parties.
We facilitated and structured a number of special purpose trusts that have been used in securitizations to finance education loans that our clients originated, including securitization trusts that have issued auction rate notes. Under applicable state and federal securities laws, if investors incur losses as a result of purchasing ABS that those securitization trusts have issued, we could be deemed responsible and could be liable to those investors for damages. We could also be liable to investors or other parties for certain updated information that we have provided subsequent to the original ABS issuances by the trusts. If we have failed to cause the securitization trusts or other transaction parties to disclose adequately all material information regarding an investment in any securities, if we or the trusts made statements that were misleading in any material respect in information delivered to investors in any securities or if we breached any duties as the structuring advisor, administrator or special servicer of the securitization trusts, it is possible that we could be sued and ultimately held liable to an investor or other transaction party. This risk includes failure to properly administer or oversee servicing or collections guidelines and may increase if the performance of the securitization trusts’ loan portfolios degrades, and rating agencies over the past several years have downgraded various ABS issued by the trusts we facilitated. Investigations by state Attorneys General, as well as private litigation, have focused on auction rate securities, including the marketing and trading of such securities. It is possible that we could become involved in such matters in the future. In addition, under various agreements entered into with underwriters or financial guaranty insurers of those ABS, as well as certain lenders, we are contractually bound to indemnify those persons if an
34
investor is successful in seeking to recover any loss from those parties and the securitization trusts are found to have made a materially misleading statement or to have omitted material information.
If we are liable to an investor or other transaction party for a loss incurred in any of the securitizations that we have facilitated or structured and any insurance that we may have does not cover this liability or proves to be insufficient, our results of operations or financial position could be materially adversely affected.
We may determine to incur near-term losses based on longer-term strategic considerations.
We may consider long-term strategic considerations more important than near-term economic gains when assessing business arrangements and opportunities, including financing arrangements for education loans. For example, we expect the structure and pricing terms in near-term future securitization transactions, if any, to be substantially different from our past transactions, including lower revenues and lower advance rates. We may nevertheless determine to participate in, or structure, future financing transactions based on longer-term strategic considerations. As a result, net cash flows over the life of a future securitization trust, particularly any trust that we may facilitate in the near-term as we re-enter the securitization market, could be negative as a result of transaction size, transaction expenses or financing costs.
Risks Related to Regulatory Matters
We are subject to, or will become subject to, new supervision and regulations which could increase our costs of compliance and alter our business practices.
Various regulators have increased diligence and enforcement efforts and new laws and regulations have been passed or are under consideration in the U.S. Congress as a result of turbulence in the financial services industry. The Dodd-Frank Act requires various federal agencies to adopt a broad range of new implementing rules and regulations, and the federal agencies are given significant discretion in drafting the implementing rules and regulations. Consequently, many of the details and much of the impact of the Dodd-Frank Act may not be known for many months or years.
As a federal savings bank, Union Federal’s primary bank regulator is the OCC. As a thrift holding company, FMD is regulated by the Federal Reserve. The Dodd-Frank Act imposes consolidated capital requirements on savings and loan holding companies, but these requirements are not effective until five years after enactment of the Dodd-Frank Act.
The Dodd-Frank Act established the CFPB as an independent agency within the Federal Reserve. The CFPB has been given broad powers, including the power to:
| | • | | Supervise non-depository institutions, including those that offer or provide education loans; |
| | • | | Supervise depository institutions with assets of $10 billion or more for compliance with consumer protection laws, as well as the service providers to such institutions; |
| | • | | Regulate consumer financial products, including education loans, and services offered primarily for personal, family or household purposes; |
| | • | | Promulgate rules with respect to unfair, deceptive or abusive practices; and |
| | • | | Take enforcement action against institutions under its supervision. |
The CFPB may institute regulatory measures that directly impact our business operations. The CFPB has initiated an examination program of non-depository institutions (which could include service providers such as FMER). The FTC maintains parallel authority to enforce Section 5 of the Federal Trade Commission Act prohibiting unfair or deceptive acts or practices against non-depository financial providers, such as FMER, TMS and Cology LLC. The OCC maintains parallel authority to enforce Section 5 of the Federal Trade Commission Act against federal savings associations, such as Union Federal, as well as authority to examine and supervise federal savings associations with assets of less than $10 billion, such as Union Federal, for compliance with consumer protection laws.
35
The CFPB has significant rulemaking and enforcement powers and the potential reach of the CFPB’s broad new rulemaking powers and enforcement authority on the operations of financial institutions offering consumer financial products or services, including FMD, is currently unknown. In addition, the Dodd-Frank Act established a Student Loan Ombudsman within the CFPB, who, among other things, receives, reviews and attempts to resolve informally complaints from education loan borrowers. To date, the Student Loan Ombudsman has only issued the Report, which noted concerns that private education loan borrowers may not have fully understood all the terms and conditions of their different loans. As a result, we expect private education loan marketing practices to be carefully scrutinized.
The CFPB’s initiatives and similar efforts with respect to other credit and retail banking products, could increase our costs and the complexity of our operations. See “Business—Government Regulation” included in Item 1 of this annual report for additional information.
The Dodd-Frank Act also includes several provisions that could affect our future portfolio funding transactions, if any, including potential risk retention requirements applicable to any entity that organizes and initiates an ABS transaction, new disclosure and reporting requirements for each tranche of ABS, including new loan-level data requirements, and new disclosure requirements relating to the representations, warranties and enforcement mechanisms available to ABS investors. The Dodd-Frank Act may have a material impact on our operations, including through increased operating and compliance costs.
We are subject to regulation as a savings and loan holding company, and Union Federal is regulated extensively. We could incur additional costs in complying with regulations applicable to savings and loan holding companies and savings banks, or significant penalties if we fail to comply.
As a result of our acquisition of Union Federal in November 2006, we became subject to regulation as a savings and loan holding company, and our business is limited to activities that are financial or real-estate related. FMD is subject to regulation, supervision and examination by the Federal Reserve. The Federal Reserve and the OCC each have certain types of enforcement authority over us, including the ability in certain circumstances to review and approve changes in management and compensation arrangements, issue cease-and-desist orders, force divestiture of Union Federal and impose civil and monetary penalties for violations of federal banking laws and regulations or for unsafe or unsound banking practices. Any such actions could adversely affect our reputation, liquidity or ability to execute our business plan. In addition, we could incur additional costs in complying with differing interpretations by these new regulators, or significant penalties if we fail to comply.
Union Federal is subject to regulation, supervision and examination by the OCC and the FDIC. Such regulation covers all banking business, including activities and investments, lending practices, safeguarding deposits, capitalization, risk management policies and procedures, relationships with affiliated companies, efforts to combat money laundering, recordkeeping and conduct and qualifications of personnel. In particular, the failure to meet minimum capital requirements could result in initiation of certain mandatory, and possibly additional discretionary, actions by regulators that, if undertaken, could have a material adverse effect on our operations and our consolidated financial statements. We have in the past been required to make capital contributions to Union Federal, and regulatory authorities could require us to make additional capital contributions or to take other corrective measures in the future.
We could incur additional costs in complying with regulations applicable to savings and loan holding companies and savings banks, or significant penalties if we fail to comply. Our ability to comply with all applicable laws and rules depends largely on our establishment and maintenance of a system to ensure such compliance, as well as our ability to attract and retain qualified compliance personnel. Further reductions in staffing levels could make it difficult to retain experienced personnel to maintain adequate internal controls related to regulatory matters. If severe failures in internal controls occur, regulatory authorities could impose sanctions on Union Federal or us. We could in the future be subject to supervisory orders to cease and desist, civil monetary penalties or other actions due to claimed noncompliance, which could have an adverse effect on our business, financial condition and operating results.
36
We may become subject to additional state registration or licensing requirements, which could increase our compliance costs significantly and may result in other adverse consequences.
Many states have statutes and regulations that require the licensure of small loan lenders, loan brokers, credit services organizations, loan arrangers and collection agencies. Some of these statutes are drafted or interpreted to cover a broad scope of activities. While we believe we have satisfied all material licensing, registration and other regulatory requirements that could be applicable to us based on current laws and the manner in which we currently conduct business, we may determine that we need to submit additional license applications, and we may otherwise become subject to additional state licensing, registration and other regulatory requirements in the future. In particular, certain state licenses or registrations may be required if we change our operations, if regulators reconsider their prior guidance or if federal or state laws or regulations are changed. Even if we are not physically present in a state, its regulators may take the position that registration or licensing is required because we provide services to borrowers located in the state by mail, telephone, the Internet or other remote means.
To the extent that our services are conducted through Union Federal, state requirements for licensure are inapplicable. However, as a result of the enactment of the Dodd-Frank Act and the reduced preemption enjoyed by federal savings banks resulting from the Dodd-Frank Act, we may now be subject to state consumer protection laws in each state where we do business and those laws may be interpreted and enforced differently in different states. We will continue to review state registration and licensing requirements, and we intend to pursue registration or licensing in applicable jurisdictions where we are not currently registered or licensed if we elect to operate through an entity that does not enjoy federal preemption of such registration or licensing requirements. We cannot assure you that we will be successful in obtaining additional state licenses or registrations in a timely manner, or at all. If we determine that additional state registrations or licenses are necessary, we may be required to delay or restructure our activities in a manner that will not subject us to such licensing or registration requirements. Compliance with state licensing requirements could involve additional costs or delays, which could have a material adverse effect on our business. Our failure to comply with these laws could lead to, among other things:
| | • | | Curtailment of our ability to continue to conduct business in the relevant jurisdiction, pending a return to compliance or processing of registration or a license application; |
| | • | | Administrative enforcement actions; |
| | • | | The assertion of legal defenses delaying or otherwise affecting the enforcement of loans; and |
| | • | | Criminal as well as civil liability. |
Any of the foregoing could have a material adverse effect on our business.
We may be exposed to liability for failures of third parties with which we do business to comply with the registration, licensing and other requirements that apply to them.
Third parties with which we do, or have done, business, including federal and state chartered financial institutions and non-bank loan marketers, are subject to registration, licensing and governmental regulations, including TILA and other consumer protection laws and regulations. For example, some of the third-party marketers with which we have done or may do business may be subject to state registration or licensing requirements and laws and regulations, including those relating to loan brokers, small loan lenders, credit services organizations, loan arrangers and collection agencies. As a result of the activities that we conduct or may conduct for our clients, it may be asserted that we have some responsibility for compliance by third parties with whom we do business with the laws and regulations applicable to them, whether on contractual or other grounds. If it is determined that we have failed to comply with our obligations with respect to these third parties, we could be subject to civil or criminal liability. Even if we bear no legal liability for the actions of these third parties, the imposition of licensing and registration requirements on them, or any sanctions against them for conducting business without a license or registration, may reduce the volume of loans we process from them in the future.
37
Failure to comply with consumer protection laws could subject us to civil and criminal penalties or litigation, including class actions, and have a material adverse effect on our business.
We are subject to a broad range of federal and state consumer protection laws applicable to our student lending, mortgage lending and other retail banking activities, including laws governing fair lending, unfair, deceptive and abusive acts and practices, service member protections, interest rates and loan fees, disclosures of loan terms, marketing, brokering, servicing, collections and foreclosure.
Violations or changes in federal or state consumer protection laws or related regulations, or in the prevailing interpretations thereof, may expose us to litigation, result in greater compliance costs, constrain the marketing of education loans, adversely affect the collection of balances due on the loan assets held by securitization trusts or otherwise adversely affect our business. We could incur substantial additional expense complying with these requirements and may be required to create new processes and information systems. Moreover, changes in federal or state consumer protection laws and related regulations, or in the prevailing interpretations thereof, could invalidate or call into question the legality of certain of our services and business practices.
Violations of the laws or regulations governing our operations, or the operations of our clients, could result in the imposition of civil or criminal penalties, the cancellation of our contracts to provide services or our exclusion from participating in education loan programs. These penalties or exclusions, were they to occur, would impair our business reputation and ability to operate our business. In some cases, such violations may render the loan assets unenforceable.
Recent legislative proposals could affect the non-dischargeability of education loans in bankruptcy. If the legislative proposals are enacted, it could adversely affect the loan portfolios under our Monogram platform, including loans for which we have provided credit enhancements with our partnered lenders, and adversely affect the overall desirability of private education loan assets to investors.
Under current law, education loans can be discharged in bankruptcy only upon a court finding of “undue hardship” if the borrower were required to continue to make loan payments. Legislation has been introduced in both houses of Congress that would generally end the bankruptcy exemption from dischargeability for certain private education loans. If enacted as initially proposed, this legislation would apply retroactively to private education loans already made, and would not require the borrower to make any payments before seeking discharge in bankruptcy. This legislation is substantially similar to legislation that was introduced in both houses of Congress in the last Congress. If enacted in this Congress, such legislation may adversely affect the performance of the education loans under our Monogram platform, restrict the availability of capital to fund education loans and increase loan pricing to borrowers to compensate for the additional risk of bankruptcy discharge, which could adversely affect the competitiveness of our Monogram platform and our ability to engage lenders to fund loans based on our Monogram platform.
In addition, the July 2012 report on private education lending released by the CFPB recommended that the U.S. Congress reconsider the advisability of continuing the current non-dischargeable status of private education loans.
Recent litigation has sought to re-characterize certain loan marketers and other originators as lenders; if litigation on similar theories were successful against us or any third-party marketer we work with, the education loans that we facilitate would be subject to individual state consumer protection laws.
A majority of the lenders with which we work are federally-insured banks and credit unions. As a result, they are able to charge the interest rates, fees and other charges available to the most favored lender in their home state. In addition, our lender clients or prospective lender clients may be chartered by the federal government and enjoy preemption from enforcement of state consumer protection laws. In providing our education loan services to our lender clients, we do not act as a lender, guarantor or loan servicer, and the terms of the education loans that we facilitate are regulated in accordance with the laws and regulations applicable to the lenders.
The association between marketers of high-interest “payday” loans, tax-return anticipation loans, or subprime credit cards, and online payment services, on the one hand, and banks, on the other hand, has come
38
under recent scrutiny. Recent litigation asserts that loan marketers use lenders with a bank charter that authorizes the lender to charge the most favored interest rate available in the lender’s home state in order to evade usury and interest rate caps, and other consumer protection laws imposed by the states where they do business. Such litigation has sought, successfully in some instances, to re-characterize the loan marketer as the lender for purposes of state consumer protection law restrictions. Similar civil actions have been brought in the context of gift cards. Moreover, federal banking regulators and the FTC have undertaken enforcement actions challenging the activities of certain loan marketers and their bank partners, particularly in the context of subprime credit cards. We believe that our activities, and the activities of third parties whose marketing on behalf of lenders may be coordinated by us, are distinguishable from the activities involved in these cases.
Additional state consumer protection laws would be applicable to the education loans we facilitate if we, or any third-party loan marketer engaged by us, were re-characterized as a lender, and the education loans (or the provisions governing interest rates, fees and other charges) could be unenforceable unless we or a third-party loan marketer had the requisite licenses or other authority to make such loans. In addition, we could be subject to claims by consumers, as well as enforcement actions by regulators. Even if we were not required to cease doing business with residents of certain states or to change our business practices to comply with applicable laws and regulations, we could be required to register or obtain licenses or regulatory approvals that could impose a substantial delay or cost to us. There have been no actions taken or threatened against us on the theory that we have engaged in unauthorized lending; however, if such actions occurred, they could have a material adverse effect on our business.
Risks Related to Ownership of Our Common Stock
The price of our common stock may be volatile.
The trading price of our common stock may fluctuate substantially, depending on many factors, some of which are beyond our control and may not be related to our operating performance. These fluctuations could cause you to lose part or all of your investment in your shares of our common stock. Those factors that could cause fluctuations include, but are not limited to, the following:
| | • | | The success of our Monogram platform, our fee-for-service offerings, our TMS offerings and our Cology LLC offerings; |
| | • | | Announcements by us, our competitors or our potential competitors of acquisitions, new products or services, significant contracts, commercial relationships or capital markets activities; |
| | • | | Actual or anticipated changes in our earnings or fluctuations in our operating results or in the expectations of securities analysts, including as a result of the timing, size or structure of any portfolio funding transactions; |
| | • | | Developments or the perception of developments in litigation or proceedings in which we are involved, including any challenges to tax refunds previously received in the amounts of $176.6 million and $45.1 million as a result of the ongoing IRS audit of our past tax returns, including as a result of the NOPAs we received on September 10, 2013, the resolution of our appeal of the ATB Order in the cases pertaining to our Massachusetts state income tax return and the purported class action filed against FMD and certain of our officers in the United States District Court for the District of Massachusetts in August 2013; |
| | • | | Difficulties we may encounter in structuring securitizations or alternative financings, including disruptions in the education loan ABS market or demand for securities offered by securitization trusts that we facilitate, or the loss of opportunities to structure securitization transactions; |
| | • | | General economic conditions and trends, including unemployment rates and economic pressure on consumer asset classes such as education loans; |
| | • | | Legislative initiatives affecting federal or private education loans, including initiatives relating to bankruptcy dischargeability and the federal budget and regulations implementing the Dodd-Frank Act; |
39
| | • | | Changes in the education finance marketplace generally; |
| | • | | Negative publicity about the education loan market generally or us specifically; |
| | • | | Regulatory developments or sanctions directed at Union Federal or us; |
| | • | | Application of accounting policies and pronouncements, and their effects on our reported financial condition and results of operations, including future determinations under ASU 2009-17 to consolidate or deconsolidate VIEs; |
| | • | | Price and volume fluctuations in the overall stock market and volatility in the ABS market, from time to time; |
| | • | | Delisting of our common stock from the New York Stock Exchange, or NYSE, for failure to comply with NYSE continued listing standards, including without limitation, the NYSE’s average closing price standard; |
| | • | | Significant volatility in the market price and trading volume of financial services and process outsourcing companies; |
| | • | | Major catastrophic events; |
| | • | | Purchases or sales of large blocks of our common stock or other strategic investments involving us; |
| | • | | Dilution from raising capital through a stock or other equity instrument issuance; or |
| | • | | Departures or long-term unavailability of key personnel, including FMD’s Chief Executive Officer, who we believe has unique insights and experience at this point of change in our business and the education loan industry. |
Securities class action litigation has often been brought against companies following periods of volatility in the market price of their securities. In August 2013, a purported class action was filed against us and certain of our current officers in the United States District Court for the District of Massachusetts. The plaintiff alleges, among other things, that the defendants made false and misleading statements and failed to disclose material information in various SEC filings, press releases and other public statements concerning our corporate income tax filings. The complaint alleges various claims under the Exchange Act and Rule 10b-5 promulgated thereunder. The complaint seeks, among other relief, class certification, unspecified damages, fees and such other relief as the court may deem just and proper. No class has been certified in the action.
We intend to vigorously assert our defenses, however, there can be no assurance that we will be successful, and regardless of the merits of our defenses, the price of our common stock could be adversely affected by a perception of risk in connection with this lawsuit, including any such perception that may arise out of any developments adverse to us with respect to this lawsuit. In addition, adverse developments and/or an adverse resolution of the lawsuit could have a material effect on our consolidated financial position and results of operations, which could, in turn, have a negative effect on the price of our common stock. Although we carry insurance for these types of claims, we are not presently able to reasonably estimate potential losses, if any, related to the lawsuit and a judgment significantly in excess of our insurance coverage could materially and adversely affect our financial condition, results of operations and cash flows.
Stockholders that own large blocks of our common stock could exercise substantial control over us and could limit your ability to influence the outcome of key transactions, including a change of control.
There are certain investors that hold large blocks of our common stock, which could impact the outcome of key transactions. In addition, our directors and executive officers owned approximately 8.7% of the outstanding shares of our common stock as of June 30, 2013, excluding shares issuable upon vesting of outstanding restricted stock units and shares issuable upon exercise of outstanding vested stock options. These stockholders, if acting together, could substantially influence matters requiring approval by our stockholders, including the election of directors and the approval of mergers or other extraordinary transactions. They may also have interests that differ from yours and may vote in a way with which you disagree and which may be adverse to your interests. The
40
concentration of ownership may have the effect of delaying, preventing or deterring a change of control of our company, could deprive our stockholders of an opportunity to receive a premium for their common stock as part of a sale of our company and might ultimately affect the market price of our common stock.
Some provisions in our restated certificate of incorporation and amended and restated by-laws may deter third parties from acquiring us.
Our restated certificate of incorporation and amended and restated by-laws contain provisions that may make the acquisition of our company more difficult without the approval of the FMD Board of Directors, including the following:
| | • | | Only the FMD Board of Directors, our Chairman of the Board or our President may call special meetings of our stockholders; |
| | • | | Our stockholders may take action only at a meeting of our stockholders and not by written consent; |
| | • | | We have authorized undesignated preferred stock, the terms of which may be established and shares of which may be issued without stockholder approval; |
| | • | | Our directors may be removed only for cause by the affirmative vote of a majority of the directors present at a meeting duly held at which a quorum is present, or by the holders of 75% of the votes that all stockholders would be entitled to cast in the election of directors; and |
| | • | | We impose advance notice requirements for stockholder proposals. |
These anti-takeover defenses could discourage, delay or prevent a transaction involving a change in control of our company. These provisions could also discourage proxy contests and make it more difficult for you and other stockholders to elect directors of your choosing or cause us to take other corporate actions you desire.
Section 203 of the Delaware General Corporation Law may delay, defer or prevent a change in control that our stockholders might consider to be in their best interests.
We are subject to Section 203 of the Delaware General Corporation Law which, subject to certain exceptions, prohibits “business combinations” between a Delaware corporation and an “interested stockholder,” which is generally defined as a stockholder who becomes a beneficial owner of 15% or more of a Delaware corporation’s voting stock, for a three-year period following the date that such stockholder became an interested stockholder. Section 203 could have the effect of delaying, deferring or preventing a change in control that our stockholders might consider to be in their best interests.
| Item 1B. | Unresolved Staff Comments |
None.
We lease buildings for our executive offices and operations. Our headquarters are located in Boston, Massachusetts, and we have additional offices in Medford, Massachusetts, North Providence, Rhode Island, Warwick, Rhode Island, Mather, California, Scottsdale, Arizona, Bryan, Texas and Bedford, Massachusetts.
The following table summarizes information as of September 13, 2013 with respect to the principal facilities that we lease:
| | | | | | | | |
Location | | Principal activities | | Area
(sq. feet) | | | Lease
expiration
date |
Boston, MA (Boylston Street) | | Headquarters | | | 57,647 | | | 2014 |
Boston, MA (St. James Avenue) | | None | | | 135,719 | | | 2014 |
Medford, MA | | Loan Processing | | | 84,458 | | | 2017 |
41
| | | | | | | | |
Location | | Principal activities | | Area
(sq. feet) | | | Lease
expiration
date |
North Providence, RI | | Union Federal | | | 13,064 | | | 2017 |
Warwick, RI | | TMS | | | 27,250 | | | 2015 |
Mather, CA | | Cology LLC | | | 10,297 | | | 2016 |
Scottsdale, AZ | | Cology LLC Headquarters | | | 2,911 | | | 2016 |
Bryan, TX | | Cology LLC Loan Processing | | | 1,944 | | | 2015 |
Bedford, MA | | Information Technology | | | 3,000 | | | 2015 |
In connection with our expense control initiatives, we have sought to reduce our occupancy costs. In particular:
| | • | | We have subleased all 135,719 square feet of our Boston, Massachusetts (St. James Avenue) location through April 30, 2014. |
| | • | | The lease relating to our Medford, Massachusetts location originally covered 153,156 square feet. In November 2010, we amended the lease which, among other things, reduced the rented space by 59,790 square feet as of April 1, 2011 and extended the term of the lease to March 31, 2017. In July 2011, we further reduced the leased space by 8,908 square feet. |
| | • | | In June 2011, we entered into a sublease agreement reducing our rented space at our corporate headquarters in Boston, Massachusetts (Boylston Street) by 27,587 square feet from July 1, 2011 through the remainder of our lease term. |
We do not anticipate significant difficulty in obtaining lease renewals or alternate space as needed.
Internal Revenue Service Audit
Effective March 31, 2009, we completed the sale of the Trust Certificate. In connection with the sale of the Trust Certificate, FMD entered into the Asset Services Agreement pursuant to which FMD provided various consulting and advisory services to the purchaser of the Trust Certificate. As a result of the sale of the Trust Certificate, as well as our operating losses incurred in fiscal 2009, we recorded an income tax receivable for federal income taxes paid on taxable income in prior fiscal years. In fiscal 2010, we received a total of $189.3 million in federal and state income tax refunds related to our income tax receivables. In April 2010, the IRS commenced an audit of our tax returns for fiscal 2007 through fiscal 2009, including a review of the tax treatment of the sale of the Trust Certificate. Such audits are consistent with the practice of the Joint Committee of Taxation, which requires the IRS to perform additional procedures, up to and including an audit of a taxpayer who receives a tax refund in excess of $2.0 million. The IRS is also auditing our fiscal 2010 tax return in light of the $45.1 million income tax refund that we received in October 2010. We cannot predict the timing or outcome of the IRS audit.
We announced on August 15, 2013 that, as part of the audit process, we expected to receive a NOPA from the IRS. On September 10, 2013 we received two NOPAs from the IRS that contain the proposed adjustments that we announced on August 15, 2013. In the NOPAs, the IRS asserts that our sale of the Trust Certificate should not be recognized for federal income tax purposes primarily because we retained the economic benefits and burdens of the Trust Certificate, including, among other things, retaining certain repurchase rights and data rights. The IRS further concludes that the transaction should be characterized as a financing instead of a sale and asserts that the sale of the Trust Certificate and the execution of the Asset Services Agreement had the impact of converting taxable income to the owner from an accrual basis to a cash basis. As a result, the NOPAs propose to disallow the loss that generated the tax refunds that we previously received as well as require us to include income from the Trust Certificate from the March 31, 2009 sale date through June 30, 2011 in our taxable income for such years. If the IRS’ positions are successful, the disallowance of the loss, coupled with the additional taxable income after the sale date through June 30, 2011, would create federal income tax adjustments
42
that we estimate to be approximately $300.0 million plus interest, with the interest continuing to accrue until the matter is resolved. The NOPAs do not address tax years beyond June 30, 2011. The NOPAs are only initial IRS positions and not final determinations and, as a result, do not require any tax payment at this time.
The determination of whether or not to accrue a liability, if any, requires a significant amount of judgment and entails, by necessity, the need to incorporate estimates. We have considered the requirements of ASC 740, the impact of the NOPAs, along with other information supporting our overall tax position, in our assessment of the ultimate outcome of this matter with the IRS, and based on our analysis, we did not record an accrual related to this matter in our consolidated financial statements at June 30, 2013 or when we received the NOPAs. Such an accrual, if it becomes necessary, could be significant and material to our consolidated financial statements.
The ongoing IRS audit or any other investigation, audit, appeals proceeding or suit relating to the sale of the Trust Certificate could result in substantial costs. A state taxing authority could also challenge our tax position in connection with the transactions, notwithstanding our receipt of any income tax refund.
See “Management’s Discussion and Analysis of Financial Condition and Results of Operations—Results of Operations—Fiscal Years ended June 30, 2013, June 30, 2012 and June 30, 2011—Overall Results—Continuing Operations—Internal Revenue Service Audit” included in Item 7 of this annual report for additional information.
Massachusetts Appellate Tax Board Matters
We are involved in several matters relating to the Massachusetts tax treatment of GATE, a former subsidiary of FMD, includingThe First Marblehead Corp. v. Commissioner of Revenue, ATB Docket No. C293487, which was instituted on September 5, 2007;GATE Holdings, Inc. v. Commissioner of Revenue, ATBDocket No. C305217, which was instituted on March 16, 2010;The First Marblehead Corp. v. Commissioner of Revenue, ATB Docket No. C305241, which was instituted on March 22, 2010; andGATE Holdings, Inc. v. Commissioner of Revenue, ATB Docket No. C305240, which was instituted on March 22, 2010. We took the position in the ATB proceedings that GATE was properly taxable as a financial institution and not as a business corporation and was entitled to apportion its income under applicable provisions of Massachusetts tax law. The Commissioner took alternative positions: that GATE was properly taxable as a business corporation, or that GATE was taxable as a financial institution, but was not entitled to apportionment or was subject to 100% Massachusetts apportionment. In September 2007, we filed a petition with the ATB seeking a refund of state taxes paid for our taxable year ended June 30, 2004, all of which taxes had previously been paid as if GATE were a business corporation. In December 2009, the Commissioner made additional assessments of taxes, along with accrued interest, of approximately $11.9 million for GATE’s taxable years ended June 30, 2004, 2005 and 2006, and approximately $8.1 million for our taxable years ended June 30, 2005 and 2006. For the 2005 and 2006 taxable years, only one of the two assessments made by the Commissioner would ultimately be allowed. In March 2010, we filed petitions with the ATB contesting the additional assessments against GATE and us. In April 2011, the ATB held an evidentiary hearing on the foregoing, and the parties filed their final briefs in September 2011. On November 9, 2011, the ATB issued the ATB Order regarding these proceedings. The ATB Order reflected the following rulings and findings:
| | • | | GATE was properly taxable as a financial institution, rather than a business corporation, for each of the tax years at issue; |
| | • | | GATE was entitled to apportion its income under applicable provisions of Massachusetts tax law for each of the tax years at issue; |
| | • | | GATE properly calculated one of the two applicable apportionment factors used to calculate GATE’s financial institution excise tax; |
| | • | | GATE incorrectly calculated the other apportionment factor, which we refer to as the Property Factor, by excluding all income from trust-owned education loans outside of Massachusetts rather than including such income for the purposes of GATE’s Massachusetts state tax returns; and |
| | • | | All penalties assessed to FMD and GATE were abated. |
43
In connection with the ATB Order, as well as the expiration of the statute of limitations applicable to GATE’s taxable year ended June 30, 2007, we recognized an income tax benefit of $12.5 million during the second quarter of fiscal 2012. In the third quarter of fiscal 2012, we made a $5.1 million payment that satisfied our obligation to the Massachusetts Department of Revenue for GATE’s taxable years ended June 30, 2004, 2005 and 2006.
On April 17, 2013, the ATB issued the ATB Opinion. We had argued that the loan servicers’ activities, which were conducted outside of Massachusetts on behalf of the trusts, determined the location of the loans for purposes of the Property Factor. The ATB disagreed and determined that the loan servicers’ activities should not be attributed to GATE and further determined that, for purposes of the Property Factor, the trust-owned education loans were located in Massachusetts, GATE’s commercial domicile.
On July 22, 2013, we filed an appeal of the ATB’s findings with regard to the Property Factor in the Massachusetts Appeals Court (No. 2013-P-0935). The appeal of the ATB’s findings includes a refund claim with respect to the $5.1 million payment made in the third quarter of fiscal 2012. The Commissioner has decided not appeal the ATB’s other findings. If we are unsuccessful in an appeal of the ATB Order, we could be required to make additional tax payments, including interest, for GATE’s taxable years ended June 30, 2008 and 2009, which could materially adversely affect our liquidity position. We have accrued a total income tax liability of $25.2 million, including interest, as of June 30, 2013 related to the 2008 and 2009 tax returns for GATE, which amount was included in income taxes payable on our consolidated balance sheet. On June 29, 2013, the Massachusetts Department of Revenue delivered a notice of intent to assess for our taxable years ended June 30, 2008 and June 30, 2009. This assessment included approximately $822 thousand of additional tax liability and an assessment for penalties of $4.1 million. We have accrued for the additional tax liability, including interest, as of June 30, 2013 but have not accrued for the penalties as we believe that it is more likely than not that the penalties will ultimately be abated, which is consistent with the treatment of our taxable years ended June 30, 2004, 2005 and 2006. We cannot predict the outcome of this matter or the timing of such payments, if any, at this time.
Federal Class Action Lawsuit
On August 28, 2013, a purported class action was filed in the United States District Court for the District of Massachusetts against FMD, Daniel Meyers, FMD’s Chief Executive Officer and Chairman of the FMD Board of Directors, and Kenneth Klipper, FMD’s Chief Financial Officer and one of FMD’s Managing Directors. The plaintiff alleges, among other things, that the defendants made false and misleading statements and failed to disclose material information in various SEC filings, press releases and other public statements concerning our corporate income tax filings. The complaint alleges various claims under the Exchange Act and Rule 10b-5 promulgated thereunder. The complaint seeks, among other relief, class certification, unspecified damages, fees and such other relief as the court may deem just and proper. No class has been certified in the above action.
We intend to vigorously assert our defenses. There can be no assurance, however, that we will be successful, and adverse developments and/or an adverse resolution of the lawsuit could have a material effect on our consolidated financial position and results of operations, which could, in turn, have a negative effect on the price of our common stock. In addition, although we carry insurance for these types of claims, we are not presently able to reasonably estimate potential losses, if any, related to the lawsuit and a judgment significantly in excess of our insurance coverage could materially and adversely affect our financial condition, results of operations and cash flows.
We are involved from time to time in routine legal proceedings occurring in the ordinary course of business. In the opinion of management, there are no matters outstanding, other than those referenced above, that would have a material adverse impact on our operations or financial condition.
| Item 4. | Mine Safety Disclosures. |
Not applicable.
44
PART II
| Item 5. | Market for Registrant’s Common Equity, Related Stockholder Matters and Issuer Purchases of Equity Securities |
Market Information and Holders
Our common stock is listed on the NYSE under the trading symbol FMD. The following table sets forth the high and low sales prices of our common stock, as reported by the NYSE, for each quarterly period within our two most recent fiscal years:
| | | | | | | | |
| | | High | | | Low | |
Fiscal 2013 | | | | | | | | |
First Quarter | | $ | 1.24 | | | $ | 1.00 | |
Second Quarter | | | 1.16 | | | | 0.61 | |
Third Quarter | | | 1.09 | | | | 0.76 | |
Fourth Quarter | | | 1.30 | | | | 0.98 | |
| | |
Fiscal 2012 | | | | | | | | |
First Quarter | | $ | 1.86 | | | $ | 1.00 | |
Second Quarter | | | 1.40 | | | | 0.83 | |
Third Quarter | | | 1.52 | | | | 1.18 | |
Fourth Quarter | | | 1.25 | | | | 0.86 | |
Computershare Trust Company, N.A. is the transfer agent and registrar for our common stock. As of the close of business on September 11, 2013, we had 67 holders of record of our common stock. This number does not include stockholders for whom shares are held in “street” or nominee name.
45
Performance Graph
The following graph compares the cumulative five-year total return attained by stockholders on our common stock relative to the cumulative total returns of the Dow Jones U.S. index and the Dow Jones U.S. Financial Services index. The graph tracks the performance of a $100 investment in our common stock and in each of the indices (with the reinvestment of all dividends) from June 30, 2008 to June 30, 2013.
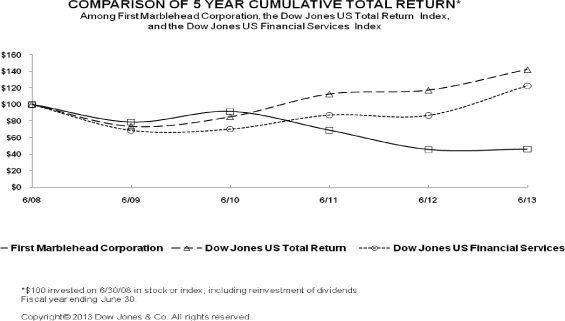
The information included under the heading “Performance Graph” is “furnished” and not “filed” for purposes of Section 18 of the Exchange Act, or otherwise subject to the liabilities of that section, nor shall it be deemed to be “soliciting material” subject to Regulation 14A or incorporated by reference in any filing under the Securities Act or the Exchange Act.
Dividends
We did not declare any dividends during fiscal 2013 or fiscal 2012, and we do not expect to declare any dividends in the foreseeable future. Any decision to pay future dividends will be made by the FMD Board of Directors and will depend upon applicable regulatory approvals and our earnings, financial condition, capital and regulatory requirements and such other factors as the FMD Board of Directors deems relevant. In connection with the termination of the supervisory agreement that we had entered into in July 2009 with the OTS, which was the primary federal regulator of Union Federal prior to the OCC, the FMD Board of Directors adopted resolutions requiring FMD to notify the OCC in advance of any distributions to our stockholders in excess of $1.0 million in any fiscal quarter.
46
Issuer Purchases of Equity Securities
The following table provides information as of and for the fiscal quarter ended June 30, 2013 regarding shares of our common stock that were repurchased under our 2003 stock incentive plan, as amended and restated, which we refer to as our 2003 Plan, and our 2011 stock incentive plan, which we refer to as our 2011 Plan:
| | | | | | | | | | | | | | |
| | | Total number of
shares purchased | | | Average price
paid per share | | | Total number of shares
purchased as part of publicly
announced plans or programs | | | Maximum number of shares
that may yet be purchased
under the plans or programs |
April 1 - 30, 2013 | | | 162,888 | | | $ | 1.03 | | | | — | | | N/A |
May 1 - 31, 2013 | | | 10,160 | | | | 1.25 | | | | — | | | N/A |
June 1 - 30, 2013 | | | 35,282 | | | | 1.23 | | | | — | | | N/A |
| | | | | | | | | | | | | | |
Total Purchases of Equity Securities(1) | | | 208,330 | | | $ | 1.08 | | | | — | | | |
| | | | | | | | | | | | | | |
| (1) | Participants in our 2003 Plan and our 2011 Plan may elect to satisfy tax withholding obligations upon vesting of restricted stock units by delivering shares of our common stock, including shares retained from the restricted stock units creating the tax obligation. Our 2003 Plan was approved by stockholders on November 16, 2009 and has an expiration date of September 14, 2013. Our 2011 Plan was approved by stockholders on November 14, 2011 and has an expiration date of November 14, 2021. |
| Item 6. | Selected Financial Data |
The following selected consolidated financial data should be read in conjunction with our consolidated financial statements and related notes under the heading, “Financial Statements and Supplementary Data,” included in Item 8 of this annual report and “Management’s Discussion and Analysis of Financial Condition and Results of Operations” included in Item 7 of this annual report. We have derived the data from our consolidated financial statements, which were audited by KPMG LLP, an independent registered public accounting firm. The historical results presented here are not necessarily indicative of future results.
47
The results for fiscal years 2010 and 2009 include the results of UFSB-SPV, a special purpose vehicle that financed certain education loans we originated. UFSB-SPV was deconsolidated on July 1, 2010 with our adoption of ASU 2009-16 and ASU 2009-17.
| | | | | | | | | | | | | | | | | | | | |
| | | Fiscal years ended June 30, | |
| | | 2013 | | | 2012 | | | 2011 | | | 2010 | | | 2009 | |
| | | (dollars and shares in thousands, except per share data) | |
Consolidated Statements of Operations Data: | | | | | | | | | | | | | | | | | | | | |
Revenues: | | | | | | | | | | | | | | | | | | | | |
Net interest income: | | | | | | | | | | | | | | | | | | | | |
Interest income | | $ | 5,685 | | | $ | 3,290 | | | $ | 1,777 | | | $ | 23,029 | | | $ | 42,242 | |
Interest expense | | | (1,422 | ) | | | (915 | ) | | | (1,037 | ) | | | (13,158 | ) | | | (17,139 | ) |
| | | | | | | | | | | | | | | | | | | | |
Net interest income | | | 4,263 | | | | 2,375 | | | | 740 | | | | 9,871 | | | | 25,103 | |
(Provision) credit for loan losses | | | (148 | ) | | | 615 | | | | (281 | ) | | | (121 | ) | | | (491 | ) |
| | | | | | | | | | | | | | | | | | | | |
Net interest income after (provision) credit for loan losses | | | 4,115 | | | | 2,990 | | | | 459 | | | | 9,750 | | | | 24,612 | |
Non-interest revenues: | | | | | | | | | | | | | | | | | | | | |
Tuition payment processing fees | | | 26,668 | | | | 26,544 | | | | 12,904 | | | | — | | | | — | |
Administrative and other fees | | | 11,595 | | | | 9,925 | | | | 10,747 | | | | 13,103 | | | | 15,591 | |
Fair value changes to service revenue receivables | | | 2,068 | | | | 947 | | | | (23,178 | ) | | | (13,567 | ) | | | (338,067 | ) |
| | | | | | | | | | | | | | | | | | | | |
Total non-interest revenues | | | 40,331 | | | | 37,416 | | | | 473 | | | | (464 | ) | | | (322,476 | ) |
| | | | | | | | | | | | | | | | | | | | |
Total revenues | | | 44,446 | | | | 40,406 | | | | 932 | | | | 9,286 | | | | (297,864 | ) |
Non-interest expenses: | | | | | | | | | | | | | | | | | | | | |
Compensation and benefits | | | 40,413 | | | | 42,052 | | | | 36,690 | | | | 41,436 | | | | 40,473 | |
General and administrative | | | 53,582 | | | | 61,101 | | | | 56,140 | | | | 57,835 | | | | 79,620 | |
Loss on education loans held-for-sale | | | — | | | | — | | | | — | | | | 130,955 | | | | 138,163 | |
| | | | | | | | | | | | | | | | | | | | |
Total non-interest expenses | | | 93,995 | | | | 103,153 | | | | 92,830 | | | | 230,226 | | | | 258,256 | |
| | | | | | | | | | | | | | | | | | | | |
Loss from operations | | | (49,549 | ) | | | (62,747 | ) | | | (91,898 | ) | | | (220,940 | ) | | | (556,120 | ) |
Other income: | | | | | | | | | | | | | | | | | | | | |
Gain from deconsolidation of trusts | | | — | | | | 9,514 | | | | — | | | | — | | | | — | |
Proceeds from TERI settlement | | | 702 | | | | 1,685 | | | | 8,112 | | | | — | | | | — | |
Other | | | 946 | | | | — | | | | — | | | | — | | | | — | |
| | | | | | | | | | | | | | | | | | | | |
Total other income | | | 1,648 | | | | 11,199 | | | | 8,112 | | | | — | | | | — | |
| | | | | | | | | | | | | | | | | | | | |
Loss from continuing operations, before income taxes | | | (47,901 | ) | | | (51,548 | ) | | | (83,786 | ) | | | (220,940 | ) | | | (556,120 | ) |
Income tax expense (benefit) from continuing operations | | | 2,296 | | | | (17,955 | ) | | | 208 | | | | (47,072 | ) | | | (162,841 | ) |
| | | | | | | | | | | | | | | | | | | | |
Net loss from continuing operations | | | (50,197 | ) | | | (33,593 | ) | | | (83,994 | ) | | | (173,868 | ) | | | (393,279 | ) |
Discontinued operations, net of taxes | | | — | | | | 1,135,821 | | | | (137,567 | ) | | | 2,966 | | | | 3,074 | |
| | | | | | | | | | | | | | | | | | | | |
Net (loss) income | | $ | (50,197 | ) | | $ | 1,102,228 | | | $ | (221,561 | ) | | $ | (170,902 | ) | | $ | (390,205 | ) |
| | | | | | | | | | | | | | | | | | | | |
Net (loss) income per basic common share: | | | | | | | | | | | | | | | | | | | | |
From continuing operations | | $ | (0.47 | ) | | $ | (0.30 | ) | | $ | (0.83 | ) | | $ | (1.75 | ) | | $ | (3.95 | ) |
From discontinued operations | | | — | | | | 10.28 | | | | (1.37 | ) | | | 0.03 | | | | 0.01 | |
| | | | | | | | | | | | | | | | | | | | |
Total basic net (loss) income per common share | | | (0.47 | ) | | | 9.98 | | | | (2.20 | ) | | | (1.72 | ) | | | (3.94 | ) |
| | | | | | | | | | | | | | | | | | | | |
Net (loss) income per diluted common share: | | | | | | | | | | | | | | | | | | | | |
From continuing operations | | $ | (0.47 | ) | | $ | (0.30 | ) | | $ | (0.83 | ) | | $ | (1.75 | ) | | $ | (3.95 | ) |
From discontinued operations | | | — | | | | 10.26 | | | | (1.37 | ) | | | 0.03 | | | | 0.01 | |
| | | | | | | | | | | | | | | | | | | | |
Total diluted net (loss) income per common share | | $ | (0.47 | ) | | $ | 9.96 | | | $ | (2.20 | ) | | $ | (1.72 | ) | | $ | (3.94 | ) |
| | | | | | | | | | | | | | | | | | | | |
Weighted-average shares outstanding: | | | | | | | | | | | | | | | | | | | | |
Basic | | | 107,346 | | | | 101,575 | | | | 100,919 | | | | 99,537 | | | | 99,081 | |
Diluted | | | 107,346 | | | | 110,667 | | | | 100,919 | | | | 99,537 | | | | 99,081 | |
48
| | | | | | | | | | | | | | | | | | | | |
| | | June 30, | |
| | | 2013 | | | 2012 | | | 2011 | | | 2010 | | | 2009 | |
| | | (dollars in thousands) | |
Consolidated Balance Sheet Data: | | | | | | | | | | | | | | | | | | | | |
Cash and cash equivalents | | $ | 81,910 | | | $ | 123,497 | | | $ | 217,367 | | | $ | 331,047 | | | $ | 171,254 | |
Short-term investments, at cost | | | 55,179 | | | | 85,007 | | | | 50,000 | | | | 50,000 | | | | — | |
Restricted cash | | | 87,338 | | | | 65,401 | | | | 124,687 | | | | 1,026 | | | | 1,842 | |
Investments available-for-sale, at fair value | | | 84,782 | | | | 68,598 | | | | 11,019 | | | | 4,471 | | | | 8,450 | |
Education loans held-for-sale, at lower of cost or fair value | | | — | | | | — | | | | — | | | | 105,082 | | | | 344,886 | |
Education loans held-to-maturity, net of allowance | | | 62,996 | | | | 33,095 | | | | — | | | | 391 | | | | — | |
Mortgage loans held-to-maturity, net of allowance | | | 12,629 | | | | 7,811 | | | | 6,417 | | | | 8,118 | | | | 9,469 | |
Service revenue receivables, at fair value | | | 14,817 | | | | 16,341 | | | | 29,610 | | | | 53,279 | | | | 67,475 | |
Goodwill and intangible assets | | | 44,259 | | | | 40,470 | | | | 42,588 | | | | 1,194 | | | | 1,931 | |
Income taxes receivable | | | — | | | | — | | | | — | | | | 12,176 | | | | 157,210 | |
Total assets from continuing operations | | | 472,293 | | | | 457,805 | | | | 507,021 | | | | 585,471 | | | | 798,244 | |
Deposits | | | 163,977 | | | | 83,428 | | | | 60,492 | | | | 108,732 | | | | 154,462 | |
Restricted funds due to clients | | | 86,994 | | | | 104,981 | | | | 124,194 | | | | — | | | | — | |
Income taxes payable | | | 25,922 | | | | 23,414 | | | | 39,979 | | | | — | | | | — | |
Education loan warehouse facility | | | — | | | | — | | | | — | | | | 218,059 | | | | 230,137 | |
Total liabilities from continuing operations | | | 292,966 | | | | 230,817 | | | | 250,120 | | | | 364,197 | | | | 417,890 | |
Total stockholders’ equity (deficit) | | | 179,327 | | | | 226,988 | | | | (879,939 | )* | | | 217,252 | | | | 378,280 | |
| * | The June 30, 2011 stockholders’ deficit includes an accumulated deficit of $1.13 billion related to the securitization trusts that we previously consolidated. Total stockholders’ equity at June 30, 2013 and June 30, 2012 no longer included this deficit as a result of the deconsolidation of these securitization trusts during fiscal 2012. |
| Item 7. | Management’s Discussion and Analysis of Financial Condition and Results of Operations |
You should read the following discussion and analysis of our financial condition and results of operations together with our “Selected Financial Data” included in Item 6 of this annual report and “Financial Statements and Supplementary Data” included in Item 8 of this annual report. In addition to historical information, this discussion of financial condition and results of operations contains certain forward-looking statements that involve risks and uncertainties. Our actual results could differ materially from those expressed or implied by the forward-looking statements due to applications of our critical accounting policies and factors including, but not limited to, those set forth under the caption “Risk Factors” included in Item 1A of this annual report.
Executive Summary
Overview
We are a specialty finance company focused on the education financing marketplace in the United States. We provide loan programs on behalf of our lender clients for K-12, undergraduate and graduate students and for college graduates seeking to refinance private education loan obligations. We also provide tuition planning, tuition billing, refund management and payment technology services through TMS. TMS provides such services on behalf of over 700 educational institutions. We offer a fully integrated suite of services through our Monogram platform, as well as certain services on a stand-alone, fee-for-service basis. We partner with lenders to design and administer education loan programs through our Monogram platform, which are typically school-certified. They are designed to be marketed through educational institutions or to prospective borrowers and their families directly and to generate portfolios intended to be held by the originating lender or financed in the capital markets. We also offer a number of other services on a stand-alone, fee-for-service basis in support of our clients, including retail banking, loan origination, portfolio management and securitization services.
On October 19, 2012, FMD’s subsidiary Cology LLC acquired a substantial portion of the operating assets, and assumed certain liabilities, of the Cology Sellers. Through Cology LLC, we provide loan processing services to approximately 270 credit union and other lender clients. Our consolidated financial statements for fiscal 2013 reflect revenues and expenses of Cology LLC since the date of acquisition.
49
For a detailed description of our product and service offerings, see “Business—Overview” included in Item 1 of this annual report.
Loan Processing and Origination
During the first quarter of fiscal 2011, we began providing services for two lender clients related to school-certified education loan programs, including originating education loans, based on our Monogram platform. During fiscal 2012, we began performing services for Union Federal related to school-certified education loan programs based on our Monogram platform, including a K-12 loan program. In June 2012, we launched a Monogram-based loan program with a new lender client and, in August 2012, we launched a Monogram-based loan consolidation program with an existing client. Our Monogram platform continues to provide us with an opportunity to originate, administer, manage and finance education loans, and our lender clients’ Monogram-based loan programs are a significant component of our return to the education financing marketplace. The education loans that we originate on behalf of our partnered lending clients, excluding our subsidiary Union Federal, are not included on our consolidated balance sheets but, rather are included on the balance sheets of our partnered lending clients. As such, none of the references in this annual report to education loans included on our consolidated balance sheets include the education loans processed by us on behalf of our partnered lending clients.
In October 2012, we began to process and disburse education loans through Cology LLC on behalf of its credit union and other lender clients. Cology LLC earns fees primarily based on the number of loan applications, loan certifications and disbursements it processes on behalf of its clients. Because Cology LLC is a loan processer, the education loans that it processes on behalf of its clients are not included on our consolidated balance sheets but, rather, are included on the balance sheets of its clients. As such, none of the references in this annual report to education loans included on our consolidated balance sheets include the education loans processed by Cology LLC on behalf of its clients.
The following table presents our loan facilitation data with respect to our Monogram-based programs for fiscal 2013 and 2012, as well as the education loans processed by Cology LLC for the period since the date of acquisition through June 30, 2013. We use the term “facilitated loan” to mean an education loan that has been approved following receipt of all applicant data, including the signed credit agreement, required certifications from the school and applicant and any required income or employment verification. We use the term “disbursed loan” to mean a loan for which loan funds have been disbursed on behalf of the lender.
| | | | | | | | | | | | | | | | | | | | | | | | | | | | | | | | |
| | | Fiscal 2013 | | | Fiscal 2012 | |
| | | Partnered
Lending | | | Union
Federal | | | Monogram Loan
Programs Total | | | Cology LLC
(since
acquisition) | | | Total | | | Partnered
Lending | | | Union
Federal | | | Monogram Loan
Programs Total | |
| | | (dollars in thousands) | |
Facilitated Loans | | $ | 101,343 | | | $ | 32,404 | | | $ | 133,747 | | | $ | 164,462 | | | $ | 298,209 | | | $ | 26,021 | | | $ | 37,627 | | | $ | 63,648 | |
Disbursed Loans | | | 98,260 | | | | 33,604 | | | | 131,864 | | | | 310,949 | | | | 442,813 | | | | 23,399 | | | | 34,301 | | | | 57,700 | |
Historically, we have processed the greatest Monogram-based loan application volume during the summer and early fall months, as students and their families seek to borrow money in order to pay tuition costs for the fall semester or the entire academic year. The following table represents our loan origination metrics with respect to our Monogram-based programs held at Union Federal at June 30, 2013 and 2012:
| | | | | | | | |
| | | June 30, | |
| | | 2013 | | | 2012 | |
Weighted-average FICO score | | | 752 | | | | 753 | |
Co-signers | | | 83 | % | | | 85 | % |
Delinquent loans | | | 0.45 | % | | | 0.03 | % |
The weighted-average FICO score is based on the maximum score of the borrower or co-signer at origination.
50
Portfolio Performance
Credit performance of consumer-related loans generally has been adversely affected by general economic conditions in the United States over the past four years. These conditions have included higher unemployment rates and deteriorating credit performance, including higher levels of education loan defaults and lower recoveries on such defaulted loans. Although these conditions have lessened to a certain extent recently, they may have a material adverse effect on consumer loan portfolio performance in the future. Our Monogram-based education loan portfolios are not yet fully exposed to significant adverse portfolio performance because a majority of these portfolios have yet to experience any significant seasoning. Consequently, in evaluating loan portfolio performance, we review projected gross default rates and projected post-default recovery rates. Further, we evaluate the loan portfolio performance of the securitization trusts that we previously facilitated. The service revenue receivables from these trusts that remain on our consolidated balance sheets at June 30, 2013 and June 30, 2012 have not been significantly impacted by defaults or recoveries since these trusts possess guarantees that help to partially negate the overall impact of any default activity. Many of these securitization trusts are also cash flowing, seasoned portfolios that, for the most part, have relatively short remaining weighted-average lives.
Capital Markets
We believe that conditions in the capital markets generally improved in fiscal 2013 compared to recent years. In particular, investors in ABS demonstrated increased interest in ABS backed by private education loans, resulting in a reduction in credit spreads applicable to these securities. Additionally, during the third quarter of fiscal 2013, a private education loan ABS issuance by a third party included a subordinate bond, the first such bond to be included in a new issuance since 2007. The inclusion of this subordinate bond served to increase the advance rate, or amount of funds raised as a percentage of the collateral in the issuance. We believe that these trends during fiscal 2013 indicate that the economics of private education loan ABS are starting to become more attractive to issuers in the private education loan securitization marketplace. However, we have not completed a securitization transaction since fiscal 2008 and if we execute a financing transaction in the capital markets, the structure and economics of any such transaction may be materially different from prior transactions that we have sponsored. Such differences may include lower revenues as a result of comparatively wider credit spreads and lower advance rates.
Uncertainties
Our near-term financial performance and future growth depends, in large part, on our ability to successfully and efficiently market our Monogram platform, Cology LLC offerings and TMS offerings so that we may grow and diversify our client base and revenues. Facilitated and disbursed loan volumes are key elements of our financial results and business strategy, and we believe that the results from the 2011-2012 and the 2012-2013 academic years demonstrate market demand for Monogram-based education loans.
We have invested in our distribution capabilities over the course of the past two years, including our school sales force and TMS, but we face challenges in increasing loan volumes. For example, competitors with larger customer bases, greater name or brand recognition, or more established customer relationships than those of our clients, have an advantage in attracting loan applicants at a lower acquisition cost than us and making education loans on a recurring, or “serialized,” basis.
Outlook
Our long-term success depends on our ability to attract additional lender clients, or otherwise obtain additional sources of interim or permanent financing, such as securitizations or alternative financing transactions. This is particularly true as the level of loan originations for the Union Federal Private Student Loan Program is subject to regulatory limits that are based upon the overall size of Union Federal’s balance sheet and Union Federal’s capital levels, as determined by FMD. To date, we have entered into education loan program agreements based on our Monogram platform with four lender clients, including FMD’s subsidiary Union Federal. While we have demonstrated market demand for Monogram-based education loans, we are uncertain as
51
to the degree of market acceptance that our Monogram platform will achieve, particularly in the current economic environment where lenders continue to evaluate their education lending business models. Additionally, as one of our four partnered lending clients provides the majority of our Monogram-based loan program fees, we are subject to concentration risk as it relates to this revenue stream until we are able to attract additional lender clients. We believe, however, that the credit quality characteristics and interest rates of the loan portfolios originated in the 2011-2012 and the 2012-2013 academic years will be attractive to additional potential lender clients, as well as capital markets participants. We also believe that the ability to permanently finance private education loan portfolios through the capital markets would make our products and services more attractive to lenders and would accelerate improvement in our long-term financial results.
We are uncertain of the volume of education loans to be generated by the Monogram-based loan programs of our four lender clients, or any additional lender clients, including clients acquired through our acquisition of a substantial portion of the operating assets of the Cology Sellers in October 2012. It is our view that returning to profitability will be dependent on a number of factors, including our loan capacity and related volumes, expense management and growth at TMS, Cology LLC and Union Federal, and the availability of financing alternatives, including our ability to successfully re-enter the securitization market. In particular, we need to generate loan volumes substantially greater than those that we have generated to date, as well as to develop funding capacity for Monogram-based loan programs at loan volume levels greater than those of our four lender clients with lower credit enhancement levels and higher capital markets advance rates than those available today. We must also continue to achieve efficiencies in attracting applicants, through loan serialization or otherwise, in order to reduce our overall cost of acquisition. In the case of Cology LLC, we expect to continue to provide loan processing services to the former customers of the Cology Sellers similar to the services provided to them by the Cology Sellers prior to the asset acquisition. In addition, we hope to provide various Monogram-based products and services to these customers to assist them in education loan product design, pricing, marketing, reporting and analysis, as well as education loan portfolio management services.
Changes in any of the following factors could materially affect our financial results:
| | • | | Demand for education financing, which may be affected by changes in limitations established by the federal government on the amount of federal loans that a student can receive, the terms and eligibility criteria for loans and grants under federal or state government programs and legislation currently under consideration; |
| | • | | The extent to which our services and products, including our Monogram platform, Cology LLC offerings and TMS offerings, gain market share and remain competitive at pricing favorable to us; |
| | • | | The amount of education loan volume disbursed under our lender clients’ Monogram-based loan programs; |
| | • | | Our ability to sell Monogram products and services to Cology LLC’s customers; |
| | • | | An adverse outcome in any challenge to federal tax refunds previously received in the amounts of $176.6 million and $45.1 million as a result of the audit of our past tax returns currently being conducted by the IRS, including as a result of the NOPAs we received from the IRS on September 10, 2013 that propose to disallow the loss that generated the tax refunds that we previously received as well as require us to include income from the Trust Certificate from the March 31, 2009 sale date through June 30, 2011 in our taxable income for such years. If the IRS’ positions are successful, the disallowance of the loss, coupled with the additional taxable income after the sale date through June 30, 2011, would create federal tax adjustments that we estimate to be approximately $300.0 million plus interest, with the interest continuing to accrue until the matter is resolved; |
| | • | | Regulatory requirements applicable to Union Federal, TMS and FMD, including conditions and approvals relating to the Union Federal Private Student Loan Program, which limit Union Federal’s ability to fund education loans; |
| | • | | Conditions in the education loan financing market, including the costs or availability of financing, rating agency assumptions or actions, and market receptivity to private education loan asset-backed securitizations; |
52
| | • | | The underlying loan performance of the Monogram-based loan programs, including the net default rates, and the timing and amounts of receipt of excess credit enhancements, if any, that may be material to us; |
| | • | | The resolution of our appeal of the ATB Order in the cases pertaining to our Massachusetts state income tax returns; |
| | • | | Application of critical accounting policies and estimates, which impact the carrying value of assets and liabilities, as well as our determinations to consolidate or deconsolidate a VIE; |
| | • | | Application of the Dodd-Frank Act, through the supervisory authority of the CFPB, which has the authority to regulate consumer financial products such as education loans, and to take enforcement actions against institutions marketing and selling consumer financial products under its supervision, such as Union Federal, and institutions that act as service providers to originators and processers of education loans, such as our subsidiaries FMER and Cology LLC; |
| | • | | Applicable laws and regulations, which may affect the terms upon which lenders agree to make education loans, the terms of future portfolio funding transactions, including disclosure and risk retention requirements, recovery rates on defaulted education loans and the cost and complexity of our loan facilitation operations; and |
| | • | | Departures or long-term unavailability of key personnel. |
Results of Operations—Fiscal Years ended June 30, 2013, June 30, 2012 and June 30, 2011
The financial results of operations include FMD and its subsidiaries for the fiscal years then ended. These results are reported through our continuing operations. Previously consolidated securitization trusts and the results of FMD’s subsidiary First Marblehead Data Services, Inc., or FMDS, are included in discontinued operations as discussed below for the fiscal years ended June 30, 2012 and June 2011.
Discontinued Operations
Upon our adoption of ASU 2009-16 and ASU 2009-17, effective July 1, 2010, we consolidated 14 securitization trusts that we facilitated during fiscal 2004 through fiscal 2008. The education loans purchased by the Trusts were initially subject to a default repayment guaranty by TERI, while the education loans purchased by the NCT Trusts were, with limited exceptions, not TERI-guaranteed. Of the 14 securitization trusts consolidated on July 1, 2010, 11 were Trusts and 3 were NCT Trusts. We refer to the consolidated Trusts as the NCSLT Trusts and the consolidated NCT Trusts as the GATE Trusts.
Consistent with our goal of refining our business model and focusing on our Monogram platform and tuition billing and payment processing services, we disposed of certain components of our business in fiscal 2012. In particular, we sold our remaining variable interests in the Trusts, we sold our trust administrator, FMDS, and we resigned as the special servicer of the Trusts, including the NCSLT Trusts. In addition, the new third party owner of FMDS terminated the agreement, effective September 30, 2012, with FMD’s subsidiary FMER for the special servicing of the NCT Trusts, including the GATE Trusts. During the fourth quarter of fiscal 2012, we determined that we no longer had any significant continuing involvement in the operations relating to the NCSLT Trusts and the GATE Trusts. Further, we concluded that this would occur within an appropriate assessment period for both the NCSLT Trusts and the GATE Trusts. As a result, we reported the operations and activities relating to the NCSLT Trusts, the GATE Trusts and FMDS within discontinued operations for fiscal 2012 and fiscal 2011.
See Note 3, “Discontinued Operations,” in the notes to our consolidated financial statements included in Item 8 of this annual report for additional information.
53
Overall Results—Continuing Operations
The following table summarizes the results of our consolidated operations:
| | | | | | | | | | | | | | | | | | | | |
| | | Fiscal years ended June 30, | | | Change between periods | |
| | | 2013 | | | 2012 | | | 2011 | | | 2013 - 2012 | | | 2012 - 2011 | |
| | | (dollars in thousands) | |
Revenues: | | | | | | | | | | | | | | | | | | | | |
Net interest income: | | | | | | | | | | | | | | | | | | | | |
Interest income | | $ | 5,685 | | | $ | 3,290 | | | $ | 1,777 | | | $ | 2,395 | | | $ | 1,513 | |
Interest expense | | | (1,422 | ) | | | (915 | ) | | | (1,037 | ) | | | (507 | ) | | | 122 | |
| | | | | | | | | | | | | | | | | | | | |
Net interest income | | | 4,263 | | | | 2,375 | | | | 740 | | | | 1,888 | | | | 1,635 | |
(Provision) credit for loan losses | | | (148 | ) | | | 615 | | | | (281 | ) | | | (763 | ) | | | 896 | |
| | | | | | | | | | | | | | | | | | | | |
Net interest income after (provision) credit for loan losses | | | 4,115 | | | | 2,990 | | | | 459 | | | | 1,125 | | | | 2,531 | |
Non-interest revenues: | | | | | | | | | | | | | | | | | | | | |
Tuition payment processing fees | | | 26,668 | | | | 26,544 | | | | 12,904 | | | | 124 | | | | 13,640 | |
Administrative and other fees | | | 11,595 | | | | 9,925 | | | | 10,747 | | | | 1,670 | | | | (822 | ) |
Fair value changes to service revenue receivables | | | 2,068 | | | | 947 | | | | (23,178 | ) | | | 1,121 | | | | 24,125 | |
| | | | | | | | | | | | | | | | | | | | |
Total non-interest revenues | | | 40,331 | | | | 37,416 | | | | 473 | | | | 2,915 | | | | 36,943 | |
| | | | | | | | | | | | | | | | | | | | |
Total revenues | | | 44,446 | | | | 40,406 | | | | 932 | | | | 4,040 | | | | 39,474 | |
Total non-interest expenses | | | 93,995 | | | | 103,153 | | | | 92,830 | | | | (9,158 | ) | | | 10,323 | |
| | | | | | | | | | | | | | | | | | | | |
Loss from operations | | | (49,549 | ) | | | (62,747 | ) | | | (91,898 | ) | | | 13,198 | | | | 29,151 | |
Total other income | | | 1,648 | | | | 11,199 | | | | 8,112 | | | | (9,551 | ) | | | 3,087 | |
| | | | | | | | | | | | | | | | | | | | |
Loss from continuing operations, before income taxes | | | (47,901 | ) | | | (51,548 | ) | | | (83,786 | ) | | | 3,647 | | | | 32,238 | |
Income tax expense (benefit) from continuing operations | | | 2,296 | | | | (17,955 | ) | | | 208 | | | | 20,251 | | | | (18,163 | ) |
| | | | | | | | | | | | | | | | | | | | |
Net loss from continuing operations | | | (50,197 | ) | | | (33,593 | ) | | | (83,994 | ) | | | (16,604 | ) | | | 50,401 | |
Discontinued operations, net of taxes | | | — | | | | 1,135,821 | | | | (137,567 | ) | | | (1,135,821 | ) | | | 1,273,388 | |
| | | | | | | | | | | | | | | | | | | | |
Net (loss) income | | $ | (50,197 | ) | | $ | 1,102,228 | | | $ | (221,561 | ) | | $ | (1,152,425 | ) | | $ | 1,323,789 | |
| | | | | | | | | | | | | | | | | | | | |
The net loss from continuing operations for the fiscal year ended June 30, 2013 was $50.2 million, or $(0.47) per common share, compared to a net loss from continuing operations of $33.6 million, or $(0.30) per common share, for the fiscal year ended June 30, 2012. The increase in the net loss year-over-year was primarily attributable to the results for fiscal 2012 which included significant benefits of $9.5 million related to the deconsolidation of the GATE Trusts, which is included in other income, as well as an income tax benefit from continuing operations of $18.0 million. The aggregate of these benefits was $27.5 million, or $0.25 per common share.
The net loss from continuing operations for the fiscal year ended June 30, 2012 was $33.6 million, or $(0.30) per common share, compared to a net loss from continuing operations of $84.0 million, or $(0.83) per common share, for the fiscal year ended June 30, 2011. The decrease in the net loss year-over-year was principally the result of a $24.1 million improvement in the fair value changes of service revenue receivables and a larger income tax benefit of $18.2 million.
Net Interest Income after (Provision) Credit for Loan Losses
For fiscal 2013, net interest income after (provision) credit for loan losses increased by $1.1 million to $4.1 million from $3.0 million in fiscal 2012. The increase resulted from an improved net interest margin due to
54
an increase in net interest income from higher-yielding investment securities and education loans held by Union Federal. The provision for loan losses decreased by $763 thousand, reflecting higher cash recoveries received during fiscal 2012 on previously defaulted education loans transferred by Union Federal to an indirect subsidiary of FMD in 2009 and a larger education loan portfolio on Union Federal’s balance sheet.
For fiscal 2012, net interest income after (provision) credit for loan losses increased by $2.5 million to $3.0 million from $459 thousand in fiscal 2011. The increase resulted from an improved net interest margin due to the investment by Union Federal of cash into mortgage-backed securities and, to a lesser extent, education loans. The provision for loan losses improved by $896 thousand, reflecting higher cash recoveries received during fiscal 2012 on previously defaulted education loans transferred by Union Federal to an indirect subsidiary of FMD in 2009.
Non-Interest Revenues
Non-interest revenues include tuition payment processing fees earned by TMS, fee-for-service revenues for loan processing and origination and program support and fees related to our Monogram platform, as well as fair value changes related to service revenue receivables. As it relates to fiscal 2012 and fiscal 2011, it also included fees for portfolio management performed on behalf of the securitization trusts that we previously facilitated.
Non-interest revenues were $40.3 million for the fiscal year ended June 30, 2013, up $2.9 million from $37.4 million for the fiscal year ended June 30, 2012. The increase from fiscal 2012 to fiscal 2013 was primarily related to $4.6 million in higher fee income related to our Monogram platform as a result of significantly higher partnered lending loan disbursements, the inclusion of $2.2 million of revenues from Cology LLC for loan processing and increases in the valuation of our service revenue receivables of $1.1 million, partially offset by $5.1 million in lower revenues from special servicing and transition services related to the FMDS sale.
Non-interest revenues were $37.4 million for the fiscal year ended June 30, 2012, up $36.9 million from $473 thousand for the fiscal year ended June 30, 2011. The increase from fiscal 2011 to fiscal 2012 was principally due to the result of a non-cash loss of $26.4 million recorded during the third quarter of fiscal 2011 for changes to the recovery rate assumption used in determining the fair value of the service revenue receivables, discussed below, and an increase of $13.6 million in TMS tuition payment processing fees. Since we did not acquire TMS until December 31, 2010, our fiscal 2011 results only included six months of results of TMS versus a full year of revenue recorded in fiscal 2012. These increases were partially offset by lower administrative and other fees principally due to lower allowable revenues as a result of reductions in expense reimbursements by the NCSLT Trusts and the GATE Trusts under special servicing agreements for default prevention as well as lower education loan balances upon which the administrative fees were based.
Fair value changes to service revenue receivables We record our service revenue receivables at fair value on our consolidated balance sheet. At June 30, 2013, our service revenue receivables consisted of additional structural advisory fee and residual receivables and represent the estimated fair value of the service revenue receivables expected to be collected over the life of the various separate securitization trusts that have purchased education loans facilitated by us, with no further service obligations on our part. Prior to the sale of our variable interests in the Trusts on November 14, 2011, we recorded asset servicing fee and additional structural advisory fee receivables in the NCSLT Trusts. As compensation for our services related to asset servicing, we were entitled to a monthly asset servicing fee based on the aggregate outstanding principal balance of the education loans owned by the Trusts.
Changes in the estimated fair value of the service revenue receivables due, less any cash distributions received, are recorded in our consolidated statements of operations within the fair value changes to service revenue receivables.
In the absence of market-based transactions, we use cash flow modeling techniques to derive an estimate of fair value for financial reporting purposes. Significant observable and unobservable inputs used to develop our fair value estimates include, but are not limited to, recovery, net default and prepayment rates, discount rates and the forward LIBOR curve. See Note 11, “Fair Value Measurements,” in the notes to our consolidated financial statements included in Item 8 of this annual report for additional information.
55
The following table summarizes the details of the fair value changes to additional structural advisory fees, residual receivables and asset servicing fees:
| | | | | | | | | | | | | | | | | | | | |
| | | Fiscal years ended June 30, | | | Change between periods | |
| | | 2013 | | | 2012 | | | 2011 | | | 2013 - 2012 | | | 2012 - 2011 | |
| | | (dollars in thousands) | |
Additional structural advisory fees | | $ | 198 | | | $ | (2,668 | ) | | $ | (15,798 | ) | | $ | 2,866 | | | $ | 13,130 | |
Residuals | | | 1,870 | | | | 3,883 | | | | (3,220 | ) | | | (2,013 | ) | | | 7,103 | |
Asset servicing fees | | | — | | | | (268 | ) | | | (4,160 | ) | | | 268 | | | | 3,892 | |
| | | | | | | | | | | | | | | | | | | | |
Total fair value changes to service revenue receivables | | $ | 2,068 | | | $ | 947 | | | $ | (23,178 | ) | | $ | 1,121 | | | $ | 24,125 | |
| | | | | | | | | | | | | | | | | | | | |
The increase in the fair value changes to service revenue receivables of $24.1 million from fiscal 2011 to fiscal 2012 was largely due to the losses recorded in fiscal 2011 related to decreases in our net recovery rate assumptions for the NCSLT Trusts as compared to fiscal 2012. The increase in the fair value changes to service revenue receivables of $1.1 million from fiscal 2012 to fiscal 2013 was primarily due to fiscal 2012 events which included the sale of the additional structural advisory fee receivables related to the NCSLT Trusts and the related asset servicing agreement.
Non-Interest Expenses
The following table reflects the composition of non-interest expenses:
| | | | | | | | | | | | | | | | | | | | |
| | | Fiscal years ended June 30, | | | Change between periods | |
| | | 2013 | | | 2012 | | | 2011 | | | 2013 - 2012 | | | 2012 - 2011 | |
| | | (dollars in thousands) | |
Compensation and benefits | | $ | 40,413 | | | $ | 42,052 | | | $ | 36,690 | | | $ | (1,639 | ) | | $ | 5,362 | |
General and administrative: | | | | | | | | | | | | | | | | | | | | |
Third-party services | | | 15,212 | | | | 16,393 | | | | 16,461 | | | | (1,181 | ) | | | (68 | ) |
Depreciation and amortization | | | 4,347 | | | | 4,766 | | | | 8,253 | | | | (419 | ) | | | (3,487 | ) |
Marketing | | | 5,273 | | | | 8,433 | | | | 1,004 | | | | (3,160 | ) | | | 7,429 | |
Occupancy and equipment | | | 11,757 | | | | 11,272 | | | | 11,759 | | | | 485 | | | | (487 | ) |
Servicer fees | | | 761 | | | | 738 | | | | 661 | | | | 23 | | | | 77 | |
Merchant fees | | | 6,663 | | | | 6,467 | | | | 2,640 | | | | 196 | | | | 3,827 | |
Trust related special servicing expenses | | | 1,639 | | | | 5,920 | | | | 7,898 | | | | (4,281 | ) | | | (1,978 | ) |
Other | | | 7,930 | | | | 7,112 | | | | 7,464 | | | | 818 | | | | (352 | ) |
| | | | | | | | | | | | | | | | | | | | |
Total general and administrative | | | 53,582 | | | | 61,101 | | | | 56,140 | | | | (7,519 | ) | | | 4,961 | |
| | | | | | | | | | | | | | | | | | | | |
Total non-interest expenses | | $ | 93,995 | | | $ | 103,153 | | | $ | 92,830 | | | $ | (9,158 | ) | | $ | 10,323 | |
| | | | | | | | | | | | | | | | | | | | |
Total number of employees at fiscal year-end | | | 302 | | | | 306 | | | | 339 | | | | | | | | | |
Compensation and Benefits Compensation and benefits expenses decreased to $40.4 million in fiscal 2013 from $42.1 million in fiscal 2012. The decrease of $1.6 million year-over-year was primarily due to approximately $700 thousand in lower severance related costs and $553 thousand in lower non-cash compensation partially offset by $348 thousand in higher variable sales compensation. Total headcount decreased in fiscal 2013 due to the implementation of certain expense reduction efforts. These decreases in headcount were largely offset by our hiring of 43 employees from the Cology Sellers in connection with the acquisition of a substantial portion of the operating assets of the Cology Sellers as of October 19, 2012.
Compensation and benefits expenses increased to $42.1 million in fiscal 2012 from $36.7 million in fiscal 2011. The increase was primarily the result of our acquisition of TMS during mid-year of fiscal 2011.
General and Administrative Expenses General and administrative expenses decreased to $53.6 million in fiscal 2013 from $61.1 million in fiscal 2012. The decrease of $7.5 million was largely driven by a decrease in
56
trust related special servicing expenses, which declined $4.3 million year-over-year, primarily as a result of the cessation of our special servicing obligations for the NCSLT Trusts. Additionally, marketing costs decreased by $3.2 million year-over-year due to our investment in brand development of Union Federal’s Monogram-based loan programs in fiscal 2012.
General and administrative expenses increased to $61.1 million in fiscal 2012 from $56.1 million in fiscal 2011. The increase of $5.0 million was a result of higher marketing expenses incurred in fiscal 2012 related to loan acquisition and the initial brand development of Union Federal’s Monogram-based loan programs as well as higher merchant fees expenses related to payment processing services performed by TMS as our fiscal 2011 results included only six months of results for TMS. These increases were partially offset by lower depreciation and amortization expenses for certain fixed assets that were fully depreciated and lower trust related special servicing costs for the NCSLT Trusts.
Other Income
We recorded other income of $702 thousand, $1.7 million and $8.1 million for fiscal 2013, fiscal 2012 and fiscal 2011, respectively, due to resolution of certain matters related to the TERI Reorganization. This income represented the forgiveness of notes payable and other liabilities, and cash distributions from the liquidating trust under TERI’s confirmed plan of reorganization. During fiscal 2012, we also recorded income related to the deconsolidation of the securitization trusts previously consolidated of $9.5 million largely relating to the re-establishment of the fair value of the residual interests that were previously eliminated upon the adoption of ASU 2009-17 on July 1, 2010. During fiscal 2013, we recorded other income of $946 thousand related to the gain on the sale of a defaulted loan portfolio, which was transferred by Union Federal to an indirect subsidiary of FMD in 2009.
| | | | | | | | | | | | |
| | | Fiscal years ended June 30, | |
| | | 2013 | | | 2012 | | | 2011 | |
| | | (dollars in thousands) | |
Gain from deconsolidation of trusts | | $ | — | | | $ | 9,514 | | | $ | — | |
Proceeds from TERI settlement | | | 702 | | | | 1,685 | | | | 8,112 | |
Other | | | 946 | | | | — | | | | — | |
| | | | | | | | | | | | |
Total other income | | $ | 1,648 | | | $ | 11,199 | | | $ | 8,112 | |
| | | | | | | | | | | | |
Income Taxes
We are subject to federal income tax, as well as income tax in multiple U.S. state and local jurisdictions. Our effective income tax rate is calculated on a consolidated basis. The IRS is auditing our tax returns for fiscal 2007 through fiscal 2010. We also remain subject to federal income tax examinations for fiscal 2011 through fiscal 2013. In addition, we are involved in several matters relating to the Massachusetts tax treatment of GATE, a former subsidiary of FMD. See “—Internal Revenue Service Audit” below as well as Item 3, “Legal Proceedings,” and Note 16, “Commitments and Contingencies—Income Tax Matters,” in the notes to our consolidated financial statements included in Item 8 of this annual report for additional information regarding these matters.
Our state income tax returns in jurisdictions other than Massachusetts remain subject to examination for various fiscal years ended between June 30, 2009 and June 30, 2013.
Income tax expense from continuing operations for the fiscal year ended June 30, 2013 was $2.3 million as compared to an income tax benefit of $18.0 million in fiscal 2012 and income tax expense of $208 thousand in fiscal 2011. The benefit in fiscal 2012 was primarily the result of the recognition of an income tax benefit of $12.5 million during the second quarter of fiscal 2012 in connection with the ATB Order, as well as the expiration of the statute of limitations applicable to GATE’s taxable year ended June 30, 2007. In addition, a $5.7 million benefit was recorded in the third quarter of fiscal 2012 related to the gain on the sale of FMDS, which was included in discontinued operations.
57
Beginning in fiscal 2011, we no longer had any taxable income in prior periods to offset current period net operating losses for federal income tax purposes. As a result, we recorded a net operating loss carryforward asset as of June 30, 2013 and June 30, 2012, totaling $45.0 million and $28.0 million, respectively, for which we recorded a full valuation allowance.
Under current law, we do not have remaining taxes paid within available net operating loss carryback periods, and it is more likely than not that our deferred tax assets will not be realized through future reversals of existing temporary differences or available tax planning strategies. Accordingly, we have determined that a valuation allowance was necessary for all of our deferred tax assets not scheduled to reverse against existing deferred tax liabilities as of June 30, 2013 and June 30, 2012. We will continue to review the recognition of deferred tax assets on a quarterly basis.
Internal Revenue Service Audit
Effective March 31, 2009, we completed the sale of the Trust Certificate. In connection with the sale of the Trust Certificate, FMD entered into the Asset Services Agreement pursuant to which FMD provided various consulting and advisory services to the purchaser of the Trust Certificate. As a result of the sale of the Trust Certificate, as well as our operating losses incurred in fiscal 2009, we recorded an income tax receivable for federal income taxes paid on taxable income in prior fiscal years. In fiscal 2010, we received a total of $189.3 million in federal and state income tax refunds related to our income tax receivables. Furthermore, we received a federal income tax refund of $45.1 million in October 2010 related to the operating losses in fiscal 2010, which we applied to taxable income from fiscal 2008. In April 2010, the IRS commenced an audit of our tax returns for fiscal 2007 through fiscal 2009, including a review of the tax treatment of the sale of the Trust Certificate. Such audits are consistent with the practice of the Joint Committee of Taxation, which requires the IRS to perform additional procedures, up to and including an audit of a taxpayer who receives a tax refund in excess of $2.0 million. The IRS is also auditing our fiscal 2010 tax return in light of the $45.1 million income tax refund that we received in October 2010. We cannot predict the timing or outcome of the IRS audit.
We announced on August 15, 2013 that, as part of the audit process, we expected to receive a NOPA from the IRS. On September 10, 2013 we received two NOPAs from the IRS that contain the proposed adjustments that we announced on August 15, 2013. In the NOPAs, the IRS asserts that our sale of the Trust Certificate should not be recognized for federal income tax purposes primarily because we retained the economic benefits and burdens of the Trust Certificate, including, among other things, retaining certain repurchase rights and data rights. The IRS further concludes that the transaction should be characterized as a financing instead of a sale and asserts that the sale of the Trust Certificate and the execution of the Asset Services Agreement had the impact of converting taxable income to the owner from an accrual basis to a cash basis. As a result, the NOPAs propose to disallow the loss that generated the tax refunds that we previously received as well as require us to include income from the Trust Certificate from the March 31, 2009 sale date through June 30, 2011 in our taxable income for such years. If the IRS’ positions are successful, the disallowance of the loss, coupled with the additional taxable income after the sale date through June 30, 2011, would create federal income tax adjustments that we estimate to be approximately $300.0 million plus interest, with the interest continuing to accrue until the matter is resolved. The NOPAs do not address tax years beyond June 30, 2011.
The NOPAs are proposed recommendations of the reviewing agent in the IRS field office and, as such, are initial IRS positions and not final determinations, and, as a result, do not require any tax payment at the time of issuance. We have considered the requirements of ASC 740, the impact of the NOPAs, along with other information supporting our overall tax position, in our assessment of the ultimate outcome of this matter with the IRS, and based on our analysis, we did not record an accrual related to this matter in our consolidated financial statements at June 30, 2013 or when we received the NOPAs. Such an accrual, if it becomes necessary, could be significant and material to our consolidated financial statements.
We plan to vigorously contest the proposed adjustments, and we believe we have a strong position as it relates to this matter. The process of resolving this issue, which may include an appeals process with the IRS and litigation
58
in the U.S. Tax Court and the U.S. Court of Appeals, may extend over multiple years depending on how it progresses through the IRS and, if necessary, the courts. Assuming this matter advances unresolved through the IRS’ administrative process and the courts, we are not required to make tax payments, if any, until the matter is fully resolved, which may be several years from now. However, if we receive an unfavorable outcome from the U.S. Tax Court and appeal, we must post a bond in order to prevent collection of the tax deficiency.
Financial Condition
Total assets increased $14.5 million to $472.3 million at June 30, 2013 from $457.8 million at June 30, 2012. Total stockholders’ equity decreased $47.7 million to $179.3 million at June 30, 2013 from $227.0 million at June 30, 2012. The changes in our financial position from June 30, 2012 to June 30, 2013 are discussed in detail below.
Cash, Cash Equivalents and Short-term Investments
We had combined cash, cash equivalents and short-term investments of $137.1 million and $208.5 million at June 30, 2013 and June 30, 2012, respectively. Of this total, at June 30, 2013, FMD and its non-bank subsidiaries held $110.1 million in interest-bearing and non-interest-bearing deposits, money market funds and certificates of deposit with highly-rated financial institutions. Union Federal held a total of $27.0 million in interest-bearing and non-interest-bearing deposits and money market funds at June 30, 2013. Union Federal is subject to restrictions on the payment of dividends without prior approval from the OCC.
The decrease of $71.4 million was a result of $52.4 million related to net investments in available-for-sale securities, education loans and mortgage loans at Union Federal, $42.5 million to fund operations, $9.1 million in additional deposits for participation accounts and $4.7 million related to cash paid for a substantial portion of the operating assets of the Cology Sellers. These uses were partially offset by net growth in deposits at Union Federal of $40.5 million.
Restricted Cash
At June 30, 2013, restricted cash on our consolidated balance sheets was $87.3 million, of which $86.7 million was held by TMS. Restricted cash at June 30, 2012 was $65.4 million, of which $100.5 million was held by TMS, including $40.0 million held at Union Federal, which was eliminated for purposes of our consolidated balance sheet presentation, and $4.9 million was held by FMD and its other non-bank subsidiaries. The increase of $21.9 million from fiscal 2012 to fiscal 2013 in restricted cash was primarily due to the return of the deposit held at Union Federal back to TMS in fiscal 2013, partially offset by lower outstanding balances.
Restricted cash held by TMS represents tuition payments collected from students or their families on behalf of educational institutions. These cash balances are held in escrow under a trust agreement for the benefit of
59
TMS’ educational institution clients and are generally subject to cyclicality, tending to peak in August of each school year, early in the enrollment cycle, and to decrease in May, at the end of the school year. During fiscal 2013, TMS’ restricted cash balances ranged from a high of $341.1 million during August 2012 to a low of $38.8 million during May 2013. At times, TMS may deposit a portion of restricted cash in a deposit account at Union Federal. Such deposit is governed by a trust agreement between TMS and a third party trustee. Subject to the capital requirements and other laws, regulations, and restrictions applicable to Union Federal, the cash that is deposited with Union Federal in connection with the tuition payment plans is not restricted and, accordingly, is not included in restricted cash in our consolidated financial statements. In December 2011, we transferred $40.0 million of TMS deposits to Union Federal and, in the fourth quarter of fiscal 2013, this deposit was transferred, in full, back to TMS. Restricted cash held by Cology LLC represents loan origination proceeds and loan payments which it collects and disburses on behalf of its lender clients. Restricted cash held by our other subsidiaries relates to recoveries on defaulted education loans collected on behalf of clients as well as undistributed loan origination proceeds. We record a liability on our consolidated balance sheets representing tuition payments due to our TMS clients, loan origination proceeds and loan payments due to our Cology LLC clients and recoveries on defaulted education loans and education loan proceeds due to schools.
Investments Available-for-Sale
Investments classified as available-for-sale are reported at fair value at our consolidated balance sheet date. Our investment portfolio provides a source of short-term liquidity. Investments available-for-sale principally consisted of mortgage-backed federal agency securities held by Union Federal at both June 30, 2013 and June 30, 2012. The investments available-for-sale increased by $16.2 million from $68.6 million at June 30, 2012 to $84.8 million at June 30, 2013 primarily as a result of Union Federal’s purchase of $32.0 million in mortgage-backed securities, partially offset by $14.4 million in principal repayments during fiscal 2013. The portfolio generated net unrealized losses of $742 thousand at June 30, 2013 and net unrealized gains of $610 thousand at June 30, 2012, which was recognized in other comprehensive income, a component of stockholders’ equity.
See Note 7, “Investments Available-for-Sale,” in the notes to our consolidated financial statements included in Item 8 of this annual report for additional information
Loans
At June 30, 2013 and June 30, 2012, we classified all education loans and substantially all mortgage loans as held-to-maturity. The net carrying value of loans consisted of the following, as of the dates indicated:
| | | | | | | | |
| | | June 30, | |
| | 2013 | | | 2012 | |
| | (dollars in thousands) | |
Education loans held-to-maturity, net | | $ | 62,996 | | | $ | 33,095 | |
Mortgage loans held-to-maturity, net | | | 12,629 | | | | 7,811 | |
Education Loans Held-to-Maturity
The increase of $29.9 million in education loans at June 30, 2013 from June 30, 2012 was principally related to disbursed education loans through our Monogram platform at Union Federal.
The following table summarizes the composition of the net carrying value of our education loans held-to-maturity as of the dates indicated:
| | | | | | | | |
| | | June 30, | |
| | 2013 | | | 2012 | |
| | (dollars in thousands) | |
Gross loan principal outstanding | | $ | 64,655 | | | $ | 34,404 | |
Allowance for loan losses | | | (1,659 | ) | | | (1,309 | ) |
| | | | | | | | |
Education loans held-to-maturity, net of allowance | | $ | 62,996 | | | $ | 33,095 | |
| | | | | | | | |
60
Allowance for Loan Losses
The following is a roll forward of the net carrying value of education loans held-to-maturity:
| | | | | | | | | | | | | | | | | | | | | | | | |
| | | Fiscal years ended June 30, | |
| | 2013 | | | 2012 | |
| | Gross loans
outstanding | | | Allowance for
loan losses | | | Net carrying
value | | | Gross loans
outstanding | | | Allowance for
loan losses | | | Net carrying
value | |
| | | (dollars in thousands) | |
Balance, beginning of year | | $ | 34,404 | | | $ | (1,309 | ) | | $ | 33,095 | | | $ | 1,336 | | | $ | (1,336 | ) | | $ | — | |
Disbursements of principal to borrowers | | | 33,555 | | | | — | | | | 33,555 | | | | 34,301 | | | | — | | | | 34,301 | |
Principal receipts from borrowers | | | (4,020 | ) | | | — | | | | (4,020 | ) | | | (1,877 | ) | | | — | | | | (1,877 | ) |
Interest capitalized on loans in deferment and forbearance | | | 377 | | | | — | | | | 377 | | | | 70 | | | | — | | | | 70 | |
(Provision) credit for loan losses | | | — | | | | (11 | ) | | | (11 | ) | | | — | | | | 601 | | | | 601 | |
Reserves reclassified from interest receivable for capitalized interest | | | 31 | | | | (31 | ) | | | — | | | | 24 | | | | (24 | ) | | | — | |
Net charge-offs: | | | | | | | | | | | | | | | | | | | | | | | | |
Charge-offs | | | (156 | ) | | | 156 | | | | — | | | | (240 | ) | | | 240 | | | | — | |
Recoveries from borrowers | | | 464 | | | | (464 | ) | | | — | | | | 790 | | | | (790 | ) | | | — | |
| | | | | | | | | | | | | | | | | | | | | | | | |
Net charge-offs | | | 308 | | | | (308 | ) | | | — | | | | 550 | | | | (550 | ) | | | — | |
| | | | | | | | | | | | | | | | | | | | | | | | |
Balance, end of year | | $ | 64,655 | | | $ | (1,659 | ) | | $ | 62,996 | | | $ | 34,404 | | | $ | (1,309 | ) | | $ | 33,095 | |
| | | | | | | | | | | | | | | | | | | | | | | | |
To estimate the allowance for loan losses on our newly originated Monogram-based loan portfolio, we utilized specific default and recovery rates projected for the Monogram-based loan portfolio over the 12-month loss confirmation period. We may also apply qualitative adjustments in determining the allowance for loan losses. Our default experience with this loan portfolio is limited by the seasoning of the portfolio; however, we have utilized our historical database and experience in projecting the level of defaults and recoveries of the Monogram-based loan portfolio relying in part on historical results from our securitization trusts that we previously facilitated for loans that have similar credit characteristics to those in our Monogram-based loan portfolio.
At June 30, 2013 and 2012, there were $189 thousand and $54 thousand, respectively, of educations loans that were in non-accrual status and no education loans that had specific reserves. These loans included $42 thousand and $54 thousand, at June 30, 2013 and June 30, 2012, respectively, of loans that were transferred by Union Federal to an indirect subsidiary of FMD in 2009, prior to the launch of our Monogram platform. For loans greater than 180 days past due, but not yet charged-off, our policy is to evaluate the loans under ASC 310,Receivables, for a specific reserve. At June 30, 2013, there were $110 thousand of education loans that were greater than 180 days past due, which included $77 thousand of Monogram-based education loans issued through Union Federal.
Loans which were transferred by Union Federal to an indirect subsidiary of FMD in 2009, prior to the launch of our Monogram platform, were fully reserved for at June 30, 2013 and 2012.
Overall Education Loan Credit Quality
Management monitors the credit quality of an education loan based on loan status, as outlined below. The impact of changes in loan status, such as delinquency and time in repayment, is incorporated into the quarterly allowance for loan loss calculation through our projection of defaults. The following table represents our loan origination metrics with respect to our Monogram-based programs held at Union Federal at June 30, 2013 and June 30, 2012:
| | | | | | | | |
| | | June 30, | |
| | | 2013 | | | 2012 | |
Weighted-average FICO score | | | 752 | | | | 753 | |
Co-signers | | | 83 | % | | | 85 | % |
Delinquent loans | | | 0.45 | % | | | 0.03 | % |
The weighted-average FICO score is based on the maximum score of the borrower or co-signer at origination.
61
The following table provides additional information on the status of education loans outstanding:
| | | | | | | | | | | | | | | | |
| | | June 30,
2013 | | | As a percentage
of total | | | June 30,
2012 | | | As a percentage
of total | |
| | | (dollars in thousands) | |
Principal of loans outstanding: | | | | | | | | | | | | | | | | |
In basic forbearance | | $ | 439 | | | | 0.7 | % | | $ | 171 | | | | 0.5 | % |
In school and in deferment | | | 22,948 | | | | 35.5 | | | | 14,781 | | | | 43.0 | |
In repayment, including alternative payment plans, classified as: | | | | | | | | | | | | | | | | |
Current:£30 days past due | | | 40,724 | | | | 63.0 | | | | 19,289 | | | | 56.0 | |
Delinquent: >30 days past due, but£120 days past due | | | 355 | | | | 0.5 | | | | 109 | | | | 0.3 | |
Delinquent: >120 days past due, but£180 days past due | | | 79 | | | | 0.1 | | | | 54 | | | | 0.2 | |
In default: >180 days past due, but not yet charged-off | | | 110 | | | | 0.2 | | | | — | | | | — | |
| | | | | | | | | | | | | | | | |
Total gross loan principal outstanding | | $ | 64,655 | | | | 100.0 | % | | $ | 34,404 | | | | 100.0 | % |
| | | | | | | | | | | | | | | | |
Non-accrual loan principal (>120 days past due) | | $ | 189 | | | | 0.3 | % | | $ | 54 | | | | 0.2 | % |
Past due loan principal (>90 days, but£120 days past due still accruing interest) | | | 121 | | | | 0.2 | | | | 11 | | | | — | |
In alternative payment plans | | | 784 | | | | 1.2 | | | | 263 | | | | 0.8 | |
We use the following terms to describe borrowers’ payment status:
In School and in Deferment Pursuant to the terms of the education loans, a borrower may choose to defer principal and interest payments while carrying a specified academic course load and may be eligible to defer payments for an additional six months after graduation during a grace period. At the end of the deferment period, any remaining accrued but unpaid interest is capitalized and added to principal outstanding.
In Repayment We determine the repayment status of a borrower, including a borrower making payments pursuant to alternative payment plans, by contractual due dates. A borrower making reduced payments for a limited period of time pursuant to an alternative payment plan will be considered current if such reduced payments are timely made. Under our Monogram platform, borrowers may be in repayment while in school. Payment options while in school include full principal and interest, partial interest and interest only.
Forbearance Pursuant to the terms of the education loans, a borrower may apply for forbearance, which is a temporary reprieve from making full contractual payments. Forbearance can take many forms, at the option of the creditor. The most common forms of forbearance include the following:
| | • | | Basic forbearance—Cessation of all contractual payments for a maximum allowable forbearance period of one year, granted in three-month increments. Although basic forbearance is available as part of our Monogram-based programs, it has not been substantially utilized due to the seasoning of our Monogram-based education loan portfolio. |
| | • | | Alternative payment plans—Pursuant to an alternative payment plan, a borrower can make a reduced payment for a limited period of time. The amount of the payment varies depending on the program and may be set at a fixed dollar amount, a percentage of contractual required payments or interest-only payments. Generally, approval for alternative payment plans is granted for a maximum of six to 24 months, depending on the program. |
The use of forbearance is contemplated at the origination of an education loan and, as noted in the credit agreement with the borrower, is granted at the lender’s discretion. Under both basic forbearance and alternative payment plans, the education loan continues to accrue interest. When forbearance ceases, unpaid interest is capitalized and added to principal outstanding, and the borrower’s required payments are recalculated at a higher amount to pay off the loan, plus the additional accrued and capitalized interest, at the original stated interest rate by the original maturity date. There is no forgiveness of principal or interest, reduction in the interest rate or extension of the maturity date.
62
Forbearance programs result in a delay in the timing of payments received from borrowers; however, assuming the collection of the forborne amounts, provide for an increase in the gross volume of cash receipts over the term of the education loan due to the additional accrued interest capitalized while in forbearance. Forbearance programs may have the effect of delaying default emergence, and alternative payment plans may reduce the utilization of basic forbearance.
Mortgage Loans Held-to-Maturity
Through our bank subsidiary, Union Federal, we carry a portfolio of mortgage loans held-to-maturity. We establish a general allowance for loan losses for mortgage loans that have similar risk profiles. The allowance allocation factor for the general reserve is based on the historical net charge-off rate, which is then adjusted for current qualitative or environmental factors that are likely to cause estimated credit losses associated with the existing portfolio to differ from historical loss experience. Management considers the risk factors and assesses the impact of current issues and changes in those factors to the portfolio on an ongoing basis. In addition, we establish a specific allowance for loan losses when a loan is deemed to be impaired. Management estimates the credit loss by comparing the loan’s carrying value against either (1) the present value of the expected future cash flows discounted at the loan’s effective interest rate; (2) the loan’s observable market price or (3) the expected realizable fair value of the collateral, in the case of collateral dependent loans. A specific allowance is assigned to the impaired loan for the amount of estimated credit loss. Impaired loans are charged off, in whole or in part, when management believes that the recorded investment in the loan is uncollectible.
The following table summarizes the activity in the allowance for loan losses for mortgage loans:
| | | | | | | | |
| | | Fiscal years ended
June 30, | |
| | | 2013 | | | 2012 | |
| | | (dollars in thousands) | |
Balance, beginning of year | | $ | 591 | | | $ | 882 | |
Provision (credit) for loan losses | | | 137 | | | | (13 | ) |
Charge-offs | | | (295 | ) | | | (335 | ) |
Recoveries from borrowers | | | 7 | | | | 57 | |
| | | | | | | | |
Balance, end of year | | $ | 440 | | | $ | 591 | |
| | | | | | | | |
We place mortgage loans on non-accrual status when they become 90 days past due as to either principal or interest. The following table summarizes the aging of past due mortgage loans:
| | | | | | | | |
| | | June 30, | |
| | | 2013 | | | 2012 | |
| | | (dollars in thousands) | |
Non-accrual loans: | | | | | | | | |
Residential (1-4 family) | | $ | 570 | | | $ | 1,049 | |
Commercial/mixed use | | | 94 | | | | 220 | |
Accruing loans: | | | | | | | | |
Accruing loans 30-59 days past due | | | 560 | | | | 708 | |
We did not have any accruing mortgage loans that were 60 or more days past due.
Deposits for Participation Interest Accounts
Deposits for participation accounts were reported at fair value on our consolidated balance sheets. Deposits for participation accounts increased by $9.1 million from $4.0 million at June 30, 2012 to $13.1 million at June 30, 2013. The increase year-over-year is primarily attributable to increased fundings in fiscal 2013 due to an increase in disbursed loan volumes for our partnered lending clients.
63
Goodwill and Intangible Assets
Goodwill represents the excess of the cost of an acquisition over the fair value of the net tangible and other intangible assets acquired. Other intangible assets represent purchased assets that can be distinguished from goodwill because of contractual rights or because the asset can be exchanged on its own or in combination with a related contract, asset or liability. In connection with our acquisition of assets from TMS and the Cology Sellers, we recorded other intangible assets related to the TMS customer list and tradename and the Cology Sellers customer list, each of which we amortize on a straight-line basis over 15 years, and TMS technology, which we amortize on a straight-line basis over six years. We record amortization expense in general and administrative expenses in our consolidated statements of operations.
As it relates to TMS, the customer list intangible asset is related to educational institutions with which TMS had existing tuition programs in place as of December 31, 2010. The trade name intangible asset relates to the name and reputation of TMS in the tuition payment industry. Intangible assets attributable to technology represented the replacement cost of software and systems acquired that are necessary to support operations, net of an obsolescence factor. Goodwill represents the value ascribed to the acquisition of TMS that cannot be separately ascribed to a tangible or intangible asset.
As it relates to Cology LLC, the customer list intangible asset is related to lender clients, including credit unions, banks and schools, with which the Cology Sellers had existing loan origination and servicing programs in place as of October 19, 2012. Goodwill represents the value ascribed to the acquisition of a substantial portion of the operating assets of the Cology Sellers that cannot be separately ascribed to a tangible or intangible asset.
In 2013, we evaluated our goodwill for impairment on May 31, which is our annual impairment testing date, and concluded that the fair market values of the TMS and Cology LLC reporting units were approximately 40% and 15%, respectively, in excess of our recorded book value and, therefore, were not impaired as of that date. In determining whether impairment exists, we assess impairment at the level of the TMS and Cology LLC reporting units. There have been no indicators of impairment since that date.
Various assumptions go into our assessment of whether there is any goodwill impairment to be recorded. The more meaningful assumptions that contribute to the cash flow model used to determine the fair value of the TMS reporting unit include the net retention rate of new and existing clients, the penetration rate achieved in the overall customer portfolio, adoption of refund management and Student Account Center products and pricing, the level of interest income to be earned by TMS on funds received but not yet disbursed to client schools, including the forward LIBOR curve, the level of cash balances and the applicable hold periods, all of which impact net interest income, expense levels at TMS and the discount rate used to determine the present value of the cash flow streams. TMS’ business would be adversely affected if any of the following were to occur: higher attrition rates than planned as a result of the competitive environment or our inability to provide products and services that are competitive in the marketplace, lower-than-planned adoption rates of refund management and Student Account Center products, higher-than-expected expense levels to provide services to TMS’ clients, a lower interest rate environment than depicted by the LIBOR curve, shorter hold periods or lower cash balances than contemplated, which would reduce our overall net interest income opportunity for cash that is held by us on behalf of TMS’ school clients, increases in equity returns required by investors and changes in our business model that may impact one or more of these variables. The more meaningful assumptions that contribute to the cash flow model used to determine the fair value of the Cology LLC reporting unit include loan volume growth, revenues related to the cross-selling of Monogram-based products and services, client attrition, costs required to support the assumed volume of the business, and discount rates. Cology LLC’s business would be adversely affected if any of the following were to occur: higher attrition rates than planned, a lack of acceptance of Monogram products and services by its credit union and other lender clients, higher-than-expected expense levels to provide services to Cology LLC clients and changes in our business model that may impact one or more of these variables.
At June 30, 2013, our net intangible assets balance was $24.2 million, of which $18.7 million related to TMS and $5.4 million related to Cology LLC. During the fiscal year ended June 30, 2013, we recorded amortization expense of $1.9 million related to TMS and $283 thousand related to Cology LLC.
64
Contractual Obligations
Our consolidated contractual obligations consist of commitments under operating leases.
The following table below summarizes our contractual cash obligations by period at June 30, 2013, excluding the offsetting effect of payments due to us under subleases:
| | | | | | | | | | | | | | | | | | | | |
Contractual obligations | | Payments due by period | |
| | Total | | | Less than
1 year | | | 1-3 years | | | 3-5 years | | | More than
5 years | |
| | | (dollars in thousands) | |
Operating lease obligations(1) | | $ | 15,938 | | | $ | 8,848 | | | $ | 5,336 | | | $ | 1,754 | | | $ | — | |
| (1) | For additional information on our operating leases, see Item 2, “Properties,” in this annual report. We sublease 135,719 square feet of our Boston, Massachusetts (St. James Avenue) location. We expect to collect $2.7 million in sublease revenue over the remaining term of this sublease. On June 10, 2011, we entered into a sublease agreement, effective July 1, 2011, reducing our rented space at our corporate headquarters in Boston, Massachusetts (Boylston Street) by 27,587 square feet. We expect to collect $800 thousand in sublease revenue over the remaining term of this sublease. In addition, effective July 1, 2011, we entered into an amendment to reduce our rented space in our Medford, Massachusetts location by 8,908 square feet, which results in a savings of $718 thousand over the remaining term of the lease. |
Total Stockholders’ Equity
Total stockholders’ equity decreased from $227.0 million at June 30, 2012 to $179.3 million at June 30, 2013 as a result of our net loss of $50.2 million and the change in accumulated other comprehensive income of $1.4 million for the net unrealized losses on our investments available-for-sale portfolio, partially offset by an increase of $4.1 million in additional paid-in capital primarily for stock compensation.
Off-Balance Sheet Arrangements
We offer outsourcing services in connection with education loan programs, from program design through securitization of the education loans. We have historically structured and facilitated the securitization of education loans for our clients through a series of special purpose trusts.
The principal uses of the securitization trusts we facilitated have been to generate sources of liquidity for our clients’ and Union Federal’s assets sold into such trusts and make available more funds to students and colleges. See “—Critical Accounting Policies and Estimates—Consolidation” below for a discussion of our determination to not consolidate these securitization trusts.
65
Consolidated Average Balance Sheet
The following tables reflect our consolidated average balance sheet, net interest income and rates earned and paid on interest-earning assets and interest-bearing liabilities from continuing operations:
| | | | | | | | | | | | | | | | | | | | | | | | | | | | | | | | | | | | |
| | | Fiscal years ended June 30, | |
| | 2013 | | | 2012 | | | 2011 | |
| | Average
daily
balance | | | Interest | | | Rate | | | Average
daily
balance | | | Interest | | | Rate | | | Average
daily
balance | | | Interest | | | Rate | |
| | | (dollars in thousands) | |
Assets: | | | | | | | | | | | | | | | | | | | | | | | | | | | | | | | | | | | | |
Interest-bearing cash and cash equivalents | | $ | 118,884 | | | $ | 186 | | | | 0.16 | % | | $ | 168,046 | | | $ | 257 | | | | 0.15 | % | | $ | 261,673 | | | $ | 551 | | | | 0.21 | % |
Short-term investments | | | 57,200 | | | | 337 | | | | 0.59 | | | | 60,766 | | | | 290 | | | | 0.48 | | | | 52,191 | | | | 269 | | | | 0.52 | |
Interest-bearing restricted cash | | | 15,497 | | | | 38 | | | | 0.24 | | | | 70,726 | | | | 482 | | | | 0.68 | | | | 41,689 | | | | 133 | | | | 0.32 | |
Investments available-for-sale | | | 80,050 | | | | 1,483 | | | | 1.85 | | | | 41,502 | | | | 844 | | | | 2.03 | | | | 3,763 | | | | 181 | | | | 4.81 | |
Education loans held-to-maturity | | | 51,849 | | | | 3,216 | | | | 6.20 | | | | 17,456 | | | | 1,109 | | | | 6.35 | | | | 24,918 | | | | 288 | | | | 1.16 | |
Mortgage loans held-to-maturity | | | 10,772 | | | | 425 | | | | 3.95 | | | | 7,832 | | | | 308 | | | | 3.93 | | | | 8,050 | | | | 355 | | | | 4.40 | |
| | | | | | | | | | | | | | | | | | | | | | | | | | | | | | | | | | | | |
Total interest-earning assets | | | 334,252 | | | | 5,685 | | | | 1.70 | | | | 366,328 | | | | 3,290 | | | | 0.90 | | | | 392,284 | | | | 1,777 | | | | 0.45 | |
Non-interest-bearing cash | | | 1,320 | | | | | | | | | | | | 1,531 | | | | | | | | | | | | 1,492 | | | | | | | | | |
Allowance for loan losses and lower of cost or fair value adjustments | | | (2,018 | ) | | | | | | | | | | | (2,010 | ) | | | | | | | | | | | (2,231 | ) | | | | | | | | |
Other assets | | | 156,446 | | | | | | | | | | | | 121,200 | | | | | | | | | | | | 88,462 | | | | | | | | | |
| | | | | | | | | | | | | | | | | | | | | | | | | | | | | | | | | | | | |
Total assets | | $ | 490,000 | | | | | | | | | | | $ | 487,049 | | | | | | | | | | | $ | 480,007 | | | | | | | | | |
| | | | | | | | | | | | | | | | | | | | | | | | | | | | | | | | | | | | |
Liabilities: | | | | | | | | | | | | | | | | | | | | | | | | | | | | | | | | | | | | |
Time and savings account deposits | | $ | 50,050 | | | $ | 528 | | | | 1.05 | % | | $ | 43,095 | | | $ | 408 | | | | 0.95 | % | | $ | 48,537 | | | $ | 468 | | | | 0.96 | % |
Money market account deposits | | | 78,249 | | | | 769 | | | | 0.98 | | | | 27,668 | | | | 257 | | | | 0.93 | | | | 20,121 | | | | 150 | | | | 0.74 | |
Other interest-bearing liabilities | | | 1,996 | | | | 125 | | | | 6.25 | | | | 4,264 | | | | 250 | | | | 5.86 | | | | 7,531 | | | | 419 | | | | 5.56 | |
| | | | | | | | | | | | | | | | | | | | | | | | | | | | | | | | | | | | |
Total interest-bearing liabilities | | | 130,295 | | | | 1,422 | | | | 1.09 | | | | 75,027 | | | | 915 | | | | 1.22 | | | | 76,189 | | | | 1,037 | | | | 1.36 | |
All other liabilities | | | 155,318 | | | | | | | | | | | | 174,631 | | | | | | | | | | | | 102,060 | | | | | | | | | |
| | | | | | | | | | | | | | | | | | | | | | | | | | | | | | | | | | | | |
Total liabilities | | | 285,613 | | | | | | | | | | | | 249,658 | | | | | | | | | | | | 178,249 | | | | | | | | | |
Stockholders’ equity | | | 204,387 | | | | | | | | | | | | 237,391 | | | | | | | | | | | | 301,758 | | | | | | | | | |
| | | | | | | | | | | | | | | | | | | | | | | | | | | | | | | | | | | | |
Total liabilities and stockholders’ equity | | $ | 490,000 | | | | | | | | | | | $ | 487,049 | | | | | | | | | | | $ | 480,007 | | | | | | | | | |
| | | | | | | | | | | | | | | | | | | | | | | | | | | | | | | | | | | | |
Total interest-earning assets | | $ | 334,252 | | | | | | | | | | | $ | 366,328 | | | | | | | | | | | $ | 392,284 | | | | | | | | | |
| | | | | | | | | | | | | | | | | | | | | | | | | | | | | | | | | | | | |
Net interest income | | | | | | $ | 4,263 | | | | | | | | | | | $ | 2,375 | | | | | | | | | | | $ | 740 | | | | | |
| | | | | | | | | | | | | | | | | | | | | | | | | | | | | | | | | | | | |
Net interest margin | | | | | | | | | | | 1.28 | % | | | | | | | | | | | 0.65 | % | | | | | | | | | | | 0.19 | % |
66
Analysis of changes in net interest income
| | | | | | | | | | | | | | | | | | | | | | | | |
| | | From 2013 to 2012
due to change in | | | From 2012 to 2011
due to change in | |
| | Volume | | | Rate | | | Net
change | | | Volume | | | Rate | | | Net
change | |
| | (dollars in thousands) | |
Interest-bearing cash and cash equivalents | | $ | (77 | ) | | $ | 6 | | | $ | (71 | ) | | $ | (143 | ) | | $ | (151 | ) | | $ | (294 | ) |
Short-term investments | | | (17 | ) | | | 64 | | | | 47 | | | | 41 | | | | (20 | ) | | | 21 | |
Interest-bearing restricted cash | | | (134 | ) | | | (310 | ) | | | (444 | ) | | | 198 | | | | 151 | | | | 349 | |
Investments available-for-sale | | | 715 | | | | (76 | ) | | | 639 | | | | 767 | | | | (104 | ) | | | 663 | |
Education loans held-to-maturity | | | 2,133 | | | | (26 | ) | | | 2,107 | | | | (475 | ) | | | 1,296 | | | | 821 | |
Mortgage loans held-to-maturity | | | 115 | | | | 2 | | | | 117 | | | | (9 | ) | | | (38 | ) | | | (47 | ) |
| | | | | | | | | | | | | | | | | | | | | | | | |
Total interest income | | | | | | | | | | | 2,395 | | | | | | | | | | | | 1,513 | |
| | | | | | | | | | | | | | | | | | | | | | | | |
Time and savings account deposits | | | 73 | | | | 47 | | | | 120 | | | | (52 | ) | | | (8 | ) | | | (60 | ) |
Money market account deposits | | | 497 | | | | 15 | | | | 512 | | | | 70 | | | | 37 | | | | 107 | |
Other interest-bearing liabilities | | | (141 | ) | | | 16 | | | | (125 | ) | | | (192 | ) | | | 23 | | | | (169 | ) |
| | | | | | | | | | | | | | | | | | | | | | | | |
Total interest expense | | | | | | | | | | | 507 | | | | | | | | | | | | (122 | ) |
| | | | | | | | | | | | | | | | | | | | | | | | |
Net increase in net interest income | | | | | | | | | | $ | 1,888 | | | | | | | | | | | $ | 1,635 | |
| | | | | | | | | | | | | | | | | | | | | | | | |
Liquidity and Capital Resources
Sources and Uses of Cash
The following is a discussion of sources and uses of cash on a GAAP basis as presented in our consolidated statements of cash flows included in our consolidated financial statements included in Item 8 of this annual report. We also use a non-GAAP financial metric, “net operating cash usage,” when evaluating our cash and liquidity position, discussed in detail under “—Non-GAAP Measure: Net Operating Cash Usage” below.
Net cash used in operating activities from continuing operations for fiscal 2013 was $51.1 million, compared with net cash used in operating activities from continuing operations of $42.2 million for fiscal 2012. The increase in cash used was principally the result of an increase in net funding of participation accounts of $13.6 million for fiscal 2013 coupled with the receipt of $13.0 million from the sale of certain service revenue receivables in the second quarter of fiscal 2012. These changes were partially offset by a $13.2 million lower loss from operations in fiscal 2013 compared to fiscal 2012.
We anticipate continuing to receive fees related to loan processing and origination and portfolio management services as well as fees related to Monogram-based loan programs. We believe that our cash, cash equivalents and investments, coupled with the management of our expenses and these fees, will be adequate to fund our operating losses in the short term as we seek to expand our client and revenue base over the short and long term. We are uncertain, however, as to whether we will be successful in selling our Monogram platform to additional lenders or how much loan volume may be originated by current or any additional lenders in the future.
Net cash used in investing activities from continuing operations for fiscal 2013 was $70.7 million compared to $88.1 million for fiscal 2012. The improvement of $17.4 million was the result of an increase in the net proceeds from short-term investments of $64.8 million and a $39.7 million decline in the net purchases of available-for-sale securities as this portfolio was significantly expanded in fiscal 2012 as part of the asset diversification process at Union Federal. These were partially offset by an $80.0 million decrease in restricted cash and restricted funds due to clients, due to the $40.0 million of TMS deposits that was transferred to Union Federal in fiscal 2012 and returned to TMS in fiscal 2013, and $4.7 million used for the acquisition of a substantial portion of the operating assets of the Cology Sellers.
Net cash provided by financing activities from continuing operations was $80.2 million for fiscal 2013 compared to net cash provided by financing activities of $22.7 million during fiscal 2012, primarily reflecting an increase in deposits.
67
The OCC regulates all capital distributions by Union Federal directly or indirectly to us, including dividend payments. Union Federal is required to file a notice with the OCC at least 30 days before the proposed declaration of a dividend or approval of a proposed capital distribution by Union Federal’s board of directors. Union Federal must file an application to receive the approval of the OCC for a proposed capital distribution when, among other circumstances, the total amount of all capital distributions (including the proposed capital distribution) for the applicable calendar year exceeds net income for that year to date plus the retained net income for the preceding two years.
A notice or application to make a capital distribution by Union Federal may be disapproved or denied by the OCC if it determines that, after making the capital distribution, Union Federal would fail to meet minimum required capital levels or if the capital distribution raises safety or soundness concerns or is otherwise restricted by statute, regulation or agreement between Union Federal and the OCC or a condition imposed by an OCC agreement. Under the Federal Deposit Insurance Corporation Improvement Act, or FDICIA, an FDIC-insured depository institution such as Union Federal is prohibited from making capital distributions, including the payment of dividends, if, after making such distribution, the institution would become “undercapitalized” (as such term is used in the FDICIA).
Sources and Uses of Liquidity
We expect to fund our short-term liquidity requirements primarily through cash and cash equivalents and revenues from operations, and we expect to fund our long-term liquidity requirements through a combination of revenues from operations and various financing vehicles available to us in the ABS markets. We may also utilize issuances of common stock, promissory notes or other securities or the potential sale of certain assets of FMD. We expect to assess our financing alternatives periodically and access the capital markets opportunistically. If our existing resources are insufficient to satisfy our liquidity requirements, or if we were to enter into a strategic arrangement with another company, we may need to sell additional equity or debt securities. Any sale of additional equity or convertible debt securities may result in additional dilution to our stockholders, and we cannot be certain that additional public or private financing will be available in amounts or on terms acceptable to us, if at all. If we are unable to obtain this additional financing, we may be required to further delay, reduce the scope of or eliminate one or more aspects of our operational activities, which could harm our business.
Our liquidity and capital funding requirements may depend on a number of factors, including:
| | • | | Cash necessary to fund our operations, including the operations of Union Federal, TMS and Cology LLC, and capital expenditures; |
| | • | | The extent to which our services and products, including our Monogram platform, TMS offerings and Cology LLC offerings, gain market share and remain competitive at pricing levels favorable to us; |
| | • | | The results of the audit conducted by the IRS of our tax returns for fiscal 2007 through fiscal 2010, which could result in challenges to tax refunds previously received in the amounts of $176.6 million in connection with our sale of the Trust Certificate and the $45.1 million income tax refund received in October 2010. In connection with the IRS audit, on September 10, 2013, we received two NOPAs from the IRS that contain the proposed adjustments that we announced on August 15, 2013. The NOPAs propose to disallow the loss that generated the tax refunds that we previously received as well as require us to include income from the Trust Certificate from the March 31, 2009 sale date through June 30, 2011 in our taxable income for such years. If the IRS’ positions are successful, the disallowance of the loss, coupled with the additional taxable income after the sale date through June 30, 2011, would create federal income tax adjustments that we estimate to be approximately $300.0 million plus interest, with the interest continuing to accrue until the matter is resolved; |
| | • | | The profitability of our Monogram platform, which is dependent on, among other things, the amount of loan volume our lender clients are able to generate and costs incurred to acquire such volume; |
| | • | | The extent to which we fund credit enhancement arrangements or contribute to credit facility providers in connection with our Monogram platform; |
| | • | | The ability to access wholesale financing opportunities within Union Federal to help meet the liquidity needs generated by Monogram-based loans; |
68
| | • | | The regulatory capital requirements applicable to Union Federal (see “—Support of Subsidiary Bank” below for additional information) as well as any capital contributions or credit enhancements FMD may make to Union Federal; |
| | • | | The resolution of our appeal of the ATB Order, which could also affect our state tax liabilities for fiscal 2008 and fiscal 2009; and |
| | • | �� | The timing, size, structure and terms of any securitization or other funding transactions that we structure, as well as the composition of the loan pool being securitized. |
Liquidity is required for capital expenditures, working capital, business development expenses, business acquisitions, income tax payments, costs associated with alternative financing transactions, general corporate expenses, capital provided in connection with Monogram-based loan program credit enhancement arrangements or capital market transactions and maintaining the regulatory capital of Union Federal. In order to preserve capital and maximize liquidity in challenging market conditions, we have in the past taken certain broad measures to reduce the risk related to education loans and residual receivables on our consolidated balance sheet, change our fee structure, add new products and reduce our overhead expenses. In addition, the FMD Board of Directors has eliminated regular quarterly cash dividends for the foreseeable future.
Deposits
Union Federal has liabilities for retail time, money market and savings deposits accounts. The following table summarizes Union Federal’s time deposits greater than $100 thousand by maturity at June 30, 2013:
| | | | |
| | | (dollars in thousands) | |
Within three months | | $ | 5,369 | |
Three to six months | | | 2,363 | |
Six months to twelve months | | | 3,209 | |
Greater than twelve months | | | 6,169 | |
| | | | |
Total time deposits >$100 thousand | | $ | 17,110 | |
| | | | |
The maturities of these deposits are not directly indicative of the future timing of cash needed for financing activities because they do not take into account the customers that may reinvest their funds into new time deposits or into other types of deposit accounts.
Restricted Funds Due to Clients
As part of our operations, we have cash that is recorded as restricted cash on our consolidated balance sheets because it is deposited with third party institutions and not available for our use. Included in restricted cash on our consolidated balance sheets are tuition payments due to schools, undisbursed loan origination proceeds and loan payments and recoveries on defaulted education loans. We record a liability on our consolidated balance sheets representing tuition payments due to our TMS clients, loan origination proceeds and loan payments due to our Cology LLC clients and recoveries on defaulted education loans and education loan proceeds due to schools.
Lines of Credit
At June 30, 2013, through Union Federal, we had $82.0 million available for borrowing under an unused line of credit with the Federal Home Loan Bank of Boston. There were no borrowings outstanding under this line of credit at June 30, 2013 or June 30, 2012.
Non-GAAP Measure: Net Operating Cash Usage
In addition to providing financial measurements based on GAAP, we present below an additional financial metric that we refer to as “net operating cash usage” that was not prepared in accordance with GAAP. We define “net operating cash usage” to approximate cash requirements to fund our operations. “Net operating cash usage”
69
is not directly comparable to our consolidated statements of cash flows prepared in accordance with GAAP. Legislative and regulatory guidance discourage the use of, and emphasis on, non-GAAP financial metrics and require companies to explain why a non-GAAP financial metric is relevant to management and investors.
Management and the FMD Board of Directors use this non-GAAP financial metric, in addition to GAAP financial measures, as a basis for measuring and forecasting our core operating performance and comparing such performance to that of prior periods. This non-GAAP financial measure is also used by us in our financial and operational decision-making.
We believe that the inclusion of this non-GAAP financial metric helps investors to gain a better understanding of our results, including our non-interest expenses and liquidity position. In addition, our presentation of this non-GAAP financial measure is consistent with how we expect that analysts may calculate their estimates of our financial results in their research reports and with how clients, investors, analysts and financial news media may evaluate our financial results.
There are limitations associated with reliance on any non-GAAP financial measure because any such measure is specific to our operations and financial performance, which makes comparisons with other companies’ financial results more challenging. Nevertheless, by providing both GAAP and non-GAAP financial measures, we believe that investors are able to compare our GAAP results to those of other companies, while also gaining a better understanding of our operating performance, consistent with management’s evaluation.
“Net operating cash usage” should be considered in addition to, and not as a substitute for, or superior to, financial information prepared in accordance with GAAP. “Net operating cash usage” excludes the effects of income taxes, acquisitions or divestitures, participation account net fundings and changes in other assets and other liabilities that are solely related to short-term timing of cash payments or receipts.
In accordance with the requirements of Regulation G promulgated by the SEC, the table below presents the most directly comparable GAAP financial measure, loss from continuing operations, before income taxes, for the twelve months ended June 30, 2013 and June 30, 2012, and reconciles the GAAP measure to the comparable non-GAAP financial metric:
| | | | | | | | |
| | | Twelve Months Ended
June 30, | |
| | | 2013 | | | 2012 | |
| | | (dollars in thousands) | |
Loss from continuing operations, before income taxes | | $ | (47,901 | ) | | $ | (51,548 | ) |
Adjustments to loss from continuing operations, before income taxes: | | | | | | | | |
Non-cash gain from deconsolidation of trusts | | | — | | | | (9,514 | ) |
Fair value changes to service revenue receivables | | | (2,068 | ) | | | (947 | ) |
Cash distributions from service revenue receivables | | | 3,592 | | | | 1,216 | |
Depreciation and amortization | | | 4,347 | | | | 4,766 | |
Stock-based compensation | | | 4,214 | | | | 4,647 | |
TMS deferred revenue | | | (496 | ) | | | (1,701 | ) |
Additions to property and equipment | | | (3,465 | ) | | | (1,727 | ) |
Other, net of cash flows from FMDS in fiscal 2012 | | | (708 | ) | | | 1,738 | |
| | | | | | | | |
Non-GAAP net operating cash usage | | $ | (42,485 | ) | | $ | (53,070 | ) |
| | | | | | | | |
“Net operating cash usage” for the fiscal year ended June 30, 2013 was $42.5 million, a $10.6 million, or 20%, reduction compared to the fiscal year ended June 30, 2012. The decrease of $10.6 million for fiscal 2013 as compared to fiscal 2012 was largely the result of a decrease in non-interest cash expenses of $8.3 million driven principally by decreases of $7.1 million in general and administrative expenses and $1.2 million in compensation and benefits expenses. The decrease in general and administrative expenses was largely due to a decrease of $4.3 million in trust related special servicing expenses as a result of the cessation of our special servicing obligations for the NCSLT Trusts. Increased cash receipts from service revenue receivables of $2.4 million also contributed to the decrease in “net operating cash usage.” The decrease in “net operating cash usage” was partially offset by approximately $3.2 million of cash flows related to FMDS in fiscal 2012 not received in fiscal 2013.
70
Support of Subsidiary Bank
Union Federal is a federally-chartered thrift that is subject to various regulatory capital requirements administered by the federal banking agencies. Failure to meet minimum capital requirements can result in initiation of certain mandatory and possibly additional discretionary actions by the regulators that, if undertaken, could have a direct material effect on our liquidity. Under capital adequacy guidelines and the regulatory framework for prompt corrective action, Union Federal must meet specific capital guidelines that involve quantitative measures of Union Federal’s assets and liabilities as calculated under regulatory accounting practices. The capital amounts and classifications, however, are also subject to qualitative judgments by the regulators about components, risk weightings and other factors.
Union Federal’s equity capital was $21.6 million at June 30, 2013, up from $16.3 million at June 30, 2012, principally due to $5.8 million in capital contributions to Union Federal by FMD during fiscal 2013. Quantitative measures established by regulation to ensure capital adequacy require Union Federal to maintain minimum amounts and ratios of total capital and Tier 1 capital to risk-weighted assets (each as defined in the regulations). As of June 30, 2013 and June 30, 2012, Union Federal was well capitalized under the regulatory framework for prompt corrective action.
Union Federal’s regulatory capital ratios were as follows as of the dates below:
| | | | | | | | | | | | | | | | |
| | | Regulatory Guidelines | | | June 30, | |
| | | Minimum | | | Well
Capitalized | | | 2013 | | | �� 2012 | |
Capital ratios: | | | | | | | | | | | | | | | | |
Tier 1 risk-based capital | | | 4.0 | % | | | 6.0 | % | | | 25.2 | % | | | 31.3 | % |
Total risk-based capital | | | 8.0 | | | | 10.0 | | | | 26.0 | | | | 31.7 | |
Tier 1 (core) capital | | | 4.0 | | | | 5.0 | | | | 11.7 | | | | 11.0 | |
FMD is subject to regulation, supervision and examination by the Federal Reserve, as a savings and loan holding company, and Union Federal is subject to regulation, supervision and examination by the OCC.
In March 2010, the FMD Board of Directors adopted resolutions required by the OTS, Union Federal’s regulator at that time, undertaking to support the implementation by Union Federal of its business plan, so long as Union Federal is owned or controlled by FMD, and to notify the OTS (and now the OCC effective in fiscal 2012) in advance of any distributions to our stockholders in excess of $1.0 million per fiscal quarter and any incurrence or guarantee of debt in excess of $5.0 million. These resolutions continue to be applied by the Federal Reserve. Distribution to our stockholders may be further restricted by the Federal Reserve’s required approval in those instances when such distributions exceed the net earnings of the prior 12-month period.
Inflation
Inflation was not a material factor in either revenues or operating expenses during the periods presented.
Critical Accounting Policies and Estimates
Our consolidated financial statements have been prepared in accordance with GAAP. The preparation of our consolidated financial statements requires management to make estimates, assumptions and judgments that affect the reported amounts of assets and liabilities, and the disclosure of contingent assets and liabilities, at the date of our consolidated financial statements, as well as the reported amounts of revenues and expenses during the reporting period. We base our estimates, assumptions and judgments on our historical experience, economic conditions and on various other factors that we believe are reasonable under the circumstances. Actual results may differ from these estimates under varying assumptions or conditions. Our significant accounting policies are more fully described in Note 2, “Summary of Significant Accounting Policies,” in the notes to our consolidated financial statements included in Item 8 of this annual report.
71
On an ongoing basis, we evaluate our estimates and judgments, particularly as they relate to accounting policies that we believe are most important to the portrayal of our financial condition and results of operations. We regard an accounting estimate or assumption underlying our consolidated financial statements to be a “critical accounting estimate” where:
| | • | | The nature of the estimate or assumption is material due to the level of subjectivity and judgment necessary to account for highly uncertain matters or the susceptibility of such matters to change; and |
| | • | | The impact of the estimates and assumptions on our financial condition or operating performance is material. |
We have discussed our accounting policies with the Audit Committee of the FMD Board of Directors. We consider the following to be our critical accounting policies:
| | • | | Whether to consolidate the financial results of a VIE; |
| | • | | The determination of goodwill and other intangible asset impairment; and |
| | • | | Income taxes relating to uncertain tax positions under ASC 740. |
Consolidation
We review certain VIEs for which we have previously securitized to determine whether we are the primary beneficiary of the entity. We continually reassess our involvement with each VIE in which we have an interest, both on- and off-balance sheet, and our determination of whether consolidation or deconsolidation of a VIE is appropriate. We monitor matters related to our ability to control economic performance, such as contractual changes in the services we provide, the extent of our ownership and the rights of third parties to terminate us as a service provider. In addition, we monitor the financial performance of each VIE for indications that we may or may not have the right to absorb benefits or the obligation to absorb losses associated with variability in the financial performance of the VIE that could potentially be significant to that VIE. If, for any reason, we determine that we can no longer be considered the primary beneficiary, we would be required to deconsolidate the VIE. Deconsolidation of a VIE is accounted for in the same manner as the sale of a subsidiary, with a gain or loss recorded in our consolidated statements of operations to the extent that proceeds, if any, are more or less than the net assets of the VIE.
Effective July 1, 2010, the Financial Accounting Standards Board amended ASC 810,Consolidation, or ASC 810, and removed the exemption from consolidation for a Qualifying Special Purpose Entity. ASC 810 further requires enterprises to perform analyses to determine if they are the primary beneficiary of a VIE. A primary beneficiary of a VIE is an enterprise that has both:
| | • | | The power to direct the activities of a VIE that most significantly impact that VIE’s economic performance; and |
| | • | | The obligation to absorb losses of the VIE that could potentially be significant to that VIE or the right to receive benefits from the VIE that could potentially be significant to that VIE. |
As a result, on July 1, 2010, we consolidated 14 securitization trusts that were facilitated by us because we determined that our services related to default prevention and collections management, for which we can only be removed for cause, combined with the variability that we absorbed as part of our securitization fee structure, made us the primary beneficiary of those trusts. In addition, we deconsolidated our indirect subsidiary UFSB-SPV because we determined that we did not have the power to direct activities that most significantly impact UFSB-SPV’s economic performance. During fiscal 2012, we deconsolidated the 14 securitization trusts we had consolidated as we no longer were the primary beneficiary of these trusts. See Note 3, “Discontinued Operations,” in the notes to our consolidated financial statements included in Item 8 of this annual report for additional information
We also monitor our involvement with nine off-balance sheet VIEs for which we have determined that we are not the primary beneficiary due to the sole, unilateral rights of other parties to terminate us in our role as
72
service provider or due to a lack of obligation on our part to absorb benefits or losses of the VIE that would be significant to that VIE. A significant change to the pertinent rights of other parties or us, or a significant change to the ranges of possible financial performance outcomes used in our assessment of the variability of cash flows due to us, could cause us to change our determination of whether or not a VIE should be consolidated in future periods. Our determination to consolidate or deconsolidate a VIE may lead to increased volatility in our financial results and make comparisons of results between time periods challenging.
Review of Goodwill and Intangible Assets for Impairment
On December 31, 2010, we completed our acquisition of the assets, liabilities and operations of TMS, formerly a division of KeyBank National Association. On October 19, 2012, Cology LLC acquired a substantial portion of the operating assets, and assumed certain liabilities, of the Cology Sellers. As a result of these acquisitions, we recorded goodwill and intangible assets. We test goodwill for impairment annually and more frequently if circumstances warrant.
Intangible assets acquired consist of the TMS customer lists, technology and tradename and the Cology Sellers customer list. The values of these intangible assets were estimated using valuation techniques, based on discounted cash flow analysis. These intangible assets are being amortized over the period the assets are expected to contribute to our cash flows. These intangible assets are subject to impairment tests in accordance with GAAP, generally, whenever events or changes in circumstances indicate that their carrying amount may not be fully recoverable.
We evaluate goodwill for impairment by comparing the fair values of the operations of the TMS and Cology LLC reporting units to their carrying values, including goodwill. If the fair value of the reporting unit exceeds the carrying value, goodwill is not deemed to be impaired. If the fair value is less than the carrying value, a further analysis is required to determine the amount of impairment, if any.
There are significant judgments involved in determining the fair values of the TMS and Cology LLC reporting units, including assumptions regarding the estimates of future cash flows from existing and new business activities, customer relationships, the value of existing customer contracts, the value of other intangible assets, as well as assumptions regarding what we believe a third party is willing to pay for all of the assets and liabilities of TMS and Cology LLC. The calculation also requires us to estimate the appropriate discount and growth rates to apply to those projected cash flows and an appropriate control premium to apply to arrive at a final fair value. Since the businesses are not publicly traded, and often there is not comparable market data available, there is a higher degree of judgment applied and the use of cash flows is weighted more heavily than the use of market multiples. In the event that we determine that our goodwill or intangible assets are impaired, the recognition of an impairment charge could have an adverse impact on our results of operations in the period that the impairment occurred or on our financial position. For fiscal 2013 and fiscal 2012, we recorded no goodwill impairment. We evaluated goodwill for impairment at our annual impairment testing date of May 31.
Income Taxes
Certain areas of accounting for income taxes require management’s judgment, including determining the adequacy of liabilities for uncertain tax positions. Judgments are made regarding various tax positions, which are often subjective and involve assumptions about items that are inherently uncertain. If actual factors and conditions differ materially from estimates made by management, the actual realization of liabilities for uncertain tax positions could vary materially from the amounts previously recorded.
Deferred tax assets arise from items that may be used as a tax deduction or credit in future income tax returns, for which a financial statement tax benefit has already been recognized. The realization of the net deferred tax asset generally depends upon future levels of taxable income and the existence of prior years’ taxable income to which refund claims could be carried back. Valuation allowances are recorded against those deferred tax assets determined not likely to be realized. Deferred tax liabilities represent items that will require a future tax payment. They generally represent tax expense recognized in our consolidated financial statements for which payment has been deferred, or a deduction taken on our tax return but not yet recognized as an expense in our consolidated financial statements.
73
| Item 7A. | Quantitative and Qualitative Disclosures about Market Risk |
Interest rate risk is the primary market risk associated with our operations. Management monitors liquidity and interest rate risk matters. These matters are discussed with the FMD Board of Directors and the Union Federal Board of Directors, as applicable. Interest rate risk is the risk of loss to future earnings due to changes in interest rates. Interest rate risk applies to all of our interest-bearing assets and liabilities, as well as service revenue receivables.
Our risk-based interest-bearing assets are largely made up of our investments available-for-sale, education loans and mortgage loans. The mix of fixed rate versus variable rate instruments for our investments available-for-sale and loan portfolios as of June 30, 2013 are presented in the table below:
| | | | | | | | | | | | | | | | | | | | |
June 30, 2013 | | Amount | | | Variable | | | % Variable | | | Fixed | | | % Fixed | |
| | | (dollars in thousands) | |
Investments available-for-sale | | $ | 84,782 | | | $ | 16,522 | | | | 19.5 | % | | $ | 68,260 | | | | 80.5 | % |
Education loans held-to-maturity | | | 62,996 | | | | 62,996 | | | | 100.0 | | | | — | | | | — | |
Mortgage loans held-to-maturity | | | 12,629 | | | | 3,634 | | | | 28.8 | | | | 8,995 | | | | 71.2 | |
| | | | | | | | | | | | | | | | | | | | |
| | $ | 160,407 | | | $ | 83,152 | | | | 51.8 | % | | $ | 77,255 | | | | 48.2 | % |
| | | | | | | | | | | | | | | | | | | | |
As shown above, at June 30, 2013, our education loan portfolio consisted entirely of variable rate loans that generally reprice in accordance with LIBOR. Additionally, approximately 20% of our investments available-for-sale and approximately 29% of our mortgage loan portfolio were also variable rate instruments. As market rates increase or decrease, our variable rate interest-bearing assets are likely to be immediately impacted while our interest-bearing liabilities would be slower to reprice. The balance of the interest-bearing assets in the table above were fixed rate instruments. Of these fixed rate instruments, approximately 88% were available-for-sale securities, which had a weighted average life of 4.0 years. In addition to the interest-bearing assets in the table above, our interest-bearing assets included short-term investments of $55.2 million at June 30, 2013, which consisted of fixed-rate certificates of deposit that have maturities of less than one year.
Our interest-bearing liabilities consisted of customer deposits held at Union Federal, totaling $164.0 million at June 30, 2013. Of these deposits, approximately 76% were comprised of demand deposits, including savings deposits and money market deposits, which are generally subject to daily re-pricing. The remaining approximately 24% of customer deposits represented fixed-rate time deposits, of which approximately 27% had maturities in excess of 12 months from June 30, 2013.
Deposit pricing is subject to regular examination by a committee of senior managers from Union Federal and FMD’s Finance and Governance, Risk and Compliance Departments. The committee considers competitors’ pricing, inflows and outflows of deposit balances and Union Federal’s funding requirements to make pricing decisions in order to attain the desired volume of deposits in each given duration and product type.
Our investment decisions with respect to the interest rate characteristics of our interest-bearing assets are driven by the nature, volume and duration of our interest-bearing liabilities. Generally, our interest-bearing liabilities are either variable-rate instruments or are of a short duration, as discussed above. Accordingly, we generally seek to invest in interest-bearing assets that are subject to frequent repricing or are of limited duration. As noted above, approximately 29% of Union Federal’s mortgage loans, approximately 20% of its available-for-sale securities and all of its education loans had variable interest rates at June 30, 2013. Although these variable interest rate assets generally reprice more frequently and have longer duration than our deposits, interest rate risk with respect to net interest revenues is mitigated by similarities in the interest rate and market risks underlying loan and deposit pricing. We invest our excess cash primarily in money market funds, federal funds sold, time deposits with original maturities of less than one year and U.S. federal agency mortgage-backed securities.
Management regularly reviews a wide variety of interest rate shift scenario results to evaluate interest rate risk exposure, including scenarios showing the effect of steepening or flattening changes in the yield curve. The changes contemplated in these interest rate scenarios would result in immaterial changes to our overall results, largely as a result of a high percentage of assets that possess variable interest rates. Further, increases in interest
74
rates may have an adverse impact on our consolidated balance sheets as the fixed rate portion of our investments available-for-sale portfolio could continue to experience unrealized losses. Interest rate risk is mitigated with respect to our investments available-for-sale portfolio due to the largely variable rate nature of our interest-bearing assets and liabilities.
We use current market interest rates and our expectations of future interest rates to estimate fair value of service revenue receivables. We believe that this approach adequately reflects the interest rate risk inherent in those estimates.
75
| Item 8. | Financial Statements and Supplementary Data |
FINANCIAL STATEMENTS
Report of Independent Registered Public Accounting Firm
The Board of Directors and Stockholders
The First Marblehead Corporation:
We have audited the accompanying consolidated balance sheets of The First Marblehead Corporation and subsidiaries (the Company) as of June 30, 2013 and 2012, and the related consolidated statements of operations, comprehensive (loss) income, changes in stockholders’ equity (deficit), and cash flows for each of the years in the three-year period ended June 30, 2013. These consolidated financial statements are the responsibility of the Company’s management. Our responsibility is to express an opinion on these consolidated financial statements based on our audits.
We conducted our audits in accordance with the standards of the Public Company Accounting Oversight Board (United States). Those standards require that we plan and perform the audit to obtain reasonable assurance about whether the financial statements are free of material misstatement. An audit includes examining, on a test basis, evidence supporting the amounts and disclosures in the financial statements. An audit also includes assessing the accounting principles used and significant estimates made by management, as well as evaluating the overall financial statement presentation. We believe that our audits provide a reasonable basis for our opinion.
In our opinion, the consolidated financial statements referred to above present fairly, in all material respects, the financial position of the Company as of June 30, 2013 and 2012, and the results of their operations and their cash flows for each of the years in the three-year period ended June 30, 2013, in conformity with U.S. generally accepted accounting principles.
We also have audited, in accordance with the standards of the Public Company Accounting Oversight Board (United States), the Company’s internal control over financial reporting as of June 30, 2013, based on criteria established inInternal Control—Integrated Framework issued by the Committee of Sponsoring Organizations of the Treadway Commission (COSO), and our report dated September 13, 2013 expressed an unqualified opinion on the effectiveness of the Company’s internal control over financial reporting.
/s/ KPMG LLP
Boston, Massachusetts
September 13, 2013
76
THE FIRST MARBLEHEAD CORPORATION AND SUBSIDIARIES
CONSOLIDATED BALANCE SHEETS
June 30, 2013 and 2012
(dollars and shares in thousands, except per share amounts)
| | | | | | | | |
| | | 2013 | | | 2012 | |
ASSETS | | | | | | | | |
Cash and cash equivalents | | $ | 81,910 | | | $ | 123,497 | |
Short-term investments, at cost | | | 55,179 | | | | 85,007 | |
Restricted cash | | | 87,338 | | | | 65,401 | |
Investments available-for-sale, at fair value | | | 84,782 | | | | 68,598 | |
Education loans held-to-maturity, net of allowance of $1,659 and $1,309 | | | 62,996 | | | | 33,095 | |
Mortgage loans held-to-maturity, net of allowance of $440 and $591 | | | 12,629 | | | | 7,811 | |
Deposits for participation interest accounts, at fair value | | | 13,147 | | | | 4,039 | |
Service revenue receivables, at fair value | | | 14,817 | | | | 16,341 | |
Goodwill | | | 20,066 | | | | 19,548 | |
Intangible assets, net | | | 24,193 | | | | 20,922 | |
Property and equipment, net | | | 6,176 | | | | 4,570 | |
Other assets | | | 9,060 | | | | 8,976 | |
| | | | | | | | |
Total assets | | $ | 472,293 | | | $ | 457,805 | |
| | | | | | | | |
LIABILITIES AND STOCKHOLDERS’ EQUITY | | | | | | | | |
Liabilities: | | | | | | | | |
Deposits | | $ | 163,977 | | | $ | 83,428 | |
Restricted funds due to clients | | | 86,994 | | | | 104,981 | |
Accounts payable, accrued expenses and other liabilities | | | 14,884 | | | | 18,133 | |
Income taxes payable | | | 25,922 | | | | 23,414 | |
Net deferred income tax liability | | | 1,189 | | | | 861 | |
| | | | | | | | |
Total liabilities | | | 292,966 | | | | 230,817 | |
Commitments and contingencies: | | | | | | | | |
Stockholders’ equity: | | | | | | | | |
Preferred stock, par value $0.01 per share; 20,000 shares authorized; 0 and 133 shares issued and outstanding | | | — | | | | 1 | |
Common stock, par value $0.01 per share; 250,000 shares authorized; 120,513 and 110,658 shares issued; 111,547 and 102,002 shares outstanding | | | 1,204 | | | | 1,106 | |
Additional paid-in capital | | | 456,843 | | | | 452,726 | |
Accumulated deficit | | | (90,824 | ) | | | (40,627 | ) |
Treasury stock, 8,966 and 8,656 shares held, at cost | | | (187,154 | ) | | | (186,828 | ) |
Accumulated other comprehensive (loss) income | | | (742 | ) | | | 610 | |
| | | | | | | | |
Total stockholders’ equity | | | 179,327 | | | | 226,988 | |
| | | | | | | | |
Total liabilities and stockholders’ equity | | $ | 472,293 | | | $ | 457,805 | |
| | | | | | | | |
See accompanying notes to consolidated financial statements.
77
THE FIRST MARBLEHEAD CORPORATION AND SUBSIDIARIES
CONSOLIDATED STATEMENTS OF OPERATIONS
Fiscal years ended June 30, 2013, 2012 and 2011
(dollars and shares in thousands, except per share amounts)
| | | | | | | | | | | | |
| | | 2013 | | | 2012 | | | 2011 | |
Revenues: | | | | | | | | | | | | |
Net interest income: | | | | | | | | | | | | |
Interest income | | $ | 5,685 | | | $ | 3,290 | | | $ | 1,777 | |
Interest expense | | | (1,422 | ) | | | (915 | ) | | | (1,037 | ) |
| | | | | | | | | | | | |
Net interest income | | | 4,263 | | | | 2,375 | | | | 740 | |
(Provision) credit for loan losses | | | (148 | ) | | | 615 | | | | (281 | ) |
| | | | | | | | | | | | |
Net interest income after (provision) credit for loan losses | | | 4,115 | | | | 2,990 | | | | 459 | |
Non-interest revenues: | | | | | | | | | | | | |
Tuition payment processing fees | | | 26,668 | | | | 26,544 | | | | 12,904 | |
Administrative and other fees | | | 11,595 | | | | 9,925 | | | | 10,747 | |
Fair value changes to service revenue receivables | | | 2,068 | | | | 947 | | | | (23,178 | ) |
| | | | | | | | | | | | |
Total non-interest revenues | | | 40,331 | | | | 37,416 | | | | 473 | |
| | | | | | | | | | | | |
Total revenues | | | 44,446 | | | | 40,406 | | | | 932 | |
Non-interest expenses: | | | | | | | | | | | | |
Compensation and benefits | | | 40,413 | | | | 42,052 | | | | 36,690 | |
General and administrative | | | 53,582 | | | | 61,101 | | | | 56,140 | |
| | | | | | | | | | | | |
Total non-interest expenses | | | 93,995 | | | | 103,153 | | | | 92,830 | |
| | | | | | | | | | | | |
Loss from operations | | | (49,549 | ) | | | (62,747 | ) | | | (91,898 | ) |
Other income: | | | | | | | | | | | | |
Gain from deconsolidation of trusts | | | — | | | | 9,514 | | | | — | |
Proceeds from TERI settlement | | | 702 | | | | 1,685 | | | | 8,112 | |
Other | | | 946 | | | | — | | | | — | |
| | | | | | | | | | | | |
Total other income | | | 1,648 | | | | 11,199 | | | | 8,112 | |
| | | | | | | | | | | | |
Loss from continuing operations, before income taxes | | | (47,901 | ) | | | (51,548 | ) | | | (83,786 | ) |
Income tax expense (benefit) from continuing operations | | | 2,296 | | | | (17,955 | ) | | | 208 | |
| | | | | | | | | | | | |
Net loss from continuing operations | | | (50,197 | ) | | | (33,593 | ) | | | (83,994 | ) |
Discontinued operations, net of taxes | | | — | | | | 1,135,821 | | | | (137,567 | ) |
| | | | | | | | | | | | |
Net (loss) income | | $ | (50,197 | ) | | $ | 1,102,228 | | | $ | (221,561 | ) |
| | | | | | | | | | | | |
Net (loss) income per basic common share: | | | | | | | | | | | | |
From continuing operations | | $ | (0.47 | ) | | $ | (0.30 | ) | | $ | (0.83 | ) |
From discontinued operations | | | — | | | | 10.28 | | | | (1.37 | ) |
| | | | | | | | | | | | |
Total basic net (loss) income per common share | | $ | (0.47 | ) | | $ | 9.98 | | | $ | (2.20 | ) |
| | | | | | | | | | | | |
Net (loss) income per diluted common share: | | | | | | | | | | | | |
From continuing operations | | $ | (0.47 | ) | | $ | (0.30 | ) | | $ | (0.83 | ) |
From discontinued operations | | | — | | | | 10.26 | | | | (1.37 | ) |
| | | | | | | | | | | | |
Total diluted net (loss) income per common share | | $ | (0.47 | ) | | $ | 9.96 | | | $ | (2.20 | ) |
| | | | | | | | | | | | |
Weighted-average common shares outstanding: | | | | | | | | | | | | |
Basic | | | 107,346 | | | | 101,575 | | | | 100,919 | |
Diluted | | | 107,346 | | | | 110,667 | | | | 100,919 | |
See accompanying notes to consolidated financial statements.
78
THE FIRST MARBLEHEAD CORPORATION AND SUBSIDIARIES
CONSOLIDATED STATEMENTS OF COMPREHENSIVE (LOSS) INCOME
Fiscal years ended June 30, 2013, 2012 and 2011
(dollars in thousands)
| | | | | | | | | | | | |
| | | 2013 | | | 2012 | | | 2011 | |
Net (loss) income | | $ | (50,197 | ) | | $ | 1,102,228 | | | $ | (221,561 | ) |
Other comprehensive (loss) income, net of tax: | | | | | | | | | | | | |
Unrealized (loss) gain on investments available-for-sale arising during the period | | | (1,352 | ) | | | 329 | | | | 18 | |
| | | | | | | | | | | | |
Total comprehensive (loss) income | | $ | (51,549 | ) | | $ | 1,102,557 | | | $ | (221,543 | ) |
| | | | | | | | | | | | |
See accompanying notes to consolidated financial statements.
79
THE FIRST MARBLEHEAD CORPORATION AND SUBSIDIARIES
CONSOLIDATED STATEMENTS OF CHANGES IN STOCKHOLDERS’ EQUITY (DEFICIT)
Fiscal years ended June 30, 2013, 2012 and 2011
(dollars and shares in thousands)
| | | | | | | | | | | | | | | | | | | | | | | | | | | | | | | | | | | | | | | | |
| | | Non-voting
convertible
preferred stock
issued | | | Common stock | | | Additional
paid-in
capital | | | Accumulated
Deficit | | | Accumulated
other
comprehensive
(loss)
income, net of
tax | | | Total
stockholders’
equity
(deficit) | |
| | | Issued | | | In treasury | | | | | |
| | Shares | | | Amount | | | Shares | | | Amount | | | Shares | | | Amount | | | | | |
Balance at June 30, 2010 | | | 133 | | | $ | 1 | | | | 108,975 | | | $ | 1,090 | | | | (8,239 | ) | | $ | (186,218 | ) | | $ | 443,290 | | | $ | (41,174 | ) | | $ | 263 | | | $ | 217,252 | |
Cumulative effect of a change in accounting principle, net of tax | | | | | | | | | | | | | | | | | | | | | | | | | | | | | | | (880,120 | ) | | | — | | | | (880,120 | ) |
Comprehensive loss: | | | | | | | | | | | | | | | | | | | | | | | | | | | | | | | | | | | | | | | | |
Net loss | | | — | | | | — | | | | — | | | | — | | | | — | | | | — | | | | — | | | | (221,561 | ) | | | — | | | | (221,561 | ) |
Accumulated other comprehensive income | | | — | | | | — | | | | — | | | | — | | | | — | | | | — | | | | — | | | | | | | | 18 | | | | 18 | |
| | | | | | | | | | | | | | | | | | | | | | | | | | | | | | | | | | | | | | | | |
Total comprehensive loss | | | — | | | | — | | | | — | | | | — | | | | — | | | | — | | | | — | | | | (221,561 | ) | | | 18 | | | | (221,543 | ) |
Net stock issuance from vesting of stock units | | | — | | | | — | | | | 742 | | | | 7 | | | | (160 | ) | | | (333 | ) | | | (7 | ) | | | — | | | | — | | | | (333 | ) |
Stock-based compensation | | | — | | | | — | | | | — | | | | — | | | | — | | | | — | | | | 4,805 | | | | — | | | | — | | | | 4,805 | |
| | | | | | | | | | | | | | | | | | | | | | | | | | | | | | | | | | | | | | | | |
Balance at June 30, 2011 | | | 133 | | | $ | 1 | | | | 109,717 | | | $ | 1,097 | | | | (8,399 | ) | | $ | (186,551 | ) | | $ | 448,088 | | | $ | (1,142,855 | ) | | $ | 281 | | | $ | (879,939 | ) |
Comprehensive income: | | | | | | | | | | | | | | | | | | | | | | | | | | | | | | | | | | | | | | | | |
Net income | | | — | | | | — | | | | — | | | | — | | | | — | | | | — | | | | — | | | | 1,102,228 | | | | — | | | | 1,102,228 | |
Accumulated other comprehensive income | | | — | | | | — | | | | — | | | | — | | | | — | | | | — | | | | — | | | | — | | | | 329 | | | | 329 | |
| | | | | | | | | | | | | | | | | | | | | | | | | | | | | | | | | | | | | | | | |
Total comprehensive income | | | — | | | | — | | | | — | | | | — | | | | — | | | | — | | | | — | | | | 1,102,228 | | | | 329 | | | | 1,102,557 | |
Net stock issuance from vesting of stock units | | | — | | | | — | | | | 941 | | | | 9 | | | | (257 | ) | | | (277 | ) | | | (9 | ) | | | — | | | | — | | | | (277 | ) |
Stock-based compensation | | | — | | | | — | | | | — | | | | — | | | | — | | | | — | | | | 4,647 | | | | — | | | | — | | | | 4,647 | |
| | | | | | | | | | | | | | | | | | | | | | | | | | | | | | | | | | | | | | | | |
Balance at June 30, 2012 | | | 133 | | | $ | 1 | | | | 110,658 | | | $ | 1,106 | | | | (8,656 | ) | | $ | (186,828 | ) | | $ | 452,726 | | | $ | (40,627 | ) | | $ | 610 | | | $ | 226,988 | |
Comprehensive loss: | | | | | | | | | | | | | | | | | | | | | | | | | | | | | | | | | | | | | | | | |
Net loss | | | — | | | | — | | | | — | | | | — | | | | — | | | | — | | | | — | | | | (50,197 | ) | | | — | | | | (50,197 | ) |
Accumulated other comprehensive (loss) | | | — | | | | — | | | | — | | | | — | | | | — | | | | — | | | | — | | | | — | | | | (1,352 | ) | | | (1,352 | ) |
| | | | | | | | | | | | | | | | | | | | | | | | | | | | | | | | | | | | | | | | |
Total comprehensive loss | | | — | | | | — | | | | — | | | | — | | | | — | | | | — | | | | — | | | | (50,197 | ) | | | (1,352 | ) | | | (51,549 | ) |
Net stock issuance from vesting of stock units | | | — | | | | — | | | | 1,008 | | | | 10 | | | | (310 | ) | | | (326 | ) | | | (10 | ) | | | — | | | | — | | | | (326 | ) |
Stock-based compensation | | | — | | | | — | | | | — | | | | — | | | | — | | | | — | | | | 4,214 | | | | — | | | | — | | | | 4,214 | |
Conversion of preferred stock to common stock | | | (133 | ) | | | (1 | ) | | | 8,847 | | | | 88 | | | | — | | | | — | | | | (87 | ) | | | — | | | | — | | | | — | |
| | | | | | | | | | | | | | | | | | | | | | | | | | | | | | | | | | | | | | | | |
Balance at June 30, 2013 | | | — | | | $ | — | | | | 120,513 | | | $ | 1,204 | | | | (8,966 | ) | | $ | (187,154 | ) | | $ | 456,843 | | | $ | (90,824 | ) | | $ | (742 | ) | | $ | 179,327 | |
| | | | | | | | | | | | | | | | | | | | | | | | | | | | | | | | | | | | | | | | |
See accompanying notes to consolidated financial statements.
80
THE FIRST MARBLEHEAD CORPORATION AND SUBSIDIARIES
CONSOLIDATED STATEMENTS OF CASH FLOWS
Fiscal years ended June 30, 2013, 2012 and 2011
(dollars in thousands)
| | | | | | | | | | | | |
| | | 2013 | | | 2012 | | | 2011 | |
Cash flows from operating activities, net of effects of acquisitions: | | | | | | | | | | | | |
Net (loss) income | | $ | (50,197 | ) | | $ | 1,102,228 | | | $ | (221,561 | ) |
Discontinued operations, net of tax | | | — | | | | (1,135,821 | ) | | | 137,567 | |
Adjustments to reconcile net (loss) income to net cash (used in) provided by operating activities: | | | | | | | | | | | | |
Non-cash gain from deconsolidation of trusts | | | — | | | | (9,514 | ) | | | — | |
Non-cash gain from TERI settlement | | | — | | | | — | | | | (5,021 | ) |
Depreciation and amortization | | | 4,347 | | | | 4,766 | | | | 8,253 | |
Provision (credit) for loan losses | | | 148 | | | | (615 | ) | | | 281 | |
Deferred income tax expense (benefit) | | | 328 | | | | 30 | | | | (646 | ) |
Stock-based compensation | | | 4,214 | | | | 4,647 | | | | 4,805 | |
Service revenue receivable sale proceeds and distributions | | | 3,592 | | | | 14,216 | | | | 490 | |
Other non-cash (benefits) losses | | | — | | | | (5,261 | ) | | | 1,004 | |
Changes in assets/liabilities: | | | | | | | | | | | | |
Participation interest accounts | | | (9,108 | ) | | | 4,473 | | | | (8,512 | ) |
Fair value (increase) decrease to service revenue receivables | | | (2,068 | ) | | | (947 | ) | | | 23,178 | |
Other assets | | | 80 | | | | 2,632 | | | | 900 | |
Accounts payable, accrued expenses and other liabilities | | | (4,921 | ) | | | (6,491 | ) | | | (1,185 | ) |
Income taxes payable | | | 2,508 | | | | (16,565 | ) | | | 47,644 | |
| | | | | | | | | | | | |
Cash used in operating activities – continuing operations | | | (51,077 | ) | | | (42,222 | ) | | | (12,803 | ) |
Cash provided by operating activities – discontinued operations | | | — | | | | 49,921 | | | | 239,325 | |
| | | | | | | | | | | | |
Net cash (used in) provided by operating activities | | | (51,077 | ) | | | 7,699 | | | | 226,522 | |
Cash flows from investing activities, net of effects of acquisitions: | | | | | | | | | | | | |
Net cash paid for acquisition of operating assets of Cology, Inc. | | | (4,757 | ) | | | — | | | | — | |
Net cash paid for acquisition of TMS | | | — | | | | — | | | | (46,959 | ) |
Cash received for disposition of TMS K-12 contracts | | | — | | | | 700 | | | | 5,417 | |
Purchases of short-term investments | | | (30,172 | ) | | | (85,007 | ) | | | (75,000 | ) |
Proceeds from maturities of short-term investments | | | 60,000 | | | | 50,000 | | | | 75,000 | |
Net (increase) decrease in restricted cash | | | (21,937 | ) | | | 59,286 | | | | 22,302 | |
Net decrease in restricted funds due to clients | | | (17,987 | ) | | | (19,213 | ) | | | (25,101 | ) |
Purchases of investments available-for-sale | | | (31,955 | ) | | | (62,555 | ) | | | (7,904 | ) |
Principal repayments from investments available-for-sale | | | 14,419 | | | | 5,304 | | | | 1,374 | |
Net increase in education loans held-to-maturity | | | (29,912 | ) | | | (33,095 | ) | | | — | |
Net (increase) decrease in mortgage loans held-to-maturity | | | (4,955 | ) | | | (1,685 | ) | | | 1,133 | |
Purchases of property and equipment | | | (3,465 | ) | | | (1,869 | ) | | | (3,426 | ) |
| | | | | | | | | | | | |
Net cash used in investing activities – continuing operations | | | (70,721 | ) | | | (88,134 | ) | | | (53,164 | ) |
Net cash provided by investing activities – discontinued operations | | | — | | | | 143,612 | | | | 392,429 | |
| | | | | | | | | | | | |
Net cash (used in) provided by investing activities | | | (70,721 | ) | | | 55,478 | | | | 339,265 | |
Cash flows from financing activities, net of effects of acquisitions: | | | | | | | | | | | | |
Net increase (decrease) in deposits | | | 80,549 | | | | 22,936 | | | | (48,240 | ) |
Payments on capital lease obligations | | | (12 | ) | | | — | | | | (1,396 | ) |
Repurchases of common stock | | | (326 | ) | | | (277 | ) | | | (333 | ) |
| | | | | | | | | | | | |
Net cash provided by (used in) financing activities – continuing operations | | | 80,211 | | | | 22,659 | | | | (49,969 | ) |
Net cash used in financing activities – discontinued operations | | | — | | | | (179,706 | ) | | | (629,498 | ) |
| | | | | | | | | | | | |
Net cash provided by (used in) financing activities | | | 80,211 | | | | (157,047 | ) | | | (679,467 | ) |
| | | | | | | | | | | | |
Net decrease in cash and cash equivalents | | | (41,587 | ) | | | (93,870 | ) | | | (113,680 | ) |
Cash and cash equivalents, beginning of year | | | 123,497 | | | | 217,367 | | | | 331,047 | |
| | | | | | | | | | | | |
Cash and cash equivalents, end of year | | $ | 81,910 | | | $ | 123,497 | | | $ | 217,367 | |
| | | | | | | | | | | | |
Supplemental disclosures of cash flow information from continuing operations: | | | | | | | | | | | | |
Interest paid | | | 1,292 | | | | 664 | | | | 619 | |
Income taxes paid | | | 12 | | | | 5,179 | | | | 182 | |
Supplemental disclosure of non-cash investing and financing activities from continuing operations: | | | | | | | | | | | | |
Interest receivable capitalized to loan principal | | | 377 | | | | 24 | | | | — | |
Extinguishment of TERI note payable | | | — | | | | — | | | | 3,101 | |
Conversion of preferred stock to common stock | | | 87 | | | | — | | | | — | |
See accompanying notes to consolidated financial statements.
81
THE FIRST MARBLEHEAD CORPORATION AND SUBSIDIARIES
NOTES TO CONSOLIDATED FINANCIAL STATEMENTS
June 30, 2013, 2012 and 2011
(1) Nature of Business
Unless otherwise indicated, or unless the context of the discussion requires otherwise, all references in these notes to “we,” “us,” “our” and similar references mean The First Marblehead Corporation and its subsidiaries, on a consolidated basis. All references in these notes to “First Marblehead” and “FMD” mean The First Marblehead Corporation on a stand-alone basis. We use the term “education loan” to refer to private education loans that are not guaranteed by the federal government. Our fiscal year ends on June 30, and we identify fiscal years by the calendar years in which they end. For example, we refer to the fiscal year ended June 30, 2013 as “fiscal 2013.”
We are a specialty finance company focused on the education financing marketplace in the United States. We provide loan programs on behalf of our lender clients for K-12, undergraduate and graduate students and for college graduates seeking to refinance private education loan obligations, as well as tuition planning, tuition billing, refund management and payment technology services. We offer a fully integrated suite of services through our Monogram® loan product service platform (Monogram platform), as well as certain services on a stand-alone, fee-for-service basis. We partner with lenders to design and administer education loan programs through our Monogram platform, which are typically school-certified. They are designed to be marketed through educational institutions or to prospective borrowers and their families directly and to generate portfolios intended to be held by the originating lender or financed in the capital markets. We also offer a number of other services on a stand-alone, fee-for-service basis in support of our clients, including retail banking, loan origination, portfolio management and securitization services.
On October 19, 2012, we acquired a substantial portion of the operating assets, and assumed certain liabilities, of Cology, Inc. and its affiliates. We refer to Cology, Inc. and its affiliates as the Cology Sellers. We refer to the FMD subsidiary that acquired a substantial portion of the operating assets of the Cology Sellers as Cology LLC. Through Cology LLC, we provide loan processing services to approximately 270 credit union and other lender clients. Because Cology LLC is a loan processer, the education loans that it processes on behalf of its clients are not included on our consolidated balance sheets but, rather, are included on the balance sheets of its clients. As such, none of the references in these notes to our consolidated financial statements to education loans included on our consolidated balance sheets include the education loans originated by Cology LLC on behalf of its clients. Our consolidated financial statements for fiscal 2013 reflect revenues and expenses of Cology LLC since the date of acquisition.
Our product and service offerings are part of a change in our revenue model that we have been implementing since fiscal 2009 with a focus on fee-based revenues. Our long-term success depends on the continued development of four principal revenue lines:
| | • | | Partnered lending—We provide customized Monogram-based education loan programs for lenders who wish to hold originated portfolios to maturity. We may provide credit enhancements by funding participation interest accounts (participation accounts) or, in the case of FMD’s subsidiary Union Federal Savings Bank (Union Federal®), deposit accounts, to serve as a first loss reserve for defaulted program loans. In consideration for funding participation accounts, we are entitled to receive a share of the interest income generated on the loans. We are paid for our origination and marketing services at the time approved education loans are disbursed and receive monthly payments for portfolio management services, credit enhancement and administrative services throughout the life of the loan. |
| | • | | Banking services—Union Federal offers traditional retail banking products, including residential and commercial mortgages, time deposits and money market demand accounts, on a stand-alone basis. In addition, Union Federal generates additional revenues by originating Monogram-based education loan portfolios, subject to regulatory conditions, with the intent of holding them to maturity. |
82
THE FIRST MARBLEHEAD CORPORATION AND SUBSIDIARIES
NOTES TO CONSOLIDATED FINANCIAL STATEMENTS (Continued)
June 30, 2013, 2012 and 2011
(1) Nature of Business (Continued)
| | • | | Capital markets—Our capital markets experience coupled with our loan performance database and risk analytics provide specialized insight into funding options available to our lender clients. We have a right of first refusal should one of our partner lenders wish to sell some or all of its education loan portfolio prior to maturity. In addition to traditional asset-backed securitizations, funding options may also include whole loan sales or other financing alternatives. We can also earn net interest income by retaining a portion of the equity in any of these transactions. |
| | • | | Fee-for-service—Loan origination, portfolio management, analytical and structuring services, tuition billing and payment processing and refund management services are each available on a stand-alone, fee-for-service basis. We offer outsourced tuition planning, tuition billing, refund management and payment technology services for universities, colleges and secondary schools through FMD’s subsidiary Tuition Management Systems LLC (TMS). TMS provides such services on behalf of over 700 educational institutions. Through Cology LLC, we earn fees for the processing of education loans on behalf of its approximately 270 credit union and other lender clients. |
(2) Summary of Significant Accounting Policies
Basis of Presentation and Use of Estimates
Our consolidated financial statements have been prepared in accordance with U.S. generally accepted accounting principles (GAAP). All significant intercompany transactions have been eliminated.
The preparation of our consolidated financial statements requires management to make estimates, assumptions and judgments that affect the reported amounts of assets and liabilities, and the disclosure of contingent assets and liabilities, at the date of our consolidated financial statements, as well as the reported amounts of revenues and expenses during the reporting period. We base our estimates, assumptions and judgments on our historical experience, economic conditions and on various other factors that we believe are reasonable under the circumstances. Actual results may differ from these estimates under varying assumptions or conditions.
On an ongoing basis, we evaluate our estimates and judgments, particularly as they relate to accounting policies that we believe are most important to the portrayal of our financial condition and results of operations. Material estimates, assumptions and judgments that are particularly susceptible to change relate to:
| | • | | Whether to consolidate the financial results of a variable interest entity (VIE); |
| | • | | The determination of goodwill and other intangible asset impairment; and |
| | • | | Income taxes relating to uncertain tax positions under Accounting Standards Codification (ASC) 740,Income Taxes (ASC 740). |
Our consolidated financial statements include the accounts of FMD and its subsidiaries. We evaluate our involvement with certain VIEs and whether they should be consolidated, in accordance with ASC 810,Consolidation(ASC 810).
Effective July 1, 2010, we adopted Accounting Standards Update (ASU) 2009-16,Transfers and Servicing (Topic 860)—Accounting for Transfers of Financial Assets(ASU 2009-16), and ASU 2009-17,Consolidation (Topic 810)—Improvement to Financial Reporting by Enterprises Involved With Variable Interest Entities(ASU 2009-17), which amended the accounting for the consolidation of VIEs. This guidance requires that we evaluate
83
THE FIRST MARBLEHEAD CORPORATION AND SUBSIDIARIES
NOTES TO CONSOLIDATED FINANCIAL STATEMENTS (Continued)
June 30, 2013, 2012 and 2011
(2) Summary of Significant Accounting Policies (Continued)
whether to consolidate a VIE on an ongoing basis, as opposed to a trigger-based quantitative assessment under previous guidance. As a result of adopting the consolidation guidance, we were required to consolidate 14 securitization trusts that were facilitated by us because we determined that our services related to default prevention and collections management, for which we can only be removed for cause, combined with the variability that we absorbed as part of our securitization fee structure, made us the primary beneficiary of those trusts. In addition, we deconsolidated FMD’s indirect subsidiary UFSB Private Loan SPV, LLC (UFSB-SPV) because we determined that we did not have the power to direct activities that most significantly impact UFSB-SPV’s economic performance. During fiscal 2012, we deconsolidated the 14 securitization trusts we had consolidated as we no longer were the primary beneficiary of these trusts. See Note 3, “Discontinued Operations,” for additional information.
We continually reassess our involvement with each VIE in which we have an interest, both on- and off-balance sheet, and our determination of whether consolidation or deconsolidation of a VIE is appropriate. We monitor matters related to our ability to control economic performance, such as contractual changes in the services we provide, the extent of our ownership and the rights of third parties to terminate us as a service provider. In addition, we monitor the financial performance of each VIE for indications that we may or may not have the right to absorb benefits or the obligation to absorb losses associated with variability in the financial performance of the VIE that could potentially be significant to that VIE. If, for any reason, we determine that we can no longer be considered the primary beneficiary, we would be required to deconsolidate the VIE. Deconsolidation of a VIE is accounted for in the same manner as the sale of a subsidiary, with a gain or loss recorded in our consolidated statements of operations to the extent that proceeds, if any, are more or less than the net assets of the VIE.
We also monitor our involvement with nine off-balance sheet VIEs for which we have determined that we are not the primary beneficiary due to the sole, unilateral rights of other parties to terminate us in our role as service provider or due to a lack of obligation on our part to absorb benefits or losses of the VIE that would be significant to that VIE. A significant change to the pertinent rights of other parties or us, or a significant change to the ranges of possible financial performance outcomes used in our assessment of the variability of cash flows due to us, could cause us to change our determination of whether or not a VIE should be consolidated in future periods. Our determination to consolidate or deconsolidate a VIE may lead to increased volatility in our financial results and make comparisons of results between time periods challenging.
We consider highly liquid debt instruments with original maturities of three months or less on the date of purchase and investments in money market funds to be cash equivalents. Cash equivalents are carried at cost, which also approximates fair value.
| (c) | Restricted Cash and Restricted Funds Due to Clients |
As part of our operations, we have cash that is recorded as restricted cash on our consolidated balance sheets because it is deposited with third party institutions and is not available for our use. In the case of TMS, it collects tuition payments from students or their families on behalf of educational institutions that are held under a trust agreement for the benefit of TMS’ educational institution clients, and will also at times deposit a portion of this cash in a deposit account at Union Federal. Such deposit account is governed by a trust agreement between TMS and a third party trustee. Subject to the capital requirements and other laws, regulations and restrictions applicable to Union Federal, the cash that is deposited with Union Federal in connection with the tuition payment
84
THE FIRST MARBLEHEAD CORPORATION AND SUBSIDIARIES
NOTES TO CONSOLIDATED FINANCIAL STATEMENTS (Continued)
June 30, 2013, 2012 and 2011
(2) Summary of Significant Accounting Policies (Continued)
plans is not restricted, and, accordingly, is not included in restricted cash in our consolidated financial statements. This is consistent with how third party institutions handle cash deposits by TMS. In the case of Cology LLC, it collects and disburses loan origination proceeds on behalf of its lender clients. Cology LLC also serves as the loan servicer for certain of its lender clients for which it performs payment processing and disbursement services. Restricted cash held by our other subsidiaries relates to recoveries on defaulted education loans collected on behalf of clients as well as undistributed loan origination proceeds. We record a liability on our consolidated balance sheets representing tuition payments due to our TMS clients, loan origination proceeds and loan payments due to our Cology LLC clients and recoveries on defaulted education loans and education loan proceeds due to schools.
We classify investments with original maturities greater than three months and remaining maturities of less than one year at the date of purchase as short-term investments and carry such short-term investments at cost, which approximates fair value.
We classify investments in marketable debt securities as available-for-sale, trading or held-to-maturity. Management determines the appropriate classification of securities at the time of purchase. We carry available-for-sale investments at fair value, with net unrealized gains and losses recorded in other comprehensive income, a component of stockholders’ equity. Trading securities are securities held in anticipation of short-term market movements and are carried at fair value with net unrealized gains and losses recorded in our consolidated statements of operations. We classify investments as held-to-maturity when we have both the ability and intent to hold the securities until maturity. We carry held-to-maturity investments at amortized cost. We currently do not own a held-to-maturity or trading securities portfolio.
When the fair value of an investment security is less than its amortized cost basis, we assess whether the decline in value is other-than-temporary. Management considers various factors in making these determinations including the length of time and extent to which the fair value has been less than amortized cost, projected future cash flows, creditworthiness and near-term prospects of issuers. If we determine that a decline in fair value is other-than-temporary and it is more likely than not that we will be required to sell the security before recovery of its amortized cost, the entire difference between the amortized cost and fair value of the security will be recognized in earnings. If we determine that a decline in fair value is other-than-temporary and that it is more likely than not that we will not sell or be required to sell the security before its recovery of the remaining amortized cost, the credit portion of the impairment loss is recorded in earnings and the noncredit portion is recognized in other comprehensive income.
We classify loans as held-to-maturity when we have both the ability and intent to hold the loans until maturity. We carry loans held-to-maturity at amortized cost, less an allowance for loan losses, described below. Amortized cost includes principal outstanding plus net unamortized loan acquisition costs and origination fees. Interest income is accrued on a level yield basis on principal amounts outstanding. Deferred loan origination fees and costs are amortized as an adjustment to yield over the life of the related loan using the effective interest method. Education loans are placed on non-accrual status and interest recognition is suspended when the loan becomes 120 days past due. Mortgage loans are placed on non-accrual status and interest recognition is suspended when the loan becomes 90 days past due. We evaluate loans for which there have been concessions, such as a reduction of interest rates, other than normal market rate adjustments, or deferral of principal and interest payments that have been granted that have not otherwise been considered at the time of origination to determine
85
THE FIRST MARBLEHEAD CORPORATION AND SUBSIDIARIES
NOTES TO CONSOLIDATED FINANCIAL STATEMENTS (Continued)
June 30, 2013, 2012 and 2011
(2) Summary of Significant Accounting Policies (Continued)
if the loan constitutes a troubled debt restructuring (TDR). TDRs are included in the impaired loan category, and, as such, are individually reviewed and evaluated, and a specific reserve is assigned for the amount of the estimated credit loss.
| (f) | Allowance for Loan Losses |
We maintain an allowance for loan losses at an amount sufficient to absorb probable credit losses inherent in our portfolios of loans held-to-maturity at our consolidated balance sheet date. The allowance for loan losses is increased through charges to the provision for loan losses in our consolidated statements of operations, and reduced by net charge-offs of loans deemed uncollectible from the borrower and third party guarantors, if any. Inherent credit losses include losses for loans in default that have not been charged-off or foreclosed and loans that are probable of default, less any amounts expected to be recoverable from borrowers or third parties or, for mortgage loans, sale of the collateral.
Education Loans
We consider an education loan to be in default when it is 180 days past due as to either principal or interest, based on the timing of cash receipts from the borrower. We use projected cash flows to determine the allowance amount deemed necessary for education loans with a probability of default at our consolidated balance sheet date. We may also incorporate qualitative adjustments in determining our allowance for loan losses. We base our default estimates on a loss confirmation period of one year, which we believe to be the approximate amount of time that it would take a loss inherent in the education loan portfolio at our consolidated balance sheet date to ultimately default and be charged-off. The calculation of the allowance for education loan losses is subject to a number of estimates and assumptions, including default and recovery rates, the effects of basic forbearance and alternative payment plans available to borrowers and the appropriateness of assessing both quantitative and qualitative factors. These assumptions are based on the status of education loans at our consolidated balance sheet date, as well as our historical experience. If actual future loan performance were to differ significantly from the estimates and assumptions used, the impact on the allowance for loan losses and the related provision for loan losses for education loans recorded in our consolidated statements of operations could be material.
Mortgage Loans
We establish a general allowance for loan losses for mortgage loans that have similar risk profiles. The allowance allocation factor for the general reserve is based on the historical net charge-off rate, which is then adjusted for current qualitative or environmental factors that are likely to cause estimated credit losses associated with the existing portfolio to differ from historical loss experience. Management considers the risk factors and assesses the impact of current issues and changes in those factors to the portfolio on an ongoing basis. In addition, we establish a specific allowance for loan losses when a loan is deemed to be impaired. Management estimates the credit loss by comparing the loan’s carrying value against either (1) the present value of the expected future cash flows discounted at the loan’s effective interest rate; (2) the loan’s observable market price or (3) the expected realizable fair value of the collateral, in the case of collateral dependent loans. A specific allowance is assigned to the impaired loan for the amount of estimated credit loss. Impaired loans are charged off, in whole or in part, when management believes that the recorded investment in the loan is uncollectible.
A mortgage loan for which we have foreclosed on the property is recorded at fair value less costs to sell (which becomes the cost basis of the asset) and is reclassified to other real estate owned, a component of other assets. After foreclosure, the foreclosed real estate asset is carried at the lower of fair value less costs to sell or the cost of the asset.
86
THE FIRST MARBLEHEAD CORPORATION AND SUBSIDIARIES
NOTES TO CONSOLIDATED FINANCIAL STATEMENTS (Continued)
June 30, 2013, 2012 and 2011
(2) Summary of Significant Accounting Policies (Continued)
| (g) | Deposits for Participation Interest Accounts |
We account for deposits for participation accounts in a manner similar to our service revenue receivables, and we carry such deposits at fair value on our consolidated balance sheet. We estimate fair value based on the net present value of cash flows into and out of the participation accounts, based on the education loans originated by participating lenders at our consolidated balance sheet date. We record changes in estimated fair value, excluding cash funded by us or distributed out of the participation accounts to us, if any, in non-interest revenues as part of administrative and other fees. See Note 10, “Deposits for Participation Interest Accounts,” for additional information.
| (h) | Service Revenue Receivables |
Service revenue receivables consist of our additional structural advisory fee and residual receivables, which we carry at fair value on our consolidated balance sheet. As required under GAAP, we recognized the fair value of additional structural advisory fee and residual receivables as revenue at the time the securitization trust purchased the education loans, but before we actually received payment, as these revenues were deemed to be earned at the time of the securitization. These amounts were deemed earned at securitization because:
| | • | | Evidence of an arrangement existed; |
| | • | | We provided the services; |
| | • | | The fee was fixed and determinable based upon a discounted cash flow analysis; and |
| | • | | There were no future contingencies or obligations due on our part. |
Payment of these receivables is contingent upon the following:
| | • | | Additional structural advisory fees are paid to us over time, based on the payment priorities established in the applicable indenture for each of the securitization trusts. We generally become entitled to receive these additional fees, plus interest, if applicable, once the ratio of securitization trust assets to liabilities, which we refer to as the parity ratio, reaches a stipulated level or after all noteholders have been paid in full. |
| | • | | Residuals associated with any securitization trusts that we facilitated are typically junior in priority to the rights of the holders of the asset-backed securities (ABS) issued in the securitizations and any additional structural advisory fees. |
In the absence of readily determinable market values, we update our estimates of the fair value of service revenue receivables on a quarterly basis, based on the present value of expected future cash flows. Such estimates include assumptions regarding discount rates, defaults, net of third party guarantees, net recovery, prepayment and forward interest rates, among others. If readily determinable market values became available or if actual performance were to vary appreciably from assumptions used, assumptions may need to be adjusted, which could result in material differences from the recorded carrying amounts.
| (i) | Goodwill and Intangible Assets |
Goodwill represents the excess of the cost of an acquisition over the fair value of the net tangible and other intangible assets acquired. Other intangible assets represent purchased assets that can be distinguished from goodwill because of contractual rights or because the asset can be exchanged on its own or in combination with a related contract, asset or liability. In connection with our acquisition of TMS, we recorded other intangible assets related to the TMS customer list and tradename, each of which we amortize on a straight-line basis over 15 years,
87
THE FIRST MARBLEHEAD CORPORATION AND SUBSIDIARIES
NOTES TO CONSOLIDATED FINANCIAL STATEMENTS (Continued)
June 30, 2013, 2012 and 2011
(2) Summary of Significant Accounting Policies (Continued)
and technology, which we amortize on a straight-line basis over six years. In connection with our acquisition of a substantial portion of the operating assets of the Cology Sellers, we recorded an intangible asset related to the Cology Sellers customer list, which we amortize on a straight-line basis over 15 years. We record amortization expense in general and administrative expenses in our consolidated statements of operations.
Goodwill is not amortized, but is subject to an annual evaluation for impairment (or more frequently if indicators of impairment exist). Impairment of goodwill is deemed to exist if the carrying value of a reporting unit, including its allocation of goodwill and other intangible assets, exceeds its estimated fair value. Impairment of other intangible assets is deemed to exist if the balance of the other intangible assets exceeds the cumulative expected net cash inflows related to the asset over its remaining estimated useful life. If we determine that goodwill or other intangible assets are impaired based on our periodic reviews, we would write down the values of these assets through a charge included in general and administrative expenses.
| (j) | Property and Equipment |
We record leasehold improvements, computers, software and other equipment at cost less accumulated depreciation and amortization. We record depreciation and amortization in general and administrative expenses and calculate them using the straight-line method over the estimated useful life of the asset or the remaining terms of the lease, if shorter. We charge maintenance and repairs to general and administrative expenses as incurred, while we capitalize major leasehold improvements and amortize them over the lesser of their estimated useful life or the remaining term of the lease.
Costs related to internal-use software development projects are capitalized if the software is expected to yield long-term operational benefits, such as operational efficiencies and/or incremental revenue streams.
| (k) | Fair Value of Financial Instruments |
Fair value is defined as the price that would be received in the sale of an asset, or paid to transfer a liability, in an orderly transaction between market participants at the measurement date. A three-level hierarchy is used to qualify fair value measurements based upon the transparency of inputs to the valuation of an asset or liability as of the measurement date:
| | • | | Level 1—Quoted prices (unadjusted) foridentical assets or liabilities in active markets. |
| | • | | Level 2—Observable inputs other than Level 1 prices, such as quoted prices forsimilar assets and liabilities in active markets, quoted prices for identical orsimilar assets or liabilities in markets that are not active, and inputs that are observable or can be corroborated, either directly or indirectly, for substantially the full term of the financial instrument. All of our investment securities are debt securities and have Level 2 fair values on our consolidated balance sheet. |
| | • | | Level 3—Valuations derived from valuation techniques in which one or more significant inputs or significant value drivers areunobservable in the markets and which reflect our market assumptions. Examples in this category include service revenue receivables and our deposits in participation accounts. |
We apply quoted market prices, where available, to determine fair value of eligible assets. For financial instruments for which quotes from recent exchange transactions are not available, we base fair value on discounted cash flow analysis and comparison to similar instruments. Discounted cash flow analysis is dependent upon estimated future cash flows and the level of interest rates.
88
THE FIRST MARBLEHEAD CORPORATION AND SUBSIDIARIES
NOTES TO CONSOLIDATED FINANCIAL STATEMENTS (Continued)
June 30, 2013, 2012 and 2011
(2) Summary of Significant Accounting Policies (Continued)
The methods we use for current fair value estimates may not be indicative of net realizable value or reflective of future fair values. If readily determinable market values became available or if actual performance were to vary appreciably from assumptions used, we might need to adjust our assumptions, which could result in material differences from the recorded carrying amounts. We believe our methods of determining fair value are appropriate and consistent with other market participants. However, the use of different methodologies or different assumptions to value certain financial instruments could result in a different estimate of fair value.
Net Interest Income
We recognize interest income on education and mortgage loans held-to-maturity as earned, using the effective interest method.
We place education loans held-to-maturity on non-accrual status when they become 120 days past due as to either principal or interest, or earlier when full collection of principal or interest is not considered probable. When we place an education loan on non-accrual status, we discontinue the accrual of interest, and previously recorded but unpaid interest is reversed and charged against interest revenues. For education loans on non-accrual status but not yet charged-off, we recognize interest revenues on a cash basis. If a borrower makes payments sufficient to become current on principal and interest prior to being charged-off, or “cures” the education loan delinquency, we remove the loan from non-accrual status and recommence recognizing interest revenues. Once a loan has been charged-off, we apply any payments made by the borrower to outstanding principal, and we only record income on a cash basis when all principal has been recovered.
We place mortgage loans on non-accrual status when they become 90 days past due as to either principal or interest. Once a loan has been placed on non-accrual status, we do not resume recognition of interest until the borrower has become current on the loan as to both principal and interest for a consecutive period of 12 months. Income received on non-accrual loans is either recorded in income or applied to the principal balance of the loan, dependent on management’s evaluation as to the collectability of principal.
Tuition Payment Processing Fees
Tuition payment processing fees include revenues generated by TMS, including program enrollment fees, late fees, convenience fees and tuition billing fees. Program enrollment fees are up-front nonrefundable fees, the recognition of which is deferred and amortized into revenue over the payment term which approximates when services are provided. Late fees and convenience fees are recognized in the period in which the transactions occur, typically monthly, and tuition billing fees are recognized in the period that the services are provided.
Administrative and Other Fees
Revenue recognition associated with our Monogram platform is subject to accounting guidance under ASU 2009-13,Revenue Recognition-Multiple-Deliverable Revenue Arrangements (ASU 2009-13), which is effective prospectively for contracts entered into or materially modified in fiscal years beginning on or after June 15, 2010. ASU 2009-13 requires that revenue under a contract be allocated to separately-identifiable deliverables based on a fair value analysis and prohibits separate recognition for each element of a contract unless certain criteria are met. We have applied the guidance in ASU 2009-13 to our recognition of revenues related to our Monogram platform.
89
THE FIRST MARBLEHEAD CORPORATION AND SUBSIDIARIES
NOTES TO CONSOLIDATED FINANCIAL STATEMENTS (Continued)
June 30, 2013, 2012 and 2011
(2) Summary of Significant Accounting Policies (Continued)
In addition, we provide other services on a stand-alone, fee-for-service basis that may be based on the volume of education loans disbursed, the number of applications processed or other contractual terms. Our recognition of such fees is based on these contractual terms.
Our consolidated statements of operations for fiscal 2011, fiscal 2012 and a portion of fiscal 2013 included special servicing fees due from certain securitization trusts that we previously facilitated, which represented compensation to us for managing the performance of default prevention and collections management services. Such fees were based, in part, upon the volume of assets under management, and, in part, upon the reimbursement of expenses. We recognized such fees as the services were performed or as the reimbursable expenses were incurred, as applicable.
Fair Value Changes to Service Revenue Receivables
We record changes in the fair value of additional structural advisory fee and residual receivables as revenues in our consolidated statements of operations. We record any change in the assumptions used to estimate fair value in our consolidated statements of operations in the period in which the change is made.
In determining a provision for income taxes, we base our estimated annual effective tax rate on expected annual income or loss, statutory tax rates, our ability to utilize net operating loss carryforwards and tax planning opportunities available to us in the various jurisdictions in which we operate. The estimated annual effective income tax rate also includes our best estimate of the ultimate outcome of income tax audits.
We use the asset and liability method of accounting for recognition of deferred income taxes. Under the asset and liability method, we recognize deferred tax assets and liabilities in connection with the tax effects of temporary differences between our financial statement carrying amounts of existing assets and liabilities and their respective tax bases and operating loss carrybacks and carryforwards. We measure deferred tax assets and liabilities using enacted tax rates expected to apply to taxable income or loss in the years in which those temporary differences are expected to be recovered or settled. We recognize the effect of a change in tax rates on deferred tax assets and liabilities as tax expense (benefit) in the period that includes the enactment date. We establish a deferred tax asset valuation allowance if we consider it more likely than not that all or a portion of the deferred tax assets will not be realized. We recognize the effect of income tax positions only if those positions are more likely than not to be sustained. Recognized income tax positions are measured at the largest amount that is greater than 50% likely of being realized. Changes in recognition or measurement are reflected in the period in which the change in judgment occurs. We also record interest related to unrecognized tax benefits in income tax expense. Penalties would be recognized as a component of income tax expense in the period in which the minimum statutory threshold is exceeded.
| (n) | Net Income (Loss) Per Share |
We compute basic net income or loss per share by dividing net income or loss by the weighted-average number of shares outstanding. We compute diluted net income or loss per share by dividing net income or loss by the sum of the weighted-average number of shares determined for the basic earnings per common share computation and the number of common stock equivalents that would have a dilutive effect. To the extent that there is a net loss, we assume all common stock equivalents to be anti-dilutive, and they are excluded from diluted weighted-average shares outstanding. We determine common stock equivalent shares outstanding in accordance with the treasury stock method. In those years in which we have both net income and participating
90
THE FIRST MARBLEHEAD CORPORATION AND SUBSIDIARIES
NOTES TO CONSOLIDATED FINANCIAL STATEMENTS (Continued)
June 30, 2013, 2012 and 2011
(2) Summary of Significant Accounting Policies (Continued)
securities, we compute basic net income per share utilizing the two-class method earnings allocation formula to determine earnings per share for each class of stock according to dividends and participation rights in undistributed earnings. Under the two-class method, basic earnings per common share is computed by dividing net earnings allocated to common stock by the weighted-average number of common shares outstanding.
| (o) | Stock-based Compensation |
We record compensation expense equal to the estimated fair value on the grant date of stock options granted to purchase common stock, on a straight-line basis over the options’ service period. We record compensation expense for equity-based awards other than options based on the timing of vesting and the grant date fair value.
We use the Black-Scholes option pricing model to determine the fair value of any option granted. The fair value of any equity-based award other than an option, such as a restricted stock unit (RSU), is based on the price of our common stock on the date of grant.
Comprehensive income is defined as all changes in equity, except for those resulting from transactions with stockholders. Net income is a component of comprehensive income, with all other components referred to in the aggregate as other comprehensive income.
For purposes of reporting cash flows, cash and cash equivalents include cash on hand, amounts due from banks and federal funds sold. Generally, federal funds sold are on an overnight basis.
| (r) | Recently Issued Accounting Pronouncements |
ASU 2011-05,Comprehensive Income (Topic 220): Presentation of Comprehensive Income (ASU 2011-05), is effective for fiscal years, and interim periods within those years, beginning after December 15, 2011. ASU 2011-05 eliminates the option in GAAP to present other comprehensive income in our consolidated statements of changes in stockholders’ equity (deficit). ASU 2011-05 requires that non-owner changes in stockholders’ equity be presented either in a single continuous statement of comprehensive income or in two separate but consecutive statements. The provisions of ASU 2011-05 were applied retrospectively and were effective for fiscal years and interim periods beginning in the first quarter of fiscal 2013. We elected to present comprehensive income in a separate financial statement, our consolidated statements of comprehensive income. The adoption of ASU 2011-05 did not have a material impact on our consolidated financial statements.
ASU 2013-02, Comprehensive Income (Topic 220): Reporting of Amounts Reclassified Out of Accumulated Other Comprehensive Income(ASU 2013-02), is effective prospectively for annual reporting periods beginning after December 15, 2012 and interim periods within those years. ASU 2013-02 requires entities to disclose: (1) for items reclassified out of accumulated other comprehensive income and into net income for their entirety, the effect of the reclassification on each affected net income line item and (2) for accumulated other comprehensive income reclassification items that are not reclassified in their entirety into net income, a cross reference to other required GAAP disclosures. We expect to adopt ASU 2013-02 in the first quarter of fiscal 2014. We do not expect the adoption of ASU 2013-02 to have a material impact on our consolidated financial statements.
We do not expect any other recently issued, but not yet effective, accounting pronouncements to have a material impact on our consolidated financial statements.
91
THE FIRST MARBLEHEAD CORPORATION AND SUBSIDIARIES
NOTES TO CONSOLIDATED FINANCIAL STATEMENTS (Continued)
June 30, 2013, 2012 and 2011
(3) Discontinued Operations
Upon our adoption of ASU 2009-16 and ASU 2009-17, effective July 1, 2010, we consolidated 14 securitization trusts that we facilitated during fiscal 2004 through fiscal 2008. The education loans purchased by certain of the securitization trusts (Trusts) were initially subject to a default repayment guaranty by The Education Resources Institute, Inc. (TERI), while the education loans purchased by other securitization trusts (NCT Trusts) were, with limited exceptions, not TERI-guaranteed. Of the 14 securitization trusts consolidated on July 1, 2010, 11 were Trusts and 3 were NCT Trusts. We refer to the consolidated Trusts as the NCSLT Trusts and the consolidated NCT Trusts as the GATE Trusts.
On November 14, 2011, we sold to a third party all of our interests in the structuring advisory agreements relating to the Trusts and the related asset services agreement for $13.0 million in cash. Our variable interests in the Trusts included our right to receive the additional structural advisory fees. As a result of this sale, we no longer held a variable interest in the NCSLT Trusts and were, therefore, no longer the primary beneficiary of the NCSLT Trusts. Accordingly, we deconsolidated $6.61 billion of assets and $7.85 billion of liabilities from our consolidated balance sheets and recognized a $1.24 billion non-cash gain in our consolidated statements of operations during the second quarter of fiscal 2012, representing the accumulated deficit in the NCSLT Trusts.
On March 2, 2012, FMD sold to a third party all of its outstanding capital stock in its subsidiary First Marblehead Data Services, Inc. (FMDS) for $13.7 million in cash. FMDS served as the trust administrator of the NCT Trusts. On March 30, 2012, the new third party owner of FMDS terminated the agreement, effective September 30, 2012, with FMD’s subsidiary First Marblehead Education Resources, Inc. (FMER) for the special servicing of the NCT Trusts. With the termination of this agreement, we no longer had the power to direct the activities that most significantly impact the performance of the GATE Trusts and, therefore, we were no longer considered the primary beneficiary of these trusts. As a result, we deconsolidated the GATE Trusts effective March 31, 2012. We deconsolidated $258.4 million of assets and $260.1 million of liabilities from our consolidated balance sheets and recognized a $1.7 million non-cash gain in our consolidated statements of operations during the third quarter of fiscal 2012, representing the accumulated deficit in the GATE Trusts. In addition to the non-cash gain of $1.7 million, we also recorded an additional gain of $9.2 million representing the fair value of the residual interests and additional structural advisory fees related to these trusts that were previously eliminated through consolidation, resulting in a total non-cash gain of $10.9 million for the deconsolidation event.
On April 13, 2012, FMER provided its notice of resignation as special servicer of the Trusts. The resignation became effective June 21, 2012. Pursuant to the terms of the resignation, FMER assisted the new special servicer of the Trusts for a transition period that terminated on November 30, 2012.
92
THE FIRST MARBLEHEAD CORPORATION AND SUBSIDIARIES
NOTES TO CONSOLIDATED FINANCIAL STATEMENTS (Continued)
June 30, 2013, 2012 and 2011
(3) Discontinued Operations (Continued)
During the fourth quarter of fiscal 2012, we determined that we no longer had any significant continuing involvement in the operations relating to the NCSLT Trusts and the GATE Trusts. Further, we concluded that this would occur within an appropriate assessment period for both the NCSLT Trusts and the GATE Trusts. As a result, we reported the operations and activities relating to the NCSLT Trusts, the GATE Trusts and FMDS within discontinued operations for fiscal 2012 and fiscal 2011. The non-cash gains representing the accumulated deficit recognized upon deconsolidations of the NCSLT Trusts and the GATE Trusts, as discussed above, were included in discontinued operations. Further, the gain recognized as the result of the sale of FMDS, as well as the revenues and expenses of FMDS prior to the sale, were recorded in discontinued operations for fiscal 2012. The revenues and expenses of discontinued operations for fiscal 2012 and fiscal 2011 were as follows:
| | | | | | | | |
| | | Fiscal year ended June 30, | |
| | | 2012 | | | 2011 | |
| | | (dollars in thousands) | |
Total revenues | | $ | (100,737 | ) | | $ | (140,565 | ) |
Total expenses | | | 15,408 | | | | 37,690 | |
Other income | | | 1,258,564 | | | | 42,587 | |
| | | | | | | | |
Net income (loss) from discontinued operations, before income taxes | | | 1,142,419 | | | | (135,668 | ) |
Income tax expense | | | 6,598 | | | | 1,899 | |
| | | | | | | | |
Discontinued operations, net of taxes | | $ | 1,135,821 | | | $ | (137,567 | ) |
| | | | | | | | |
The securitization trusts previously consolidated were considered pass-through entities for income tax purposes and, accordingly, the net income or loss of the trusts was included in the tax returns of the trust owners rather than the trust entities themselves. Income taxes allocated to discontinued operations were related to the sales and operations of FMDS.
(4) Asset Acquisition of Cology, Inc.
On October 19, 2012, FMD’s subsidiary Cology LLC completed its acquisition of a substantial portion of the operating assets of the Cology Sellers for $4.7 million in cash and the assumption of certain liabilities. Our consolidated financial statements for fiscal 2013 reflect revenues and expenses of Cology LLC since the date of acquisition. Cology LLC provides education loan processing and disbursement services to approximately 270 credit union and other lender clients in the United States as well as offering life-of-loan servicing. Cology LLC earns fees based primarily on the number of loan applications, loan certifications and disbursements it processes on behalf of its clients. Cology LLC does not originate education loans for its own account.
In connection with the transaction, we entered into special retention agreements with certain Cology LLC employees that provide for a bonus payment to those employees who are employed by Cology LLC on the one-year anniversary of the acquisition date, subject to the attainment of certain reductions in operating expenses by Cology LLC. We have not accrued any amounts under the special retention agreements as of June 30, 2013. We also established a performance incentive plan that provides for payment of bonuses to eligible employees based on Cology LLC’s achievement of certain profitability targets for the periods ending June 30, 2013, 2014 and 2015. We have not accrued any amounts under the performance incentive plan as of June 30, 2013.
93
THE FIRST MARBLEHEAD CORPORATION AND SUBSIDIARIES
NOTES TO CONSOLIDATED FINANCIAL STATEMENTS (Continued)
June 30, 2013, 2012 and 2011
(5) Cash and Cash Equivalents
The following table summarizes our cash and cash equivalents:
| | | | | | | | |
| | | June 30, | |
| | | 2013 | | | 2012 | |
| | | (dollars in thousands) | |
Cash equivalents (money market funds) | | $ | 33,032 | | | $ | 80,574 | |
Interest-bearing deposits with the Federal Reserve | | | 24,906 | | | | 27,396 | |
Interest-bearing deposits with banks | | | 22,438 | | | | 14,026 | |
Non-interest-bearing deposits with banks | | | 1,334 | | | | 1,302 | |
Federal funds sold | | | 200 | | | | 199 | |
| | | | | | | | |
Total cash and cash equivalents | | $ | 81,910 | | | $ | 123,497 | |
| | | | | | | | |
Cash and cash equivalents of Union Federal of $27.0 million and $29.9 million at June 30, 2013 and June 30, 2012, respectively, were not available for dividends without prior approval from the Office of the Comptroller of the Currency (OCC), Union Federal’s regulator.
(6) Short-term Investments
Short-term investments of $55.2 million at June 30, 2013 and $85.0 at million June 30, 2012 included certificates of deposits with highly-rated financial institutions, carried at cost. These certificates of deposits have a range of maturities between 1.5 months to 7.6 months.
(7) Investments Available-for-Sale
We categorize available-for-sale investment securities by major security type. Government-sponsored enterprises (GSE) are comprised of debt securities issued by the Federal Home Loan Bank, the Federal Home Loan Mortgage Corporation and the Federal National Mortgage Association.
The following table provides a summary of investments available-for-sale by major security type:
| | | | | | | | | | | | | | | | |
| | | Amortized
cost | | | Unrealized
gains | | | Unrealized
losses | | | Fair
value | |
| | | (dollars in thousands) | |
At June 30, 2013: | | | | | | | | | | | | | | | | |
GSE mortgage-backed securities | | $ | 71,970 | | | $ | 294 | | | $ | (1,020 | ) | | $ | 71,244 | |
Mortgage-backed securities issued by U.S. government agencies | | | 13,554 | | | | 153 | | | | (169 | ) | | | 13,538 | |
| | | | | | | | | | | | | | | | |
Total | | $ | 85,524 | | | $ | 447 | | | $ | (1,189 | ) | | $ | 84,782 | |
| | | | | | | | | | | | | | | | |
At June 30, 2012: | | | | | | | | | | | | | | | | |
GSE mortgage-backed securities | | $ | 51,972 | | | $ | 369 | | | $ | (56 | ) | | $ | 52,285 | |
Mortgage-backed securities issued by U.S. government agencies | | | 16,016 | | | | 299 | | | | (2 | ) | | | 16,313 | |
| | | | | | | | | | | | | | | | |
Total | | $ | 67,988 | | | $ | 668 | | | $ | (58 | ) | | $ | 68,598 | |
| | | | | | | | | | | | | | | | |
At June 30, 2013 and June 30, 2012, ten and three investment securities totaling $53.1 million and $16.0 million, respectively, had unrealized losses of $1.2 million and $58 thousand, respectively, and had been in an
94
THE FIRST MARBLEHEAD CORPORATION AND SUBSIDIARIES
NOTES TO CONSOLIDATED FINANCIAL STATEMENTS (Continued)
June 30, 2013, 2012 and 2011
(7) Investments Available-for-Sale (Continued)
unrealized loss position for less than one year. Management evaluates impairments in values, whether caused by adverse interest rates or credit movements, to determine if they are other-than-temporary. Additionally, management evaluates whether it intends to sell or will be required to sell the debt securities before the anticipated recovery of their remaining amortized cost. Management concluded the unrealized losses at June 30, 2013 and June 30, 2012 were temporary in nature.
The amortized cost basis of available-for-sale securities by maturity as of June 30, 2013 is presented below. Mortgage-backed securities were included based on weighted-average maturities, adjusted for anticipated prepayments. Contractual maturities on the mortgage-backed securities range from eight to 29 years.
| | | | | | | | | | | | | | | | | | | | |
| | | June 30, 2013 | |
| | | Due in one year
or less | | | Due after one
year but within
five years | | | Due after five
years but within
ten years | | | Due after ten
years | | | Total | |
| | | (dollars in thousands) | |
Securities available-for-sale: | | | | | | | | | | | | | | | | | | | | |
GSE mortgage-backed securities: | | | | | | | | | | | | | | | | | | | | |
Amortized cost | | $ | 74 | | | $ | 47,822 | | | $ | 24,074 | | | $ | — | | | $ | 71,970 | |
Weighted-average yield | | | 1.17 | % | | | 1.96 | % | | | 1.79 | % | | | — | % | | | 1.90 | % |
Mortgage-backed securities issued by U.S. government agencies: | | | | | | | | | | | | | | | | | | | | |
Amortized cost | | $ | — | | | $ | 13,554 | | | $ | — | | | $ | — | | | $ | 13,554 | |
Weighted-average yield | | | — | % | | | 2.16 | % | | | — | % | | | — | % | | | 2.16 | % |
| | | | | | | | | | | | | | | | | | | | |
Total debt securities: | | | | | | | | | | | | | | | | | | | | |
Amortized cost | | $ | 74 | | | $ | 61,376 | | | $ | 24,074 | | | $ | — | | | $ | 85,524 | |
Weighted-average yield | | | 1.17 | % | | | 2.00 | % | | | 1.79 | % | | | — | % | | | 1.94 | % |
| | | | | | | | | | | | | | | | | | | | |
Fair value | | $ | 74 | | | $ | 60,680 | | | $ | 24,028 | | | $ | — | | | $ | 84,782 | |
| | | | | | | | | | | | | | | | | | | | |
At June 30, 2013, the expected weighted-average remaining life of the mortgage-backed securities, calculated using prepayment speed assumptions, was 4.0 years.
(8) Education Loans Held-to-Maturity
| (a) | Gross Education Loans Outstanding |
We began originating Monogram-based loans through Union Federal in fiscal 2012. At June 30, 2013 and June 30, 2012, education loans outstanding primarily consisted of education loans held by Union Federal, totaling $63.6 million and $33.3 million, respectively. Other education loans consisted of loans totaling $1.1 million at both June 30, 2013 and June 30, 2012, which were transferred by Union Federal to an indirect subsidiary of FMD in 2009, prior to the launch of our Monogram platform. These loans were fully reserved for at June 30, 2013 and June 30, 2012.
95
THE FIRST MARBLEHEAD CORPORATION AND SUBSIDIARIES
NOTES TO CONSOLIDATED FINANCIAL STATEMENTS (Continued)
June 30, 2013, 2012 and 2011
(8) Education Loans Held-to-Maturity (Continued)
The following table summarizes the composition of the net carrying value of our education loans held-to-maturity as of the dates indicated:
| | | | | | | | |
| | | June 30, | |
| | | 2013 | | | 2012 | |
| | | (dollars in thousands) | |
Gross loan principal outstanding | | $ | 64,655 | | | $ | 34,404 | |
Allowance for loan losses | | | (1,659 | ) | | | (1,309 | ) |
| | | | | | | | |
Education loans held-to-maturity, net of allowance | | $ | 62,996 | | | $ | 33,095 | |
| | | | | | | | |
| (b) | Education Loan Allowance for Loan Losses and the Related Provision for Loan Losses |
We recorded the following activity in the allowance for loan losses for education loans:
| | | | | | | | |
| | | Fiscal years ended
June 30, | |
| | | 2013 | | | 2012 | |
| | | (dollars in thousands) | |
Balance, beginning of year | | $ | 1,309 | | | $ | 1,336 | |
Provision (credit) for loan losses | | | 11 | | | | (601 | ) |
Reserves reclassified from interest receivable for capitalized interest | | | 31 | | | | 24 | |
Charge-offs | | | (156 | ) | | | (240 | ) |
Recoveries from borrowers | | | 464 | | | | 790 | |
| | | | | | | | |
Balance, end of year | | $ | 1,659 | | | $ | 1,309 | |
| | | | | | | | |
To estimate the allowance for loan losses on our newly originated Monogram-based loan portfolio, we utilized specific default and recovery rates projected for the Monogram-based loan portfolio over the 12-month loss confirmation period. We may also apply qualitative adjustments in determining the allowance for loan losses. Our default experience with this loan portfolio is limited by the seasoning of the portfolio; however, we have utilized our historical database and experience in projecting the level of defaults and recoveries of the Monogram-based loan portfolio relying in part on historical results from our securitization trusts that we previously facilitated for loans that have similar credit characteristics to those in our Monogram-based loan portfolio.
At June 30, 2013 and June 30, 2012, there was $189 thousand and $54 thousand, respectively, of educations loans that were in non-accrual status and no education loans that had specific reserves. These loans included $42 thousand and $54 thousand, at June 30, 2013 and June 30, 2012, respectively, of loans that were transferred by Union Federal to an indirect subsidiary of FMD in 2009, prior to the launch of our Monogram platform. For loans greater than 180 days past due, but not yet charged-off, our policy is to evaluate the loans under ASC 310,Receivables, for a specific reserve. At June 30, 2013, there were $110 thousand of education loans that were greater than 180 days past due, which included $77 thousand of Monogram-based education loans issued through Union Federal.
96
THE FIRST MARBLEHEAD CORPORATION AND SUBSIDIARIES
NOTES TO CONSOLIDATED FINANCIAL STATEMENTS (Continued)
June 30, 2013, 2012 and 2011
(8) Education Loans Held-to-Maturity (Continued)
Overall Education Loan Credit Quality
Management monitors the credit quality of an education loan based on loan status, as outlined below. The impact of changes in loan status, such as delinquency and time in repayment, is incorporated into the quarterly allowance for loan loss calculation through our projection of defaults. The following table represents our loan origination metrics with respect to our Monogram-based programs held at Union Federal at June 30, 2013 and June 30, 2012:
| | | | | | | | |
| | | June 30, | |
| | | 2013 | | | 2012 | |
Weighted-average FICO score | | | 752 | | | | 753 | |
Co-signers | | | 83 | % | | | 85 | % |
Delinquent loans | | | 0.45 | % | | | 0.03 | % |
The weighted-average FICO score is based on the maximum score of the borrower or co-signer at origination.
The following table provides additional information on the status of education loans outstanding:
| | | | | | | | | | | | | | | | |
| | | June 30,
2013 | | | As a percentage
of total | | | June 30,
2012 | | | As a percentage
of total | |
| | | (dollars in thousands) | |
Principal of loans outstanding: | | | | | | | | | | | | | | | | |
In basic forbearance | | $ | 439 | | | | 0.7 | % | | $ | 171 | | | | 0.5 | % |
In school and in deferment | | | 22,948 | | | | 35.5 | | | | 14,781 | | | | 43.0 | |
In repayment, including alternative payment plans, classified as: | | | | | | | | | | | | | | | | |
Current:£30 days past due | | | 40,724 | | | | 63.0 | | | | 19,289 | | | | 56.0 | |
Delinquent: >30 days past due, but£120 days past due | | | 355 | | | | 0.5 | | | | 109 | | | | 0.3 | |
Delinquent: >120 days past due, but£180 days past due | | | 79 | | | | 0.1 | | | | 54 | | | | 0.2 | |
In default: >180 days past due, but not yet charged-off | | | 110 | | | | 0.2 | | | | — | | | | — | |
| | | | | | | | | | | | | | | | |
Total gross loan principal outstanding | | $ | 64,655 | | | | 100.0 | % | | $ | 34,404 | | | | 100.0 | % |
| | | | | | | | | | | | | | | | |
Non-accrual loan principal (>120 days past due) | | $ | 189 | | | | 0.3 | % | | $ | 54 | | | | 0.2 | % |
Past due loan principal (>90 days, but£120 days past due still accruing interest) | | | 121 | | | | 0.2 | | | | 11 | | | | — | |
In alternative payment plans | | | 784 | | | | 1.2 | | | | 263 | | | | 0.8 | |
We use the following terms to describe borrowers’ payment status:
In School and In Deferment Pursuant to the terms of the education loans, a borrower may choose to defer principal and interest payments while carrying a specified academic course load and may be eligible to defer payments for an additional six months after graduation during a grace period. At the end of the deferment period, any remaining accrued but unpaid interest is capitalized and added to principal outstanding.
In Repayment We determine the repayment status of a borrower, including a borrower making payments pursuant to alternative payment plans, by contractual due dates. A borrower making reduced payments for a limited period of time pursuant to an alternative payment plan will be considered current if such reduced
97
THE FIRST MARBLEHEAD CORPORATION AND SUBSIDIARIES
NOTES TO CONSOLIDATED FINANCIAL STATEMENTS (Continued)
June 30, 2013, 2012 and 2011
(8) Education Loans Held-to-Maturity (Continued)
payments are timely made. Under our Monogram platform, borrowers may be in repayment while in school. Payment options while in school include full principal and interest, partial interest and interest only.
Forbearance Pursuant to the terms of the education loans, a borrower may apply for forbearance, which is a temporary reprieve from making full contractual payments. Forbearance can take many forms, at the option of the creditor. The most common forms of forbearance include the following:
| | • | | Basic forbearance—Cessation of all contractual payments for a maximum allowable forbearance period of one year, granted in three-month increments. Although basic forbearance is available as part of our Monogram-based programs, it has not been substantially utilized due to the seasoning of our Monogram-based education loan portfolio. |
| | • | | Alternative payment plans—Pursuant to an alternative payment plan, a borrower can make a reduced payment for a limited period of time. The amount of the payment varies depending on the program and may be set at a fixed dollar amount, a percentage of contractual required payments or interest-only payments. Generally, approval for alternative payment plans is granted for a maximum of six to 24 months, depending on the program. |
The use of forbearance is contemplated at the origination of an education loan and, as noted in the credit agreement with the borrower, is granted at the lender’s discretion. Under both basic forbearance and alternative payment plans, the education loan continues to accrue interest. When forbearance ceases, unpaid interest is capitalized and added to principal outstanding, and the borrower’s required payments are recalculated at a higher amount to pay off the loan, plus the additional accrued and capitalized interest, at the original stated interest rate by the original maturity date. There is no forgiveness of principal or interest, reduction in the interest rate or extension of the maturity date.
Forbearance programs result in a delay in the timing of payments received from borrowers; however, assuming the collection of the forborne amounts, provide for an increase in the gross volume of cash receipts over the term of the education loan due to the additional accrued interest capitalized while in forbearance. Forbearance programs may have the effect of delaying default emergence, and alternative payment plans may reduce the utilization of basic forbearance.
There have been no modifications granted which would constitute a TDR as it relates to our education loan portfolio.
(9) Mortgage Loans Held-to-Maturity
| (a) | Gross Mortgage Loans Outstanding |
Through our bank subsidiary, Union Federal, we carry a portfolio of mortgage loans held-to-maturity. The following table provides information on the carrying values and implicit credit quality of this portfolio:
| | | | | | | | |
| | | June 30, | |
| | 2013 | | | 2012 | |
| | (dollars in thousands) | |
Gross loan principal outstanding | | $ | 13,021 | | | $ | 8,381 | |
Allowance for loan losses | | | (440 | ) | | | (591 | ) |
Deferred costs | | | 48 | | | | 21 | |
| | | | | | | | |
Mortgage loans held-to-maturity, net of allowance | | $ | 12,629 | | | $ | 7,811 | |
| | | | | | | | |
| | |
Outstanding principal on mortgage loans on non-accrual status | | $ | 987 | | | $ | 1,424 | |
98
THE FIRST MARBLEHEAD CORPORATION AND SUBSIDIARIES
NOTES TO CONSOLIDATED FINANCIAL STATEMENTS (Continued)
June 30, 2013, 2012 and 2011
(9) Mortgage Loans Held-to-Maturity (Continued)
We did not have any mortgage loans greater than 90 days past due that were accruing interest.
| (b) | Mortgage Loan Allowance for Loan Losses and the Related Provision for Loan Losses |
We recorded the following activity in the allowance for loan losses for mortgage loans:
| | | | | | | | |
| | | Fiscal years ended
June 30, | |
| | | 2013 | | | 2012 | |
| | | (dollars in thousands) | |
Balance, beginning of year | | $ | 591 | | | $ | 882 | |
Provision (credit) for loan losses | | | 137 | | | | (13 | ) |
Charge-offs | | | (295 | ) | | | (335 | ) |
Recoveries from borrowers | | | 7 | | | | 57 | |
| | | | | | | | |
Balance, end of year | | $ | 440 | | | $ | 591 | |
| | | | | | | | |
On a quarterly basis, we prepare an estimate of the allowance necessary to cover estimated credit losses. We maintain the allowance at a level that we deem adequate to absorb all reasonably anticipated losses from specifically known and other credit risks associated with the portfolio. We use a systematic methodology to measure the amount of estimated loan loss exposure inherent in the portfolio for purposes of establishing a sufficient allowance for loan losses. The methodology makes use of specific reserves, for loans individually evaluated and deemed impaired and general reserves, for groups of loans with similar risk characteristics, which rely on a combination of qualitative and quantitative factors that could have an impact on the credit quality of the portfolio. Key qualitative factors that we deemed likely to cause estimated credit losses to differ from the historical charge-off rate included underlying collateral values and the current economic environment and conditions. We believe these to be the most significant qualitative factors; however, we recognize that additional issues may also impact the estimate of credit losses to some degree. From time to time, we will re-evaluate the qualitative factors in use in order to consider the impact of other issues, which based on changing circumstances, may become more significant in the future.
We place mortgage loans on non-accrual status when they become 90 days past due as to either principal or interest. The following table summarizes the aging of past due mortgage loans. The balances represent the recorded investment in the loans, which is equal to outstanding principal net of charge-offs.
| | | | | | | | |
| | | June 30, | |
| | | 2013 | | | 2012 | |
| | | (dollars in thousands) | |
Non-accrual loans: | | | | | | | | |
Residential (1-4 family) | | $ | 570 | | | $ | 1,049 | |
Commercial/mixed use | | | 94 | | | | 220 | |
Accruing loans: | | | | | | | | |
Accruing loans 30-59 days past due | | | 560 | | | | 708 | |
We did not have any accruing mortgage loans that were 60 or more days past due.
99
THE FIRST MARBLEHEAD CORPORATION AND SUBSIDIARIES
NOTES TO CONSOLIDATED FINANCIAL STATEMENTS (Continued)
June 30, 2013, 2012 and 2011
(9) Mortgage Loans Held-to-Maturity (Continued)
Impaired Loans
A loan is impaired when, based on current information and events, it is probable that a creditor will be unable to collect all amounts due according to the contractual terms of the loan agreement. When a loan is impaired, we measure impairment based on the present value of expected future cash flows discounted at the loan’s effective interest rate, except that as a practical expedient, we measure impairment based on a loan’s observable market price or the fair value of the collateral if the loan is collateral dependent. See Note 2, “Summary of Significant Accounting Policies,” for a description of our policy for recognizing interest income on impaired loans.
The composition of impaired loans was as follows:
| | | | | | | | |
| | | June 30, | |
| | 2013 | | | 2012 | |
| | (dollars in thousands) | |
Impaired loans on non-accrual | | $ | 664 | | | $ | 1,269 | |
Total recorded investment in impaired loans | | | 1,506 | | | | 2,078 | |
Average recorded investment of impaired loans | | | 2,077 | | | | 2,232 | |
Unpaid principal balance of impaired loans | | | 1,872 | | | | 2,233 | |
Accruing troubled debt restructurings | | | 413 | | | | 578 | |
Interest income recognized on impaired loans | | | 80 | | | | 85 | |
The following impaired loans had specific reserves at June 30, 2013 and 2012:
| | | | | | | | | | | | | | | | |
| | | June 30, | |
| | 2013 | | | 2012 | |
| | Carrying Value | | | Specific Reserve | | | Carrying Value | | | Specific Reserve | |
| | (dollars in thousands) | |
Commercial/mixed use | | $ | 121 | | | $ | 36 | | | $ | 220 | | | $ | 118 | |
Residential (1-4) family | | | 590 | | | | 209 | | | | 409 | | | | 156 | |
| | | | | | | | | | | | | | | | |
| | $ | 711 | | | $ | 245 | | | $ | 629 | | | $ | 274 | |
| | | | | | | | | | | | | | | | |
There was one impaired commercial/mixed use loan of $94 thousand with no specific reserve at June 30, 2013. There were four impaired residential (1-4) family loans totaling $701 thousand with no specific reserve at June 30, 2013. These impaired loans had no specific reserves at June 30, 2013 due to partial charge-offs taken for the amounts determined to be uncollectible. There were eight impaired residential (1-4) family loans totaling $1.4 million with no specific reserve at June 30, 2012. Three of the eight impaired loans had no specific reserves at June 30, 2012 due to partial charge-offs taken for the amounts determined to be uncollectible. The remaining five impaired loans had no specific reserves at June 30, 2012 as the balances were supported by expected future cash flows or, for those collateral dependent loans, the net realizable value of the underlying collateral.
Troubled Debt Restructurings
TDRs are loans where Union Federal, for economic reasons related to the borrower’s financial condition, has granted a significant concession to the borrower that it would not otherwise consider. TDRs can be classified as either accrual or non-accrual loans. Union Federal continued to accrue interest on all TDRs except for five loans totaling $664 thousand as of June 30, 2013 and five loans totaling $908 thousand as of June 30, 2012.
100
THE FIRST MARBLEHEAD CORPORATION AND SUBSIDIARIES
NOTES TO CONSOLIDATED FINANCIAL STATEMENTS (Continued)
June 30, 2013, 2012 and 2011
(9) Mortgage Loans Held-to-Maturity (Continued)
Union Federal had TDRs of $1.1 million and $1.5 million at June 30, 2013 and June 30, 2012, respectively. Union Federal assigned $176 thousand and $240 thousand of specific reserves to loans classified as TDRs as of June 30, 2013 and June 30, 2012, respectively. TDRs were assigned specific reserves in accordance with our allowance for loan loss methodology.
The following is information pertaining to TDRs that occurred during the fiscal year ended June 30, 2013:
| | | | | | | | | | | | |
| | | Number of
loans | | | Pre-modification
outstanding
recorded
investment | | | Post-modification
outstanding
recorded
investment | |
| | | (dollars in thousands) | |
Residential (1-4) family | | | 2 | | | $ | 299 | | | $ | 311 | |
There were two non-performing residential (1-4) family loans modified during fiscal 2013. The loans were modified by reducing interest rates as well as extending the terms of the loans. The financial impact of the modifications was a $6 thousand reduction in interest payments for the fiscal year ended June 30, 2013.
The following is information pertaining to TDRs that occurred during the fiscal year ended June 30, 2012:
| | | | | | | | | | | | |
| | | Number of
loans | | | Pre-modification
outstanding
recorded
investment | | | Post-modification
outstanding
recorded
investment | |
| | | (dollars in thousands) | |
Commercial/mixed use | | | 1 | | | $ | 227 | | | $ | 227 | |
There was one non-performing commercial/mixed use loan modified during fiscal 2012. The loan was modified by reducing the interest rate of the loan. The financial impact of the modification was a $2 thousand reduction in interest payments for the fiscal year ended June 30, 2012.
(10) Deposits for Participation Interest Accounts
In connection with certain of our lender clients’ Monogram-based loan programs, we have provided credit enhancements by funding participation accounts to serve as a first-loss reserve for defaulted program loans. We have made initial deposits toward our credit enhancement arrangements and agreed to provide periodic supplemental deposits, up to specified limits, during the disbursement periods under our loan program agreements based on the credit mix and volume of disbursed program loans and adjustments to default projections for program loans.
Participation accounts serve as a first-loss reserve to the originating lenders for defaults experienced in Monogram-based loan program portfolios. As defaults occur, our lender clients withdraw the outstanding balance of defaulted principal and interest from the participation account applicable to their respective programs. As amounts are recovered from borrowers, those amounts are deposited back into the applicable participation account, if applicable. Legal ownership of the defaulted education loan may be transferred to us or continue to be owned by the lender client, depending on the terms of the loan program agreement. Defaulted education loans transferred to us are immediately charged-off and the recoveries are deposited back to the applicable participation account regardless of our ownership of the education loan.
101
THE FIRST MARBLEHEAD CORPORATION AND SUBSIDIARIES
NOTES TO CONSOLIDATED FINANCIAL STATEMENTS (Continued)
June 30, 2013, 2012 and 2011
(10) Deposits for Participation Interest Accounts (Continued)
Cash balances in the participation accounts earn interest at market rates applicable to commercial interest-bearing deposit accounts. In addition, participation account administration fees are deposited directly by our lender clients into the applicable participation accounts. These fees represent compensation to us for providing the credit enhancement, and are distributed from the participation accounts to us monthly and are not eligible to be used as credit enhancement. Interest and fees deposited into the participation accounts are not recognized as revenue in our consolidated statements of operations. Instead, accretion due to discounting and other changes in fair value are recognized in revenue.
To the extent that the credit enhancement balance in participation accounts is in excess of contractually required amounts, as a result of declining loan balances, or if actual loan volumes or default experience are less than our funded amounts, we are eligible to receive periodic releases of funds, in addition to the monthly participation account administration fee, pursuant to the terms of the applicable loan program agreement. The timing and amount of releases, if any, from the participation accounts are uncertain and vary among the loan programs.
We carry participation accounts at fair value on our consolidated balance sheet. Fair value is equal to the amount of cash on deposit in the participation account adjusted for unrealized gains or losses. Due to the lack of availability of market prices for financial instruments of this type, we estimate unrealized gains and unrealized losses related to the participation accounts based on the net present value of expected future cash flows into and out of the account related to education loans originated as of our consolidated balance sheet date, using an estimate of prepayments, defaults and recoveries, and the timing of the return of our capital, if any, at a discount rate commensurate with the risks and durations involved. We record changes in estimated fair value of participation accounts, if any, in non-interest revenues as part of administrative and other fees.
(11) Fair Value Measurements
| (a) | Financial Instruments Recorded at Fair Value on our Consolidated Balance Sheets |
For financial instruments recorded at fair value on our consolidated balance sheet, we base that financial instrument’s categorization within the valuation hierarchy upon the lowest level of input that is significant to the fair value measurement. During fiscal 2013 and fiscal 2012, there were no transfers between the hierarchy levels.
The following is a description of the valuation methodologies used for financial instruments recorded at fair value on our consolidated balance sheet:
Investments Available-for-Sale
We utilize a third-party pricing vendor to provide valuations on our available-for-sale securities, which include GSE mortgage-backed securities and mortgage-backed securities issued by U.S. government agencies. Fair values as provided by the vendor are generally determined based upon available direct market data (including trades, covers, bids, offers and price talk) along with market data for similar securities (including indices and market research). Prepayment/default projections based on historical statistics of the underlying collateral and current market data are also used. Management regards the inputs and methods used by the third-party pricing vendor to be Level 2 inputs and methods in the valuation hierarchy. We periodically obtain a secondary source to assess the reasonableness of prices provided by our primary pricing vendor.
102
THE FIRST MARBLEHEAD CORPORATION AND SUBSIDIARIES
NOTES TO CONSOLIDATED FINANCIAL STATEMENTS (Continued)
June 30, 2013, 2012 and 2011
(11) Fair Value Measurements (Continued)
Participation Interest Account Deposits
We recorded participation account deposits at fair value using cash flow modeling techniques as they do not have available market prices. As such, we estimate fair value using the net present value of expected future cash flows. Changes in the estimated fair value of our participation account deposits are recorded in our consolidated statement of operations within administrative and other fees. At June 30, 2013 and June 30, 2012, the fair value of deposits for participation accounts was not materially different from the cash balance of the underlying interest-bearing deposits. These assets are classified within Level 3 of the valuation hierarchy.
Service Revenue Receivables
We recorded our service revenue receivables at fair value on our consolidated balance sheet. Our service revenue receivables consist of additional structural advisory fees and residual receivables and represent the estimated fair value of our service revenue receivables expected to be collected over the life of the various separate securitization trusts that have purchased education loans facilitated by us, with no further service obligations on our part. Changes in the estimated fair value of our service revenue receivables due, less any cash distributions received, are recorded in our consolidated statements of operations within the fair value changes to service revenue receivables.
In the absence of market-based transactions, we use cash flow modeling techniques to derive a Level 3 estimate of fair value for financial reporting purposes. Significant observable and unobservable inputs used to develop our fair value estimates include, but are not limited to, recovery, net default and prepayment rates, discount rates and the forward London Interbank Offered Rate (LIBOR) curve. These inputs have not changed significantly from June 30, 2012. Our significant unobservable inputs are included below.
The following table presents financial instruments carried at fair value on our consolidated balance sheet, in accordance with the valuation hierarchy described above, on a recurring basis:
| | | | | | | | | | | | | | | | | | | | | | | | | | | | | | | | |
| | | June 30, | |
| | | 2013 | | | 2012 | |
| | | Level 1 | | | Level 2 | | | Level 3 | | | Total
carrying
value | | | Level 1 | | | Level 2 | | | Level 3 | | | Total
carrying
value | |
| | | (dollars in thousands) | |
Assets: | | | | | | | | | | | | | | | | | | | | | | | | | | | | | | | | |
Investments available-for-sale | | $ | — | | | $ | 84,782 | | | $ | — | | | $ | 84,782 | | | $ | — | | | $ | 68,598 | | | $ | — | | | $ | 68,598 | |
Deposits for participation interest accounts | | | — | | | | — | | | | 13,147 | | | | 13,147 | | | | — | | | | — | | | | 4,039 | | | | 4,039 | |
Service revenue receivables | | | — | | | | — | | | | 14,817 | | | | 14,817 | | | | — | | | | — | | | | 16,341 | | | | 16,341 | |
| | | | | | | | | | | | | | | | | | | | | | | | | | | | | | | | |
Total assets | | $ | — | | | $ | 84,782 | | | $ | 27,964 | | | $ | 112,746 | | | $ | — | | | $ | 68,598 | | | $ | 20,380 | | | $ | 88,978 | |
| | | | | | | | | | | | | | | | | | | | | | | | | | | | | | | | |
103
THE FIRST MARBLEHEAD CORPORATION AND SUBSIDIARIES
NOTES TO CONSOLIDATED FINANCIAL STATEMENTS (Continued)
June 30, 2013, 2012 and 2011
(11) Fair Value Measurements (Continued)
The following table presents activity related to our financial assets categorized as Level 3 of the valuation hierarchy, valued on a recurring basis, for fiscal 2013 and fiscal 2012. All realized and unrealized gains and losses recorded during the periods presented relate to assets still held at our consolidated balance sheet date. There have been no transfers in or out of Level 3 of the hierarchy, or between Levels 1 and 2, for the periods presented.
| | | | | | | | | | | | | | | | |
| | | Fiscal years ended June 30, | |
| | 2013 | | | 2012 | |
| | Deposits for participation
interest accounts | | | Service revenue
receivables | | | Deposits for participation
interest accounts | | | Service revenue
receivables | |
| | | (dollars in thousands) | |
Fair value, beginning of year | | $ | 4,039 | | | $ | 16,341 | | | $ | 8,512 | | | $ | 29,610 | |
Realized and unrealized gains (losses) | | | (144 | ) | | | 2,068 | | | | (14 | ) | | | 947 | |
Net contributions (distributions)(1) | | | 9,252 | | | | (3,592 | ) | | | (4,459 | ) | | | (14,216 | ) |
| | | | | | | | | | | | | | | | |
Fair value, end of year | | $ | 13,147 | | | $ | 14,817 | | | $ | 4,039 | | | $ | 16,341 | |
| | | | | | | | | | | | | | | | |
| (1) | During fiscal 2012, we recorded a settlement of our asset servicing fee receivable and additional structural advisory fee receivable of $13.0 million in connection with the sale of the rights to this revenue stream on November 14, 2011. |
The following table presents additional quantitative information about the assets measured at fair value on a recurring basis for which we have utilized Level 3 inputs to determine fair value at June 30, 2013:
| | | | | | | | | | | | |
Asset | | Fair Value | | | Valuation Techniques | | Significant Unobservable Inputs | | Range | |
| | | (dollars in
thousands) | | | | | | | | |
Deposits for participation interest accounts | | $ | 13,147 | | | Discounted cash flows | | Discount rate | | | 8-15 | % |
| | | | | | | | Annual prepayment rates | | | 5-12 | % |
| | | | | | | | Annual net recovery rates | | | 2.67 | % |
| | | | | | | | Annual default rates | | | 0-2.25 | % |
| | | | |
Service revenue receivables | | $ | 14,817 | | | Discounted cash flows | | Discount rate | | | 10-16 | % |
| | | | | | | | Annual prepayment rates | | | 3-9 | % |
| | | | | | | | Annual net recovery rates | | | 2-2.5 | % |
| | | | | | | | Annual default rates | | | 1-10 | % |
| (b) | Level 3 Inputs Used to Determine Fair Value |
The unobservable inputs used to determine the fair value of our service revenue receivables and participation accounts include, but are not limited to, discount rates, prepayment rates, recovery rates and default rates. The forward LIBOR curve is a key observable input utilized in determining the fair value of expected future cash flows from these assets. There have been no significant changes in these inputs from June 30, 2012.
104
THE FIRST MARBLEHEAD CORPORATION AND SUBSIDIARIES
NOTES TO CONSOLIDATED FINANCIAL STATEMENTS (Continued)
June 30, 2013, 2012 and 2011
(11) Fair Value Measurements (Continued)
Sensitivity to Changes in Assumptions
The service revenue receivables recorded at June 30, 2013 and June 30, 2012 were related to the GATE Trusts and other securitization trusts we previously facilitated. Substantially all of the loans held by these securitization trusts have guarantees from schools, and, in some cases, from a third party bank. These guarantees help to partially mitigate the overall impact of defaults and sensitivity to changes in default activity to the residual interest holder. In addition, the recoveries on guaranteed defaults are returned back to the schools or bank, as applicable, not the residual interest holder, therefore, limiting the impact and sensitivity of the residual interest holder to recoveries. Further, due to the seasoning of these trusts, many of the residual interests have relatively short weighted-average lives and are currently cash-flowing, and, as such, are not significantly impacted by other assumptions, such as discount rates.
| (c) | Fair Values of Other Financial Instruments |
Fair value estimates for financial instruments not carried at fair value on our consolidated balance sheets are generally subjective in nature, and are made as of a specific point in time based on the characteristics of the financial instruments and relevant available market information. The fair value estimates for the financial instruments disclosed below does not necessarily incorporate the exit price concept used to record financial instruments at fair value on our consolidated balance sheet.
Cash and Cash Equivalents, Short-Term Investments, Restricted Cash and Restricted Funds Due to Clients
The carrying amount approximates fair value principally due to the short maturities of these instruments.
Mortgages
The fair value of the fixed-rate mortgage portfolio was determined by discounting the cash flows using rates obtained from a third party as of our consolidated balance sheet date. The fair value of the variable rate portfolio was determined by discounting the scheduled cash flows through the estimated maturity of the loans using the interest rates offered as of our consolidated balance sheet date that reflect the current interest rate inherent in the loans. This method of estimating fair value does not incorporate the exit price concept of fair value. Mortgage loans were classified within Level 3 of the fair value hierarchy.
Education Loans
The fair value of education loans was determined by discounting the scheduled cash flows through the estimated maturity of the loans using interest rates offered as of our consolidated balance sheet date that reflect the credit and interest rate risk inherent in the loans. The estimate of maturity was based on our historical repayment experience. Since the education loans held were principally variable rate, carrying value approximates fair value. This method of estimating fair value does not incorporate the exit price concept of fair value. Education loans were classified within Level 3 of the fair value hierarchy.
Time Deposits
The fair value of time deposits was determined by discounting the scheduled cash flows using the rates we offered as of our consolidated balance sheet date for deposits with similar remaining maturities or rates of our competitors. In determining our offering rates, we compare our rates on a continuous basis to other banks and competitors. As such, time-deposits were classified within Level 2 of the fair value hierarchy.
105
THE FIRST MARBLEHEAD CORPORATION AND SUBSIDIARIES
NOTES TO CONSOLIDATED FINANCIAL STATEMENTS (Continued)
June 30, 2013, 2012 and 2011
(11) Fair Value Measurements (Continued)
Savings, Checking and Money Market Deposits
The fair value of our savings, checking and money market deposits with no stated maturity, were equal to the amounts payable upon demand.
The following tables present the carrying amount, estimated fair value and placement in the fair value hierarchy for our financial instruments not measured at fair value on our consolidated balance sheets at June 30, 2013 and June 30, 2012:
| | | | | | | | | | | | | | | | | | | | |
June 30, 2013 | | Carrying
Amount | | | Estimated
Fair Value | | | Fair Value Measurements | |
| | | | Level 1 | | | Level 2 | | | Level 3 | |
| | | (dollars in thousands) | |
Financial Assets: | | | | | | | | | | | | | | | | | | | | |
Cash and cash equivalents | | $ | 81,910 | | | $ | 81,910 | | | $ | 81,910 | | | $ | — | | | $ | — | |
Short-term investments | | | 55,179 | | | | 55,179 | | | | 55,179 | | | | — | | | | — | |
Restricted cash | | | 87,338 | | | | 87,338 | | | | 87,338 | | | | — | | | | — | |
Mortgage loans, net of allowance | | | 12,629 | | | | 12,538 | | | | — | | | | — | | | | 12,538 | |
Educations loans, net of allowance | | | 62,996 | | | | 63,197 | | | | — | | | | — | | | | 63,197 | |
Financial liabilities: | | | | | | | | | | | | | | | | | | | | |
Time deposits | | $ | 38,922 | | | $ | 39,273 | | | $ | — | | | $ | 39,273 | | | $ | — | |
Savings, checking and money market deposits | | | 125,055 | | | | 125,055 | | | | 125,055 | | | | — | | | | — | |
Restricted funds due to clients | | | 86,994 | | | | 86,994 | | | | 86,994 | | | | — | | | | — | |
| | | | | | | | | | | | | | | | | | | | |
June 30, 2012 | | Carrying
Amount | | | Estimated
Fair Value | | | Fair Value Measurements | |
| | | | Level 1 | | | Level 2 | | | Level 3 | |
| | | (dollars in thousands) | |
Financial Assets: | | | | | | | | | | | | | | | | | | | | |
Cash and cash equivalents | | $ | 123,497 | | | $ | 123,497 | | | $ | 123,497 | | | $ | — | | | $ | — | |
Short-term investments | | | 85,007 | | | | 85,007 | | | | 85,007 | | | | — | | | | — | |
Restricted cash | | | 65,401 | | | | 65,401 | | | | 65,401 | | | | — | | | | — | |
Mortgage loans, net of allowance | | | 7,811 | | | | 7,811 | | | | — | | | | — | | | | 7,811 | |
Educations loans, net of allowance | | | 33,095 | | | | 33,280 | | | | — | | | | — | | | | 33,280 | |
Financial liabilities: | | | | | | | | | | | | | | | | | | | | |
Time deposits | | $ | 43,155 | | | $ | 43,248 | | | $ | — | | | $ | 43,248 | | | $ | — | |
Savings, checking and money market deposits | | | 40,273 | | | | 40,273 | | | | 40,273 | | | | — | | | | — | |
Restricted funds due to clients | | | 104,981 | | | | 104,981 | | | | 104,981 | | | | — | | | | — | |
(12) Goodwill and Intangible Assets
As a result of our acquisition of a substantial portion of the operating assets of the Cology Sellers in October 2012, we recorded a customer list intangible asset of $5.7 million for the approximately 250 credit union and other lender clients that the Cology Sellers did business with as of the acquisition date along with $518 thousand of goodwill. Our customer list intangible asset will be amortized over a 15-year period on a straight line basis. We expect amortization expense related to the Cology LLC intangible asset to be approximately $377 thousand per year. We expect amortization of the intangible asset and goodwill to be fully deductible for income tax purposes over a 15 year period. We recorded no goodwill or intangible asset impairment during fiscal 2013.
106
THE FIRST MARBLEHEAD CORPORATION AND SUBSIDIARIES
NOTES TO CONSOLIDATED FINANCIAL STATEMENTS (Continued)
June 30, 2013, 2012 and 2011
(12) Goodwill and Intangible Assets (Continued)
We completed our acquisition of TMS during fiscal 2011. We recorded goodwill of $22.2 million at the acquisition date. On June 30, 2011, TMS sold a portfolio of contracts with K-12 schools to Nelnet Business Solutions, Inc. in a transaction that eliminated a portion of goodwill by $2.6 million and decreased our customer list intangible asset by $4.1 million. As a result, $19.5 million of goodwill remained at June 30, 2013 and 2012 and the adjusted cost basis of our customer list intangible was $17.9 million. We recorded no goodwill or intangible asset impairment during fiscal 2013 or fiscal 2012.
| (c) | Impairment Review of Goodwill |
In fiscal 2013, we evaluated our goodwill for impairment on May 31, 2013, which is our annual impairment testing date, and concluded that the fair market value of the TMS and Cology LLC reporting units were in excess of our recorded book value and, therefore, were not impaired as of that date. In determining whether impairment exists, we assess impairment at the level of the TMS and Cology LLC reporting units. There have been no indicators of impairment since that date.
Intangible assets at June 30, 2013 include the following:
| | | | | | | | | | | | | | | | |
| | | Amortization
period | | | Adjusted cost
basis | | | Accumulated
amortization | | | Net | |
| | (in years) | | | (dollars in thousands) | |
Intangible assets: | | | | | | | | |
Customer list | | | 15 | | | $ | 23,600 | | | $ | (3,274 | ) | | $ | 20,326 | |
Technology | | | 6 | | | | 4,400 | | | | (2,158 | ) | | | 2,242 | |
Tradename | | | 15 | | | | 1,950 | | | | (325 | ) | | | 1,625 | |
| | | | | | | | | | | | | | | | |
Total intangible assets at June 30, 2013 | | | | | | $ | 29,950 | | | $ | (5,757 | ) | | $ | 24,193 | |
| | | | | | | | | | | | | | | | |
Amortization expense recorded for fiscal 2013 and fiscal 2012 was $2.4 million and $2.3 million, respectively.
Estimated annual amortization expense for each of the fiscal years subsequent to June 30, 2013 and thereafter is as follows:
| | | | | | | | | | | | | | | | |
| | | Customer list | | | Technology | | | Tradename | | | Total | |
| | | (dollars in thousands) | |
Estimated amortization expense: | | | | | | | | | | | | | | | | |
2014 | | $ | 1,573 | | | $ | 721 | | | $ | 130 | | | $ | 2,424 | |
2015 | | | 1,573 | | | | 608 | | | | 130 | | | | 2,311 | |
2016 | | | 1,573 | | | | 608 | | | | 130 | | | | 2,311 | |
2017 | | | 1,573 | | | | 305 | | | | 130 | | | | 2,008 | |
2018 | | | 1,573 | | | | — | | | | 130 | | | | 1,703 | |
Thereafter | | | 12,461 | | | | — | | | | 975 | | | | 13,436 | |
| | | | | | | | | | | | | | | | |
Total | | $ | 20,326 | | | $ | 2,242 | | | $ | 1,625 | | | $ | 24,193 | |
| | | | | | | | | | | | | | | | |
107
THE FIRST MARBLEHEAD CORPORATION AND SUBSIDIARIES
NOTES TO CONSOLIDATED FINANCIAL STATEMENTS (Continued)
June 30, 2013, 2012 and 2011
(13) Property and Equipment, Net
Property and equipment is recorded at cost less accumulated depreciation and amortization. We calculate depreciation and amortization for financial reporting purposes using the straight-line method over the estimated useful life of the asset.
| | | | | | | | | | |
| | | June 30, | | | |
| | | 2013 | | | 2012 | | | Useful life |
| | | (dollars in thousands) | | | |
Equipment | | $ | 13,289 | | | $ | 12,290 | | | 3 - 5 years |
Software | | | 40,053 | | | | 36,609 | | | 3 years |
Software under development | | | 332 | | | | 1,129 | | | |
Leasehold improvements | | | 11,844 | | | | 11,830 | | | lesser of 5 years or lease term |
Capital leases (equipment, furniture and fixtures) | | | 17,463 | | | | 17,463 | | | lesser of 3-5 years or lease term |
Furniture and fixtures | | | 2,710 | | | | 2,787 | | | 5 years |
| | | | | | | | | | |
| | | 85,691 | | | | 82,108 | | | |
Less accumulated depreciation and amortization | | | (79,515 | ) | | | (77,538 | ) | | |
| | | | | | | | | | |
Total property and equipment, net | | $ | 6,176 | | | $ | 4,570 | | | |
| | | | | | | | | | |
(14) Deposits
The following table summarizes our deposits held by Union Federal:
| | | | | | | | | | | | | | | | | | | | | | | | |
| | | June 30, | |
| | | 2013 | | | 2012 | |
| | | Year-end
amount | | | Annual
average
balance | | | Weighted-
average
rate | | | Year-end
amount | | | Annual
average
balance | | | Weighted-
average
rate | |
| | | (dollars in thousands) | |
Deposits: | | | | | | | | | | | | | | | | | | | | | | | | |
Time, savings and checking deposits | | $ | 43,525 | | | $ | 50,047 | | | | 1.03 | % | | $ | 49,046 | | | $ | 43,103 | | | | 0.95 | % |
Money market accounts | | | 120,452 | | | | 78,249 | | | | 0.98 | | | | 34,382 | | | | 27,668 | | | | 0.94 | |
| | | | | | | | | | | | | | | | | | | | | | | | |
| | $ | 163,977 | | | | | | | | | | | $ | 83,428 | | | | | | | | | |
| | | | | | | | | | | | | | | | | | | | | | | | |
At June 30, 2013 and 2012, time deposits with maturities greater than one year were $10.4 million and $7.5 million, respectively.
(15) Liabilities and Unused Lines of Credit
| (a) | Unused Lines of Credit |
At June 30, 2013, through Union Federal, we had $82.0 million available for borrowing under an unused line of credit with the Federal Home Loan Bank of Boston. There were no borrowings outstanding under this line of credit at June 30, 2013 or June 30, 2012.
| (b) | Amounts Due to Clients |
As part of our operations, we have cash that is recorded as restricted cash on our consolidated balance sheets because it is deposited with third party institutions and not available for our use. Included in restricted cash on
108
THE FIRST MARBLEHEAD CORPORATION AND SUBSIDIARIES
NOTES TO CONSOLIDATED FINANCIAL STATEMENTS (Continued)
June 30, 2013, 2012 and 2011
(15) Liabilities and Unused Lines of Credit (Continued)
our consolidated balance sheets are tuition payments due to schools, undisbursed loan origination proceeds and loan payments and recoveries on defaulted education loans. We record a liability on our consolidated balance sheets representing tuition payments due to our TMS clients, loan origination proceeds and loan payments due to our Cology LLC clients and recoveries on defaulted education loans and education loan proceeds due to schools.
(16) Commitments and Contingencies
Internal Revenue Service Audit
Effective March 31, 2009, we completed the sale of the trust certificate of NC Residuals Owners Trust (the Trust Certificate). In connection with the sale of the Trust Certificate, FMD entered into an asset services agreement (the Asset Services Agreement) pursuant to which FMD provided various consulting and advisory services to the purchaser of the Trust Certificate. As a result of the sale of the Trust Certificate, as well as our operating losses incurred in fiscal 2009, we recorded an income tax receivable for federal income taxes paid on taxable income in prior fiscal years. In fiscal 2010, we received a total of $189.3 million in federal and state income tax refunds related to our income tax receivables. In April 2010, the Internal Revenue Service (IRS) commenced an audit of our tax returns for fiscal 2007 through fiscal 2009, including a review of the tax treatment of the sale of the Trust Certificate. Such audits are consistent with the practice of the Joint Committee of Taxation, which requires the IRS to perform additional procedures, up to and including an audit of a taxpayer who receives a tax refund in excess of $2.0 million. The IRS is also auditing our fiscal 2010 tax return in light of the $45.1 million income tax refund that we received in October 2010. We cannot predict the timing or the outcome of the IRS audit.
We announced on August 15, 2013 that, as part of the audit process, we expected to receive a Notice of Proposed Adjustment (NOPA) from the IRS. On September 10, 2013 we received two NOPAs from the IRS that contain the proposed adjustments that we announced on August 15, 2013. In the NOPAs, the IRS asserts that our sale of the Trust Certificate should not be recognized for federal income tax purposes primarily because we retained the economic benefits and burdens of the Trust Certificate, including, among other things, retaining certain repurchase rights and data rights. The IRS further concludes that the transaction should be characterized as a financing instead of a sale and asserts that the sale of the Trust Certificate and the execution of the Asset Services Agreement had the impact of converting taxable income to the owner from an accrual basis to a cash basis. As a result, the NOPAs propose to disallow the loss that generated the tax refunds that we previously received as well as require us to include income from the Trust Certificate from the March 31, 2009 sale date through June 30, 2011 in our taxable income for such years. If the IRS’ positions are successful, the disallowance of the loss, coupled with the additional taxable income after the sale date through June 30, 2011, would create federal income tax adjustments that we estimate to be approximately $300.0 million plus interest, with the interest continuing to accrue until the matter is resolved. The NOPAs do not address tax years beyond June 30, 2011.
The ongoing IRS audit or any other investigation, audit, appeals proceeding or suit relating to the sale of the Trust Certificate could result in substantial costs. A state taxing authority could also challenge our tax position in connection with the transactions, notwithstanding our receipt of any income tax refund.
The determination of whether or not to accrue a liability, if any, requires a significant amount of judgment and entails by necessity, the need to incorporate estimates. We have considered the requirements of ASC 740, the impact of the NOPAs, along with other information supporting our overall tax position, in our assessment of the ultimate outcome of this matter with the IRS, and based on our analysis, we did not record an accrual related to
109
THE FIRST MARBLEHEAD CORPORATION AND SUBSIDIARIES
NOTES TO CONSOLIDATED FINANCIAL STATEMENTS (Continued)
June 30, 2013, 2012 and 2011
(16) Commitments and Contingencies (Continued)
this matter in our consolidated financial statements at June 30, 2013 or when we received the NOPAs. Such an accrual, if it becomes necessary, could be significant and material to our consolidated financial statements.
Massachusetts Appellate Tax Board Matters
We are involved in several matters relating to the Massachusetts tax treatment of GATE Holdings, Inc. (GATE), a former subsidiary of FMD. We took the position in proceedings before the Massachusetts Appellate Tax Board (ATB) that GATE was properly taxable as a financial institution and not as a business corporation and was entitled to apportion its income under applicable provisions of Massachusetts tax law. The Massachusetts Commissioner of Revenue (Commissioner) took alternative positions: that GATE was properly taxable as a business corporation, or that GATE was taxable as a financial institution, but was not entitled to apportionment or was subject to 100% Massachusetts apportionment. In September 2007, we filed a petition with the ATB seeking a refund of state taxes paid for our taxable year ended June 30, 2004, all of which taxes had previously been paid as if GATE were a business corporation. In December 2009, the Commissioner made additional assessments of taxes, along with accrued interest, of approximately $11.9 million for GATE’s taxable years ended June 30, 2004, 2005 and 2006, and approximately $8.1 million for our taxable years ended June 30, 2005 and 2006. For the 2005 and 2006 taxable years, only one of the two assessments made by the Commissioner would ultimately be allowed. In March 2010, we filed petitions with the ATB contesting the additional assessments against GATE and us. In April 2011, the ATB held an evidentiary hearing on the foregoing, and the parties filed their final briefs in September 2011. On November 9, 2011, the ATB issued an order (ATB Order) regarding these proceedings. The ATB Order reflected the following rulings and findings:
| | • | | GATE was properly taxable as a financial institution, rather than a business corporation, for each of the tax years at issue; |
| | • | | GATE was entitled to apportion its income under applicable provisions of Massachusetts tax law for each of the tax years at issue; |
| | • | | GATE properly calculated one of the two applicable apportionment factors used to calculate GATE’s financial institution excise tax; |
| | • | | GATE incorrectly calculated the other apportionment factor, which we refer to as the Property Factor, by excluding all income from trust-owned education loans outside of Massachusetts rather than including such income for the purposes of GATE’s Massachusetts state tax returns; and |
| | • | | All penalties assessed to FMD and GATE were abated. |
In connection with the ATB Order, as well as the expiration of the statute of limitations applicable to GATE’s taxable year ended June 30, 2007, we recognized an income tax benefit of $12.5 million during the second quarter of fiscal 2012. In the third quarter of fiscal 2012, we made a $5.1 million payment that satisfied our obligation to the Massachusetts Department of Revenue for GATE’s taxable years ended June 30, 2004, 2005 and 2006.
On April 17, 2013, the ATB issued its opinion confirming the rulings and findings included in the ATB Order (the ATB Opinion). We had argued that the loan servicers’ activities, which were conducted outside of Massachusetts on behalf of the trusts, determined the location of the loans for purposes of the Property Factor. The ATB disagreed and determined that the loan servicers’ activities should not be attributed to GATE and further determined that, for purposes of the Property Factor, the trust-owned education loans were located in Massachusetts, GATE’s commercial domicile.
110
THE FIRST MARBLEHEAD CORPORATION AND SUBSIDIARIES
NOTES TO CONSOLIDATED FINANCIAL STATEMENTS (Continued)
June 30, 2013, 2012 and 2011
(16) Commitments and Contingencies (Continued)
On July 22, 2013, we filed an appeal of the ATB’s findings with regard to the Property Factor in the Massachusetts Appeals Court. The Commissioner has decided not to appeal the ATB’s other findings. If we are unsuccessful in an appeal of the ATB Order, we could be required to make additional tax payments, including interest, for GATE’s taxable years ended June 30, 2008 and 2009, which could materially adversely affect our liquidity position. We have accrued a total of $25.2 million, including interest, at June 30, 2013 related to the 2008 and 2009 tax returns for GATE, which amount was included in income taxes payable on our consolidated balance sheet. On June 29, 2013, the Massachusetts Department of Revenue delivered a notice of intent to assess for our taxable years ended June 30, 2008 and June 30, 2009. This assessment included approximately $822 thousand of additional tax liability and an assessment for penalties of $4.1 million. We have accrued for the additional tax liability, including interest, as of June 30, 2013 but have not accrued for the penalties as we believe that it is more likely than not that the penalties will ultimately be abated, which is consistent with the treatment of our taxable years ended June 30, 2004, 2005 and 2006. We cannot predict the outcome of this matter or the timing of such payments, if any, at this time.
| (b) | Indemnifications—Sale of FMDS |
In connection with the sale of FMDS, we have agreed to indemnify the buyer for breaches of representations, warranties and covenants, subject to certain terms, conditions and exceptions.
The buyer’s rights to indemnification with respect to breaches of certain of our representations and warranties in the purchase agreement (the Non-Fundamental Representations) are subject to:
| | • | | An aggregate deductible of $1.0 million (the Deductible); |
| | • | | An aggregate cap of $2.0 million (the Non-Fundamental Cap); and |
| | • | | A survival limitation requiring the buyer to assert claims within 18 months after the closing date of March 2, 2012 (the Survival Limitation). |
With respect to breaches of Non-Fundamental Representations, the buyer would be entitled to indemnification if its aggregate indemnifiable losses were to exceed the Deductible. In that event, the buyer would be entitled to indemnification to the extent that its losses exceeded $750 thousand, up to the Non-Fundamental Cap; provided, however, that if the Non-Fundamental Cap were reached and the buyer were to have suffered additional indemnifiable losses solely as a result of a breach of our representations and warranties with regard to legal compliance, the buyer would be entitled to recover up to an additional $2.0 million in the aggregate.
The buyer’s rights to indemnification with respect to breaches of our other representations and warranties in the purchase agreement (the Fundamental Representations) are not subject to the Deductible or the Survival Limitation and are subject to a cap equal to the purchase price minus the aggregate amount paid by us in connection with breaches of Non-Fundamental Representations. We refer to this cap as the Fundamental Cap. The Fundamental Representations include representations and warranties by FMD with regard to its organization, its authorization of the transaction, the absence of broker’s fees and its ownership of the shares of capital stock of FMDS. The Fundamental Representations also include representations and warranties by FMD with regard to FMDS’ organization, qualification and corporate power, FMDS’ capitalization, the absence of broker’s fees, the absence of subsidiaries and certain tax matters.
The buyer’s rights to indemnification would not be subject to the Deductible, the Non-Fundamental Cap, the Fundamental Cap or the Survival Limitation in the case of any breach or nonperformance by us or any of our
111
THE FIRST MARBLEHEAD CORPORATION AND SUBSIDIARIES
NOTES TO CONSOLIDATED FINANCIAL STATEMENTS (Continued)
June 30, 2013, 2012 and 2011
(16) Commitments and Contingencies (Continued)
covenants or obligations set forth in the purchase agreement. In addition, we have agreed to provide a separate, unconditional indemnity with regard to tax matters related to FMDS arising prior to the closing date, including the audit currently being conducted by the IRS, as discussed above. This special indemnity is not subject to the Deductible, the Non-Fundamental Cap, the Fundamental Cap or the Survival Limitation. Finally, we have agreed to indemnify and defend the buyer from certain other specified matters. The buyer’s rights to such indemnification would be initially capped at the purchase price, and the applicable cap would then decrease over time. We believe that at the time of the sale of FMDS and at June 30, 2013, the likelihood of making any payment under these indemnifications was remote. As such, the fair value of any such liability for the indemnifications would, therefore, also be immaterial to our consolidated financial statements.
In connection with Union Federal’s sale of an education loan portfolio in October 2009, FMD delivered a performance guaranty pursuant to which FMD guarantees the performance by Union Federal of its obligations and agreements, including its indemnification or loan repurchase obligations, under the loan purchase and sale agreement relating to the transaction. We were not aware of any contingencies existing at June 30, 2013 that were both probable and estimable for which we would record a reserve, nor can we estimate a range of possible losses at this time.
| (d) | Indemnifications—Union Federal |
In April 2010, FMD and certain of its subsidiaries entered into agreements relating to the restructuring of the education loan warehouse facility of FMD’s indirect subsidiary, UFSB-SPV. In connection with the restructuring, FMD agreed, among other things, to provide a separate indemnity for third-party claims by or on behalf of borrowers against the third-party conduit lender based on loan origination errors under the facility. We were not aware of any contingencies existing at our consolidated balance sheet date that were both probable and estimable for which we would record a reserve, nor can we estimate a range of possible losses at this time.
We lease office space and equipment under non-cancelable operating leases expiring at various times through November 2017. Rent expense under operating leases for fiscal 2013, fiscal 2012 and fiscal 2011 was approximately $4.4 million, $3.3 million and $5.6 million, respectively.
The future minimum office space lease payments required under operating leases for each of the five fiscal years subsequent to June 30, 2013 and thereafter are as follows:
| | | | |
Fiscal years ending June 30, | | Lease obligations | |
| | | (dollars in thousands) | |
2014 | | $ | 8,848 | |
2015 | | | 3,033 | |
2016 | | | 2,303 | |
2017 | | | 1,704 | |
2018 and thereafter | | | 50 | |
| | | | |
Total minimum lease payments | | $ | 15,938 | |
| | | | |
We are entitled to receive $3.5 million under non-cancelable subleases of office space in fiscal 2014.
112
THE FIRST MARBLEHEAD CORPORATION AND SUBSIDIARIES
NOTES TO CONSOLIDATED FINANCIAL STATEMENTS (Continued)
June 30, 2013, 2012 and 2011
(17) Net Interest Income
The following table reflects the components of net interest income:
| | | | | | | | | | | | |
| | | Fiscal years ended June 30, | |
| | | 2013 | | | 2012 | | | 2011 | |
| | | (dollars in thousands) | |
Interest income: | | | | | | | | | | | | |
Cash and cash equivalents | | $ | 186 | | | $ | 257 | | | $ | 551 | |
Short-term investments and federal funds sold | | | 337 | | | | 290 | | | | 269 | |
Restricted cash | | | 38 | | | | 482 | | | | 133 | |
Investments available-for-sale | | | 1,483 | | | | 844 | | | | 181 | |
Education loans held-to-maturity | | | 3,216 | | | | 1,109 | | | | 288 | |
Mortgage loans held-to-maturity | | | 425 | | | | 308 | | | | 355 | |
| | | | | | | | | | | | |
Total interest income | | | 5,685 | | | | 3,290 | | | | 1,777 | |
Interest expense: | | | | | | | | | | | | |
Time and savings account deposits | | | 528 | | | | 408 | | | | 468 | |
Money market account deposits | | | 769 | | | | 257 | | | | 150 | |
Other interest-bearing liabilities | | | 125 | | | | 250 | | | | 419 | |
| | | | | | | | | | | | |
Total interest expense | | | 1,422 | | | | 915 | | | | 1,037 | |
| | | | | | | | | | | | |
Net interest income | | $ | 4,263 | | | $ | 2,375 | | | $ | 740 | |
| | | | | | | | | | | | |
(18) General and Administrative Expenses
The following table reflects the components of general and administrative expenses:
| | | | | | | | | | | | |
| | | Fiscal years ended June 30, | |
| | | 2013 | | | 2012 | | | 2011 | |
| | | (dollars in thousands) | |
General and administrative expenses: | | | | | | | | | | | | |
Third-party services | | $ | 15,212 | | | $ | 16,393 | | | $ | 16,461 | |
Depreciation and amortization | | | 4,347 | | | | 4,766 | | | | 8,253 | |
Marketing | | | 5,273 | | | | 8,433 | | | | 1,004 | |
Occupancy and equipment | | | 11,757 | | | | 11,272 | | | | 11,759 | |
Servicer fees | | | 761 | | | | 738 | | | | 661 | |
Merchant fees | | | 6,663 | | | | 6,467 | | | | 2,640 | |
Trust related special servicing expenses | | | 1,639 | | | | 5,920 | | | | 7,898 | |
Other | | | 7,930 | | | | 7,112 | | | | 7,464 | |
| | | | | | | | | | | | |
Total | | $ | 53,582 | | | $ | 61,101 | | | $ | 56,140 | |
| | | | | | | | | | | | |
Included in other expenses in fiscal 2013, fiscal 2012 and fiscal 2011 were fees of $1.2 million, $1.3 million and $1.1 million, respectively, paid to Sextant Holdings, LLC (Sextant) under a time-sharing agreement for business-related use of a private aircraft. Under the time sharing agreement, the fees may not exceed the actual expense of each specific flight as authorized by federal aviation regulations. In addition to the time sharing agreement, in fiscal 2012, the FMD Board of Directors approved 75 hours of flight time for personal flight reimbursement each fiscal year. The reimbursement for personal travel time was $400 thousand for fiscal 2013 and $507 thousand for fiscal 2012 and were included in compensation and benefits. The sole manager and member of Sextant is Daniel Meyers, our Chairman of the Board and Chief Executive Officer.
113
THE FIRST MARBLEHEAD CORPORATION AND SUBSIDIARIES
NOTES TO CONSOLIDATED FINANCIAL STATEMENTS (Continued)
June 30, 2013, 2012 and 2011
(19) Other Income
TERI was a private, not-for-profit Massachusetts organization. In its role as guarantor in the education lending market, TERI previously agreed to reimburse many of the securitization trusts we facilitated for unpaid principal and interest on defaulted education loans. In April 2008, TERI filed a voluntary petition for relief under Chapter 11 of the U.S. Bankruptcy Code (the TERI Reorganization). As a result of the TERI Reorganization, the securitization trusts facilitated by us have not been able to fully realize TERI’s guarantee obligations. Under TERI’s confirmed plan of reorganization, which became effective in November 2010, general unsecured creditors of TERI, including us, are entitled to receive a pro rata share of cash and future recoveries or other proceeds in respect of a portfolio of defaulted education loans held by a liquidating trust. In addition, FMD and certain subsidiaries entered into a stipulation with TERI and the Official Committee of Unsecured Creditors of TERI that became effective in October 2010 that resolved all claims and controversies among the parties to the agreement.
The proceeds from the TERI settlement represented gains from the forgiveness of notes payable and other liabilities, cash distributions from the liquidating trustee and the transfer of assets to us in excess of our recorded receivables.
During fiscal 2012, we also recorded income of $9.5 million related to the deconsolidation of the securitization trusts previously consolidated, largely relating to the fair value of the residual interests that were previously eliminated upon our adoption of ASU 2009-17 on July 1, 2010.
During fiscal 2013, we recorded income of $946 thousand related to the sale of a defaulted loan portfolio, which was transferred by Union Federal to an indirect subsidiary of FMD in 2009.
| | | | | | | | | | | | |
| | | Fiscal years ended June 30, | |
| | | 2013 | | | 2012 | | | 2011 | |
| | | (dollars in thousands) | |
Gain from deconsolidation of trusts | | $ | — | | | $ | 9,514 | | | $ | — | |
Proceeds from TERI settlement | | | 702 | | | | 1,685 | | | | 8,112 | |
Other | | | 946 | | | | — | | | | — | |
| | | | | | | | | | | | |
Total other income | | $ | 1,648 | | | $ | 11,199 | | | $ | 8,112 | |
| | | | | | | | | | | | |
(20) Income Taxes
We are subject to federal income tax, as well as income tax in multiple U.S. state and local jurisdictions. Our effective income tax rate is calculated on a consolidated basis. The IRS is auditing our tax returns for fiscal 2007 through fiscal 2010. We also remain subject to federal income tax examinations for fiscal 2011 through fiscal 2013. In addition, we are involved in several matters relating to the Massachusetts tax treatment of GATE, a former subsidiary of FMD. See Note 16, “Commitments and Contingencies—Income Tax Matters,” for additional information regarding these matters.
Our state income tax returns in jurisdictions other than Massachusetts remain subject to examination for various fiscal years ending between June 30, 2009 and June 30, 2013.
114
THE FIRST MARBLEHEAD CORPORATION AND SUBSIDIARIES
NOTES TO CONSOLIDATED FINANCIAL STATEMENTS (Continued)
June 30, 2013, 2012 and 2011
(20) Income Taxes (Continued)
The following table reflects components of income tax expense (benefit) attributable to loss from continuing operations before income taxes:
| | | | | | | | | | | | |
| | | Fiscal years ended June 30, | |
| | | 2013 | | | 2012 | | | 2011 | |
| | | (dollars in thousands) | |
Current: | | | | |
Federal | | $ | — | | | $ | (5,527 | ) | | $ | — | |
State | | | 1,968 | | | | (12,458 | ) | | | 854 | |
| | | | | | | | | | | | |
Total current tax expense (benefit) | | | 1,968 | | | | (17,985 | ) | | | 854 | |
Deferred: | | | | | | | | | | | | |
Federal | | | 431 | | | | 922 | | | | 348 | |
State | | | (103 | ) | | | (892 | ) | | | (994 | ) |
| | | | | | | | | | | | |
Total deferred tax expense (benefit) | | | 328 | | | | 30 | | | | (646 | ) |
| | | | | | | | | | | | |
Income tax expense (benefit) from continuing operations | | $ | 2,296 | | | $ | (17,955 | ) | | $ | 208 | |
| | | | | | | | | | | | |
The following table reconciles the expected federal income tax expense (benefit) (computed by applying the federal statutory tax rate to income (loss) before taxes) from continuing operations to recorded income tax expense (benefit):
| | | | | | | | | | | | |
| | | Fiscal years ended June 30, | |
| | | 2013 | | | 2012 | | | 2011 | |
| | | (dollars in thousands) | |
Computed federal tax benefit | | $ | (16,765 | ) | | $ | (18,042 | ) | | $ | (29,325 | ) |
State tax, net of federal benefit | | | 1,212 | | | | (8,678 | ) | | | 2,888 | |
Federal valuation allowance | | | 17,068 | | | | 7,709 | | | | 25,882 | |
Non-deductible compensation | | | 661 | | | | 919 | | | | 912 | |
Other, net | | | 120 | | | | 137 | | | | (149 | ) |
| | | | | | | | | | | | |
Income tax expense (benefit) from continuing operations | | $ | 2,296 | | | $ | (17,955 | ) | | $ | 208 | |
| | | | | | | | | | | | |
115
THE FIRST MARBLEHEAD CORPORATION AND SUBSIDIARIES
NOTES TO CONSOLIDATED FINANCIAL STATEMENTS (Continued)
June 30, 2013, 2012 and 2011
(20) Income Taxes (Continued)
The following table reflects the tax effects of temporary differences between financial statement carrying amounts of existing assets and liabilities and their respective tax bases that give rise to significant deferred tax assets and deferred tax liabilities:
| | | | | | | | |
| | | June 30, | |
| | | 2013 | | | 2012 | |
| | | (dollars in thousands) | |
Deferred tax assets: | | | | |
Net operating loss carryforwards | | $ | 44,970 | | | $ | 28,008 | |
Federal benefit of unrecognized tax benefits | | | 8,833 | | | | 8,149 | |
Depreciation and amortization | | | 4,440 | | | | 5,778 | |
Allowance for loan losses | | | 5,631 | | | | 4,591 | |
Amortization of deferred costs | | | 3,058 | | | | 3,636 | |
Other, net | | | 7,435 | | | | 6,772 | |
| | | | | | | | |
Gross deferred tax assets | | | 74,367 | | | | 56,934 | |
Valuation allowance | | | (66,363 | ) | | | (48,702 | ) |
| | | | | | | | |
Total net deferred tax asset | | | 8,004 | | | | 8,232 | |
Deferred tax liabilities: | | | | | | | | |
Additional structural advisory fees | | | (833 | ) | | | (1,261 | ) |
Residual fees | | | (5,230 | ) | | | (4,486 | ) |
Other, net | | | (3,130 | ) | | | (3,346 | ) |
| | | | | | | | |
Total deferred tax liability | | | (9,193 | ) | | | (9,093 | ) |
| | | | | | | | |
Net deferred tax liability | | $ | (1,189 | ) | | $ | (861 | ) |
| | | | | | | | |
Under current law, we do not have remaining taxes paid within available net operating loss carryback periods, and it is more likely than not that our deferred tax assets will not be fully realized through future reversals of existing temporary differences or available tax planning strategies. Accordingly, we have determined that a valuation allowance was necessary for all of our deferred tax assets not scheduled to reverse against existing deferred tax liabilities as of June 30, 2013 and June 30, 2012. We will continue to review the recognition of deferred tax assets on a quarterly basis.
116
THE FIRST MARBLEHEAD CORPORATION AND SUBSIDIARIES
NOTES TO CONSOLIDATED FINANCIAL STATEMENTS (Continued)
June 30, 2013, 2012 and 2011
(20) Income Taxes (Continued)
Unrecognized Tax Benefits
A reconciliation of the beginning and ending amount of unrecognized tax benefits is as follows:
| | | | | | | | | | | | |
| | | Fiscal years ended June 30, | |
| | | 2013 | | | 2012 | | | 2011 | |
| | | (dollars in thousands) | |
Beginning unrecognized tax benefits | | $ | 19,630 | | | $ | 30,936 | | | $ | 30,936 | |
Reduction as a result of ATB Order and expiration of statute of limitations | | | — | | | | (11,306 | ) | | | — | |
Additional state tax liability recognized for the 2008 and 2009 tax years | | | 822 | | | | — | | | | — | |
| | | | | | | | | | | | |
Ending unrecognized tax benefits | | $ | 20,452 | | | $ | 19,630 | | | $ | 30,936 | |
| | | | | | | | | | | | |
Beginning accrued interest | | $ | 3,451 | | | $ | 8,375 | | | $ | 5,771 | |
Reduction as a result of ATB Order and expiration of statute of limitations | | | — | | | | (6,281 | ) | | | — | |
Interest expense recognized | | | 1,336 | | | | 1,357 | | | | 2,604 | |
| | | | | | | | | | | | |
Ending accrued interest | | $ | 4,787 | | | $ | 3,451 | | | $ | 8,375 | |
| | | | | | | | | | | | |
The ending balance at June 30, 2013, 2012, and 2011 if recognized would favorably affect our effective income tax rate. We recognize interest and penalties in income tax expense when incurred.
117
THE FIRST MARBLEHEAD CORPORATION AND SUBSIDIARIES
NOTES TO CONSOLIDATED FINANCIAL STATEMENTS (Continued)
June 30, 2013, 2012 and 2011
(21) Net (Loss) Income per Share
The following table sets forth the computation of basic and diluted net (loss) income per share of common stock:
| | | | | | | | | | | | |
| | | Fiscal years ended June 30, | |
| | | 2013 | | | 2012 | | | 2011 | |
| | | (dollars and shares in thousands, except per
share amounts) | |
Loss from continuing operations | | $ | (50,197 | ) | | $ | (33,593 | ) | | $ | (83,994 | ) |
Less: Loss allocated to participating securities | | | — | | | | (2,691 | ) | | | — | |
| | | | | | | | | | | | |
Loss from continuing operations allocated to common shares outstanding | | $ | (50,197 | ) | | $ | (30,902 | ) | | $ | (83,994 | ) |
| | | | | | | | | | | | |
Income (loss) from discontinued operations, net of taxes | | $ | — | | | $ | 1,135,821 | | | $ | (137,567 | ) |
Less: Earnings allocated to participating securities | | | — | | | | 90,999 | | | | — | |
| | | | | | | | | | | | |
Income (loss) from discontinued operations allocated to common shares outstanding | | | — | | | $ | 1,044,822 | | | $ | (137,567 | ) |
| | | | | | | | | | | | |
Net (loss) income per basic common share: | | | | | | | | | | | | |
From continuing operations | | $ | (0.47 | ) | | $ | (0.30 | ) | | $ | (0.83 | ) |
From discontinued operations | | | — | | | | 10.28 | | | | (1.37 | ) |
| | | | | | | | | | | | |
Total basic net (loss) income per common share | | $ | (0.47 | ) | | $ | 9.98 | | | $ | (2.20 | ) |
| | | | | | | | | | | | |
Net (loss) income per diluted common share: | | | | | | | | | | | | |
From continuing operations | | $ | (0.47 | ) | | $ | (0.30 | ) | | $ | (0.83 | ) |
From discontinued operations | | | — | | | | 10.26 | | | | (1.37 | ) |
| | | | | | | | | | | | |
Total diluted net (loss) income per common share | | $ | (0.47 | ) | | $ | 9.96 | | | $ | (2.20 | ) |
| | | | | | | | | | | | |
Weighted-average common shares outstanding: | | | | | | | | | | | | |
Basic | | | 107,346 | | | | 101,575 | | | | 100,919 | |
Diluted | | | 107,346 | | | | 110,667 | | | | 100,919 | |
Anti-dilutive common stock equivalents | | | 138 | | | | — | | | | 8,940 | |
For the periods in which a net loss was incurred, common stock equivalents are considered anti-dilutive, and, therefore, are excluded from diluted weighted-average shares outstanding. Common stock equivalents include RSUs, stock options and, for fiscal 2011 and fiscal 2012, include Series B Non-Voting Convertible Preferred Stock, $0.01 par value per share (Series B Preferred Stock). For the stock options outstanding, the conversion or exercise price exceeds fair market value at the reporting date.
(22) Stockholders’ Equity
In December 2007, FMD entered into an investment agreement with GS Parthenon A, L.P. and GS Parthenon B, L.P., affiliates of GS Capital Partners (the Purchasers). Pursuant to the investment agreement, FMD
118
THE FIRST MARBLEHEAD CORPORATION AND SUBSIDIARIES
NOTES TO CONSOLIDATED FINANCIAL STATEMENTS (Continued)
June 30, 2013, 2012 and 2011
(22) Stockholders’ Equity (Continued)
issued 132,701 shares of Series B Preferred Stock at a purchase price of $1 thousand per share. The Series B Preferred Stock was automatically convertible into FMD’s common stock upon the sale or transfer by any holder of the Series B Preferred Stock to any party other than an affiliate of such holder. The number of common shares issuable upon conversion was equal to the initial purchase price of the Series B Preferred Stock, divided by the conversion price of $15.00 per share. On November 30, 2012, the Purchasers entered into a purchase agreement with a third party to sell, in a private transaction, all 132,701 shares of Series B Preferred Stock then outstanding. On December 4, 2012, the transaction was settled and the Series B Preferred Stock was converted into 8,846,733 shares of FMD’s common stock and was issued to the third-party purchaser. Following this transaction, there are no longer any shares of Series B Preferred Stock outstanding.
| (b) | 2003 Employee Stock Purchase Plan |
In 2003, the FMD Board of Directors and stockholders approved the 2003 employee stock purchase plan (ESPP). A total of 600,000 shares of common stock were authorized for issuance under the ESPP. The ESPP permitted eligible employees to purchase shares of FMD’s common stock at the lower of 85% of its fair market value at the beginning or at the end of each offering period. Participation was voluntary. In April 2008, the FMD Board of Directors, which administers the ESPP, terminated the offering period that began on January 1, 2008 and indefinitely suspended the ESPP. As a result, no shares were issued under the ESPP in fiscal 2013, fiscal 2012 or fiscal 2011. At June 30, 2013, 405,554 shares were available for future purchase under the ESPP.
Treasury stock was $187.2 million (8,965,445 shares) and $186.8 million (8,655,846 shares) at June 30, 2013 and June 30, 2012, respectively. The increase in shares was a result of common stock withheld from employees to satisfy statutory minimum withholding obligations as equity compensation awards vest.
(23) Stock-Based Compensation
Stock-based compensation expense was $4.2 million, $4.6 million and $4.8 million for fiscal 2013, fiscal 2012 and fiscal 2011, respectively. As of June 30, 2013, there was $6.7 million of total unrecognized compensation cost related to non-vested share-based compensation arrangements. That cost is expected to be recognized over a weighted-average period of approximately two years.
| (a) | Stockholder Approved Plans |
We have stock awards outstanding under three stock-based incentive compensation plans, each approved by both the FMD Board of Directors and stockholders in 2002 (2002 Plan), 2003 (2003 Plan) and 2011 (2011 Plan).
Under the 2002 Plan, we granted non-statutory stock options to non-employee members of the FMD Board of Directors. In 2006, the FMD Board of Directors suspended new awards under the 2002 Plan. As of June 30, 2013, 66,000 shares of common stock were issuable upon exercise of awards granted under the 2002 Plan.
Under the 2003 Plan, we granted stock based awards to employees, directors and consultants. No further awards may be granted under the 2003 Plan following the stockholder approval of the 2011 Plan in November 2011; however, 896,209 shares of common stock were issuable upon the vesting of awards granted under the 2003 Plan as of June 30, 2013.
Under the 2011 Plan, the FMD Board of Directors, or one or more sub-committees of the FMD Board of Directors, may grant options, restricted stock, RSUs, other stock based awards or performance awards to employees, directors, consultants or advisors. As of June 30, 2013, 6,662,515 shares were available for future
119
THE FIRST MARBLEHEAD CORPORATION AND SUBSIDIARIES
NOTES TO CONSOLIDATED FINANCIAL STATEMENTS (Continued)
June 30, 2013, 2012 and 2011
(23) Stock-Based Compensation (Continued)
grant under the 2011 Plan and 2,095,000 shares of common stock were issuable upon the vesting of awards granted under the 2011 Plan. We typically issue new shares of common stock as opposed to using treasury shares.
The following table summarizes information about stock options outstanding at June 30, 2013:
| | | | | | | | | | | | | | | | |
Exercise prices | | Number
outstanding | | | Weighted-average
remaining
contractual term | | | Weighted-average
exercise price | | | Number
exercisable | |
| | | (shares in thousands) | |
$6.00(1) | | | 2,000 | | | | 5.06 | | | $ | 6.00 | | | | 2,000 | |
$8.10 - $10.00 | | | 24 | | | | 0.19 | | | | 8.58 | | | | 24 | |
$12.00(1) | | | 2,000 | | | | 5.06 | | | | 12.00 | | | | 2,000 | |
$16.00(1) | | | 2,000 | | | | 5.06 | | | | 16.00 | | | | 2,000 | |
$19.04 | | | 18 | | | | 2.22 | | | | 19.04 | | | | 18 | |
$32.97 | | | 24 | | | | 1.22 | | | | 32.97 | | | | 24 | |
| | | | | | | | | | | | | | | | |
$6.00 - $32.97 | | | 6,066 | | | | 4.99 | | | | 11.43 | | | | 6,066 | |
| | | | | | | | | | | | | | | | |
| (1) | These options were not issued under any of our existing stockholder-approved incentive plans. The FMD Board of Directors elected Daniel Meyers as President and Chief Executive Officer and as a member of the FMD Board of Directors, effective September 1, 2008. In connection with the election, the FMD Board of Directors and a subcommittee of the Compensation Committee of the FMD Board of Directors approved the grant in August 2008 (Grant Date) of stock options to Mr. Meyers to purchase (a) 2,000,000 shares of our common stock, at an exercise price of $6.00 per share, that vested and became exercisable in full on August 18, 2012; (b) 2,000,000 shares of our common stock, at an exercise price of $12.00 per share, that vested and became exercisable in full on November 30, 2008 and (c) 2,000,000 shares of our common stock, at an exercise price of $16.00 per share, that vested and became exercisable in full on November 30, 2008. Each of the stock options will expire ten years from the Grant Date. |
The options exercisable at June 30, 2013 have no intrinsic value as the exercise prices are above market price. The weighted-average remaining contractual term of options exercisable is approximately five years. Options expire a maximum of ten years from the grant date.
120
THE FIRST MARBLEHEAD CORPORATION AND SUBSIDIARIES
NOTES TO CONSOLIDATED FINANCIAL STATEMENTS (Continued)
June 30, 2013, 2012 and 2011
(23) Stock-Based Compensation (Continued)
The following table presents stock option activity for fiscal 2013, fiscal 2012 and fiscal 2011:
| | | | | | | | |
| | | Number
of options | | | Weighted-
average exercise
price per share | |
| | | (shares in thousands) | |
Outstanding options at June 30, 2010 | | | 6,103 | | | | 11.43 | |
Exercised | | | — | | | | — | |
| | | | | | | | |
Outstanding options at June 30, 2011 | | | 6,103 | | | | 11.43 | |
Exercised | | | — | | | | — | |
| | | | | | | | |
Outstanding options at June 30, 2012 | | | 6,103 | | | | 11.43 | |
Forfeited | | | (18 | ) | | | 20.04 | |
Expired | | | (19 | ) | | | 3.33 | |
| | | | | | | | |
Outstanding options at June 30, 2013 | | | 6,066 | | | | 11.43 | |
| | | | | | | | |
Each stock unit, including both RSUs and director stock units, represents a contingent right to receive one share of our common stock upon vesting. Shares in respect of vested stock units are issued as soon as practicable after each vesting date.
Pursuant to a directors’ compensation program formerly under the 2003 Plan and now under the 2011 Plan, our non-employee directors are entitled to stock units for their service. Stock units granted to non-employee directors are fully vested upon grant. In May 2010, the director compensation program was amended to provide for the grant of 10,000 stock units upon initial election to the FMD Board of Directors and an annual grant of 10,000 stock units on September 20 of each year, if the non-employee director has then served on the FMD Board of Directors for at least 180 days. During fiscal 2013, fiscal 2012 and fiscal 2011, 60,000 stock units, 70,000 stock units and 60,000 stock units were granted to non-employee directors, respectively.
RSUs may be granted to employees and outside consultants. During fiscal 2013, approximately 2,237,000 RSUs were granted to employees, including executive officers, all of which were due to vest over the next four years. During fiscal 2012, approximately 1,013,000 RSUs were granted to employees, including executive officers, all of which vest over four years from the grant date. During fiscal 2011, approximately 1,052,000 RSUs were granted to employees, including executive officers, all of which vest over four years from the grant date.
121
THE FIRST MARBLEHEAD CORPORATION AND SUBSIDIARIES
NOTES TO CONSOLIDATED FINANCIAL STATEMENTS (Continued)
June 30, 2013, 2012 and 2011
(23) Stock-Based Compensation (Continued)
The following table presents stock unit activity, including both RSUs and director stock units, for fiscal 2013, fiscal 2012 and fiscal 2011:
| | | | | | | | |
| | | Number of
stock units | | | Weighted-
average grant
date fair value
per share | |
| | | (shares in thousands) | |
Outstanding stock units at June 30, 2010 | | | 2,444 | | | | 4.41 | |
Granted | | | 1,112 | | | | 2.12 | |
Vested and issued | | | (743 | ) | | | 4.56 | |
Forfeited | | | (340 | ) | | | 4.77 | |
| | | | | | | | |
Outstanding stock units at June 30, 2011 | | | 2,473 | | | | 3.28 | |
Granted | | | 1,083 | | | | 1.39 | |
Vested and issued | | | (946 | ) | | | 3.23 | |
Forfeited | | | (775 | ) | | | 2.11 | |
| | | | | | | | |
Outstanding stock units at June 30, 2012 | | | 1,835 | | | | 2.68 | |
Granted | | | 2,297 | | | | 1.17 | |
Vested and issued | | | (1,002 | ) | | | 2.55 | |
Forfeited | | | (139 | ) | | | 1.26 | |
| | | | | | | | |
Outstanding stock units at June 30, 2013 | | | 2,991 | | | | 1.64 | |
| | | | | | | | |
(24) Defined Contribution Plans
We sponsor a 401(k) retirement savings plan for the benefit of all full time employees. Eligible employees can join the plan after three months of employment. Investment decisions are made by individual employees. At our option, we can contribute to the plan for the benefit of employees. Employee and employer contributions vest immediately. We made contributions of approximately $900 thousand for each year in the three year period ended June 30, 2013.
(25) Union Federal Regulatory Matters
Union Federal is a federally-chartered thrift that is subject to various regulatory capital requirements administered by the federal banking agencies. Failure to meet minimum capital requirements can result in initiation of certain mandatory and possibly additional discretionary actions by the regulators that, if undertaken, could have a direct material effect on our liquidity. Under capital adequacy guidelines and the regulatory framework for prompt corrective action, Union Federal must meet specific capital guidelines that involve quantitative measures of Union Federal’s assets and liabilities as calculated under regulatory accounting practices. The capital amounts and classifications, however, are also subject to qualitative judgments by the regulators about components, risk weightings and other factors. Union Federal’s equity capital was $21.6 million and $16.3 million at June 30, 2013 and June 30, 2012, respectively. During fiscal 2013, Union Federal received capital contributions of $5.8 million from FMD.
Quantitative measures established by regulation to ensure capital adequacy require Union Federal to maintain minimum amounts and ratios of total capital and Tier 1 capital to risk-weighted assets (each as defined in the regulations). As of June 30, 2013 and June 30, 2012, Union Federal was well capitalized under the regulatory framework for prompt corrective action.
122
THE FIRST MARBLEHEAD CORPORATION AND SUBSIDIARIES
NOTES TO CONSOLIDATED FINANCIAL STATEMENTS (Continued)
June 30, 2013, 2012 and 2011
(25) Union Federal Regulatory Matters (Continued)
Union Federal’s regulatory capital ratios were as follows as of the dates below:
| | | | | | | | | | | | | | | | |
| | | Regulatory Guidelines | | | June 30, | |
| | | Minimum | | | Well
capitalized | | | 2013 | | | 2012 | |
Capital ratios: | | | | | | | | | | | | | | | | |
Tier 1 risk-based capital | | | 4.0 | % | | | 6.0 | % | | | 25.2 | % | | | 31.3 | % |
Total risk-based capital | | | 8.0 | | | | 10.0 | | | | 26.0 | | | | 31.7 | |
Tier 1 (core) capital | | | 4.0 | | | | 5.0 | | | | 11.7 | | | | 11.0 | |
FMD is subject to regulation, supervision and examination by the Board of Governors of the Federal Reserve System (Federal Reserve) as a savings and loan holding company, and Union Federal is subject to regulation, supervision and examination by the OCC.
The OCC regulates all capital distributions by Union Federal directly or indirectly to FMD, including dividend payments. Union Federal is required to file a notice with the OCC at least 30 days before the proposed declaration of a dividend or approval of a proposed capital distribution by Union Federal’s Board of Directors. Union Federal must file an application to receive the approval of the OCC for a proposed capital distribution when, among other circumstances, the total amount of all capital distributions (including the proposed capital distribution) for the applicable calendar year exceeds net income for that year to date plus the retained net income for the preceding two years.
A notice or application to make a capital distribution by Union Federal may be disapproved or denied by the OCC if it determines that, after making the capital distribution, Union Federal would fail to meet minimum required capital levels or if the capital distribution raises safety or soundness concerns or is otherwise restricted by statute, regulation or agreement between Union Federal and the OCC, or a condition imposed by an OCC agreement. Under the Federal Deposit Insurance Corporation Improvement Act (FDICIA), a Federal Depository Insurance Corporation-insured depository institution such as Union Federal is prohibited from making capital distributions, including the payment of dividends, if, after making such distribution, the institution would become “undercapitalized” (as such term is used in the FDICIA).
In March 2010, the FMD Board of Directors adopted resolutions required by the U.S. Office of Thrift Supervision (OTS), Union Federal’s regulator at that time, undertaking to support the implementation by Union Federal of its business plan, so long as Union Federal is owned or controlled by FMD, and to notify the OTS (and now the OCC effective in fiscal 2012) in advance of any distribution to our stockholders in excess of $1.0 million per fiscal quarter and any incurrence or guarantee of debt in excess of $5.0 million. These resolutions continue to be applied by the Federal Reserve. Distribution to our stockholders may be further restricted by the Federal Reserve’s required approval in those instances when such distributions exceed the net earnings of the prior12-month period.
123
THE FIRST MARBLEHEAD CORPORATION AND SUBSIDIARIES
NOTES TO CONSOLIDATED FINANCIAL STATEMENTS (Continued)
June 30, 2013, 2012 and 2011
(26) Subsequent Event
On August 28, 2013, a purported class action was filed in the United States District Court for the District of Massachusetts against FMD, Daniel Meyers, FMD’s Chief Executive Officer and Chairman of the FMD Board of Directors, and Kenneth Klipper, FMD’s Chief Financial Officer and one of FMD’s Managing Directors. The plaintiff alleges, among other things, that the defendants made false and misleading statements and failed to disclose material information in various Securities and Exchange Commission filings, press releases and other public statements concerning our corporate income tax filings. The complaint alleges various claims under the Securities Exchange Act of 1934, as amended, and Rule 10b-5 promulgated thereunder. The complaint seeks, among other relief, class certification, unspecified damages, fees and such other relief as the court may deem just and proper. No class has been certified in the action. At this time, we are unable to estimate the financial effect, if any, related to this lawsuit.
124
SUPPLEMENTARY DATA
UNAUDITED QUARTERLY INFORMATION
The table below summarizes unaudited quarterly information for each of the three month periods in fiscal 2013 and fiscal 2012:
| | | | | | | | | | | | | | | | |
| | | Three months ended | |
| | | September 30,
2012 | | | December 31,
2012 | | | March 31,
2013 | | | June 30,
2013 | |
| | | (dollars in thousands, except per share data) | |
Total revenues | | $ | 12,671 | | | $ | 11,213 | | | $ | 12,792 | | | $ | 7,770 | |
Non-interest expenses | | | 26,208 | | | | 23,402 | | | | 21,626 | | | | 22,759 | |
Other income | | | — | | | | 281 | | | | 421 | | | | 946 | |
Income tax expense | | | 395 | | | | 375 | | | | 376 | | | | 1,150 | |
| | | | | | | | | | | | | | | | |
Net loss | | $ | (13,932 | ) | | $ | (12,283 | ) | | $ | (8,789 | ) | | $ | (15,193 | ) |
| | | | | | | | | | | | | | | | |
Net loss per basic and diluted common share: | | | | | | | | | | | | | | | | |
Basic | | $ | (0.14 | ) | | $ | (0.12 | ) | | $ | (0.08 | ) | | $ | (0.14 | ) |
Diluted | | $ | (0.14 | ) | | $ | (0.12 | ) | | $ | (0.08 | ) | | $ | (0.14 | ) |
| | | | | | | | | | | | | | | | |
| | | Three months ended | |
| | | September 30,
2011 | | | December 31,
2011 | | | March 31,
2012 | | | June 30,
2012 | |
| | | (dollars in thousands, except per share data) | |
Total revenues | | $ | 11,103 | | | $ | 6,682 | | | $ | 13,718 | | | $ | 8,903 | |
Non-interest expenses | | | 30,681 | | | | 23,720 | | | | 25,123 | | | | 23,629 | |
Gain from deconsolidation of trusts | | | — | | | | 358 | | | | 9,156 | | | | — | |
Proceeds from TERI settlements | | | 1,124 | | | | 281 | | | | — | | | | 280 | |
Income tax expense (benefit) | | | 339 | | | | (12,631 | ) | | | (5,197 | ) | | | (466 | ) |
| | | | | | | | | | | | | | | | |
(Loss) income from continuing operations | | | (18,793 | ) | | | (3,768 | ) | | | 2,948 | | | | (13,980 | ) |
Discontinued operations, net of taxes | | | (69,165 | ) | | | 1,198,036 | | | | 6,910 | | | | 40 | |
| | | | | | | | | | | | | | | | |
Net (loss) income | | $ | (87,958 | ) | | $ | 1,194,268 | | | $ | 9,858 | | | $ | (13,940 | ) |
| | | | | | | | | | | | | | | | |
Net (loss) income per basic common share: | | | | | | | | | | | | | | | | |
From continuing operations | | $ | (0.19 | ) | | $ | (0.03 | ) | | $ | 0.03 | | | $ | (0.14 | ) |
From discontinued operations | | | (0.68 | ) | | | 10.85 | | | | 0.06 | | | | — | |
| | | | | | | | | | | | | | | | |
Total basic net (loss) income per common share | | $ | (0.87 | ) | | $ | 10.82 | | | $ | 0.09 | | | $ | (0.14 | ) |
| | | | | | | | | | | | | | | | |
Net (loss) income per diluted common share: | | | | | | | | | | | | | | | | |
From continuing operations | | $ | (0.19 | ) | | $ | (0.03 | ) | | $ | 0.03 | | | $ | (0.14 | ) |
From discontinued operations | | | (0.68 | ) | | | 10.85 | | | | 0.06 | | | | — | |
| | | | | | | | | | | | | | | | |
Total diluted net (loss) income per common share | | $ | (0.87 | ) | | $ | 10.82 | | | $ | 0.09 | | | $ | (0.14 | ) |
| | | | | | | | | | | | | | | | |
Total net (loss) income per share was computed using the two-class method earnings allocation formula when there were earnings to distribute to participating securities in a given quarter. In those quarters above that include a net loss for the quarter, the two-class method would not apply. As such, the aggregate net (loss) income per share for fiscal 2012 as a whole would not agree in the aggregate with the quarterly information presented above. Beginning with the third quarter of fiscal 2013, due to the conversion of the Series B Preferred Stock to common stock, we no longer had participating securities.
125
| Item 9. | Changes in and Disagreements with Accountants on Accounting and Financial Disclosure |
None.
| Item 9A. | Controls and Procedures |
Disclosure Controls and Procedures
Our management, with the participation of FMD’s Chief Executive Officer and Chief Financial Officer (our principal executive officer and principal financial officer, respectively), evaluated the effectiveness of our disclosure controls and procedures as of June 30, 2013. The term “disclosure controls and procedures,” as defined in Rules 13a-15(e) and 15d-15(e) under the Exchange Act, means controls and other procedures of a company that are designed to ensure that information required to be disclosed by the company in the reports that it files or submits under the Exchange Act is recorded, processed, summarized and reported, within the time periods specified in the rules and forms of the SEC. Disclosure controls and procedures include, without limitation, controls and procedures designed to ensure that information required to be disclosed by a company in the reports that it files or submits under the Exchange Act is accumulated and communicated to the company’s management, including its principal executive and principal financial officers, as appropriate, to allow timely decisions regarding required disclosure. Management recognizes that any controls and procedures, no matter how well designed and operated, can provide only reasonable assurance of achieving their objectives and management necessarily applies its judgment in evaluating the cost-benefit relationship of possible controls and procedures. Based on the evaluation of our disclosure controls and procedures as of June 30, 2013, FMD’s Chief Executive Officer and Chief Financial Officer concluded that, as of such date, our disclosure controls and procedures were effective at the reasonable assurance level.
126
Management’s Report on Internal Control over Financial Reporting
MANAGEMENT’S REPORT ON INTERNAL CONTROL OVER FINANCIAL REPORTING
The management of The First Marblehead Corporation and subsidiaries (Company) is responsible for establishing and maintaining adequate internal control over financial reporting. Internal control over financial reporting is defined in Rule 13a-15(f) or 15d-15(f) promulgated under the Securities Exchange Act of 1934, as amended, as a process designed by, or under the supervision of, the company’s principal executive and principal financial officers and effected by the company’s board of directors, management and other personnel, to provide reasonable assurance regarding the reliability of financial reporting and the preparation of financial statements for external purposes in accordance with generally accepted accounting principles and includes those policies and procedures that:
| | • | | Pertain to the maintenance of records that in reasonable detail accurately and fairly reflect the transactions and dispositions of the assets of the company; |
| | • | | Provide reasonable assurance that transactions are recorded as necessary to permit preparation of financial statements in accordance with generally accepted accounting principles, and that receipts and expenditures of the company are being made only in accordance with authorizations of management and directors of the company; and |
| | • | | Provide reasonable assurance regarding prevention or timely detection of unauthorized acquisition, use or disposition of the company’s assets that could have a material effect on the financial statements. |
Because of its inherent limitations, internal control over financial reporting may not prevent or detect misstatements. Projections of any evaluation of effectiveness to future periods are subject to the risk that controls may become inadequate because of changes in conditions, or that the degree of compliance with the policies or procedures may deteriorate.
The Company’s management assessed the effectiveness of the Company’s internal control over financial reporting as of June 30, 2013. In making this assessment, the Company’s management used the criteria set forth by the Committee of Sponsoring Organizations of the Treadway Commission in Internal Control-Integrated Framework.
Based on our assessment, management concluded that, as of June 30, 2013, the Company’s internal control over financial reporting is effective based on those criteria.
The Company’s independent auditors have issued an attestation report on the Company’s internal control over financial reporting. That report appears on page 128 of this annual report.
|
| /s/ DANIEL MEYERS |
Chief Executive Officer and Chairman of the Board of Directors |
|
| /s/ KENNETH KLIPPER |
| Managing Director and Chief Financial Officer |
127
Attestation Report of our Independent Registered Public Accounting Firm
Report of Independent Registered Public Accounting Firm
The Board of Directors and Stockholders
The First Marblehead Corporation:
We have audited The First Marblehead Corporation’s (the Company) internal control over financial reporting as of June 30, 2013, based on criteria established inInternal Control—Integrated Framework issued by the Committee of Sponsoring Organizations of the Treadway Commission (COSO). The Company’s management is responsible for maintaining effective internal control over financial reporting and for its assessment of the effectiveness of internal control over financial reporting, included in the accompanying management’s report on internal control over financial reporting. Our responsibility is to express an opinion on the Company’s internal control over financial reporting based on our audit.
We conducted our audit in accordance with the standards of the Public Company Accounting Oversight Board (United States). Those standards require that we plan and perform the audit to obtain reasonable assurance about whether effective internal control over financial reporting was maintained in all material respects. Our audit included obtaining an understanding of internal control over financial reporting, assessing the risk that a material weakness exists, and testing and evaluating the design and operating effectiveness of internal control based on the assessed risk. Our audit also included performing such other procedures as we considered necessary in the circumstances. We believe that our audit provides a reasonable basis for our opinion.
A company’s internal control over financial reporting is a process designed to provide reasonable assurance regarding the reliability of financial reporting and the preparation of financial statements for external purposes in accordance with generally accepted accounting principles. A company’s internal control over financial reporting includes those policies and procedures that (1) pertain to the maintenance of records that, in reasonable detail, accurately and fairly reflect the transactions and dispositions of the assets of the company; (2) provide reasonable assurance that transactions are recorded as necessary to permit preparation of financial statements in accordance with generally accepted accounting principles, and that receipts and expenditures of the company are being made only in accordance with authorizations of management and directors of the company; and (3) provide reasonable assurance regarding prevention or timely detection of unauthorized acquisition, use, or disposition of the company’s assets that could have a material effect on the financial statements.
Because of its inherent limitations, internal control over financial reporting may not prevent or detect misstatements. Also, projections of any evaluation of effectiveness to future periods are subject to the risk that controls may become inadequate because of changes in conditions, or that the degree of compliance with the policies or procedures may deteriorate.
In our opinion, the Company maintained, in all material respects, effective internal control over financial reporting as of June 30, 2013, based on criteria established inInternal Control—Integrated Framework issued by the Committee of Sponsoring Organizations of the Treadway Commission.
We also have audited, in accordance with the standards of the Public Company Accounting Oversight Board (United States), the consolidated balance sheets of The First Marblehead Corporation and subsidiaries as of June 30, 2013 and 2012, and the related consolidated statements of operations, changes in comprehensive (loss) income, changes in stockholders’ equity (deficit), and cash flows for each of the years in the three-year period ended June 30, 2013, and our report dated September 13, 2013 expressed an unqualified opinion on those consolidated financial statements.
/s/ KPMG LLP
Boston, Massachusetts
September 13, 2013
128
Change in Internal Control Over Financial Reporting
No change in our internal control over financial reporting, as defined in Rules 13a-15(f) and 15d-15(f) under the Exchange Act, occurred during the fiscal quarter ended June 30, 2013 that has materially affected, or is reasonably likely to materially affect, our internal control over financial reporting.
| Item 9B. | Other Information |
Not applicable.
PART III
Pursuant to Paragraph G(3) of the General Instructions to Form 10-K, information required by Part III (Items 10, 11, 12, 13 and 14) is being incorporated by reference herein from our definitive proxy statement to be filed with the SEC within 120 days of the end of the fiscal year ended June 30, 2013 in connection with our 2013 annual meeting of stockholders, which we refer to below as our 2013 Proxy Statement.
| Item 10. | Directors, Executive Officers and Corporate Governance |
The information required by this item with respect to our executive officers and code of ethics is included in Item 1, “Business,” of this annual report.
The information required by this item with respect to directors will be contained in our 2013 Proxy Statement under the caption “Discussion of Proposals—Proposal One: Election of Directors” and is incorporated in this annual report by reference.
The information required by this item with regard to Section 16(a) beneficial ownership reporting compliance will be contained in our 2013 Proxy Statement under the caption “Other Information—Section 16(a) Beneficial Ownership Reporting Compliance” and is incorporated in this annual report by reference.
The information required by this item with respect to corporate governance matters will be contained in our 2013 Proxy Statement under the caption “Information About Corporate Governance—Board Committees” and is incorporated in this annual report by reference. Complete copies of the audit committee charter, as well as our corporate governance guidelines and the charters of the compensation committee and nominating and corporate governance committee, are available on our website atwww.firstmarblehead.com. Alternatively, paper copies of these documents may be obtained free of charge by writing to Investor Relations, The First Marblehead Corporation, The Prudential Tower, 800 Boylston Street, 34th Floor, Boston, Massachusetts 02199 or e-mailing Investor Relations atinfo@fmd.com.
| Item 11. | Executive Compensation |
The information required by this item will be contained in our 2013 Proxy Statement under the captions “Information About Corporate Governance” and “Information About Our Executive Officers” and is incorporated in this annual report by this reference.
| Item 12. | Security Ownership of Certain Beneficial Owners and Management and Related Stockholder Matters |
The information required by this item with regard to security ownership of certain beneficial owners and management will be contained in our 2013 Proxy Statement under the caption “Other Information—Principal Stockholders” and is incorporated in this annual report by reference.
The information required by this item with regard to securities authorized for issuance under equity compensation plans will be contained in our 2013 Proxy Statement under the caption “Information About Corporate Governance” and is incorporated in this annual report by reference.
129
| Item 13. | Certain Relationships and Related Transactions, and Director Independence |
The information required by this item with regard to certain relationships and related-person transactions will be contained in our 2013 Proxy Statement under the caption “Information About Our Executive Officers” and is incorporated in this annual report by reference.
The information required by this item with regard to director independence will be contained in our 2013 Proxy Statement under the caption “Information About Corporate Governance” and is incorporated in this annual report by reference.
| Item 14. | Principal Accountant Fees and Services |
The information required by this item will be contained in our 2013 Proxy Statement under the caption “Discussion of Proposals—Proposal Two: Ratification of Appointment of Independent Registered Public Accounting Firm” and is incorporated in this annual report by reference.
PART IV
| Item 15. | Exhibits and Financial Statement Schedules |
| (a) | The following documents are filed as part of this annual report: |
Our consolidated financial statements are included as Item 8, “Financial Statements and Supplementary Data,” herein and are filed as part of this annual report. Our consolidated financial statements include the reports made in Item 9A, “Controls and Procedures,” herein.
| | (2) | Financial Statement Schedules. |
None.
The exhibits set forth on the Exhibit Index following this annual report are filed as part of this annual report. This list of exhibits identifies each management contract or compensatory plan or arrangement required to be filed as an exhibit to this annual report.
130
SIGNATURES
Pursuant to the requirements of Section 13 or 15(d) of the Securities Exchange Act of 1934, the registrant has duly caused this report to be signed on its behalf by the undersigned, thereunto duly authorized.
| | |
| THE FIRST MARBLEHEAD CORPORATION |
| |
| By: | | /S/ DANIEL MEYERS |
| | Daniel Meyers |
| | Chief Executive Officer and Chairman of the Board of Directors |
| |
| Date: | | September 13, 2013 |
Pursuant to the requirements of the Securities Exchange Act of 1934, this report has been signed below by the following persons on behalf of the registrant and in the capacities and on the dates indicated:
| | | | |
Signature | | Title(s) | | Date |
| | |
/S/ DANIEL MEYERS Daniel Meyers | | Chief Executive Officer and Chairman of the Board of Directors (Principal Executive Officer) | | September 13, 2013 |
| | |
/S/ KENNETH KLIPPER Kenneth Klipper | | Managing Director and Chief Financial Officer (Principal Financial Officer and Principal Accounting Officer) | | September 13, 2013 |
| | |
/S/ NANCY Y. BEKAVAC Nancy Y. Bekavac | | Director | | September 13, 2013 |
| | |
/S/ DORT A. CAMERON III Dort A. Cameron III | | Director | | September 13, 2013 |
| | |
/S/ GEORGE G. DALY George G. Daly | | Director | | September 13, 2013 |
| | |
/S/ PETER S. DROTCH Peter S. Drotch | | Director | | September 13, 2013 |
| | |
/S/ THOMAS P. EDDY Thomas P. Eddy | | Director | | September 13, 2013 |
| | |
/S/ WILLIAM D. HANSEN William D. Hansen | | Director | | September 13, 2013 |
131
EXHIBIT INDEX
| | |
Number | | Description |
3.1(1) | | Restated Certificate of Incorporation of the Registrant, as amended |
| |
3.2(2) | | Amended and Restated By-laws of the Registrant |
| |
4.1(3) | | Indenture, dated July 18, 2007, among UFSB Private Loan SPV, LLC, CIESCO, LLC, Citicorp North America, Inc., U.S. Bank National Association and Union Federal Savings Bank, as amended by Amendment No. 1 to Indenture, Limited Waiver and Acknowledgement dated April 15, 2009, among UFSB Private Loan SPV, LLC, CIESCO, LLC, Citicorp North America, Inc., U.S. Bank National Association and Union Federal Savings Bank, as amended by Amendment No. 2 to Indenture dated April 16, 2010, among UFSB Private Loan SPV, LLC, CIESCO, LLC, Citicorp North America, Inc., U.S. Bank National Association, the Registrant and Union Federal Savings Bank |
| |
4.2(3) | | Settlement Agreement and Release, dated April 16, 2010, among UFSB Private Loan SPV, LLC, CIESCO, LLC, Citicorp North America, Inc., U.S. Bank National Association, the Registrant, The National Collegiate Funding II, LLC, The National Collegiate Student Loan Trust 2009-1 and Union Federal Savings Bank |
| |
10.1(2)# | | 2002 Director Stock Plan |
| |
10.2(2)# | | 2003 Employee Stock Purchase Plan |
| |
10.3(4)# | | 2003 Stock Incentive Plan, as amended and restated |
| |
10.4(5)# | | 2011 Stock Incentive Plan |
| |
10.5(1)# | | Executive Incentive Compensation Plan |
| |
10.6# | | Summary of non-employee director compensation arrangements |
| |
10.7(6)# | | Form of Nonstatutory Stock Option Agreement evidencing grants under the 2002 Director Stock Plan |
| |
10.8(7)# | | Forms of Incentive Stock Option Agreement and Nonstatutory Stock Option Agreement evidencing grants under the 2003 Stock Incentive Plan |
| |
10.9(8)# | | Form of Restricted Stock Unit Agreement evidencing grants under the 2003 Stock Incentive Plan |
| |
10.10(9)# | | Form of Restricted Stock Unit Agreement evidencing grants under the 2011 Stock Incentive Plan |
| |
10.11(8)# | | Form of Invention, Non-disclosure, Non-competition and Non-solicitation Agreement |
| |
10.12(10)# | | Employment Agreement, dated as of August 18, 2008, between the Registrant and Daniel Meyers |
| |
10.13(11)# | | First Amendment to Employment Agreement, dated as of May 17, 2010, between the Registrant and Daniel Meyers |
| |
10.14(10)# | | Indemnification Agreement, dated August 18, 2008, between the Registrant and Daniel Meyers |
| |
10.15(11)# | | First Amendment to Indemnification Agreement, dated as of July 22, 2010, between the Registrant and Daniel Meyers |
| |
10.16(12)# | | Non-Statutory Stock Option Agreement for $6.00 stock options between the Registrant and Daniel Meyers |
| |
10.17(12)# | | Non-Statutory Stock Option Agreement for $12.00 stock options between the Registrant and Daniel Meyers |
| |
10.18(12)# | | Non-Statutory Stock Option Agreement for $16.00 stock options between the Registrant and Daniel Meyers |
132
| | |
Number | | Description |
10.19(11)# | | Letter Agreement, dated February 25, 2005, between the Registrant and Kenneth Klipper, as supplemented |
| |
10.20(11)# | | Letter Agreement, dated September 22, 2008, between the Registrant and Seth Gelber, as supplemented |
| |
10.21(11)# | | Letter Agreement, dated September 22, 2008, between the Registrant and Gary Santo, as supplemented |
| |
10.22# | | Letter Agreement, dated June 7, 2004, between the Registrant and William P. Baumer, as supplemented |
| |
10.23# | | Letter Agreement, dated January 11, 2011, between the Registrant and Barry Heneghan |
| |
10.24(13) | | Time Sharing Agreement, dated February 4, 2009, between the Registrant and Sextant Holdings, LLC |
| |
10.25(12) | | Indenture of Lease, dated September 5, 2003, between the Registrant and BP Prucenter Acquisition LLC, as amended |
| |
10.26(12) | | Commercial Lease, dated August 13, 2004, between the Registrant and Cabot Road Partners, LLC, as amended |
| |
10.27(14) | | Second Amendment to Lease, dated as of November 3, 2010, between the Registrant and Cabot Road Owner—VEF VI, LLC |
| |
10.28(8) | | Third Amendment to Lease, dated as of July 1, 2011, between the Registrant and Cabot Road Owner—VEF VI, LLC |
| |
10.29(15) | | Purchase Agreement, dated as of March 31, 2009, among the Registrant, VCG Owners Trust and VCG Securities LLC |
| |
10.30(15) | | Letter Agreement, dated as of March 31, 2009, delivered by Vanquish Advisors LLC to the Registrant |
| |
10.31(15) | | Asset Services Agreement, dated as of March 31, 2009, among the Registrant, First Marblehead Education Resources, Inc., VCG Owners Trust and VCG Securities LLC |
| |
10.32(15) | | Data Sharing and License Agreement, dated as of March 31, 2009, between the Registrant and VCG Owners Trust |
| |
10.33(15) | | Indemnification Agreement, dated as of March 31, 2009, between the Registrant, VCG Owners Trust and VCG Securities LLC |
| |
10.34(16) | | Loan Purchase and Sale Agreement, dated October 13, 2009, between Union Federal Savings Bank and Wells Fargo Bank, N.A. |
| |
10.35(16) | | Performance Guarantee, dated October 16, 2009, delivered by the Registrant to Wells Fargo Bank, N.A. |
| |
10.36(17)†† | | Amended and Restated Private Student Loan Servicing Agreement, dated as of September 28, 2006, between the Registrant and Pennsylvania Higher Education Assistance Agency |
| |
10.37(12)†† | | Amendments to Amended and Restated Private Student Loan Servicing Agreement, dated as of September 28, 2006, between the Registrant and Pennsylvania Higher Education Assistance Agency |
| |
10.38(18)†† | | Private Student Loan Monogram Program Agreement, dated as of February 5, 2010, between the Registrant and Pennsylvania Higher Education Assistance Agency |
| |
10.39(18)†† | | Loan Program Agreement, dated as of April 20, 2010, among the Registrant, First Marblehead Education Resources, Inc. and SunTrust Bank |
133
| | |
Number | | Description |
10.40(18)†† | | Certificate of Satisfaction and First Amendment to Loan Program Agreement, dated as of July 15, 2010, among the Registrant, First Marblehead Education Resources, Inc. and SunTrust Bank |
| |
10.41(19)†† | | Fifth Amendment to Loan Program Agreement dated November 14, 2011, among the Registrant, First Marblehead Education Resources, Inc. and SunTrust Bank |
| |
10.42(20)†† | | Loan Program Agreement, dated as of August 2, 2012, among the Registrant, First Marblehead Education Resources, Inc., and SunTrust Bank |
| |
10.43(8)†† | | Loan Program Agreement, dated as of June 30, 2011, among the Registrant, First Marblehead Education Resources, Inc. and Union Federal Savings Bank |
| |
10.44(21) | | Stipulation Resolving Claims of First Marblehead Education Resources, Inc., the Registrant, and First Marblehead Data Services, Inc. dated as of October 7, 2010 |
| |
10.45(22) | | Asset Purchase Agreement among FM Systems LLC, KeyBank National Association and, for solely purposes of Sections 7.1.6 and 7.12, the Registrant, dated November 21, 2010 |
| |
10.46(23) | | Purchase and Assignment Agreement dated November 14, 2011, among the Registrant, First Marblehead Education Resources, Inc. and VCG Special Opportunities Master Fund Limited |
| |
10.47(23) | | Inducement Agreement dated November 14, 2011, among the Registrant, First Marblehead Education Resources, Inc., VCG Owners Trust and VCG Securities LLC |
| |
21.1 | | List of Subsidiaries |
| |
23.1 | | Consent of Independent Registered Public Accounting Firm |
| |
31.1 | | Chief Executive Officer—Certification pursuant to Rule 13a-14(a) of the Securities Exchange Act of 1934, as adopted pursuant to Section 302 of the Sarbanes-Oxley Act of 2002 |
| |
31.2 | | Chief Financial Officer—Certification pursuant to Rule 13a-14(a) of the Securities Exchange Act of 1934, as adopted pursuant to Section 302 of the Sarbanes-Oxley Act of 2002 |
| |
32.1 | | Chief Executive Officer—Certification pursuant to Rule 13a-14(a) of the Securities Exchange Act of 1934 and 18 U.S.C. Section 1350, as adopted pursuant to Section 906 of the Sarbanes-Oxley Act of 2002 |
| |
32.2 | | Chief Financial Officer—Certification pursuant to Rule 13a-14(a) of the Securities Exchange Act of 1934 and 18 U.S.C. Section 1350, as adopted pursuant to Section 906 of the Sarbanes-Oxley Act of 2002 |
| |
101.INS(24) | | Instance Document |
| |
101.SCH(24) | | Taxonomy Extension Schema Document |
| |
101.CAL(24) | | Taxonomy Calculation Linkbase Document |
| |
101.LAB(24) | | Taxonomy Label Linkbase Document |
| |
101.PRE(24) | | Taxonomy Presentation Linkbase Document |
| |
101.DEF(24) | | Taxonomy Extension Definition Linkbase Document |
| (1) | Incorporated by reference to the exhibit to the Registrant’s annual report on Form 10-K filed with the SEC on August 29, 2008. |
| (2) | Incorporated by reference to the exhibits to the Registrant’s registration statement on Form S-1 (File No. 333-108531). |
| (3) | Incorporated by reference to the exhibits to the Registrant’s current report on Form 8-K filed with the SEC on April 20, 2010. |
134
| (4) | Incorporated by reference to the exhibit to the Registrant’s registration statement on Form S-8 (File No. 333-163141). |
| (5) | Incorporated by reference to the exhibit to the Registrant’s current report on Form 8-K filed with the SEC on November 17, 2011. |
| (6) | Incorporated by reference to the exhibits to the Registrant’s annual report on Form 10-K filed with the SEC on September 15, 2004. |
| (7) | Incorporated by reference to the exhibits to the Registrant’s annual report on Form 10-K filed with the SEC on September 7, 2005. |
| (8) | Incorporated by reference to the exhibits to the Registrant’s annual report on Form 10-K filed with the SEC on September 8, 2011. |
| (9) | Incorporated by reference to the exhibits to the Registrant’s current report on Form 8-K filed with the SEC on January 31, 2012. |
| (10) | Incorporated by reference to the exhibits to the Registrant’s current report on Form 8-K filed with the SEC on August 18, 2008. |
| (11) | Incorporated by reference to the exhibits to the Registrant’s annual report on Form 10-K filed with the SEC on September 2, 2010. |
| (12) | Incorporated by reference to the exhibits to the Registrant’s annual report on Form 10-K filed with the SEC on September 3, 2009. |
| (13) | Incorporated by reference to the exhibit to the Registrant’s quarterly report on Form 10-Q filed with the SEC on February 9, 2009. |
| (14) | Incorporated by reference to the exhibit to the Registrant’s current report on Form 8-K filed with the SEC on November 5, 2010. |
| (15) | Incorporated by reference to the exhibits to the Registrant’s current report on Form 8-K filed with the SEC on April 6, 2009. |
| (16) | Incorporated by reference to the exhibits to the Registrant’s current report on Form 8-K filed with the SEC on October 16, 2009. |
| (17) | Incorporated by reference to the exhibit to the Registrant’s quarterly report on Form 10-Q filed with the SEC on November 8, 2006. |
| (18) | Incorporated by reference to the exhibits to the Registrant’s Amendment No. 1 to annual report onForm 10-K filed with the SEC on November 18, 2010. |
| (19) | Incorporated by reference to the exhibits to the Registrant’s current report on Form 8-K filed with the SEC on November 15, 2011. |
| (20) | Incorporated by reference to the exhibits to the Registrant’s current report on Form 8-K filed with the SEC on August 2, 2012. |
| (21) | Incorporated by reference to the exhibit to the Registrant’s current report on Form 8-K filed with the SEC on October 14, 2010. |
| (22) | Incorporated by reference to the exhibit to the Registrant’s current report on Form 8-K filed with the SEC on November 22, 2010. |
| (23) | Incorporated by reference to the exhibits to the Registrant’s current report on Form 8-K filed with the SEC on November 14, 2011. |
| (24) | These interactive data files shall not be deemed filed for purposes of Section 11 or Section 12 of the Securities Act of 1933, as amended, or Section 18 of the Securities Exchange Act of 1934, as amended, or otherwise be subject to liability under those sections. |
135
| †† | Confidential treatment has been granted or requested for certain provisions of this Exhibit pursuant to Rule 24b-2 promulgated under the Securities Exchange Act of 1934, as amended. |
| # | This Exhibit is a management contract or compensatory plan or arrangement. |
136