UNITED STATES
SECURITIES AND EXCHANGE COMMISSION
WASHINGTON, D.C. 20549
FORM 10-K
x ANNUAL REPORT PURSUANT TO SECTION 13 OR 15(d)
OF THE SECURITIES EXCHANGE ACT OF 1934
| | |
| For the fiscal year ended December 31, 2006 | | Commission file number 001-31906 |
OR
¨ TRANSITION REPORT PURSUANT TO SECTION 13 OR 15(d)
OF THE SECURITIES EXCHANGE ACT OF 1934
For the transition period from to
HIGHLAND HOSPITALITY CORPORATION
(Exact name of registrant as specified in its charter)
| | |
| MARYLAND | | 57-1183293 |
(State or Other Jurisdiction of Incorporation or Organization) | | (I.R.S. Employer Identification No.) |
8405 Greensboro Drive, Suite 500, McLean, Virginia 22102
Telephone Number (703) 336-4901
Securities registered pursuant to Section 12(b) of the Act:
| | |
Title of Each Class
| | Name of Exchange On Which Registered
|
Common Stock, $.01 par value | | New York Stock Exchange |
Series A Cumulative Redeemable Preferred Stock, $.01 par value | | New York Stock Exchange |
Securities registered pursuant to Section 12(g) of the Act: None
Indicate by check mark if the registrant is a well-known seasoned issuer, as defined in Rule 405 of the Securities Exchange Act of 1934. Yes x No ¨
Indicate by check mark if the registrant is not required to file reports pursuant to Section 13 or Section 15(d) of the Securities Exchange Act of 1934. Yes ¨ No x
Indicate by check mark whether the registrant (1) has filed all reports required to be filed by Section 13 or 15(d) of the Securities Exchange Act of 1934 during the preceding 12 months, and (2) has been subject to such filing requirements for the past 90 days. Yes x No¨
Indicate by check mark if disclosure of delinquent filers pursuant to Item 405 of Regulation S-K is not contained herein, and will not be contained, to the best of registrant’s knowledge, in definitive proxy or information statements incorporated by reference in Part III of this Form 10-K or any amendment to this Form 10-K.¨
Indicate by check mark whether the registrant is a large accelerated filer, an accelerated filer, or a non-accelerated filer. See definition of “accelerated filer and large accelerated filer” in Rule 12b-2 of the Securities Exchange Act of 1934:
| | | | |
| Large accelerated filer x | | Accelerated filer ¨ | | Non-accelerated filer ¨ |
Indicate by check mark whether the registrant is a shell company (as defined in Rule 12b-2 of the Securities Exchange Act of 1934). Yes ¨ No x
As of June 30, 2006, the aggregate market value of the registrant’s common stock held by non-affiliates of the registrant was approximately $808,783,000, based on the closing price reported on the New York Stock Exchange. As of February 23, 2007, there were 61,414,744 shares of the registrant’s common stock issued and outstanding.
DOCUMENTS INCORPORATED BY REFERENCE
Part III of this Form 10-K incorporates by reference certain portions of the Registrant’s proxy statement for its 2007 annual meeting of stockholders to be filed with the Securities and Exchange Commission not later than 120 days after the end of the fiscal year covered by this report.
HIGHLAND HOSPITALITY CORPORATION
INDEX
2
CAUTIONARY STATEMENT REGARDING FORWARD-LOOKING STATEMENTS
This report contains forward-looking statements within the meaning of Section 27A of the Securities Act of 1933 and Section 21E of the Securities Exchange Act of 1934, and as such may involve known and unknown risks, uncertainties and other factors which may cause our actual results, performance or achievements to be materially different from future results, performance or achievements expressed or implied by such forward-looking statements. Forward-looking statements, which are based on certain assumptions and describe our future plans, strategies and expectations, are generally identified by our use of words, such as “intend,” “plan,” “may,” “should,” “will,” “project,” “estimate,” “anticipate,” “believe,” “expect,” “continue,” “potential,” “opportunity,” and similar expressions, whether in the negative or affirmative. All statements regarding our expected financial position, business and financing plans are forward-looking statements. Factors which could have a material adverse effect on our operations and future prospects include those discussed in “Business,” “Risk Factors,” “Management’s Discussion and Analysis of Financial Condition and Results of Operations,” and elsewhere in this Form 10-K. These risks and uncertainties should be considered in evaluating any forward-looking statement contained in this report or incorporated by reference herein.
All forward-looking statements speak only as of the date of this report or, in the case of any document incorporated by reference, the date of that document. All subsequent written and oral forward-looking statements attributable to us or any person acting on our behalf are qualified by the cautionary statements in this section. We undertake no obligation to update or publicly release any revisions to forward-looking statements to reflect events, circumstances or changes in expectations after the date of this report.
3
PART I
Item 1. Business
Overview
Highland Hospitality Corporation is a self-advised real estate investment trust (“REIT”) that was incorporated in the state of Maryland and owns upscale full-service, premium limited-service, and extended-stay properties located in major convention, business, resort and airport markets in the United States. We commenced operations on December 19, 2003 when we completed our initial public offering (“IPO”) and concurrently acquired our first three hotel properties. As of February 27, 2007, we owned 27 hotel properties with 8,382 rooms located in 14 states and the District of Columbia.
Substantially all of our assets are held by, and all of our operations are conducted through, Highland Hospitality, L.P., our operating partnership (the “Operating Partnership”). In order for us to qualify as a REIT, neither our company nor the Operating Partnership can operate hotels directly. Therefore, the Operating Partnership, which is owned approximately 99% by us and approximately 1% by other limited partners, leases its hotels to subsidiaries of HHC TRS Holding Corporation (collectively, “HHC TRS”), which is a wholly owned subsidiary of the Operating Partnership. HHC TRS then engages hotel management companies to operate the hotels pursuant to management contracts. HHC TRS is treated as a taxable REIT subsidiary for federal income tax purposes.
Our corporate office is located at 8405 Greensboro Drive, Suite 500, McLean, Virginia 22102. Our telephone number is (703) 336-4901.
Recent Investment Activity
During 2006 and early 2007, we acquired the following six hotel properties for an aggregate purchase price of approximately $381.1 million:
| | • | | in February 2006, the 673-room Nashville Renaissance hotel, a full-service upscale hotel located in Nashville, Tennessee, for a purchase price of approximately $80.3 million; |
| | • | | in March 2006, the 240-room Melrose hotel, an independent full-service hotel located in Washington, DC, for a purchase price of approximately $77.0 million; |
| | • | | in March 2006, the 585-room Pointe Hilton Tapatio Cliffs resort, an upscale all-suite resort located in Phoenix, Arizona, for a purchase price of approximately $81.9 million; |
| | • | | in June 2006, the 210-room Courtyard Gaithersburg Washingtonian Center hotel, an upscale limited-service hotel located in Gaithersburg, Maryland, for a purchase price of approximately $30.1 million; |
| | • | | in September 2006, the 444-room Ritz-Carlton Atlanta Downtown hotel, a full-service luxury hotel located in Atlanta, Georgia, for a purchase price of approximately $77.4 million; and |
| | • | | in February 2007, the 143-room Crowne Plaza Chicago-Silversmith hotel, a full-service upscale hotel located in Chicago, Illinois, for a purchase price of approximately $34.5 million. |
Also during 2006, we disposed of the following two hotel properties for aggregate net sales proceeds of approximately $70.3 million:
| | • | | in June 2006, the 283-room Marriott Mount Laurel hotel, located in Mount Laurel, New Jersey, for net sales proceeds of approximately $31.8 million; and |
| | • | | in August 2006, the 332-room Barceló Tucancun Beach resort, located in Cancun, Mexico, for net sales proceeds of approximately $38.5 million. |
4
Business Strategy
We intend to evaluate our portfolio on a regular basis to determine if our hotel properties continue to satisfy our current investment criteria. We believe that the following investment criteria and strategies promote our continued growth and our total return to stockholders:
Diversification—We seek to invest in and maintain a diversified hotel portfolio by brand, management company, and product mix.
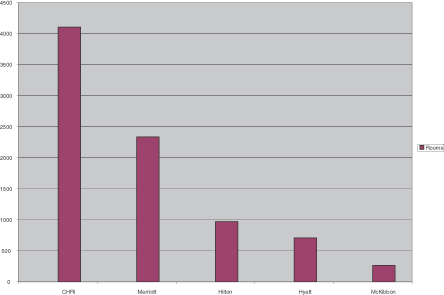
All five major brand companies in the United States (Marriott, Hilton, Hyatt, Starwood and Intercontinental) offer highly regarded upscale and upper-upscale brands which fit well within our acquisition strategy. We believe that a portfolio diversified by brand both mitigates risk in the event that certain brand becomes out of favor and also provides us leverage in negotiating hotel management and license agreements. Additionally, we believe that diverse brand relationships create value opportunities and pipeline potential through referrals of acquisition opportunities from the brand management and franchise management teams. The following chart reflects our hotel property rooms by brand as of February 27, 2007:

5
We believe that employing and retaining a diverse mix of quality management companies provides us with the ability to drive value with our preferred manager (Crestline Hotels and Resorts, Inc.) and other third party management companies. Diversification in our management companies allows us to diversify the risk of strategic or management direction changes in a certain management company and allows us to compare revenue and operating metrics, cost control initiatives, and other benchmarking strategies. The following chart reflects our hotel property rooms by management company as of February 27, 2007:
Finally, we believe that a broad range of product types, including both full-service and limited-service hotels, along with corporate, convention and resort hotels, and urban and suburban locations, is necessary to avoid a concentrated risk in any certain product type.
External Growth—We seek to focus our future investments in the top 25 metropolitan statistical areas (“MSAs”) in the United States. Specifically, we invest in upscale full-service, premium limited-service and extended-stay hotels located in major convention, business, resort and airport markets. We believe that these types of hotels currently offer the opportunity for better risk-adjusted returns than hotels in other sectors in the industry. As of February 27, 2007, approximately 67% of our hotel rooms were located in the top 25 MSA markets. Within our target sectors, we seek to acquire hotel properties that have superior locations within their respective markets, are in markets with high barriers-to-entry, are market leaders or are new, or relatively new, properties and well maintained. We also consider investments in hotel properties that possess sound operating fundamentals but are underperforming in their respective markets and would benefit from renovation, re-branding or a change in management.
We seek to invest in hotels operating under national franchise brands such as Marriott, Hilton, Hyatt, Renaissance, Sheraton, Westin, Crowne Plaza, Courtyard by Marriott, Residence Inn by Marriott, Embassy Suites, Homewood Suites, and Hilton Garden Inn. However, our ability to operate a hotel under these brands is subject to the franchisor’s approval of any application we would submit to operate a particular facility under such brand and our execution of a franchise agreement with the franchisor.
In addition, on occasion, we will seek to invest in individual independent hotels located in certain urban areas of the top 25 MSAs in the United States. While the national brands mentioned above provide for a significant contribution of revenue through brand loyalty programs, national sales and other marketing programs, we believe that hotels of up to 250 rooms in top gateway markets are not necessarily in need of a brand marketing program to be successful. In certain cases, we believe that an independent hotel can produce a higher yield by taking advantage of today’s independent internet search and booking engines, along with third party websites, without paying royalty fees on all room revenues.
6
Stabilized Assets—We believe that over the next several years, existing upscale full-service, premium limited-service and extended-stay hotels located in major convention, business, resort and airport markets in the United States will offer the opportunity for better risk-adjusted returns than hotels in other sectors in the industry. Within our target sectors, we seek to acquire hotel properties that meet the following criteria:
| | • | | Strong location in its market—hotel properties located in markets with high barriers to entry, adjacent to a convention center, that serve as an integral component of a master development or mixed-use project or reside on a superior beachfront location or within a protected area that prohibits further development; |
| | • | | Hard to duplicate hotel property—hotel properties developed using public financing that could not have been financed entirely in the private sector or possessing a unique competitive advantage that distinguishes them from other hotels in their markets; |
| | • | | Market leaders—hotel properties that are proven leaders in market share, setting the rates in the market and providing superior meeting space, services or amenities; and |
| | • | | Good condition—hotel properties that are new, or relatively new, or recently renovated and well-maintained. |
Because we believe hotel properties that possess these characteristics currently can be acquired at prices below replacement costs, we expect these hotel properties to provide stable returns over the long term.
Renovation, Repositioning and Re-branding Opportunities—We believe that there are opportunities to acquire hotel properties that possess sound operating fundamentals, but are underperforming in their respective markets and would benefit from renovation, repositioning or re-branding efforts. We intend to pursue opportunities for:
| | • | | Re-branding—we investigate opportunities to re-brand certain hotels by determining which brands are available in the market, seeking to quantify the potential improvement in revenue generation and profitability and undertaking a cost/benefit analysis of investing capital to bring the property into compliance with the standards of the selected brand; |
| | • | | Renovation—we consider properties that are in prime locations and are structurally sound, but have been neglected and can be purchased at attractive prices and renovated and reintroduced into the market at a cost significantly lower than what would have been spent to acquire a stabilized property or to develop a new hotel of similar quality; or |
| | • | | New management—we consider hotel properties that are underperforming due to poor management where we can acquire the properties at an attractive price and replace management with qualified managers. |
Internal Growth—We work with our hotel management companies to aggressively pursue ways to enhance the profitability of our hotels. We seek to negotiate management agreements that align our managers’ interests with ours, which is to generate revenue growth while producing acceptable operating profits. We work with our managers to identify cost-savings opportunities and projects that result in a positive return on investment.
Strategic Alliance Agreement
On December 19, 2003, we entered into a seven-year strategic alliance agreement with Barceló Crestline Corporation (“Barceló Crestline”) pursuant to which (i) Barceló Crestline agrees to refer to us (on an exclusive basis) hotel acquisition opportunities in the United States presented to Barceló Crestline or its subsidiaries, other than opportunities that primarily relate to third-party management arrangements offered to Barceló Crestline, and (ii) we agree to offer Barceló Crestline or its subsidiaries the right to manage hotel properties that we acquire in the United States, unless (a) a majority of our independent directors in good faith concludes for valid business reasons that another management company should manage the acquired hotel, or (b) the hotel is encumbered by a
7
management agreement that would extend beyond the date of our acquisition of the hotel and a termination fee is payable to terminate the existing management agreement (unless Barceló Crestline pays such termination fee). Crestline Hotels & Resorts, Inc., which is a wholly owned subsidiary of Barceló Crestline, currently manages 15 of our 27 hotel properties.
Lease Agreements
In order for us to qualify as a REIT, neither our company nor the Operating Partnership or its subsidiaries can operate our hotels directly. Our Operating Partnership, or subsidiaries of our Operating Partnership, as lessors, leases our hotels to HHC TRS, or subsidiaries of HHC TRS, as TRS lessees, and the TRS lessees enter into agreements with third-party management companies to manage the hotels. Each lease for the hotels has a non-cancelable term of ten years, subject to earlier termination upon the occurrence of certain contingencies described in the lease.
During the term of each lease, the TRS lessees are obligated to pay (i) the greater of a fixed annual base rent or percentage rent and (ii) certain other additional charges. Base rent accrues and is paid monthly. Percentage rent is calculated by multiplying fixed percentages by gross room revenues, food and beverage revenues, and other revenues for each of the hotels and is paid quarterly.
Management Agreements
Our hotels are managed and operated by third parties pursuant to management agreements with our TRS lessees. The initial terms of our management agreements are generally 10 to 20 years, subject, in some cases, to renewal options. We have five different management companies operating our hotels. The management companies generally have sole responsibility and exclusive authority for all activities necessary for the day-to-day operation of the hotels, including establishing all room rates, processing reservations, procuring inventories, supplies and services, and promoting and publicizing the hotels. In addition, the management companies provide all managerial and other employees for the hotels, oversee the operation and maintenance of the hotels, prepare reports, budgets and projections, and provide other administrative and accounting support services to the hotels.
Each management company receives a base management fee generally between 2% and 4% of hotel revenues. The management companies are also eligible to receive an incentive management fee, if hotel operating income, as defined in the management agreements, exceeds certain performance thresholds. The incentive management fee is generally calculated as a percentage of hotel operating income after we have received a priority return on our investment in the hotel. The management agreements also allow the management companies to charge our hotels for services that are generally furnished on a centralized basis. Such services include: (1) the development and operation of certain computer systems and reservation services; (2) regional management and administrative services, regional marketing and sales services, regional training services, manpower development and relocation of regional personnel; and (3) such additional central or regional services as may from time to time be more efficiently performed on a regional or group basis rather than at an individual hotel. Costs and expenses incurred in providing these services are generally allocated among all hotels managed by the management company or its affiliates.
Generally, our management agreements limit our ability to sell, lease or otherwise transfer the hotels by requiring that the transferee assume the related management agreements and meet specified other conditions, including the condition that the transferee not be a competitor of the management company. In addition, the management agreements provide for termination rights in the case of a management company’s failure to meet certain financial performance criteria.
Franchise Agreements
Of our 27 hotel properties, 14 currently operate pursuant to franchise agreements from national hotel companies. The initial terms of our franchise agreements are generally 20 to 30 years. Ten of our hotel properties
8
are managed by Hyatt Corporation, Marriott International, Inc., or Hilton Hotels Corporation. The management agreements for these ten hotel properties allow the hotel property to operate under the respective brand. With respect to our other three hotel properties, The Churchill hotel, The Melrose hotel, and The Silversmith hotel operate as independent hotels.
We anticipate that most of the additional hotel properties that we acquire will operate pursuant to franchise agreements or management agreements that allow our hotel properties to operate under nationally recognized brands. We believe that the public’s perception of quality associated with a franchisor is an important feature in the operation of a hotel. Franchisors provide a variety of benefits for franchisees, which include national advertising, publicity and other marketing programs designed to increase brand awareness, training of personnel, continuous review of quality standards, and centralized reservation systems.
The franchise agreements are entered into by our TRS lessees. The franchise agreements generally specify certain management, operational, record keeping, accounting, reporting and marketing standards and procedures with which the TRS lessees must comply. The franchise agreements obligate the TRS lessees to comply with the franchisors’ standards and requirements with respect to training of operational personnel, safety, maintaining specified insurance, the types of services and products ancillary to guest room services that may be provided, display of signs, and the type, quality and age of furniture, fixtures and equipment included in guest rooms, lobbies and other common areas.
The franchise agreements provide for termination at the franchisor’s option upon the occurrence of certain events, including the TRS lessees’ failure to pay royalties and fees or perform its other covenants pursuant to the franchise agreement, bankruptcy, abandonment of the franchise, commission of a felony, assignment of the franchise without the consent of the franchisor, or failure to comply with applicable law in the operation of the relevant hotel. The franchise agreements will not renew automatically upon expiration. The TRS lessees are responsible for making all payments pursuant to the franchise agreements to the franchisors. Pursuant to the franchise agreements, the TRS lessees pay a royalty fee generally between 4% and 5% of room revenues, plus additional fees for marketing, central reservation systems, and other franchisor costs that amount to between 3% and 4% of room revenues from the hotels.
Tax Status
We have elected to be taxed as a REIT under Sections 856 through 860 of the Internal Revenue Code. To qualify as a REIT, we must meet a number of organizational and operational requirements, including a requirement that we currently distribute at least 90% of our REIT taxable income (excluding net capital gains) to our stockholders. It is our current intention to adhere to these requirements and maintain our qualification for taxation as a REIT. As a REIT, we generally will not be subject to federal corporate income tax on that portion of our taxable income that is currently distributed to stockholders. If we fail to qualify for taxation as a REIT in any taxable year, we will be subject to federal income taxes at regular corporate rates (including any applicable alternative minimum tax) and may not be able to qualify as a REIT for four subsequent taxable years. Even if we qualify for taxation as a REIT, we may be subject to certain state and local taxes on our income and property, and to federal income and excise taxes on our undistributed taxable income. In addition, taxable income from non-REIT activities managed through taxable REIT subsidiaries is subject to federal, state and local income taxes.
Seasonality
Demand in the lodging industry is affected by recurring seasonal patterns. For non-resort properties, demand is generally lower in the winter months due to decreased travel and higher in the spring and summer months during the peak travel season. For resort properties, demand is generally higher in the winter months. We expect that our operations will generally reflect non-resort seasonality patterns. Accordingly, we expect that we will have lower revenue, operating income and cash flow in the first and fourth quarters and higher revenue, operating income and cash flow in the second and third quarters. These general trends are, however, expected to be greatly influenced by overall economic cycles.
9
Competition
The hotel industry is highly competitive with various participants competing on the basis of price, level of service and geographic location. Each of our hotels is located in a developed area that includes other hotel properties. The number of competitive hotel properties in a particular area could have a material adverse effect on occupancy, average daily rate (“ADR”) and revenue per available room (“RevPAR”) of our hotels or at hotel properties acquired in the future. We believe that brand recognition, location, the quality of the hotel, consistency of services provided, and price are the principal competitive factors affecting our hotels.
Environmental Matters
In connection with the ownership and operation of the hotels, we are subject to various federal, state and local laws, ordinances and regulations relating to environmental protection. Under these laws, a current or previous owner or operator of real estate may be liable for the costs of removal or remediation of certain hazardous or toxic substances on, under, or in such property. Such laws often impose liability without regard to whether the owner or operator knew of, or was responsible for, the presence of hazardous or toxic substances. In addition, the presence of contamination from hazardous or toxic substances, or the failure to remediate such contaminated property properly, may adversely affect the owner’s ability to borrow using such property as collateral. Furthermore, a person who arranges for the disposal or treatment of a hazardous or toxic substance at a property owned by another, or who transports such substance to or from such property, may be liable for the costs of removal or remediation of such substance released into the environment at the disposal or treatment facility. The costs of remediation or removal of such substances may be substantial, and the presence of such substances may adversely affect the owner’s ability to sell such real estate. In connection with the ownership of the hotels, we may be potentially liable for such costs.
We believe that our hotels are in compliance, in all material respects, with all federal, state and local environmental ordinances and regulations regarding hazardous or toxic substances and other environmental matters, the violation of which would have a material adverse effect on us. We have not received written notice from any governmental authority of any material noncompliance, liability or claim relating to hazardous or toxic substances or other environmental matters in connection with any of our present hotel properties.
Employees
As of February 27, 2007, we employed 16 persons, all of whom work at our corporate office in McLean, Virginia. All persons employed in the day-to-day operations of the hotels are employees of the management companies engaged by the TRS lessees to operate such hotels.
Executive Officers
The following table lists our executive officers as of February 27, 2007:
| | | | |
Name
| | Age
| | Position
|
James L. Francis | | 44 | | President, Chief Executive Officer and Director |
Tracy M.J. Colden | | 45 | | Executive Vice President, General Counsel and Secretary |
Patrick W. Campbell | | 44 | | Executive Vice President and Chief Investment Officer |
Douglas W. Vicari | | 47 | | Executive Vice President and Chief Financial Officer |
James L. Francis is our President and Chief Executive Officer. Mr. Francis served as the Chief Operating Officer, Chief Financial Officer and Treasurer of Barceló Crestline Corporation from June 2002 until the completion of our initial public offering and as Executive Vice President and Chief Financial Officer of Crestline Capital Corporation from December 1998 to June 2002. From June 1997 to December 1998, Mr. Francis held the position of Assistant Treasurer and Vice President Corporate Finance for Host Marriott Corporation.
10
Tracy M.J. Colden is our Executive Vice President, General Counsel and Secretary. Ms. Colden served as the Executive Vice President, General Counsel and Secretary of Barceló Crestline Corporation from June 2002 until the completion of our initial public offering and as Senior Vice President, General Counsel and Secretary of Crestline Capital Corporation from December 1998 to June 2002. From January 1996 to December 1998, Ms. Colden held various positions with Host Marriott Corporation, the last of which was Assistant General Counsel.
Patrick W. Campbell is our Executive Vice President and Chief Investment Officer. Mr. Campbell served as Senior Vice President of Acquisitions of Crestline Hotels & Resorts, Inc. from January 2003 until the completion of our initial public offering and as Vice President of Business Development of Crestline Capital Corporation from July 2000 to December 2002. From May 1998 to June 2000, Mr. Campbell held the position of Vice President of Acquisitions and Development with Bristol Hotels & Resorts, Inc., prior to its being acquired by Bass PLC (now Intercontinental Hotels Group).
Douglas W. Vicari is our Executive Vice President and Chief Financial Officer, a position he has held since September 2003. From August 1998 to July 2003, Mr. Vicari served as Senior Vice President and Chief Financial Officer of Prime Hospitality Corporation.
Available Information
We maintain an Internet site, www.highlandhospitality.com, which contains additional information concerning Highland Hospitality Corporation. We make available free of charge through our Internet site our filings with the Securities and Exchange Commission as soon as reasonably practicable after we electronically file such materials with, or furnish them to, the Securities and Exchange Commission. We also post on this website our Code of Business Conduct and Ethics, Principles of Corporate Governance, and the charters of our Audit, Compensation Policy, and Nominating and Corporate Governance Committees of our board of directors. We intend to disclose on our website any changes to, or waivers from, our Code of Business Conduct and Ethics. Information on our Internet site is neither part of nor incorporated into this Form 10-K.
11
Item 1A. Risk Factors
Risks Related to Our Organization and Structure
Our failure to qualify as a REIT under the federal tax laws would result in adverse tax consequences.
The U.S. federal income tax laws governing REITs are complex.
We intend to operate in a manner that will qualify us as a real estate investment trust, or REIT, under the U.S. federal income tax laws. The REIT qualification requirements are extremely complex, however, and interpretations of the U.S. federal income tax laws governing qualification as a REIT are limited. Accordingly, we cannot be certain that we will be successful in operating so we can qualify as a REIT. At any time, new laws, interpretations, or court decisions may change the federal tax laws or the U.S. federal income tax consequences of our qualification as a REIT.
Failure to qualify as a REIT would subject us to U.S. federal income tax and would subject us and our stockholders to other adverse consequences.
We believe that we have qualified for taxation as a REIT for federal income tax purposes commencing with our taxable year ended December 31, 2003. We intend to continue to operate as a REIT during future years, however, no assurance can be provided that we will qualify as a REIT. As a REIT, we generally will not be subject to federal income tax on our income that we distribute currently to our stockholders. Many of the REIT requirements are highly technical and complex. The determination that we are a REIT requires an analysis of various factual matters and circumstances that may not be totally within our control. For example, to qualify as a REIT, at least 95% of our gross income must come from sources that are itemized in the REIT tax laws. We generally are prohibited from owning more than 10% of the voting securities or more than 10% of the value of the outstanding securities of any one issuer, subject to certain exceptions, including an exception with respect to certain debt instruments and corporations electing to be taxable REIT subsidiaries. We are also required to distribute to stockholders at least 90% of our REIT taxable income (excluding capital gains). The fact that we hold most of our assets through the Operating Partnership further complicates the application of the REIT requirements. Even a technical or inadvertent mistake could jeopardize our REIT status. Furthermore, Congress or the Internal Revenue Service might make changes to the tax laws and regulations, or the courts might issue new rulings that make it more difficult, or impossible, for us to remain qualified as a REIT.
If we fail to qualify as a REIT for federal income tax purposes, and are unable to avail ourselves of certain savings provisions set forth in the Internal Revenue Code, we would be subject to federal income tax at regular corporate rates. As a taxable corporation, we would not be allowed to take a deduction for distributions to stockholders in computing our taxable income or pass through long term capital gains to individual stockholders at favorable rates. We also could be subject to the federal alternative minimum tax and possibly increased state and local taxes. We would not be able to elect to be taxed as a REIT for four years following the year we first failed to qualify unless the IRS were to grant us relief under certain statutory provisions. If we failed to qualify as a REIT, we would have to pay significant income taxes, which would reduce our net earnings available for investment or distribution to our stockholders. This likely would have a significant adverse effect on our results of operations and the value of our common shares. In addition, we would no longer be required to pay any distributions to stockholders and all of our distributions to stockholders would be taxable as regular corporate dividends to the extent of our current and accumulated earnings and profits. This means that stockholders taxed as individuals currently would be taxed on those dividends at capital gains rates and corporate stockholders generally would be entitled to the dividends received deduction with respect to such dividends, subject in each case, to applicable limitations under the Internal Revenue Code. If we fail to qualify as a REIT for federal income tax purposes and are able to avail ourselves of one or more of the statutory savings provisions in order to maintain our REIT status, we would nevertheless be required to pay penalty taxes of $50,000 or more for each such failure.
Failure to make required distributions would subject us to U.S. federal income tax.
In order to qualify as a REIT, each year we must pay out to our stockholders in distributions at least 90% of our taxable income, other than any net capital gains. To the extent that we satisfy this distribution requirement,
12
but distribute less than 100% of our taxable income, we will be subject to federal corporate income tax on our undistributed taxable income. In addition, we will be subject to a 4% nondeductible excise tax if the actual amount that we pay out to our stockholders in a calendar year is less than a minimum amount specified under federal tax laws. Our only source of funds to make these distributions comes from distributions that we receive from our Operating Partnership. Accordingly, we may be required to borrow money or sell assets to make distributions sufficient to enable us to pay out enough of our taxable income to satisfy the distribution requirement and to avoid corporate income tax and the 4% nondeductible excise tax in a particular year.
Our taxable REIT subsidiary lessees are subject to federal, state and local income taxes.
HHC TRS Holding Corporation, the sole owner of all of the lessees of our hotel properties organized as limited liability companies, or TRS lessees, is subject to U.S. federal income tax on its taxable income, which will consist of the revenues from the hotels leased by the TRS lessees, net of the operating expenses for such hotels and rent payments to us. Accordingly, although our ownership of the TRS lessees, through HHC TRS Holding Corporation, will allow us to participate in the operating income from our hotels in addition to receiving rent, that operating income will be fully subject to U.S. federal income tax. The after-tax net income of HHC TRS Holding Corporation is available for distribution to us.
We will incur a 100% excise tax on transactions with our TRS lessees that are not conducted on an arm’s-length basis. For example, to the extent that the rent paid by one of our TRS lessees to us exceeds an arm’s-length rental amount, such amount potentially will be subject to the excise tax. We intend that all transactions between us and our TRS lessees will be conducted on an arm’s-length basis and, therefore, that the rent paid by our TRS lessees to us will not be subject to the excise tax.
If our hotel leases are not respected as true leases for U.S. federal income tax purposes, we would fail to qualify as a REIT.
To qualify as a REIT, we must satisfy two gross income tests, under which specified percentages of our gross income must be passive income, like rent. For the rent paid pursuant to the leases, which constitutes substantially all of our gross income, to qualify for purposes of the gross income tests, the leases must be respected as true leases for U.S. federal income tax purposes and not be treated as service contracts, joint ventures or some other type of arrangement. We believe that the leases will be respected as true leases for U.S. federal income tax purposes. There can be no assurance, however, that the Internal Revenue Service will agree with this view.
If HHC TRS Holding Corporation fails to qualify as a taxable REIT subsidiary, we would fail to qualify as a REIT.
We are able to lease our hotel properties to the TRS lessees, relying on an exception from the general prohibition against leasing to a related-party tenant. This exception permits a REIT to lease hotel properties to its taxable REIT subsidiaries. As our TRS lessees are wholly owned by HHC TRS Holding Corporation, they are disregarded as separate entities for U.S. federal income tax purposes and the leases are treated as if made with HHC TRS Holding Corporation. So long as HHC TRS Holding Corporation qualifies as a taxable REIT subsidiary of ours, we can lease the hotel properties to HHC TRS Holding Corporation and receive rents that qualify as rents from real property for the REIT gross income test purposes. We believe that HHC TRS Holding Corporation qualifies to be treated as a taxable REIT subsidiary for U.S. federal income tax purposes. We cannot assure you, however, that the Internal Revenue Service will not challenge its status as a taxable REIT subsidiary for U.S. federal income tax purposes, or that a court would not sustain such a challenge. If the Internal Revenue Service were successful in disqualifying HHC TRS Holding Corporation from treatment as a taxable REIT subsidiary, we would fail to meet the asset tests applicable to REITs and substantially all of our income would fail to qualify for the gross income tests and, accordingly, we would fail to qualify as a REIT.
13
Despite our REIT status, we remain subject to various taxes.
Notwithstanding our status as a REIT, we are subject, through our ownership interest in our Operating Partnership and HHC TRS Holding Corporation, to certain U.S. federal, state and local taxes on our income and property. Moreover, if we have net income from “prohibited transactions,” that income will be subject to a 100% tax. In general, prohibited transactions are sales or other dispositions of property held primarily for sale to customers in the ordinary course of business. The determination as to whether a particular sale is a prohibited transaction depends on the facts and circumstances related to that sale. While we will undertake sales of assets if those assets become inconsistent with our long-term strategic or return objectives, we do not believe that those sales should be considered prohibited transactions, but there can be no assurance that the IRS would not contend otherwise. The need to avoid prohibited transactions could cause us to forego or defer sales of properties that might otherwise be in our best interest to sell.
If our Operating Partnership failed to qualify as a partnership for U.S. federal income tax purposes, we would cease to qualify as a REIT and suffer other adverse consequences.
We believe that our Operating Partnership qualifies to be treated as a partnership for U.S. federal income tax purposes. As a partnership, it is not subject to U.S. federal income tax on its income. Instead, each of its partners, including us, is required to pay tax on its allocable share of the Operating Partnership’s income. No assurance can be provided, however, that the Internal Revenue Service will not challenge its status as a partnership for U.S. federal income tax purposes, or that a court would not sustain such a challenge. If the Internal Revenue Service were successful in treating our Operating Partnership as a corporation for tax purposes, we would fail to meet the gross income tests and certain of the asset tests applicable to REITs and, accordingly, cease to qualify as a REIT. Also, the failure of our Operating Partnership to qualify as a partnership would cause it to become subject to U.S. federal and state corporate income tax, which would reduce significantly the amount of cash available for debt service and for distribution to its partners, including us.
Provisions of our charter may limit the ability of a third party to acquire control of our company.
Our ownership limitations may restrict or prevent you from engaging in certain transfers of our common stock.
In order to maintain our REIT qualification, no more than 50% in value of our outstanding stock may be owned, directly or indirectly, by five or fewer individuals (as defined in the U.S. federal income tax laws to include various kinds of entities) during the last half of any taxable year. To preserve our REIT qualification, our charter contains an aggregate share ownership limit and a common share ownership limit. Generally, any shares of our stock owned by affiliated owners will be added together for purposes of the aggregate share ownership limit, and any shares of common stock owned by affiliated owners will be added together for purposes of the common share ownership limit. Our charter provides that no person may directly or indirectly own more than 9.9% of the value of our outstanding shares of stock or more than 9.9% of the number of our outstanding shares of common stock. These ownership limitations may prevent an acquisition of control of our company by a third party without our board of directors’ approval, even if our stockholders believe the change of control is in their interest.
If anyone transfers shares in a way that would violate the aggregate share ownership limit or the common share ownership limit, or prevent us from continuing to qualify as a REIT under the U.S. federal income tax laws, we will consider the transfer to be null and void from the outset, and the intended transferee of those shares will be deemed never to have owned the shares or those shares instead will be transferred to a trust for the benefit of a charitable beneficiary and will be either redeemed by us or sold to a person whose ownership of the shares will not violate the aggregate share ownership limit or the common share ownership limit. Anyone who acquires shares in violation of the aggregate share ownership limit, the common share ownership limit or the other restrictions on transfer in our charter bears the risk of suffering a financial loss when the shares are redeemed or sold if the market price of our stock falls between the date of purchase and the date of redemption or sale.
14
Authority to issue stock.
Our charter authorizes our board of directors to issue up to 500,000,000 shares of common stock and up to 100,000,000 shares of preferred stock, to classify or reclassify any unissued shares of common stock or preferred stock and to set the preferences, rights and other terms of the classified or reclassified shares. Issuances of additional shares of stock may have the effect of delaying or preventing a change in control of our company, including transactions at a premium over the market price of our stock, even if stockholders believe that a change of control is in their interest.
Provisions of Maryland law may limit the ability of a third party to acquire control of our company.
Certain provisions of the Maryland General Corporation Law, or the MGCL, may have the effect of inhibiting a third party from making a proposal to acquire us or of impeding a change of control under circumstances that otherwise could provide the holders of shares of our common stock with the opportunity to realize a premium over the then prevailing market price of such shares, including:
| | • | | “business combination” provisions that, subject to limitations, prohibit certain business combinations between us and an “interested stockholder” (defined generally as any person who beneficially owns 10% or more of the voting power of our shares or an affiliate thereof) for five years after the most recent date on which the stockholder becomes an interested stockholder, and thereafter imposes special appraisal rights and special stockholder voting requirements on these combinations; and |
| | • | | “control share” provisions that provide that “control shares” of our company (defined as shares which, when aggregated with other shares controlled by the stockholder, entitle the stockholder to exercise one of three increasing ranges of voting power in electing directors) acquired in a “control share acquisition” (defined as the direct or indirect acquisition of ownership or control of “control shares”) have no voting rights except to the extent approved by our stockholders by the affirmative vote of at least two-thirds of all the votes entitled to be cast on the matter, excluding all interested shares. |
We have opted out of these provisions of the MGCL, in the case of the business combination provisions of the MGCL by resolution of our board of directors, and in the case of the control share provisions of the MGCL pursuant to a provision in our bylaws. However, our board of directors may by resolution elect to opt in to the business combination provisions of the MGCL and we may, by amendment to our bylaws, opt in to the control share provisions of the MGCL in the future.
Additionally, Title 3, Subtitle 8 of the MGCL permits our board of directors, without stockholder approval and regardless of what is currently provided in our charter or bylaws, to implement takeover defenses (for example, a classified board). These provisions may have the effect of inhibiting a third party from making an acquisition proposal for our company or of delaying, deferring or preventing a change in control of our company under the circumstances that otherwise could provide the holders of our common stock with the opportunity to realize a premium over the then current market price.
Risks Related to Our Business
The ability of our board of directors to change our major corporate policies may not be in your interest.
Our board of directors determines our major corporate policies, including our acquisition, financing, growth, operations and distribution policies. Our board may amend or revise these and other policies from time to time without the vote or consent of our stockholders.
Our success depends on key personnel whose continued service is not guaranteed.
We depend on the efforts and expertise of our President and Chief Executive Officer, our Executive Vice President and Chief Investment Officer, our Executive Vice President, General Counsel and Corporate Secretary and our Executive Vice President and Chief Financial Officer to manage our day-to-day operations and strategic business direction. The loss of any of their services could have an adverse effect on our operations.
15
We have conflicts of interest that may have affected the terms of our acquisition of our three initial properties and the related management agreements, as well as other management agreements we have subsequently entered into. We will have conflicts going forward with our chairman and one other director with respect to the management of our hotels by Barceló Crestline and the disposition of hotels acquired from Barceló Crestline.
There were conflicts of interest relating to the negotiation of the agreements pursuant to which we acquired interests in our three initial properties from Barceló Crestline. Bruce D. Wardinski, our chairman, was also the President and Chief Executive Officer of Barceló Crestline and served on an advisory committee of Barceló Corporación Empresarial, S.A., the parent company of Barceló Crestline. James L. Francis, another director and our President and Chief Executive Officer, was also the Chief Operating Officer and Chief Financial Officer of Barceló Crestline. In addition, two of our other senior executive officers were employees of Barceló Crestline at the time we negotiated and executed our agreements with Barceló Crestline to acquire our three initial properties, all of which are managed by a wholly owned subsidiary of Barceló Crestline under management contracts with our TRS lessees. Since then, subsidiaries of Barceló Crestline have also entered into similar agreements with our subsidiaries to manage 12 of our other 24 hotel properties. As a result, the agreements pursuant to which we acquired our initial properties and Barceló Crestline has agreed to manage the properties were not negotiated in an arm’s-length manner and the terms may be less favorable to us than we could have received from a third party.
Additionally, at the time of our IPO, we entered into a seven-year strategic alliance agreement with Barceló Crestline that requires Barceló Crestline, subject to certain exceptions, to refer to us, on an exclusive basis, any hotel investment opportunity which is presented to Barceló Crestline, and requires us to offer Barceló Crestline the opportunity to manage U.S. hotels that we acquire in the future unless a majority of our independent directors conclude in good faith for valid business reasons that another management company should manage one or more of such hotels. In addition to Mr. Wardinski, W. Reeder Glass, who became a director following the completion of the initial public offering, was at the time of his appointment and is also currently a director of Barceló Crestline and serves as Barceló Crestline’s designee pursuant to its right to nominate one director under the strategic alliance agreement. As a result, our board of directors may experience similar conflicts of interest with respect to any future acquisition of a hotel property by us from Barceló Crestline or its affiliates or in considering whether to engage Barceló Crestline to manage any of our hotel properties in the future.
In addition, because Barceló Crestline would receive a special allocation of taxable gain under the U.S. federal income tax rules relating to contributions of appreciated property to a partnership, if we dispose of one of more of our three initial properties in a taxable transaction, our board of directors may experience conflicts of interest with respect to any disposition of one or more of our three initial properties.
Our returns depend on management of our hotels by third parties.
In order to qualify as a REIT, we cannot operate our hotel properties or participate in the decisions affecting the daily operations of our hotels. Our TRS lessees may not operate the leased hotels and, therefore, they must enter into management agreements with eligible independent contractors which are not our subsidiaries or otherwise controlled by us to manage the hotels. Thus, independent hotel operators, under a management agreement with our TRS lessees, will control the daily operations of our hotels.
Under the terms of the management agreements that we have entered into with these management companies to date, our ability to participate in operating decisions regarding the hotels is limited. We depend on these independent management companies to adequately operate our hotels as provided in the management agreements. We do not have the authority to require any hotel to be operated in a particular manner or to govern any particular aspect of the daily operations of any hotel (for instance, setting room rates). Thus, even if we believe our hotels are being operated inefficiently or in a manner that does not result in satisfactory occupancy rates, revenue per available room, or RevPAR, and average daily rates, we may not be able to force the management company to change its method of operation of our hotels. We can only seek redress if a management company violates the terms of the applicable management agreement with a TRS lessee, and then
16
only to the extent of the remedies provided for under the terms of the management agreement. As a result, failure by our hotel managers to fully perform the duties agreed to in our management agreements could adversely affect our results of operations. In addition, our hotel managers manage, and in some cases own or have invested in, hotels that compete with our hotels, which may result in conflicts of interest. As a result, our hotel managers have in the past made and may in the future make decisions regarding competing lodging facilities that are not or would not be in our best interests. Additionally, in the event that we need to replace any of our management companies, we may be required by the terms of the management agreement to pay substantial termination fees and may experience significant disruptions at the affected hotels.
Our TRS lessee structure subjects us to the risk of increased hotel operating expenses.
Our leases with our TRS lessees will provide for the payment of rent based in part on revenues from our hotels. Our operating risks include not only changes in hotel revenues and changes to our lessee’s ability to pay the rent due under the leases, but also increased hotel operating expenses, including but not limited to the following:
| | • | | wage and benefit costs; |
| | • | | repair and maintenance expenses; |
| | • | | other operating expenses. |
Any increases in these operating expenses can have a significant adverse impact on our earnings and cash flow.
Operating our hotels under franchise agreements could adversely affect our distributions to our stockholders.
Our hotels will operate under franchise agreements, and we are subject to the risks that are found in concentrating our hotel investments in several franchise brands. These risks include reductions in business following negative publicity related to one of our brands.
The maintenance of the franchise licenses for our hotels is subject to our franchisors’ operating standards and other terms and conditions. Our franchisors periodically inspect our hotels to ensure that we and our lessees and management companies follow their standards. Failure by us, one of our TRS lessees or one of our management companies to maintain these standards or other terms and conditions could result in a franchise license being canceled. If a franchise license terminates due to our failure to make required improvements or to otherwise comply with its terms, we may also be liable to the franchisor for a termination payment, which varies by franchisor and by hotel. As a condition of our continued holding of a franchise license, a franchisor could also possibly require us to make capital expenditures, even if we do not believe the capital improvements are necessary or desirable or will result in an acceptable return on our investment. Nonetheless, we may risk losing a franchise license if we do not make franchisor-required capital expenditures.
If a franchisor terminates the franchise license, we may try either to obtain a suitable replacement franchise or to operate the hotel without a franchise license. The loss of a franchise license could materially and adversely affect the operations or the underlying value of the hotel because of the loss of associated name recognition, marketing support and centralized reservation systems provided by the franchisor. A loss of a franchise license for one or more hotels could materially and adversely affect our revenues. This loss of revenues could, therefore, also adversely affect our financial condition, results of operations and cash available for distribution to stockholders.
17
Our ability to make distributions to our stockholders may be affected by factors in the lodging industry.
Operating risks.
Our hotel properties are subject to various operating risks common to the lodging industry, many of which are beyond our control, including the following:
| | • | | competition from other hotel properties in our markets; |
| | • | | over-building of hotels in our markets, which adversely affects occupancy and revenues at our hotels; |
| | • | | dependence on business and commercial travelers and tourism; |
| | • | | increases in energy costs and other expenses affecting travel, which may affect travel patterns and reduce the number of business and commercial travelers and tourists; |
| | • | | increases in operating costs due to inflation and other factors that may not be offset by increased room rates; |
| | • | | changes in governmental laws and regulations, fiscal policies and zoning ordinances and the related costs of compliance with laws and regulations, fiscal policies and ordinances; |
| | • | | adverse effects of national, regional and local economic and market conditions; |
| | • | | adverse effects of a downturn in the lodging industry; and |
| | • | | risks generally associated with the ownership of hotel properties and real estate, as we discuss in detail below. |
These factors could reduce the net operating profits of our TRS lessees, which in turn could adversely affect our ability to make distributions to our stockholders.
We face competition for the acquisition of hotels, and we may not be able to complete acquisitions that we have identified.
One component of our business strategy is expansion through acquisitions, and we may not be successful in completing acquisitions that are consistent with our strategy. We compete with institutional pension funds, private equity investors, other REITs, owner-operators of hotels, franchise-owned hotels and others who are engaged in the acquisition of hotels. These competitors may affect the supply/demand dynamics and, accordingly, increase the price we must pay for hotels we seek to acquire, and these competitors may succeed in acquiring those hotels themselves. Also, our potential acquisition targets may find our competitors to be more attractive acquirors because they may have greater marketing and financial resources, may be willing to pay more, or may have a more compatible operating philosophy. In addition, the number of entities competing for suitable hotels may increase in the future, which would increase demand for these hotels and the prices we must pay to acquire them. If we pay higher prices for hotels, our profitability may be reduced. Also, once we have identified potential acquisitions, such acquisitions are subject to the satisfactory completion of due diligence, the negotiation and execution of definitive agreements and the satisfaction of customary closing conditions, and we cannot assure you that we will be able to reach acceptable terms with the sellers or that these conditions will be satisfied.
Seasonality of hotel business.
The hotel industry is seasonal in nature. This seasonality can be expected to cause quarterly fluctuations in our revenues. Our quarterly earnings may be adversely affected by factors outside our control, including weather conditions and poor economic factors. As a result, we may have to enter into short-term borrowings in certain quarters in order to offset these fluctuations in revenues and to make distributions to our stockholders.
18
Investment concentration in particular segments of single industry.
Our entire business is hotel-related. Therefore, a downturn in the lodging industry, in general, and the segments in which we operate, in particular, will have a material adverse effect on our lease revenues and the net operating profits of our TRS lessees and amounts available for distribution to our stockholders.
Capital expenditures.
Our hotel properties have an ongoing need for renovations and other capital improvements, including replacements, from time to time, of furniture, fixtures and equipment. The franchisors of our hotels also require periodic capital improvements as a condition of keeping the franchise licenses. In addition, our lenders require that we set aside annual amounts for capital improvements to our hotel properties. These capital improvements may give rise to the following risks:
| | • | | possible environmental problems; |
| | • | | construction cost overruns and delays; |
| | • | | a possible shortage of available cash to fund capital improvements and the related possibility that financing for these capital improvements may not be available to us on affordable terms; and |
| | • | | uncertainties as to market demand or a loss of market demand after capital improvements have begun. |
The costs of all these capital improvements could adversely affect our financial condition and amounts available for distribution to our stockholders.
The increasing use of Internet travel intermediaries by consumers may adversely affect our profitability.
Some of our hotel rooms will be booked through Internet travel intermediaries such as Travelocity.com, Expedia.com and Priceline.com. As these Internet bookings increase, these intermediaries may be able to obtain higher commissions, reduced room rates or other significant contract concessions from us and our management companies. Moreover, some of these Internet travel intermediaries are attempting to offer hotel rooms as a commodity, by increasing the importance of price and general indicators of quality (such as “three-star downtown hotel”) at the expense of brand identification. These agencies hope that consumers will eventually develop brand loyalties to their reservations system rather than to our lodging brands. Although most of the business for our hotels is expected to be derived from traditional channels, if the amount of sales made through Internet intermediaries increases significantly, room revenues may flatten or decrease and our profitability may be adversely affected.
The threat of terrorism has harmed the hotel industry generally and these harmful effects may continue or worsen, particularly if there are further terrorist events.
The threat of terrorism has had a negative impact on hotel operations and caused a significant decrease in hotel occupancy and average daily rates due to disruptions in business and leisure travel patterns and concerns about travel safety. Hotels in major metropolitan areas and near airports, such as many of our hotels, have been harmed due to concerns about air travel safety and a significant overall decrease in the amount of air travel, particularly transient business travel, which includes the corporate and premium business segments that generally pay the highest average room rates. Future terrorist acts in the U.S. and abroad, terrorism alerts or outbreaks of hostilities could have a negative effect on travel, and correspondingly, on our business.
The attacks of September 11, 2001 had a dramatic adverse impact on business and leisure travel, hotel occupancy and RevPAR. While there have been recent improvements, the uncertainty associated with the continuing war on terrorism, the U.S.-led military action in Iraq and Afghanistan, and the possibility of future attacks may negatively affect business and leisure travel patterns and, accordingly, the performance of our business.
19
Uninsured and underinsured losses could adversely affect our operating results and our ability to make distributions to our stockholders.
We maintain comprehensive insurance on each of our hotel properties, including terrorism, liability, fire and extended coverage, of the type and amount we believe are customarily obtained for or by hotel owners. There are no assurances that current coverage will continue to be available at reasonable rates. Because various types of catastrophic losses, such as those that may arise out of earthquakes and floods, may not be insurable at reasonable rates, we may not always obtain insurance against these losses. In the event of a substantial loss, our insurance coverage, if any, may not be sufficient to cover the full current market value or replacement cost of our lost investment. Should an uninsured loss or a loss in excess of insured limits occur, we could lose all or a portion of the capital we have invested in a hotel or resort, as well as the anticipated future revenue from the hotel or resort. In that event, we might nevertheless remain obligated for any mortgage debt or other financial obligations related to the property. Inflation, changes in building codes and ordinances, environmental considerations and other factors might also keep us from using insurance proceeds to replace or renovate a hotel after it has been damaged or destroyed. Under those circumstances, the insurance proceeds we receive might be inadequate to restore our economic position on the damaged or destroyed property.
Noncompliance with governmental regulations could adversely affect our operating results.
Environmental matters.
Our hotel properties are subject to various federal, state and local environmental laws. Under these laws, courts and government agencies have the authority to require us, as owner of a contaminated property, to clean up the property, even if we did not know of or were not responsible for the contamination. These laws also apply to persons who owned a property at the time it became contaminated. In addition to the costs of cleanup, environmental contamination can affect the value of a property and, therefore, an owner’s ability to borrow funds using the property as collateral or to sell the property. Under the environmental laws, courts and government agencies also have the authority to require that a person who sent waste to a waste disposal facility, such as a landfill or an incinerator, pay for the clean-up of that facility if it becomes contaminated and threatens human health or the environment. A person that arranges for the disposal or transports for disposal or treatment a hazardous substance at a property owned by another may be liable for the costs of removal or remediation of hazardous substances released into the environment at that property.
Furthermore, various court decisions have established that third parties may recover damages for injury caused by property contamination. For instance, a person exposed to asbestos while staying in a hotel may seek to recover damages if he or she suffers injury from the asbestos. Lastly, some of these environmental laws restrict the use of a property or place conditions on various activities. An example would be laws that require a business using chemicals (such as swimming pool chemicals at a hotel property) to manage them carefully and to notify local officials that the chemicals are being used.
We could be responsible for the costs discussed above. The costs to clean up a contaminated property, to defend against a claim, or to comply with environmental laws could be material and could adversely affect the funds available for distribution to our stockholders. We may have material environmental liabilities of which we are unaware. We can make no assurances that (1) future laws or regulations will not impose material environmental liabilities or (2) the current environmental condition of our hotel properties will not be affected by the condition of the properties in the vicinity of our hotel properties (such as the presence of leaking underground storage tanks) or by third parties unrelated to us.
Americans with Disabilities Act and other changes in governmental rules and regulations.
Under the Americans with Disabilities Act of 1990, or the ADA, all public accommodations must meet various federal requirements related to access and use by disabled persons. Compliance with the ADA’s requirements could require removal of access barriers, and non-compliance could result in the U.S. government
20
imposing fines or in private litigants winning damages. If we are required to make substantial modifications to our hotels, whether to comply with the ADA or other changes in governmental rules and regulations, our financial condition, results of operations and ability to make distributions to our stockholders could be adversely affected.
Unanticipated expenses and insufficient demand for hotels we open in new geographic markets could adversely affect our profitability and our ability to make distributions to our stockholders.
As part of our business plan, we may develop or acquire new hotels in geographic areas in which our management may have little or no operating experience and in which potential customers may not be familiar with our franchise brands. As a result, we may have to incur costs relating to the opening, operation and promotion of those new hotel properties that are substantially greater than those incurred in other areas. These hotels may attract fewer customers than our existing hotels, while at the same time, we may incur substantial additional costs with these new hotel properties. As a result, the results of operations at new hotel properties may be less than those of our existing hotels. Unanticipated expenses and insufficient demand at a new hotel property, therefore, could adversely affect our profitability and our ability to make distributions to our stockholders.
Our ability to maintain distributions to our stockholders is subject to fluctuations in our financial performance, operating results and capital improvements requirements.
As a REIT, we are required to distribute at least 90% of our taxable income (excluding net capital gains) each year to our stockholders. In the event of future downturns in our operating results and financial performance or unanticipated capital improvements to our hotels, including capital improvements which may be required by our franchisors, we may be unable to declare or pay distributions to our stockholders. The timing and amount of distributions are in the sole discretion of our board of directors which will consider, among other factors, our financial performance, debt service obligations and debt covenants, and capital expenditure requirements. We cannot assure you that we will continue to generate sufficient cash in order to fund distributions.
Among the factors which could adversely affect our results of operations and our distributions to stockholders are the failure of our TRS lessees to make required rent payments because of reduced net operating profits or operating losses; increased debt service requirements and capital expenditures at our hotels, including capital expenditures required by the franchisors of our hotels. Among the factors which could reduce the net operating profits of our TRS lessees are decreases in hotel revenues and increases in hotel operating expenses. Hotel revenue can decrease for a number of reasons, including increased competition from new supply of hotel rooms and decreased demand for hotel rooms. These factors can reduce both occupancy and room rates at our hotels.
We lease all of our hotels to our TRS lessees. These TRS lessees are subject to hotel operating risks, including risks of sustaining operating losses after payment of hotel operating expenses, including management fees. These risks can affect adversely the net operating profits of our TRS lessees, our operating expenses, and our ability to make distributions to our stockholders.
The hotel business is capital intensive and our inability to obtain financing could limit our growth.
Our hotel properties will require periodic capital expenditures and renovation to remain competitive. Acquisitions or development of additional hotel properties will require significant capital expenditures. We may not be able to fund capital improvements or acquisitions solely from cash provided from our operating activities because we must distribute at least 90% of our taxable income (net of capital gains) each year to maintain our REIT tax status. As a result, our ability to fund capital expenditures, acquisitions or hotel development through retained earnings is very limited. Consequently, we rely upon the availability of debt or equity capital to fund hotel acquisitions and improvements. Our ability to grow through acquisitions or development of hotels could be hampered by a number of factors, many of which are outside of our control, including, without limitation, declining general market conditions, unfavorable market perception of our growth potential, decreases in our
21
current and estimated future earnings, excessive cash distributions or decreases in the market price of our common stock. In addition, our ability to access additional capital may also be limited by the terms of our existing indebtedness, which, among other things, restricts our incurrence of debt and the payment of distributions. The occurrence of any of these above-mentioned factors, individually or in combination, could prevent us from being able to obtain the external capital we require on terms that are acceptable to us or at all and the failure to obtain necessary external capital could have a material adverse affect on our ability to finance our future growth.
General Risks Related to the Real Estate Industry
Illiquidity of real estate investments could significantly impede our ability to respond to adverse changes in the performance of our properties and harm our financial condition.
Because real estate investments are relatively illiquid, our ability to promptly sell one or more hotel properties in our portfolio in response to changing economic, financial and investment conditions is limited. The real estate market is affected by many factors that are beyond our control, including:
| | • | | adverse changes in national, regional and local economic and market conditions; |
| | • | | changes in interest rates and in the availability, cost and terms of debt financing; |
| | • | | changes in governmental laws and regulations, fiscal policies and zoning ordinances and the related costs of compliance with laws and regulations, fiscal policies and ordinances; |
| | • | | the ongoing need for capital improvements, particularly in older structures; |
| | • | | changes in operating expenses; and |
| | • | | civil unrest, acts of God, including earthquakes, floods and other natural disasters, which may result in uninsured losses, and acts of war or terrorism, including the consequences of terrorist acts such as those that occurred on September 11, 2001. |
We may decide to sell our hotels in the future. We cannot predict whether we will be able to sell any hotel property for the price or on the terms set by us, or whether any price or other terms offered by a prospective purchaser would be acceptable to us. We also cannot predict the length of time needed to find a willing purchaser and to close the sale of a hotel property.
We may be required to expend funds to correct defects or to make improvements before a hotel property can be sold. We cannot assure you that we will have funds available to correct those defects or to make those improvements. In acquiring a hotel property, we may agree to lock-out provisions that materially restrict us from selling that property for a period of time or impose other restrictions, such as a limitation on the amount of debt that can be placed or repaid on that property. These factors and any others that would impede our ability to respond to adverse changes in the performance of our properties could have a material adverse effect on our operating results and financial condition, as well as our ability to pay distributions to stockholders.
Increases in our property taxes would adversely affect our ability to make distributions to our stockholders.
Each of our hotels will be subject to real and personal property taxes. These taxes on our hotel properties may increase as tax rates change and as the properties are assessed or reassessed by taxing authorities. If property taxes increase, our ability to make distributions to our stockholders would be adversely affected.
Future debt service obligations could adversely affect our overall operating results and may require us to sell assets to meet our payment obligations.
While we have adopted a target debt level of 40-50% of historical asset cost, because neither our charter nor our bylaws limits the amount of debt that we can incur, our board of directors may change this debt policy at any
22
time without stockholder approval. We and our subsidiaries may be able to incur substantial additional debt, including secured debt, in the future. Incurring debt could subject us to many risks, including the risks that:
| | • | | our cash flow from operations will be insufficient to make required payments of principal and interest; |
| | • | | our debt may increase our vulnerability to adverse economic and industry conditions; |
| | • | | we may be required to dedicate a substantial portion of our cash flow from operations to payments on our debt, thereby reducing cash available for distribution to our stockholders, funds available for operations and capital expenditures, future business opportunities or other purposes; and |
| | • | | the terms of any refinancing will not be as favorable as the terms of the debt being refinanced. |
If we violate covenants in our future indebtedness agreements, we could be required to repay all or a portion of our indebtedness before maturity at a time when we might be unable to arrange financing for such repayment on attractive terms, if at all.
If we obtain debt in the future and do not have sufficient funds to repay our debt at maturity, it may be necessary to refinance this debt through additional debt financing, private or public offerings of debt securities, or additional equity financings. If, at the time of any refinancing, prevailing interest rates or other factors result in higher interest rates on refinancings, increases in interest expense could adversely affect our cash flow, and, consequently, cash available for distribution to our stockholders. If we are unable to refinance our debt on acceptable terms, we may be forced to dispose of hotel properties on disadvantageous terms, potentially resulting in losses adversely affecting cash flow from operating activities. We may place mortgages on our hotel properties to secure our line of credit or other debt. To the extent we cannot meet our debt service obligations, we risk losing some or all of those properties to foreclosure. Also, covenants applicable to our debt could impair our planned strategies and, if violated, result in a default of our debt obligations.
Higher interest rates could increase debt service requirements on our floating rate debt and could reduce the amounts available for distribution to our stockholders, as well as reducing funds available for our operations, future business opportunities, or other purposes. We may obtain in the future one or more forms of interest rate protection—in the form of swap agreements, interest rate cap contracts or similar agreements—to “hedge” against the possible negative effects of interest rate fluctuations. However, we cannot assure you that any hedging will adequately relieve the adverse effects of interest rate increases or that counterparties under these agreement will honor their obligations thereunder. Adverse economic conditions could also cause the terms on which we borrow to be unfavorable. We could be required to liquidate one or more of our hotel investments at times which may not permit us to receive an attractive return on our investments in order to meet our debt service obligations.
Our ability to pay dividends on our common stock may be limited or prohibited by the terms of our indebtedness.
We have an unsecured revolving credit facility with a syndicate of banks, which provides for a maximum borrowing of up to $200 million. The facility matures on February 23, 2009 and has a one-year extension option. The facility contains financial covenants that could limit our ability to pay dividends on our common stock. Under the terms of the facility, provided no event of default has occurred, we may pay dividends on, or repurchase, shares of our common stock so long as the payments, together with the previous such cash payments in the same fiscal year, are not in excess of the greater of (i) 95% of our funds from operations during such fiscal year, and (ii) the amount required (on an annualized basis) for us to maintain our status as a REIT. The facility’s financial covenants could adversely affect our financial condition.
In addition, we and our subsidiaries, including our Operating Partnership, are, and may in the future become, parties to loan agreements and other arrangements which further restrict or prevent the payment of dividends on our classes and series of capital stock before certain financial or operational thresholds are met.
23
Market interest rates may affect the price of shares of our common stock.
We believe that one of the factors that investors consider important in deciding whether to buy or sell shares of a REIT is the distribution rate on the shares, considered as a percentage of the price of the shares, relative to market interest rates. If market interest rates increase, prospective purchasers of REIT shares may expect a higher distribution rate. Thus, higher market interest rates could cause the market price of our shares to go down.
Item 1B. Unresolved Staff Comments
Not applicable.
24
Item 2. Properties
As of February 27, 2007, we owned the following 27 hotel properties:
| | | | |
Property
| | Number of
Rooms
| | Location
|
Full Service: | | | | |
Portsmouth Renaissance and Conference Center | | 249 | | Portsmouth, VA |
Nashville Renaissance | | 673 | | Nashville, TN |
Sugar Land Marriott and Conference Center | | 300 | | Sugar Land, TX |
Plaza San Antonio Marriott | | 252 | | San Antonio, TX |
Dallas/Fort Worth Airport Marriott | | 491 | | Dallas/Fort Worth, TX |
Omaha Marriott | | 299 | | Omaha, NE |
Ritz-Carlton Atlanta Downtown | | 444 | | Atlanta, GA |
Hyatt Regency Savannah | | 351 | | Savannah, GA |
Hyatt Regency Wind Watch Long Island | | 358 | | Hauppauge, NY |
Hilton Tampa Westshore | | 238 | | Tampa, FL |
Hilton Parsippany | | 509 | | Parsippany, NJ |
Hilton Boston Back Bay | | 385 | | Boston, MA |
Pointe Hilton Tapatio Cliffs | | 585 | | Phoenix, AZ |
Crowne Plaza Atlanta-Ravinia | | 495 | | Atlanta, GA |
Sheraton Annapolis | | 196 | | Annapolis, MD |
Westin Princeton at Forrestal Village | | 294 | | Princeton, NJ |
Wyndham Palm Springs | | 410 | | Palm Springs, CA |
The Churchill | | 144 | | Washington, DC |
The Melrose | | 240 | | Washington, DC |
The Silversmith | | 143 | | Chicago, IL |
| | |
| | |
| | | 7,056 | | |
| | |
| | |
Limited Service: | | | | |
Hilton Garden Inn Virginia Beach Town Center | | 176 | | Virginia Beach, VA |
Hilton Garden Inn BWI Airport | | 158 | | Linthicum, MD |
Courtyard Savannah Historic District | | 156 | | Savannah, GA |
Courtyard Boston Tremont | | 315 | | Boston, MA |
Courtyard Denver Airport | | 202 | | Denver, CO |
Courtyard Gaithersburg Washingtonian Center | | 210 | | Gaithersburg, MD |
| | |
| | |
| | | 1,217 | | |
| | |
| | |
Extended Stay: | | | | |
Residence Inn Tampa Downtown | | 109 | | Tampa, FL |
| | |
| | |
Total number of rooms | | 8,382 | | |
| | |
| | |
Item 3. Legal Proceedings
We are not involved in any material litigation nor, to our knowledge, is any material litigation threatened against us.
Item 4. Submission of Matters to a Vote of Security Holders
No matters were submitted to a vote of our stockholders during the fourth quarter of the fiscal year ended December 31, 2006.
25
PART II
Item 5. Market for Registrant’s Common Equity, Related Stockholder Matters and Issuer Purchases of Equity Securities
Market Information
Our common stock trades on the New York Stock Exchange under the symbol “HIH”. The following table sets forth, for the indicated period, the high and low closing prices for the common stock, as reported on the New York Stock Exchange:
| | | | | | |
| | | Price Range
|
| | | High
| | Low
|
Year Ended December 31, 2005 | | | | | | |
First Quarter | | $ | 11.10 | | $ | 10.05 |
Second Quarter | | $ | 11.13 | | $ | 10.24 |
Third Quarter | | $ | 12.12 | | $ | 10.25 |
Fourth Quarter | | $ | 11.05 | | $ | 9.95 |
Year Ended December 31, 2006 | | | | | | |
First Quarter | | $ | 12.90 | | $ | 10.82 |
Second Quarter | | $ | 14.08 | | $ | 11.87 |
Third Quarter | | $ | 14.87 | | $ | 13.16 |
Fourth Quarter | | $ | 14.97 | | $ | 13.12 |
Year Ending December 31, 2007 | | | | | | |
First Quarter (through February 23, 2007) | | $ | 17.29 | | $ | 14.00 |
The closing price of our common stock on the New York Stock Exchange on February 23, 2007 was $16.86 per share.
Distribution Information
In order to maintain our qualification as a REIT, we must make annual distributions to our stockholders of at least 90% of our taxable income (excluding net capital gains). For federal income tax purposes, distributions that we make may consist of ordinary income, capital gains, nontaxable return of capital or a combination of those items. Distributions that exceed our current and accumulated earnings and profits (calculated for tax purposes) constitute a return of capital rather than a dividend, which reduces a stockholder’s basis in the shares of common stock and will not be taxable to the extent that the distribution equals or is less than the stockholder’s basis in the stock. To the extent that a distribution exceeds both current and accumulated earnings and profits and the stockholder’s basis in the stock, that distribution will be treated as a gain from the sale or exchange of that stockholder’s shares. Every year, we notify stockholders of the taxable composition of distributions paid during the preceding year. The following characterizes distributions paid per common share and preferred share for the years ended December 31, 2006, 2005 and 2004:
| | | | | | | | | | | | | | | | | | |
| | | 2006
| | | 2005
| | | 2004
| |
| | | $
| | %
| | | $
| | %
| | | $
| | %
| |
Common shares | | | | | | | | | | | | | | | | | | |
Ordinary income | | $ | .4415 | | 65.90 | % | | $ | .3042 | | 54.33 | % | | $ | .1767 | | 80.31 | % |
Return of capital | | | .0975 | | 14.55 | % | | | .2558 | | 45.67 | % | | | .0433 | | 19.69 | % |
Capital gain distribution | | | .1310 | | 19.55 | % | | | — | | — | | | | — | | — | |
| | |
|
| |
|
| |
|
| |
|
| |
|
| |
|
|
| | | $ | .6700 | | 100.00 | % | | $ | .5600 | | 100.00 | % | | $ | .2200 | | 100.00 | % |
| | |
|
| |
|
| |
|
| |
|
| |
|
| |
|
|
Series A preferred shares(1) | | | | | | | | | | | | | | | | | | |
Ordinary income | | $ | 1.5183 | | 77.12 | % | | $ | .1859 | | 100.00 | % | | | | | | |
Return of capital | | | — | | — | | | | — | | — | | | | | | | |
Capital gain distribution | | | .4504 | | 22.88 | % | | | — | | — | | | | | | | |
| | |
|
| |
|
| |
|
| |
|
| | | | | | |
| | | $ | 1.9688 | | 100.00 | % | | $ | .1859 | | 100.00 | % | | | | | | |
| | |
|
| |
|
| |
|
| |
|
| | | | | | |
| (1) | | per share amounts may not add due to rounding. |
26
We intend to continue to declare quarterly distributions to our stockholders. The amount of our future distributions will be based upon quarterly operating results, general economic conditions, capital requirements, the Internal Revenue Code’s annual distribution requirements, and other factors which our board of directors deems relevant.
The terms of our revolving credit facility limit our ability to pay dividends on our common stock. Under the terms of the facility, provided no event of default thereunder has occurred, we may pay dividends on, or repurchase, shares of our common stock so long as the payments, together with the previous such cash payments in the same fiscal year, are not in excess of the greater of (i) 95% of our funds from operations during such fiscal year and (ii) the amount required (on an annualized basis) for us to maintain our status as a REIT.
Stockholder Information
As of February 16, 2007, there were 31 record holders of our common stock, including shares held in “street name” by nominees who are record holders.
In order to comply with certain requirements related to our qualification as a REIT, our charter, subject to certain exceptions, limits the number of common shares that may be owned by any single person or affiliated group to 9.9% of the outstanding common shares.
Issuer Purchases of Equity Securities
The following table provides information about our purchases of our common stock within the fourth quarter of the year ended December 31, 2006:
| | | | | | | | | |
Period
| | Total Number
of Shares
Purchased
| | Average Price
Paid Per Share
| | Total Number of
Shares Purchased
as Part of
Publicly
Announced Plans
or Programs
| | Approximate Dollar
Value of Shares
that May Yet Be Purchased
Under the Plans or
Programs
|
October 1, 2006—October 31, 2006 | | 2,250 | | $ | 14.00 | | n/a | | n/a |
November 1, 2006—November 30, 2006 | | 4,294 | | $ | 13.53 | | n/a | | n/a |
December 1, 2006—December 31, 2006 | | 40,950 | | $ | 13.83 | | n/a | | n/a |
| | |
| | | | | | | |
Total | | 47,494 | | $ | 13.81 | | n/a | | n/a |
We do not currently have a repurchase plan or program in place. However, we do provide employees, who have been issued shares of restricted common stock, the option of selling shares to us to satisfy the minimum statutory tax withholding requirements on the date their shares vest. The shares of common stock purchased in the fourth quarter 2006 related to such repurchases.
Item 6. Selected Financial Data
The following table sets forth selected historical financial data for Highland Hospitality Corporation beginning with its commencement of operations on December 19, 2003. Prior to December 19, 2003, the table sets forth selected historical financial data for Portsmouth Hotel Associates, LLC, which was acquired by us concurrent with the completion of our IPO on December 19, 2003. Portsmouth Hotel Associates, LLC, which leases the Portsmouth Renaissance hotel and conference center, was owned 66.7% by Barceló Crestline, which was the sponsor of our formation and IPO. Portsmouth Hotel Associates, LLC is considered the predecessor to Highland Hospitality Corporation for accounting purposes.
The selected historical financial data for Highland Hospitality Corporation for the years ended December 31, 2006, 2005 and 2004 and the period from December 19, 2003 through December 31, 2003, and the selected historical financial data for Portsmouth Hotel Associates, LLC for the period from January 1, 2003 through December 18, 2003 and the year ended December 31, 2002 have been derived from the historical
27
financial statements of Highland Hospitality Corporation and Portsmouth Hotel Associates, LLC. The following selected historical financial data should be read in conjunction with “Management’s Discussion and Analysis of Financial Condition and Results of Operations” and the financial statements and notes thereto, both included elsewhere in this Form 10-K (in thousands, except per share data).
| | | | | | | | | | | | | | | | | | | | | | | | |
| | | Highland Hospitality Corporation
| | | The Predecessor
| |
| | | Year Ended December 31,
| | | Period From
December 19, 2003 to December 31, 2003
| | | Period From
January 1, 2003 to December 18, 2003
| | | Year Ended
December 31, 2002
| |
| | | 2006
| | | 2005
| | | 2004
| | | | |
Statement of Operations Data: | | | | | | | | | | | | | | | | | | | | | | | | |
Revenues | | $ | 422,588 | | | $ | 238,767 | | | $ | 130,971 | | | $ | 683 | | | $ | 10,656 | | | $ | 10,881 | |
Hotel operating expenses, excluding depreciation and amortization | | | 301,068 | | | | 174,253 | | | | 99,516 | | | | 760 | | | | 9,110 | | | | 9,182 | |
Depreciation and amortization | | | 43,341 | | | | 22,845 | | | | 11,449 | | | | 108 | | | | 670 | | | | 679 | |
Corporate general and administrative | | | 15,092 | | | | 9,667 | | | | 9,536 | | | | 2,894 | | | | — | | | | — | |
Operating income (loss) | | | 63,087 | | | | 32,002 | | | | 10,470 | | | | (3,079 | ) | | | 876 | | | | 1,020 | |
Interest income | | | 1,839 | | | | 1,819 | | | | 1,206 | | | | 65 | | | | 4 | | | | 17 | |
Interest expense | | | 38,929 | | | | 24,683 | | | | 8,406 | | | | — | | | | 987 | | | | 967 | |
Income (loss) from continuing operations | | | 21,984 | | | | 8,873 | | | | 4,209 | | | | (2,673 | ) | | | (107 | ) | | | 70 | |
Income from discontinued operations | | | 10,891 | | | | 800 | | | | 57 | | | | — | | | | — | | | | — | |
Net income (loss) | | | 32,875 | | | | 9,673 | | | | 4,266 | | | | (2,673 | ) | | | (107 | ) | | | 70 | |
Net income (loss) available to common stockholders | | | 26,575 | | | | 8,046 | | | | 4,266 | | | | (2,673 | ) | | | (107 | ) | | | 70 | |
Net income (loss) per common share: | | | | | | | | | | | | | | | | | | | | | | | | |
Basic: | | | | | | | | | | | | | | | | | | | | | | | | |
Continuing operations | | | .26 | | | | .16 | | | | .10 | | | | (.07 | ) | | | — | | | | — | |
Discontinued operations | | | .19 | | | | .02 | | | | — | | | | — | | | | — | | | | — | |
Net income available to common stockholders(1) | | | .45 | | | | .18 | | | | .10 | | | | — | | | | — | | | | — | |
Diluted: | | | | | | | | | | | | | | | | | | | | | | | | |
Continuing operations | | | .26 | | | | .16 | | | | .10 | | | | (.07 | ) | | | — | | | | — | |
Discontinued operations | | | .19 | | | | .02 | | | | — | | | | — | | | | — | | | | — | |
Net income available to common stockholders(1) | | | .44 | | | | .18 | | | | .10 | | | | — | | | | — | | | | — | |
| | | | | | |
Other Financial Data: | | | | | | | | | | | | | | | | | | | | | | | | |
Adjusted FFO available to common stockholders(2) | | | 62,702 | | | | 32,104 | | | | 15,830 | | | | (2,565 | ) | | | 563 | | | | 749 | |
Adjusted EBITDA(3) | | | 108,641 | | | | 57,157 | | | | 21,967 | | | | (2,907 | ) | | | 1,546 | | | | 1,699 | |
Net cash provided by (used in): | | | | | | | | | | | | | | | | | | | | | | | | |
Operating activities | | | 82,486 | | | | 34,248 | | | | 22,609 | | | | 568 | | | | (89 | ) | | | 880 | |
Investing activities | | | (307,643 | ) | | | (356,787 | ) | | | (470,617 | ) | | | (137,934 | ) | | | (396 | ) | | | (99 | ) |
Financing activities | | | 197,698 | | | | 311,819 | | | | 297,859 | | | | 362,996 | | | | (555 | ) | | | (297 | ) |
| (1) | | per share amounts may not add due to rounding. |
| | | | | | | | | | | | | | | |
| | | Highland Hospitality Corporation As of December 31,
| | The Predecessor
As of December 31, 2002
|
| | | 2006
| | 2005
| | 2004
| | 2003
| |
Balance Sheet Data: | | | | | | | | | | | | | | | |
Cash and cash equivalents | | $ | 37,302 | | $ | 64,761 | | $ | 75,481 | | $ | 225,630 | | $ | 1,975 |
Investment in hotel properties, net | | | 1,207,812 | | | 910,532 | | | 578,715 | | | 147,562 | | | 11,090 |
Total assets | | | 1,313,197 | | | 1,056,831 | | | 724,641 | | | 379,488 | | | 13,717 |
Long-term debt | | | 646,432 | | | 494,799 | | | 342,854 | | | — | | | 12,040 |
Minority interest in operating partnership | | | 4,497 | | | 4,500 | | | 8,321 | | | 8,457 | | | — |
Total stockholders’ equity | | | 605,637 | | | 524,324 | | | 347,478 | | | 355,263 | | | 650 |
| (2) | | Adjusted FFO available to common stockholders—Adjusted FFO available to common stockholders is defined as net income (loss) available to common stockholders, excluding depreciation and amortization, gains (losses) on sales of hotel properties, and certain other non-recurring items. Historical cost accounting for real estate assets implicitly assumes that the value of real estate assets diminishes predictably over time. Since real estate values instead have historically risen or fallen with market conditions, most industry investors |
28
| | have considered presentations of operating results for real estate companies that use historical cost accounting to be insufficient by themselves. Accordingly, we believe that adjusted FFO available to common stockholders is a useful financial measure for investors and management because it provides another indication of our performance, excluding real estate related depreciation and amortization. We also exclude gains (losses) on sales of hotel properties and certain other non-recurring items, such as gains (losses) on early extinguishments of debt, from net income (loss) available to common stockholders because we believe that by excluding non-recurring items, investors and management are provided a more comparable financial measure of our operating performance. |
The following table reconciles adjusted FFO available to common stockholders to net income (loss) available to common stockholders (in thousands):
| | | | | | | | | | | | | | | | | | | | | | | | |
| | | Highland Hospitality Corporation
| | | The Predecessor
| |
| | | Year Ended December 31,
| | | Period From
December 19, 2003 to December 31, 2003
| | | Period From
January 1, 2003 to December 18, 2003
| | | Year Ended December 31, 2002
| |
| | | 2006
| | | 2005
| | | 2004
| | | | |
Net income (loss) available to common stockholders | | $ | 26,575 | | | $ | 8,046 | | | $ | 4,266 | | | $ | (2,673 | ) | | $ | (107 | ) | | $ | 70 | |
Adjustments: | | | | | | | | | | | | | | | | | | | | | | | | |
Depreciation and amortization | | | 43,341 | | | | 22,845 | | | | 11,449 | | | | 108 | | | | 670 | | | | 679 | |
Depreciation and amortization from discontinued operations | | | 1,032 | | | | 1,213 | | | | 115 | | | | — | | | | — | | | | — | |
Gain on sale of hotel properties | | | (9,242 | ) | | | — | | | | — | | | | — | | | | — | | | | — | |
| | |
|
|
| |
|
|
| |
|
|
| |
|
|
| |
|
|
| |
|
|
|
FFO available to common stockholders | | | 61,706 | | | | 32,104 | | | | 15,830 | | | | (2,565 | ) | | | 563 | | | | 749 | |
Adjustment: | | | | | | | | | | | | | | | | | | | | | | | | |
Loss on early extinguishment of debt | | | 996 | | | | — | | | | — | | | | — | | | | — | | | | — | |
| | |
|
|
| |
|
|
| |
|
|
| |
|
|
| |
|
|
| |
|
|
|
Adjusted FFO available to common stockholders | | $ | 62,702 | | | $ | 32,104 | | | $ | 15,830 | | | $ | (2,565 | ) | | $ | 563 | | | $ | 749 | |
| | |
|
|
| |
|
|
| |
|
|
| |
|
|
| |
|
|
| |
|
|
|
(3) Adjusted EBITDA—EBITDA is defined as net income before interest, income taxes and depreciation and amortization. We believe it is a useful financial measure for investors and management because it provides an indication of the operating performance of our hotel properties and is not impacted by our capital structure. We further adjust EBITDA to exclude gains (losses) on sales of hotel properties and certain other non-recurring items, such as gains (losses) on early extinguishments of debt, because we believe that by excluding non-recurring items, investors and management are provided a more comparable financial measure of our operating performance. The following table reconciles adjusted EBITDA to net income (loss) (in thousands): | |
| | | Highland Hospitality Corporation
| | | The Predecessor
| |
| | | Year Ended December 31,
| | | Period From
December 19, 2003 to December 31, 2003
| | | Period From
January 1, 2003 to December 18, 2003
| | | Year Ended December 31, 2002
| |
| | | 2006
| | | 2005
| | | 2004
| | | | |
Net income (loss) | | $ | 32,875 | | | $ | 9,673 | | | $ | 4,266 | | | $ | (2,673 | ) | | $ | (107 | ) | | $ | 70 | |
Adjustments: | | | | | | | | | | | | | | | | | | | | | | | | |
Depreciation and amortization | | | 43,341 | | | | 22,845 | | | | 11,449 | | | | 108 | | | | 670 | | | | 679 | |
Interest expense | | | 38,929 | | | | 24,683 | | | | 8,406 | | | | — | | | | 987 | | | | 967 | |
Interest income | | | (1,839 | ) | | | (1,819 | ) | | | (1,206 | ) | | | (65 | ) | | | (4 | ) | | | (17 | ) |
Income tax expense (benefit) | | | 2,731 | | | | 114 | | | | (1,040 | ) | | | (277 | ) | | | — | | | | — | |
Discontinued operations(1) | | | 951 | | | | 1,661 | | | | 92 | | | | — | | | | — | | | | — | |
| | |
|
|
| |
|
|
| |
|
|
| |
|
|
| |
|
|
| |
|
|
|
EBITDA | | | 116,988 | | | | 57,157 | | | | 21,967 | | | | (2,907 | ) | | | 1,546 | | | | 1,699 | |
Adjustments: | | | | | | | | | | | | | | | | | | | | | | | | |
Loss on early extinguishment of debt | | | 996 | | | | — | | | | — | | | | — | | | | — | | | | — | |
Gain on sale of hotel properties | | | (9,343 | ) | | | — | | | | — | | | | — | | | | — | | | | — | |
| | |
|
|
| |
|
|
| |
|
|
| |
|
|
| |
|
|
| |
|
|
|
Adjusted EBITDA | | $ | 108,641 | | | $ | 57,157 | | | $ | 21,967 | | | $ | (2,907 | ) | | $ | 1,546 | | | $ | 1,699 | |
| | |
|
|
| |
|
|
| |
|
|
| |
|
|
| |
|
|
| |
|
|
|
| (1) | | reflects depreciation and amortization, interest expense and income taxes included in discontinued operations |
The calculation of adjusted FFO available to common stockholders and adjusted EBITDA may vary from entity to entity, and as such, the presentation of these non-GAAP financial measures by us may not be comparable to adjusted FFO available to common stockholders and adjusted EBITDA reported by other REITs.
29
Item 7. Management’s Discussion and Analysis of Financial Condition and Results of Operations
Overview
Highland Hospitality Corporation is a self-advised REIT that was incorporated in the state of Maryland and owns upscale full-service, premium limited-service, and extended-stay properties located in major convention, business, resort and airport markets in the United States. We commenced operations on December 19, 2003 when we completed our IPO and concurrently acquired our first three hotel properties. As of December 31, 2006, we owned the following 26 hotel properties:
| | | | | | |
Property
| | Number of
Rooms
| | Location
| | Acquired
|
Portsmouth Renaissance and Conference Center | | 249 | | Portsmouth, VA | | December 19, 2003 |
Sugar Land Marriott and Conference Center | | 300 | | Sugar Land, TX | | December 19, 2003 |
Hilton Garden Inn Virginia Beach Town Center | | 176 | | Virginia Beach, VA | | December 19, 2003 |
Plaza San Antonio Marriott | | 252 | | San Antonio, TX | | December 29, 2003 |
Hyatt Regency Savannah | | 351 | | Savannah, GA | | December 30, 2003 |
Hilton Tampa Westshore | | 238 | | Tampa, FL | | January 8, 2004 |
Hilton Garden Inn BWI Airport | | 158 | | Linthicum, MD | | January 12, 2004 |
Dallas/Fort Worth Airport Marriott | | 491 | | Dallas/Fort Worth, TX | | May 10, 2004 |
Residence Inn Tampa Downtown | | 109 | | Tampa, FL | | August 2, 2004 |
Courtyard Savannah Historic District | | 156 | | Savannah, GA | | August 2, 2004 |
Hyatt Regency Wind Watch Long Island | | 358 | | Hauppauge, NY | | August 19, 2004 |
Courtyard Boston Tremont | | 315 | | Boston, MA | | August 19, 2004 |
Crowne Plaza Atlanta-Ravinia | | 495 | | Atlanta, GA | | August 19, 2004 |
Hilton Parsippany | | 509 | | Parsippany, NJ | | August 19, 2004 |
Omaha Marriott | | 299 | | Omaha, NE | | September 15, 2004 |
Courtyard Denver Airport | | 202 | | Denver, CO | | September 17, 2004 |
Sheraton Annapolis | | 196 | | Annapolis, MD | | February 4, 2005 |
Wyndham Palm Springs | | 410 | | Palm Springs, CA | | July 14, 2005 |
Hilton Boston Back Bay | | 385 | | Boston, MA | | October 24, 2005 |
Westin Princeton at Forrestal Village | | 294 | | Princeton, NJ | | November 15, 2005 |
The Churchill | | 144 | | Washington, DC | | December 9, 2005 |
Nashville Renaissance | | 673 | | Nashville, TN | | February 24, 2006 |
The Melrose | | 240 | | Washington, DC | | March 15, 2006 |
Pointe Hilton Tapatio Cliffs | | 585 | | Phoenix, AZ | | March 16, 2006 |
Courtyard Gaithersburg Washingtonian Center. | | 210 | | Gaithersburg, MD | | June 1, 2006 |
Ritz-Carlton Atlanta Downtown | | 444 | | Atlanta, GA | | September 22, 2006 |
| | |
| | | | |
Total number of rooms | | 8,239 | | | | |
| | |
| | | | |
Substantially all of our assets are held by, and all of our operations are conducted through, Highland Hospitality, L.P. (our “Operating Partnership”). In order for us to qualify as a REIT, neither our company nor the Operating Partnership can operate hotels directly. Therefore, the Operating Partnership, which is owned approximately 99% by us and approximately 1% by other limited partners, leases its hotels to subsidiaries of HHC TRS Holding Corporation (collectively, “HHC TRS”), which is a wholly owned subsidiary of the Operating Partnership. HHC TRS then engages hotel management companies to operate the hotels pursuant to management contracts. HHC TRS is treated as a taxable REIT subsidiary for federal income tax purposes.
Key Operating Metrics
Hotel results of operations are best explained by three key performance indicators: occupancy, average daily rate (“ADR”) and revenue per available room (“RevPAR”), which is room revenue divided by total number of room nights. RevPAR does not include food and beverage revenues or other ancillary revenues, such as telephone, parking or other guest services provided by the property.
30
Occupancy is a major driver of room revenue, as well as other revenue categories, such as food and beverage and telephone. ADR helps to drive room revenue as well; however, it does not have a direct effect on other revenue categories. Fluctuations in occupancy are accompanied by fluctuations in most categories of variable operating costs, such as utility costs and certain labor costs such as housekeeping, resulting in varying levels of hotel profitability. Increases in ADR typically result in higher hotel profitability since variable hotel expenses generally do not increase correspondingly. Thus, increases in RevPAR attributable to increases in occupancy are accompanied by increases in most categories of variable operating costs, while increases in RevPAR attributable to increases in ADR are accompanied by increases in limited categories of operating costs, such as management fees and franchise fees.
Executive Summary of 2006 Events
2006 was another good year for the U.S. lodging industry. Demand growth for hotel rooms continued to outpace supply growth. According to Smith Travel Research, industry-wide RevPAR increased 7.5% for the full year, including increases of 7.4% and 8.5% for the upper upscale and upscale segments, respectively, where we are focused. Occupancy for both the upper upscale and upscale segments was in the 70-71% range, which resulted in the ability of hotel operators to increase room rates. The strength of the U.S. economy and corporate profits resulted in continued strong group and business transient demand. In 2007, we expect positive trends to continue. We believe that we will continue to see very solid business transient demand supported by healthy corporate profits which will continue to allow for pricing power in our revenue equation. And while leisure demand may not be as robust as business demand, similar to 2006, we expect it to track economic growth with lower gas prices and stable interest rates supporting the strength of the consumer.
2006 was an even better year for Highland Hospitality, in which we achieved above-industry increases in RevPAR and hotel profitability. For 2006, our comparable hotel portfolio and total hotel portfolio experienced RevPAR increases of 13.2% and 11.2%, respectively, and hotel operating margins increases of 250 basis points and 320 basis points, respectively. In addition, our 2006 adjusted FFO per share (a key financial measure used by both management and investors) increased 44% from 2005. Much of the increase in these financial measures can be attributed to the hotel properties that we renovated and repositioned during 2004 and 2005, including the Hyatt Regency Savannah hotel, the Plaza San Antonio Marriott hotel, the Crowne Plaza Atlanta-Ravinia hotel and the Courtyard Boston Tremont hotel. Although we don’t expect to be able to maintain such significant increases in 2007, we do still expect to outpace our peer group in terms of RevPAR growth and FFO per share growth.
With respect to our hotel investments, we started 2006 where we left off in 2005 by focusing on hotel acquisitions located in the top 25 MSAs in the United States. During 2006, we acquired five hotel properties for approximately $346.6 million, including the 673-room Nashville Renaissance hotel in Nashville, Tennessee, the 240-room Melrose hotel in Washington, DC, the 585-room Pointe Hilton Tapatio Cliffs resort in Phoenix, Arizona, the 210-room Courtyard Gaithersburg Washingtonian Center hotel in Gaithersburg, Maryland, and the 444-room Ritz-Carlton Atlanta Downtown hotel in Atlanta, Georgia. During 2006, we also disposed of two non-strategic hotel properties, the Barceló Tucancun Beach resort and the Marriott Mount Laurel hotel, which provided us net sales proceeds of approximately $70.3 million. We continue to seek to selectively acquire high-quality assets located in major, high barrier-to-entry markets with strong current yields and solid bottom-line growth potential. Although the acquisition environment remains challenging and competitive, we still believe there are opportunities for us to deploy capital in 2007.
We continue to maintain a prudent capital structure. During 2006, we replaced our term loan facility with a revolving credit facility, providing additional borrowing capacity, financial flexibility, and improved pricing. We also took advantage of the continued favorable debt environment and obtained approximately $142.2 million of mortgage financing. In March 2006, we completed an underwritten public offering and raised approximately $88.1 million. As of December 31, 2006, our debt-to-total asset ratio was approximately 50% and our average cost of borrowing was 6.33%.
Results of Operations
On June 29, 2006, we sold the Marriott Mount Laurel hotel for net sales proceeds of approximately $31.8 million and recognized a gain of approximately $7.4 million. On August 31, 2006, we sold the Barceló Tucancun
31
Beach resort for net sales proceeds of approximately $38.5 million and recognized a net gain of approximately $1.8 million. The results of operations for the Marriott Mount Laurel hotel and the Barceló Tucancun Beach resort have been reclassified as discontinued operations in the consolidated statements of operations for the years ended December 31, 2006, 2005 and 2004.
Comparison of Years Ended December 31, 2006 and 2005
Results of operations for the year ended December 31, 2006 include the operating activity of 21 hotels for a full year and seven hotels for a partial year. Results of operations for the year ended December 31, 2005 include the operating activity of 17 hotels for a full year and six hotels for a partial year (see table above for hotel property acquisition dates). As such, comparisons of results of operations for the year ended December 31, 2006 versus the prior year are not meaningful.
Revenues—Total revenue for the year ended December 31, 2006 was $422.6 million, as compared to $238.8 million for the prior year. Total revenue for the year ended December 31, 2006 included rooms revenue of $278.7 million, food and beverage revenue of $123.2 million, and other revenue of $20.7 million. Total revenue for the year ended December 31, 2005 included rooms revenue of $156.4 million, food and beverage revenue of $73.5 million, and other revenue of $8.9 million.
For the year ended December 31, 2006, we assessed the performance of our hotel portfolio based on two groupings: total hotel portfolio and comparable hotel portfolio. The total hotel portfolio includes all our hotel properties, excluding the sold Barceló Tucancun Beach resort and Marriott Mount Laurel hotel and the newly developed Courtyard Gaithersburg Washingtonian Center hotel. The comparable hotel portfolio includes hotel properties owned as of January 1, 2005, as well as the Sheraton Annapolis hotel which was acquired on February 4, 2005. Included in the following table are comparisons of the key operating metrics for our hotel portfolio for the years ended December 31, 2006 and 2005. Since eight of our hotels owned as of December 31, 2006 were acquired at various times during 2005 and 2006, the key operating metrics for the total hotel portfolio reflect the results of operations of those eight hotels under previous ownership for either a portion of, or the entire, year ended December 31, 2005.
| | | | | | | | | | | | | | | | | | |
| | | Year Ended December 31,
|
| | | 2006
| | 2005 (Pro Forma)
|
| | | Occ %
| | | ADR
| | RevPAR
| | Occ %
| | | ADR
| | RevPAR
|
Total Hotel Portfolio (25 hotels) | | 71.7 | % | | $ | 141.50 | | $ | 101.43 | | 70.0 | % | | $ | 130.34 | | $ | 91.24 |
Comparable Hotel Portfolio (17 hotels)(1) | | 71.1 | % | | $ | 132.15 | | $ | 94.00 | | 69.1 | % | | $ | 120.17 | | $ | 83.05 |
| (1) | | Includes hotel properties owned on January 1, 2005, as well as the Sheraton Annapolis hotel acquired on February 4, 2005. |
For the year ended December 31, 2006, RevPAR for our total hotel portfolio increased 11.2% to $101.43 from the comparable pro forma period in 2005. Occupancy increased by 1.7 percentage points to 71.7%, while ADR increased by 8.6% to $141.50. For our comparable hotel portfolio, RevPAR increased 13.2% to $94.00 from the comparable pro forma period in 2005. Occupancy increased by 2.0 percentage points to 71.1%, while ADR increased by 10.0% to $132.15. The increase in RevPAR for the year ended 2006 versus 2005 was largely a result of significant RevPAR increases at our recently renovated hotels, including the Courtyard Boston Tremont hotel, the Hyatt Regency Savannah hotel, the Crowne Plaza Atlanta-Ravinia hotel, and the Plaza San Antonio Marriott hotel. In addition, both the Hilton Boston Back Bay hotel and the Courtyard Denver Airport hotel experienced RevPAR increases in excess of 15.0% during 2006.
Hotel operating expenses—Hotel operating expenses, excluding depreciation and amortization, for the year ended December 31, 2006 were $301.1 million, as compared to $174.3 million for the prior year. Direct hotel operating expenses for the year ended December 31, 2006 included rooms expenses of $61.3 million, food and beverage expenses of $83.0 million, and other direct expenses of $10.5 million. Direct hotel operating expenses for the year ended December 31, 2005 included rooms expenses of $35.7 million, food and beverage expenses of
32
$49.4 million, and other direct expenses of $4.3 million. Indirect hotel operating expenses, which includes management and franchise fees, real estate taxes, insurance, utilities, repairs and maintenance, advertising and sales, and general and administrative expenses, for the year ended December 31, 2006 were $146.3 million, as compared to $84.8 million for the prior year.
Hotel operating income and margins—Included in the following table is a comparison of hotel operating income (hotel revenues less hotel operating expenses) and hotel operating income margins (hotel operating income divided by hotel revenues) for our hotel portfolio for the years ended December 31, 2006 and 2005. The comparisons do not include the results of operations for the sold Barceló Tucancun Beach resort and Marriott Mount Laurel hotel or the newly developed Courtyard Gaithersburg Washingtonian Center hotel. Since eight of our hotels owned as of December 31, 2006 were acquired at various times during 2005 and 2006, the hotel operating income and hotel operating income margins for the total hotel portfolio reflect the results of operations of those eight hotels under previous ownership for either a portion of, or the entire, year ended December 31, 2005.
| | | | | | | | | | | | |
| | | Year Ended December 31,
| |
| | | 2006
| | | 2005 (Pro Forma)
| |
| | | $(1)
| | %(2)
| | | $(1)
| | %(2)
| |
Total Hotel Portfolio (25 hotels) | | $ | 120.4 | | 28.8 | % | | $ | 97.7 | | 25.6 | % |
Comparable Hotel Portfolio (17 hotels)(3) | | $ | 75.1 | | 29.9 | % | | $ | 61.6 | | 27.4 | % |
| (2) | | Percentage of hotel revenue |
| (3) | | Includes hotel properties owned on January 1, 2005, as well as the Sheraton Annapolis hotel acquired on February 4, 2005. |
For the year ended December 31, 2006, hotel operating income for our total hotel portfolio increased 23.3% to $120.4 million from the prior year and hotel operating income margins increased by 3.2 percentage points to 28.8%. For our comparable hotel portfolio, hotel operating income increased 21.9% to $75.1 million from the prior year and hotel operating income margins increased by 2.5 percentage points to 29.9%. The significant increase in hotel operating income and margins for the year ended December 31, 2006 versus the prior year was largely a result of significant operating income increases at our recently renovated hotels, including the Hyatt Regency Savannah hotel, the Courtyard Boston Tremont hotel, the Crowne Plaza Atlanta-Ravinia hotel, and the Plaza San Antonio Marriott hotel. In addition, several of the hotels that we acquired in the last 15 months experienced significant operating income increases, including the Hilton Boston Back Bay hotel, the Nashville Renaissance hotel, the Pointe Hilton Tapatio Cliffs resort, and The Melrose hotel.
Depreciation and amortization—Depreciation and amortization expense for the year ended December 31, 2006 was $43.3 million, as compared to $22.8 million for the prior year. The increase in depreciation and amortization expense in 2006 versus 2005 was directly attributable to the increase in investment in hotel properties over the two-year period.
Corporate general and administrative—Total corporate general and administrative expenses for the year ended December 31, 2006 were $15.1 million, as compared to $9.7 million for the prior year. Included in corporate general and administrative expenses for the years ended December 31, 2006 and 2005 was $6.4 million and $3.2 million, respectively, of non-cash stock-based compensation expense. The increase in corporate general and administrative expenses is primarily a result of an increase in corporate franchise tax expense, due to the mix of states in which we own hotels, an increase in employee salaries and bonuses, and additional stock-based compensation expense related to restricted stock awards granted in May 2006.
Interest income—Interest income was $1.8 million for the years ended December 31, 2006 and 2005.
Interest expense—Interest expense for the year ended December 31, 2006 was $38.9 million, as compared to $24.7 million for the prior year. The increase in interest expense in 2006 versus 2005 was directly attributable to the increase in outstanding long-term debt over the two-year period.
33
Income tax expense—Income tax expense for the year ended December 31, 2006 was $2.7 million, as compared to $0.1 million for the prior year. The increase in income tax expense for the year ended December 31, 2006 versus the prior year resulted primarily from an increase in taxable operating income incurred by our TRS.
Net income—Net income for the year ended December 31, 2006 was $32.9 million, as compared to $9.7 million for the prior year, due primarily to the items discussed above. Also contributing to the increase in net income for the year ended December 31, 2006 was $10.9 million of income from discontinued operations, including $9.2 million of net gain on sale of hotel properties, as compared to $0.8 million for the prior year.
Comparison of Years Ended December 31, 2005 and 2004
Results of operations for the year ended December 31, 2005 include the operating activity of 17 hotels for a full year and six hotels for a partial year. Results of operations for the year ended December 31, 2004 include the operating activity of five hotels for a full year and 12 hotels for a partial year (see table above for hotel property acquisition dates). As such, comparisons of results of operations for the year ended December 31, 2005 versus the prior year are not meaningful.
Revenues—Total revenue for the year ended December 31, 2005 was $238.8 million, as compared to $131.0 million for the prior year. Total revenue for the year ended December 31, 2005 included rooms revenue of $156.4 million, food and beverage revenue of $73.5 million, and other revenue of $8.9 million. Total revenue for the year ended December 31, 2004 included rooms revenue of $84.1 million, food and beverage revenue of $41.5 million, and other revenue of $5.4 million.
For the year ended December 31, 2005, we assessed the performance of our hotel portfolio based on two groupings: stabilized portfolio and rebranded/renovated portfolio. The rebranded/renovated portfolio includes hotels that are currently going through, or have recently gone through, significant renovation and/or in the process of changing, or have recently changed, their franchise affiliation. The stabilized portfolio includes hotels that are not being disrupted by renovation or rebranding efforts. Included in the following table is a comparison of the key operating metrics for our hotel portfolio for the years ended December 31, 2005 and 2004. The comparison does not include results of operations for the Wyndham Palm Springs hotel, the Hilton Boston Back Bay hotel, the Westin Princeton at Forrestal Village hotel, and The Churchill hotel, which were all acquired in 2005. Also excluded is the Marriott Mount Laurel hotel and the Barceló Tucancun Beach resort, which were sold during 2006, and accordingly, their results of operations have been reclassified to discontinued operations for both 2005 and 2004. Since 11 of the 17 hotels were acquired at various times during 2004, the key operating metrics for those 11 hotels reflect the results of operations of the hotels under previous ownership for a portion of the year ended December 31, 2004.
| | | | | | | | | | | | | | | | | | |
| | | Year Ended December 31,
|
| | | 2005
| | 2004 (Pro Forma)
|
| | | Occ %
| | | ADR
| | RevPAR
| | Occ %
| | | ADR
| | RevPAR
|
Stabilized Portfolio (11 hotels) | | 75.1 | % | | $ | 114.86 | | $ | 86.28 | | 71.7 | % | | $ | 107.60 | | $ | 77.15 |
Rebranded/Renovated Portfolio(6 hotels) | | 62.5 | % | | $ | 127.51 | | $ | 79.64 | | 69.5 | % | | $ | 119.33 | | $ | 82.91 |
Comparable Portfolio (17 hotels) | | 69.1 | % | | $ | 120.26 | | $ | 83.15 | | 70.7 | % | | $ | 113.05 | | $ | 79.87 |
For the year ended December 31, 2005, RevPAR for our stabilized hotels increased 11.8% to $86.28 from the prior year. Occupancy increased by 3.4 percentage points to 75.1%, while ADR increased by 6.7% to $114.86. For our rebranded/renovated hotels, RevPAR decreased 3.9% to $79.64 from the prior year. Occupancy decreased by 7.0 percentage points to 62.5%, while ADR increased by 6.8% to $127.51. For the comparable 17 hotels, RevPAR increased by 4.1% to $83.15 from the prior year. Occupancy decreased by 1.6 percentage points to 69.1%, while ADR increased by 6.4% to $120.26. Driving the increase in RevPAR for the stabilized hotels were the Hilton Tampa Westshore hotel, the Sugar Land Marriott hotel, the Hilton Garden Inn Virginia Beach Town Center hotel, and the Courtyard Denver Airport hotel, where each experienced double digit RevPAR growth for 2005. Although RevPAR for the rebranded/renovated hotels decreased for the full year 2005, as renovations were completed at four of our hotels during 2005, we began to see significant improvements in RevPAR for those hotels, attributed to higher ADRs we achieved as rooms came back on line.
34
Hotel operating expenses—Hotel operating expenses, excluding depreciation and amortization, for the year ended December 31, 2005 were $174.3 million, as compared to $99.5 million for the prior year. Direct hotel operating expenses for the year ended December 31, 2005 included rooms expenses of $35.7 million, food and beverage expenses of $49.4 million, and other direct expenses of $4.3 million. Direct hotel operating expenses for the year ended December 31, 2004 included rooms expenses of $19.5 million, food and beverage expenses of $29.9 million, and other direct expenses of $3.1 million. Indirect hotel operating expenses, which includes management and franchise fees, real estate taxes, insurance, utilities, repairs and maintenance, advertising and sales, and general and administrative expenses, for the year ended December 31, 2005 were $84.8 million, as compared to $47.0 million for the prior year.
Hotel operating income and margins—Included in the following table is a comparison of hotel operating income (hotel revenues less hotel operating expenses) and hotel operating income margins (hotel operating income divided by hotel revenues) for our hotel portfolio for the years ended December 31, 2005 and 2004. The comparison does not include results of operations for the Wyndham Palm Springs hotel, the Hilton Boston Back Bay hotel, the Westin Princeton at Forrestal Village hotel, and The Churchill hotel, which were all acquired in 2005. Also excluded is the Marriott Mount Laurel hotel and the Barceló Tucancun Beach resort, which were sold during 2006, and accordingly, their results of operations have been reclassified to discontinued operations for both 2005 and 2004. Since 11 of the 17 hotels were acquired at various times in 2004, the hotel operating income and hotel operating income margins for those 11 hotels reflect the results of operations of the hotels under previous ownership for a portion of the year ended December 31, 2004.
| | | | | | | | | | | | |
| | | Year Ended December 31,
| |
| | | 2005
| | | 2004 (Pro Forma)
| |
| | | $(1)
| | %(2)
| | | $(1)
| | %(2)
| |
Stabilized Portfolio (11 hotels) | | $ | 36.1 | | 30.2 | % | | $ | 27.8 | | 25.8 | % |
Rebranded/Renovated Portfolio (6 hotels) | | $ | 25.5 | | 24.3 | % | | $ | 26.9 | | 24.5 | % |
Comparable Portfolio (17 hotels) | | $ | 61.5 | | 27.4 | % | | $ | 54.8 | | 25.1 | % |
| (2) | | Percentage of hotel revenue |
For the year ended December 31, 2005, hotel operating income for our stabilized hotels increased 29.6% to $36.1 million from the prior year and hotel operating income margins increased by 4.4 percentage points to 30.2%. For our rebranded/renovated hotels, hotel operating income decreased 5.5% to $25.5 million from the prior year and hotel operating income margins decreased by 0.2 percentage points to 24.3%. For the comparable 17 hotels, hotel operating income increased by 12.3% to $61.5 million from the prior year and hotel operating income margins increased by 2.3 percentage points to 27.4%. Driving the increase in hotel operating income and margins for the stabilized hotels were the Hilton Tampa Westshore hotel, the Sugar Land Marriott hotel, the Dallas/Fort Worth Airport Marriott hotel, and the Omaha Marriott hotel. Although hotel operating income for the rebranded/renovated hotels decreased for the full year 2005, as renovations were completed at four of our hotels during 2005, we began to see significant improvements in hotel operating income for those hotels, attributed to higher ADRs we achieved as rooms came back on line.
Depreciation and amortization—Depreciation and amortization expense for the year ended December 31, 2005 was $22.8 million, as compared to $11.4 million for the prior year. The increase in depreciation and amortization expense in 2005 versus 2004 was directly attributable to the increase in investment in hotel properties over the two-year period.
Corporate general and administrative—Total corporate general and administrative expenses for the year ended December 31, 2005 were $9.7 million, as compared to $9.5 million for the prior year. Included in corporate general and administrative expenses for the years ended December 31, 2005 and 2004 was $3.2 million and $3.1 million, respectively, of non-cash stock-based compensation expense.
35
Interest income—Interest income for the year ended December 31, 2005 was $1.8 million, as compared to $1.2 million for the prior year. The increase in interest income in 2005 versus 2004 was mostly attributable to the increase in short-term investment yields, partially offset by a decrease in cash and cash equivalents over the two-year period.
Interest expense—Interest expense for the year ended December 31, 2005 was $24.7 million, as compared to $8.4 million for the prior year. The increase in interest expense in 2005 versus 2004 was directly attributable to the increase in outstanding long-term debt over the two-year period.
Income tax expense—Income tax expense for the year ended December 31, 2005 was $0.1 million, as compared to an income tax benefit of $1.0 million for the prior year. Income tax expense for the year ended December 31, 2005 resulted primarily from taxable operating income incurred by our TRS, whereas the income tax benefit for the year ended December 31, 2004 resulted from taxable operating losses incurred by our TRS.
Net income—Net income for the year ended December 31, 2005 was $9.7 million, as compared to $4.3 million for the prior year, due primarily to the items discussed above. Also contributing to the increase in net income for the year ended December 31, 2005 was $0.8 million of income from discontinued operations, as compared to $0.1 million for the prior year.
Sources and Uses of Cash
Our principal source of cash to meet our operating requirements, including distributions to stockholders and repayments of indebtedness, is from our hotels’ results of operations. For the year ended December 31, 2006, net cash provided by operating activities was $82.5 million. We currently expect that our operating cash flows will be sufficient to fund our continuing operations, including distributions to stockholders required to maintain our REIT status and our required debt service obligations.
For the year ended December 31, 2006, net cash used in investing activities was approximately $307.6 million, including approximately $338.2 million to purchase the 673-room Nashville Renaissance hotel in Nashville, Tennessee, the 240-room Melrose hotel in Washington, DC, the 585-room Pointe Hilton Tapatio Cliffs resort in Phoenix, Arizona, the 210-room Courtyard Gaithersburg Washingtonian Center hotel in Gaithersburg, Maryland, and the 444-room Ritz-Carlton Atlanta Downtown hotel in Atlanta, Georgia. We also used approximately $51.1 million for improvements and additions to our hotel properties, the majority of which was used for major renovations taking place at the Hilton Parsippany hotel, the Courtyard Boston Tremont hotel, and the sold Marriott Mount Laurel hotel and Barceló Tucancun Beach resort. Offsetting the aforementioned cash payments was approximately $71.6 million of net sales proceeds received related primarily to the sale of the Marriott Mount Laurel hotel and the Barceló Tucancun Beach resort on June 29, 2006 and August 31, 2006, respectively.
For the year ended December 31, 2006, net cash provided by financing activities was approximately $197.7 million. In March 2006, we completed an underwritten public offering and sold 7,300,000 shares of common stock, generating net proceeds after deducting underwriting discounts and offering expenses of approximately $88.2 million. We also issued 681,275 shares of common stock as a result of our IPO lead managing underwriter’s exercises of warrants, generating proceeds of approximately $6.8 million. We generated $142.3 million from the issuance of mortgage loans secured by the Westin Princeton at Forrestal Village hotel, the Nashville Renaissance hotel, and the Pointe Hilton Tapatio Cliffs resort. In February 2006, we closed on an unsecured revolving credit facility and borrowed $100 million immediately to extinguish our term loan facility. Since then, we have borrowed an additional net $4 million under the revolving credit facility. We also used approximately $45.2 million to pay dividends to common and preferred stockholders.
In August 2006, we finalized the settlement of our insurance claim relating to the damages caused by Hurricane Wilma at the 332-room Barceló Tucancun Beach resort in Cancun, Mexico for a total of approximately $9.0 million in proceeds, all of which has been received.
36
Liquidity and Capital Resources
As of December 31, 2006, we had cash and cash equivalents of approximately $37.3 million and restricted cash of approximately $22.3 million. As of February 23, 2007, after the acquisition of the Crowne Plaza Chicago-Silversmith hotel, we had approximately $28.0 million of cash and cash equivalents and $52 million of remaining borrowing capacity under our $200 million revolving credit facility. We have the ability to raise additional capital by obtaining mortgage loans on our unencumbered hotel properties. We intend to invest our remaining cash and cash equivalents and additional capacity under the revolving credit facility in hotel properties, either through planned renovations or new hotel acquisitions.
In December 2004, we filed a registration statement on Form S-3 with the Securities and Exchange Commission, registering equity securities with a maximum aggregate offering price of up to $500 million. As of December 31, 2006, we had equity securities with a maximum aggregate offering price of approximately $213 million available to issue.
Capital Expenditures
We maintain each hotel in good repair and condition and in conformity with applicable laws and regulations and in accordance with the franchisor’s standards and the agreed-upon requirements in our management agreements. The cost of all such routine improvements and alterations will be paid out of a property improvement fund, which will be funded by a portion of hotel gross revenues. Routine capital expenditures will be administered by the management companies. However, we have approval rights over the capital expenditures as part of the annual budget process.
From time-to-time, certain of our hotel properties may be undergoing renovations as a result of our decision to upgrade portions of the hotels, such as guestrooms, meeting space, and/or restaurants, in order to better compete with other hotels in our markets. In addition, often after we acquire a hotel property, we are required to complete a property improvement plan (“PIP”) in order to bring the hotel property up to the respective franchisor’s standards. If permitted by the terms of the management agreement, funding for a renovation will first come from the property improvement fund. To the extent that the property improvement fund is not adequate to cover the cost of the renovation, we will fund the remaining portion of the renovation with cash and cash equivalents on hand.
Contractual Obligations
The following table sets forth our contractual obligations as of December 31, 2006, and the effect such obligations are expected to have on our liquidity and cash flow in future periods (in thousands). There were no other material off-balance sheet arrangements at December 31, 2006.
| | | | | | | | | | | | | | | |
| | | Payments Due by Period
|
Contractual Obligations
| | Total
| | Less Than
One Year
| | One to
Three Years
| | Three to
Five Years
| | More Than
Five Years
|
Ground and building leases(1) | | $ | 75,692 | | $ | 1,930 | | $ | 3,733 | | $ | 3,715 | | $ | 66,314 |
Capital leases, including interest | | | 1,220 | | | 261 | | | 523 | | | 436 | | | — |
Mortgage loans, including interest | | | 691,568 | | | 39,214 | | | 88,606 | | | 279,632 | | | 284,116 |
Mezzanine loan, including interest | | | 33,755 | | | 2,411 | | | 4,822 | | | 26,522 | | | — |
Revolving credit facility, including interest(2) | | | 121,038 | | | 7,872 | | | 113,166 | | | — | | | — |
| | |
|
| |
|
| |
|
| |
|
| |
|
|
| | | $ | 923,273 | | $ | 51,688 | | $ | 210,850 | | $ | 310,305 | | $ | 350,430 |
| | |
|
| |
|
| |
|
| |
|
| |
|
|
| (1) | | Included in the table are the base rent payments (i.e., minimum lease payments) due under our ground and building lease agreements. Additional and percentage rent payments are not included in the table due to the uncertainty of the timing and amount of the payments in the future. |
| (2) | | Assumes no additional borrowings under the revolving credit facility and interest payments based on the interest rate in effect as of December 31, 2006. |
37
Inflation
Operators of hotels, in general, possess the ability to adjust room rates daily to reflect the effects of inflation. However, competitive pressures may limit the ability of our management companies to raise room rates.
Seasonality
Demand in the lodging industry is affected by recurring seasonal patterns. For non-resort properties, demand is generally lower in the winter months due to decreased travel and higher in the spring and summer months during the peak travel season. For resort properties, demand is generally higher in the winter months. We expect that our operations will generally reflect non-resort seasonality patterns. Accordingly, we expect that we will have lower revenue, operating income and cash flow in the first and fourth quarters and higher revenue, operating income and cash flow in the second and third quarters. These general trends are, however, expected to be greatly influenced by overall economic cycles.
Critical Accounting Policies
We believe that the following critical accounting policies affect the most significant judgments and estimates used in the preparation of our financial statements:
Investment in Hotel Properties—Investments in hotel properties are stated at acquisition cost and allocated to land, property and equipment and identifiable intangible assets at fair value in accordance with Statement of Financial Accounting Standards No. 141,Business Combinations. Property and equipment are recorded at fair value based on current replacement cost for similar capacity and allocated to buildings, improvements, furniture, fixtures and equipment using cost segregation studies performed by management and independent third parties. Property and equipment are depreciated using the straight-line method over an estimated useful life of 15 to 40 years for buildings and improvements and three to ten years for furniture and equipment. Identifiable intangible assets are typically contracts, including lease, management and franchise agreements, which are recorded at fair value. Above-market and below-market contract values are based on the present value of the difference between contractual amounts to be paid pursuant to the contracts acquired and our estimate of the fair market contract rates for corresponding contracts measured over a period equal to the remaining non-cancelable term of the contract. Contracts acquired which are at market do not have significant value. An existing management or franchise agreement is typically terminated at the time of acquisition and a new agreement is entered into based on then current market terms. Intangible assets are amortized using the straight-line method over the remaining non-cancelable term of the related agreements. In making estimates of fair values for purposes of allocating purchase price, we may utilize a number of sources that may be obtained in connection with the acquisition or financing of a property and other market data. Management also considers information obtained about each property as a result of its pre-acquisition due diligence in estimating the fair value of the tangible and intangible assets acquired.
We review our investments in hotel properties for impairment whenever events or changes in circumstances indicate that the carrying value of the investments in hotel properties may not be recoverable. Events or circumstances that may cause us to perform our review include, but are not limited to, adverse changes in the demand for lodging at our properties due to declining national or local economic conditions and/or new hotel construction in markets where our hotels are located. When such conditions exist, management performs an analysis to determine if the estimated undiscounted future cash flows from operations and the proceeds from the ultimate disposition of an investment in a hotel property exceed the hotel’s carrying value. If the estimated undiscounted future cash flows are less than the carrying amount of the asset, an adjustment to reduce the carrying value to the estimated fair market value is recorded and an impairment loss recognized.
Stock-Based Compensation—From time-to-time, we grant restricted stock awards to employees. To-date, we have granted three types of restricted stock awards: (1) awards that vest solely on continued employment
38
(time-based awards); (2) awards that vest based on us achieving specified levels of funds from operations (FFO) and continued employment (performance-based awards); and (3) awards that vest based on us achieving specified levels of relative total shareholder return and continued employment (market-based awards).
We measure stock-based compensation expense for the restricted stock awards based on the fair value of the awards on the date of grant. The fair value of time-based awards and performance-based awards is determined based on the average trading price of our common stock on the measurement date, which is generally the date of grant. The fair value of market-based awards is determined using a Monte Carlo simulation performed by a third-party valuation specialist. A Monte Carlo simulation requires the use of a number of assumptions, including historical volatility and correlation of our common stock and the common stock of our peer group, a risk-free rate of return, and an expected term.
For time-based awards, stock-based compensation expense is recognized on a straight-line basis over the life of the entire award. For market-based awards, stock-based compensation expense is recognized over the requisite service period for each award. For both time-based awards and market-based awards, once the total amount of stock-based compensation expense is determined on the date of the grant, no adjustments are made to the amount recognized each period. Similar to market-based awards, stock-based compensation expense for performance-based awards is recognized over the requisite service period for each award. However, unlike time-based awards and market-based awards, the amount of stock-based compensation expense, if any, recognized each period is based on whether the performance measure is expected to be met. For all three types of awards, no compensation cost is recognized for awards for which employees do not render the requisite service.
Revenue Recognition—Hotel revenues, including room, food and beverage, and other hotel revenues, are recognized as the related services are provided.
New Accounting Pronouncements
FASB Interpretation No. 48,Accounting for Uncertainty in Income Taxes, an interpretation of FASB Statement No. 109 (“FIN 48”), prescribes a recognition threshold and measurement attribute for the financial statement recognition and measurement of a tax position taken in a tax return. We must determine whether it is “more-likely-than-not” that a tax position will be sustained upon examination, including resolution of any related appeals or litigation processes, based on the technical merits of the position. Once it is determined that a position meets the more-likely-than-not recognition threshold, the position is measured to determine the amount of benefit to recognize in the financial statements. FIN 48 applies to all tax positions related to income taxes subject to Statement of Financial Accounting Standards No. 109,Accounting for Income Taxes. We adopted the provisions of this interpretation effective for the first quarter of 2007. The adoption of FIN 48 did not have a material effect on our results of operations, financial position, or cash flows.
Statement of Financial Accounting Standards No. 157,Fair Value Measurements(“SFAS 157”), defines fair value, establishes a framework for measuring fair value in U.S. generally accepted accounting principles, and expands disclosures about fair value measurements. Statement of Financial Accounting Standards No. 159, The Fair Value Option for Financial Assets and Financial Liabilities (“SFAS 159”), provides companies with the option to report selected financial assets and liabilities at fair value. The statement’s objective is to reduce both complexity in accounting for financial instruments and the volatility in earnings caused by measuring related assets and liabilities differently. We will adopt the provisions of SFAS 157 and SFAS 159 effective January 1, 2008. We do not anticipate that the adoption of the two statements will have a material impact on our results of operations, financial position, or cash flows.
Item 7A. Quantitative and Qualitative Disclosures About Market Risk
Interest Rate Risk—We are not significantly exposed to interest rate risk. As of December 31, 2006, $530.8 million or 82% of our $646.6 million of long-term debt was fixed. Another $60.8 million was effectively fixed, as a result of interest rate swaps that fix the interest rates on our variable-rate mortgage loan and $50 million borrowed under our revolving credit facility. The remaining $54 million borrowed under our revolving credit facility as of December 31, 2006 was variable.
39
Due to the fact that our portfolio of long-term debt is substantially comprised of fixed-rate instruments, the fair value of the portfolio is relatively sensitive to effects of interest rate fluctuations. Assuming a hypothetical 10% decrease in interest rates, the fair value of our portfolio of long-term debt would increase by approximately $16.8 million. Although a change in market interest rates impacts the fair value of our fixed-rate debt, it has no impact on interest expense incurred or cash flows.
With respect to our variable rate long-term debt, if market rates of interest on our variable long-term debt increase by 1%, the increase in interest expense on our variable long-term debt would decrease future earnings and cash flows by approximately $.5 million annually. On the other hand, if market rates of interest on our variable rate long-term debt decrease by 1%, the decrease in interest expense on our variable rate long-term debt would increase future earnings and cash flows by approximately $.5 million annually. This assumes that the amount outstanding under our revolving credit facility remains at $104 million, the balance at December 31, 2006, and we continue to fix the interest rate on $50 million of the $104 million through the use of an interest rate swap.
Item 8. Financial Statements and Supplementary Data
See Index to the Financial Statements on page F-1.
Item 9. Changes in and Disagreements with Accountants on Accounting and Financial Disclosure
None.
Item 9A. Controls and Procedures
Evaluation of Disclosure Controls and Procedures—We have established disclosure controls and procedures to ensure that material information relating to Highland Hospitality Corporation, including its consolidated subsidiaries, is made known to the officers who certify our financial reports and to other members of senior management and the board of directors.
Based on their evaluation as of December 31, 2006, the principal executive officer and principal financial officer of Highland Hospitality Corporation have concluded that our disclosure controls and procedures (as defined in Rules 13a-15(e) and 15d-15(e) under the Securities Exchange Act of 1934, as amended (the “Exchange Act”)) are effective.
Changes in Internal Controls—No change in our internal control over financial reporting (as defined in Rules 13a-15(d) and 15d-15(d) of the Exchange Act) occurred during the quarter ended December 31, 2006, that materially affected, or is reasonably likely to materially affect, our internal control over financial reporting.
Management’s Report on Internal Control Over Financial Reporting—See Management’s Report on Internal Control Over Financial Reporting on page F-2.
Item 9B. Other Information
None.
40
PART III
The information required by Items 10-14 is incorporated by reference to our proxy statement for the 2007 annual meeting of stockholders (to be filed with the Securities and Exchange Commission not later than 120 days after the end of the fiscal year covered by this report).
Item 10. Directors, Executive Officers and Corporate Governance
Information on our directors is incorporated by reference to our 2007 proxy statement. Information on our executive officers is included under the heading “Executive Officers” on page 10 of this report.
Item 11. Executive Compensation
The information required by this item is incorporated by reference to our 2007 proxy statement.
Item 12. Security Ownership of Certain Beneficial Owners and Management and Related Stockholder Matters
The information required by this item is incorporated by reference to our 2007 proxy statement.
Item 13. Certain Relationships and Related Transactions, and Director Independence
The information required by this item is incorporated by reference to our 2007 proxy statement.
Item 14. Principal Accountant Fees and Services
The information required by this item is incorporated by reference to our 2007 proxy statement.
41
PART IV
Item 15. Exhibits and Financial Statement Schedules
Included herein at pages F-1 through F-28.
| 2. | | Financial Statement Schedules |
The following financial statement schedule is included herein at page F-29:
Schedule III—Real Estate and Accumulated Depreciation
All other schedules for which provision is made in Regulation S-X are either not required to be included herein under the related instructions or are inapplicable or the related information is included in the footnotes to the applicable financial statement and, therefore, have been omitted.
The following exhibits are filed as part of this Form 10-K:
| | |
Exhibit
Number
| | Description of Exhibit
|
| 3.1 | | Amended and Restated Articles of Incorporation of Highland Hospitality Corporation (incorporated by reference to Exhibit 3.1 to the registrant’s Form 10-K for the year ended December 31, 2003) |
| |
| 3.2 | | Amended and Restated Bylaws of Highland Hospitality Corporation (incorporated by reference to Exhibit 3.2 to the registrant’s Form 10-K for the year ended December 31, 2003) |
| |
| 3.3 | | Second Amended and Restated Agreement of Limited Partnership of Highland Hospitality, L.P. (as amended through September 30, 2004) (incorporated by reference to Exhibit 3.3.1 to the registrant’s Form 10-Q for the quarter ended September 30, 2004) |
| |
| 3.3.1 | | First Amendment to the Second Amended and Restated Agreement of Limited Partnership of Highland Hospitality L.P. (incorporated by reference to Exhibit 3.3.1 to the registrant’s Form 10-Q for the quarter ended June 30, 2006) |
| |
| 3.3.2 | | Second Amendment to the Second Amended and Restated Agreement of Limited Partnership of Highland Hospitality, L.P. (incorporated by reference to Exhibit 3.3.2 to the registrant’s Form 10-Q for the quarter ended June 30, 2006) |
| |
| 3.3.3 | | Third Amendment to the Second Amended and Restated Agreement of Limited Partnership of Highland Hospitality, L.P. (incorporated by reference to Exhibit 3.3 to the registrant’s Form 10-Q for the quarter ended September 30, 2005) |
| |
| 3.3.4 | | Fourth Amendment to the Second Amended and Restated Agreement of Limited Partnership of Highland Hospitality, L.P. (incorporated by reference to Exhibit 3.3.4 to the registrant’s Form 10-Q for the quarter ended June 30, 2006) |
| |
| 4.1 | | Form of Certificate for Common Stock (incorporated by reference to Exhibit 4.1 to the registrant’s Form 10-K for the year ended December 31, 2005) |
| |
| 4.2 | | Articles Supplementary to Highland Hospitality Corporation’s Amended and Restated Articles of Incorporation relating to the 7.875% Series A Cumulative Redeemable Preferred Stock (incorporated by reference to Exhibit 4.1 to the registrant’s Form 8-K dated September 27, 2005) |
| |
| 4.3 | | Form of Certificate for 7.875% Series A Cumulative Redeemable Preferred Stock (incorporated by reference to Exhibit 4.3 to the registrant’s Form 10-K for the year ended December 31, 2005) |
| |
| 10.1* | | Highland Hospitality Corporation Amended and Restated 2003 Omnibus Stock Incentive Plan (incorporated by reference to Exhibit 10.1 to the registrant’s Form 8-K dated May 23, 2006) |
42
| | |
Exhibit
Number
| | Description of Exhibit
|
| 10.1.1* | | Form of Restricted Stock Agreement (incorporated by reference to Exhibit 10.2 to the registrant’s Form 8-K dated May 23, 2006) |
| |
| 10.2* | | Highland Hospitality Corporation Executive Deferred Compensation Plan, as amended through March 10, 2005 (incorporated by reference to Exhibit 10.20 to the registrant’s Form 10-K/A filed on April 21, 2005) |
| |
| 10.2.1* | | First Amendment to Highland Hospitality Corporation Executive Deferred Compensation Plan |
| |
| 10.3* | | Employment Agreement between Highland Hospitality Corporation and James L. Francis (incorporated by reference to Exhibit 10.2 to the registrant’s Registration Statement on Form S-11 (No. 333-108671)) |
| |
| 10.3.1* | | First Amendment to Employment Agreement between Highland Hospitality Corporation and James L. Francis, dated as of March 29, 2004 (incorporated by reference to Exhibit 10.2.1 to the registrant’s Form 10-Q for the quarter ended March 31, 2004) |
| |
| 10.3.2* | | Second Amendment to Employment Agreement between Highland Hospitality Corporation and James L. Francis, dated as of May 23, 2006 (incorporated by reference to Exhibit 10.3.2 to the registrant’s Form 10-Q for the quarter ended June 30, 2006) |
| |
| 10.4* | | Employment Agreement between Highland Hospitality Corporation and Patrick W. Campbell (incorporated by reference to Exhibit 10.3 to the registrant’s Registration Statement on Form S-11 (No. 333-108671)) |
| |
| 10.4.1* | | First Amendment to Employment Agreement between Highland Hospitality Corporation and Patrick W. Campbell, dated as of March 29, 2004 (incorporated by reference to Exhibit 10.3.1 to the registrant’s Form 10-Q for the quarter ended March 31, 2004) |
| |
| 10.4.2* | | Second Amendment to Employment Agreement between Highland Hospitality Corporation and Patrick W. Campbell, dated as of May 23, 2006 (incorporated by reference to Exhibit 10.4.2 to the registrant’s Form 10-Q for the quarter ended June 30, 2006) |
| |
| 10.5* | | Employment Agreement between Highland Hospitality Corporation and Tracy M.J. Colden (incorporated by reference to Exhibit 10.4 to the registrant’s Registration Statement on Form S-11 (No. 333-108671)) |
| |
| 10.5.1* | | First Amendment to Employment Agreement between Highland Hospitality Corporation and Tracy M.J. Colden, dated as of March 29, 2004 (incorporated by reference to Exhibit 10.4.1 to the registrant’s Form 10-Q for the quarter ended March 31, 2004) |
| |
| 10.5.2* | | Second Amendment to Employment Agreement between Highland Hospitality Corporation and Tracy M.J. Colden, dated as of May 23 2006 (incorporated by reference to Exhibit 10.5.2 to the registrant’s Form 10-Q for the quarter ended June 30, 2006) |
| |
| 10.6* | | Employment Agreement between Highland Hospitality Corporation and Douglas W. Vicari (incorporated by reference to Exhibit 10.5 to the registrant’s Registration Statement on Form S-11 (No. 333-108671)) |
| |
| 10.6.1* | | First Amendment to Employment Agreement between Highland Hospitality Corporation and Douglas W. Vicari, dated as of March 29, 2004 (incorporated by reference to Exhibit 10.5.1 to the registrant’s Form 10-Q for the quarter ended March 31, 2004) |
| |
| 10.6.2* | | Second Amendment to Employment Agreement between Highland Hospitality Corporation and Douglas W. Vicari, dated as of May 23, 2006 (incorporated by reference to Exhibit 10.6.2 to the registrant’s Form 10-Q for the quarter ended June 30, 2006) |
| |
| 10.7 | | Strategic Alliance Agreement dated September 4, 2003 among Highland Hospitality Corporation, Highland Hospitality, L.P. and Barceló Crestline Corporation (incorporated by reference to Exhibit 10.6 to the registrant’s Registration Statement on Form S-11 (No. 333-108671)) |
| |
| 10.8 | | Form of Management Agreement with Crestline Hotels & Resorts, Inc. (incorporated by reference to Exhibit 10.8 to the registrant’s Form 10-K for the year ended December 31, 2005) |
43
| | |
Exhibit
Number
| | Description of Exhibit
|
| 10.9 | | Form of Lease with taxable REIT subsidiaries (incorporated by reference to Exhibit 10.13 to the registrant’s Form 10-K for the year ended December 31, 2005) |
| |
| 10.10 | | Warrant Agreement between Friedman, Billings, Ramsey & Co., Inc. and Highland Hospitality Corporation (incorporated by reference to Exhibit 10.18 to the registrant’s Form 10-K for the year ended December 31, 2003) |
| |
| 10.11 | | Registration Rights Agreement dated November 6, 2003 by and between Highland Hospitality Corporation and the parties listed on Schedule A thereto (incorporated by reference to Exhibit 10.34 to the registrant’s Registration Statement on Form S-11 (No. 333-108671)) |
| |
| 10.12 | | Registration Rights Agreement between Highland Hospitality Corporation and Friedman, Billings, Ramsey & Co., Inc. (incorporated by reference to Exhibit 10.36 to the registrant’s Form 10-K for the year ended December 31, 2003) |
| |
| 10.13 | | Loan Agreement, dated July 9, 2004, between HH Savannah LLC, HH Baltimore Holdings LLC, Portsmouth Hotel Associates, LLC and Column Financial, Inc., an affiliate of Credit Suisse First Boston (incorporated by reference to Exhibit 10.37 to the registrant’s Form 10-Q for the quarter ended September 30, 2004) |
| |
| 10.14 | | Loan Agreement, dated August 19, 2004, between HH FP Portfolio Holding LLC and JP Morgan Chase Bank (incorporated by reference to Exhibit 10.38 to the registrant’s Form 10-Q for the quarter ended September 30, 2004) |
| |
| 10.15 | | Loan Agreement, dated August 19, 2004, between HH FP Portfolio LLC and JP Morgan Chase Bank (incorporated by reference to Exhibit 10.39 to the registrant’s Form 10-Q for the quarter ended September 30, 2004) |
| |
| 10.16 | | Deed of Trust and Security Agreement, dated September 9, 2004, between HH DFW Hotel Associates, L.P. and Connecticut General Life Insurance Company (incorporated by reference to Exhibit 10.40 to the registrant’s Form 10-Q for the quarter ended September 30, 2004) |
| |
| 10.17 | | Leasehold Deed of Trust and Security Agreement, dated July 14, 2005, between HH Palm Springs LLC and Connecticut General Life Insurance Company (incorporated by reference to Exhibit 10.1 to the registrant’s Form 10-Q for the quarter ended September 30, 2005) |
| |
| 10.18 | | Loan Agreement, dated December 6, 2005, between HH Boston Back Bay LLC and Connecticut General Life Insurance Company (incorporated by reference to Exhibit 10.23 to the registrant’s Form 10-K for the year ended December 31, 2005) |
| |
| 10.19 | | Credit Agreement, dated February 24, 2006, between Highland Hospitality, L.P., Wells Fargo Bank, N.A., and PNC Bank, N.A. (incorporated by reference to Exhibit 10.24 to the registrant’s Form 10-K for the year ended December 31, 2005) |
| |
| 10.20 | | Leasehold Deed of Trust and Security Agreement, dated March 13, 2006, between HH Nashville LLC and Connecticut General Life Insurance Company (incorporated by reference to Exhibit 10.1 to the registrant’s Form 10-Q for the quarter ended March 31, 2006) |
| |
| 10.21* | | Summary of Non-Employee Director Compensation |
| |
| 12.1 | | Computation of Ratio of Earnings to Combined Fixed Charges and Preferred Stock Dividends |
| |
| 21.1 | | List of Subsidiaries of Highland Hospitality Corporation |
| |
| 23.1 | | Consent of KPMG LLP |
| |
| 31.1 | | Rule 13a-14(a)/15d-14(a) Certification of President and Chief Executive Officer |
| |
| 31.2 | | Rule 13a-14(a)/15d-14(a) Certification of Chief Financial Officer |
| |
| 32.1 | | Section 1350 Certification of President and Chief Executive Officer |
| |
| 32.2 | | Section 1350 Certification of Chief Financial Officer |
| * | | Denotes management contract or other compensatory plan or arrangement. |
44
SIGNATURES
Pursuant to the requirements of Section 13 or 15(d) of the Securities Exchange Act of 1934, the Registrant has duly caused this report to be signed on its behalf by the undersigned, thereunto duly authorized.
| | |
HIGHLAND HOSPITALITY CORPORATION |
| |
By: | | /s/ DOUGLAS W. VICARI
|
| | | Douglas W. Vicari Executive Vice President and Chief Financial Officer |
Pursuant to the requirements of the Securities Exchange Act of 1934, this report has been signed below by the following persons on behalf of the registrant and in the capacities and on the dates indicated.
| | | | |
Signature
| | Title
| | Date
|
/s/ BRUCE D. WARDINSKI
Bruce D. Wardinski | | Chairman of the Board of Directors | | February 27, 2007 |
| | |
/s/ JAMES L. FRANCIS
James L. Francis | | President, Chief Executive Officer, and Director | | February 27, 2007 |
| | |
/s/ DOUGLAS W. VICARI
Douglas W. Vicari | | Executive Vice President and Chief Financial Officer (Principal Financial and Accounting Officer) | | February 27, 2007 |
| | |
/s/ JOHN M. ELWOOD
John M. Elwood | | Director | | February 27, 2007 |
| | |
/s/ W. REEDER GLASS
W. Reeder Glass | | Director | | February 27, 2007 |
| | |
/s/ JOHN W. HILL
John W. Hill | | Director | | February 27, 2007 |
| | |
/s/ THOMAS A. NATELLI
Thomas A. Natelli | | Director | | February 27, 2007 |
| | |
/s/ MARGARET A. SHEEHAN
Margaret A. Sheehan | | Director | | February 27, 2007 |
| | |
/s/ WILLIAM L. WILSON
William L. Wilson | | Director | | February 27, 2007 |
45
HIGHLAND HOSPITALITY CORPORATION
INDEX TO FINANCIAL STATEMENTS
F-1
MANAGEMENT’S REPORT ON
INTERNAL CONTROL OVER FINANCIAL REPORTING
Management of Highland Hospitality Corporation (the “Company”) is responsible for establishing and maintaining adequate internal control over financial reporting and for the assessment of the effectiveness of internal control over financial reporting. As defined by the Securities and Exchange Commission, internal control over financial reporting is a process designed by, or under the supervision of the Company’s principal executive and principal financial officers and effected by the Company’s board of directors, management and other personnel, to provide reasonable assurance regarding the reliability of financial reporting and the preparation of the consolidated financial statements in accordance with U.S. generally accepted accounting principles.
The Company’s internal control over financial reporting is supported by written policies and procedures that (1) pertain to the maintenance of records that, in reasonable detail, accurately and fairly reflect the Company’s transactions and dispositions of the Company’s assets; (2) provide reasonable assurance that transactions are recorded as necessary to permit preparation of the consolidated financial statements in accordance with U.S. generally accepted accounting principles, and that receipts and expenditures of the Company are being made only in accordance with authorizations of the Company’s management and directors; and (3) provide reasonable assurance regarding prevention or timely detection of unauthorized acquisition, use or disposition of the Company’s assets that could have a material effect on the consolidated financial statements.
Because of its inherent limitations, internal control over financial reporting may not prevent or detect misstatements. Also, projections of any evaluation of effectiveness to future periods are subject to the risk that controls may become inadequate because of changes in conditions, or that the degree of compliance with the policies or procedures may deteriorate.
In connection with the preparation of the Company’s annual consolidated financial statements, management has undertaken an assessment of the effectiveness of the Company’s internal control over financial reporting as of December 31, 2006, based on criteria established inInternal Control—Integrated Framework issued by the Committee of Sponsoring Organizations of the Treadway Commission (COSO). Management’s assessment included an evaluation of the design of the Company’s internal control over financial reporting and testing of the operational effectiveness of those controls.
Based on this assessment, management has concluded that as of December 31, 2006, the Company’s internal control over financial reporting was effective to provide reasonable assurance regarding the reliability of financial reporting and the preparation of financial statements for external purposes in accordance with U.S. generally accepted accounting principles.
KPMG LLP, the independent registered public accounting firm that audited the Company’s consolidated financial statements included in this report, has issued an audit report on management’s assessment of internal control over financial reporting.
F-2
Report of Independent Registered Public Accounting Firm
The Board of Directors and Stockholders
Highland Hospitality Corporation:
We have audited management’s assessment, included in the accompanying Management’s Report on Internal Control over Financial Reporting, that Highland Hospitality Corporation (the Company) maintained effective internal control over financial reporting as of December 31, 2006, based on criteria established inInternal Control—Integrated Frameworkissued by the Committee of Sponsoring Organizations of the Treadway Commission (COSO). The Company’s management is responsible for maintaining effective internal control over financial reporting and for its assessment of the effectiveness of internal control over financial reporting. Our responsibility is to express an opinion on management’s assessment and an opinion on the effectiveness of the Company’s internal control over financial reporting based on our audit.
We conducted our audit in accordance with the standards of the Public Company Accounting Oversight Board (United States). Those standards require that we plan and perform the audit to obtain reasonable assurance about whether effective internal control over financial reporting was maintained in all material respects. Our audit included obtaining an understanding of internal control over financial reporting, evaluating management’s assessment, testing and evaluating the design and operating effectiveness of internal control, and performing such other procedures as we considered necessary in the circumstances. We believe that our audit provides a reasonable basis for our opinion.
A company’s internal control over financial reporting is a process designed to provide reasonable assurance regarding the reliability of financial reporting and the preparation of financial statements for external purposes in accordance with generally accepted accounting principles. A company’s internal control over financial reporting includes those policies and procedures that (1) pertain to the maintenance of records that, in reasonable detail, accurately and fairly reflect the transactions and dispositions of the assets of the company; (2) provide reasonable assurance that transactions are recorded as necessary to permit preparation of financial statements in accordance with generally accepted accounting principles, and that receipts and expenditures of the company are being made only in accordance with authorizations of management and directors of the company; and (3) provide reasonable assurance regarding prevention or timely detection of unauthorized acquisition, use, or disposition of the company’s assets that could have a material effect on the financial statements.
Because of its inherent limitations, internal control over financial reporting may not prevent or detect misstatements. Also, projections of any evaluation of effectiveness to future periods are subject to the risk that controls may become inadequate because of changes in conditions, or that the degree of compliance with the policies or procedures may deteriorate.
In our opinion, management’s assessment that Highland Hospitality Corporation maintained effective internal control over financial reporting as of December 31, 2006, is fairly stated, in all material respects, based on criteria established in Internal Control—Integrated Frameworkissued by COSO.Also, in our opinion, Highland Hospitality Corporation maintained, in all material respects, effective internal control over financial reporting as of December 31, 2006, based on criteria established in Internal Control—Integrated Frameworkissued by COSO.
We also have audited, in accordance with the standards of the Public Company Accounting Oversight Board (United States), the consolidated balance sheets of Highland Hospitality Corporation and subsidiaries as of December 31, 2006 and 2005, and the related consolidated statements of operations, stockholders’ equity, and cash flows for each of the years in the three-year period ended December 31, 2006, and our report dated February 27, 2007, expressed an unqualified opinion on those consolidated financial statements.
/s/ KPMG LLP
McLean, Virginia
February 27, 2007
F-3
Report of Independent Registered Public Accounting Firm
The Board of Directors and Stockholders
Highland Hospitality Corporation:
We have audited the accompanying consolidated balance sheets of Highland Hospitality Corporation (the Company) and subsidiaries as of December 31, 2006 and 2005, and the related consolidated statements of operations, stockholders’ equity, and cash flows for each of the years in the three-year period ended December 31, 2006. In connection with our audits of the consolidated financial statements of the Company, we have also audited the related financial statement schedule of real estate and accumulated depreciation. These consolidated financial statements and financial statement schedule are the responsibility of the Company’s management. Our responsibility is to express an opinion on these consolidated financial statements and financial statement schedule based on our audits.
We conducted our audits in accordance with the standards of the Public Company Accounting Oversight Board (United States). Those standards require that we plan and perform the audit to obtain reasonable assurance about whether the financial statements are free of material misstatement. An audit includes examining, on a test basis, evidence supporting the amounts and disclosures in the financial statements. An audit also includes assessing the accounting principles used and significant estimates made by management, as well as evaluating the overall financial statement presentation. We believe that our audits provide a reasonable basis for our opinion.
In our opinion, the consolidated financial statements referred to above present fairly, in all material respects, the financial position of Highland Hospitality Corporation and subsidiaries as of December 31, 2006 and 2005, and the results of their operations and their cash flows for each of the years in the three-year period ended December 31, 2006, in conformity with U.S. generally accepted accounting principles. Also, in our opinion, the related financial statement schedule, when considered in relation to the basic consolidated financial statements taken as a whole, presents fairly, in all material respects, the information set forth therein.
We also have audited, in accordance with the standards of the Public Company Accounting Oversight Board (United States), the effectiveness of Highland Hospitality Corporation’s internal control over financial reporting as of December 31, 2006, based on criteria established inInternal Control—Integrated Framework issued by the Committee of Sponsoring Organizations of the Treadway Commission (COSO), and our report dated February 27, 2007, expressed an unqualified opinion on management’s assessment of, and the effective operation of, internal control over financial reporting.
/s/ KPMG LLP
McLean, Virginia
February 27, 2007
F-4
HIGHLAND HOSPITALITY CORPORATION
CONSOLIDATED BALANCE SHEETS
(in thousands, except share data)
| | | | | | | | |
| | | December 31,
| |
| | | 2006
| | | 2005
| |
ASSETS | | | | | | | | |
Investment in hotel properties, net | | $ | 1,207,812 | | | $ | 910,532 | |
Deposits on hotel property acquisitions | | | — | | | | 8,202 | |
Cash and cash equivalents | | | 37,302 | | | | 64,761 | |
Restricted cash | | | 22,310 | | | | 21,486 | |
Accounts receivable, net of allowance for doubtful accounts
of $320 and $174, respectively | | | 17,162 | | | | 12,927 | |
Prepaid expenses and other assets | | | 24,182 | | | | 34,401 | |
Deferred financing costs, net of accumulated amortization
of $1,607 and $1,256, respectively | | | 4,429 | | | | 4,522 | |
| | |
|
|
| |
|
|
|
Total assets | | $ | 1,313,197 | | | $ | 1,056,831 | |
| | |
|
|
| |
|
|
|
LIABILITIES AND STOCKHOLDERS’ EQUITY | | | | | | | | |
Long-term debt | | $ | 646,432 | | | $ | 494,799 | |
Accounts payable and accrued expenses | | | 39,675 | | | | 23,163 | |
Dividends payable | | | 14,055 | | | | 7,327 | |
Other liabilities | | | 2,901 | | | | 2,718 | |
| | |
|
|
| |
|
|
|
Total liabilities | | | 703,063 | | | | 528,007 | |
| | |
|
|
| |
|
|
|
| | |
Minority interest in operating partnership | | | 4,497 | | | | 4,500 | |
Commitments and contingencies (Note 15) | | | | | | | | |
| | |
Preferred stock, $.01 par value; 100,000,000 shares authorized;
Series A Cumulative Redeemable Preferred Stock; 3,200,000
shares issued and outstanding at December 31, 2006 and 2005
($81,033 liquidation preference) | | | 77,112 | | | | 77,112 | |
Common stock, $.01 par value; 500,000,000 shares authorized;
61,327,647 shares and 51,969,372 shares issued at
December 31, 2006 and 2005, respectively | | | 613 | | | | 519 | |
Additional paid-in capital | | | 578,966 | | | | 477,876 | |
Treasury stock, at cost; 223,160 shares and 160,992 shares
at December 31, 2006 and 2005, respectively | | | (2,612 | ) | | | (1,772 | ) |
Cumulative dividends in excess of net income | | | (48,442 | ) | | | (29,411 | ) |
| | |
|
|
| |
|
|
|
Total stockholders’ equity | | | 605,637 | | | | 524,324 | |
| | |
|
|
| |
|
|
|
Total liabilities and stockholders’ equity | | $ | 1,313,197 | | | $ | 1,056,831 | |
| | |
|
|
| |
|
|
|
The accompanying notes are an integral part of these financial statements.
F-5
HIGHLAND HOSPITALITY CORPORATION
CONSOLIDATED STATEMENTS OF OPERATIONS
(in thousands, except per share data)
| | | | | | | | | | | | |
| | | Year Ended December 31,
| |
| | | 2006
| | | 2005
| | | 2004
| |
REVENUE | | | | | | | | | | | | |
Rooms | | $ | 278,652 | | | $ | 156,370 | | | $ | 84,097 | |
Food and beverage | | | 123,216 | | | | 73,505 | | | | 41,501 | |
Other | | | 20,720 | | | | 8,892 | | | | 5,373 | |
| | |
|
|
| |
|
|
| |
|
|
|
Total revenue | | | 422,588 | | | | 238,767 | | | | 130,971 | |
| | |
|
|
| |
|
|
| |
|
|
|
EXPENSES | | | | | | | | | | | | |
Hotel operating expenses: | | | | | | | | | | | | |
Rooms | | | 61,283 | | | | 35,706 | | | | 19,539 | |
Food and beverage | | | 82,973 | | | | 49,403 | | | | 29,868 | |
Other direct | | | 10,509 | | | | 4,309 | | | | 3,083 | |
Indirect | | | 146,303 | | | | 84,835 | | | | 47,026 | |
| | |
|
|
| |
|
|
| |
|
|
|
Total hotel operating expenses | | | 301,068 | | | | 174,253 | | | | 99,516 | |
Depreciation and amortization | | | 43,341 | | | | 22,845 | | | | 11,449 | |
Corporate general and administrative: | | | | | | | | | | | | |
Stock-based compensation | | | 6,404 | | | | 3,222 | | | | 3,122 | |
Other | | | 8,688 | | | | 6,445 | | | | 6,414 | |
| | |
|
|
| |
|
|
| |
|
|
|
Total operating expenses | | | 359,501 | | | | 206,765 | | | | 120,501 | |
| | |
|
|
| |
|
|
| |
|
|
|
Operating income | | | 63,087 | | | | 32,002 | | | | 10,470 | |
| | | |
Interest income | | | 1,839 | | | | 1,819 | | | | 1,206 | |
Interest expense | | | 38,929 | | | | 24,683 | | | | 8,406 | |
Loss on early extinguishment of debt | | | 996 | | | | — | | | | — | |
| | |
|
|
| |
|
|
| |
|
|
|
Income before income taxes, minority interest
in operating partnership and discontinued operations | | | 25,001 | | | | 9,138 | | | | 3,270 | |
| | | |
Income tax benefit (expense) | | | (2,731 | ) | | | (114 | ) | | | 1,040 | |
Minority interest in operating partnership | | | (286 | ) | | | (151 | ) | | | (101 | ) |
| | |
|
|
| |
|
|
| |
|
|
|
Income from continuing operations | | | 21,984 | | | | 8,873 | | | | 4,209 | |
| | |
|
|
| |
|
|
| |
|
|
|
Discontinued operations: | | | | | | | | | | | | |
Income from hotel properties sold | | | 1,649 | | | | 800 | | | | 57 | |
Gain on sale of hotel properties | | | 9,242 | | | | — | | | | — | |
| | |
|
|
| |
|
|
| |
|
|
|
Total income from discontinued operations | | | 10,891 | | | | 800 | | | | 57 | |
| | |
|
|
| |
|
|
| |
|
|
|
Net income | | | 32,875 | | | | 9,673 | | | | 4,266 | |
Preferred stock dividends | | | (6,300 | ) | | | (1,627 | ) | | | — | |
| | |
|
|
| |
|
|
| |
|
|
|
Net income available to common stockholders | | $ | 26,575 | | | $ | 8,046 | | | $ | 4,266 | |
| | |
|
|
| |
|
|
| |
|
|
|
Net income per common share—basic: | | | | | | | | | | | | |
Continuing operations | | $ | .26 | | | $ | .16 | | | $ | .10 | |
Discontinued operations | | | .19 | | | | .02 | | | | — | |
| | |
|
|
| |
|
|
| |
|
|
|
Net income available to common stockholders | | $ | .45 | | | $ | .18 | | | $ | .10 | |
| | |
|
|
| |
|
|
| |
|
|
|
Net income per common share—diluted: | | | | | | | | | | | | |
Continuing operations | | $ | .26 | | | $ | .16 | | | $ | .10 | |
Discontinued operations | | | .19 | | | | .02 | | | | — | |
| | |
|
|
| |
|
|
| |
|
|
|
Net income available to common stockholders | | $ | .44 | | | $ | .18 | | | $ | .10 | |
| | |
|
|
| |
|
|
| |
|
|
|
The accompanying notes are an integral part of these financial statements.
F-6
HIGHLAND HOSPITALITY CORPORATION
CONSOLIDATED STATEMENTS OF STOCKHOLDERS’ EQUITY
(in thousands, except share data)
| | | | | | | | | | | | | | | | | | | | | | | | | | | | | |
| | | | | | | Common Stock
| | | Additional Paid-In Capital
| | | Dividends in Excess of Net Income
| | | Total
| |
| | | Preferred Stock
| | Issued
| | Treasury
| | | | |
| | | Shares
| | Amount
| | Shares
| | Amount
| | Shares
| | | Amount
| | | | |
Balances at December 31, 2003 | | — | | $ | — | | 39,882,500 | | $ | 399 | | — | | | $ | — | | | $ | 357,537 | | | $ | (2,673 | ) | | $ | 355,263 | |
Issuance of restricted common stock to employees | | — | | | — | | 107,511 | | | 1 | | — | | | | — | | | | (1 | ) | | | — | | | | — | |
Issuance of unrestricted common stock to directors | | — | | | — | | 12,000 | | | — | | — | | | | — | | | | 129 | | | | — | | | | 129 | |
Purchase of treasury stock | | — | | | — | | — | | | — | | (71,242 | ) | | | (801 | ) | | | — | | | | — | | | | (801 | ) |
Stock-based compensation | | — | | | — | | — | | | — | | — | | | | — | | | | 2,993 | | | | — | | | | 2,993 | |
Adjustments to minority interest in operating partnership related to issuance of common stock and LP units and purchase of treasury stock | | — | | | — | | — | | | — | | — | | | | — | | | | 16 | | | | — | | | | 16 | |
Declaration of dividends on common stock | | — | | | — | | — | | | — | | — | | | | — | | | | — | | | | (14,388 | ) | | | (14,388 | ) |
Net income | | — | | | — | | — | | | — | | — | | | | — | | | | — | | | | 4,266 | | | | 4,266 | |
| | |
| |
|
| |
| |
|
| |
|
| |
|
|
| |
|
|
| |
|
|
| |
|
|
|
Balances at December 31, 2004 | | — | | | — | | 40,002,011 | | | 400 | | (71,242 | ) | | | (801 | ) | | | 360,674 | | | | (12,795 | ) | | | 347,478 | |
Sale of common stock, net of underwriters’ fees and issuance costs | | — | | | — | | 11,500,000 | | | 115 | | — | | | | — | | | | 110,406 | | | | — | | | | 110,521 | |
Sale of preferred stock, net of underwriters’ fees and issuance costs | | 3,200,000 | | | 77,112 | | — | | | — | | — | | | | — | | | | — | | | | — | | | | 77,112 | |
Issuance of common stock related to redemption of Operating Partnership units | | — | | | — | | 437,361 | | | 4 | | — | | | | — | | | | 3,768 | | | | — | | | | 3,772 | |
Issuance of restricted common stock to employees | | — | | | — | | 20,000 | | | — | | — | | | | — | | | | — | | | | — | | | | — | |
Issuance of unrestricted common stock to directors | | — | | | — | | 10,000 | | | — | | — | | | | — | | | | 110 | | | | — | | | | 110 | |
Purchase of treasury stock | | — | | | — | | — | | | — | | (89,750 | ) | | | (971 | ) | | | — | | | | — | | | | (971 | ) |
Stock-based compensation | | — | | | — | | — | | | — | | — | | | | — | | | | 3,112 | | | | — | | | | 3,112 | |
Adjustments to minority interest in operating partnership related to issuance of common stock and purchase of treasury stock | | — | | | — | | — | | | — | | — | | | | — | | | | (194 | ) | | | — | | | | (194 | ) |
Declaration of dividends on common stock | | — | | | — | | — | | | — | | — | | | | — | | | | — | | | | (25,694 | ) | | | (25,694 | ) |
Declaration of dividends on preferred stock | | — | | | — | | — | | | — | | — | | | | — | | | | — | | | | (595 | ) | | | (595 | ) |
Net income | | — | | | — | | — | | | — | | — | | | | — | | | | — | | | | 9,673 | | | | 9,673 | |
| | |
| |
|
| |
| |
|
| |
|
| |
|
|
| |
|
|
| |
|
|
| |
|
|
|
Balances at December 31, 2005 | | 3,200,000 | | | 77,112 | | 51,969,372 | | | 519 | | (160,992 | ) | | | (1,772 | ) | | | 477,876 | | | | (29,411 | ) | | | 524,324 | |
Sale of common stock, net of underwriters’ fees and issuance costs | | — | | | — | | 7,300,000 | | | 73 | | — | | | | — | | | | 87,989 | | | | — | | | | 88,062 | |
Issuance of common stock related to exercise of warrants | | — | | | — | | 681,275 | | | 8 | | — | | | | — | | | | 6,804 | | | | — | | | | 6,812 | |
Issuance of restricted common stock to employees | | — | | | — | | 1,365,000 | | | 13 | | — | | | | — | | | | (13 | ) | | | — | | | | — | |
Issuance of unrestricted common stock to directors | | — | | | — | | 12,000 | | | — | | — | | | | — | | | | 145 | | | | — | | | | 145 | |
Purchase of treasury stock | | — | | | — | | — | | | — | | (62,168 | ) | | | (840 | ) | | | — | | | | — | | | | (840 | ) |
Stock-based compensation | | — | | | — | | — | | | — | | — | | | | — | | | | 6,259 | | | | — | | | | 6,259 | |
Adjustments to minority interest in operating partnership related to issuance of common stock and purchase of treasury stock | | — | | | — | | — | | | — | | — | | | | — | | | | (94 | ) | | | — | | | | (94 | ) |
Declaration of dividends on common stock | | — | | | — | | — | | | — | | — | | | | — | | | | — | | | | (45,606 | ) | | | (45,606 | ) |
Declaration of dividends on preferred stock | | — | | | — | | — | | | — | | — | | | | — | | | | — | | | | (6,300 | ) | | | (6,300 | ) |
Net income | | — | | | — | | — | | | — | | — | | | | — | | | | — | | | | 32,875 | | | | 32,875 | |
| | |
| |
|
| |
| |
|
| |
|
| |
|
|
| |
|
|
| |
|
|
| |
|
|
|
Balances at December 31, 2006 | | 3,200,000 | | $ | 77,112 | | 61,327,647 | | $ | 613 | | (223,160 | ) | | $ | (2,612 | ) | | $ | 578,966 | | | $ | (48,442 | ) | | $ | 605,637 | |
| | |
| |
|
| |
| |
|
| |
|
| |
|
|
| |
|
|
| |
|
|
| |
|
|
|
The accompanying notes are an integral part of these financial statements.
F-7
HIGHLAND HOSPITALITY CORPORATION
CONSOLIDATED STATEMENTS OF CASH FLOWS
(in thousands)
| | | | | | | | | | | | |
| | | Year Ended December 31,
| |
| | | 2006
| | | 2005
| | | 2004
| |
Cash flows from operating activities: | | | | | | | | | | | | |
Net income | | $ | 32,875 | | | $ | 9,673 | | | $ | 4,266 | |
Adjustments to reconcile net income to net cash provided by operating activities: | | | | | | | | | | | | |
Depreciation and amortization | | | 43,341 | | | | 22,845 | | | | 11,449 | |
Amortization of deferred financing costs | | | 978 | | | | 1,021 | | | | 190 | |
Amortization of discount on mortgage loan | | | 72 | | | | 72 | | | | 30 | |
Change in fair value of interest rate swaps | | | (252 | ) | | | (512 | ) | | | (178 | ) |
Minority interest in operating partnership | | | 286 | | | | 151 | | | | 101 | |
Stock-based compensation | | | 6,404 | | | | 3,222 | | | | 3,122 | |
Loss on early extinguishment of debt | | | 996 | | | | — | | | | — | |
Gain on sale of hotel properties | | | (9,242 | ) | | | — | | | | — | |
Changes in assets and liabilities: | | | | | | | | | | | | |
Accounts receivable, net | | | (3,515 | ) | | | (4,810 | ) | | | 1,411 | |
Prepaid expenses and other assets | | | (757 | ) | | | (1,479 | ) | | | (4,001 | ) |
Accounts payable and accrued expenses | | | 9,382 | | | | 3,558 | | | | 7,298 | |
Other liabilities | | | 731 | | | | — | | | | (1,319 | ) |
Discontinued operations | | | 1,187 | | | | 507 | | | | 240 | |
| | |
|
|
| |
|
|
| |
|
|
|
Net cash provided by operating activities | | | 82,486 | | | | 34,248 | | | | 22,609 | |
| | |
|
|
| |
|
|
| |
|
|
|
Cash flows from investing activities: | | | | | | | | | | | | |
Acquisition of hotel properties, net of cash acquired | | | (338,193 | ) | | | (321,191 | ) | | | (416,743 | ) |
Payment of value-added taxes (VAT) related to foreign hotel acquisition | | | — | | | | (3,509 | ) | | | — | |
VAT refund related to foreign hotel acquisition | | | 3,774 | | | | — | | | | — | |
Improvements and additions to hotel properties | | | (51,062 | ) | | | (49,311 | ) | | | (6,688 | ) |
Deposits on hotel property acquisitions | | | — | | | | — | | | | (8,670 | ) |
Proceeds from insurance claim | | | 6,500 | | | | — | | | | — | |
Proceeds from sale of hotel properties | | | 71,638 | | | | — | | | | — | |
Change in restricted cash | | | (300 | ) | | | 17,224 | | | | (38,516 | ) |
| | |
|
|
| |
|
|
| |
|
|
|
Net cash used in investing activities | | | (307,643 | ) | | | (356,787 | ) | | | (470,617 | ) |
| | |
|
|
| |
|
|
| |
|
|
|
Cash flows from financing activities: | | | | | | | | | | | | |
Proceeds from sale of common stock | | | 95,069 | | | | 110,888 | | | | — | |
Proceeds from sale of preferred stock | | | — | | | | 77,481 | | | | — | |
Payment of offering expenses related to sale of common and preferred stock | | | (195 | ) | | | (736 | ) | | | (1,893 | ) |
Purchase of treasury stock | | | (840 | ) | | | (971 | ) | | | (801 | ) |
Net borrowings from revolving credit facility | | | 104,000 | | | | — | | | | — | |
Proceeds from term loan facility | | | 10,000 | | | | 40,000 | | | | 50,000 | |
Payment on term loan facility | | | (100,000 | ) | | | — | | | | — | |
Proceeds from issuance of mortgage debt | | | 142,250 | | | | 116,050 | | | | 282,600 | |
Scheduled principal payments on mortgage debt | | | (5,791 | ) | | | (4,177 | ) | | | (1,187 | ) |
Principal prepayment on mortgage debt | | | — | | | | — | | | | (16,927 | ) |
Payment of deferred financing costs | | | (1,974 | ) | | | (855 | ) | | | (4,923 | ) |
Deposits on loan applications | | | 754 | | | | (754 | ) | | | — | |
Payment of dividends to common stockholders | | | (38,920 | ) | | | (24,031 | ) | | | (8,798 | ) |
Payment of dividends to preferred stockholders | | | (6,300 | ) | | | (595 | ) | | | — | |
Payment of distributions to minority interests | | | (355 | ) | | | (481 | ) | | | (212 | ) |
| | |
|
|
| |
|
|
| |
|
|
|
Net cash provided by financing activities | | | 197,698 | | | | 311,819 | | | | 297,859 | |
| | |
|
|
| |
|
|
| |
|
|
|
Net decrease in cash | | | (27,459 | ) | | | (10,720 | ) | | | (150,149 | ) |
Cash and cash equivalents, beginning of period | | | 64,761 | | | | 75,481 | | | | 225,630 | |
| | |
|
|
| |
|
|
| |
|
|
|
Cash and cash equivalents, end of period | | $ | 37,302 | | | $ | 64,761 | | | $ | 75,481 | |
| | |
|
|
| |
|
|
| |
|
|
|
Supplemental disclosure of cash flow information: | | | | | | | | | | | | |
Cash paid for interest | | $ | 38,785 | | | $ | 24,929 | | | $ | 8,019 | |
Cash paid for income taxes | | | 1,541 | | | | — | | | | — | |
Capital lease obligations | | | 1,102 | | | | — | | | | — | |
Assumption of mortgage loans related to hotel acquisitions | | | — | | | | — | | | | 28,343 | |
Assumption of interest rate swap related to hotel acquisition | | | — | | | | — | | | | 948 | |
Issuance of common stock related to redemption of Operating Partnership units | | | — | | | | 3,772 | | | | — | |
The accompanying notes are an integral part of these financial statements.
F-8
HIGHLAND HOSPITALITY CORPORATION
NOTES TO CONSOLIDATED FINANCIAL STATEMENTS
| 1. | | Organization and Description of Business |
Highland Hospitality Corporation (the “Company”) is a self-advised real estate investment trust (“REIT”) that owns upscale full-service, premium limited-service, and extended-stay properties located in major convention, business, resort and airport markets in the United States. The Company commenced operations on December 19, 2003 when it completed its initial public offering (“IPO”) and concurrently acquired its first three hotel properties. As of December 31, 2006, the Company owned 26 hotel properties with 8,239 rooms located in 13 states and the District of Columbia.
Substantially all of the Company’s assets are held by, and all of its operations are conducted through, Highland Hospitality, L.P., a Delaware limited partnership (the “Operating Partnership”). For the Company to qualify as a REIT, it cannot operate hotels. Therefore, the Operating Partnership, which is owned approximately 99% by the Company and approximately 1% by other limited partners, leases its hotels to subsidiaries of HHC TRS Holding Corporation (collectively, “HHC TRS”), which is a wholly owned subsidiary of the Operating Partnership. HHC TRS then engages hotel management companies to operate the hotels pursuant to management contracts. HHC TRS is treated as a taxable REIT subsidiary for federal income tax purposes.
| 2. | | Summary of Significant Accounting Policies |
Basis of Presentation—The consolidated financial statements presented herein include all of the accounts of Highland Hospitality Corporation and its subsidiaries. All intercompany accounts and transactions have been eliminated in consolidation.
Cash and Cash Equivalents—The Company considers all highly liquid investments with an original maturity of three months or less to be cash equivalents.
Restricted Cash—Restricted cash includes reserves held in escrow for hotel renovations, normal replacements of furniture, fixtures and equipment, real estate taxes, and insurance, pursuant to certain requirements in the Company’s hotel management, franchise, and loan agreements.
Derivative Instruments—The Company accounts for derivative instruments in accordance with the provisions of Statement of Financial Accounting Standards No. 133,Accounting for Derivative Instruments and Hedging Activities, as amended and interpreted (“SFAS 133”). Under SFAS 133, all derivative instruments are required to be recognized as either assets or liabilities in the balance sheet and measured at fair value. Derivative instruments used to hedge the exposure to changes in the fair value of an asset, liability, or firm commitment attributable to a particular risk, such as interest rate risk, are considered fair value hedges. Derivative instruments used to hedge the exposure to variability in expected future cash flows, or other types of forecasted transactions, are considered cash flow hedges. For a derivative instrument designated as a cash flow hedge, the change in fair value each period is reported in accumulated other comprehensive income in stockholders’ equity to the extent the hedge is effective. For a derivative instrument designated as a fair value hedge, the change in fair value each period is reported in earnings along with the change in fair value of the hedged item attributable to the risk being hedged. For a derivative instrument that does not qualify for hedge accounting or is not designated as a hedge, the change in fair value each period is reported in earnings. The Company does not enter into derivative instruments for speculative trading purposes.
Fair Value of Financial Instruments—The Company’s financial instruments include cash and cash equivalents, restricted cash, accounts receivable, accounts payable, accrued expenses, and long-term debt. The carrying values reported in the consolidated balance sheets for these financial instruments approximate fair value.
Investment in Hotel Properties—Investments in hotel properties are recorded at acquisition cost and allocated to land, property and equipment and identifiable intangible assets in accordance with Statement of
F-9
HIGHLAND HOSPITALITY CORPORATION
NOTES TO CONSOLIDATED FINANCIAL STATEMENTS—(Continued)
Financial Accounting Standards No. 141,Business Combinations. Replacements and improvements are capitalized, while repairs and maintenance are expensed as incurred. Upon the sale or retirement of a fixed asset, the cost and related accumulated depreciation are removed from the Company’s accounts and any resulting gain or loss is included in the consolidated statements of operations.
Depreciation is computed using the straight-line method over the estimated useful lives of the assets, generally 15 to 40 years for buildings and building improvements and three to ten years for furniture, fixtures and equipment. Leasehold improvements are amortized over the shorter of the lease term or the useful lives of the related assets.
The Company reviews its investments in hotel properties for impairment whenever events or changes in circumstances indicate that the carrying value of the hotel properties may not be recoverable. Events or circumstances that may cause a review include, but are not limited to, adverse changes in the demand for lodging at the properties due to declining national or local economic conditions and/or new hotel construction in markets where the hotels are located. When such conditions exist, management performs an analysis to determine if the estimated undiscounted future cash flows from operations and the proceeds from the ultimate disposition of a hotel property exceed its carrying value. If the estimated undiscounted future cash flows are less than the carrying amount of the asset, an adjustment to reduce the carrying amount to the related hotel property’s estimated fair market value is recorded and an impairment loss recognized. For the year ended December 31, 2005, the Company recorded an impairment loss of $6.5 million as a result of the damage caused by Hurricane Wilma at the Barcelo Tucancun Beach resort (see Note 6). No impairment losses have been recorded for the year ended December 31, 2006 or the year ended December 31, 2004.
The Company classifies a hotel property as held for sale in the period in which it has made the decision to dispose of the hotel property, a binding agreement to purchase the property has been signed under which the buyer has committed a significant amount of nonrefundable cash, and no significant financing contingencies exist which could cause the transaction not to be completed in a timely manner. If these criteria are met, depreciation of the hotel property will cease and an impairment loss will be recorded if the fair value of the hotel property, less the costs to sell, is lower than the carrying amount of the hotel property. The Company will classify the loss, together with the related results of operations, as discontinued operations in the consolidated statements of operations and classify the assets and related liabilities as held for sale in the consolidated balance sheets.
The Company capitalizes interest related to hotel properties undergoing major renovations. Interest capitalized for the years ended December 31, 2006 and 2005 was $0.5 million and $0.4 million, respectively. No interest was capitalized for the year ended December 31, 2004.
Minority Interest in Operating Partnership—Certain hotel properties have been acquired by the Operating Partnership, in part, through the issuance of limited partnership units of the Operating Partnership. The minority interest in the Operating Partnership is: (i) increased or decreased by the limited partners’ pro-rata share of the Operating Partnership’s net income or net loss, respectively; (ii) decreased by distributions; (iii) decreased by redemption of partnership units for the Company’s common stock; and (iv) adjusted to equal the net equity of the Operating Partnership multiplied by the limited partners’ ownership percentage immediately after each issuance of units of the Operating Partnership and/or shares of the Company’s common stock and after each purchase of treasury stock through an adjustment to additional paid-in capital. Net income or net loss is allocated to the minority interest in the Operating Partnership based on the weighted-average percentage ownership throughout the period.
Revenue Recognition—Revenues from operations of the hotels are recognized when the services are provided. Revenues consist of room sales, food and beverage sales, and other hotel department revenues, such as golf, parking, telephone, and gift shop sales.
F-10
HIGHLAND HOSPITALITY CORPORATION
NOTES TO CONSOLIDATED FINANCIAL STATEMENTS—(Continued)
Deferred Financing Costs—Deferred financing costs are recorded at cost and consist of loan fees and other costs incurred in issuing debt. Amortization of deferred financing costs is computed using a method that approximates the effective interest method over the term of the related debt and is included in interest expense in the consolidated statements of operations.
Debt Discounts or Premiums—Debt assumed in connection with hotel property acquisitions is recorded at fair value at the acquisition date and any resulting discount or premium is amortized through interest expense in the consolidated statements of operations over the remaining term of the debt.
Income Taxes—The Company has elected to be taxed as a REIT under Sections 856 through 860 of the Internal Revenue Code. As a REIT, the Company generally will not be subject to federal income tax on that portion of its net income (loss) that does not relate to HHC TRS, the Company’s wholly owned taxable REIT subsidiary. HHC TRS, which leases the Company’s hotels from the Operating Partnership, is subject to federal and state income taxes.
The Company accounts for income taxes in accordance with the provisions of Statement of Financial Accounting Standards No. 109,Accounting for Income Taxes (“SFAS 109”). Under SFAS 109, the Company accounts for income taxes using the asset and liability method under which deferred tax assets and liabilities are recognized for the future tax consequences attributable to differences between the financial statement carrying amounts of existing assets and liabilities and their respective tax bases. Valuation allowances are provided if based upon the weight of the available evidence, it is more likely than not that some or all of the deferred tax assets will not be realized.
Earnings Per Share—Basic net income (loss) per common share is calculated by dividing net income (loss) available to common stockholders, less dividends on unvested restricted common stock, by the weighted-average number of common shares outstanding during the period. Diluted net income (loss) per common share is calculated by dividing net income (loss) available to common stockholders, less dividends on unvested restricted common stock, by the weighted-average number of common shares outstanding during the period, plus other potentially dilutive securities, such as unvested shares of restricted common stock and warrants. The outstanding Operating Partnership units (which may be redeemed for common shares) have been excluded from the diluted net income (loss) per common share calculation, as there would be no effect on reported diluted net income (loss) per common share.
Stock-Based Compensation—From time-to-time, the Company grants restricted stock awards to employees. To-date, the Company has granted three types of restricted stock awards: (1) awards that vest solely on continued employment (time-based awards); (2) awards that vest based on the Company achieving specified levels of funds from operations (FFO) and continued employment (performance-based awards); and (3) awards that vest based on the Company achieving specified levels of relative total shareholder return and continued employment (market-based awards). The Company measures stock-based compensation expense for the restricted stock awards based on the fair value of the awards on the date of grant. The fair value of time-based awards and performance-based awards is determined based on the average trading price of the Company’s common stock on the measurement date, which is generally the date of grant. The fair value of market-based awards is determined using a Monte Carlo simulation. For time-based awards, stock-based compensation expense is recognized on a straight-line basis over the life of the entire award. For performance-based awards and market-based awards, stock-based compensation expense is recognized over the requisite service period for each award. No compensation cost is recognized for awards for which employees do not render the requisite service.
Comprehensive Income (Loss)—Comprehensive income (loss), as defined, includes all changes in stockholders’ equity during a period from non-owner sources. The Company does not have any items of comprehensive income (loss) other than net income (loss).
F-11
HIGHLAND HOSPITALITY CORPORATION
NOTES TO CONSOLIDATED FINANCIAL STATEMENTS—(Continued)
Treasury Stock—The Company records treasury stock purchases under the cost method whereby the entire cost of the acquired stock is recorded as treasury stock.
Segment Information—Statement of Financial Accounting Standards No. 131,Disclosures about Segments of an Enterprise and Related Information (“SFAS 131”), requires public entities to report certain information about operating segments. Based on the guidance provided in SFAS 131, the Company has determined that its business is conducted in one reportable segment, hotel ownership.
Use of Estimates—The preparation of the financial statements in conformity with U.S. generally accepted accounting principles requires management to make estimates and assumptions that affect the reported amounts of assets and liabilities and disclosure of contingent assets and liabilities at the date of the financial statements and the reported amounts of revenues and expenses during the reporting period. Actual results could differ from those estimates.
Reclassifications—Certain reclassifications have been made to the prior year financial statements to conform to the current year presentation.
New Accounting Pronouncements—FASB Interpretation No. 48,Accounting for Uncertainty in Income Taxes, an interpretation of FASB Statement No. 109 (“FIN 48”), prescribes a recognition threshold and measurement attribute for the financial statement recognition and measurement of a tax position taken in a tax return. The Company must determine whether it is “more-likely-than-not” that a tax position will be sustained upon examination, including resolution of any related appeals or litigation processes, based on the technical merits of the position. Once it is determined that a position meets the more-likely-than-not recognition threshold, the position is measured to determine the amount of benefit to recognize in the financial statements. FIN 48 applies to all tax positions related to income taxes subject to Statement of Financial Accounting Standards No. 109,Accounting for Income Taxes. The Company will adopt the provisions of this interpretation beginning in the first quarter of 2007. The cumulative effect of applying the provisions of FIN 48 will be reported as an adjustment to the opening balance of retained earnings on January 1, 2007. The Company does not anticipate that the adoption of FIN 48 will have a material effect on its results of operations, financial position, or cash flows.
Statement of Financial Accounting Standards No. 157,Fair Value Measurements(“SFAS 157”), defines fair value, establishes a framework for measuring fair value in U.S. generally accepted accounting principles, and expands disclosures about fair value measurements. Statement of Financial Accounting Standards No. 159, The Fair Value Option for Financial Assets and Financial Liabilities (“SFAS 159”), provides companies with the option to report selected financial assets and liabilities at fair value. The statement’s objective is to reduce both complexity in accounting for financial instruments and the volatility in earnings caused by measuring related assets and liabilities differently. The Company will adopt the provisions of SFAS 157 and SFAS 159 effective January 1, 2008. The Company does not anticipate that the adoption of the two statements will have a material impact on the Company’s results of operations, financial position, or cash flows.
| 3. | | Acquisition of Hotel Properties |
For the years ended December 31, 2006, 2005 and 2004, the Company acquired the following hotel properties:
On January 8, 2004, the Company acquired the 238-room Hilton Tampa Westshore hotel located in Tampa, Florida for approximately $30.2 million, which included the assumption of mortgage debt that encumbered the hotel property of $17.0 million. On January 12, 2004, the Company acquired the 158-room Hilton Garden Inn Baltimore/Washington International (BWI) Airport hotel located in Linthicum, Maryland for approximately $22.7 million. The Company entered into long-term agreements with Crestline Hotels & Resorts, Inc. to manage the two hotel properties.
On May 10, 2004, the Company acquired the 491-room Dallas/Fort Worth Airport Marriott hotel located in Dallas/Fort Worth, Texas for approximately $59.6 million. The Company assumed the existing long-term agreement with Marriott International, Inc. to manage the hotel property.
F-12
HIGHLAND HOSPITALITY CORPORATION
NOTES TO CONSOLIDATED FINANCIAL STATEMENTS—(Continued)
On August 2, 2004, the Company acquired the 156-room Courtyard Savannah Historic District hotel in Savannah, Georgia and the 109-room Residence Inn Tampa Downtown hotel in Tampa, Florida for approximately $38.5 million. The Company entered into long-term agreements with McKibbon Hotel Management, Inc. to manage the two hotel properties.
On August 19, 2004, the Company acquired a four-hotel portfolio, consisting of the 510-room Hilton Parsippany hotel in Parsippany, New Jersey, the 495-room Crowne Plaza Atlanta-Ravinia hotel in Atlanta, Georgia, the 360-room Wyndham Wind Watch hotel in Hauppauge, New York, and the 322-room Tremont Boston hotel in Boston, Massachusetts, for approximately $229 million. The acquisition was partially funded with a $160 million financing, comprised of a $135 million mortgage loan and a $25 million mezzanine loan.
The Company entered into long-term agreements with Crestline Hotels & Resorts, Inc. to manage the Hilton Parsippany hotel and the Crowne Plaza Atlanta-Ravinia hotel. The Company converted the Wyndham Wind Watch hotel to the Hyatt Regency brand and entered into a long-term agreement with Hyatt Corporation to manage the hotel property. The Company converted the Tremont Boston hotel to the Courtyard brand and entered into a long-term agreement with Marriott International, Inc. to manage the hotel property.
On September 1, 2004, the Company acquired the 283-room Radisson Mount Laurel hotel for approximately $14.5 million and subsequently sold the hotel on June 29, 2006 (see Note 5).
On September 15, 2004, the Company acquired the 299-room Omaha Marriott hotel for approximately $29.1 million. The Company entered into a long-term agreement with Crestline Hotels & Resorts, Inc. to manage the hotel property.
On September 17, 2004, the Company acquired the 202-room Courtyard Denver Airport hotel for approximately $18.1 million, which included the assumption of mortgage debt that encumbers the hotel property of approximately $11.3 million, net of discount. The Company assumed the existing long-term agreement with Marriott International, Inc. to manage the hotel property.
On February 4, 2005, the Company acquired the 196-room Sheraton Annapolis hotel in Annapolis, Maryland for approximately $18.4 million. The entity that sold the hotel is owned 33.3% by Barceló Corporación Empresarial, S.A. (“Barceló”), which is a related party and the parent company of Barceló Crestline Corporation (“Barceló Crestline”), which sponsored the Company’s formation and IPO. In conjunction with the acquisition, the Company assumed a lease agreement for the land underlying the hotel with an initial term ending September 2059. The Company concluded that the ground lease terms are below current market terms and recorded a $1.7 million favorable lease asset, which the Company is amortizing over the useful life of the building. The Company entered into a long-term agreement with Crestline Hotels & Resorts, Inc. to manage the hotel property.
On April 15, 2005, the Company acquired the 332-room Tucancun Beach Resort and Villas in Cancun, Mexico for approximately $32.5 million and subsequently sold the resort on August 31, 2006 (see Note 5).
On July 14, 2005, the Company acquired the 410-room Wyndham Palm Springs hotel in Palm Springs, California for approximately $57.1 million. In conjunction with the acquisition, the Company assumed a sub-lease agreement for the land underlying the hotel with an initial term ending December 2059, with the right to extend the term an additional 25 years. The acquisition was funded with proceeds from the issuance of a $37.1 million loan, secured by the Wyndham Palm Springs hotel, and a portion of a $25 million borrowing under the Company’s term loan facility. The Company entered into a long-term agreement with Crestline Hotels & Resorts, Inc. to manage the property.
F-13
HIGHLAND HOSPITALITY CORPORATION
NOTES TO CONSOLIDATED FINANCIAL STATEMENTS—(Continued)
On October 24, 2005, the Company acquired the 385-room Hilton Boston Back Bay hotel in Boston, Massachusetts for approximately $110.3 million. The Company entered into a long-term agreement with Hilton Hotels Corporation to manage the hotel property.
On November 15, 2005, the Company acquired the 294-room Westin Princeton at Forrestal Village hotel in Princeton, New Jersey for approximately $54.2 million. In conjunction with the acquisition, the Company assumed a lease agreement for the land underlying the hotel with an initial term ending April 2056. Rent for the term of the ground lease was paid in full by a previous lessee, and as a result, the Company recorded a $7.4 million favorable lease asset, which the Company is amortizing over the useful life of the building. The Company entered into a long-term agreement with Crestline Hotels & Resorts, Inc. to manage the property.
On December 9, 2005, the Company acquired the 144-room Churchill hotel in Washington, DC for approximately $49.4 million. The Company entered into a long-term agreement with Crestline Hotels & Resorts, Inc. to manage the property.
On February 24, 2006, the Company acquired the 673-room Nashville Renaissance hotel in Nashville, Tennessee for approximately $80.3 million. In conjunction with the acquisition, the Company assumed a lease agreement for the land underlying the hotel and a portion of the adjoining convention center with an initial term ending June 2017, with seven 10-year renewal options. The Company entered into a long-term agreement with Marriott International, Inc. to manage the property.
On March 15, 2006, the Company acquired the 240-room Melrose hotel in Washington, DC for approximately $77.0 million. The Company entered into a long-term agreement with Crestline Hotels & Resorts, Inc. to manage the property as an independent hotel.
On March 16, 2006, the Company acquired the 585-room Pointe Hilton Tapatio Cliffs resort in Phoenix, Arizona for approximately $81.9 million. The Company entered into a long-term agreement with Hilton Hotels Corporation to manage the hotel property.
On June 1, 2006, the Company acquired the newly developed 210-room Courtyard Gaithersburg Washingtonian Center hotel in Gaithersburg, Maryland for approximately $30.1 million. The acquisition had been under a definitive agreement since June 2004, at which time the Company placed $8 million of the purchase price into escrow pending completion of the development. The Company entered into a long-term agreement with Marriott International, Inc. to manage the property.
On September 22, 2006, the Company acquired the 444-room Ritz-Carlton Atlanta Downtown hotel in Atlanta, Georgia for approximately $77.4 million. The Company assumed the existing management agreement under which the Ritz-Carlton Hotel Company LLC will continue to operate the hotel.
F-14
HIGHLAND HOSPITALITY CORPORATION
NOTES TO CONSOLIDATED FINANCIAL STATEMENTS—(Continued)
The combined allocation of the purchase prices to the acquired assets and liabilities based on their fair values was as follows (in thousands):
| | | | | | | | |
| | | 2006 Acquisitions
| | | 2005 Acquisitions
| |
Land and land improvements | | $ | 50,564 | | | $ | 35,819 | |
Buildings and leasehold improvements | | | 267,278 | | | | 254,615 | |
Furniture, fixtures and equipment | | | 30,800 | | | | 22,800 | |
Cash | | | 126 | | | | 130 | |
Restricted cash | | | 524 | | | | — | |
Accounts receivable, net | | | 1,370 | | | | 619 | |
Prepaid assets and other assets | | | 2,402 | | | | 10,433 | |
Accounts payable and accrued expenses | | | (6,492 | ) | | | (2,409 | ) |
| | |
|
|
| |
|
|
|
Net assets acquired | | $ | 346,572 | | | $ | 322,007 | |
| | |
|
|
| |
|
|
|
The results of operations for each of the hotel properties are included in the Company’s consolidated statements of operations from their respective acquisition dates. The following pro forma financial information presents the results of operations of the Company for the years ended December 31, 2006 and 2005 as if the Nashville Renaissance hotel, The Melrose hotel, the Pointe Hilton Tapatio Cliffs resort, and the Ritz-Carlton Atlanta Downtown hotel acquisitions, as well as the hotel acquisitions that occurred in 2005 (except for the Barceló Tucancun Beach resort), and the financing transactions necessary to acquire the hotel properties had taken place on January 1, 2005. The pro forma financial information does not include discontinued operations related to the Marriott Mount Laurel hotel and the Barceló Tucancun Beach resort, which were sold on June 29, 2006 and August 31, 2006, respectively. In addition, no pro forma adjustments have been included for the newly developed Courtyard Gaithersburg Washingtonian Center hotel. The pro forma results have been prepared for comparative purposes only and do not purport to be indicative of the results of operations that would have actually occurred had the transactions taken place on January 1, 2005, or of future results of operations (in thousands, except per share data).
| | | | | | |
| | | Year Ended
December 31,
|
| | | 2006
| | 2005
|
Total revenue | | $ | 469,716 | | $ | 422,536 |
Total operating expenses | | | 397,764 | | | 367,359 |
Operating income | | | 71,952 | | | 55,177 |
Net income | | | 27,653 | | | 16,857 |
Net income available to common stockholders | | | 21,353 | | | 10,557 |
Net income per common share: | | | | | | |
Basic and diluted | | | .35 | | | .18 |
| 4. | | Investment in Hotel Properties |
Investment in hotel properties as of December 31, 2006 and 2005 consisted of the following (in thousands):
| | | | | | | | |
| | | December 31,
| |
| | | 2006
| | | 2005
| |
Land and land improvements | | $ | 142,478 | | | $ | 103,133 | |
Buildings and leasehold improvements | | | 1,019,490 | | | | 756,971 | |
Furniture, fixtures and equipment | | | 122,300 | | | | 70,220 | |
Construction-in-progress | | | 3,639 | | | | 18,287 | |
| | |
|
|
| |
|
|
|
| | | | 1,287,907 | | | | 948,611 | |
Less: accumulated depreciation and amortization | | | (80,095 | ) | | | (38,079 | ) |
| | |
|
|
| |
|
|
|
| | | $ | 1,207,812 | | | $ | 910,532 | |
| | |
|
|
| |
|
|
|
F-15
HIGHLAND HOSPITALITY CORPORATION
NOTES TO CONSOLIDATED FINANCIAL STATEMENTS—(Continued)
| 5. | | Discontinued Operations |
On June 29, 2006, the Company sold the Marriott Mount Laurel hotel in Mount Laurel, New Jersey for net sales proceeds of approximately $31.8 million and recognized a gain of approximately $7.4 million.
On August 31, 2006, the Company sold the Barceló Tucancun Beach resort to Playa Hotels & Resorts, S.L. for net sales proceeds of approximately $38.5 million and recognized a gain of approximately $1.8 million, net of taxes of $0.1 million. Playa Hotels & Resorts, S.L., a related party, is partially owned by Barceló. Barceló Crestline advises Playa Hotels & Resorts, S.L. in evaluating investment opportunities. The Company’s non-executive Chairman, Bruce D. Wardinski, is the Chief Executive Officer of Barceló Crestline and the Chairman and Chief Executive Officer of Playa Hotels & Resorts, S.L. The sale of this resort was unanimously approved by a special committee consisting of the Company’s independent directors.
The results of operations for the Marriott Mount Laurel hotel and the Barceló Tucancun Beach resort have been reclassified as discontinued operations in the consolidated statements of operations for all years presented. For the years ended December 31, 2006, 2005 and 2004, total revenues for the Marriott Mount Laurel hotel and the Barceló Tucancun Beach resort were approximately $9.6 million, $12.4 million and $2.0 million, respectively, and pre-tax income from operations was $1.3 million, $0.9 million and $30,000, respectively.
On October 22, 2005, Hurricane Wilma made landfall in Cancun, Mexico causing substantial wind and water damage to the Barceló Tucancun Beach resort. The Company had comprehensive insurance coverage for both property damage and business interruption, providing for an aggregate of $25 million in coverage. In 2005, the Company assessed the property damage to be approximately $6.5 million and recorded an investment in hotel properties write-off and a corresponding insurance claim receivable for the $6.5 million. After six months of restoration, the resort reopened for business on April 22, 2006. In August 2006, the Company finalized the settlement related to damages for approximately $9 million. Approximately $6.6 million of the insurance proceeds related to property damage coverage and approximately $2.4 million related to business interruption coverage. For the year ended December 31, 2006, the Company recorded a gain on settlement of insurance claim of approximately $1.3 million, net of taxes of approximately $0.5 million. Since the Barceló Tucancun Beach resort was sold on August 31, 2006, the net gain is included in income from hotel properties sold in the consolidated statements of operations.
On January 8, 2004, in connection with the Hilton Tampa Westshore hotel acquisition, the Company assumed a $17 million mortgage loan that encumbered the hotel property. The loan bore a fixed annual interest rate of 7.9% and was scheduled to mature on July 1, 2005. On December 1, 2004, the Company refinanced the assumed loan with a $17.6 million mortgage loan. The new mortgage loan bears a fixed annual interest rate of 5.7% and matures on December 1, 2014. Principal payments commenced in December 2004 and are based on a 30-year amortization period. In addition, the loan agreement contains a restrictive provision that requires the loan servicer to retain in escrow excess cash flow from the encumbered hotel property if net cash flow, as defined, for the trailing twelve months declines below a specified threshold.
On July 9, 2004, the Company completed a $67 million financing secured by the Hyatt Regency Savannah hotel, the Portsmouth Renaissance hotel and conference center, and the Hilton Garden Inn BWI Airport hotel. The loan bears a fixed annual interest rate of 6.47% and matures on July 11, 2011. Principal payments commenced in August 2005 and are based on a 25-year amortization period. The loan agreement contains
F-16
HIGHLAND HOSPITALITY CORPORATION
NOTES TO CONSOLIDATED FINANCIAL STATEMENTS—(Continued)
standard provisions that require the loan servicer to maintain escrow accounts over the term of the loan for certain items, including hotel capital improvements, ground rent, real estate taxes and insurance. In addition, the loan agreement contains a restrictive provision that requires the loan servicer to retain in escrow excess cash flow from the encumbered hotel properties if net cash flow, as defined, for the trailing twelve months declines below a specified threshold.
On August 19, 2004, in connection with the acquisition of the Hilton Parsippany hotel, the Crowne Plaza Atlanta-Ravinia hotel, the Hyatt Regency Wind Watch Long Island hotel, and the Courtyard Boston Tremont hotel, the Company completed a $160 million financing, comprised of a $135 million mortgage loan and a $25 million mezzanine loan. The $135 million mortgage loan is secured by the four hotel properties. The $25 million mezzanine loan is secured by equity interests in the Company’s subsidiary that is the borrower under the $135 million mortgage loan. The financing bears interest at a fixed, annual, blended rate of 6.65% and matures on September 1, 2011. Principal payments commenced in September 2004 and are based on a 25-year amortization period. The loan agreements contain standard provisions that require the loan servicer to maintain escrow accounts over the terms of the loans for certain items, including hotel capital improvements and real estate taxes. In addition, the loan agreements contain a restrictive provision that requires the loan servicer to retain in escrow excess cash flow from the encumbered hotel properties if net cash flow, as defined, for the trailing twelve months declines below a specified threshold.
On September 9, 2004, the Company completed a $38 million financing secured by the Dallas/Fort Worth Airport Marriott hotel. The loan bears a fixed annual interest rate of 5.8% and matures on October 1, 2011. Principal payments commenced in October 2004 and are based on a 25-year amortization period.
On September 17, 2004, in connection with the Courtyard Denver Airport hotel acquisition, the Company assumed an $11.3 million, net of discount of $0.3 million, mortgage loan that encumbers the hotel property. The loan bears an interest rate of LIBOR, plus 1.75%, and matures on November 1, 2008. The loan agreement provides for monthly principal and interest payments, with principal payments being based on a 20-year amortization period. The Company also assumed an interest rate swap agreement that fixes the interest rate on the mortgage loan to an annual rate of 7.34%.
On December 22, 2004, the Company completed a $100 million term loan facility. The facility bore interest at the Company’s election of either (a) LIBOR, plus 2.5%, or (b) the greater of (i) the prime rate, plus 0.5% and (ii) the federal funds rate, plus 1.5%. On February 24, 2006, the Company extinguished the $100 million term loan facility and completed a separate unsecured revolving credit facility with a syndicate of banks. In connection with the extinguishment, the Company wrote off approximately $1.1 million of remaining unamortized deferred financing costs related to the term loan facility.
The revolving credit facility provides aggregate revolving loan commitments of up to $150 million with an option to increase the amount of the facility by up to $50 million. The $50 million option was exercised in November 2006. The amount that the Company can borrow under the revolving credit facility is based on the value of the Company’s unencumbered hotel properties included in the borrowing base, as defined in the credit agreement. As of December 31, 2006, the maximum borrowing availability under the facility was $200 million, of which $104 million had been drawn.
Borrowings under the revolving credit facility bear interest at variable rates equal to, at the Company’s option, either (a) LIBOR, plus a credit spread, or (b) a base rate, plus a credit spread. The base rate in effect on any given day is equal to the higher of (a) the prime rate published by Wells Fargo Bank, N.A., or (b) the Federal Funds Rate announced by the Federal Reserve Bank, plus 0.5%. The credit spread is reset each quarter based on the Company’s current leverage ratio. The credit agreement contains standard financial covenants, including
F-17
HIGHLAND HOSPITALITY CORPORATION
NOTES TO CONSOLIDATED FINANCIAL STATEMENTS—(Continued)
certain leverage ratios, coverage ratios, and a minimum tangible net worth. The Company is required to pay an unused fee of 0.20% per annum on the amount of unused capacity under the credit facility. The facility matures on February 23, 2009 and has a one-year extension option.
On July 14, 2005, in connection with the Wyndham Palm Springs hotel acquisition, the Company completed a $37.1 million financing secured by the Wyndham Palm Springs hotel. The loan bears a fixed annual interest rate of 5.35% and matures on August 1, 2012. Principal payments will commence in August 2007 and will be based on a 30-year amortization period.
On October 7, 2005, the Company completed a $10 million financing secured by the Sheraton Annapolis hotel. The loan bears a fixed annual interest rate of 5.21% and matures on November 1, 2012. Principal payments will commence in November 2007 and will be based on a 30-year amortization period.
On December 6, 2005, the Company completed a $69 million financing secured by the Hilton Boston Back Bay hotel. The loan bears a fixed annual interest rate of 5.96% and matures on January 1, 2013. Principal payments will commence in January 2007 and will be based on a 30-year amortization period.
On January 6, 2006, the Company completed a $35 million financing secured by the Westin Princeton at Forrestal Village hotel. The loan bears a fixed annual interest rate of 5.97% and matures on February 1, 2013. Principal payments will commence in February 2007 and will be based on a 30-year amortization period.
On March 13, 2006, the Company completed a $52 million financing secured by the Nashville Renaissance hotel. The loan bears a fixed annual interest rate of 6.11% and matures on April 1, 2013. Principal payments commenced in April 2006 and are based on a 25-year amortization period.
On August 30, 2006, the Company completed a $55.3 million financing secured by the Pointe Hilton Tapatio Cliffs resort. The loan bears a fixed annual interest rate of 6.28% and matures on September 1, 2016. Principal payments will commence in September 2008 and will be based on a 30-year amortization period.
As of December 31, 2006, the Company was in compliance with the financial covenants contained in its loan agreements. The following details the Company’s long-term debt as of December 31, 2006 (in thousands):
| | | | | | | | | | | | |
| | | Encumbered Hotels
| | Interest Rate
| | Maturity
| | Principal Balance December 31, 2006
| |
Mortgage loan | | 3 hotels | | 6.47% | | Fixed | | July 2011 | | $ | 65,504 | |
Mortgage loan(1) | | 4 hotels | | 6.00% | | Fixed | | September 2011 | | | 129,700 | |
Mortgage loan | | 1 hotel | | 5.80% | | Fixed | | October 2011 | | | 36,373 | |
Mortgage loan(2) | | 1 hotel | | LIBOR + 1.75% | | Variable | | November 2008 | | | 10,790 | |
Mortgage loan | | 1 hotel | | 5.70% | | Fixed | | December 2014 | | | 17,141 | |
Mezzanine loan(1) | | None | | 10.14% | | Fixed | | September 2011 | | | 24,332 | |
Mortgage loan | | 1 hotel | | 5.35% | | Fixed | | August 2012 | | | 37,050 | |
Mortgage loan | | 1 hotel | | 5.21% | | Fixed | | November 2012 | | | 10,000 | |
Mortgage loan | | 1 hotel | | 5.96% | | Fixed | | January 2013 | | | 69,000 | |
Mortgage loan | | 1 hotel | | 5.97% | | Fixed | | February 2013 | | | 35,000 | |
Mortgage loan | | 1 hotel | | 6.11% | | Fixed | | April 2013 | | | 51,322 | |
Mortgage loan | | 1 hotel | | 6.28% | | Fixed | | September 2016 | | | 55,250 | |
Revolving credit facility | | None | | LIBOR + 1.75% | | Variable | | February 2009 | | | 104,000 | |
Capital leases | | None | | 6.33% - 7.22% | | Fixed | | August 2011 | | | 1,102 | |
| | | | | | | | | | |
|
|
|
| | | | | | | | | | | | 646,564 | |
Unamortized discount | | | | | | | | | | | (132 | ) |
| | | | | | | | | | |
|
|
|
| | | | | | | | | | | $ | 646,432 | |
| | | | | | | | | | |
|
|
|
F-18
HIGHLAND HOSPITALITY CORPORATION
NOTES TO CONSOLIDATED FINANCIAL STATEMENTS—(Continued)
| (1) | | The Company issued this mortgage loan and mezzanine loan in conjunction with the acquisition of a four-hotel portfolio. The financing bears interest at a fixed, annual, blended rated of 6.65%. |
| (2) | | The Company assumed this mortgage loan along with an interest rate swap (see Note 8) that effectively fixes the interest rate on the mortgage loan to an annual rate of 7.34%. |
As of December 31, 2006, the Company’s weighted-average interest rate on its long-term debt was 6.33%. Future scheduled principal payments of debt obligations as of December 31, 2006 are as follows (in thousands):
| | | |
Year
| | Amounts
|
2007 | | $ | 8,096 |
2008 | | | 19,151 |
2009 | | | 113,788 |
2010 | | | 10,421 |
2011 | | | 239,608 |
Thereafter | | | 255,500 |
| | |
|
|
| | | $ | 646,564 |
| | |
|
|
| 8. | | Derivative Instruments |
On September 17, 2004, in connection with the Courtyard Denver Airport hotel acquisition, the Company assumed an interest rate swap agreement that effectively fixes the interest rate on a related assumed mortgage loan to an annual rate of 7.34%. The swap agreement terminates on November 1, 2008 and has an adjusting notional amount equal to the outstanding loan principal balance.
In connection with the completion of the revolving credit facility, the Company entered into an interest rate swap agreement for a notional amount of $50 million. Under the agreement, the Company pays a fixed annual interest rate of 4.91% and receives the London InterBank Offered Rate (LIBOR). The agreement effectively fixes the interest rate on the first $50 million of borrowings under the Company’s revolving credit facility at an annual interest rate of 4.91%, plus a credit spread. The agreement expires on February 1, 2009.
As the interest rate swaps are not designated as hedges, the change in fair values of the swaps each period is recorded in interest expense in the consolidated statements of operations.
F-19
HIGHLAND HOSPITALITY CORPORATION
NOTES TO CONSOLIDATED FINANCIAL STATEMENTS—(Continued)
The following is a reconciliation of the amounts used in calculating basic and diluted net income per common share (in thousands, except share and per share data):
| | | | | | | | | | | | |
| | | Year Ended December 31,
| |
| | | 2006
| | | 2005
| | | 2004
| |
Numerator: | | | | | | | | | | | | |
Net income available to common stockholders | | $ | 26,575 | | | $ | 8,046 | | | $ | 4,266 | |
Less: discontinued operations | | | (10,891 | ) | | | (800 | ) | | | (57 | ) |
Less: dividends on unvested restricted common stock | | | (711 | ) | | | (310 | ) | | | (288 | ) |
| | |
|
|
| |
|
|
| |
|
|
|
Net income from continuing operations available to common stockholders | | $ | 14,973 | | | $ | 6,936 | | | $ | 3,921 | |
| | |
|
|
| |
|
|
| |
|
|
|
Denominator: | | | | | | | | | | | | |
Weighted-average number of common shares
outstanding—basic | | | 57,840,143 | | | | 42,455,438 | | | | 39,093,691 | |
Effect of dilutive securities: | | | | | | | | | | | | |
Unvested restricted common stock | | | 299,162 | | | | 185,654 | | | | 215,541 | |
Warrants | | | 94,526 | | | | 61,309 | | | | 91,964 | |
| | |
|
|
| |
|
|
| |
|
|
|
Weighted-average number of common shares
outstanding—diluted | | | 58,233,831 | | | | 42,702,401 | | | | 39,401,196 | |
| | |
|
|
| |
|
|
| |
|
|
|
Net income per common share—basic: | | | | | | | | | | | | |
Continuing operations | | $ | .26 | | | $ | .16 | | | $ | .10 | |
Discontinued operations | | | .19 | | | | .02 | | | | — | |
| | |
|
|
| |
|
|
| |
|
|
|
Net income available to common stockholders(1) | | $ | .45 | | | $ | .18 | | | $ | .10 | |
| | |
|
|
| |
|
|
| |
|
|
|
Net income per common share—diluted: | | | | | | | | | | | | |
Continuing operations | | $ | .26 | | | $ | .16 | | | $ | .10 | |
Discontinued operations | | | .19 | | | | .02 | | | | — | |
| | |
|
|
| |
|
|
| |
|
|
|
Net income available to common stockholders(1) | | $ | .44 | | | $ | .18 | | | $ | .10 | |
| | |
|
|
| |
|
|
| |
|
|
|
| (1) | | per share amounts may not add due to rounding |
For the years ended December 31, 2006, 2005 and 2004, the Company’s board of directors declared common and preferred stock dividends per share as follows:
| | | | | | | | | |
| | | Year Ended December 31,
|
| | | 2006
| | 2005
| | 2004
|
Common stock: | | | | | | | | | |
First Quarter | | $ | .16 | | $ | .14 | | $ | — |
Second Quarter | | | .18 | | | .14 | | | .13 |
Third Quarter | | | .19 | | | .14 | | | .09 |
Fourth Quarter | | | .22 | | | .14 | | | .14 |
| | |
|
| |
|
| |
|
|
| | | $ | .75 | | $ | .56 | | $ | .36 |
| | |
|
| |
|
| |
|
|
Series A preferred stock: | | | | | | | | | |
First Quarter | | $ | .4922 | | $ | — | | $ | — |
Second Quarter | | | .4922 | | | — | | | — |
Third Quarter | | | .4922 | | | — | | | — |
Fourth Quarter | | | .4922 | | | .1859 | | | — |
| | |
|
| |
|
| |
|
|
| | | $ | 1.9688 | | $ | .1859 | | $ | — |
| | |
|
| |
|
| |
|
|
F-20
HIGHLAND HOSPITALITY CORPORATION
NOTES TO CONSOLIDATED FINANCIAL STATEMENTS—(Continued)
Common Stock—The Company is authorized to issue up to 500,000,000 shares of common stock, $.01 par value per share. Each outstanding share of common stock entitles the holder to one vote on all matters submitted to a vote of stockholders. Holders of the Company’s common stock are entitled to receive distributions when authorized by the Company’s board of directors out of assets legally available for the payment of distributions.
On September 28, 2005, the Company completed an underwritten public offering and sold 11,500,000 shares of common stock at a price of $10.15 per share, including 1,500,000 shares sold as a result of the exercise of the underwriters’ over-allotment option. After deducting underwriting discounts and offering expenses, the Company generated net proceeds of approximately $110.5 million.
On March 14, 2006, the Company completed an underwritten public offering and sold 7,300,000 shares of common stock at a price of $12.35 per share. After deducting underwriting discounts and offering expenses, the Company generated net proceeds of approximately $88.1 million.
For the years ended December 31, 2006, 2005 and 2004, the Company issued 1,377,000 shares, 30,000 shares, 119,511 shares, respectively, of common stock to its employees and directors. As of December 31, 2006, the Company had 61,104,487 shares of common stock outstanding.
Treasury Stock—For the years ended December 31, 2006, 2005, and 2004, the Company purchased 62,168 shares, 89,750 shares and 71,242 shares, respectively, of common stock from employees to satisfy the minimum statutory tax withholding requirements related to the vesting of their shares of restricted common stock.
Warrants—In connection with the IPO, the Company granted to its lead managing underwriter, as partial consideration for its services, warrants representing the right to acquire 888,488 shares of common stock. The warrants are exercisable for a period of five years commencing December 19, 2003 at an exercise price of $10 per share. For the year ended December 31, 2006, the underwriter acquired 681,275 shares of common stock upon exercises of the warrants. As of December 31, 2006, the Company has reserved 207,213 shares of common stock for issuance upon additional exercises of the warrants.
Preferred Stock—The Company is authorized to issue up to 100,000,000 shares of preferred stock, $.01 par value per share. The Company’s board of directors is required to set for each class or series of preferred stock the terms, preferences, conversion or other rights, voting powers, restrictions, limitations as to dividends or other distributions, qualifications, and terms or conditions of redemption.
On September 28, 2005, the Company completed an underwritten public offering and sold 3,000,000 shares of 7.875% Series A Cumulative Redeemable Preferred Stock. On October 5, 2005, the Company sold an additional 200,000 shares of 7.875% Series A Cumulative Redeemable Preferred Stock, as a result of the exercise of the underwriters’ over-allotment option. After deducting underwriting discounts and offering expenses, the Company generated net proceeds of approximately $77.1 million.
Holders of Series A Cumulative Redeemable Preferred Stock are entitled to receive, when and as authorized by the Company’s board of directors, out of funds legally available for the payment of dividends, cumulative cash dividends at the rate of 7.875% per annum of the $25 per share liquidation preference, equivalent to $1.96875 per annum per share. Dividends on the Series A Cumulative Redeemable Preferred Stock are cumulative from the date of original issuance and will be payable quarterly in arrears on or about the 15th day of each of February, May, August and November. The Series A Cumulative Redeemable Preferred Stock ranks senior to the Company’s common stock with respect to the payment of dividends; the Company will not declare
F-21
HIGHLAND HOSPITALITY CORPORATION
NOTES TO CONSOLIDATED FINANCIAL STATEMENTS—(Continued)
or pay any dividends, or set aside any funds for the payment of dividends, on its common stock unless the Company also has declared and either paid or set aside for payment the dividends on the Series A Cumulative Redeemable Preferred Stock.
The Company cannot redeem the Series A Cumulative Redeemable Preferred Stock prior to September 28, 2010, except in certain limited circumstances related to the ownership limitation necessary to preserve the Company’s qualification as a REIT. On and after September 28, 2010, the Company, at its option, can redeem the Series A Cumulative Redeemable Preferred Stock, in whole or from time to time in part, at a redemption price of $25 per share, plus any accrued and unpaid dividends. In general, the holders of Series A Cumulative Redeemable Preferred Stock have no voting rights.
Operating Partnership Units—Holders of Operating Partnership units have certain redemption rights, which enable them to cause the Operating Partnership to redeem their units in exchange for, at the sole discretion of the Operating Partnership, either shares of the Company’s common stock on a one-for-one basis or cash per unit equal to the market price of the Company’s common stock at the time of redemption. The number of shares issuable upon exercise of the redemption rights will be adjusted upon the occurrence of stock splits, mergers, consolidations or similar pro-rata share transactions, which otherwise would have the effect of diluting the ownership interests of the limited partners or the stockholders of the Company.
In February 2005, a limited partner caused the Operating Partnership to redeem its units in exchange for 142,688 shares of the Company’s common stock. In December 2005, another limited partner caused the Operating Partnership to redeem its units in exchange for 294,673 shares of the Company’s common stock. As of December 31, 2006, the total number of Operating Partnership units outstanding owned by third-party limited partners was 529,850.
Universal Shelf—In December 2004, the Company filed a registration statement on Form S-3 with the Securities and Exchange Commission, registering equity securities with a maximum aggregate offering price of up to $500 million. As of December 31, 2006, the Company had equity securities with a maximum aggregate offering price of $213 million available to issue.
In May 2006, the Company’s stockholders approved the amendment and restatement of the 2003 Omnibus Stock Incentive Plan, as amended and restated (the “Plan”), which authorizes the issuance of options to purchase shares of common stock and the grant of stock awards, stock appreciation rights, deferred shares, performance shares and performance units. Employees and directors of the Company and other persons that provide consulting services to the Company are eligible to participate in the Plan. The compensation policy committee of the board of directors administers the Plan and determines the numbers of awards to be granted, the vesting period, and the exercise price, if any.
The Plan provides for the grant of incentive stock options and non-qualified stock options. Incentive stock options may only be granted to persons who are employees of the Company. The exercise price for granted options cannot be less than the fair market value of the Company’s common stock on the date the option is granted, and in the event a participant is deemed to be a 10% or more owner of the Company, the exercise price of an incentive stock option cannot be less than 110% of the fair market value of the Company’s common stock on the date the option is granted. No participant may be granted incentive stock options that are exercisable for the first time in any calendar year for common stock having a total fair market value (determined as of the option grant), in excess of $100,000. As of December 31, 2006, no stock options had been granted under the Plan.
The Plan also provides for the grant of stock awards. A stock award may be subject to payment by the participant of a purchase price for shares of common stock subject to a stock award, and a stock award may be
F-22
HIGHLAND HOSPITALITY CORPORATION
NOTES TO CONSOLIDATED FINANCIAL STATEMENTS—(Continued)
subject to vesting requirements or transfer restrictions or both as determined by the compensation policy committee of the board of directors. Those conditions may include, for example, a requirement that the participant complete a specified period of service or that certain performance objectives be achieved. Transfer of the shares of common stock subject to a stock award normally will be restricted prior to vesting.
Under the Plan, the maximum number of shares of common stock that may be subject to stock options, stock awards, deferred shares or performance shares or covered by stock appreciation rights is 5,002,000 shares. No one participant may receive awards for more than 500,000 shares of common stock in any one calendar year. The maximum number of performance units that may be granted to a participant in any one calendar year is 750,000 for each full or fractional year included in the performance period for the award granted during the calendar year. These limitations, and the terms of outstanding awards, will be adjusted without the approval of the Company’s stockholders as the compensation policy committee of the board of directors determines is appropriate in the event of a stock dividend, stock split, reclassification of stock or similar events. If an award terminates, expires, is forfeited or becomes unexercisable, the shares of common stock subject to such award become available for future awards under the Plan. In addition, shares which are granted under any type of award under the Plan and which are repurchased or reacquired by the Company at the original purchase price for such shares also become available for future awards under the Plan. As of December 31, 2006, subject to increases resulting from the forfeiture of currently outstanding awards, 2,642,989 shares of common stock were reserved and available for future issuances under the Plan.
The board of directors may amend or terminate the Plan at any time, but an amendment will not become effective without the approval of the Company’s stockholders (within 12 months of the date such amendment is adopted by the board of directors) if it increases the aggregate number of shares of common stock that may be granted under the Plan. No amendment or termination of the Plan will affect a participant’s rights under outstanding awards without the participant’s consent.
In May 2006, the Company granted 1,340,000 shares of restricted common stock to certain employees. Three types of shares were granted: (1) 893,332 shares that vest solely on continued employment (time-based awards); (2) 148,889 shares that vest based on the Company achieving specified levels of FFO and continued employment (performance-based awards); and (3) 297,779 shares that vest based on the Company achieving specified levels of relative total shareholder return and continued employment (market-based awards). The time-based awards are eligible to vest 10% in 2007, 25% in 2008, 30% in 2009, and 35% in 2010. The performance-based awards and market-based awards are eligible to vest 25% in each of 2007 through 2010. Additional vesting of market-based awards may also occur in 2010 if the cumulative level of relative total shareholder return during the entire performance measurement period results in a higher total number of shares being vested than the total number of shares that vested based on relative total shareholder return on an individual year basis. Dividends on the shares of restricted common stock will accrue, but will not be paid unless the related shares vest. The fair value of the market-based awards was determined using a Monte Carlo simulation with the following assumptions: volatility of 25.2% based on the Company’s stock price since the IPO; an expected term equal to the requisite service period for the awards; and a three-year risk-free interest rate of 4.90%.
F-23
HIGHLAND HOSPITALITY CORPORATION
NOTES TO CONSOLIDATED FINANCIAL STATEMENTS—(Continued)
As of December 31, 2006, there was approximately $11.4 million of unrecognized stock-based compensation expense related to shares of restricted common stock. The unrecognized stock-based compensation expense is expected to be recognized over a weighted-average period of 1.9 years. The following is a summary of the Company’s shares of restricted common stock for the year ended December 31, 2006:
| | | | | | | |
| | | Number of Shares
| | | Weighted-Average Grant-Date Fair Value
| |
Restricted common stock as of December 31, 2005 | | 359,168 | | | $ | 10.36 | |
Granted | | 1,365,000 | | | $ | 11.48 | (1) |
Vested | | (329,999 | ) | | $ | 10.26 | |
Forfeited | | — | | | | — | |
| | |
|
| | | | |
Restricted common stock as of December 31, 2006 | | 1,394,169 | | | $ | 11.48 | (1) |
| | |
|
| | | | |
| (1) | | The calculated weighted-average grant-date fair value does not include performance-based awards that are eligible to vest in 2008, 2009 and 2010 because their fair value was not determinable on the date of grant. |
The Company has elected to be taxed as a REIT under Sections 856 through 860 of the Internal Revenue Code. To qualify as a REIT, the Company must meet a number of organizational and operational requirements, including a requirement that it currently distribute at least 90% of its taxable income (excluding net capital gains) to its stockholders. As a REIT, the Company generally will not be subject to federal income tax on that portion of its net income (loss) that does not relate to HHC TRS, the Company’s wholly owned taxable REIT subsidiary. HHC TRS, which leases the Company’s hotels from the Operating Partnership, is subject to federal and state income taxes.
The components of income tax expense (benefit) from continuing operations for the years ended December 31, 2006, 2005 and 2004 are as follows (in thousands):
| | | | | | | | | | |
| | | Year Ended December 31,
| |
| | | 2006
| | 2005
| | 2004
| |
Current: | | | | | | | | | | |
Federal | | $ | 1,174 | | $ | — | | $ | — | |
State | | | 495 | | | — | | | — | |
| | |
|
| |
|
| |
|
|
|
| | | | 1,669 | | | — | | | — | |
| | |
|
| |
|
| |
|
|
|
Deferred: | | | | | | | | | | |
Federal | | | 862 | | | 96 | | | (876 | ) |
State | | | 200 | | | 18 | | | (164 | ) |
| | |
|
| |
|
| |
|
|
|
| | | | 1,062 | | | 114 | | | (1,040 | ) |
| | |
|
| |
|
| |
|
|
|
Income tax expense (benefit) | | $ | 2,731 | | $ | 114 | | $ | (1,040 | ) |
| | |
|
| |
|
| |
|
|
|
F-24
HIGHLAND HOSPITALITY CORPORATION
NOTES TO CONSOLIDATED FINANCIAL STATEMENTS—(Continued)
A reconciliation of the statutory federal income tax expense to the Company’s income tax expense (benefit) from continuing operations is as follows (in thousands):
| | | | | | | | | | | | |
| | | Year Ended December 31,
| |
| | | 2006
| | | 2005
| | | 2004
| |
Statutory federal income tax expense | | $ | 8,500 | | | $ | 3,107 | | | $ | 1,112 | |
Effect of non-taxable REIT income | | | (6,298 | ) | | | (3,045 | ) | | | (2,044 | ) |
State income tax expense (benefit), net of federal benefit | | | 304 | | | | 11 | | | | (108 | ) |
DC unincorporated business franchise tax | | | 234 | | | | — | | | | — | |
Other | | | (9 | ) | | | 41 | | | | — | |
| | |
|
|
| |
|
|
| |
|
|
|
Income tax expense (benefit) | | $ | 2,731 | | | $ | 114 | | | $ | (1,040 | ) |
| | |
|
|
| |
|
|
| |
|
|
|
The tax effect of each type of temporary difference and carryforward that gives rise to the deferred tax assets and liabilities as of December 31, 2006 and 2005 are as follows (in thousands):
| | | | | | |
| | | December 31,
|
| | | 2006
| | 2005
|
Deferred tax assets: | | | | | | |
Employee-related compensation | | $ | 337 | | $ | 197 |
Start-up costs | | | 45 | | | 63 |
Net operating loss carryforwards | | | — | | | 1,578 |
Other | | | 45 | | | — |
| | |
|
| |
|
|
| | | | 427 | | | 1,838 |
| | |
|
| |
|
|
Deferred tax liabilities: | | | | | | |
Investment in hotel properties | | | 427 | | | 572 |
Other | | | — | | | 39 |
| | |
|
| |
|
|
| | | | 427 | | | 611 |
| | |
|
| |
|
|
Net deferred tax asset | | $ | — | | $ | 1,227 |
| | |
|
| |
|
|
For the years ended December 31, 2006, 2005 and 2004, income tax expense (benefit) included in discontinued operations was approximately $(0.3) million, $0.1 million, and $(30,000), respectively.
| 14. | | Related-Party Transactions |
As of December 31, 2006, Barceló Crestline, which was the sponsor of the Company’s formation and IPO, owned approximately 2% of the Company’s outstanding common stock and 529,850 Operating Partnership units.
Strategic Alliance Agreement—On December 19, 2003, the Company entered into a seven-year strategic alliance agreement with Barceló Crestline pursuant to which (i) Barceló Crestline agrees to refer to the Company (on an exclusive basis) hotel acquisition opportunities in the United States presented to Barceló Crestline or its subsidiaries other than opportunities that primarily relate to third-party management arrangements offered to Barceló Crestline, and (ii) the Company agrees to offer Barceló Crestline or its subsidiaries the right to manage hotel properties that the Company acquires in the United States, unless (a) a majority of the Company’s independent directors in good faith concludes for valid business reasons that another management company should manage the acquired hotel, or (b) the hotel is encumbered by a management agreement that would extend beyond the date of the Company’s acquisition of the hotel and a termination fee is payable to terminate the existing management agreement (unless Barceló Crestline pays such termination fee).
F-25
HIGHLAND HOSPITALITY CORPORATION
NOTES TO CONSOLIDATED FINANCIAL STATEMENTS—(Continued)
Management Agreements—As of December 31, 2006, 14 of the Company’s 26 hotels operated pursuant to management agreements with Crestline Hotels & Resorts, Inc., which is a wholly owned subsidiary of Barceló Crestline, each for a 10-year term. Crestline Hotels & Resorts receives a base management fee, and if the hotels meet and exceed certain performance thresholds, an incentive management fee. The base management fee for the hotels is generally between 2% and 3.5% of total gross revenues from the hotels. The incentive management fee, if any, for each hotel will be equal to 15% of the amount by which operating income for the fiscal year exceeds 11% of the Company’s capitalized investment in the hotel and will be due annually in arrears within 105 days after the end of each fiscal year. Crestline Hotels & Resorts will not be entitled to receive any incentive management fee in any fiscal year in which the operating income of the hotel has not equaled at least 11% of the Company’s capitalized investment in the hotel. The management agreements place a cap on the total amount of combined base and incentive management fees paid to Crestline Hotels & Resorts for each hotel at 4.5% of gross revenues for each fiscal year.
For the years ended December 31, 2006, 2005 and 2004, the Company paid Crestline Hotels & Resorts approximately $5.3 million, $3.2 million, and $1.6 million, respectively, in management fees.
Overhead and Cost-Sharing Arrangement—Since the Company’s inception, it has had an informal overhead and cost-sharing arrangement with Barceló Crestline whereby the Company has shared Barceló Crestline’s office space and related furniture, fixtures and equipment and certain support services, including human resources and information technology functions, in exchange for a monthly reimbursement of the estimated value to the Company from this sharing arrangement. For the years ended December 31, 2006, 2005 and 2004, the Company paid Barceló Crestline approximately $0.2 million $0.2 million and $0.3 million, respectively, under this arrangement.
| 15. | | Commitments and Contingencies |
Ground and Building Leases—The Company leases the Portsmouth Renaissance hotel and adjoining conference center pursuant to two separate lease agreements, each with an initial term ending May 2049, with four ten-year renewal options and one nine-year renewal option. Base rent under the hotel lease is $50,000 per year. Annual percentage rent, if any, is equal to 100% of available net cash flow after payment of all hotel operating expenses, the base rent, real estate taxes, insurance and a cumulative priority annual return to the Company of approximately $2 million, up to $0.2 million, then 50% of any remaining net cash flow until the landlord has been paid percentage (and additional) rent of $10 million in aggregate, and thereafter 10% of net cash flow annually. If the Company sells or assigns the hotel lease, an additional rent payment equal to 50% of the net sales proceeds in excess of the Company’s capital investment in the hotel and unpaid annual return of 15% on the investment will be due. Annual rent under the conference center lease is equal to the lesser of $75,000 per year or the maximum amount of rent allowable under tax regulations so as to preserve the tax-exempt status of the Portsmouth Industrial Development Authority bonds issued in connection with the hotel and conference center.
The Company leases the conference center and parking facility adjoining the Sugar Land Marriott hotel pursuant to a lease agreement with an initial term ending October 2102. The minimum rent is $1 per year, plus an incentive rent payment for the first 25 years of the term of the lease. If during any of those first 25 years, the Company’s cumulative internal rate of return on investment in the hotel exceeds 15%, then the Company will pay incentive rent in an amount equal to 36% of the net cash flow for the applicable year in excess of the amount of net cash flow that would be necessary to generate a cumulative internal rate of return of 15%.
The Company leases the land underlying the Nashville Renaissance hotel and a portion of the adjoining convention center pursuant to a lease agreement with an initial term ending June 2017, with seven 10-year
F-26
HIGHLAND HOSPITALITY CORPORATION
NOTES TO CONSOLIDATED FINANCIAL STATEMENTS—(Continued)
renewal options. Base rent under the lease is $0.5 million per year. Annual percentage rent is equal to 20% of available net cash flow after payment of all hotel operating expenses, the base rent, real estate taxes, insurance, debt service, property improvement reserve funding, and a priority annual return to the Company of 15% of the Company’s capitalized investment in the hotel. If the Company sells or assigns the hotel lease, an additional payment equal to 20% of the net sales proceeds in excess of the Company’s capital investment in the hotel will be due. In addition, if the Company refinances the debt secured by the hotel, an additional payment equal to 20% of the net cash proceeds will be due.
Percentage and incentive rent is accrued when it becomes probable that the specified thresholds will be achieved. No percentage or incentive rent was recognized in any period presented in the consolidated financial statements, as the thresholds were not met.
The Company leases the land underlying the Sheraton Annapolis hotel pursuant to a lease agreement with an initial term ending September 2059. Annual rent due under the lease is approximately $0.3 million and increases each year over the remaining term of the lease by 40% of the increase in the Consumer Price Index (CPI) for that year. In addition, the land will be appraised every five years and the annual rent will be increased to an amount equal to the product of the appraised value and 12%. However, annual rent will not be increased by an amount greater than 10% of the annual rent for the preceding year.
The Company leases the land underlying the Wyndham Palm Springs hotel pursuant to a sub-lease agreement with an initial term ending December 2059, with a 25-year renewal option. Annual rent due under the lease is the greater of base rent or percentage rent. Annual base rent for the years 2005 through 2009 is approximately $0.9 million. Base rent increases every five years over the remaining term of the lease by the increase in the CPI over that same five-year period; however, the increase in base rent every five years will not be increased by an amount greater than 30% of the base rent for the preceding five-year period. Annual percentage rent is equal to the sum of 4% of rooms gross receipts, 2% of food and beverage gross receipts, and 10% of tenant rentals.
Management Agreements—As of December 31, 2006, the Company’s hotel properties operated pursuant to long-term agreements with five management companies, including Crestline Hotels & Resorts, Inc. (14 hotels), Marriott International, Inc. (6 hotels), Hyatt Corporation (2 hotels), McKibbon Hotel Management, Inc. (2 hotels), and Hilton Hotels Corporation (2 hotels). Each management company receives a base management fee generally between 2% and 4% of hotel revenues. The management companies are also eligible to receive an incentive management fee if hotel operating income, as defined in the management agreements, exceeds certain performance thresholds. The incentive management fee is generally calculated as a percentage of hotel operating income after the Company has received a priority return on its investment in the hotel.
Franchise Agreements—As of December 31, 2006, 14 of the Company’s 26 hotel properties operated pursuant to franchise agreements from national hotel companies. Pursuant to the franchise agreements, the Company pays a royalty fee generally between 4% and 5% of room revenues, plus additional fees for marketing, central reservation systems, and other franchisor costs that amount to between 3% and 4% of room revenues from the hotels. Ten of the Company’s 26 hotel properties, which include the Hyatt Regency Savannah hotel, the Hyatt Regency Wind Watch Long Island hotel, the Dallas/Fort Worth Airport Marriott hotel, the Nashville Renaissance hotel, the Ritz-Carlton Atlanta Downtown hotel, the Courtyard Boston Tremont hotel, the Courtyard Denver Airport hotel, the Courtyard Gaithersburg Washingtonian Center hotel, the Hilton Boston Back Bay hotel, and the Pointe Hilton Tapatio Cliffs resort are managed by Hyatt Corporation, Marriott International, Inc., or Hilton Hotels Corporation. The management agreements for these ten hotel properties allow the hotel properties to operate under the respective brand. With respect to the Company’s other two hotel properties, The Churchill hotel and The Melrose hotel operate as independent hotels.
F-27
HIGHLAND HOSPITALITY CORPORATION
NOTES TO CONSOLIDATED FINANCIAL STATEMENTS—(Continued)
Property Improvement Reserves—Pursuant to its management, franchise and loan agreements, the Company is required to establish a property improvement reserve for each hotel to cover the cost of replacing furniture, fixtures and equipment at the hotels. Contributions to the property improvement reserve are based on a percentage of gross revenues or receipts at each hotel. The Company is generally required to contribute between 3% and 5% of gross revenues each month over the term of the agreements.
Litigation—The Company is not involved in any material litigation nor, to its knowledge, is any material litigation threatened against the Company.
| 16. | | Quarterly Operating Results (Unaudited) |
| | | | | | | | | | | | | | |
| | | Quarter Ended - 2006
| |
| | | March 31
| | June 30
| | September 30
| | | December 31
| |
| | | (in thousands, except per share data) | |
Total revenue | | $ | 85,000 | | $ | 113,233 | | $ | 99,663 | | | $ | 124,692 | |
Total operating expenses | | | 71,479 | | | 91,707 | | | 89,671 | | | | 106,644 | |
Operating income | | | 13,521 | | | 21,526 | | | 9,992 | | | | 18,048 | |
Net income | | | 5,292 | | | 18,195 | | | 2,281 | | | | 7,107 | |
Net income available to common stockholders | | | 3,717 | | | 16,620 | | | 706 | | | | 5,532 | |
Net income per common share—basic: | | | | | | | | | | | | | | |
Continuing operations | | | .07 | | | .14 | | | (.03 | ) | | | .08 | |
Discontinued operations | | | — | | | .14 | | | .04 | | | | .01 | |
Net income available to common stockholders(1) | | | .07 | | | .28 | | | .01 | | | | .09 | |
Net income per common share—diluted: | | | | | | | | | | | | | | |
Continuing operations | | | .07 | | | .14 | | | (.03 | ) | | | .08 | |
Discontinued operations | | | — | | | .14 | | | .04 | | | | .01 | |
Net income available to common stockholders(1) | | | .07 | | | .28 | | | .01 | | | | .09 | |
| |
| | | Quarter Ended - 2005
| |
| | | March 31
| | June 30
| | September 30
| | | December 31
| |
| | | (in thousands, except per share data) | |
Total revenue | | $ | 48,865 | | $ | 58,841 | | $ | 56,395 | | | $ | 74,666 | |
Total operating expenses | | | 44,941 | | | 48,745 | | | 50,290 | | | | 62,789 | |
Operating income | | | 3,924 | | | 10,096 | | | 6,105 | | | | 11,877 | |
Net income | | | 4 | | | 4,190 | | | 812 | | | | 4,667 | |
Net income available to common stockholders | | | 4 | | | 4,190 | | | 763 | | | | 3,089 | |
Net income per common share—basic: | | | | | | | | | | | | | | |
Continuing operations | | | — | | | .08 | | | — | | | | .07 | |
Discontinued operations | | | — | | | .02 | | | .01 | | | | (.01 | ) |
Net income available to common stockholders(1) | | | — | | | .10 | | | .02 | | | | .06 | |
Net income per common share—diluted: | | | | | | | | | | | | | | |
Continuing operations | | | — | | | .08 | | | — | | | | .07 | |
Discontinued operations | | | — | | | .02 | | | .01 | | | | (.01 | ) |
Net income available to common stockholders(1) | | | — | | | .10 | | | .02 | | | | .06 | |
| (1) | | per share amounts may not add due to rounding. |
On February 23, 2007, the Company acquired the 143-room Crowne Plaza Chicago-Silversmith hotel in Chicago, Illinois for approximately $34.5 million. The Company entered into a long-term agreement with Crestline Hotels & Resorts, Inc. to manage the property as an independent hotel.
F-28
HIGHLAND HOSPITALITY CORPORATION
SCHEDULE III—REAL ESTATE AND ACCUMULATED DEPRECIATION
AS OF DECEMBER 31, 2006
(in thousands)
| | | | | | | | | | | | | | | | | | | | | | | | | | | | | | |
Description
| | Encumbrances
| | | Initial Cost
| | Costs Capitalized
Subsequent to
Acquisition
| | Gross Amount at End of Year
| | Accumulated
Depreciation
| | | Year of
Acquisition
| | Depreciation
Life
|
| | | Land
| | Buildings and
Improvements
| | | Land
| | Buildings and
Improvements
| | Total
| | | |
Portsmouth Renaissance
Portsmouth, Virginia | | $ | | (1) | | $ | — | | $ | 11,825 | | $ | 22 | | $ | — | | $ | 11,847 | | $ | 11,847 | | $ | (1,759 | ) | | 2003 | | 40 years |
Plaza San Antonio Marriott
San Antonio, Texas | | | — | | | | 3,622 | | | 28,157 | | | 3,105 | | | 3,622 | | | 31,262 | | | 34,884 | | | (2,474 | ) | | 2003 | | 40 years |
Hyatt Regency Savannah
Savannah, Georgia | | | | (1) | | | 6,684 | | | 42,948 | | | 5,976 | | | 6,684 | | | 48,924 | | | 55,608 | | | (3,841 | ) | | 2003 | | 40 years |
Sugar Land Marriott
Sugar Land, Texas | | | — | | | | 330 | | | 27,401 | | | 7 | | | 330 | | | 27,408 | | | 27,738 | | | (2,183 | ) | | 2003 | | 40 years |
Hilton Garden Inn Virginia Beach Town Center
Virginia Beach, Virginia | | | — | | | | 1,760 | | | 15,797 | | | 2 | | | 1,760 | | | 15,799 | | | 17,559 | | | (1,234 | ) | | 2003 | | 40 years |
Hilton Tampa Westshore
Tampa, Florida | | | 17,141 | | | | 2,753 | | | 23,151 | | | 348 | | | 2,753 | | | 23,499 | | | 26,252 | | | (1,819 | ) | | 2004 | | 40 years |
Hilton Garden Inn BWI Airport
Linthicum, Maryland | | | | (1) | | | 1,443 | | | 20,063 | | | 56 | | | 1,443 | | | 20,119 | | | 21,562 | | | (1,576 | ) | | 2004 | | 40 years |
Dallas/Fort Worth Airport Marriott
Dallas/Fort Worth, Texas | | | 36,373 | | | | 6,500 | | | 50,035 | | | 4,948 | | | 6,500 | | | 54,983 | | | 61,483 | | | (3,495 | ) | | 2004 | | 40 years |
Courtyard Savannah Historic District
Savannah, Georgia | | | — | | | | 1,014 | | | 23,068 | | | 26 | | | 1,014 | | | 23,094 | | | 24,108 | | | (1,395 | ) | | 2004 | | 40 years |
Residence Inn Tampa Downtown
Tampa, Florida | | | — | | | | 550 | | | 12,672 | | | 10 | | | 550 | | | 12,682 | | | 13,232 | | | (766 | ) | | 2004 | | 40 years |
Hyatt Regency Wind Watch Long Island
Hauppauge, New York | | | | (2) | | | 11,160 | | | 36,189 | | | 4,335 | | | 11,160 | | | 40,524 | | | 51,684 | | | (2,602 | ) | | 2004 | | 40 years |
Hilton Parsippany
Parsippany, New Jersey | | | | (2) | | | 9,800 | | | 66,262 | | | 4,042 | | | 9,800 | | | 70,304 | | | 80,104 | | | (3,946 | ) | | 2004 | | 40 years |
Crowne Plaza Atlanta-Ravinia
Atlanta, Georgia | | | | (2) | | | 4,500 | | | 56,186 | | | 3,827 | | | 4,500 | | | 60,013 | | | 64,513 | | | (3,707 | ) | | 2004 | | 40 years |
Courtyard Boston Tremont
Boston, Massachusetts | | | | (2) | | | 6,500 | | | 31,204 | | | 5,499 | | | 6,500 | | | 36,703 | | | 43,203 | | | (2,102 | ) | | 2004 | | 40 years |
Omaha Marriott
Omaha, Nebraska | | | — | | | | 4,268 | | | 21,781 | | | 756 | | | 4,268 | | | 22,537 | | | 26,805 | | | (1,319 | ) | | 2004 | | 40 years |
Courtyard Denver Airport
Denver, Colorado | | | 10,790 | | | | 1,430 | | | 15,350 | | | 167 | | | 1,430 | | | 15,517 | | | 16,947 | | | (885 | ) | | 2004 | | 40 years |
Sheraton Annapolis
Annapolis, Maryland | | | 10,000 | | | | — | | | 15,683 | | | 1,565 | | | — | | | 17,248 | | | 17,248 | | | (809 | ) | | 2005 | | 40 years |
Wyndham Palm Springs
Palm Springs, California | | | 37,050 | | | | — | | | 54,926 | | | 186 | | | — | | | 55,112 | | | 55,112 | | | (2,015 | ) | | 2005 | | 40 years |
Hilton Boston Back Bay
Boston, Massachusetts | | | 69,000 | | | | 20,000 | | | 79,268 | | | 1,220 | | | 20,000 | | | 80,488 | | | 100,488 | | | (2,393 | ) | | 2005 | | 40 years |
Westin Princeton at Forrestal Village
Princeton, New Jersey | | | 35,000 | | | | — | | | 43,182 | | | 59 | | | — | | | 43,241 | | | 43,241 | | | (1,220 | ) | | 2005 | | 40 years |
The Churchill
Washington, DC | | | — | | | | 9,600 | | | 38,241 | | | 13 | | | 9,600 | | | 38,254 | | | 47,854 | | | (1,015 | ) | | 2005 | | 40 years |
Nashville Renaissance
Nashville, Tennessee | | | 51,322 | | | | — | | | 68,428 | | | 181 | | | — | | | 68,609 | | | 68,609 | | | (1,453 | ) | | 2006 | | 40 years |
The Melrose
Washington, DC | | | — | | | | 11,400 | | | 62,483 | | | 120 | | | 11,400 | | | 62,603 | | | 74,003 | | | (1,247 | ) | | 2006 | | 40 years |
Pointe Hilton Tapatio Cliffs
Phoenix, Arizona | | | 55,250 | | | | 21,400 | | | 50,489 | | | 2,240 | | | 21,400 | | | 52,729 | | | 74,129 | | | (1,061 | ) | | 2006 | | 40 years |
Courtyard Gaithersburg Washingtonian Center
Gaithersburg, Maryland | | | — | | | | 5,974 | | | 21,117 | | | 6 | | | 5,974 | | | 21,123 | | | 27,097 | | | (308 | ) | | 2006 | | 40 years |
Ritz-Carlton Atlanta Downtown
Atlanta, Georgia | | | — | | | | 11,790 | | | 64,868 | | | — | | | 11,790 | | | 64,868 | | | 76,658 | | | (446 | ) | | 2006 | | 40 years |
| | |
|
|
| |
|
| |
|
| |
|
| |
|
| |
|
| |
|
| |
|
|
| | | | |
Totals | | $ | 517,130 | | | $ | 142,478 | | $ | 980,774 | | $ | 38,716 | | $ | 142,478 | | $ | 1,019,490 | | $ | 1,161,968 | | $ | (47,070 | ) | | | | |
| | |
|
|
| |
|
| |
|
| |
|
| |
|
| |
|
| |
|
| |
|
|
| | | | |
| (1) | | This property secures the mortgage loan issued on July 9, 2004, which had an outstanding principal balance of $65,504 as of December 31, 2006. |
| (2) | | This property secures the mortgage loan issued on August 19, 2004, which had an outstanding principal balance of $129,700 as of December 31, 2006. |
F-29
HIGHLAND HOSPITALITY CORPORATION
SCHEDULE III—REAL ESTATE AND ACCUMULATED DEPRECIATION—(Continued)
AS OF DECEMBER 31, 2006
(in thousands)
Notes:
| (a) | | The change in total cost of real estate assets for the years ended December 31, 2006, 2005 and 2004 is as follows: |
| | | | |
Balance as of December 31, 2003 | | $ | 138,928 | |
Acquisitions | | | 419,623 | |
Capital expenditures and transfers from construction-in-progress | | | 300 | |
| | |
|
|
|
Balance as of December 31, 2004 | | | 558,851 | |
Acquisitions | | | 290,287 | |
Capital expenditures and transfers from construction-in-progress | | | 16,466 | |
Barceló Tucancun Beach resort impairment loss | | | (5,500 | ) |
| | |
|
|
|
Balance as of December 31, 2005 | | | 860,104 | |
Acquisitions | | | 317,949 | |
Capital expenditures and transfers from construction-in-progress | | | 31,094 | |
Hotel property dispositions | | | (47,179 | ) |
| | |
|
|
|
Balance as of December 31, 2006 | | $ | 1,161,968 | |
| | |
|
|
|
| (b) | | The change in accumulated depreciation and amortization of real estate assets for the years ended December 31, 2006, 2005 and 2004 is as follows: |
| | | | |
Balance as of December 31, 2003 | | $ | 1,180 | |
Depreciation and amortization | | | 7,440 | |
| | |
|
|
|
Balance as of December 31, 2004 | | | 8,620 | |
Depreciation and amortization | | | 14,999 | |
| | |
|
|
|
Balance as of December 31, 2005 | | | 23,619 | |
Depreciation and amortization | | | 24,754 | |
Hotel property dispositions | | | (1,303 | ) |
| | |
|
|
|
Balance as of December 31, 2006 | | $ | 47,070 | |
| | |
|
|
|
F-30