1 Earnings Presentation 3Q 2024
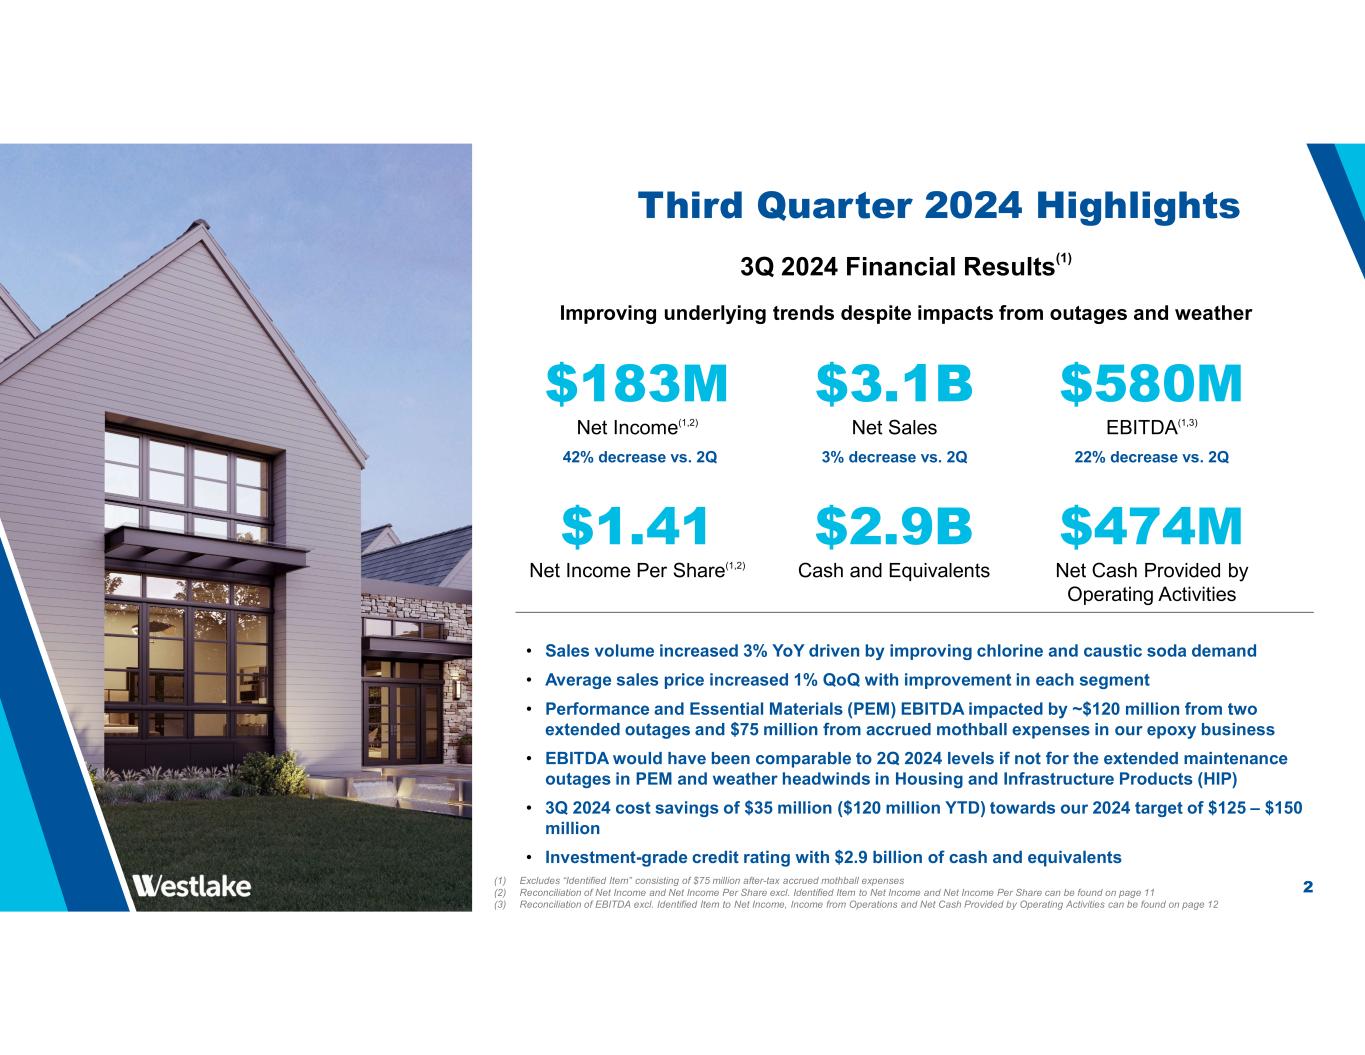
2 Third Quarter 2024 Highlights 3Q 2024 Financial Results(1) Improving underlying trends despite impacts from outages and weather • Sales volume increased 3% YoY driven by improving chlorine and caustic soda demand • Average sales price increased 1% QoQ with improvement in each segment • Performance and Essential Materials (PEM) EBITDA impacted by ~$120 million from two extended outages and $75 million from accrued mothball expenses in our epoxy business • EBITDA would have been comparable to 2Q 2024 levels if not for the extended maintenance outages in PEM and weather headwinds in Housing and Infrastructure Products (HIP) • 3Q 2024 cost savings of $35 million ($120 million YTD) towards our 2024 target of $125 – $150 million • Investment-grade credit rating with $2.9 billion of cash and equivalents $3.1B Net Sales 3% decrease vs. 2Q $183M Net Income(1,2) 42% decrease vs. 2Q $580M EBITDA(1,3) 22% decrease vs. 2Q $1.41 Net Income Per Share(1,2) $474M Net Cash Provided by Operating Activities $2.9B Cash and Equivalents (1) Excludes “Identified Item” consisting of $75 million after-tax accrued mothball expenses (2) Reconciliation of Net Income and Net Income Per Share excl. Identified Item to Net Income and Net Income Per Share can be found on page 11 (3) Reconciliation of EBITDA excl. Identified Item to Net Income, Income from Operations and Net Cash Provided by Operating Activities can be found on page 12
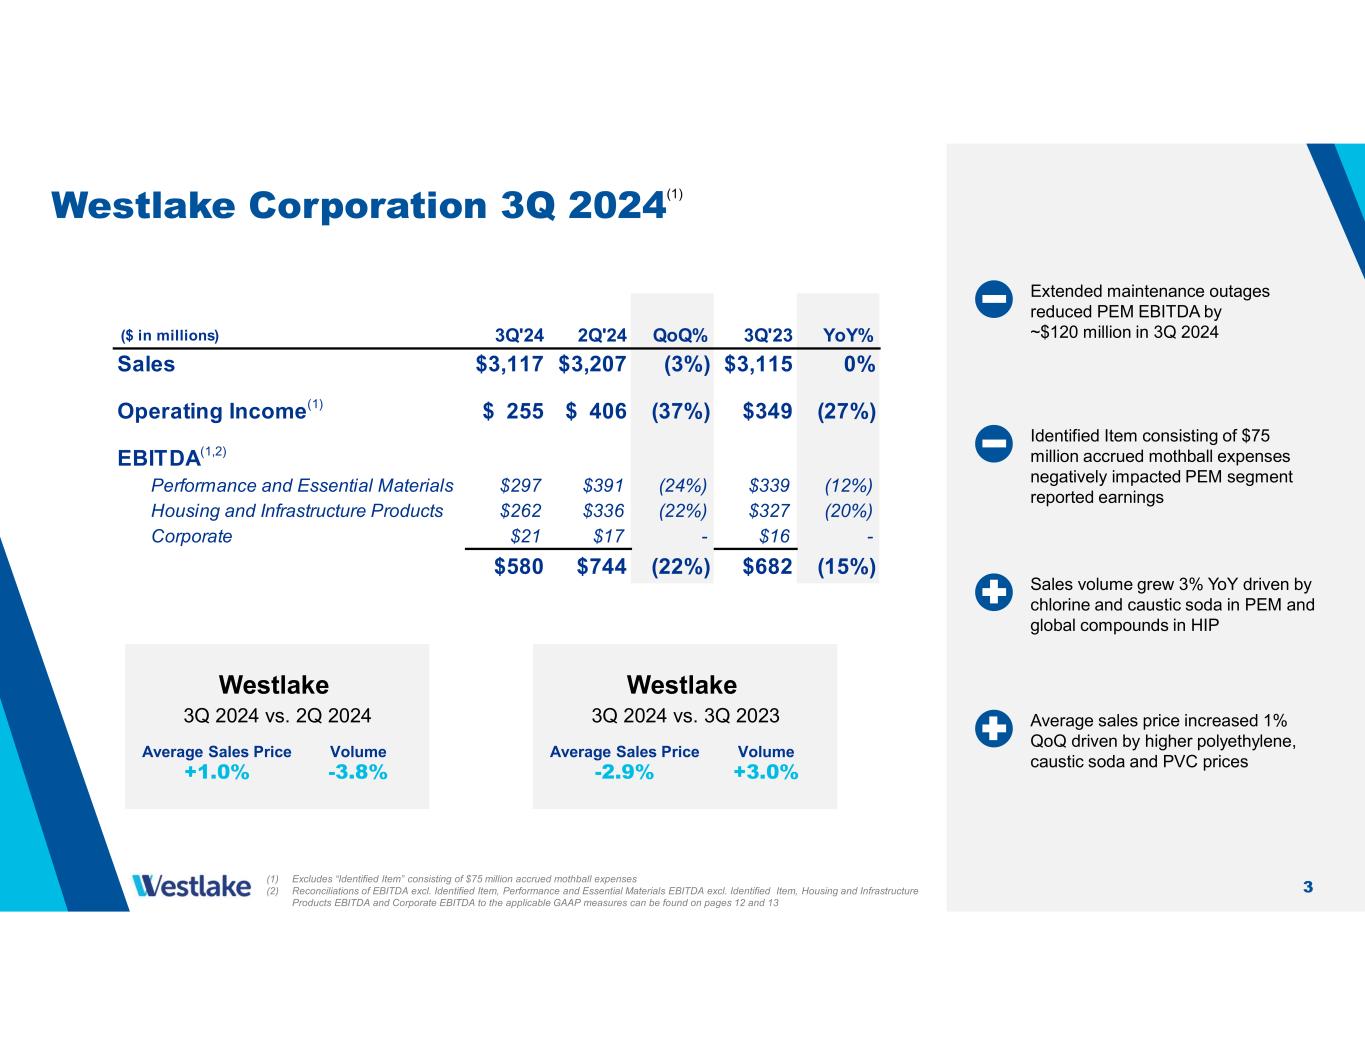
3 Westlake Corporation 3Q 2024(1) Sales volume grew 3% YoY driven by chlorine and caustic soda in PEM and global compounds in HIP Identified Item consisting of $75 million accrued mothball expenses negatively impacted PEM segment reported earnings Westlake 3Q 2024 vs. 2Q 2024 Average Sales Price +1.0% Volume -3.8% Westlake 3Q 2024 vs. 3Q 2023 Average Sales Price -2.9% Volume +3.0% 3Q'24 2Q'24 QoQ% 3Q'23 YoY% $3,117 $3,207 (3%) $3,115 0% $ 255 $ 406 (37%) $349 (27%) Performance and Essential Materials $297 $391 (24%) $339 (12%) Housing and Infrastructure Products $262 $336 (22%) $327 (20%) Corporate $21 $17 - $16 - $580 $744 (22%) $682 (15%) Operating Income(1) Sales EBITDA(1,2) ($ in millions) (1) Excludes “Identified Item” consisting of $75 million accrued mothball expenses (2) Reconciliations of EBITDA excl. Identified Item, Performance and Essential Materials EBITDA excl. Identified Item, Housing and Infrastructure Products EBITDA and Corporate EBITDA to the applicable GAAP measures can be found on pages 12 and 13 Extended maintenance outages reduced PEM EBITDA by ~$120 million in 3Q 2024 Average sales price increased 1% QoQ driven by higher polyethylene, caustic soda and PVC prices
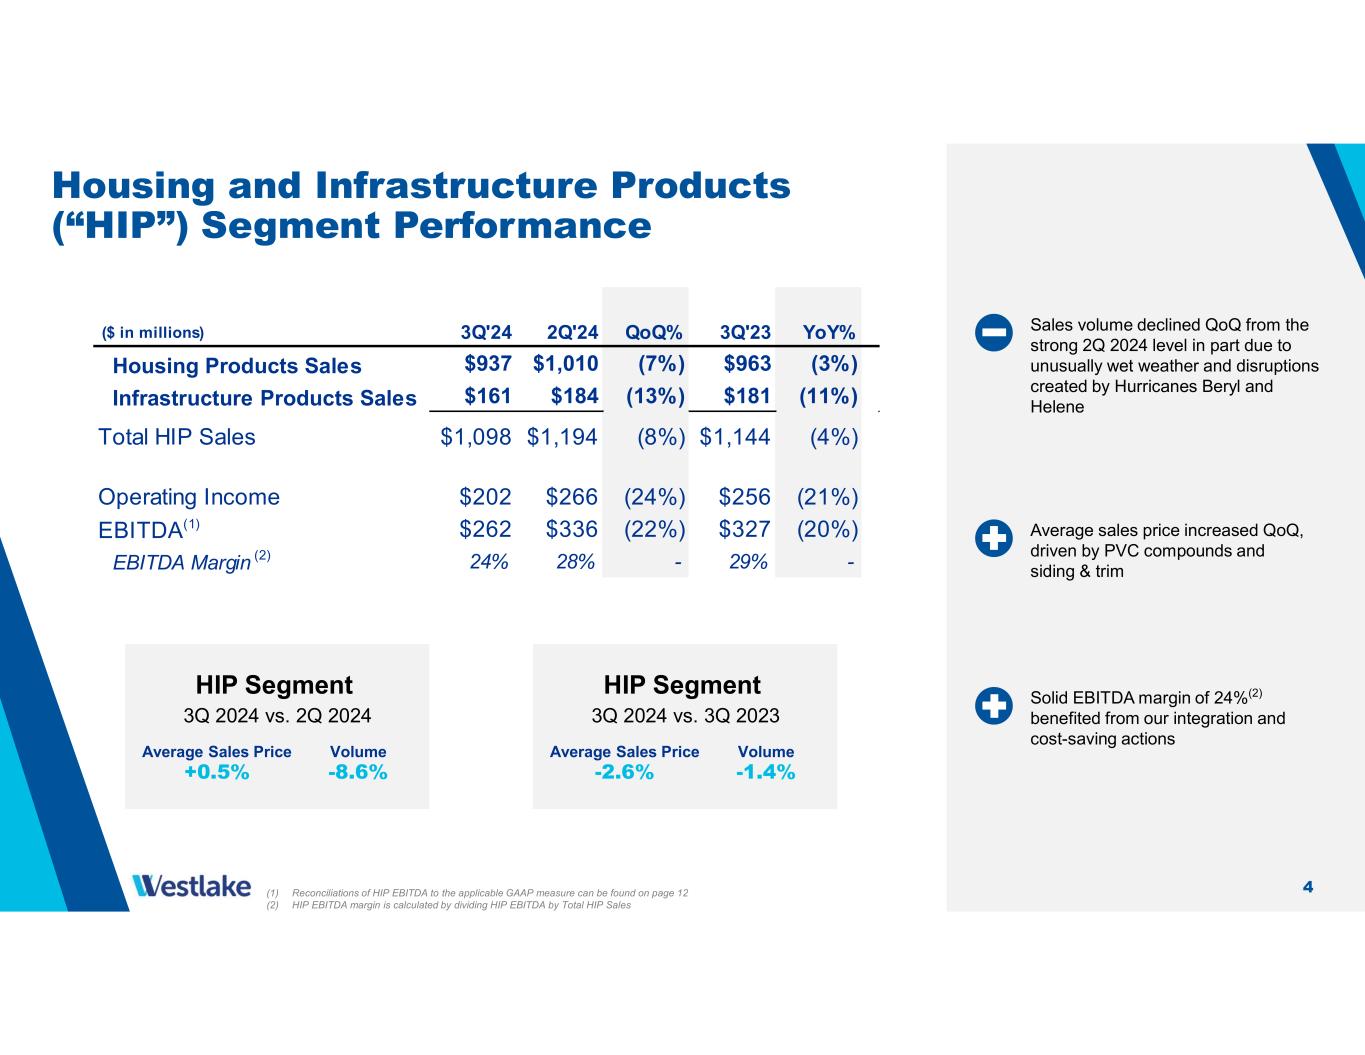
4 Housing and Infrastructure Products (“HIP”) Segment Performance HIP Segment 3Q 2024 vs. 2Q 2024 Average Sales Price +0.5% Volume -8.6% HIP Segment 3Q 2024 vs. 3Q 2023 Average Sales Price -2.6% Volume -1.4% Average sales price increased QoQ, driven by PVC compounds and siding & trim Sales volume declined QoQ from the strong 2Q 2024 level in part due to unusually wet weather and disruptions created by Hurricanes Beryl and Helene Solid EBITDA margin of 24%(2) benefited from our integration and cost-saving actions (1) Reconciliations of HIP EBITDA to the applicable GAAP measure can be found on page 12 (2) HIP EBITDA margin is calculated by dividing HIP EBITDA by Total HIP Sales 3Q'24 2Q'24 QoQ% 3Q'23 YoY% Housing Products Sales $937 $1,010 (7%) $963 (3%) Infrastructure Products Sales $161 $184 (13%) $181 (11%) Total HIP Sales $1,098 $1,194 (8%) $1,144 (4%) Operating Income $202 $266 (24%) $256 (21%) EBITDA(1) $262 $336 (22%) $327 (20%) EBITDA Margin (2) 24% 28% - 29% - ($ in millions)

5 Housing and Infrastructure Products Update 2 New PVCO pipe plant under construction to support the strong growth and market adoption for this innovative product that streamlines the assembly process with a more sustainable environmental footprint 3 Disruptions caused by Hurricanes Beryl, Helene and Milton are impacting 2024 sales volume, but Westlake Royal Building Products is positioned well to help communities rebuild in 2025 once disaster relief funding is dispersed and insurance claims are processed 4 Repair & remodel activity provides steady growth driven by large number of homes in prime remodel age, healthy home equity levels, homeowners with low-rate mortgages remaining in place, and significant backlog of projects 1 Longer-term housing fundamentals remain strong due to decade-plus of under-building, increasingly favorable demographics and popularity of remote work
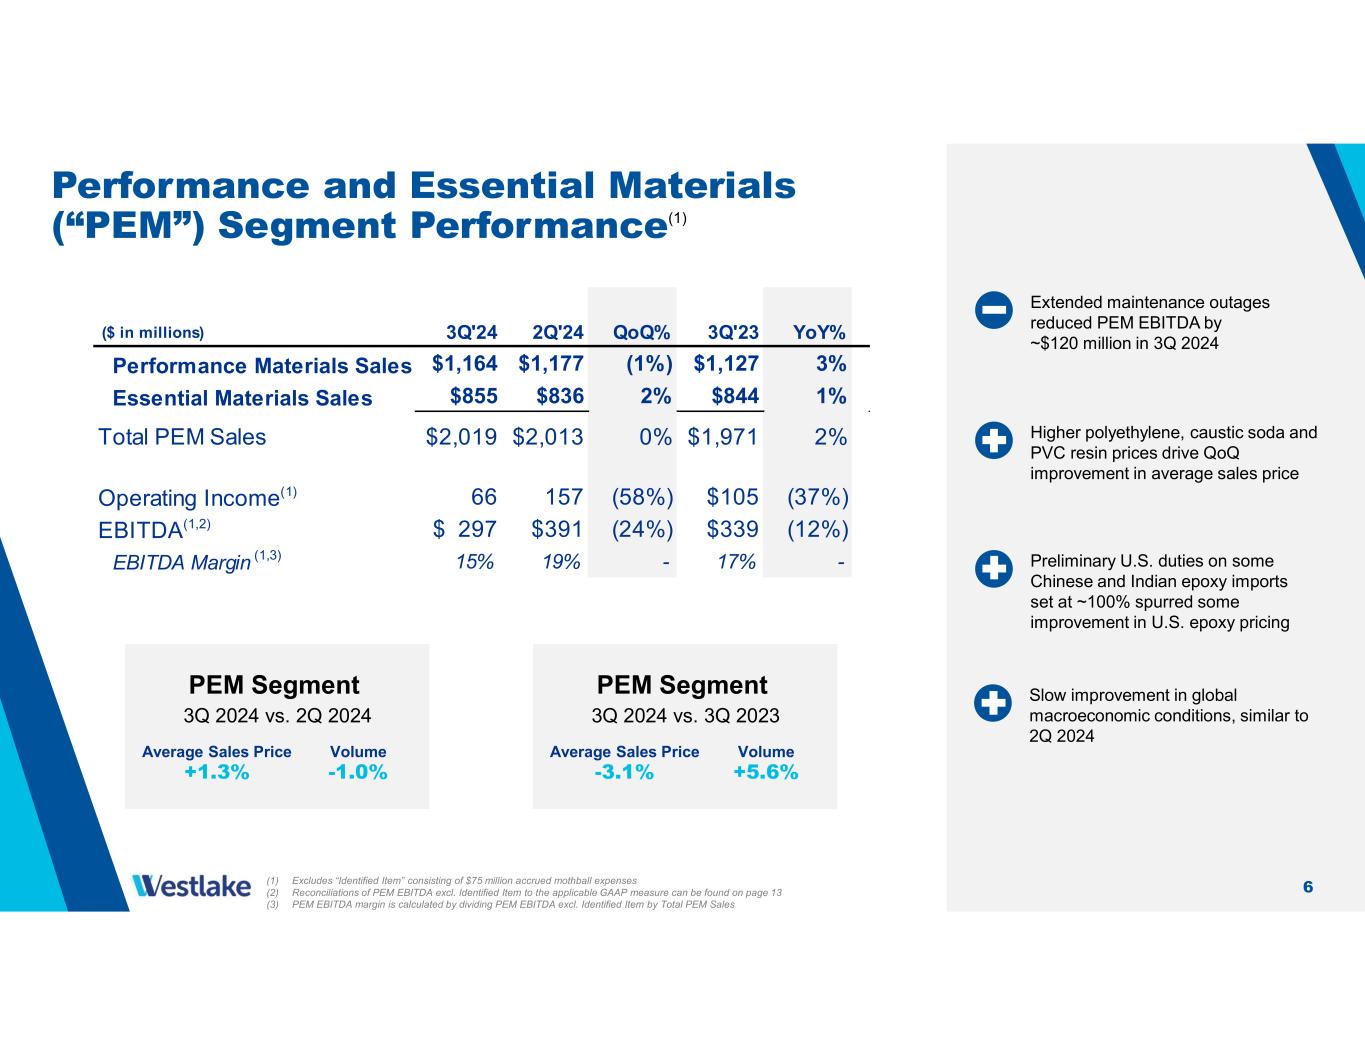
6 PEM Segment 3Q 2024 vs. 2Q 2024 Average Sales Price +1.3% Volume -1.0% PEM Segment 3Q 2024 vs. 3Q 2023 Average Sales Price -3.1% Volume +5.6% Higher polyethylene, caustic soda and PVC resin prices drive QoQ improvement in average sales price Preliminary U.S. duties on some Chinese and Indian epoxy imports set at ~100% spurred some improvement in U.S. epoxy pricing Slow improvement in global macroeconomic conditions, similar to 2Q 2024 3Q'24 2Q'24 QoQ% 3Q'23 YoY% Performance Materials Sales $1,164 $1,177 (1%) $1,127 3% Essential Materials Sales $855 $836 2% $844 1% Total PEM Sales $2,019 $2,013 0% $1,971 2% Operating Income(1) 66 157 (58%) $105 (37%) EBITDA(1,2) $ 297 $391 (24%) $339 (12%) EBITDA Margin (1,3) 15% 19% - 17% - ($ in millions) (1) Excludes “Identified Item” consisting of $75 million accrued mothball expenses (2) Reconciliations of PEM EBITDA excl. Identified Item to the applicable GAAP measure can be found on page 13 (3) PEM EBITDA margin is calculated by dividing PEM EBITDA excl. Identified Item by Total PEM Sales Performance and Essential Materials (“PEM”) Segment Performance(1) Extended maintenance outages reduced PEM EBITDA by ~$120 million in 3Q 2024
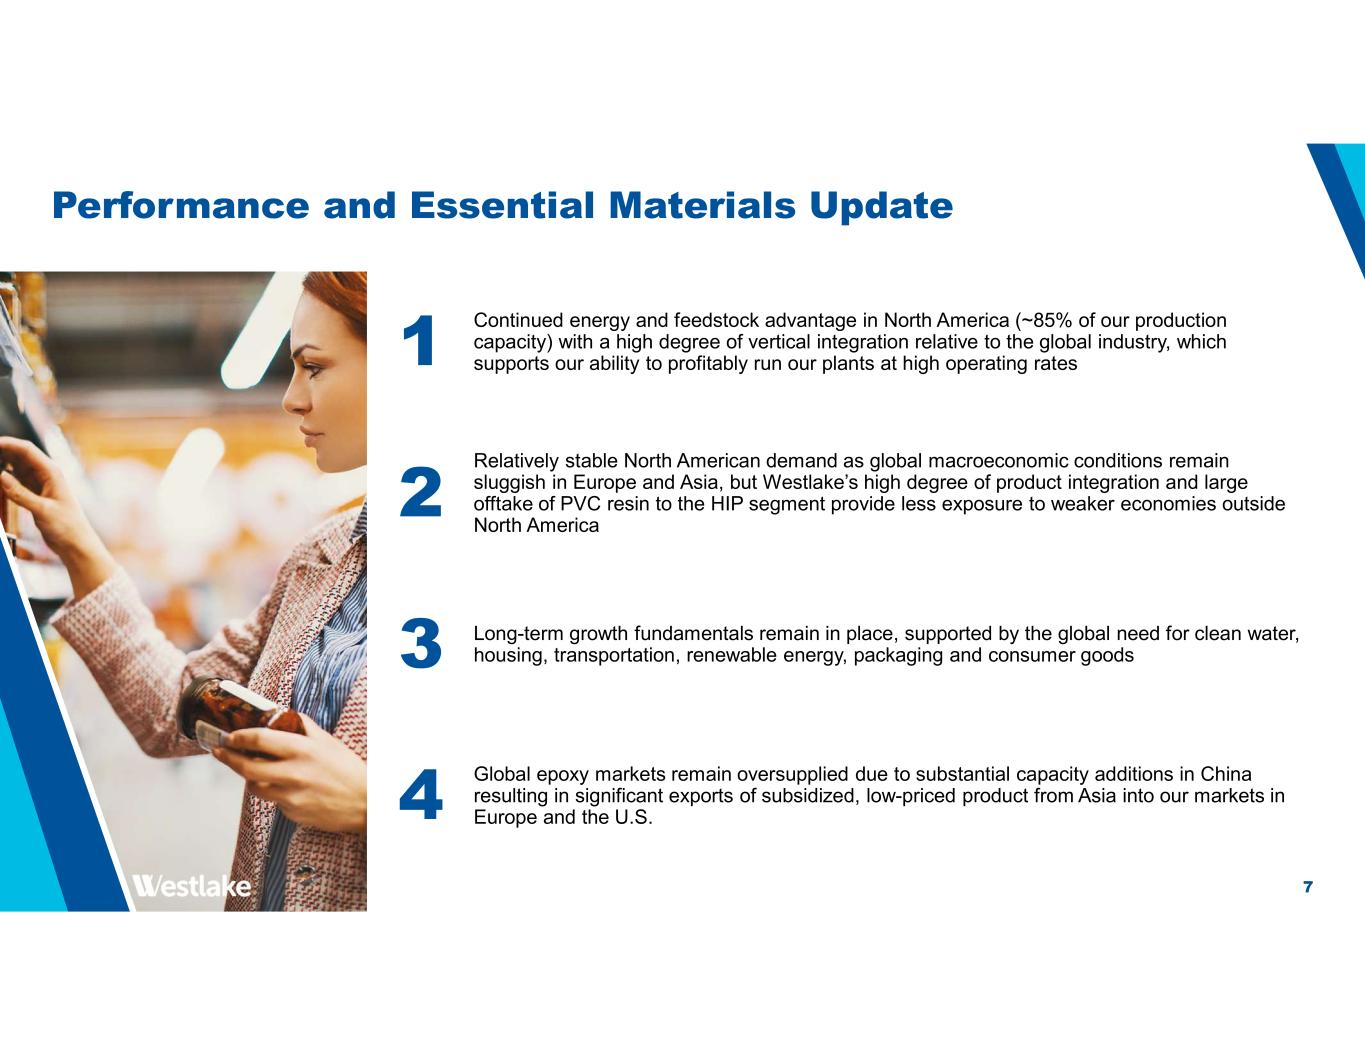
7 Performance and Essential Materials Update 2 Relatively stable North American demand as global macroeconomic conditions remain sluggish in Europe and Asia, but Westlake’s high degree of product integration and large offtake of PVC resin to the HIP segment provide less exposure to weaker economies outside North America 3 Long-term growth fundamentals remain in place, supported by the global need for clean water, housing, transportation, renewable energy, packaging and consumer goods 4 Global epoxy markets remain oversupplied due to substantial capacity additions in China resulting in significant exports of subsidized, low-priced product from Asia into our markets in Europe and the U.S. 1 Continued energy and feedstock advantage in North America (~85% of our production capacity) with a high degree of vertical integration relative to the global industry, which supports our ability to profitably run our plants at high operating rates
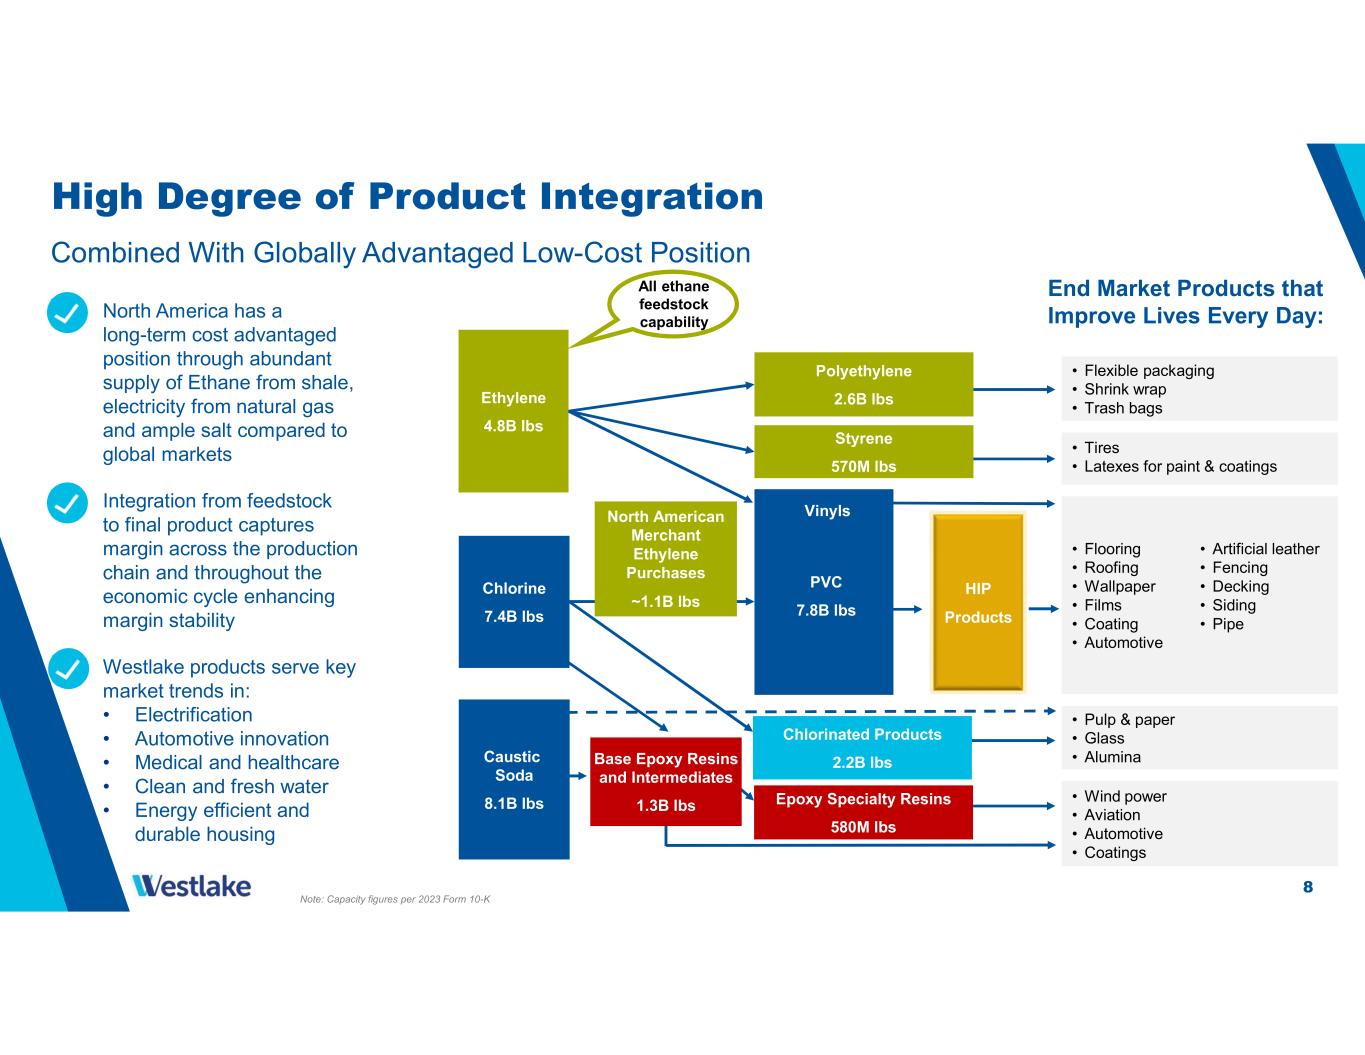
8 High Degree of Product Integration Combined With Globally Advantaged Low-Cost Position North America has a long-term cost advantaged position through abundant supply of Ethane from shale, electricity from natural gas and ample salt compared to global markets Integration from feedstock to final product captures margin across the production chain and throughout the economic cycle enhancing margin stability Westlake products serve key market trends in: • Electrification • Automotive innovation • Medical and healthcare • Clean and fresh water • Energy efficient and durable housing Polyethylene 2.6B lbs Styrene 570M lbs Chlorinated Products 2.2B lbs Epoxy Specialty Resins 580M lbs Base Epoxy Resins and Intermediates 1.3B lbs North American Merchant Ethylene Purchases ~1.1B lbs Vinyls Ethylene 4.8B lbs Chlorine 7.4B lbs Caustic Soda 8.1B lbs All ethane feedstock capability • Pulp & paper • Glass • Alumina • Tires • Latexes for paint & coatings • Flooring • Roofing • Wallpaper • Films • Coating • Automotive • Artificial leather • Fencing • Decking • Siding • Pipe • Flexible packaging • Shrink wrap • Trash bags End Market Products that Improve Lives Every Day: • Wind power • Aviation • Automotive • Coatings PVC 7.8B lbs HIP Products Note: Capacity figures per 2023 Form 10-K

99 Financial Reconciliations

10 Consolidated Statements of Operations Performance and Essential Materials Sales $ 2,019 $ 1,971 $ 2,013 $ 5,963 $ 6,456 Housing and Infrastructure Products Sales 1,098 1,144 1,194 3,336 3,266 Net sales 3,117 3,115 3,207 9,299 9,722 Cost of sales Gross profit Selling, general and administrative expenses Amortization of intangibles Restructuring, transaction and integration-related costs Income from operations Interest expense Other income, net Income before income taxes Provision for income taxes Net income Net income attributable to noncontrolling interests Net income attributable to Westlake Corporation $ 108 $ 285 $ 313 $ 595 $ 976 Earnings per common share attributable to Westlake Corporation: Basic $ 0.84 $ 2.22 $ 2.42 $ 4.61 $ 7.61 Diluted $ 0.83 $ 2.20 $ 2.40 $ 4.58 $ 7.56 10 33 33 10 12 323 70 214 249 4 406 (41) 59 2023 2024 2023 (In millions of dollars, except per share data) 424 101 65 (39) (40) (120) (124) 295 628 1,009 185 365 842 1,258 44 56 153 101 120 75 - 83 6 180 349 809 1,281 29 31 89 92 30 215 206 648 641 224 Three months ended September 30, Nine months ended September 30, Three months ended June 30, 499 586 1,629 2,020 2024 2,543 664 2,618 2,529 7,670 7,702 2024
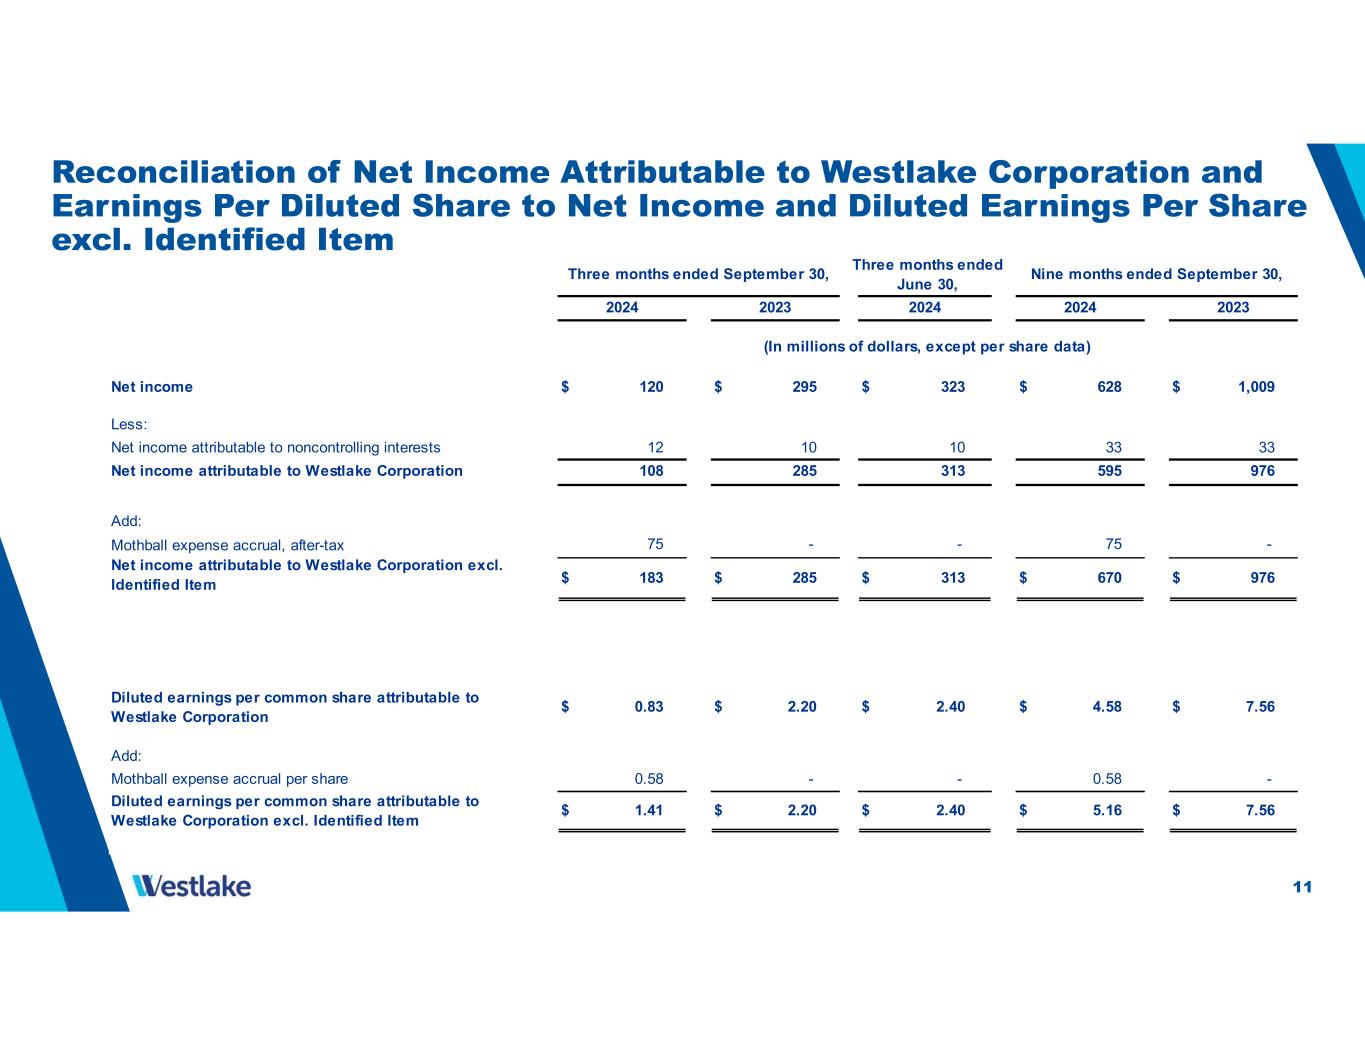
11 Reconciliation of Net Income Attributable to Westlake Corporation and Earnings Per Diluted Share to Net Income and Diluted Earnings Per Share excl. Identified Item Net income $ 120 $ 295 $ 323 $ 628 $ 1,009 Less: Net income attributable to noncontrolling interests Net income attributable to Westlake Corporation 108 285 313 595 976 Add: Mothball expense accrual, after-tax Net income attributable to Westlake Corporation excl. Identified Item $ 183 $ 285 $ 313 $ 670 $ 976 Diluted earnings per common share attributable to Westlake Corporation $ 0.83 $ 2.20 $ 2.40 $ 4.58 $ 7.56 Add: Mothball expense accrual per share Diluted earnings per common share attributable to Westlake Corporation excl. Identified Item $ 1.41 $ 2.20 $ 2.40 $ 5.16 $ 7.56 75 - - - - 75 - - 12 10 10 33 33 0.58 0.58 Three months ended September 30, Three months ended June 30, Nine months ended September 30, 2024 2023 2024 2024 2023 (In millions of dollars, except per share data)

12 Net cash provided by operating activities $ 474 $ 696 $ 237 $ 880 $ 1,763 Changes in operating assets and liabilities and other Deferred income taxes Net income Less: Other income, net Interest expense Provision for income taxes Income from operations Add: Depreciation and amortization Other income, net EBITDA 505 682 1,795 2,197 Add: Mothball expense accrual EBITDA excl. Identified Item $ 580 $ 682 $ 744 $ 1,870 $ 2,197 Income from operations margin 6% 11% 13% 9% 13% EBITDA excl. Identified Item margin 19% 22% 23% 20% 23% 75 - - 75 - Three months ended September 30, Nine months ended September 30, 20242024 2023 2024 2023 Three months ended June 30, (In millions of dollars) 67 50 (354) (417) (310) (821) 36 0 16 58 323 120 295 628 1,009 (41)(39) (40) (120) (124) 59 44 56 153 101 406 180 349 809 1,281 (101)(65) (70) (214) (249) 59 44 56 153 101 279 281 277 833 815 744 Reconciliation of EBITDA excl. Identified Item to EBITDA, Net Income, Income from Operations and Net Cash Provided by Operating Activities

13 Three months ended September 30, Three months ended June 30, Nine months ended September 30, 2024 2023 2024 2024 2023 Performance and Essential Materials EBITDA excl. Identified Item $ 297 $ 339 $ 391 $ 941 $ 1,389 Less: Mothball Expense Accrual 75 - - 75 - Depreciation and Amortization 225 225 224 669 652 Other income, net 6 9 10 27 14 Performance and Essential Materials Operating Income (Loss) (9) 105 157 170 723 Housing and Infrastructure Products EBITDA 262 327 336 862 776 Less: Depreciation and Amortization 54 51 53 157 157 Other income, net 6 20 17 27 30 Housing and Infrastructure Products Operating Income (Loss) 202 256 266 678 589 Corporate EBITDA 21 16 17 67 32 Less: Depreciation and Amortization 2 1 2 7 6 Other income, net 32 27 32 99 57 Corporate Operating Income (Loss) (13) (12) (17) (39) (31) Performance and Essential Materials Operating Income (Loss) (9) 105 157 170 723 Housing and Infrastructure Products Operating Income 202 256 266 678 589 Corporate Operating Income (Loss) (13) (12) (17) (39) (31) Total Operating Income 180$ 349$ 406$ 809$ 1,281$ (In millions of dollars) Reconciliation of PEM EBITDA excl. Identified Item, HIP EBITDA and Corporate EBITDA to Operating Income (Loss)
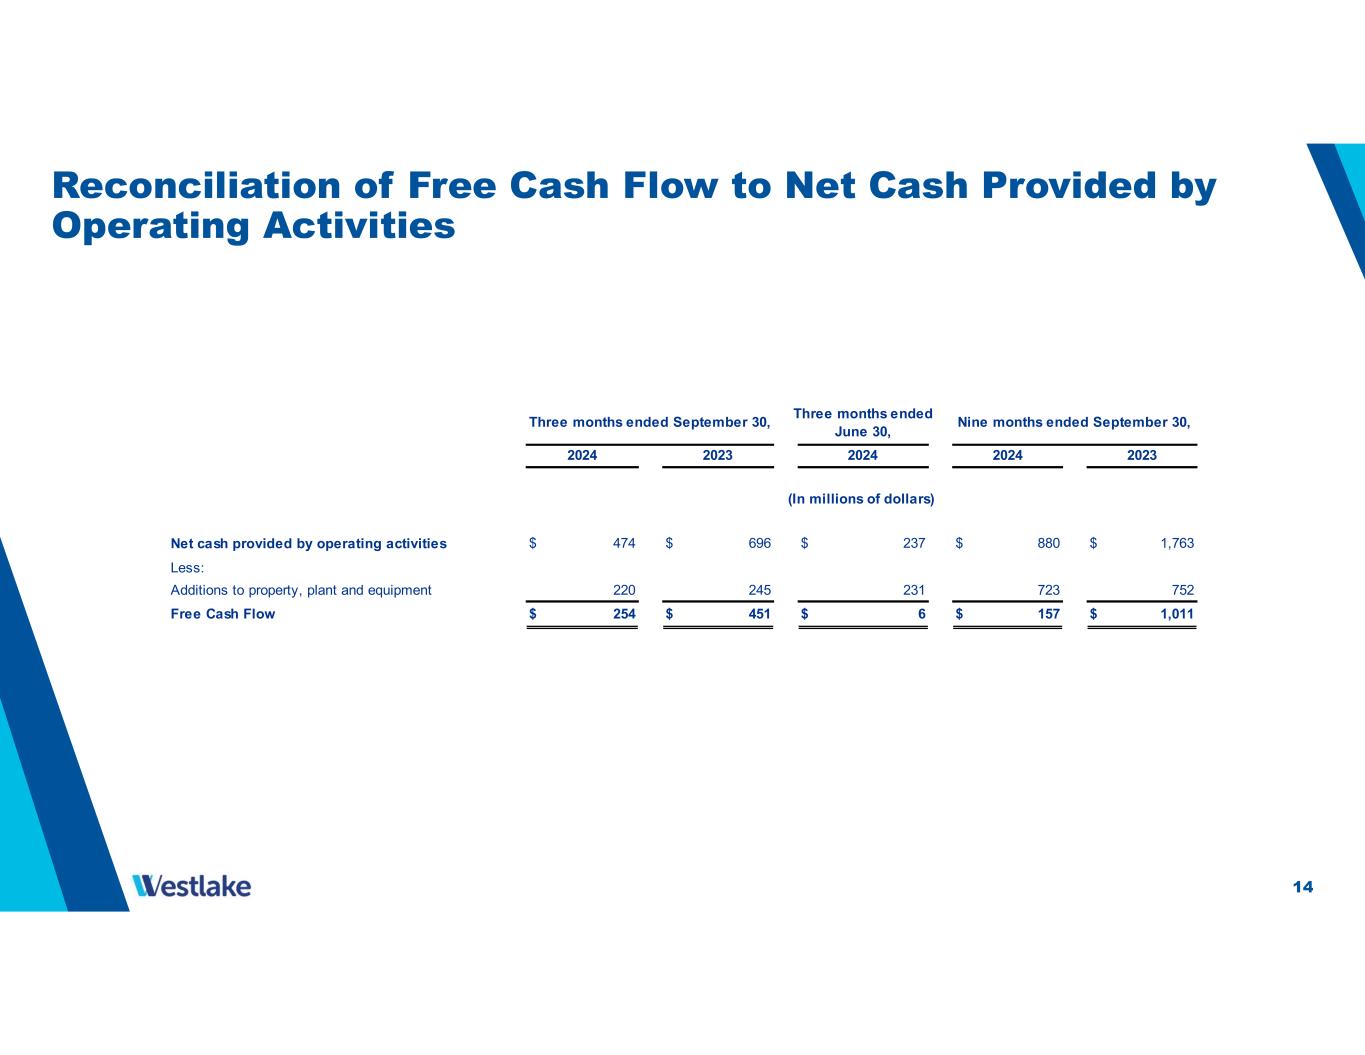
14 Reconciliation of Free Cash Flow to Net Cash Provided by Operating Activities Net cash provided by operating activities $ 474 $ 696 $ 237 $ 880 $ 1,763 Less: Additions to property, plant and equipment Free Cash Flow $ 254 $ 451 $ 6 $ 157 $ 1,011 220 245 231 723 752 (In millions of dollars) Three months ended September 30, Three months ended June 30, Nine months ended September 30, 2024 2023 2024 2024 2023

15 Safe Harbor Language This presentation contains certain forward-looking statements including statements regarding our cost savings objectives and our ability to maintain synergies, pricing and demand for our products and across the industrial and manufacturing sectors, global macroeconomic conditions, anticipated sales volumes, industry outlook for both of our segments, our cost control and efficiency efforts, the effects of changing demographics in the markets that we serve, anticipated residential construction, repair and remodel activities and infrastructure growth, housing market fundamentals, the proliferation of electrification, expectations regarding mortgage rates and their effects on the affordability of homes, expectations regarding homebuilder confidence, our cost advantages in the North American chemicals market, benefits from construction of our new PVCO plant, and our participation in rebuilding efforts following hurricanes. Actual results may differ materially depending on factors, including, but not limited to, the following: general economic and business conditions; the cyclical nature of the chemical and building products industries; the results of acquisitions and our integration efforts; the availability, cost and volatility of raw materials and energy; uncertainties associated with the United States, European and worldwide economies, including those due to political tensions and conflict in the Middle East, Russia, Ukraine and elsewhere; uncertainties associated with pandemic infectious diseases; uncertainties associated with climate change; the potential impact on the demand for ethylene, polyethylene and polyvinyl chloride due to initiatives such as recycling and customers seeking alternatives to polymers; current and potential governmental regulatory actions in the United States and other countries; industry production capacity and operating rates; the supply/demand balance for our products; competitive products and pricing pressures; instability in the credit and financial markets; access to capital markets; terrorist acts; operating interruptions; changes in laws or regulations, including trade policies; technological developments; information systems failures and cyber attacks; foreign currency exchange risks; our ability to implement our business strategies; creditworthiness of our customers; the effect and results of litigation and settlements of litigation; and other factors described in our reports filed with the Securities and Exchange Commission. Many of these factors are beyond our ability to control or predict. Any of these factors, or a combination of these factors, could materially affect our future results of operations and the ultimate accuracy of the forward-looking statements. These forward-looking statements are not guarantees of our future performance, and our actual results and future developments may differ materially from those projected in the forward-looking statements. Management cautions against putting undue reliance on forward-looking statements. Every forward-looking statement speaks only as of the date of the particular statement, and we undertake no obligation to publicly update or revise any forward-looking statements. Investor Relations Contacts Steve Bender Executive Vice President & Chief Financial Officer John Zoeller Vice President & Treasurer Westlake Corporation 2801 Post Oak Boulevard, Suite 600, Houston, Texas 77056 | 713-960-9111
