 Q1 Fiscal Year 2013 Earnings Presentation, Commentary & Financial Results Supplement October 25, 2012 Exhibit 99.2 |
 This document is Vistaprint’s first quarter fiscal year 2013 earnings commentary. This document contains slides and accompanying comments in the “notes” section below each slide. |
 Safe Harbor Statement 2 This presentation and the accompanying notes contain statements about our future expectations, plans and prospects of our business that constitute forward-looking statements for purposes of the safe harbor provisions under the Private Securities Litigation Reform Act of 1995, including but not limited to our financial guidance, outlook, expectations, and investment areas for fiscal year 2013; our planned investments in our business and the anticipated effects of those investments; our operational growth strategy and the anticipated development of our business and financial results in response to our strategy; and the anticipated growth and development of our business and markets, especially in Europe. Projections are inherently uncertain and are based on assumptions and judgments by management. Our actual results may differ materially from those indicated by these forward-looking statements as a result of various important factors, including but not limited to flaws in the assumptions and judgments upon which our projections and guidance are based; our failure to make the investments in our business that we plan to make or the failure of those investments to have the effects that we expect; our failure to execute our strategy; the willingness of purchasers of marketing services and products to shop online; our failure to identify and address the causes of our revenue weakness in Europe; currency fluctuations that affect our revenues and costs; costs and disruptions caused by acquisitions; the failure of our acquired businesses to perform as expected; difficulties or higher than anticipated costs in integrating the systems and operations of our acquired businesses into our systems and operations; unanticipated changes in our market, customers or business; our failure to acquire new customers and enter new markets, retain our current customers, and sell more products to current and new customers; our failure to promote and strengthen our brand; the failure of our current and new marketing channels to attract customers; our failure to manage growth and changes in our organization; our failure to manage the complexity of our business and expand our operations; our inability to manage the challenges and risks of our international operations; competitive pressures; costs and judgments resulting from litigation; changes in the laws and regulations or in the interpretations of laws or regulations to which we are subject, including tax laws, or the institution of new laws or regulations that affect our business; and general economic conditions. You can also find other factors described in our Form 10-K for the fiscal year ended June 30, 2012 and the other documents we periodically file with the U.S. Securities and Exchange Commission. |
 Please read the above safe harbor statement. Additionally, a detailed reconciliation of GAAP and non-GAAP measures is posted in the appendix of the Q1 fiscal 2013 earnings presentation that accompanies these remarks. |
 Presentation Organization & Call Details 3 Presentation Organization: • Quarterly review and update on initiatives • Q1 FY13 operating and financial results • Looking ahead to Q2 and remainder of fiscal year • Supplementary information • Reconciliation of GAAP to Non-GAAP results Live Q&A Session: • 5:15 p.m. Eastern • Link from the IR section of www.vistaprint.com • Hosted by: Robert Keane President & CEO Ernst Teunissen EVP & CFO |
 This presentation is organized into the categories shown on the left hand of this slide. Robert Keane, CEO, and Ernst Teunissen, CFO, will host a live question and answer conference call at 5:15 p.m. US Eastern time which you can access through a link on the investor relations section of www.vistaprint.com. |
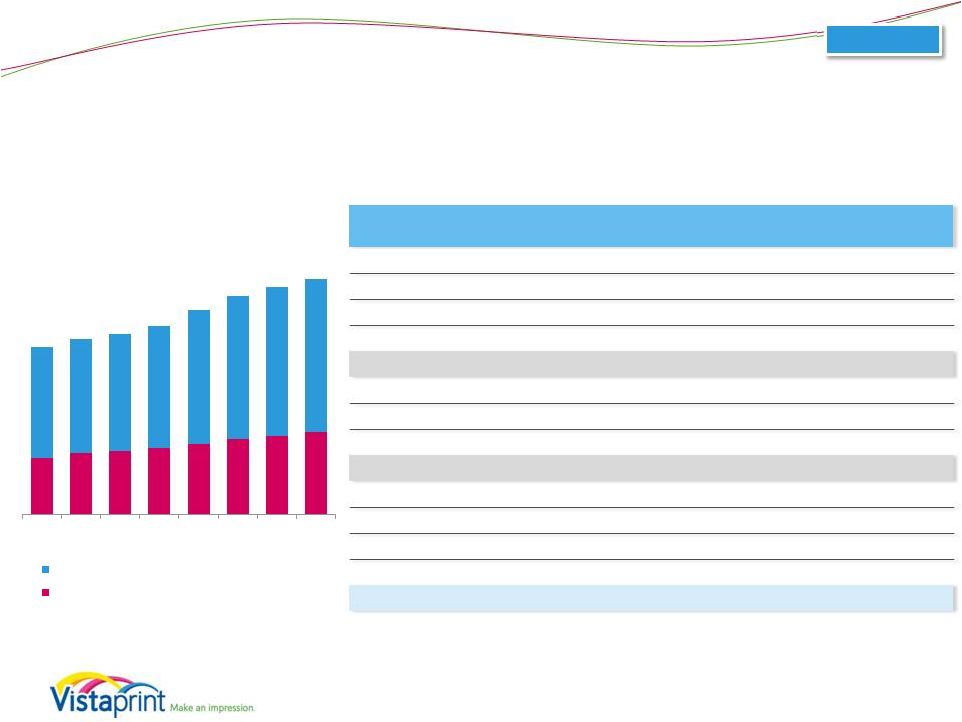
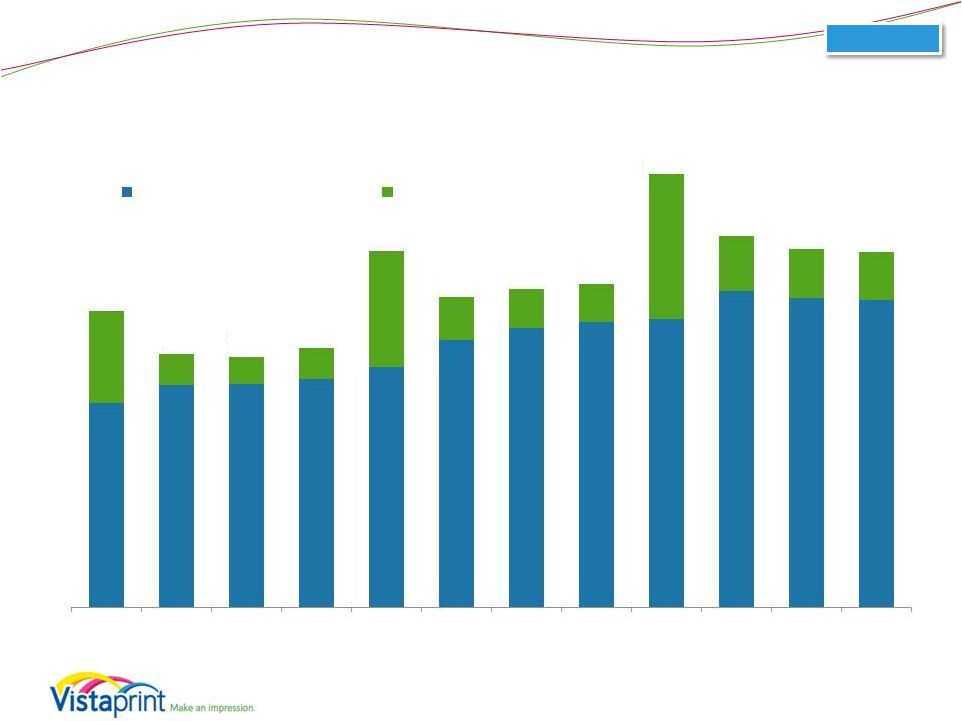
 Quarterly Financial Results 4 Consolidated $234 $204 $209 $212 $300 $258 $250 $251 Q2 FY11 Q3 FY11 Q4 FY11 Q1 FY12 Q2 FY12 Q3 FY12 Q4 FY12 Q1 FY13 Webs revenue (millions) Albumprinter revenue (millions) Organic revenue (millions) $0.75 $0.51 $0.32 $0.19 $0.82 $0.01 $0.10 $(0.05) $0.89 $0.63 $0.43 $0.31 $0.97 $0.29 $0.40 $0.25 Q2 FY11 Q3 FY11 Q4 FY11 Q1 FY12 Q2 FY12 Q3 FY12 Q4 FY12 Q1 FY13 GAAP EPS* Non-GAAP EPS* Revenue and EPS results for the consolidated business, including Albumprinter and Webs results since October 31, 2011 and December 28, 2011 (dates of purchase, respectively). Non-GAAP adjusted net income per diluted share for all periods presented excludes the impact of share-based compensation expense and its related tax effect, amortization of acquired intangible assets and a tax charge related to the alignment of Webs IP with our global structure. Please see reconciliation to GAAP net income (loss) at the end of this presentation. * Per diluted share |
 Our consolidated revenue in the first quarter of the new fiscal year was at the low end of our guidance range set three months ago. Revenue grew 23% on a consolidated constant currency basis, to $251 million, including revenue from our Albumprinter and Webs acquisitions. On an organic constant currency basis, we grew 13% globally. This reflects strikingly different levels of regional revenue performance: our organic constant currency revenue growth in North America was strong at 19%, was on track in Asia Pacific at 29%, but in Europe was well below our expectations and plans at just 1%. We manage our business to a global budget, but the underlying differences in our regional performance highlight both encouraging results of our strategy execution in North America, as well as persistent challenges that we are actively working to address in Europe. As we mentioned last quarter, while it is possible that the economy in Europe is impacting our business, we believe our own value proposition and operational execution must improve. In the last quarter we made some organizational changes that we believe will help drive longer-term improvements in Europe, but we are very early in this process. Earnings per share for the quarter was a loss of $0.05, and we are on track and committed to delivering EPS in line with our annual plan and the annual guidance we provided at the beginning of the year. |
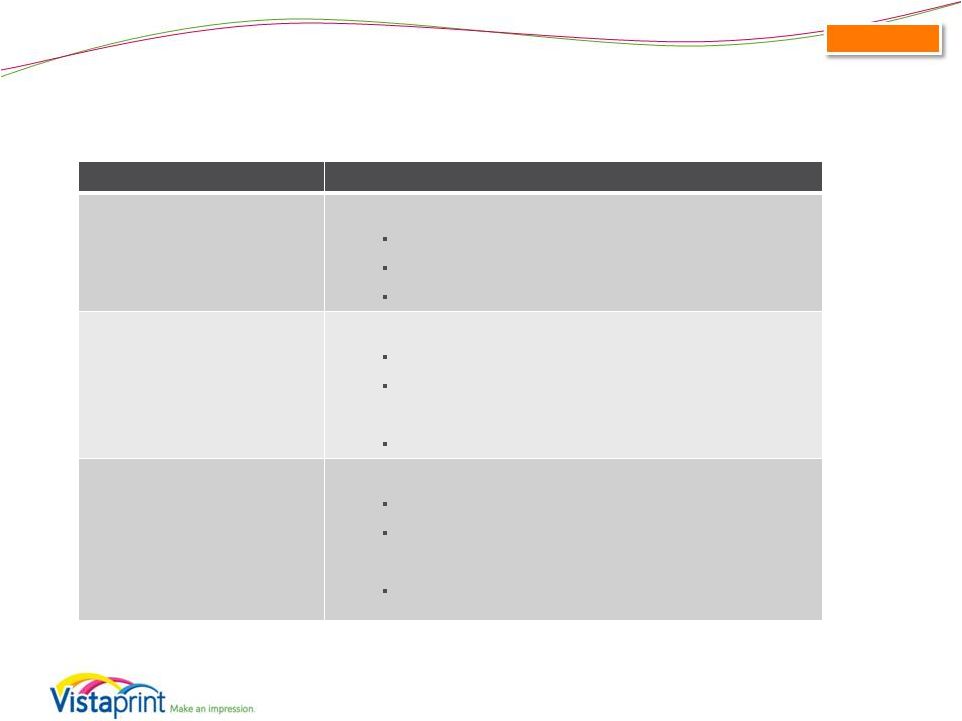
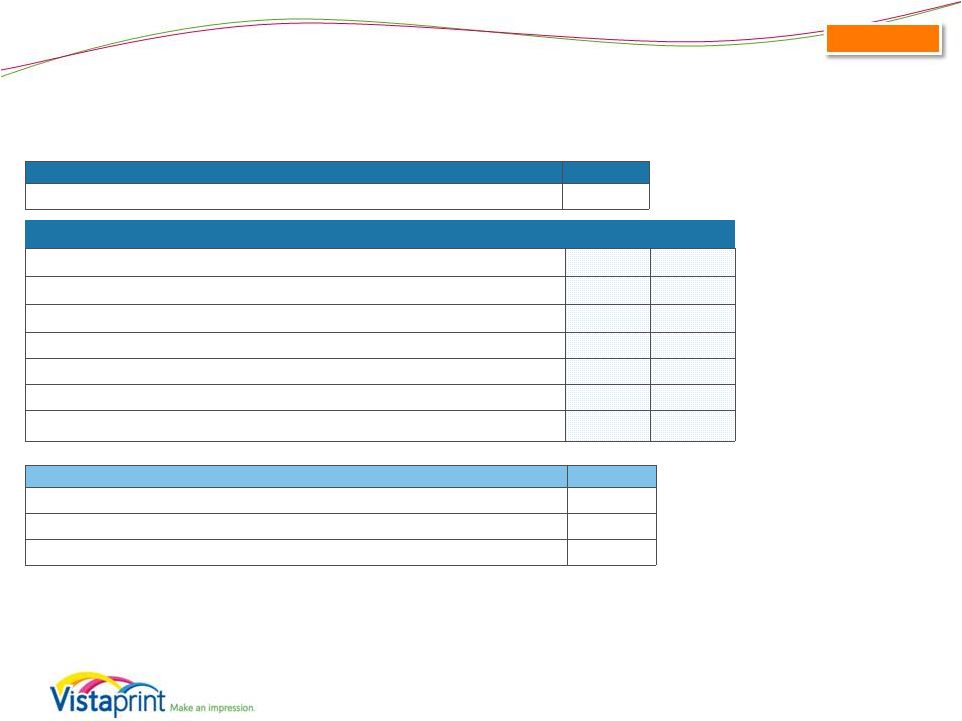
 Operational Performance: Reinvigorate Growth in the Core Business 5 Strategy Element Description Long-Term Goals Q1 FY13 Results/Examples Major improvements to customer experience, satisfaction and loyalty Change success metrics from short-term transaction-focused value to longer-term life time value and achieve higher life time value per customer • Continued improvements in net promoter score, a leading retention indicator • New website experience • Improved substrate quality on T-shirts • Continued improvements in marketing by segment • Additional substrate upgrades Invest more deeply into selected traditional Vistaprint marketing channels and expand in relatively new channels such as broadcast with higher than average COCA, but excellent longer term ROI Accelerate new customer acquisition Reach offline audiences not currently looking to online suppliers • New customer growth of 16% • Launched new TV broadcast creative in N.A. • Radio testing in N.A. • Continued testing into new channels in Europe and APAC Accelerate investment in production process improvements, employee training, supply chain management and manufacturing-related engineering Step function changes in quality and reliability Significantly lower unit manufacturing costs • Upgrades to product quality & substrates • Launch of proprietary manufacturing system for low- volume promotional products • Continued efforts in improving manufacturing operating metrics (quality, speed, delivery, cost, reliability) Customer Value Proposition Improvements Life Time Value Based Marketing World Class Manufacturing |
 During the quarter, we continued to roll out initiatives in each of our strategy elements designed to reinvigorate growth in our core business. First, we are steadily improving our customer value proposition. Compared to a year ago we have more customer service, better quality product substrates, faster shipping times, clearer website experience, less price-driven merchandising, more transparent pricing, and upgraded tone, professionalism and relevance of our retention marketing efforts. As a result, our Net Promoter Score (NPS) continues to improve globally. In time we expect this to result in improved life time value of our customers. Specific examples from the first quarter are: • • • • Second, we are now investing in advertising based on the life time value of our customers. This is in full swing in North America, and in the testing phase in other regions. During the first quarter, we launched new creative in our North American TV broadcast campaign and tested more heavily into radio. We tested TV advertising in the UK and Australia, and prepared to do so in Q2 in Germany and France. We continued to see strong new customer growth in all geographies, with a total increase of 16% year over year. Third, our investments in world-class manufacturing continue. Our engineering and management teams are leveraging our recently functionally aligned organization to increase our sharing of best practices and processes across regions. We are making significant improvements in productivity measures, and achieving cost savings from more professional and global supply chain management. Our strong gross margin in Q1 was influenced by multiple positive and negative drivers, but we believe the productivity and supply chain improvements we are making will help us achieve long-term scale leverage on the gross margin line. This quarter’s launch of a new line of promotional products was enabled by proprietary equipment engineering and system development in our manufacturing team. And across Vistaprint, teams are standardizing and improving processes such as packaging automation, cutting, recycling, scrap reduction, and shipment reliability. We launched a new website navigation and merchandising structure, with more streamlined shopping categories, a simplified user interface, and enhanced value-based messaging and merchandising designed to improve the overall experience. In the December quarter we expect to launch localization tools for this new site that will allow for more relevant localization of markets outside of the US. We upgraded our T-shirt stock in a further step to improve our quality across multiple product lines. Our new Jamaican customer service center opened this quarter, which should help us better serve our North American customers from a single, purpose-built location for our growing service staff. We continued efforts in making our site and retention marketing programs more relevant to our various customer segments. |
 Operational Performance: Regional Review 6 North America • Acceleration of growth rate o Improved customer value proposition o LTV based advertising, including but not limited to television o Strong organization effectiveness in marketing team • Strategy implementation is far Europe • Poor revenue performance o Weak macroeconomic backdrop, but we are focusing on improving our own execution • Prior organizational structure • Looking forward o Anticipate improved growth in FY13 o Fundamental turn-around requires longer term perspective from complete, but off to a strong start limited ability to shift marketing approach o New structure in place during Q1 |
 The strategic initiatives we just described are being rolled out globally, but with some differences in timing. We also have seen differences in our operational execution across regions. Let’s take a moment to review our two largest geographic regions and the differences that we believe are factors in their diverging Q1 performance. North America In our largest geographic market, we have seen revenue growth accelerate from as low as 15% eight quarters ago, to 18- 22% over the last year. Growth in this quarter of 19% compares to growth of 17% in the first quarter of FY12. In North America our strategic investments have been further strengthened and propelled by strong organizational effectiveness in our NA marketing teams. That team has improved the efficiency of our traditional channels, rolled out new multi-channel campaigns, and expanded our partner program to extend our market reach. These efforts have been building over the course of the past three years. Our North American strategy implementation is far from complete, but the strong revenue growth we are seeing there makes us confident in both our strategy and our execution. Europe As noted above, our poor revenue performance in Europe is a stark contrast to North America’s success. We are actively working to understand and address the root causes of this decline in our EU growth rate. While the macroeconomic environment in Europe is clearly challenging, we are focusing our efforts on improving what we can control, and on our performance regardless of the economy. We believe our long-term strategy is the right strategy for Europe, but neither our implementation of the strategy, nor our operational marketing execution has been as effective in Europe as it has been in North America to date. We believe that the reorganization we previously announced, which went into effect July 1st, 2012, will better equip us in steering the European business back on track. We believe that the move away from our historic transaction-based customer interaction management to a focus on improving overall value to the customer will be better executed in an organization that is aligned in functional units as opposed to the country-based structure we previously had in place. We expect to see an improved year-over-year growth rate in the EU for the remainder of fiscal 2013 as compared with the first quarter. However, just as it took time to reverse the growth rate trends in the US, we believe that fundamental European improvements to achieve our potential in the market will require time to implement and better execution. |
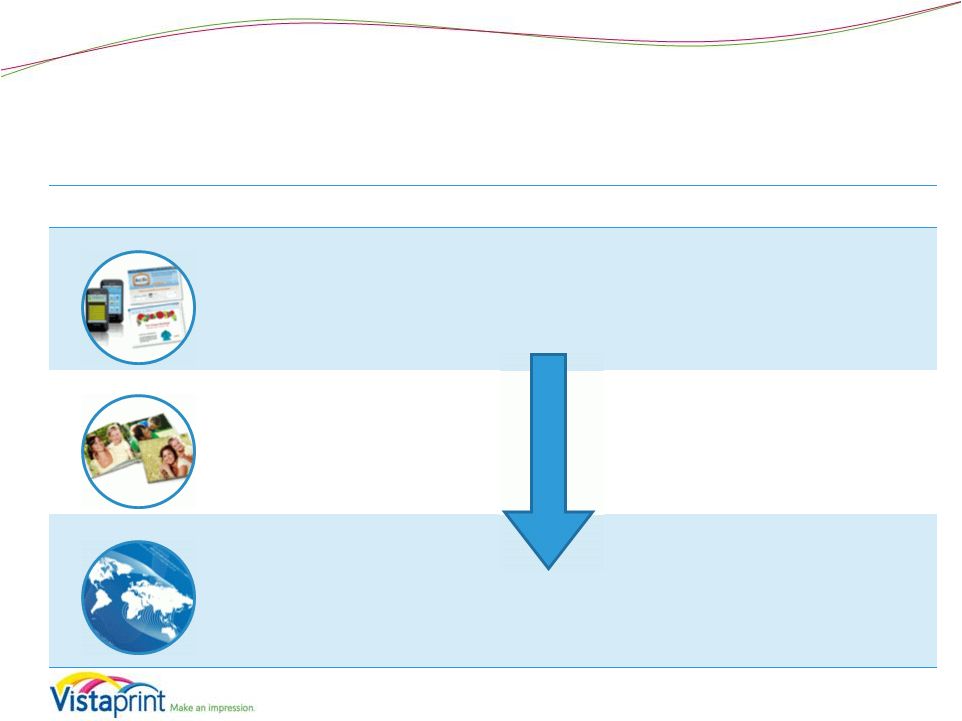 Operational Performance: Build Foundations for Future Growth 7 Strategy Element Description Long-Term Goals Q1 FY13 Results/Examples Digital small business marketing offerings (websites, email marketing, social media) Lay foundations for continued rapid growth five and more years in the future Seek M&A opportunities of firms that possess technology, market presence and/or expertise in target areas • Continued digital subscriber adds in Q1 • Launch of Facebook Cover Pages • Launched white label Pagemodo product to Vistaprint base • Continued with Webs integration and technology investments Enable customers to share and preserve memories through personalized products for home and family use • Testing of Albumprinter photo books with Vistaprint’s EU customer base • Albumprinter manufacturing process improvements based upon work with Vistaprint manufacturing • Preparation for holiday quarter Expand to markets beyond Europe and North America Near term focus on Asia • Continued organizational building of Singapore leadership team • Opened India production & service operations, initial site launch • Ops planning, recruitment, cross- training & process development for China minority interest Digital Marketing Home & Family Geographic Expansion |
 In addition to our initiatives in the core business, efforts in our adjacencies continued. Our Vistaprint-branded digital subscriber base reached 353,000 customers with continued improvement in monthly revenue per customer, and our Webs-branded paid subscriber base grew at a healthy clip. Our Webs Pagemodo product surpassed one million users since its initial launch, and we just released a new Facebook cover page designer. We launched a white labeled version of that Facebook page builder to Vistaprint customers and enhanced the product bundle packages of our digital offering. In the home and family area, we continued testing cross-selling of Albumprinter photo books into the Vistaprint European customer base, and in early October turned on this new photo book offering in 9 of our European countries. Our global engineering teams and the Albumprinter manufacturing team implemented more efficient manufacturing processes in the Albumprinter production facility. We are also preparing for the upcoming holiday season with new content designs for our most popular holiday products. In terms of geographic expansion, we continued building out our Singapore-based APAC leadership team in order to support future opportunities in global emerging markets. In India we opened Vistaprint’s newest production facility, recruited and trained our service teams, and launched the first version of our Indian website. Over the coming year in India we are focused on making significant strides in terms of localization of content and product, operations ramp up and initial marketing efforts. And in China, via our minority interest in Namex, we conducted significant operational planning, cross-training, recruitment and establishment of reporting processes. |
 Q1 FY 2013 Operating and Financial Results 8 |
 Q1 FY 2013: Key Financial Metrics* 9 * Financial metrics for the consolidated business, including Albumprinter results since October 31, 2011 and Webs results since December 28, 2011 (dates of purchase). ** Non-GAAP adjusted net income and non-GAAP adjusted EPS exclude share-based compensation expense and its related tax effect, amortization of acquired intangible assets, and charges related to the alignment of Webs IP with our global operations. Please see reconciliation to GAAP net income (loss) and EPS at the end of this presentation. Quarter Ended 09/30/2012 Revenue • $251.4 million 18% y/y growth 23% y/y constant currency growth 13% y/y organic constant currency (ex-acquisitions) GAAP Net Income (Loss) • $(1.7) million (0.7)% net margin vs. 3.8% last year decrease of 121% y/y • $(0.05) Diluted EPS decrease of 126% y/y Non-GAAP Adjusted Net Income** • $8.9 million 3.5% net margin vs. 6.1% last year decrease of 32% y/y • $0.25 Diluted EPS decrease of 19% y/y Consolidated |
 Turning to financials, Vistaprint generated revenues of $251 million in the first quarter, reflecting an 18% year over year increase. In organic constant-currency terms, excluding Albumprinter and Webs, this reflects 13% year over year growth for the business, at the low end of the constant-currency expectations we set three months ago. GAAP net loss for the first quarter was $1.7 million, or negative 0.7% of revenue, reflecting a 121% decrease year over year. We expected GAAP EPS to decline significantly year over year due to the investments in our strategy for the traditional organic business as well as the dilutive impact of the Webs and Albumprinter acquisitions. GAAP EPS in the first quarter was a loss of $0.05, reflecting a decrease of 126% year over year. Non-GAAP adjusted net income in the first quarter was $8.9 million, or 3.5% of revenue, reflecting a decrease of 32% year over year. Non-GAAP adjusted EPS was $0.25 in the first quarter of fiscal 2013, which reflects a decrease of 19% year over year. Non-GAAP EPS declined less than GAAP EPS primarily due to higher stock-based compensation from our acquisitions and the accounting timing impact of our recent premium price stock option grants for our executive officers, of which the most significant portion has an accelerated expense profile versus traditional stock options and RSUs. |
 Cash Flow & ROIC Highlights* Quarterly cash flows and investments (in millions) Q1FY13 Q1FY12 Cash flow from operations $6.6 $30.5 Free cash flow** $(22.4) $17.8 Capital expenditures $27.8 $11.0 as % of revenue 11.0% 5.2% Trailing Twelve Month Return on Invested Capital*** (GAAP) 7% 27% Trailing Twelve Month Return on Invested Capital*** (Non-GAAP) 15% 35% 10 Share repurchase program Q1FY13 Shares purchased - Average cost per share - Total purchase spend, inclusive of transaction costs, in millions - Balance sheet (in millions, as of September 30, 2012) Cash and cash equivalents $59.3 Consolidated * Financial results for the consolidated business, including Albumprinter and Webs results ** FCF = Cash Flow from Operations – Capital Expenditures – Purchases of Intangible assets not related to acquisitions – Capitalized Software Expenses *** ROIC = NOPAT / (Debt + Equity – Excess Cash) Net operating profit after taxes (NOPAT) Excess cash is cash and investments >10% of last twelve month revenues Operating leases have not been converted to debt Non-GAAP TTM ROIC excludes share-based compensation expense and its related tax effect, amortization of acquired intangibles, and charges related to the alignment of Webs IP with our global structure on NOPAT |
 Cash and cash equivalents were approximately $59.3 million as of September 30, 2012. During the quarter, Vistaprint generated $6.6 million in cash from operations, compared with $30.5 million in the first quarter of fiscal 2012. Free cash flow was $(22.4) million in the first quarter, down from $17.8 million in the first quarter of fiscal 2012. On a trailing twelve-month basis, return on invested capital (or ROIC) as September 30, 2012 declined due to the planned reduced profitability in our business during the fiscal year. Including share based compensation expense, it was approximately 7%, and excluding share based compensation expense, it was approximately 15%. We expect ROIC to improve significantly over time, as we expect our FY12 and FY13 investments to bear fruit later in FY14 and beyond. We did not repurchase shares during the quarter. We have approximately one million shares left under the repurchase authorization approved by our shareholders in November 2011. Note that in the proxy for our November 8, 2012 annual meeting of shareholders, we are asking our shareholders to authorize additional share repurchases beyond that remainder. |
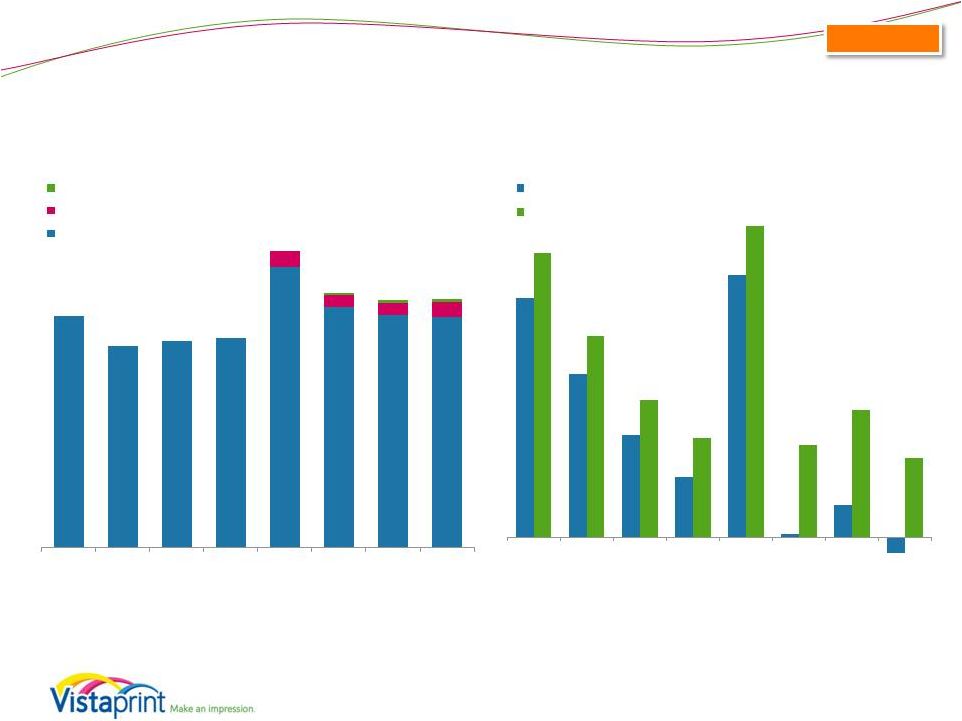
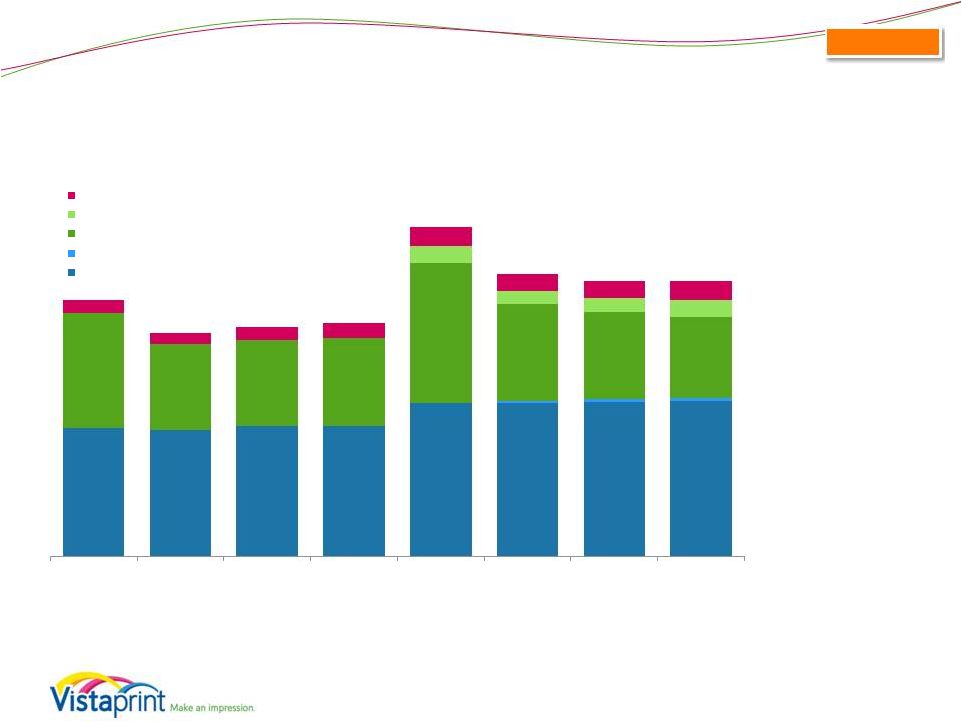 Geographic Segment Revenue - Quarterly (millions) North America: 57% of total revenue 22% y/y growth 22% y/y constant currency growth including Webs 19% y/y organic constant currency growth Europe: 36% of total revenue 12% y/y growth 23% y/y constant currency growth including Albumprinter 1% y/y organic constant currency growth Asia Pacific: 7% of total revenue 28% y/y growth 29% y/y constant currency growth Revenue results for the consolidated business, including Albumprinter and Webs results since respective acquisition dates. All Albumprinter revenue included in European segment. All Webs revenue included in NA segment. Note: Constant currency basis is estimated by translating all non-U.S. Dollar denominated revenue generated in the current period using the prior year period’s average exchange rate for each currency to the U.S. Dollar. Please see reconciliation to reported revenue growth rates at the end of this presentation. Q1 FY2013 11 $116.7 $115.5 $119.2 $118.7 $139.8 $139.7 $140.9 $141.6 $2.3 $2.5 $2.6 $105.3 $77.7 $77.8 $80.0 $127.3 $88.4 $79.1 $74.3 $15.7 $11.8 $12.9 $15.4 $12.1 $10.5 $11.8 $13.7 $17.0 $15.4 $15.1 $17.5 Q2 FY11 Q3 FY11 Q4 FY11 Q1 FY12 Q2 FY12 Q3 FY12 Q4 FY12 Q1 FY13 Asia-Pacific Albumprinter (inc. in Europe) Europe Webs (inc. in North America) North America Consolidated |
 For the first quarter, revenue performance by geography, inclusive of Albumprinter and Webs revenues, was as follows: • • Currency exchange rates in the quarter had a negative impact on revenue growth year over year. All of our major currencies (the Euro, British pound, Canadian Dollar and Australian Dollar) weakened against the U.S. dollar since Q1 2012. The net result of currency movements year over year in Q1 was a negative impact of approximately $9 million on a consolidated basis. Sequentially, the Euro weakened against the U.S. dollar, while the Australian Dollar and Canadian Dollar strengthened slightly and the Pound remained flat. The net effect of all currencies on revenue was a negative impact of less than $1 million versus fourth quarter rates. Compared to the currency rates we assumed when we gave guidance in July, currency helped us by approximately $1.4 million. North American revenue was $144.2 million, reflecting 22% growth year over year in both reported and constant currency terms. This revenue is inclusive of the $2.6 million of revenue from the Webs acquisition. Excluding Webs, our North American business grew 19% year over year in constant currency. We are seeing continued strength in our results in North America and we consider our performance in this region as a validation of our overall strategic direction. European revenue was $89.7 million, reflecting 12% growth year over year as reported and 23% growth year over year in constant currency. This revenue is inclusive of the $15.4 million of revenue from the Albumprinter acquisition. Excluding Albumprinter, our European business grew 1% year over year in constant currency. This growth is much lower than both what we want to see and what we believe is possible longer term in Europe. We believe it is possible that the macroeconomic environment in Europe is having an impact on us, but we can’t quantify it. Instead we are focusing on our own execution in Europe, which we believe can and must improve. Asia-Pacific revenue was $17.5 million, reflecting 28% growth year over year in reported terms and 29% growth year over year in constant currency. This remains our fastest growing geography, and we are pleased with our results in the first quarter. |
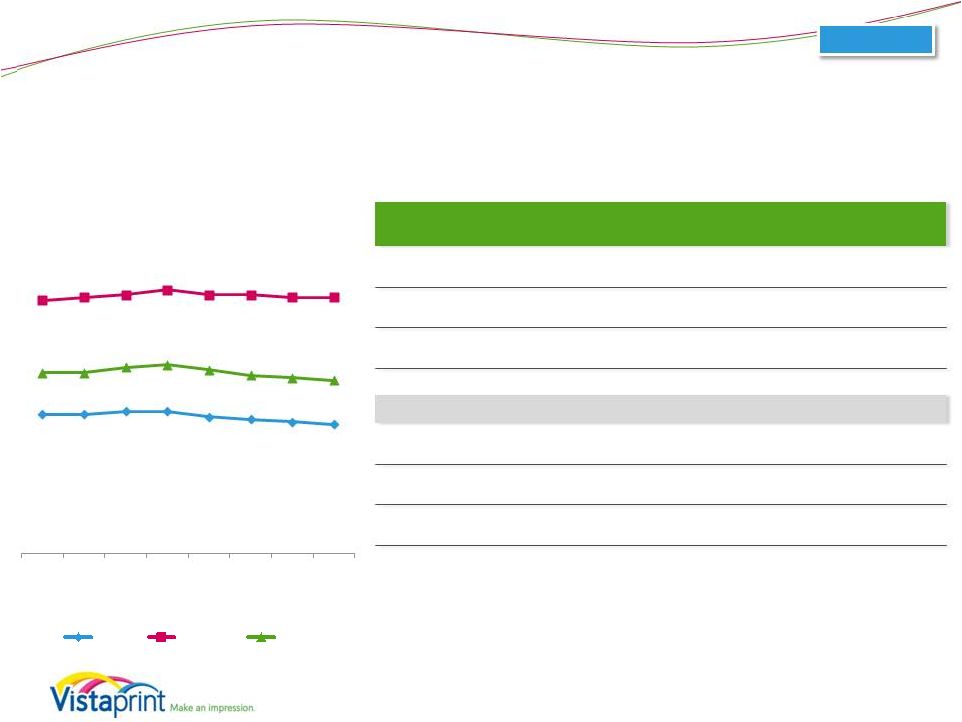
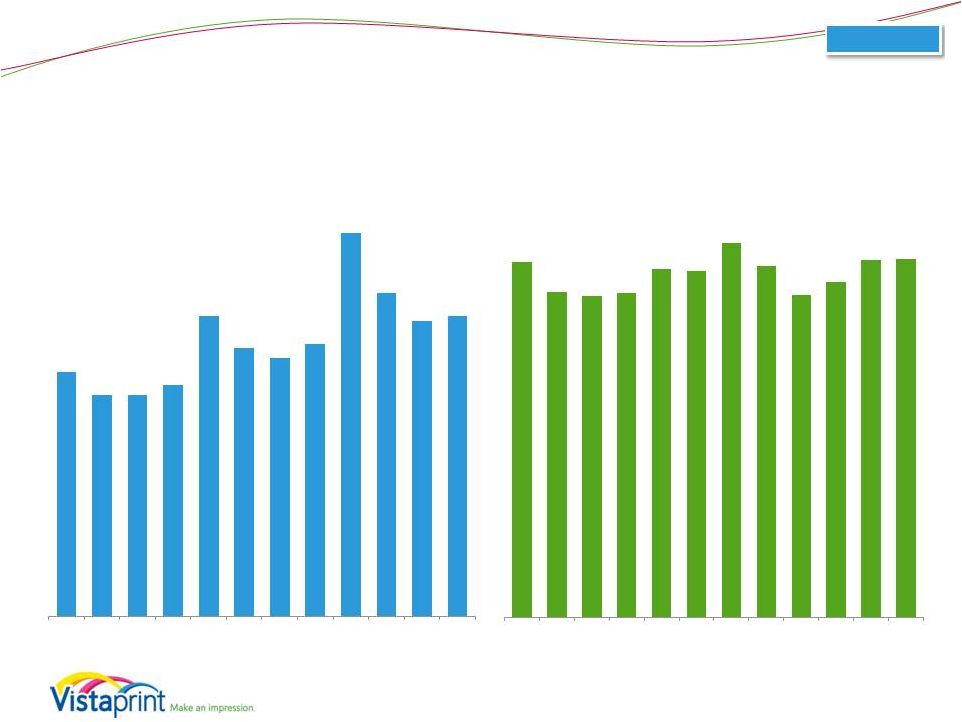 Operational Metrics (Excludes Albumprinter and Webs) 12 5.3 4.8 4.8 5.0 6.5 5.8 5.6 5.9 8.3 7.0 6.4 6.5 Q2 FY10 Q3 FY10 Q4 FY10 Q1 FY11 Q2 FY11 Q3 FY11 Q4 FY11 Q1 FY12 Q2 FY12 Q3 FY12 Q4 FY12 Q1 FY13 Orders (M) $36.63 $34.79 $34.56 $34.69 $36.17 $36.03 $37.75 $36.38 $34.61 $35.38 $36.73 $36.78 Q2 FY10 Q3 FY10 Q4 FY10 Q1 FY11 Q2 FY11 Q3 FY11 Q4 FY11 Q1 FY12 Q2 FY12 Q3 FY12 Q4 FY12 Q1 FY13 Average Order Value Organic |
 Vistaprint’s organic business metrics, excluding Albumprinter and Webs, were as follows: These metrics should be viewed together and not individually, as factors such as currency, product mix, marketing campaigns, partner performance, seasonality, and the like, can impact them. Total orders processed in the quarter were approximately 6.5 million reflecting growth of 10% year over year. Average order value was $36.78, roughly flat versus an average order value of $36.38 in Q1 of last fiscal year. AOV was up year over year in North America, yet down in Europe. |
 Operational Metrics (Excludes Albumprinter and Webs) 13 Organic 2.2 New Customers (million) Implied COCA Advertising as % of Revenue 0.0 0.5 1.0 1.5 2.0 2.5 3.0 0 $ 5 $ 10 $ 15 $ 20 $ 25 $ 30 $ 35 $ 0% 5% 10% 15% 20% 25% 30% 35% $22 $21 $22 $23 $24 $24 $26 $27 $26 $26 $25 $28 20% 20% 21% 21% 22% 21% 23% 24% 27% 26% 24% 26% |
 Additional customer metrics for the business on an organic basis, for the period ending September 30, 2012, were as follows: Quarterly new customer additions were approximately 2.2 million, reflecting 16% year over year growth over the approximately 1.9 million new customer adds in Q1 of last fiscal year. We are passing the anniversary of two initiatives that helped us accelerate new customer growth last year: our increased advertising as a percentage of revenue, and our partnership with Staples. We continue to expect new customer growth as a part of our efforts to extend our reach, but we don’t believe we will see 30% growth this fiscal year like we did last year. Vistaprint uses the term “implied cost of customer acquisition” or “implied COCA” to describe total advertising expense in a period divided by the number of unique first time customers in that period. The second chart illustrates our implied COCA, which is higher than years past due to our planned increased investment in advertising over time, and was up from Q4 to Q1 at approximately $28. Advertising costs for the organic business were $60.8 million, or 26.1% of organic revenue in the quarter. As part of our strategic investments, we expected this increase versus years past. As a reminder, our continued success with wholesale partnerships also reduces our COCA and our advertising as a percent of revenue, because those partners sell under their own brand and Vistaprint does not incur material advertising expenses in this type of wholesale partnership. |
 Historical Revenue Driver Metrics (Quarterly) 14 10.6 11.1 11.4 11.9 *trailing twelve month at period end 12.9 Organic 13.8 14.4 14.9 Q2 FY11 Q3 FY11 Q4 FY11 Q1 FY12 Q2 FY12 Q3 FY12 Q4 FY12 Q1 FY13 TTM Unique Customers (M) 10.6 11.1 11.4 11.9 12.9 13.8 14.4 14.9 TTM New Customers (M) 7.0 7.2 7.4 7.7 8.4 9.0 9.4 9.7 TTM Repeating Customers (M) 3.6 3.9 4.0 4.2 4.5 4.8 5.0 5.2 As % of Unique Customers TTM New Customers 66% 65% 65% 65% 65% 65% 65% 65% TTM Repeating Customers 34% 35% 35% 35% 35% 35% 35% 35% Y/Y Growth TTM Unique Customers 19% 21% 19% 19% 22% 24% 26% 25% TTM New Customers 15% 16% 16% 17% 20% 25% 27% 26% TTM Repeating Customers 29% 30% 25% 24% 25% 23% 25% 24% Implied Retention* 40% 42% 42% 42% 42% 43% 44% 44% *TTM repeating customers as % of year -ago unique customers 3.6 3.9 4.0 4.2 4.5 4.8 5.0 5.2 7.0 7.2 7.4 7.7 8.4 9.0 9.4 9.7 Q2 FY11 Q3 FY11 Q4 FY11 Q1 FY12 Q2 FY12 Q3 FY12 Q4 FY12 Q1 FY13 TTM* Unique Customers (M) New Customers Aquired in Period Customers Repeating from Prior Periods |
 Our unique customer metrics for the core business on a trailing twelve month basis were as follows: On a TTM basis, unique customer count was 14.9 million, reflecting 25% year over year growth of unique customers. First-time unique customers in the TTM period ending September 30, 2012 grew 26% year over year while unique customers transacting from prior periods grew 24% year over year. |
 Historical Revenue Driver Metrics 15 Average Customer Spend: Organic $54 $54 $55 $55 $53 $52 $51 $50 $98 $99 $100 $102 $100 $100 $99 $99 $70 $70 $72 $73 $71 $69 $68 $67 Q2 FY11 Q3 FY11 Q4 FY11 Q1 FY12 Q2 FY12 Q3 FY12 Q4 FY12 Q1 FY13 Average Spend Per Unique Customer (USD) New Repeat Total Q2 FY11 Q3 FY11 Q4 FY11 Q1 FY12 Q2 FY12 Q3 FY12 Q4 FY12 Q1 FY13 Average Spend per Unique Customer $70 $70 $72 $73 $71 $69 $68 $67 Average Spend per New Customer $54 $54 $55 $55 $53 $52 $51 $50 Average Spend per Repeat Customer $98 $99 $100 $102 $100 $100 $99 $99 Y/Y Growth Average Spend per Unique Customer 4% 1% (1%) (6%) (8%) Average Spend per New Customer 2% (2%) (4%) (7%) (9%) Average Spend per Repeat Customer 3% 2% 1% (1%) (3%) FY11-FY16, long-term target of low- to mid- single digit growth in bookings per unique customer. |
 Average spend per unique customer for the core business on a trailing twelve month basis developed as follows: • • • • • Average spend per unique customer during the TTM period ending September 30, 2012 was $67, reflecting an 8% decline year over year. We believe this decline was due to several factors: The near-term drag created by the changes we made in FY12 to drive long-term retention, including reduced in- transaction cross sell; The impact of our success with wholesale partnerships such as FedEx Office and Staples, for which we receive wholesale revenue per order that is on average lower than our direct-to-customer business; and A year-over-year negative impact of currency movements, which impacts this metric, as well as the sub-metrics below. Average spend per new customer acquired in the TTM period was $50, reflecting a 9% decline year over year. This decrease is consistent with the changes described above, as well as our new customer AOV trends which have been down slightly in the past few quarters due to the impact of less aggressive cross-selling and growth of wholesale partnerships. Average spend per customer transacting in prior periods during the TTM period was $99, reflecting a 3% decline year over year. |
 Looking Ahead 16 |
 Outlook Commentary 17 • Revenue range reduced by $10M o Underperformance of European business (adjusted down by about $25M) o Currency outlook (adjusted up by about $15M) • EPS guidance unchanged; actively managing expenses to enable EPS performance in line with FY13 plan o Protecting revenue-generating expenses o Slowing some hiring relative to budget (while still growing headcount year over year in strategic areas) o Reducing some travel expenses relative to budget |
 After the first quarter of fiscal 2013, we are adjusting our full fiscal year 13 guidance as follows: Revenue We are lowering our revenue guidance range by $10M. This reflects two factors: The full fiscal year guidance we initiated last quarter did factor in an expectation for continued weakness in European revenue at the low end of the range. However, now we believe it is prudent to lower our expectation further given our poor performance in the first quarter and the impact that is likely to have on the full year. As a reminder, our December quarter, traditionally our largest of the year, is still ahead of us. This quarter is especially significant in Europe, where a larger percent of our home and family based bookings come from. With that said, we do have an expectation that European organic constant currency growth rates can improve from the 1% we delivered in Q1. We have already seen some improvement in year-over-year bookings growth rates later in the first quarter and into the first couple weeks of October, and we are focused on improving execution. Finally, our expectation is that we can continue to deliver strong growth in North America and Asia Pacific, in line with our prior expectations. EPS We remain committed to delivering EPS in line with our annual plan. As a result, our FY13 EPS guidance remains unchanged. In order to compensate for a reduced revenue outlook, we are actively managing our expenses: • Our operational expectations for European revenue have been lowered by about $25M for the full year. • In general, we plan to protect revenue-generating expenses • Currency has moved in our favor since we initially gave guidance in July. We are adjusting our expectations to reflect an expected $15M benefit for the year. • We are slowing some hiring relative to budget, though we are still expecting to grow headcount year over year • We are also reducing some travel and other discretionary expenses relative to budget |
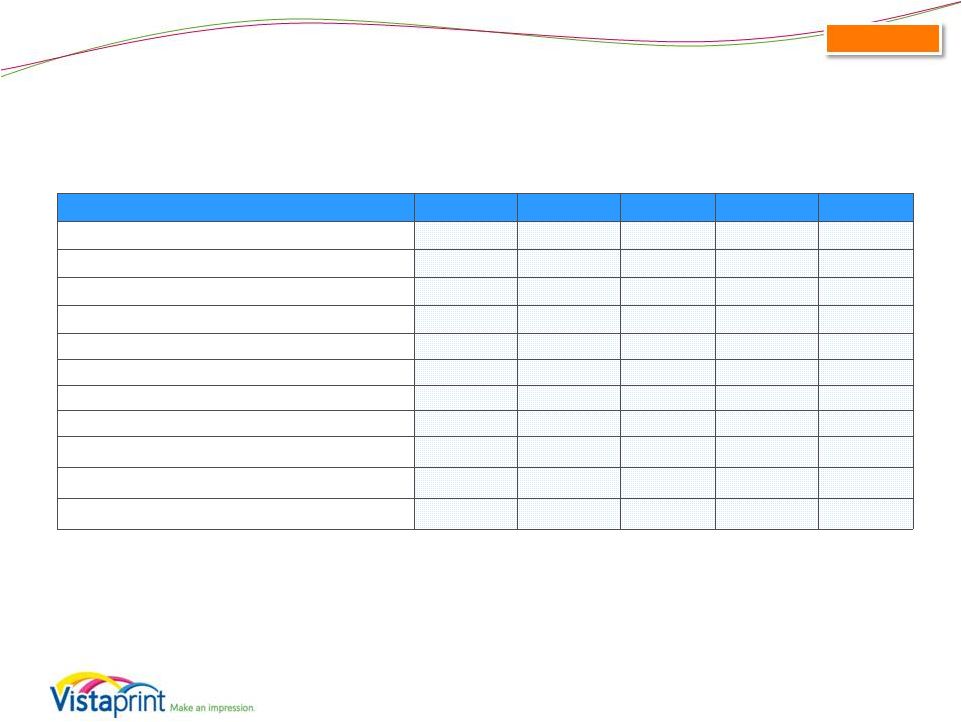
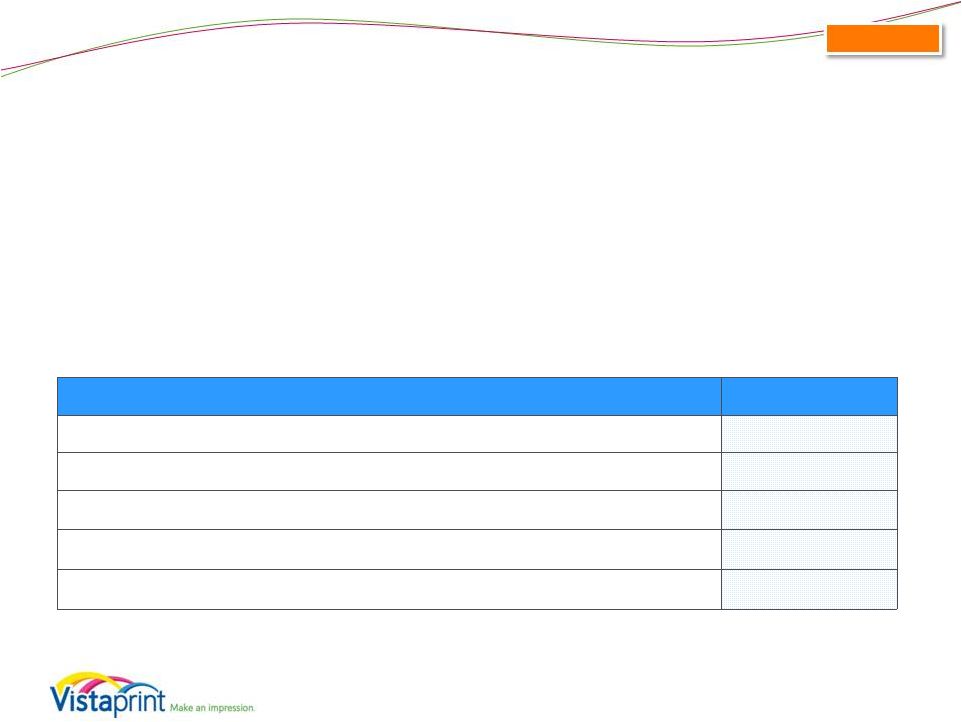
 Financial Guidance* (as of October 25, 2012) The Company is providing the following assumptions to facilitate non-GAAP adjusted net income per diluted share comparisons that exclude share- based compensation related expenses, amortization of acquired intangible assets and tax charges related to the alignment of IP with our global operations: FY13 ending 06/30/2013 Q2 FY13 ending 12/31/2012 Revenue $1,165 - $1,215 $335 - $355 Revenue growth from FY 2012 period 14% - 19% 12% - 18% Organic constant currency revenue growth estimate 12% - 17% 11% - 17% GAAP EPS $0.40 - $0.70 EPS decline from FY 2012 period (65%) - (38%) GAAP share count 35.3 million FY13 ending 06/30/2013 Non-GAAP adjusted EPS $1.62 - $1.92 EPS decline from FY 2012 period (17%) – (2%) Non-GAAP share count 36.1 million Non-GAAP exclusions $45.1 * Millions, except share and per share amounts and as noted 18 Consolidated |
 The table above is Vistaprint’s financial guidance as of October 25, 2012. This guidance reflects our expected market opportunity and our ongoing commitment to making investments for growth and competitive advantage. Vistaprint specifically disclaims any obligation to update any forward-looking statements, which should not be relied upon as representing our expectations or beliefs as of any date subsequent to October 25, 2012, the date of this presentation. Our expectations for the full fiscal year ending June 30, 2013 are as follows: • • Our revenue expectations for the quarter ending December 31, 2012, the second quarter of fiscal year 2013, are expected to be in the range of $335 million to $355 million, an increase of 12% to 18% in U.S. dollars, and 14% to 20% in constant currencies. We expect organic constant-currency growth of 11% to 17% year over year. For full year revenue, our organic constant-currency growth expectations are 12% to 17% growth, and consolidated constant-currency growth expectations are 15% to 20%. If exchange rates stay the same as they were for the 30-day average in mid-October 2012, we would expect consolidated revenue to be $1,165 million to $1,215 million, an increase of 14% to 19% year over year in U.S. dollars. Of course, actual revenue will depend in part on currency exchange rate development throughout the fiscal year. Full fiscal year GAAP EPS, on a diluted basis, is expected to be between $0.40 and $0.70 based on about 35.3 million weighted average shares outstanding. |
 Financial Guidance* (as of October 25, 2012) The Company is providing the following assumptions to facilitate non-GAAP adjusted net income per diluted share comparisons that exclude share- based compensation related expenses, amortization of acquired intangible assets and tax charges related to the alignment of IP with our global operations: FY13 ending 06/30/2013 Q2 FY13 ending 12/31/2012 Revenue $1,165 - $1,215 $335 - $355 Revenue growth from FY 2012 period 14% - 19% 12% - 18% Organic constant currency revenue growth estimate 12% - 17% 11% - 17% GAAP EPS $0.40 - $0.70 EPS decline from FY 2012 period (65%) - (38%) GAAP share count 35.3 million FY13 ending 06/30/2013 Non-GAAP adjusted EPS $1.62 - $1.92 EPS decline from FY 2012 period (17%) – (2%) Non-GAAP share count 36.1 million Non-GAAP exclusions $45.1 * Millions, except share and per share amounts and as noted 19 Consolidated |
 We are providing the assumptions noted on our guidance slide to facilitate comparisons with non-GAAP adjusted net income per diluted share. • Based on these assumptions, for the full fiscal year 2013, non-GAAP adjusted EPS is expected to be between $1.62 and $1.92, and excludes expected acquisition-related amortization of intangible assets of approximately $7.6 million; share- based compensation expense and its related tax effect of approximately $35.3 million; charges related to the alignment of acquisition-related intellectual property with global operations of approximately $2.2 million; and 36.1 million shares outstanding. • We expect these expenses which are excluded from non-GAAP results to be fairly evenly distributed throughout the fiscal year with the exception of the alignment of the acquisition-related IP which is recorded based on the timing of how the profits come in on a quarterly basis. |
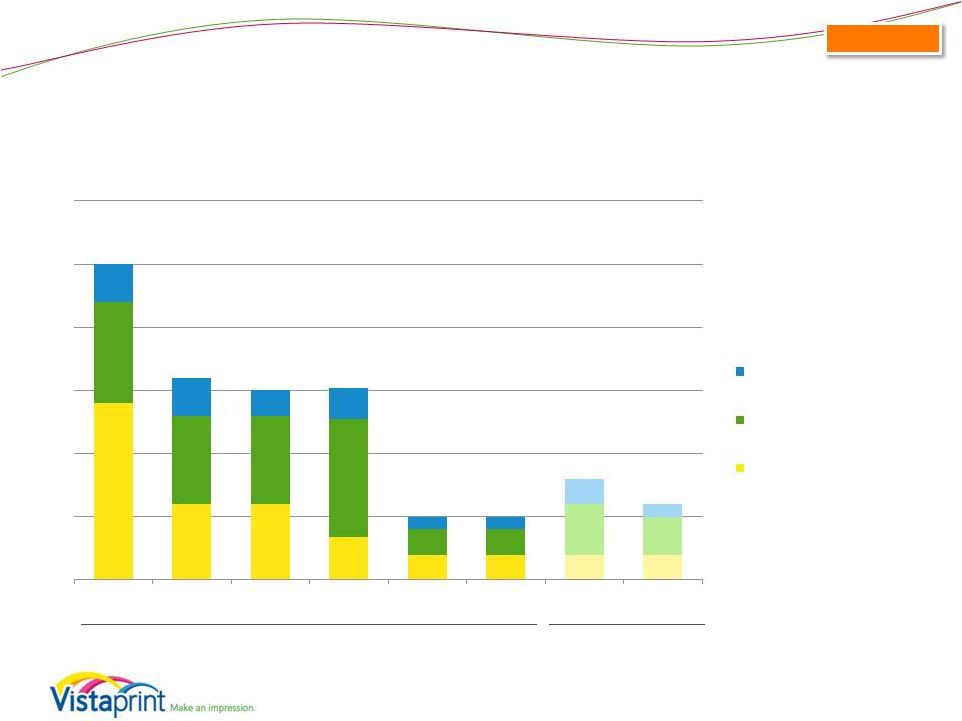 Capital Expenditures Guidance (as of October 25, 2012) Expressed as percent of revenue • $80M - $95M Actuals Guidance $63M $63M $76M $95M $80M $101M $37M 20 $46M 14% 6% 6% 3% 2% 2% 2% 2% 8% 7% 7% 9% 2% 2% 4% 3% 3% 3% 2% 3% 1% 1% 2% 1% FY 2007 FY 2008 FY 2009 FY 2010 FY 2011 FY 2012 FY 2013- High FY 2013- Low Other Land and Facilities Manufacturing & Automation Equipment 25% 16% 15% 5% 8% 15% 5% 7% • 7% - 8% of revenue guidance midpoint Consolidated FY 2013 Guidance: |
 This chart shows capital expenditures in dollars and as a percentage of revenue for the past several years, and also shows our expectations for fiscal 2013 at the midpoint of our revenue guidance range. We expect capital expenditures as a percentage of revenue and in absolute dollars to increase in fiscal 2013 over 2012. For FY 2013, we have narrowed our previous guidance range and now expect capital expenditures of $80 to $95 million, or 7% to 8% of our revenue guidance midpoint. This guidance includes the expansion of our Venlo production facility, capital expenditures to create a small production facility in India, and other IT and manufacturing equipment requirements to support our growth plans. |
 Commentary on Revenue and EPS Seasonality 21 • As previously noted, no longer provide quarterly EPS guidance • Expect our typical seasonality trends to continue o Albumprinter increases seasonal effect of December quarter • Expect to deliver majority of annual GAAP EPS in our second quarter o In line with recent years • Will provide quarterly revenue guidance o Quarterly updates on our annual revenue and EPS guidance |
 With one quarter behind us, and the seasonality of our upcoming second quarter, we want to provide some color on the expected trends in the business: We will continue to provide annual revenue and EPS guidance, with quarterly updates. We will also provide quarterly revenue guidance. • We expect the seasonal revenue trends in our core business to continue, notwithstanding recent weakness in Europe, which typically has a higher percentage of home and family oriented revenue than other regions. The addition of Albumprinter increases the seasonal nature of our business. • We expect the recent trend of delivering a majority of annual GAAP earnings during our second quarter to continue in FY 2013. The additional volume of our holiday business adds significant volume through our facilities, and so we expect to see higher gross margin in the second quarter due to the absorption of fixed costs. Additionally, we expect our quarterly tax provision to match the seasonality of our profits as we are required to book the provision each quarter based on the percentage completion of forecasted profits for the year. |
 Summary • Mixed results, most notably poor EU performance o Addressing issues, but this is a longer term effort • Strong progress in all other parts of the business o Value proposition, LTV advertising, manufacturing o Foundations for future in digital, photo books & Asia o Great results in North America • Believe we have the right strategy to drive o Long-term revenue and profit growth o Competitive advantage o Significant value for long term shareholders 22 |
 In summary, this quarter’s results were mixed. The notable shortcoming was our poor revenue performance in Europe. We recognize the need to address this issue and are making plans to do so, while being realistic that this will not be a short-term turnaround. In almost every other part of our business we made strong progress relative to our objectives. Strategically speaking, our progress included improving our customer value proposition, investing in life time value based advertising, improving our manufacturing and supply chain capabilities, expanding our technology resources and laying foundations for future growth in digital, home and family and Asian markets. Combined with strong tactical execution this strategy has meant continued strength in our largest geographic market, North America, whose growth rates have stabilized over the past year. Our strategic progress and the North American results give us confidence in the approach we are taking to drive revenue and profit growth worldwide. We will continue to move these initiatives forward, and believe that we are building a solid future of growth, competitive advantage and significant value for our long-term shareholders. |
 Q&A Session Please go to the Investor Relations section of www.vistaprint.com for the live Q&A call at 5:15 pm EDT on October 25, 2012 |
 Q1 Fiscal Year 2013 Financial and Operating Results Supplement |
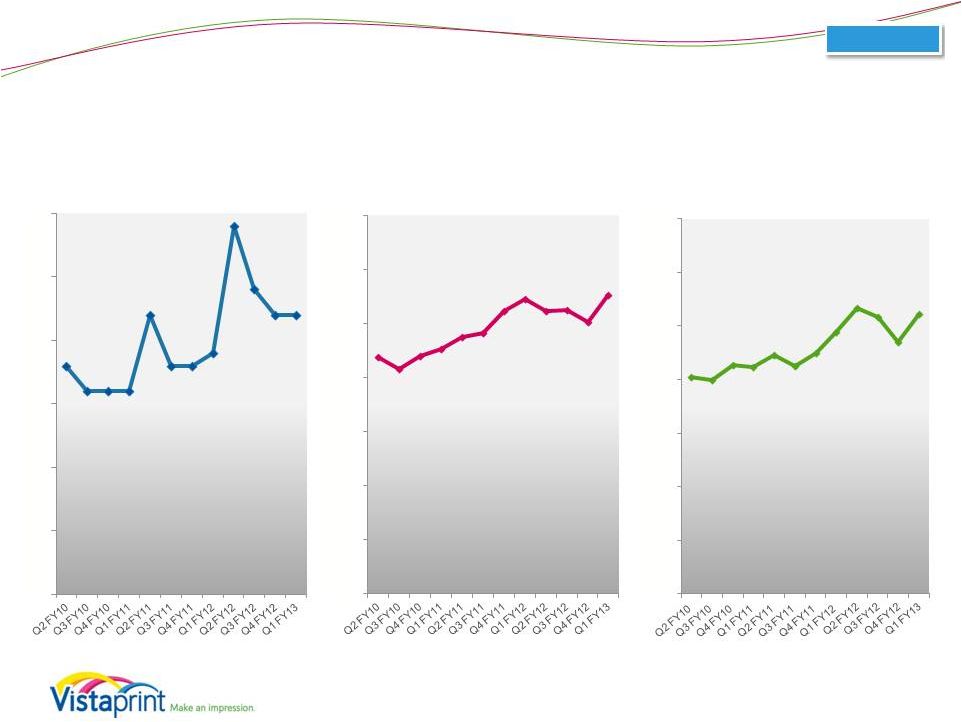
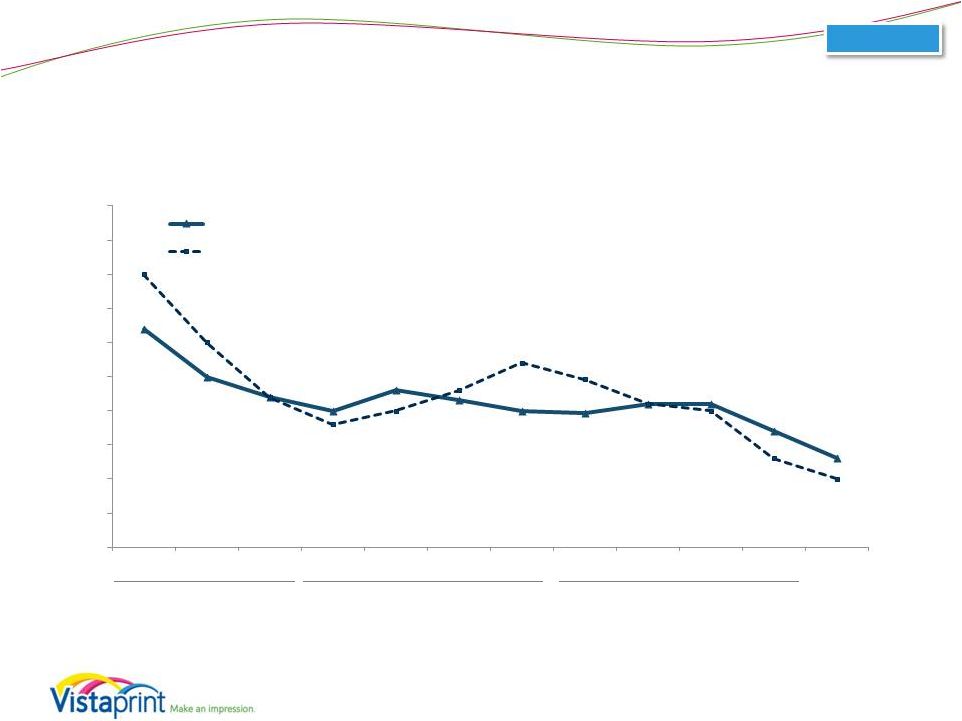 Total Company Organic Growth Rates (Excludes Albumprinter and Webs) Note: Constant currency basis is estimated by translating all non-U.S. Dollar denominated revenue generated in the current period using the prior year period’s average exchange rate for each currency to the U.S. Dollar. Please see reconciliation to reported revenue growth rates at the end of this presentation. 10% reported 13% constant-currency FY10 28% constant-currency growth 25 FY11 22% constant-currency growth FY12 20% constant-currency growth Organic 0% 5% 10% 15% 20% 25% 30% 35% 40% 45% 50% Q2 FY10 Q3 FY10 Q4 FY10 Q1 FY11 Q2 FY11 Q3 FY11 Q4 FY11 Q1 FY12 Q2 FY12 Q3 FY12 Q4 FY12 Q1 FY13 Constant-Currency Reported |
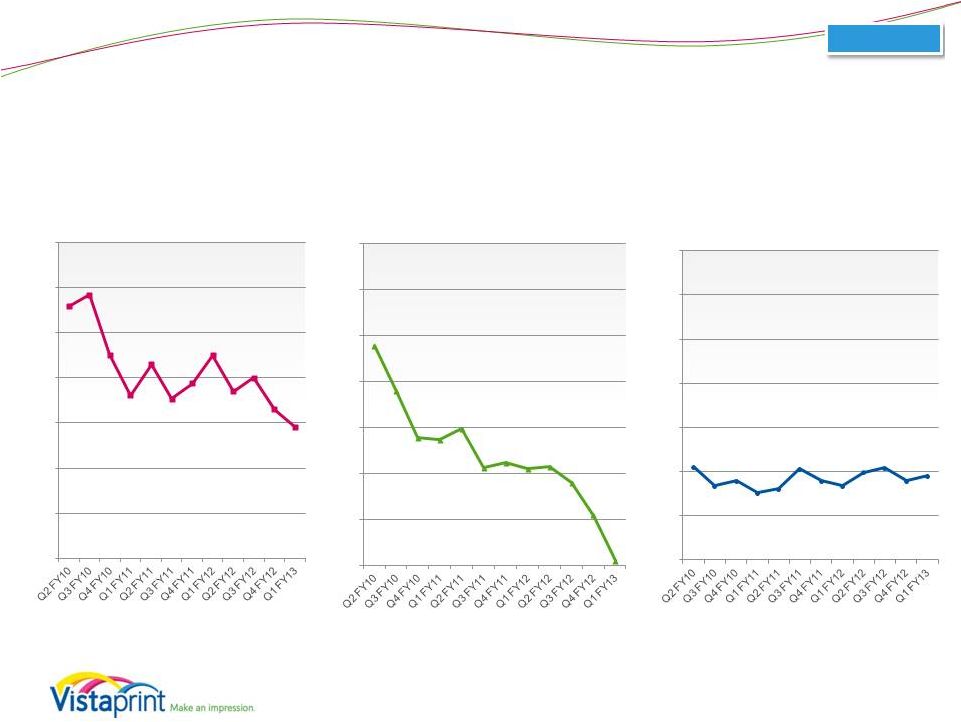 Segment Revenue Growth Rates Constant Currency Organic 26 Organic 56% 58% 45% 36% 43% 35% 39% 45% 37% 40% 33% 29% 0% 10% 20% 30% 40% 50% 60% 70% APAC 48% 38% 28% 27% 30% 21% 22% 21% 22% 18% 11% 1% 0% 10% 20% 30% 40% 50% 60% 70% Europe 21% 17% 18% 15% 16% 21% 18% 17% 20% 21% 18% 19% 0% 10% 20% 30% 40% 50% 60% 70% North America |
 Gross Margin and Gross Profit 27 FY10 64.2% FY11 64.8% FY12 65.2% Consolidated $127 $106 $105 $108 $155 $133 $133 $134 $200 $169 $162 $163 65.1% 64.1% 63.6% 63.1% 66.3% 65.3% 63.9% 63.2% 66.8% 65.5% 64.6% 65.0% Q2 FY10 Q3 FY10 Q4 FY10 Q1 FY11 Q2 FY11 Q3 FY11 Q4 FY11 Q1 FY12 Q2 FY12 Q3 FY12 Q4 FY12 Q1 FY13 Gross Profit (millions) GM % |
 GAAP Net Income (Loss) and Net Margin 28 FY10 $68 FY11 $82 FY12 $44 Consolidated $27 $16 $12 $11 $34 $23 $14 $8 $32 $0 $4 $(2) 9.7% 7.1% 6.3% 14.5% 11.3% 6.9% 3.8% 10.6% 0.1% 1.5% -0.7% -5.0% 0.0% 5.0% 10.0% 15.0% $(2) $3 $8 $13 $18 $23 $28 $33 $38 $43 $48 $53 $58 Q2 FY10 Q3 FY10 Q4 FY10 Q1 FY11 Q2 FY11 Q3 FY11 Q4 FY11 Q1 FY12 Q2 FY12 Q3 FY12 Q4 FY12 Q1 FY13 GAAP Net Income (loss), in millions GAAP Net Margin 13.8% |
 Non-GAAP Adjusted Net Income* and Adjusted Net Margin 29 FY10 $91 FY11 $105 FY12 $77 Consolidated $34 $21 $17 $16 $40 $28 $20 $13 $38 $11 $15 $9 17.3% 12.9% 10.5% 9.6% 17.3% 13.8% 9.4% 6.1% 12.6% 4.4% 5.9% 3.5% Q2 FY10 Q3 FY10 Q4 FY10 Q1 FY11 Q2 FY11 Q3 FY11 Q4 FY11 Q1 FY12 Q2 FY12 Q3 FY12 Q4 FY12 Q1 FY13 Non-GAAP Adjusted Net Income (millions) Non-GAAP Adjusted Net Margin *Non-GAAP adjusted net income for all periods presented excludes the impact of share-based compensation expense and its related tax effect, amortization of acquired intangibles, and charges related to the alignment of Webs IP with our global structure. Please see reconciliation to GAAP net income at the end of this presentation. |
 Q1 Income Statement Comparison to Prior Year (as a percentage of revenue) 30 Consolidated 0.1% 4.6% 10.1% 10.1% 15.0% 12.6% 39.8% 35.9% 35.0% 36.8% Q1 FY2013 Q1 FY2012 Cost of revenue Marketing and selling Technology and development General and administrative Income from operations |
 Q1 Income Statement Comparison to Prior Quarter (as a percentage of revenue) 31 0.1% 2.0% 10.1% 11.5% 15.0% 14.8% 39.8% 36.3% 35.0% 35.4% Q1 FY2013 Q4 FY2012 Cost of revenue Marketing and selling Technology and development General and administrative Income from operations Consolidated |
 Share-Based Compensation* (millions) * Share-based compensation (SBC) expense includes SBC-related tax adjustment. 32 FY10 $23.2 FY11 $22.4 FY12 $26.1 $6.7 $5.3 $5.7 $5.6 $6.4 $5.3 $5.1 $4.9 $5.0 $7.6 $8.6 $8.4 Q2 FY10 Q3 FY10 Q4 FY10 Q1 FY11 Q2 FY11 Q3 FY11 Q4 FY11 Q1 FY12 Q2 FY12 Q3 FY12 Q4 FY12 Q1 FY13 Consolidated |
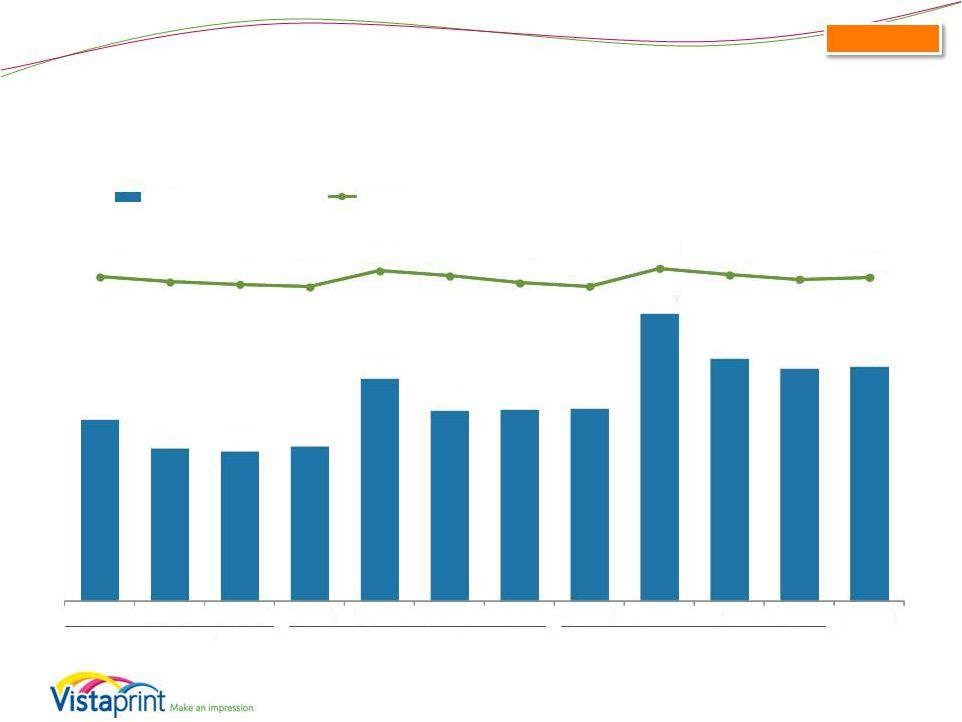
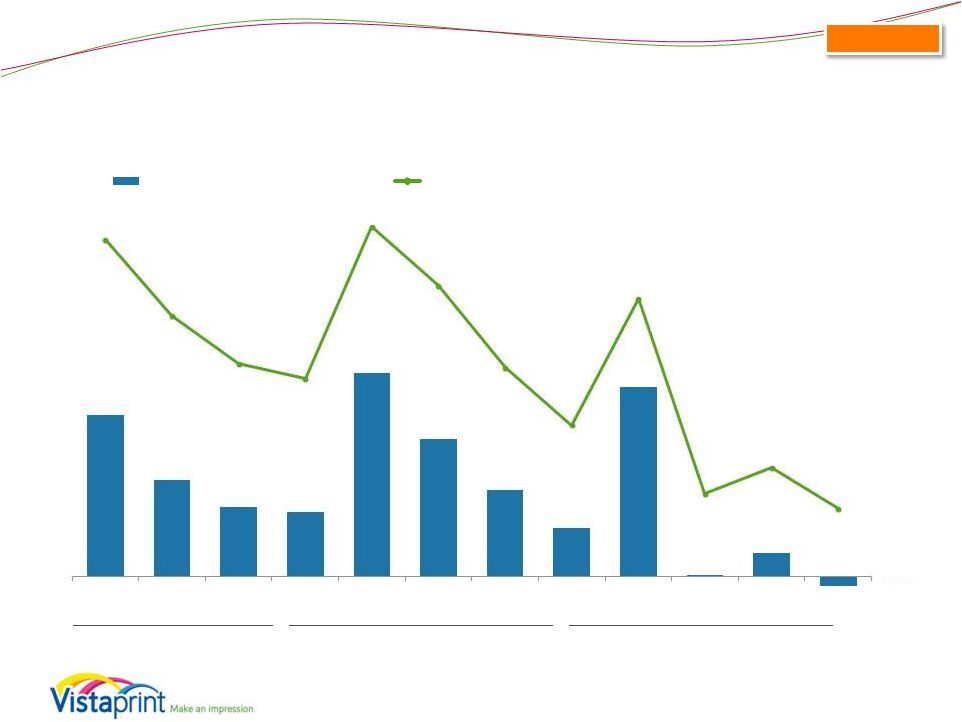
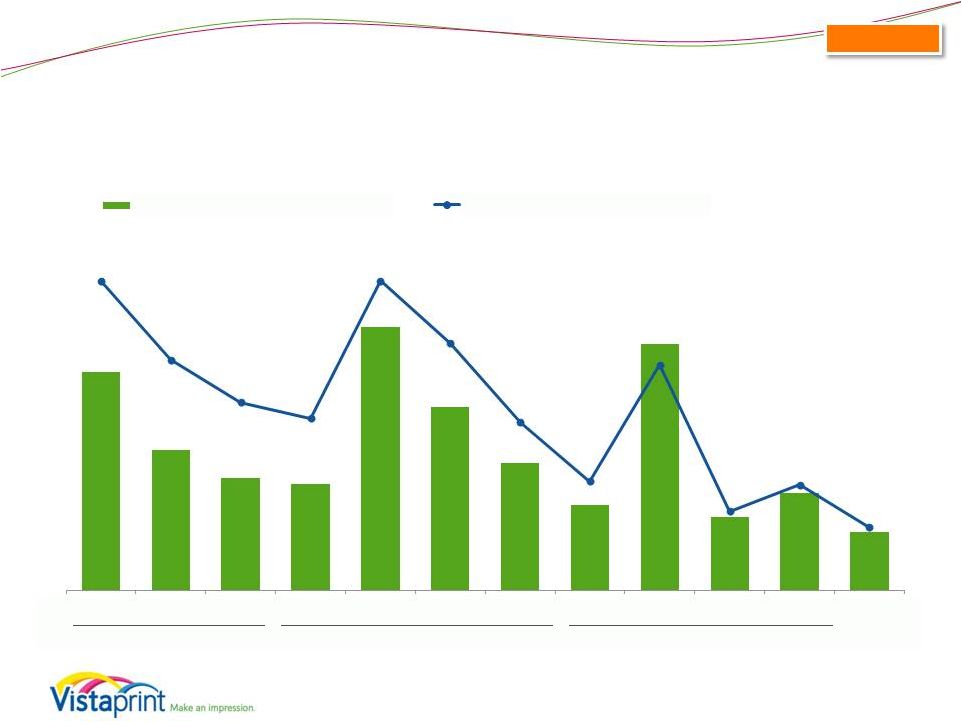
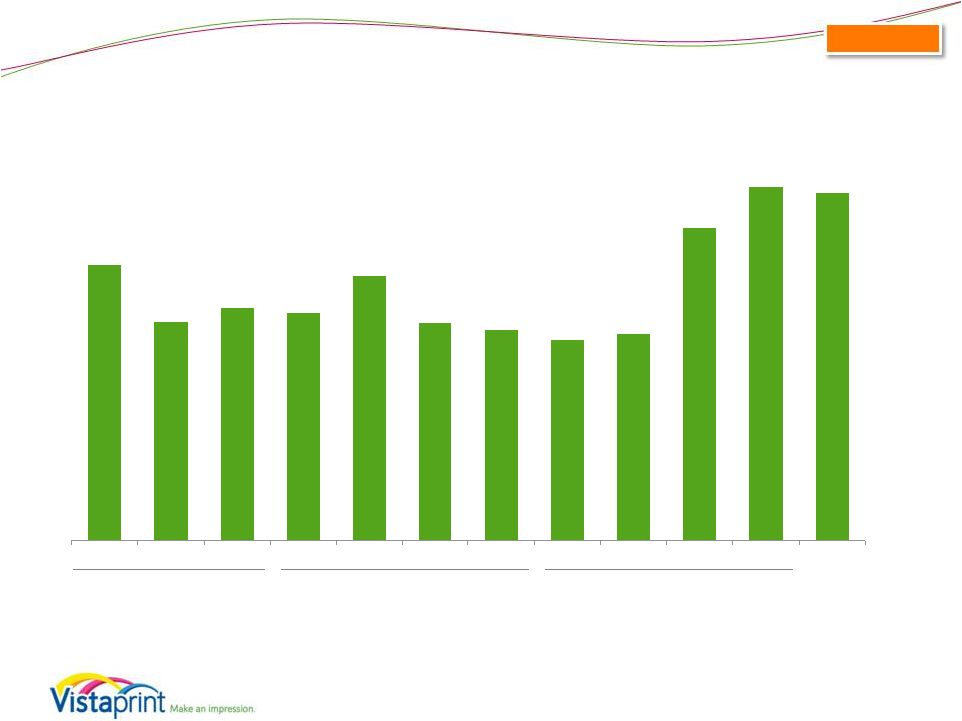
 Revenue Seasonality (Excludes Albumprinter and Webs) * Home and family revenue is calculated using a product format-based approach 33 $195 $166 $164 $170 $234 $204 $209 $212 $284 $244 $235 $233 Q2 FY10 Q3 FY10 Q4 FY10 Q1 FY11 Q2 FY11 Q3 FY11 Q4 FY11 Q1 FY12 Q2 FY12 Q3 FY12 Q4 FY12 Q1 FY13 Small Business Marketing Home and Family* Organic |
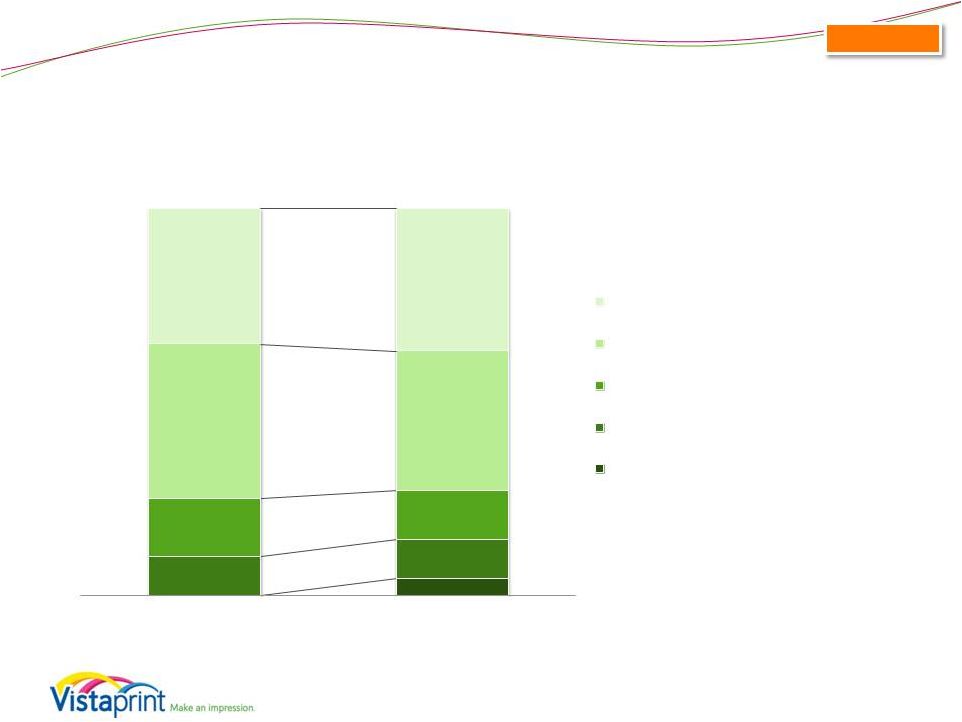
 Q1 FY 2013 Bookings by Marketing Channel (excludes Albumprinter and Webs bookings) ~2.2 million new customers in Q1 FY2013 Paid Search Other Channels and Partners 3 Party Permission- Based email Direct URL Type-In Paid Search Other Channels and Partners Our Own Permission-Based email Direct URL Type- In First-time Order Bookings: 32% Repeat Order Bookings: 68% Our Own Permission-Based email 34 Organic rd |
 Balance Sheet Highlights Balance Sheet highlights, in millions, at period end 09/30/12 06/30/12 3/31/12 12/31/11 09/30/11 Total assets $620.5 $592.4 $588.0 $590.3 $469.0 Cash and cash equivalents $59.3 $62.2 $52.1 $67.5 $161.1 Total current assets $114.6 $115.6 $103.5 $123.7 $194.0 Goodwill and intangible assets $179.5 $180.7 $192.0 $196.6 $5.1 Total liabilities $421.3 $403.1 $306.0 $322.5 $108.8 Current liabilities $129.4 $142.0 $148.1 $166.2 $97.1 Long-term debt $259.3 $229.0 $126.5 $140.5 $- Shareholders’ Equity $199.2 $189.3 $281.9 $267.8 $360.2 Treasury shares (in millions) 15.7 15.8 13.0 13.1 9.8 35 Consolidated |
 Long-Term Debt Availability under our credit facility 09/30/12 Maximum aggregate available borrowing amounts $387.5M Outstanding borrowings of credit facility ($259.3M) Remaining amount $128.2M ($39.9M) Amount available borrowing as of September 30, 2012 $88.3M 36 Consolidated * Our borrowing ability can be limited by our debt covenants each quarter. These covenants may limit our borrowing capacity depending on our leverage, other indebtedness, such as installment obligations and letters of credit, and other factors that are outlined in the credit agreement filed as an exhibit in our Form 8-K filed on October 26, 2011. • Credit facility in place with aggregate loan commitments of $387.5M • Interest rate is LIBOR plus 1.25% - 1.50% • Currently in compliance with all covenants. Key covenants are: o Senior leverage ratio not to exceed 2.75x TTM EBITDA o Total leverage ratio not to exceed 3.5x TTM EBITDA o Interest coverage ratio of at least 3.0 o Total cash/debt use for share repurchases of $400M since inception of credit facility (10/21/2011) Limitations to borrowing due to debt covenants and other obligations* |
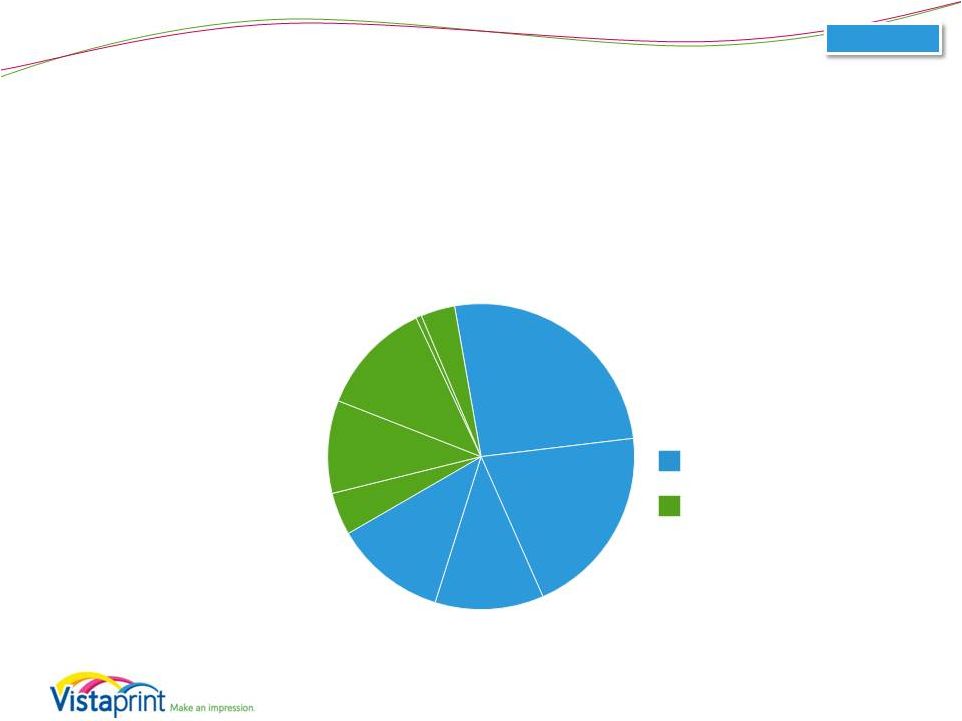
 Q1 FY13 Capital Expenditure Breakdown Q1 CapEx: $27.8M 1 3 2 37 Consolidated 56% 22% 22% Land/Facilities Mfg & Automation Equipment Other 1 Land, building and construction, leasehold improvements, and furniture and fixtures 2 All manufacturing and automation equipment, including offset and digital print lines, other printing equipment, pre-press and post-press equipment such as cutters, and automation equipment 3 IT infrastructure, software and office equipment |
 Appendix Including a Reconciliation of GAAP to Non-GAAP Financial Measures |
 About non-GAAP financial measures To supplement Vistaprint’s consolidated financial statements presented in accordance with U.S. generally accepted accounting principles, or GAAP, Vistaprint has used the following measures defined as non-GAAP financial measures by Securities and Exchange Commission, or SEC, rules: non-GAAP adjusted net income, non-GAAP adjusted net income per diluted share, free cash flow, constant-currency revenue growth, and constant-currency organic revenue growth. The items excluded from the non-GAAP adjusted net income measurements are share-based compensation expense and its related tax effect, amortization of acquisition-related intangibles, and tax charges related to the alignment of acquisition- related intellectual property with global operations. Free cash flow is defined as net cash provided by operating activities less purchases of property, plant and equipment, purchases of intangible assets, and capitalization of software and website development costs. Constant-currency revenue growth is estimated by translating all non-U.S. dollar denominated revenue generated in the current period using the prior year period’s average exchange rate for each currency to the U.S. dollar. Constant-currency organic revenue growth excludes the impact of currency as defined above and revenue from acquired companies. The presentation of non-GAAP financial information is not intended to be considered in isolation or as a substitute for the financial information prepared and presented in accordance with GAAP. For more information on these non-GAAP financial measures, please see the tables captioned “Reconciliations of Non-GAAP Financial Measures” included at the end of this release. The tables have more details on the GAAP financial measures that are most directly comparable to non-GAAP financial measures and the related reconciliation between these financial measures. (continued on next page) 39 |
 About non-GAAP financial measures continued… Vistaprint’s management believes that these non-GAAP financial measures provide meaningful supplemental information in assessing our performance and when forecasting and analyzing future periods. These non-GAAP financial measures also have facilitated management’s internal comparisons to Vistaprint’s historical performance and our competitors’ operating results. Management provides these non-GAAP financial measures as a courtesy to investors. However, to gain a more complete understanding of the company’s financial performance, management does (and investors should) rely upon GAAP statements of operations and cash flow. 40 |
 Reconciliation: GAAP to Non-GAAP Results FY 2003 FY 2004 FY 2005* FY 2006 FY 2007 FY 2008 FY 2009 FY2010 FY2011 FY2012 GAAP Net Income $473 $3,440 ($16,218) $19,234 $27,143 $39,831 $55,686 $67,741 $82,109 $43,994 Share-based compensation and related tax effect $0 $0 $0 $4,850 $8,765 $15,275 $20,177 $23,156 $22,400 $26,060 Amortization of acquired intangible assets - - - - - - - - - $5,754 Webs IP transfer - - - - - - - - - $1,235 Non-GAAP Adjusted Net Income $473 $3,440 $4,782 $23,146 $35,908 $55,106 $75,863 $90,897 $104,509 $77,043 Net Income – Annual ($ in thousands) *Fiscal 2005 non-GAAP results exclude a contract termination payment of $21mm Note: share-based compensation expense includes tax effects 41 |
 Reconciliation: GAAP to Non-GAAP Results Net Income – Quarterly ($ in thousands) 42 . Fiscal Year 2010 Fiscal Year 2011 Fiscal Year 2012 Fiscal Year 2013 Q2 Q3 Q4 Q1 Q2 Q3 Q4 Q1 Q2 Q3 Q4 Q1 GAAP Net Income $26,948 $16,167 $11,650 $10,781 $34,014 $22,917 $14,397 $8,172 $31,697 $274 $3,851 $(1,696) Share-based compensation and related tax effect $6,679 $5,315 $5,662 $5,550 $6,435 $5,285 $5,129 $4,876 $5,021 $7,566 $8,596 $8,445 Amortization of acquired intangible assets - - - - - - - - $1,148 $2,381 $2,225 $2,178 Webs IP Transfer - - - - - - - - - $1,017 $218 - Non-GAAP Adjusted Net Income $33,627 $21,482 $17,312 $16,331 $40,449 $28,202 $19,526 $13,048 $37,866 $11,238 $14,890 $8,927 |
 Diluted Earnings Per Share - Annual Reconciliation: GAAP to Non-GAAP Results 43 FY 2006 FY 2007 FY 2008 FY 2009 FY2010 FY2011 FY2012 GAAP Net Income Per Share $0.45 $0.60 $0.87 $1.25 $1.49 $1.83 $1.13 Share-based Compensation Per Share* $0.09 $0.18 $0.31 $0.43 $0.49 $0.47 $0.65 Amortization of acquired intangible assets - - - - - - $0.14 Webs IP Transfer - - - - - - $0.03 Non-GAAP Adjusted Net Income Per Share $0.54 $0.78 $1.18 $1.68 $1.98 $2.30 $1.95 Weighted average shares used in computing (millions) 42.651 45.825 46.780 45.099 45.989 45.448 39.426 *Note: share-based compensation expense includes tax effects |
 Reconciliation: GAAP to Non-GAAP Results Earnings Per Diluted Share - Quarterly *Note: share-based compensation expense includes tax effects 44 . Fiscal Year 2010 Fiscal Year 2011 Fiscal Year 2012 Fiscal Year 2013 Q2 Q3 Q4 Q1 Q2 Q3 Q4 Q1 Q2 Q3 Q4 Q1 GAAP Net Income Per Share $0.59 $0.35 $0.26 $0.24 $0.75 $0.51 $0.32 $0.19 $0.82 $0.01 $0.10 $(0.05) Share-based Compensation Per Share* $0.14 $0.11 $0.12 $0.12 $0.14 $0.12 $0.11 $0.12 $0.12 $0.20 $0.23 $0.24 Amortization of acquired intangible assets - - - - - - - - $0.03 $0.06 $0.06 $0.06 Webs IP Transfer - - - - - - - - - $0.02 $0.01 - Non-GAAP Adjusted Net Income Per Share $0.73 $0.46 $0.38 $0.36 $0.89 $0.63 $0.43 $0.31 $0.97 $0.29 $0.40 $0.25 Weighted average shares used in computing Non- GAAP (millions) 46.027 46.231 46.136 45.704 45.625 45.079 45.156 42.569 39.041 38.346 37.620 35.793 |
 Reconciliation: Free Cash Flow (in thousands) 45 Three Months Ended September 30, 2012 2011 Net cash provided by operating activities $ 6,650 $ 30,541 Purchases of property, plant and equipment (27,759) (10,998) Purchases of intangibles assets (9) (89) Capitalization of software and website development costs (1,301) (1,682) Free cash flow $ (22,419) $ 17,772 |
 Reconciliation: Constant-Currency Revenue Growth Rates Quarterly 46 Q2 FY2010 Q3 FY10 Q4 FY10 Q1 FY11 Q2 FY11 Q3 FY11 Q4 FY11 Q1 FY12 Q2 FY12 Q3 FY12 Q4 FY12 Q1 FY13 Reported revenue growth 40% 30% 22% 18% 20% 23% 27% 25% 28% 26% 20% 18% Currency impact (8%) (5%) 0% 2% 3% (1%) (7%) (5%) 0% 2% 5% 5% Revenue growth in constant currency 32% 25% 22% 20% 23% 22% 20% 20% 28% 28% 25% 23% Impact of acquisitions to growth in constant currency (7%) (7%) (8%) (10%) Revenue growth rate, ex acquisitions, in constant currency 32% 25% 22% 20% 23% 22% 20% 20% 21% 21% 17% 13% Note: Constant-currency revenue growth is estimated by translating all non-U.S. dollar denominated revenue generated in the current period using the prior year period’s average exchange rate for each currency to the U.S. dollar. |
 Reconciliation: Constant-Currency Revenue Growth Rates Annual 47 FY2009 FY2010 FY2011 FY2012 Reported revenue growth 29% 30% 22% 25% Currency impact 7% (2%) - 0% Revenue growth in constant currency 36% 28% 22% 25% Impact of acquisition to growth in constant currency - - - (5%) Revenue growth rate, ex acquisition, in constant currency 36% 28% 22% 20% Note: Constant-currency revenue growth is estimated by translating all non-U.S. dollar denominated revenue generated in the current period using the prior year period’s average exchange rate for each currency to the U.S. dollar. |
 Reconciliation: Non-U.S. Constant-Currency Revenue Growth Rates and Reported Growth Rates, ex Albumprinter 48 Non-US Revenue Growth Q2 FY10 Q3 FY10 Q4 FY10 Q1 FY11 Q2 FY11 Q3 FY11 Q4 FY11 Q1 FY12 Q2 FY12 Q3 FY12 Q4 FY12 Q1 FY13 Non-US reported revenue growth 68% 55% 30% 23% 26% 27% 41% 35% 36% 31% 20% 15% Currency impact (20%) (14%) 1% 7% 6% (2%) (16%) (11%) - 3% 10% 10% Non-US revenue growth in constant currency 48% 41% 31% 30% 32% 25% 25% 24% 36% 34% 30% 25% Impact of acquisition to non- US growth in constant currency - - - - - - - - (13%) (13%) (15%) (18%) Non-US organic growth in constant currency 48% 41% 31% 30% 32% 25% 25% 24% 23% 21% 15% 7% Note: Constant-currency revenue growth is estimated by translating all non-U.S. dollar denominated revenue generated in the current period using the prior year period’s average exchange rate for each currency to the U.S. dollar. |
 Reconciliation: Constant-Currency Revenue Growth Rates and Reported Growth Rates (U.S. v. Non-U.S.) 49 Note: Constant-currency revenue growth is estimated by translating all non-U.S. dollar denominated revenue generated in the current period using the prior year period’s average exchange rate for each currency to the U.S. dollar. Q1 FY2013 US Non-US Total Company Reported revenue growth 21% 15% 18% Currency impact - 10% 5% Revenue growth in constant currency 21% 25% 23% Impact of acquisition to growth in constant currency (2%) (18%) (10%) Revenue growth rate, ex acquisition, in constant currency 19% 7% 13% |
 Reconciliation: Geographic Segment Constant-Currency Revenue Growth Rates and Reported Growth Rates 50 Note: Constant-currency revenue growth is estimated by translating all non-U.S. dollar denominated revenue generated in the current period using the prior year period’s average exchange rate for each currency to the U.S. dollar. Q1 FY2013 North America Europe Asia-Pacific Total Company Reported revenue growth 22% 12% 28% 18% Currency impact -% 11% 1% 5% Revenue growth in constant currency 22% 23% 29% 23% |