 Q2 Fiscal Year 2013 Earnings Presentation, Commentary & Financial Results Supplement January 31, 2013 Exhibit 99.2 |
 This document is Vistaprint’s second quarter fiscal year 2013 earnings commentary. This document contains slides and accompanying comments in the “notes” section below each slide. |
 Safe Harbor Statement 2 This presentation and the accompanying notes contain statements about our future expectations, plans and prospects of our business that constitute forward-looking statements for purposes of the safe harbor provisions under the Private Securities Litigation Reform Act of 1995, including but not limited to our financial guidance, outlook, expectations, and investment areas for the third quarter and fiscal year 2013; our planned investments in our business and the anticipated effects of those investments; our operational growth strategy, our 2016 financial targets, and the anticipated development of our business and financial results in response to our strategy; and the anticipated growth and development of our business and markets, especially in Europe. Forward-looking projections and expectations are inherently uncertain, are based on assumptions and judgments by management, and may turn out to be wrong. Our actual results may differ materially from those indicated by these forward-looking statements as a result of various important factors, including but not limited to flaws in the assumptions and judgments upon which our projections and guidance are based; our failure to execute our strategy; our failure to make the investments in our business that we plan to make or the failure of those investments to have the effects that we expect; our failure to identify and address the causes of our revenue weakness in Europe; our failure to acquire new customers and enter new markets, retain our current customers, and sell more products to current and new customers; the willingness of purchasers of marketing services and products to shop online; currency fluctuations that affect our revenues and costs; costs and disruptions caused by acquisitions; the failure of our acquired businesses to perform as expected; difficulties or higher than anticipated costs in integrating the systems and operations of our acquired businesses into our systems and operations; unanticipated changes in our market, customers or business; our failure to promote and strengthen our brand; the failure of our current and new marketing channels to attract customers; our failure to manage the growth, changes, and complexity of our business and expand our operations; competitive pressures; our failure to maintain compliance with the financial covenants in our revolving credit facility or to pay our debts when due; costs and judgments resulting from litigation; changes in the laws and regulations or in the interpretations of laws or regulations to which we are subject, including tax laws, or the institution of new laws or regulations that affect our business; and general economic conditions. You can also find other factors described in our Form 10-Q for the fiscal quarter ended September 30, 2012 and the other documents we periodically file with the U.S. Securities and Exchange Commission. |
 Please read the above safe harbor statement. Additionally, a detailed reconciliation of GAAP and non-GAAP measures is posted in the appendix of the Q2 fiscal 2013 earnings presentation that accompanies these remarks. |
 Presentation Organization & Call Details 3 Presentation Organization: • Quarterly review and update on initiatives • Q2 FY13 operating and financial results • Looking ahead to Q3 and remainder of fiscal year • Long-term outlook commentary • Supplementary information • Reconciliation of GAAP to Non-GAAP results Live Q&A Session: • 5:15 p.m. Eastern • Link from the IR section of www.vistaprint.com • Hosted by: Robert Keane President & CEO Ernst Teunissen EVP & CFO |
 This presentation is organized into the categories shown on the left hand of this slide. Robert Keane, CEO, and Ernst Teunissen, CFO, will host a live question and answer conference call at 5:15 p.m. US Eastern time which you can access through a link on the investor relations section of www.vistaprint.com. |
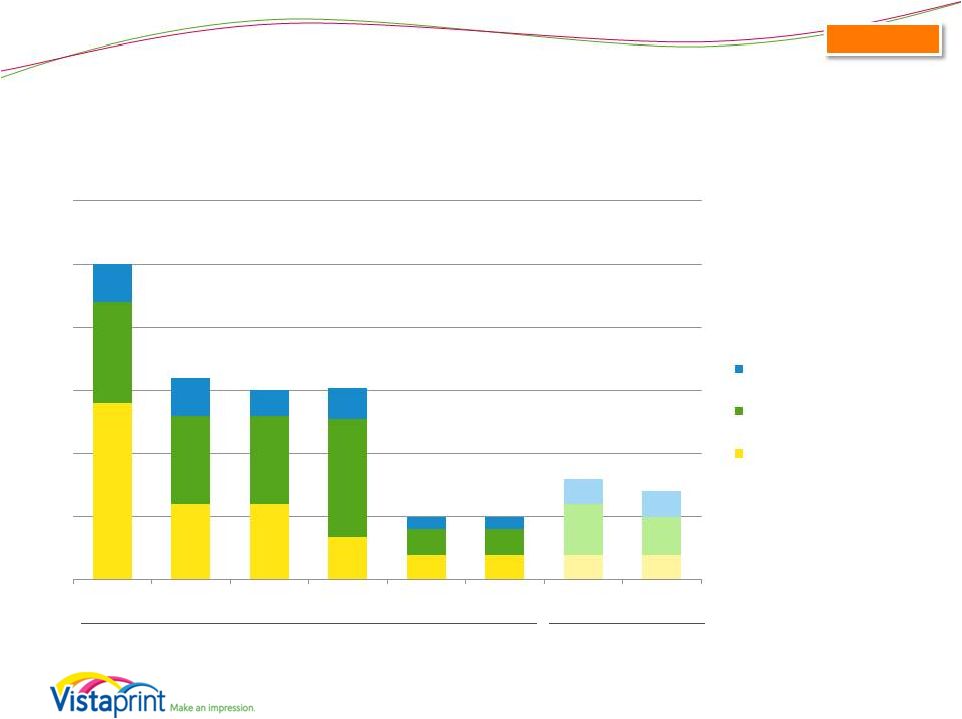
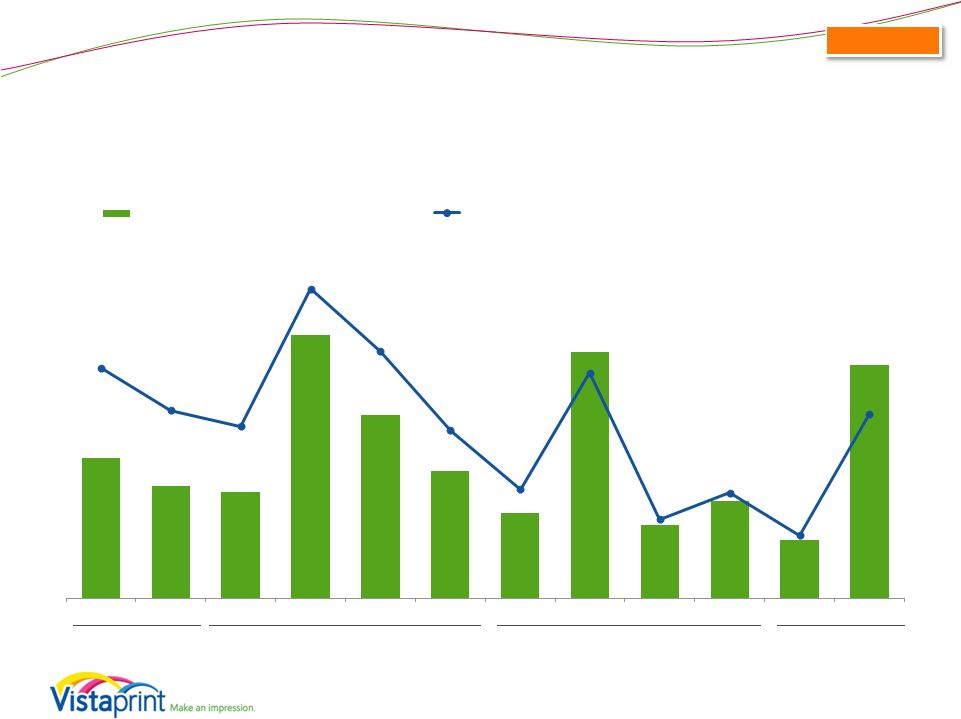
 Quarterly Financial Results 4 * Per diluted share Consolidated $0.51 $0.32 $0.19 $0.82 $0.01 $0.10 $(0.05) $0.66 $0.63 $0.43 $0.31 $0.97 $0.29 $0.40 $0.25 $1.02 Q3 FY11 Q4 FY11 Q1 FY12 Q2 FY12 Q3 FY12 Q4 FY12 Q1 FY13 Q2 FY13 GAAP EPS* Non-GAAP EPS* $204 $209 $212 $300 $258 $250 $251 $348 Q3 FY11 Q4 FY11 Q1 FY12 Q2 FY12 Q3 FY12 Q4 FY12 Q1 FY13 Q2 FY13 Webs revenue (millions) Albumprinter revenue (millions) Organic revenue (millions) Revenue and EPS results for the consolidated business, including Albumprinter and Webs results since October 31, 2011 and December 28, 2011 (dates of purchase, respectively). Non-GAAP adjusted net income per diluted share for all periods presented excludes the impact of share-based compensation expense and its related tax effect, amortization of acquired intangible assets and a tax charge related to the alignment of Webs IP with our global structure. Please see reconciliation to GAAP net income (loss) at the end of this presentation. |
 Our consolidated revenue in the second quarter of fiscal 2013 was above the midpoint of the range we set three months ago. Revenue grew 17% on a consolidated constant currency basis, to $348 million, including revenue from our Albumprinter and Webs acquisitions. On an organic constant currency basis, revenue grew 14% globally. Earnings per share for the quarter was above our expectations at $0.66, due primarily to strong gross margin performance and one-time favorability in our tax rate. We are on track and committed to delivering EPS in line with the annual guidance we provided at the beginning of the year. We are pleased with the progress we have made in many of our strategic initiatives, but we remain disappointed with our European marketing performance. As we described last quarter, we are working hard to overcome the growth challenges we have faced in Europe in recent quarters but a sustainable turn-around in Europe will take time. We believe the year-over-year uptick in our European growth rate from last quarter was largely due to our seasonal consumer and holiday business, which will not be a major part of our revenue in the back half of the year. |
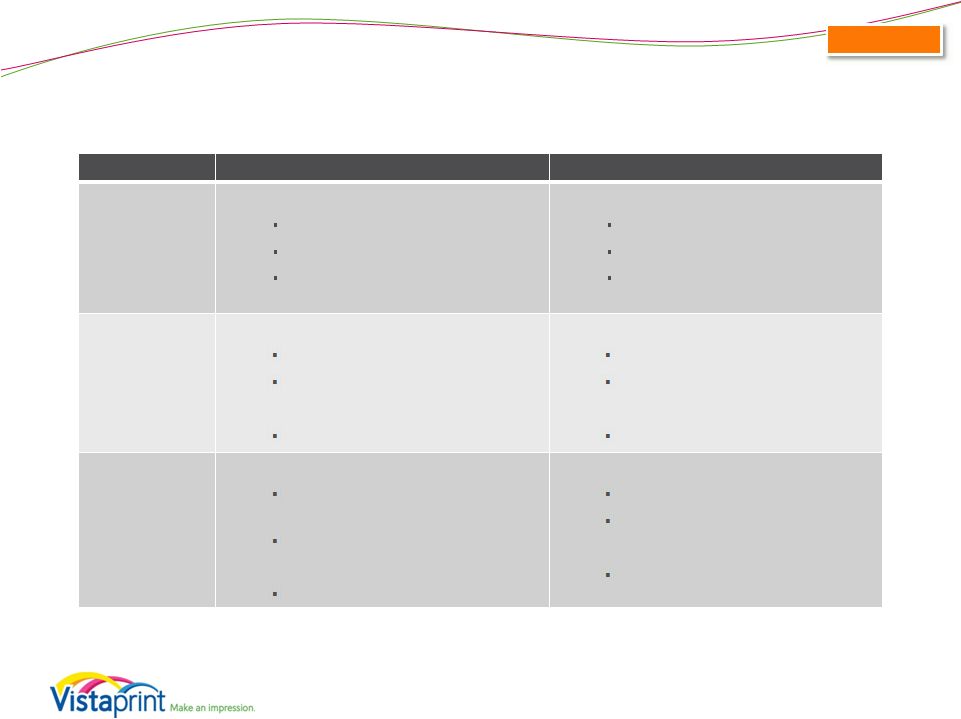
 Operational Performance: Reinvigorate Growth in the Core Business 5 Strategy Element Description Long-Term Goals Q2 FY13 Results/Examples Major improvements to customer experience, satisfaction and loyalty Change success metrics from short-term transaction-focused value to longer-term life time value and achieve higher life time value per customer • Continued improvements in net promoter score, a leading retention indicator • Tested changes to pricing transparency, simplicity and consistency • Packaging improvements Invest more deeply into selected traditional Vistaprint marketing channels and expand in relatively new channels such as broadcast with higher than average COCA, but excellent longer term ROI Accelerate new customer acquisition Reach offline audiences not currently looking to online suppliers • Tested new TV broadcast creative in NA including holiday products • Improved efficiency in NA channels • Continued testing into new channels in Europe and APAC • 18 months of experience in this initiative will enable optimization based on historical data trends Accelerate investment in production process improvements, employee training, supply chain management and manufacturing-related engineering Step function changes in quality and reliability Significantly lower unit manufacturing costs • New product launch: iPhone cases • Continued efforts in improving manufacturing operating metrics (quality, speed, delivery, cost, reliability) Customer Value Proposition Improvements Life Time Value Based Marketing World Class Manufacturing |
 During the quarter, we made progress in each of our strategic initiatives that are designed to reinvigorate growth in our organic business. In terms of improving our customer value proposition, we introduced better substrates for many of our products, we increased the exposure of our service telephone numbers, and we tested ways to increase pricing simplicity, clarity and consistency. In our LTV-based advertising initiatives, we launched a North American broadcast test that incorporated home and family holiday products as part of the message, and we rolled out new broadcast creative in several European markets. With 18 months of increased LTV advertising under our belts, we are starting to be able to measure historical results relative to our original expectations, and we believe that over the coming year we will be able to use such data to improve the quality of our ad spend based on forecasted net present value. Our manufacturing investments led to lower cost of goods sold and increased delivery performance and product quality, and enabled new product launches and upgraded substrate quality. |
 Regional Strategy Execution Update 6 • Product quality improvements • Manufacturing process investments • Customer service expansion • Enhanced site experience • Increased advertising spend • Customer research • Advertising consistent with brand values • Integrated cross-channel advertising • Pricing methodology improvements • Improved creative treatments • Deeper & broader marketing leadership • Have not progressed as needed on the above NA strengths • Product and creative not as localized as in North America • 17 markets; 14 languages • Organizational, leadership and process changes required Common Strategy in North America and Europe Additional NA Strengths European Challenges |
 As you know, we made some structural and management changes in our marketing organization at the beginning of FY13. Six months have passed, and we continue to improve our understanding of the factors that have led to our diverging performance in our North American and European businesses. Some of our strategic investments have been common to both North America and Europe, and we are seeing early indicators of success in many of these investments in both regions. Examples of common strategic progress include improvements in product quality, manufacturing processes, customer service, and site experience, as well as increased advertising spend and customer research. Results have included increased customer satisfaction scores for product quality and customer service availability, as well as improved net promoter scores across both regions. However we have also experienced important differences by region that we believe have influenced the relative performances of North America and Europe. As an example of some of these differences: • In North America we have been able to more effectively evolve our sales and marketing methods in line with our overall strategic move to be more customer-centric. Examples are advertising messaging and tactics that speak to our brand values rather than our traditional deep discount direct marketing, integration of common messaging across advertising channels and campaigns, enhancements to our pricing methodology through greater simplicity and clarity, and improvements to our creative treatments. In North America we have also benefitted from a more seasoned and experienced marketing executive team that has very effectively managed and improved our quarter-to-quarter marketing tactics. • In Europe, we have struggled to move as quickly in each of the above areas that have been strengths in North America. We also have more work to do to localize our product formats, services and creative content for European customers. Of course, these are more difficult challenges for a region serving 17 countries in 14 languages, but we believe we can do better. As discussed in recent earnings calls, we have been making organizational and leadership changes in Europe to address these and related challenges. We are working hard to make improvements, but expect a turnaround in European performance will be a long-term effort. Our success in North America gives us confidence that our key strategy themes will enable our efforts to improve European performance over the longer term. |
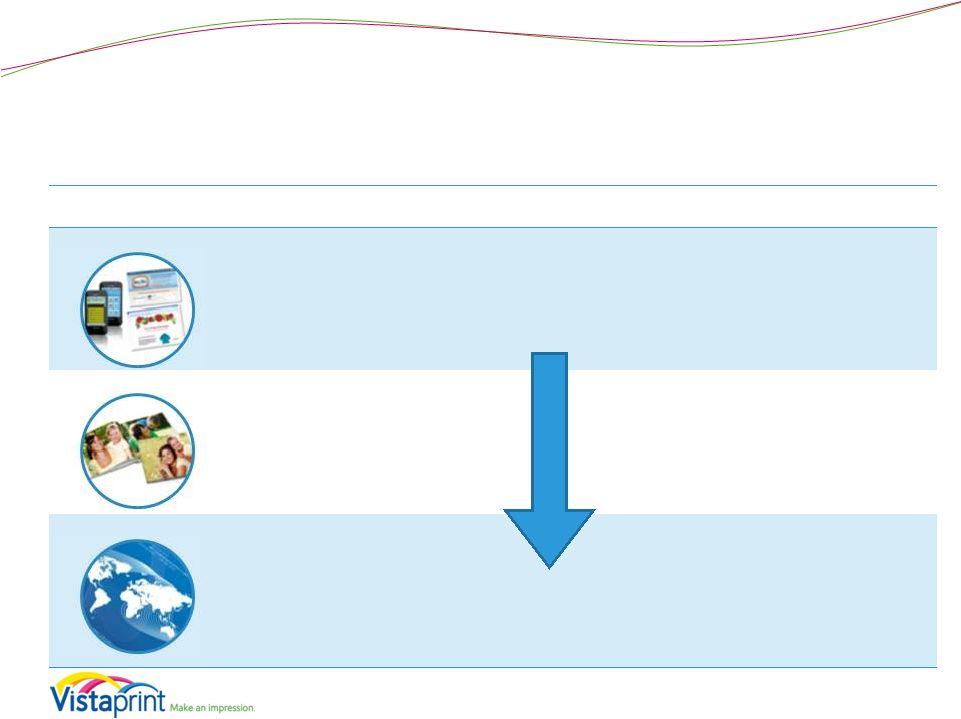 Operational Performance: Build Foundations for Future Growth 7 Strategy Element Description Long-Term Goals Q2 FY13 Results/Examples Digital small business marketing offerings (websites, email marketing, social media) Lay foundations for continued rapid growth five and more years in the future Seek M&A opportunities of firms that possess technology, market presence and/or expertise in target areas • Continued digital subscriber adds in Q2 with continued increase in ARPU • Continued with Webs integration and technology investments including offer enhancements Enable customers to share and preserve memories through personalized products for home and family use • Strong holiday results globally • Rolled out Albumprinter photo books to Vistaprint’s EU customer base • Continued Albumprinter manufacturing process improvements based upon work with Vistaprint manufacturing Expand to markets beyond Europe and North America Current focus on building foundation for future growth in Asia • Continued organizational building of Singapore leadership team • Opened India production & service operations, initial site launch • Ops planning, recruitment, cross- training & process development for China minority interest Digital Marketing Home & Family Geographic Expansion |
 In addition to our initiatives impacting our organic business, efforts in our adjacencies continued, with the objective of building foundations for future growth. Our Vistaprint-branded digital subscriber base reached 357,000 customers with continued improvement in monthly revenue per customer. In addition, our Webs-branded business continued to grow in line with expectations and we continued progress toward technology integration. In the home and family market, we had very good results in our core holiday business around the world, and our Albumprinter team continued to integrate with European countries and streamline manufacturing and production. Finally, we continued to build out our teams in Singapore, India and, via our indirect minority investment, China. These and other emerging markets will not have any significant impact on our revenue in the near term, but we remain confident that that they offer attractive long term growth opportunities for Vistaprint. |
 Q2 FY 2013 Operating and Financial Results 8 |
 Q2 FY 2013: Key Financial Metrics* 9 * Financial metrics for the consolidated business, including Albumprinter results since October 31, 2011 and Webs results since December 28, 2011 (dates of purchase). ** Non-GAAP adjusted net income and non-GAAP adjusted EPS exclude share-based compensation expense and its related tax effect, amortization of acquired intangible assets, and charges related to the alignment of Webs IP with our global operations. Please see reconciliation to GAAP net income (loss) and EPS at the end of this presentation. Quarter Ended 12/31/2012 YTD Period Ending 12/31/2012 Revenue • $348.3 million 16% y/y growth 17% y/y constant currency growth 14% y/y organic constant currency (ex-acquisitions) • $599.7 million 17% y/y growth 19% y/y constant currency growth 14% y/y organic constant currency (ex-acquisitions) GAAP Net Income (Loss) • $23.0 million 6.6% net margin vs. 10.6% last year decrease of 28% y/y • $0.66 Diluted EPS decrease of 20% y/y • $21.3 million 3.6% net margin vs. 7.8% last year decrease of 47% y/y • $0.61 Diluted EPS decrease of 38% y/y Non-GAAP Adjusted Net Income** • $35.9 million 10.3% net margin vs. 12.6% last year decrease of 5% y/y • $1.02 Non-GAAP Diluted EPS increase of 5% y/y • $44.8 million 7.5% net margin vs. 9.9% last year decrease of 12% y/y • $1.26 Non-GAAP Diluted EPS increase of 1% y/y Consolidated |
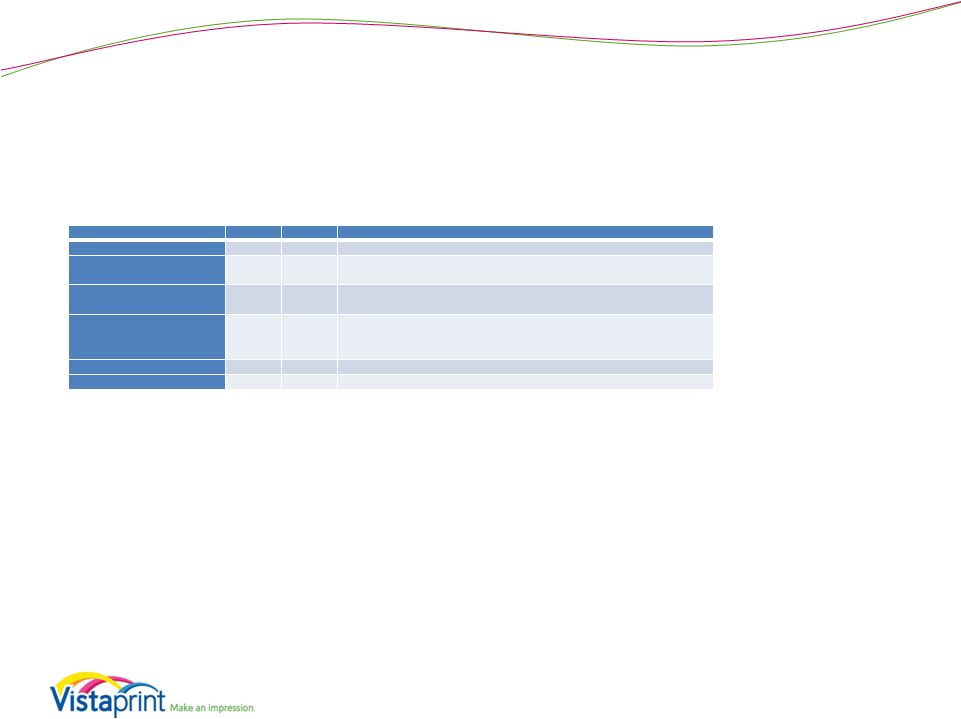 Turning to financials, and as noted above, Vistaprint generated revenue of $348 million in the second quarter, reflecting a 16% year over year increase. In organic constant- currency terms, excluding Albumprinter and Webs, this reflected 14% year over year growth for the business, at the midpoint of the constant-currency expectations we set three months ago. GAAP net income for the second quarter was $23.0 million, or 6.6% of revenue, reflecting a 28% decrease year over year. GAAP EPS in the second quarter was $0.66, reflecting a decrease of 20% year over year. We expected GAAP net income and EPS to decline year over year due to the dilutive impact of the Webs and Albumprinter acquisitions, as well as several differences in below-the-line items compared with Q2 2012: Non-GAAP adjusted net income in the second quarter was $35.9 million, or 10.3% of revenue, reflecting a decrease of 5% year over year. Non-GAAP adjusted net income declined less than GAAP net income primarily due to higher stock-based compensation from our acquisitions and the accounting timing impact of our recent premium price stock option grants for our executive officers, of which the most significant portion has an accelerated expense profile versus traditional stock options and RSUs. Non-GAAP adjusted EPS was $1.02 in the second quarter of fiscal 2013, which is up 5% year over year, due to the effect of our share repurchases over the past year. Q2 13 Q2 12 Comments GAAP Operating income $33.0M $32.5M Interest income (expense), net ($1.3)M ($0.4)M Borrowings from share repurchases and acquisitions Other income (expense) ($0.3)M $2.4M Q2 12 gain from currency transactions related to Albumprinter acquisition Income tax provision $8.2M $2.9M Q2 12 rate favorability due to currency revaluations on inter- company loan for Albumprinter acquisition; Q2 13 higher cost base and acquisition-related tax partially offset by one-time tax benefit Earnings in equity interests ($0.3)M - Q2 13 losses from equity interest in China GAAP Net Income $23.0M $31.7M |
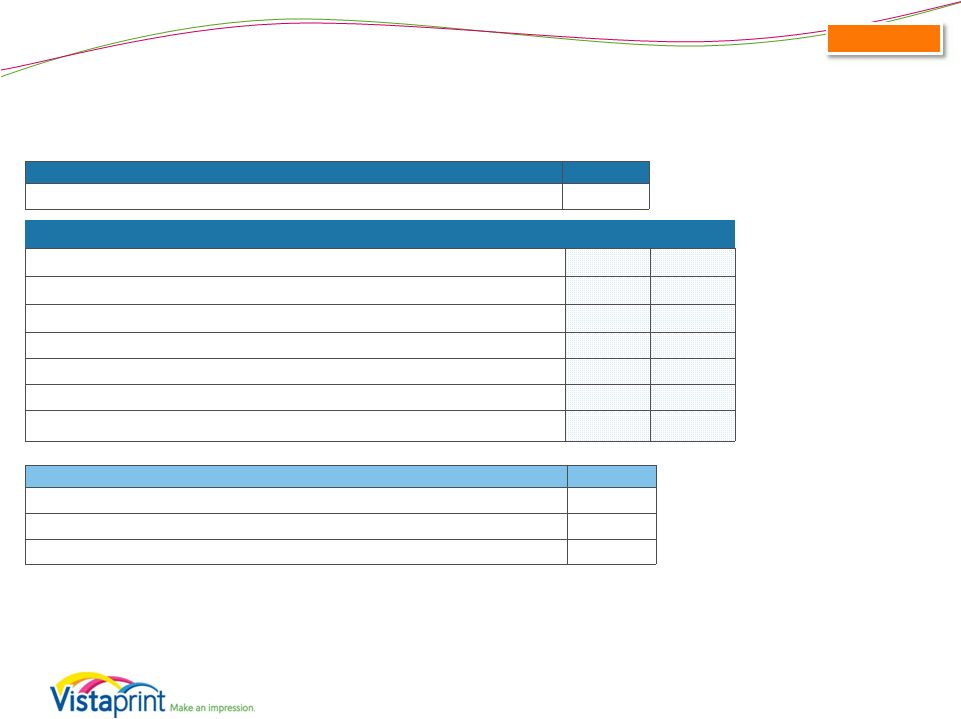 Cash Flow & ROIC Highlights* Quarterly cash flows and investments (in millions) Q2FY13 Q2FY12 Cash flow from operations $88.5 $81.1 Free cash flow** $58.7 $66.4 Capital expenditures $27.6 $13.4 as % of revenue 7.9% 4.5% Trailing Twelve Month Return on Invested Capital*** (GAAP) 7% 26% Trailing Twelve Month Return on Invested Capital*** (Non-GAAP) 17% 34% 10 Share repurchase program Q2FY13 Shares purchased 827,346 Average cost per share $29.94 Total purchase spend, inclusive of transaction costs, in millions $24.8 Balance sheet (in millions, as of December 31, 2012) Cash and cash equivalents $64.7 Consolidated * Financial results for the consolidated business, including Albumprinter and Webs results ** FCF = Cash Flow from Operations – Capital Expenditures – Purchases of Intangible assets not related to acquisitions – Capitalized Software Expenses *** ROIC = NOPAT / (Debt + Equity – Excess Cash) Net operating profit after taxes (NOPAT) Excess cash is cash and investments of 5% of last twelve month revenues Operating leases have not been converted to debt Non-GAAP TTM ROIC excludes share-based compensation expense and its related tax effect, amortization of acquired intangibles, and charges related to the alignment of Webs IP with our global structure on NOPAT Excess cash definition updated in period ending 12/31/2012 and for prior periods. |
 Cash and cash equivalents were approximately $64.7 million as of December 31, 2012. During the quarter, Vistaprint generated $88.5 million in cash from operations, compared with $81.1 million in the second quarter of fiscal 2012. Free cash flow was $58.7 million in the second quarter, down from $66.4 million in the second quarter of fiscal 2012. On a trailing twelve-month basis, return on invested capital (or ROIC) as of December 31, 2012 declined due to the planned reduced profitability in our business during the fiscal year. Including share based compensation expense, it was approximately 7%, and excluding share based compensation expense, it was approximately 17%. We expect ROIC to improve significantly over time, as we expect our FY12 and FY13 investments to bear fruit later in FY14 and beyond. The company repurchased 827,346 shares during the quarter at an average cost per share of $29.94. We have approximately 375,000 shares left under the repurchase authorization approved by our shareholders in November 2011 and under the Supervisory Board approval of February 2012. We also received shareholder authorization to repurchase up to an additional 6.8 million of our outstanding shares at our November 2012 annual general meeting, but our Supervisory Board has not yet approved any repurchase program pursuant to this shareholder authority. We sought this approval for flexibility, and any decision to make additional repurchases will be weighed carefully by our Supervisory Board and Management Board, and will depend upon many factors. |
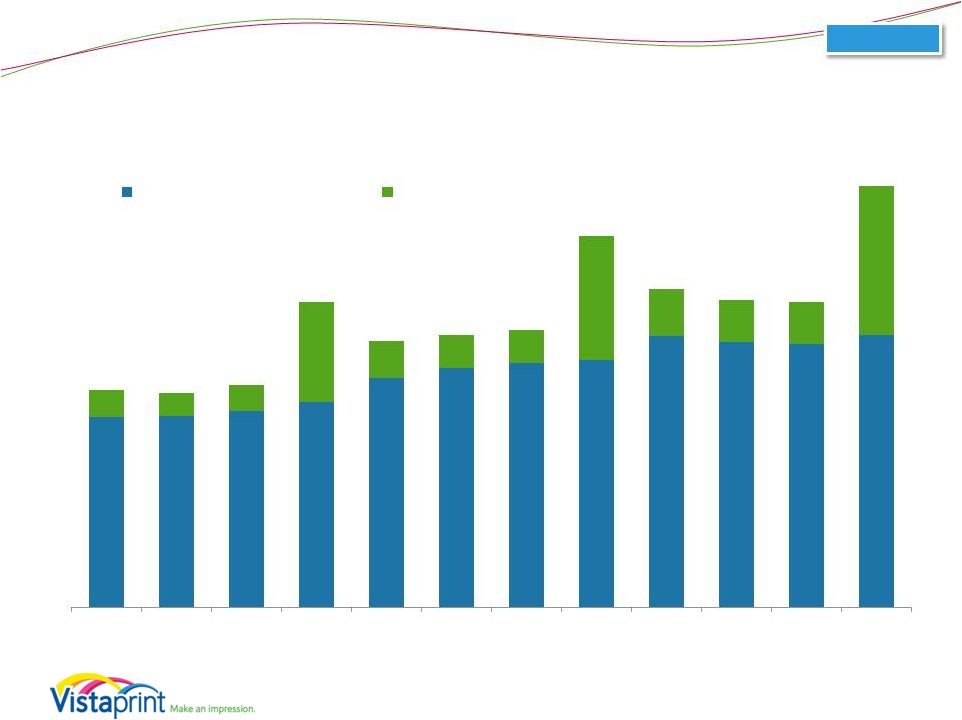
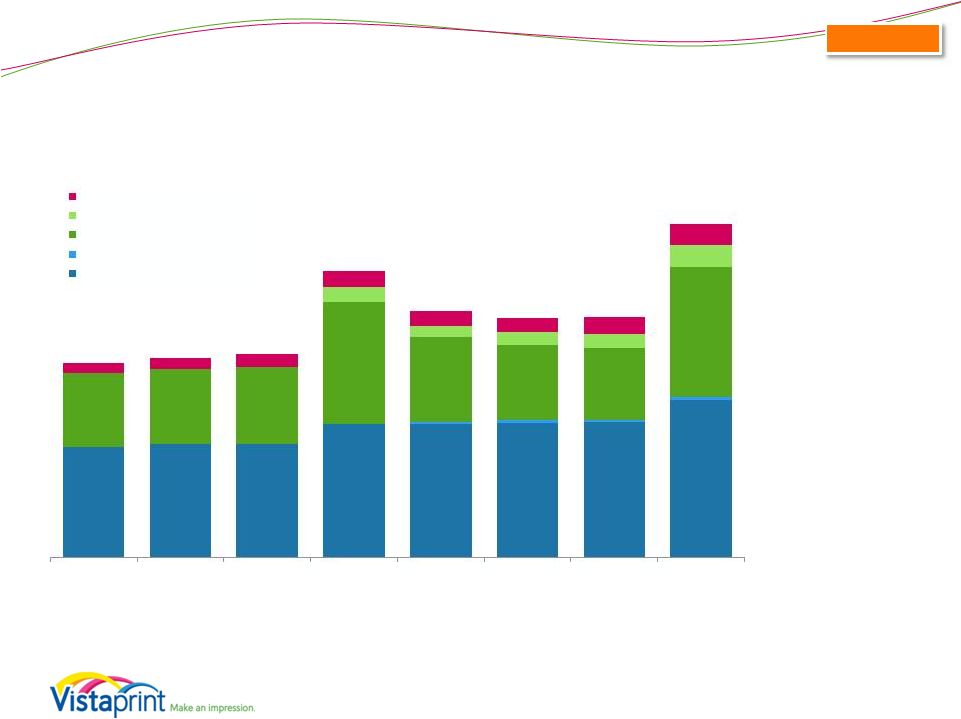 Geographic Segment Revenue - Quarterly (millions) North America: 48% of total revenue 20% y/y growth 20% y/y constant currency growth including Webs 18% y/y organic constant currency growth Europe: 46% of total revenue 11% y/y growth 14% y/y constant currency growth including Albumprinter 9% y/y organic constant currency growth Asia Pacific: 6% of total revenue 26% y/y growth 24% y/y constant currency growth Q2 FY2013 11 $115.5 $119.2 $118.7 $139.8 $139.7 $140.9 $141.6 $164.7 $2.3 $2.5 $2.6 $2.8 $77.7 $77.8 $80.0 $127.3 $88.4 $79.1 $74.3 $136.5 $15.7 $11.8 $12.9 $15.4 $22.8 $10.5 $11.8 $13.7 $17.0 $15.4 $15.1 $17.5 $21.5 Q3 FY11 Q4 FY11 Q1 FY12 Q2 FY12 Q3 FY12 Q4 FY12 Q1 FY13 Q2 FY13 Asia-Pacific Albumprinter (inc. in Europe) Europe Webs (inc. in North America) North America Consolidated Revenue results for the consolidated business, including Albumprinter and Webs results since respective acquisition dates. All Albumprinter revenue included in European segment. All Webs revenue included in NA segment. Note: Constant currency basis is estimated by translating all non-U.S. Dollar denominated revenue generated in the current period using the prior year period’s average exchange rate for each currency to the U.S. Dollar and excludes the impact of gains and losses on effective foreign currency hedges recognized in revenue. Please see reconciliation to reported revenue growth rates at the end of this presentation. |
 For the second quarter, revenue performance by geography, inclusive of Albumprinter and Webs revenues, was as follows: • North American revenue was $167.5 million, reflecting 20% growth year over year in both reported and constant currency terms. This revenue is inclusive of the $2.8 million of revenue from the Webs acquisition. Excluding Webs, our North American business grew 18% year over year in constant currency. We saw continued strength in our results in North America, which we attribute largely to solid execution against the key strategy initiatives we launched 18 months ago. Within the North American business, the US growth rate remained steady, while the Canadian growth rate slowed slightly due to pricing tests we rolled out since last year which are intended to test enhancements to our pricing methodology, including greater simplicity and clarity beyond what we have already implemented in the US market. • European revenue was $159.3 million, reflecting 14% growth year over year in constant currency and 11% growth year over year as reported. This revenue is inclusive of the $22.8 million of revenue from the Albumprinter acquisition. Excluding Albumprinter, our European business grew 9% year over year in constant currency. Even during the seasonally strong consumer quarter for Europe, this growth was lower than what we believe is possible longer term in Europe. In addition to the operational issues we have discussed above and in the past, we believe it is possible that the macroeconomic environment in Europe is having an impact on us, but we can’t quantify it. Instead we are focusing on our own value proposition and marketing execution in Europe, both of which we are working to improve. • Asia-Pacific revenue was $21.5 million, reflecting 26% growth year over year in reported terms and 24% growth year over year in constant currency. This remains our fastest growing geography. That being said, we expect growth rates here to decline further for the foreseeable future as we reach relative maturity in the Australian and New Zealand markets, which currently constitute the vast majority of our revenue in this region. Similar to Canada, we implemented changes to pricing and the presentation of our offers as part of our commitment to improving our customer value proposition. We believe these changes negatively impacted our growth rate in the region in the second quarter and are likely to continue to impact the growth rate near term. But we believe that these are the right marketing practices for improving our longer-term customer loyalty. Currency exchange rates in the quarter had a slightly negative impact on revenue growth year over year. The Euro weakened against the U.S. dollar since Q2 2012, partially offset by a strengthened British pound, Canadian Dollar and Australian Dollar. The net result of currency movements year over year in Q2 was a negative impact of approximately $2 million on a consolidated basis. Sequentially, the Euro, Canadian dollar and Pound strengthened against the U.S. dollar, while the Australian Dollar remained flat. The net effect of all currencies on revenue was a benefit of approximately $4 million versus first quarter rates. Compared to the currency rates we assumed when we gave guidance in October, the currency impact was neutral. |
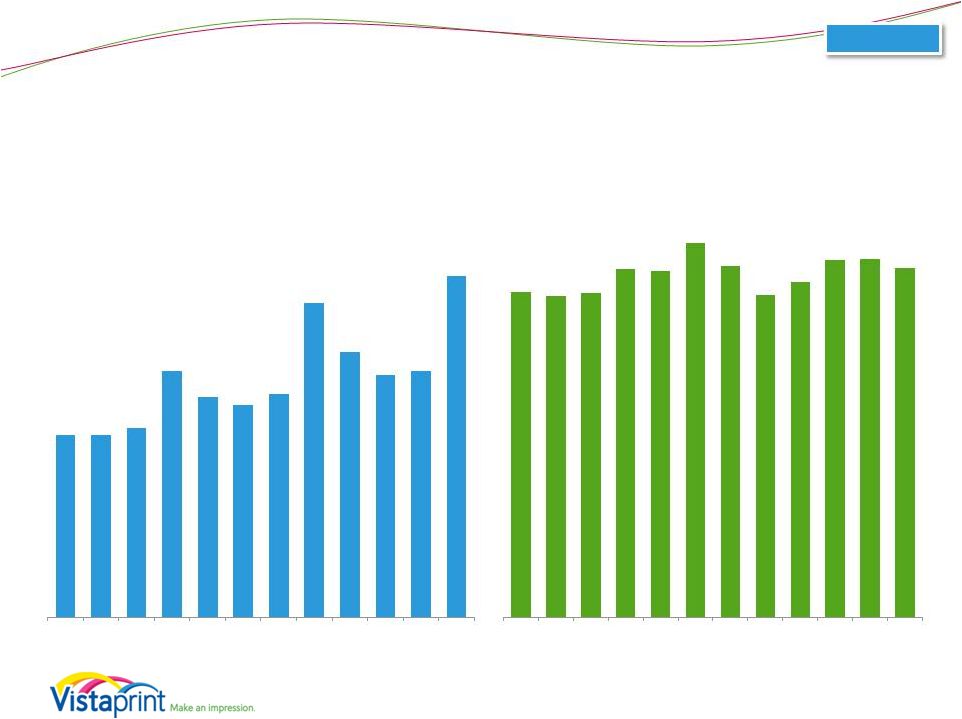 Operational Metrics (Excludes Albumprinter and Webs) 12 Organic $34.79 $34.56 $34.69 $36.17 $36.03 $37.75 $36.38 $34.61 $35.38 $36.73 $36.78 $36.25 FY10 FY10 FY11 FY11 FY11 FY11 FY12 FY12 FY12 FY12 FY13 FY13 Average Order Value 4.8 4.8 5.0 6.5 5.8 5.6 5.9 8.3 7.0 6.4 6.5 9.0 FY10 FY10 FY11 FY11 FY11 FY11 FY12 FY12 FY12 FY12 FY13 FY13 Orders (M) Q3 Q4 Q1 Q2 Q3 Q4 Q1 Q2 Q3 Q4 Q1 Q2 Q3 Q4 Q1 Q2 Q3 Q4 Q1 Q2 Q3 Q4 Q1 Q2 |
 Vistaprint’s organic business metrics, excluding Albumprinter and Webs, were as follows: • • Total orders processed in the quarter were approximately 9.0 million reflecting growth of 8% year over year. Average order value was $36.25, up from an average order value of $34.61 in Q2 of last fiscal year. AOV was up year over year in North America, yet down slightly in Europe and Asia Pacific. Currency had a slightly negative impact in Europe year over year. These metrics should be viewed together and not individually, as factors such as currency, product mix, marketing campaigns, partner performance, seasonality, and the like, can impact them. |
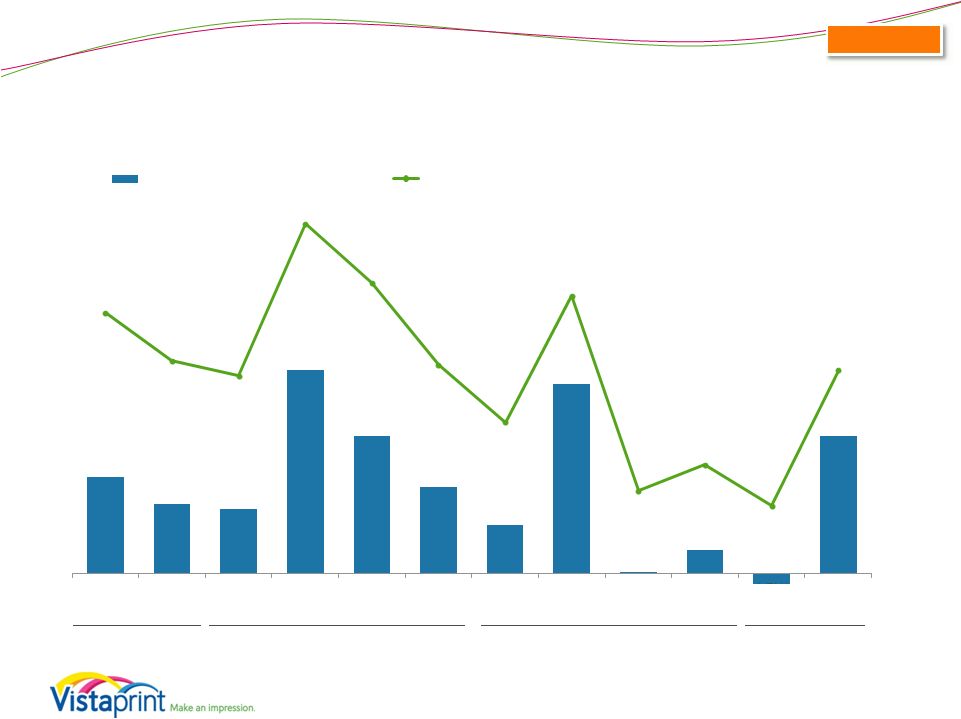
 Operational Metrics (Excludes Albumprinter and Webs) 13 3.2 Organic 0.0 0.5 1.0 1.5 2.0 2.5 3.0 3.5 0% 5% 10% 15% 20% 25% 30% 35% $21 $22 $23 $24 $24 $26 $27 $26 $26 $25 $28 $27 0 $ 5 $ 10 $ 15 $ 20 $ 25 $ 30 $ 35 $ 20% 21% 21% 22% 21% 23% 24% 27% 26% 24% 26% 27% New Customers (million) Advertising as % of Revenue Implied COCA |
 Additional customer metrics for the organic business for the period ending December 31, 2012, were as follows: • Quarterly new customer additions excluding Albumprinter and Webs were approximately 3.2 million, reflecting 10% year over year growth over the approximately 2.9 million new customer adds in Q2 of last fiscal year. This quarter, we passed the anniversary of two initiatives that helped us accelerate new customer growth last year: our increased advertising expense as a percentage of revenue, and our partnership with Staples. We continue to expect new customer growth as a part of our efforts to extend our reach, but we don’t believe we will see 30% growth this fiscal year like we did last year. In addition, our European new customer add growth rate was weaker than the North American growth rate and slowed from last quarter. • Vistaprint uses the term “implied cost of customer acquisition” or “implied COCA” to describe total advertising expense in a period divided by the number of unique first time customers in that period. The second chart illustrates our implied COCA, which was down from Q1 to Q2 at approximately $27 but is higher than the prior fiscal year second quarter due to our planned increased investment in advertising over time. • Advertising costs for the organic business were $87.3 million, or 27.0% of organic revenue in the quarter. As part of our strategic investments, we expected this increase versus years past. |
 Historical Revenue Driver Metrics (Quarterly) 14 11.1 11.4 11.9 *trailing twelve month at period end 12.9 Organic 13.8 14.4 14.9 15.4 3.9 4.0 4.2 4.5 4.8 5.0 5.2 5.4 7.2 7.4 7.7 8.4 9.0 9.4 9.7 10.0 FY11 FY11 FY12 FY12 FY12 FY12 FY13 FY13 New Customers Aquired in Period Customers Repeating from Prior Periods Q3 Q4 Q1 Q2 Q3 Q4 Q1 Q2 FY11 FY11 FY12 FY12 FY12 FY12 FY13 FY13 TTM Unique Customers (M) 11.1 11.4 11.9 12.9 13.8 14.4 14.9 15.4 TTM New Customers (M) 7.2 7.4 7.7 8.4 9.0 9.4 9.7 10.0 TTM Repeating Customers (M) 3.9 4.0 4.2 4.5 4.8 5.0 5.2 5.4 As % of Unique Customers TTM New Customers 65% 65% 65% 65% 65% 65% 65% 65% TTM Repeating Customers 35% 35% 35% 35% 35% 35% 35% 35% Q3 Q4 Q1 Q2 Q3 Q4 Q1 Q2 Y/Y Growth TTM Unique Customers 21% 19% 19% 22% 24% 26% 25% 19% TTM New Customers 16% 16% 17% 20% 25% 27% 26% 19% TTM Repeating Customers 30% 25% 24% 25% 23% 25% 24% 20% Implied Retention** 42% 42% 42% 42% 43% 44% 44% 42% **TTM repeating customers as % of year ago unique customers TTM* Unique Customers (M) |
 Our unique customer metrics for the organic business on a trailing twelve month basis were as follows: • • As we have described in the past, many of the changes we have made since the beginning of FY12 are impacting our metrics in different ways. While one of our long-term objectives is to increase retained customers as a percent of the prior year’s total unique customer count, we previously noted that this metric repeat order activity due in part to some of our customer value proposition changes (which influences the numerator of this metric). For example, excluding the impact of retail partners, the percentage of repeating customers from prior periods would have been flat sequentially. could decline in FY13 due to the significant acceleration of new customers we added in FY12 (the denominator of this metric), as well as some slowing of On a TTM basis for the period ending December 31, 2012, unique customer count was 15.4 million, reflecting 19% year over year growth of unique customers. First-time unique customers in the TTM period ending December 31, 2012 grew 19% year over year while unique customers transacting from prior periods grew 20% year over year. |
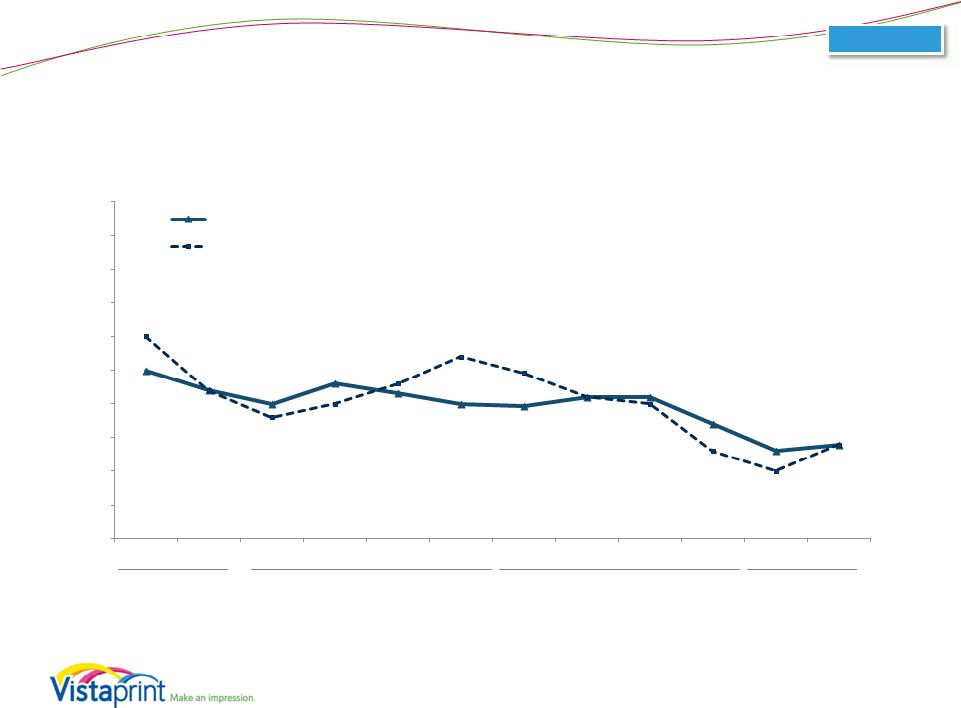
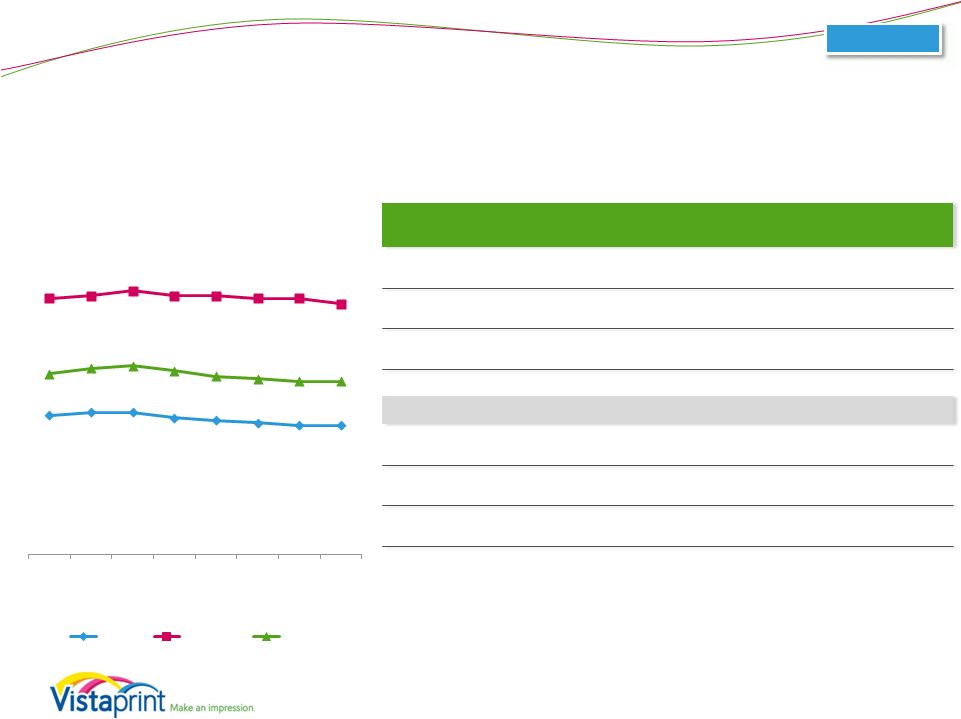 Historical Revenue Driver Metrics 15 Average Customer Spend: Organic Q3 FY11 Q4 FY11 Q1 FY12 Q2 FY12 Q3 FY12 Q4 FY12 Q1 FY13 Q2 FY13 $99 $100 $102 $100 $100 $99 $99 $97 Average Spend Per Unique Customer (USD) $70 $72 $73 $71 $69 $68 $67 $67 $54 $55 $55 $53 $52 $51 $50 $50 Q3 FY11 Q4 FY11 Q1 FY12 Q2 FY12 Q3 FY12 Q4 FY12 Q1 FY13 Q2 FY13 Average Spend per Unique Customer $70 $72 $73 $71 $69 $68 $67 $67 Average Spend per New Customer $54 $55 $55 $53 $52 $51 $50 $50 Average Spend per Repeat Customer $99 $100 $102 $100 $100 $99 $99 $97 Y/Y Growth Average Spend per Unique Customer 4% 1% (1%) (6%) (8%) (6%) Average Spend per New Customer 2% (2%) (4%) (7%) (9%) (6%) Average Spend per Repeat Customer 3% 2% 1% (1%) (3%) (3%) FY11-FY16, long-term target of low- to mid- single digit growth in bookings per unique customer. New Repeat Total |
 Average spend per unique customer for the organic business on a trailing twelve month basis for the period ended December 31, 2012 developed as follows: • Average spend per unique customer during the TTM period ending December 31, 2012 was $67, reflecting a 6% decline year over year. We believe this decline was due to several factors, including: • The near-term drag created by changes we made in FY12 to drive long-term customer retention, such as reduced in-transaction cross sell. This was most apparent in the European TTM average spend per unique customer, which continued to decline and created a drag on the average. This was due to lower growth of average spend for both unique new and repeat customers in the TTM period; • The impact of our success with wholesale partnerships such as FedEx Office and Staples, for which we receive wholesale revenue per order that is on average lower than our direct-to-customer business; and • A year-over-year negative impact of currency movements, which impacts this metric, as well as the sub- metrics below. • Average spend per new customer acquired in the TTM period was $50, reflecting a 6% decline year over year. • Average spend per customer transacting in prior periods during the TTM period was $97, reflecting a 3% decline year over year. |
 Looking Ahead 16 |
 FY13 Outlook Commentary 17 • Revenue guidance midpoint reduced by $30M o Operational performance: underperformance of European business plus reduction in advertising expense (adjusted down by about $35M) o Currency outlook (adjusted up by about $5M) • EPS guidance unchanged o Positives: continued GM strength, H2 reductions to advertising expense, Q2 tax rate favorability, reduced share count o Negatives: reduced revenue outlook, some one-time expenses related to changes in our European business, additional interest expense from recent share repurchases |
 With the first half of the fiscal year behind us, we are adjusting our full fiscal year 13 guidance as follows: Revenue We are lowering our revenue guidance range by $30M at the guidance range midpoint. This reflects two primary factors: • Our expectations for revenue have been lowered by about $35M for the full year, reflecting European weakness and a decision to trim advertising expense, which will further reduce revenue. • Currency has moved in our favor since we gave guidance in October. We are adjusting our expectations to reflect an expected $5M benefit for the year. Though our Q2 European growth rate was an improvement from the 1% we delivered in Q1 of this fiscal year, we believe this was largely due to some success in our holiday and consumer business in Europe, which will not repeat in the back half of the year. Given the execution challenges we have experienced in Europe, we believe it is prudent to expect that the shift from our Q2 holiday-oriented focus to our small-business-oriented focus in the third and fourth quarters will be even more challenging than it has been historically. Our new revenue range incorporates a range of second half outcomes for Europe, including very little growth at the low end of the range, to modest growth similar to our first half constant currency growth of 6% at the high end of the range. Our expectation is that we can continue to deliver strong growth in North America for the remainder of the fiscal year, in line with our recent performance ranges. In Asia-Pacific, we expect some deceleration in growth rates year-over-year primarily due to customer-value-oriented pricing and offer changes described earlier. EPS We remain confident in our ability to deliver EPS in line with our previously announced annual guidance. As a result, we are narrowing our FY13 EPS guidance range to the upper part of our prior guidance range. There are several positives and negatives influencing this number relative to past guidance, which net out to roughly no change. |
 Financial Guidance* (as of October 25, 2012) The Company is providing the following assumptions to facilitate non-GAAP adjusted net income per diluted share comparisons that exclude share- based compensation related expenses, amortization of acquired intangible assets and tax charges related to the alignment of IP with our global operations: FY13 ending 06/30/2013 Q3 FY13 ending 3/31/2013 Revenue $1,145 - $1,175 $275 - $290 Revenue growth from FY 2012 period 12% - 15% 7% - 13% Organic constant currency revenue growth estimate 10% - 13% 5% - 11% GAAP EPS $0.50 - $0.70 EPS decline from FY 2012 period (56%) - (38%) GAAP share count 34.6 million FY13 ending 06/30/2013 Non-GAAP adjusted EPS $1.79 - $1.99 EPS decline from FY 2012 period (8%) – 2% Non-GAAP share count 35.2 million Non-GAAP exclusions $45.3 * Millions, except share and per share amounts and as noted 18 Consolidated |
 The table above is Vistaprint’s financial guidance as of January 31, 2013. This guidance reflects our expected market opportunity and planned investments for growth and competitive advantage. Vistaprint specifically disclaims any obligation to update any forward-looking statements, which should not be relied upon as representing our expectations or beliefs as of any date subsequent to January 31, 2013, the date of this presentation. Our expectations for the full fiscal year ending June 30, 2013 are as follows: • For full year revenue, our organic constant-currency growth expectations are 10% to 13% growth, and consolidated constant-currency growth expectations are 12% to 15%. If exchange rates stay the same as they were for the 30-day average in mid-January 2013, we would expect consolidated revenue to be $1,145 million to $1,175 million, an increase of 12% to 15% year over year in U.S. dollars. Of course, actual revenue will depend in part on currency exchange rate development throughout the remainder of the fiscal year. • Full fiscal year GAAP EPS, on a diluted basis, is expected to be between $0.50 and $0.70 based on about 34.6 million weighted average shares outstanding. Our consolidated revenue expectations for the quarter ending March 31, 2013, the third quarter of fiscal year 2013, are expected to be in the range of $275 million to $290 million, an increase of 7% to 13% in U.S. dollars, and 6% to 12% in constant currencies. We expect organic constant-currency growth of 5% to 11% year over year. |
 Financial Guidance* (as of October 25, 2012) The Company is providing the following assumptions to facilitate non-GAAP adjusted net income per diluted share comparisons that exclude share- based compensation related expenses, amortization of acquired intangible assets and tax charges related to the alignment of IP with our global operations: FY13 ending 06/30/2013 Q3 FY13 ending 3/31/2013 Revenue $1,145 - $1,175 $275 - $290 Revenue growth from FY 2012 period 12% - 15% 7% - 13% Organic constant currency revenue growth estimate 10% - 13% 5% - 11% GAAP EPS $0.50 - $0.70 EPS decline from FY 2012 period (56%) - (38%) GAAP share count 34.6 million FY13 ending 06/30/2013 Non-GAAP adjusted EPS $1.79 - $1.99 EPS decline from FY 2012 period (8%) – 2% Non-GAAP share count 35.2 million Non-GAAP exclusions $45.3 * Millions, except share and per share amounts and as noted 19 Consolidated |
 We are providing the assumptions noted on our guidance slide to facilitate comparisons with non-GAAP adjusted net income per diluted share. • Based on these assumptions, for the full fiscal year 2013, non-GAAP adjusted EPS is expected to be between $1.79 and $1.99, and excludes expected acquisition-related amortization of intangible assets of approximately $8.4 million; share-based compensation expense and its related tax effect of approximately $34.6 million; charges related to the alignment of acquisition-related intellectual property with global operations of approximately $2.4 million; and 35.2 million shares outstanding. • We expect these expenses which are excluded from non-GAAP results to be fairly evenly distributed throughout the fiscal year, with the exception of the alignment of the acquisition-related intellectual property which is recorded based on the timing of how the profits come in on a quarterly basis. |
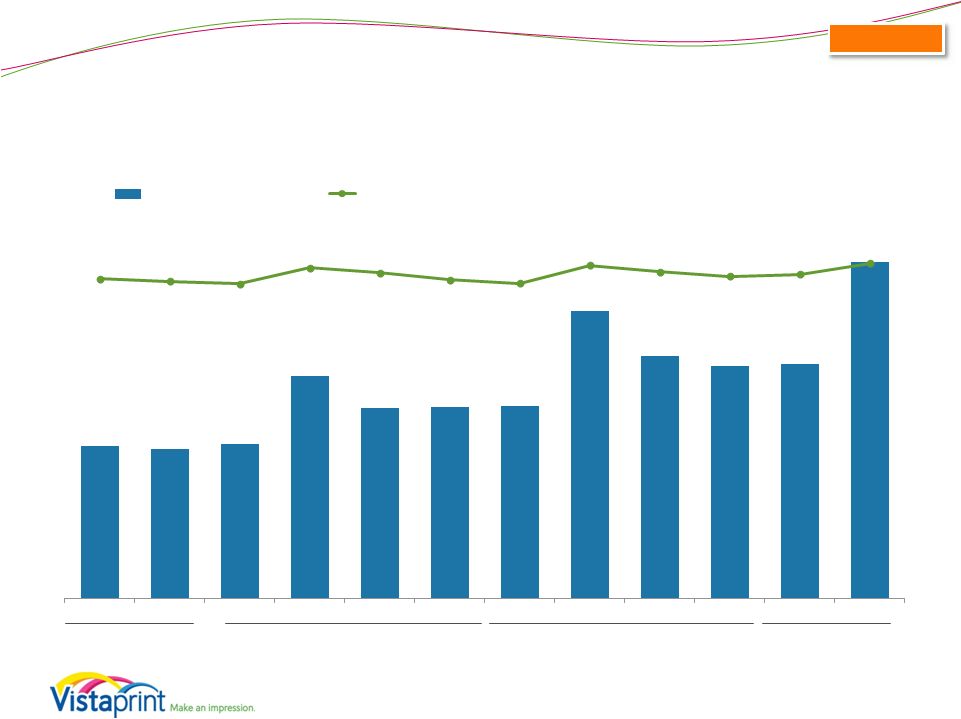
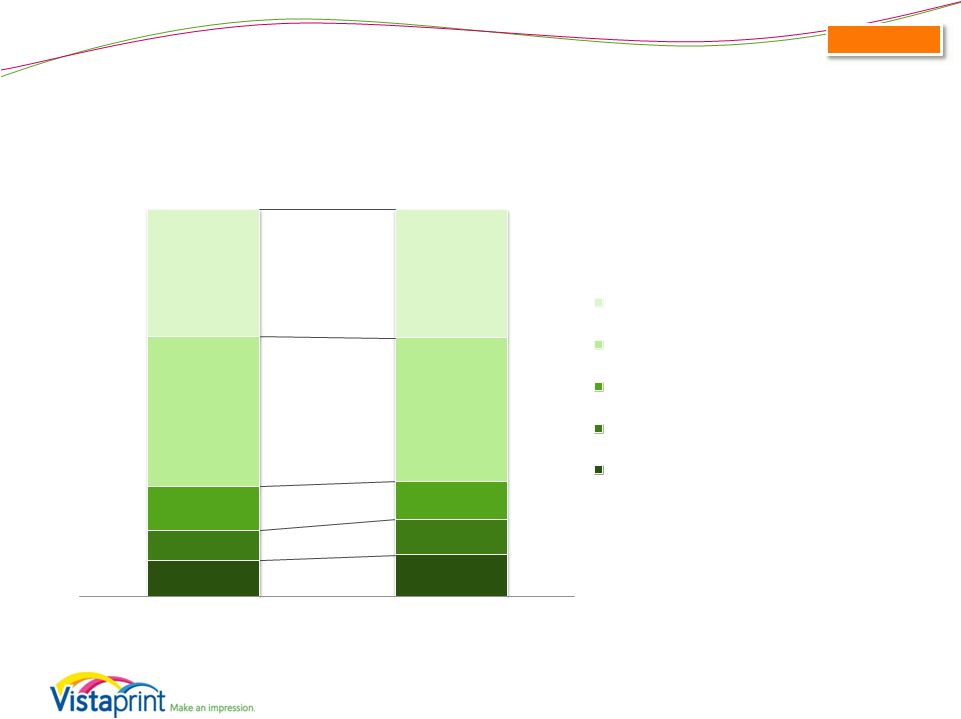
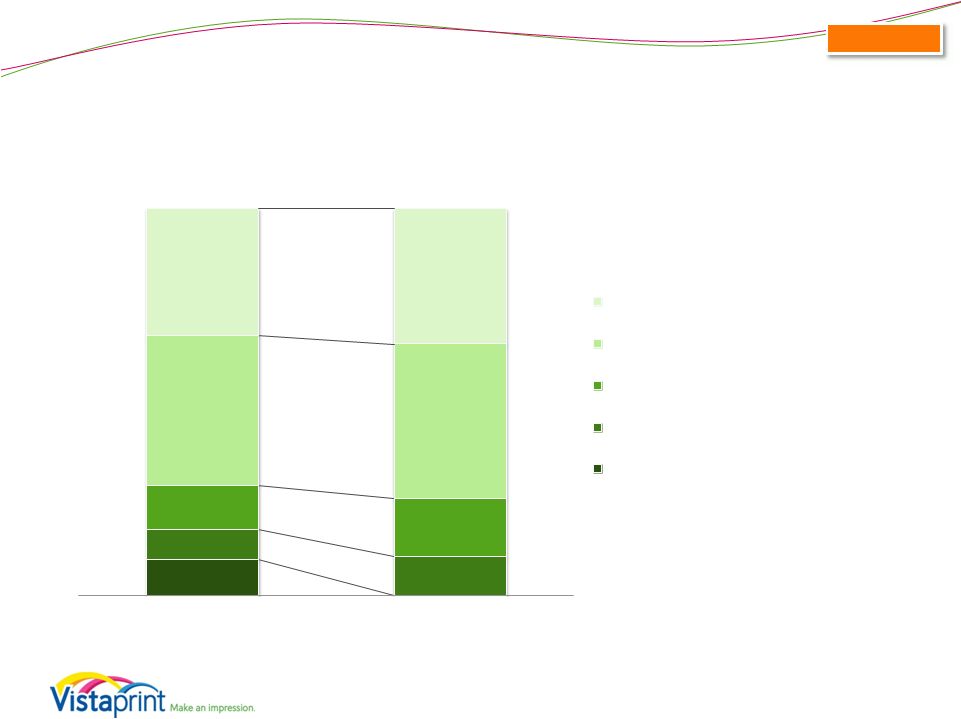
 Capital Expenditures Guidance (as of January 31, 2013) Expressed as percent of revenue FY 2013 Guidance: • • Actuals Guidance $63M $63M $76M $95M $85M $101M $37M 20 Consolidated $46M 25% 16% 15% 5% 8% 15% 5% 7% 14% 6% 6% 3% 2% 2% 2% 2% 8% 7% 7% 9% 2% 2% 4% 3% 3% 3% 2% 3% 1% 1% 2% 2% FY 2007 FY 2008 FY 2009 FY 2010 FY 2011 FY 2012 FY 2013 - High FY 2013 - Low Other Land and Facilities Manufacturing & Automation Equipment 7% - 8% of revenue guidance midpoint $85M - $95M |
 This chart shows capital expenditures in dollars and as a percentage of revenue for the past several years, and also shows our expectations for fiscal 2013 at the midpoint of our revenue guidance range. We expect capital expenditures as a percentage of revenue and in absolute dollars to increase in fiscal 2013 over 2012. For FY 2013, we have narrowed our previous guidance range and now expect capital expenditures of $85 to $95 million, or 7% to 8% of our revenue guidance midpoint. This guidance includes the expansion of our Venlo production facility, capital expenditures to create a small production facility in India, and other IT and manufacturing equipment requirements to support our growth plans. |
 Commentary on Revenue and EPS Seasonality 21 • As previously noted, no longer provide quarterly EPS guidance • Expect our typical seasonality trends to continue • We have already delivered majority of annual GAAP EPS in our second fiscal quarter o In line with recent years • Will provide quarterly revenue guidance o Quarterly updates on our annual revenue and EPS guidance |
 Our business is seasonal. We want to provide some color on the expected trends in the business through the year: • We expect the seasonal revenue trends in our business to continue, notwithstanding recent weakness in Europe, which typically has a higher percentage of home and family oriented revenue than other regions. The addition of Albumprinter increases the seasonal nature of our business. Now that our seasonally strong second fiscal quarter is behind us, we expect lower revenue and profits in the back half of the year. • We expect our recent trend of delivering a majority of annual GAAP earnings during our second fiscal quarter to continue in FY 2013. Given our year-to-date FY 13 EPS of $0.66, and our full fiscal year guidance range of $0.50 to $0.70, it is possible that we will lose money in the second half of the fiscal year, as we did in Q1. We will continue to provide annual revenue and EPS guidance, with quarterly updates. We will also provide quarterly revenue guidance. |
 Commentary on Long-Term Outlook 22 • Continue to believe scale matters and market opportunity is large • Continue to target $2B in annual revenue and beyond as we strive to create enduring transformational business institution • Current reality of disappointing revenue results in Europe means we are likely to reach $2B later than the FY16 mark that we originally targeted • Despite weaker revenue outlook, we believe we have multiple levers for profit growth • Still targeting FY16 net income goal • We believe we have opportunity to achieve this through mix of execution of strategic plan and careful investment trade-offs • Per our usual annual cycle, we will take remainder of FY13 to plan for these trade-offs, but our current FY14 view is that we expect revenue growth to be subsidiary to building strong foundations in our business and to profit growth Revenue Profit |
 Before closing, we’d like to comment on our long-term outlook. In the past we have described publicly our 2016 financial targets as part of our long-term strategy and investment approach. As a growing business, we regularly make investment trade-off decisions that we anticipate will have near- and long-term impacts to revenue and profitability. As our performance and anticipated investment returns evolve over time, it may be prudent for us to make adjustments to our plans that we believe will best position us to achieve our strategic and financial objectives. As an example, the continuing weakness of our performance in Europe in recent quarters has put significant pressure on our ability to achieve our 2016 financial targets. We continue to believe that scale drives competitive advantage in this business and that our market opportunity is large. We also continue to target at least $2B in annual organic revenue in the future. However, based on our most recent outlook in light of our performance to-date in FY13, we now believe it is unlikely that we will achieve $2B in annual organic revenue in FY16 as we had originally targeted. On the profit side, we believe we have many levers to help us minimize the impact of our weaker revenue outlook. We continue to target our FY16 goal of $220 million of net income, plus or minus 10%, and over the next six months, we will work on evolving our plans to achieve this profit goal in light of our new revenue outlook. In FY12 and FY13, our focus has been to deemphasize near-term profits in order to fund significant investments targeting long-term revenue growth. In FY14 through FY16, as described previously, we expect to continue to invest for the long term, but we will also seek to drive margin improvements that make our long-term profit objective feasible. We believe we can achieve profit growth through a mix of the expected benefits of our strategy execution (such as improved gross margin due to manufacturing efficiencies) combined with a series of investment tradeoffs, improvements to our organizational effectiveness, advertising optimization and expense management. Not only do we believe such improvements and investment trade-offs will support near-term profitability, but we will seek to take actions consistent with our goal of long-term value creation. We have described in this presentation a mixed picture of our recent performance: • On the positive side, we believe that many of our strategic initiatives are gaining traction, and we are proud of what we have accomplished so far in areas like product quality improvements, our North American marketing improvements and revenue results, manufacturing, software development, customer service, digital products, the European photo book market, and APAC. • Conversely, our results in Europe have not been nearly what we had planned, and we believe our revenue challenges there will persist through at least the remainder of FY13. This creates significant ripple effects for the entire business. • As discussed in slide 5, we now have 18 months of historical data relating to our LTV based advertising investments, and we expect to make NPV-based optimization decisions as a result. Choosing to reduce our advertising as a percent of revenue in FY14 would likely impact our revenue growth negatively, but should improve our operating margins and the NPV of our still-substantial advertising budget. We have a varied set of similar inputs for our planning process for FY14 and beyond. Our current view of FY14 is that while we expect revenue growth will remain important during this time, it will be subsidiary to our goals of building solid operational and management foundations designed to address the shortcomings we have seen to date in certain parts of our business, and to building toward our 2016 profit objectives. As an example, depending on the options we choose to manage through our European challenges, we could decide to accept continued low revenue growth in Europe in FY14 as we focus on our efforts to become more customer centric and improve our execution and profitability there. As our team looks at the opportunities ahead of us, we want to focus on creating the best possible plan, and we will take the remainder of FY13 to do so, as we typically do in every annual planning cycle. |
 Investor Day Update 23 • Investor Day will be postponed to August 6, 2013 to align with our annual planning sequence • We expect a higher quality event at that time as we will have completed our FY14 planning process and can provide more concrete insight into our investment decisions and their impact to our long-term outlook |
 Finally, as our shareholders know, we had been planning to host an Investor Day on February 7, 2013. We have decided to postpone this event until after our Q4 2013 earnings announcement. The new date will be August 6, 2013. We believe that moving the date to the beginning of the new fiscal year, after we have completed our strategic and financial planning process for FY14, will give us the chance to provide our investors more concrete insight into our investment plans for FY14 and the impact we expect them to have on our longer-term revenue and earnings results. We apologize for any inconvenience caused by this decision, but expect our shareholders will find the postponed event to include a higher-quality discussion of our plans and outlook. Going forward, we would expect to continue to hold our annual Investor Day around the same time in August each year. |
 Summary • Solid revenue results relative to guidance, with continued mixed execution: o Stronger NA marketing execution o Weaker EU marketing execution • Strong progress in other parts of the business o Value proposition, LTV advertising, manufacturing o Foundations for future in digital, Asia & EU photo books • Believe we have the right strategy to drive o Long-term revenue and profit growth o Competitive advantage o Significant value for long-term shareholders 24 |
 In summary, our second fiscal quarter revenue results were solid relative to the expectations we set three months ago, but tracking below our longer-term aspirations largely due to continued challenges in our European business. We are working hard to address this issue, but believe this will not be a short-term turnaround. We are making good progress relative to our objectives in other areas, including improving our customer value proposition, investing in life time value based advertising, improving our manufacturing and supply chain capabilities, expanding our technology resources and laying foundations for future growth in digital, Asia and the European photo book market. We remain confident in the overall approach we are taking to drive long-term revenue and profit growth worldwide, and in our ability to respond flexibly to changing circumstances we might face in the future. We intend to continue to leverage the benefits of our scale and core capabilities, and believe that we are building toward a solid future of growth, competitive advantage and value for our long-term shareholders. |
 Q&A Session Please go to the Investor Relations section of www.vistaprint.com for the live Q&A call at 5:15 pm EDT on January 31, 2013 |
 Q2 Fiscal Year 2013 Financial and Operating Results Supplement |
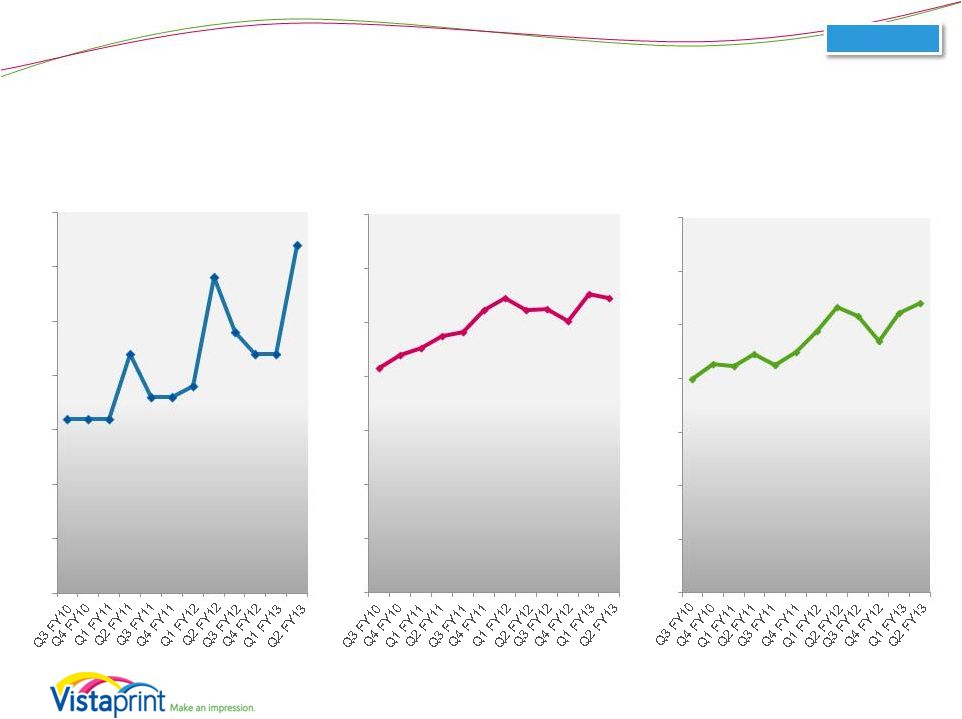
 Total Company Organic Growth Rates (Excludes Albumprinter and Webs) Note: Constant currency basis is estimated by translating all non-U.S. Dollar denominated revenue generated in the current period using the prior year period’s average exchange rate for each currency to the U.S. Dollar and excludes the impact of gains and losses on effective foreign currency hedges recognized in revenue. Please see reconciliation to reported revenue growth rates at the end of this presentation. 14% reported 14% constant-currency FY10 28% constant-currency growth 27 FY11 22% constant-currency growth FY12 20% constant-currency growth YTD FY13 14% constant-currency growth 0% 5% 10% 15% 20% 25% 30% 35% 40% 45% 50% Q3 FY10 Q4 FY10 Q1 FY11 Q2 FY11 Q3 FY11 Q4 FY11 Q1 FY12 Q2 FY12 Q3 FY12 Q4 FY12 Q1 FY13 Q2 FY13 Constant-Currency Reported Organic |
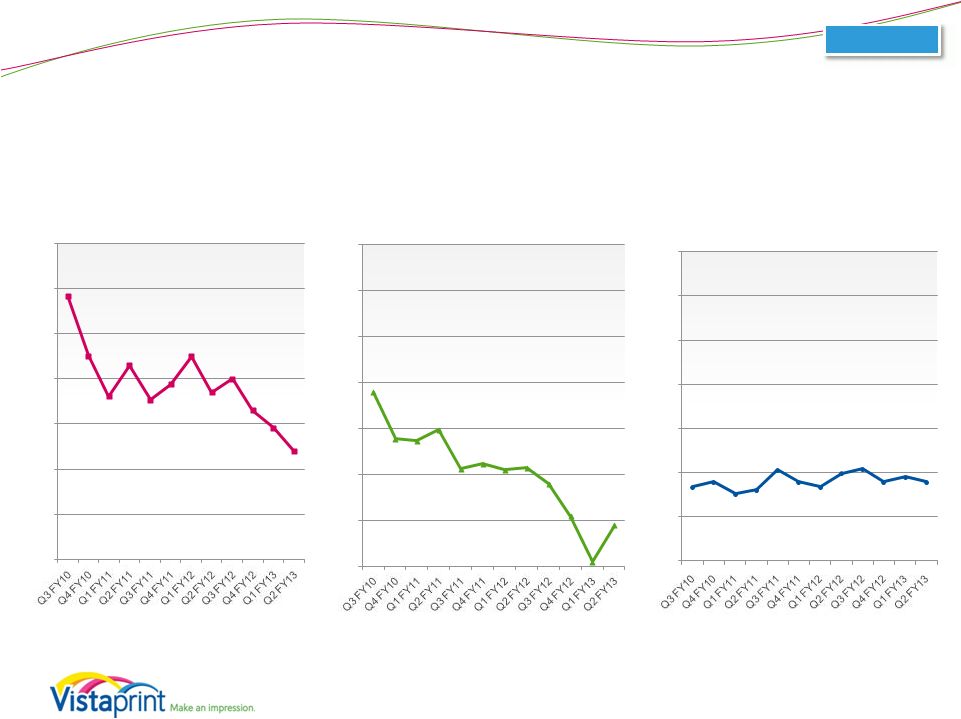 Segment Revenue Growth Rates Constant Currency Organic 28 Organic 10% 20% 30% 40% 50% 60% 70% APAC 10% 20% 30% 40% 50% 60% 70% Europe 10% 20% 30% 40% 50% 60% 70% North America 58% 45% 36% 43% 35% 39% 45% 37% 40% 33% 29% 24% 38% 28% 27% 30% 21% 22% 21% 22% 18% 11% 1% 9% 17% 18% 15% 16% 21% 18% 17% 20% 21% 18% 19% 18% 0% 0% 0% |
 Gross Margin and Gross Profit 29 FY10 64.2% FY11 64.8% FY12 65.2% FY13 YTD 66.3% Gross Profit (millions) GM % $234 64.1% 63.6% 63.1% 66.3% 65.3% 63.9% 63.2% 66.8% 65.5% 64.6% 65.0% 67.2% $106 $105 $108 $155 $133 $133 $134 $200 $169 $162 $163 Q3 FY10 Q4 FY10 Q1 FY11 Q2 FY11 Q3 FY11 Q4 FY11 Q1 FY12 Q2 FY12 Q3 FY12 Q4 FY12 Q1 FY13 Q2 FY13 Consolidated |
 GAAP Net Income (Loss) and Net Margin 30 FY10 $68 FY11 $82 FY12 $44 FY13 YTD $21 Consolidated GAAP Net Income (loss), in millions GAAP Net Margin 9.7% 7.1% 6.3% 14.5% 11.3% 6.9% 3.8% 10.6% 0.1% 1.5% -0.7% 6.6% 5.0% 0.0% 5.0% 10.0% 15.0% - Q3 FY10 Q4 FY10 Q1 FY11 Q2 FY11 Q3 FY11 Q4 FY11 Q1 FY12 Q2 FY12 Q3 FY12 Q4 FY12 Q1 FY13 Q2 FY13 $(2) $16 $12 $11 $34 $23 $14 $8 $32 $0 $4 $23 |
 Non-GAAP Adjusted Net Income* and Adjusted Net Margin *Non-GAAP adjusted net income for all periods presented excludes the impact of share-based compensation expense and its related tax effect, amortization of acquired intangibles, and charges related to the alignment of Webs IP with our global structure. Please see reconciliation to GAAP net income at the end of this presentation. 31 FY10 $91 FY11 $105 FY12 $77 FY13 YTD $45 Consolidated Non-GAAP Adjusted Net Income (millions) Non-GAAP Adjusted Net Margin 12.9% 10.5% 9.6% 17.3% 13.8% 9.4% 6.1% 12.6% 4.4% 3.5% 10.3% 5.9% $21 $17 $16 $40 $28 $20 $13 $38 $11 $15 $9 $36 Q3 FY10 Q4 FY10 Q1 FY11 Q2 FY11 Q3 FY11 Q4 FY11 Q1 FY12 Q2 FY12 Q3 FY12 Q4 FY12 Q1 FY13 Q2 FY13 |
 Q2 Income Statement Comparison to Prior Year (as a percentage of revenue) 32 Consolidated 9.5% 10.9% 7.6% 9.1% 11.5% 9.9% 38.6% 36.9% 32.8% 33.2% Q2 FY2013 Q2 FY2012 Cost of revenue Marketing and selling Technology and development General and administrative Income from operations |
 Q2 Income Statement Comparison to Prior Quarter (as a percentage of revenue) 33 Consolidated 9.5% 0.1% 7.6% 10.1% 11.5% 15.0% 38.6% 39.8% 32.8% 35.0% Q2 FY2013 Q1 FY2013 Cost of revenue Marketing and selling Technology and development General and administrative Income from operations |
 Share-Based Compensation* (millions) * Share-based compensation (SBC) expense includes SBC-related tax adjustment. 34 FY10 $23.2 FY11 $22.4 FY12 $26.1 Consolidated $5.3 $5.7 $5.6 $6.4 $5.3 $5.1 $4.9 $5.0 $7.6 $8.6 $8.4 $8.5 Q3 FY10 Q4 FY10 Q1 FY11 Q2 FY11 Q3 FY11 Q4 FY11 Q1 FY12 Q2 FY12 Q3 FY12 Q4 FY12 Q1 FY13 Q2 FY13 |
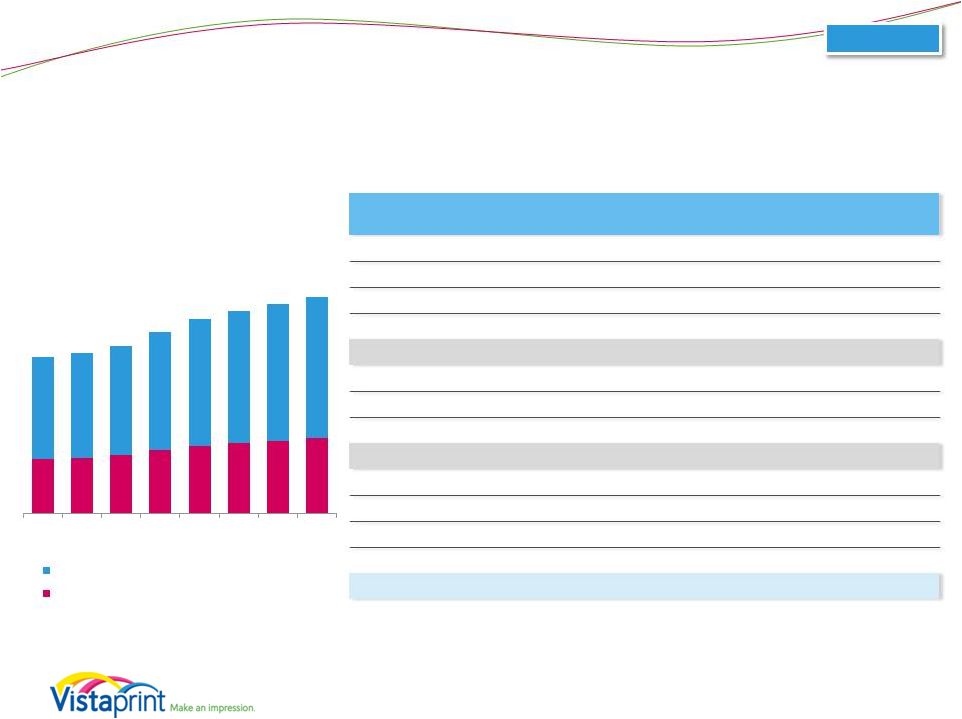
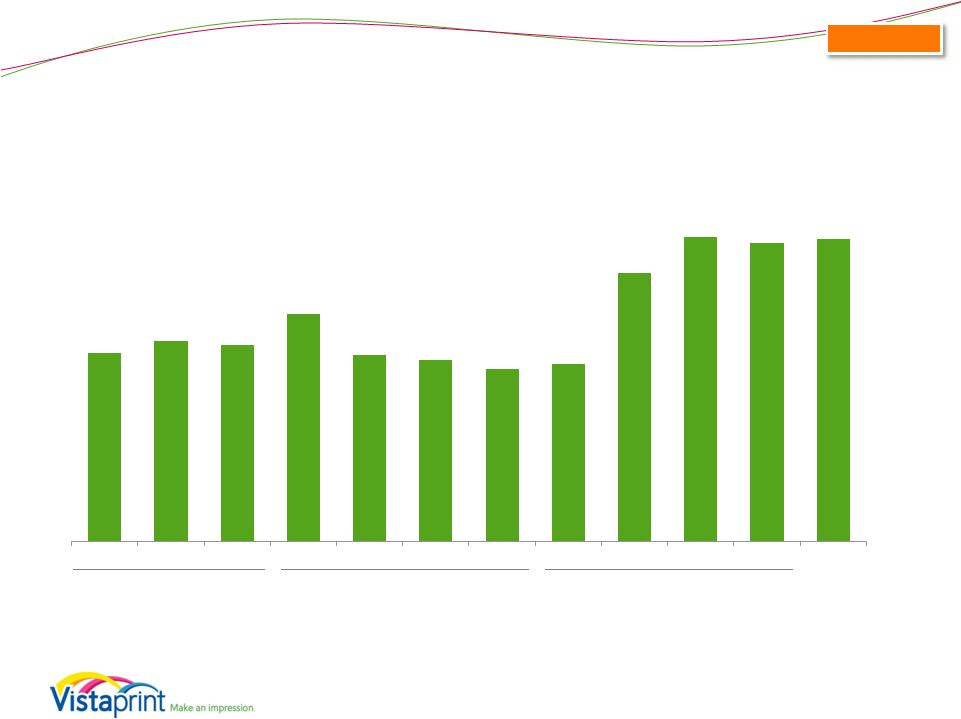
 Revenue Seasonality (Excludes Albumprinter and Webs) * Home and family revenue is calculated using a product format-based approach 35 Organic $166 $164 $170 $234 $204 $209 $212 $284 $244 $235 $233 $323 Q3 FY10 Q4 FY10 Q1 FY11 Q2 FY11 Q3 FY11 Q4 FY11 Q1 FY12 Q2 FY12 Q3 FY12 Q4 FY12 Q1 FY13 Q2 FY13 Small Business Marketing Home and Family* |
 Q2 FY 2013 Bookings by Marketing Channel (excludes Albumprinter and Webs bookings) ~3.2 million new customers in Q2 FY2013 Paid Search Other Channels and Partners 3 Party Permission- Based email Direct URL Type-In Paid Search Other Channels and Partners Our Own Permission-Based email Direct URL Type- In First-time Order Bookings: 32% Repeat Order Bookings: 68% Our Own Permission-Based email 36 Organic rd |
 Balance Sheet Highlights Balance Sheet highlights, in millions, at period end 12/31/12 09/30/12 06/30/12 3/31/12 12/31/11 Total assets $653.7 $620.5 $592.4 $588.0 $590.3 Cash and cash equivalents $64.7 $59.3 $62.2 $52.1 $67.5 Total current assets $132.3 $114.6 $115.6 $103.5 $123.7 Goodwill and intangible assets $179.2 $179.5 $180.7 $192.0 $196.6 Total liabilities $443.8 $421.3 $403.1 $306.0 $322.5 Current liabilities $182.4 $129.4 $142.0 $148.1 $166.2 Long-term debt $230.5 $259.3 $229.0 $126.5 $140.5 Shareholders’ Equity $209.9 $199.2 $189.3 $281.9 $267.8 Treasury shares (in millions) 16.4 15.7 15.8 13.0 13.1 37 Consolidated |
 Long-Term Debt Availability under our credit facility 12/31/12 Maximum aggregate available borrowing amounts $387.5M Outstanding borrowings of credit facility ($230.5M) Remaining amount $157.0M Limitations to borrowing due to debt covenants and other obligations* ($31.9M) Amount available for borrowing as of December 31, 2012 $125.1M 38 Consolidated • Credit facility in place with aggregate loan commitments of $387.5M • Interest rate is LIBOR plus 1.25% - 1.50% • Currently in compliance with all covenants. Key covenants are: Senior leverage ratio not to exceed 2.75x TTM EBITDA Total leverage ratio not to exceed 3.5x TTM EBITDA Interest coverage ratio of at least 3.0 Total cash/debt use for share repurchases of $400M since inception of credit facility (10/21/2011) * Our borrowing ability can be limited by our debt covenants each quarter. These covenants may limit our borrowing capacity depending on our leverage, other indebtedness, such as installment obligations and letters of credit, and other factors that are outlined in the credit agreement filed as an exhibit in our Form 8-K filed on October 26, 2011. |
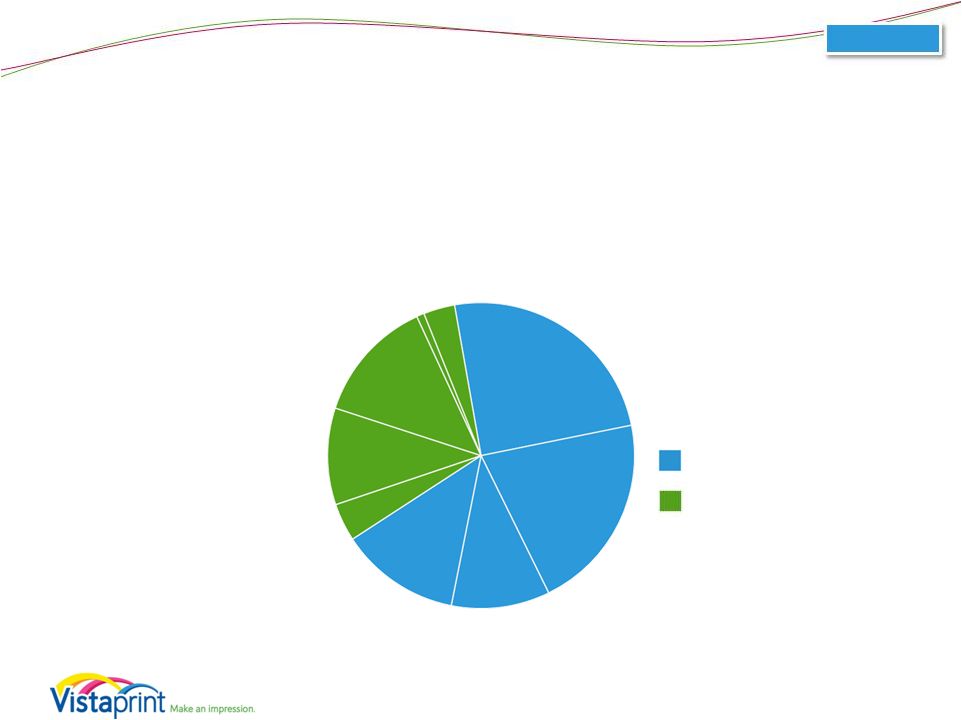
 Q2 FY13 Capital Expenditure Breakdown Q2 CapEx: $27.6M 1 3 2 1 Land, building and construction, leasehold improvements, and furniture and fixtures 2 3 IT infrastructure, software and office equipment 39 Consolidated 52% 32% 17% Land/Facilities Mfg & Automation Equipment Other equipment, pre-press and post-press equipment such as cutters, and automation equipment All manufacturing and automation equipment, including offset and digital print lines, other printing |
 Appendix Including a Reconciliation of GAAP to Non-GAAP Financial Measures |
 About non-GAAP financial measures To supplement Vistaprint’s consolidated financial statements presented in accordance with U.S. generally accepted accounting principles, or GAAP, Vistaprint has used the following measures defined as non-GAAP financial measures by Securities and Exchange Commission, or SEC, rules: non-GAAP adjusted net income, non-GAAP adjusted net income per diluted share, free cash flow, constant-currency revenue growth, and constant-currency organic revenue growth. The items excluded from the non-GAAP adjusted net income measurements are share-based compensation expense and its related tax effect, amortization of acquisition-related intangibles, and tax charges related to the alignment of acquisition- related intellectual property with global operations. Free cash flow is defined as net cash provided by operating activities less purchases of property, plant and equipment, purchases of intangible assets, and capitalization of software and website development costs. Constant-currency revenue growth is estimated by translating all non-U.S. dollar denominated revenue generated in the current period using the prior year period’s average exchange rate for each currency to the U.S. dollar and excludes the impact of gains and losses on effective foreign currency hedges recognized in revenue. Constant-currency organic revenue growth excludes the impact of currency as defined above and revenue from acquired companies. The presentation of non-GAAP financial information is not intended to be considered in isolation or as a substitute for the financial information prepared and presented in accordance with GAAP. For more information on these non-GAAP financial measures, please see the tables captioned “Reconciliations of Non-GAAP Financial Measures” included at the end of this release. The tables have more details on the GAAP financial measures that are most directly comparable to non-GAAP financial measures and the related reconciliation between these financial measures. (continued on next page) 41 |
 About non-GAAP financial measures continued… Vistaprint’s management believes that these non-GAAP financial measures provide meaningful supplemental information in assessing our performance and when forecasting and analyzing future periods. These non-GAAP financial measures also have facilitated management’s internal comparisons to Vistaprint’s historical performance and our competitors’ operating results. Management provides these non-GAAP financial measures as a courtesy to investors. However, to gain a more complete understanding of the company’s financial performance, management does (and investors should) rely upon GAAP statements of operations and cash flow. 42 |
 Reconciliation: GAAP to Non-GAAP Results FY 2003 FY 2004 FY 2005* FY 2006 FY 2007 FY 2008 FY 2009 FY2010 FY2011 FY2012 GAAP Net Income $473 $3,440 ($16,218) $19,234 $27,143 $39,831 $55,686 $67,741 $82,109 $43,994 Share-based compensation and related tax effect $0 $0 $0 $4,850 $8,765 $15,275 $20,177 $23,156 $22,400 $26,060 Amortization of acquired intangible assets - - - - - - - - - $5,754 Webs IP transfer - - - - - - - - - $1,235 Non-GAAP Adjusted Net Income $473 $3,440 $4,782 $23,146 $35,908 $55,106 $75,863 $90,897 $104,509 $77,043 Net Income – Annual ($ in thousands) *Fiscal 2005 non-GAAP results exclude a contract termination payment of $21mm Note: share-based compensation expense includes tax effects 43 |
 Reconciliation: GAAP to Non-GAAP Results . Fiscal Year 2010 Fiscal Year 2011 Fiscal Year 2012 Fiscal Year 2013 Q3 Q4 Q1 Q2 Q3 Q4 Q1 Q2 Q3 Q4 Q1 Q2 GAAP Net Income $16,167 $11,650 $10,781 $34,014 $22,917 $14,397 $8,172 $31,697 $274 $3,851 $(1,696) $22,960 Share-based compensation and related tax effect $5,315 $5,662 $5,550 $6,435 $5,285 $5,129 $4,876 $5,021 $7,566 $8,596 $8,445 $8,540 Amortization of acquired intangible assets - - - - - - - $1,148 $2,381 $2,225 $2,178 $2,243 Webs IP Transfer - - - - - - - - $1,017 $218 - $2,164 Non-GAAP Adjusted Net Income $21,482 $17,312 $16,331 $40,449 $28,202 $19,526 $13,048 $37,866 $11,238 $14,890 $8,927 $35,907 Net Income (Loss) – Quarterly ($ in thousands) 44 |
 Diluted Earnings Per Share - Annual Reconciliation: GAAP to Non-GAAP Results 45 FY 2006 FY 2007 FY 2008 FY 2009 FY2010 FY2011 FY2012 GAAP Net Income Per Share $0.45 $0.60 $0.87 $1.25 $1.49 $1.83 $1.13 Share-based Compensation Per Share* $0.09 $0.18 $0.31 $0.43 $0.49 $0.47 $0.65 Amortization of acquired intangible assets - - - - - - $0.14 Webs IP Transfer - - - - - - $0.03 Non-GAAP Adjusted Net Income Per Share $0.54 $0.78 $1.18 $1.68 $1.98 $2.30 $1.95 Weighted average shares used in computing Non- GAAP EPS (millions) 42.651 45.825 46.780 45.099 45.989 45.448 39.426 *Note: share-based compensation expense includes tax effects |
 Reconciliation: GAAP to Non-GAAP Results . Fiscal Year 2010 Fiscal Year 2011 Fiscal Year 2012 Fiscal Year 2013 Q3 Q4 Q1 Q2 Q3 Q4 Q1 Q2 Q3 Q4 Q1 Q2 GAAP Net Income Per Share $0.35 $0.26 $0.24 $0.75 $0.51 $0.32 $0.19 $0.82 $0.01 $0.10 $(0.05) $0.66 Share-based Compensation Per Share* $0.11 $0.12 $0.12 $0.14 $0.12 $0.11 $0.12 $0.12 $0.20 $0.23 $0.24 $0.24 Amortization of acquired intangible assets - - - - - - - $0.03 $0.06 $0.06 $0.06 $0.06 Webs IP Transfer - - - - - - - - $0.02 $0.01 - $0.06 Non-GAAP Adjusted Net Income Per Share $0.46 $0.38 $0.36 $0.89 $0.63 $0.43 $0.31 $0.97 $0.29 $0.40 $0.25 $1.02 Weighted average shares used in computing Non- GAAP EPS (millions) 46.231 46.136 45.704 45.625 45.079 45.156 42.569 39.041 38.346 37.620 35.793 35.156 Earnings Per Diluted Share - Quarterly *Note: share-based compensation expense includes tax effects 46 |
 Reconciliation: Free Cash Flow (in thousands) 47 Three Months Ended Six Months Ended December 31, December 31 2012 2011 2012 2011 Net cash provided by operating activities $ 88,533 $ 81,138 $ 95,183 $ 111,680 Purchases of property, plant and equipment (27,609) (13,447) (55,368) (24,445) Purchases of intangibles assets (361) (42) (370) (131) Capitalization of software and website development costs (1,839) (1,209) (3,140) (2,891) Free cash flow $ 58,724 $ 66,441 $ 36,305 $ 84,213 |
 Reconciliation: Constant-Currency Revenue Growth Rates Quarterly 48 Q3 FY10 Q4 FY10 Q1 FY11 Q2 FY11 Q3 FY11 Q4 FY11 Q1 FY12 Q2 FY12 Q3 FY12 Q4 FY12 Q1 FY13 Q2 FY13 Reported revenue growth 30% 22% 18% 20% 23% 27% 25% 28% 26% 20% 18% 16% Currency impact (5%) 0% 2% 3% (1%) (7%) (5%) 0% 2% 5% 5% 1% Revenue growth in constant currency 25% 22% 20% 23% 22% 20% 20% 28% 28% 25% 23% 17% Impact of acquisitions to growth in constant currency (7%) (7%) (8%) (10%) (3%) Revenue growth rate, ex acquisitions, in constant currency 25% 22% 20% 23% 22% 20% 20% 21% 21% 17% 13% 14% Note: Constant currency basis is estimated by translating all non-U.S. Dollar denominated revenue generated in the current period using the prior year period’s average exchange rate for each currency to the U.S. Dollar and excludes the impact of gains and losses on effective foreign currency hedges recognized in revenue. |
 Reconciliation: Constant-Currency Revenue Growth Rates Annual 49 FY2009 FY2010 FY2011 FY2012 Reported revenue growth 29% 30% 22% 25% Currency impact 7% (2%) - 0% Revenue growth in constant currency 36% 28% 22% 25% Impact of acquisitions to growth in constant currency - - - (5%) Revenue growth rate, ex acquisitions, in constant currency 36% 28% 22% 20% Note: Constant currency basis is estimated by translating all non-U.S. Dollar denominated revenue generated in the current period using the prior year period’s average exchange rate for each currency to the U.S. Dollar and excludes the impact of gains and losses on effective foreign currency hedges recognized in revenue. |
 Reconciliation: Geographic Segment Constant-Currency Revenue Growth Rates and Reported Growth Rates 50 Q2 FY2013 North America Europe Asia-Pacific Total Company Reported revenue growth 20% 11% 26% 16% Currency impact -% 3% (2%) 1% Revenue growth in constant currency 20% 14% 24% 17% Impact of acquisitions to growth in constant currency (2%) (5%) - (3%) Revenue growth rate, ex acquisitions, in constant currency 18% 9% 24% 14% Note: Constant currency basis is estimated by translating all non-U.S. Dollar denominated revenue generated in the current period using the prior year period’s average exchange rate for each currency to the U.S. Dollar and excludes the impact of gains and losses on effective foreign currency hedges recognized in revenue. |