 Q3 Fiscal Year 2013 Earnings Presentation, Commentary & Financial Results Supplement April 25, 2013 |
 This document is Vistaprint’s third quarter fiscal year 2013 earnings commentary. This document contains slides and accompanying comments in the “notes” section below each slide. |
 Safe Harbor Statement 2 This presentation and the accompanying notes contain statements about our future expectations, plans and prospects of our business that constitute forward-looking statements for purposes of the safe harbor provisions under the Private Securities Litigation Reform Act of 1995, including but not limited to our financial guidance, outlook, expectations, and investment areas for the fourth quarter and fiscal year 2013; our planned investments in our business and the anticipated effects of those investments; our operational growth strategy and the anticipated development of our business and financial results in response to our strategy; and the anticipated growth and development of our business and markets, especially in Europe and Asia-Pacific. Forward-looking projections and expectations are inherently uncertain, are based on assumptions and judgments by management, and may turn out to be wrong. Our actual results may differ materially from those indicated by these forward-looking statements as a result of various important factors, including but not limited to flaws in the assumptions and judgments upon which our projections and guidance are based; our failure to execute our strategy; our failure to make the investments in our business that we plan to make or the failure of those investments to have the effects that we expect; our failure to identify and address the causes of our revenue weakness in Europe; our failure to acquire new customers and enter new markets, retain our current customers, and sell more products to current and new customers; the willingness of purchasers of marketing services and products to shop online; currency fluctuations that affect our revenues and costs; costs and disruptions caused by acquisitions; the failure of our acquired businesses to perform as expected; difficulties or higher than anticipated costs in integrating the systems and operations of our acquired businesses into our systems and operations; unanticipated changes in our market, customers or business; our failure to promote and strengthen our brand; the failure of our current and new marketing channels to attract customers; our failure to manage the growth, changes, and complexity of our business and expand our operations; competitive pressures; our failure to maintain compliance with the financial covenants in our revolving credit facility or to pay our debts when due; costs and judgments resulting from litigation; changes in the laws and regulations or in the interpretations of laws or regulations to which we are subject, including tax laws, or the institution of new laws or regulations that affect our business; and general economic conditions. You can also find other factors described in our Form 10-Q for the fiscal quarter ended December 31, 2012 and the other documents we periodically file with the U.S. Securities and Exchange Commission. |
 Please read the above safe harbor statement. Additionally, a detailed reconciliation of GAAP and non-GAAP measures is posted in the appendix of the Q3 fiscal 2013 earnings presentation that accompanies these remarks. |
 Presentation Organization & Call Details 3 Presentation Organization: • Quarterly review and operational update • Q3 FY13 operating and financial results • Looking ahead o Remainder of FY13 o Guidance o Early thoughts on FY14 • Supplementary information • Reconciliation of GAAP to Non-GAAP results Live Q&A Session: • 5:15 p.m. Eastern • Link from the IR section of www.vistaprint.com • Hosted by: Robert Keane President & CEO Ernst Teunissen EVP & CFO |
 This presentation is organized into the categories shown on the left hand of this slide. Robert Keane, CEO, and Ernst Teunissen, CFO, will host a live question and answer conference call at 5:15 p.m. US Eastern time which you can access through a link on the investor relations section of www.vistaprint.com. |
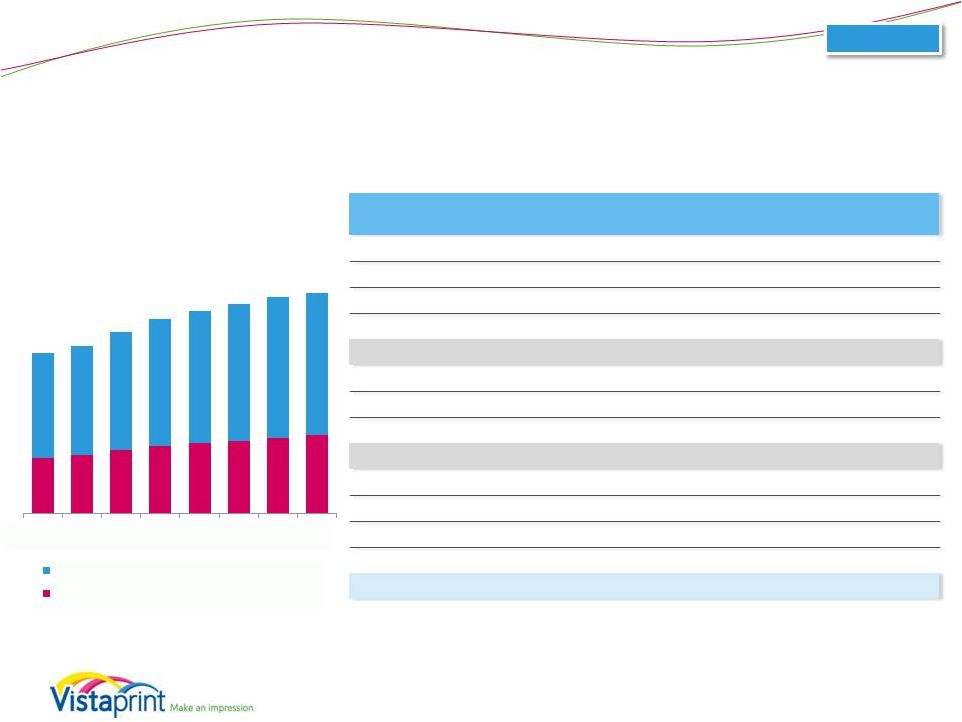
 Quarterly Financial Results 4 Consolidated $0.32 $0.19 $0.82 $0.01 $0.10 $(0.05) $0.66 $0.17 $0.43 $0.31 $0.97 $0.29 $0.40 $0.25 $1.02 $0.48 Q4 FY11 Q1 FY12 Q2 FY12 Q3 FY12 Q4 FY12 Q1 FY13 Q2 FY13 Q3 FY13 GAAP EPS* Non-GAAP EPS* $209 $212 $300 $258 $250 $251 $348 $288 Q4 FY11 Q1 FY12 Q2 FY12 Q3 FY12 Q4 FY12 Q1 FY13 Q2 FY13 Q3 FY13 Webs revenue (millions) Albumprinter revenue (millions) Organic revenue (millions) Revenue and EPS results for the consolidated business, including Albumprinter and Webs results since October 31, 2011 and December 28, 2011 (dates of purchase, respectively). Non-GAAP adjusted net income per diluted share for all periods presented excludes the impact of share-based compensation expense and its related tax effect, amortization of acquired intangible assets and a tax charge related to the alignment of Webs IP with our global structure. Please see reconciliation to GAAP net income (loss) at the end of this presentation. * Per diluted share |
 Our consolidated revenue in the third quarter of fiscal 2013 was in the upper part of the guidance range we set three months ago. Revenue grew 12% on a consolidated constant currency basis, to $288 million, including revenue from our Albumprinter and Webs acquisitions. On an organic constant currency basis, revenue grew 11% globally. GAAP earnings per share for the quarter was also ahead of our expectations at $0.17, driven by lower advertising expense as a percent of revenue, lower than expected operating expenses, and strong gross margin performance. Our outlook remains relatively unchanged versus the commentary we provided in January. As described previously, we’re working to improve our execution in Europe. In Asia-Pacific, the majority of our revenue is in Australia and New Zealand, where we have high relative market share and have aggressively moved toward more customer-centric marketing approaches, including changes to pricing and the presentation of our offers. This has led to slowing near-term growth prospects in the region. In North America, we continue to execute well against our long-term strategic initiatives, but we have not yet seen a meaningful increase in customer retention, which we would expect to see over the longer-term. On the profit side, we continue to execute well and we expect to deliver EPS at or above our previous expectations for the year. |
 Operational Update 5 • Organic constant-currency results still mixed o North America up 15% o Europe up 5% o Asia Pacific up 10% • Continued effort to improve execution in Europe and drive toward a more customer-centric culture globally • Acquired companies (Albumprinter and Webs) o Post-acquisition integration on track o Both grew >25% year over year in constant currencies |
 At a high level, our operational results were as follows: • Organic revenue growth by region continues to vary. Our new customer growth continues to be relatively in line with our expectations given our advertising spend, and our repeat orders continue to lag our expectations. The many changes we are making to customer experience, pricing, and our marketing and merchandising approach continue to create headwinds for revenue. But we remain confident that our approach will benefit customers, the company and our shareholders over the longer term. • We continue to make strides in aligning our marketing organization globally and laying the foundations to improve our European marketing execution. This quarter, we continued to evolve our organizational structure in marketing, and our European team delivered on the targets we set three months ago. We are doing this in tandem with an ongoing cultural shift at the company to become more customer centric. As described last quarter, we expect our efforts to take time to drive a noticeable difference in our revenue growth rates. • Moving to the acquisitions we made last year, both Albumprinter and Webs are performing well, each having grown over 25% year-over-year in Q3. We are on track with our major integration activities as well. |
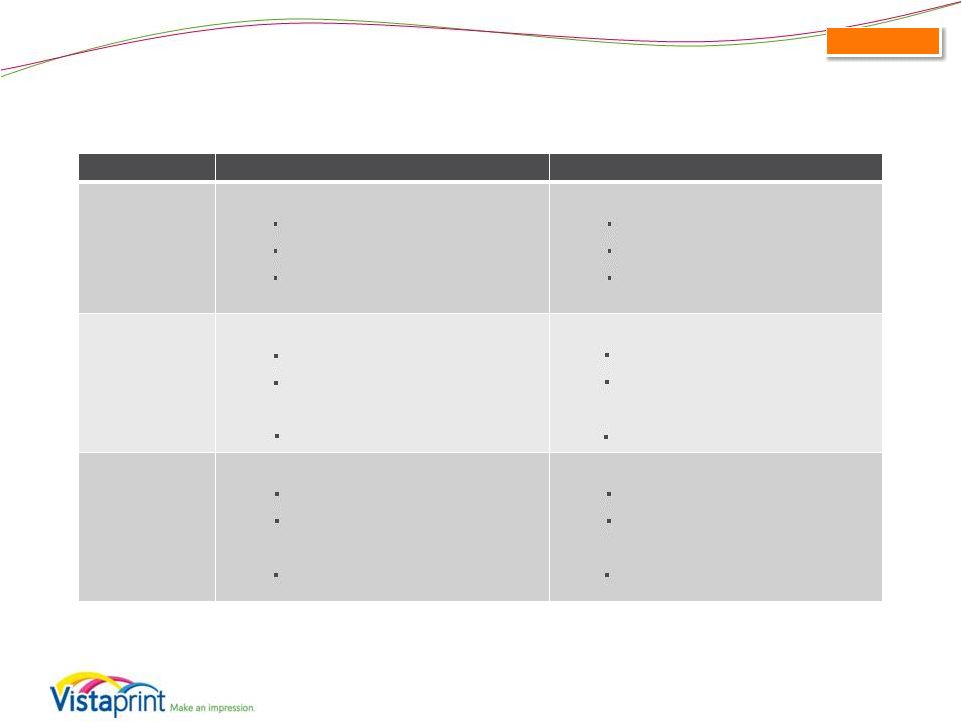
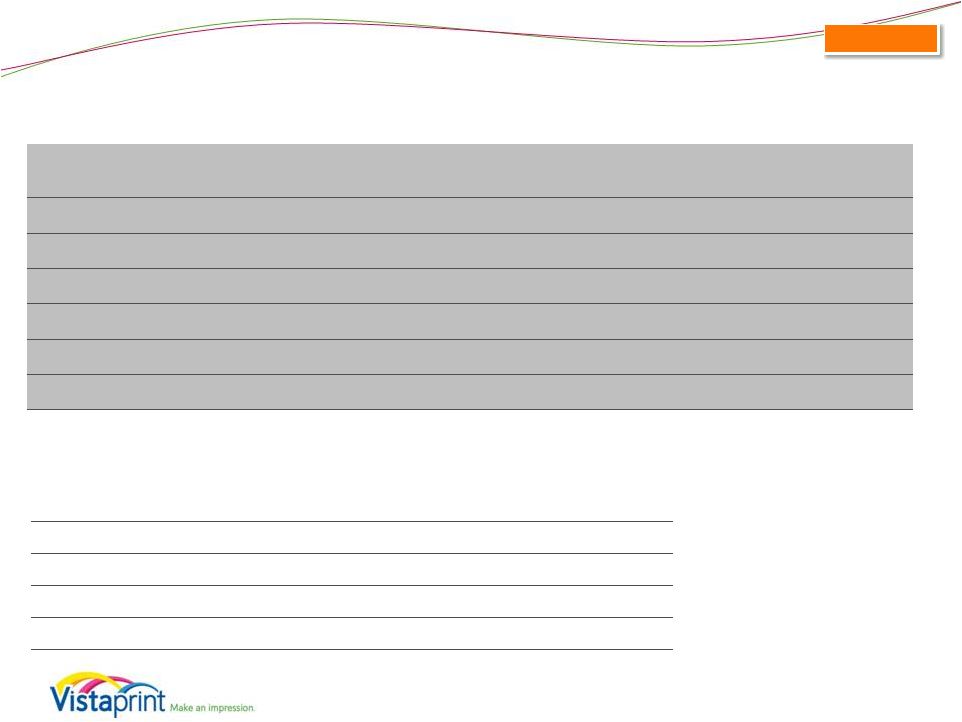
 Operational Performance: Reinvigorate Growth in the Core Business 6 Strategy Element Description Long-Term Goals Q3 FY13 Results/Examples Major improvements to customer experience, satisfaction and loyalty Change success metrics from short-term transaction-focused value to longer-term life time value and achieve higher life time value per customer • Continued improvements in net promoter score, a leading retention indicator • Continued testing changes to pricing transparency, simplicity and consistency • New content designs • New tools to reduce printing errors • Customer service improvements Invest more deeply into selected traditional Vistaprint marketing channels and expand in relatively new channels such as broadcast with higher than average COCA, but attractive longer term ROI Accelerate new customer acquisition Reach offline audiences not currently looking to online suppliers • Refining modeling and measurement to help optimize spend • Leverage customer research to define branding attributes Accelerate investment in production process improvements, employee training, supply chain management and manufacturing-related engineering Step function changes in quality and reliability Significantly lower unit manufacturing costs • Continued improvements to manufacturing operating metrics (quality, speed, delivery, cost, reliability) • Quality conformance and problem resolution initiative Customer Value Proposition Improvements Life Time Value Based Marketing World Class Manufacturing |
 During the quarter, we made progress in each of our strategic initiatives to reinvigorate growth in our organic business. In terms of improving our customer value proposition, this quarter we continued our efforts to improve the clarity of pricing, offers and messaging; we continued with extensive market research; we introduced new premium graphic design templates for key marketing products; we utilized new behind- the-scenes software tools that help minimize printing errors and enhance the customer experience; and we further empowered our customer service organization to assist our customers. In our LTV-based advertising initiatives, we are focused on refining our modeling and measurement techniques to help us optimize our advertising spend and gain efficiencies, and we are leveraging our customer research to inform future branding and advertising initiatives in various markets. Our manufacturing investments continue to drive improvements in process productivity, delivery reliability and product quality, and we also launched a new initiative to improve product quality conformance and drive faster problem resolution when issues arise. |
 Operational Performance: Build Foundations for Future Growth 7 Strategy Element Description Long-Term Goals Q3 FY13 Results/Examples Digital small business marketing offerings (websites, email marketing, social media) Lay foundations for continued rapid growth five and more years in the future Seek M&A opportunities of firms that possess technology, market presence and/or expertise in target areas • Continued digital subscriber adds in Q3 with continued increase in ARPU • Strong Webs revenue growth • New product feature: Pagemodo Posts • Continued with Webs integration; on track for deliverables Enable customers to share and preserve memories through personalized products for home and family use • Strong Albumprinter revenue growth • New design content for invitations and announcements products • New wedding site experience and wedding design content Expand to markets beyond Europe and North America Current focus on building foundation for future growth in Asia • Continued organizational building of teams in Singapore and India • Minority investment in China • Strong growth off of small Japanese business • Significant commitment of financial resources for the foreseeable future Digital Marketing Home & Family Geographic Expansion |
 In addition to our initiatives in our organic business, our efforts to build foundations for future growth in adjacent markets continued. Digital: Our Vistaprint-branded digital subscriber base was 356,000 customers as of March 31, with continued improvement in monthly revenue per customer. In addition, we made significant progress on product development and integration activities. In the third quarter, we launched a new feature for Pagemodo called Pagemodo Posts, which helps customers generate content to engage their customers over social media. We are tracking to an on- schedule launch of a new version of Vistaprint web sites with the same site builder designed and utilized by Webs at its heart – we expect this over the summer. And we continue to drive toward an integrated experience for a customer to purchase physical products with content that matches their digital web site. Home and Family: Albumprinter performed very well during the quarter as we continue to expand our sales of photo books in Europe. In our organic business, we launched new designs for our invitations and announcements product lines, and delivered an enhanced wedding site where brides-to-be can purchase all the paper products they need for a successful wedding, including save the dates, invitations, thank you cards, menus, place cards and more. We’ve been adding new premium design content so that brides don’t have to sacrifice style to meet their budget. Geographic Expansion: Finally, we continued to build out our teams in Singapore, India and, via our indirect minority investment, China. In Japan, we continue to see strong growth off of a small revenue base. These geographic markets are not expected to have any significant impact on our revenue in the near term, but we remain confident that that they offer attractive longer term growth opportunities for Vistaprint. Our investments here are, in aggregate, a significant financial commitment that will continue for the foreseeable future. |
 Q3 FY 2013 Financial and Operating Results 8 |
 Q3 FY 2013: Key Financial Metrics* 9 * Financial metrics for the consolidated business, including Albumprinter results since October 31, 2011 and Webs results since December 28, 2011 (dates of purchase). ** Non-GAAP adjusted net income and non-GAAP adjusted EPS exclude share-based compensation expense and its related tax effect, amortization of acquired intangible assets, and charges related to the alignment of Webs IP with our global operations. Please see reconciliation to GAAP net income (loss) and EPS at the end of this presentation. Quarter Ended 03/31/2013 YTD Period Ending 03/31/2013 Revenue • $287.7 million 12% y/y growth 12% y/y constant currency growth 11% y/y organic constant currency (ex-acquisitions) • $887.4 million 15% y/y growth 17% y/y constant currency growth 13% y/y organic constant currency (ex-acquisitions) GAAP Net Income • $5.9 million 2.0% net margin vs. 0.1% last year significant increase y/y • $0.17 Diluted EPS significant increase y/y • $27.1 million 3.1% net margin vs. 5.2% last year decrease of 32% y/y • $0.78 Diluted EPS decrease of 23% y/y Non-GAAP Adjusted Net Income** • $16.9 million 5.9% net margin vs. 4.4% last year increase of 51% y/y • $0.48 Non-GAAP Diluted EPS increase of 66% y/y • $61.8 million 7.0% net margin vs. 8.1% last year decrease of 1% y/y • $1.75 Non-GAAP Diluted EPS increase of 13% y/y Consolidated |
 Turning to financials, and as noted above, Vistaprint generated revenue of $288 million in the third quarter, reflecting a 12% year-over-year increase. In organic constant-currency terms, excluding Albumprinter and Webs, this reflected 11% year-over-year growth for the business, at the high end of the constant-currency expectations we set three months ago. GAAP net income for the third quarter was $5.9 million, or 2.0% of revenue, reflecting an increase versus an essentially break-even quarter in the year-ago period. GAAP EPS in the third quarter was $0.17, compared to $0.01 in the year-ago-period. We have passed the one-year anniversary of the acquisitions of Webs and Albumprinter, so our year-over-year net income comparison is more favorable than in the first half of 2013. Additionally, as mentioned previously, we have begun to slow our expense growth, which had a meaningful impact on our profits in the third quarter. Non-GAAP adjusted net income in the third quarter was $16.9 million, or 5.9% of revenue, reflecting an increase of 51% year over year. Non-GAAP adjusted EPS was $0.48 in the third quarter of fiscal 2013, which is up 66% year over year. Both GAAP and non-GAAP EPS reflect the benefit of a lower share count year-over year due to past share repurchases. |
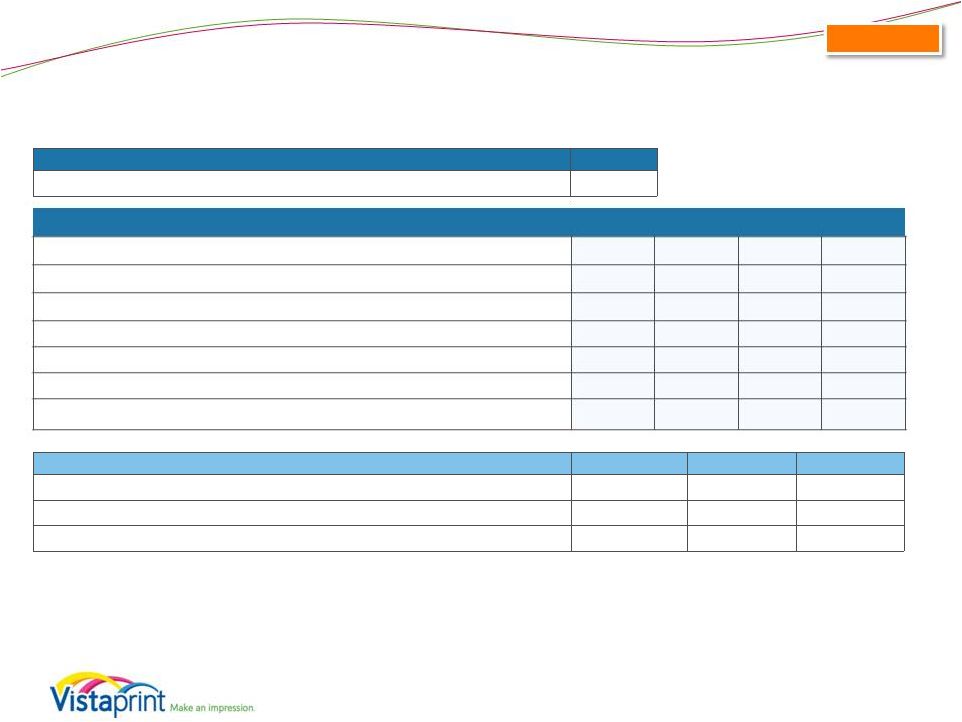 Cash Flow & ROIC Highlights* Quarterly cash flows and investments (in millions) Q3FY13 Q3FY12 YTD FY13 YTD FY12 Cash flow from operations $8.1 $9.6 $103.3 $121.3 Free cash flow** $(5.5) $(0.3) $30.8 $83.9 Capital expenditures $11.2 $8.5 $66.5 $32.9 as % of revenue 3.9% 3.3% 7.5% 4.3% Trailing Twelve Month Return on Invested Capital*** (GAAP) 8% 17% NA NA Trailing Twelve Month Return on Invested Capital*** (Non-GAAP) 18% 25% NA NA 10 Share repurchase program Q3FY13 April 1-17, 2013 YTD FY13 Shares purchased 410,400 493,700 1,731,446 Average cost per share $39.50 $37.90 $35.08 Total purchase spend, inclusive of transaction costs, in millions $16.2 $18.7 $59.7 Consolidated Balance sheet (in millions, as of March 31, 2013) Cash and cash equivalents $51.3 * Financial results for the consolidated business, including Albumprinter and Webs results ** FCF = Cash Flow from Operations – Capital Expenditures – Purchases of Intangible assets not related to acquisitions – Capitalized Software Expenses *** ROIC = NOPAT / (Debt + Equity – Excess Cash) Net operating profit after taxes (NOPAT) Excess cash is cash and investments of 5% of last twelve month revenues Operating leases have not been converted to debt Non-GAAP TTM ROIC excludes share-based compensation expense and its related tax effect, amortization of acquired intangibles, and charges related to the alignment of Webs IP with our global structure on NOPAT Excess cash definition updated in period ending 03/31/2013 and for prior periods. |
 Cash and cash equivalents were approximately $51.3 million as of March 31, 2013. During the quarter, Vistaprint generated $8.1 million in cash from operations, compared with $9.6 million in the third quarter of fiscal 2012. Free cash flow was ($5.5) million in the third quarter, down from ($0.3) million in the third quarter of fiscal 2012. On a trailing twelve-month basis, return on invested capital (or ROIC) as of March 31, 2013 declined due to the planned reduced profitability in our business during the fiscal year. Including share based compensation expense, it was approximately 8%, and excluding share based compensation expense, it was approximately 18%. We expect ROIC to improve significantly over time, as we expect our FY12 and FY13 investments to bear fruit later in FY14 and beyond. The company repurchased 410,400 shares during the quarter at an average cost per share of $39.50. Subsequent to the end of the quarter (through April 17, 2013), we have repurchased an additional 493,700 shares at an average cost per share of $37.90. Year to date (through April 17, 2013), we have repurchased a total of 1,731,446 shares at an average cost of $35.08. We have approximately 6.3 million shares left under the repurchase authorization approved by our shareholders in November 2012 and under the Supervisory Board approval of February 2013. We sought this approval for flexibility, and any decision to make additional repurchases will be weighed carefully by our Supervisory Board and Management Board, and will depend upon many factors. |
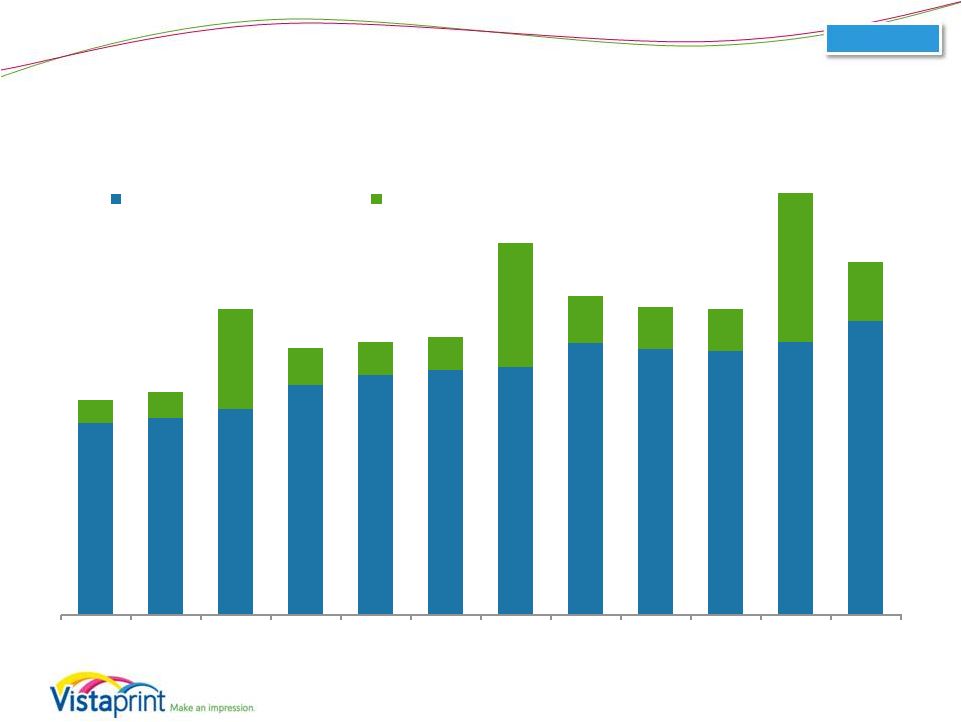
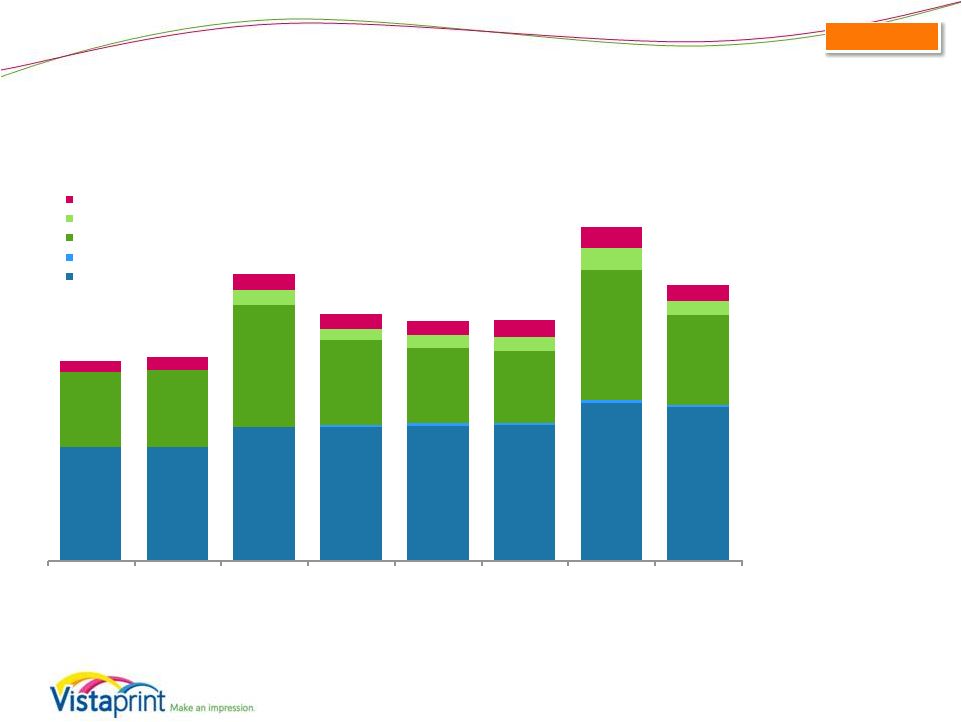 Geographic Segment Revenue - Quarterly (millions) North America: 57% of total revenue 15% y/y growth 15% y/y constant currency growth including Webs 15% y/y organic constant currency growth Europe: 37% of total revenue 8% y/y growth 8% y/y constant currency growth including Albumprinter 5% y/y organic constant currency growth Asia Pacific: 6% of total revenue 6% y/y growth 10% y/y constant currency growth Revenue results for the consolidated business, including Albumprinter and Webs results since respective acquisition dates. All Albumprinter revenue included in European segment. All Webs revenue included in NA segment. Please see reconciliation to reported revenue growth rates at the end of this presentation. Q3 FY2013 11 Consolidated $119.2 $118.7 $139.8 $139.7 $140.9 $141.6 $164.7 $160.1 $2.3 $2.5 $2.6 $2.8 $2.9 $77.8 $80.0 $127.3 $88.4 $79.1 $74.3 $136.5 $93.2 $15.7 $11.8 $12.9 $15.4 $22.8 $15.1 $11.8 $13.7 $17.0 $15.4 $15.1 $17.5 $21.5 $16.4 Q4 FY11 Q1 FY12 Q2 FY12 Q3 FY12 Q4 FY12 Q1 FY13 Q2 FY13 Q3 FY13 Asia-Pacific Albumprinter (inc. in Europe) Europe Webs (inc. in North America) North America Constant-currency revenue growth is estimated by translating all non-U.S. dollar denominated revenue generated in the current period using the prior year period’s average exchange rate for each currency to the U.S. dollar and excludes the impact of gains and losses on effective currency hedges recognized in revenue. |
 For the third quarter, revenue performance by geography, inclusive of Albumprinter and Webs revenues, was as follows: North American revenue was $163.0 million, reflecting 15% growth year over year in both reported and constant currency terms. This revenue is inclusive of the $2.9 million of revenue from the Webs acquisition. Excluding Webs, our North American business also grew 15% year over year in constant currency. The North American team continues to execute well against the key customer value initiatives we launched 18 months ago. With that said, we have yet to see the improvements we’ve made here in customer satisfaction translate into a meaningful increase in repeat revenue. We have however seen annual gross profit per customer improve in North America since the launch of our strategy. European revenue was $108.3 million, reflecting 8% growth year over year in both reported and constant currency terms. This revenue is inclusive of the $15.1 million of revenue from the Albumprinter acquisition. Excluding Albumprinter, our European business grew 5% year over year in constant currency. While this was in line with the expectations set three months ago, this growth was lower than what we believe is possible longer term in Europe. Although it is possible that the macroeconomic environment in Europe is having an impact on us, we can’t quantify it and do not believe this is a material cause of our below-plan performance. Instead we are focusing on improving our own value proposition and marketing execution in Europe. Asia-Pacific revenue was $16.4 million, reflecting 6% growth year over year in reported terms and 10% growth year over year in constant currency. As we mentioned last quarter, we expected growth rates in Asia-Pacific to remain relatively low for the foreseeable future as we are aggressively adopting pricing and offering changes here as part of our commitment to improving our customer value proposition, and as we reach relative maturity in the Australian and New Zealand markets, which currently constitute the vast majority of our revenue in this region and where we have high levels of market penetration. Our revenue in Japan, India and other parts of Asia Pacific are faster growing, but are currently a small part of our overall revenue in the region. Currency exchange rates in the quarter were essentially neutral to revenue growth year over year as most major currencies moved only slightly in comparison to Q3 FY2012 exchange rates. Sequentially, the Euro and Australian Dollar strengthened against the U.S. dollar, while the British Pound and Canadian Dollar weakened. The net effect of all currencies on revenue was neutral versus second quarter rates. Compared to the currency rates we assumed when we gave guidance in January, there was a negative currency impact on Q3 revenue of $1.4 million. |
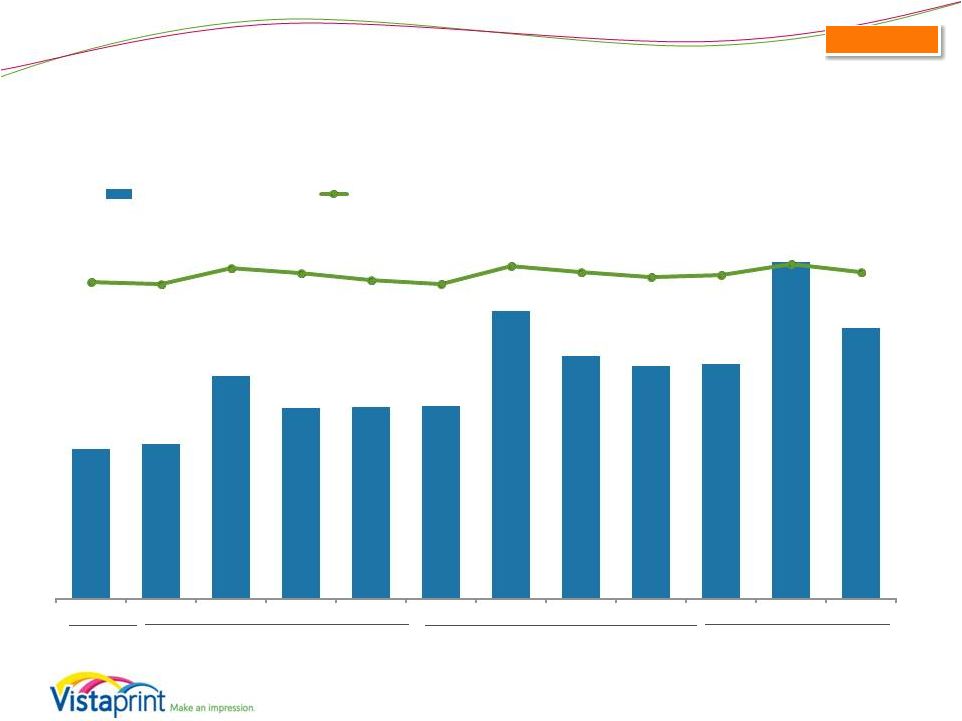
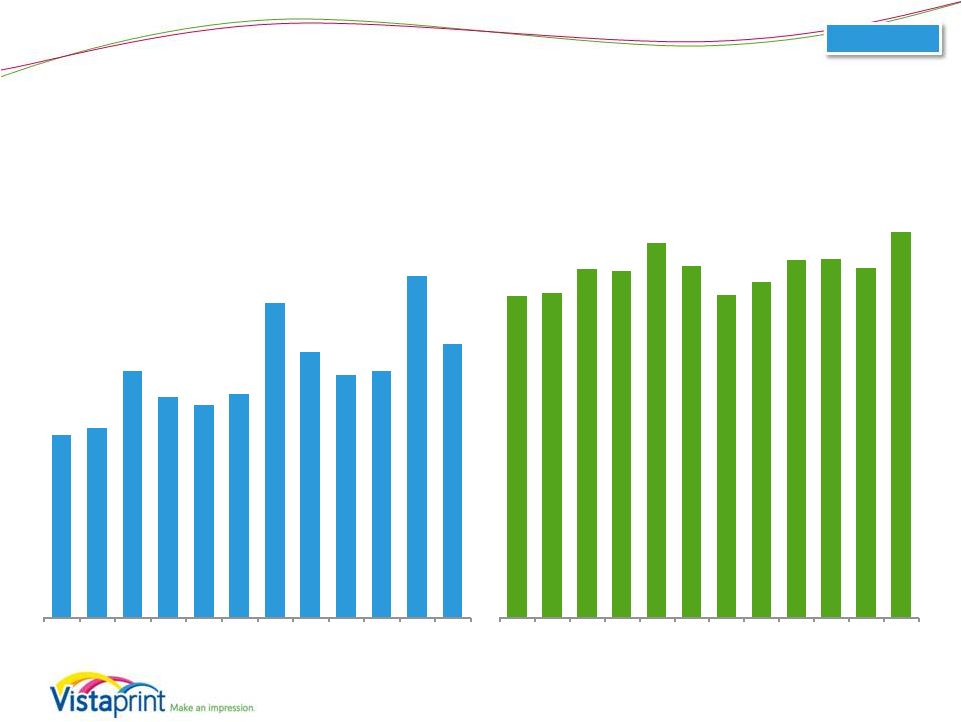 Operational Metrics (Excludes Albumprinter and Webs) 12 Organic $34.56 $34.69 $36.17 $36.03 $37.75 $36.38 $34.61 $35.38 $36.73 $36.78 $36.25 $38.43 Q4 FY10 Q1 FY11 Q2 FY11 Q3 FY11 Q4 FY11 Q1 FY12 Q2 FY12 Q3 FY12 Q4 FY12 Q1 FY13 Q2 FY13 Q3 FY13 Average Order Value 4.8 5.0 6.5 5.8 5.6 5.9 8.3 7.0 6.4 6.5 9.0 7.2 Q4 FY10 Q1 FY11 Q2 FY11 Q3 FY11 Q4 FY11 Q1 FY12 Q2 FY12 Q3 FY12 Q4 FY12 Q1 FY13 Q2 FY13 Q3 FY13 Orders (M) |
 Vistaprint’s organic business metrics, excluding Albumprinter and Webs, were as follows: Total orders processed in the quarter were approximately 7.2 million reflecting growth of 3% year over year. Average order value was $38.43, up 9% from an average order value of $35.38 in Q3 of last fiscal year. Both new and repeat AOV grew year over year. AOV was up year over year in North America and Europe, yet down slightly in Asia Pacific. These metrics should be viewed together and not individually, as factors such as currency, product mix, marketing campaigns, partner performance, seasonality, and the like, can impact them. |
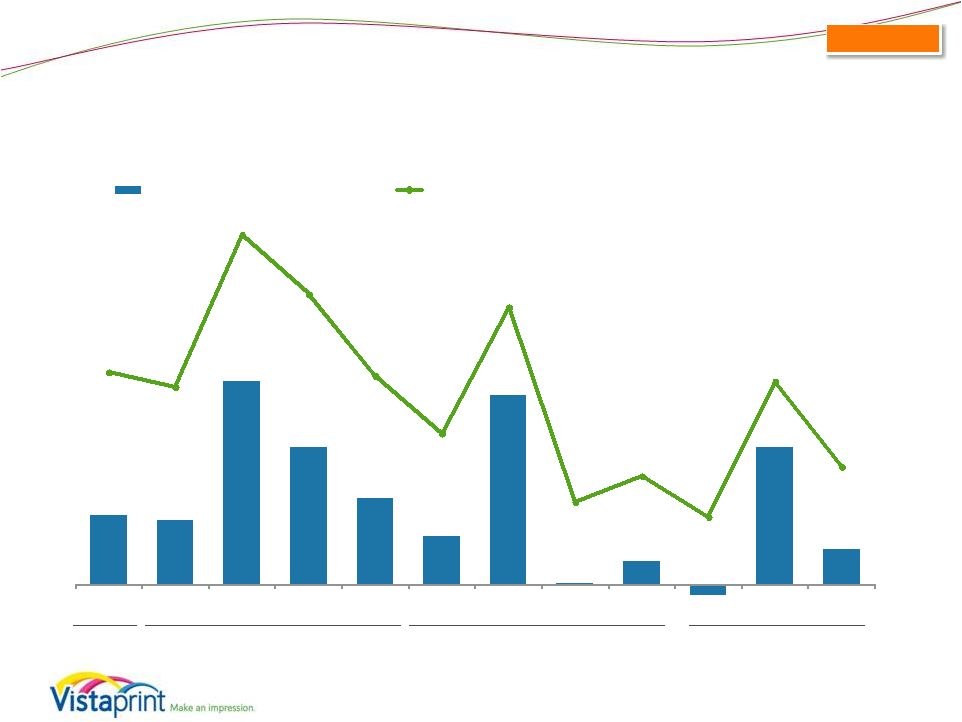
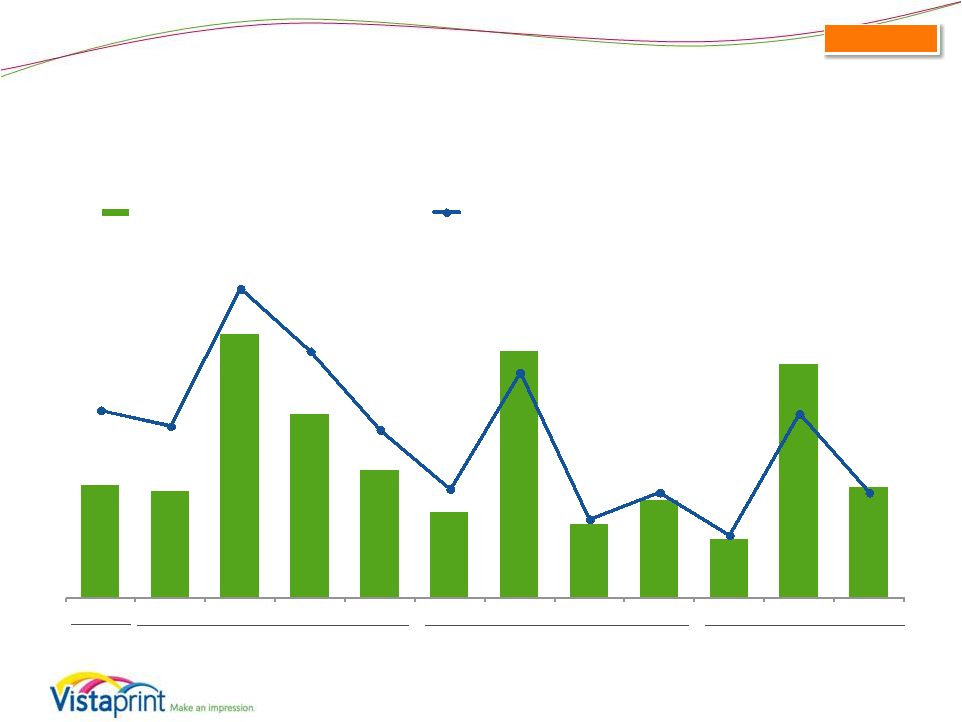
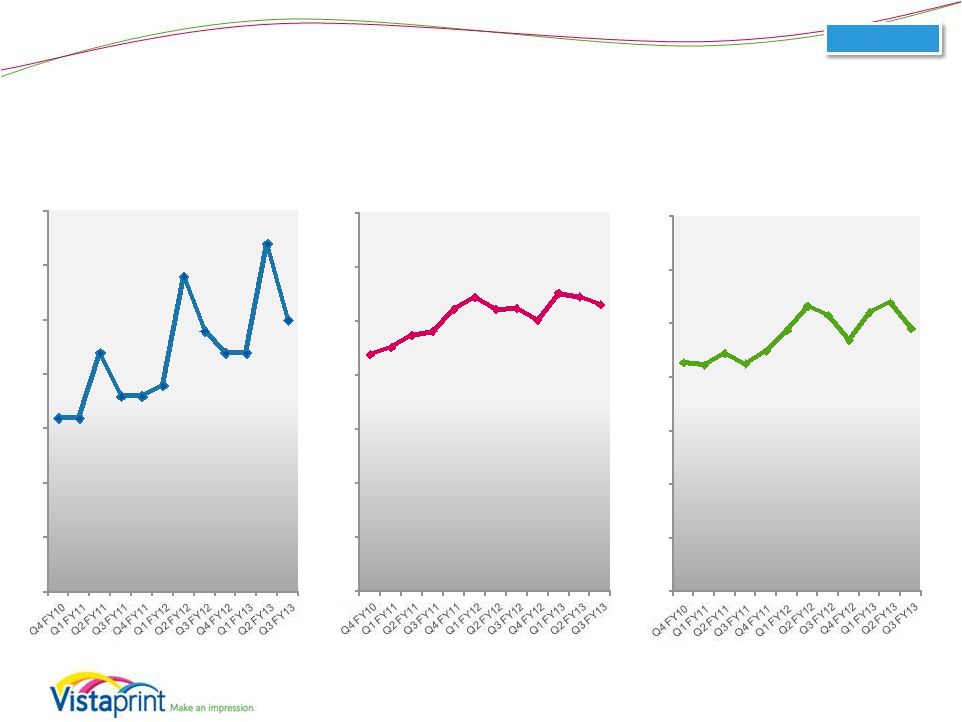 Operational Metrics (Excludes Albumprinter and Webs) 13 Organic 0.0 0.5 1.0 1.5 2.0 2.5 3.0 3.5 New Customers (million) 21% 21% 22% 21% 23% 24% 27% 26% 24% 26% 27% 25% 0% 5% 10% 15% 20% 25% 30% 35% Advertising as % of Revenue $22 $23 $24 $24 $26 $27 $26 $26 $25 $28 $27 $27 0 $ 5 $ 10 $ 15 $ 20 $ 25 $ 30 $ 35 $ Implied COCA 2.5 |
 Additional customer metrics for the organic business for the period ending March 31, 2013, were as follows: Quarterly new customer additions excluding Albumprinter and Webs were approximately 2.5 million, reflecting 4% year over year growth over the approximately 2.4 million new customer adds in Q3 of last fiscal year. New customer orders grew modestly in North America and Asia Pacific, but declined slightly year over year in Europe due to recent execution challenges as well as a deliberate trimming of planned advertising expense this quarter. Vistaprint uses the term “implied cost of customer acquisition” or “implied COCA” to describe total advertising expense in a period divided by the number of unique first time customers in that period. The second chart illustrates our implied COCA, at approximately $27, was roughly flat from Q2 to Q3 and was slightly higher than the prior fiscal year third quarter. Advertising costs for the organic business were $66.4 million, or 24.6% of organic revenue in the quarter. This is lower than recent quarters as we optimize spend as a result of applying learnings from past investments to our spending plans, as well as trimming the least efficient spend in Europe as our returns there are currently lower than initially anticipated. |
 Historical Revenue Driver Metrics (Quarterly) 14 15.7 11.4 11.9 *trailing twelve month at period end 12.9 Organic 13.8 14.4 14.9 15.4 Q4 FY11 Q1 FY12 Q2 FY12 Q3 FY12 Q4 FY12 Q1 FY13 Q2 FY13 Q3 FY13 TTM Unique Customers (M) 11.4 11.9 12.9 13.8 14.4 14.9 15.4 15.7 TTM New Customers (M) 7.4 7.7 8.4 9.0 9.4 9.7 10.0 10.1 TTM Repeating Customers (M) 4.0 4.2 4.5 4.8 5.0 5.2 5.4 5.6 TTM New Customers 65% 65% 65% 65% 65% 65% 65% 64% TTM Repeating Customers 35% 35% 35% 35% 35% 35% 35% 36% TTM Unique Customers 19% 19% 22% 24% 26% 25% 19% 14% TTM New Customers 16% 17% 20% 25% 27% 26% 19% 12% TTM Repeating Customers 25% 24% 25% 23% 25% 24% 20% 17% Implied Retention** 42% 42% 42% 43% 44% 44% 42% 41% As % of Unique Customers Y/Y Growth 4.0 4.2 4.5 4.8 5.0 5.2 5.4 5.6 7.4 7.7 8.4 9.0 9.4 9.7 10.0 10.1 Q4 FY11 Q1 FY12 Q2 FY12 Q3 FY12 Q4 FY12 Q1 FY13 Q2 FY13 Q3 FY13 TTM* Unique Customers (M) New Customers Aquired in Period Customers Repeating from Prior Periods **TTM repeating customers as % of year-ago unique customers |
 Our unique customer metrics for the organic business on a trailing twelve month basis were as follows: On a TTM basis for the period ending March 31, 2013, unique customer count was 15.7 million, reflecting 14% year over year growth of unique customers. First-time unique customers in the TTM period ending March 31, 2013 grew 12% year over year while unique customers transacting from prior periods grew 17% year over year. As we have described in the past, many of the changes we have made since the beginning of FY12 are impacting our metrics in different ways. While one of our long-term objectives is to increase retained customers as a percent of the prior year’s total unique customer count, we previously noted that this metric could decline in FY13 due to the significant acceleration of new customers we added in FY12 (the denominator of this metric), as well as some slowing of repeat order activity due in part to some of our customer value proposition changes (which influences the numerator of this metric). For example, excluding the impact of retail partners, the percentage of repeating customers from prior periods would have been flat sequentially. |
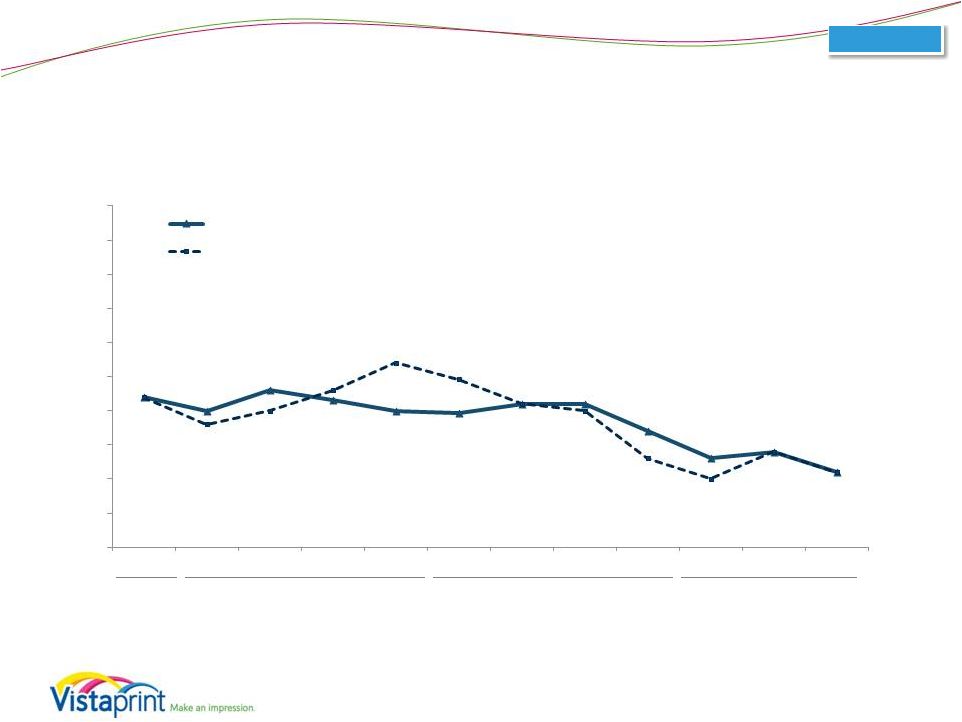
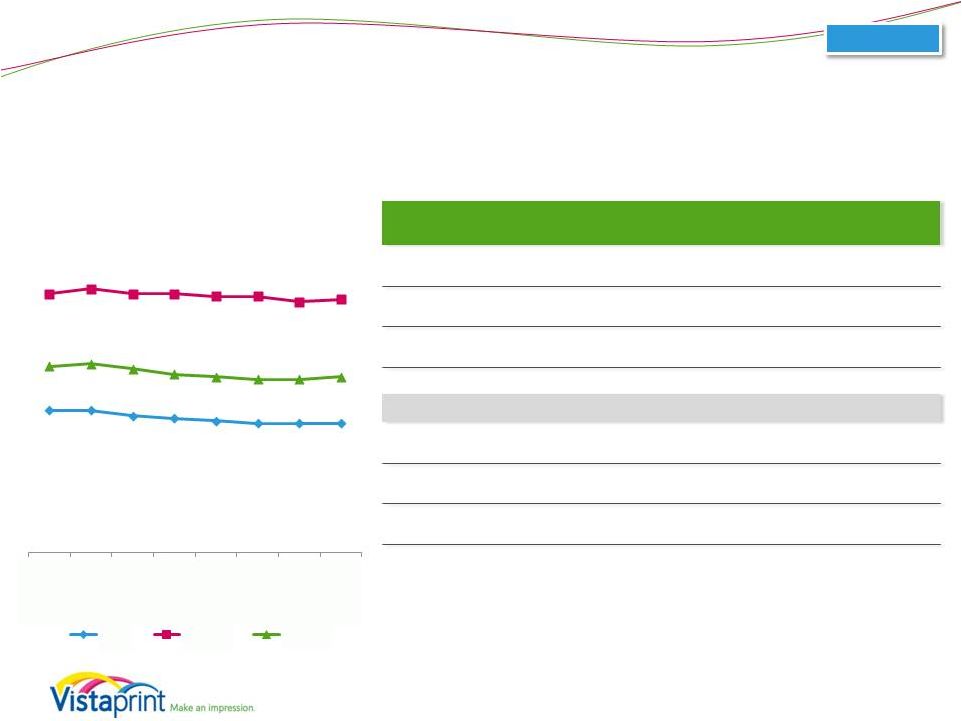 Historical Revenue Driver Metrics 15 Organic Q4 FY11 Q1 FY12 Q2 FY12 Q3 FY12 Q4 FY12 Q1 FY13 Q2 FY13 Q3 FY13 Average Spend per Unique Customer $72 $73 $71 $69 $68 $67 $67 $68 Average Spend per New Customer $55 $55 $53 $52 $51 $50 $50 $50 Average Spend per Repeat Customer $100 $102 $100 $100 $99 $99 $97 $98 Average Spend per Unique Customer 4% 1% (1%) (6%) (8%) (6%) (1%) Average Spend per New Customer 2% (2%) (4%) (7%) (9%) (6%) (4%) Average Spend per Repeat Customer 3% 2% 1% (1%) (3%) (3%) (2%) Y/Y Growth $55 $55 $53 $52 $51 $50 $50 $50 $100 $102 $100 $100 $99 $99 $97 $98 $72 $73 $71 $69 $68 $67 $67 $68 Q4 FY11 Q1 FY12 Q2 FY12 Q3 FY12 Q4 FY12 Q1 FY13 Q2 FY13 Q3 FY13 Average Spend Per Unique Customer (USD) New Repeat Total FY11-FY16, long-term target of low- to mid- single digit growth in bookings per unique customer. Average Customer Spend: |
 Average spend per unique customer for the organic business on a trailing twelve month basis for the period ended March 31, 2013 was as follows: • Average spend per unique customer during the TTM period ending March 31, 2013 was $68, reflecting a 1% decline year over year. We believe this decline was due to several factors, including: • Our marketing execution in Europe, where we are seeing TTM average spend per unique customer continue to decline and create a drag on the average. This was due to lower growth of average spend for both unique new and repeat customers in the TTM period; and • The impact of our success with wholesale partnerships such as FedEx Office and Staples, for which we receive wholesale revenue per order that is on average lower than our direct-to-customer business. • Average spend per new customer acquired in the TTM period was $50, reflecting a 4% decline year over year. This decrease was due to our new customer AOV trends which were down slightly in the earlier few quarters of the TTM period due in part to the impact of factors such as less aggressive cross-selling and growth of wholesale partnerships. • Average spend per customer transacting in prior periods during the TTM period was $98, reflecting a 2% decline year over year. |
 Looking Ahead 16 |
 FY13 Outlook Commentary 17 • Narrowing revenue guidance range with one quarter remaining in fiscal year o Operational performance on track o Currency fluctuations since January guidance reduce FY outlook by ~$4M o Result is that we are narrowing the revenue guidance range around the former guidance midpoint • Raising EPS guidance range o Strong annual profit performance despite revenue challenges |
 With just one quarter remaining in FY 2013, we are adjusting our full fiscal year guidance as follows: Revenue We are narrowing our revenue guidance range around the guidance midpoint set in January after adjusting for currency movements. • Operationally, our expectations for revenue are in line with the guidance we gave in January. • Currency has moved unfavorably since we gave guidance in January. We are adjusting our expectations to reflect an expected $4M impact for the year. EPS With three quarters behind us in the fiscal year, we remain confident in our ability to deliver EPS in line with or above our prior annual guidance range. As a result, we are raising our FY13 EPS guidance range. Given that our year to date GAAP EPS is $0.78, the new range implies that we would have a net loss in the fourth quarter at all parts of the range except the high end. |
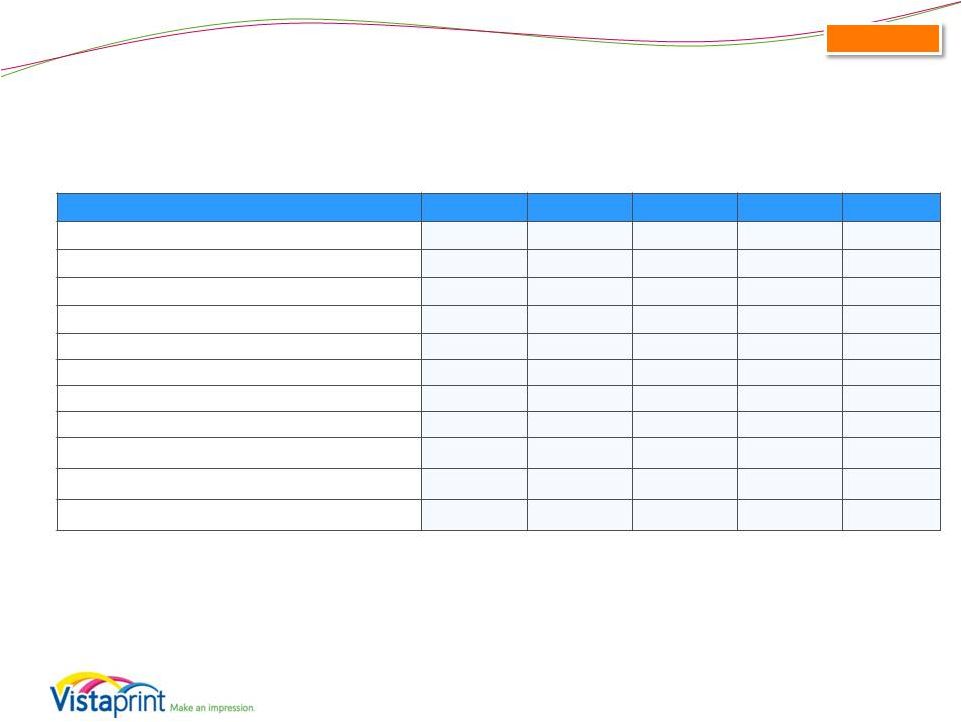
 Financial Guidance* (as of April 25, 2013) FY13 ending 06/30/2013 Q4 FY13 ending 6/30/2013 Revenue $1,150 - $1,165 $263 - $278 Revenue growth from FY 2012 period 13% - 14% 5% - 11% Organic constant currency revenue growth estimate 11% - 12% 5% - 11% GAAP EPS $0.60 - $0.80 EPS decline from FY 2012 period (47%) - (29%) GAAP share count 34.5 million FY13 ending 06/30/2013 Non-GAAP adjusted EPS $1.94 - $2.14 EPS decline from FY 2012 period (1%) – 10% Non-GAAP share count 35.2 million Non-GAAP exclusions $47.2 * Millions, except share and per share amounts and as noted 18 Consolidated The Company is providing the following assumptions to facilitate non-GAAP adjusted net income per diluted share comparisons that exclude share- based compensation related expenses, amortization of acquired intangible assets and tax charges related to the alignment of IP with our global operations: |
 The table above is Vistaprint’s financial guidance as of April 25, 2013. This guidance reflects our expected market opportunity and planned investments for growth and competitive advantage. Vistaprint specifically disclaims any obligation to update any forward-looking statements, which should not be relied upon as representing our expectations or beliefs as of any date subsequent to April 25, 2013, the date of this presentation. Our expectations for the full fiscal year ending June 30, 2013 are as follows: • For full year revenue, our organic constant-currency growth expectations are 11% to 12% growth, and consolidated constant-currency growth expectations are 14% to 15%. If exchange rates stay the same as they were for the 30-day average in mid-January 2013, we would expect consolidated revenue to be $1,150 million to $1,165 million, an increase of 13% to 14% year over year in U.S. dollars. Of course, actual revenue will depend in part on currency exchange rate development throughout the remainder of the fiscal year. • Full fiscal year GAAP EPS, on a diluted basis, is expected to be between $0.60 and $0.80 based on about 34.5 million weighted average shares outstanding. Our consolidated revenue expectations for the quarter ending June 30, 2013, the fourth quarter of fiscal year 2013, are expected to be in the range of $263 million to $278 million, a year-over-year increase of 5% to 11% in U.S. dollars, constant currencies, as well as organic constant currencies. |
 Financial Guidance* (as of April 25, 2013) FY13 ending 06/30/2013 Q4 FY13 ending 6/30/2013 Revenue $1,150 - $1,165 $263 - $278 Revenue growth from FY 2012 period 13% - 14% 5% - 11% Organic constant currency revenue growth estimate 11% - 12% 5% - 11% GAAP EPS $0.60 - $0.80 EPS decline from FY 2012 period (47%) - (29%) GAAP share count 34.5 million FY13 ending 06/30/2013 Non-GAAP adjusted EPS $1.94 - $2.14 EPS decline from FY 2012 period (1%) – 10% Non-GAAP share count 35.2 million Non-GAAP exclusions $47.2 * Millions, except share and per share amounts and as noted 19 Consolidated The Company is providing the following assumptions to facilitate non-GAAP adjusted net income per diluted share comparisons that exclude share- based compensation related expenses, amortization of acquired intangible assets and tax charges related to the alignment of IP with our global operations: |
 We are providing the assumptions noted on our guidance slide to facilitate comparisons with non-GAAP adjusted net income per diluted share. Based on these assumptions, for the full fiscal year 2013, non-GAAP adjusted EPS is expected to be between $1.94 and $2.14, and excludes expected acquisition-related amortization of intangible assets of approximately $10.4 million; share-based compensation expense and its related tax effect of approximately $34.4 million; charges related to the alignment of acquisition-related intellectual property with global operations of approximately $2.4 million; and 35.2 million shares outstanding. |
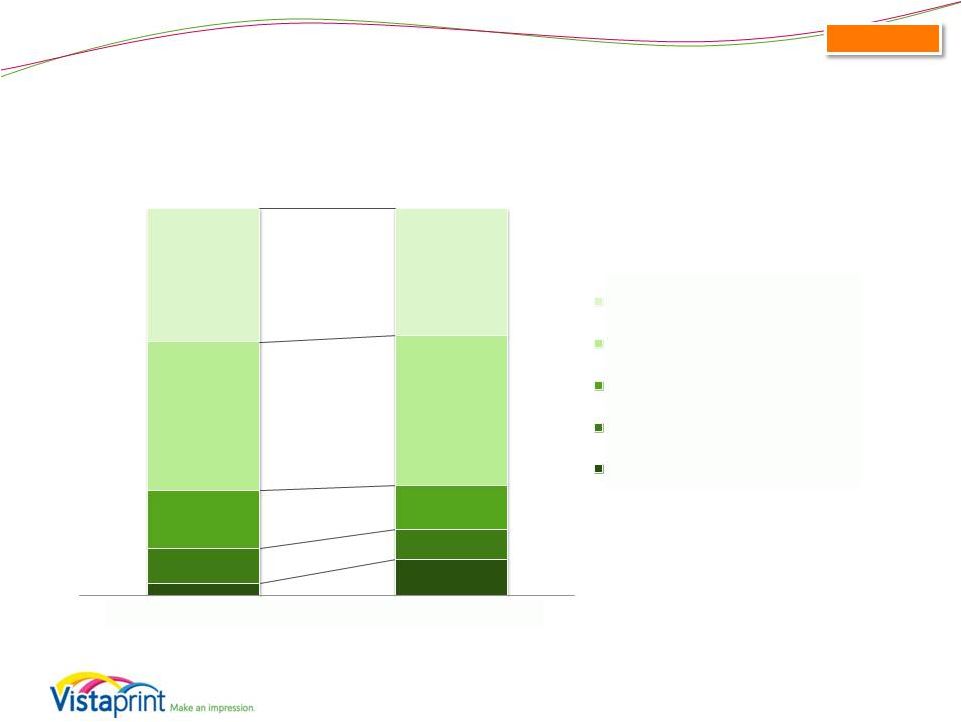
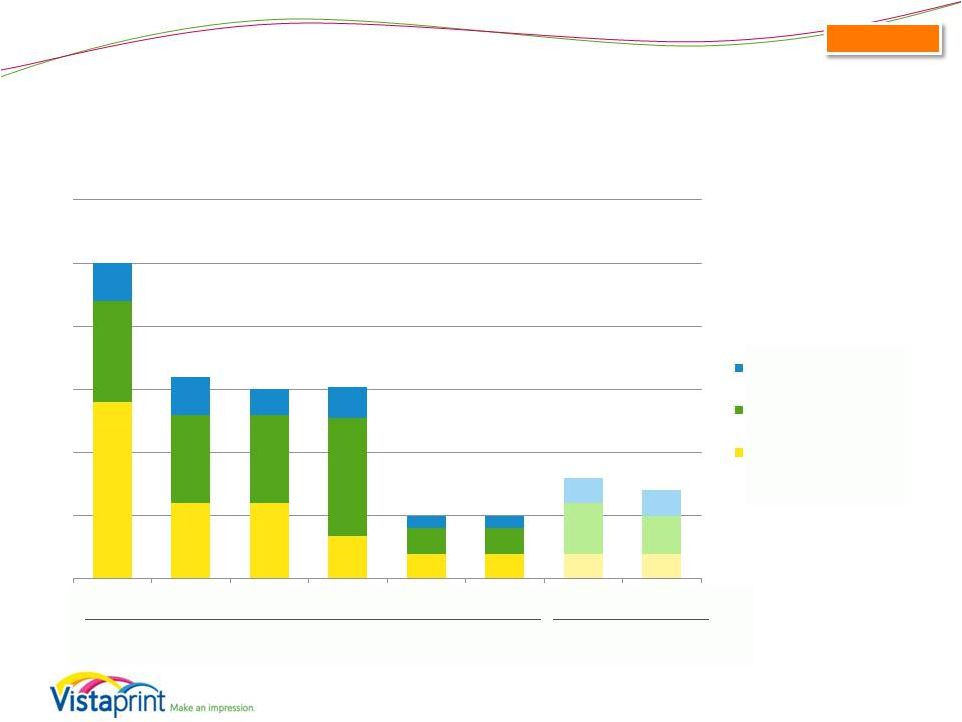 Capital Expenditures Guidance (as of April 25, 2013) Expressed as percent of revenue Actuals Guidance $63M $63M $76M $95M $85M $101M $37M 20 Consolidated $46M FY 2013 Guidance: 14% 6% 6% 3% 2% 2% 2% 2% 8% 7% 7% 9% 2% 2% 4% 3% 3% 3% 2% 3% 1% 1% 2% 2% FY 2007 FY 2008 FY 2009 FY 2010 FY 2011 FY 2012 FY 2013- High FY 2013- Low Other Land and Facilities Manufacturing & Automation Equipment 25% 16% 15% 5% 8% 15% 5% 7% • $85M - $95M • 7% - 8% of revenue guidance midpoint |
 This chart shows capital expenditures in dollars and as a percentage of revenue for the past several years, and also shows our expectations for fiscal 2013 at the midpoint of our revenue guidance range. We expect capital expenditures as a percentage of revenue and in absolute dollars to increase in fiscal 2013 over 2012. For FY 2013, we expect capital expenditures of $85 to $95 million, or 7% to 8% of our revenue guidance midpoint. This guidance includes the expansion of our Venlo production facility, capital expenditures to create a small production facility in India, and other IT and manufacturing equipment requirements to support our growth plans. |
 Ceasing Quarterly Guidance in FY14 21 • Stopped quarterly EPS guidance last year • Stopping quarterly revenue guidance effective next earnings release o Consistent with fiscal year focus of management objectives o Focus on long-term value creation • Expect to guide to annual revenue and EPS for foreseeable future o With each quarterly earnings release |
 Please recall that we stopped providing quarterly EPS guidance at the beginning of FY2013. Effective with our next earnings release we will also stop providing quarterly revenue guidance. We manage our financial budgets on a fiscal year basis, not quarterly. We believe that managing to quarterly public guidance is not helpful to achieving those annual targets and, in fact, can create incentives to manage to suboptimal outcomes when viewed from a long-term value creation perspective. For the foreseeable future we expect to continue to provide full fiscal year (annual) revenue and EPS guidance with each quarterly earnings release. |
 Early Thoughts on FY14 22 • FY14 planning not yet completed o Comments on this page are preliminary and subject to change • Remain committed to driving toward meaningful EPS growth and margin expansion in FY14 o Specific profit levels to be established over coming months o Expect to seek balance of long-term value creating investments and near-term margin expansion • Will share FY14 outlook on next earnings call and at the August 6 th investor day |
 We have not yet completed our planning process for FY14, so the following comments are preliminary and subject to change. Over the next three months, we will make decisions about our FY14 operating plan that will have an impact on our financial objectives for next year. As such it’s too early to share detailed expectations with you at this time. At a high level, we remain committed to driving toward our plans for meaningful earnings growth and margin expansion in fiscal year 2014, which we believe we can deliver by leveraging the substantial investments we’ve made over the past two years. We expect to balance the opportunity to expand our profit margins next year with continued investments that will drive long term value creation, such as improvements to our customer value proposition, our manufacturing capabilities, our foundations for future growth and our engineering resources. We look forward to sharing our outlook and guidance for FY14 revenue and profit margins on our fiscal year-end earnings call and in our subsequent Investor Day on August 6, 2013. |
 Summary • Solid revenue results relative to guidance, but lower growth than original plan for the year • Continued focus on strategic initiatives • Believe we have the right strategy to drive o Long-term revenue and profit growth o Competitive advantage o Significant value for long-term shareholders 23 |
 In summary, our third quarter revenue results were solid relative to the expectations we set three months ago. Though our revenue growth is tracking below our initial plan for the year, we remain confident in our ability to improve our execution over time. In the meantime, we will continue to focus on our objectives to improve our customer value proposition, invest in life time value based advertising, improve our manufacturing and supply chain capabilities, and lay foundations for future growth in digital marketing, the home and family market and in Asia. Additionally, we are building a balanced plan for FY14 that fuels investment in these initiatives while enabling us to begin to drive margin expansion. We believe focusing on these areas will help us deliver long-term value to customers, our employees and our shareholders. We look forward to speaking with you next quarter. |
 Q&A Session Please go to the Investor Relations section of www.vistaprint.com for the live Q&A call at 5:15 pm EDT on April 25, 2013 |
 Q3 Fiscal Year 2013 Financial and Operating Results Supplement |
 Total Company Organic Growth Rates (Excludes Albumprinter and Webs) Please see reconciliation to reported revenue growth rates at the end of this presentation. 11% reported 11% constant-currency FY10 28% constant- currency growth 26 FY11 22% constant-currency growth FY12 20% constant-currency growth Organic YTD FY13 13% constant-currency growth 0% 5% 10% 15% 20% 25% 30% 35% 40% 45% 50% Q4 FY10 Q1 FY11 Q2 FY11 Q3 FY11 Q4 FY11 Q1 FY12 Q2 FY12 Q3 FY12 Q4 FY12 Q1 FY13 Q2 FY13 Q3 FY13 Constant-Currency Reported Note: Constant-currency revenue growth is estimated by translating all non-U.S. dollar denominated revenue generated in the current period using the prior year period’s average exchange rate for each currency to the U.S. dollar and excludes the impact of gains and losses on effective currency hedges recognized in revenue. |
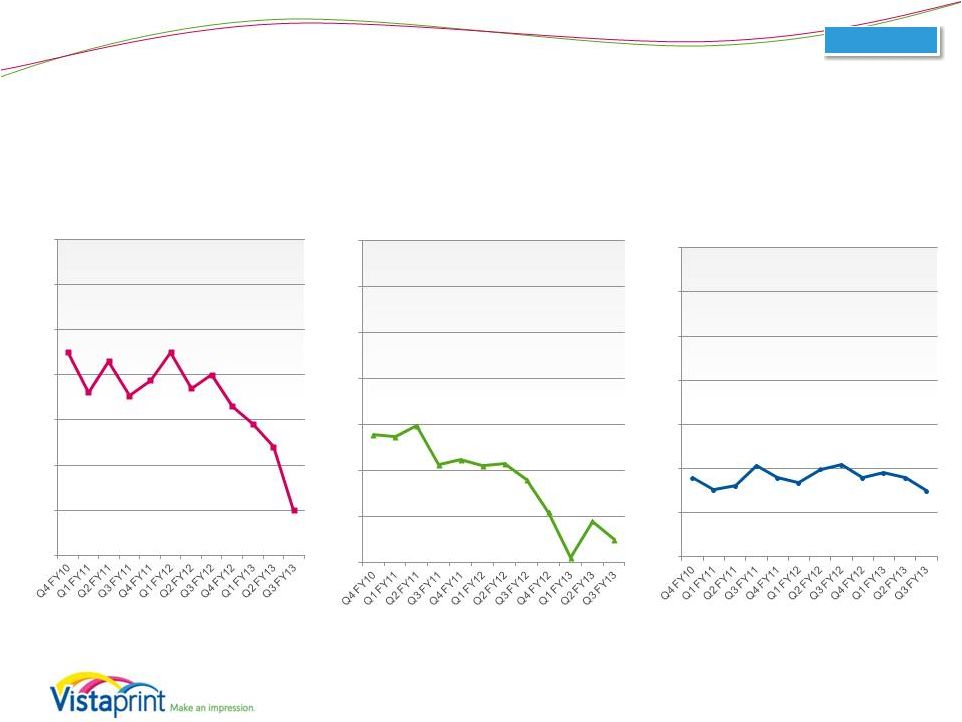 Segment Revenue Growth Rates Constant Currency Organic Organic 0% 10% 20% 30% 40% 50% 60% 70% North America 45% 36% 43% 35% 39% 45% 37% 40% 33% 29% 24% 10% 0% 10% 20% 30% 40% 50% 60% 70% APAC 28% 27% 30% 21% 22% 21% 22% 18% 11% 1% 9% 5% 0% 10% 20% 30% 40% 50% 60% 70% Europe 18% 15% 16% 21% 18% 17% 20% 21% 18% 19% 18% 15% 27 |
 Gross Margin and Gross Profit 28 FY10 64.2% FY11 64.8% FY12 65.2% Consolidated FY13 YTD 66.0% $105 $108 $155 $133 $133 $134 $200 $169 $162 $163 $234 $189 63.6% 63.1% 66.3% 65.3% 63.9% 63.2% 66.8% 65.5% 64.6% 65.0% 67.2% 65.5% Q4 FY10 Q1 FY11 Q2 FY11 Q3 FY11 Q4 FY11 Q1 FY12 Q2 FY12 Q3 FY12 Q4 FY12 Q1 FY13 Q2 FY13 Q3 FY13 Gross Profit (millions) GM % |
 GAAP Net Income (Loss) and Net Margin 29 FY10 $68 FY11 $82 FY12 $44 Consolidated FY13 YTD $27 $12 $11 $34 $23 $14 $8 $32 $0 $4 $(2) $23 $6 7.1% 6.3% 14.5% 11.3% 6.9% 3.8% 10.6% 0.1% 1.5% -0.7% 6.6% 2.0% -5.0% 0.0% 5.0% 10.0% 15.0% $(2) $3 $8 $13 $18 $23 $28 $33 $38 $43 $48 $53 $58 Q4 FY10 Q1 FY11 Q2 FY11 Q3 FY11 Q4 FY11 Q1 FY12 Q2 FY12 Q3 FY12 Q4 FY12 Q1 FY13 Q2 FY13 Q3 FY13 GAAP Net Income (loss), in millions GAAP Net Margin |
 Non-GAAP Adjusted Net Income* and Adjusted Net Margin 30 FY10 $91 FY11 $105 FY12 $77 Consolidated FY13 YTD $62 $17 $16 $40 $28 $20 $13 $38 $11 $15 $9 $36 $17 10.5% 9.6% 17.3% 13.8% 9.4% 6.1% 12.6% 4.4% 5.9% 3.5% 10.3% 5.9% Q4 FY10 Q1 FY11 Q2 FY11 Q3 FY11 Q4 FY11 Q1 FY12 Q2 FY12 Q3 FY12 Q4 FY12 Q1 FY13 Q2 FY13 Q3 FY13 Non-GAAP Adjusted Net Income (millions) Non-GAAP Adjusted Net Margin *Non-GAAP adjusted net income for all periods presented excludes the impact of share-based compensation expense and its related tax effect, amortization of acquired intangibles, and charges related to the alignment of Webs IP with our global structure. Please see reconciliation to GAAP net income at the end of this presentation. |
 Q3 Income Statement Comparison to Prior Year (as a percentage of revenue) 31 Consolidated 3.4% 3.0% 9.0% 10.8% 14.9% 13.8% 38.2% 37.9% 34.5% 34.5% Q3 FY2013 Q3 FY2012 Cost of revenue Marketing and selling Technology and development General and administrative Income from operations |
 Q3 Income Statement Comparison to Prior Quarter (as a percentage of revenue) 32 Consolidated 3.4% 9.5% 9.0% 7.6% 14.9% 11.5% 38.2% 38.6% 34.5% 32.8% Q3 FY2013 Q2 FY2013 Cost of revenue Marketing and selling Technology and development General and administrative Income from operations |
 Share-Based Compensation* (millions) * Share-based compensation (SBC) expense includes SBC-related tax adjustment. 33 FY10 $23.2 FY11 $22.4 FY12 $26.1 Consolidated YTD FY13 $25.3 $5.7 $5.6 $6.4 $5.3 $5.1 $4.9 $5.0 $7.6 $8.6 $8.4 $8.5 $8.4 Q4 FY10 Q1 FY11 Q2 FY11 Q3 FY11 Q4 FY11 Q1 FY12 Q2 FY12 Q3 FY12 Q4 FY12 Q1 FY13 Q2 FY13 Q3 FY13 |
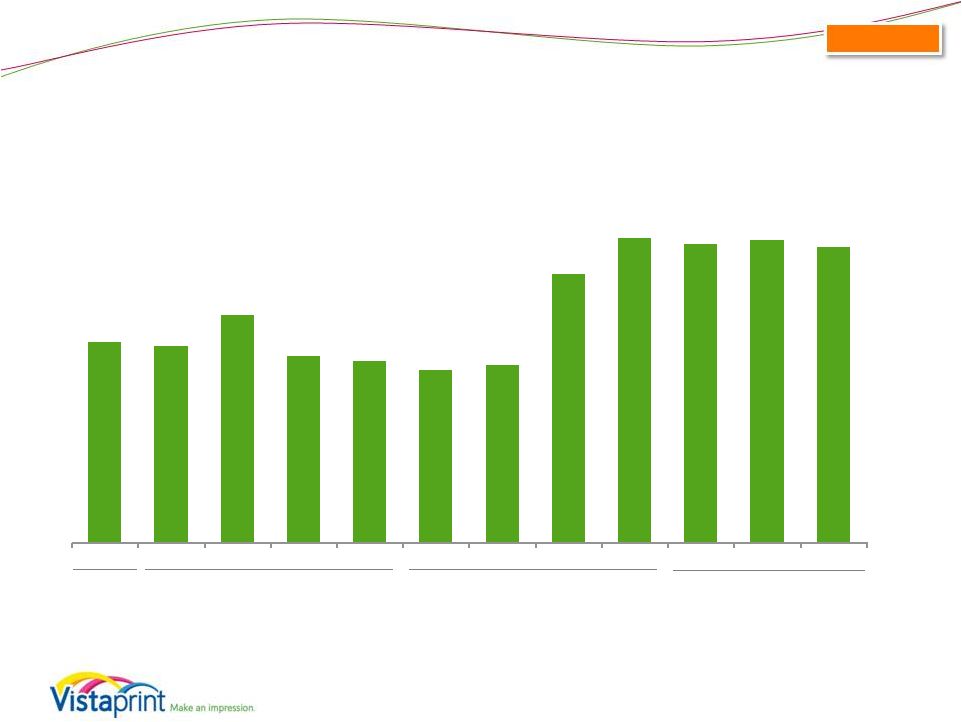
 Revenue Seasonality (Excludes Albumprinter and Webs) * Home and family revenue is calculated using a product format-based approach 34 Organic $164 $167 $234 $204 $209 $212 $284 $244 $235 $233 $323 $270 Q4 FY10 Q1 FY11 Q2 FY11 Q3 FY11 Q4 FY11 Q1 FY12 Q2 FY12 Q3 FY12 Q4 FY12 Q1 FY13 Q2 FY13 Q3 FY13 Small Business Marketing Home and Family* |
 Q3 FY 2013 Bookings by Marketing Channel (excludes Albumprinter and Webs bookings) ~2.5 million new customers in Q3 FY2013 Paid Search Other Channels and Partners 3 rd Party Permission- Based email Direct URL Type-In Paid Search Other Channels and Partners Our Own Permission-Based email Direct URL Type- In First-time Order Bookings: 32% Repeat Order Bookings: 68% Our Own Permission-Based email 35 Organic |
 Balance Sheet Highlights Balance Sheet highlights, in millions, at period end 03/31/13 12/31/12 09/30/12 06/30/12 3/31/12 Total assets $616.4 $653.7 $620.5 $592.4 $588.0 Cash and cash equivalents $51.3 $64.7 $59.3 $62.2 $52.1 Total current assets $104.4 $132.3 $114.6 $115.6 $103.5 Goodwill and intangible assets $174.3 $179.2 $179.5 $180.7 $192.0 Total liabilities $414.7 $443.8 $421.3 $403.1 $306.0 Current liabilities $154.0 $182.4 $129.4 $142.0 $148.1 Long-term debt $229.0 $230.5 $259.3 $229.0 $126.5 Shareholders’ Equity $201.7 $209.9 $199.2 $189.3 $281.9 Treasury shares (in millions) 10.9 16.4 15.7 15.8 13.0 36 Consolidated |
 Total Debt Availability under our credit facility 3/31/13 Maximum aggregate available borrowing amounts $500.0M Outstanding borrowings of credit facility ($238.5M) Remaining amount $261.5M Limitations to borrowing due to debt covenants and other obligations* ($24.2M) Amount available for borrowing as of March 31, 2013 $237.3M 37 Consolidated * Our borrowing ability can be limited by our debt covenants each quarter. These covenants may limit our borrowing capacity depending on our leverage, other indebtedness, such as installment obligations and letters of credit, and other factors that are outlined in the restated credit agreement filed as an exhibit in our Form 8-K filed on February 13, 2013. • Credit facility in place with aggregate loan commitments of $500.0M • Interest rate is LIBOR plus 1.25% - 2.0%, depending on leverage • Currently in compliance with all covenants. Key covenants are: o Total leverage ratio not to exceed 3.5x TTM EBITDA (reducing to 3.25x in 1 year and 3.0x in 2 years). o Interest coverage ratio of at least 3.0. o Maximum of $400M of share repurchases allowed over the credit facility tenor (2/8/2013 to 2/8/2018). If $400M is reached, an additional $25M per year is allowed. |
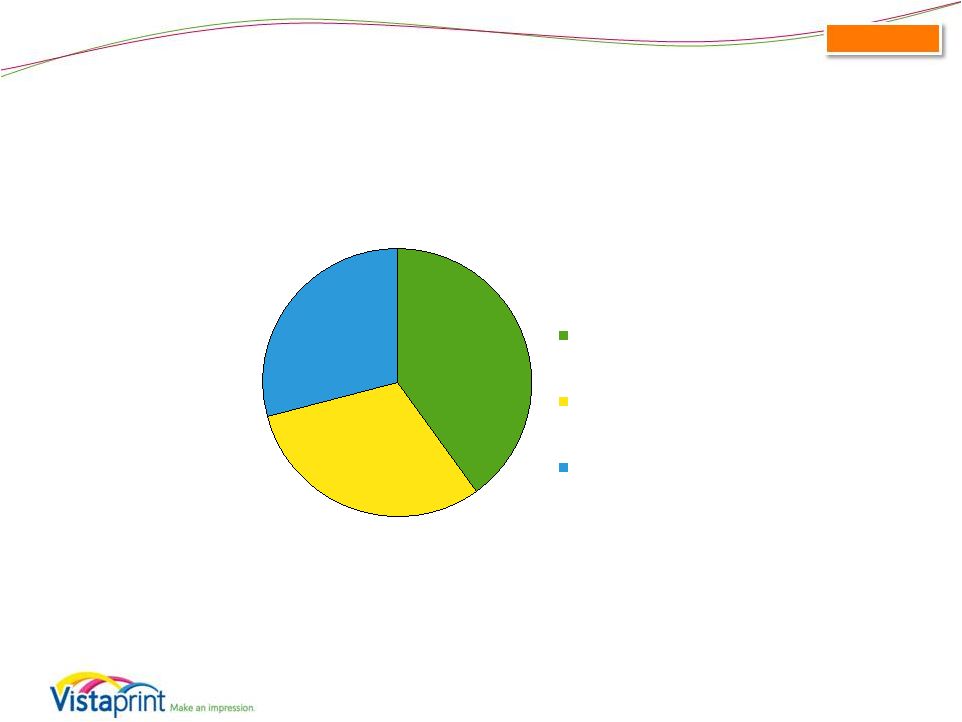 Q3 FY13 Capital Expenditure Breakdown Q3 CapEx: $11.2M 1 3 2 38 Consolidated 1 Land, building and construction, leasehold improvements, and furniture and fixtures 2 All manufacturing and automation equipment, including offset and digital print lines, other printing equipment, pre-press and post-press equipment such as cutters, and automation equipment 3 IT infrastructure, software and office equipment 40% 31% 29% Land/Facilities Mfg & Automation Equipment Other |
 Appendix Including a Reconciliation of GAAP to Non-GAAP Financial Measures |
 About non-GAAP financial measures To supplement Vistaprint’s consolidated financial statements presented in accordance with U.S. generally accepted accounting principles, or GAAP, Vistaprint has used the following measures defined as non-GAAP financial measures by Securities and Exchange Commission, or SEC, rules: non-GAAP adjusted net income, non-GAAP adjusted net income per diluted share, free cash flow, constant-currency revenue growth, and constant-currency organic revenue growth. The items excluded from the non-GAAP adjusted net income measurements are share-based compensation expense and its related tax effect, amortization of acquisition-related intangibles, and tax charges related to the alignment of acquisition- related intellectual property with global operations. Free cash flow is defined as net cash provided by operating activities less purchases of property, plant and equipment, purchases of intangible assets, and capitalization of software and website development costs. Constant-currency revenue growth is estimated by translating all non-U.S. dollar denominated revenue generated in the current period using the prior year period’s average exchange rate for each currency to the U.S. dollar and excludes the impact of gains and losses on effective currency hedges recognized in revenue. Constant-currency organic revenue growth excludes the impact of currency as defined above and revenue from acquired companies. The presentation of non-GAAP financial information is not intended to be considered in isolation or as a substitute for the financial information prepared and presented in accordance with GAAP. For more information on these non-GAAP financial measures, please see the tables captioned “Reconciliations of Non-GAAP Financial Measures” included at the end of this release. The tables have more details on the GAAP financial measures that are most directly comparable to non-GAAP financial measures and the related reconciliation between these financial measures. (continued on next page) 40 |
 About non-GAAP financial measures continued… Vistaprint’s management believes that these non-GAAP financial measures provide meaningful supplemental information in assessing our performance and when forecasting and analyzing future periods. These non-GAAP financial measures also have facilitated management’s internal comparisons to Vistaprint’s historical performance and our competitors’ operating results. Management provides these non-GAAP financial measures as a courtesy to investors. However, to gain a more complete understanding of the company’s financial performance, management does (and investors should) rely upon GAAP statements of operations and cash flow. 41 |
 Reconciliation: GAAP to Non-GAAP Results FY 2003 FY 2004 FY 2005* FY 2006 FY 2007 FY 2008 FY 2009 FY2010 FY2011 FY2012 GAAP Net Income $473 $3,440 ($16,218) $19,234 $27,143 $39,831 $55,686 $67,741 $82,109 $43,994 Share-based compensation and related tax effect $0 $0 $0 $4,850 $8,765 $15,275 $20,177 $23,156 $22,400 $26,060 Amortization of acquired intangible assets - - - - - - - - - $5,754 Webs IP transfer - - - - - - - - - $1,235 Non-GAAP Adjusted Net Income $473 $3,440 $4,782 $23,146 $35,908 $55,106 $75,863 $90,897 $104,509 $77,043 Net Income – Annual ($ in thousands) *Fiscal 2005 non-GAAP results exclude a contract termination payment of $21mm Note: share-based compensation expense includes tax effects 42 |
 Reconciliation: GAAP to Non-GAAP Results . Fiscal Year 2010 Fiscal Year 2011 Fiscal Year 2012 Fiscal Year 2013 Q4 Q1 Q2 Q3 Q4 Q1 Q2 Q3 Q4 Q1 Q2 Q3 GAAP Net Income $11,650 $10,781 $34,014 $22,917 $14,397 $8,172 $31,697 $274 $3,851 $(1,696) $22,960 $5,866 Share-based compensation and related tax effect $5,662 $5,550 $6,435 $5,285 $5,129 $4,876 $5,021 $7,566 $8,596 $8,445 $8,540 $8,353 Amortization of acquired intangible assets - - - - - - $1,148 $2,381 $2,225 $2,178 $2,243 $2,275 Webs IP Transfer - - - - - - - $1,017 $218 - $2,164 $431 Non-GAAP Adjusted Net Income $17,312 $16,331 $40,449 $28,202 $19,526 $13,048 $37,866 $11,238 $14,890 $8,927 $35,907 $16,925 Net Income (Loss) – Quarterly ($ in thousands) 43 |
 Diluted Earnings Per Share - Annual Reconciliation: GAAP to Non-GAAP Results 44 FY 2006 FY 2007 FY 2008 FY 2009 FY2010 FY2011 FY2012 GAAP Net Income Per Share $0.45 $0.60 $0.87 $1.25 $1.49 $1.83 $1.13 Share-based Compensation Per Share* $0.09 $0.18 $0.31 $0.43 $0.49 $0.47 $0.65 Amortization of acquired intangible assets - - - - - - $0.14 Webs IP Transfer - - - - - - $0.03 Non-GAAP Adjusted Net Income Per Share $0.54 $0.78 $1.18 $1.68 $1.98 $2.30 $1.95 Weighted average shares used in computing Non- GAAP EPS (millions) 42.651 45.825 46.780 45.099 45.989 45.448 39.426 *Note: share-based compensation expense includes tax effects |
 Reconciliation: GAAP to Non-GAAP Results . Fiscal Year 2010 Fiscal Year 2011 Fiscal Year 2012 Fiscal Year 2013 Q4 Q1 Q2 Q3 Q4 Q1 Q2 Q3 Q4 Q1 Q2 Q3 GAAP Net Income Per Share $0.26 $0.24 $0.75 $0.51 $0.32 $0.19 $0.82 $0.01 $0.10 $(0.05) $0.66 $0.17 Share-based Compensation Per Share* $0.12 $0.12 $0.14 $0.12 $0.11 $0.12 $0.12 $0.20 $0.23 $0.24 $0.24 $0.24 Amortization of acquired intangible assets - - - - - - $0.03 $0.06 $0.06 $0.06 $0.06 $0.06 Webs IP Transfer - - - - - - - $0.02 $0.01 - $0.06 $0.01 Non-GAAP Adjusted Net Income Per Share $0.38 $0.36 $0.89 $0.63 $0.43 $0.31 $0.97 $0.29 $0.40 $0.25 $1.02 $0.48 Weighted average shares used in computing Non- GAAP EPS (millions) 46.136 45.704 45.625 45.079 45.156 42.569 39.041 38.346 37.620 35.793 35.156 35.217 Earnings Per Diluted Share - Quarterly *Note: share-based compensation expense includes tax effects 45 |
 Reconciliation: Free Cash Flow (in thousands) 46 Three Months Ended Nine Months Ended March 31, March 31 2013 2012 2013 2012 Net cash provided by operating activities $ 8,135 $ 9,620 $ 103,318 $ 121,300 Purchases of property, plant and equipment (11,155) (8,493) (66,523) (32,938) Purchases of intangibles assets (82) (41) (452) (172) Capitalization of software and website development costs (2,439) (1,411) (5,579) (4,302) Free cash flow $ (5,541) $ (325) $ 30,764 $ 83,888 |
 Reconciliation: Constant-Currency Revenue Growth Rates Quarterly 47 ASIA-PACIFIC Q4 FY10 Q1 FY11 Q2 FY11 Q3 FY11 Q4 FY11 Q1 FY12 Q2 FY12 Q3 FY12 Q4 FY12 Q1 FY13 Q2 FY13 Q3 FY13 Reported revenue growth 69% 48% 55% 50% 65% 67% 41% 47% 28% 28% 26% 6% Currency impact (24%) (12%) (12%) (15%) (26%) (22%) (4%) (7%) 5% 2% (3%) 4% Revenue growth in constant currency 45% 36% 43% 35% 39% 45% 37% 40% 33% 29% 24% 10% Impact of acquisitions to growth in constant currency - - - - - - - - - - - - Revenue growth rate, ex acquisitions, in constant currency 45% 36% 43% 35% 39% 45% 37% 40% 33% 29% 24% 10% EUROPE Q4 FY10 Q1 FY11 Q2 FY11 Q3 FY11 Q4 FY11 Q1 FY12 Q2 FY12 Q3 FY12 Q4 FY12 Q1 FY13 Q2 FY13 Q3 FY13 Reported revenue growth 23% 18% 22% 22% 38% 31% 36% 29% 18% 12% 11% 8% Currency impact 5% 10% 8% (1%) (15%) (10%) 1% 5% 12% 11% 2% 0% Revenue growth in constant currency 28% 27% 30% 21% 22% 21% 37% 34% 30% 23% 14% 8% Impact of acquisitions to growth in constant currency - - - - - - (15%) (16) (19%) (22%) (5%) (3%) Revenue growth rate, ex acquisitions, in constant currency 28% 27% 30% 21% 22% 21% 22% 18% 11% 1% 9% 5% Note: Constant-currency revenue growth is estimated by translating all non-U.S. dollar denominated revenue generated in the current period using the prior year period’s average exchange rate for each currency to the U.S. dollar and excludes the impact of gains and losses on effective currency hedges recognized in revenue. |
 Reconciliation: Constant-Currency Revenue Growth Rates Quarterly 48 NORTH AMERICA Q4 FY10 Q1 FY11 Q2 FY11 Q3 FY11 Q4 FY11 Q1 FY12 Q2 FY12 Q3 FY12 Q4 FY12 Q1 FY13 Q2 FY13 Q3 FY13 Reported revenue growth 19% 16% 16% 21% 18% 17% 20% 23% 20% 22% 20% 15% Currency impact (1%) 0% 0% 0% 0% 0% 0% 0% 0% 0% 0% 0% Revenue growth in constant currency 18% 15% 16% 21% 18% 17% 20% 23% 21% 22% 20% 15% Impact of acquisitions to growth in constant currency - - - - - - - (2%) (3%) (3%) (2%) 0% Revenue growth rate, ex acquisitions, in constant currency 18% 15% 16% 21% 18% 17% 20% 21% 18% 19% 18% 15% TOTAL COMPANY Q4 FY10 Q1 FY11 Q2 FY11 Q3 FY11 Q4 FY11 Q1 FY12 Q2 FY12 Q3 FY12 Q4 FY12 Q1 FY13 Q2 FY13 Q3 FY13 Reported revenue growth 22% 18% 20% 23% 27% 25% 28% 26% 20% 18% 16% 12% Currency impact 0% 2% 3% (1%) (7%) (5%) 0% 2% 5% 5% 1% 0% Revenue growth in constant currency 22% 20% 23% 22% 20% 20% 28% 28% 25% 23% 17% 12% Impact of acquisitions to growth in constant currency - - - - - - (7%) (7%) (8%) (10%) (3%) (1%) Revenue growth rate, ex acquisitions, in constant currency 22% 20% 23% 22% 20% 20% 21% 21% 17% 13% 14% 11% Note: Constant-currency revenue growth is estimated by translating all non-U.S. dollar denominated revenue generated in the current period using the prior year period’s average exchange rate for each currency to the U.S. dollar and excludes the impact of gains and losses on effective currency hedges recognized in revenue. |
 Reconciliation: Constant-Currency Revenue Growth Rates Annual 49 FY2009 FY2010 FY2011 FY2012 Reported revenue growth 29% 30% 22% 25% Currency impact 7% (2%) - 0% Revenue growth in constant currency 36% 28% 22% 25% Impact of acquisitions to growth in constant currency - - - (5%) Revenue growth rate, ex acquisitions, in constant currency 36% 28% 22% 20% Note: Constant-currency revenue growth is estimated by translating all non-U.S. dollar denominated revenue generated in the current period using the prior year period’s average exchange rate for each currency to the U.S. dollar and excludes the impact of gains and losses on effective currency hedges recognized in revenue. |