 Q2 Fiscal Year 2014 Earnings Presentation, Commentary & Financial Results Supplement January 29, 2014 Exhibit 99.2 |
 Safe Harbor Statement 2 This presentation and the accompanying notes contain statements about our future expectations, plans and prospects of our business that constitute forward-looking statements for purposes of the safe harbor provisions under the Private Securities Litigation Reform Act of 1995, including but not limited to our financial guidance, outlook, expectations, and investment areas for the fiscal year 2014; the anticipated effects on our business of our strategy and investments; and the anticipated development of our business, markets, and financial results in fiscal 2014 and beyond, including the impact of our hedging activities and intercompany activities. Forward-looking projections and expectations are inherently uncertain, are based on assumptions and judgments by management, and may turn out to be wrong. Our actual results may differ materially from those indicated by these forward-looking statements as a result of various important factors, including but not limited to flaws in the assumptions and judgments upon which our projections and guidance are based; our failure to execute our strategy; our failure to make the investments in our business that we plan to make or the failure of those investments to have the effects that we expect; our failure to identify and address the causes of our revenue weakness in Europe; our failure to acquire new customers and enter new markets, retain our current customers, and sell more products to current and new customers; the willingness of purchasers of marketing services and products to shop online; currency fluctuations that affect our revenues and costs, including the impact of our currency hedging strategies; costs and disruptions caused by acquisitions; the failure of our acquired businesses to perform as expected; unanticipated changes in our market, customers or business; our failure to promote and strengthen our brand; the failure of our current and new marketing channels to attract customers; our failure to manage the growth, changes, and complexity of our business and expand our operations; competitive pressures; our failure to maintain compliance with the financial covenants in our revolving credit facility or to pay our debts when due; costs and judgments resulting from litigation; changes in the laws and regulations or in the interpretations of laws or regulations to which we are subject, including tax laws, or the institution of new laws or regulations that affect our business; and general economic conditions. You can also find other factors described in our Form 10-Q for the fiscal quarter ended September 30, 2013 and the other documents we periodically file with the U.S. Securities and Exchange Commission. |
 Presentation Organization & Call Details 3 Presentation Organization: • Q2 FY14 overview • Q2 FY14 operating and financial results • FY14 outlook • Supplementary information • Reconciliation of GAAP to Non-GAAP results Live Q&A Session: • 5:15 p.m. Eastern • Link from the IR section of www.vistaprint.com • Hosted by: Robert Keane President & CEO Ernst Teunissen EVP & CFO |
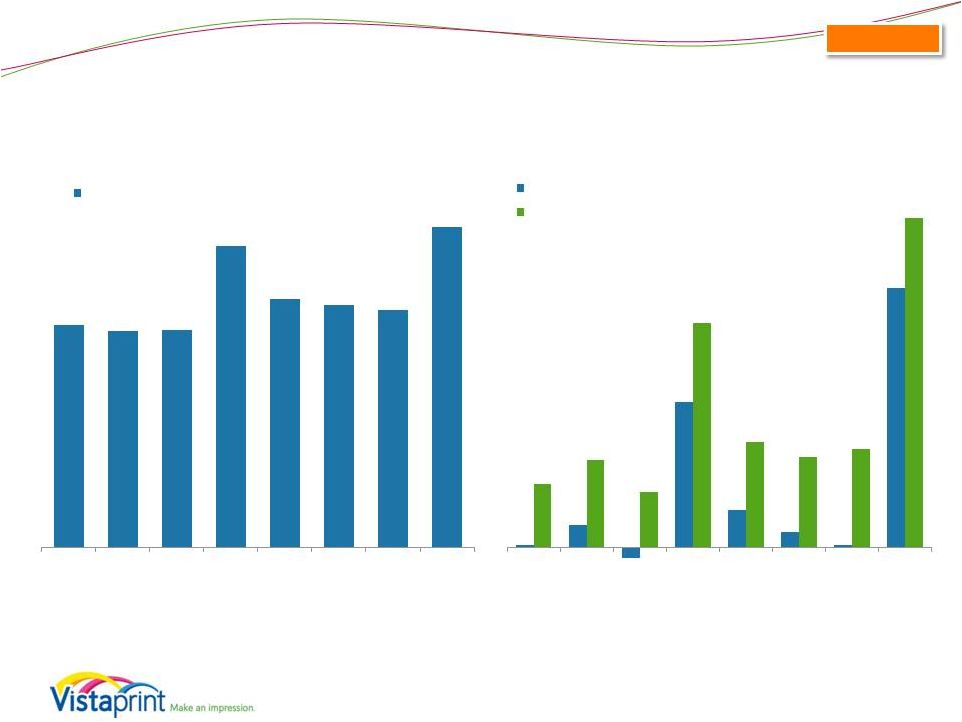 Consolidated Quarterly Financial Results 4 $258 $250 $251 $348 $288 $280 $275 $371 Q3 FY12 Q4 FY12 Q1 FY13 Q2 FY13 Q3 FY13 Q4 FY13 Q1 FY14 Q2 FY14 Consolidated Revenue $0.01 $0.10 $(0.05) $0.66 $0.17 $0.07 $0.01 $1.18 $0.29 $0.40 $0.25 $1.02 $0.48 $0.41 $0.45 $1.50 Q3 FY12 Q4 FY12 Q1 FY13 Q2 FY13 Q3 FY13 Q4 FY13 Q1 FY14 Q2 FY14 GAAP EPS* Non-GAAP EPS* Revenue and EPS results for the consolidated business, including Albumprinter and Webs results since October 31, 2011 and December 28, 2011 (dates of purchase, respectively). Non-GAAP adjusted net income for all periods presented excludes the impact of share-based compensation expense and its related tax effect, amortization of acquired intangibles, charges related to the alignment of Webs IP with our global structure, changes in unrealized gains and losses on currency forward contracts, and unrealized currency transaction gains and losses on intercompany financing arrangements and the related tax effect. Please see reconciliation to GAAP net income at the end of this presentation. Q2 FY204 Non-GAAP EPS reflects recast to exclude impact of changes in unrealized gains/losses on hedges * Per diluted share |
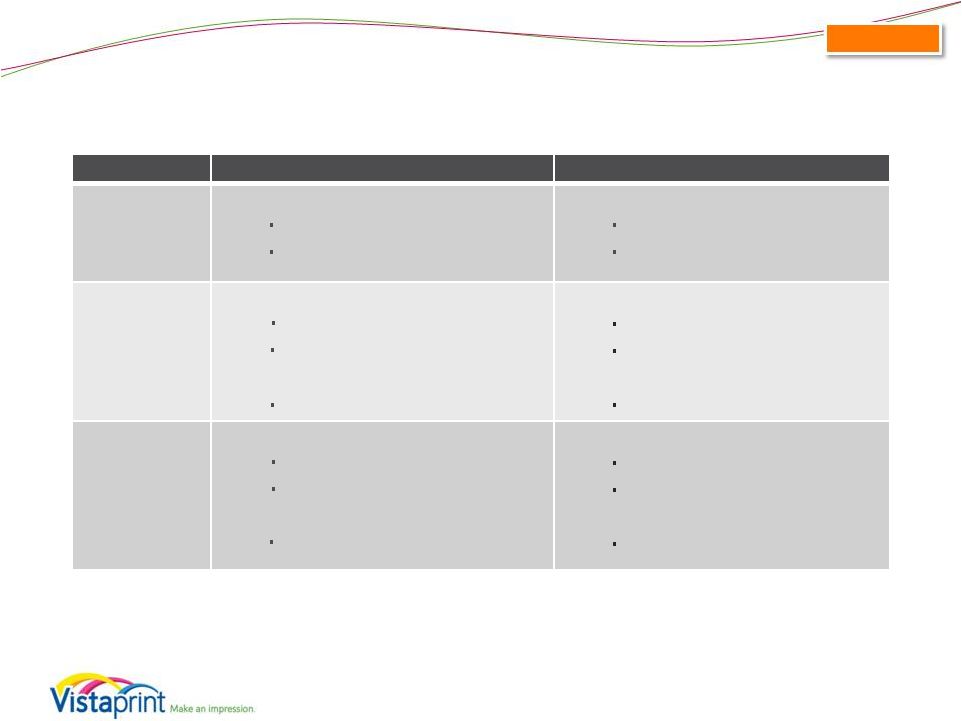
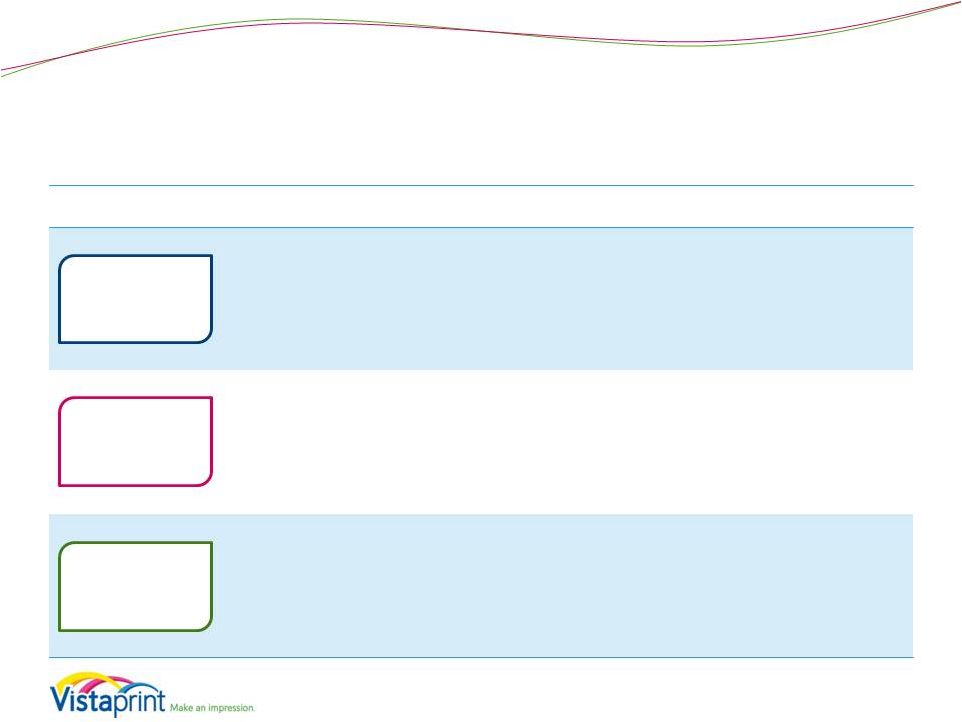 FY14 Operational Performance: Invigorate the Core Business 5 Strategy Element Description Long-Term Goals Q2FY14 Examples Change from short-term transaction-focused decision- making to long-term customer- focused value. Do so by making major improvements to customer experience, marketing methods, service levels and product quality Increase customer satisfaction, loyalty and life time value • Continued to roll out pricing and messaging changes in various countries • Launched new creative designs • Enhanced product packaging • Rolled out carrier notifications for customers in certain markets Invest more deeply into selected traditional Vistaprint marketing channels and expand in relatively new channels such as broadcast with higher than average COCA, but with ROI still above our hurdle rate Accelerate new customer acquisition Reach offline audiences not currently looking to online suppliers • Continued to optimize spend in relatively new channels • Trimmed ad expense in Europe with change in customer economics • Launched new broadcast advertising campaigns Accelerate investment in production process improvements, employee training, supply chain management and manufacturing-related engineering Step function changes in quality and reliability Significantly lower unit manufacturing costs • New product launches • Cost savings through recycling and scrap reduction • Vendor negotiation for more favorable costs Customer Value Proposition Improvements Life Time Value Based Marketing World Class Manufacturing |
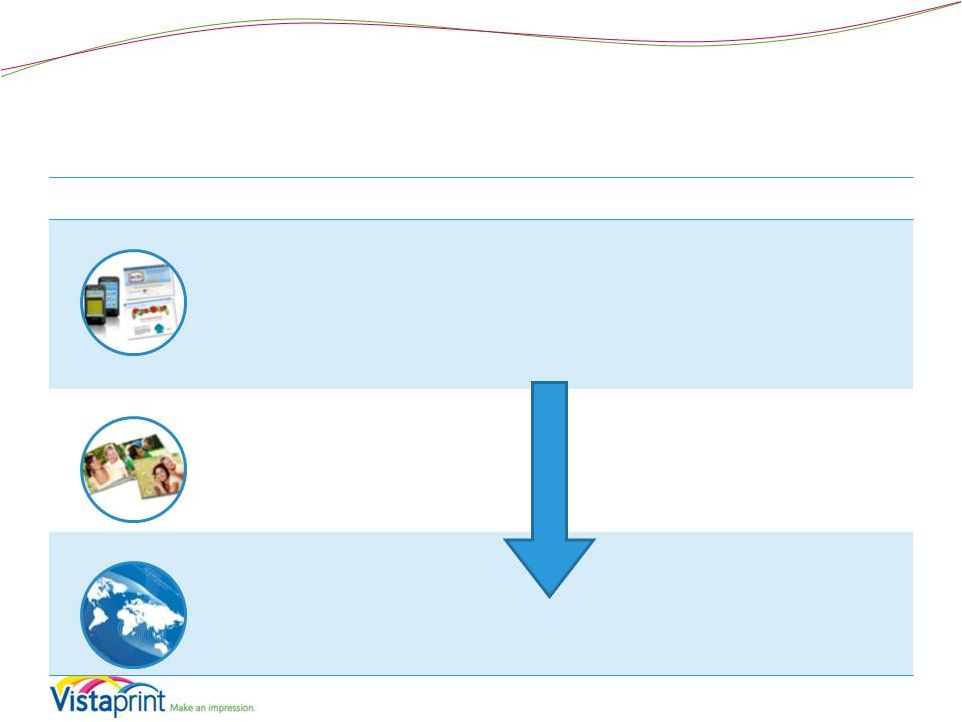 FY14 Operational Performance: Build Foundations for Future Growth 6 Strategy Element Description Long-Term Goals Q2FY14 Examples Digital small business marketing offerings (websites, email marketing, social media) Lay foundations for continued rapid growth five and more years in the future Seek M&A opportunities of firms that possess technology, market presence and/or expertise in target areas • Total Q2 digital marketing services revenue of approx. $20 million (includes Webs) or approx. 5% of revenue • Webs site builder technology localized and rolled out to EU markets • New capabilities in other products Enable customers to share and preserve memories through personalized products for home and family use • Launched over 150 new holiday card designs with added photo and backside options • New lay-flat photo books for Albumprinter customers Expand to markets beyond North America and Europe • Continued focus on supporting growth in India, Japan and China, entering into a definitive agreement for a joint venture with Plaza Create in Japan Digital Marketing Home & Family Geographic Expansion |
 Q2 FY 2014 Financial and Operating Results 7 |
 Q2 FY 2014: Key Financial Metrics 8 Quarter Ended 12/31/2013 Six Months Ended 12/31/2013 Revenue • $370.8 million 6% y/y growth 6% y/y constant currency growth • $645.9 million 8% y/y growth 7% y/y constant currency growth GAAP Net Income • $40.9 million 11.0% net margin vs. 6.6% last year increase of 78% y/y • $1.18 Diluted EPS increase of 79% y/y • $41.3 million 6.4% net margin vs. 3.5% last year increase of 94% y/y • $1.20 Diluted EPS increase of 97% y/y Non-GAAP Adjusted Net Income** • $52.7 million 14.2% net margin vs. 10.3% last year increase of 47% y/y • $1.50 Non-GAAP Diluted EPS increase of 47% y/y • $68.8 million 10.6% net margin vs. 7.5% last year increase of 53% y/y • $1.96 Non-GAAP Diluted EPS increase of 56% y/y Consolidated ** Non-GAAP adjusted net income and non-GAAP adjusted EPS exclude share-based compensation expense and its related tax effect, amortization of acquired intangible assets, charges related to the alignment of Webs IP with our global operations, changes in unrealized gains and losses on currency forward contracts, and unrealized currency transaction gains and losses on intercompany financing arrangements and the related tax effect. Please see reconciliation to GAAP net income (loss) and EPS at the end of this presentation. |
 Consolidated Cash Flow & ROIC Highlights Quarterly cash flows and investments (in millions) Q2FY14 Q2FY13 Cash flow from operations $95.0 $88.5 Free cash flow* $67.8 $58.7 Capital expenditures $24.6 $27.6 as % of revenue 6.6% 7.9% Trailing Twelve Month Return on Invested Capital** (GAAP) 15% 7% Trailing Twelve Month Return on Invested Capital** (Non-GAAP) 24% 17% 9 Share repurchase program Q2FY14 Shares purchased - Average cost per share - Total purchase spend, inclusive of transaction costs, in millions - Balance sheet (in millions, as of December 31, 2013) Cash and cash equivalents $62.3 FCF = Cash Flow from Operations – Capital Expenditures – Purchases of Intangible assets not related to acquisitions – Capitalized Software Expenses ROIC = NOPAT / (Debt + Equity – Excess Cash) Net operating profit after taxes (NOPAT) Excess cash is cash and investments of 5% of last twelve month revenues Operating leases have not been converted to debt Non-GAAP TTM ROIC excludes share-based compensation expense and its related tax effect, amortization of acquired intangibles, charges related to the alignment of Webs IP with our global operations, changes in unrealized gains and losses on currency forward contracts, and unrealized currency transaction gains and losses on intercompany financing arrangements and the related tax effect Excess cash definition updated in period ending 03/31/2013 and for prior periods. * ** |
 Geographic Segment Revenue - Quarterly (millions) North America: 51% of total revenue 13% y/y growth 14% y/y constant currency growth Europe: 43% of total revenue 1% y/y growth -2% y/y constant currency growth Asia Pacific: 5% of total revenue -5% y/y growth 6% y/y constant currency growth Q2 FY2014 10 Consolidated $142.0 $143.4 $144.2 $167.5 $163.0 $169.6 $164.8 $189.4 $100.2 $92.0 $89.7 $159.3 $108.3 $94.9 $94.7 $161.0 $15.4 $15.1 $17.5 $21.5 $16.4 $15.6 $15.6 $20.3 Q3 FY12 Q4 FY12 Q1 FY13 Q2 FY13 Q3 FY13 Q1 FY14 Q2 FY14 Asia-Pacific Europe North America Revenue results for the consolidated business, including Albumprinter and Webs results since respective acquisition dates. All Albumprinter revenue included in European segment. All Webs revenue included in North American segment. Constant-currency revenue growth is estimated by translating all non-U.S. dollar denominated revenue generated in the current period using the prior year period’s average exchange rate for each currency to the U.S. dollar and excludes the impact of gains and losses on effective currency hedges recognized in revenue for applicable periods. Please see reconciliation to reported revenue growth rates at the end of this presentation. |
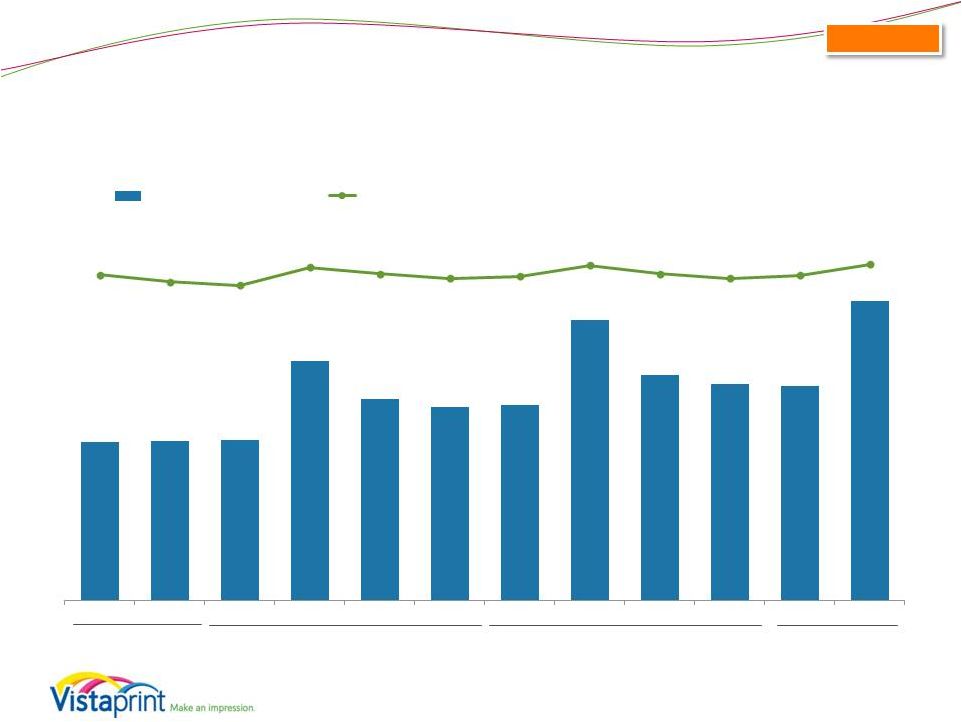
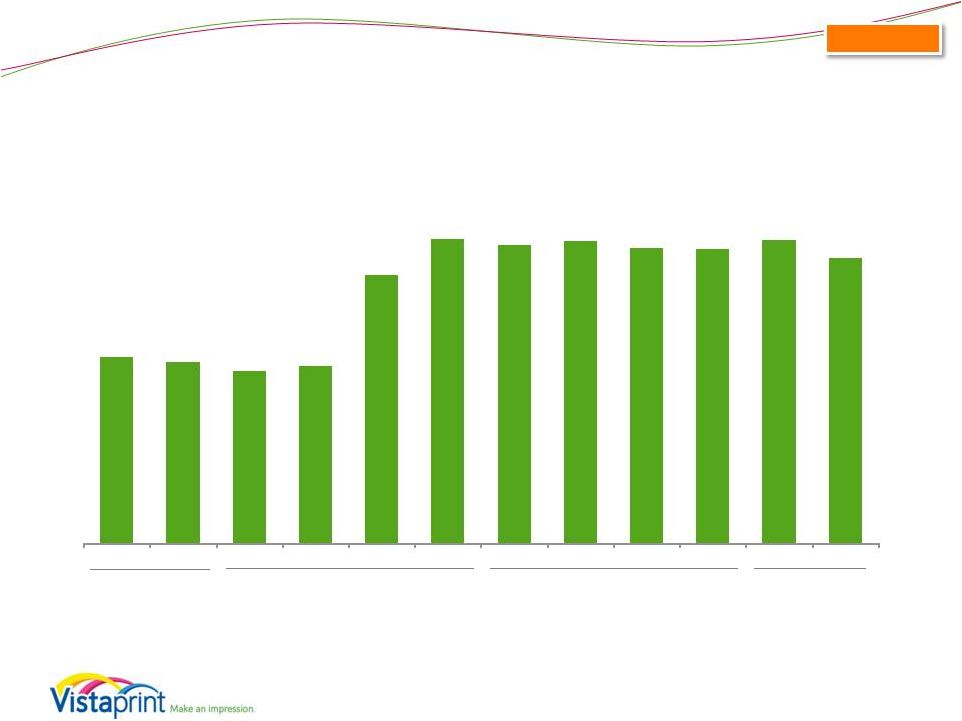
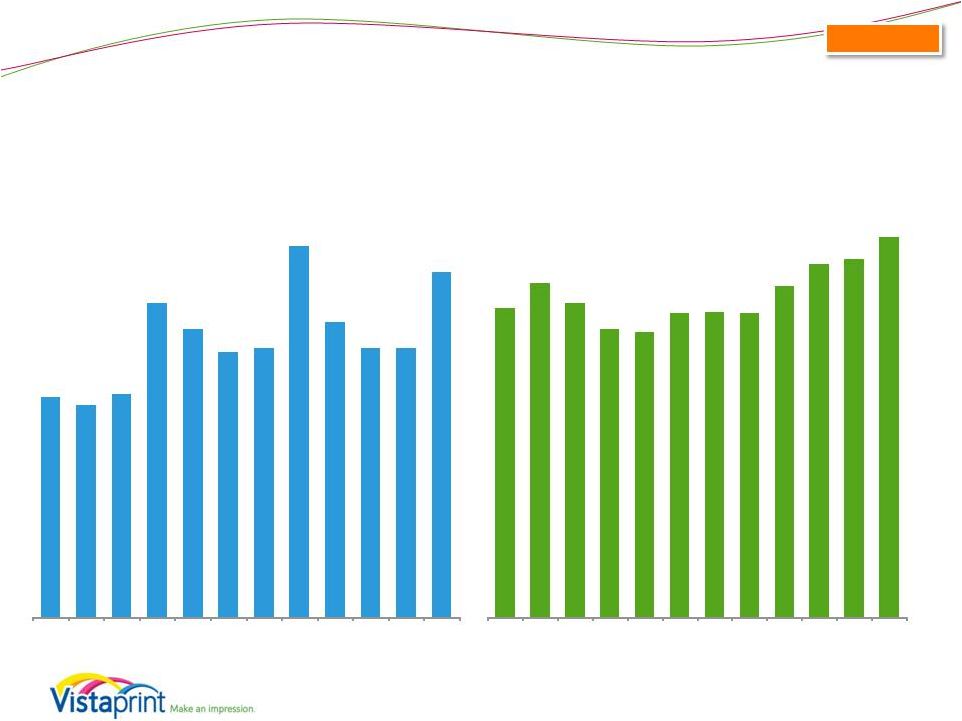 Operational Metrics (Includes Albumprinter and Webs as of acquisition dates) 11 *Albumprinter and Webs included starting Q3FY12 Also starting in the same period, a minor calculation methodology change was made in order to accommodate the consolidation of metrics. Consolidated $36.03 $37.75 $36.38 $34.61 $34.43 $35.69 $35.79 $35.72 $37.56 $39.08 $39.40 $40.92 Q3 FY11 Q4 FY11 Q1 FY12 Q2 FY12 Q3 FY12* Q4 FY12 Q1 FY13 Q2 FY13 Q3 FY13 Q4 FY13 Q1 FY14 Q2 FY14 5.8 5.6 5.9 8.3 7.6 7.0 7.1 9.8 7.8 7.1 7.1 9.1 Q3 FY11 Q4 FY11 Q1 FY12 Q2 FY12 Q3 FY12* Q4 FY12 Q1 FY13 Q2 FY13 Q3 FY13 Q4 FY13 Q1 FY14 Q2 FY14 Orders (M) Average Order Value |
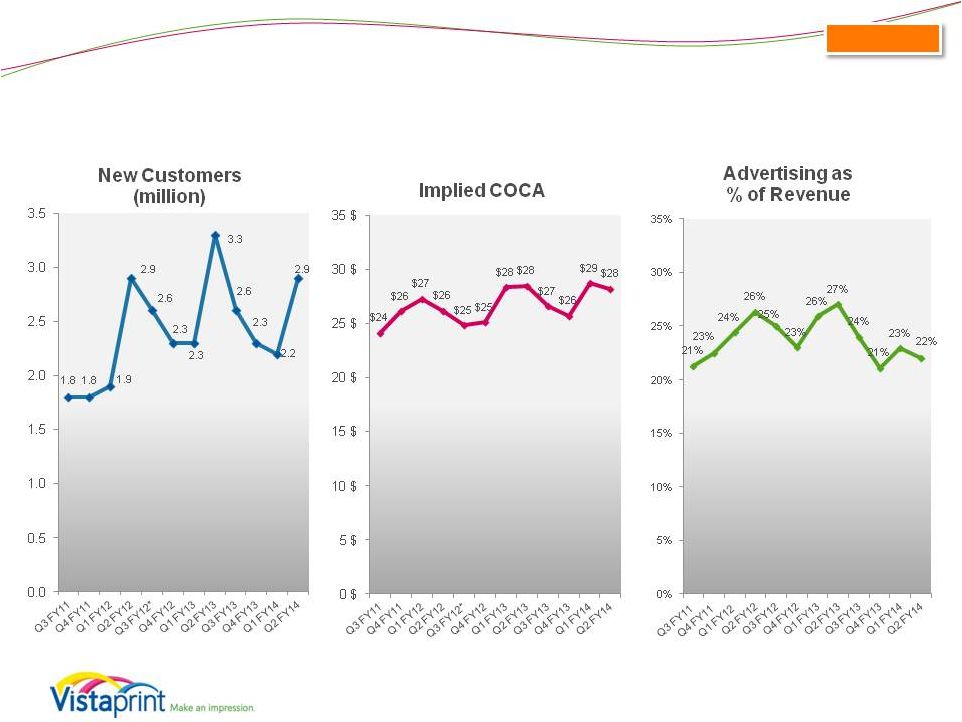 Consolidated Operational Metrics (Includes Albumprinter and Webs as of acquisition dates) 12 *Albumprinter and Webs included starting Q3FY12 Also starting in the same period, a minor calculation methodology change was made in order to accommodate the consolidation of metrics. |
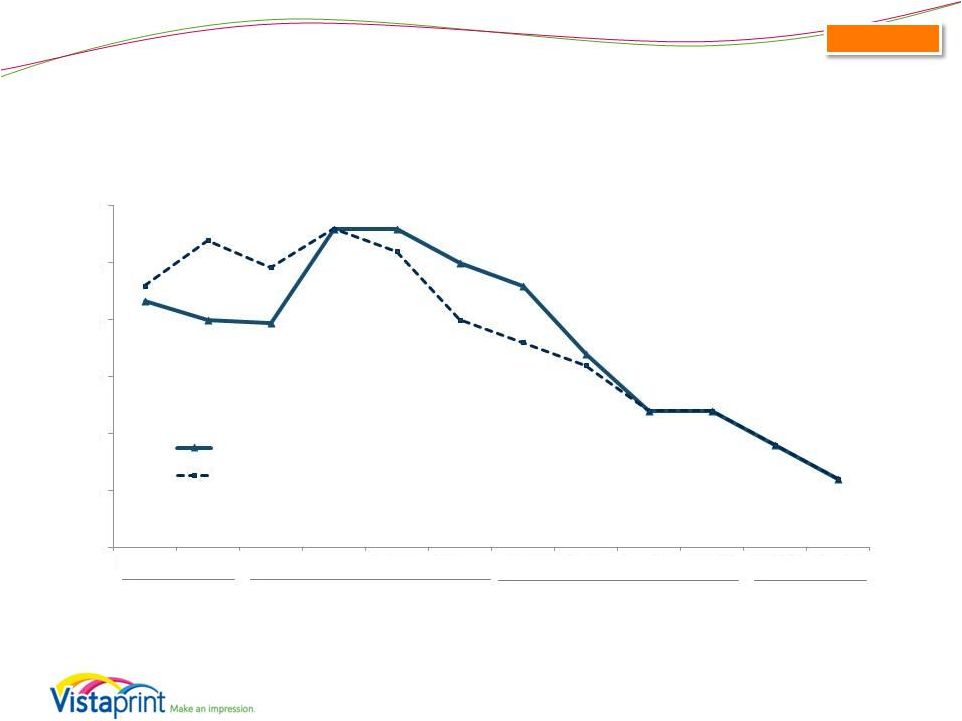
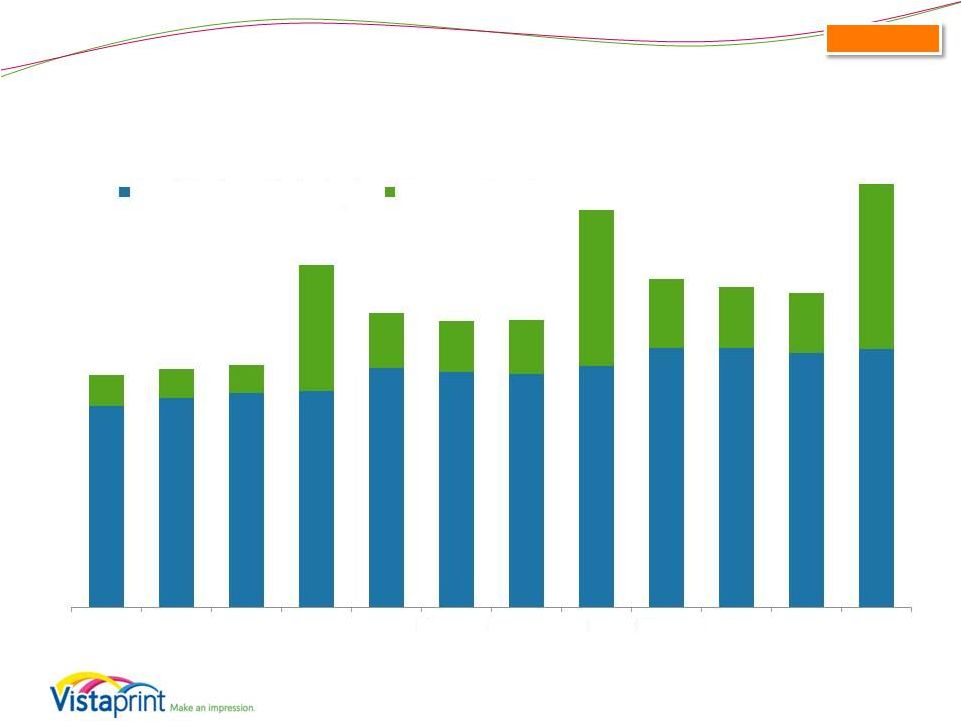
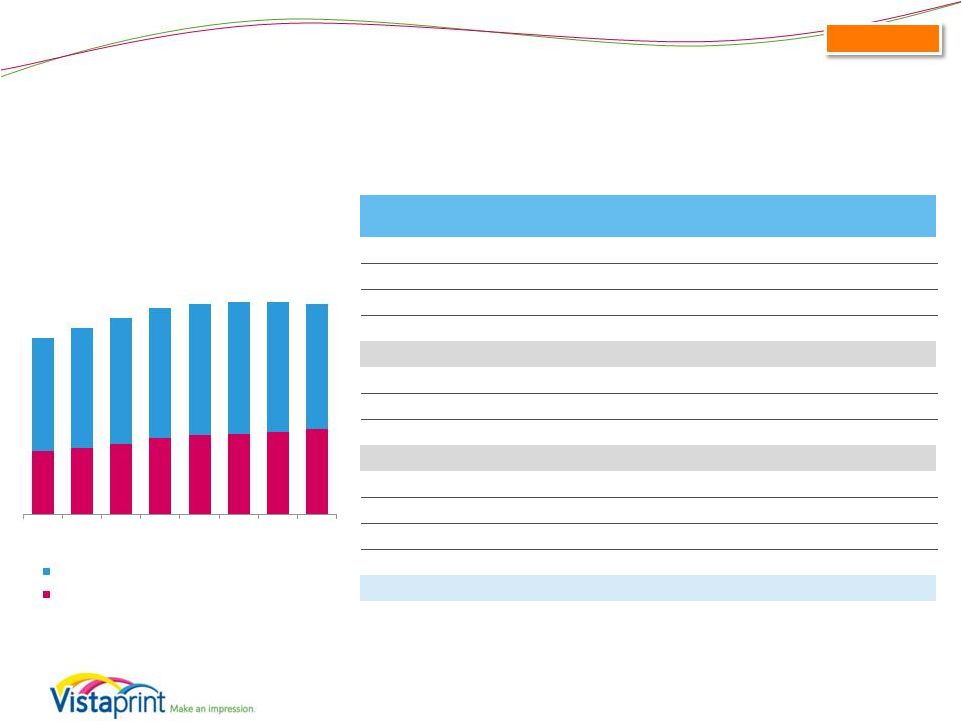 Consolidated Historical Revenue Driver Metrics (Includes Albumprinter and Webs as of acquisition dates) 13 *trailing twelve month at period end Q3 FY12 Q4 FY12 Q1 FY13 Q2 FY13 Q3 FY13 Q4 FY13 Q1 FY14 Q2 FY14 TTM Unique Customers (M) 14.2 15.0 15.8 16.6 16.9 17.0 17.1 16.9 TTM New Customers (M) 9.1 9.6 10.1 10.5 10.5 10.5 10.4 10.0 TTM Repeating Customers (M) 5.1 5.4 5.7 6.1 6.4 6.5 6.7 6.9 As % of Unique Customers TTM New Customers 64% 64% 64% 63% 62% 62% 61% 59% TTM Repeating Customers 36% 36% 36% 37% 38% 38% 39% 41% Y/Y Growth TTM Unique Customers 28% 32% 33% 29% 19% 13% 8% 2% TTM New Customers 26% 30% 31% 25% 15% 9% 3% -5% TTM Repeating Customers 31% 34% 35% 37% 25% 20% 18% 13% Implied Retention** 46% 47% 48% 48% 45% 43% 42% 42% 5.1 5.4 5.7 6.1 6.4 6.5 6.7 6.9 9.1 9.6 10.1 10.5 10.5 10.5 10.4 10.0 Q3 FY12 Q4 FY12 Q1 FY13 Q2 FY13 Q3 FY13 Q4 FY13 Q1 FY14 Q2 FY14 TTM* Unique Customers (M) New Customers Aquired in Period Customers Repeating from Prior Periods **TTM repeating customers as % of year-ago unique customers Starting in Q3 FY12, impact of Albumprinter and Webs has been included. 16.9 14.2 15.0 15.8 16.6 17.0 17.1 16.9 |
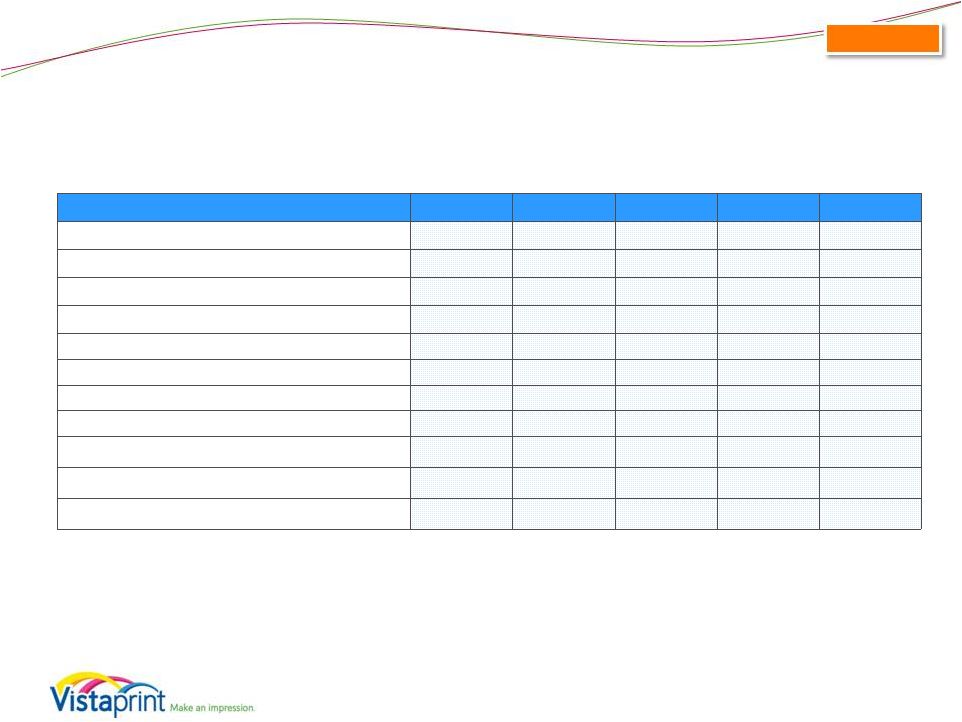
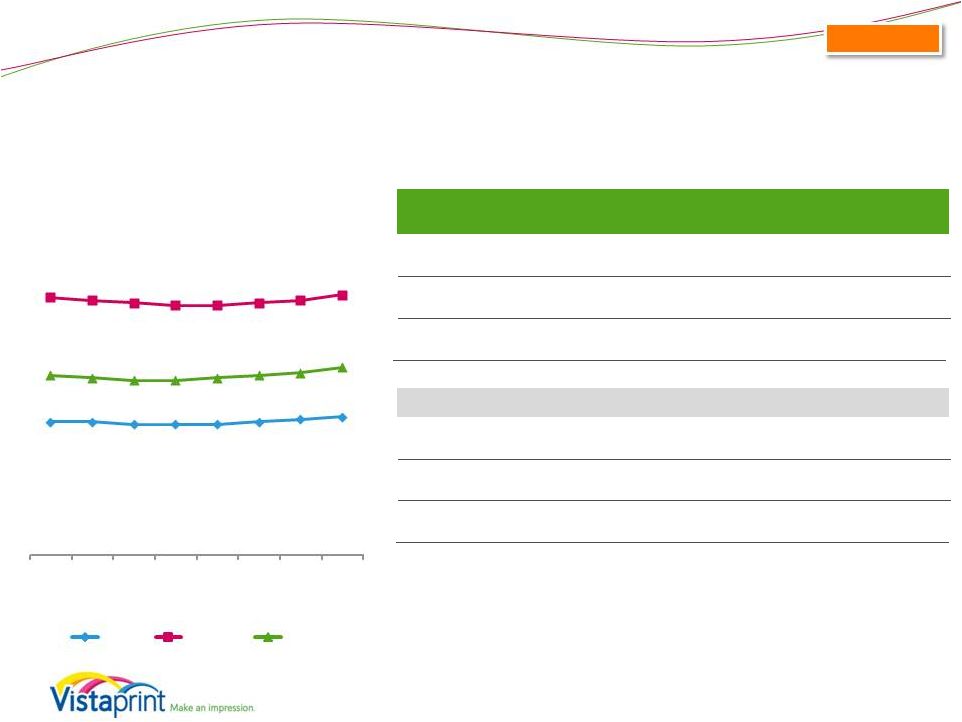 Consolidated Historical Revenue Driver Metrics (Includes Albumprinter and Webs as of acquisition dates) 14 Average Customer Bookings: $51 $51 $50 $50 $50 $51 $99 $98 $97 $96 $96 $97 $98 $100 $69 $68 $67 $67 $68 $69 $70 $72 Q3 FY12 Q4 FY12 Q1 FY13 Q2 FY13 Q3 FY13 Q4 FY13 Q1 FY14 Q2 FY14 Average Bookings Per Unique Customer (USD) New Repeat Total $52 $53 Q3 FY12 Q4 FY12 Q1 FY13 Q2 FY13 Q3 FY13 Q4 FY13 Q1 FY14 Q2 FY14 Average Bookings per Unique Customer $69 $68 $67 $67 $68 $69 $70 $72 Average Bookings per New Customer $51 $51 $50 $50 $50 $51 $52 $53 Average Bookings per Repeat Customer $99 $98 $97 $96 $96 $97 $98 $100 Y/Y Growth Average Bookings per Unique Customer -1% -6% -8% -6% -1% 1% 4% 7% Average Bookings per New Customer -6% -7% -9% -6% -2% 0% 4% 6% Average Bookings per Repeat Customer 0% -2% -5% -4% -3% -1% 1% 4% Starting in Q3 FY12, impact of Albumprinter and Webs has been included. |
 Looking Ahead 15 |
 FY14 Outlook Commentary 16 • Revenue guidance range changes: o ~6% to 8% constant currency growth • North America growth in low to mid teens • Europe growth roughly flat • APAC growth in mid single digits o At low end of former expectation range o We are patient with low revenue growth rates this year, as they come with positive long-term changes to customer value proposition and profitability improvements, especially in Europe • EPS guidance range: o Continue to expect strong margin and EPS growth year over year o Raising our EPS guidance range o Special items are largely timing issues and under current currency assumptions, should not materially impact the full year • Mark-to-market net impact of unrealized hedge gains/losses • Currency gains/losses on intercompany financing arrangements |
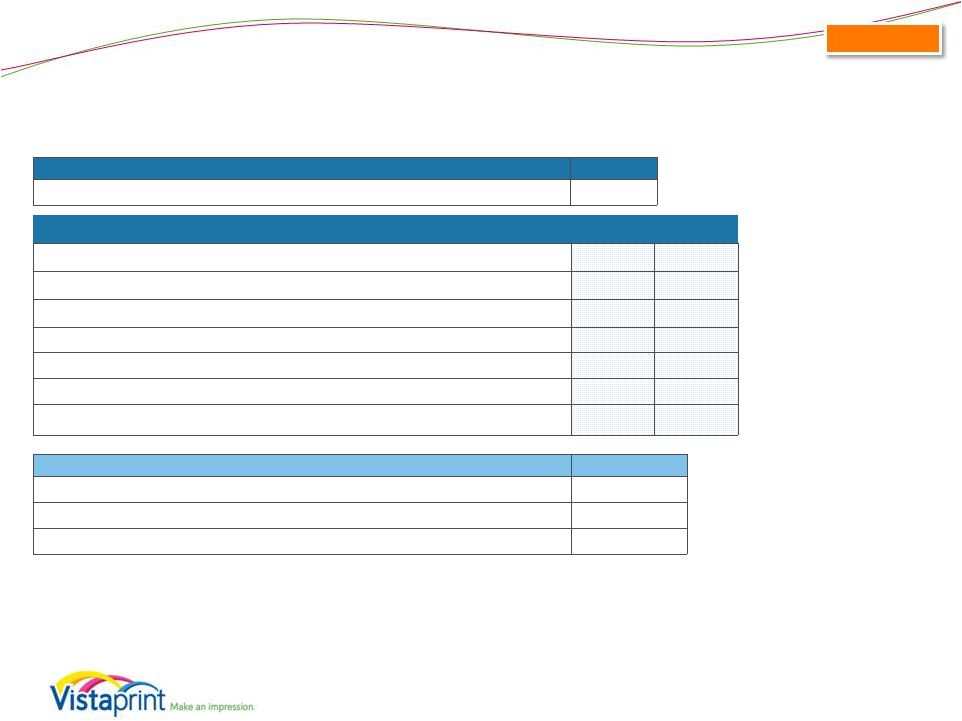
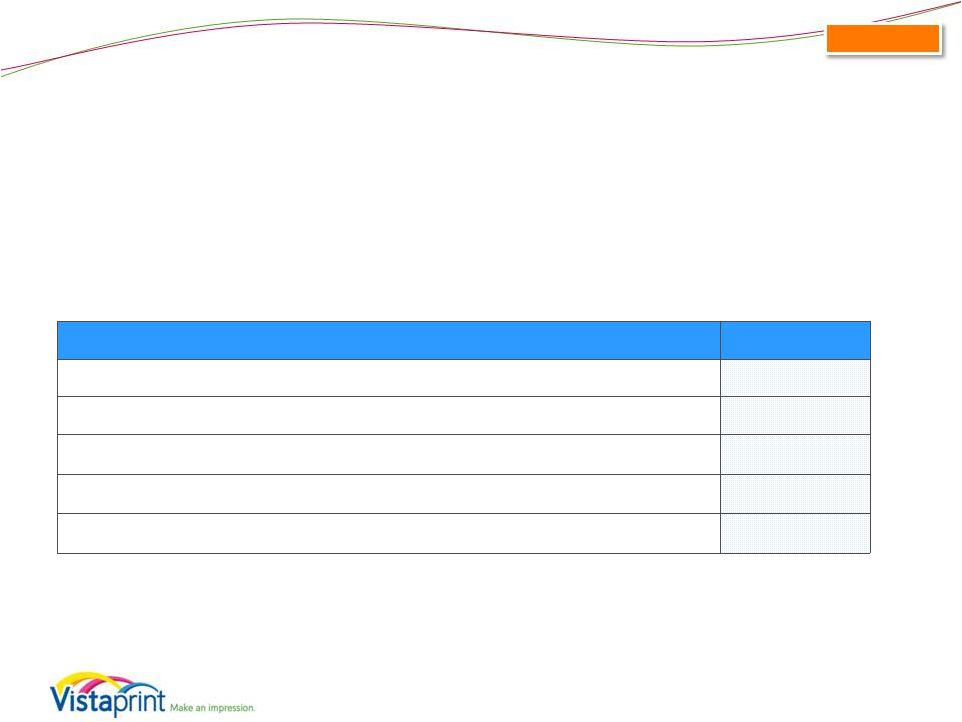
 Revenue and EPS Guidance* (as of January 29, 2014) FY14 ending 06/30/2014 Revenue $1,235 - $1,265 Revenue growth from FY 2013 period 6% - 8% Constant currency revenue growth estimate 6% - 8% GAAP EPS $1.55 - $1.80 EPS growth from FY 2013 period 82% - 112% GAAP share count 34.5 million FY14 ending 06/30/2014 Non-GAAP adjusted EPS $2.68 - $2.93 EPS growth from FY 2013 period 25% – 36% Non-GAAP share count 35.0 million Non-GAAP exclusions $39.6 * Millions, except share and per share amounts and as noted 17 Consolidated The Company is providing the following assumptions to facilitate non-GAAP adjusted net income per diluted share comparisons that exclude share-based compensation related expenses, amortization of acquired intangible assets, tax charges related to the alignment of IP with our global operations, changes in unrealized gains and losses on currency forward contracts, and unrealized currency transaction gains and losses on intercompany financing arrangements: |
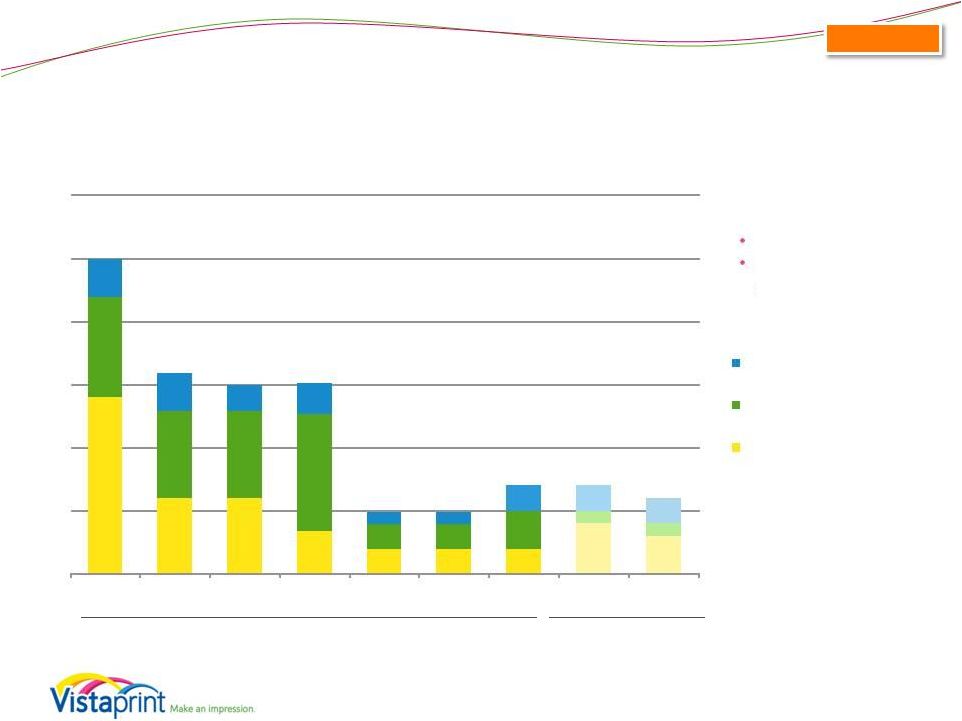 Capital Expenditures Guidance (as of January 29, 2014) Expressed as percent of revenue FY 2014 Guidance: $80M - $90M 6% - 7% of revenue Actuals Guidance $63M $63M $76M $90M $80M $101M $37M 18 $46M $79M Consolidated 14% 6% 6% 3% 2% 2% 2% 8% 7% 7% 9% 2% 2% 3% 3% 3% 2% 3% 1% 1% FY 07 FY 08 FY 09 FY 10 FY 11 FY 12 FY 13 FY 14-High FY 14-Low Other Land and Facilities Manufacturing & Automation Equipment 25% 16% 15% 5% 7% 15% 5% 6% 7% 4% 3% 1% 1% 2% 2% 2% guidance midpoint |
 Summary • Focus on strategic initiatives and operational implementation • Patient with our slower revenue growth • Strong profit execution • Continued focus on driving: o Competitive advantage o Long-term revenue and profit growth o Significant value for long-term shareholders 19 |
 Q&A Session Please go to the Investor Relations section of www.vistaprint.com for the live Q&A call at 5:15 pm EST on January 29, 2014 |
 Q2 Fiscal Year 2014 Financial and Operating Results Supplement |
 Consolidated Total Company Growth Rates* 6% reported 6% constant-currency 22 22% constant-currency growth FY11 FY12 25% constant-currency growth FY13 16% constant-currency growth 7% constant-currency growth 0% 5% 10% 15% 20% 25% 30% Q3 FY11 Q4 FY11 Q1 FY12 Q2 FY12* Q3 FY12 Q4 FY12 Q1 FY13 Q2 FY13 Q3 FY13 Q4 FY13 Q1 FY14 Q2 FY14 Constant-Currency Reported *Starting in Q2FY2012, revenue from acquired companies included. Note: Constant-currency revenue growth is estimated by translating all non-U.S. dollar denominated revenue generated in the current period using the prior year period’s average exchange rate for each currency to the U.S. dollar and excludes the impact of gains and losses on effective currency hedges recognized in revenue for applicable periods. Please see reconciliation to reported revenue growth rates at the end of this presentation. YTD FY14 |
 Consolidated 23 *Starting in Q2FY2012, revenue from acquired companies included. Note: Constant-currency revenue growth is estimated by translating all non-U.S. dollar denominated revenue generated in the current period using the prior year period’s average exchange rate for each currency to the U.S. dollar and excludes the impact of gains and losses on effective currency hedges recognized in revenue for applicable periods. Please see reconciliation to reported revenue growth rates at the end of this presentation. Segment Revenue Growth Rates* Constant Currency |
 Consolidated 24 FY11 64.8% FY12 65.2% FY13 65.7% YTD FY14 66.5% $133 $133 $134 $200 $169 $162 $163 $234 $189 $179 $250 65.3% 63.9% 63.2% 66.8% 65.5% 64.6% 65.0% 67.2% 65.5% 64.6% 65.2% 67.4% Q3 FY11 Q4 FY11 Q1 FY12 Q2 FY12 Q3 FY12 Q4 FY12 Q1 FY13 Q2 FY13 Q3 FY13 Q4 FY13 Q1 FY14 Q2 FY14 Gross Profit (millions) GM % $181 Gross Margin and Gross Profit |
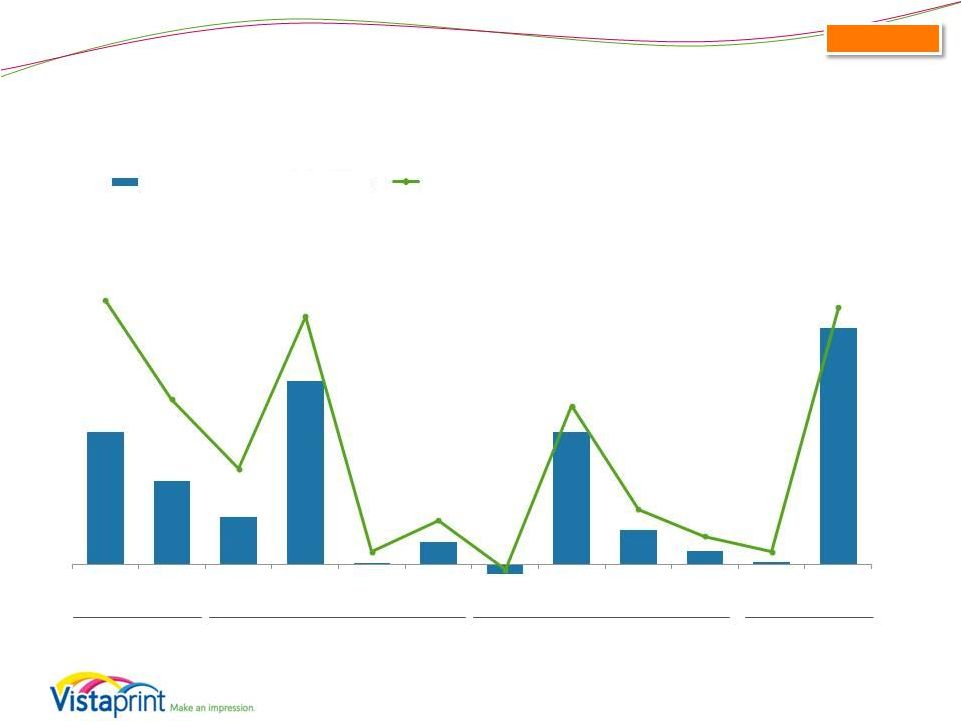 Consolidated 25 FY11 $82 FY12 $44 FY13 $29 YTD FY14 $41 $23 $14 $8 $32 $0 $4 $(2) $23 $6 $2 $0 $41 11.3% 6.9% 3.8% 10.6% 0.1% 1.5% -0.7% 6.6% 2.0% 0.8% 0.1% 11.0% Q3 FY11 Q4 FY11 Q1 FY12 Q2 FY12 Q3 FY12 Q4 FY12 Q1 FY13 Q2 FY13 Q3 FY13 Q4 FY13 Q1 FY14 Q2 FY14 GAAP Net Income (loss), in millions GAAP Net Margin GAAP Net Income (Loss) and Net Margin |
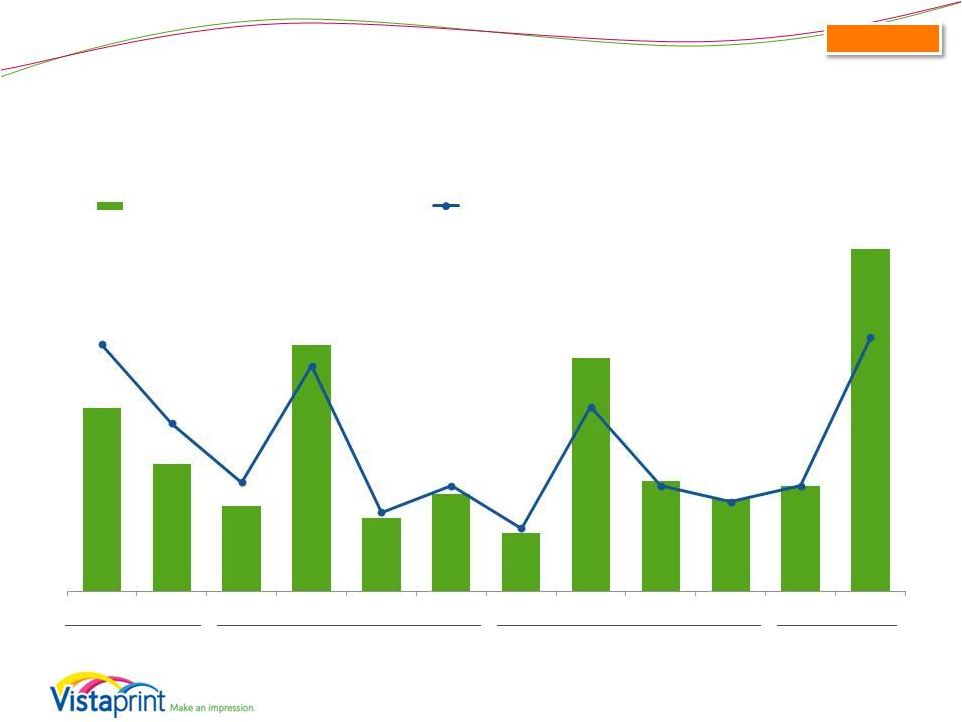 Non-GAAP Adjusted Net Income* and Non-GAAP Adjusted Net Margin *Non-GAAP adjusted net income for all periods presented excludes the impact of share-based compensation expense and its related tax effect, amortization of acquired intangibles, charges related to the alignment of Webs IP with our global structure, changes in unrealized gains and losses on currency forward contracts, and unrealized currency transaction gains and losses on intercompany financing arrangements and the related tax effect. Please see reconciliation to GAAP net income at the end of this presentation. 26 FY11 $105 FY12 $77 FY13 $76 YTD FY14 $69 $28 $20 $13 $38 $11 $15 $9 $36 $17 $14 $16 $53 13.8% 9.4% 6.1% 12.6% 4.4% 5.9% 3.5% 10.3% 5.9% 5.0% 5.9% 14.2% Non-GAAP Adjusted Net Income (millions) Non-GAAP Adjusted Net Margin Q3 FY11 Q4 FY11 Q1 FY12 Q2 FY12 Q3 FY12 Q4 FY12 Q1 FY13 Q2 FY13 Q3 FY13 Q4 FY13 Q1 FY14 Q2 FY14 Consolidated |
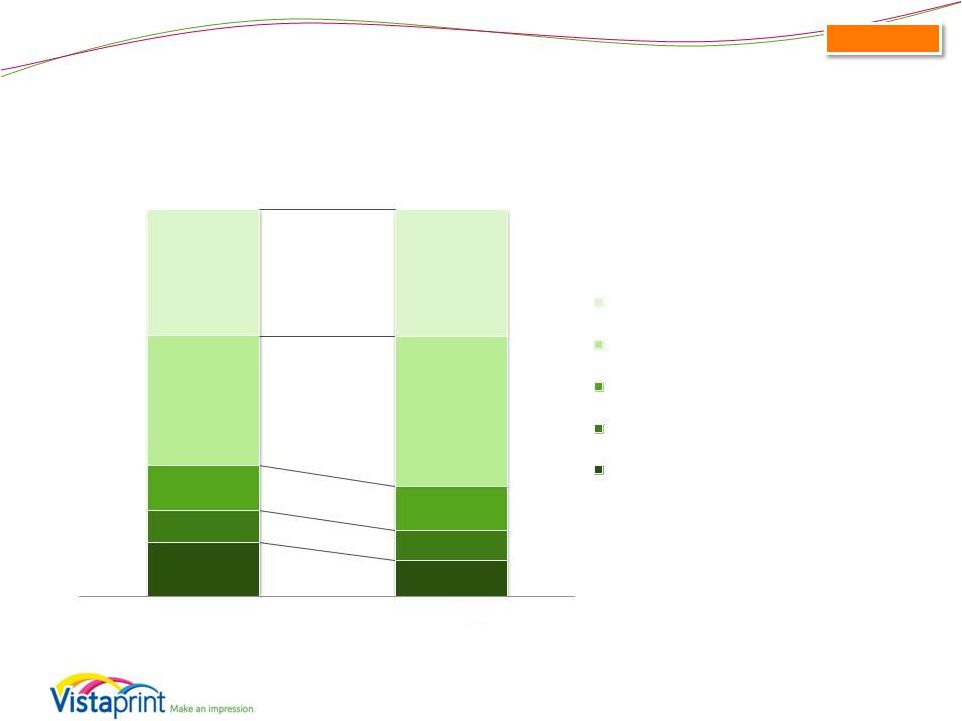 Q2 Income Statement Comparison to Prior Year (as a percentage of revenue) 27 14.2% 9.5% 8.2% 7.6% 11.5% 11.5% 33.5% 38.6% 32.6% 32.8% Q2 FY2014 Q2 FY2013 Cost of revenue Marketing and selling Technology and development General and administrative Income from operations Consolidated |
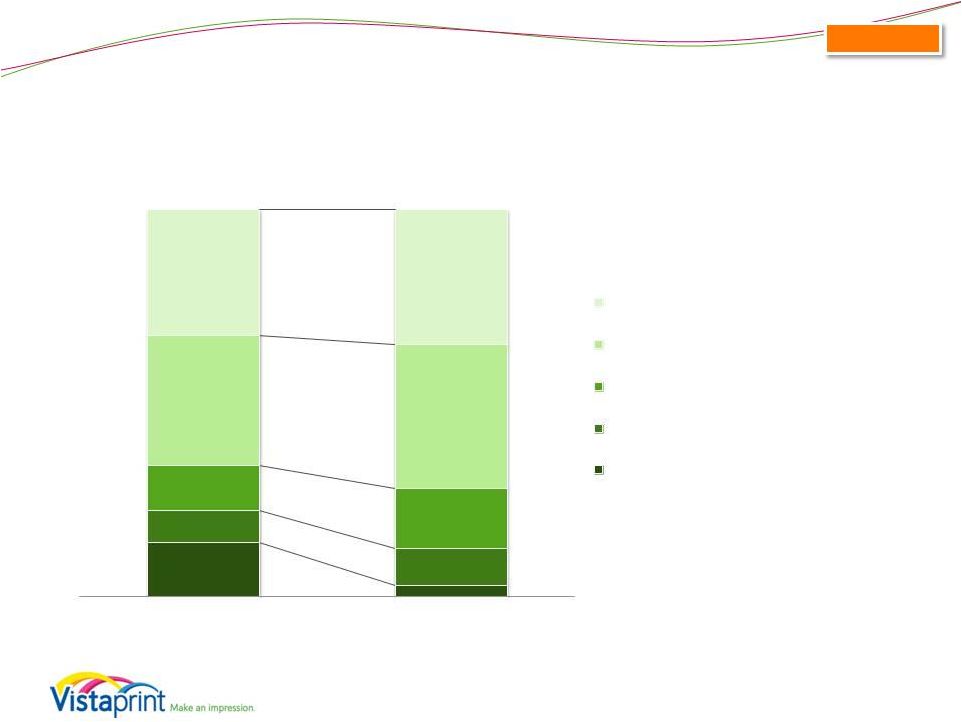 Consolidated Q2 Income Statement Comparison to Prior Quarter (as a percentage of revenue) 28 14.2% 3.1% 8.2% 9.5% 11.5% 15.4% 33.5% 37.2% 32.6% 34.8% Q2 FY2014 Q1 FY2014 Cost of revenue Marketing and selling Technology and development General and administrative Income from operations |
 Share-Based Compensation* (millions) * Share-based compensation (SBC) expense includes SBC-related tax adjustment. 29 FY11 $22.4 FY12 $26.1 FY13 $33.7 YTD FY14 $16.6 $5.3 $5.1 $4.9 $5.0 $7.6 $8.6 $8.4 $8.5 $8.4 $8.3 $8.6 $8.1 Q3 FY11 Q4 FY11 Q1 FY12 Q2 FY12 Q3 FY12 Q4 FY12 Q1 FY13 Q2 FY13 Q3 FY13 Q4 FY13 Q1 FY14 Q2 FY14 Consolidated |
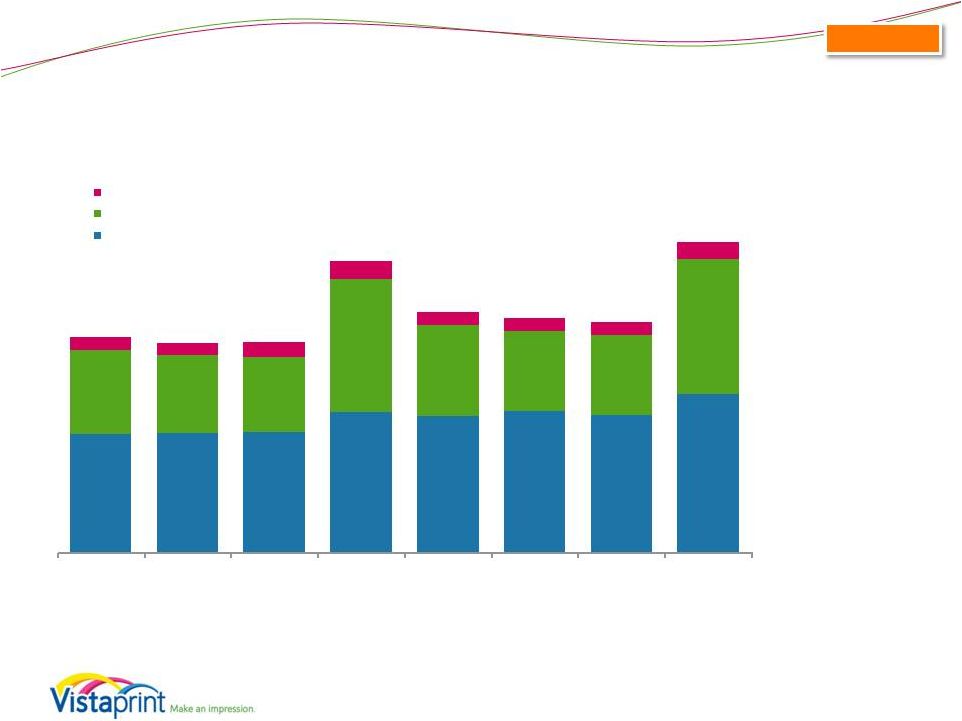
 * Home and family revenue is calculated using a product format-based approach; all Albumprinter revenue is included in home and family and all Webs revenue is included in Small business marketing 30 $204 $209 $212 $300 $258 $250 $251 $348 $288 $280 $275 $371 Q3 FY11 Q4 FY11 Q1 FY12 Q2 FY12 Q3 FY12 Q4 FY12 Q1 FY13 Q2 FY13 Q3 FY13 Q4 FY13 Q1 FY14 Q2 FY14 Small Business Marketing* Home and Family* Consolidated Revenue Seasonality (Includes Albumprinter and Webs as of the dates of acquisition) |
 Consolidated Balance Sheet Highlights Balance Sheet highlights, in millions, at period end 12/31/13 09/30/2013 06/30/13 03/31/13 12/31/12 Total assets $674.6 $638.7 $601.6 $616.4 $653.7 Cash and cash equivalents $62.3 $64.7 $50.1 $51.3 $64.7 Total current assets $135.5 $121.8 $100.2 $104.4 $132.3 Goodwill and intangible assets $171.6 $171.5 $171.2 $174.3 $179.2 Total liabilities $414.4 $432.0 $412.0 $414.7 $443.8 Current liabilities $197.9 $144.3 $155.0 $154.0 $182.4 Long-term debt $189.3 $262.5 $230.0 $229.0 $230.5 Shareholders’ Equity $260.3 $206.7 $189.6 $201.7 $209.9 Treasury shares (in millions) 10.9 11.0 11.3 10.9 16.4 31 |
 Consolidated Total Debt as of December 31, 2013 Availability under our credit facility ($ millions)* 12/31/13 Maximum aggregate available borrowing amounts 496.3 Outstanding borrowings of credit facility (204.5) Remaining amount 291.8 Limitations to borrowing due to debt covenants and other obligations** (2.1) Amount available for borrowing as of December 31, 2013 $289.7 32 • Aggregate loan commitments of $496.3M • Interest rate of LIBOR plus 1.50% - 2.0%, depending on leverage • Currently in compliance with all covenants. Key financial covenants are: Total leverage ratio not to exceed 3.5x TTM EBITDA (reducing to 3.25x on 3/31/14 and 3.0x on 3/31/15). Interest coverage ratio of at least 3.0x TTM EBITDA. • Purchases of our ordinary shares, payments of dividends, and mergers and acquisitions are subject to more restrictive consolidated leverage ratio thresholds than those listed above when calculated on a proforma basis in certain scenarios. Also the credit agreement limits the amount of purchases of our ordinary shares, payments of dividends, mergers and acquisitions, investments in joint ventures or minority interests, and consolidated capital expenditures that we may make. These limitations can include annual limits that vary from year-to-year and aggregate limits over the term of the credit facility. Therefore, our ability to make desired investments may be limited during the term of our revolving credit facility. * As announced in our Form 8-K filed on January 22, 2014, we entered into an amendment to our credit agreement on January 17, 2014 resulting in an increase to aggregate loan commitments under the credit agreement by $303.75 million, to a total of $800.0 million by adding new lenders and increasing the commitments of several existing lenders. The loan commitments consist of revolving loans of $640.0 million and a term loan of $160.0 million. Key covenants, pricing, and maturity date have remained the same. ** Our borrowing ability can be limited by our debt covenants each quarter. These covenants may limit our borrowing capacity depending on our leverage, other indebtedness, such as installment obligations and letters of credit, and other factors that are outlined in our credit agreement filed as an exhibit in our Form 8-Ks filed on February 13, 2013 and January 22, 2014. o o |
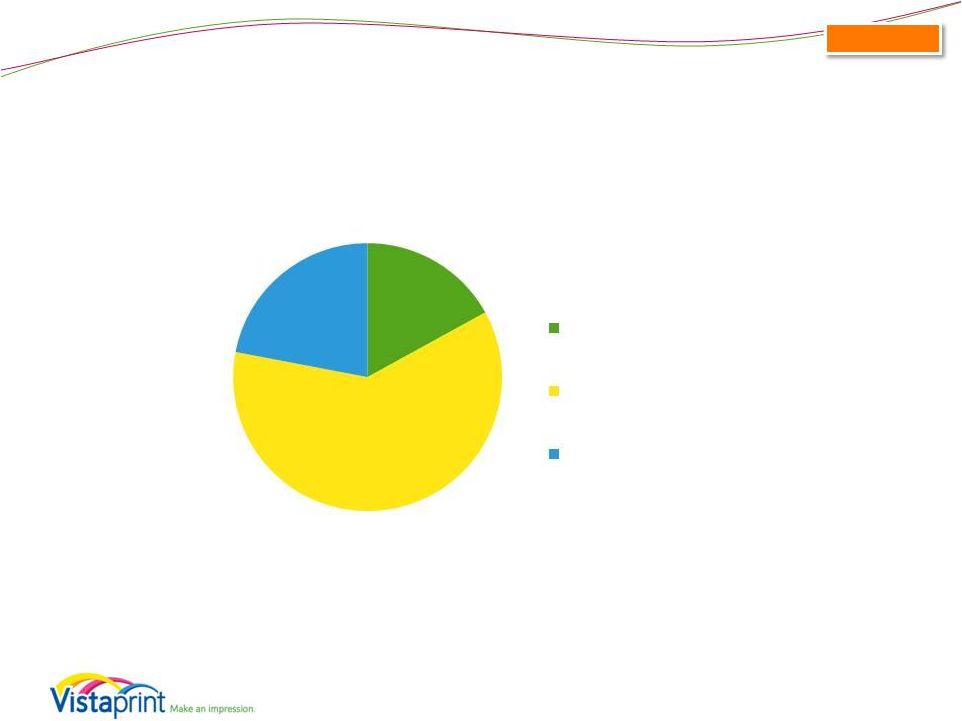 Q2 FY14 Capital Expenditure Breakdown 33 Q2 FY14 CapEx: $24.6M Consolidated 1 3 2 17% 61% 22% Land/Facilities Mfg & Automation Equipment Other 1 Land, building and construction, leasehold improvements, and furniture and fixtures 2 All manufacturing and automation equipment, including offset and digital print lines, other printing equipment, pre-press and post-press equipment such as cutters, and automation equipment 3 IT infrastructure, software and office equipment |
 Appendix Including a Reconciliation of GAAP to Non-GAAP Financial Measures |
 About non-GAAP financial measures To supplement Vistaprint’s consolidated financial statements presented in accordance with U.S. generally accepted accounting principles, or GAAP, Vistaprint has used the following measures defined as non-GAAP financial measures by Securities and Exchange Commission, or SEC, rules: non-GAAP adjusted net income, non-GAAP adjusted net income per diluted share, free cash flow and constant-currency revenue growth. The items excluded from the non-GAAP adjusted net income measurements are share-based compensation expense and its related tax effect, amortization of acquisition-related intangibles, tax charges related to the alignment of acquisition-related intellectual property with global operations, changes in unrealized gains and losses on currency forward contracts, and unrealized currency transaction gains and losses on intercompany financing arrangements and the related tax effect. Free cash flow is defined as net cash provided by operating activities less purchases of property, plant and equipment, purchases of intangible assets not related to acquisitions, and capitalization of software and website development costs. Constant-currency revenue growth is estimated by translating all non-U.S. dollar denominated revenue generated in the current period using the prior year period’s average exchange rate for each currency to the U.S. dollar and excludes the impact of gains and losses on effective currency hedges recognized in revenue in the prior year periods. The presentation of non-GAAP financial information is not intended to be considered in isolation or as a substitute for the financial information prepared and presented in accordance with GAAP. For more information on these non-GAAP financial measures, please see the tables captioned “Reconciliations of Non-GAAP Financial Measures” included at the end of this release. The tables have more details on the GAAP financial measures that are most directly comparable to non-GAAP financial measures and the related reconciliation between these financial measures. Vistaprint’s management believes that these non-GAAP financial measures provide meaningful supplemental information in assessing our performance and liquidity by excluding certain items that may not be indicative of our recurring core business operating results, which could be non-cash charges or discrete cash charges that are infrequent in nature. These non-GAAP financial measures also have facilitated management’s internal comparisons to Vistaprint’s historical performance and our competitors’ operating results. 35 |
 Reconciliation: GAAP to Non-GAAP Results FY 2003 FY 2004 FY 2005* FY 2006 FY 2007 FY 2008 FY 2009 FY2010 FY2011 FY2012 FY2013 GAAP Net Income $473 $3,440 ($16,218) $19,234 $27,143 $39,831 $55,686 $67,741 $82,109 $43,994 $29,435 Share-based compensation and related tax effect $0 $0 $0 $4,850 $8,765 $15,275 $20,177 $23,156 $22,400 $26,060 $33,662 Amortization of acquired intangible assets - - - - - - - - - $5,754 $10,361 Tax Impact of Webs IP transfer - - - - - - - - - $1,235 $2,387 Non-GAAP Adjusted Net Income $473 $3,440 $4,782 $23,146 $35,908 $55,106 $75,863 $90,897 $104,50 9 $77,043 $75,845 Net Income (Loss) – Annual ($ in thousands) *Fiscal 2005 non-GAAP results exclude a contract termination payment of $21mm 36 |
 Reconciliation: GAAP to Non-GAAP Results Net Income (Loss) – Quarterly ($ in thousands) . Fiscal Year 2011 Fiscal Year 2012 Fiscal Year 2013 FY2014 Q3 Q4 Q1 Q2 Q3 Q4 Q1 Q2 Q3 Q4 Q1 Q2 GAAP Net Income $22,917 $14,397 $8,172 $31,697 $274 $3,851 $(1,696) $22,960 $5,866 $2,305 $412 $40,875 Share-based compensation and related tax effect $5,285 $5,129 $4,876 $5,021 $7,566 $8,596 $8,445 $8,540 $8,353 $8,324 $8,576 $8,062 Amortization of acquired intangible assets - - - $1,148 $2,381 $2,225 $2,178 $2,243 $2,275 $3,665 $2,200 $2,249 Tax Impact of Webs IP Transfer - - - - $1,017 $218 - $2,164 $431 ($208) $63 $1,468 Changes in unrealized (gain) loss on currency forward contracts included in net income $4,856 $(1,155) Unrealized currency transaction loss on intercompany loan and the related tax effect - $1,163 Non-GAAP Adjusted Net Income $28,202 $19,526 $13,048 $37,866 $11,238 $14,890 $8,927 $35,907 $16,925 $14,086 $16,107 $52,662 37 |
 Reconciliation: GAAP to Non-GAAP Results Diluted Earnings Per Share - Annual 38 FY 2006 FY 2007 FY 2008 FY 2009 FY2010 FY2011 FY2012 FY2013 GAAP Net Income per share $0.45 $0.60 $0.87 $1.25 $1.49 $1.83 $1.13 $0.85 Share-based Compensation and related tax effect per share $0.09 $0.18 $0.31 $0.43 $0.49 $0.47 $0.65 $0.95 Amortization of acquired intangible assets per share - - - - - - $0.14 $0.29 Tax Impact of Webs IP Transfer per share - - - - - - $0.03 $0.06 Non-GAAP Adjusted Net Income per share $0.54 $0.78 $1.18 $1.68 $1.98 $2.30 $1.95 $2.15 Weighted average shares used in computing Non- GAAP EPS (millions) 42.651 45.825 46.780 45.099 45.989 45.448 39.426 35.201 |
 Reconciliation: GAAP to Non-GAAP Results Earnings Per Diluted Share - Quarterly . Fiscal Year 2011 Fiscal Year 2012 Fiscal Year 2013 FY2014 Q3 Q4 Q1 Q2 Q3 Q4 Q1 Q2 Q3 Q4 Q1 Q2 GAAP Net Income per share $0.51 $0.32 $0.19 $0.82 $0.01 $0.10 $(0.05) $0.66 $0.17 $0.07 $0.01 $1.18 Share-based Compensation and related tax effect per share $0.12 $0.11 $0.12 $0.12 $0.20 $0.23 $0.24 $0.24 $0.24 $0.24 $0.25 $0.22 Amortization of acquired intangible assets per share - - - $0.03 $0.06 $0.06 $0.06 $0.06 $0.06 $0.11 $0.06 $0.06 Tax impact of Webs IP Transfer per share - - - - $0.02 $0.01 - $0.06 $0.01 $(0.01) $0.00 $0.04 Changes in unrealized (gain) loss on currency forward contracts included in net income per share $0.13 $(0.03) Unrealized currency transaction loss on intercompany loan and the related tax effect per share $0.00 $0.03 Non-GAAP Adjusted Net Income per share $0.63 $0.43 $0.31 $0.97 $0.29 $0.40 $0.25 $1.02 $0.48 $0.41 $0.45 $1.50 Weighted average shares used in computing Non- GAAP EPS (millions) 45.079 45.156 42.569 39.041 38.346 37.620 35.793 35.156 35.217 34.633 35.005 35.118 39 |
 Reconciliation: Free Cash Flow (in thousands) 40 Three Months Ended Six Months Ended December 31, December 31, 2013 2012 2013 2012 Net cash provided by operating activities $ $ $ $ Purchases of property, plant and equipment Purchases of intangibles assets Capitalization of software and website development costs Free cash flow $ $ $ $ 95,027 (24,592) (44) (2,605) 67,786 88,533 (27,609) (361) (1,839) 58,724 94,904 (42,169) (119) (4,419) 48,197 95,183 (55,368) (370) (3,140) 36,305 |
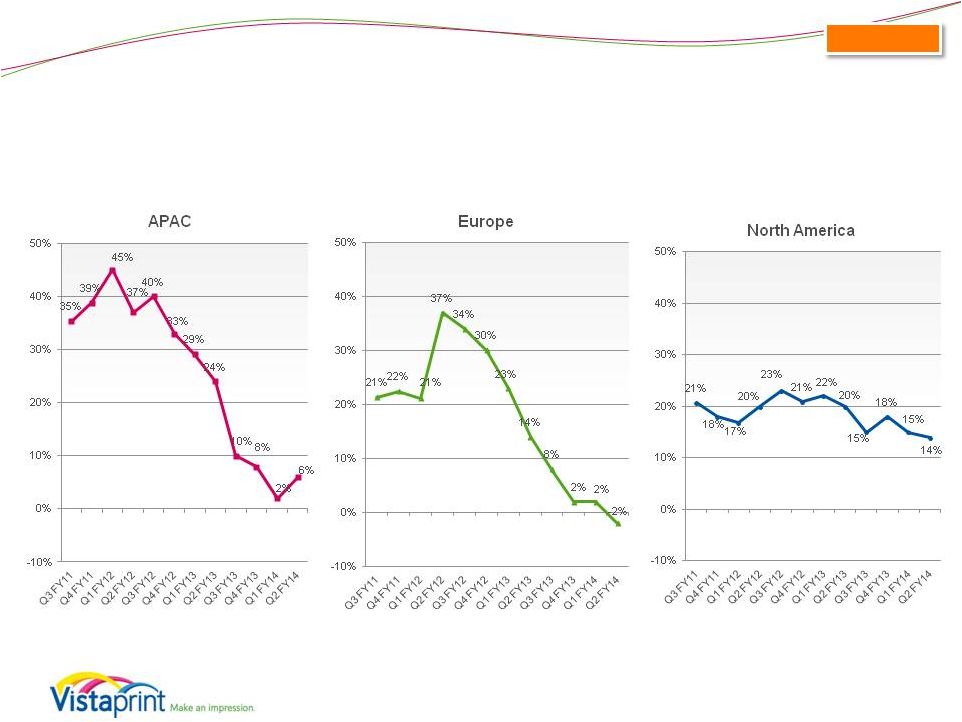
 Reconciliation: Constant-Currency Revenue Growth Rates Quarterly 41 ASIA-PACIFIC Q3 FY11 Q4 FY11 Q1 FY12 Q2 FY12 Q3 FY12 Q4 FY12 Q1 FY13 Q2 FY13 Q3 FY13 Q4 FY13 Q1 FY14 Q2 FY14 Reported revenue growth 50% 65% 67% 41% 47% 28% 28% 26% 6% 4% (11%) (5%) Currency impact (15%) (26%) (22%) (4%) (7%) 5% 2% (3%) 4% 4% 13% 11% Revenue growth in constant currency 35% 39% 45% 37% 40% 33% 29% 24% 10% 8% 2% 6% Note: Constant-currency revenue growth is estimated by translating all non-U.S. dollar denominated revenue generated in the current period using the prior year period’s average exchange rate for each currency to the U.S. dollar and excludes the impact of gains and losses on effective currency hedges recognized in revenue for applicable periods. EUROPE Q3 FY11 Q4 FY11 Q1 FY12 Q2 FY12 Q3 FY12 Q4 FY12 Q1 FY13 Q2 FY13 Q3 FY13 Q4 FY13 Q1 FY14 Q2 FY14 Reported revenue growth 22% 38% 31% 36% 29% 18% 12% 11% 8% 3% 6% 1% Currency impact (1%) (15%) (10%) 1% 5% 12% 11% 2% 0% (1%) (4%) (3%) Revenue growth in constant currency 21% 22% 21% 37% 34% 30% 23% 14% 8% 2% 2% (2%) |
 Reconciliation: Constant-Currency Revenue Growth Rates Quarterly 42 NORTH AMERICA Q3 FY11 Q4 FY11 Q1 FY12 Q2 FY12 Q3 FY12 Q4 FY12 Q1 FY13 Q2 FY13 Q3 FY13 Q4 FY13 Q1 FY14 Q2 FY14 Reported revenue growth 21% 18% 17% 20% 23% 20% 22% 20% 15% 18% 14% 13% Currency impact 0% 0% 0% 0% 0% 0% 0% 0% 0% 0% 1% 1% Revenue growth in constant currency 21% 18% 17% 20% 23% 21% 22% 20% 15% 18% 15% 14% Note: Constant-currency revenue growth is estimated by translating all non-U.S. dollar denominated revenue generated in the current period using the prior year period’s average exchange rate for each currency to the U.S. dollar and excludes the impact of gains and losses on effective currency hedges recognized in revenue for applicable periods. TOTAL COMPANY Q3 FY11 Q4 FY11 Q1 FY12 Q2 FY12 Q3 FY12 Q4 FY12 Q1 FY13 Q2 FY13 Q3 FY13 Q4 FY13 Q1 FY14 Q2 FY14 Reported revenue growth 23% 27% 25% 28% 26% 20% 18% 16% 12% 12% 9% 6% Currency impact (1%) (7%) (5%) 0% 2% 5% 5% 1% 0% 0% 0% 0% Revenue growth in constant currency 22% 20% 20% 28% 28% 25% 23% 17% 12% 12% 9% 6% |