Exhibit 99.2
|
Exhibit 99.2
Q4 & Fiscal Year 2014
Earnings Presentation, Commentary
& Financial Results Supplement
July 30, 2014
|
Safe Harbor Statement
This presentation and the accompanying notes contains statements about our future expectations, plans and prospects of our business that constitute forward-looking statements for purposes of the safe harbor provisions under the Private Securities Litigation Reform Act of 1995, including but not limited to our expectations for the growth, development, and profitability of our business and our recent acquisitions, the integration of our recent acquisitions, and our financial outlook and guidance set forth under the headings “FY2015 Outlook &Expectations,” “Revenue and EPS Guidance,” and “Capital Expenditures Guidance.” Forward-looking projections and expectations are inherently uncertain, are based on assumptions and judgments by management, and may turn out to be wrong. Our actual results may differ materially from those indicated by these forward-looking statements as a result of various important factors, including but not limited to flaws in the assumptions and judgments upon which our forecasts are based; our failure to execute our strategy; our inability to make the investments in our business that we plan to make; the failure of our strategy, investments, and efforts to reposition the Vistaprint brand to have the effects that we expect; our failure to promote and strengthen our brands; our failure to acquire new customers and enter new markets, retain our current customers and sell more products to current and new customers; our failure to identify and address the causes of our revenue weakness; our failure to manage the complexity of our business and expand our operations; costs and disruptions caused by acquisitions and strategic investments; the failure of the businesses we acquire or invest in, including People & Print Group and Pixartprinting, to perform as expected; difficulties or higher than anticipated costs in integrating the systems and operations of our acquired businesses into our systems and operations; the willingness of purchasers of marketing services and products to shop online; the failure of our current and new marketing channels to attract customers; our failure to manage growth and changes in our organization; currency fluctuations that affect our revenues and costs including the impact of currency hedging strategies and intercompany transactions; unanticipated changes in our markets, customers, or business; competitive pressures; interruptions in or failures of our websites, network infrastructure or manufacturing operations; our failure to retain key employees; our failure to maintain compliance with the financial covenants in our revolving credit facility or to pay our debts when due; costs and judgments resulting from litigation; changes in the laws and regulations or in the interpretations of laws or regulations to which we are subject, including tax laws, or the institution of new laws or regulations that affect our business; general economic conditions; and other factors described in our Form 10-Q for the fiscal quarter ended March 31, 2014 and the other documents we periodically file with the U.S. Securities and Exchange Commission.
2 |
|
|
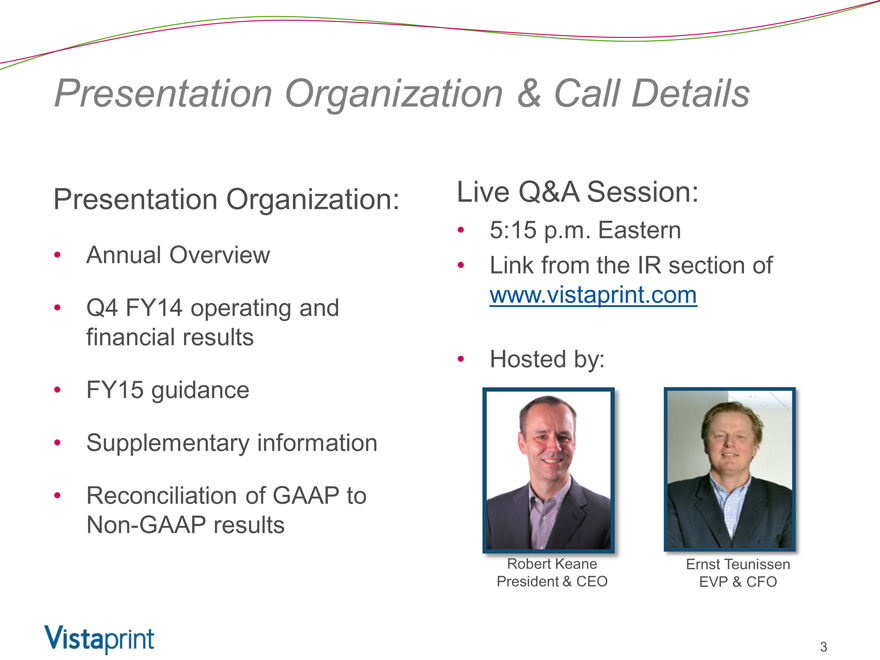
Presentation Organization & Call Details
Presentation Organization:
Annual Overview
Q4 FY14 operating and financial results
FY15 guidance
Supplementary information
Reconciliation of GAAP to Non-GAAP results
Live Q&A Session: ession:
5:15 p.m. Eastern
Link from the IR section of www.vistaprint.com
Hosted by:
Robert Keane
President & CEO
Ernst Teunissen
EVP & CFO
3 |
|
|
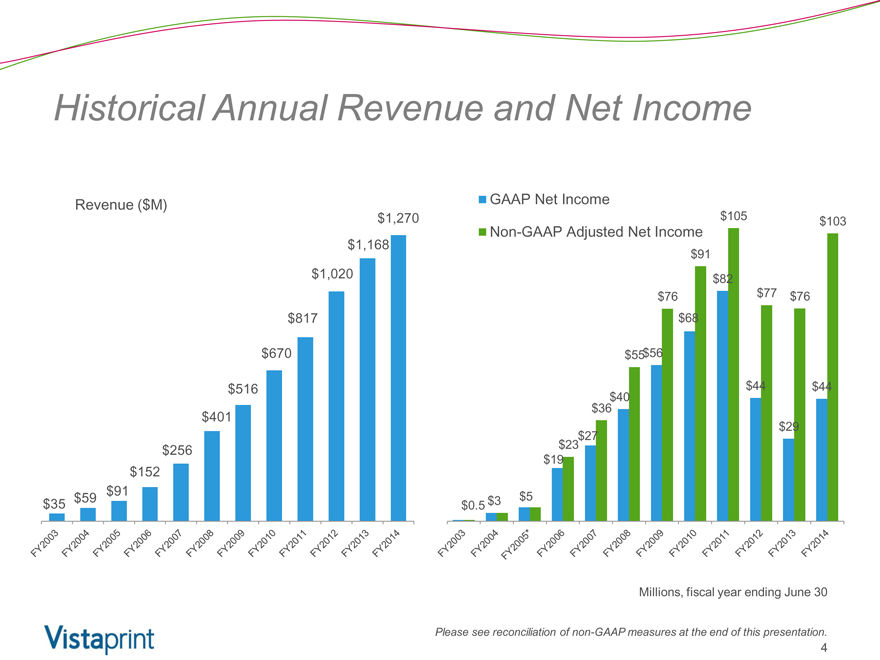
Historical Annual Revenue and Net Income
Revenue ($M) $1,270 $1,168
$1,020
$817 $670 $516 $401
$256 $152 $91 $59 $35
GAAP Net Income $105 $103
Non-GAAP Adjusted Net Income $91 $82
$76 $77 $76 $68
$55$56
$40 $44 $44 $36 $29 $27 $23 $19
$3 $5
$0.5
Millions, fiscal year ending June 30
Please see reconciliation of non-GAAP measures at the end of this presentation.
4 |
|
|
Vistaprint Brand: North America and Europe
Continued work ork to move ove value alue proposition away way from a deep-discount, price-focus toward needs of customers with higher expectations
Digital marketing products value proposition improvements
Advertising as a percent of revenue below 20% this quarter
Improved revenue growth rates versus Q3 in US, UK and Germany
5 |
|
|
Asia Pacific
New pricing/marketing changes launched in Australia and Japan in Q4
Australia changes less impactful than U.S. and Germany changes in Q3
Japan JV: beginning a longer-term effort to materially improve Japanese customer value proposition
India continues strong growth
$12.7M charge for disposal of minority equity investment in China but remain committed to the market longer-term
6 |
|
|
Recent Acquisitions
People & Print Group and Pixartprinting outperformed our revenue and profit expectations for the quarter
Subsequent to the quarter we made a small acquisition that will become part of our Albumprinter brands: FotoKnudsen
7 |
|
|
Manufacturing & Technology
Continued benefits from our multi-year investments
Beginning to shift some People & Print Group manufacturing to our Venlo facility to further improve costs (6-9 month process)
Pixartprinting facility in Italy will continue to operate, yet also expect synergies
8 |
|
|
Q4 & FY 2014
Financial and Operating Metrics
9
|
Consolidated
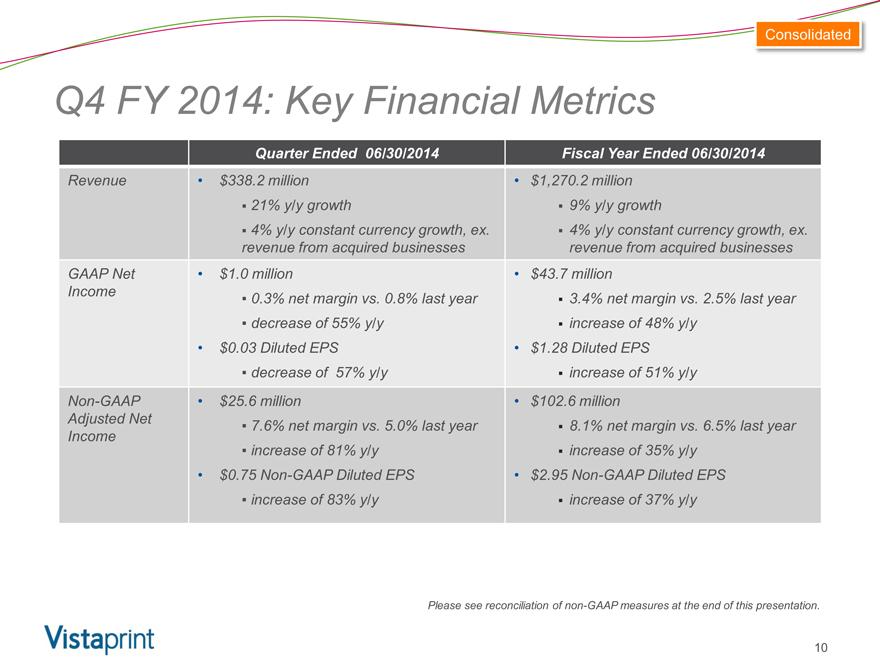
Q4 FY 2014: Key Financial Metrics
Revenue
GAAP Net
Income
Non-GAAP
Adjusted Net
Income
Quarter Ended 06/30/2014
$ 338.2 million
21% y/y growth
4% y/y constant currency growth, ex. revenue from acquired businesses
$ 1.0 million
0.3% net margin vs. 0.8% last year decrease of 55% y/y
$ 0.03 Diluted EPS decrease of 57% y/y
$ 25.6 million
7.6% net margin vs. 5.0% last year increase of 81% y/y
$ 0.75 Non-GAAP Diluted EPS
increase of 83% y/y
Fiscal Year Ended 06/30/2014
$ 1,270.2 million
9% y/y growth
4% y/y constant currency growth, ex. revenue from acquired businesses
$ 43.7 million
3.4% net margin vs. 2.5% last year
increase of 48% y/y
$ 1.28 Diluted EPS
increase of 51% y/y
$ 102.6 million
8.1% net margin vs. 6.5% last year
increase of 35% y/y
$ 2.95 Non-GAAP Diluted EPS increase of 37% y/y
Please see reconciliation of non-GAAP measures at the end of this presentation.
10
|
Consolidated
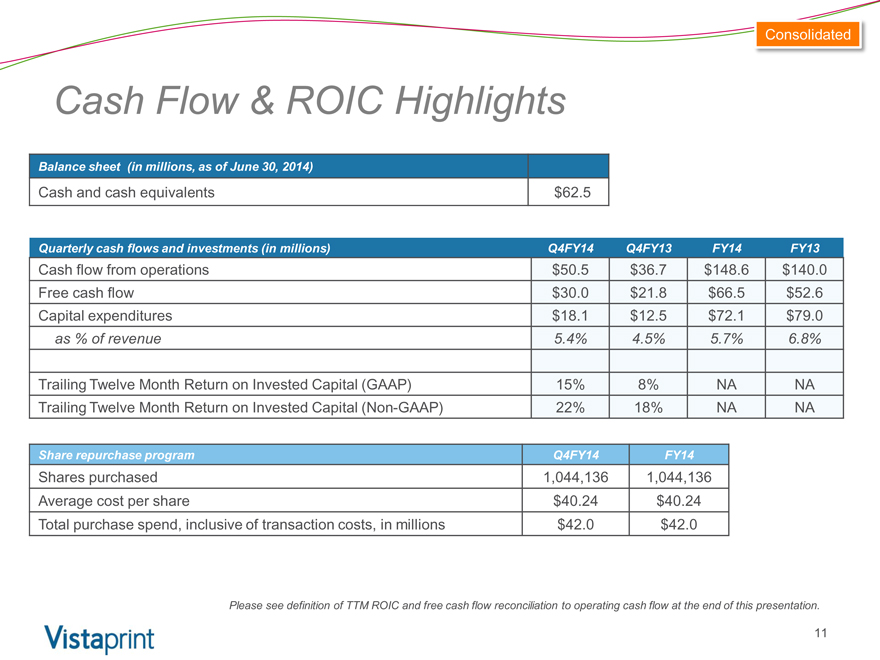
Cash Flow & ROIC Highlights
Balance sheet (in millions, as of June 30, 2014)
Cash and cash equivalents $62.5
Quarterly cash flows and investments (in millions) Q4FY14 Q4FY13 FY14 FY13
Cash flow from operations $50.5 $36.7 $148.6 $140.0
Free cash flow $30.0 $21.8 $66.5 $52.6
Capital expenditures $18.1 $12.5 $72.1 $79.0
as % of revenue 5.4% 4.5% 5.7% 6.8%
Trailing Twelve Month Return on Invested Capital (GAAP) 15% 8% NA NA
Trailing Twelve Month Return on Invested Capital (Non-GAAP) 22% 18% NA NA
Share repurchase program Q4FY14 FY14
Shares purchased 1,044,136 1,044,136
Average cost per share $40.24 $40.24
Total purchase spend, inclusive of transaction costs, in millions $42.0 $42.0
Please see definition of TTM ROIC and free cash flow reconciliation to operating cash flow at the end of this presentation.
11
|
Consolidated
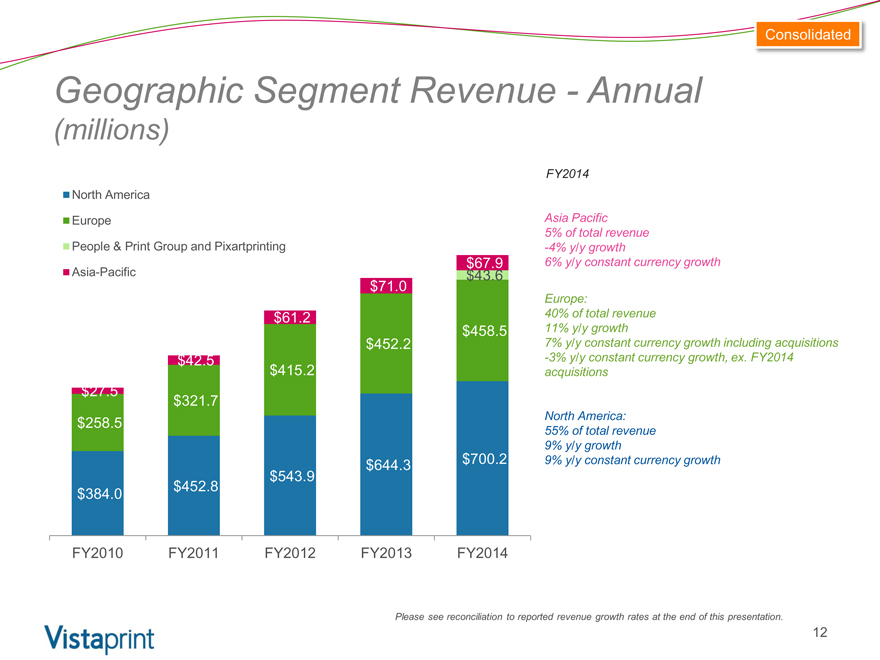
Geographic Segment Revenue—Annual
(millions)
FY2014
Asia Pacific
5% of total revenue
-4% y/y growth
6% y/y constant currency growth
Europe:
40% of total revenue
11% y/y growth
7% y/y constant currency growth including acquisitions
-3% y/y constant currency growth, ex. FY2014
acquisitions
North America:
55% of total revenue
9% y/y growth
9% y/y constant currency growth
North America
Europe
People & Print Group and Pixartprinting
$67.9
Asia-Pacific $43.6
$71.0
$61.2 $458.5
$452.2
$42.5
$415.2
$27.5
$321.7
$258.5
$644.3 $700.2
$543.9
$452.8
$384.0
FY2010 FY2011 FY2012 FY2013 FY2014
Please see reconciliation to reported revenue growth rates at the end of this presentation.
12
|
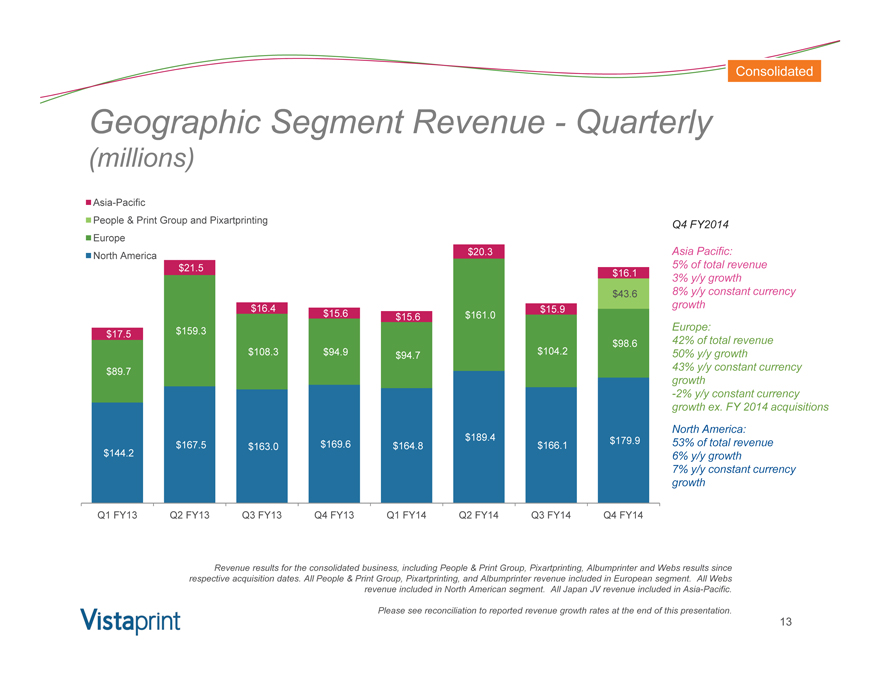
Consolidated
Geographic Segment Revenue—Quarterly
(millions)
Revenue results for the consolidated business, including People & Print Group, Pixartprinting, Albumprinter and Webs results since respective acquisition dates. All People & Print Group, Pixartprinting, and Albumprinter revenue included in European segment. All Webs revenue included in North American segment. All Japan JV revenue included in Asia-Pacific.
Please see reconciliation to reported revenue growth rates at the end of this presentation.
13
Asia-Pacific
People & Print Group and Pixartprinting
Europe
North America $20.3
$21.5
$16.1
$43.6
$16.4 $15.9
$15.6 $15.6 $161.0
$17.5 $159.3
$98.6
$108.3 $94.9 $94.7 $104.2
$89.7
$189.4 $179.9
$144.2 $167.5 $163.0 $169.6 $164.8 $166.1
Q1 FY13 Q2 FY13 Q3 FY13 Q4 FY13 Q1 FY14 Q2 FY14 Q3 FY14 Q4 FY14
Q4 FY2014
Asia Pacific: 5% of total revenue 3% y/y growth 8% y/y constant currency growth Europe: 42% of total revenue 50% y/y growth 43% y/y constant currency growth -2% y/y constant currency growth ex. FY 2014 acquisitions North America: 53% of total revenue 6% y/y growth 7% y/y constant currency growth
Excludes FY14
|
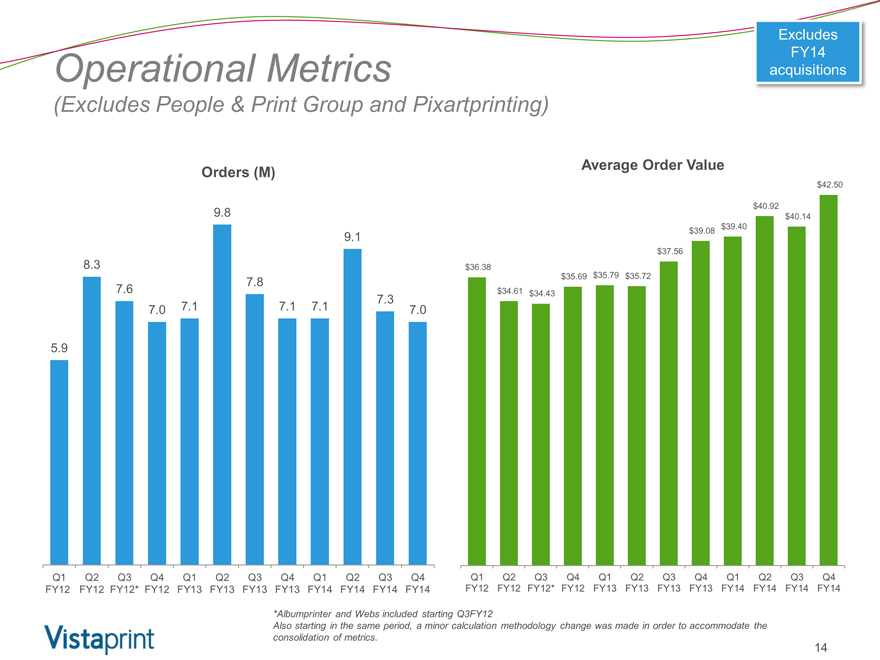
Operational Metrics
(Excludes People & Print Group and Pixartprinting)
Average Order Value Orders (M)
9.8
9.1
8.3
78 .
7.6
7.3
7.0 7.1 7.1 7.1 7.0
5.9
Q1 Q2 Q3 Q4 Q1 Q2 Q3 Q4 Q1 Q2 Q3 Q4 FY12 FY12 FY12* FY12 FY13 FY13 FY13 FY13 FY14 FY14 FY14 FY14
$42.50
$40.92
$40.14
$39.40
$39.08
$37.56
$36.38 $35.79
$35.69 $35.72
$34.61 $34.43
Q1 Q2 Q3 Q4 Q1 Q2 Q3 Q4 Q1 Q2 Q3 Q4 FY12 FY12 FY12* FY12 FY13 FY13 FY13 FY13 FY14 FY14 FY14 FY14
*Albumprinter and Webs included starting Q3FY12
Also starting in the same period, a minor calculation methodology change was made in order to accommodate the
consolidation of metrics.
Excludes FY14 acquisitions
14
|
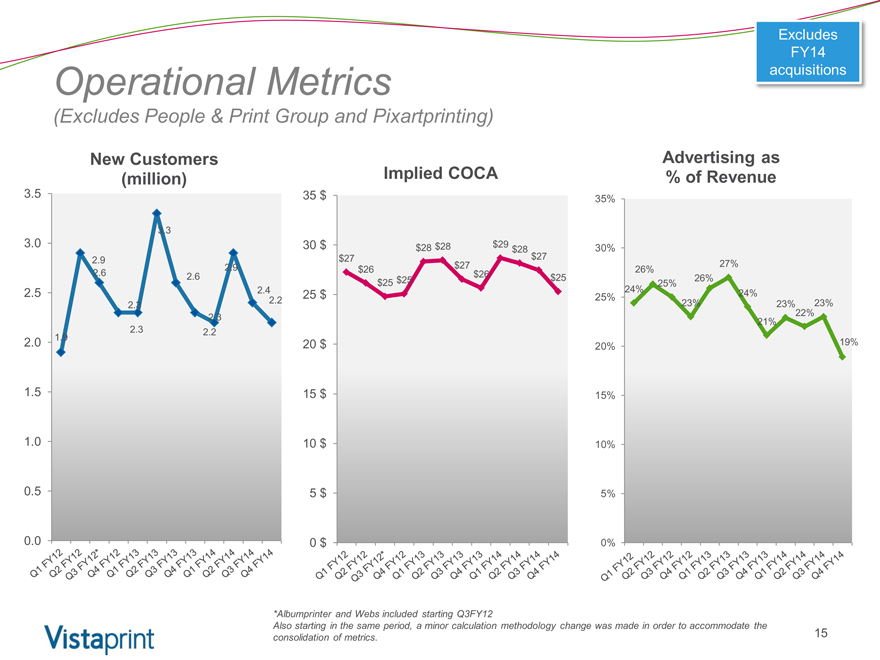
Operational Metrics
(Excludes People & Print Group and Pixartprinting)
New Customers (million)
3.5
3.3
3.0
2.9
2.9
2.6 2.6
2.5 2.4
2.2
2.3
2.3
2.3 2.2
2.0 1.9
1.5
1.0
0.5
0.0
Implied COCA
35 $
30 $ $28 $28 $29 $28
$27 $27 $27 $26
$26 $25
$25 $25
25 $ 20 $ 15 $ 10 $ 5 $ 0 $
Advertising as % of Revenue
35%
30%
27% 26% 26% 25% 24% 24%
25%
23% 23% 23% 21% 22%
20% 19%
15%
10% 5% 0%
*Albumprinter and Webs included starting Q3FY12
Also starting in the same period, a minor calculation methodology change was made in order to accommodate the consolidation of metrics. 15
Excludes FY14 acquisitions
|
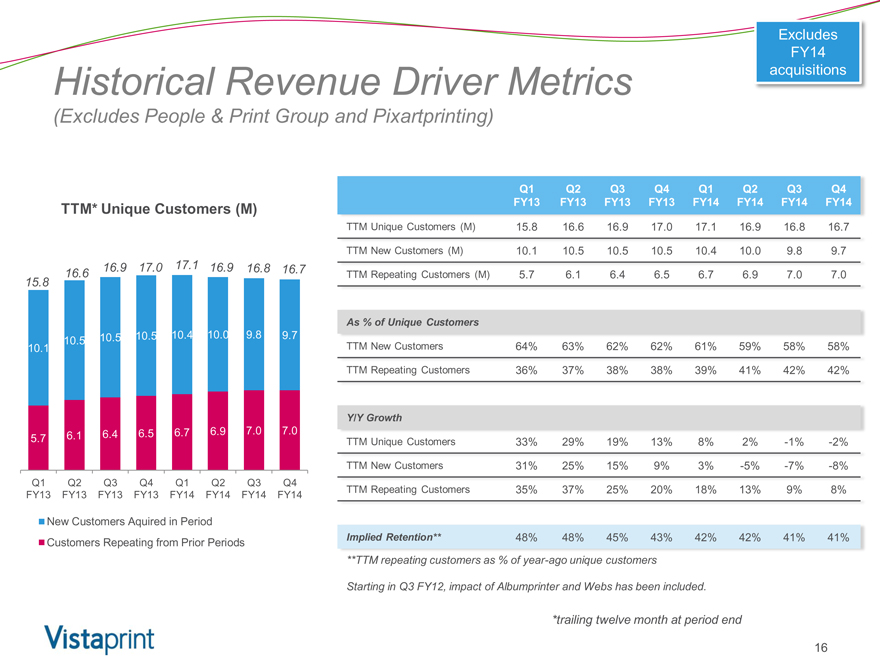
Historical Revenue Driver Metrics
(Excludes People & Print Group and Pixartprinting)
Q1 Q2 Q3 Q4 Q1 Q2 Q3 Q4
FY13 FY13 FY13 FY13 FY14 FY14 FY14 FY14
TTM Unique Customers (M) 15.8 16.6 16.9 17.0 17.1 16.9 16.8 16.7
TTM New Customers (M) 10.1 10.5 10.5 10.5 10.4 10.0 9.8 9.7
TTM Repeating Customers (M) 5.7 6.1 6.4 6.5 6.7 6.9 7.0 7.0
As % of Unique Customers
TTM New Customers 64% 63% 62% 62% 61% 59% 58% 58%
TTM Repeating Customers 36% 37% 38% 38% 39% 41% 42% 42%
Y/Y Growth
TTM Unique Customers 33% 29% 19% 13% 8% 2% -1% -2%
TTM New Customers 31% 25% 15% 9% 3% -5% -7% -8%
TTM Repeating Customers 35% 37% 25% 20% 18% 13% 9% 8%
Implied Retention** 48% 48% 45% 43% 42% 42% 41% 41%
**TTM repeating customers as % of year-ago unique customers
Starting in Q3 FY12, impact of Albumprinter and Webs has been included.
TTM* Unique Customers (M)
16.9 17.0 17.1 16.9 16.8 16.7
16.6
15.8
10.5 10.5 10.4 10.0 9.8 9.7
10.5
10.1
6.1 6.4 6.5 6.7 6.9 7.0 7.0
5.7
Q1 Q2 Q3 Q4 Q1 Q2 Q3 Q4 FY13 FY13 FY13 FY13 FY14 FY14 FY14 FY14
New Customers Aquired in Period Customers Repeating from Prior Periods
*trailing twelve month at period end
Excludes FY14 acquisitions
16
|
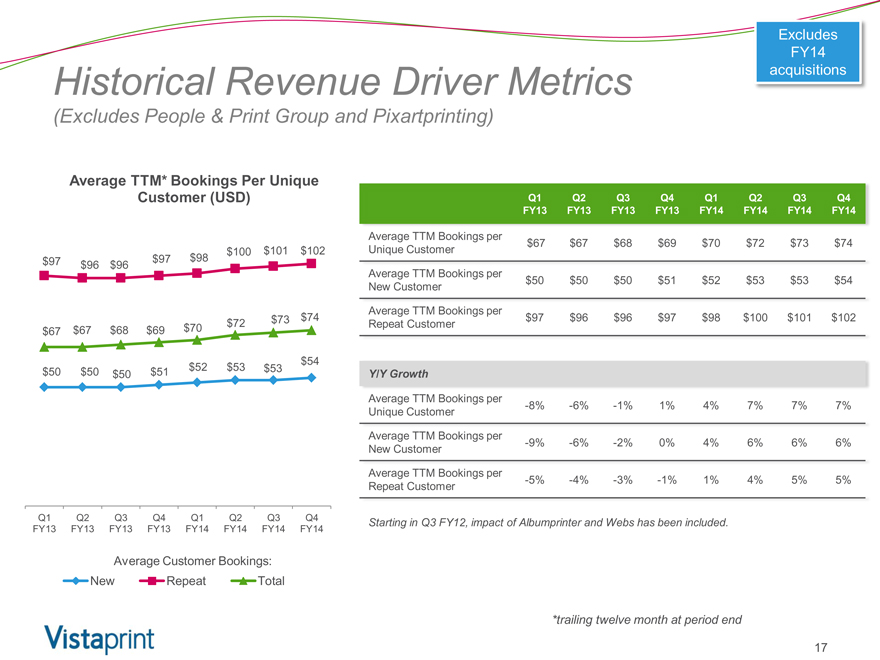
Historical Revenue Driver Metrics
(Excludes People & Print Group and Pixartprinting)
Q1 FY13 Q2 FY13 Q3 FY13 Q4 FY13 Q1 FY14 Q2 FY14 Q3 FY14 Q4 FY14
Average TTM Bookings per
Unique Customer $67 $ 67 $ 68 $ 69 $ 70 $72 $73 $74
Average TTM Bookings per New Customer $50 $ 50 $ 50 $ 51 $ 52 $53 $53 $54
Average TTM Bookings per Repeat Customer $97 $ 96 $ 96 $ 97 $ 98 $100 $101 $102
Y/Y Growth
Average TTM Bookings per Unique Customer -8% -6% -1% 1% 4% 7% 7% 7%
Average TTM Bookings per New Customer -9% -6% -2% 0% 4% 6% 6% 6%
Average TTM Bookings per Repeat Customer -5% -4% -3% -1% 1% 4% 5% 5%
Starting in Q3 FY12, impact of Albumprinter and Webs has been included.
Average TTM* Bookings Per Unique Customer (USD)
$100 $101 $102
$97 $97 $98
$96 $96
$73 $74
$70 $72
$67 $67 $68 $69
$54
$50 $50 $51 $52 $53 $53 $50
Q1 Q2 Q3 Q4 Q1 Q2 Q3 Q4 FY13 FY13 FY13 FY13 FY14 FY14 FY14 FY14
Average Customer Bookings: New Repeat Total
*trailing twelve month at period end
Excludes FY14 acquisitions
17
|

Looking Ahead
18
|
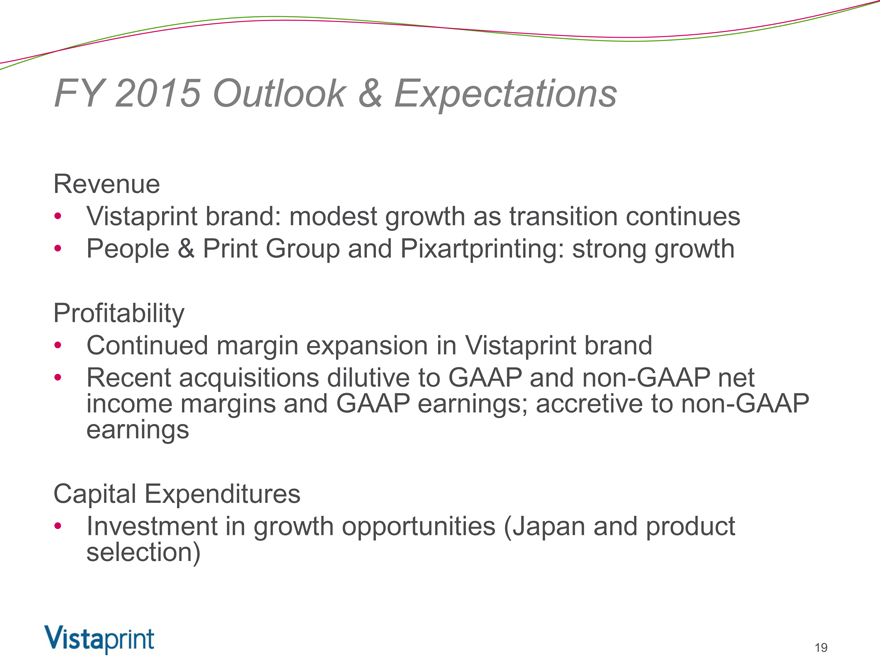
FY 2015 Outlook & Expectations
Revenue
Vistaprint brand: modest growth as transition continues
People & Print Group and Pixartprinting: strong growth
Profitability
Continued margin expansion in Vistaprint brand
Recent acquisitions dilutive to GAAP and non-GAAP net income margins and GAAP earnings; accretive to non-GAAP earnings
Capital Expenditures
Investment in growth opportunities (Japan and product selection)
19
|
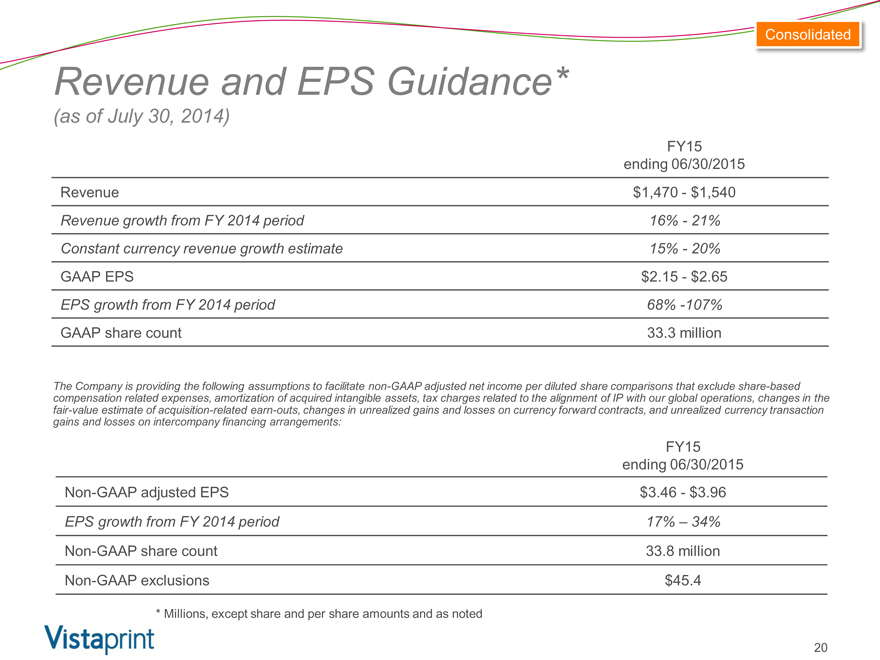
Consolidated
Revenue and EPS Guidance*
(as of July 30, 2014)
FY15
ending 06/30/2015
Revenue $1,470—$1,540
Revenue growth from FY 2014 period 16%—21%
Constant currency revenue growth estimate 15%—20%
GAAP EPS $2.15—$2.65
EPS growth from FY 2014 period 68% -107%
GAAP share count 33.3 million
The Company is providing the following assumptions to facilitate non-GAAP adjusted net income per diluted share comparisons that exclude share-based compensation related expenses, amortization of acquired intangible assets, tax charges related to the alignment of IP with our global operations, changes in the fair-value estimate of acquisition-related earn-outs, changes in unrealized gains and losses on currency forward contracts, and unrealized currency transaction gains and losses on intercompany financing arrangements:
FY15
ending 06/30/2015
Non-GAAP adjusted EPS $3.46—$3.96
EPS growth from FY 2014 period 17% – 34%
Non-GAAP share count 33.8 million
Non-GAAP exclusions $45.4
* |
| Millions, except share and per share amounts and as noted |
20
|
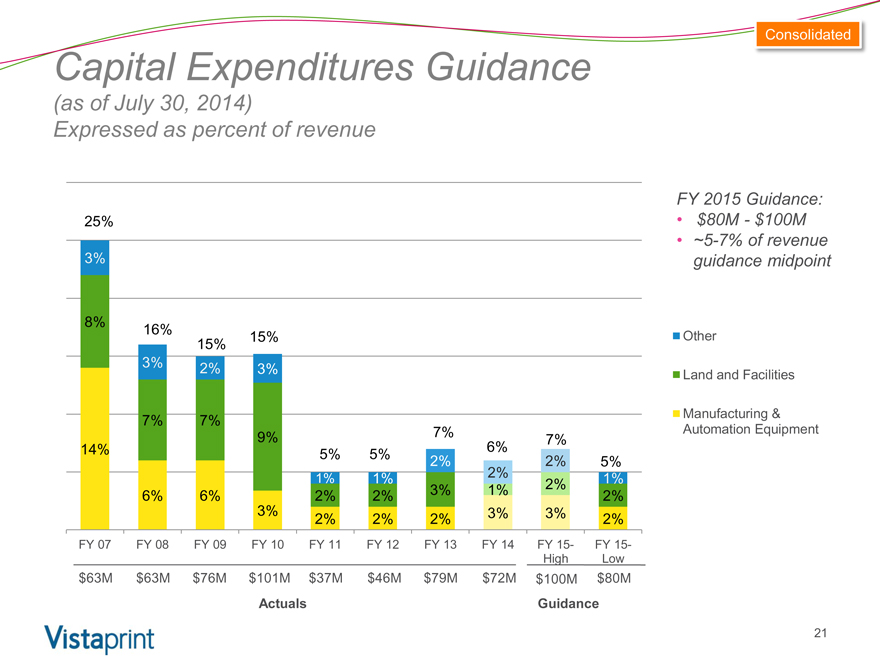
Consolidated
Capital Expenditures Guidance
(as of July 30, 2014)
Expressed as percent of revenue
25%
3%
8%
16%
15% 15%
3% 2% 3%
7% 7%
9% 7%
7% 14% 6%
5% 5%
2% 2% 5%
1% 1% 2% 1%
3% 1% 2%
6% 6% 2% 2% 2%
3% 3% 3%
2% 2% 2% 2%
FY 07 FY 08 FY 09 FY 10 FY 11 FY 12 FY 13 FY 14 FY 15- FY 15-High Low $63M $63M $76M $101M $37M $46M $79M $72M $100M $80M
Actuals Guidance
FY 2015 Guidance:
$80M—$100M
~5-7% of revenue guidance midpoint
Other
Land and Facilities
Manufacturing & Automation Equipment
21
|
Summary
Focused on strategic initiatives and operational implementation o Manufacturing competitive advantage
Patient with our slower revenue growth with Vistaprint brand
Commitment to: o Cash flow return-based investment evaluation o Investing for long term competitive advantage
Investor Day on August 6, 2014
22
|
Q&A Session
Please go to the
Investor Relations section of www.vistaprint.com for the live Q&A call at 5:15 pm EDT on July 29, 2014
|
Q4 & Fiscal Year 2014
Financial and Operating Results Supplement
|
Consolidated
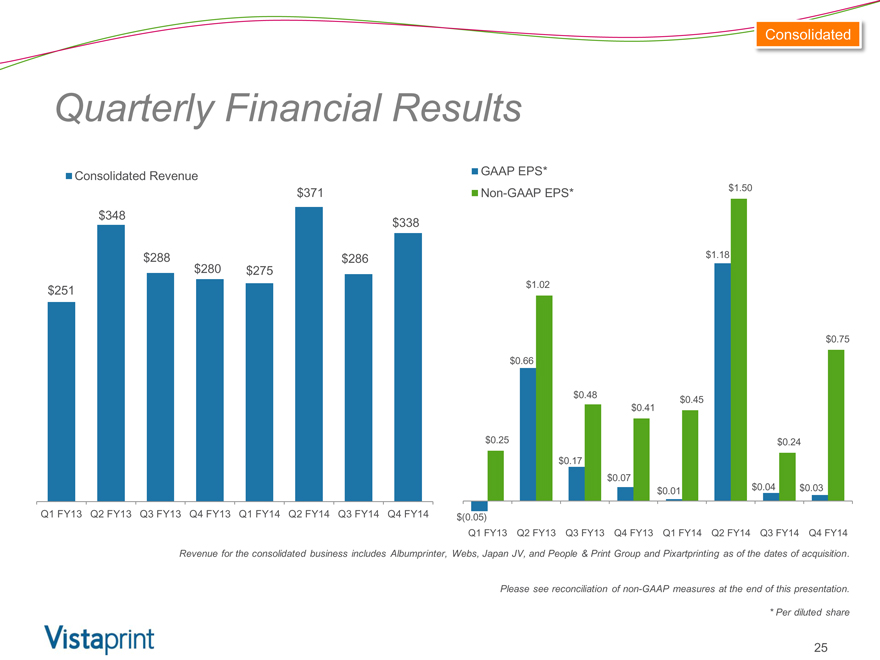
Quarterly Financial Results
GAAP EPS*
Non-GAAP EPS* $1.50
$1.18
$1.02
$0.75
$0.66
$0.48
$0.45
$0.41
$0.25 $0.24
$0.17
$0.07 $0.04
$0.01 $0.03
$(0.05)
Q1 FY13 Q2 FY13 Q3 FY13 Q4 FY13 Q1 FY14 Q2 FY14 Q3 FY14 Q4 FY14
Consolidated Revenue $371 $348 $338
$288 $280 $286 $275 $251
Q1 FY13 Q2 FY13 Q3 FY13 Q4 FY13 Q1 FY14 Q2 FY14 Q3 FY14 Q4 FY14
Revenue for the consolidated business includes Albumprinter, Webs, Japan JV, and People & Print Group and Pixartprinting as of the dates of acquisition.
Please see reconciliation of non-GAAP measures at the end of this presentation.
* |
| Per diluted share |
25
|
Consolidated
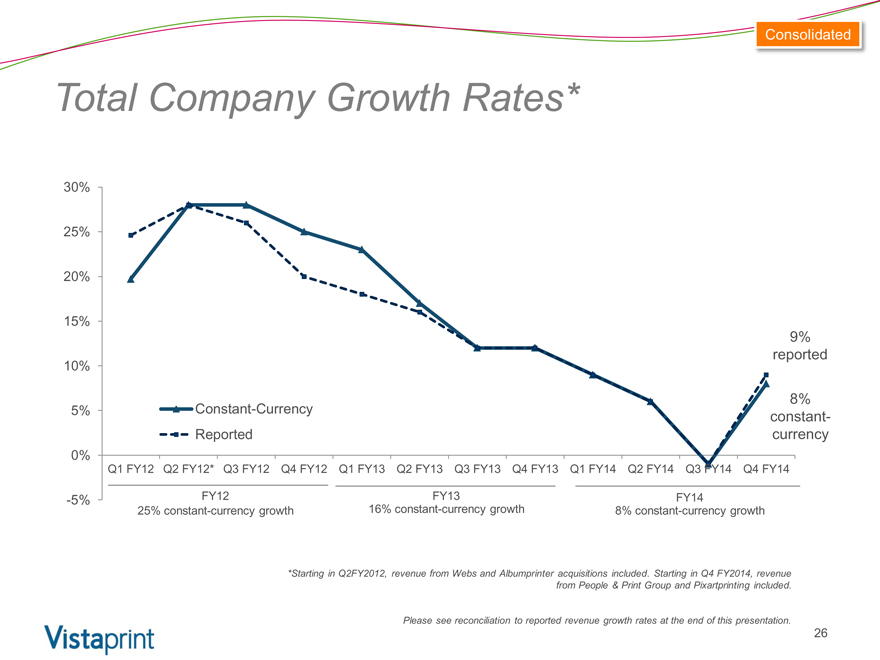
Total Company Growth Rates*
30% 25% 20%
15%
9% reported
10%
8%
5% Constant-Currency constant-
Reported currency
0%
Q1 FY12 Q2 FY12* Q3 FY12 Q4 FY12 Q1 FY13 Q2 FY13 Q3 FY13 Q4 FY13 Q1 FY14 Q2 FY14 Q3 FY14 Q4 FY14
-5% FY12 FY13 FY14
25% constant-currency growth 16% constant-currency growth 8% constant-currency growth
*Starting in Q2FY2012, revenue from Webs and Albumprinter acquisitions included. Starting in Q4 FY2014, revenue
from People & Print Group and Pixartprinting included.
Please see reconciliation to reported revenue growth rates at the end of this presentation.
26
|
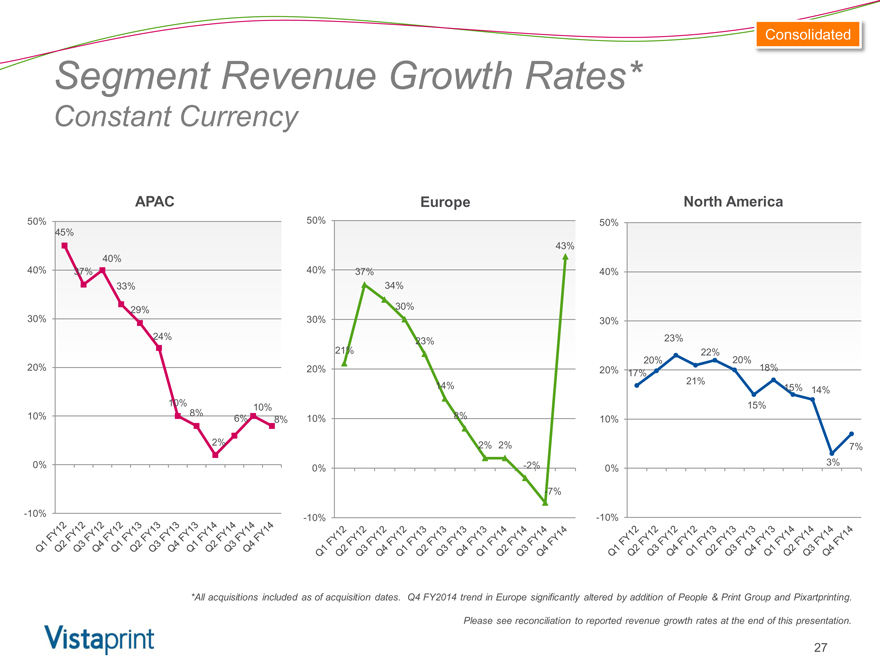
Consolidated
Segment Revenue Growth Rates*
Constant Currency
Europe
50%
43%
40% 37% 34%
30% 30%
21% 23% 20% 14%
10% 8%
2% 2%
0% -2% -7%
-10%
APAC
50% 45%
40% 40% 37% 33%
30% 29% 24%
20%
10% 10% 10% 8%
6% 8% 2% 0%
-10%
North America
50%
40%
30%
23% 22% 20% 20% 20% 18% 17% 21%
15% 14% 15% 10%
7% 3% 0%
-10%
*All acquisitions included as of acquisition dates. Q4 FY2014 trend in Europe significantly altered by addition of People & Print Group and Pixartprinting.
Please see reconciliation to reported revenue growth rates at the end of this presentation.
27
|
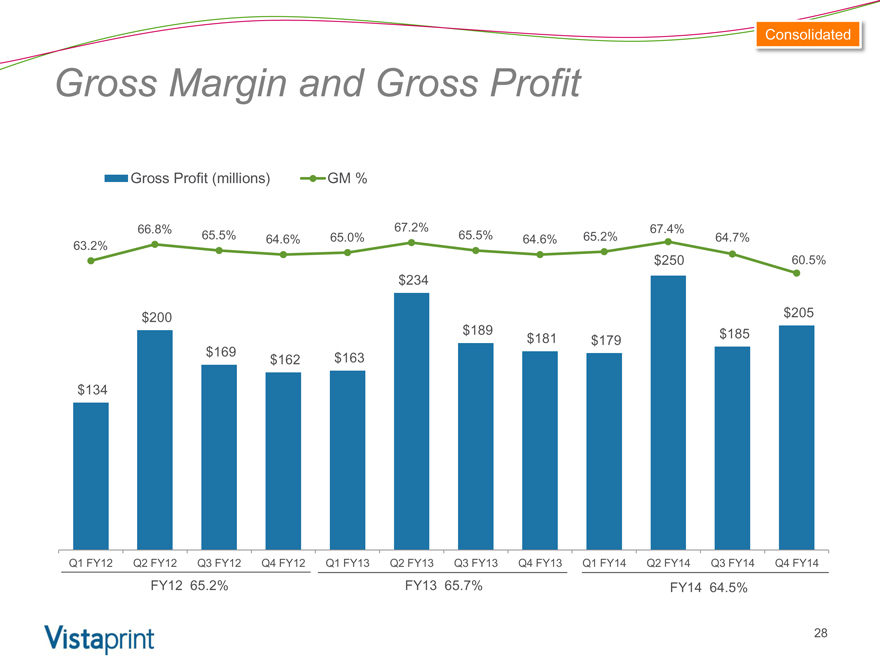
Consolidated
Gross Margin and Gross Profit
Gross Profit (millions) GM %
66.8% 67.2% 67.4%
63.2% 65.5% 64.6% 65.0% 65.5% 64.6% 65.2% 64.7% $250 60.5% $234
$200 $205 $189 $185 $181 $179 $169 $163 $162
$134
Q1 FY12 Q2 FY12 Q3 FY12 Q4 FY12 Q1 FY13 Q2 FY13 Q3 FY13 Q4 FY13 Q1 FY14 Q2 FY14 Q3 FY14 Q4 FY14
FY12 65.2% FY13 65.7% FY14 64.5%
28
|
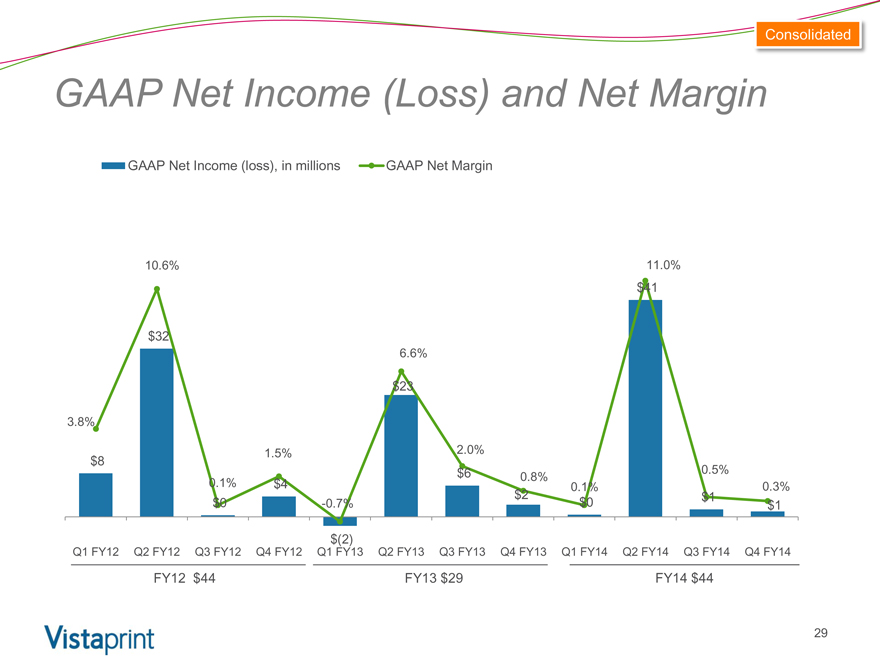
Consolidated
GAAP Net Income (Loss) and Net Margin
GAAP Net Income (loss), in millions GAAP Net Margin
56
51 12.
10.6% 11.0%
46
$41 10.
41
36
$32 8.5%
31 6.6%
6.5%
26 $23
21 4.5%
16 3.8%
1.5% 2.0%
11 $8 2.5%
$6 05% .
0.8%
$6 0.1% $4 $2 0.1% 0.3%
$0 $0 $1 0.5%
-0.7% $1 $1
Q1 FY12 Q2 FY12 Q3 FY12 Q4 FY12 Q1 FY13 Q2 FY13 Q3 FY13 Q4 FY13 Q1 FY14 Q2 FY14 Q3 FY14 Q4 FY14
FY12 $44 FY13 $29 FY14 $44
29
|
Consolidated
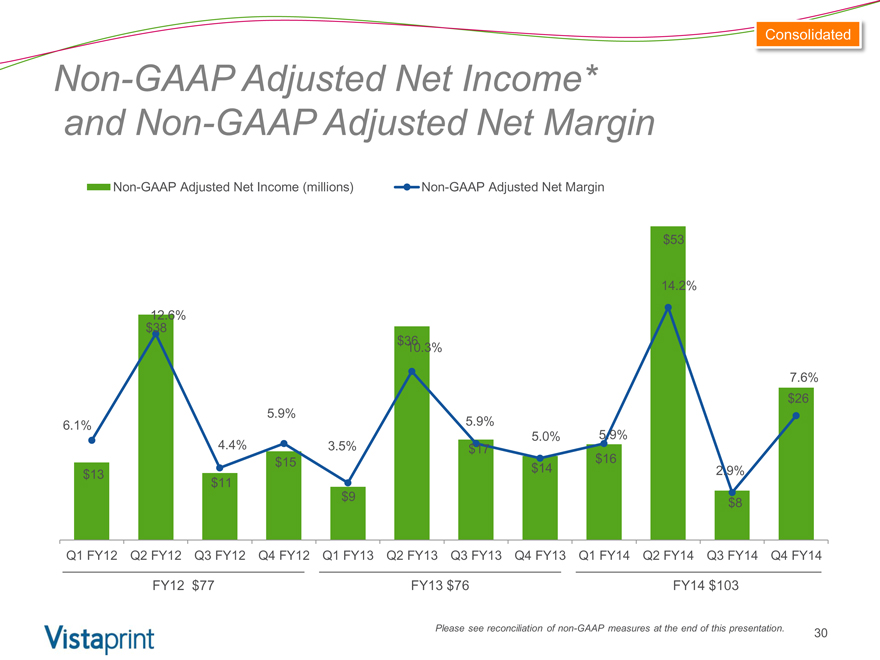
Non-GAAP Adjusted Net Income* and Non-GAAP Adjusted Net Margin
Non-GAAP Adjusted Net Income (millions) Non-GAAP Adjusted Net Margin
$53
14.2%
12.6% $38 $36
10.3%
7.6% $26
5.9%
6.1% 5.9%
5.0% 5.9%
4.4% 3.5% $17
$15 $16
$14 2.9% $13 $11 $9 $8
Q1 FY12 Q2 FY12 Q3 FY12 Q4 FY12 Q1 FY13 Q2 FY13 Q3 FY13 Q4 FY13 Q1 FY14 Q2 FY14 Q3 FY14 Q4 FY14
FY12 $77 FY13 $76 FY14 $103
Please see reconciliation of non-GAAP measures at the end of this presentation.
30
|
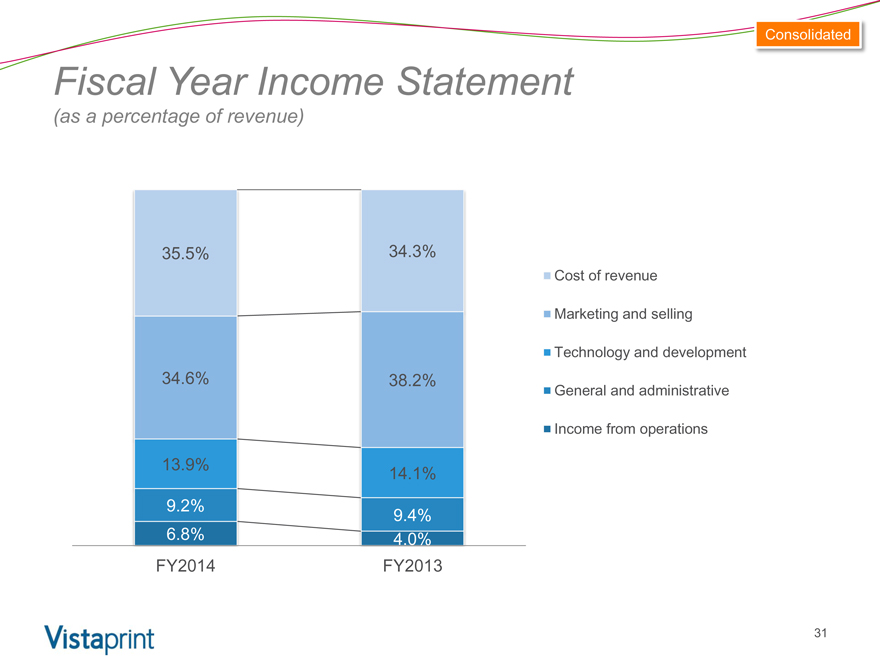
Consolidated
Fiscal Year Income Statement
(as a percentage of revenue)
35.5%
34.6%
13.9%
9.2%
6.8% FY2014
34.3%
38.2%
14.1%
9.4%
4.0% FY2013
Cost of revenue Marketing and selling Technology and development General and administrative Income from operations
31
|
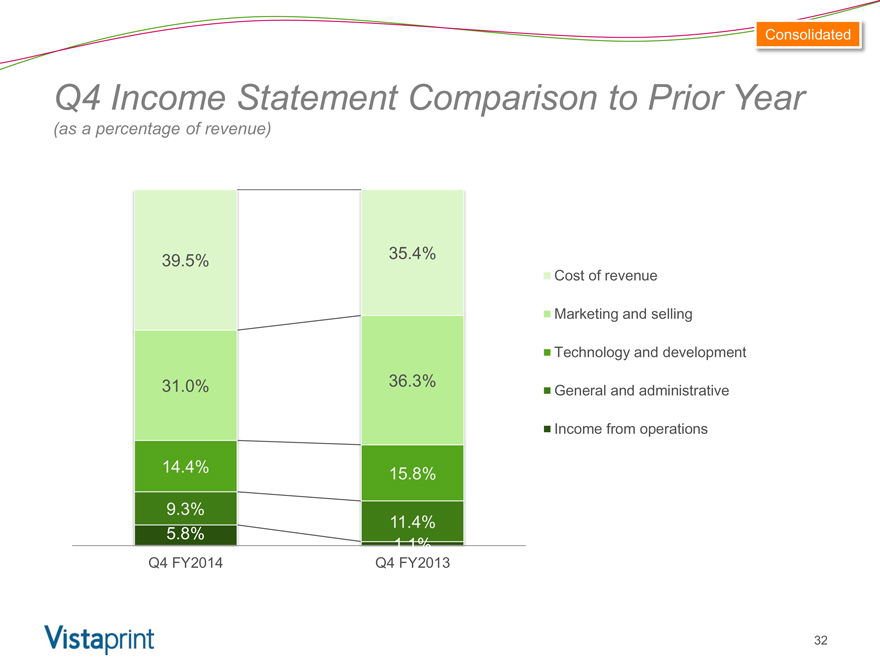
Consolidated
Q4 Income Statement Comparison to Prior Year
(as a percentage of revenue)
39.5%
31.0%
14.4%
9.3%
5.8%
Q4 FY2014
35.4%
36.3%
15.8%
11.4%
1.1%
Q4 FY2013
Cost of revenue Marketing and selling Technology and development General and administrative Income from operations
32
|

Consolidated
Q4 Income Statement Comparison to Prior Quarter
(as a percentage of revenue)
39.5%
31.0%
14.4%
9.3%
5.8% Q4 FY2014
35.3%
38.1%
14.8%
10.0%
1.8% Q3 FY2014
Cost of revenue Marketing and selling Technology and development General and administrative Income from operations
33
|
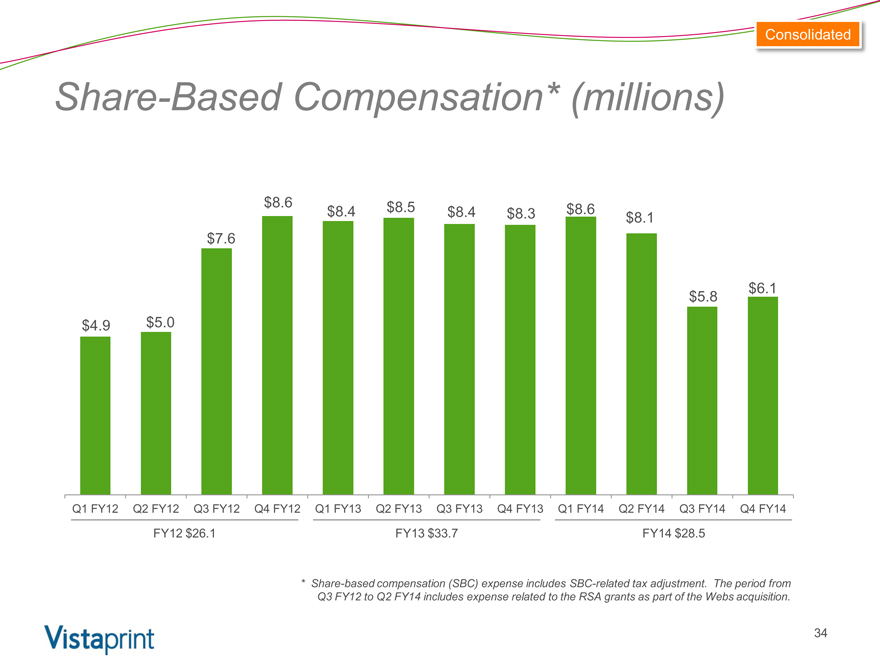
Consolidated
Share Based Compensation* (millions)
$8.6
$8.4
$8.5
$8.4
$8.3
$8.6
$8.1
$7.6
$5.8
$6.1
$4.9
$5.0
Q1 FY12 Q2 FY12 Q3 FY12 Q4 FY12 Q1 FY13 Q2 FY13 Q3 FY13 Q4 FY13 Q1 FY14 Q2 FY14 Q3 FY14 Q4 FY14
FY12 $26.1 FY13 $33.7 FY14 $28.5
* Share-based compensation (SBC) expense includes SBC-related tax adjustment. The period from Q3 FY12 to Q2 FY14 includes expense related to the RSA grants as part of the Webs acquisition.
34
|
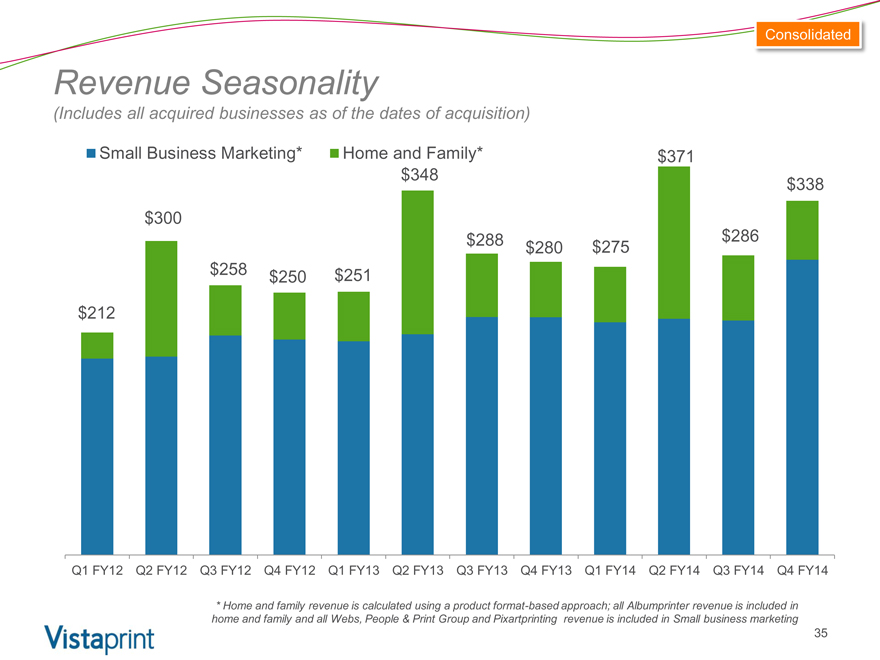
Consolidated
Revenue Seasonality
(Includes all acquired businesses as of the dates of acquisition)
Small Business Marketing* Home and Family* $371 $348 $338 $300 $288 $286 $280 $275 $258 $250 $251 $212
Q1 FY12 Q2 FY12 Q3 FY12 Q4 FY12 Q1 FY13 Q2 FY13 Q3 FY13 Q4 FY13 Q1 FY14 Q2 FY14 Q3 FY14 Q4 FY14
* Home and family revenue is calculated using a product format-based approach; all Albumprinter revenue is included in home and family and all Webs, People & Print Group and Pixartprinting revenue is included in Small business marketing
35
|
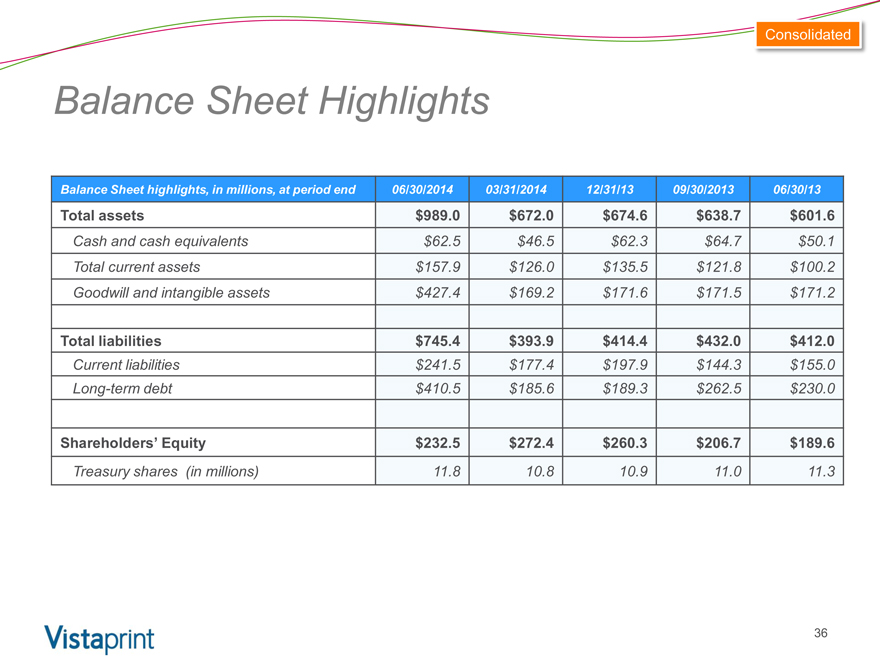
Consolidated
Balance Sheet Highlights
Balance Sheet highlights, in millions, at period end 06/30/2014 03/31/2014 12/31/13 09/30/2013 06/30/13
Total assets $989.0 $672.0 $674.6 $638.7 $601.6
Cash and cash equivalents $62.5 $46.5 $62.3 $64.7 $50.1
Total current assets $157.9 $126.0 $135.5 $121.8 $100.2
Goodwill and intangible assets $427.4 $169.2 $171.6 $171.5 $171.2
Total liabilities $745.4 $393.9 $414.4 $432.0 $412.0
Current liabilities $241.5 $177.4 $197.9 $144.3 $155.0
Long-term debt $410.5 $185.6 $189.3 $262.5 $230.0
Shareholders’ Equity $232.5 $272.4 $260.3 $206.7 $189.6
Treasury shares (in millions) 11.8 10.8 10.9 11.0 11.3
36
|
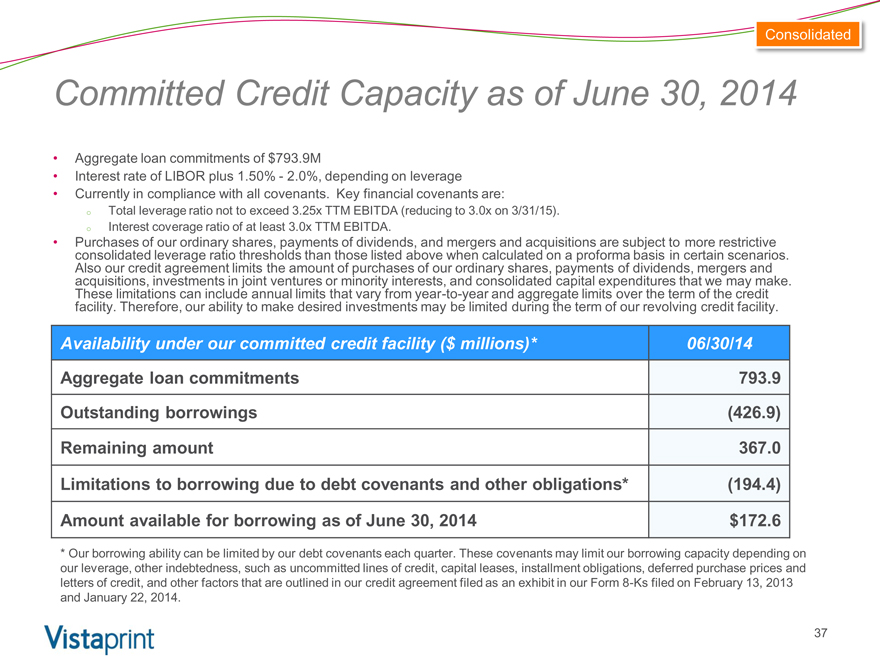
Consolidated
Committed Credit Capacity as of June 30, 2014
Aggregate loan commitments of $793.9M
Interest rate of LIBOR plus 1.50%—2.0%, depending on leverage
Currently in compliance with all covenants. Key financial covenants are: o Total leverage ratio not to exceed 3.25x TTM EBITDA (reducing to 3.0x on 3/31/15). o Interest coverage ratio of at least 3.0x TTM EBITDA.
Purchases of our ordinary shares, payments of dividends, and mergers and acquisitions are subject to more restrictive consolidated leverage ratio thresholds than those listed above when calculated on a proforma basis in certain scenarios. Also our credit agreement limits the amount of purchases of our ordinary shares, payments of dividends, mergers and acquisitions, investments in joint ventures or minority interests, and consolidated capital expenditures that we may make. These limitations can include annual limits that vary from year-to-year and aggregate limits over the term of the credit facility. Therefore, our ability to make desired investments may be limited during the term of our revolving credit facility.
Availability under our committed credit facility ($ millions)* 06/30/14
Aggregate loan commitments .
Outstanding borrowings(426.9)
Remaining amount 367.0
Limitations to borrowing due to debt covenants and other obligations*(194.4)
Amount available for borrowing as of June 30, 2014 $172.6
* Our borrowing ability can be limited by our debt covenants each quarter. These covenants may limit our borrowing capacity depending on our leverage, other indebtedness, such as uncommitted lines of credit, capital leases, installment obligations, deferred purchase prices and letters of credit, and other factors that are outlined in our credit agreement filed as an exhibit in our Form 8-Ks filed on February 13, 2013 and January 22, 2014.
37
|
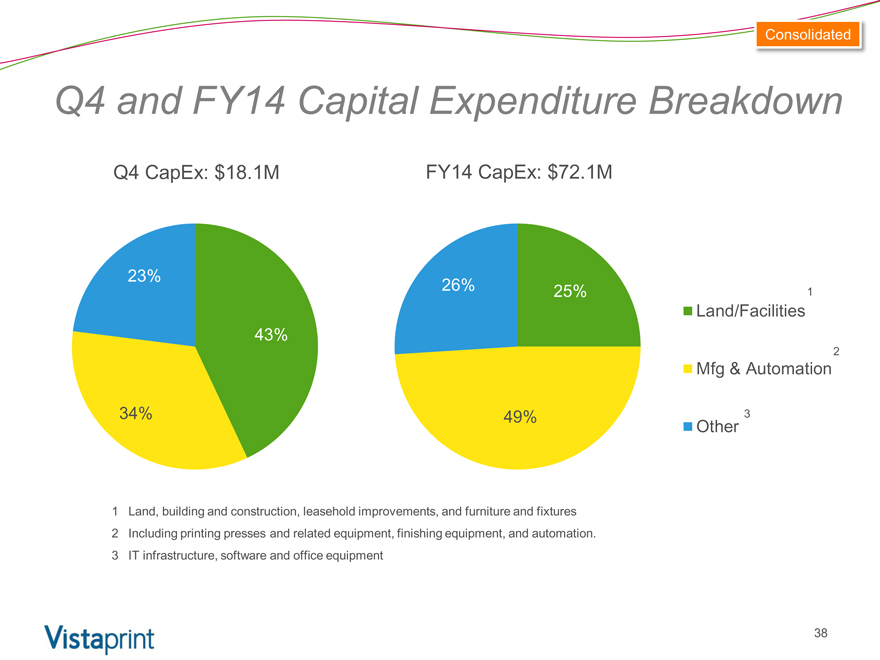
Consolidated
Q4 and FY14 Capital Expenditure Breakdown
Q4 CapEx: $18.1M
23%
43%
34%
FY14 CapEx: $72.1M
26% 25%
49%
Land/Facilities 1
Mfg & Automation 2
Other 3
1 |
| Land, building and construction, leasehold improvements, and furniture and fixtures |
2 |
| Including printing presses and related equipment, finishing equipment, and automation. |
3 |
| IT infrastructure, software and office equipment |
38
|
Appendix
Including a Reconciliation of GAAP to Non-GAAP Financial Measures
|
About non GAAP financial measures
To supplement Vistaprint’s consolidated financial statements presented in accordance with U.S. generally accepted accounting principles, or GAAP, Vistaprint has used the following measures defined as non-GAAP financial measures by Securities and Exchange Commission, or SEC, rules: non-GAAP adjusted net income, non-GAAP adjusted net income per diluted share, free cash flow, trailing twelve month return on invested capital, constant-currency revenue growth and constant-currency revenue growth excluding revenue from fiscal 2014 acquisitions. Please see the next slide for definitions of these items.
The presentation of non-GAAP financial information is not intended to be considered in isolation or as a substitute for the financial information prepared and presented in accordance with GAAP. For more information on these non-GAAP financial measures, please see the tables captioned “Reconciliations of Non-GAAP Financial Measures” included at the end of this release. The tables have more details on the GAAP financial measures that are most directly comparable to non-GAAP financial measures and the related reconciliation between these financial measures.
Vistaprint s management believes that these non-GAAP financial measures provide meaningful supplemental information in assessing our performance and liquidity by excluding certain items that may not be indicative of our recurring core business operating results, which could be non-cash charges or discrete cash charges that are infrequent in nature. These non-GAAP financial measures also have facilitated management’s internal comparisons to Vistaprint’s historical performance and our competitors’ operating results.
40
|
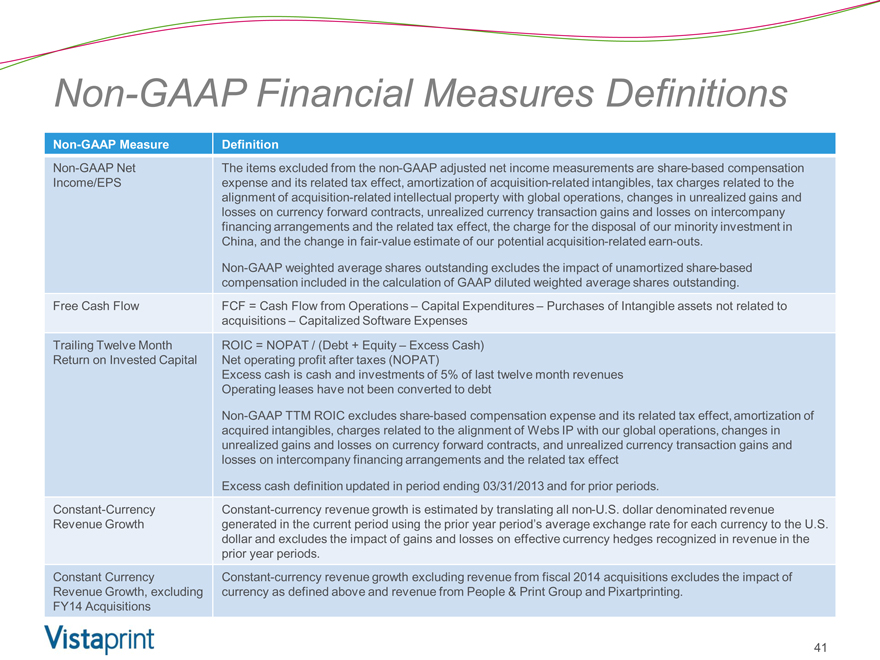
Non GAAP Financial Measures Definitions
Non-GAAP Measure
Non-GAAP Net Income/EPS
Free Cash Flow
Trailing Twelve Month Return on Invested Capital
Constant-Currency Revenue Growth
Constant Currency Revenue Growth, excluding FY14 Acquisitions
Definition The items excluded from the non-GAAP adjusted net income measurements are share-based compensation expense and its related tax effect, amortization of acquisition-related intangibles, tax charges related to the alignment of acquisition-related intellectual property with global operations, changes in unrealized gains and losses on currency forward contracts, unrealized currency transaction gains and losses on intercompany financing arrangements and the related tax effect, the charge for the disposal of our minority investment in China, and the change in fair-value estimate of our potential acquisition-related earn-outs.
Non-GAAP weighted average shares outstanding excludes the impact of unamortized share-based compensation included in the calculation of GAAP diluted weighted average shares outstanding.
FCF = Cash Flow from Operations – Capital Expenditures – Purchases of Intangible assets not related to acquisitions – Capitalized Software Expenses
ROIC = NOPAT / (Debt + Equity – Excess Cash) Net operating profit after taxes (NOPAT) Excess cash is cash and investments of 5% of last twelve month revenues Operating leases have not been converted to debt
Non-GAAP TTM ROIC excludes share-based compensation expense and its related tax effect, amortization of acquired intangibles, charges related to the alignment of Webs IP with our global operations, changes in unrealized gains and losses on currency forward contracts, and unrealized currency transaction gains and losses on intercompany financing arrangements and the related tax effect
Excess cash definition updated in period ending 03/31/2013 and for prior periods. Constant-currency revenue growth is estimated by translating all non-U.S. dollar denominated revenue generated in the current period using the prior year period’s average exchange rate for each currency to the U.S. dollar and excludes the impact of gains and losses on effective currency hedges recognized in revenue in the prior year periods.
Constant-currency revenue growth excluding revenue from fiscal 2014 acquisitions excludes the impact of currency as defined above and revenue from People & Print Group and Pixartprinting.
41
|
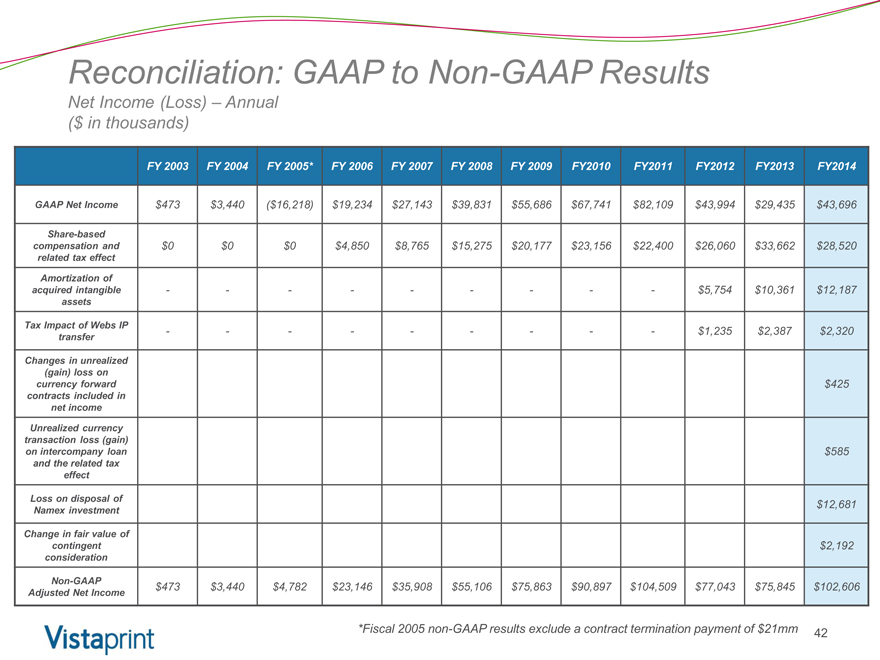
Reconciliation: GAAP to Non-GAAP Results
Net Income (Loss) – Annual
($ in thousands)
FY 2003 FY 2004 FY 2005* FY 2006 FY 2007 FY 2008 FY 2009 FY2010 FY2011 FY2012 FY2013 FY2014
GAAP Net Income $473 $3,440($16,218) $19,234 $27,143 $39,831 $55,686 $67,741 $82,109 $43,994 $29,435 $43,696
Share-based compensation and related tax effect $0 $0 $0 $4,850 $8,765 $15,275 $20,177 $23,156 $22,400 $26,060 $33,662 $28,520
Amortization of acquired intangible assets — — — ——$5,754 $10,361 $12,187
Tax Impact of Webs IP transfer — — — ——$1,235 $2,387 $2,320
Changes in unrealized (gain) loss on currency forward contracts included in net income $425
Unrealized currency transaction loss (gain) on intercompany loan and the related tax effect $585
Loss on disposal of Namex investment $12,681
Change in fair value of contingent consideration $2,192
Non-GAAP Adjusted Net Income $473 $3,440 $4,782 $23,146 $35,908 $55,106 $75,863 $90,897 $104,509 $77,043 $75,845 $102,606
*Fiscal 2005 non-GAAP results exclude a contract termination payment of $21mm
42
|
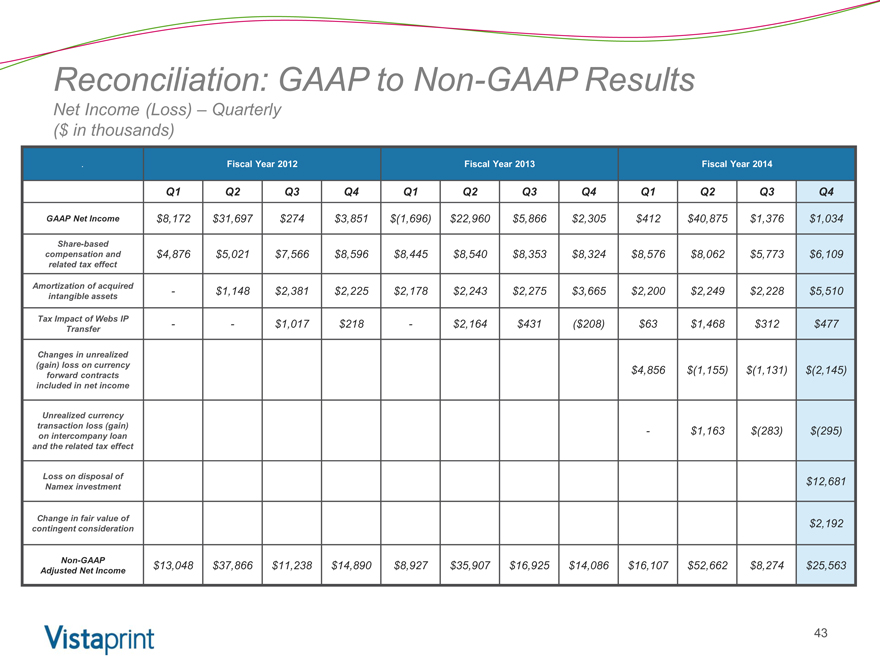
Reconciliation: GAAP to Non-GAAP Results
Net Income (Loss) – Quarterly
($ in thousands)
. Fiscal Year 2012 Fiscal Year 2013 Fiscal Year 2014
Q1 Q2 Q3 Q4 Q1 Q2 Q3 Q4 Q1 Q2 Q3 Q4
GAAP Net Income $8,172 $31,697 $274 $3,851 $(1,696) $22,960 $5,866 $2,305 $412 $40,875 $1,376 $1,034
Share-based compensation and related tax effect $4,876 $5,021 $7,566 $8,596 $8,445 $8,540 $8,353 $8,324 $8,576 $8,062 $5,773 $6,109
Amortization of acquired intangible assets—$1,148 $2,381 $2,225 $2,178 $2,243 $2,275 $3,665 $2,200 $2,249 $2,228 $5,510
Tax Impact of Webs IP Transfer — $1,017 $218—$2,164 $431($208) $63 $1,468 $312 $477
Changes in unrealized (gain) loss on currency forward contracts included in net income $4,856 $(1,155) $(1,131) $(2,145)
Unrealized currency transaction loss (gain) on intercompany loan and the related tax effect—$1,163 $(283) $(295)
Loss on disposal of Namex investment $12,681
Change in fair value of contingent consideration $2,192
Non-GAAP Adjusted Net Income $13,048 $37,866 $11,238 $14,890 $8,927 $35,907 $16,925 $14,086 $16,107 $52,662 $8,274 $25,563
43
|
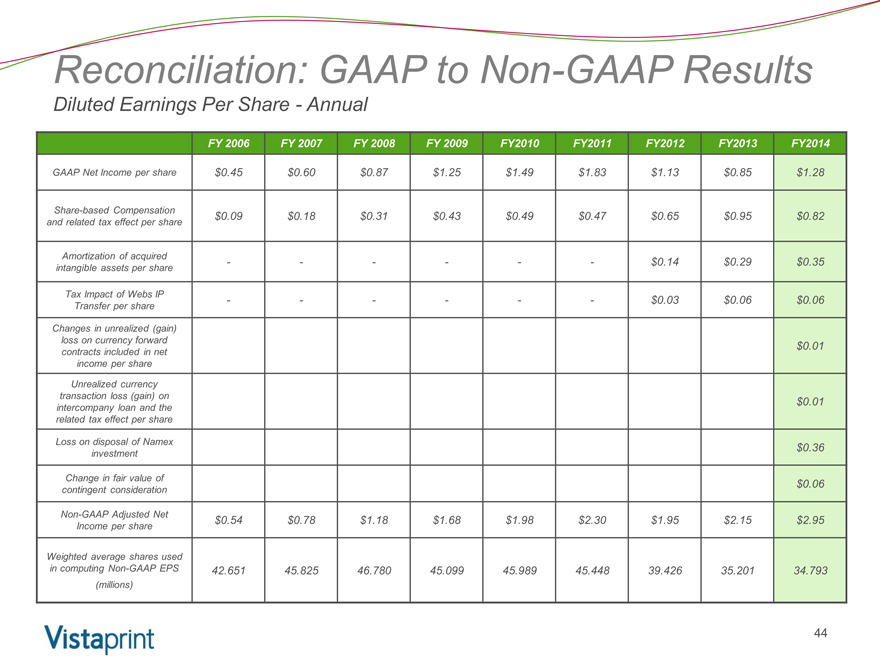
Reconciliation: GAAP to Non-GAAP Results
Diluted Earnings Per Share—Annual
FY 2006 FY 2007 FY 2008 FY 2009 FY2010 FY2011 FY2012 FY2013 FY2014
GAAP Net Income per share $0.45 $0.60 $0.87 $1.25 $1.49 $1.83 $1.13 $0.85 $1.28
Share-based Compensation and related tax effect per share $0.09 $0.18 $0.31 $0.43 $0.49 $0.47 $0.65 $0.95 $0.82
Amortization of acquired intangible assets per share — — — $0.14 $0.29 $0.35
Tax Impact of Webs IP Transfer per share — — — $0.03 $0.06 $0.06
Changes in unrealized (gain) loss on currency forward contracts included in net income per share $0.01
Unrealized currency transaction loss (gain) on intercompany loan and the related tax effect per share $0.01
Loss on disposal of Namex investment $0.36
Change in fair value of contingent consideration $0.06
Non-GAAP Adjusted Net Income per share $0.54 $0.78 $1.18 $1.68 $1.98 $2.30 $1.95 $2.15 $2.95
Weighted average shares used in computing Non-GAAP EPS (millions) 42.651 45.825 46.780 45.099 45.989 45.448 39.426 35.201 34.793
44
|
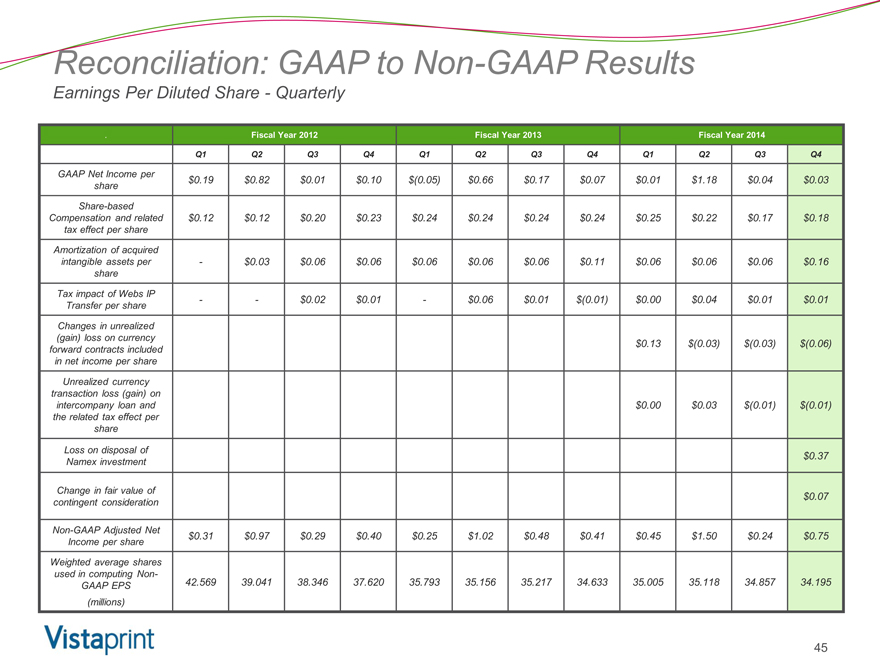
Reconciliation: GAAP to Non-GAAP Results
Earnings Per Diluted Share - Quarterly
. Fiscal Year 2012 Fiscal Year 2013 Fiscal Year 2014
Q1 Q2 Q3 Q4 Q1 Q2 Q3 Q4 Q1 Q2 Q3 Q4
GAAP Net Income per share $0.19 $0.82 $0.01 $0.10 $(0.05) $0.66 $0.17 $0.07 $0.01 $1.18 $0.04 $0.03
Share-based Compensation and related tax effect per share $0.12 $0.12 $0.20 $0.23 $0.24 $0.24 $0.24 $0.24 $0.25 $0.22 $0.17 $0.18
Amortization of acquired intangible assets per share—$0.03 $0.06 $0.06 $0.06 $0.06 $0.06 $0.11 $0.06 $0.06 $0.06 $0.16
Tax impact of Webs IP Transfer per share — $0.02 $0.01—$0.06 $0.01 $(0.01) $0.00 $0.04 $0.01 $0.01
Changes in unrealized (gain) loss on currency forward contracts included in net income per share $0.13 $(0.03) $(0.03) $(0.06)
Unrealized currency transaction loss (gain) on intercompany loan and the related tax effect per share $0.00 $0.03 $(0.01) $(0.01)
Loss on disposal of Namex investment $0.37
Change in fair value of contingent consideration $0.07
Non-GAAP Adjusted Net Income per share $0.31 $0.97 $0.29 $0.40 $0.25 $1.02 $0.48 $0.41 $0.45 $1.50 $0.24 $0.75
Weighted average shares used in computing Non- GAAP EPS (millions) 42.569 39.041 38.346 37.620 35.793 35.156 35.217 34.633 35.005 35.118 34.857 34.195
45
|
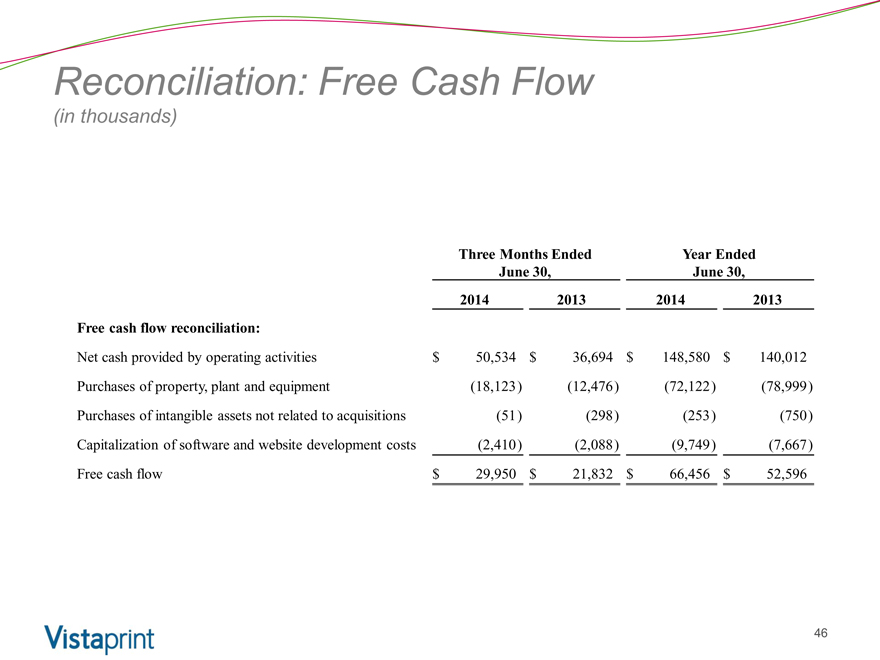
Reconciliation: Free Cash Flow
(in thousands)
Three Months Ended June 30, Year Ended June 30,
2014 2013 2014 2013
Free cash flow reconciliation:
Net cash provided by operating activities $50,534 $36,694 $148,580 $140,012
Purchases of property, plant and equipment(18,123)(12,476)(72,122)(78,999)
Purchases of intangible assets not related to acquisitions(51)(298)(253)(750)
Capitalization of software and website development costs(2,410)(2,088)(9,749)(7,667)
Free cash flow $29,950 $21,832 $66,456 $52,596
46
|
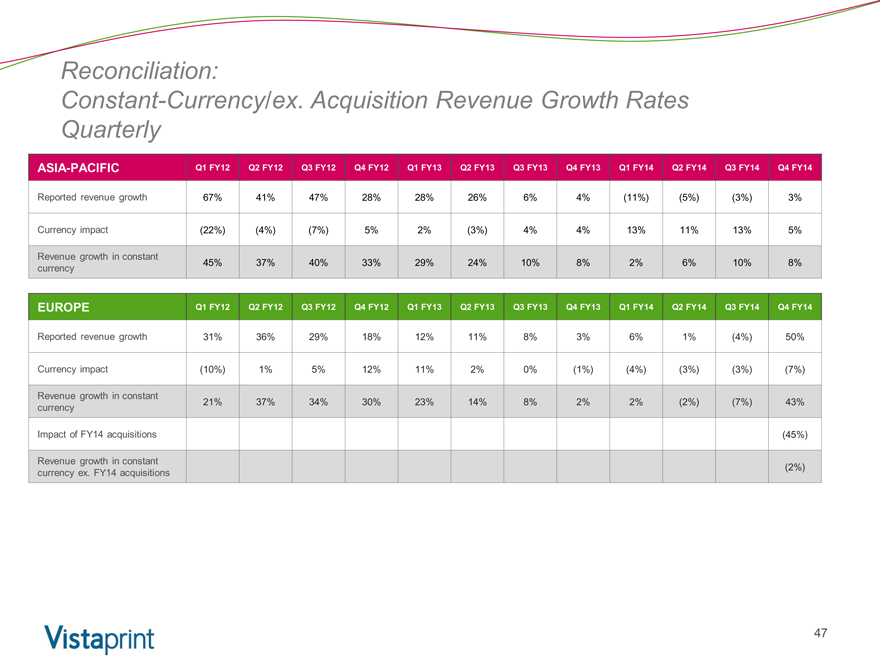
Reconciliation:
Constant-Currency/ex. Acquisition Revenue Growth Rates Quarterly
ASIA-PACIFIC Q1 FY12 Q2 FY12 Q3 FY12 Q4 FY12 Q1 FY13 Q2 FY13 Q3 FY13 Q4 FY13 Q1 FY14 Q2 FY14 Q3 FY14 Q4 FY14
Reported revenue growth 67% 41% 47% 28% 28% 26% 6% 4%(11%)(5%)(3%) 3%
Currency impact(22%)(4%)(7%) 5% 2%(3%) 4% 4% 13% 11% 13% 5%
Revenue growth in constant currency 45% 37% 40% 33% 29% 24% 10% 8% 2% 6% 10% 8%
EUROPE Q1 FY12 Q2 FY12 Q3 FY12 Q4 FY12 Q1 FY13 Q2 FY13 Q3 FY13 Q4 FY13 Q1 FY14 Q2 FY14 Q3 FY14 Q4 FY14
Reported revenue growth 31% 36% 29% 18% 12% 11% 8% 3% 6% 1%(4%) 50%
Currency impact(10%) 1% 5% 12% 11% 2% 0%(1%)(4%)(3%)(3%)(7%)
Revenue growth in constant currency 21% 37% 34% 30% 23% 14% 8% 2% 2%(2%)(7%) 43%
Impact of FY14 acquisitions(45%)
Revenue growth in constant currency ex. FY14 acquisitions(2%)
47
|
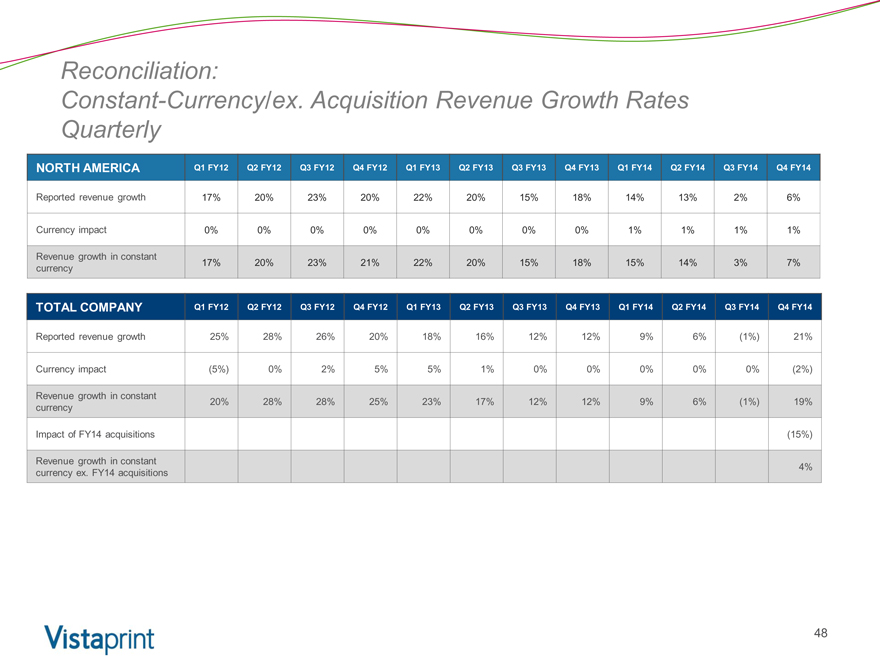
Reconciliation:
Constant-Currency/ex. Acquisition Revenue Growth Rates Quarterly
NORTH AMERICA Q1 FY12 Q2 FY12 Q3 FY12 Q4 FY12 Q1 FY13 Q2 FY13 Q3 FY13 Q4 FY13 Q1 FY14 Q2 FY14 Q3 FY14 Q4 FY14
Reported revenue growth 17% 20% 23% 20% 22% 20% 15% 18% 14% 13% 2% 6%
Currency impact 0% 0% 0% 0% 0% 0% 0% 0% 1% 1% 1% 1%
Revenue growth in constant currency 17% 20% 23% 21% 22% 20% 15% 18% 15% 14% 3% 7%
TOTAL COMPANY Q1 FY12 Q2 FY12 Q3 FY12 Q4 FY12 Q1 FY13 Q2 FY13 Q3 FY13 Q4 FY13 Q1 FY14 Q2 FY14 Q3 FY14 Q4 FY14
Reported revenue growth 25% 28% 26% 20% 18% 16% 12% 12% 9% 6%(1%) 21%
Currency impact(5%) 0% 2% 5% 5% 1% 0% 0% 0% 0% 0%(2%)
Revenue growth in constant currency 20% 28% 28% 25% 23% 17% 12% 12% 9% 6%(1%) 19%
Impact of FY14 acquisitions(15%)
Revenue growth in constant currency ex. FY14 acquisitions 4%
48
|
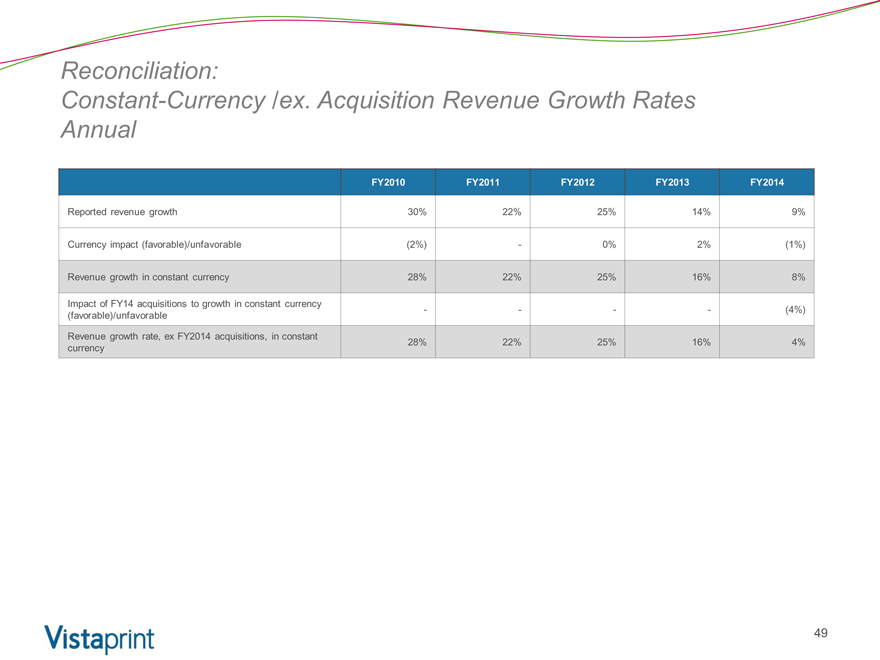
Reconciliation:
Constant-Currency /ex. Acquisition Revenue Growth Rates Annual
FY2010 FY2011 FY2012 FY2013 FY2014
Reported revenue growth 30% 22% 25% 14% 9%
Currency impact (favorable)/unfavorable(2%)—0% 2%(1%)
Revenue growth in constant currency 28% 22% 25% 16% 8%
Impact of FY14 acquisitions to growth in constant currency (favorable)/unfavorable — —(4%)
Revenue growth rate, ex FY2014 acquisitions, in constant currency 28% 22% 25% 16% 4%
49
|
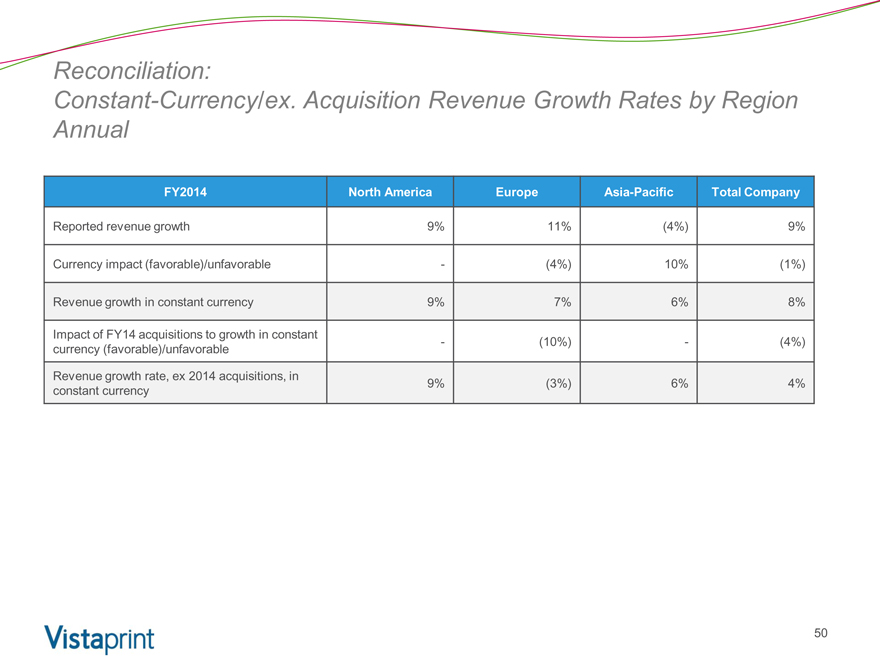
Reconciliation:
Constant-Currency/ex. Acquisition Revenue Growth Rates by Region Annual
FY2014 North America Europe Asia-Pacific Total Company
Reported revenue growth 9% 11%(4%) 9%
Currency impact (favorable)/unfavorable -(4%) 10%(1%)
Revenue growth in constant currency 9% 7% 6% 8%
Impact of FY14 acquisitions to growth in constant currency (favorable)/unfavorable -(10%) -(4%)
Revenue growth rate, ex 2014 acquisitions, in constant currency 9%(3%) 6% 4%
50