 Vistaprint N.V. Investor Day 2014 Webcast will begin at 8:30am ET August 6, 2014 Investor Day 2014 Exhibit 99.1 |
 Welcome Meredith Burns Vice President, Investor Relations Investor Day 2014 |
 Agenda and Presenters 3 |
 Housekeeping Items Restrooms are located outside the room and to the right Please use the rear doors when entering and exiting the room Please silence all mobile devices 4 |
 Safe Harbor Statement 5 Today’s presentations contain statements about our future expectations, plans and prospects of our business that constitute forward-looking statements for purposes of the safe harbor provisions under the Private Securities Litigation Reform Act of 1995, including but not limited to our expectations for the growth, development, and profitability of our business, products, markets, and acquisitions, and our financial outlook and guidance for fiscal year 2015. Forward- looking projections and expectations are inherently uncertain, are based on assumptions and judgments by management, and may turn out to be wrong. Our actual results may differ materially from those indicated by these forward-looking statements as a result of various important factors, including but not limited to flaws in the assumptions and judgments upon which our forecasts are based; our failure to execute our strategy; our inability to make the investments in our business that we plan to make; the failure of our strategy, investments, and efforts to reposition the Vistaprint brand to have the effects that we expect; our failure to promote and strengthen our brands; our failure to acquire new customers and enter new markets, retain our current customers and sell more products to current and new customers; our failure to identify and address the causes of our revenue weakness; our failure to manage the complexity of our business and expand our operations; costs and disruptions caused by acquisitions and strategic investments; the failure of the businesses we acquire or invest in, including People & Print Group and Pixartprinting, to perform as expected; difficulties or higher than anticipated costs in integrating the systems and operations of our acquired businesses into our systems and operations; the willingness of purchasers of marketing services and products to shop online; the failure of our current and new marketing channels to attract customers; our failure to manage growth and changes in our organization; currency fluctuations that affect our revenues and costs including the impact of currency hedging strategies and intercompany transactions; unanticipated changes in our markets, customers, or business; competitive pressures; interruptions in or failures of our websites, network infrastructure or manufacturing operations; our failure to retain key employees; our failure to maintain compliance with the financial covenants in our revolving credit facility or to pay our debts when due; costs and judgments resulting from litigation; changes in the laws and regulations or in the interpretations of laws or regulations to which we are subject, including tax laws, or the institution of new laws or regulations that affect our business; general economic conditions; and other factors described in our Form 10-Q for the fiscal quarter ended March 31, 2014 and the other documents we periodically file with the U.S. Securities and Exchange Commission. |
 Introduction & Overview Robert Keane President and Chief Executive Officer Investor Day 2014 |
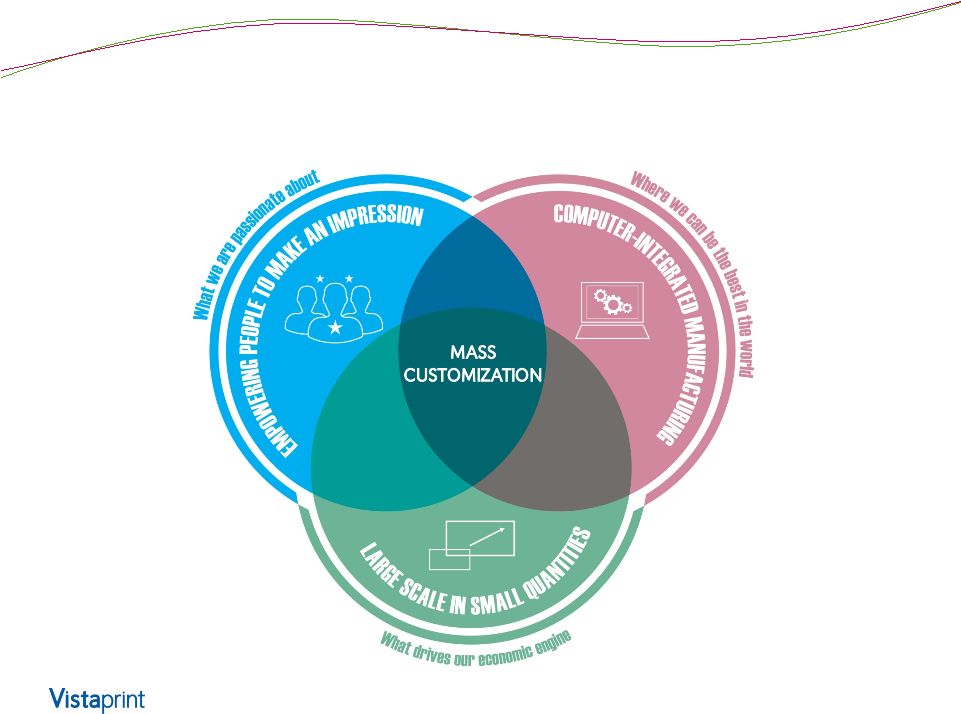
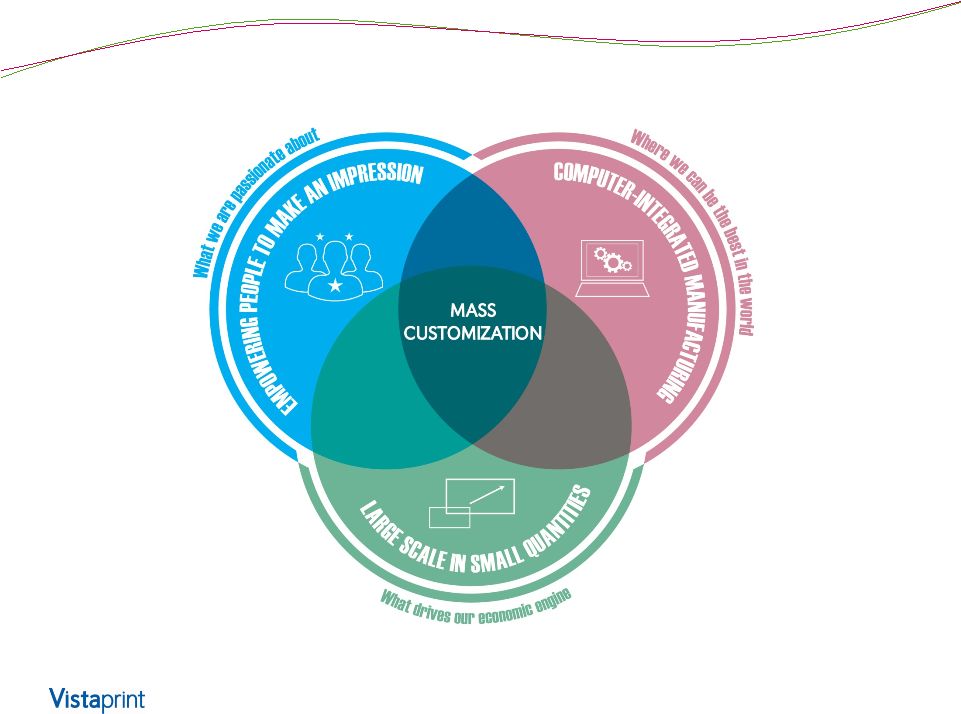
 Our Focus 7 What we are What we are passionate passionate about about Where we can Where we can be the best in be the best in the world the world What drives What drives our economic our economic engine engine |
 What we are passionate about 8 Empowering people to make an impression Empowering people to make an impression |
 Where we can be the best in the world Where we can be the best in the world 9 Computer-Integrated Manufacturing Computer-Integrated Manufacturing |
 Vistaprint Volume Low Volume Markets High Volume Markets What drives our economic engine 10 Large scale in small quantities |
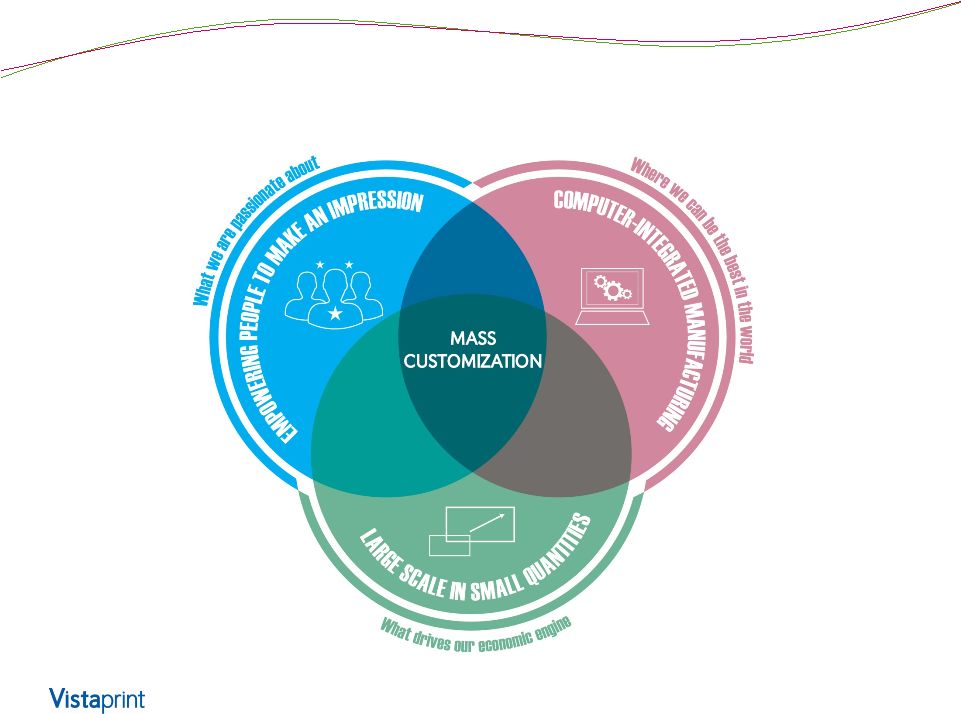 Our Focus: Mass Customization 11 |
 12 Mass customization is about producing, with the reliability, quality and affordability of mass production, small individual orders where each and every one embodies the personal relevance inherent to customized physical products. |
 Focus on Scale Advantage Focus on Scale Advantage 13 |
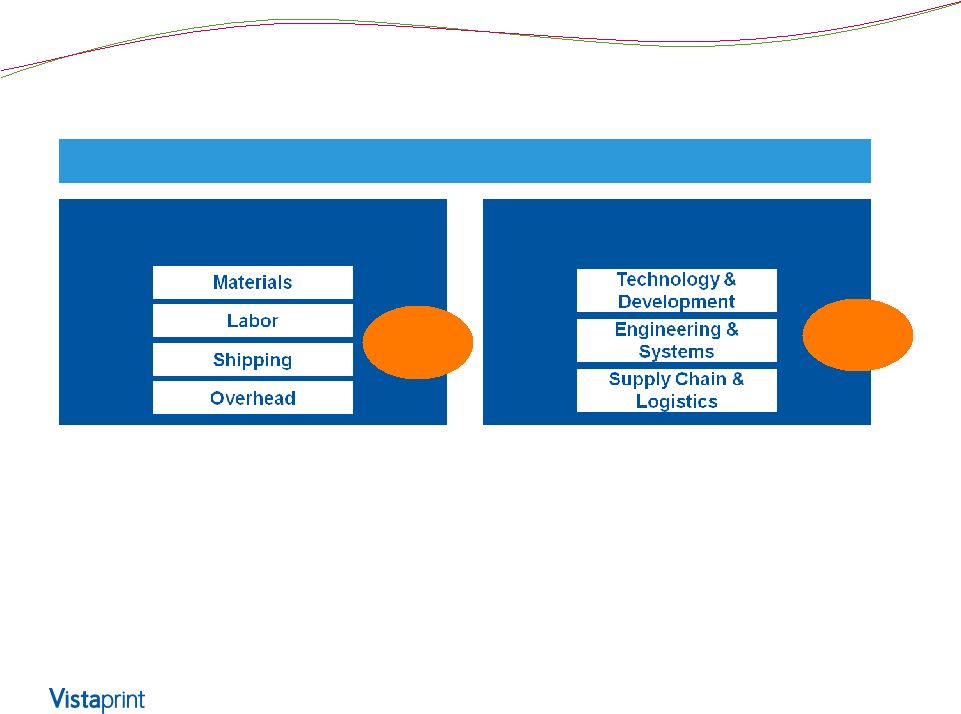
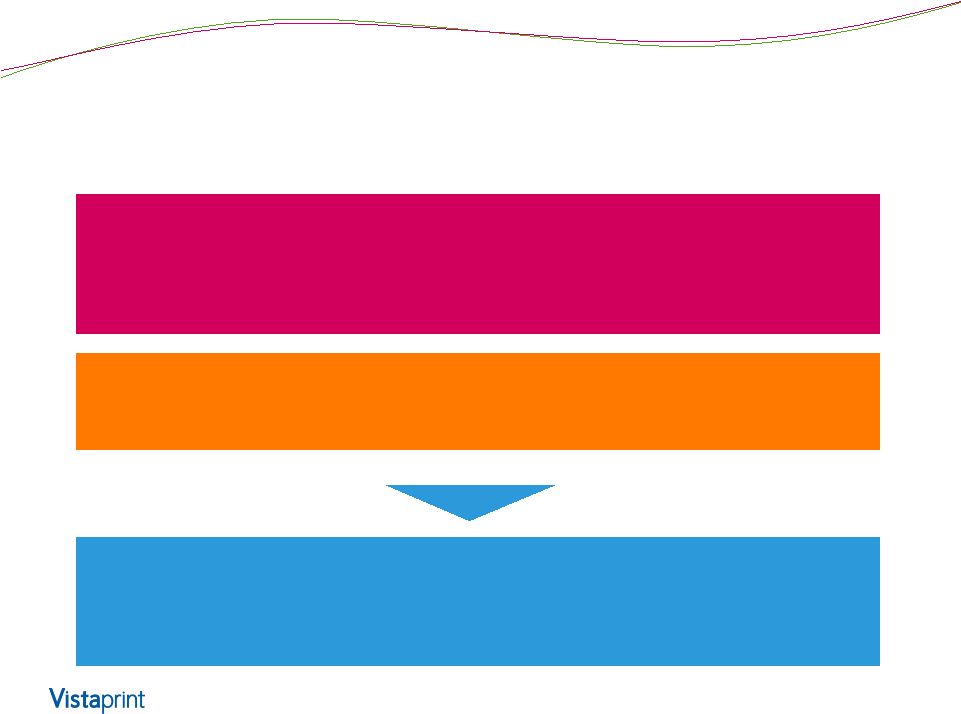
 14 Shared Computer-Integrated Manufacturing Platform New Geographies |
 Driving Financial Returns 15 • Strive to maximize intrinsic value per share (i.e. DCF/share) o Present value of free cash flow per share over the long-term, not for the near-term or for a specific point in time • We seek to achieve this through thoughtful combination of revenue growth, margin expansion, capital expenditures, M&A & share buybacks • As anticipated, FY14 was a turning point year for us in which we balanced investments in future growth and margin expansion appropriately given revenue headwinds • Expect continued margin expansion, EPS and FCF growth in FY15 |
 What You Will Hear Today Steadfast in our move to reposition the Vistaprint brand Even though it continues to create revenue headwinds, we believe it is important to long-term value creation Manufacturing investments are driving significant value with improvements to cost, productivity, quality and product selection Scale drives competitive advantage and we believe thoughtful M&A can drive further advantage for us Anticipate continued improvements in profitability As always, goal of building a transformational, enduring business institution that will drive long-term returns for customers, employees and long-term shareholders 16 |
 Investor Day 2014 |
 Vistaprint Brand Trynka Shineman President, Vistaprint Business Unit Investor Day 2014 |
 Vistaprint Brand Overview 19 Context for our performance and brand evolution FY 2014 investment examples Why we are confident |
 A great deal of opportunity to gain share in the $30B microbusiness market* 20 Price Primary Higher Expectations Locally Focused * All segment views are illustrative only; not a precise view of market sizes |
 Re-centering our target, widening our bulls-eye Price Primary (PP) Micro Businesses Higher Expectations (HE) Micro Businesses Locally Focused Micro Businesses 21 |
 HEs tend to market themselves more, but many of the qualities of PP and HE are similar Demographics of Business Products Purchased Purchase Frequency/ Channel PP-centric Common HE-centric More Part-time Businesses A sub-segment only buys business cards 1-3 per year Online Common in business tenure, industry and business size Both purchase a variety of business cards and marketing products More Full-time businesses Additionally tend to purchase a more complex marketing products 4+ per year Online and Offline 22 |
 We’ve expanded our focus from PP to also include HE; significant commonalities Customer Comms PP-centric Common HE-centric • Promotions/ Deals • Low quantities • Basic products • Relevant marketing • Basic customer support • e-commerce standard site experience • Design Help • Great value • Category credibility • Delivered quality • Reputable provider • Value-Added Services • Broader assortment within categories • Faster shipping • Low entry prices • Lower shipping prices • Pricing consistency • Lower prices on higher quantities End-to-End Experience (Site and Service) Product offering Pricing 23 |
 24 Brand evolution video |
 Vistaprint Brand Overview 25 Context for our performance and brand evolution FY 2014 investment examples Why we are confident |
 Improving every aspect of our customer experience 26 Customer Communications End-to-End Experience (Site and Service) Product offering Pricing |
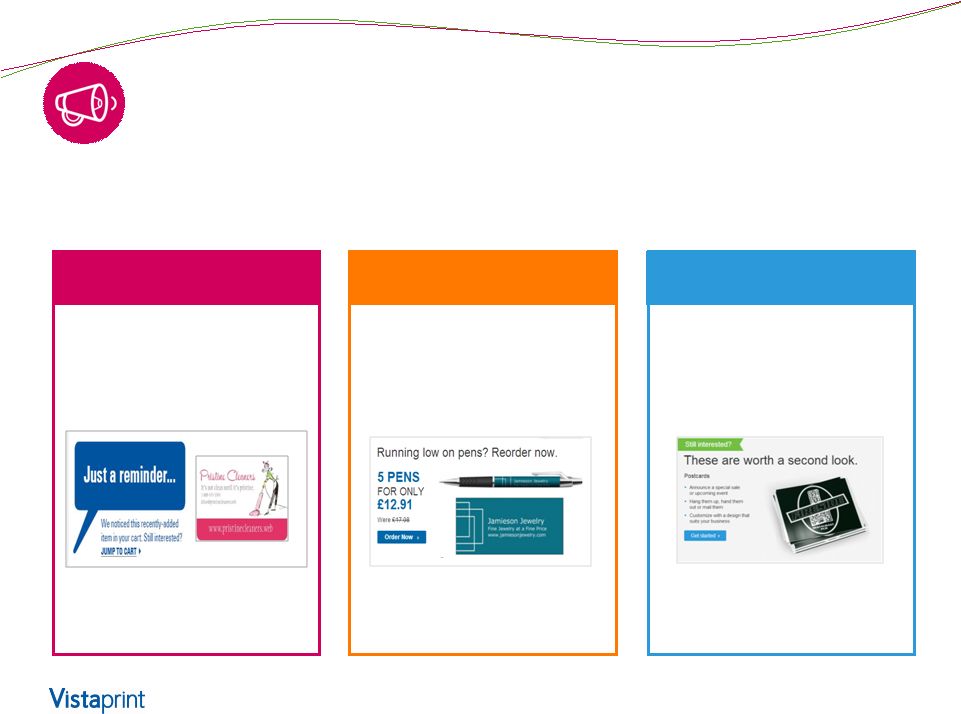 Communications Evolution: Personalized Content Showing relevant products in our mass email communications proves significant increases in $/customer and purchase rate Lifts $/customer: 5% Purchase Rate: 4% Dynamically rendering the products and designs in a customers cart with a goal to close the sale Dynamically rendering a purchased product to drive a replenishment order and upselling additional product options Promoting a product that a customer has recently browsed while showcasing content that matches a previous designed product Lifts $/customer: 11% Purchase Rate: 10% Lifts $/customer: 9% Purchase Rate: 6% Product in Cart Replenishment Browsed 27 |
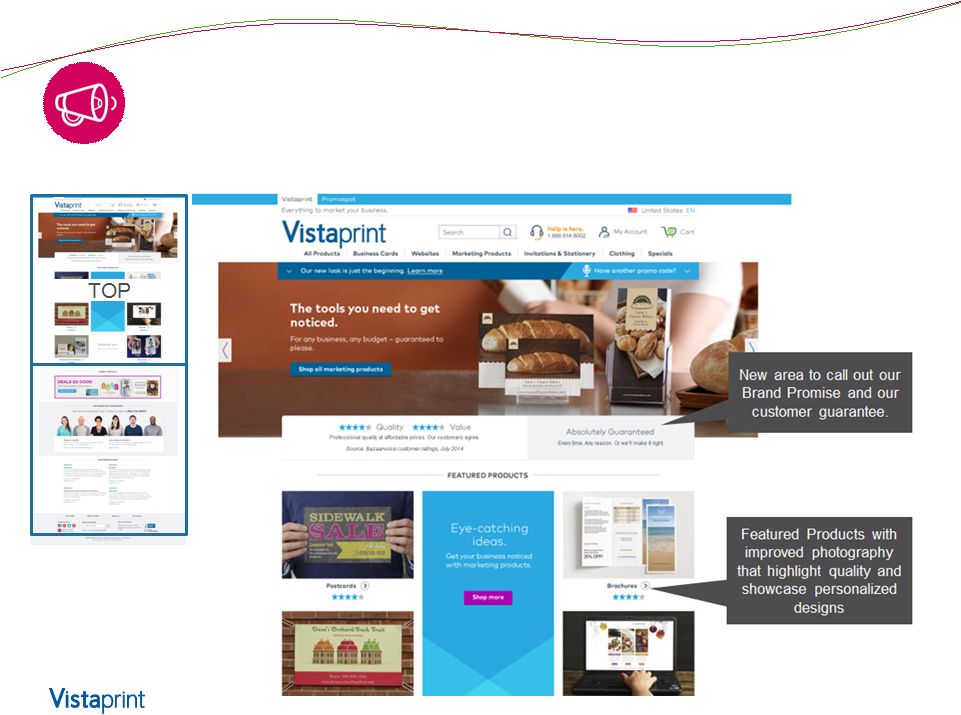 Communications Evolution: More Brand-Forward Site 28 |
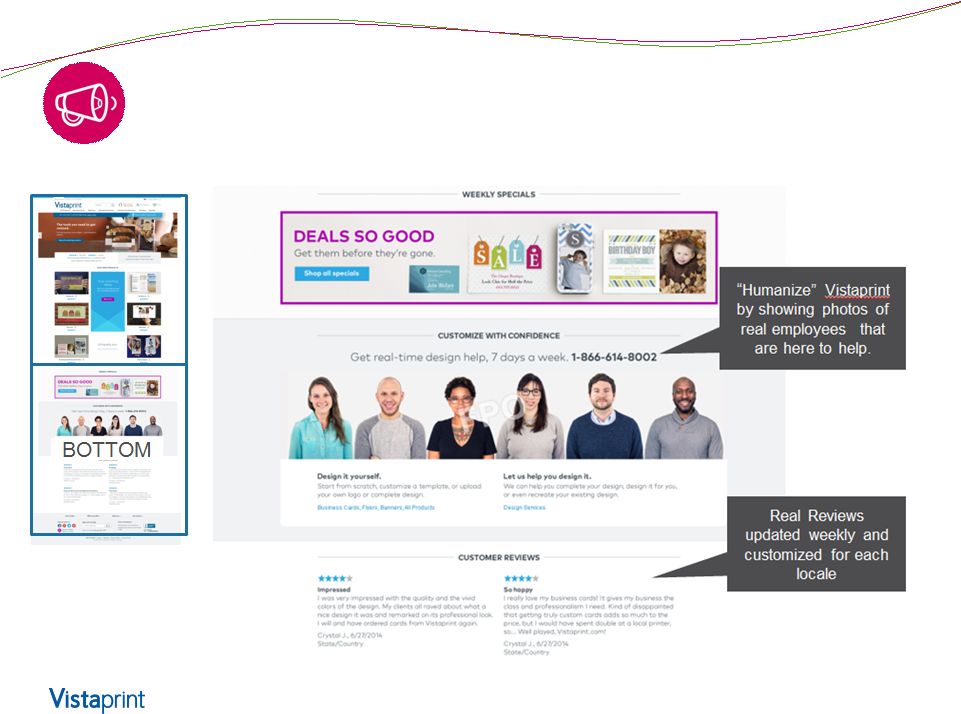 Communications Evolution: More Brand-Forward Site 29 |
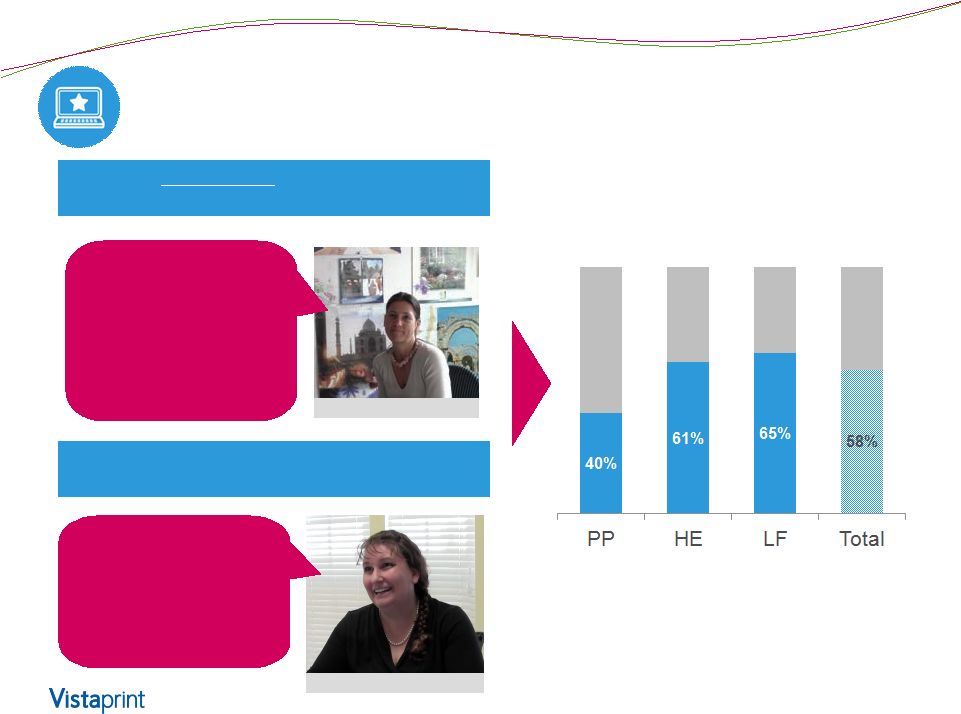 Customers want and need Design Help 30 Received Design Assistance (DIWH or DIFY) in the L12M They lack the skill, both artistic and technical, and time to do it themselves “If I have to do it myself, I’m not a pro and I don’t know how to do the technical things like uploads and layout” Claudia, HE, Germany They want a customized design, even with DIY templates “I want the design to be unique to me…. I see even templates as a starting point for customization” Various, HE/PP, US and EU |
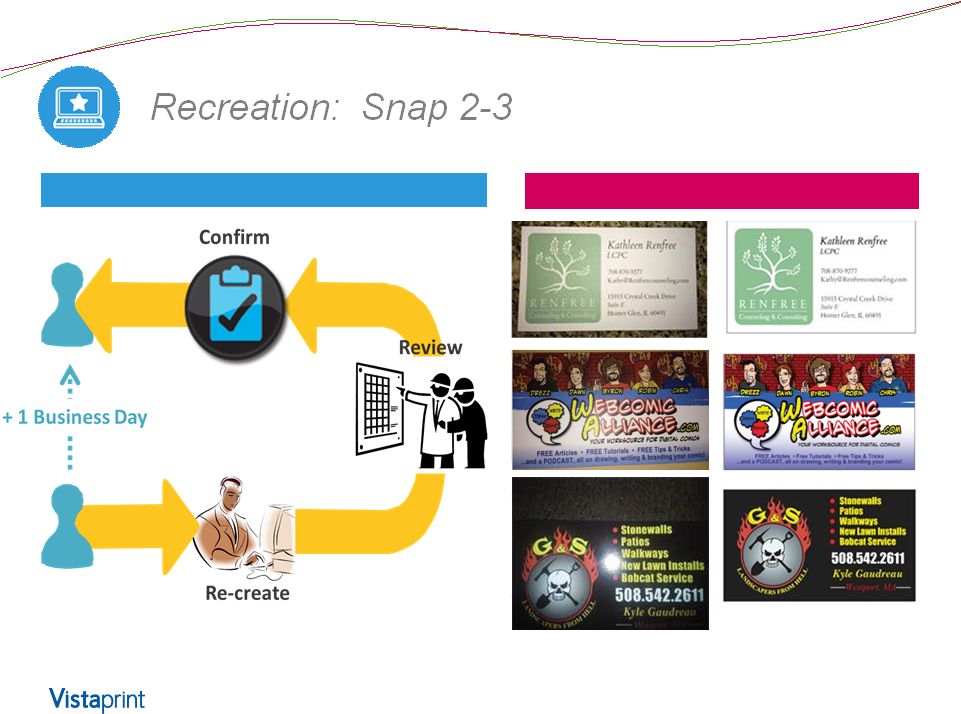
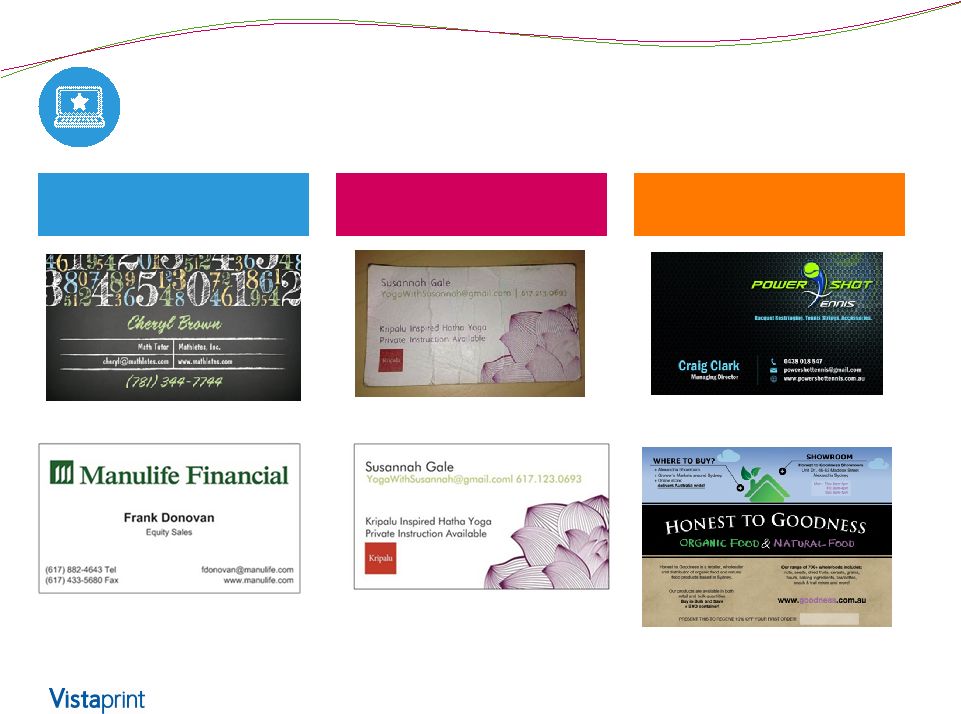 DIY Templates and Build a Design DIWH- Recreation Services DIFY- Custom Design Design Services: Examples across the continuum 31 |
 Website Experience: New Design Studio 32 Smart guides for easy alignment Tablet-friendly user interface Error detection Access to support |
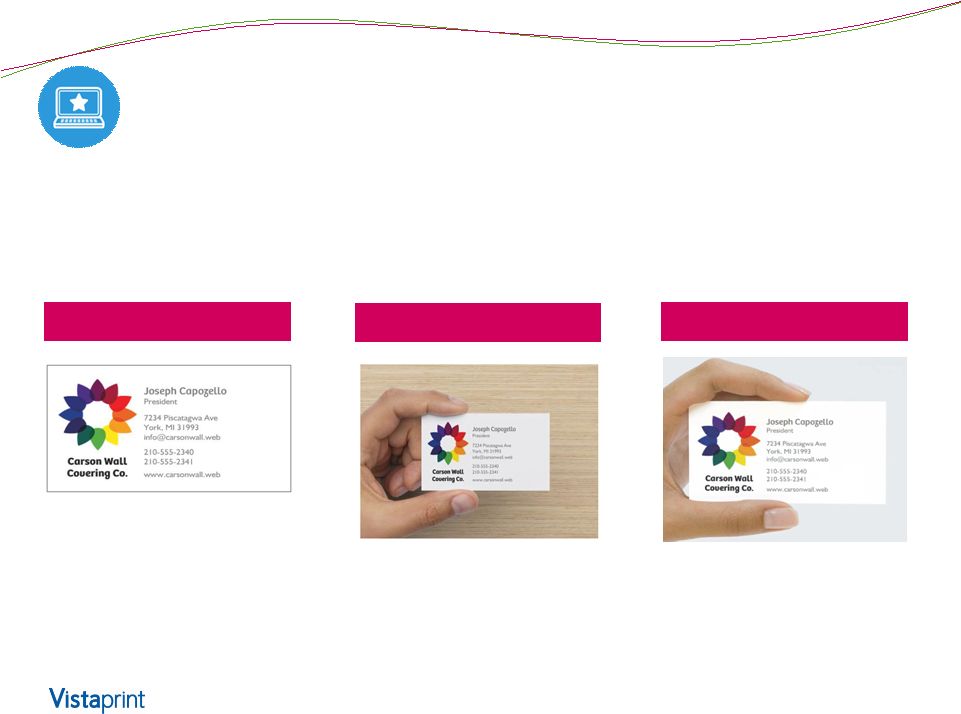 Website Experience: Product Rendering 33 33 Our new rendering technology allows customers to see their personalized product in a real-life context. We measured a significant conversion rate increase and reduced design complaint rates with these photo-realistic previews. Spot Gloss Animation Dynamic Image Preview Standard Product Preview |
 34 Easy Process Before & After |
 Product Offering Evolution: Delivered Quality 35 Planned initiatives to improve Delivered Quality: 1. Pre-printing design checks 2. DIY error detection Only half of customer dissatisfaction with quality is Vistaprint controllable Vistaprint Controlled Unknown Customer Design Errors |
 Product Offering Evolution: Expanded assortment to increase category credibility 36 36 From a limited selection per category To credible assortment |
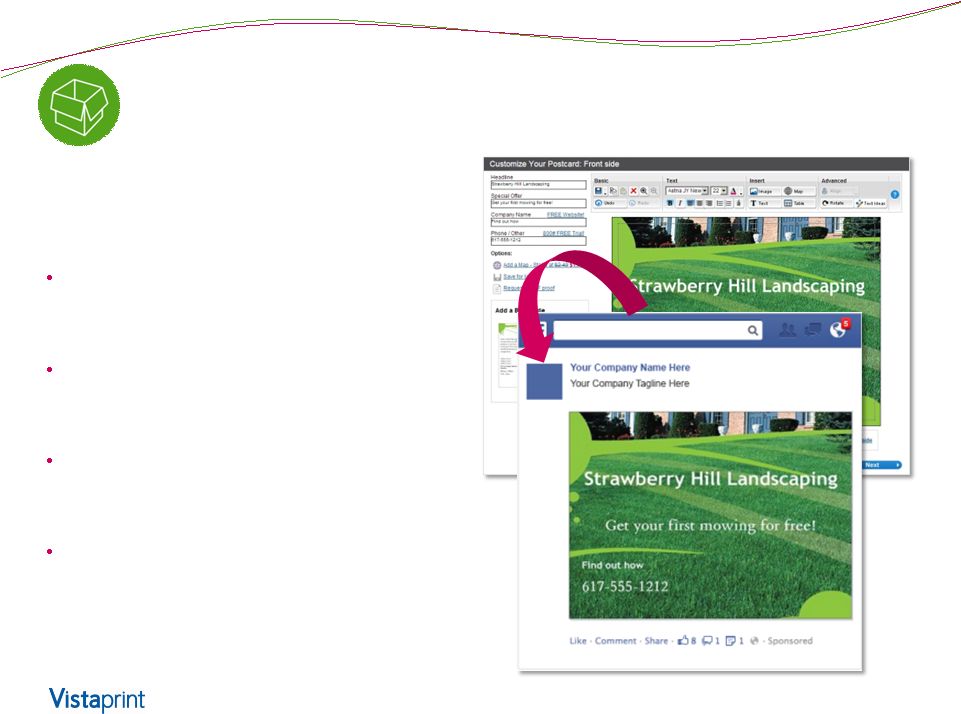 Product Offering Evolution: Digital -Physical Innovation 37 Facebook Postcard Distribution Use your postcard design to generate a matching Facebook ad Turn nearby Facebook users into customers Quick and easy way to trial social media marketing Strong take rate during vapor testing indicated customer demand 37 |
 Pricing Evolution: Rationale for “ Reinvents” 38 • Customers did not like our high shipping prices; we weren’t e-commerce standard with our shipping as a % of order value • Too proactive up- and cross-selling hurt customer trust and satisfaction, especially charging for digital items like image uploads • We were encouraging a focus on price with the inconsistency in pricing across channels – we trained customers to hunt for the lowest prices • Customers were flocking to paid channels, where the prices were often the lowest (most competitive), creating less acquisition efficiency |
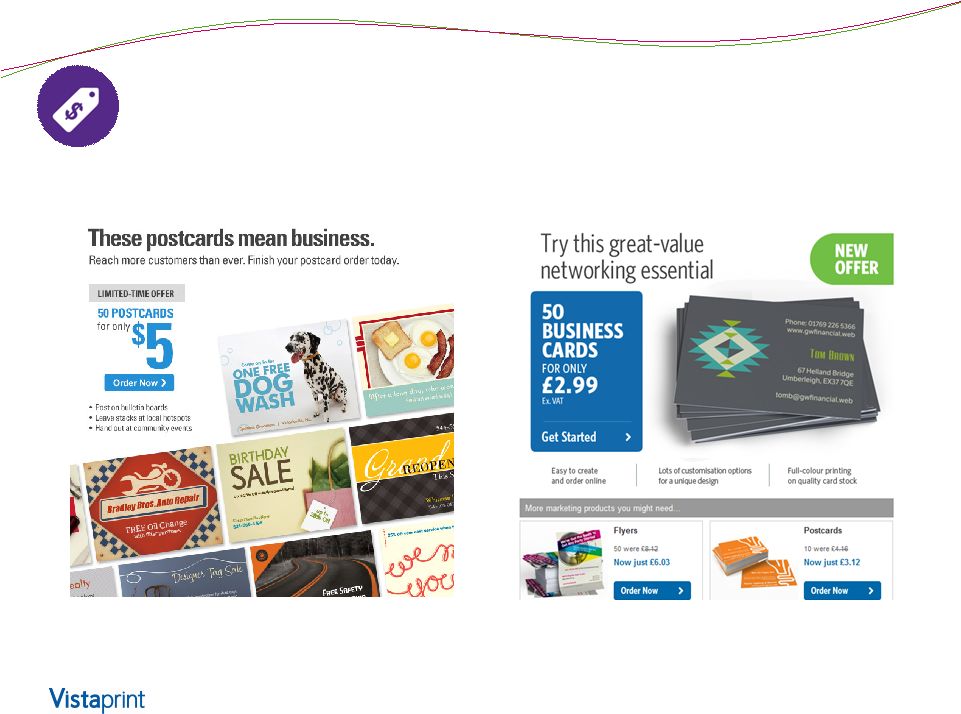 Pricing Evolution: maintaining PP leadership 39 Introducing lower quantities for our lead offer at a lower face price |
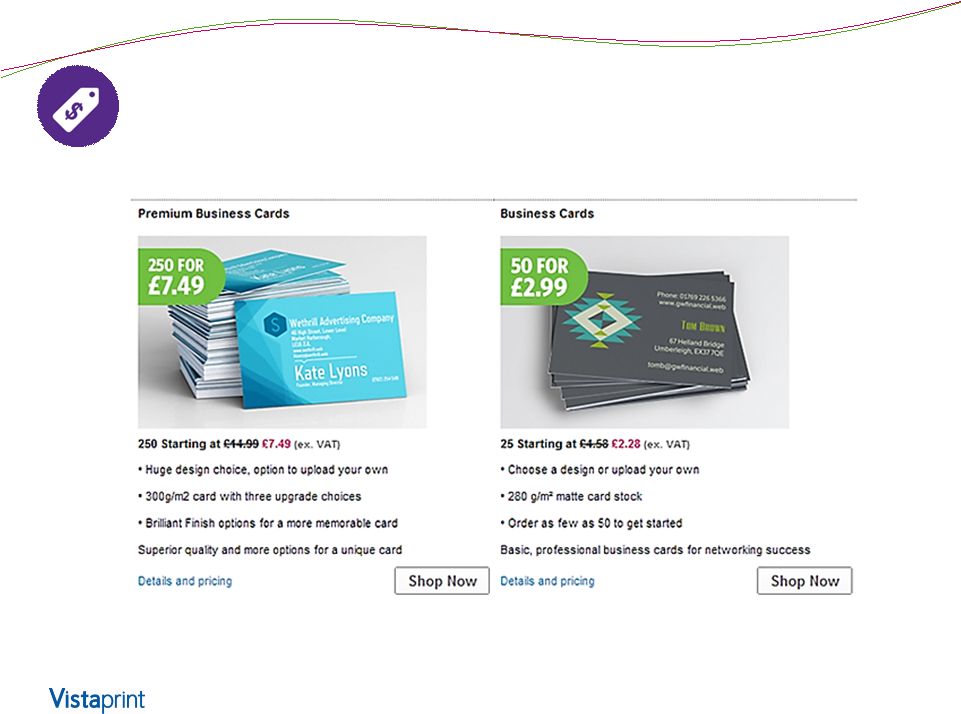 Pricing Evolution: balancing segment needs 40 Targeting HE vs. PP with different quantities/price points to increase relevance |
 Vistaprint Brand Overview 41 Context for our performance and brand evolution FY 2014 investment examples Why we are confident |
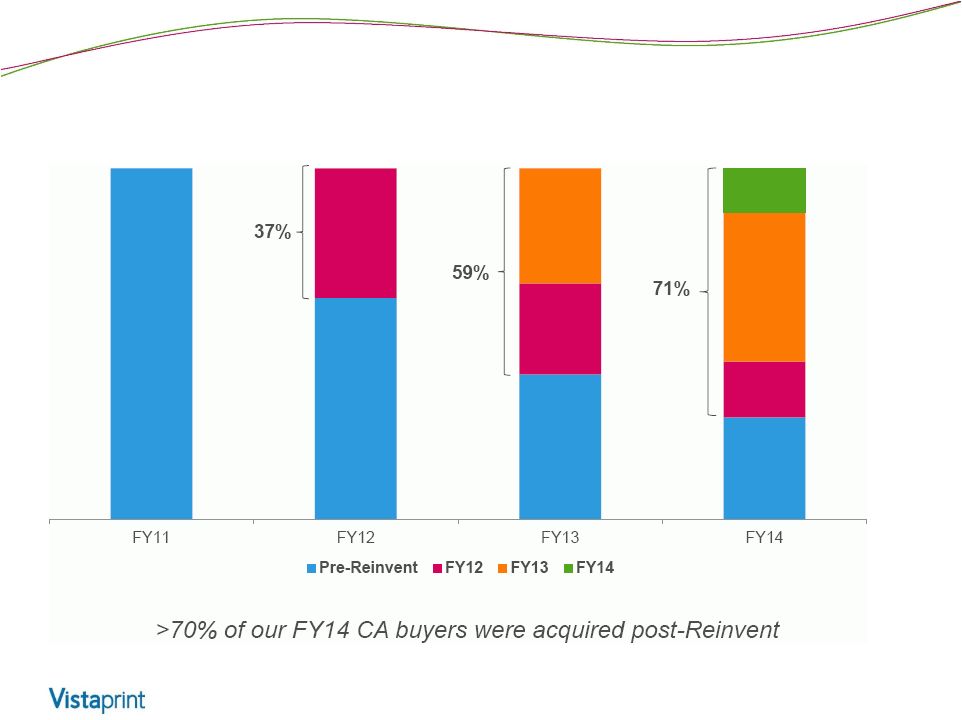
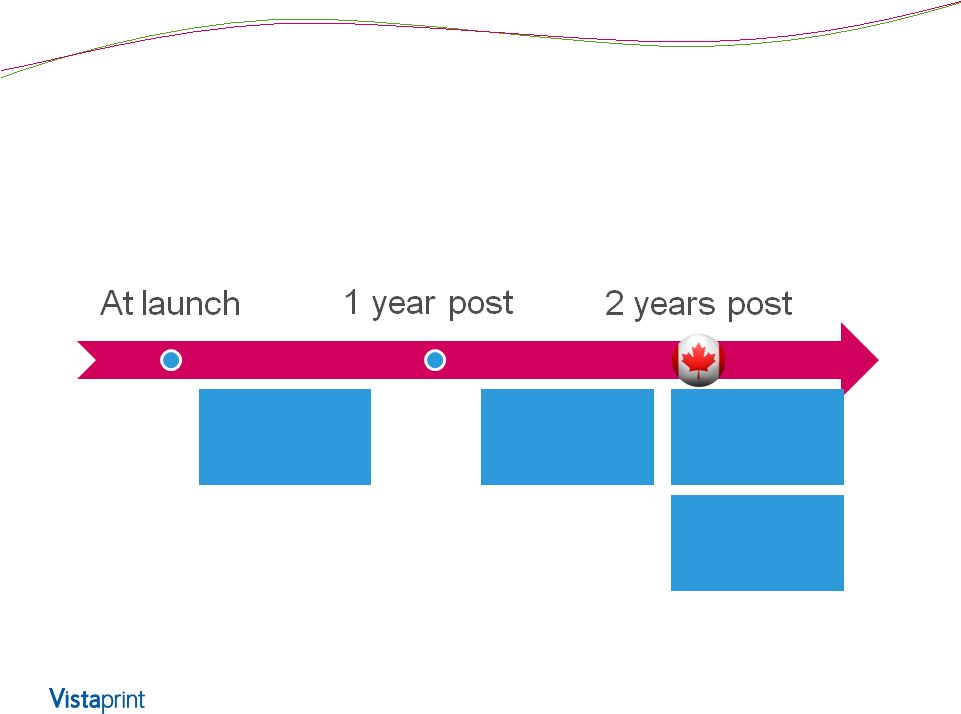 Canada’s growth has been driven by a number of KPIs, some of which we’ re starting to see in other, reinvented countries 42 Promising trends in profit per customer Improved spend leverage Improvements in customer satisfaction Better retention |
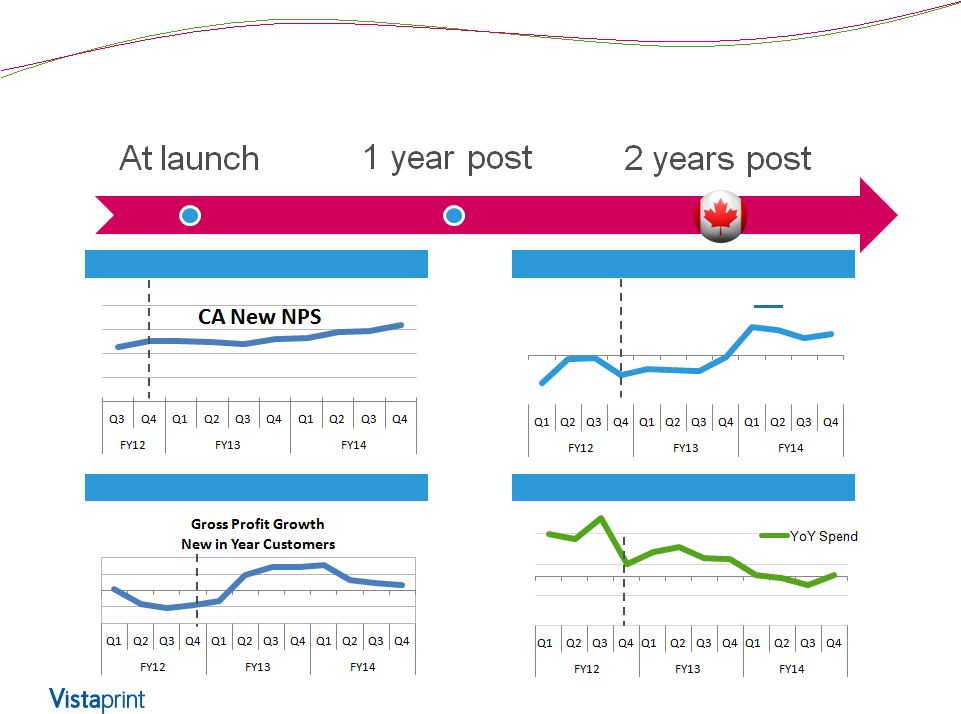 Signs of Progress - Canada 43 Better retention Improved spend leverage Improvements in customer satisfaction Promising trends in profit per customer YoY change |
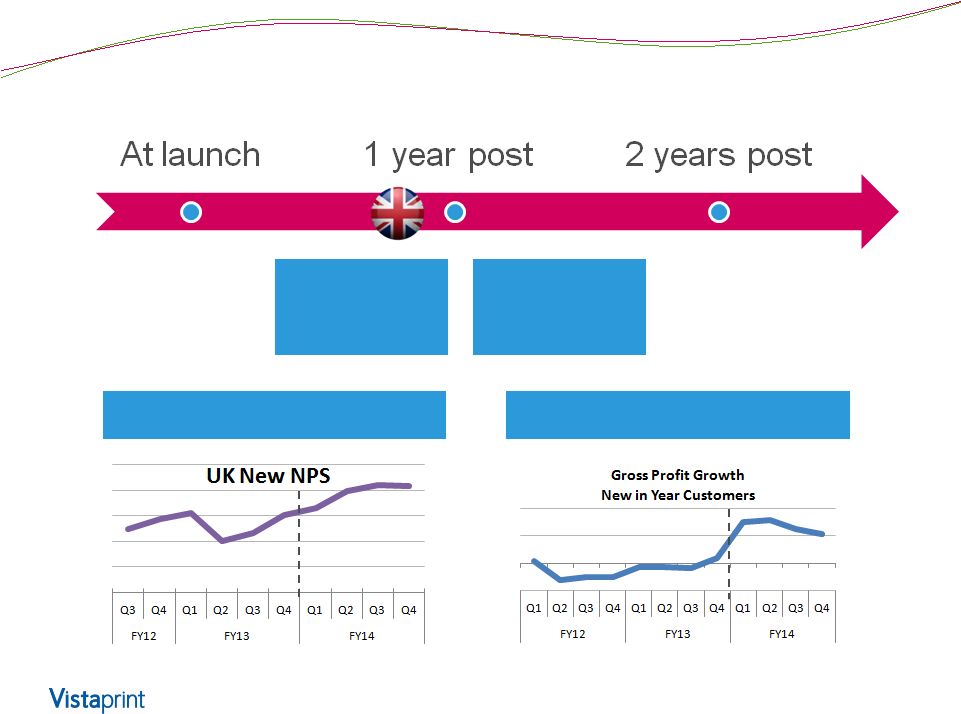 Promising trends in profit per customer Signs of Progress - UK 44 Improvements in customer satisfaction Improvements in customer satisfaction Promising trends in profit per customer |
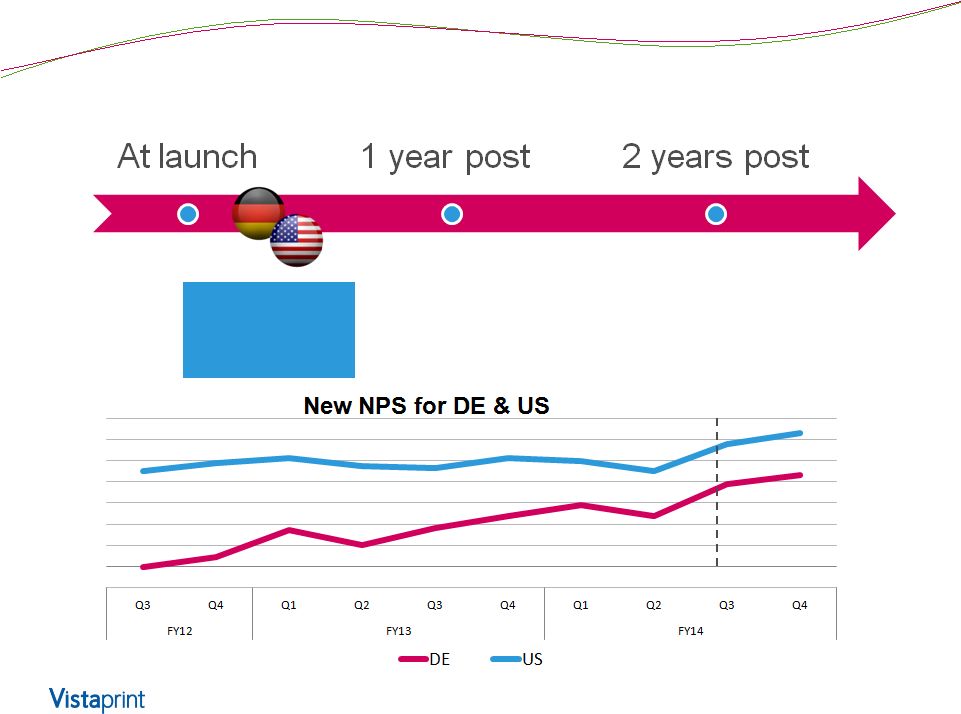 Signs of Progress – U.S. and Germany 45 Improvements in customer satisfaction |
 Why do the Pricing Reinvents take so long to see improvements to Repeat Rates? 46 |
 47 • Higher quality customers • More efficient advertising • Stronger brand loyalty What we expect to see long term with this strategy |
 Real, Unscripted Customers 48 |
 Investor Day 2014 |
 Manufacturing and Supply Chain (M+S) Don Nelson President, Software and Manufacturing Platform Investor Day 2014 |
 Manufacturing + Supply Chain Overview 51 Current State of M+S o Our network and capabilities o Scale advantage through operational excellence • Superior quality and conformance • Low COGS Changes to support our strategy o M+S and the Orion fulfillment system o Expanded selection o Commitment to conformance o Transferring scale advantage through PMI |
 Manufacturing + Supply Chain: Who we are 52 • M+S is a unit deeply committed to providing distinctive speed and value to our customers while operating with best-in-class internal costs and maintaining a highly safe and nurturing workplace for our employees Manufacturing & Supply Chain Manufacturing operations (COGS) >1,000 FTE Manufacturing + SC capabilities (OPEX) >160 FTE |
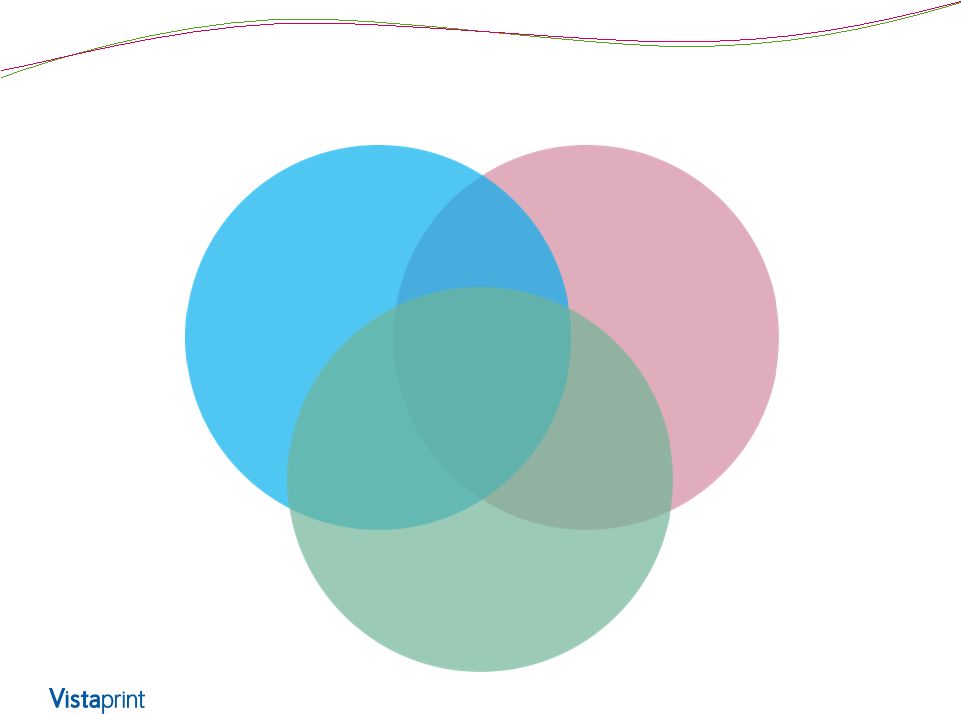
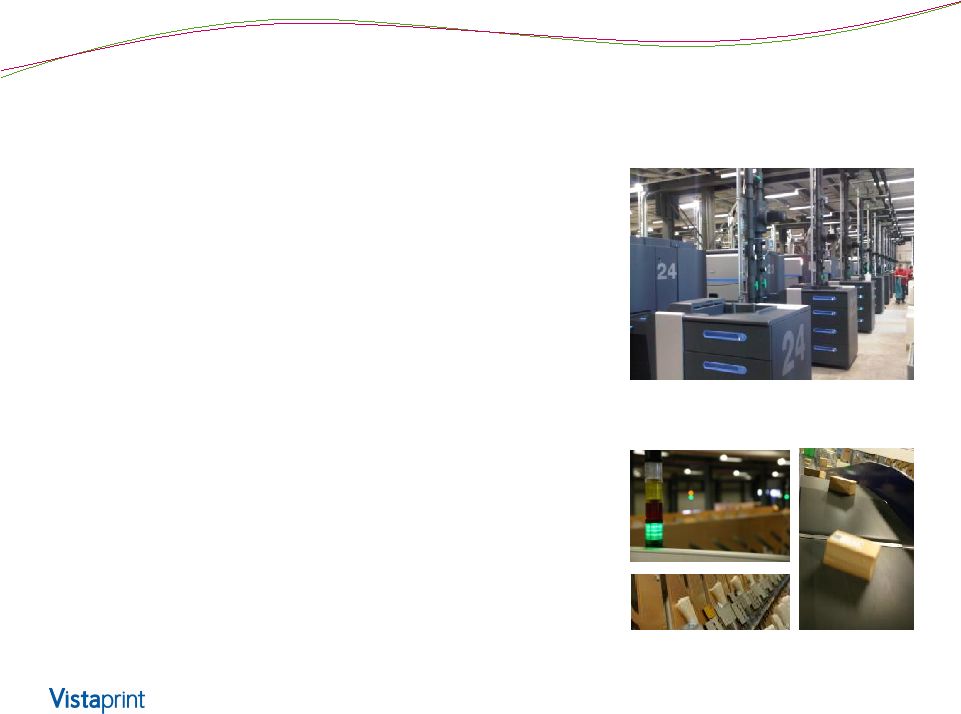
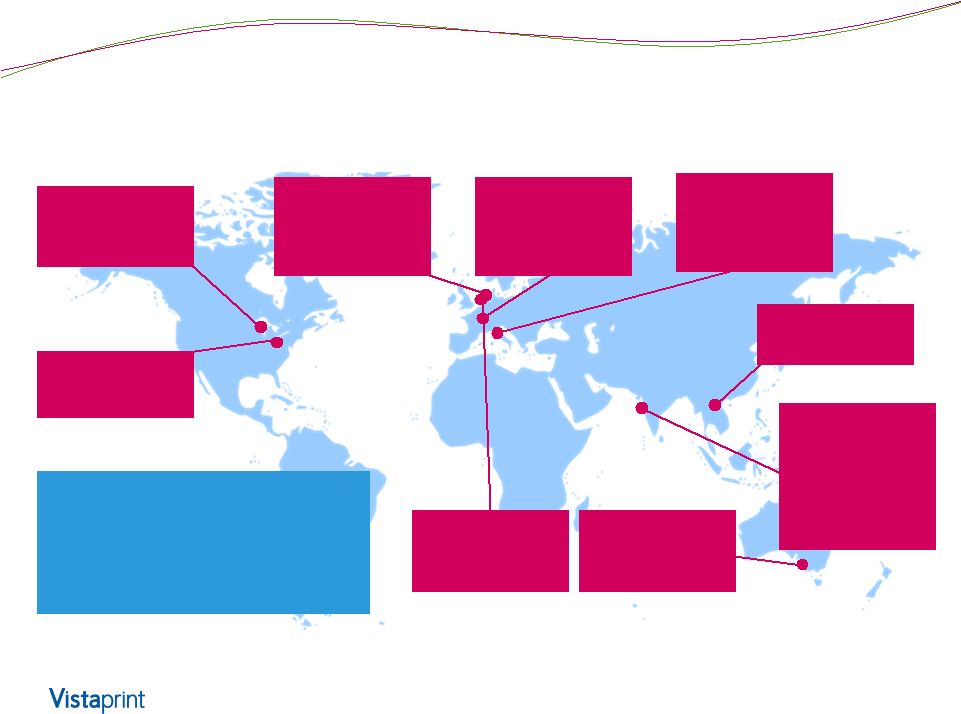 M+S operates a global delivery organization with > $1 billion in output 53 Prod. plant Windsor, CA >500,000 ft 2 Software Development Lexington, MA Prod. plant Ypenburg, NL Albumprinter > 64,000 ft2 Prod. plant Venlo, NL >320,000 ft2 Design/Tech Center Winterthur, CH >160 FTE Prod. Plant Treviso, IT Pixartprinting 170,000 ft2 Asia Sourcing Hong Kong Prod. plant Bhiwandi, IN (Mumbai) Launched Sept 2012 >27,000 ft2 Prod. plant Deer Park, AU >110,000 ft2 Vistaprint M&S globally 2014: • 9 locations • ~$1.1 billion output • Serves major worldwide markets |
 Manufacturing – Capturing scale advantage • M+S is concluding a 3-year program that greatly improved our operational capabilities and performance • This has reinforced our unique competitive advantage of combining scale and operational excellence in a mass customization environment • As a result, we have improved our delivery of customer value while capturing significant reductions to key areas of COGS 54 |
 We have driven operational improvements in many key customer facing areas 55 Improved speed, quality, consistency, and efficiency assure excellent conformance to customer expectations at low cost -72% -38% Quality Complaints Production Throughput Time 2010 2014 2010 2014 2010 2014 Late Deliveries -62% +48% Direct Labor Productivity 2010 2014 (-10% YOY Q4 FY14) (+12% YOY Q4 FY14) (-14% YOY Q4 FY14) (-10% YOY Q4 FY14) |
 Combining scale advantage in ways others cannot match 56 >5.5 billion business cards, 4 million signs, 5.6 million garments per year >90,000 orders shipped per average day with a focus on lean manufacturing >$1.2 billion output/yr from >1 million ft 2 of plant space, with 24 hour operation Very little direct labor per order shipped Excellent shipping rates and service through scale-based relationships Very Low material costs and waste levels |
 This scale and performance optimization has a material impact on COGS and margin 57 Savings are deployed to fund investments in quality, offset inflation, or increase gross margin • ROIC: increasing levels of volume and revenue flowing across equipment and facilities with 24 hours of daily production • Shipping: channeling the power of 90,000 shipments per day to get the best rates and service • Raw material: using the scale advantage from 150,000 lbs. of daily usage to drive superior material prices • Direct labor: using proprietary scheduling along with lean production to significantly improve labor efficiency |
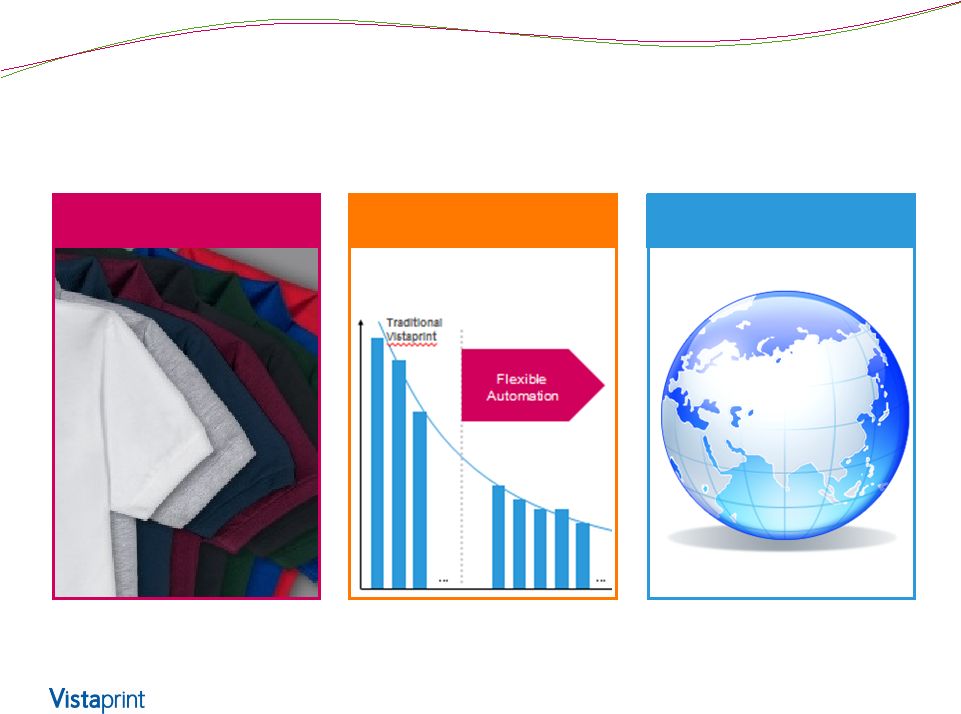
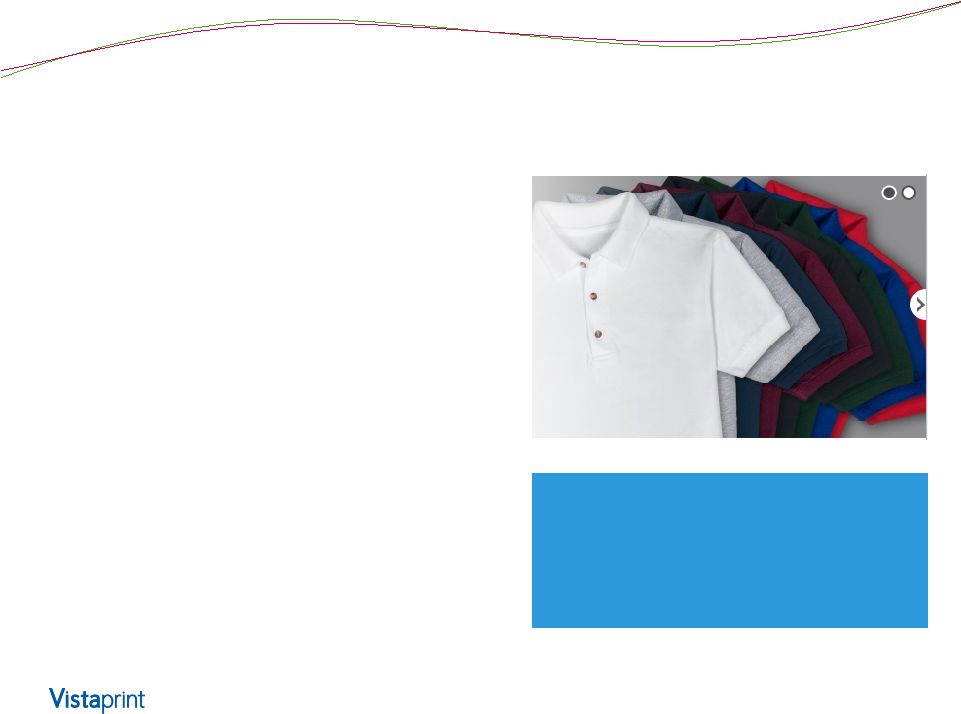 Next Wave: Product Diversity 58 • Even as we offer costs well below competitors • 3 to 5 year project similar in scope and ambition as just finished • Includes: o Product types – breadth and depth o Delivery options o Decoration method o Quantity available Today we offer 8 colors of Men’s embroidered polo shirts. In the future, we want much higher selection across multiple product categories. |
 Manufacturing + Supply Chain Overview 59 Current State of M+S o Our network and capabilities o Scale advantage through operational excellence • Superior quality and conformance • Low COGS Changes to support our strategy o M+S and the Orion fulfillment system o Expanded selection o Commitment to conformance o Transferring scale advantage through PMI |
 M+S is now part of Orion, a platform that is creating scale advantage through selection, cost, and conformance 60 • Multiple customer facing brands all leveraging mass customization through shared computer integrated manufacturing platform Shared Computer-Integrated Manufacturing Platform New Geographies |
 Why this is difficult 61 • SKU management without inventory proliferation • Data systems to manage massive increase in substrates • Off-the-shelf equipment either o Small job shop – unreliable, high unit costs o Mass volume – high set up costs not economic for small order volumes • We want to do it differently o Innovative use of digitally driven equipment o Proprietary production methods developed in over past 3 years – all capable of extremely low units o E.g., embroidery |
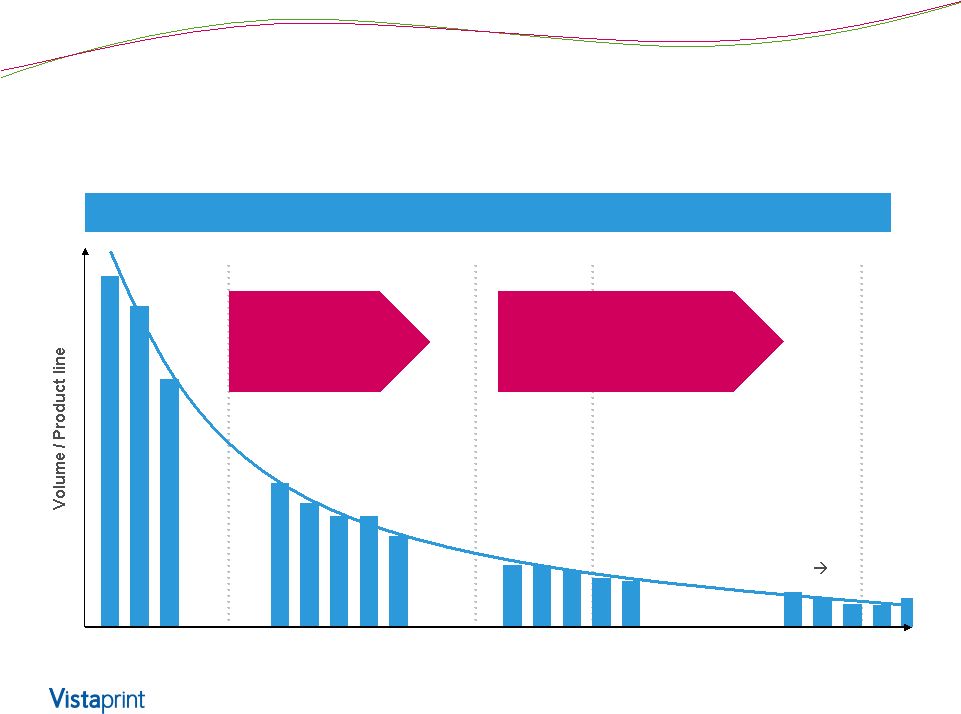 … Platform to move toward a “long tail” selection 62 Product line (category) … … … Traditional Vistaprint Conceptual Flexible Automation Product & delivery platform Product and Delivery Platform Fringe products Not offered Outsourcing, potentially in-sourced decoration for low quantity |
 Dramatically increasing SKU selection 63 ~600 ~1800 ~3300 ~5700 Vistaprint SKUs, start of FY14 SKUs of acquired companies in FY14 SKUs of apparel, soft goods and other products planned in FY15 (in Beta phase) Total potential SKUs M+S is increasing selection by >800% with Orion, and we plan to increase even further over time |
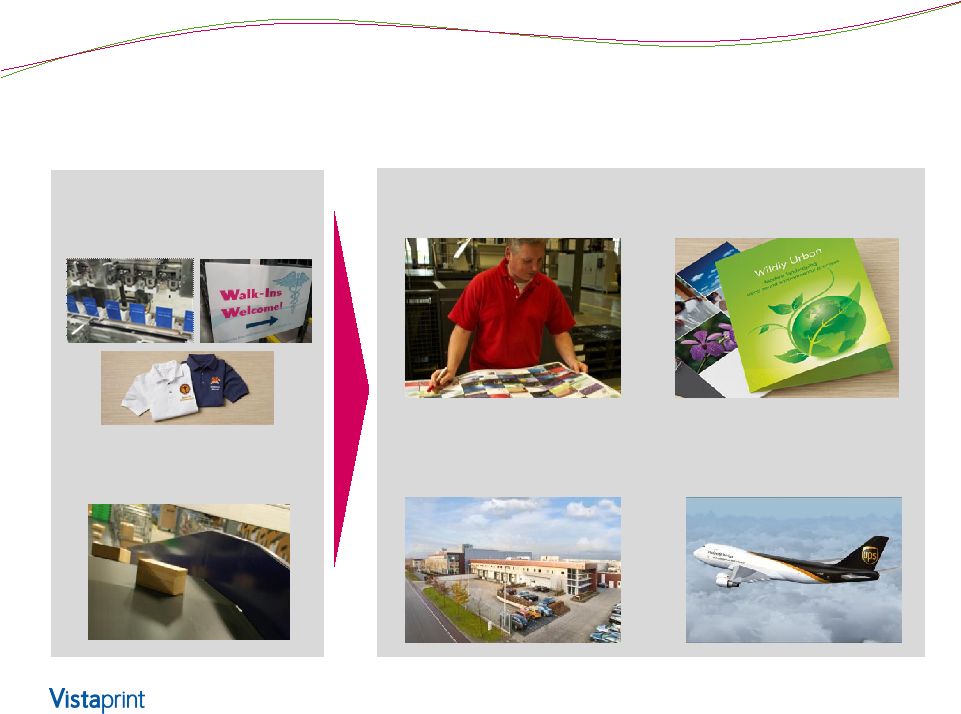
 Example: Signage from acquired companies 64 Before After We will materially expand our signage offering for the Vistaprint brand starting in H2 FY15 with knowledge from People & Print Group and Pixartprinting • 10 – 15 banner sizes • New substrates • New features like reinforced grommets, roll-up banner stands • Plus, signage extensions in posters, signs, decals and more! |
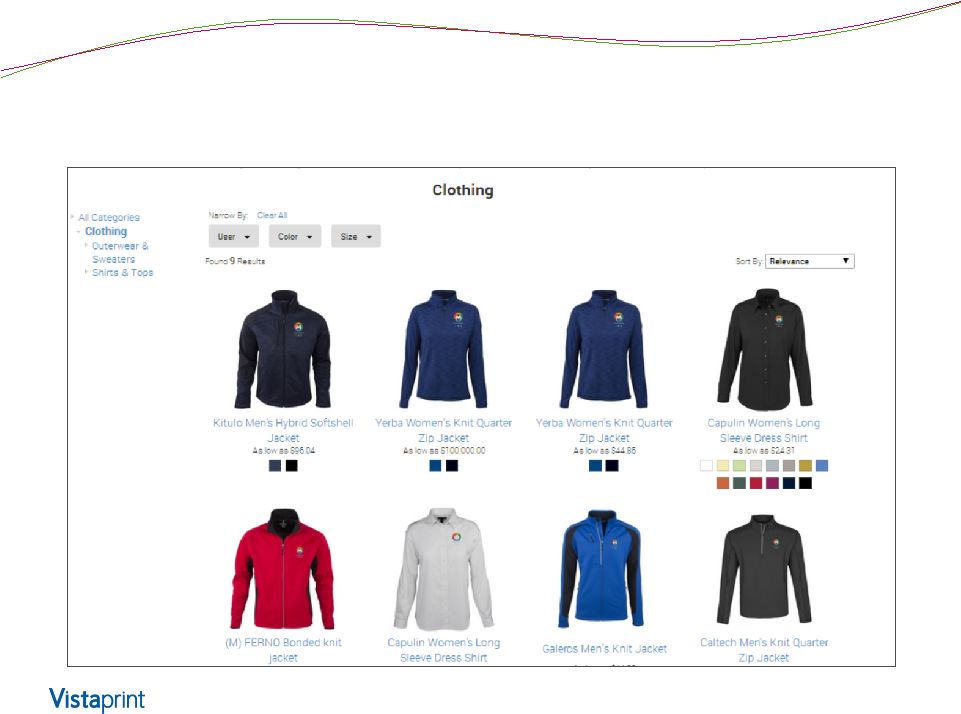 Example: radical increase to apparel & soft goods selection 65 |
 Distinctive internal M+S capabilities will drive our entry in the apparel & soft goods market 66 By Q3 of FY15 we plan to make a large portion of the (currently beta) product line available starting at QUANTITIES OF ONE Traditionally high file processing and setup costs mean that the market does not effectively serve small customized quantities – therefore most logo apparel and soft goods products were out of reach for the micro-business market Multi-year manufacturing capabilities and supply chain strategies we are making are designed to break this constraint |
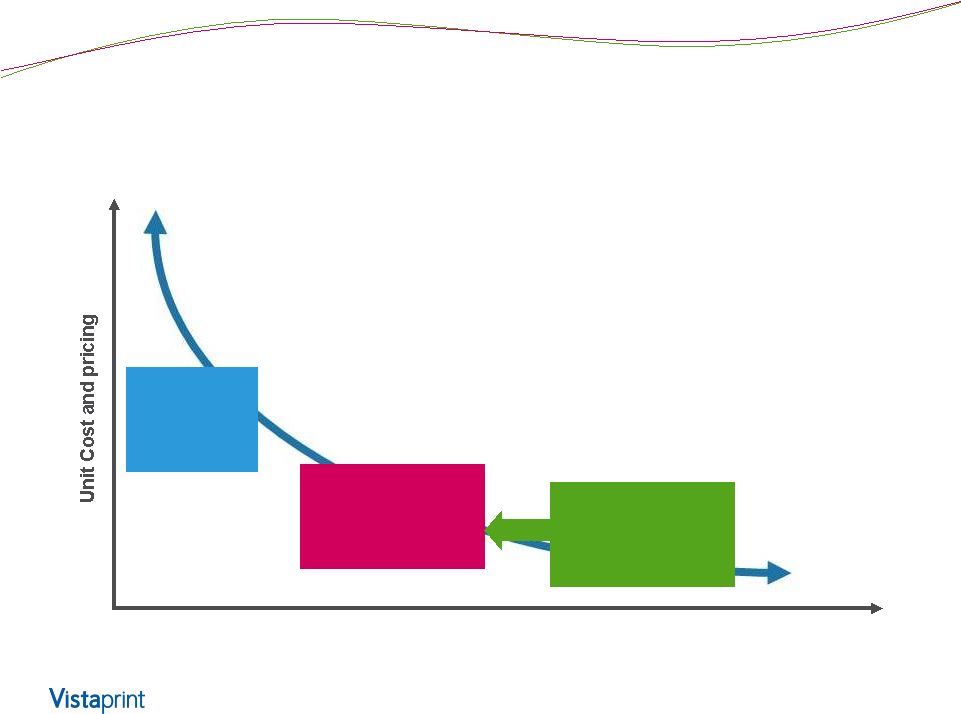 Large Scale in Small Quantities 67 Quantity of custom decorated items in a given order Low Volume High Volume Vistaprint (currently in development) Traditional resellers of apparel & soft goods importers and decorators Asian and other LCC suppliers to apparel & soft goods importers |
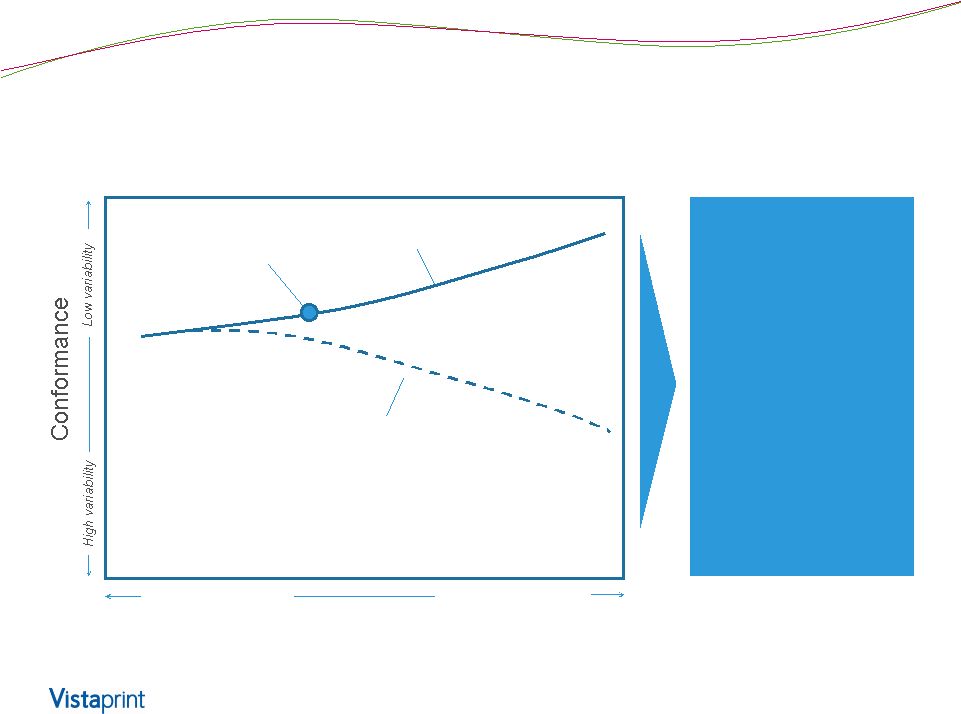 The conformance lever: we will have great consistency while expanding selection 68 As we further develop our unique approach to mass customization, we are building the capability to improve conformance while simultaneously increasing selection Customization & Selection Level VPNV today* Our planned trajectory * Conformance has actually been improving while selection is increasing Traditional Manufacturing Approaches Level of Conformance Few, standard products Many, custom products |
 We leverage our scale advantage & capabilities as we greatly expand selection 69 Level of advantage when offering high selection levels Automated file preparation software Specialized lean direct labor optimization Fully automated high- volume processing lines Volume material cost advantage Volume shipping cost advantage Equipment / facility utilization advantage No cost advantage Limited cost advantage Significant cost advantage Great cost advantage |
 Cost: We are transferring our capabilities and scale advantages to new acquisitions and partners 70 Two pillars of transferrable cost advantage: Orion makes these advantages modular and easy to transfer. Example: Albumprinter achieved post-acquisition: • Reduction in cost of purchased materials • Increased labor productivity • Lower production throughput time Unique Capabilities brought by VPNV: • Proprietary software • Patented scheduling approach • Lean application in mass customization • Proprietary production platforms Improved Scale from joining with VPNV: • Production scale • Material purchasing scale • Supply chain & logistics scale • Engineering scale |
 Summary 71 • Established history of technology-enabled operational advantage has led to improvements in quality, cost, reliability and throughput time • Proactively investing to further traditional advantages • Building new capabilities that likewise break traditional constraints of low-volume production while maintaining low costs • All in support of goal to build a common back-end platform where scale drives advantages to conformance, selection and cost |
 Investor Day 2014 |
 Long-Term Financial Strategy Ernst Teunissen EVP and Chief Financial Officer Investor Day 2014 |
 Long -Term Financial Strategy 74 • Maximize long-term intrinsic value per share (DCF/share) • In our core business return to pre-FY12 margins, while continuing to invest for long-term health and growth • Use cash flow and balance sheet to drive DCF/share beyond core business: o Synergistic M&A o Share repurchases • Prioritize by comparing cash returns between the above levers |
 Still early in our journey 75 FY15 GAAP and non-GAAP EPS guidance as of July 30, 2014 Please see non-GAAP reconciliation at the end of this deck |
 After two years of investment in advertising and opex, increasing margins in FY13 -15 76 *Midpoint Net Income margin guidance for fiscal year 2015 provided on July 30, 2014 |
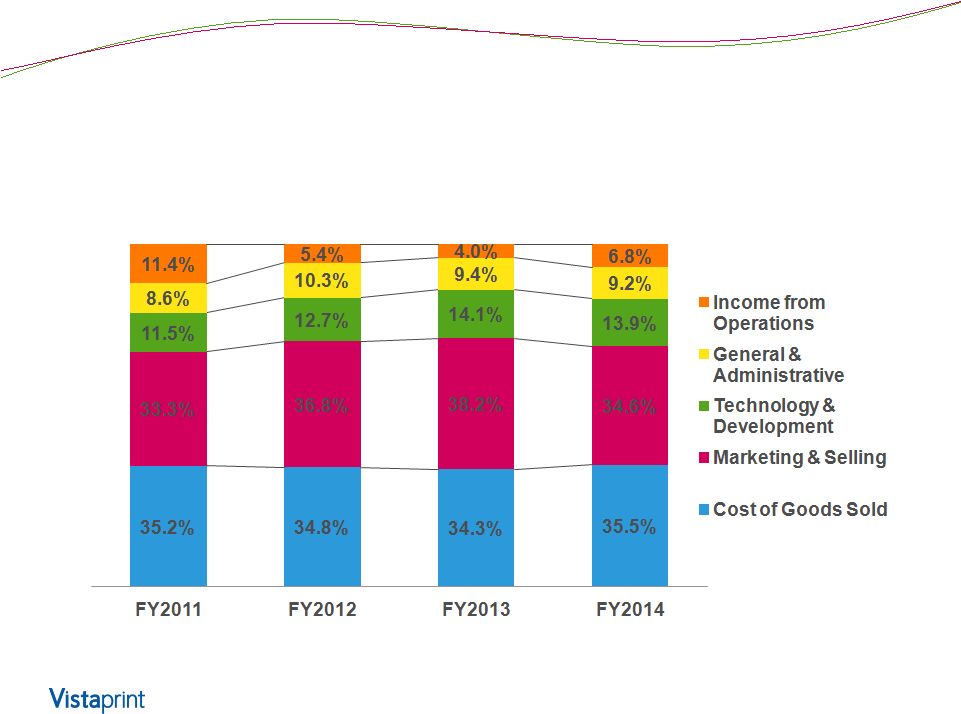 Margins improving most in advertising and G&A 77 P&L line items as a percent of revenue |
 Expect to continue margin expansion in FY15 Select P&L Line Items (as % of revenue) FY2014 Actual FY2015 Midpoint Guidance Comments: Expectations excluding Recent Acquisitions* Comments: Expected Impact of Recent Acquisitions* Gross Margin 64.5% ~60% - 62% Increased manufacturing productivity, offset by investments in product quality and selection, Significant impact from lower GM of acquired companies Advertising 21.1% ~20% Opportunity for slight investment for Vistaprint brand if we believe returns are there Lower ad spend at acquired companies more than offsets any investments in Vistaprint brand Other Operating Expense 36.6% ~34% - 35% Drive for efficiencies in G&A functions partially offset by targeted Technology investments Integration costs related to acquisitions Operating Income 6.8% Slightly higher Slowing down headcount growth, drive for efficiencies Accretive to OI $, but dilutive to OI margin Net Income 3.4% ~5.3% Nonrecurrence of Namex losses lifts FY15 margin Increased interest expense from recent borrowing partially offsets Namex lift Slower OI expansion than FY14, but FY14 was greater than originally planned; Acquisitions disrupt margin distribution *People & Print Group, Pixartprinting and FotoKnudsen |
 Significant investments: Vistaprint brand 79 • Continued upgrades to product substrates, formats and shipping options • Pricing and marketing changes in remaining European markets • Opportunity to increase advertising as a percent of revenue for Vistaprint brand • Design service expansions |
 Significant investment: new capabilities 80 Additional investments beyond those we are making to reposition the “Vistaprint” brand. New Product Capabilities Platform to Support Multiple Front Ends New Geographies |
 M&A Approach 81 • As discussed for years, scale matters in our business model o Lower unit costs (supply chain, production focus & automation) o Expansion of product breadth and delivery options o Quality and engineering systems • Increasing interest in pursuing M&A to accelerate scale o Brands that are differentiated from our “Vistaprint” brand o Yet which can benefit from and add to a common operational platform to drive scale-based competitive advantages • Determined to be disciplined, only pursue opportunities that meet o Strategically clear objectives o Risk-adjusted IRR better than alternative investments (& WACC) |
 Share Repurchases can be a powerful driver of FCF per share 82 We have reduced our share count by 26% since the end of FY10; we compare any allocation of capital for M&A or the business against additional share repurchases FY10 FY11 FY12 FY13 FY14 Shares outstanding (MM) 43.9 43.1 34.1 32.8 32.3 Shares purchased (MM) - 1.3 9.9 1.9 1.0 Average cost per share - $42.91 $31.28 $34.77 $40.24 Total purchase spend ($MM) - $56.9 $309.7 $64.4 $42.0 Cumulative Accretion to FCF/share* $0.04 $0.33 $0.39 $0.54 *Accretion to FCF/share does not take into account the increased interest expense from funding the repurchases. It is calculated by comparing actual FCF/share to a hypothetical FCF/share, in which the weighted share count for each period is adjusted (increased) by the weighted cumulative effect of repurchases up to that date. See non-GAAP reconciliations at the end of this presentation. |
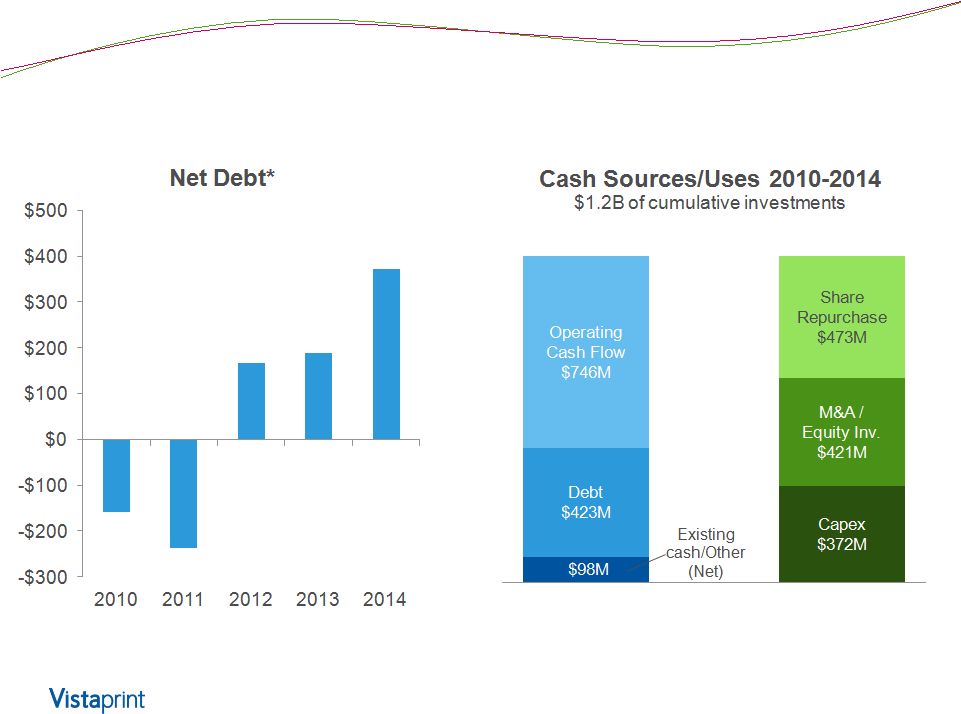 Sources and Uses of Capital 83 * Net debt defined as bank debt less cash and cash equivalents |
 Financial Leverage 84 • June 30, 2014 bank debt of $448M o Committed credit facility $794M ($640M revolver, $154M term loan A) o Floating rate debt at 1.81% (2.06% including swaps) o Leverage (Debt/TTM EBITDA) at 2.5x pro forma* • Total leverage covenant currently 3.25x o Q1 FY15 additional borrowing capacity limited to $153M pro forma* • Total leverage covenant for M&A and share repurchases currently 2.75x on proforma basis (additional limits can apply) * Proforma includes impact of July 1, 2014 acquisition of Fotoknudsen AS |
 Capital Structure Philosophy and Outlook 85 • Given cost of borrowing we believe medium/long-term leverage levels as allowed in credit facility are attractive assuming we continue to find high-returning opportunities to invest in o If opportunities are not there, FCF generated will naturally decrease our leverage by paying down Revolver o For the right opportunities we could see leverage temporarily go up • We will continue to evaluate various instruments, including longer-term debt (not included in guidance) |
 Summary 86 • We continue to have multiple levers for driving long-term profit and cash flow growth • We have demonstrated profit margin and FCF growth and expect to continue this focus over a multi-year period • We believe the investment options we have created by leveraging our balance sheet are creating long-term shareholder value |
 Investor Day 2014 |
 Closing Remarks Robert Keane President and Chief Executive Officer Investor Day 2014 |
 89 |
 Our Focus: Mass Customization 90 |
 Vistaprint means different things to different stakeholders 91 • Increasing divergence between Vistaprint the brand and customer value proposition and Vistaprint the corporation • Strategy to preserve the differentiation and independence of acquired company brands, as well as the Vistaprint brand Compelling reasons to change the name of the corporate parent company |
 92 |
 93 |
 Next Steps 94 • This is a corporate name change, not a change to any customer-facing brands • As a Dutch company, a name change requires shareholder approval • This proposal will be on the ballot for our 2014 Annual Meeting in November • We would expect the name change to take effect along with a corresponding change to our ticker symbol shortly after the Annual Meeting |
 Our Big Picture Steadfast in our belief that we can drive excellent long-term returns by consolidating our industry • Vistaprint brand • Thoughtful M&A • Shared CIM platform We are committed to growing DCF per share 95 |
 Investor Day 2014 |
 Non-GAAP Reconciliation and Reference Information Investor Day 2014 |
 About non-GAAP financial measures To supplement Vistaprint’s consolidated financial statements presented in accordance with U.S. generally accepted accounting principles, or GAAP, Vistaprint has used the following measures defined as non- GAAP financial measures by Securities and Exchange Commission, or SEC, rules: non-GAAP adjusted net income, non-GAAP adjusted net income per diluted share, free cash flow, trailing twelve month return on invested capital, constant-currency revenue growth and constant-currency revenue growth excluding revenue from fiscal 2014 acquisitions. Please see the next slide for definitions of these items. The presentation of non-GAAP financial information is not intended to be considered in isolation or as a substitute for the financial information prepared and presented in accordance with GAAP. For more information on these non-GAAP financial measures, please see the tables captioned “Reconciliations of Non-GAAP Financial Measures” included at the end of this release. The tables have more details on the GAAP financial measures that are most directly comparable to non-GAAP financial measures and the related reconciliation between these financial measures. Vistaprint’s management believes that these non-GAAP financial measures provide meaningful supplemental information in assessing our performance and liquidity by excluding certain items that may not be indicative of our recurring core business operating results, which could be non-cash charges or discrete cash charges that are infrequent in nature. These non-GAAP financial measures also have facilitated management’s internal comparisons to Vistaprint’s historical performance and our competitors’ operating results. 98 |
 Non-GAAP Financial Measures Definitions 99 Non-GAAP Measure Definition Non-GAAP Net Income/EPS The items excluded from the non-GAAP adjusted net income measurements are share-based compensation expense and its related tax effect, amortization of acquisition-related intangibles, tax charges related to the alignment of acquisition-related intellectual property with global operations, changes in unrealized gains and losses on currency forward contracts, unrealized currency transaction gains and losses on intercompany financing arrangements and the related tax effect, the charge for the disposal of our minority investment in China, and the change in fair-value estimate of our potential acquisition-related earn-outs. Non-GAAP weighted average shares outstanding excludes the impact of unamortized share-based compensation included in the calculation of GAAP diluted weighted average shares outstanding. Free Cash Flow FCF = Cash Flow from Operations – Capital Expenditures – Purchases of Intangible assets not related to acquisitions – Capitalized Software Expenses Trailing Twelve Month Return on Invested Capital ROIC = NOPAT / (Debt + Equity – Excess Cash) Net operating profit after taxes (NOPAT) Excess cash is cash and investments of 5% of last twelve month revenues Operating leases have not been converted to debt Non-GAAP TTM ROIC excludes share-based compensation expense and its related tax effect, amortization of acquired intangibles, charges related to the alignment of Webs IP with our global operations, changes in unrealized gains and losses on currency forward contracts, and unrealized currency transaction gains and losses on intercompany financing arrangements and the related tax effect Excess cash definition updated in period ending 03/31/2013 and for prior periods. Constant-Currency Revenue Growth Constant-currency revenue growth is estimated by translating all non-U.S. dollar denominated revenue generated in the current period using the prior year period’s average exchange rate for each currency to the U.S. dollar and excludes the impact of gains and losses on effective currency hedges recognized in revenue in the prior year periods. Constant Currency Revenue Growth, excluding FY14 Acquisitions Constant-currency revenue growth excluding revenue from fiscal 2014 acquisitions excludes the impact of currency as defined above and revenue from People & Print Group and Pixartprinting. |
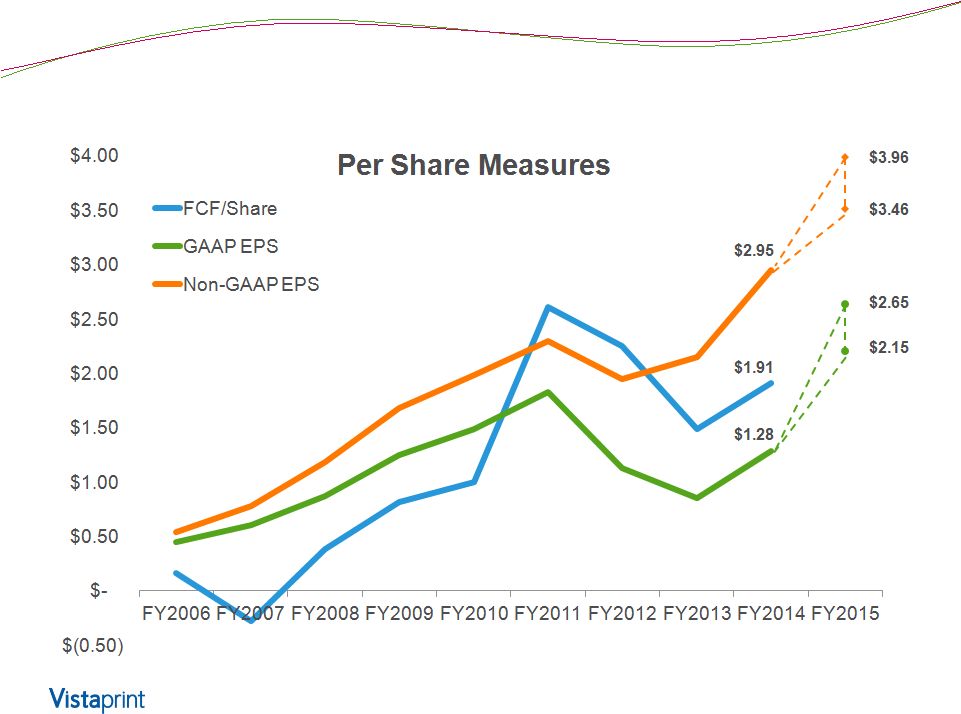
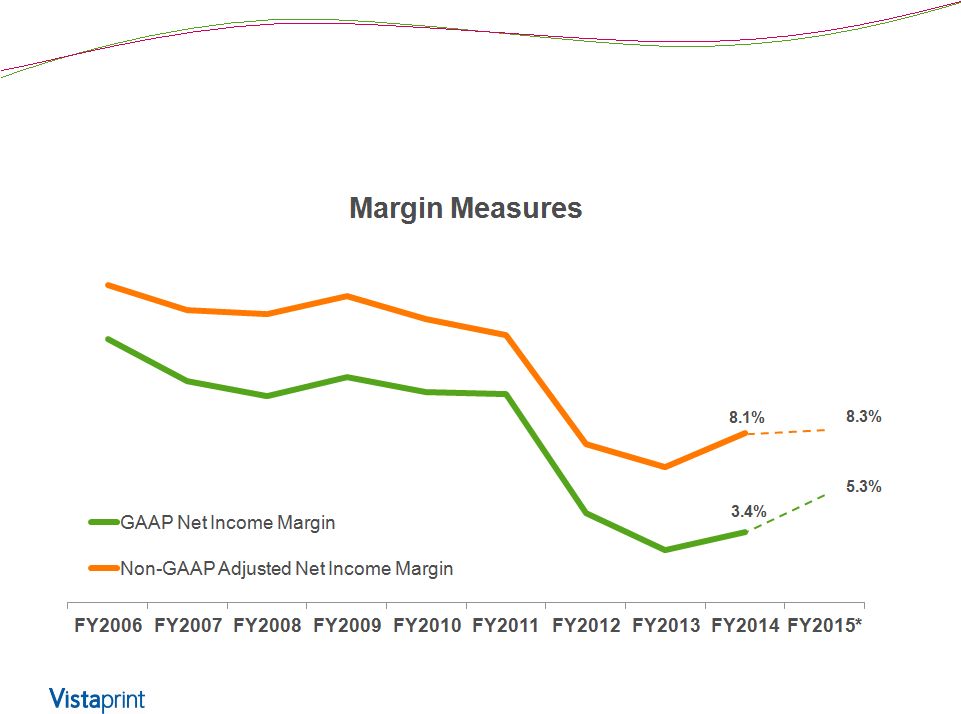
 Reconciliation: GAAP to Non-GAAP Results Net Income (Loss) – Annual ($ in thousands) FY 2006 FY 2007 FY 2008 FY 2009 FY2010 FY2011 FY2012 FY2013 FY2014 GAAP Net Income $19,234 $27,143 $39,831 $55,686 $67,741 $82,109 $43,994 $29,435 $43,696 Share-based compensation and related tax effect $4,850 $8,765 $15,275 $20,177 $23,156 $22,400 $26,060 $33,662 $28,520 Amortization of acquired intangible assets - - - - - - $5,754 $10,361 $12,187 Tax Impact of Webs IP transfer - - - - - - $1,235 $2,387 $2,320 Changes in unrealized (gain) loss on currency forward contracts included in net income $425 Unrealized currency transaction loss (gain) on intercompany loan and the related tax effect $585 Loss on disposal of Namex investment $12,681 Change in fair value of contingent consideration $2,192 Non-GAAP Adjusted Net Income $23,146 $35,908 $55,106 $75,863 $90,897 $104,509 $77,043 $75,845 $102,606 Revenue $152,149 $255,933 $400,657 $515,826 $670,035 $817,009 $1,020,269 $1,167,478 $1,270,236 GAAP Net Income as a percent of revenue 12.6% 10.6% 9.9% 10.8% 10.1% 10.0% 4.3% 2.5% 3.4% Non-GAAP Net Income as a percent of revenue 15.2% 14.0% 13.8% 14.7% 13.6% 12.8% 7.6% 6.5% 8.1% 100 |
 Reconciliation: GAAP to Non-GAAP Results Diluted Earnings Per Share - Annual FY 2006 FY 2007 FY 2008 FY 2009 FY2010 FY2011 FY2012 FY2013 FY2014 GAAP Net Income per share $0.45 $0.60 $0.87 $1.25 $1.49 $1.83 $1.13 $0.85 $1.28 Share-based Compensation and related tax effect per share $0.09 $0.18 $0.31 $0.43 $0.49 $0.47 $0.65 $0.95 $0.82 Amortization of acquired intangible assets per share - - - - - - $0.14 $0.29 $0.35 Tax Impact of Webs IP Transfer per share - - - - - - $0.03 $0.06 $0.06 Changes in unrealized (gain) loss on currency forward contracts included in net income per share $0.01 Unrealized currency transaction loss (gain) on intercompany loan and the related tax effect per share $0.01 Loss on disposal of Namex investment $0.36 Change in fair value of contingent consideration $0.06 Non-GAAP Adjusted Net Income per share $0.54 $0.78 $1.18 $1.68 $1.98 $2.30 $1.95 $2.15 $2.95 Weighted average shares used in computing Non- GAAP EPS (millions) 42.651 45.825 46.780 45.099 45.989 45.448 39.426 35.201 34.793 101 |
 Reconciliation: GAAP to Non-GAAP Results Free Cash Flow- Annual ($ in thousands, except share and per share amounts and as noted) FY 2006 FY 2007 FY 2008 FY 2009 FY2010 FY2011 FY2012 FY2013 FY2014 Net cash provided by operating activities $34,637 $54,240 $ 87,731 $120,051 $153,701 $162,634 $140,641 $140,012 $148,580 Purchase of property, plant, and equipment ($24.929) ($62,845) ($62,740) ($76,286) ($101,326) ($37,405) ($46,420) ($78,999) ($72,122) Purchases of intangible assets not related to acquisitions - - ($1,250) - - ($205) ($239) ($750) ($253) Capitalization of software and website development costs ($2,656) ($4,189) ($5,696) ($7,168) ($6,516) ($6,290) ($5,463) ($7,667) ($9,749) Free Cash Flow $7,052 ($12,794) $18,045 $ 36,597 $45,859 $118,734 $ 88,519 $52,596 $66,456 Weighted average shares used in computing Non- GAAP EPS* (millions) 42,651 45,825 46,780 45,099 45,989 45,448 39,426 35,201 34,793 Free cash flow per share $ 0.17 ($0.28) $0.39 $0.81 $1.00 $2.61 $2.25 $1.49 $1.91 *GAAP weighted average/diluted shares for the full year used in FY 2006 and FY 2007 calculations, as Non-GAAP share count is not available. 102 |
 Reconciliation: Constant-Currency/ex. Acquisition Revenue Growth Rates Quarterly ASIA-PACIFIC Q1 FY12 Q2 FY12 Q3 FY12 Q4 FY12 Q1 FY13 Q2 FY13 Q3 FY13 Q4 FY13 Q1 FY14 Q2 FY14 Q3 FY14 Q4 FY14 Reported revenue growth 67% 41% 47% 28% 28% 26% 6% 4% (11%) (5%) (3%) 3% Currency impact (22%) (4%) (7%) 5% 2% (3%) 4% 4% 13% 11% 13% 5% Revenue growth in constant currency 45% 37% 40% 33% 29% 24% 10% 8% 2% 6% 10% 8% EUROPE Q1 FY12 Q2 FY12 Q3 FY12 Q4 FY12 Q1 FY13 Q2 FY13 Q3 FY13 Q4 FY13 Q1 FY14 Q2 FY14 Q3 FY14 Q4 FY14 Reported revenue growth 31% 36% 29% 18% 12% 11% 8% 3% 6% 1% (4%) 50% Currency impact (10%) 1% 5% 12% 11% 2% 0% (1%) (4%) (3%) (3%) (7%) Revenue growth in constant currency 21% 37% 34% 30% 23% 14% 8% 2% 2% (2%) (7%) 43% Impact of FY14 acquisitions (45%) Revenue growth in constant currency ex. FY14 acquisitions (2%) 103 |
 Reconciliation: Constant-Currency/ex. Acquisition Revenue Growth Rates Quarterly NORTH AMERICA Q1 FY12 Q2 FY12 Q3 FY12 Q4 FY12 Q1 FY13 Q2 FY13 Q3 FY13 Q4 FY13 Q1 FY14 Q2 FY14 Q3 FY14 Q4 FY14 Reported revenue growth 17% 20% 23% 20% 22% 20% 15% 18% 14% 13% 2% 6% Currency impact 0% 0% 0% 0% 0% 0% 0% 0% 1% 1% 1% 1% Revenue growth in constant currency 17% 20% 23% 21% 22% 20% 15% 18% 15% 14% 3% 7% TOTAL COMPANY Q1 FY12 Q2 FY12 Q3 FY12 Q4 FY12 Q1 FY13 Q2 FY13 Q3 FY13 Q4 FY13 Q1 FY14 Q2 FY14 Q3 FY14 Q4 FY14 Reported revenue growth 25% 28% 26% 20% 18% 16% 12% 12% 9% 6% (1%) 21% Currency impact (5%) 0% 2% 5% 5% 1% 0% 0% 0% 0% 0% (2%) Revenue growth in constant currency 20% 28% 28% 25% 23% 17% 12% 12% 9% 6% (1%) 19% Impact of FY14 acquisitions (15%) Revenue growth in constant currency ex. FY14 acquisitions 4% 104 |
 Reconciliation: Constant-Currency /ex. Acquisition Revenue Growth Rates Annual FY2010 FY2011 FY2012 FY2013 FY2014 Reported revenue growth 30% 22% 25% 14% 9% Currency impact (favorable)/unfavorable (2%) - 0% 2% (1%) Revenue growth in constant currency 28% 22% 25% 16% 8% Impact of FY14 acquisitions to growth in constant currency (favorable)/unfavorable - - - - (4%) Revenue growth rate, ex FY2014 acquisitions, in constant currency 28% 22% 25% 16% 4% 105 |
 FY2014 North America Europe Asia-Pacific Total Company Reported revenue growth 9% 11% (4%) 9% Currency impact (favorable)/unfavorable - (4%) 10% (1%) Revenue growth in constant currency 9% 7% 6% 8% Impact of FY14 acquisitions to growth in constant currency (favorable)/unfavorable - (10%) - (4%) Revenue growth rate, ex 2014 acquisitions, in constant currency 9% (3%) 6% 4% Reconciliation: Constant-Currency/ex. Acquisition Revenue Growth Rates by Region Annual 106 |
 Revenue and EPS Guidance* (as of July 30, 2014) The Company is providing the following assumptions to facilitate non-GAAP adjusted net income per diluted share comparisons that exclude share-based compensation related expenses, amortization of acquired intangible assets, tax charges related to the alignment of IP with our global operations, changes in the fair-value estimate of acquisition-related earn-outs, changes in unrealized gains and losses on currency forward contracts, and unrealized currency transaction gains and losses on intercompany financing arrangements: FY15 ending 06/30/2015 Revenue $1,470 - $1,540 Revenue growth from FY 2014 period 16% - 21% Constant currency revenue growth estimate 15% - 20% GAAP EPS $2.15 - $2.65 EPS growth from FY 2014 period 68% -107% GAAP share count 33.3 million FY15 ending 06/30/2015 Non-GAAP adjusted EPS $3.46 - $3.96 EPS growth from FY 2014 period 17% – 34% Non-GAAP share count 33.8 million Non-GAAP exclusions $45.4 * Millions, except share and per share amounts and as noted 107 Consolidate d |
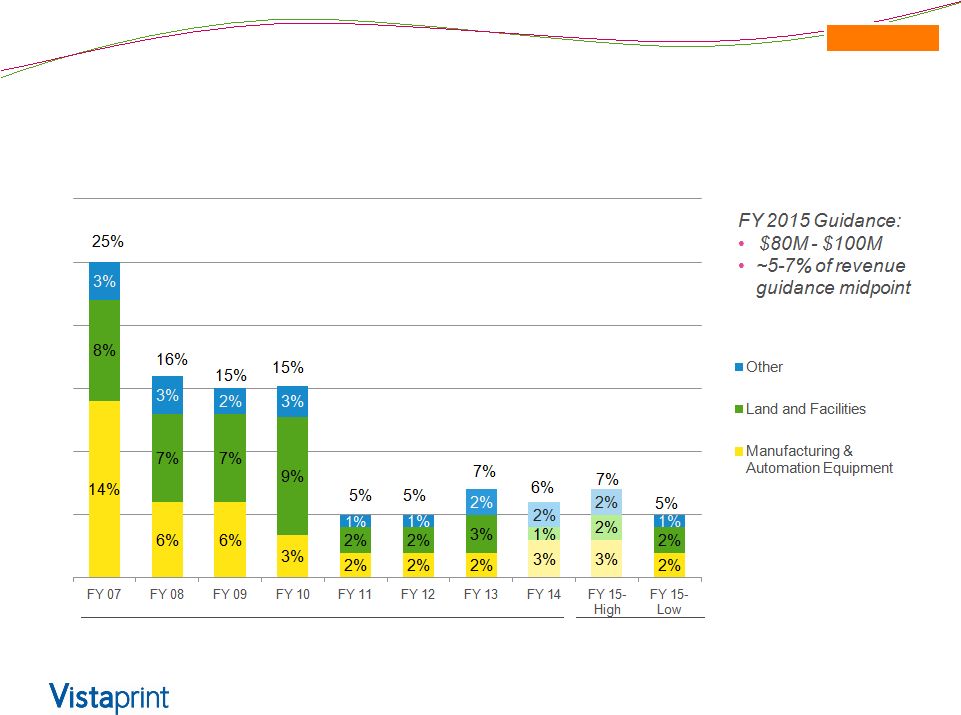 Capital Expenditures Guidance (as of July 30, 2014) Expressed as percent of revenue Actuals Guidance $63M $63M $76M $100M $80M $101M $37M Consolidate d $46M $79M $72M 108 |