 Q1 Fiscal Year 2015 Earnings presentation, commentary & financial results supplement October 29, 2014 Exhibit 99.2 |
 Safe Harbor Statement This presentation and the accompanying notes contains statements about our future expectations, plans and prospects of our business that constitute forward-looking statements for purposes of the safe harbor provisions under the Private Securities Litigation Reform Act of 1995, including but not limited to our expectations for the growth, development, and profitability of our business and our recent acquisitions and investments, the integration of our recent acquisitions, and our financial outlook and guidance set forth under the headings “FY2015 Outlook & Expectations,” “Revenue and EPS Guidance,” and “Capital Expenditures Guidance.” Forward-looking projections and expectations are inherently uncertain, are based on assumptions and judgments by management, and may turn out to be wrong. Our actual results may differ materially from those indicated by these forward-looking statements as a result of various important factors, including but not limited to flaws in the assumptions and judgments upon which our forecasts are based; our failure to execute our strategy; our inability to make the investments in our business that we plan to make; the failure of our strategy, investments, and efforts to reposition the Vistaprint brand to have the effects that we expect; our failure to promote and strengthen our brands; our failure to acquire new customers and enter new markets, retain our current customers, and sell more products to current and new customers; our failure to identify and address the causes of our revenue weakness; our failure to manage the complexity of our business and expand our operations; costs and disruptions caused by acquisitions and strategic investments; the failure of the businesses we acquire or invest in, including People & Print Group, Pixartprinting, FotoKnudsen, and Printi, to perform as expected; difficulties or higher than anticipated costs in integrating the systems and operations of our acquired businesses into our systems and operations; the willingness of purchasers of marketing services and products to shop online; the failure of our current and new marketing channels to attract customers; our failure to manage growth and changes in our organization; currency fluctuations that affect our revenues and costs including the impact of currency hedging strategies and intercompany transactions; unanticipated changes in our markets, customers, or business; competitive pressures; interruptions in or failures of our websites, network infrastructure or manufacturing operations; our failure to retain key employees; our failure to maintain compliance with the financial covenants in our revolving credit facility or to pay our debts when due; costs and judgments resulting from litigation; changes in the laws and regulations or in the interpretations of laws or regulations to which we are subject, including tax laws, or the institution of new laws or regulations that affect our business; general economic conditions; and other factors described in our Form 10-K for the fiscal year ended June 30, 2014 and the other documents we periodically file with the U.S. Securities and Exchange Commission. 2 |
 Presentation Organization & Call Details 3 • Q1 FY15 Overview • Q1 FY15 Operating and finance results • Supplementary information • Reconciliation of GAAP to non-GAAP Results Live Q&A Session: TOMORROW MORNING October 30, 2014 7:30 a.m. Eastern Link from the IR section of www.vistaprint.com Hosted by: Robert Keane President & CEO Ernst Teunissen EVP & CFO |
 Q1 FY15 Overview |
 Q1 FY 2015 Overview • Year-over-year revenue growth of 21% – Vistaprint brand growth rate accelerated slightly – Recent acquisitions performing well • Strong GAAP profitability helped by non-operational or timing related items • Non-GAAP EPS up 87% YoY • Continued progress against strategic goals 5 Consolidated Results Solid Start to the Year |
 • Continued to move value proposition toward needs of customers with higher expectations – New visual identity – Major site experience changes – New graphic design studio software – “Good, Better, Best” approach launched for US business cards – “Reinvent” pricing and marketing launch in France – Improved trends in UK, US, and Germany – Phased pricing and marketing changes in other European countries • Year-over-year improvements in Net Promoter Score™ and gross profit per customer • Continued product improvements with launch of market standard formats for flyers in non-US geographies 6 Vistaprint Business Unit |
 Other Businesses: Geographic Expansion 7 • Japan JV foundation building – Ending deep discount marketing practices – Learning from JV partner – Beginning construction of production facility • Strong growth in India off small base • $8.2M investment in Brazil – www.Printi.com.br – 41.6% minority interest |
 Other Businesses: Focused Brands • Continue to be be pleased with results – Strong growth – Clear market focus & differentiation – Engaged management teams – Belief in longer-term operational synergies 8 |
 Manufacturing & Technology 9 • Launched beta site for customized soft goods and apparel • Moved some People & Print Group production to Venlo facility • Supported expanded product availability in new locations • Continued to invest in talent and software technology to support a common mass customization platform |
 Q1 FY15 Financial & Operating Metrics |
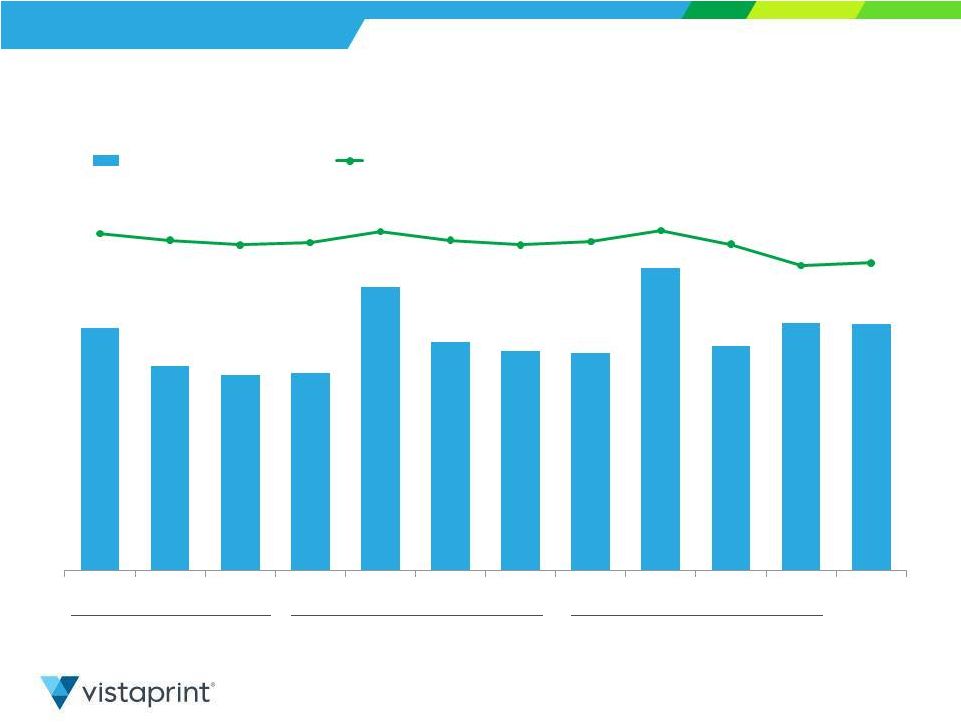
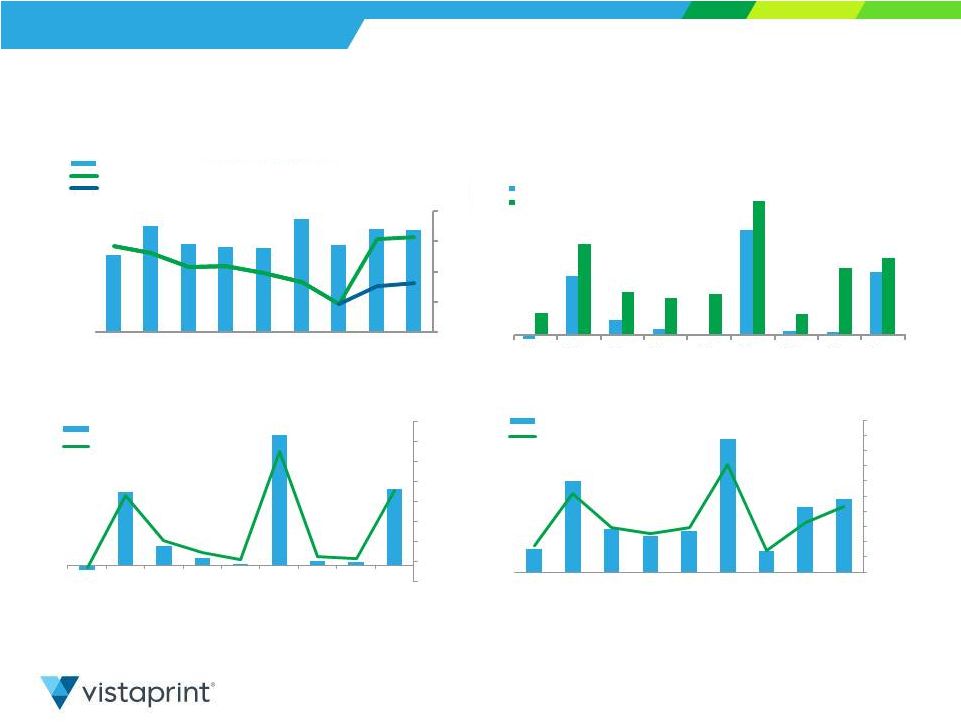 Q1 FY2015: Key Financial Metrics 11 Consolidated Results GAAP and Non-GAAP EPS Total Revenue GAAP Net Income (Loss) Non-GAAP Net Income In USD millions except per share data. Please see reconciliation to GAAP net income at the end of this presentation. PPG = People & Print Group PXP = Pixartprinting FTK = FotoKnudsen Q1 FY13 Q2 FY13 Q3 FY13 Q4 FY13 Q1 FY14 Q2 FY14 Q3 FY14 Q4 FY14 Q1 FY15 Q1 FY13 Q2 FY13 Q3 FY13 Q4 FY13 Q1 FY14 Q2 FY14 Q3 FY14 Q4 FY14 Q1 FY15 -$0.05 $0.66 $0.17 $0.07 $0.01 $1.18 $0.04 $0.03 $0.71 $0.25 $1.02 $0.48 $0.41 $0.46 $1.50 $0.24 $0.75 $0.86 GAAP EPS Non -GAAP EPS $251 $348 $288 $280 $275 $371 $286 $338 $334 - 10% 0% 10% 20% 30% Total Revenue (reported) Year-over-Year Growth Year-over-Year growth excl. PPG, PXP & FTK $(2) $23 $6 $2 $0 $41 $1 $1 $24 Q1 FY13 Q2 FY13 Q3 FY13 Q4 FY13 Q1 FY14 Q2 FY14 Q3 FY14 Q4 FY14 Q1 FY15 GAAP Net Income GAAP Net Income Margin Q1 FY13 Q2 FY13 Q3 FY13 Q4 FY13 Q1 FY14 Q2 FY14 Q3 FY14 Q4 FY14 Q1 FY15 0% 2% 4% 6% 8% 10% 12% 14% 16% 18% 20% $9 $36 $17 $14 $16 $53 $8 $26 $29 Non-GAAP Net Income Non-GAAP Net Income Margin 0% 2% 4% 6% 8% 10% 12% 14% -2% |
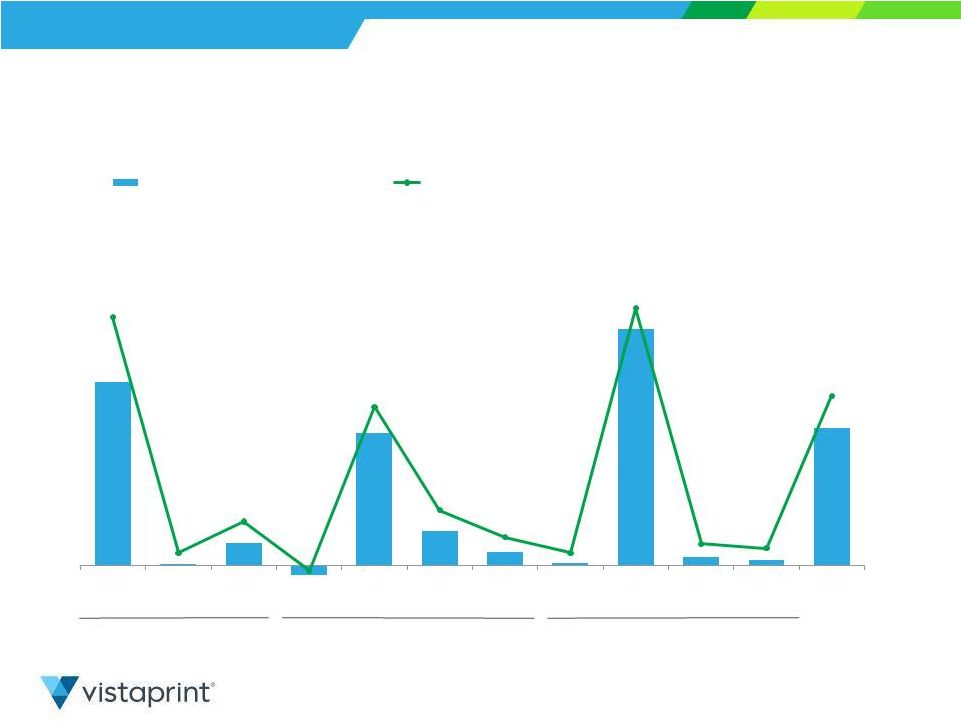
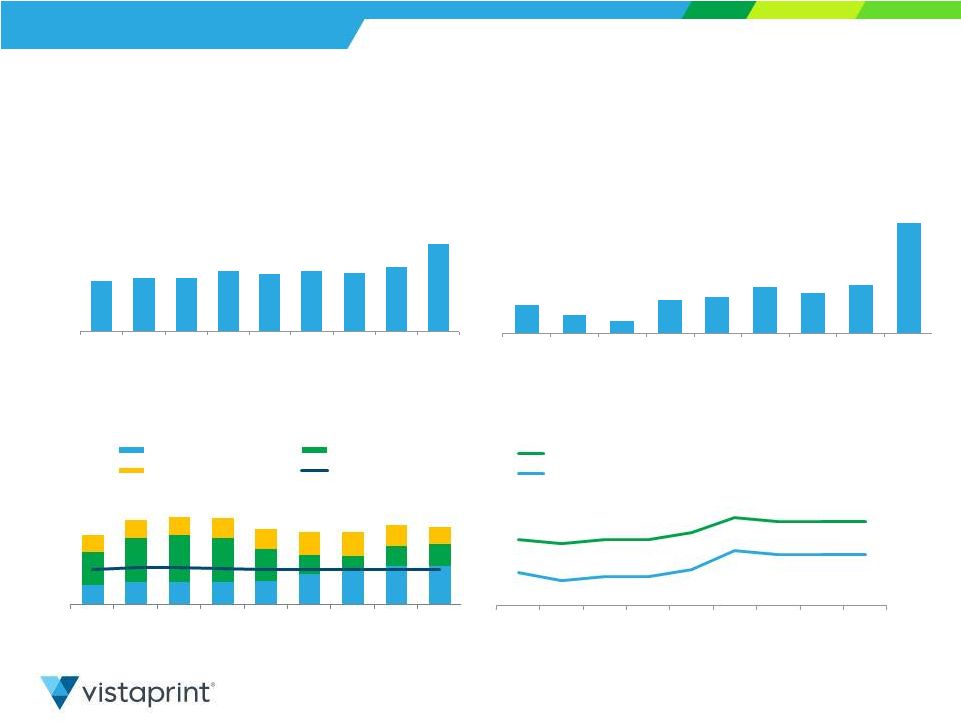 Cash Flow and ROIC Highlights 12 TTM Free Cash Flow TTM Cash Flow from Operations TTM Capital Expenditures TTM Return on Invested Capital (In millions) Consolidated Results $63 $77 $80 $79 $69 $66 $66 $72 $71 In USD millions except percentages. Please see reconciliation of non-GAAP measures at the end of this presentation. $117 $124 $123 $140 $133 $140 $135 $149 $201 Q1 FY13 Q2 FY13 Q3 FY13 Q4 FY13 Q1 FY14 Q2 FY14 Q3 FY14 Q4 FY14 Q1 FY15 $48 $41 $35 $53 $55 $64 $58 $66 $118 Q1 FY13 Q2 FY13 Q3 FY13 Q4 FY13 Q1 FY14 Q2 FY14 Q3 FY14 Q4 FY14 Q1 FY15 6% 7% 7% 7% 6% 5% 5% 6% 5% Q1 FY13 Q2 FY13 Q3 FY13 Q4 FY13 Q1 FY14 Q2 FY14 Q3 FY14 Q4 FY14 Q1 FY15 Mfg & Automation Land & Facilities Other % of revenue 18% 17% 18% 18% 20% 24% 23% 23% 23% 9% 7% 8% 8% 10% 15% 14% 14% 14% Q1 FY13 Q2 FY13 Q3 FY13 Q4 FY13 Q1 FY14 Q2 FY14 Q3 FY14 Q4 FY14 Q1 FY15 TTM Non -GAAP ROIC TTM GAAP ROIC |
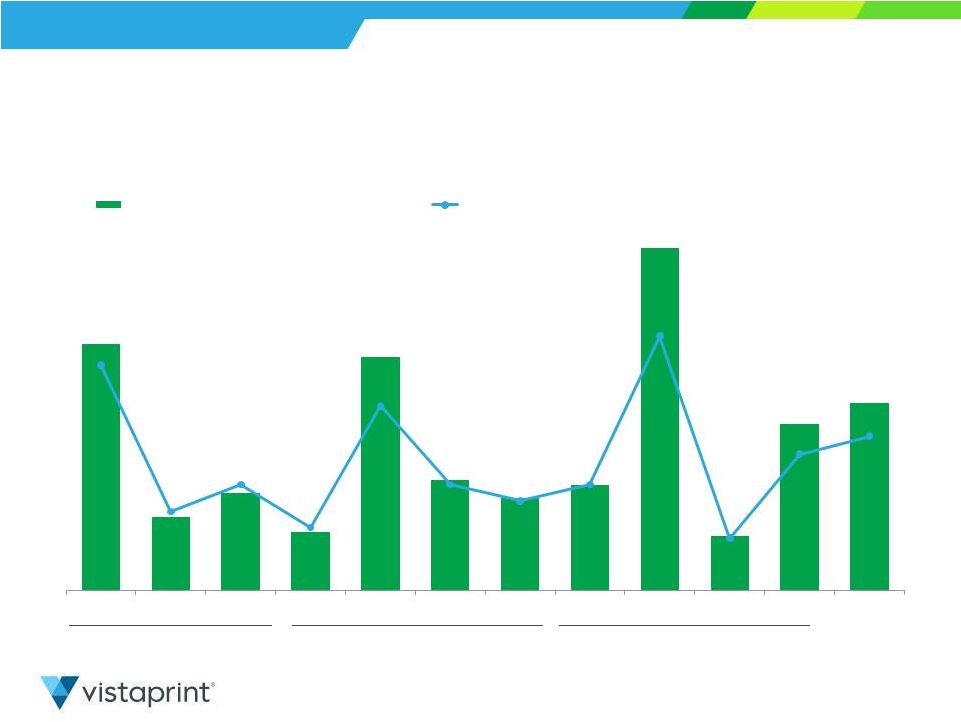
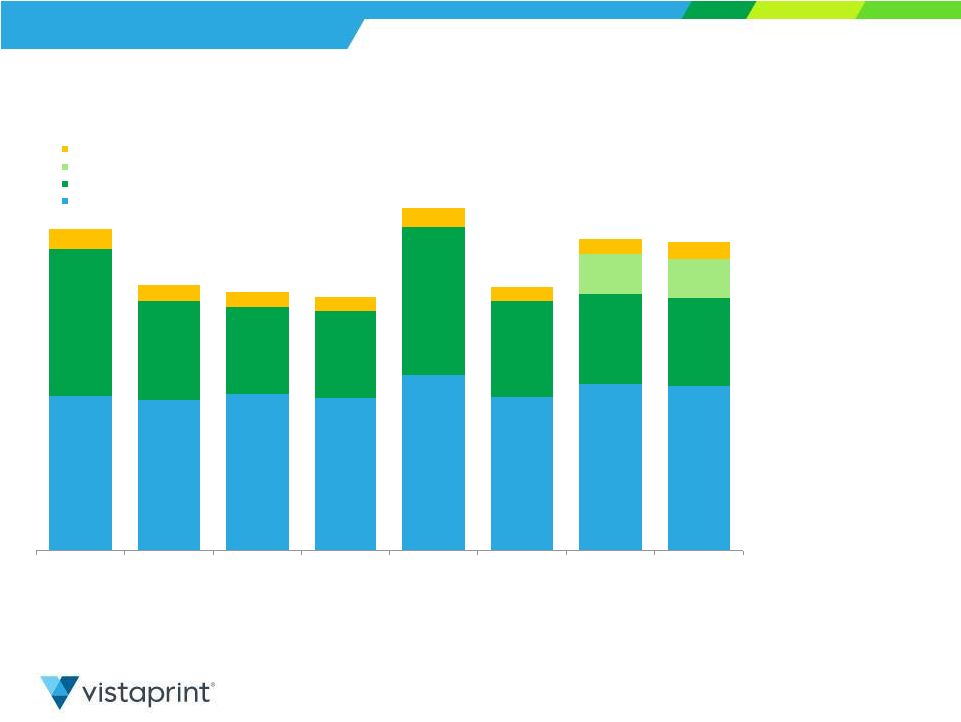 Geographic Region Revenue – Quarterly (millions) 13 Consolidated Results North America: 53% of total revenue 8% y/y growth 8% y/y constant currency growth Europe: 42% of total revenue 46% y/y growth 45% y/y constant currency growth 1% y/y constant currency growth ex. acquisitions from past year Asia Pacific: 5% of total revenue 14% y/y growth 13% y/y constant currency growth All People & Print Group, Pixartprinting, FotoKnudsen, and Albumprinter revenue included in European region. All Webs revenue included in North American region. All Japan JV revenue included in Asia-Pacific region. Please see reconciliation to reported revenue growth rates at the end of this presentation. Q1 FY2015 $167.5 $163.0 $169.6 $164.8 $189.4 $166.1 $179.9 $177.7 $159.3 $108.3 $94.9 $94.7 $161.0 $104.2 $98.6 $96.5 $43.6 $41.9 $21.5 $16.4 $15.6 $15.6 $20.3 $15.9 $16.1 $17.8 Q2 FY13 Q3 FY13 Q4 FY13 Q1 FY14 Q2 FY14 Q3 FY14 Q4 FY14 Q1 FY15 Asia-Pacific People & Print Group, Pixartprinting & FotoKnudsen Europe North America |
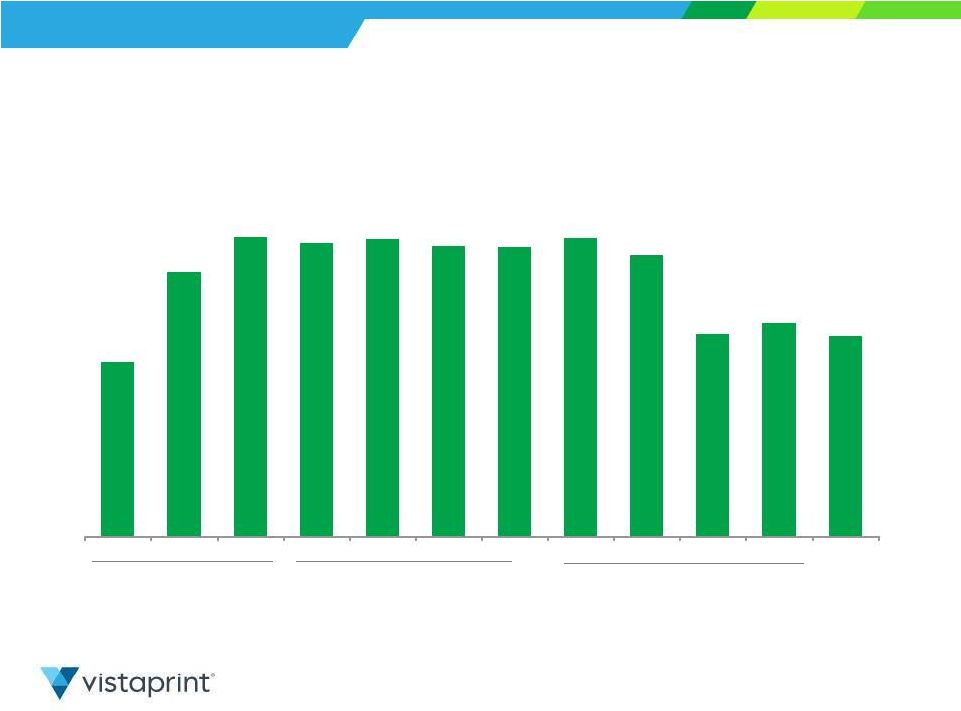
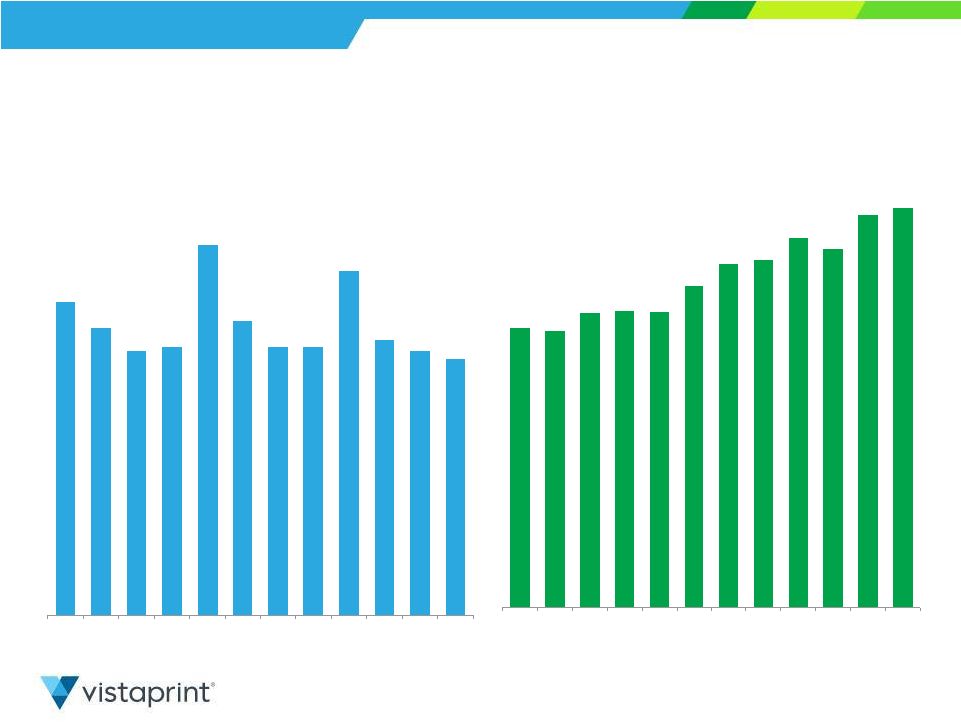 Operational Metrics 14 Vistaprint, Albumprinter and Webs Brands Excludes People & Print Group, Pixartprinting and FotoKnudsen *Albumprinter and Webs included starting Q3FY12 Also starting in the same period, a minor calculation methodology change was made in order to accommodate the consolidation of metrics. $43.32 8.3 7.6 7.0 7.1 9.8 7.8 7.1 7.1 9.1 7.3 7.0 6.8 Q2 FY12 Q3 FY12* Q4 FY12 Q1 FY13 Q2 FY13 Q3 FY13 Q4 FY13 Q1 FY14 Q2 FY14 Q3 FY14 Q4 FY14 Q1 FY15 Orders (M) $34.61 $34.43 $35.69 $35.79 $35.72 $37.56 $39.08 $39.40 $40.92 $40.14 $42.50 Q2 FY12 Q3 FY12* Q4 FY12 Q1 FY13 Q2 FY13 Q3 FY13 Q4 FY13 Q1 FY14 Q2 FY14 Q3 FY14 Q4 FY14 Q1 FY15 Average Order Value |
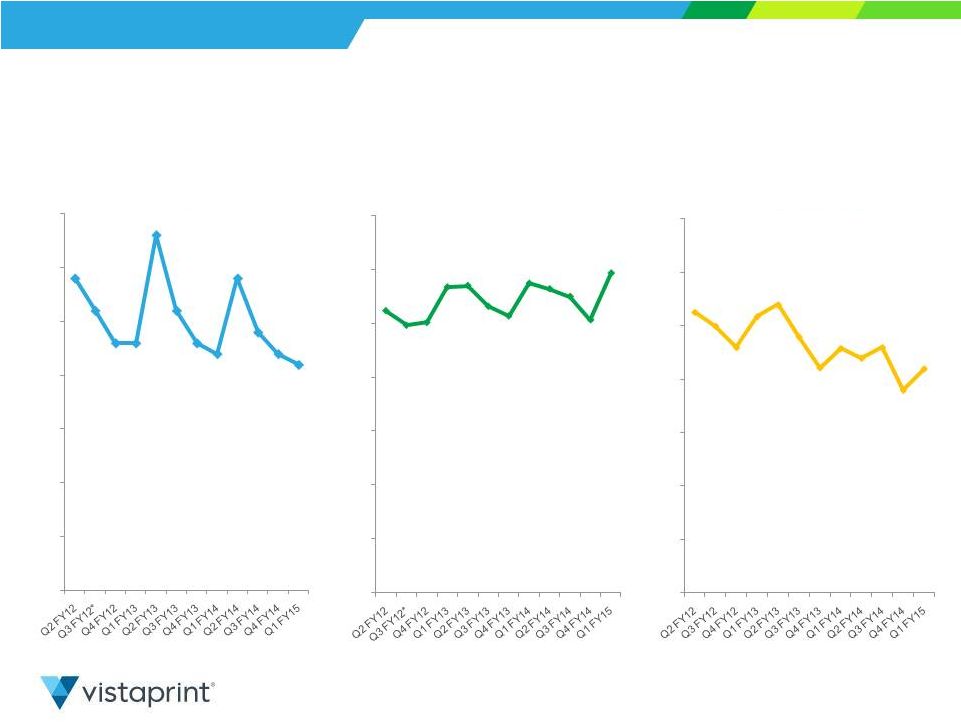 Operational Metrics 15 Vistaprint, Albumprinter and Webs Brands Excludes People & Print Group, Pixartprinting and FotoKnudsen *Albumprinter and Webs included starting Q3FY12 Also starting in the same period, a minor calculation methodology change was made in order to accommodate the consolidation of metrics. 2.9 2.6 2.3 2.3 3.3 2.6 2.3 2.2 2.9 2.4 2.2 2.1 0.0 0.5 1.0 1.5 2.0 2.5 3.0 3.5 New Customers (millions) $26 $25 $25 $28 $28 $27 $26 $29 $28 $27 $25 $30 0 $ 5 $ 10 $ 15 $ 20 $ 25 $ 30 $ 35 $ Implied COCA 26% 25% 23% 26% 27% 24% 21% 23% 22% 23% 19% 21% 0% 5% 10% 15% 20% 25% 30% 35% Advertising as % of Revenue |
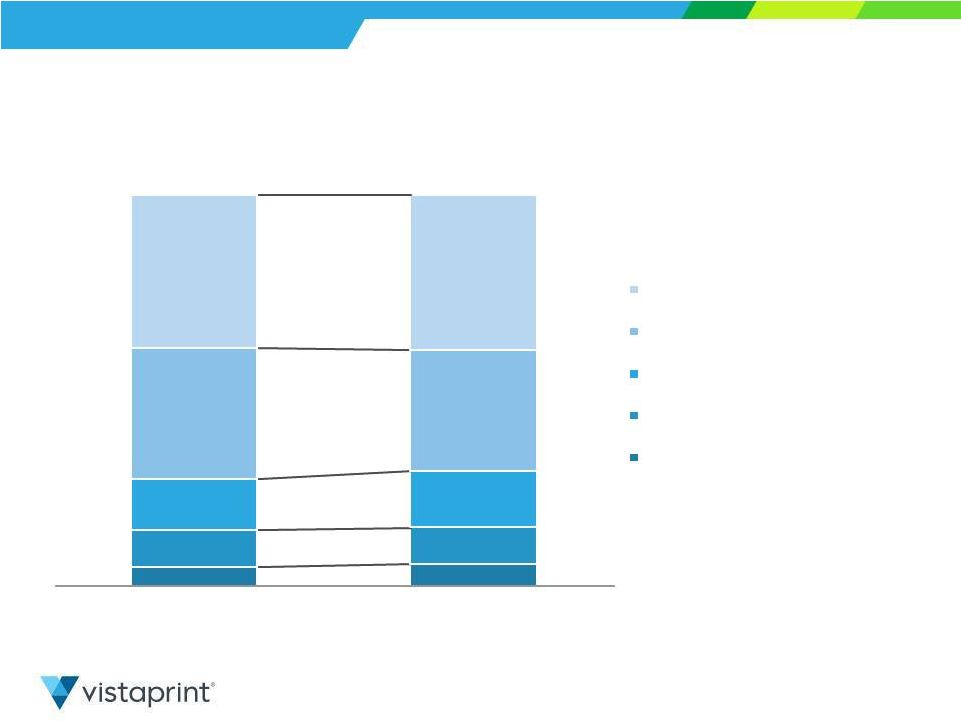
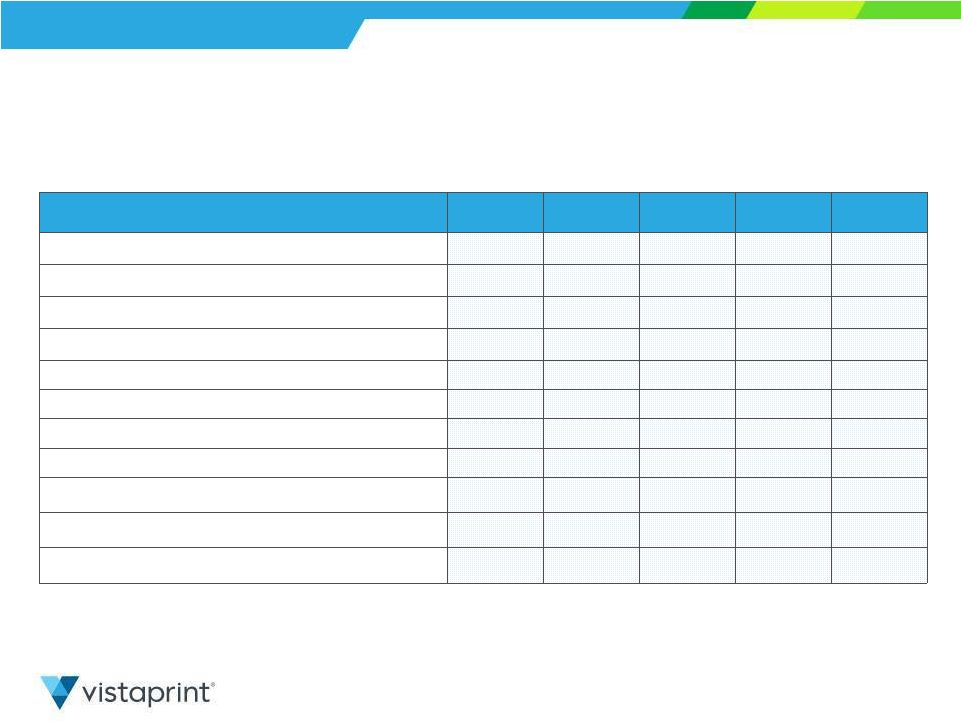
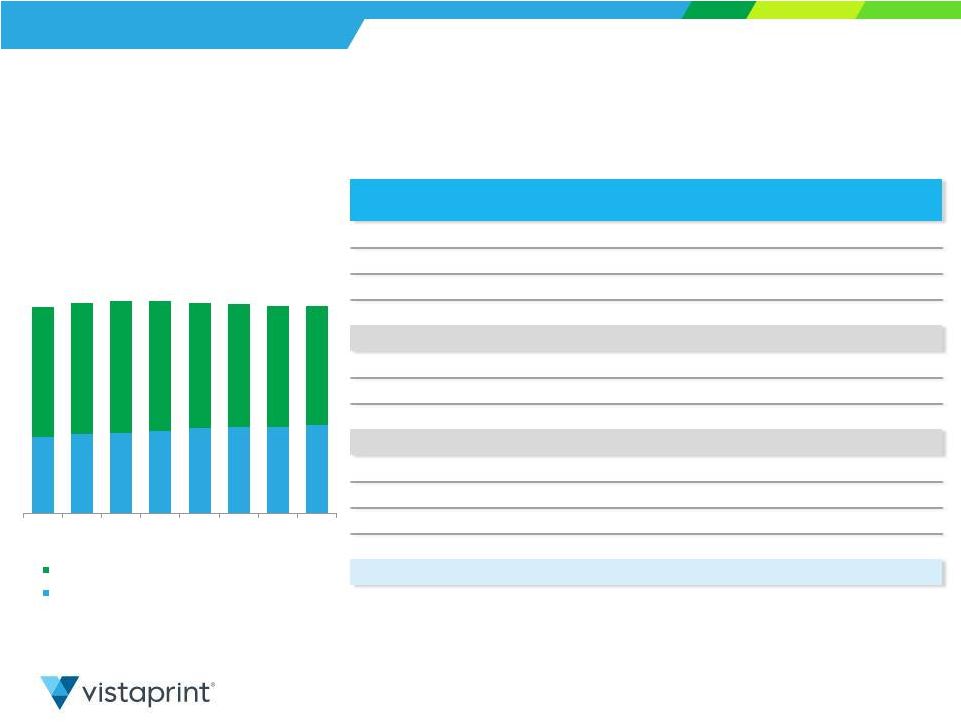 Historical Revenue Driver Metrics 16 Vistaprint, Albumprinter and Webs Brands Excludes People & Print Group, Pixartprinting and FotoKnudsen 16.9 *trailing twelve month at period end 16.8 16.6 17.0 17.1 16.9 16.7 16.7 6.1 6.4 6.5 6.7 6.9 7.0 7.0 7.1 10.5 10.5 10.5 10.4 10.0 9.8 9.7 9.6 Q2 FY13 Q3 FY13 Q4 FY13 Q1 FY14 Q2 FY14 Q3 FY14 Q4 FY14 Q1 FY15 TTM* Unique Customers (M) New Customers Aquired in Period Customers Repeating from Prior Periods Q2 FY13 Q3 FY13 Q4 FY13 Q1 FY14 Q2 FY14 Q3 FY14 Q4 FY14 Q1 FY15 TTM Unique Customers (M) 16.6 16.9 17.0 17.1 16.9 16.8 16.7 16.7 TTM New Customers (M) 10.5 10.5 10.5 10.4 10.0 9.8 9.7 9.6 TTM Repeating Customers (M) 6.1 6.4 6.5 6.7 6.9 7.0 7.0 7.1 As % of Unique Customers TTM New Customers 63% 62% 62% 61% 59% 58% 58% 57% TTM Repeating Customers 37% 38% 38% 39% 41% 42% 42% 43% Y/Y Growth TTM Unique Customers 29% 19% 13% 8% 2% -1% -2% -2% TTM New Customers 25% 15% 9% 3% -5% -7% -8% -8% TTM Repeating Customers 37% 25% 20% 18% 13% 9% 8% 6% Implied Retention** 48% 45% 43% 42% 42% 41% 41% 42% **TTM repeating customers as % of year-ago unique customers Starting in Q3 FY12, impact of Albumprinter and Webs has been included. |
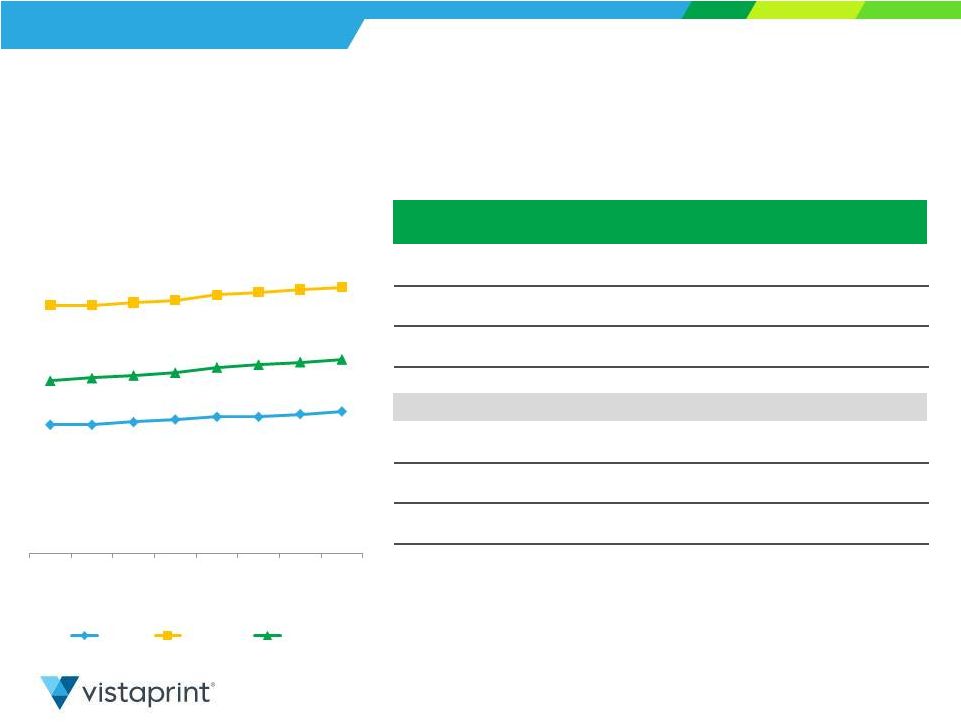 Historical Revenue Driver Metrics 17 Vistaprint, Albumprinter and Webs Brands Excludes People & Print Group, Pixartprinting and FotoKnudsen Average Customer Bookings: *trailing twelve month at period end Q2 FY13 Q3 FY13 Q4 FY13 Q1 FY14 Q2 FY14 Q3 FY14 Q4 FY14 Q1 FY15 Average TTM Bookings per Unique Customer $67 $68 $69 $70 $72 $73 $74 $75 Average TTM Bookings per New Customer $50 $50 $51 $52 $53 $53 $54 $55 Average TTM Bookings per Repeat Customer $96 $96 $97 $98 $100 $101 $102 $103 Y/Y Growth Average TTM Bookings per Unique Customer -6% -1% 1% 4% 7% 7% 7% 7% Average TTM Bookings per New Customer -6% -2% 0% 4% 6% 6% 6% 6% Average TTM Bookings per Repeat Customer -4% -3% -1% 1% 4% 5% 5% 5% $50 $50 $51 $52 $53 $53 $54 $55 $96 $96 $97 $98 $100 $101 $102 $103 $67 $68 $69 $70 $72 $73 $74 $75 Q2 FY13 Q3 FY13 Q4 FY13 Q1 FY14 Q2 FY14 Q3 FY14 Q4 FY14 Q1 FY15 Average TTM* Bookings Per Unique Customer (USD) New Repeat Total Starting in Q3 FY12, impact of Albumprinter and Webs has been included. |
 Looking Ahead |
 FY 2015 Outlook & Expectations 19 Operationally unchanged outlook – Vistaprint brand revenue growth mid-to-high single digits – Acquired company revenue growth in double-digits – Expansion of operating margins, EPS and free cash flow Non-operational changes to guidance ranges: – Revenue guidance range lowered by $40M to reflect currency movements since July – Would be largely offset by natural hedges and below-the-line currency gains if currency rates remain at recent 30-day average – GAAP EPS range increased by $0.09, updated to reflect: » Change in fair-value estimate of acquisition-related earn-outs » Change in acquisition-related amortization of intangibles » Estimated unrealized currency gain on revaluing intercompany loans Non-GAAP EPS guidance unchanged 19 |
 FY 2015 Outlook & Expectations (cont.) Guidance does not include: – Potential for further changes in fair value estimate of acquisition-related earn-outs – Potential for increased interest expense resulting from further financing activity – Estimate for impact of consolidating results of minority investment Printi LLC 20 20 |
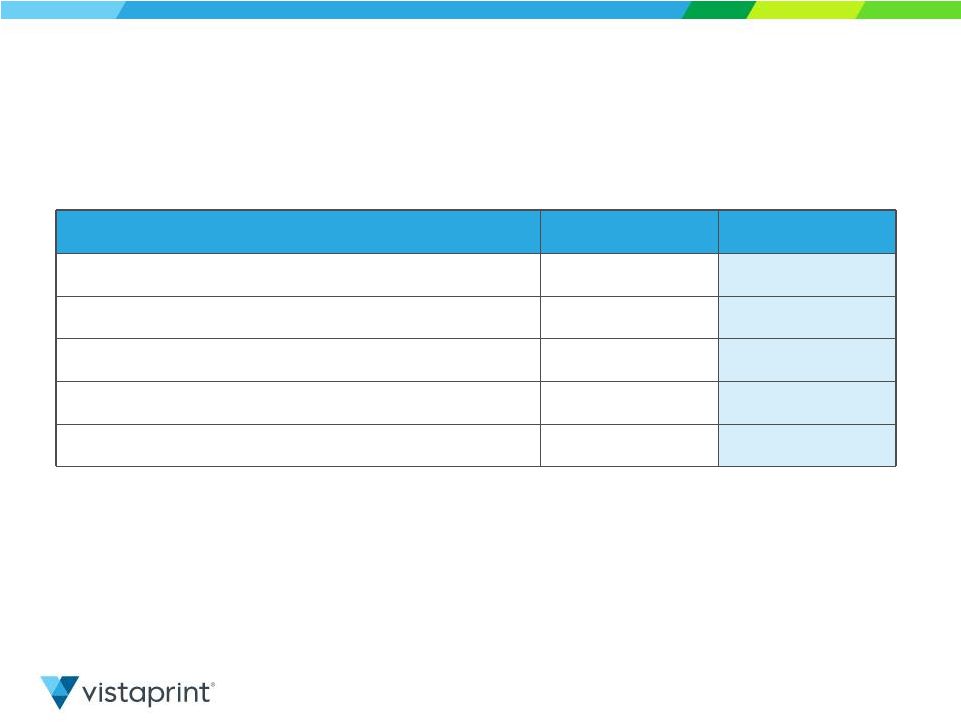
 Revenue and EPS Guidance* The Company is providing the following assumptions to facilitate non-GAAP adjusted net income per diluted share comparisons that exclude share-based compensation related expenses, amortization of acquired intangible assets, tax charges related to the alignment of IP with our global operations, changes in the fair-value estimate of acquisition-related earn-outs, changes in unrealized gains and losses on currency forward contracts, and unrealized currency transaction gains and losses on intercompany financing arrangements: As of October 29, 2014 FY15 ending 06/30/2015 Revenue $1,430 - $1,500 million Revenue growth from FY 2014 period 13% - 18% Constant currency revenue growth estimate 15% - 20% GAAP EPS $2.24 - $2.74 EPS growth from FY 2014 period 75% -114% GAAP share count 33.3 million FY15 ending 06/30/2015 Non-GAAP adjusted EPS $3.46 - $3.96 EPS growth from FY 2014 period 17% – 34% Non-GAAP share count 33.8 million Non-GAAP exclusions $42.5 million * Millions, except share and per share amounts and as noted 21 Consolidated 21 |
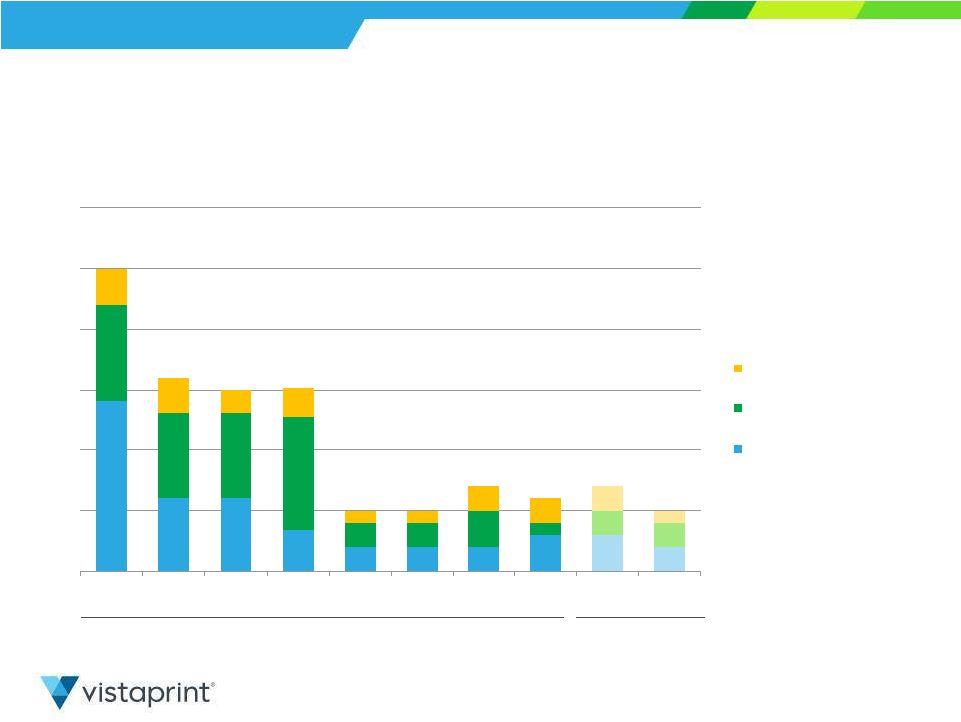 14% 6% 6% 3% 2% 2% 2% 3% 3% 2% 8% 7% 7% 9% 2% 2% 3% 1% 2% 2% 3% 3% 2% 3% 1% 1% 2% 2% 2% 1% FY 07 FY 08 FY 09 FY 10 FY 11 FY 12 FY 13 FY 14 FY 15- High FY 15- Low Other Land and Facilities Manufacturing & Automation Equipment 25% 16% 15% 5% 6% 15% 5% 7% 7% 5% Capital Expenditures Guidance Consolidated as of October 29, 2014 (expressed as percent of revenue) FY 2015 Guidance: • $80M - $100M Actuals Guidance $63M $63M $76M $100M $80M $101M $37M $46M $79M $72M 22 22 • ~5-7% of revenue guidance midpoint |
 Summary Clear priorities » Leadership: become the world leader in mass customization • Passionate about enabling millions of customers to make an impression • Strive to be best in the world at computer-integrated manufacturing • Drive economic engine through large scale in small quantities » Long termism: multi-decade mutual success for stakeholders » Intrinsic value: maximizing DCF per share Q1 a good start to FY15 » Important investments across the business » Beginning to see wider-spread benefits of Vistaprint brand repositioning » Financial results in line with our expectations Annual meeting for shareholders on November 12, 2014 – Proposal on name change for corporate parent to Cimpress N.V. – If shareholders approve the change, we expect to change our name and ticker symbol, and launch a new corporate website at www.cimpress.com 23 |
 Q&A Session Please go to the Investor Relations section of www.vistaprint.com for the live Q&A call at 7:30 am EDT on October 30, 2014 |
 Q1 Fiscal Year 2015 Financial and Operating Results Supplement |
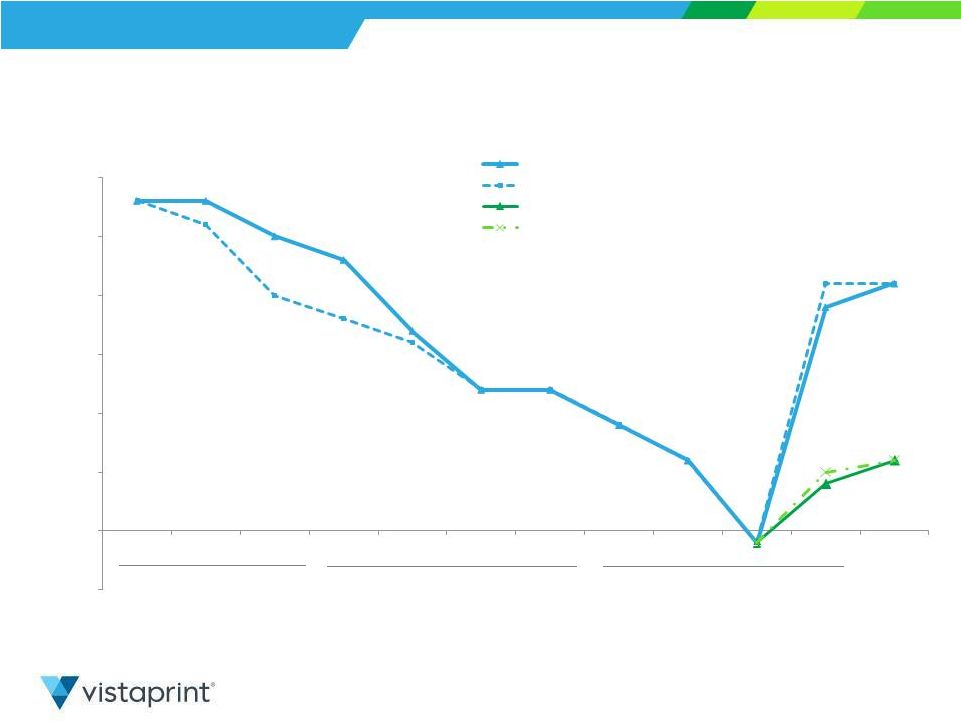 Revenue Growth Rates* 26 Consolidated *All acquisitions included as of acquisition dates. Please see reconciliation to reported revenue growth rates at the end of this presentation. 21% reported and constant- currency FY12 25% constant-currency growth FY13 16% constant-currency growth FY14 8% constant-currency growth -5% 0% 5% 10% 15% 20% 25% 30% Q2 FY12 Q3 FY12 Q4 FY12 Q1 FY13 Q2 FY13 Q3 FY13 Q4 FY13 Q1 FY14 Q2 FY14 Q3 FY14 Q4 FY14 Q1 FY15 6% reported and constant- currency Constant-Currency Reported Constant-Currency Excl. PPG, PXP & FTK Reported Excl. PPG, PXP & FTK |
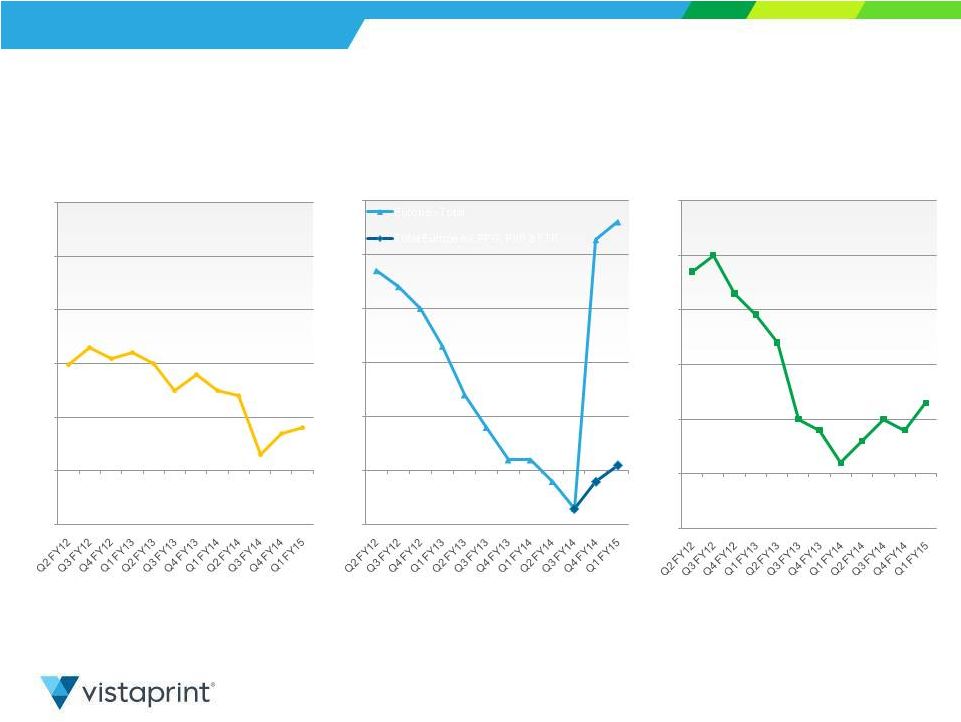 Geographic Region Revenue Growth Rates* Consolidated Constant Currency *All acquisitions included as of acquisition dates. Please see reconciliation to reported revenue growth rates at the end of this presentation. 27 27 20% 23% 21% 22% 18% 15% 14% 3% 7% 8% -10% 0% 10% 20% 30% 40% 50% North America 15% 37% 34% 30% 23% 14% 8% 2% 2% -2% -7% 46% -2% 1% -10% 0% 10% 20% 30% 40% 50% Europe Europe - Total Total Europe ex. PPG, PXP & FTK 43% 37% 40% 33% 29% 24% 10% 8% 2% 6% 10% 8% -10% 0% 10% 20% 30% 40% 50% APAC 13% 20% |
 Gross Margin and Gross Profit Consolidated FY12 65.2% FY13 65.7% FY14 64.5% 28 28 $200 $169 $162 $163 $234 $189 $181 $179 $250 $185 $205 $204 66.8% 65.5% 64.6% 65.0% 67.2% 65.5% 64.6% 65.2% 67.4% 64.7% 60.5% 61.0% Q2 FY12 Q3 FY12 Q4 FY12 Q1 FY13 Q2 FY13 Q3 FY13 Q4 FY13 Q1 FY14 Q2 FY14 Q3 FY14 Q4 FY14 Q1 FY15 Gross Profit (millions) GM % |
 GAAP Net Income (Loss) and Net Margin 29 Consolidated FY12 $44 FY13 $29 FY14 $44 $32 $0 $4 $(2) $23 $6 $2 $0 $41 $1 $1 $24 10.6% 0.1% 1.5% -0.7% 6.6% 2.0% 0.8% 0.1% 11.0% 0.5% 0.3% 7.1% Q2 FY12 Q3 FY12 Q4 FY12 Q1 FY13 Q2 FY13 Q3 FY13 Q4 FY13 Q1 FY14 Q2 FY14 Q3 FY14 Q4 FY14 Q1 FY15 GAAP Net Income (loss), in millions GAAP Net Margin |
 Non-GAAP Adjusted Net Income* & Non-GAAP Adjusted Net Margin* Consolidated *Please see reconciliation of non-GAAP measures at the end of this presentation. FY12 $77 FY13 $76 FY14 $103 30 30 $11 $15 $9 $36 $17 $14 $16 $53 $8 $26 $29 12.6% 4.4% 5.9% 3.5% 10.3% 5.9% 5.0% 5.9% 14.2% 2.9% 7.6% 8.6% Q2 FY12 Q3 FY12 Q4 FY12 Q1 FY13 Q2 FY13 Q3 FY13 Q4 FY13 Q1 FY14 Q2 FY14 Q3 FY14 Q4 FY14 Q1 FY15 Non-GAAP Adjusted Net Income (millions) Non-GAAP Adjusted Net Margin $38 |
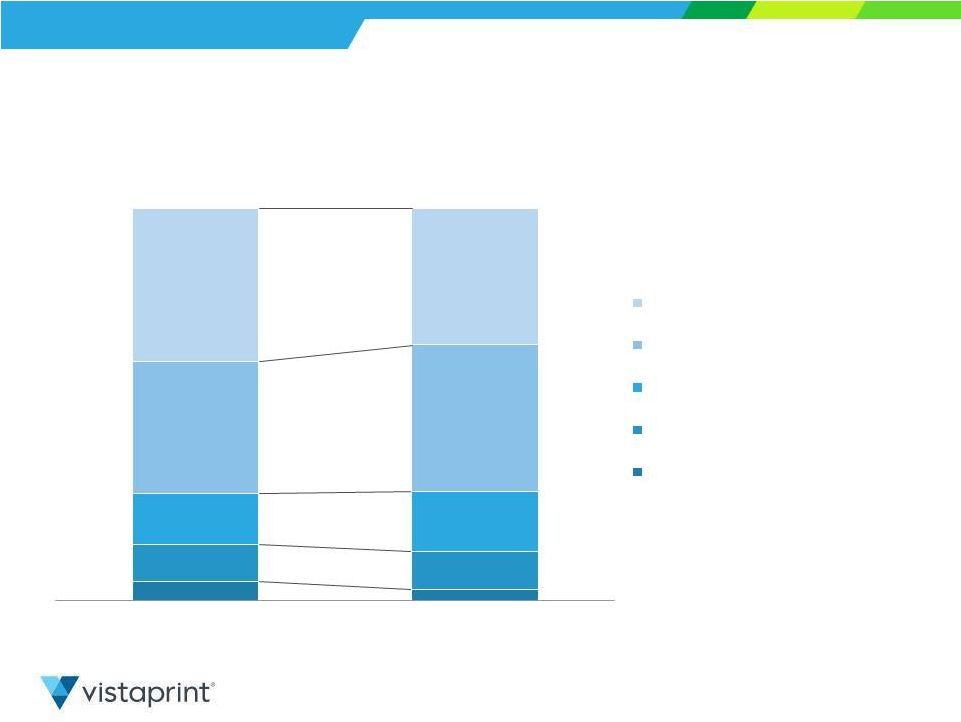 Q1 Income Statement Comparison to Prior Year Consolidated (as a percentage of revenue) 31 31 5.1% 3.1% 9.3% 9.5% 13.1% 15.4% 33.5% 37.2% 39.0% 34.8% Q1 FY2015 Q1 FY2014 Cost of revenue Marketing and selling Technology and development General and administrative Income from operations |
 Q1 Income Statement Comparison to Prior Quarter 32 Consolidated (as a percentage of revenue) Q1 FY2015 Q4 FY2014 5.1% 5.8% 9.3% 9.3% 13.1% 14.4% 33.5% 31.0% 39.0% 39.5% Cost of revenue Marketing and selling Technology and development General and administrative Income from operations |
 Share-Based Compensation* (millions) 33 Consolidated * Share-based compensation (SBC) expense includes SBC-related tax adjustment. The period from Q3 FY12 to Q2 FY14 includes expense related to the RSA grants as part of the Webs acquisition. FY12 $26.1 FY13 $33.7 FY14 $28.5 $5.0 $7.6 $8.6 $8.4 $8.5 $8.4 $8.3 $8.6 $8.1 $5.8 $6.1 $5.8 Q2 FY12 Q3 FY12 Q4 FY12 Q1 FY13 Q2 FY13 Q3 FY13 Q4 FY13 Q1 FY14 Q2 FY14 Q3 FY14 Q4 FY14 Q1 FY15 |
 Balance Sheet Highlights Balance Sheet highlights, in millions, at period end 09/30/2014 06/30/2014 03/31/2014 12/31/2013 09/30/2013 Total assets $984.1 $989.0 $672.0 $674.6 $638.7 Cash and cash equivalents $60.9 $62.5 $46.5 $62.3 $64.7 Total current assets $144.3 $157.9 $126.0 $135.5 $121.8 Goodwill and intangible assets $426.7 $427.4 $169.2 $171.6 $171.5 Total liabilities $757.9 $745.4 $393.9 $414.4 $432.0 Current liabilities $218.9 $241.5 $177.4 $197.9 $144.3 Long-term debt $433.5 $410.5 $185.6 $189.3 $262.5 Shareholders’ Equity attributable to Vistaprint NV $211.8 $232.5 $272.4 $260.3 $206.7 Treasury shares (in millions) 11.6 11.8 10.8 10.9 11.0 Consolidated 34 34 |
 Committed Credit Capacity as of September 30, 2014 Availability under our committed credit facility (millions)* 09/30/14 Aggregate loan commitments $850.0 Outstanding borrowings $(440.0) Remaining amount $410.0 Limitations to borrowing due to debt covenants and other obligations* $(141.8) Amount available for borrowing as of September 30, 2014 $268.1 Consolidated * Our borrowing ability under our committed credit facility can be limited by our debt covenants each quarter. These covenants may limit our borrowing capacity depending on our leverage, other senior indebtedness, such as capital leases, letters of credit, and other debt secured by a lien, and other factors that are outlined in our credit agreement filed as an exhibit in our Form 8-Ks filed on February 13, 2013, January 22, 2014, and September 25, 2014. • Aggregate loan commitments of $850.0M • Interest rate of LIBOR plus 1.50% - 2.25%, depending on leverage • Currently in compliance with all covenants. Key financial covenants are: – Total leverage ratio not to exceed 4.5x TTM EBITDA – Senior leverage ratio not to exceed 3.25x TTM EBITDA – Interest coverage ratio of at least 3.0x TTM EBITDA • Purchases of our ordinary shares, payments of dividends, and mergers and acquisitions are subject to more restrictive total leverage ratio thresholds than those listed above when calculated on a proforma basis. Also, our credit agreement limits the amount of purchases of our ordinary shares, payments of dividends, mergers and acquisitions, investments in joint ventures or minority interests, consolidated capital expenditures, and other investments that we may desire to make. These limitations can include annual limits that vary from year-to-year and aggregate limits over the term of the credit facility. Therefore, our ability to make desired investments may be limited during the term of our revolving credit facility. 35 |
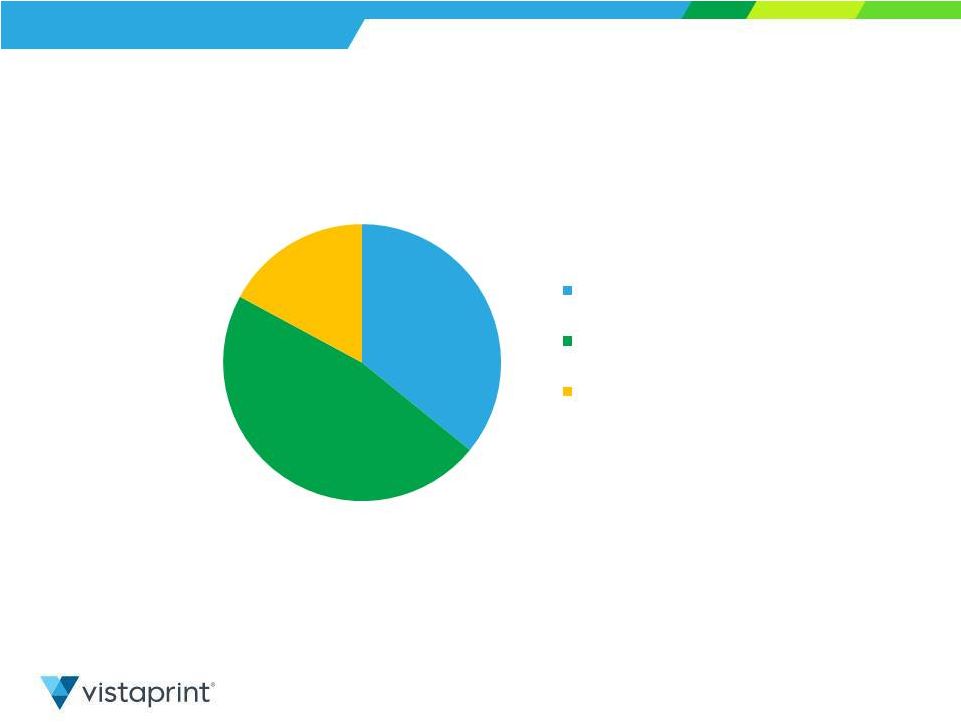 Q1 FY15 Capital Expenditure Breakdown Consolidated 1 3 2 36 Q1 CapEx: $16.7M 1 Land, building and construction, leasehold improvements, and furniture and fixtures 2 Including printing presses and related equipment, finishing equipment, and automation. 3 IT infrastructure, software and office equipment 36 36% 47% 17% Other Land/Facilities Mfg & Automation Equipment |
 Appendix Including a Reconciliation of GAAP to Non-GAAP Financial Measures |
 About Non-GAAP Financial Measures 38 To supplement Vistaprint’s consolidated financial statements presented in accordance with U.S. generally accepted accounting principles, or GAAP, Vistaprint has used the following measures defined as non-GAAP financial measures by Securities and Exchange Commission, or SEC, rules: non-GAAP adjusted net income, adjusted EBITDA, free cash flow, constant-currency revenue growth and constant-currency revenue growth excluding revenue from fiscal 2014 acquisitions. Please see the next slide for definitions of these items. The presentation of non-GAAP financial information is not intended to be considered in isolation or as a substitute for the financial information prepared and presented in accordance with GAAP. For more information on these non-GAAP financial measures, please see the tables captioned “Reconciliations of Non-GAAP Financial Measures” included at the end of this release. The tables have more details on the GAAP financial measures that are most directly comparable to non-GAAP financial measures and the related reconciliation between these financial measures. Vistaprint’s management believes that these non-GAAP financial measures provide meaningful supplemental information in assessing our performance and liquidity by excluding certain items that may not be indicative of our recurring core business operating results, which could be non-cash charges or discrete cash charges that are infrequent in nature. These non-GAAP financial measures also have facilitated management’s internal comparisons to Vistaprint’s historical performance and our competitors’ operating results. |
 Non-GAAP Financial Measures Definitions Non-GAAP Measure Definition Non-GAAP Net Income/EPS The items excluded from the non-GAAP adjusted net income measurements are share-based compensation expense and its related tax effect, amortization of acquisition-related intangibles, tax charges related to the alignment of acquisition-related intellectual property with global operations, changes in unrealized gains and losses on currency forward contracts (starting in Q1 FY 2014), unrealized currency transaction gains and losses on intercompany financing arrangements and the related tax effect, the charge for the disposal of our minority investment in China, and the change in fair-value estimate of our potential acquisition-related earn-outs. Non-GAAP weighted average shares outstanding excludes the impact of unamortized share-based compensation included in the calculation of GAAP diluted weighted average shares outstanding. Free Cash Flow FCF = Cash Flow from Operations – Capital Expenditures – Purchases of Intangible assets not related to acquisitions – Capitalized Software Expenses Trailing Twelve Month Return on Invested Capital ROIC = NOPAT / (Debt + Redeemable Non-Controlling Interest + Total Shareholders Equity – Excess Cash) NOPAT is net operating profit after taxes (Operating Income less Tax Provision) Excess cash is cash and equivalents > 5% of last twelve month revenues; if negative, capped at zero Operating leases have not been converted to debt Non-GAAP TTM ROIC excludes share-based compensation expense and its related tax effect, amortization of acquisition-related intangibles, and the change in fair-value estimate of our potential acquisition-related earn- outs. Constant-Currency Revenue Growth Constant-currency revenue growth is estimated by translating all non-U.S. dollar denominated revenue generated in the current period using the prior year period’s average exchange rate for each currency to the U.S. dollar and excludes the impact of gains and losses on effective currency hedges recognized in revenue in the prior year periods. Constant Currency Revenue Growth, excluding TTM Acquisitions Constant-currency revenue growth excluding revenue from trailing twelve month acquisitions excludes the impact of currency as defined above and revenue from People & Print Group, Pixartprinting and FotoKnudsen. 39 39 |
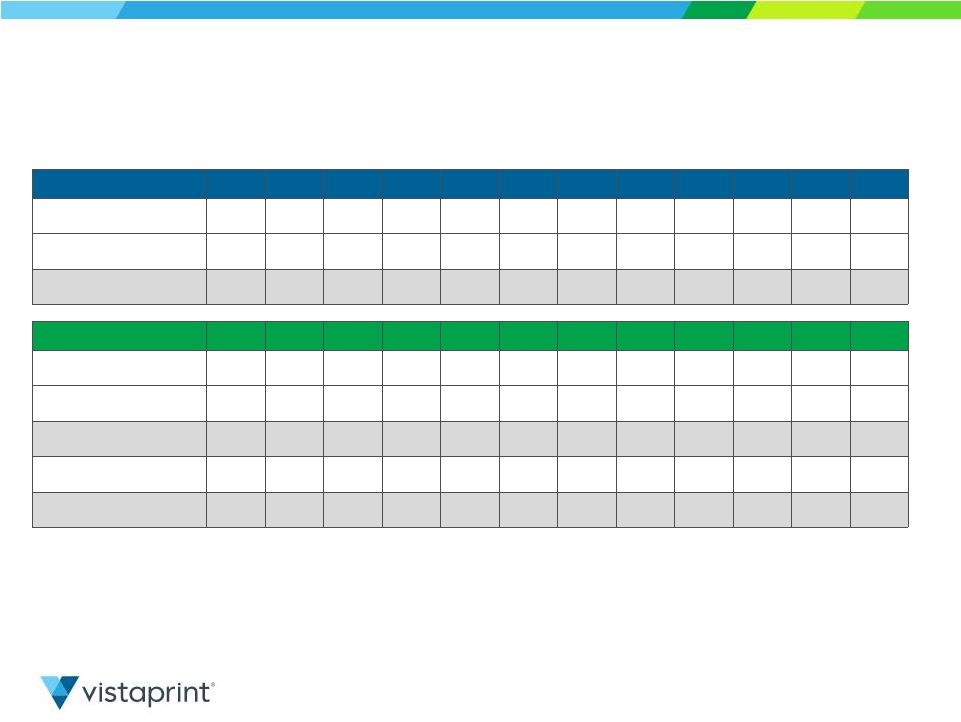
 Reconciliation: GAAP to Non-GAAP Results Net Income (Loss) – Quarterly, $ in thousands . Fiscal Year 2012 Fiscal Year 2013 Fiscal Year 2014 Fiscal Year 2015 Q2 Q3 Q4 Q1 Q2 Q3 Q4 Q1 Q2 Q3 Q4 Q1 GAAP Net Income $31,697 $274 $3,851 $(1,696) $22,960 $5,866 $2,305 $412 $40,875 $1,376 $1,034 $23,694 Share-based compensation and related tax effect $5,021 $7,566 $8,596 $8,445 $8,540 $8,353 $8,324 $8,576 $8,062 $5,773 $6,109 $5,769 Amortization of acquired intangible assets $1,148 $2,381 $2,225 $2,178 $2,243 $2,275 $3,665 $2,200 $2,249 $2,228 $5,510 $6,539 Tax Impact of Webs IP Transfer - $1,017 $218 - $2,164 $431 ($208) $63 $1,468 $312 $477 $546 Changes in unrealized loss (gain) on currency forward contracts included in net income $4,856 $(1,155) $(1,131) $(2,145) $(3,468) Unrealized currency transaction loss (gain) on intercompany loan and the related tax effect - $1,163 $(283) $(295) $(7,986) Loss on disposal of Namex investment $12,681 - Change in fair value of contingent consideration $2,192 $3,677 Non-GAAP Adjusted Net Income $37,866 $11,238 $14,890 $8,927 $35,907 $16,925 $14,086 $16,107 $52,662 $8,274 $25,563 $28,771 40 40 |
 . Fiscal Year 2012 Fiscal Year 2013 Fiscal Year 2014 Fiscal Year 2015 Q2 Q3 Q4 Q1 Q2 Q3 Q4 Q1 Q2 Q3 Q4 Q1 GAAP Net Income per share $0.82 $0.01 $0.10 $(0.05) $0.66 $0.17 $0.07 $0.01 $1.18 $0.04 $0.03 $0.71 Share-based Compensation and related tax effect per share $0.12 $0.20 $0.23 $0.24 $0.24 $0.24 $0.24 $0.25 $0.22 $0.17 $0.18 $0.17 Amortization of acquired intangible assets per share $0.03 $0.06 $0.06 $0.06 $0.06 $0.06 $0.11 $0.06 $0.06 $0.06 $0.16 $0.19 Tax impact of Webs IP Transfer per share - $0.02 $0.01 - $0.06 $0.01 $(0.01) $0.00 $0.04 $0.01 $0.01 $0.02 Changes in unrealized loss (gain) on currency forward contracts included in net income per share $0.13 $(0.03) $(0.03) $(0.06) $(0.10) Unrealized currency transaction loss (gain) on intercompany loan and the related tax effect per share $0.00 $0.03 $(0.01) $(0.01) $(0.23) Loss on disposal of Namex investment $0.37 - Change in fair value of contingent consideration $0.07 $0.10 Non-GAAP Adjusted Net Income per share $0.97 $0.29 $0.40 $0.25 $1.02 $0.48 $0.41 $0.45 $1.50 $0.24 $0.75 $0.86 Weighted average shares used in computing Non- GAAP EPS (millions) 39.041 38.346 37.620 35.793 35.156 35.217 34.633 35.005 35.118 34.857 34.195 33.606 Reconciliation: GAAP to Non-GAAP Results Earnings Per Diluted Share - Quarterly 41 |
 Reconciliation: Free Cash Flow In thousands 42 Q1 FY2014 Q1 FY2015 Net cash (used in) provided by operating activities ($123) $52,620 Purchases of property, plant and equipment ($17,577) ($16,684) Purchases of intangible assets not related to acquisitions ($75) ($85) Capitalization of software and website development costs ($1,814) ($3,539) Free cash flow ($19,589) $32,312 42 |
 Reconciliation: TTM Free Cash Flow In thousands 43 TTM Q1 FY13 TTM Q2 FY13 TTM Q3 FY13 TTM Q4 FY13 TTM Q1 FY14 TTM Q2 FY14 TTM Q3 FY14 TTM Q4 FY14 TTM Q1 FY15 Net cash provided by operating activities $116,750 $124,144 $122,659 $140,012 $133,239 $139,733 $134,740 $148,580 $201,319 Purchase of property, plant, and equipment $(63,181) $(77,343) $(80,006) $(78,999) (68,818) $(65,801) $(66,476) $(72,122) $(71,228) Purchases of intangible assets not related to acquisitions $(160) $(478) $(519) $(750) $(816) $(499) $(500) $(253) $(263) Capitalization of software and website development costs $(5,081) $(5,712) $(6,739) $(7,667) $(8,179) $(8,945) $(9,426) $(9,749) $(11,474) Free Cash Flow $48,328 $40,611 $35,395 $52,596 $55,426 $64,488 $58,338 $66,456 $118,353 |
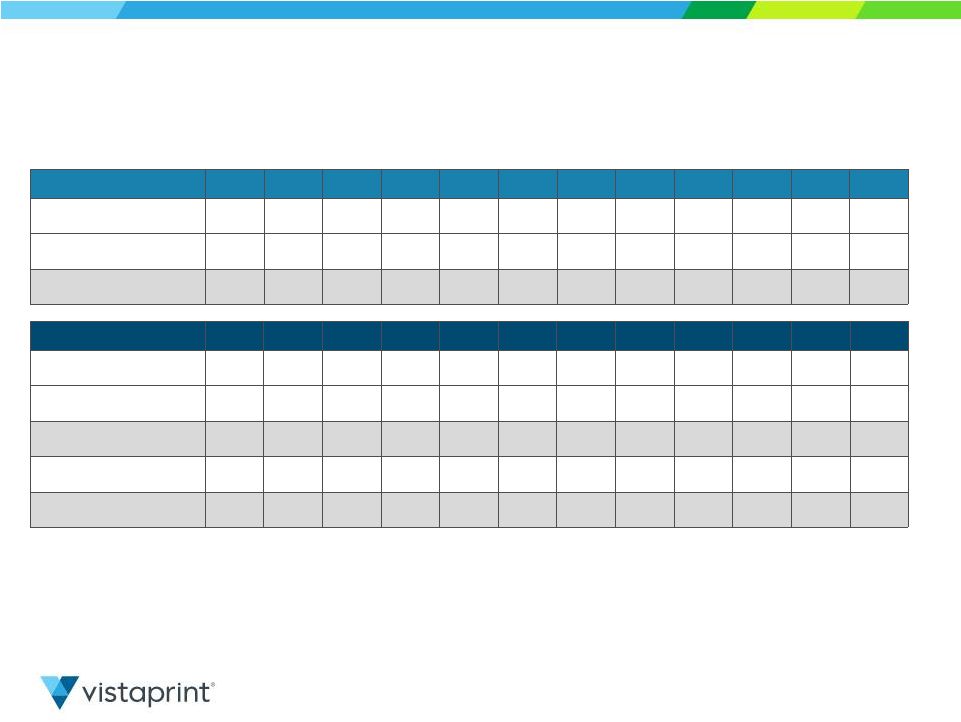
 Reconciliation: TTM ROIC In thousands except percentages 44 TTM Q1 FY13 TTM Q2 FY13 TTM Q3 FY13 TTM Q4 FY13 TTM Q1 FY14 TTM Q2 FY14 TTM Q3 FY14 TTM Q4 FY14 TTM Q1 FY15 Operating Income $45,662 $46,161 $48,110 $46,124 $54,299 $73,780 $69,286 $85,914 $94,385 Tax Provision $(9,878) $(15,196) $(11,989) $(9,387) $(10,068) $(7,884) $(6,619) $(10,590) $(12,007) Net Operating Profit After Taxes (NOPAT) $35,784 $30,965 $36,121 $36,737 $44,231 $65,896 $62,667 $75,324 $82,378 SBC incl. tax effect $29,628 $33,147 $33,934 $33,662 $33,793 $33,315 $30,735 $28,520 $25,713 Amortization $7,932 $9,027 $8,921 $10,361 $10,383 $10,389 $10,342 $12,187 $16,526 Changes in acq.-related earn-outs $2,192 $5,869 Non-GAAP NOPAT $73,344 $73,139 $78,976 $80,760 $88,407 $109,600 $103,744 $118,223 $130,486 Average Invested Capital¹ $414,392 $423,884 $432,621 $437,925 $442,793 $450,819 $459,360 $525,201 $575,837 GAAP ROIC 9% 7% 8% 8% 10% 15% 14% 14% 14% Non-GAAP ROIC 18% 17% 18% 18% 20% 24% 23% 23% 23% ¹See explanation of average invested capital on next slide. In Q1 FY15, we updated our definition of ROIC to include invested capital inclusive of redeemable non-controlling interests, which date back to Q4 FY14. We also corrected an error in our Q4 FY14 TTM ROIC calculation in which we had not excluded certain acquisition-related items from Non-GAAP ROIC (changes in acquisition- related earn-outs; amortization of intangibles from recent acquisitions). These changes resulted in a small adjustment to our previously reported Q4 FY14 TTM ROIC. |
 Reconciliation: Average Invested Capital In thousands except percentages 45 Q2 FY12 Q3 FY12 Q4 FY12 Q1 FY13 Q2 FY13 Q3 FY13 Q4 FY13 Q1 FY14 Q2 FY14 Q3 FY14 Q4 FY14 Q1 FY15 Total Debt $146,500 $126,500 $229,000 $259,314 $230,500 $238,500 $238,750 $270,000 $204,500 $201,953 $448,059 $447,870 Redeemable Non- Controlling Interest $11,160 $10,109 Total Shareholders Equity $267,823 $281,940 $189,287 $199,186 $209,895 $201,684 $189,561 $206,715 $260,288 $272,395 $232,457 $216,185 Excess Cash 1 $(21,236) $(3,205) $(11,190) $(6,353) $(9,339) - - $(5,093) $(1,628) - - - Invested Capital $393,087 $405,235 $407,097 $452,147 $431,056 $440,184 $428,311 $471,622 $463,160 $474,348 $691,676 $674,164 Average Invested Capital $414,392 $423,884 $432,621 $437,925 $442,793 $450,819 $459,360 $525,201 $575,837 1 Excess cash is cash and equivalents > 5% of last twelve month revenues; if negative, capped at zero 2 Average invested capital represents a four quarter average of total debt, redeemable non-controlling interests and total shareholder equity, less excess cash 2 |
 ASIA-PACIFIC Q2 FY12 Q3 FY12 Q4 FY12 Q1 FY13 Q2 FY13 Q3 FY13 Q4 FY13 Q1 FY14 Q2 FY14 Q3 FY14 Q4 FY14 Q1 FY15 Reported revenue growth 41% 47% 28% 28% 26% 6% 4% (11%) (5%) (3%) 3% 14% Currency impact (4%) (7%) 5% 2% (3%) 4% 4% 13% 11% 13% 5% (1%) Revenue growth in constant currency 37% 40% 33% 29% 24% 10% 8% 2% 6% 10% 8% 13% EUROPE Q2 FY12 Q3 FY12 Q4 FY12 Q1 FY13 Q2 FY13 Q3 FY13 Q4 FY13 Q1 FY14 Q2 FY14 Q3 FY14 Q4 FY14 Q1 FY15 Reported revenue growth 36% 29% 18% 12% 11% 8% 3% 6% 1% (4%) 50% 46% Currency impact 1% 5% 12% 11% 2% 0% (1%) (4%) (3%) (3%) (7%) (1%) Revenue growth in constant currency 37% 34% 30% 23% 14% 8% 2% 2% (2%) (7%) 43% 45% Impact of TTM acquisitions (45%) (44%) Revenue growth in constant currency ex. TTM acquisitions (2%) 1% 46 Reconciliation: Constant-Currency/ex. TTM Acquisition Revenue Growth Rates - Quarterly 46 |
 NORTH AMERICA Q2 FY12 Q3 FY12 Q4 FY12 Q1 FY13 Q2 FY13 Q3 FY13 Q4 FY13 Q1 FY14 Q2 FY14 Q3 FY14 Q4 FY14 Q1 FY15 Reported revenue growth 20% 23% 20% 22% 20% 15% 18% 14% 13% 2% 6% 8% Currency impact 0% 0% 0% 0% 0% 0% 0% 1% 1% 1% 1% 0% Revenue growth in constant currency 20% 23% 21% 22% 20% 15% 18% 15% 14% 3% 7% 8% TOTAL COMPANY Q2 FY12 Q3 FY12 Q4 FY12 Q1 FY13 Q2 FY13 Q3 FY13 Q4 FY13 Q1 FY14 Q2 FY14 Q3 FY14 Q4 FY14 Q1 FY15 Reported revenue growth 28% 26% 20% 18% 16% 12% 12% 9% 6% (1%) 21% 21% Currency impact 0% 2% 5% 5% 1% 0% 0% 0% 0% 0% (2%) 0% Revenue growth in constant currency 28% 28% 25% 23% 17% 12% 12% 9% 6% (1%) 19% 21% Impact of TTM acquisitions (15%) (15%) Revenue growth in constant currency ex. TTM acquisitions 4% 6% 47 Reconciliation: Constant-Currency/ex. TTM Acquisition Revenue Growth Rates - Quarterly 47 |