
Management’s Discussion & Analysis of Financial Results
For the three months ended March 31, 2020
Excellon Resources Inc. (the “Company” or “Excellon”) has prepared this Management’s Discussion and Analysis of Financial Results (“MD&A”) for the three months ended March 31, 2020 in accordance with the requirements of National Instrument 51-102 (“NI 51-102”).
This MD&A contains information as at June 1, 2020 and provides information on the operations of the Company for the three months ended March 31, 2020 and 2019 and subsequent to the period end, and should be read in conjunction with the unaudited condensed consolidated financial statements for the three months ended March 31, 2020 and the audited consolidated financial statements for the year ended December 31, 2019 which have been filed on SEDAR. The audited consolidated financial statements for the year ended December 31, 2019 have been prepared in accordance with International Financial Reporting Standards (“IFRS”). All figures in this MD&A are in thousands of United States dollars ($’000) unless otherwise noted.
This MD&A also refers to Production Cost per Tonne, Cash Cost per Silver Ounce Payable, and All-in Sustaining Cost (“AISC”) per Silver Ounce Payable, all of which are Non-IFRS Measures. Please refer to the sections of this MD&A entitled “Production Cost per Tonne”, “Total Cash Cost per Silver Ounce Payable” and “All-in Sustaining Cost per Silver Ounce Payable” for an explanation of these measures and reconciliation to the Company’s reported financial results.
| BUSINESS AND STRATEGIC PRIORITIES | 2 |
| FIRST QUARTER HIGHLIGHTS | 2 |
| OUTLOOK | 4 |
| OPERATIONAL REVIEW | 5 |
| EXPLORATION AND EVALUATION REVIEW | 10 |
| CORPORATE RESPONSIBILITY REVIEW | 13 |
| FINANCIAL REVIEW | 14 |
| RELATED PARTY TRANSACTIONS | 20 |
| COMMON SHARE DATA AS AT JUNE 1, 2020 | 20 |
| LIQUIDITY AND CAPITAL RESOURCES | 20 |
| ACCOUNTING POLICIES AND INTERNAL CONTROLS | 24 |
| BUSINESS ENVIRONMENT AND RISKS | 26 |
1| Page |
Management’s Discussion & Analysis of Financial Results
For the three months ended March 31, 2020
BUSINESS AND STRATEGIC PRIORITIES
Excellon’s vision is to create wealth by realizing strategic opportunities through discipline and innovation for the benefit of our employees, communities and shareholders. The Company is advancing a precious metals growth pipeline that includes: Platosa, Mexico’s highest-grade silver mine since production commenced in 2005; Kilgore, a high-quality gold development project in Idaho with strong economics and significant growth and discovery potential; and an option on Silver City, a high-grade epithermal silver district in Saxony, Germany with 750 years of mining history and no modern exploration. The Company also aims to continue capitalizing on current market conditions by acquiring undervalued projects.
The common shares of Excellon (“Common Shares”) trade on the Toronto Stock Exchange under the symbol “EXN”.
FIRST QUARTER HIGHLIGHTS
Acquisition of Otis Gold Corp.
On April 23, 2020, the Company announced the successful completion of the acquisition of Otis Gold Corp. (“Otis”) via a statutuory plan of arrangement under the Business Corporations Act (British Columbia) (the “Arrangement”).
| ● | Pursuant to the Arrangement, Excellon acquired all of the issued and outstanding common shares of Otis on the basis of 0.23 Common Shares (the “Exchange Ratio”) for each Otis Share. Adjusted in accordance with the Exchange Ratio, each Otis warrant became exercisable for Common Shares of Excellon and each Otis option was exchanged for an option to acquire Common Shares of Excellon. |
| ● | On May 7, 2020, the Company announced that the United States Federal District Court for the District of Idaho (the “Court”) had issued a decision amending its December 2019 judgment in respect of the United States Forest Service (“USFS”) Environmental Assessment (“EA”) and Decision Notice/Finding of No Significant Impact (“DN/FONSI”) for the Kilgore Project in Clark County, Idaho. The EA analyzed a proposed diamond drilling plan of operations (the “Plan”) at the Kilgore Project to further delineate mineral resources and mineralized zones. A lawsuit was filed by two environmental organizations in November 2019 on several grounds, including that there was inadequate consideration of potential ground water impacts within the Dog Bone Ridge area of the Kilgore Project. Dog Bone Ridge is a regional target in the proposed exploration program in the Plan and is not associated with the defined Kilgore mineral resource or the associated preliminary economic assessment on such resource. In the December 2019 decision, the Court ruled in favour of the USFS on all but the claim in respect of Dog Bone Ridge. The Court remanded the EA back to the USFS to supplement its analysis on Dog Bone Ridge, leaving the EA and the approved Plan in place. The plaintiffs subsequently moved the Court to amend its judgment to vacate the DN/FONSI and EA pending completion of the supplemental analysis. The Court agreed with the plaintiffs and vacated the DN/FONSI and EA in its amended judgment. |
Sprott Credit Facility
On March 16, 2020, the Company announced the closing of a US$6-million bridge-loan credit facility (the “Facility”) with Sprott Private Resource Lending II (Collector), LP (“Sprott Lending”). The Facility bears interest at 10% per annum, compounded and payable monthly, and is due and payable in full on or before September 14, 2020. In consideration for the Facility, Excellon issued 536,454 Common Shares to Sprott Lending, which are subject to a hold period of four months and one day from the date of issuance under applicable securities laws.
2| Page |
Management’s Discussion & Analysis of Financial Results
For the three months ended March 31, 2020
Q1 2020 Financial and Operational Highlights (compared to Q1 2019)
| ● | Silver equivalent (“AgEq”) production of 523,742 oz (Q1 2019 – 522,261 AgEq oz) |
| o | Silver production increased 14% to 296,281 oz (Q1 2019 – 260,445 oz) | |
| o | Lead production increased 37% to 1.9 million lb (Q1 2019 – 1.4 million lb) | |
| o | Zinc production decreased 4% to 2.1 million lb (Q1 2019 – 2.2 million lb) |
| ● | Revenues of $6.6 million (Q1 2019 – $5.2 million) |
| ● | AgEq ounces payable sold of 434,190 (Q1 2019 – 383,438 AgEq ounces payable sold) |
| ● | Total cash cost per Ag oz payable of $15.35 (Q1 2019 – $11.71) |
| ● | All-in sustaining cost net of byproducts per Ag oz payable (“AISC”) of $26.52 (Q1 2019 – $25.35) |
| ● | Net loss of $6.4 million or $0.06/share (Q1 2019 – net loss of $3.8 million or $0.04/share) |
| (in thousands of U.S dollars except amounts per share, cost per tonne, ounces and per ounce) | Q1 2020 | Q1 2019 | ||||||
| Revenues | $ | 6,615 | $ | 5,179 | ||||
| Gross profit (loss) | $ | (133 | ) | $ | (602 | ) | ||
| Net Income (Loss) | $ | (6,372 | ) | $ | (3,785 | ) | ||
| Income (loss) per share – basic | $ | (0.06 | ) | $ | (0.04 | ) | ||
| Silver ounces produced | 296,281 | 260,445 | ||||||
| Silver ounces payable | 246,062 | 174,194 | ||||||
Silver equivalent ounces produced (1)
| 523,742 | 522,261 | ||||||
Silver equivalent ounces payable (1) (2)
| 434,190 | 383,438 | ||||||
Production cost per tonne (3)
| $ | 292 | $ | 272 | ||||
| Total cash cost per silver ounce payable | $ | 15.35 | $ | 11.71 | ||||
| AISC per silver ounce payable | $ | 26.52 | $ | 25.35 | ||||
Average realized silver price per ounce sold (4)
| $ | 15.04 | $ | 15.45 | ||||
3| Page |
Management’s Discussion & Analysis of Financial Results
For the three months ended March 31, 2020
| (1) | AgEq ounces established using average realized metal prices during the period indicated, applied to the recovered metal content of the concentrates to reflect the revenue contribution of base metal sales during the period. | |
| (2) | Payable metal reflects current metals delivered, net of payable deductions under the Company’s offtake arrangements. | |
| (3) | Production cost per tonne includes mining and milling costs, excluding depletion and amortization and inventory adjustments. | |
| (4) | Average realized silver price is calculated on current period sale deliveries and does not include prior period provisional adjustments in the period. |
OUTLOOK
Mexican Operations
On April 2, 2020, the Company announced the temporary suspension of mining, milling and exploration activities at its Mexican operations, in accordance with the March 31st Mexican Presidential Order (the “Order”) to slow the spread of COVID-19. The Order did not list mining and mineral processing as essential activities. The Mexican Federal Government has since extended the temporary suspension of activities until May 31, 2020. During this time, critical pumping, safety, security and environmental management continue. As the state of emergency is expected to end on June 1, 2020, the Company has commenced activities to restart operations. Please also refer to the Company’s news release dated June 1, 2020.
To date, there have been no reported cases of COVID-19 at the Company’s operations. The Company has used this opportunity to focus on cost savings and business improvement initiatives including the permanent reduction of the labour force by 110 full-time positions; continued implementation of a new energy contract, a modifided mining method and various other operational efficiencies at Platosa.
Excellon completed the bulk sample of ore from Hecla Mining Company’s (“Hecla”) San Sebastián Mine in Durango during Q1 2020. As originally contemplated in the toll milling arrangement, Hecla is now conducting metallurgical studies on the Hugh Zone (part of the San Sebastián deposit) to generate a third salable concentrate (copper) from the ore, which has a significant impact on the potential return of the project and how the sulphide and oxide parts of the deposit should be sequenced. The oxide part of the San Sebastián deposit is currently expected to end production in the fourth quarter of 2020. The ability to produce a third concentrate, if achieved, could result in a restart of production in 2021 or 2022.
Exploration Plans
Exploration plans were delayed as a result of COVID-19. Jurisdictions around the world, including Mexico, Germany and the United States are now beginning phased restart of operations, and the Company expects 2020 exploration plans to resume accordingly.
At the Kilgore Project, the Company aims to improve understanding of the deposit setting on a local and regional scale through: re-logging core to enhance the underlying structural and lithologic framework, improving characterization of host rocks through lithogeochemistry, and sampling and assaying of silver mineralization to potentially improve project economics. The Company also looks forward to continuing regional exploration, prospecting and geophysics to generate new targets.
4| Page |
Management’s Discussion & Analysis of Financial Results
For the three months ended March 31, 2020
Intention to List on the NYSE American, LLC (“NYSE”) Exchange
The Company continues to advance its intention to file a listing application for the NYSE, with advancement being impacted market and outlook uncertainties related to COVID-19 (as discussed below). The Company believes that this additional listing will provide increased exposure to a large and diversified investor base and improve market liquidity.
Epidemic and Pandemic Diseases – COVID-19
The Company’s business could be adversely impacted by the effects of a widespread global outbreak of contagious disease, including the recent outbreak of respiratory illness caused by a novel coronavirus (“COVID-19”). The Company cannot accurately predict the impact COVID-19 will have on third parties’ abilities to meet their obligations with the Company, including uncertainties relating to the ultimate geographic spread of the virus, the severity of the disease, the duration of the outbreak, and the length of travel and quarantine restrictions imposed by governments of affected countries. Additionally, significant outbreak of contagious diseases in the human population could result in a widespread health crisis that could adversely affect the economies and financial markets of many countries, resulting in an economic downturn that could impact demand for the Company’s services and operating results.
Management continues to closely evaluate the impact of the COVID-19 pandemic on the Company’s business and logistics. While it is not possible to reliably estimate the financial impact or severity of the COVID-19 pandemic to the Company, if silver, lead and zinc prices remain at or below current price levels for an extended period of time, the Company’s financial position, liquidity and results for future periods could be significantly adversely impacted.
OPERATIONAL REVIEW
Production
Platosa Mine production statistics for the periods indicated were as follows:
| Q1 | Q1 | |||||||
| 2020(1) | 2019(1) | |||||||
| Tonnes Mined from Platosa: | 19,899 | 19,496 | ||||||
| Ore processed (t): | 19,042 | 16,769 | ||||||
| Historical stockpile processed (t): | - | 1,450 | ||||||
| Platosa ore processed (t): | 19,042 | 18,219 | ||||||
| Ore grades: | ||||||||
| Silver (g/t) | 542 | 534 | ||||||
| Lead (%) | 5.44 | 5.01 | ||||||
| Zinc (%) | 6.78 | 8.00 | ||||||
| Historical stockpile grades: | ||||||||
| Silver (g/t) | - | 123 | ||||||
| Lead (%) | - | 1.22 | ||||||
| Zinc (%) | - | 1.44 | ||||||
| Blended head grade: | ||||||||
| Silver (g/t) | - | 502 | ||||||
| Lead (%) | - | 4.71 | ||||||
| Zinc (%) | - | 7.48 | ||||||
| Recoveries: | ||||||||
| Silver (%) | 89.3 | 89.7 | ||||||
| Lead (%) | 82.8 | 74.6 | ||||||
| Zinc (%) | 74.9 | 78.1 | ||||||
| Metal Production: | ||||||||
| Silver – (oz) | 296,281 | 260,445 | ||||||
| Lead – (lb) | 1,890,456 | 1,376,423 | ||||||
| Zinc – (lb) | 2,131,034 | 2,209,624 | ||||||
| Silver equivalent (oz) (2) | 523,742 | 522,261 | ||||||
| Payable: (3) | ||||||||
| Silver – (oz) | 246,062 | 174,194 | ||||||
| Lead – (lb) | 1,514,285 | 890,712 | ||||||
| Zinc – (lb) | 1,805,672 | 1,919,733 | ||||||
| Silver equivalent (oz) (2) | 434,190 | 383,438 | ||||||
| Average realized prices: (4) | ||||||||
| Silver – ($US/oz) | $ | 15.04 | $ | 15.45 | ||||
| Lead – ($US/lb) | $ | 0.79 | $ | 0.92 | ||||
| Zinc – ($US/lb) | $ | 0.90 | $ | 1.26 | ||||
| San Sebastián ore processed (t) | 4,785 | - | ||||||
5| Page |
Management’s Discussion & Analysis of Financial Results
For the three months ended March 31, 2020
| (1) | Period deliveries remain subject to assay and price adjustments on final settlement with concentrate purchaser(s). Data has been adjusted to reflect final assay and price adjustments for prior period deliveries settled during the period. Tonnes Mined and Ore processed are in DMT. |
| (2) | AgEq ounces established using average realized metal prices during the period indicated applied to the recovered metal content of the concentrates to reflect the revenue contribution of base metal sales during the period. |
| (3) | Payable metal is based on the metals delivered and sold during the period, net of payable deductions under the Company’s offtake arrangements, and will therefore differ to produced ounces. |
| (4) | Average realized price is calculated on current period sale deliveries and does not include the impact of prior period provisional adjustments in the period. |
Operations Commentary
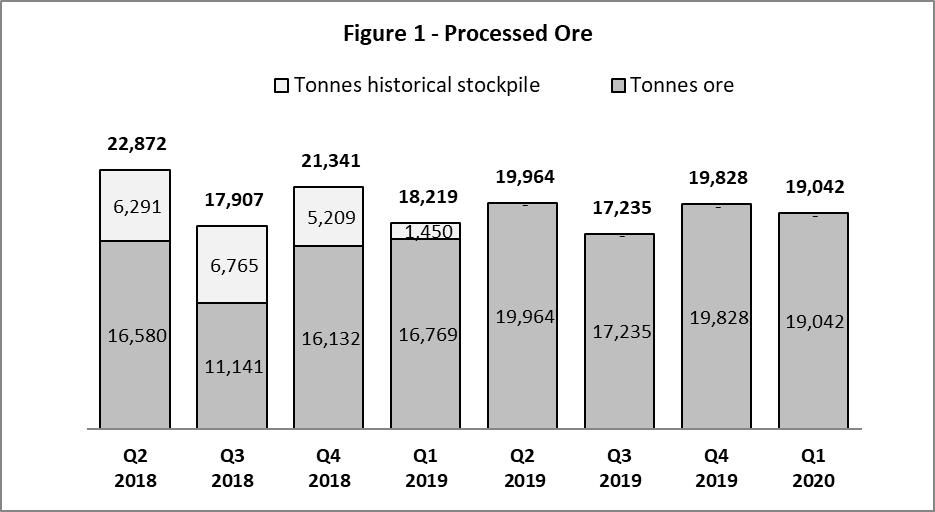
Total tonnage processed of 19,042 tonnes in Q1 2020 was 5% higher relative to Q1 2019 tonnes of 18,219 (including, 1,450 tonnes of historical stockpile processed). All of the tonnage processed during the quarter was from freshly mined ore.
Mine production during Q1 2020 accessed multiple ore faces in the Rodilla, 623, Guadalupe and Pierna mantos, with improved grades for silver and lead. Zinc grades were more variable than expected due to grade variability among the four mantos, leading to lower zinc recoveries.
Dry mining conditions continue to increase productivity with improved access to ore faces. As such, development continues to progress towards the next production horizons utilizing the 730 and 731 ramps in Pierna and Rodilla in the 895 and 903 elevations respectively and the 725 ramp in 623 to access the 890 elevation.
6| Page |
Management’s Discussion & Analysis of Financial Results
For the three months ended March 31, 2020
During the temporary suspension, the Company progressed several initiatives to materially reduce operating costs upon restart in the second quarter, including:
| ● | Permanent reduction of the labour force by 110 full-time positions; | |
| ● | Final stages of implementation of new energy contract, which is expected to result in a 40% decrease in electricity rates; and |
additional key business initiatives underway at Platosa include
| ● | Improved blasting procedure to increase cycle efficiency through increased blasting control and reduced loading time and ground support; | |
| ● | New shift scheduling to improve consistency and efficiency; | |
| ● | Enhanced geotechnical model to mitigate challenging ground conditions, improving safety and productivity and reducing costs; and | |
| ● | Implementation of modified mining method to decrease mining costs and increase stope extraction rate, which is now incorporated in future mining plans. |
During the quarter, dewatering efforts continued, which include sustaining capital related to the ordinary course maintenance and expansion of the dewatering system going forward for the life of mine. The program includes the periodic development of new well bays and drilling of new wells, with submersible pumps being moved to the new wells as wells at higher elevations begin to lose pumping efficiency. In Q1 2020, the Company incurred dewatering capital expenditures of $1.4 million, of which $1.1 million were one-time capital expenditures related to engineering and infrastructure.
At the Miguel Auza processing facility, the optimized flow sheet upgrades continued. While lead recoveries improved, zinc recoveries were impacted by ongoing adjustments designed to stabilize mill performance, including the use of different reagents to optimize recoveries of all three metals.
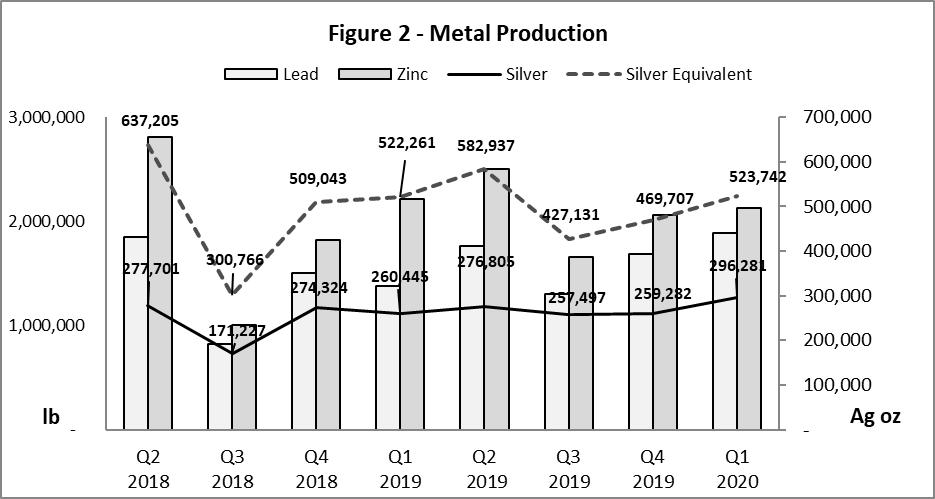
Overall metal production of silver and lead increased relative to Q1 2019, while zinc was lower due to lower recoveries versus the comparative quarter.
7| Page |
Management’s Discussion & Analysis of Financial Results
For the three months ended March 31, 2020
The previous eight quarters of production at Platosa are summarized below:
8| Page |
Management’s Discussion & Analysis of Financial Results
For the three months ended March 31, 2020
Analysis of the components of mine operating results is as follows:
| Q1 | ||||||||
| 2020 | 2019 | |||||||
| Ore processed | 19,042 | 16,769 | ||||||
Total tonnage processed of 19,042 tonnes in Q1 2020 was 5% higher relative to Q1 2019. All of the tonnage processed in the current quarter was from freshly mined ore. Prior periods included processing of low-grade historical stockpiles, which have recently not been processed due to the availability of higher-grade ore. In addition, the mill processed 4,785 tonnes of ore from San Sebastián in Q1 2020 (not included in figures above).
| Ag (g/t) | 542 | 534 | ||||||||
| Head grade | Pb (%) | 5.44 | 5.01 | |||||||
| Zn (%) | 6.78 | 8.00 |
Silver and lead grades improved by 2% and 9% respectively in Q1 2020 relative to Q1 2019. Zinc grades were 15% lower over the same period due to variability in the production stopes being mined during the quarter, while improved silver and lead grades were a function of processing solely fresh ore in Q1 2020, whereas historical stockpile was also processed in the comparative period.
| Ag (%) | 89.3 | 89.7 | ||||||||
| Recoveries | Pb (%) | 82.8 | 74.6 | |||||||
| Zn (%) | 74.9 | 78.1 |
Silver recoveries were consistent with the comparative period. While lead recoveries continued to improve, zinc recoveries were impacted by ongoing adjustments designed to stabilize mill performance, including the use of different reagents to optimize recoveries of all three metals.
| Ag (oz) | 296,281 | 260,445 | ||||||||
| Metal Production | Pb (lb) | 1,890,456 | 1,376,423 | |||||||
| Zn (lb) | 2,131,034 | 2,209,624 | ||||||||
| AgEq (oz) | 523,742 | 522,261 |
Silver and lead production increased 14% and 37% in Q1 2020 driven by increased grades and fresh ore tonnage relative to Q1 2019, as discussed above. Zinc production was 4% lower in Q1 2020 due to lower grade and recoveries as discussed above relative to the comparative period.
9| Page |
Management’s Discussion & Analysis of Financial Results
For the three months ended March 31, 2020
QUALIFIED PERSONS
Jeremy Ouellette, P. Eng., has acted as the Qualified Person, as defined in NI 43-101, with respect to the disclosure of the scientific and technical information relating to production results contained in this MD&A.
EXPLORATION AND EVALUATION REVIEW
Platosa Property
In Q1 2020, the Company conducted limited exploration on the Platosa project. Planning continued for future field work and drilling, particularly at Jaboncillo and PDN. At Jaboncillo, the Company expects to follow up on drilling completed in 2019 that intersected multiple gossanous horizons with pyritic breccias and arsenopyrite. These observations confirm the presence of the target system on multiple structures over an approximately one-kilometre area. Drilling will continue in this area with the aim of discovering an economically significant component to the system.
Follow up drilling is also planned for PDN where intense dolomitization and sanding along structures was intersected, indicating the movement of hydrothermal fluids.
During early Q1 2020, the Company commenced an underground drill program focused on further defining and expanding the Pierna, Rodilla and NE-1 mantos. This program is scheduled to recommence upon the restart of operations and once completed, will also target gaps between the 623 and NE-1S mantos.
Evolución Project
The Company commenced a proof-of-concept drilling program on Evolución during Q2 2018, targeting four priority targets believed to be indicative of the distal part of a larger epithermal system. The Company increased the drilling program to 6,000 metres based on initial success on the Lechuzas structure. Drilling in Q4 2018 and into Q1 2019 tested strike and dip extensions of the mineralization encountered at Lechuzas with the purpose of tracking higher grades and more robust widths. During Q1 2019, the Company announced results from the Lechuzas structure, which defined a mineralized envelope of 600 metres along strike and 500 metres down dip. This envelope was extended by a further 250 metres along strike through 2019 and into Q1 2020 and remains open in multiple direcitons. As part of this drilling program, re-assaying of samples from the Calvario vein and re-modelling of the region was undertaken. The Company intends to incorporate this workin into an updated mineral resource estimate and associated technical report in 2020.
In Q3 2019, the Company completed the initial drill program on the Laika target with two holes completed for a total of 1,000 metres. A sequence of overburden was intersected in these holes before transitioning into a rhyolite sequence with zones of intense alteration and leaching. The target of this program, the origin of chalcedonic and opaline pyrite bearing quartz in the overburden, was not intersected
Subsequent to the Laika program, two drill holes were completed at Loma de las Minas for a total of 622 metres, intersecting highly anomalous mineralization near surface in silificied sediments, and one drill hole at Negrillas for a total of 502 metres targeting a large structural intersection.
During the first quarter, regional exploration on the greater Evolución concession recommenced, including mapping and prospecting and 1,200 metres of reverse circulation “RC” drilling at a newly developed target called Guardian to the south east of the Laika Target.
10| Page |
Management’s Discussion & Analysis of Financial Results
For the three months ended March 31, 2020
2018-2020 Drilling Highlights
| ● | 101 g/t AgEq (22 g/t Ag, 0.4% Pb, 1.0% Zn and 0.1 g/t Au) over 154 metres in EX18MAZ-251, including 532 g/t AgEq (188 g/t Ag, 4.4% Pb, 2.9% Zn and 0.1 g/t Au) over 2.4 metres and 238 g/t AgEq (48 g/t Ag, 0.7% Pb, 2.8% Zn and 0.2 g/t Au) over 17.7 metres; | |
| ● | 70 g/t AgEq (14 g/t Ag, 0.3% Pb, 0.7% Zn and 0.1 g/t Au) over 219 metres in EX18MAZ-253, including 274 g/t AgEq (70 g/t Ag, 1.3% Pb, 2.2% Zn and 0.4 g/t Au) over 12.6 metres; | |
| ● | 663 g/t AgEq (175 g/t Ag, 4.3% Pb, 5.4% Zn and 0.4 g/t Au) over 3.4 metres in EX18MAZ-257; | |
| ● | 259 g/t AgEq (64 g/t Ag, 1.4% Pb, 2.2% Zn and 0.3 g/t Au) over 24.9 metres in EX18MAZ-258; | |
| ● | 53 g/t AgEq (9 g/t Ag, 0.1% Pb, 0.8% Zn, 0.1 g/t Au) over 43.8 metres in EX19MAZ-273, including 68 g/t AgEq (12 g/t Ag, 0.2% Pb, 1.1% Zn, 0.1 g/t Au) over 28.2 metres and including 93 g/t AgEq (20 g/t Ag, 0.6% Pb, 1.2% Zn, 0.1 g/t Au) over 5.1 metres; | |
| ● | 64 g/t AgEq (10 g/t Ag, 0.2% Pb, 1.0% Zn, 0.1 g/t Au) over 31.3 metres in EX19MAZ-268; | |
| ● | 103 g/t AgEq (27 g/t Ag, 0.8% Pb, 1.1% Zn, 0.1 g/t Au) over 18.7 metres in EX19MAZ-265 including 416 g/t AgEq (105 g/t Ag, 3.5% Pb, 4.2% Zn, 0.3 g/t Au) over 2.0 metres and 213 g/t AgEq (53 g/t Ag, 1.4% Pb, 2.5% Zn, 0.1 g/t Au) over 3.0 metres; and | |
| ● | 779 g/t AgEq (290 g/t Ag, 6.9% Pb, 5.9% Zn, 0.2 g/t Au) over 1.5 metres and 244 g/t AgEq (51 g/t Ag, 1.9% Pb, 2.9% Zn, 0.1 g/t Au) over 4.5 metres in EX19MAZ-272. |
During Q1 2020, exploration activities continued, including:
| ● | Extension of mineralization at Lechuzas; | |
| ● | Definition and commencement of field work on numerous regional targets; | |
| ● | Commencement of regional exploration, mapping and sampling at new exploration targets including Guardian and Illusion; | |
| ● | Completion of an RC program at Guardian; | |
| ● | Commenced review of technical reports and commissioned a consulting group to evaluate potential for resource update at Miguel Auza; and | |
| ● | Re-assaying and re-logging of Calvario core to support remodelling of mineralization intersected. |
Silver City Project
The Silver City Project (Bräunsdorf exploration license) is a 164 km2 silver district in Saxony, Germany and encompasses a 36 km long epithermal vein system situated west of the city of Freiberg (30 km southwest of Dresden). The immediate exploration license and surrounding area have a long and rich history of silver mining dating back to the 12th century with numerous historic mine camps, small mines and prospects, many of which have only been explored and/or mined to shallow depth, seldom exceeding 200 metres below surface. Historically reported veins ranged from 0.5 to 10 metres width, with grades of over 3,500 g/t Ag and no assaying for gold or zinc available at the time.
During late 2019 and into 2020, the project continued to advance, with an induced polarization (“IP”) survey completed over two targets on the northern part of the license. Three lines were completed over the Munzig target, an area of historical high-grade production, with records indicating veins from 2 to 10 metres wide grading up to 1,000 g/t Ag. Two lines were completed over the Steinberg target, which followed up on surface sampling that contained anomalous silver, arsenic and lead. High resistivity and chargeability anomalies were detected at both targets and have been defined within prospective settings that will be tested during initial drilling.
11| Page |
Management’s Discussion & Analysis of Financial Results
For the three months ended March 31, 2020
Fluid inclusion studies completed by the University of Freiberg on samples from historical mine workings covered a strike length of approximately 15 km of the main vein system. These studies confirmed systematic vertical mineral zonation within the larger epithermal system and an expected vertical extent of the productive zones between 300-400 metres. Compilation of historical reports, maps and images from the Freiberg archives have allowed the Company to model historically mined areas, providing more detailed information on targets ahead of drilling. In mid-January, permitting documentation was submitted to regulators, with diamond drilling expected to commence in the first half of 2020 for an initial 1,500-2,000 metre drill program.
During Q1 2020 activities at Silver City included:
| ● | Filing of a Plan of Operation for drilling for up to 15 drill holes; | |
| ● | Soliciting expressions of interest from drilling companies to undertake this program; | |
| ● | Provided funding for research on the Silver City Project to the University of Freiberg; and | |
| ● | Entered into an R&D agreement with the Helmholtz Institute of Freiberg for the future exploration of the Silver City Project. |
Beschefer Option to Wallbridge Mining Company Limited
In October 2018, a wholly-owned subsidiary of the Company entered into an option agreement (the “Beschefer Agreement”) in respect of the Beschefer Project in Quebec with Wallbridge Mining Company Ltd. (“Wallbridge”). Wallbridge agreed to incur an aggregate of $4.5 million in exploration expenditures and issue a total of 7,000,000 common shares of Wallbridge (“Wallbridge Shares”) over three years to earn a 100% interest in the property. On September 21, 2019 the parties amended the original option agreement to increase the total number of shares to 8,000,000 and extend the option period by one year.
The Company received 500,000 Wallbridge Shares upon entering the Beschefer Agreement. In January 2020, a review by Wallbridge of the property status on Beschefer revealed that the claims had lapsed in December 2019 resulting in both Wallbridge and Excellon losing rights to the property. Due to the reorganization of the claims in Quebec to eliminate sub-parcels, some of the claims under the Beschefer Agreement were assigned to contiguous properties upon the lapse of the claims. On March 17, 2020, in satisfaction of the Beschefer Agreement, the Company’s subsidiary signed a release and quitclaim on the Beschefer Property and agreed to accept an additional 3,000,000 Wallbridge Shares and 500,000 warrants at a price of $1.00 for a period of five years.
Mineral Resources
SRK Consulting (Canada) Inc. (“SRK”) have prepared the following Mineral Resource Estimate (MRE) statement in compliance with National Instrument 43-101 (NI 43-101) and the technical report related to this can be found on SEDAR (www.sedar.com).
12| Page |
Management’s Discussion & Analysis of Financial Results
For the three months ended March 31, 2020
Mineral Resource Statement, Platosa Mine Mexico, SRK Consulting (Canada) Inc.
| Grade | Contained Metal | |||||||||||||||||||||||||||||||||||
| Category | Tonnes (‘000) | Ag (g/t) | Pb (%) | Zn (%) | AgEq (g/t) | Ag (‘000s oz) | Pb (‘000s lbs) | Zn (‘000s lbs) | AgEq (‘000 oz) | |||||||||||||||||||||||||||
| Indicated | 485 | 549 | 5.6 | 5.9 | 1,055 | 8,562 | 59,752 | 62,953 | 16,456 | |||||||||||||||||||||||||||
| Inferred | 13 | 516 | 4.7 | 6.5 | 1,014 | 216 | 1,344 | 1,859 | 426 | |||||||||||||||||||||||||||
| (1) | Mineral Resources are estimated pursuant to NI 43-101 with an effective date of March 31, 2018. |
| (2) | Mineral Resources are estimated at a cut-off grade of 375 g/t AgEq and silver, lead and zinc prices of $17.00, $1.10 and $1.30, and assuming metal recoveries of 89% for silver and 81% for lead and zinc, respectively. |
| (3) | This Mineral Resource Estimate was prepared under the supervision of Sébastien Bernier, Principal Resource Geologist at SRK Consulting (Canada). Mr. Bernier is a Qualified Person as defined in NI 43-101. |
| (4) | All figures have been rounded to reflect the relative accuracy of the estimates. |
| (5) | Mineral Resources that are not Mineral Reserves do not necessarily demonstrate economic viability. The Mineral Resources reported herein have been estimated using a geostatistical block modelling approach informed from silver, lead and zinc assay data collected in core borehole samples. The construction of the Mineral Resource model was a collaborative effort between Excellon and SRK personnel. The construction and methodology for the creation of the resource wireframes was overseen by Blair Hrabi of SRK, P.Geo. (APGO #1723) and geostatistical analysis, variography, mineral resource evaluation and classification were undertaken by Sébastien Bernier of SRK, P.Geo. (APGO #1847). All technical work was reviewed by Ben Pullinger, SVP Geology of Excellon (APGO #2420). |
The mineral resource estimate was prepared in accordance with the Canadian Institute of Mining, Metallurgy and Petroleum’s (CIM) ‘Mineral Resources and Mineral Reserves Best Practices’ guidelines (November 2003) and classified per the CIM ‘Definition Standards for Mineral Resources and Mineral Reserves’ (May 2014).
QUALIFIED PERSONS
Mr. Ben Pullinger, B.Sc., P.Geo., Excellon’s Senior Vice President Geology has acted as the Qualified Person, as defined in NI 43-101, with respect to the disclosure of the scientific and technical information relating to geological interpretation and results contained in this MD&A.
Please also refer to the Company’s Annual Information Form (“AIF”) for summary and background on the Company’s exploration projects and Mineral Resource Statement.
CORPORATE RESPONSIBILITY REVIEW
In Q1 2020, the Company focused on continuing to implement the 25 Corporate Responsibility (“CR”) standards introduced over the past three years at both Platosa and Miguel Auza. No new CR standards were introduced.
CR Performance at Platosa and Miguel Auza
Management continues to evaluate and monitor compliance with legal requirements and manage CR risk and the Company’s operations continue to report on the key trailing CR performance indicators and elements of the Visible Felt Leadership process. Trailing safety performance was unchanged in Q1 2020 from the full year 2019 results. The Q1 2020 RIF and LTIF were unchanged from the full-year 2019 performance. Injury severity was significantly lower than the full-year 2019 results.
13| Page |
Management’s Discussion & Analysis of Financial Results
For the three months ended March 31, 2020
There were no significant environmental incidents reported at either Platosa or Miguel Auza during Q1 2020. We continued our engagement with a range of stakeholders surrounding the Platosa and Miguel Auza business units. There was one community-related grievance reported during Q1 2020. Certain members of a local ejidal group objected to maintenance work being conducted on a water conveyance canal; the issue was resolved and closed.
Tailings Management at Miguel Auza
There are two tailings management facilities (TMF) at Miguel Auza. TMF #1 is located immediately northwest of the concentrator and has been decommissioned, rehabilitated with a soil cover and re-vegetated. TMF #2 is located on land owned by Excellon approximately one kilometre north of the Miguel Auza concentrator. Approval for the construction and operation of the facility was received on January 31, 2017.
Work continued during the quarter to implement the actions resulting from the visual inspection and review of tailings management practices completed by a recognized, North American-based consulting engineering firm. Construction of the stage 2 raise for TMF #2 began early in Q1 based on a design prepared by that firm. Construction proceeded according to plan and was largely completed before operations and associated activities were suspended early in Q2 to comply with the Mexican Presidential Order issued on March 31st. The stage 2 raise is expected to be completed soon after operations resume.
Corporate, operations and consulting engineers progressed the development of an Operations, Maintenance and Surveillance (OMS) Manual aligned with the Mining Association of Canada Guidelines. The final draft of the OMS Manual was delivered in Q1 2020 and the final version is being prepared to address comments. In the interim, the Company is implementing the requirements of the OMS Manual and continuing routine inspection and maintenance activities during the suspension of operations.
FINANCIAL REVIEW
Summary of Quarterly Financial Results
Financial statement highlights for the quarter ended March 31, 2020 and the last eight quarters are as follows:
| (in $000’s) | Q1 2020 | Q4 2019 | Q3 2019 | Q2 2019 | Q1 2019 | Q4 2018 | Q3 2018 | Q2 2018 | ||||||||||||||||||||||||
| Revenues | 6,615 | 6,414 | 6,202 | 8,674 | 5,179 | 5,955 | 2,570 | 9,877 | ||||||||||||||||||||||||
| Production costs | (5,479 | ) | (5,757 | ) | (6,050 | ) | (6,797 | ) | (4,612 | ) | (5,213 | ) | (5,221 | ) | (5,173 | ) | ||||||||||||||||
| Depletion and amortization | (1,269 | ) | (1,250 | ) | (1,140 | ) | (1,149 | ) | (1,169 | ) | (1,004 | ) | (876 | ) | (854 | ) | ||||||||||||||||
| Cost of sales | (6,748 | ) | (7,007 | ) | (7,190 | ) | (7,946 | ) | (5,781 | ) | (6,217 | ) | (6,097 | ) | (6,027 | ) | ||||||||||||||||
| Gross profit (loss) | (133 | ) | (593 | ) | (988 | ) | 728 | (602 | ) | (262 | ) | (3,527 | ) | 3,850 | ||||||||||||||||||
| Expenses: | ||||||||||||||||||||||||||||||||
| General and administrative | (1,163 | ) | (1,282 | ) | (1,151 | ) | (1,028 | ) | (1,361 | ) | (595 | ) | (1,021 | ) | (1,482 | ) | ||||||||||||||||
| Exploration | (373 | ) | (1,023 | ) | (858 | ) | (967 | ) | (1,005 | ) | (1,115 | ) | (1,021 | ) | (1,053 | ) | ||||||||||||||||
| Other income (expense) | (1,659 | ) | 1,222 | (200 | ) | 34 | (274 | ) | 51 | 368 | (497 | ) | ||||||||||||||||||||
| Net Finance (expense) income | (2,091 | ) | 753 | (71 | ) | (335 | ) | (52 | ) | 203 | 1,081 | (409 | ) | |||||||||||||||||||
| Income tax (expense) recovery | (953 | ) | (256 | ) | 365 | (640 | ) | (491 | ) | (2,432 | ) | 538 | 845 | |||||||||||||||||||
| Net income (loss) | (6,372 | ) | (1,179 | ) | (2,903 | ) | (2,208 | ) | (3,785 | ) | (4,150 | ) | (3,582 | ) | 1,254 | |||||||||||||||||
| Earnings (loss) per share – basic | (0.06 | ) | (0.01 | ) | (0.03 | ) | (0.02 | ) | (0.04 | ) | (0.04 | ) | (0.04 | ) | 0.01 | |||||||||||||||||
| – diluted | (0.06 | ) | (0.01 | ) | (0.03 | ) | (0.02 | ) | (0.04 | ) | (0.04 | ) | (0.04 | ) | 0.01 | |||||||||||||||||
| Cash flow from (used in) operations before changes in working capital | (1,778 | ) | (1,707 | ) | (1,658 | ) | 208 | (977 | ) | (1,507 | ) | (4,125 | ) | 2,253 | ||||||||||||||||||
14| Page |
Management’s Discussion & Analysis of Financial Results
For the three months ended March 31, 2020
Quarter to quarter revenue variances are a function of metal prices and production results. Production results can differ from period to period depending on geology, mining conditions, labour, and equipment availability. These in turn affect mined tonnages, grades and mill recoveries, and ultimately the quantity of metal produced and revenues received. The Company currently expenses exploration costs not associated with mine resource expansion. As exploration costs can vary from period to period, this can also create volatility in earnings from period to period. The following is a discussion of the material variances between Q1 2020 versus Q1 2019.
| Q1 2020 | Q1 2019 | |||||||
| Revenue | 6,615 | 5,179 | ||||||
| Net Loss | (6,372 | ) | (3,785 | ) | ||||
Revenues increased by 28% during Q1 2020 compared to Q1 2019, due to higher payable silver and lead metals produced and sold. Also refer to “Provisionally Priced Sales” below.
The increase in net loss of $2.6 million between Q1 2020 and Q1 2019, was a result of the following: unrealized foreign exchange losses of $1.6 million, unrealized losses on currency hedges of $1.8 million and negative variances of $1.0 million in cost of goods sold. These losses were partially offset by an overall net increase in revenue variance of $1.4 million which includes materially higher treatment and refining costs of $1.8 million versus $0.6 million in the same period last year; lower exploration cost variance of $0.6 million and share-based compensation expense variance of $0.4 million (non-cash item).
| Q1 2020 | Q1 2019 | |||||||
| Cost of Sales | (6,748 | ) | (5,781 | ) | ||||
The variance in the cost of sales between Q1 2020 and Q1 2019 was driven by higher production costs of $0.9 million and higher depreciation, depletion and amortization (“DDA”) costs of $0.1 million. Higher production costs were driven predominantly by higher electricity prices and labour costs.
Please see Operational Review section, above, for ongoing business initiatives to reduce costs.
15| Page |
Management’s Discussion & Analysis of Financial Results
For the three months ended March 31, 2020
| Q1 2020 | Q1 2019 | |||||||
| Exploration | (373 | ) | (1,005 | ) | ||||
Variances in total exploration expenditure for Q1 2020 were in line with the Company’s exploration targets over the periods. In 2020, the Company continued developing Evolución exploration targets with one diamond drill rig operating from surface, resulting in approximately 1,158 meters drilled (Q1 2019 – 2,545 metres at Evolución and 2,143 metres drilled at Platosa).
| Q1 2020 | Q1 2019 | |||||||
| Other income (expenses) | (1,659 | ) | (274 | ) | ||||
Other income includes unrealized and realized foreign exchange gains and losses, unrealized gains and losses on marketable securities and purchase warrants, interest income and other non-routine income or expenses, if any.
The material variance from Q1 2020 to Q1 2019 of $1.4 million includes, $1.6 million in unrealized foreign exchange losses and a $0.2 million loss on the completion of the Beschefer farm-out agreement with Wallbridge, partially offset by $0.1 million in realized foreign exchange gains and other items.
| Q1 2020 | Q1 2019 | |||||||
| Finance expense | (2,091 | ) | (52 | ) | ||||
Net finance income (cost) consists primarily of fair value adjustments on warrants related to convertible debentures issued in 2015 (since converted, with the warrants converted in Q4 2019), mark-to-market of currency hedges and accretion of the rehabilitation provision for the mine and mill.
During Q1 2020, the market valuation of the USD/MXN currency hedges generated an unrealized loss variance of $2.0 million from the comparable quarter. Q1 2020 also included $0.2 million in interest and certain costs related to the Sprott Credit Facility.
Provisionally Priced Sales
Sales are recorded using the metal price received for sales that settle during the reporting period. For sales that have not been settled, an estimate is used, based on the expected month of settlement and the forward price of the metal at the end of the reporting period. The difference between the estimate and the final price received is recognized by adjusting sales in the period in which the sale is settled (i.e. finalization adjustment). The finalization adjustment recorded for these sales depends on the actual price when the sale settles, which occurs either one or two months after shipment under the terms of the current concentrate purchase agreements.
In Q1 2020, the Company recognized a positive adjustment to revenues of $766, primarily related to the reversal of the mark-to-market taken during Q4 2019 as receivables were ultimately settled at higher values in Q1 2020. As at March 31, 2020, provisionally priced sales totaled $5,396, which are expected to settle at final prices during Q2 2020.
16| Page |
Management’s Discussion & Analysis of Financial Results
For the three months ended March 31, 2020
Revenues recognized in the comparable periods are reconciled below (in thousands of US dollars):
| Q1 2020 | Q1 2019 | |||||||
| Silver (1) | 4,030 | 2,645 | ||||||
| Lead (1) | 1,321 | 837 | ||||||
| Zinc (1) | 1,786 | 2,374 | ||||||
| Prior period provisional adjustments (2) | 766 | (95 | ) | |||||
| Sales before treatment and refining charges (TC/RC) | 7,903 | 5,761 | ||||||
| Less: Treatment and refining charges (TC/RC) | (1,784 | ) | (583 | ) | ||||
| Revenues from sales | 6,119 | 5,179 | ||||||
| Gross revenues from tolling services | 496 | - | ||||||
| Total revenue | 6,615 | 5,179 | ||||||
| (1) | Includes provisional price adjustments on current period sales. |
| (2) | Prior period sales that settled at amounts different from prior period’s estimate. |
Alternative Performance (Non-IFRS) Measures
Production Cost Per Tonne, Total Cash Cost Net of By-Product Credits Per Silver Ounce Payable and All-In Sustaining Cost (AISC) Per Silver Ounce Payable are non-IFRS measures that do not have a standardized meaning. The calculation of these measures may differ from that used by other companies in the industry. The Company uses these measures internally to evaluate the underlying operating performance of the Company for the reporting periods presented. These measures should not be considered in isolation or as a substitute for measures of performance prepared in accordance with generally accepted accounting principles and are not necessarily indicative of operating expenses as determined under generally accepted accounting principles. Management believes that these measures are key performance indicators of the Company’s operational efficiency and are increasingly used across the global mining industry and are intended to provide investors with information about the cash generating capabilities of the Company’s operations.
| Q1 2020 | Q1 2019 | |||||||
| Production Cost per Tonne | $ | 292 | /t | $ | 272 | /t | ||
The Company excludes inventory adjustments from the calculation of Production Cost per Tonne to improve period-over-period comparisons. A reconciliation between production cost per tonne (excluding depletion and amortization and inventory adjustments) and the Company’s cost of sales as reported in the Company’s financial statements is provided below.
| Q1 2020 | Q1 2019 | |||||||
| Cost of Sales | 6,748 | 5,781 | ||||||
| San Sebastián processing cost (Hecla bulk sample) | (234 | ) | - | |||||
| Depletion and amortization | (1,269 | ) | (1,169 | ) | ||||
| Inventory adjustments | 317 | 342 | ||||||
| Production Costs (excluding inventory adjustments) | 5,562 | 4,954 | ||||||
| Tonnes milled | 19,042 | 18,219 | ||||||
| Production cost per tonne milled ($/tonne) | 292 | 272 | ||||||
17| Page |
Management’s Discussion & Analysis of Financial Results
For the three months ended March 31, 2020
The 7% increase in cost per tonne between Q1 2020 and Q1 2019 resulted from increased production costs specifically related to electricity and labour costs as described in “Cost of Sales”, above.
| Q1 2020 | Q1 2019 | |||||||
| Total Cash Cost Per Silver Ounce Payable | $ | 15.35 | /oz | $ | 11.71 | /oz | ||
The calculation of total cash cost per silver ounce payable reflects the cost of production adjusted for by-product and various non-cash costs included in cost of sales. Changes in inventory have not been adjusted from cost of sales, as these costs are associated with the payable silver ounces sold in the period. The Company expects total cash costs net of by-product revenues to vary from period to period as planned production and development access different areas of the mine with varying ore grades and characteristics.
Reconciliation of total cash cost per silver ounce payable, net of by-product credits:
| Q1 2020 | Q1 2019 | |||||||
| Cost of sales | 6,748 | 5,781 | ||||||
| Adjustments - increase/(decrease): | ||||||||
| San Sebastián processing cost (Hecla bulk sample) | (234 | ) | - | |||||
| Depletion and amortization | (1,269 | ) | (1,169 | ) | ||||
| Third party smelting and refining charges (1) | 1,784 | 583 | ||||||
| Royalties (2) | (23 | ) | (23 | ) | ||||
| By-product credits (3) | (3,228 | ) | (3,132 | ) | ||||
| Total cash cost net of by-product credits | 3,778 | 2,040 | ||||||
| Silver ounces payable | 246,062 | 174,194 | ||||||
| Total cash cost per silver ounce payable ($/oz) | 15.35 | 11.71 | ||||||
| (1) | Treatment and refining charges recorded in net revenues. |
| (2) | Advance royalty payments on the Miguel Auza property unrelated to production from Platosa. |
| (3) | By-product credits comprise revenues from sales of lead and zinc. |
Silver production in Q1 2020 was 41% higher than Q1 2019; however, this improved production was materially offset by higher cash costs as described above and particularly impacted by higher treatment and refining charges that increased by $1.2 million during the reporting period or approximately 200%.
18| Page |
Management’s Discussion & Analysis of Financial Results
For the three months ended March 31, 2020
| Q1 2020 | Q1 2019 | |||||||
| AISC Per Silver Ounce Payable (including non-cash items) | $ | 26.52 | /oz | $ | 25.35 | /oz | ||
Higher AISC in Q1 2020 in comparison with Q1 2019 was driven by higher all in production costs ($6.5 million in Q1 2020 vs. $4.4 million in Q1 2019) due to increased treatment and refining charges ($1.2 million) and sustaining capital expenditures ($0.6 million), despite higher silver ounces produced as described above.
AISC per silver ounce payable over the preceding eight quarters are summarized below:
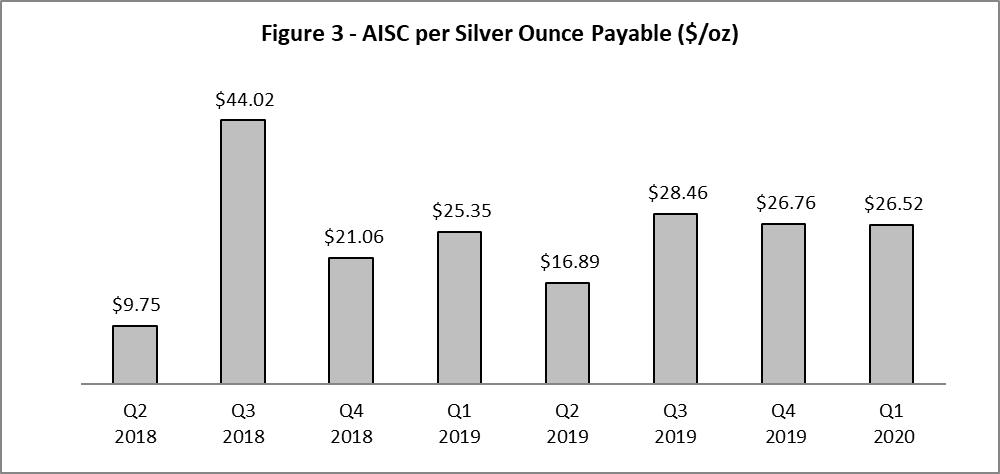
Excellon adopted the AISC measure to provide further transparency on the costs associated with producing silver and to assist stakeholders of the Company in assessing operating performance, ability to generate free cash flow from current operations and overall value. The AISC measure is a non-GAAP measure based on guidance announced by the World Gold Council in June 2013.
Excellon defines AISC per silver ounce payable as the sum of total cash costs (including treatment charges and net of by-product credits), capital expenditures that are sustaining in nature, corporate general and administrative costs (including non-cash share-based compensation), capitalized and expensed exploration that is sustaining in nature, and environmental reclamation costs (non-cash), all divided by the total payable silver ounces sold during the period to arrive at a per ounce figure.
19| Page |
Management’s Discussion & Analysis of Financial Results
For the three months ended March 31, 2020
Capital expenditures to develop new operations or capital expenditures related to major projects at existing operations where these projects will materially increase production are classified as non-sustaining and are excluded. The definition of sustaining versus non-sustaining is similarly applied to capitalized and expensed exploration costs. Exploration costs to develop new operations or that relate to major projects at existing operations where these projects are expected to materially increase production are classified as non-sustaining and are excluded.
Costs excluded from AISC are non-sustaining capital expenditures and exploration costs (as described above), finance costs, tax expense, and any items that are deducted for the purposes of adjusted earnings, if any.
The table below presents details of the AISC per silver ounce payable calculation.
| Q1 2020 | Q1 2019 | |||||||
| Total cash costs net of by-product credits | 3,778 | 2,040 | ||||||
| General and administrative costs (cash) | 933 | 798 | ||||||
| Share based payments (non-cash) | 149 | 529 | ||||||
| Accretion and amortization of reclamation costs (non-cash) | 45 | 59 | ||||||
| Sustaining exploration (manto resource exploration/drilling) | 70 | 74 | ||||||
| Sustaining capital expenditures (1) | 1,551 | 916 | ||||||
| Total sustaining costs | 2,748 | 2,376 | ||||||
| All-in sustaining costs | 6,526 | 4,416 | ||||||
| Silver ounces payable | 246,062 | 174,194 | ||||||
| AISC per silver ounce payable ($/oz) | $ | 26.52 | /oz | $ | 25.35 | /oz | ||
| AISC excluding non-cash items, per silver ounce payable ($/oz) | 25.72 | 21.97 | ||||||
| Realized silver price per ounce sold (2) | 15.04 | 15.45 | ||||||
| (1) | Sustaining capital expenditure includes sustaining property plant and equipment acquisitions and capitalized development costs. |
| (2) | Average realized silver price is calculated on current period sale deliveries and does not include the impact of prior period provisional adjustments in the period. |
RELATED PARTY TRANSACTIONS
The corporate secretary of the Company is a partner in a firm that provides legal services to the Company. During Q1 2020, the Company incurred legal services of $14 (Q1 2019 - $10). As at March 31, 2020, the Company had an outstanding payable balance of $nil (as at December 31, 2019 – $nil).
20| Page |
Management’s Discussion & Analysis of Financial Results
For the three months ended March 31, 2020
COMMON SHARE DATA AS AT JUNE 1, 2020
| Common Shares | 155,549,578 | |||
| Stock Options | 6,232,005 | |||
| Warrants | 6,987,302 | |||
| RSU | 1,539,619 | |||
| DSU | 2,576,220 | |||
| Fully Diluted | 172,884,724 |
LIQUIDITY AND CAPITAL RESOURCES
The primary source of funds available to the Company is cash flow generated by the Platosa Mine and equity financings. The Company has raised equity to fund its exploration program and certain capital and operating expenditures at the mine. A continuous review of the Company’s capital expenditure programs ensures the Company’s capital resources are utilized in a responsible and sustainable manner to conserve cash during periods of low commodity prices and economic and market uncertainty.
| March 31, 2020 | December 31, 2019 | |||||||
| Cash and Cash Equivalents | 8,442 | 6,344 | ||||||
The Company’s cash position increased by $2.1 million for the three months ended March 31, 2020 as a result of:
| (i) | $1.8 million used by operations with a $1.9 million movement in working capital, for a total of $0.1 million generated by operating activities, which included $0.4 million spent on exploration; | |
| (ii) | $3.0 million was invested in capital expenditures related to dewatering, mine development and mining equipment; and | |
| (iii) | Net $5.4 million sourced from financing activities, including $5.9 million Sprott Credit Facility of which $0.4 million was used to provide bridge financing to Otis and $0.1 million on lease payments. |
| March 31, 2020 | December 31, 2019 | |||||||
| Working Capital | 1,564 | 7,646 | ||||||
Working capital decreased by $6.1 million at March 31, 2020 relative to December 31, 2019, reflecting an increase in current assets of $1.8 million, offset by an increase in current liabilities of $7.8 million, primarily related to the Sprott Credit Facility of $5.9 million and increase of $1.8 million related to currency hedge liabilities included in trade and other payables.
| Q1 2020 | Q1 2019 | |||||||
| Cash from (used in) operations before changes in working capital ($000’s) | (1,778 | ) | (977 | ) | ||||
The variance between Q1 2020 and Q1 2019 of $0.8 million in cash flows before changes in working capital primarily comprised non-cash items including the unrealized loss variance on currency hedges ($1.8) million.
21| Page |
Management’s Discussion & Analysis of Financial Results
For the three months ended March 31, 2020
| Q1 2020 | Q1 2019 | |||||||
| Investing Activities ($000’s) | (3,029 | ) | (841 | ) | ||||
For Q1 2020, capital expenditures of $3.0 million relate to TMF#2, dewatering sustaining capital and mine development.
| Q1 2020 | Q1 2019 | |||||||
| Financing Activities ($000’s) | 5,434 | (91 | ) | |||||
During Q1 2020, $5.4 million was sourced from financing activities, including $5.9 million Sprott Credit Facility, of which $0.4 million was used to provide bridge financing to Otis and $0.1 million on mining equipment lease payments.
The Company’s has not been profitable and has had negative cashflows for the past several quarters. The Company accessed the capital markets in 2019 and arranged a bridge loan in connection with the acquisition of Otis. The Company is also implementing cost reductions and business improvements at its operations. At this time, the Company expects to continue to use portions of available cash flow and cash reserves to fund exploration and capital expenditures at each of the Company’s properties in 2020. In the event that cash flows from operations are insufficient, failure to obtain additional financing could result in delay or indefinite postponement of further exploration and development of the Company’s projects and the possible loss of such properties. There can be no assurances that the Company will be able to obtain adequate funding or that the terms of such financing will be favourable. The Company’s ability to generate positive cash flows is also impacted by financial market conditions, most notably metal prices as the Company derives its revenues from the sale of silver, lead and zinc and bears the associated TC/RCs. The Company is also exposed to currency exchange risk and accordingly manages this exposure with currency hedges as described below in “Financial Instruments”. In addition, the Company faces continued uncertainty related to the COVID-19 outbreak; please see Business Environment & Risks section below.
Financial Instruments
All financial assets and financial liabilities, other than derivatives, are initially recognized at the fair value of consideration paid or received, net of transaction costs as appropriate, and subsequently carried at fair value or amortized cost. The carrying values of cash and cash equivalents, trade receivables and other liabilities approximate their fair value, unless otherwise noted.
The Company’s financial performance is sensitive to changes in commodity prices, foreign exchange and interest rates, and the Company may periodically consider hedging such exposure. The Company’s board of directors together with executive management has overall responsibility for the establishment and oversight of the Company’s risk management framework. The Company may continue to address its price-related exposure to foreign exchange through the use of options, futures, forwards and derivative contracts.
The Mexican peso (“MXN”) and the Canadian dollar (“C”) are the functional currencies of the Company, with currency exposures arising from transactions and balances in currencies other than the functional currencies.
22| Page |
Management’s Discussion & Analysis of Financial Results
For the three months ended March 31, 2020
A significant portion of the Company’s capital expenditures, operating costs, exploration, and administrative expenditures are incurred in MXN, while revenues from the sale of concentrates are denominated in US dollars (“USD”). The fluctuation of the USD in relation to the MXN consequently impacts the reported financial performance of the Company. The Company actively manages its forward contracts in light of current market volatility.
To manage the Company’s exposure to changes in the USD/MXN exchange rate, the Company entered into forward contracts to purchase MXN in exchange for USD at various rates and maturity dates. As at March 31, 2020, forward contracts were outstanding for the purchase of MXN158 million in exchange for $7.9 million at an average rate of 20.05 MXN/USD, at various maturity dates until February 2021. Subsequent to March 31, 2020 and up to the date of filing, the Company settled [$2.6] million of these contracts, with [$5.3] million remaining outstanding.
The mark to market on forward foreign exchange contracts resulted in an unrealized loss adjustment of $1,837 recorded in finance expense during Q1 2020 (Q1 2019 – gain of $174) and a corresponding increase in other payables resulting in a net liability balance of $1,379 (as at December 31, 2019 – $432 asset balance in other payables).
Commitments
The following table summarizes the Company’s significant commitments as at March 31, 2020 (in thousands of US dollars):
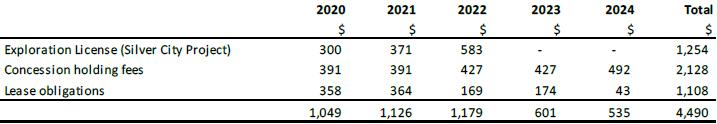
Not included in the table above is an NSR royalty payable semi-annually on the Platosa Property of (a) 1.25% in respect of manto mineralization other than skarn mineralization or (b) 0.5% in respect of skarn or “Source” mineralization. Such payments vary period to period based on production results and commodity prices.
Contingencies
Contingencies can be either possible assets or possible liabilities arising from past events which, by their nature, will only be resolved when one or more future events not within our control occur or fail to occur. The assessment of such contingencies inherently involves the exercise of significant judgment and estimates of the outcome of future events. In assessing loss contingencies related to legal proceedings that are pending against the Company or unasserted claims that may result in such proceedings or regulatory or government actions that may negatively impact our business or operations, the Company with assistance from its legal counsel evaluates the perceived merits of any legal proceedings or unasserted claims or actions.
23| Page |
Management’s Discussion & Analysis of Financial Results
For the three months ended March 31, 2020
The Company is defending various legal claims including one against a subsidiary of the Company which is party to an action by a claimant in respect of damages under a property agreement regarding a non-material mineral concession within the Evolución Project. The concession is subject to an exploration and exploitation agreement with purchase option (the “Antigua Agreement”) dated December 3, 2006 between San Pedro Resources SA de CV (“San Pedro”, now a subsidiary of Excellon) and the owner (the “Plaintiff”) that provides, among other things, for a minimum payment of US$2,500 plus value added tax per month and the payment of a 3% NSR royalty. San Pedro has the right to purchase absolute title to La Antigua including the NSR royalty upon payment of $500. San Pedro was under no contractual obligation to put the mine into production and has not done so. The Plaintiff was awarded damages in the court of first instance in Torreón, Coahuila. Both San Pedro and the Plaintiff appealed the decision to the Second District State Court in the Judicial District of Torreón. That Court confirmed the initial decision but, subsequently, pursuant to an order obtained by the Plaintiff, granted the Plaintiff an award of damages multiple times greater than any income the applicable NSR royalty could produce even in the event of commercial production. San Pedro is appealing this decision to the federal courts of Mexico and believes that the decision is without merit and not supported by the evidence, facts or law. There is currently no impact to the operation of the business.
Refer to the Company’s most recently filed AIF for further information.
Off-Balance Sheet Arrangements
The Company does not have any off-balance sheet arrangements.
ACCOUNTING POLICIES AND INTERNAL CONTROLS
Disclosure Controls and Procedures
In the disclosure set out below, references to management include the President and Chief Executive Officer and Chief Financial Officer. Management has designed disclosure controls and procedures (“DC&P”) to provide a reasonable assurance that (i) material information relating to the Company is made known to them by others, particularly during the period in which the annual filings are being prepared and (ii) information required to be disclosed by the Company in its annual filings, interim filings or other reports filed or submitted by it under securities legislation is recorded, processed, summarized and reported within the time periods specified in securities legislation.
In connection with the preparation and filing of the Company’s audited consolidated financial statements for the year ended December 31, 2019 (the “2019 Financial Statements”), the Company’s management assessed the effectiveness of the Company’s disclosure controls and procedures. In making this assessment, management used the criteria set forth in Internal Control – Integrated Framework (2013) (“COSO 2013”) issued by the Committee of Sponsoring Organizations of the Treadway Commission. Based on this assessment, management concluded that, as of December 31, 2019, the Company’s DC&P were not effective due to the material weakness described in the MD&A for the year ended December 31, 2019 (the “2019 MD&A”). Although the Company has taken significant steps to remediate the material weaknesses, management has concluded that material weaknesses in the design of DC&P continued to exist as of March 31, 2020
Internal Control Over Financial Reporting
Management is responsible for establishing, maintaining and assessing the effectiveness of adequate internal control over financial reporting (“ICFR”). The Company’s ICFR is a process designed to provide reasonable assurance regarding the reliability of financial reporting and the preparation of financial statements for external purposes in accordance with IFRS.
24| Page |
Management’s Discussion & Analysis of Financial Results
For the three months ended March 31, 2020
In connection with the preparation and filing of the 2019 Financial Statements, management assessed the effectiveness of the Company’s ICFR. In making this assessment, management used the criteria set forth in COSO 2013. Based on this assessment, management concluded that, as of December 31, 2019, as a result of the material weaknesses identified surrounding its concentrate theft in Q1 2019, the Company’s ICFR was not effective. Although the Company has made significant progress in its review and overhaul its internal processes and controls around security and control of its metals inventory and revenues, management has concluded that material weaknesses in the design of ICFR continued to exist as of March 31, 2020.
Remediation of Material Weaknesses
Management has taken an active approach remediating and enhancing controls in the revenues cycle for concentrate deliveries. This approach was set out in the 2018 MD&A and updated as at December 31, 2019.
Although there have been significant improvements made to the Company’s ICFR in relation to the material weaknesses disclosed in the 2019 MD&A, the material weaknesses cannot be considered remediated until the applicable remedial controls operate for a sufficient period of time and management has concluded, through testing, that these controls are operating effectively. These efforts have been delayed at the Company’s Mexican operations as a result of COVID-19. No assurance can be provided at this time that the actions and remediation efforts the Company has taken or will implement will effectively remediate the material weaknesses described above or prevent the incidence of other significant deficiencies or material weaknesses in the Company’s ICFR in the future. The Company does not expect that disclosure controls or ICFR will prevent all errors, even as the remediation measures are implemented and further improved to address the material weaknesses. The design of any system of controls is based in part upon certain assumptions about the likelihood of future events, and there can be no assurance that any design will succeed in achieving the Company’s stated goals under all potential future conditions.
Other than the changes described above that were implemented in 2019, and ongoing, there have been no changes in the Company’s ICFR during 2020 that have materially affected, or are reasonably likely to materially affect, the Company’s ICFR.
Accounting policy estimates and judgments
Accounting standards issued but not yet effective
The condensed consolidated financial statements referenced in this MD&A have been prepared in accordance with IAS 34, Interim Financial Reporting, using International Financial Reporting Standards (IFRS) as issued by the International Accounting Standards Board (“IASB”). The significant accounting policies used in the preparation of the condensed consolidated financial statements are consistent with those used in the Company’s audited consolidated financial statements for the year ended December 31, 2019. There have been no new accounting pronouncements issued in the Q1 2020 that are expected to impact the Company.
25| Page |
Management’s Discussion & Analysis of Financial Results
For the three months ended March 31, 2020
Significant accounting estimates and judgements
The Company’s significant accounting policies are described in Note 3 to the consolidated financial statements for the year ended December 31, 2019. The preparation of the consolidated financial statements require management to make estimates and assumptions that affect the reported amounts of assets and liabilities in the consolidated financial statements and reported amounts of expenses during the reporting period. Such estimates and assumptions affect the carrying value of assets and are based on historical experience and other factors considered relevant. The estimates and underlying assumptions are reviewed on an ongoing basis. Revisions to accounting estimates are recognized in the period in which the estimates are revised. For details of these estimates, assumptions and judgements, please refer to the Company’s consolidated financial statements for the year ended December 31, 2019, which are available on the Company’s website and on SEDAR.
BUSINESS ENVIRONMENT AND RISKS
Risks and uncertainties
The Company’s business entails exposure to certain risks, including but not limited to: metal price risk since the Company derives its revenues from the sale of silver, lead and zinc; foreign exchange risk since the Company reports in United States dollars but operates in jurisdictions that use other currencies; the inherent risk of uncertainties in estimating Mineral Resources; political risk associated with operating in foreign jurisdictions; environmental risks; surface rights and access; enforcement of legal rights; and risks associated with labour relations issues. The current or future operations of Excellon including ongoing commercial production are or will be governed by and subject to federal, state and municipal laws and regulations regarding mineral taxation, mineral royalties and other governmental charges. Any change to the mineral taxation and royalty regimes in the jurisdictions in which Excellon operates or plans to operate could have an adverse financial impact on the Company’s current and planned operations and the overall financial results of the Company, the extent of which cannot be predicted. Refer to “Outlook”, above, for a discussion of COVID-19 related risks. Further factors affecting the Company are described in the Company’s most recently filed AIF.
ADDITIONAL SOURCES OF INFORMATION
Additional disclosures pertaining to the Company, including its most recent AIF, audited and unaudited interim financial statements, management information circular, material change reports, press releases and other information, are available on the SEDAR website at www.sedar.com or on the Company’s website at www.excellonresources.com.
26| Page |
Management’s Discussion & Analysis of Financial Results
For the three months ended March 31, 2020
CAUTIONARY STATEMENT REGARDING FORWARD-LOOKING STATEMENTS AND INFORMATION
This MD&A contains “forward-looking statements” within the meaning of applicable Canadian securities legislation and applicable U.S. securities laws. Except for statements of historical fact relating to the Company, such forward-looking statements include, without limitation, statements regarding the future results of operations, performance and achievements of the Company, including potential property acquisitions, the timing, content, cost and results of proposed work programs, the discovery and delineation of mineral deposits/resources/reserves, geological interpretations, the potential of the Company’s properties, proposed production rates, potential mineral recovery processes and rates, business plans and future operating revenues. Forward-looking statements are made based on management’s beliefs, estimates, assumptions and opinions on the date the statements are made. Although the Company believes that such statements are reasonable, it can give no assurance that such expectations will prove to be correct and the Company undertakes no obligation to update forward-looking statements. Forward-looking statements are typically identified by words such as: believes, expects, anticipates, intends, estimates, targets, plans, postulates, and similar expressions, or are those which, by their nature, refer to future events. The Company cautions investors that any forward-looking statements by the Company are not guarantees of future results or performance, and that actual results may differ materially from those in forward-looking statements as a result of various risk factors, including, but not limited to, variations in the nature, quality and quantity of any mineral deposits that may be located, significant downward variations in the market price of any minerals produced (particularly silver), the Company’s inability to obtain any necessary permits, consents or authorizations required for its activities, to produce minerals from its properties successfully or profitably, to continue its projected growth, to raise the necessary capital or to be fully able to implement its business strategies. A description of the risk factors applicable to the Company can be found in the AIF under “Description of the Business – Risk Factors.” All of the Company’s public disclosure filings may be accessed via www.sedar.com and readers are urged to review these materials, including the technical reports filed with respect to the Company’s mineral properties. This document is not, and is not to be construed in any way as, an offer to buy or sell securities in the United States.
Cautionary Note to United States Investors Concerning Estimates of Measured, Indicated and Inferred Resources
The terms “Measured,” “Indicated” and “Inferred” Mineral Resources used or referenced in this MD&A are defined in accordance with Canadian National Instrument 43-101 – Standards of Disclosure for Mineral Projects (“NI 43-101”) under the guidelines set out in the Canadian Institute of Mining, Metallurgy and Petroleum (the “CIM”) Standards on Mineral Resources and Mineral Reserves. The CIM standards differ significantly from standards in the United States. United States investors are advised that while such terms are recognized and required by Canadian regulations, the United States Securities and Exchange Commission does not recognize them. “Inferred Mineral Resources” have a great amount of uncertainty as to their existence, and as to their economic and legal feasibility. It cannot be assumed that all or any part of an Inferred Mineral Resource will ever be upgraded to a higher category or that Mineral Resources will ever be upgraded to Mineral Reserves. Under Canadian rules, estimates of Inferred Mineral Resources may not form the basis of feasibility or other economic studies other than a Preliminary Economic Assessment (“PEA”). United States investors are cautioned not to assume that all or any part of Measured or Indicated Mineral Resources will ever be converted into Mineral Reserves. United States investors are also cautioned not to assume that all or any part of an Inferred Mineral Resource exists or is economically or legally mineable, or that a Measured or Indicated Mineral Resource is economically or legally mineable.
Cautionary Note to United States Investors regarding Adjacent or Similar Properties
This MD&A may also contain information with respect to adjacent or similar mineral properties in respect of which the Company has no interest or rights to explore or mine. The Company advises United States investors that the United States Securities and Exchange Commission’s mining guidelines strictly prohibit information of this type in documents filed with the SEC. Readers are cautioned that the Company has no interest in or right to acquire any interest in any such properties, and that mineral deposits on adjacent or similar properties are not indicative of mineral deposits on the company’s properties.
27| Page |